Item 1: Report to Shareholders| Institutional High Yield Fund | May 31, 2005 |
The views and opinions in this report were current as of May 31, 2005. They are not guarantees of performance or investment results and should not be taken as investment advice. Investment decisions reflect a variety of factors, and the managers reserve the right to change their views about individual stocks, sectors, and the markets at any time. As a result, the views expressed should not be relied upon as a forecast of the fund’s future investment intent. The report is certified under the Sarbanes-Oxley Act of 2002, which requires mutual funds and other public companies to affirm that, to the best of their knowledge, the information in their financial reports is fairly and accurately stated in all material respects.
Dear Investors
The portfolio posted solid gains for the year, although steep losses in March and April led to a breakeven performance for the last six months. Our results generally tracked the high-yield market’s vacillations and outperformed the Lipper average for high-yield funds in both periods. Although high-yield bonds were only marginally affected by the Fed’s short-term rate hikes, the prospect of an economic slowdown precipitated a flight to quality as we approached the end of the reporting period.
MARKET ENVIRONMENT
Following two-and-a-half years of near-perfect conditions for high-yield investors—an environment characterized by extremely low volatility and steady monthly gains—volatility crept into the market over the past six months. It was a dramatic shift and caused investor confusion and uncertainty about the market’s long-term direction.
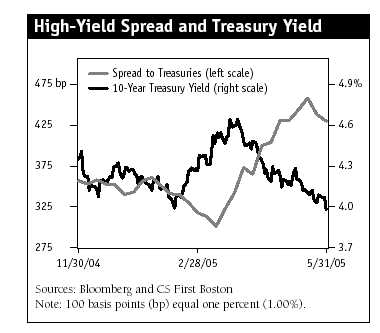
The chart shows the high-yield market’s spread, which is the yield difference between the CS First Boston High Yield Index and the 10-year U.S. Treasury note measured in basis points (100 basis points equal one percent), and the 10-year Treasury’s yield. From the end of November through mid-March, high-yield bond prices surged, compressing spreads to historically low levels, at approximately 300 basis points. After bottoming in March, spreads widened dramatically as high-yield investors became increasingly concerned about interest rate volatility and the potential impact of the Ford and GM downgrades. The market quickly reversed course in mid-May, however, as those fears subsided. April and May were volatile months; the spread widened to about 470 basis points over Treasuries in mid-May, before rallying at the end of the reporting period.
There were several factors contributing to high-yield market volatility over the past six months:
• Most important, the impending downgrades of GM and Ford debt introduced fears of a potential oversupply in the high-yield market. Junk bond investors were surprised by the speed and magnitude of these companies’ ratings downgrades, and worried about the ramifications for the high-yield market.
• The growing participation of hedge funds in our market sparked significant volatility. Hedge funds generate a substantial amount of the trading volume in high-yield bonds and, as financial markets began to experience losses, investors worried that hedge funds might be forced to unwind their aggressive positions, potentially introducing unforeseen shocks to the market.
• The 10-year Treasury’s yield zigged and zagged dramatically over the six-month period, even as the Fed repeatedly raised short-term rates. Movements in the benchmark 10-year Treasury bond directly impact relative valuations in the high-yield market and investors’ appetite for risk and yield.
• Technical factors also added volatility. Some institutional investors, sensing the market’s overvaluation, reduced high-yield holdings and locked in gains.
PERFORMANCE
| Performance Comparison | |
| Periods Ended 5/31/05 | 6 Months | 12 Months |
| Institutional High Yield Fund | 0.11% | 8.88% |
| J.P. Morgan Global High | | |
| Yield Index | 0.99 | 10.10 |
| Lipper High Current Yield | | |
| Funds Average | 0.03 | 8.60 |
| Please see the quarter-end returns table following this letter. |
Your portfolio’s six-month returns were in line with the average high-yield fund tracked by Lipper Inc. but lagged the unmanaged J.P. Morgan Global High Yield Index. A $0.64 decline in the share price almost completely offset the fund’s income of $0.42, and the $0.24 capital gain ($0.14 short term and $0.10 long term) paid late last year (see the Portfolio Characteristics table on page 3). Because returns were essentially flat for the past six months, results for the prior six months largely determined performance for our fiscal year ended May 31, 2005. Twelve-month returns were better than the average high-yield fund and trailed the J.P. Morgan index. The portfolio’s share price fell $0.16, but dividends plus the capital gains contributed $1.09 for the period, generating a solid 8.88% return.
PORTFOLIO AND STRATEGY REVIEW
We have pursued a strategy of reducing the portfolio’s risk. Over the past six months, we sold some of our lowest-quality bonds, which would suffer the most in a market correction. At the same time we increased our weighting in high-quality bonds. In hindsight, we should have owned even more BB and higher rated issues. Although they are generally more interest rate sensitive, as it turned out, they outperformed medium-quality, single B rated credits. We were wrong on our higher-rate forecast six months ago, and we continue to be surprised at how far long-term interest rates fell. At this juncture, we think it is more important to avoid credit risk than to assume interest rate risk given the market’s recent volatility and rich valuations.
Ford and General Motors Downgraded to Junk Status
At the same time that high-yield spreads were at historically low levels, investment-grade Ford and General Motors credits (rated BBB/BB until May 5) were trading at 550 basis points and 700 basis points over Treasuries, respectively. Other “five-B” split-rated bonds were trading around 200 basis points over Treasuries, while Ford and GM were trading at yields comparable to CCC credits, the high-yield market’s lowest-quality tier. This was a big valuation disconnect. It implied that the debt of these auto giants was absurdly cheap, or the high-yield market was grossly overvalued, or both. Moreover, Ford and GM were too large for the high-yield market to ignore. By some estimates, if Ford and GM were both downgraded, they could constitute as much as 12% of the high-yield market. (Please refer to our portfolio of investments for a complete listing of holdings and the amount each represents of the portfolio.)
Fundamentally, we are cautiously optimistic about Ford’s and GM’s long-term financial flexibility. We are also attracted to their cheap bond valuations. Accordingly, we scaled into half-percent positions in both companies. We were a bit early buying GM, as the bonds traded substantially lower after our initial purchase. We added at lower levels but are still a bit underwater on the position. Ford bonds, on the other hand, are trading sharply higher, and we have an overall gain on these two industrial Goliaths. On average, our Ford bond purchases yield 8.65% (based on our average cost) and the GM position yields 8.35% .
Our overall auto/truck exposure is about 3.5% . While this is not a huge sector in terms of its overall importance for the portfolio, we will continue to monitor it carefully. Short term, we recognize that Ford, GM, and the entire automotive industry are vulnerable to continued volatility. Most of the other companies are parts manufacturers, and their ultimate success is tied to the Big Three. When volumes are up, parts manufacturers do well, but when volumes fall, so do their fortunes. Although we were underweight in auto-related credits, which helped our relative results, we were hurt by our positions in EaglePicher and Autocam.
Historically, investments in “fallen angels”—former investment-grade companies like AT&T, Lucent, and Tyco—have been profitable investments for the portfolio and a core part of our strategy. We’ve often said, “When you’re yelling you should be selling, and when you’re crying you should be buying.” We were buying when things looked very ugly, and in each case, conditions subsequently improved and we earned significant capital appreciation. We believe that Ford and GM represent similar situations. Over the intermediate term, we are confident that these companies will undertake the necessary operational and financial restructuring to restore their financial health. In the meantime, each is generating an above-market yield.
| Portfolio Characteristics | |
| Periods Ended | 11/30/04 | 5/31/05 |
| Price Per Share | $11.10 | $10.46 |
| Capital Gain Distributions | | |
| Per Share | | |
| Short Term | – | 0.14 |
| Long Term | – | 0.10 |
| Dividends Per Share | | |
| For 6 Months | 0.43 | 0.42 |
| For 12 Months | 0.89 | 0.85 |
| 30-Day Dividend Yield | 7.82% | 7.84% |
| 30-Day Standardized | | |
| Yield to Maturity | 6.92 | 7.63 |
| Weighted Average Maturity | | |
| (years) | 7.6 | 7.2 |
| Weighted Average Effective | | |
| Duration (years) | 3.6 | 3.8 |
| * Dividends earned for the last 30 days of each period indicated |
| * are annualized and divided by the fund’s net asset value at the |
| * end of the period. | | |
| Note: Yields will vary and are not guaranteed. | |
Our overall strategy was essentially unchanged over the past six months. We continued to rely on the intensive and thorough research efforts of our credit analysts to find attractive yields at reasonable prices. We did not implement significant sector shifts, and our focus remains on bottom-up credit selection. We benefited from a strong run in some of our largest positions in chemicals, such as Lyondell. In the telecom sector, Western Wireless and MCI performed well, thanks to acquisitions by Alltel and Verizon, respectively. We also had a solid gain in Call-Net Enterprises, which was acquired by Rogers Communications. Rogers is itself a significant holding and was the portfolio’s third-best contributor for the past six months.
On the negative side, EaglePicher and Autocam, the previously mentioned pair of auto parts manufacturers, were our largest detractors for the six-month period. We were also hurt by our stake in Elan, the pharmaceutical company whose multiple sclerosis drug, Tysabri, was removed from the market. Tysabri had demonstrated immense promise as a potential new blockbuster drug, and it had already been approved by the FDA. Unexpectedly, though, the drug was tied to several suspected cases of a rare, and often fatal, brain disorder.
OUTLOOK
Our outlook for the high-yield market is largely consistent with our prior views. We are still concerned about rich valuations. We had hoped that the March/April correction would be somewhat longer and provide a more attractive valuation base for the market, but the late-May rally returned the market to somewhat aggressive valuation levels. We also remain cautious on interest rates with the 10-year Treasury yielding only 4%. Six months ago, we said 2005 would be a challenging year. Although we were relieved to see our market stabilize in the final weeks of the reporting period, we don’t want to become overly optimistic.
The environment appears good for many of our credits, but we sense isolated pockets of weakness. For example, there is concern about global overcapacity in the steel industry, which was one of the market’s best-performing sectors in 2004. We also remain cautious about the aggressive behavior of leveraged buyout sponsors, who are responsible for issuing a significant part of our market’s securities. These sponsors are crafting increasingly aggressive debt-financed acquisitions, and they are paying high prices. Longer term, this could compromise the high-yield market’s overall credit quality. We intend to maintain conservative portfolio posturing, and we will work diligently on your behalf to maximize yield without taking undue risk.
Respectfully submitted,

Mark J. Vaselkiv
Chairman of the fund’s Investment Advisory Committee
June 10, 2005
The committee chairman has day-to-day responsibility for managing the portfolio and works with committee members in developing and executing its investment program.
Bonds are subject to interest rate risk, the decline in bond prices that usually accompanies a rise in interest rates, and credit risk, the chance that any fund holding could have its credit rating downgraded, or that a bond issuer will default (fail to make timely payments of interest or principal), potentially reducing the fund’s income level and share price. High-yield corporate bonds could have greater price declines than funds that invest primarily in high-quality bonds. Companies issuing high-yield bonds are not as strong financially as those with higher credit ratings, so the bonds are usually considered speculative investments.
Average maturity: The weighted average of the stated maturity dates of the portfolio’s securities. In general, the longer the average maturity, the greater the fund’s sensitivity to interest rate changes. A shorter average maturity usually means less interest rate sensitivity and therefore a less volatile portfolio.
CS First Boston High Yield Index: Tracks the performance of domestic noninvestment-grade corporate bonds.
Duration: A measure of a bond or bond fund’s sensitivity to changes in interest rates. For example, a fund with a four-year duration would fall about 4% in response to a one-percentage-point rise in interest rates, and vice versa.
Federal funds rate: The interest rate charged on overnight loans of reserves by one financial institution to another in the United States. The Federal Reserve sets a target federal funds rate to affect the direction of interest rates.
J.P. Morgan Global High Yield Index: Tracks the performance of domestic and overseas noninvestment-grade corporate bonds; all are denominated in U.S. dollars.
Lehman Brothers U.S. Aggregate Index: An unmanaged index that tracks the performance of investment-grade government and corporate bonds. This index is widely accepted as the benchmark for the broad U.S. investment-grade bond market.
Lipper averages: Consist of all mutual funds in a particular category as tracked by Lipper Inc.
| Portfolio Highlights | |
| |
| Twenty-Five Largest Holdings | |
| | Percent of |
| | Net Assets |
| | 5/31/05 |
| Nextel Communications | 1.8% |
| Qwest | 1.6 |
| Rogers Communications | 1.4 |
| Quebecor Media | 1.2 |
| Dex Media | 1.0 |
| Lyondell Chemical | 1.0 |
| Chesapeake Energy | 1.0 |
| Williams Companies | 1.0 |
| AES | 1.0 |
| TRW Automotive | 0.9 |
| NRG Energy | 0.9 |
| MGM Mirage | 0.9 |
| Huntsman Company | 0.8 |
| Smurfit-Stone Container | 0.8 |
| Jostens | 0.8 |
| Salt Holdings | 0.8 |
| Amerigas Partners | 0.8 |
| CanWest Media | 0.7 |
| Brand Services | 0.7 |
| Universal City Florida | 0.7 |
| Casella Waste Systems | 0.7 |
| Koppers Industries | 0.7 |
| Cablevision Systems | 0.7 |
| WCI Communities | 0.6 |
| E*Trade Financial | 0.6 |
| Total | 23.1% |
| Note: Table excludes investments in the T. Rowe Price Reserve Investment Fund. |
| Sector Diversification | | |
| | Percent of | Percent of |
| | Net Assets | Net Assets |
| | 11/30/04 | 5/31/05 |
| Electric Utilities | 6% | 7% |
| Energy | 7 | 6 |
| Specialty Chemicals | 7 | 6 |
| Printing and Publishing | 6 | 6 |
| Wireless Communications | 6 | 6 |
| Health Care | 5 | 5 |
| Services | 5 | 5 |
| Telecommunications | 5 | 4 |
| Gaming | 3 | 4 |
| Paper and Paper Products | 4 | 4 |
| Consumer Products | 3 | 4 |
| Automobiles and Related | 4 | 4 |
| Manufacturing | 3 | 4 |
| Metals and Mining | 4 | 3 |
| Electronic Components | 4 | 3 |
| Building Products | 3 | 3 |
| Container | 4 | 3 |
| Aerospace and Defense | 2 | 3 |
| Entertainment and Leisure | 3 | 2 |
| Cable Operators | 3 | 2 |
| All Other | 11 | 11 |
| Other Assets Less Liabilities | 2 | 5 |
| Total | 100% | 100% |
This chart shows the value of a hypothetical $10,000 investment in the fund over the past 10 fiscal year periods or since inception (for funds lacking 10-year records). The result is compared with benchmarks, which may include a broad-based market index and a peer group average or index. Market indexes do not include expenses, which are deducted from fund returns as well as mutual fund averages and indexes.

This table shows how the fund and its benchmarks would have performed each year if their actual (or cumulative) returns for the periods shown had been earned at a constant rate.
| Average Annual Compound Total Return |
| |
| | | Since |
| | | Inception |
| Periods Ended 5/31/05 | 1 Year | 5/31/02 |
| Institutional High Yield Fund | 8.88% | 11.02% |
| J.P. Morgan Global High Yield Index | 10.10 | 11.78 |
| Lipper High Current Yield Funds Average | 10.96 | 9.60 |
| Returns do not reflect taxes that the shareholder may pay on distributions |
| or the redemption of shares. Past performance cannot predict future results. |
Fund Expense Example
As a mutual fund shareholder, you may incur two types of costs: (1) transaction costs such as redemption fees or sales loads and (2) ongoing costs, including management fees, distribution and service (12b-1) fees, and other fund expenses. The following example is intended to help you understand your ongoing costs (in dollars) of investing in the fund and to compare these costs with the ongoing costs of investing in other mutual funds. The example is based on an investment of $1,000 invested at the beginning of the most recent six-month period and held for the entire period.
Actual Expenses
The first line of the following table (“Actual”) provides information about actual account values and actual expenses. You may use the information in this line, together with your account balance, to estimate the expenses that you paid over the period. Simply divide your account value by $1,000 (for example, an $8,600 account value divided by $1,000 = 8.6), then multiply the result by the number in the first line under the heading “Expenses Paid During Period” to estimate the expenses you paid on your account during this period.
Hypothetical Example for Comparison Purposes
The information on the second line of the table (“Hypothetical”) is based on hypothetical account values and expenses derived from the fund’s actual expense ratio and an assumed 5% per year rate of return before expenses (not the fund’s actual return). You may compare the ongoing costs of investing in the fund with other funds by contrasting this 5% hypothetical example and the 5% hypothetical examples that appear in the shareholder reports of the other funds. The hypothetical account values and expenses may not be used to estimate the actual ending account balance or expenses you paid for the period.
You should also be aware that the expenses shown in the table highlight only your ongoing costs and do not reflect any transaction costs, such as redemption fees or sales loads. Therefore, the second line of the table is useful in comparing ongoing costs only and will not help you determine the relative total costs of owning different funds. To the extent a fund charges transaction costs, however, the total cost of owning that fund is higher.
| T. Rowe Price Institutional High Yield Fund |
| |
| | | | Expenses |
| | Beginning | Ending | Paid During |
| | Account | Account | Period* |
| | Value | Value | 12/1/04 to |
| | 12/1/04 | 5/31/05 | 5/31/05 |
| Actual | $1,000.00 | $1,001.10 | $2.49 |
| Hypothetical | | | |
| (Assumes 5% return | | | |
| before expenses) | 1,000.00 | 1,022.44 | $2.52 |
| |
| * Expenses are equal to the fund’s annualized expense ratio for the six- |
| month period (0.50%), multiplied by the average account value over |
| the period, multiplied by the number of days in the most recent fiscal |
| half year (182) divided by the days in the year (365) to reflect the |
| half-year period. | | | |
| Quarter-End Returns | | |
| |
| | | Since |
| | | Inception |
| Periods Ended 6/30/05 | 1 Year | 5/31/02 |
| Institutional High Yield Fund | 9.37% | 11.32% |
| J.P. Morgan Global High Yield Index | 10.29 | 12.06 |
| Lipper High Current Yield Funds Average | 8.93 | 9.89 |
Current performance may be lower or higher than the quoted past performance, which cannot guarantee future results. Share price, principal value, and return will vary, and you may have a gain or loss when you sell your shares. For the most recent month-end performance information, please contact a T. Rowe Price representative at 1-800-638-8790. The performance information shown does not reflect the deduction of a 1% redemption fee on shares held for three months or less. If it did, the performance would be lower.
This table provides returns through the most recent calendar quarter-end rather than through the end of the portfolio’s fiscal period. It shows how the portfolio would have performed each year if its actual (or cumulative) returns for the periods shown had been earned at a constant rate. Average annual total return figures include changes in principal value, reinvested dividends, and capital gain distributions. Returns do not reflect taxes that the shareholder may pay on distributions or the redemption of shares. When assessing performance, investors should consider both short- and long-term returns.
| Financial Highlights | | | | | | |
| T. Rowe Price Institutional High Yield Fund | | | | | | |
| |
| | For a share outstanding throughout each period |
| |
| | | Year | | | | 5/31/02 |
| | | Ended | | | Through |
| | | 5/31/05** | | 5/31/04 | | 5/31/03 |
| NET ASSET VALUE | | | | | | |
| Beginning of period | $ | 10.62 | $ | 10.47 | $ | 10.00 |
|
|
| Investment activities | | | | | | |
| Net investment income (loss) | | 0.82 | | 0.88 | | 0.83 |
| Net realized and unrealized gain (loss) | | 0.11 | | 0.19 | | 0.47 |
|
|
| Total from investment activities | | 0.93 | | 1.07 | | 1.30 |
|
|
| Distributions | | | | | | |
| Net investment income | | (0.85) | | (0.90) | | (0.83) |
| Net realized gain | | (0.24) | | (0.02) | | – |
|
|
| Total distributions | | (1.09) | | (0.92) | | (0.83) |
|
|
| |
| NET ASSET VALUE | | | | | | |
| End of period | $ | 10.46 | $ | 10.62 | $ | 10.47 |
|
|
| |
| Ratios/Supplemental Data | | | | | | |
| Total return^ | | 8.88% | | 10.44% | | 13.78% |
| Ratio of total expenses to | | | | | | |
| average net assets | | 0.50% | | 0.50% | | 0.50% |
| Ratio of net investment | | | | | | |
| income (loss) to average | | | | | | |
| net assets | | 7.52% | | 8.19% | | 8.59% |
| Portfolio turnover rate | | 64.4% | | 73.5% | | 72.3% |
| Net assets, end of period | | | | | | |
| (in thousands) | $ | 463,797 | $ | 716,564 | $ | 586,431 |
| ^ Total return reflects the rate that an investor would have earned on an investment in the fund during each period, assuming reinvestment |
| of all distributions. |
| **Per share amounts calculated using average shares outstanding method. |
| |
| The accompanying notes are an integral part of these financial statements. |
| Portfolio of Investments (1)+ | | |
| T. Rowe Price Institutional High Yield Fund | | |
| May 31, 2005 | | |
| | | |
| | $ Par/Shares | Value |
| (Amounts in 000s) | | |
| | | |
| CORPORATE BONDS AND NOTES 91.6% | | |
| | | |
| Aerospace & Defense 2.5% | | |
| Aviall, 7.625%, 7/1/11 | 1,100 | 1,147 |
| BE Aerospace | | |
| 8.00%, 3/1/08 | 925 | 927 |
| 8.50%, 10/1/10 | 525 | 570 |
| Series B, 8.875%, 5/1/11 | 1,175 | 1,198 |
| Gencorp, 9.50%, 8/15/13 | 2,150 | 2,333 |
| Moog, 6.25%, 1/15/15 | 700 | 700 |
| Northwest Airlines, 9.875%, 3/15/07 | 525 | 328 |
| Sequa, 9.00%, 8/1/09 | 825 | 883 |
| TD Funding, 8.375%, 7/15/11 | 1,275 | 1,326 |
| Vought Aircraft, 8.00%, 7/15/11 | 2,400 | 2,340 |
| | | 11,752 |
| | | |
| Automobiles and Related 3.5% | | |
| Accuride, 144A, 8.50%, 2/1/15 | 1,325 | 1,206 |
| Adesa, 7.625%, 6/15/12 | 1,220 | 1,220 |
| Asbury Automotive | | |
| 8.00%, 3/15/14 | 1,000 | 955 |
| 9.00%, 6/15/12 | 100 | 102 |
| Autocam, 10.875%, 6/15/14 | 1,275 | 638 |
| Cooper Standard Automotive | | |
| 8.375%, 12/15/14 | 1,100 | 907 |
| Ford Motor Credit | | |
| 7.00%, 10/1/13 | 1,550 | 1,465 |
| 7.375%, 10/28/09 | 500 | 485 |
| General Motors Acceptance Corp. | | |
| 6.75%, 12/1/14 | 1,975 | 1,689 |
| Insurance Auto Auctions, 144A | | |
| 11.00%, 4/1/13 | 700 | 710 |
| J.B. Poindexter, 8.75%, 3/15/14 | 775 | 732 |
| MSX International, 11.375% | | |
| 1/15/08 | 125 | 73 |
| Navistar International, 7.50% | | |
| 6/15/11 | 1,325 | 1,335 |
| Tenneco Automotive, 8.625% | | |
| 11/15/14 | 1,400 | 1,351 |
| TRW Automotive | | |
| 9.375%, 2/15/13 | 1,950 | 2,106 |
| 11.00%, 2/15/13 | 1,200 | 1,314 |
| | | 16,288 |
| | | |
| Beverages 0.4% | | |
| Le Natures, 144A, STEP, 10.00% | | |
| 6/15/13 | 1,600 | 1,648 |
| | | 1,648 |
| | | |
| Broadcasting 1.0% | | |
| Fisher Communications, 8.625% | | |
| 9/15/14 | 475 | 505 |
| Gray Communications | | |
| 9.25%, 12/15/11 | 1,100 | 1,196 |
| Sinclair Broadcast Group | | |
| 8.00%, 3/15/12 | 725 | 751 |
| 8.75%, 12/15/11 | 500 | 530 |
| XM Satellite Radio, 12.00% | | |
| 6/15/10 | 1,437 | 1,617 |
| | | 4,599 |
| | | |
| Building and Real Estate 1.2% | | |
| Mobile Mini, 9.50%, 7/1/13 | 925 | 1,008 |
| Ventas Realty, 144A, 6.75% | | |
| 6/1/10 | 450 | 458 |
| WCI Communities | | |
| 7.875%, 10/1/13 | 1,050 | 1,045 |
| 9.125%, 5/1/12 | 450 | 467 |
| 10.625%, 2/15/11 | 1,400 | 1,494 |
| Williams Scotsman, 10.00% | | |
| 8/15/08 | 1,000 | 1,076 |
| | | 5,548 |
| | | |
| Building Products 3.2% | | |
| ACIH, 144A, STEP, 0.00% | | |
| 12/15/12 | 2,025 | 1,276 |
| Building Materials, 7.75%, 8/1/14 | 1,275 | 1,198 |
| Collins & Aikman Floorcoverings | | |
| 9.75%, 2/15/10 | 1,300 | 1,368 |
| Interface | | |
| 9.50%, 2/1/14 | 125 | 124 |
| 10.375%, 2/1/10 | 1,050 | 1,126 |
| Maax, 9.75%, 6/15/12 | 875 | 792 |
| Masonite, VR, 9.13%, 10/6/06 ‡ | 2,800 | 2,772 |
| Norcraft Companies, 9.00% | | |
| 11/1/11 | 1,100 | 1,106 |
| Norcraft Holdings Capital, STEP | | |
| 0.00%, 9/1/12 | 700 | 455 |
| RMCC Acquisition, 144A, 9.50% | | |
| 11/1/12 | 1,275 | 1,237 |
| Texas Industries, 10.25% | | |
| 6/15/11 | 1,000 | 1,135 |
| U.S. Concrete, 8.375%, 4/1/14 | 1,425 | 1,318 |
| WII Components, 10.00% | | |
| 2/15/12 | 1,125 | 1,097 |
| | | 15,004 |
| | | |
| Cable Operators 2.2% | | |
| Cablevision System, 144A | | |
| 8.00%, 4/15/12 | 1,200 | 1,253 |
| CCO Holdings | | |
| 8.75%, 11/15/13 | 1,125 | 1,122 |
| 144A, VR, 7.135%, 12/15/10 | 1,100 | 1,081 |
| Charter Communications Operating | |
| 144A, 8.00%, 4/30/12 | 775 | 775 |
| CSC Holdings | | |
| 7.625%, 4/1/11 | 1,500 | 1,590 |
| 8.125%, 7/15/09 | 200 | 211 |
| Insight Midwest / Insight Capital | | |
| 9.75%, 10/1/09 | 125 | 131 |
| Mediacom Broadband, 11.00% | | |
| 7/15/13 | 850 | 920 |
| Olympus Communications, VR | | |
| 6.50%, 6/30/10 ‡ | 1,500 | 1,455 |
| Rogers Cablesystems | | |
| 6.75%, 3/15/15, | 25 | 25 |
| 11.00%, 12/1/15 | 125 | 136 |
| Videotron, 6.875%, 1/15/14 | 1,300 | 1,303 |
| | | 10,002 |
| | | |
| Container 2.7% | | |
| AEP Industries, 144A, 7.875% | | |
| 3/15/13 | 800 | 796 |
| Ball, 6.875%, 12/15/12 | 125 | 130 |
| Bway, STEP, 10.00%, 10/15/10 | 1,350 | 1,370 |
| Crown European | | |
| 9.50%, 3/1/11 | 2,275 | 2,491 |
| 10.875%, 3/1/13 | 225 | 259 |
| Graham Packaging | | |
| 144A, 8.50%, 10/15/12 | 950 | 945 |
| 144A, 9.875%, 10/15/14 | 950 | 941 |
| Greif Brothers, 8.875%, 8/1/12 | 500 | 534 |
| Owens Brockway Glass Container | | |
| 6.75%, 12/1/14 | 225 | 227 |
| 7.75%, 5/15/11 | 550 | 589 |
| 8.75%, 11/15/12 | 1,000 | 1,100 |
| Plastipak, 10.75%, 9/1/11 | 2,075 | 2,270 |
| Silgan, 6.75%, 11/15/13 | 325 | 325 |
| Solo Cup, 8.50%, 2/15/14 | 800 | 770 |
| | | 12,747 |
| | | |
| Electric Utilities 5.9% | | |
| AES | | |
| 7.75%, 3/1/14 | 475 | 503 |
| 9.375%, 9/15/10 | 1,975 | 2,232 |
| 144A, 9.00%, 5/15/15 | 1,500 | 1,676 |
| Allegheny Energy Supply | | |
| 7.80%, 3/15/11 | 275 | 293 |
| 144A, STEP, 8.25%, 4/15/12 | 585 | 631 |
| ANR Pipeline, 8.875%, 3/15/10 | 525 | 569 |
| CMS Energy, 9.875%, 10/15/07 | 2,100 | 2,273 |
| Dynegy-Roseton Danskammer | | |
| Series A, 7.27%, 11/8/10 | 1,275 | 1,249 |
| Midwest Generation, 8.75% | | |
| 5/1/34 | 1,300 | 1,456 |
| Mirant Corp., 144A, 7.90% | | |
| 7/15/09 †† | 1,400 | 1,105 |
| Northwest Pipeline, 8.125% | | |
| 3/1/10 | 900 | 977 |
| NRG Energy, 144A, 8.00% | | |
| 12/15/13 | 2,750 | 2,901 |
| Orion Power, 12.00%, 5/1/10 | 1,775 | 2,126 |
| Sierra Pacific Resources, 8.625% | | |
| 3/15/14 | 2,275 | 2,446 |
| Southern Natural Gas | | |
| 8.00%, 3/1/32 | 25 | 27 |
| 8.875%, 3/15/10 | 750 | 815 |
| Texas Genco, 144A, 6.875%, | | |
| 12/15/14 | 2,225 | 2,289 |
| Utilicorp Canada Finance, 7.75% | | |
| 6/15/11 | 1,050 | 1,050 |
| Williams Companies | | |
| 7.50%, 1/15/31 | 1,000 | 1,045 |
| 7.625%, 7/15/19 | 250 | 278 |
| 7.75%, 6/15/31 | 650 | 692 |
| STEP, 8.125%, 3/15/12 | 625 | 708 |
| | | 27,341 |
| | | |
| Electronic Components 3.3% | | |
| Activant Solutions, 144A, VR | | |
| 9.09%, 4/1/10 | 225 | 227 |
| Amkor Technology | | |
| 7.75%, 5/15/13 | 225 | 184 |
| 9.25%, 2/15/08 | 575 | 506 |
| Celestica, 7.875%, 7/1/11 | 450 | 468 |
| Flextronics International, 6.25% | | |
| 11/15/14 | 1,125 | 1,125 |
| Freescale Semiconductor | | |
| 6.875%, 7/15/11 | 825 | 866 |
| 7.125%, 7/15/14 | 1,000 | 1,060 |
| Lucent Technologies, 5.50% | | |
| 11/15/08 | 1,150 | 1,133 |
| Magnachip Semiconductor | | |
| 144A, 6.875%, 12/15/11 | 775 | 721 |
| 144A, 8.00%, 12/15/14 | 175 | 153 |
| New Asat Finance, 9.25%, 2/1/11 | 750 | 630 |
| Sanmina SCI | | |
| 10.375%, 1/15/10 | 225 | 250 |
| 144A, 6.75%, 3/1/13 | 950 | 898 |
| Semiconductor Note Partnership | | |
| 144A, Zero Coupon, 8/4/11 | 900 | 1,350 |
| Stats Chippac, 6.75%, 11/15/11 | 550 | 531 |
| Stratus Technologies, 10.375% | | |
| 12/1/08 | 1,150 | 1,127 |
| Telex Communications, 11.50% | | |
| 10/15/08 | 1,100 | 1,174 |
| UGS Corp, 10.00%, 6/1/12 | 1,375 | 1,512 |
| Xerox Corporation | | |
| 7.20%, 4/1/16 | 600 | 648 |
| 7.625%, 6/15/13 | 550 | 598 |
| | | 15,161 |
| | | |
| Energy 6.4% | | |
| Amerigas Partners | | |
| 10.00%, 4/15/06 | 2,575 | 2,665 |
| 144A, 7.25%, 5/20/15 | 825 | 829 |
| CHC Helicopter, 7.375%, 5/1/14 | 1,075 | 1,037 |
| Chesapeake Energy | | |
| 7.00%, 8/15/14 | 475 | 494 |
| 8.125%, 4/1/11 | 575 | 607 |
| 9.00%, 8/15/12 | 1,225 | 1,353 |
| 144A, 6.375%, 6/15/15 | 850 | 854 |
| 144A, 6.625%, 1/15/16 | 1,375 | 1,403 |
| Compton Petroleum, 9.90% | | |
| 5/15/09 | 225 | 240 |
| Denbury Resources, 7.50% | | |
| 4/1/13 | 1,225 | 1,250 |
| Dresser-Rand Group, 144A | | |
| 7.375%, 11/1/14 | 625 | 613 |
| El Paso Production, 7.75% | | |
| 6/1/13 | 625 | 648 |
| Encore Acquisition, 8.375% | | |
| 6/15/12 | 665 | 717 |
| Ferrellgas Partners, 8.75% | | |
| 6/15/12 | 2,261 | 2,227 |
| Forest Oil, 8.00%, 12/15/11 | 725 | 796 |
| Grant Prideco, 9.00%, 12/15/09 | 325 | 358 |
| Hanover Compressor | | |
| 9.00%, 6/1/14 | 825 | 852 |
| Zero Coupon, 3/31/07 | 275 | 236 |
| Hanover Equipment Trust | | |
| Series B, 8.75%, 9/1/11 | 375 | 389 |
| Hilcorp Energy, 144A, 10.50% | | |
| 9/1/10 | 1,325 | 1,464 |
| Inergy LP/Finance, 144A, 6.875% | | |
| 12/15/14 | 1,000 | 935 |
| Magnum Hunter Resources | | |
| 9.60%, 3/15/12 | 601 | 667 |
| Parker Drilling Company, Series B | | |
| 10.125%, 11/15/09 | 389 | 409 |
| Petroleum Geo-Services, 10.00% | | |
| 11/5/10 | 1,450 | 1,620 |
| Petroleum Helicopters, 9.375% | | |
| 5/1/09 | 1,125 | 1,164 |
| Plains All American Pipeline | | |
| 7.75%, 10/15/12 | 325 | 380 |
| Pride International, 7.375% | | |
| 7/15/14 | 975 | 1,056 |
| Range Resources | | |
| 6.375%, 3/15/15 | 275 | 267 |
| 7.375%, 7/15/13 | 675 | 702 |
| Stone Energy | | |
| 6.75%, 12/15/14 | 625 | 603 |
| 8.25%, 12/15/11 | 150 | 155 |
| Suburban Propane Partners | | |
| 6.875%, 12/15/13 | 175 | 165 |
| 144A, 6.875%, 12/15/13 | 925 | 869 |
| Swift Energy, 7.625%, 7/15/11 | 825 | 842 |
| Whiting Petroleum, 144A, 7.25% | | |
| 5/1/13 | 975 | 965 |
| | | 29,831 |
| | | |
| Entertainment and Leisure 2.2% | | |
| AMF Bowling Worldwide | | |
| 10.00%, 3/1/10 | 1,225 | 1,225 |
| Cinemark, STEP, 0.00%, 3/15/14 | 2,500 | 1,750 |
| Cinemark USA, 9.00%, 2/1/13 | 150 | 159 |
| Loews Cineplex Entertainment | | |
| 144A, 9.00%, 8/1/14 | 1,625 | 1,576 |
| Marquee | | |
| 144A, 8.625%, 8/15/12 | 300 | 313 |
| 144A, STEP, 1.00%, 8/15/14 | 675 | 395 |
| Six Flags, 9.75%, 4/15/13 | 250 | 222 |
| Universal City Development | | |
| Partners, 11.75%, 4/1/10 | 2,650 | 3,015 |
| Universal City Florida | | |
| 8.375%, 5/1/10 | 125 | 129 |
| VR, 7.96%, 5/1/10 | 175 | 179 |
| Warner Music Group, 7.375% | | |
| 4/15/14 | 1,150 | 1,144 |
| | | 10,107 |
| | | |
| Finance and Credit 1.2% | | |
| B F Saul Real Estate, 7.50% | | |
| 3/1/14 | 1,050 | 1,092 |
| Colonial Bank, 9.375%, 6/1/11 | 275 | 330 |
| Dollar Financial Group, 9.75% | | |
| 11/15/11 | 975 | 1,017 |
| E*Trade Financial, 8.00% | | |
| 6/15/11 | 2,875 | 3,004 |
| | | 5,443 |
| | | |
| Food/Tobacco 1.3% | | |
| Agrilink Foods, 11.875%, 11/1/08 | 556 | 578 |
| Alliance One International | | |
| 144A, 11.00%, 5/15/12 | 475 | 483 |
| B & G Foods, 8.00%, 10/1/11 | 1,400 | 1,445 |
| Del Monte | | |
| 8.625%, 12/15/12 | 225 | 245 |
| 144A, 6.75%, 2/15/15 | 575 | 574 |
| Dole Foods, 8.875%, 3/15/11 | 825 | 879 |
| Pierre Foods, 9.875%, 7/15/12 | 875 | 884 |
| Wornick, 10.875%, 7/15/11 | 725 | 725 |
| | | 5,813 |
| | | |
| Gaming 3.9% | | |
| American Casino & Entertainment | | |
| 7.85%, 2/1/12 | 1,450 | 1,530 |
| Ameristar Casinos, 10.75% | | |
| 2/15/09 | 1,175 | 1,284 |
| Argosy Gaming, 9.00%, 9/1/11 | 125 | 138 |
| Boyd Gaming, 7.75%, 12/15/12 | 1,500 | 1,590 |
| Global Cash Access, 8.75% | | |
| 3/15/12 | 1,400 | 1,505 |
| Herbst Gaming, 7.00%, 11/15/14 | 975 | 980 |
| Las Vegas Sands, 144A, 6.375% | | |
| 2/15/15 | 925 | 893 |
| Mandalay Resort Group | | |
| Series B, 10.25%, 8/1/07 | 825 | 912 |
| MGM Mirage | | |
| 8.50%, 9/15/10 | 2,075 | 2,298 |
| 9.75%, 6/1/07 | 675 | 734 |
| Mohegan Tribal Gaming Authority | | |
| 144A, 6.125%, 2/15/13 | 875 | 879 |
| 144A, 6.875%, 2/15/15 | 1,000 | 1,010 |
| Poster Financial Group, 8.75% | | |
| 12/1/11 | 1,075 | 1,088 |
| Resorts International Hotel | | |
| 11.50%, 3/15/09 | 150 | 170 |
| Seneca Gaming Corp, 144A, 7.25% | | |
| 5/1/12 | 600 | 607 |
| Station Casinos, 6.875%, 3/1/16 | 925 | 948 |
| Trump Entertainment Resorts | | |
| 144A, 8.50%, 6/1/15 | 575 | 562 |
| Wynn Las Vegas, 144A, 6.625% | | |
| 12/1/14 | 1,225 | 1,176 |
| | | 18,304 |
| | | |
| Healthcare Services 4.8% | | |
| Biovail, 7.875%, 4/1/10 | 900 | 909 |
| Community Health Systems | | |
| 6.50%, 12/15/12 | 575 | 575 |
| Concentra Operating | | |
| 9.125%, 6/1/12 | 1,025 | 1,061 |
| 9.50%, 8/15/10 | 800 | 828 |
| Davita | | |
| 144A, 6.625%, 3/15/13 | 450 | 457 |
| 144A, 7.25%, 3/15/15 | 1,025 | 1,030 |
| Fisher Scientific International | | |
| 8.125%, 5/1/12 | 1,200 | 1,329 |
| Fresenius Medical Capital | | |
| Trust II, 7.875%, 2/1/08 | 725 | 756 |
| Trust IV, 7.875%, 6/15/11 | 225 | 240 |
| Genesis Healthcare, 8.00% | | |
| 10/15/13 | 1,000 | 1,070 |
| HCA | | |
| 6.375%, 1/15/15 | 1,100 | 1,125 |
| 8.75%, 9/1/10 | 675 | 767 |
| Medquest, 11.875%, 8/15/12 | 600 | 600 |
| MQ Associates, STEP, 0.00% | | |
| 8/15/12 | 1,250 | 713 |
| Omnicare, 8.125%, 3/15/11 | 1,275 | 1,345 |
| Quintiles Transnational, 10.00% | | |
| 10/1/13 | 1,125 | 1,221 |
| Select Medical Corp., 144A | | |
| 7.625%, 2/1/15 | 400 | 393 |
| Tenet Healthcare | | |
| 6.50%, 6/1/12 | 575 | 545 |
| 7.375%, 2/1/13 | 550 | 533 |
| 9.875%, 7/1/14 | 200 | 214 |
| Triad Hospitals, 7.00%, 11/15/13 | 1,500 | 1,519 |
| US Oncology | | |
| 9.00%, 8/15/12 | 1,200 | 1,272 |
| 10.75%, 8/15/14 | 600 | 649 |
| Vanguard Health, 9.00%, 10/1/14 | 950 | 1,021 |
| VWR International | | |
| 6.875%, 4/15/12 | 275 | 265 |
| 8.00%, 4/15/14 | 1,050 | 987 |
| Warner Chilcott, 144A, 8.75% | | |
| 2/1/15 | 825 | 775 |
| | | 22,199 |
| | | |
| Lodging 1.4% | | |
| HMH Properties, 7.875%, 8/1/08 | 51 | 52 |
| Host Marriott, 9.50%, 1/15/07 | 875 | 930 |
| John Q. Hammons Hotels | | |
| 8.875%, 5/15/12 | 1,325 | 1,447 |
| La Quinta Properties | | |
| 7.00%, 8/15/12 | 500 | 516 |
| 8.875%, 3/15/11 | 2,050 | 2,235 |
| Meristar Hospitality | | |
| 9.00%, 1/15/08 | 450 | 459 |
| 9.125%, 1/15/11 | 675 | 688 |
| | | 6,327 |
| | | |
| Manufacturing 3.6% | | |
| Aearo, 8.25%, 4/15/12 | 1,175 | 1,163 |
| Bombardier | | |
| 144A, 6.30%, 5/1/14 | 900 | 792 |
| 144A, 6.75%, 5/1/12 | 850 | 790 |
| Case New Holland, 144A, 9.25% | | |
| 8/1/11 | 1,000 | 1,050 |
| Coleman Cable, 144A, 9.875% | | |
| 10/1/12 | 325 | 301 |
| General Cable, 9.50%, 11/15/10 | 1,000 | 1,058 |
| Hawk Corp., 8.75%, 11/1/14 | 750 | 758 |
| Invensys, 144A, 9.875%, 3/15/11 | 1,300 | 1,241 |
| JLG Industries, 8.375%, 6/15/12 | 1,046 | 1,072 |
| Manitowoc, 7.125%, 11/1/13 | 575 | 592 |
| Maytag Corp, 6.875%, 12/1/06 | 850 | 857 |
| National Waterworks, 10.50% | | |
| 12/1/12 | 2,150 | 2,408 |
| Rexnord, 10.125%, 12/15/12 | 2,125 | 2,237 |
| Superior Essex, 9.00%, 4/15/12 | 1,575 | 1,575 |
| Valmont Industries, 6.875% | | |
| 5/1/14 | 975 | 975 |
| | | 16,869 |
| | | |
| Metals and Mining 3.4% | | |
| Algoma Steel, 11.00%, 12/31/09 | 1,453 | 1,573 |
| Alpha Natural Resources, 144A | | |
| 10.00%, 6/1/12 | 1,125 | 1,240 |
| Arch Western Finance, STEP | | |
| 6.75%, 7/1/13 | 400 | 408 |
| Century Alumunium, 7.50% | | |
| 8/15/14 | 675 | 658 |
| Earle M. Jorgensen, 9.75%, 6/1/12 | 2,000 | 2,100 |
| Euramax International, 8.50% | | |
| 8/15/11 | 1,125 | 1,271 |
| Foundation Coal Holdings, 7.25% | | |
| 8/1/14 | 1,075 | 1,118 |
| Gerdau Ameristeel, 10.375% | | |
| 7/15/11 | 750 | 818 |
| IMCO Recycling Escrow, 144A | | |
| 9.00%, 11/15/14 | 475 | 490 |
| IPSCO, 8.75%, 6/1/13 | 500 | 555 |
| James River Coal Company | | |
| 9.375%, 6/1/12 | 950 | 959 |
| Joy Global, 8.75%, 3/15/12 | 725 | 812 |
| Luscar Coal, 9.75%, 10/15/11 | 1,175 | 1,287 |
| Massey Energy, 6.625%, 11/15/10 | 975 | 990 |
| Neenah Foundry, 144A, 11.00% | | |
| 9/30/10 | 800 | 864 |
| Novelis, 144A, 7.25%, 2/15/15 | 675 | 655 |
| Russel Metals, 6.375%, 3/1/14 | 125 | 119 |
| | | 15,917 |
| | | |
| Miscellaneous Consumer Products 3.7% | |
| AAC Group, 144A, STEP, 0.00% | | |
| 10/1/12 | 750 | 488 |
| American Achievement, 8.25% | | |
| 4/1/12 | 1,575 | 1,575 |
| Ames True Temper, 10.00% | | |
| 7/15/12 | 850 | 676 |
| Chattem, 7.00%, 3/1/14 | 700 | 714 |
| Church & Dwight, 144A, 6.00% | | |
| 12/15/12 | 575 | 574 |
| Couche-Tard, 7.50%, 12/15/13 | 400 | 417 |
| Equinox, 9.00%, 12/15/09 | 600 | 615 |
| FTD, 7.75%, 2/15/14 | 1,301 | 1,242 |
| Jostens, STEP, 0.00%, 12/1/13 | 3,200 | 2,080 |
| Jostens IH, 7.265%, 10/1/12 | 1,650 | 1,592 |
| K2, 7.375%, 7/1/14 | 1,300 | 1,346 |
| Pantry, 7.75%, 2/15/14 | 1,250 | 1,256 |
| Rayovac | | |
| 8.50%, 10/1/13 | 1,425 | 1,486 |
| 144A, 7.375%, 2/1/15 | 425 | 414 |
| Sealy Mattress, 8.25%, 6/15/14 | 1,275 | 1,281 |
| Simmons | | |
| 7.875%, 1/15/14 | 350 | 306 |
| 144A, STEP, 0.00%, 12/15/14 | 1,150 | 535 |
| Town Sports International Holdings | |
| 9.625%, 4/15/11 | 550 | 561 |
| | | 17,158 |
| | | |
| Paper and Paper Products 3.8% | | |
| Ainsworth Lumber, 7.25% | | |
| 10/1/12 | 1,200 | 1,116 |
| Boise Cascade, 144A, 7.125% | | |
| 10/15/14 | 775 | 734 |
| Fort James, 6.875%, 9/15/07 | 125 | 129 |
| Georgia-Pacific | | |
| 8.875%, 2/1/10 | 125 | 142 |
| 9.375%, 2/1/13 | 925 | 1,053 |
| Graphic Packaging International | | |
| 8.50%, 8/15/11 | 1,075 | 1,075 |
| 9.50%, 8/15/13 | 175 | 170 |
| Jefferson Smurfit | | |
| 7.50%, 6/1/13 | 100 | 94 |
| 8.25%, 10/1/12 | 1,250 | 1,238 |
| JSG Funding, 144A, 7.75% | | |
| 4/1/15 | 1,050 | 820 |
| Longview Fibre, 10.00% | | |
| 1/15/09 | 2,150 | 2,295 |
| MDP Acquisitions, 9.625% | | |
| 10/1/12 | 2,075 | 2,065 |
| NewPage | | |
| 144A, 10.00%, 5/1/12 | 975 | 956 |
| 144A, 12.00%, 5/1/13 | 475 | 464 |
| 144A, VR, 9.46%, 5/1/12 | 400 | 394 |
| Norske Skog, 7.375%, 3/1/14 | 925 | 863 |
| Stone Container | | |
| 8.375%, 7/1/12 | 475 | 472 |
| 9.75%, 2/1/11 | 1,045 | 1,108 |
| Stone Container Finance of | | |
| Canada, 7.375%, 7/15/14 | 1,100 | 1,023 |
| Western Forest Products, PIK | | |
| 144A, 15.00%, 7/28/09 | 1,500 | 1,605 |
| | | 17,816 |
| | | |
| Printing and Publishing 6.2% | | |
| Advanstar STEP, 0.00%, 10/15/11 | 1,050 | 1,018 |
| Advanstar Communications | | |
| 10.75%, 8/15/10 | 550 | 591 |
| 12.00%, 2/15/11 | 600 | 632 |
| 144A, 10.75%, 8/15/10 | 325 | 349 |
| Affinity Group | | |
| 9.00%, 2/15/12 | 900 | 878 |
| 144A, 10.875%, 2/15/12 | 475 | 444 |
| CanWest Media | | |
| 10.625%, 5/15/11 | 1,400 | 1,529 |
| 144A, 8.00%, 9/15/12 | 1,800 | 1,859 |
| Dex Media, 8.00%, 11/15/13 | 275 | 293 |
| Dex Media East | | |
| 9.875%, 11/15/09 | 1,025 | 1,143 |
| 12.125%, 11/15/12 | 748 | 896 |
| Dex Media West, 9.875% | | |
| 8/15/13 | 2,150 | 2,462 |
| Haights Cross Operating | | |
| 11.75%, 8/15/11 | 300 | 325 |
| 144A, 11.75%, 8/15/11 | 350 | 380 |
| Houghton Mifflin | | |
| 8.25%, 2/1/11 | 675 | 702 |
| 9.875%, 2/1/13 | 675 | 705 |
| Lighthouse International, 144A | | |
| 8.00%, 4/30/14 (EUR) | 1,525 | 1,916 |
| Mail-Well I, 9.625%, 3/15/12 | 975 | 1,046 |
| Media News Group | | |
| 6.375%, 4/1/14 | 300 | 282 |
| 6.875%, 10/1/13 | 575 | 561 |
| Morris Publishing Group, 7.00% | | |
| 8/1/13 | 850 | 825 |
| Primedia | | |
| 8.00%, 5/15/13 | 625 | 628 |
| 8.875%, 5/15/11 | 250 | 262 |
| Quebecor Media, 11.125% | | |
| 7/15/11 | 3,750 | 4,153 |
| R.H. Donnelley Finance | | |
| 10.875%, 12/15/12 | 2,150 | 2,486 |
| Vertis | | |
| 9.75%, 4/1/09 | 775 | 814 |
| 10.875%, 6/15/09 | 880 | 858 |
| WDAC Subsidiary, 144A | | |
| 8.375%, 12/1/14 | 575 | 538 |
| | | 28,575 |
| | | |
| Restaurants 0.8% | | |
| El Pollo Loco | | |
| 9.25%, 12/15/09 | 200 | 201 |
| STEP, 0.00%, 3/15/10 | 1,150 | 793 |
| Landry’s Restaurant, 144A, 7.50% | | |
| 12/15/14 | 925 | 863 |
| O’Charleys, 9.00%, 11/1/13 | 1,150 | 1,222 |
| Perkins Family Restaurant | | |
| 10.125%, 12/15/07 | 475 | 475 |
| Real Mex Restaurants, 144A, VR | | |
| 10.50%, 4/1/10 | 225 | 232 |
| | | 3,786 |
| | | |
| Retail 1.1% | | |
| Gregg Appliances, 144A, 9.00% | | |
| 2/1/13 | 875 | 796 |
| Leslies Poolmart, 144A, 7.75% | | |
| 2/1/13 | 1,550 | 1,533 |
| Movie Gallery, 144A, 11.00% | | |
| 5/1/12 | 1,150 | 1,185 |
| Nebraska Book, 8.625%, 3/15/12 | 1,850 | 1,683 |
| | | 5,197 |
| | | |
| Satellites 1.0% | | |
| Inmarsat Finance | | |
| 7.625%, 6/30/12 | 500 | 526 |
| STEP, 0.00%, 11/15/12 | 900 | 661 |
| Intelsat | | |
| 144A, STEP, 0.00%, 2/1/15 | 650 | 410 |
| Bermuda, 144A, VR, 7.805% | | |
| 1/15/12 | 1,875 | 1,898 |
| Panamsat | | |
| 9.00%, 8/15/14 | 1,175 | 1,278 |
| 144A, STEP, 0.00%, 11/1/14 | 125 | 85 |
| | | 4,858 |
| | | |
| Services 4.5% | | |
| Allied Waste | | |
| 8.875%, 4/1/08 | 850 | 890 |
| 9.25%, 9/1/12 | 1,817 | 1,949 |
| Brand Intermediate Holdings | | |
| PIK, 144A 13.00%, 10/15/13 | 1,418 | 1,503 |
| Brand Services, 12.00%, 10/15/12 | 1,700 | 1,874 |
| Brickman Group, 11.75% | | |
| 12/15/09 | 1,975 | 2,232 |
| Casella Waste Systems, 9.75% | | |
| 2/1/13 | 3,050 | 3,264 |
| Great Lakes Dredge & Dock | | |
| 7.75%, 12/15/13 | 350 | 271 |
| IPC Acquisition, 11.50% | | |
| 12/15/09 | 1,575 | 1,709 |
| Laidlaw International, 10.75% | | |
| 6/15/11 | 2,425 | 2,740 |
| NationsRent, 9.50%, 10/15/10 | 850 | 901 |
| Sunstate Equipment, 144A | | |
| 10.50%, 4/1/13 | 1,175 | 1,184 |
| Synagro Technologies, 9.50% | | |
| 4/1/09 | 675 | 737 |
| Worldspan, 144A, VR, 9.518% | | |
| 2/15/11 | 1,625 | 1,414 |
| | | 20,668 |
| | | |
| Specialty Chemicals 6.1% | | |
| Arco Chemical | | |
| 9.80%, 2/1/20 | 725 | 819 |
| 10.25%, 11/1/10 | 1,025 | 1,130 |
| Borden U.S. Finance / Nova Scotia | | |
| 144A, 9.00%, 7/15/14 | 975 | 990 |
| Compass Minerals | | |
| 10.00%, 8/15/11 | 1,350 | 1,472 |
| STEP, 0.00%, 6/1/13 | 2,575 | 2,150 |
| Crystal U.S. Holdings | | |
| 9.625% 6/15/14 | 1,725 | 1,932 |
| 144A, STEP, 0.00%, 10/1/14 | 681 | 459 |
| Equistar Chemicals, 8.75% | | |
| 2/15/09 | 175 | 184 |
| Freeport McMoRan Resources | | |
| 7.00%, 2/15/08 | 900 | 909 |
| Huntsman, 11.625%, 10/15/10 | 930 | 1,072 |
| Huntsman International | | |
| 9.875%, 3/1/09 | 1,725 | 1,846 |
| VR, 5.88%, 3/31/10 ‡ | 1,000 | 1,017 |
| IMC Global | | |
| 10.875%, 6/1/08 | 225 | 337 |
| 10.875%, 8/1/13 | 550 | 292 |
| Series B, 11.25%, 6/1/11 | 225 | 249 |
| Invista, 144A, 9.25%, 5/1/12 | 2,225 | 2,420 |
| KI Holdings, 144A, STEP, 0.00% | | |
| 11/15/14 | 2,300 | 1,311 |
| Koppers Industries, 9.875% | | |
| 10/15/13 | 1,725 | 1,837 |
| Lyondell Chemical | | |
| 9.50%, 12/15/08 | 150 | 160 |
| 9.625%, 5/1/07 | 175 | 185 |
| 10.50%, 6/1/13 | 1,650 | 1,869 |
| 11.125%, 7/15/12 | 325 | 367 |
| Resolution Performance Products | | |
| 9.50%, 4/15/10 | 1,000 | 1,035 |
| Rhodia, 10.25%, 6/1/10 | 2,175 | 2,305 |
| Rockwood Specialties, 10.625% | | |
| 5/15/11 | 950 | 1,031 |
| United Agri Products, VR, 8.25% | | |
| 12/15/11 | 750 | 761 |
| | | 28,139 |
| | | |
| Supermarkets 0.6% | | |
| Jean Coutu Group | | |
| 7.625%, 8/1/12 | 1,350 | 1,380 |
| 8.50%, 8/1/14 | 1,525 | 1,483 |
| | | 2,863 |
| | | |
| Telecommunications 4.4% | | |
| AT&T, STEP, 9.05%, 11/15/10 | 1,600 | 1,842 |
| Call-Net Enterprises, 10.625% | | |
| 12/31/08 | 1,750 | 1,873 |
| Eircom Funding, 8.25%, 8/15/13 | 2,025 | 2,126 |
| Leucadia National, 7.00% | | |
| 8/15/13 | 1,200 | 1,182 |
| MCI, VR, 7.688%, 5/1/09 | 2,050 | 2,142 |
| Primus Telecommunications | | |
| 8.00%, 1/15/14 | 1,475 | 767 |
| 12.75%, 10/15/09 | 25 | 11 |
| Qwest Communications | | |
| International, 144A, VR | | |
| 6.768%, 2/15/09 | 2,600 | 2,587 |
| Qwest Corporation | | |
| VR, 6.95%, 6/30/10 ‡ | 750 | 724 |
| VR, 7.39%, 6/30/07 ‡ | 2,250 | 2,312 |
| Quest Services, 144A, STEP | | |
| 13.50%, 12/15/10 | 1,700 | 1,930 |
| Time Warner Telecom | | |
| 9.75%, 7/15/08 | 1,150 | 1,150 |
| 10.125%, 2/1/11 | 1,150 | 1,115 |
| US LEC, VR, 11.89%, 10/1/09 | 800 | 826 |
| | | 20,587 |
| | | |
| Transportation (excluding Railroads) 0.6% | | |
| TFM, 144A, 9.375%, 5/1/12 | 550 | 569 |
| TravelCenters of America, 12.75% | | |
| 5/1/09 | 1,850 | 2,035 |
| | | 2,604 |
| | | |
| Wireless Communications 4.7% | | |
| Alamosa, 11.00% | | |
| 7/31/10 | 1,825 | 2,035 |
| American Tower | | |
| 7.125%, 10/15/12 | 475 | 493 |
| 7.50%, 5/1/12 | 375 | 393 |
| Centennial Communications | | |
| 8.125%, 2/1/14 | 850 | 871 |
| Crown Castle | | |
| 7.50%, 12/1/13 | 475 | 538 |
| Series B, 7.50%, 12/1/13 | 1,000 | 1,132 |
| Horizon PCS, 144A, 11.375% | | |
| 7/15/12 | 625 | 686 |
| IPCS, 11.50%, 5/1/12 | 725 | 801 |
| Nextel Communications | | |
| 6.875%, 10/31/13 | 1,275 | 1,361 |
| 7.375%, 8/1/15 | 3,250 | 3,518 |
| Nextel Partners, 8.125%, 7/1/11 | 1,150 | 1,251 |
| Rogers Wireless | | |
| 6.375%, 3/1/14 | 225 | 224 |
| 7.50%, 3/15/15 | 625 | 669 |
| 8.00%, 12/15/12 | 2,175 | 2,327 |
| 9.625%, 5/1/11 | 1,150 | 1,340 |
| Syniverse Technologies, 12.75% | | |
| 2/1/09 | 1,475 | 1,637 |
| U.S. Unwired, 10.00%, 6/15/12 | 1,000 | 1,095 |
| Ubiquitel Operating, 9.875% | | |
| 3/1/11 | 1,300 | 1,404 |
| | | 21,775 |
| | | |
| Total Corporate Bonds and Notes | | |
| (Cost $419,412) | | 424,926 |
| |
| COMMON STOCKS 3.0% | | |
| | | |
| Automobiles and Related 0.1% | | |
| TRW Automotive * | 31 | 636 |
| | | 636 |
| | | |
| Electric Utilities 0.8% | | |
| Duke Energy | 17 | 480 |
| FirstEnergy | 12 | 509 |
| NiSource | 44 | 1,064 |
| NRG Energy * | 2 | 80 |
| Teco Energy | 44 | 779 |
| Williams Companies | 47 | 869 |
| | | 3,781 |
| | | |
| Food/Tobacco 0.2% | | |
| Interstate Bakeries * | 119 | 764 |
| | | 764 |
| | | |
| Gaming 0.0% | | |
| Las Vegas Sands * | 4 | 131 |
| Mikohn Gaming, Warrants | | |
| 8/15/08, 144A * | 2 | 43 |
| | | 174 |
| | | |
| Paper and Paper Products 0.0% | | |
| MDP Acquisitions, Warrants | | |
| 10/1/13, 144A * | 0 | 4 |
| | | 4 |
| | | |
| Services 0.1% | | |
| Synagro Technologies * | 83 | 375 |
| | | 375 |
| | | |
| Specialty Chemicals 0.2% | | |
| UAP Holdings | 62 | 901 |
| | | 901 |
| | | |
| Telecommunications 0.1% | | |
| Time Warner Telecom, Class A * | 46 | 235 |
| | | 235 |
| | | |
| Transportation (excluding Railroads) 0.0% | | |
| TravelCenters of America | | |
| Warrants, 11/14/10 * | 2 | 2 |
| Warrants, 5/1/09 * | 6 | 7 |
| | | 9 |
| | | |
| Wireless Communications 1.5% | | |
| Nextel Communications, Class A * | 41 | 1,227 |
| Nextel Partners, Class A * | 48 | 1,148 |
| Rogers Communications, Class B | 52 | 1,579 |
| Sprint | 50 | 1,193 |
| Telus (Non-voting shares) | 51 | 1,644 |
| | | 6,791 |
| | | |
| Total Common Stocks (Cost $11,445) | | 13,670 |
| |
| CONVERTIBLE PREFERRED STOCKS 0.2% | | |
| | | |
| Electric Utilities 0.2% | | |
| NRG Energy, 144A | 1 | 1,009 |
| | | |
| Total Convertible Preferred Stocks | | |
| (Cost $996) | | 1,009 |
| |
| PREFERRED STOCKS 0.2% | | |
| | | |
| Broadcasting 0.1% | | |
| Spanish Broadcasting ‡ | 0 | 437 |
| | | 437 |
| | | |
| Printing and Publishing 0.1% | | |
| Primedia ‡ | 2 | 205 |
| | | 205 |
| | | |
| Textiles and Apparel 0.0% | | |
| Anvil Holdings, Series B *‡ | 21 | 192 |
| | | 192 |
| | | |
| Total Preferred Stocks (Cost $1,103) | | 834 |
| |
| SHORT-TERM INVESTMENTS 2.5% | | |
| | | |
| Money Market Funds 2.5% | | |
| | | |
| T. Rowe Price Reserve Investment | | |
| Fund, 3.07% #† | 11,676 | 11,676 |
| | | |
| Total Short-Term Investments | | |
| (cost $11,676) | | 11,676 |
| | | |
| Total Investments in Securities | | |
| 97.5% of Net Assets (Cost $444,632) | $ | 452,115 |
| (1) | Denominated in U.S. dollars unless otherwise noted |
| + | At May 31, 2005, some of the fund’s securities were valued |
| | by the T. Rowe Price Valuation Committee, established by |
| | the fund’s Board of Directors – See Note 1 |
| # | Seven-day yield |
| * | Non-income producing |
| †† | In default with respect to payment of interest. |
| † | Affiliated company – See Note 4 |
| 144A | Security was purchased pursuant to Rule 144A under |
| | the Securities Act of 1933 and may be resold in transactions |
| | exempt from registration only to qualified institutional |
| | buyers—total value of such securities at period-end |
| | amounts to $86,336 and represents 18.6% of net assets |
| EUR | Euro |
| PIK | Payment-in-Kind |
| STEP | Stepped coupon bond for which the coupon rate of interest |
| | will adjust on specified future date(s) |
| VR | Variable Rate; rate shown is effective rate at period-end |
| ‡ Restricted Securities | | | |
| Amounts in (000s) | | | |
| | | | |
The fund may invest in securities that cannot be offered for public resale without first being registered under the Securities Act of 1933 and related rules. The total value of restricted securities (excluding 144A issues) at period-end amounts to $9,114 and represents 2.0% of net assets.
| | Acquisition | | Acquisition |
| Description | Date | | Cost |
| Anvil Holdings, Series B | 9/23/02-5/20/03 | $ | 489 |
| Huntsman International, VR, 5.88%, 3/31/10 | 10/31/04 | | 1,000 |
| Masonite, VR, 9.13%, 10/6/06 | 4/6/05 | | 2,800 |
| Olympus Communications, VR, 6.50%, 6/30/10 | 5/21/03 | | 1,337 |
| Primedia | 5/7/03 | | 183 |
| Qwest Corporation, VR, 6.95%, 6/30/10 | 6/5/03 | | 2,227 |
| Qwest Corporation, VR, 7.39%, 6/30/07 | 6/5/03 | | 738 |
| Spanish Broadcasting | 5/2/05-6/30/05 | | 442 |
| Totals | | $ | 9,216 |
The fund has registration rights for certain restricted securities held as of May 31, 2005. Any costs related to such registration are borne by the issuer.
The accompanying notes are an integral part of these financial statements.
| Statement of Assets and Liabilities | | |
| T. Rowe Price Institutional High Yield Fund | | |
| May 31, 2005 | | |
| (In thousands except shares and per share amounts) | | |
| |
| Assets | | |
| Investments in securities, at value | | |
| Affiliated companies (cost $11,676) | $ | 11,676 |
| Non-affiliated companies (cost $432,956) | | 440,439 |
|
|
| Total investments in securities | | 452,115 |
| Dividends and interest receivable | | 9,684 |
| Receivable for investment securities sold | | 4,341 |
| Receivable for shares sold | | 189 |
| Other assets | | 100 |
|
|
| Total assets | | 466,429 |
|
|
| |
| Liabilities | | |
| Payable for investment securities purchased | | 2,103 |
| Due to affiliates | | 204 |
| Other liabilities | | 325 |
|
|
| Total liabilities | | 2,632 |
|
|
| |
| NET ASSETS | $ | 463,797 |
|
|
| Net Assets Consist of: | | |
| Undistributed net investment income (loss) | $ | (334) |
| Undistributed net realized gain (loss) | | 9,086 |
| Net unrealized gain (loss) | | 7,483 |
| Paid-in-capital applicable to 44,343,269 shares of | | |
| $0.0001 par value capital stock outstanding; | | |
| 1,000,000,000 shares of the Corporation authorized | | 447,562 |
|
|
| |
| NET ASSETS | $ | 463,797 |
|
|
| NET ASSET VALUE PER SHARE | $ | 10.46 |
|
|
The accompanying notes are an integral part of these financial statements.
| Statement of Operations | | |
| T. Rowe Price Institutional High Yield Fund | | |
| ($ 000s) | | |
| |
| | | Year |
| | | Ended |
| | | 5/31/05 |
| Investment Income (Loss) | | |
| Income | | |
| Interest | $ | 48,437 |
| Dividend | | 863 |
| Other | | 1,150 |
|
|
| Total income | | 50,450 |
| Investment management and administrative expense | | 3,135 |
|
|
| Net investment income (loss) | | 47,315 |
|
|
| Realized and Unrealized Gain (Loss) | | |
| Net realized gain (loss) | | |
| Securities | | 15,454 |
| Foreign currency transactions | | (23) |
|
|
| Net realized gain (loss) | | 15,431 |
|
|
| Change in net unrealized gain (loss) | | |
| Securities | | (2,578) |
| Other assets and liabilities | | |
| denominated in foreign currencies | | (1) |
|
|
| Change in net unrealized gain (loss) | | (2,579) |
|
|
| Net realized and unrealized gain (loss) | | 12,852 |
|
|
| |
| INCREASE (DECREASE) IN NET | | |
| ASSETS FROM OPERATIONS | $ | 60,167 |
|
|
The accompanying notes are an integral part of these financial statements.
| Statement of Changes in Net Assets | | | | |
| T. Rowe Price Institutional High Yield Fund | | | | |
| ($ 000s) | | | | |
| |
| | | Year | | |
| | | Ended | | |
| | | 5/31/05 | | 5/31/04 |
| |
| Increase (Decrease) in Net Assets | | | | |
| Operations | | | | |
| Net investment income (loss) | $ | 47,315 | $ | 55,918 |
| Net realized gain (loss) | | 15,431 | | 12,974 |
| Change in net unrealized gain (loss) | | (2,579) | | (2,769) |
|
|
| Increase (decrease) in net assets from operations | | 60,167 | | 66,123 |
|
|
| Distributions to shareholders | | | | |
| Net investment income | | (49,596) | | (57,336) |
| Net realized gain | | (13,651) | | (1,296) |
|
|
| Decrease in net assets from distributions | | (63,247) | | (58,632) |
|
|
| Capital share transactions * | | | | |
| Shares sold | | 42,487 | | 117,743 |
| Distributions reinvested | | 55,696 | | 52,467 |
| Shares redeemed | | (347,870) | | (47,568) |
|
|
| Increase (decrease) in net assets from capital | | | | |
| share transactions | | (249,687) | | 122,642 |
|
|
| |
| Net Assets | | | | |
| Increase (decrease) during period | | (252,767) | | 130,133 |
| Beginning of period | | 716,564 | | 586,431 |
|
|
| |
| End of period | $ | 463,797 | $ | 716,564 |
|
|
| (Including undistributed net investment income/(loss) | | | | |
| of $(334) at 5/31/05 and $(587) at 5/31/04) | | | | |
| | | | | |
| *Share information | | | | |
| Shares sold | | 3,943 | | 11,005 |
| Distributions reinvested | | 5,149 | | 4,876 |
| Shares redeemed | | (32,251) | | (4,408) |
|
|
| Increase (decrease) in shares outstanding | | (23,159) | | 11,473 |
The accompanying notes are an integral part of these financial statements.
| Notes to Financial Statements |
| T. Rowe Price Institutional High Yield Fund |
| May 31, 2005 |
NOTE 1 - SIGNIFICANT ACCOUNTING POLICIES
T. Rowe Price Institutional Income Funds, Inc. (the corporation) is registered under the Investment Company Act of 1940 (the 1940 Act). The Institutional High Yield Fund (the fund), a diversified, open-end management investment company, is one portfolio established by the corporation. The fund commenced operations on May 31, 2002. The fund seeks high current income and, secondarily, capital appreciation.
The accompanying financial statements were prepared in accordance with accounting principles generally accepted in the United States of America, which require the use of estimates made by fund management.
Valuation The fund values its investments and computes its net asset value per share at the close of the New York Stock Exchange (NYSE), normally 4 p.m. ET, each day that the NYSE is open for business. Debt securities are generally traded in the over-the-counter market. Securities with original maturities of one year or more are valued at prices furnished by dealers who make markets in such securities or by an independent pricing service, which considers yield or price of bonds of comparable quality, coupon, maturity, and type, as well as prices quoted by dealers who make markets in such securities. Securities with original maturities of less than one year are stated at fair value, which is determined by using a matrix system that establishes a value for each security based on bid-side money market yields.
Equity securities listed or regularly traded on a securities exchange or in the over-the-counter market are valued at the last quoted sale price or, for certain markets, the official closing price at the time the valuations are made, except for OTC Bulletin Board securities, which are valued at the mean of the latest bid and asked prices. A security that is listed or traded on more than one exchange is valued at the quotation on the exchange determined to be the primary market for such security. Listed securities not traded on a particular day are valued at the mean of the latest bid and asked prices for domestic securities and the last quoted sale price for international securities.
Investments in mutual funds are valued at the mutual fund’s closing net asset value per share on the day of valuation.
Other investments, including restricted securities, and those for which the above valuation procedures are inappropriate or are deemed not to reflect fair value are stated at fair value as determined in good faith by the T. Rowe Price Valuation Committee, established by the fund’s Board of Directors.
Most foreign markets close before the close of trading on the NYSE. If the fund determines that developments between the close of a foreign market and the close of the NYSE will, in its judgment, materially affect the value of some or all of its portfolio securities, which in turn will affect the fund’s share price, the fund will adjust the previous closing prices to reflect the fair value of the securities as of the close of the NYSE, as determined in good faith by the T. Rowe Price Valuation Committee, established by the fund’s Board of Directors. A fund may also fair value securities in other situations, such as when a particular foreign market is closed but the fund is open. In deciding whether to make fair value adjustments, the fund reviews a variety of factors, including developments in foreign markets, the performance of U.S. securities markets, and the performance of instruments trading in U. S. markets that represent foreign securities and baskets of foreign securities. The fund uses outside pricing services to provide it with closing market prices and information used for adjusting those prices. The fund cannot predict how often it will use closing prices and how often it will adjust those prices. As a means of evaluating its fair value process, the fund routinely compares closing market prices, the next day’s opening prices in the same markets, and adjusted prices.
Currency Translation Assets, including investments, and liabilities denominated in foreign currencies are translated into U.S. dollar values each day at the prevailing exchange rate, using the mean of the bid and asked prices of such currencies against U.S. dollars as quoted by a major bank. Purchases and sales of securities, income, and expenses are translated into U.S. dollars at the prevailing exchange rate on the date of the transaction. The effect of changes in foreign currency exchange rates on realized and unrealized security gains and losses is reflected as a component of security gains and losses.
Investment Transactions, Investment Income, and Distributions Income and expenses are recorded on the accrual basis. Premiums and discounts on debt securities are amortized for financial reporting purposes. Dividends received from mutual fund investments are reflected as dividend income; capital gain distributions are reflected as realized gain/loss. Dividend income and capital gain distributions are recorded on the ex-dividend date. Investment transactions are accounted for on the trade date. Realized gains and losses are reported on the identified cost basis. Paydown gains and losses are recorded as an adjustment to interest income. Distributions to shareholders are recorded on the ex-dividend date. Income distributions are declared on a daily basis and paid monthly. Capital gain distributions, if any, are declared and paid by the fund, typically on an annual basis.
NOTE 2 - INVESTMENT TRANSACTIONS
Consistent with its investment objective, the fund engages in the following practices to manage exposure to certain risks or enhance performance. The investment objective, policies, program, and risk factors of the fund are described more fully in the fund’s prospectus and Statement of Additional Information.
Noninvestment-Grade Debt Securities At May 31, 2005, approximately 91% of the fund’s net assets were invested in noninvestment-grade debt securities, commonly referred to as “high-yield” or “junk” bonds. A real or perceived economic downturn or higher interest rates could adversely affect the liquidity or value, or both, of such securities because such events could lessen the ability of issuers to make principal and interest payments.
Restricted Securities The fund may invest in securities that are subject to legal or contractual restrictions on resale. Although certain of these securities may be readily sold, for example, under Rule 144A, others may be illiquid, their sale may involve substantial delays and additional costs, and prompt sale at an acceptable price may be difficult.
Other Purchases and sales of portfolio securities, other than short-term securities, aggregated $385,707,000 and $652,705,000, respectively, for the year ended May 31, 2005.
NOTE 3 - FEDERAL INCOME TAXES
No provision for federal income taxes is required since the fund intends to continue to qualify as a regulated investment company under Subchapter M of the Internal Revenue Code and distribute to shareholders all of its taxable income and gains. Federal income tax regulations differ from generally accepted accounting principles; therefore, distributions determined in accordance with tax regulations may differ significantly in amount or character from net investment income and realized gains for financial reporting purposes. Financial reporting records are adjusted for permanent book/tax differences to reflect tax character. Financial records are not adjusted for temporary differences.
Distributions during the year ended May 31, 2005, were characterized as follows for tax purposes:
| Ordinary income | $ | 57,559,000 |
| Long-term capital gain | | 5,688,000 |
|
|
| Total distributions | $ | 63,247,000 |
|
|
At May 31, 2005, the tax-basis components of net assets were as follows:
| Unrealized appreciation | $ | 15,297,000 |
| Unrealized depreciation | | (8,946,000) |
|
|
| Net unrealized appreciation (depreciation) | | 6,351,000 |
| Undistributed ordinary income | | 1,480,000 |
| Undistributed long-term capital gain | | 8,404,000 |
| Paid-in capital | | 447,562,000 |
|
|
| |
| Net assets | $ | 463,797,000 |
|
|
For federal income tax purposes, market discount is recognized as income at the time of sale in the amount of the lesser of gain or scheduled amortization. Accordingly, at May 31, 2005, amortization of $1,133,000 that has been recognized as income for financial reporting purposes is treated as unrealized appreciation for tax purposes.
For the year ended May 31, 2005, the fund recorded the following permanent reclassifications to reflect tax character. Reclassifications to paid-in capital relate primarily to a tax practice that treats a portion of the proceeds from each redemption of capital shares as a distribution of taxable net investment income and/or realized capital gain. Reclassifications between income and gain relate primarily to differences between book/tax amortization policies. Results of operations and net assets were not affected by these reclassifications.
| Undistributed net investment income | $ | 2,534,000 |
| Undistributed net realized gain | | (5,864,000) |
| Paid-in capital | | 3,330,000 |
At May 31, 2005, the cost of investments for federal income tax purposes was $445,764,000.
NOTE 4 - RELATED PARTY TRANSACTIONS
The fund is managed by T. Rowe Price Associates, Inc. (the manager or Price Associates), a wholly owned subsidiary of T. Rowe Price Group, Inc. The investment management and administrative agreement between the fund and the manager provides for an all-inclusive annual fee equal to 0.50% of the fund’s average daily net assets. The fee is computed daily and paid monthly. The agreement provides that investment management, shareholder servicing, transfer agency, accounting, and custody services are provided to the fund, and interest, taxes, brokerage commissions, directors’ fees and expenses, and extraordinary expenses are paid directly by the fund.
The fund may invest in the T. Rowe Price Reserve Investment Fund and the T. Rowe Price Government Reserve Investment Fund (collectively, the Reserve Funds), open-end management investment companies managed by Price Associates and affiliates of the fund. The Reserve Funds are offered as cash management options to mutual funds, trusts, and other accounts managed by Price Associates and/or its affiliates, and are not available for direct purchase by members of the public. The Reserve Funds pay no investment management fees. During the year ended May 31, 2005, dividend income from the Reserve Funds totaled $378,000, and the value of shares of the Reserve Funds held at May 31, 2005 and May 31, 2004 was $11,676,000 and $19,230,000, respectively.
Mutual funds and other accounts managed by T. Rowe Price and its affiliates may invest in the fund; however, no T. Rowe Price fund may invest for the purpose of exercising management or control over the fund. At May 31, 2005, approximately 15% of the fund’s outstanding shares were held by T. Rowe Price funds.
NOTE 5 - INTERFUND BORROWING
Pursuant to its prospectus, the fund may borrow up to 33% of its total assets. The fund is party to an interfund borrowing agreement between itself and other T. Rowe Price-sponsored mutual funds, which permits it to borrow or lend cash at rates beneficial to both the borrowing and lending funds. Loans totaling 10% or more of a borrowing fund’s total assets are collateralized at 102% of the value of the loan; loans of less than 10% are unsecured. During the year ended May 31, 2005, the fund had outstanding borrowings on one day, in the average amount of $11,300,000, and at an average annual rate of 2.4% . There were no borrowings outstanding at May 31, 2005.
Report of Independent Registered Public Accounting Firm
To the Board of Directors of T. Rowe Price Institutional Income Funds, Inc. and Shareholders of T. Rowe Price Institutional High Yield Fund
In our opinion, the accompanying statement of assets and liabilities, including the portfolio of investments, and the related statements of operations and of changes in net assets and the financial highlights present fairly, in all material respects, the financial position of T. Rowe Price Institutional High Yield Fund (one of the portfolios comprising T. Rowe Price Institutional Income Funds, Inc., hereafter referred to as the “Fund”) at May 31, 2005, the results of its operations, the changes in its net assets for each of the two years in the period then ended and the financial highlights for each of the fiscal periods presented, in conformity with accounting principles generally accepted in the United States of America. These financial statements and financial highlights (hereafter referred to as “financial statements”) are the responsibility of the Fund’s management; our responsibility is to express an opinion on these financial statements based on our audits. We conducted our audits of these financial statements in accordance with the auditing standards of the Public Company Accounting Oversight Board (United States). Those standards require that we plan and perform the audit to obtain reasonable assurance about whether the financial statements are free of material misstatement. An audit includes examining, on a test basis, evidence supporting the amounts and disclosures in the financial statements, assessing the accounting principles used and significant estimates made by management, and evaluating the overall financial statement presentation. We believe that our audits, which included confirmation of securities at May 31, 2005 by correspondence with the custodian and brokers, provide a reasonable basis for our opinion.
PricewaterhouseCoopers LLP
Baltimore, Maryland
July 12, 2005
| Tax Information (Unaudited) for the Tax Year Ended 5/31/05 |
We are providing this information as required by the Internal Revenue Code. The amounts shown may differ from those elsewhere in this report because of differences between tax and financial reporting requirements.
The fund’s distributions to shareholders included:
• $9,921,000 from short-term capital gains,
• $7,060,000 from long-term capital gains, subject to the 15% rate gains category.
For taxable non-corporate shareholders, $387,000 of the fund’s income represents qualified dividend income subject to the 15% rate category.
For corporate shareholders, $374,000 of the fund’s income qualifies for the dividends-received deduction.
| Information on Proxy Voting Policies, Procedures, and Records |
A description of the policies and procedures used by T. Rowe Price funds and portfolios to determine how to vote proxies relating to portfolio securities is available in each fund’s Statement of Additional Information, which you may request by calling 1-800-225-5132 or by accessing the SEC’s Web site, www.sec.gov. The description of our proxy voting policies and procedures is also available on our Web site, www.troweprice.com. To access it, click on the words “Company Info” at the top of our homepage for individual investors. Then, in the window that appears, click on the “Proxy Voting Policy” navigation button in the top left corner.
Each fund’s most recent annual proxy voting record is available on our Web site and through the SEC’s Web site. To access it through our Web site, follow the directions above, then click on the words “Proxy Voting Record” at the bottom of the Proxy Voting Policy page.
| How to Obtain Quarterly Portfolio Holdings |
The fund files a complete schedule of portfolio holdings with the Securities and Exchange Commission for the first and third quarters of each fiscal year on Form N-Q. The fund’s Form N-Q is available electronically on the SEC’s Web site (www.sec.gov); hard copies may be reviewed and copied at the SEC’s Public Reference Room, 450 Fifth St. N.W., Washington, DC 20549. For more information on the Public Reference Room, call 1-800-SEC-0330.
| Approval of Investment Management Agreement |
On March 2, 2005, the fund’s Board of Directors unanimously approved the investment advisory contract (“Contract”) between the fund and its investment manager, T. Rowe Price Associates, Inc. (“Manager”). The Board considered a variety of factors in connection with its review of the Contract, also taking into account information provided by the Manager during the course of the year, as discussed below:
Services Provided by the Manager
The Board considered the nature, quality, and extent of the services provided to the fund by the Manager. These services included, but were not limited to, management of the fund’s portfolio and a variety of activities related to portfolio management. The Board also reviewed the background and experience of the Manager’s senior management team and investment personnel involved in the management of the fund. The Board concluded that it was satisfied with the nature, quality, and extent of the services provided by the Manager.
Investment Performance of the Fund
The Board reviewed the fund’s year-by-year returns and compared these returns to a wide variety of previously agreed upon comparable performance measures and market data, including those supplied by Lipper and Morningstar, which are independent providers of mutual fund data. On the basis of this evaluation and the Board’s ongoing review of investment results, the Board concluded that the fund’s performance was satisfactory.
Costs, Benefits, Profits, and Economies of Scale
The Board reviewed detailed information regarding the revenues received by the Manager under the Contract and other benefits that the Manager (and its affiliates) may have realized from its relationship with the fund, including research received under “soft dollar” agreements. The Board also received information on the estimated costs incurred and profits realized by the Manager and its affiliates from advising T. Rowe Price mutual funds, as well as estimates of the gross profits realized from managing the fund in particular. The Board concluded that the Manager’s profits were reasonable in light of the services provided to the fund. The Board also considered whether the fund or other funds benefit under the fee levels set forth in the Contract from any economies of scale realized by the Manager. The Board noted that, under the Contract, the fund pays the Manager a single fee based on the fund’s net assets and the Manager, in turn, pays all expenses of the fund, with certain exceptions. The Board concluded that, based on the profitability data it reviewed and consistent with this single fee structure, the Contract provided for a reasonable sharing of any benefits from economies of scale with the fund.
Fees
The Board reviewed the fund’s single fee structure and compared the rate to fees and expenses of other comparable funds based on information and data supplied by Lipper. The information provided to the Board showed that the fund’s single fee rate was generally below the median management fee rate and expense ratio for comparable funds. The Board also reviewed the fee schedules for comparable privately managed accounts of the Manager and its affiliates. Management informed the Board that the Manager’s responsibilities for privately managed accounts are more limited than its responsibilities for the fund and other T. Rowe Price mutual funds that it or its affiliates advise. On the basis of the information provided, the Board concluded that the fees paid by the fund under the Contract were reasonable.
Approval of the Contract
As noted, the Board approved the continuation of the Contract. No single factor was considered in isolation or to be determinative to the decision. Rather, the Board concluded, in light of a weighting and balancing of all factors considered, that it was in the best interests of the fund to approve the continuation of the Contract, including the fees to be charged for services thereunder.
| About the Fund’s Directors and Officers |
Your fund is governed by a Board of Directors that meets regularly to review investments, performance, expenses, and other business matters, and is responsible for protecting the interests of shareholders. The majority of the fund’s directors are independent of T. Rowe Price Associates, Inc. (T. Rowe Price); “inside” directors are officers of T. Rowe Price. The Board of Directors elects the fund’s officers, who are listed in the final table. The business address of each director and officer is 100 East Pratt Street, Baltimore, MD 21202. The Statement of Additional Information includes additional information about the fund directors and is available without charge by calling a T. Rowe Price representative at 1-800-638-8790.
| Independent Directors | |
| | |
| Name | |
| (Year of Birth) | |
| Year Elected* | Principal Occupation(s) During Past 5 Years and Directorships of Other Public Companies |
| |
| Anthony W. Deering | Chairman, Exeter Capital, LLC, a private investment firm (2004 to present); Director, Chairman of the Board, and |
| (1945) | Chief Executive Officer, The Rouse Company, real estate developers (1997 to 2004); Director, Mercantile Bank (4/03 |
| 2002 | to present) |
| |
| Donald W. Dick, Jr. | Principal, EuroCapital Advisors, LLC, an acquisition and management advisory firm; Chairman, President, and Chief |
| (1943) | Executive Officer, The Haven Group, a custom manufacturer of modular homes (1/04 to present) |
| 2002 | |
| |
| David K. Fagin | Chairman and President, Nye Corporation (6/88 to present); Director, Canyon Resources Corporation and Golden |
| (1938) | Star Resources Ltd. (5/00 to present), and Pacific Rim Mining Corp. (2/02 to present) |
| 2002 | |
| |
| Karen N. Horn | Managing Director and President, Global Private Client Services, Marsh Inc. (1999 to 2003); Managing Director and |
| (1943) | Head of International Private Banking, Bankers Trust (1996 to 1999); Director, Eli Lilly and Company and Georgia |
| 2003 | Pacific |
| |
| F. Pierce Linaweaver | President, F. Pierce Linaweaver & Associates, Inc., consulting environmental and civil engineers |
| (1934) | |
| 2002 | |
| |
| Theo C. Rodgers** | President, A&R Development Corporation |
| (1941) | |
| 2005 | |
| |
| John G. Schreiber | Owner/President, Centaur Capital Partners, Inc., a real estate investment company; Partner, Blackstone Real Estate |
| (1946) | Advisors, L.P.; Director, AMLI Residential Properties Trust |
| 2002 | |
| |
| * Each independent director oversees 112 T. Rowe Price portfolios and serves until retirement, resignation, or election of a successor. |
| ** Elected effective April 1, 2005. |
| Inside Directors | |
| |
| Name | |
| (Year of Birth) | |
| Year Elected* | |
| [Number of T. Rowe Price | |
| Portfolios Overseen] | Principal Occupation(s) During Past 5 Years and Directorships of Other Public Companies |
| |
| Mary J. Miller, CFA | Director and Vice President, T. Rowe Price; Vice President, T. Rowe Price Group, Inc.; President, Institutional |
| (1955) | Income Funds |
| 2004 | |
| [37] | |
| |
| James S. Riepe | Director and Vice President, T. Rowe Price; Vice Chairman of the Board, Director, and Vice President, T. Rowe Price |
| (1943) | Group, Inc.; Chairman of the Board and Director, T. Rowe Price Global Asset Management Limited, T. Rowe Price |
| 2002 | Global Investment Services Limited, T. Rowe Price Investment Services, Inc., T. Rowe Price Retirement Plan Services, |
| [112] | Inc., and T. Rowe Price Services, Inc.; Chairman of the Board, Director, President, and Trust Officer, T. Rowe Price |
| | Trust Company; Director, T. Rowe Price International, Inc.; Director, The Nasdaq Stock Market, Inc. |
| |
| * Each inside director serves until retirement, resignation, or election of a successor. |
| Officers | |
| |
| Name (Year of Birth) | |
| Title and Fund(s) Served | Principal Occupation(s) |
| |
| Connice A. Bavely, CFA (1951) | Vice President, T. Rowe Price and T. Rowe Price Group, Inc. |
| Vice President, Institutional Income Funds | |
| |
| Brian J. Brennan, CFA (1964) | Vice President, T. Rowe Price, T. Rowe Price Group, Inc., and T. Rowe |
| Executive Vice President, Institutional Income Funds | Price Trust Company |
| |
| Andrew M. Brooks (1956) | Vice President, T. Rowe Price and T. Rowe Price Group, Inc. |
| Vice President, Institutional Income Funds | |
| |
| Joseph A. Carrier, CPA (1960) | Vice President, T. Rowe Price, T. Rowe Price Group, Inc., T. Rowe Price |
| Treasurer, Institutional Income Funds | Investment Services, Inc., and T. Rowe Price Trust Company |
| |
| Michael J. Conelius, CFA (1964) | Vice President, T. Rowe Price, T. Rowe Price Group, Inc., and T. Rowe |
| Vice President, Institutional Income Funds | Price International, Inc. |
| |
| Roger L. Fiery III, CPA (1959) | Vice President, T. Rowe Price, T. Rowe Price Group, Inc., T. Rowe Price |
| Vice President, Institutional Income Funds | International, Inc., and T. Rowe Price Trust Company |
| |
| Robert N. Gensler (1957) | Vice President, T. Rowe Price, T. Rowe Price Group, Inc., and T. Rowe |
| Vice President, Institutional Income Funds | Price International, Inc. |
| |
| John R. Gilner (1961) | Chief Compliance Officer and Vice President, T. Rowe Price; Vice |
| Chief Compliance Officer, Institutional Income Funds | President, T. Rowe Price Group, Inc., and T. Rowe Price Investment |
| | Services, Inc. |
| |
| Gregory S. Golczewski (1966) | Vice President, T. Rowe Price and T. Rowe Price Trust Company |
| Vice President, Institutional Income Funds | |
| | |
| Henry H. Hopkins (1942) | Director and Vice President, T. Rowe Price Investment Services, Inc., |
| Vice President, Institutional Income Funds | T. Rowe Price Services, Inc., and T. Rowe Price Trust Company; Vice |
| | President, T. Rowe Price, T. Rowe Price Group, Inc., T. Rowe Price |
| | International, Inc., and T. Rowe Price Retirement Plan Services, Inc. |
| |
| Paul A. Karpers, CFA (1967) | Vice President, T. Rowe Price and T. Rowe Price Group, Inc. |
| Vice President, Institutional Income Funds | |
| |
| Ian Kelson (1956) | Vice President, T. Rowe Price, T. Rowe Price Group, Inc., and T. Rowe |
| Vice President, Institutional Income Funds | Price International, Inc. |
| |
| Patricia B. Lippert (1953) | Assistant Vice President, T. Rowe Price and T. Rowe Price Investment |
| Secretary, Institutional Income Funds | Services, Inc. |
| |
| Kevin P. Loome, CFA (1967) | Vice President, T. Rowe Price, T. Rowe Price Group, Inc., and T. Rowe |
| Vice President, Institutional Income Funds | Price International, Inc. |
| |
| Michael J. McGonigle (1966) | Vice President, T. Rowe Price and T. Rowe Price Group, Inc. |
| Vice President, Institutional Income Funds | |
| |
| Daniel O. Shackelford, CFA (1958) | Vice President, T. Rowe Price, T. Rowe Price Group, Inc., and T. Rowe |
| Vice President, Institutional Income Funds | Price Trust Company |
| |
| Walter P. Stuart III, CFA (1960) | Vice President, T. Rowe Price and T. Rowe Price Group, Inc. |
| Vice President, Institutional Income Funds | |
| |
| Thomas E. Tewksbury (1961) | Vice President, T. Rowe Price and T. Rowe Price Group, Inc. |
| Vice President, Institutional Income Funds | |
| |
| David A. Tiberii, CFA (1965) | Vice President, T. Rowe Price and T. Rowe Price Group, Inc. |
| Vice President, Institutional Income Funds | |
| |
| Mark J. Vaselkiv (1958) | Vice President, T. Rowe Price and T. Rowe Price Group, Inc. |
| Executive Vice President, Institutional Income Funds | |
| |
| Julie L. Waples (1970) | Vice President, T. Rowe Price |
| Vice President, Institutional Income Funds | |
| |
| Thea N. Williams (1961) | Vice President, T. Rowe Price and T. Rowe Price Group, Inc. |
| Vice President, Institutional Income Funds | |
Unless otherwise noted, officers have been employees of T. Rowe Price or T. Rowe Price International for at least five years.
Item 2. Code of Ethics.The registrant has adopted a code of ethics, as defined in Item 2 of Form N-CSR, applicable to its principal executive officer, principal financial officer, principal accounting officer or controller, or persons performing similar functions. A copy of this code of ethics is filed as an exhibit to this Form N-CSR. No substantive amendments were approved or waivers were granted to this code of ethics during the period covered by this report.
Item 3. Audit Committee Financial Expert.
The registrant’s Board of Directors/Trustees has determined that Mr. David K. Fagin qualifies as an audit committee financial expert, as defined in Item 3 of Form N-CSR. Mr. Fagin is considered independent for purposes of Item 3 of Form N-CSR.
Item 4. Principal Accountant Fees and Services.
(a) – (d) Aggregate fees billed to the registrant for the last two fiscal years for professional services rendered by the registrant’s principal accountant were as follows:
| | 2005 | 2004 |
| Audit Fees | $3,861 | $8,395 |
| Audit-Related Fees | 687 | 763 |
| Tax Fees | 1,180 | 2,320 |
| All Other Fees | 306 | 124 |
Audit fees include amounts related to the audit of the registrant’s annual financial statements and services normally provided by the accountant in connection with statutory and regulatory filings. Audit-related fees include amounts reasonably related to the performance of the audit of the registrant’s financial statements, specifically the issuance of a report on internal controls. Tax fees include amounts related to tax compliance, tax planning, and tax advice. Other fees include the registrant’s pro-rata share of amounts for agreed-upon procedures in conjunction with service contract approvals by the registrant’s Board of Directors/Trustees.
(e)(1) The registrant’s audit committee has adopted a policy whereby audit and non-audit services performed by the registrant’s principal accountant for the registrant, its investment adviser, and any entity controlling, controlled by, or under common control with the investment adviser that provides ongoing services to the registrant require pre-approval in advance at regularly scheduled audit committee meetings. If such a service is required between regularly scheduled audit committee meetings, pre-approval may be authorized by one audit committee member with ratification at the next scheduled audit committee meeting. Waiver of pre-approval for audit or non-audit services requiring fees of a de minimis amount is not permitted.
(2) No services included in (b) – (d) above were approved pursuant to paragraph (c)(7)(i)(C) of Rule 2-01 of Regulation S-X.
(f) Less than 50 percent of the hours expended on the principal accountant’s engagement to audit the registrant’s financial statements for the most recent fiscal year were attributed to work performed by persons other than the principal accountant’s full-time, permanent employees.
(g) The aggregate fees billed for the most recent fiscal year and the preceding fiscal year by the registrant’s principal accountant for non-audit services rendered to the registrant, its investment adviser, and any entity controlling, controlled by, or under common control with the investment adviser that provides ongoing services to the registrant were $903,000 and $821,000, respectively, and were less than the aggregate fees billed for those same periods by the registrant’s principal accountant for audit services rendered to the T. Rowe Price Funds.
(h) All non-audit services rendered in (g) above were pre-approved by the registrant’s audit committee. Accordingly, these services were considered by the registrant’s audit committee in maintaining the principal accountant’s independence.Item 5. Audit Committee of Listed Registrants.
Not applicable.
Item 6. Schedule of Investments.
Not applicable. The complete schedule of investments is included in Item 1 of this Form N-CSR.
Item 7. Disclosure of Proxy Voting Policies and Procedures for Closed-End Management Investment Companies.
Not applicable.
Item 8. Portfolio Managers of Closed-End Management Investment Companies.
Not applicable.
Item 9. Purchases of Equity Securities by Closed-End Management Investment Company and Affiliated Purchasers.
Not applicable.
Item 10. Submission of Matters to a Vote of Security Holders.
Not applicable.
Item 11. Controls and Procedures.
(a) The registrant’s principal executive officer and principal financial officer have evaluated the registrant’s disclosure controls and procedures within 90 days of this filing and have concluded that the registrant’s disclosure controls and procedures were effective, as of that date, in ensuring that information required to be disclosed by the registrant in this Form N-CSR was recorded, processed, summarized, and reported timely.
(b) The registrant’s principal executive officer and principal financial officer are aware of no change in the registrant’s internal control over financial reporting that occurred during the registrant’s second fiscal quarter covered by this report that has materially affected, or is reasonably likely to materially affect, the registrant’s internal control over financial reporting.
Item 12. Exhibits.
(a)(1) The registrant’s code of ethics pursuant to Item 2 of Form N-CSR is attached.
(2) Separate certifications by the registrant's principal executive officer and principal financial officer, pursuant to Section 302 of the Sarbanes-Oxley Act of 2002 and required by Rule 30a-2(a) under the Investment Company Act of 1940, are attached.
(3) Written solicitation to repurchase securities issued by closed-end companies: not applicable.
(b) A certification by the registrant's principal executive officer and principal financial officer, pursuant to Section 906 of the Sarbanes-Oxley Act of 2002 and required by Rule 30a-2(b) under the Investment Company Act of 1940, is attached.
SIGNATURES |
|
| |
| | Pursuant to the requirements of the Securities Exchange Act of 1934 and the Investment |
| Company Act of 1940, the registrant has duly caused this report to be signed on its behalf by the |
| undersigned, thereunto duly authorized. |
| |
| T. Rowe Price Institutional Income Funds, Inc. |
| |
| |
| By | /s/ James S. Riepe |
| | James S. Riepe |
| | Principal Executive Officer |
| |
| Date | July 20, 2005 |
| |
| |
| | Pursuant to the requirements of the Securities Exchange Act of 1934 and the Investment |
| Company Act of 1940, this report has been signed below by the following persons on behalf of |
| the registrant and in the capacities and on the dates indicated. |
| |
| |
| By | /s/ James S. Riepe |
| | James S. Riepe |
| | Principal Executive Officer |
| |
| Date | July 20, 2005 |
| |
| |
| |
| By | /s/ Joseph A. Carrier |
| | Joseph A. Carrier |
| | Principal Financial Officer |
| |
| Date | July 20, 2005 |