Item 1: Report to Shareholders
| Institutional Core Plus Fund | May 31, 2005 |
The views and opinions in this report were current as of May 31, 2005. They are not guarantees of performance or investment results and should not be taken as investment advice. Investment decisions reflect a variety of factors, and the managers reserve the right to change their views about individual stocks, sectors, and the markets at any time. As a result, the views expressed should not be relied upon as a forecast of the fund’s future investment intent. The report is certified under the Sarbanes-Oxley Act of 2002, which requires mutual funds and other public companies to affirm that, to the best of their knowledge, the information in their financial reports is fairly and accurately stated in all material respects.
Fellow Shareholders
Our first reporting period saw modest gains for the portfolio. Although the Federal Reserve raised short-term interest rates throughout the period, strong demand for bonds meant that intermediate- and longer-term rates failed to follow them higher. Longer-term Treasuries fared well, as did mortgage-backed securities. The high-yield market thrived through the start of 2005, but gave back most of its gains as the year progressed.
We would like to welcome shareholders to the fund. As you know, it is designed to follow the general contours of its benchmark, the Lehman Brothers U.S. Aggregate Index, while exploiting particular opportunities as they arise. We manage its duration within 20% of the benchmark, while maintaining our exposure to each sector within 25%. In addition, we include certain types of securities not found in the benchmark, including high-yield bonds, non-U.S. dollar issues, and emerging market securities.
ECONOMY AND INTEREST RATES
The Federal Reserve has continued its steady program of monetary tightening over the past six months, raising its official overnight lending rate by 25 basis points (0.25%) following each Federal Open Market Committee meeting since June 2004. This has brought the federal funds rate to 3.00%, 200 basis points above the low of 1.00% it reached in 2003–2004.
While the increase in short-term rates, along with higher oil prices, has arguably tempered economic growth over the past year, the economy continues to create jobs and absorb capacity at a healthy clip. Low mortgage rates have resulted in a particularly strong housing sector, and consumers have remained generally upbeat.
Against the steady drone of Fed tightening, fundamentals within the fixed-income market have experienced several shifts. The most noteworthy development has been the “conundrum,” in Fed Chairman Alan Greenspan’s words, of lower long-term rates in the face of higher short-term rates. Yields on the 10-year fixed-rate Treasury note, for example, declined by 67 and 37 basis points over the past year and six-month period, respectively. Yields on the 10-year Treasury inflation-protected security fell by 39 and 9 basis points over the same periods.
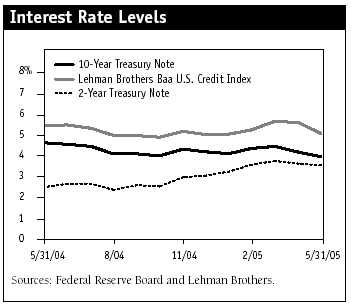
Several factors have contributed to the pattern of a flattening yield curve. For some time now, longer-term rates have been bid lower because of steady foreign buying of U.S. Treasuries. Pension funds, which seek out long-duration assets, have been another durable source of demand. Recently, the dollar has stabilized, increasing the appeal of U.S. bonds. Finally, signs of moderation in the economic expansion have lessened worries over future inflation.
PERFORMANCE AND STRATEGY
The portfolio returned 2.74% for the six-month period ended May 31, 2005. These results slightly lagged those of the Lehman Brothers U.S. Aggregate Index.
| Performance Comparison |
| Period Ended 5/31/05 | 6 Months |
| Institutional Core Plus Fund | 2.74% |
| Lehman Brothers U.S. | |
| Aggregate Index | 2.90 |
| Please see the fund’s quarter-end returns following this letter. |
While credit fundamentals remained solid overall within the corporate bond sector, specific issuers and sectors came under pressure during the six-month period. Strong corporate cash flow combined with languishing equity performance has increased the frequency of share buy-backs, the issuance of special dividends, and increased merger and acquisition activity. While these can benefit bondholders, other events, including leveraged buyouts (LBOs), have raised general concerns and heightened risk aversion in the investment-grade corporate sector.
| Major Index Returns |
| Periods Ended 5/31/05 | 6 Months | 12 Months |
| Lehman Brothers U.S. | | |
| Aggregate Index | 2.90% | 6.82% |
| Lehman Brothers | | |
| U.S. Treasury Index | 3.59 | 6.84 |
| Lehman Brothers Mortgage- | | |
| Backed Securities Index | 2.50 | 6.69 |
| Lehman Brothers U.S. | | |
| Credit Index | 3.01 | 7.75 |
| CS First Boston High | | |
| Yield Index | 0.60 | 9.97 |
| Sources: Lehman Brothers and CS First Boston. |
Such a pattern led us to reduce the portfolio’s exposure to investment-grade corporate debt during the six-month period, leaving us with a neutral position relative to the benchmark. This decision helped our results, particularly as the corporate sector further struggled under the weight of the downgrade of GM’s and Ford Motor’s debt to below investment-grade status. However, the fund’s exposure to the high-yield sector detracted from performance as the market came under pressure due to the automobile sector.
We also reduced our exposure to the mortgage market in the period. The mortgage sector stands to fare less well as the yield curve flattens—which discourages homeowners from taking out shorter-term loans—and longer-term rates stabilize. Additionally, the major consolidators of mortgage loans, Fannie Mae and Freddie Mac, have come under increased scrutiny from Congress and the Federal Reserve. However, we have recently witnessed progress on addressing governance and risk-control issues at the two entities, somewhat easing our concerns. We have also recently reduced our exposure to asset-backed securities, such as auto loan and credit card debt. These have performed well, and we considered the securities richly valued.
We shifted the composition of our exposure to non-U.S. dollar bonds over the period. We reduced our exposure to Poland and the U.K. due to good performance relative to U.S. bonds. We currently favor German, Canadian, and Mexican bonds. The fund’s exposure to Mexico has benefited in particular from the continued rise in the peso. Exposure to emerging markets has been relatively modest, however. The fund maintains exposure to the dollar-denominated debt of Brazil and Serbia and the local market debt of Turkey.

Favorable conditions have led us to increase our investment in Treasury inflation-protected securities (TIPS). TIPS have benefited from increased inflation—over the last year the consumer price index (CPI) has increased by 3.1% —which has resulted in an increase in the bonds’ inflation-adjusted principal. At the same time, the decline in interest rates resulted in price increases for TIPS. More recently, investors have shown less enthusiasm for inflation protection. Slower growth, weaker commodity prices, and a stronger dollar have lessened concerns that price increases might gain momentum. This has diminished demand for TIPS somewhat and led them to underperform comparable fixed-rate Treasuries.
| Portfolio Characteristics |
| Periods Ended | 11/30/04 | 5/31/05 |
| Institutional Core Plus | | |
| Fund Share Price | $10.00 | $10.08 |
| Dividends Per Share | | |
| For 6 Months | – | 0.19 |
| 30-Day Standardized | | |
| Yield to Maturity | – | 4.41% |
| Weighted Average Maturity | | |
| (years) | – | 6.5 |
| Weighted Average Effective | | |
| Duration (years) | – | 4.1 |
| Note: Yields will vary and are not guaranteed. | |
Like many, we have been surprised at the magnitude of the decline in long-term Treasury yields since the Fed began tightening. Our strategic decision to maintain a “barbelled” portfolio, with lower exposure to intermediate-term securities in favor of short- and longer-dated maturities, has benefited performance. We have maintained investments in longer-term issues, which have fared well as rates have fallen.
OUTLOOK
Longer-term fixed-rate Treasury yields remain near historic lows and appear unappealing by many traditional measures. Real growth in the U.S. should exceed 3% this year, and persistently firm energy prices, higher unit labor costs, and slowing productivity are adding to building inflation pressures. Nevertheless, we are mindful that U.S. interest rates are above those in the European Union, Japan, and Canada. This should help ensure that foreign demand for U.S. Treasuries, from both private and public sources, remains healthy.
Real interest rates are also low, as measured both by the TIPS market and by subtracting inflation from nominal yields in the fixed-rate market. Longer-term inflation protection looks relatively cheap, based on our view that inflation may be higher than what is implied in the instruments. Strength in commodities, particularly oil, remains intact. At this time, we favor TIPS versus comparable fixed-rate Treasuries.
The corporate bond market continues to be challenging, but further price declines should provide additional yield for the portfolio. The fundamentals of strong cash flow, balance sheet stability, and healthy economic growth make corporate bonds appealing. Our analysts also continue to find companies that remain committed to stable or improving credit metrics. Nevertheless, recent market disruptions provide a sober reminder that market factors can temporarily overwhelm fundamentals, making diversification within the corporate sector a critical form of risk control.
Mortgages will remain an important part of both the index and the fund. Current valuations, however, are based on continued low volatility and appear somewhat stretched. Our skepticism is reflected in our neutral to slightly underweight allocations.
Finally, nondollar-denominated debt should continue to perform well relative to that of U.S. issuers as we anticipate further monetary tightening by the Federal Reserve. The U.S. dollar may be entering a consolidation period after recent strength. Higher U.S. interest rate differentials, which have supported the dollar, stand likely to be offset by continued concerns about the U.S. trade and current account deficits.
Respectfully submitted,

Brian J. Brennan
Chairman of the fund’s Investment Advisory Committee
June 16, 2005
The committee chairman has day-to-day responsibility for managing the portfolio and works with committee members in developing and executing the fund’s investment program.
Bonds are subject to interest rate risk, the decline in bond prices that usually accompanies a rise in interest rates, and credit risk, the chance that any fund holding could have its credit rating downgraded or that a bond issuer will default (fail to make timely payments of interest or principal), potentially reducing the fund’s income level and share price. Mortgage-backed securities are subject to prepayment risk, particularly if falling rates lead to heavy refinancing activity, and extension risk, which is an increase in interest rates that causes a fund’s average maturity to lengthen unexpectedly due to a drop in mortgage prepayments. This could increase the fund’s sensitivity to rising interest rates and its potential for price declines.
Average maturity: The average of the stated maturity dates of a bond or money market portfolio’s securities. The average maturity for a money market fund is measured in days, whereas a bond fund’s average maturity is measured in years. In general, the longer the average maturity, the greater the fund’s sensitivity to interest rate changes, which means greater price fluctuation.
Basis point: One one-hundredth of a percentage point, or 0.01% .
CS First Boston High Yield Index: An index that tracks the performance of domestic noninvestment-grade corporate bonds.
Duration: A measure of a bond or bond fund’s sensitivity to changes in interest rates. For example, a fund with a four-year duration would fall about 4% in response to a one-percentage-point rise in interest rates, and vice versa.
Federal funds rate: The interest rate charged on overnight loans of reserves by one financial institution to another in the United States. The Federal Reserve sets a target federal funds rate to affect the direction of interest rates.
Lehman Brothers Mortgage-Backed Securities Index: An unmanaged index of 15- and 30-year fixed-rate securities backed by GNMA.
Lehman Brothers U.S. Aggregate Index: An unmanaged index that tracks the performance of investment-grade government and corporate bonds. This index is widely accepted as the benchmark for the broad U.S. investment-grade bond market.
Lehman Brothers U.S. Credit Index: (Formerly the U.S. Corporate Investment Grade Index) An unmanaged index that tracks the performance of investment-grade corporate bonds.
Lehman Brothers U.S. Treasury Index: An unmanaged index of publicly traded obligations of the U.S. Treasury.
Lipper averages: The averages of all mutual funds in a particular category as tracked by Lipper Inc.
Real interest rate: A fixed-income security’s interest rate after adjusting for inflation. It is calculated by subtracting the inflation rate from a nominal interest rate. For example, if a 10-year Treasury note is yielding 5% and inflation is 2%, the real interest rate is 3%.
Weighted average maturity: The weighted average of the stated maturity dates of the portfolio’s securities. In general, the longer the average maturity, the greater the fund’s sensitivity to interest rate changes. A shorter average maturity usually means less interest rate sensitivity and therefore a less volatile portfolio.
Yield curve: A graphic depiction of the relationship between yields and maturity dates for a set of similar securities, such as Treasuries or municipal securities. Yield curves typically slope upward, indicating that longer maturities offer higher yields. When the yield curve is flat, there is little or no difference between the yields offered by shorter- and longer-term securities.
Fund Expense Example
As a mutual fund shareholder, you may incur two types of costs: (1) transaction costs such as redemption fees or sales loads and (2) ongoing costs, including management fees, distribution and service (12b-1) fees, and other fund expenses. The following example is intended to help you understand your ongoing costs (in dollars) of investing in the fund and to compare these costs with the ongoing costs of investing in other mutual funds. The example is based on an investment of $1,000 invested at the beginning of the most recent six-month period and held for the entire period.
Actual Expenses
The first line of the following table (“Actual”) provides information about actual account values and actual expenses. You may use the information in this line, together with your account balance, to estimate the expenses that you paid over the period. Simply divide your account value by $1,000 (for example, an $8,600 account value divided by $1,000 = 8.6), then multiply the result by the number in the first line under the heading “Expenses Paid During Period” to estimate the expenses you paid on your account during this period.
Hypothetical Example for Comparison Purposes
The information on the second line of the table (“Hypothetical”) is based on hypothetical account values and expenses derived from the fund’s actual expense ratio and an assumed 5% per year rate of return before expenses (not the fund’s actual return). You may compare the ongoing costs of investing in the fund with other funds by contrasting this 5% hypothetical example and the 5% hypothetical examples that appear in the shareholder reports of the other funds. The hypothetical account values and expenses may not be used to estimate the actual ending account balance or expenses you paid for the period.
You should also be aware that the expenses shown in the table highlight only your ongoing costs and do not reflect any transaction costs, such as redemption fees or sales loads. Therefore, the second line of the table is useful in comparing ongoing costs only and will not help you determine the relative total costs of owning different funds. To the extent a fund charges transaction costs, however, the total cost of owning that fund is higher.
| T. Rowe Price Institutional Core Plus Fund |
| | | | Expenses |
| | Beginning | Ending | Paid During |
| | Account | Account | Period* |
| | Value | Value | 12/1/04 to |
| | 12/1/04 | 5/31/05 | 5/31/05 |
| Actual | $1,000.00 | $1,027.40 | $2.22 |
| Hypothetical | | | |
| (assumes 5% return | | | |
| before expenses) | 1,000.00 | 1,022.74 | 2.22 |
| |
|
|
|
|
| * | Expenses are equal to the fund’s annualized expense ratio for the six-month period (0.44%), multiplied by the average account value over the period, multiplied by the number of days in the most recent fiscal half year (182) divided by the days in the year (365) to reflect the half-year period. |
|
| | Since |
| | Inception |
| Period Ended 6/30/05 | 11/30/04 |
| |
| Institutional Core Plus Fund | 3.44% |
| Lehman Brothers U.S. Aggregate | |
| Index | 3.46 |
| |
| Current performance may be higher or lower than the quoted past performance, which cannot guarantee future results. Share price, principal value, and return will vary, and you may have a gain or loss when you sell your shares. For the most recent month-end performance information, please contact a T. Rowe Price representative at 1-800-638-8790. |
| This table provides returns through the most recent calendar quarter-end rather than through the end of the fund’s fiscal period. Average annual total return figures include changes in principal value, reinvested dividends, and capital gain distributions. Returns do not reflect taxes that the shareholder may pay on fund distributions or the redemption of fund shares. When assessing performance, investors should consider both short- and long-term returns. |
|
|
|
|
Financial Highlights
T. Rowe Price Institutional Core Plus Fund
| For a share outstanding |
| throughout the period |
| |
| | 11/30/04 |
| | Through |
| | 5/31/05** |
| NET ASSET VALUE | | |
| Beginning of period | $ | 10.00 |
|
|
| Investment activities | | |
| Net investment income (loss) | | 0.19‡ |
| Net realized and unrealized gain (loss) | | 0.08 |
|
|
| Total from investment activities | | 0.27 |
|
|
| |
| Distributions | | |
| Net investment income | | (0.19) |
|
|
| |
| NET ASSET VALUE | | |
| End of period | $ | 10.08 |
|
|
| |
| Ratios/Supplemental Data | | |
| Total return^ | | 2.74%‡ |
| Ratio of total expenses to | | |
| average net assets | | 0.44%‡† |
| Ratio of net investment | | |
| income (loss) to average | | |
| net assets | | 3.74%‡† |
| Portfolio turnover rate | | 407.9%¤† |
| Net assets, end of period | | |
| (in thousands) | $ | 15,419 |
| ^ | Total return reflects the rate that an investor would have earned on an investment in the fund during the period, assuming reinvestment of all distributions. |
| ‡ | See Note 4. Excludes expenses permanently waived of 0.01% of average net assets for the period related to investments in T. Rowe Price mutual funds. |
| ** Per share amounts calculated using average shares outstanding method. |
| ¤ | The portfolio turnover rate calculation includes purchases and sales from mortgage dollar roll transactions (see Note 2); had these transactions been excluded from the calculation, the portfolio turnover for the period ended May 31, 2005 would have been 238.1%. |
| † | Annualized |
| |
| The accompanying notes are an integral part of these financial statements. |
Portfolio of Investments (1)+
T. Rowe Price Institutional Core Plus Fund
May 31, 2005
| $ Par/Shares | Value |
| (Amounts in 000s) | | |
| | | |
| CORPORATE BONDS AND NOTES 21.1% | |
| | | |
| Automobiles and Related 1.1% | | |
| DaimlerChrysler, 6.50%, 11/15/13 | 70 | 74 |
| Ford Motor Credit | | |
| 7.375%, 10/28/09 | 100 | 97 |
| | | 171 |
| Banking 2.9% | | |
| Bank of America Capital Trust | | |
| 5.625%, 3/8/35 | 30 | 31 |
| Bank One, 5.25%, 1/30/13 | 60 | 62 |
| BB&T, 6.50%, 8/1/11 | 55 | 61 |
| Capital One Bank, 6.50%, 6/13/13 | 50 | 55 |
| Citigroup, 5.00%, 9/15/14 | 30 | 31 |
| HBOS, 144A, 6.00%, 11/1/33 | 50 | 55 |
| Huntington National Bank | | |
| 4.375%, 1/15/10 | 30 | 30 |
| MBNA America Bank | | |
| 4.625%, 8/3/09 | 50 | 50 |
| Wachovia Corporation | | |
| 6.40%, 4/1/08 | 70 | 74 |
| | | 449 |
| Beverages 0.5% | | |
| Anheuser-Busch, 4.375%, 1/15/13 | 75 | 75 |
| | | 75 |
| Broadcasting 0.3% | | |
| AOL Time Warner, 7.625%, 4/15/31 | 40 | 50 |
| | | 50 |
| Building and Real Estate 0.6% | | |
| Lennar, 144A, 5.60%, 5/31/15 | 30 | 30 |
| Pulte Homes, 7.875%, 8/1/11 | 40 | 46 |
| Ryland Group, 5.375%, 1/15/15 | 10 | 10 |
| | | 86 |
| Building Products 0.3% | | |
| Masco, 5.875%, 7/15/12 | 40 | 43 |
| | | 43 |
| Conglomerates 0.9% | | |
| General Electric Capital | | |
| 6.00%, 6/15/12 | 70 | 76 |
| Tyco International | | |
| 6.375%, 10/15/11 | 40 | 44 |
| United Technologies, 5.40%, 5/1/35 | 25 | 26 |
| | | 146 |
| Container 0.2% | | |
| Sealed Air, 144A, 5.375%, 4/15/08 | 35 | 35 |
| | | 35 |
| Diversified Chemicals 0.3% | | |
| Dow Chemical, 6.125%, 2/1/11 | 40 | 43 |
| | | 43 |
| Drugs 0.7% | | |
| Abbott Laboratories, 5.625%, 7/1/06 | 60 | 61 |
| Amgen, 4.00%, 11/18/09 | 45 | 45 |
| | | 106 |
| Electric Utilities 1.8% | | |
| Alabama Power, VR, 3.484%, 8/25/09 | 55 | 55 |
| Centerpoint Energy, 7.25%, 9/1/10 | 30 | 33 |
| Exelon Generation, 5.35%, 1/15/14 | 50 | 52 |
| PG&E, 6.05%, 3/1/34 | 35 | 38 |
| Pinnacle West Capital, 6.40%, 4/1/06 | 45 | 46 |
| Progress Energy, 6.75%, 3/1/06 | 35 | 36 |
| Western Resources, 7.875%, 5/1/07 | 15 | 16 |
| | | 276 |
| Electronic Components 0.2% | | |
| Motorola, 5.80%, 10/15/08 | 30 | 31 |
| | | 31 |
| Energy 0.6% | | |
| Transocean, 7.50%, 4/15/31 | 35 | 45 |
| XTO Energy, 6.25%, 4/15/13 | 40 | 43 |
| | | 88 |
| Exploration and Production 0.1% | | |
| Diamond Offshore Drilling | | |
| 5.15%, 9/1/14 | 20 | 20 |
| | | 20 |
| Finance and Credit 0.9% | | |
| CIT Group, 5.00%, 2/1/15 | 50 | 50 |
| Countrywide Home Loans | | |
| 4.125%, 9/15/09 | 45 | 44 |
| Household Finance | | |
| 6.375%, 11/27/12 | 45 | 50 |
| | | 144 |
| Food/Tobacco 0.1% | | |
| Philip Morris, 7.20%, 2/1/07 | 15 | 16 |
| | | 16 |
| Gaming 0.4% | | |
| GTECH, 144A, 4.50%, 12/1/09 | 30 | 30 |
| Harrah’s Operating, 5.50%, 7/1/10 | 30 | 30 |
| | | 60 |
| Gas & Gas Transmission 0.7% | | |
| Atmos Energy, 4.00%, 10/15/09 | 40 | 39 |
| Duke Capital, 6.25%, 2/15/13 | 55 | 59 |
| TGT Pipeline, 144A, 5.50%, 2/1/17 | 10 | 10 |
| | | 108 |
| Insurance 1.6% | | |
| ACE INA Holdings, 5.875%, 6/15/14 | 40 | 42 |
| AIG Sunamerica Global Financing XII | | |
| 144A, 5.30%, 5/30/07 | 70 | 71 |
| Allstate Financial Global Funding | | |
| 144A, 5.25%, 2/1/07 | 60 | 61 |
| Nationwide Financial Services | | |
| 5.90%, 7/1/12 | 50 | 54 |
| Transamerica Capital | | |
| 144A, 7.65%, 12/1/26 | 15 | 18 |
| | | 246 |
| Investment Dealers 0.6% | | |
| Goldman Sachs Capital I | | |
| 6.345%, 2/15/34 | 50 | 54 |
| Lehman Brothers Holdings | | |
| 3.50%, 8/7/08 | 40 | 39 |
| | | 93 |
| Long Distance 0.6% | | |
| AT&T Broadband, 8.375%, 3/15/13 | 40 | 49 |
| Sprint Capital, 7.625%, 1/30/11 | 40 | 46 |
| | | 95 |
| Media and Communications 0.3% | | |
| Belo, 8.00%, 11/1/08 | 10 | 11 |
| News America, 6.20%, 12/15/34 | 30 | 31 |
| | | 42 |
| Metals and Mining 0.5% | | |
| BHP Finance, 4.80%, 4/15/13 | 45 | 46 |
| Newmont Mining, 5.875%, 4/1/35 | 35 | 35 |
| | | 81 |
| Miscellaneous Consumer Products 0.3% | | |
| Procter & Gamble, 4.95%, 8/15/14 | 50 | 52 |
| | | 52 |
| Oil Field Services 0.3% | | |
| Baker Hughes, 6.875%, 1/15/29 | 40 | 49 |
| | | 49 |
| Paper and Paper Products 0.3% | | |
| Celulosa Arauco y Constitucion | | |
| 5.125%, 7/9/13 | 40 | 40 |
| | | 40 |
| Petroleum 1.1% | | |
| Amerada Hess, 7.875%, 10/1/29 | 30 | 37 |
| ConocoPhillips, 5.90%, 10/15/32 | 35 | 39 |
| Devon Financing, 7.875%, 9/30/31 | 30 | 38 |
| Pemex Project Funding Master Trust | | |
| 7.375%, 12/15/14 | 50 | 56 |
| | | 170 |
| Railroads 0.3% | | |
| Canadian National Railway | | |
| 6.25%, 8/1/34 | 40 | 46 |
| | | 46 |
| Real Estate Investment Trust Securities 0.8% | |
| Developers Diversified Realty | | |
| 3.875%, 1/30/09 | 40 | 39 |
| EOP Operating Limited Partnership | | |
| 8.375%, 3/15/06 | 35 | 36 |
| Simon Property Group, | | |
| 3.75%, 1/30/09 | 55 | 53 |
| | | 128 |
| Restaurants 0.2% | | |
| Yum! Brands, 7.70%, 7/1/12 | 30 | 35 |
| | | 35 |
| Retail 0.4% | | |
| CVS, 4.00%, 9/15/09 | 55 | 54 |
| | | 54 |
| Telephones 0.7% | | |
| Deutsche Telekom International Finance | |
| STEP, 8.75%, 6/15/30 | 40 | 54 |
| Telecom Italia Capital | | |
| 5.25%, 11/15/13 | 30 | 30 |
| Telefonos de Mexico | | |
| 144A, 5.50%, 1/27/15 | 20 | 20 |
| | | 104 |
| Transportation Services 0.2% | | |
| ERAC USA Finance | | |
| 144A, 5.60%, 5/1/15 | 25 | 26 |
| | | 26 |
| Wireless Communications 0.3% | | |
| AT&T Wireless, 8.75%, 3/1/31 | 30 | 42 |
| | | 42 |
| Total Corporate Bonds and Notes | | |
| (Cost $3,214) | | 3,250 |
| |
| ASSET-BACKED SECURITIES 3.6% | |
| | | |
| Auto-Backed 1.6% | | |
| Chase Manhattan Auto Owner Trust | | |
| Series 2003-A, Class A4 | | |
| 2.06%, 12/15/09 | 150 | 146 |
| Onyx Acceptance Grantor Trust | | |
| Series 2003-A, Class A4 | | |
| 3.04%, 11/15/09 | 100 | 100 |
| | | 246 |
| Credit Card-Backed 2.0% | | |
| Bank One Issuance Trust | | |
| Series 2002, Class A3 | | |
| 3.59%, 5/15/10 | 150 | 149 |
| Citibank Credit Cord Master Trust I | | |
| Series 1999-2, Class A | | |
| 5.875%, 3/10/11 | 150 | 159 |
| | | 308 |
| Total Asset-Backed Securities | | |
| (Cost $559) | | 554 |
| |
| NON-U.S. GOVERNMENT MORTGAGE- | |
| BACKED SECURITIES 5.5% | | |
| | | |
| Commercial Mortgage Backed Securities 5.5% | |
| Banc of America Commercial Mortgage | |
| Series 2004-6, Class A1 | | |
| CMO, 3.801%, 12/10/42 | 14 | 14 |
| Bear Stearns Commercial | | |
| Mortgage Securities | | |
| Series 2004-PWR6, Class A1 | | |
| CMO, 3.688%, 11/11/41 | 11 | 11 |
| Series 2004-PWR6, Class A4 | | |
| CMO, 4.521%, 11/11/41 | 151 | 152 |
| Series 2005-T18, Class A1 | | |
| CMO, 4.274%, 2/13/42 | 99 | 99 |
| Citigroup Commercial Mortgage Trust | |
| Series 2004-C2, Class A1 | | |
| CMO, 3.787%, 10/15/41 | 9 | 9 |
| Commercial Mortgage | | |
| Series 2005-LP5, Class A1 | | |
| CMO, PTC, 4.235%, 5/10/43 | 99 | 99 |
| Credit Suisse First Boston | | |
| Series 2005-C1, Class A2 | | |
| CMO, 4.609%, 2/15/38 | 150 | 152 |
| GMAC Commercial Mortgage Securities | |
| Series 2001-C2, Class A1 | | |
| CMO, 6.25%, 4/15/34 | 115 | 120 |
| Greenwich Capital Commercial Funding | |
| Series 2005-GG3, Class AAB | | |
| CMO, VR, 4.619%, 8/10/42 | 50 | 50 |
| J.P. Morgan Chase Commercial Mortgage | |
| Series 2001-CIBC, Class A3 | | |
| CMO, 6.26%, 3/15/33 | 75 | 82 |
| Morgan Stanley Dean Witter | | |
| Series 2002-TOP7, Class A1 | | |
| CMO, 5.38%, 1/15/39 | 54 | 56 |
| | | | |
| Total Non-U.S. Government | | |
| Mortgage-Backed Securities | | |
| (Cost $845) | | 844 |
| |
| FOREIGN GOVERNMENT | | |
| OBLIGATIONS & MUNICIPALITIES 7.2% | |
| | | | |
| Federal Republic of Germany | | |
| 3.25%, 4/9/10 (EUR) | 115 | 146 |
| 5.00%, 7/4/12 (EUR) | 100 | 139 |
| Government of Canada | | |
| 5.00%, 6/1/14 (CAD) | 345 | 298 |
| Republic of Brazil, 11.00%, 8/17/40 | 40 | 48 |
| Republic of Serbia, 3.75%, 11/1/24 | 75 | 64 |
| Republic of South Africa, | | |
| 6.50%, 6/2/14 | 40 | 44 |
| Republic of Turkey | | |
| 20.00%, 10/17/07 (TRY) | 50 | 39 |
| United Mexican States | | |
| 6.375%, 1/16/13 | 30 | 32 |
| 8.00%, 12/28/06 (MXN) | 900 | 81 |
| 8.00%, 12/19/13 (MXN) | 2,700 | 224 |
| | | | |
| Total Foreign Government | | |
| Obligations & Municipalities | | |
| (Cost $1,112) | | 1,115 |
| |
| U.S. GOVERNMENT & AGENCY | | |
| MORTGAGE-BACKED SECURITIES 29.9% | |
| | | | |
| U.S. Government Agency Obligations ± 17.3% | |
| Federal Home Loan Mortgage | | |
| ARM, 4.843%, 11/1/34 | 70 | 70 |
| CMO, 5.00%, 9/15 - 11/15/27 | 235 | 238 |
| Federal National Mortgage Assn. | | |
| 4.50%, 4/1/35 | 115 | 112 |
| 5.50%, 1/1/17 - 1/1/35 | 918 | 936 |
| 6.50%, 7/1 - 12/1/32 | 700 | 728 |
| TBA | | |
| 4.50%, 1/1/19 | 275 | 274 |
| 5.00%, 1/1/34 | 55 | 55 |
| 5.50%, 1/1/19 - 1/1/34 | 250 | 255 |
| | | 2,668 |
| U.S. Government Obligations 12.6% | | |
| Government National Mortgage Assn. | | |
| 5.50%, 12/15/33 | 830 | 847 |
| 6.00%, 12/20/34 | 759 | 783 |
| CMO, 5.50%, 5/20/31 | 300 | 307 |
| | | 1,937 |
| Total U.S. Government & Agency | | |
| Mortgage-Backed Securities | | |
| (Cost $4,601) | | 4,605 |
| |
| U.S. GOVERNMENT & AGENCY OBLIGATIONS | |
| (EXCLUDING MORTGAGE-BACKED) 24.1% | |
| | | |
| U.S. Government Agency Obligations ± 4.1% | |
| Federal Home Loan Mortgage | | |
| 4.25%, 7/15/09 | 300 | 304 |
| 6.25%, 7/15/32 | 135 | 166 |
| Federal National Mortgage Assn. | | |
| 7.125%, 6/15/10 | 135 | 154 |
| | | 624 |
| U.S. Treasury Obligations 20.0% | | |
| U.S. Treasury Bonds | | |
| 5.375%, 2/15/31 | 65 | 75 |
| 6.00%, 2/15/26 | 150 | 182 |
| 6.125%, 8/15/29 | 45 | 56 |
| 7.625%, 2/15/25 | 20 | 29 |
| 8.50%, 2/15/20 | 70 | 102 |
| U.S. Treasury Inflation-Indexed Bonds | |
| 2.375%, 1/15/25 | 144 | 158 |
| U.S. Treasury Inflation-Indexed Notes | |
| 2.00%, 7/15/14 | 149 | 154 |
| 3.625%, 1/15/08 | 215 | 229 |
| U.S. Treasury Notes | | |
| 1.50%, 3/31/06 | 625 | 616 |
| 3.375%, 11/15/08 | 150 | 148 |
| 3.50%, 2/15/10 | 45 | 45 |
| 4.00%, 6/15/09 | 70 | 71 |
| 4.25%, 11/15/13 | 700 | 715 |
| 5.75%, 8/15/10 | 75 | 82 |
| 6.875%, 5/15/06 ++ | 410 | 423 |
| | | 3,085 |
| Total U.S. Government & Agency | | |
| Obligations (excluding Mortgage-Backed) | |
| (Cost $3,648) | | 3,709 |
| MUNICIPAL BONDS 1.2% | | |
| | | |
| Atlanta Airport | | |
| 5.00%, 1/1/33 (FSA Insured) | 55 | 58 |
| California, Economic Recovery, GO | | |
| 5.00%, 7/1/16 | 35 | 38 |
| Clark County School Dist., GO | | |
| 5.00%, 6/15/18 | | |
| (MBIA Insured) | 30 | 33 |
| New York City, GO, 5.00%, 3/1/14 | 15 | 16 |
| North Carolina | | |
| Public Improvement, GO | | |
| 5.00%, 3/1/10 | 45 | 49 |
| Total Municipal Bonds (Cost $192) | 194 |
| |
| DOMESTIC BOND MUTUAL FUNDS 2.0% | |
| | | |
| T. Rowe Price Institutional | | |
| High Yield Fund | | |
| 7.63% p† | 30 | 314 |
| Total Domestic Bond Mutual Funds | |
| (Cost $327) | | 314 |
| |
| SHORT-TERM INVESTMENTS 8.2% | |
| | | |
| Money Market Funds 8.2% | | |
| T. Rowe Price Reserve | | |
| Investment Fund | | |
| 3.07% #† | 1,269 | 1,269 |
| Total Short-Term Investments | | |
| (Cost $1,269) | | 1,269 |
| |
| FORWARD CURRENCY EXCHANGE | |
| CONTRACTS 0.1% | | |
| | |
| Unrealized gain (Loss) on forward | | |
| currency exchange contracts (2) | – | 18 |
| Total Forward Currency | | |
| Exchange Contracts | | 18 |
| |
| FUTURES CONTRACTS 0.0% | | |
| | | |
| Variation margin receivable (payable) | |
| on open futures contracts (3) | – | (1) |
| Total Futures Contracts | | (1) |
| | | Value |
| (Amounts in 000s) | | |
| Total Investments in Securities | | |
| 102.9% of Net Assets (Cost $15,767) | $ | 15,871 |
| (1) | Denominated in U.S. dollars unless otherwise noted |
| # | Seven-day yield |
| ± | The issuer is a publicly-traded company that operates under |
| | a congressional charter; its securities are neither issued nor |
| | guaranteed by the U.S. government |
| ++ | All or a portion of this security is pledged to cover margin |
| | requirements on futures contracts at May 31, 2005 |
| † | Affiliated company—See Note 4 |
| + | At May 31, 2005 some of the fund’s securities were valued |
| | by the T. Rowe Price Valuation Committee, established by |
| | the fund’s Board of Directors—See Note 1 |
| p | SEC Yield |
| 144A | Security was purchased pursuant to Rule 144A under the |
| | Securities Act of 1933 and may be resold in transactions |
| | exempt from registration only to qualified institutional |
| | buyers—total value of such securities at period-end |
| | amounts to $356 and represents 2.3% of net assets |
| ARM | Adjustable Rate Mortgage |
| CAD | Canadian dollar |
| CMO | Collateralized Mortgage Obligation |
| EUR | Euro |
| FSA | Financial Security Assurance Inc. |
| GO | General Obligation |
| JPY | Japanese yen |
| MBIA | MBIA Insurance Corp. |
| MXN | Mexican peso |
| PTC | Pass-Through Certificate |
| STEP | Stepped coupon bond for which the coupon rate of interest |
| | will adjust on specified future date(s) |
| TBA | To Be Announced security was purchased on a forward |
| | commitment basis |
| TRY | Turkish lira |
| USD | U.S. dollars |
| VR | Variable Rate; rate shown is effective rate at period end |
| (2) Open Forward Currency Exchange Contracts at May 31, 2005 were as follows: |
| Amounts in (000s) |
| | | | | | | | Unrealized |
| Counterparty | Settlement | Receive | | | Deliver | | Gain (Loss) |
| Morgan Stanley | 6/1/05 | USD | 159 | | EUR | 120 | $ | 10 |
| Morgan Stanley | 6/1/05 | EUR | 120 | | USD | 155 | | (7) |
| JP Morgan Chase | 6/13/05 | USD | 74 | | MXN | 825 | | (1) |
| Royal Bank of Canada | 6/27/05 | USD | 149 | | CAD | 185 | | 1 |
| C.S. First Boston | 7/1/05 | TRY | 56 | | USD | 40 | | 1 |
| JP Morgan Chase | 7/11/05 | USD | 60 | | CAD | 75 | | – |
| C.S. First Boston | 7/11/05 | USD | 145 | | EUR | 113 | | 6 |
| Morgan Stanley | 7/19/05 | JPY | 7,800 | | USD | 73 | | (1) |
| C.S. First Boston | 7/25/05 | USD | 151 | | EUR | 115 | | 9 |
| Net unrealized gain (loss) on open | | | | | | | | |
| forward currency exchange contracts | | | | | | | $ | 18 |
| (3) Open Futures Contracts at May 31, 2005 were as follows: |
| ($ 000s) |
| | | Contract | Unrealized |
| | Expiration | Value | Gain (Loss) |
| Short, 5 U.S. Treasury five year contracts, | | | | | |
| $15 par of 6.875% U.S. Treasury Notes | | | | | |
| pledged as initial margin | 9/05 | $ | (544) | $ | (1) |
| Net payments (receipts) of variation | | | | | |
| margin to date | | | | | – |
| Variation margin receivable (payable) | | | | | |
| on open futures contracts | | | | $ | (1) |
The accompanying notes are an integral part of these financial statements.
Statement of Assets and Liabilities
T. Rowe Price Institutional Core Plus Fund
May 31, 2005
(In thousands except shares and per share amounts)
| Assets | | |
| Investments in securities, at value | | |
| Affiliated companies (cost $1,596) | $ | 1,583 |
| Non-affiliated companies (cost $14,171) | | 14,288 |
|
|
| Total investments in securities | | 15,871 |
| Dividends and interest receivable | | 143 |
| Receivable for investment securities sold | | 55 |
|
|
| Total assets | | 16,069 |
|
|
| |
| Liabilities | | |
| Payable for investment securities purchased | | 636 |
| Due to affiliates | | 14 |
|
|
| Total liabilities | | 650 |
|
|
| |
| NET ASSETS | $ | 15,419 |
|
|
| Net Assets Consist of: | | |
| Undistributed net investment income (loss) | $ | 10 |
| Undistributed net realized gain (loss) | | 27 |
| Net unrealized gain (loss) | | 104 |
| Paid-in-capital applicable to 1,528,866 shares of | | |
| $0.0001 par value capital stock outstanding; | | |
| 1,000,000,000 shares of the Corporation authorized | | 15,278 |
|
|
| |
| NET ASSETS | $ | 15,419 |
|
|
| NET ASSET VALUE PER SHARE | $ | 10.08 |
|
|
| |
| The accompanying notes are an integral part of these financial statements. | | |
Statement of Operations
T. Rowe Price Institutional Core Plus Fund
($ 000s)
| | | 11/30/04 |
| | | Through |
| | | 5/31/05 |
| Investment Income (Loss) | | |
| Income | | |
| Interest | $ | 272 |
| Dividend | | 44 |
|
|
| Total income | | 316 |
|
|
| Expenses | | |
| Investment management and administrative | | 34 |
| Investment management fees waived | | (1) |
|
|
| Total expenses | | 33 |
|
|
| Net investment income (loss) | | 283 |
|
|
| Realized and Unrealized Gain (Loss) | | |
| Net realized gain (loss) | | |
| Non-affiliated securities | | 28 |
| Affiliated securities | | (13) |
| Futures | | 3 |
| Foreign currency transactions | | 14 |
|
|
| Net realized gain (loss) | | 32 |
|
|
| Change in net unrealized gain (loss) | | |
| Securities | | 87 |
| Futures | | (1) |
| Other assets and liabilities | | |
| denominated in foreign currencies | | 18 |
|
|
| Change in net unrealized gain (loss) | | 104 |
|
|
| Net realized and unrealized gain (loss) | | 136 |
|
|
| |
| INCREASE (DECREASE) IN NET | | |
| ASSETS FROM OPERATIONS | $ | 419 |
|
|
The accompanying notes are an integral part of these financial statements.
Statement of Changes in Net Assets
T. Rowe Price Institutional Core Plus Fund
($ 000s)
| | | 11/30/04 |
| | | Through |
| | | 5/31/05 |
| Increase (Decrease) in Net Assets | | |
| Operations | | |
| Net investment income (loss) | $ | 283 |
| Net realized gain (loss) | | 32 |
| Change in net unrealized gain (loss) | | 104 |
|
|
| Increase (decrease) in net assets from operations | | 419 |
|
|
| Distributions to shareholders | | |
| Net investment income | | (290) |
|
|
| Capital share transactions * | | |
| Shares sold | | 15,000 |
| Distributions reinvested | | 290 |
|
|
| Increase (decrease) in net assets from capital | | |
| share transactions | | 15,290 |
|
|
| |
| Net Assets | | |
| Increase (decrease) during period | | 15,419 |
| Beginning of period | | – |
|
|
| End of period | $ | 15,419 |
|
|
| (Including undistributed net investment income of $10 at 5/31/05) | | |
| |
| *Share information | | |
| Shares sold | | 1,500 |
| Distributions reinvested | | 29 |
|
|
| Increase (decrease) in shares outstanding | | 1,529 |
| |
| The accompanying notes are an integral part of these financial statements. | | |
Notes to Financial Statements
T. Rowe Price Institutional Core Plus Fund
May 31, 2005
NOTE 1 - SIGNIFICANT ACCOUNTING POLICIES
T. Rowe Price Institutional Income Funds, Inc. (the corporation) is registered under the Investment Company Act of 1940 (the 1940 Act). The Institutional Core Plus Fund (the fund), a diversified, open-end management investment company, is one portfolio established by the corporation. The fund commenced operations on November 30, 2004. The fund seeks to maximize total return through income and capital appreciation.
The accompanying financial statements were prepared in accordance with accounting principles generally accepted in the United States of America, which require the use of estimates made by fund management.
Valuation The fund values its investments and computes its net asset value per share at the close of the New York Stock Exchange (NYSE), normally 4 p.m. ET, each day that the NYSE is open for business. Debt securities are generally traded in the over-the-counter market. Securities with original maturities of one year or more are valued at prices furnished by dealers who make markets in such securities or by an independent pricing service, which considers yield or price of bonds of comparable quality, coupon, maturity, and type, as well as prices quoted by dealers who make markets in such securities. Securities with original maturities of less than one year are stated at fair value, which is determined by using a matrix system that establishes a value for each security based on bid-side money market yields.
Investments in mutual funds are valued at the mutual fund’s closing net asset value per share on the day of valuation. Financial futures contracts are valued at closing settlement prices. Forward currency exchange contracts are valued using the prevailing forward exchange rate.
Other investments, including restricted securities, and those for which the above valuation procedures are inappropriate or are deemed not to reflect fair value are stated at fair value as determined in good faith by the T. Rowe Price Valuation Committee, established by the fund’s Board of Directors.
Most foreign markets close before the close of trading on the NYSE. If the fund determines that developments between the close of a foreign market and the close of the NYSE will, in its judgment, materially affect the value of some or all of its portfolio securities, which in turn will affect the fund’s share price, the fund will adjust the previous closing prices to reflect the fair value of the securities as of the close of the NYSE, as determined in good faith by the T. Rowe Price Valuation Committee, established by the fund’s Board of Directors. A fund may also fair value securities in other situations, such as when a particular foreign market is closed but the fund is open. In deciding whether to make fair value adjustments, the fund reviews a variety of factors, including developments in foreign markets, the performance of U.S. securities markets, and the performance of instruments trading in U. S. markets that represent foreign securities and baskets of foreign securities. The fund uses outside pricing services to provide it with closing market prices and information used for adjusting those prices. The fund cannot predict how often it will use closing prices and how often it will adjust those prices. As a means of evaluating its fair value process, the fund routinely compares closing market prices, the next day’s opening prices in the same markets, and adjusted prices.
Currency Translation Assets, including investments, and liabilities denominated in foreign currencies are translated into U.S. dollar values each day at the prevailing exchange rate, using the mean of the bid and asked prices of such currencies against U.S. dollars as quoted by a major bank. Purchases and sales of securities, income, and expenses are translated into U.S. dollars at the prevailing exchange rate on the date of the transaction. The effect of changes in foreign currency exchange rates on realized and unrealized security gains and losses is reflected as a component of security gains and losses.
Investment Transactions, Investment Income, and Distributions Income and expenses are recorded on the accrual basis. Premiums and discounts on debt securities are amortized for financial reporting purposes. Inflation adjustments to the principal amount of inflation-indexed bonds are included in interest income. Dividends received from mutual fund investments are reflected as dividend income; capital gain distributions are reflected as realized gain/loss. Dividend income and capital gain distributions are recorded on the ex-dividend date. Investment transactions are accounted for on the trade date. Realized gains and losses are reported on the identified cost basis. Payments (“variation margin”) made or received to settle the daily fluctuations in the value of futures contracts are recorded as unrealized gains or losses until the contracts are closed. Unsettled variation margin on futures contracts is included in investments in securities, and unrealized gains and losses on futures contracts are included in the change in net unrealized gain or loss in the accompanying financial statements. Unrealized gains and losses on forward currency exchange contracts are included in investments in securities, and in the change in net unrealized gain or loss in the accompanying financial statements. Paydown gains and losses are recorded as an adjustment to interest income. Distributions to shareholders are recorded on the ex-dividend date. Income distributions are declared on a daily basis and paid monthly. Capital gain distributions, if any, are declared and paid by the fund, typically on an annual basis.
NOTE 2 - INVESTMENT TRANSACTIONS
Consistent with its investment objective, the fund engages in the following practices to manage exposure to certain risks or enhance performance. The investment objective, policies, program, and risk factors of the fund are described more fully in the fund’s prospectus and Statement of Additional Information.
Restricted Securities The fund may invest in securities that are subject to legal or contractual restrictions on resale. Although certain of these securities may be readily sold, for example, under Rule 144A, others may be illiquid, their sale may involve substantial delays and additional costs, and prompt sale at an acceptable price may be difficult.
Forward Currency Exchange Contracts During the period ended May 31, 2005, the fund was a party to forward currency exchange contracts under which it is obligated to exchange currencies at specified future dates and exchange rates. Risks arise from the possible inability of counterparties to meet the terms of their agreements and from movements in currency values.
Futures Contracts During the period ended May 31, 2005, the fund was a party to futures contracts, which provide for the future sale by one party and purchase by another of a specified amount of a specific financial instrument at an agreed upon price, date, time, and place. Risks arise from possible illiquidity of the futures market and from movements in security values and/or interest rates.
Forward Commitments and Dollar Rolls During the period ended May 31, 2005, the fund purchased To Be Announced (TBA) mortgage backed securities on a forward commitment basis, with payment and delivery at an agreed-upon later date. The fund purchases TBAs with the intention of taking possession of the underlying mortgage securities. The fund may also enter dollar roll transactions, in which it sells a mortgage-backed security and simultaneously purchases a similar, but not identical, TBA with the same issuer, coupon, and terms. The fund accounts for dollar roll transactions as purchases and sales. Accordingly, these transactions increase the fund’s portfolio turnover rate. Losses may occur due to changes in market conditions or the failure of counter-parties to perform under the contracts, and actual mortgages received may be less favorable than those anticipated by the fund.
Other Purchases and sales of portfolio securities, other than short-term and U.S. government securities, aggregated $8,916,000 and $2,443,000, respectively, for the period ended May 31, 2005. Purchases and sales of U.S. government securities aggregated $35,195,000 and $27,162,000, respectively, for the period ended May 31, 2005.
NOTE 3 - FEDERAL INCOME TAXES
No provision for federal income taxes is required since the fund intends to qualify as a regulated investment company under Subchapter M of the Internal Revenue Code and distribute to shareholders all of its taxable income and gains. Federal income tax regulations differ from generally accepted accounting principles; therefore, distributions determined in accordance with tax regulations may differ significantly in amount or character from net investment income and realized gains for financial reporting purposes. Financial reporting records are adjusted for permanent book/tax differences to reflect tax character. Financial records are not adjusted for temporary differences.
Distributions during the year ended May 31, 2005 totaled $290,000 and were characterized as ordinary income for tax purposes. At May 31, 2005, the tax-basis components of net assets were as follows:
| Unrealized appreciation | $ | 163,000 |
| Unrealized depreciation | | (81,000) |
|
|
| Net unrealized appreciation (depreciation) | | 82,000 |
| Undistributed ordinary income | | 56,000 |
| Undistributed long-term capital gain | | 3,000 |
| Paid-in capital | | 15,278,000 |
|
|
| |
| Net assets | $ | 15,419,000 |
|
|
Federal income tax regulations require the fund to treat the gain/loss on certain open futures and forward currency exchange contracts as realized on the last day of the tax year; accordingly, $16,000 of unrealized losses reflected in the accompanying financial statements were realized for tax purposes as of May 31, 2005.
For the year ended May 31, 2005, the fund recorded the following permanent reclassifications to reflect tax character. Reclassifications to paid-in capital relate primarily to nondeductible organizational expenses. Results of operations and net assets were not affected by these reclassifications.
| Undistributed net investment income | $ | 17,000 |
| Undistributed net realized gain | | (5,000) |
| Paid-in capital | | (12,000) |
At May 31, 2005, the cost of investments for federal income tax purposes was $15,789,000.
NOTE 4 - RELATED PARTY TRANSACTIONS
The fund is managed by T. Rowe Price Associates, Inc. (the manager or Price Associates), a wholly owned subsidiary of T. Rowe Price Group, Inc. The investment management and administrative agreement between the fund and the manager provides for an all-inclusive annual fee equal to 0.45% of the fund’s average daily net assets. The fee is computed daily and paid monthly. The agreement provides that investment management, shareholder servicing, transfer agency, accounting, and custody services are provided to the fund, and interest, taxes, brokerage commissions, directors’ fees and expenses, and extraordinary expenses are paid directly by the fund.
The fund may invest in the T. Rowe Price Reserve Investment Fund and the T. Rowe Price Government Reserve Investment Fund (collectively, the Reserve Funds), open-end management investment companies managed by Price Associates and affiliates of the fund. The Reserve Funds are offered as cash management options to mutual funds, trusts, and other accounts managed by Price Associates and/or its affiliates, and are not available for direct purchase by members of the public. The Reserve Funds pay no investment management fees. During the period ended May 31, 2005, dividend income from the Reserve Funds totaled $27,000, and the value of shares of the Reserve Funds held at May 31, 2005 was $1,269,000.
The fund may invest in the T. Rowe Price Institutional High Yield Fund, Inc. (High Yield Fund) as a means of gaining efficient and cost-effective exposure to the high-yield bond markets. The High Yield Fund is an open-end management investment company managed by Price Associates, and an affiliate of the fund. The High Yield Fund pays an annual all-inclusive management and administrative fee to Price Associates equal to 0.50% of average daily net assets. To ensure that Institutional Core Plus does not incur duplicate fees for its assets invested in High Yield Fund, Price Associates has agreed to reduce its management fee to the fund. Accordingly, the management fee waiver reflected on the accompanying Statement of Operations includes $1,000 of management fees permanently waived pursuant to this agreement. During the period ended May 31, 2005, purchases and sales of High Yield Fund were $615,000 and $288,000, respectively. Realized losses during the period were $13,000, and investment income during the period was $17,000. At May 31, 2005, the value of shares of High Yield Fund held were $314,000.
As of May 31, 2005, T. Rowe Price Group, Inc. and/or its wholly owned subsidiaries owned 1,528,866 shares of the fund, representing 100% of the fund’s net assets.
Report of Independent Registered Public Accounting Firm
To the Board of Directors of T. Rowe Price Institutional Income Funds, Inc. and Shareholders of T. Rowe Price Institutional Core Plus Fund
In our opinion, the accompanying statement of assets and liabilities, including the portfolio of investments, and the related statements of operations and of changes in net assets and the financial highlights present fairly, in all material respects, the financial position of T. Rowe Price Institutional Core Plus Fund (one of the portfolios comprising T. Rowe Price Institutional Income Funds, Inc., hereafter referred to as the “Fund”) at May 31, 2005, the results of its operations, the changes in its net assets and the financial highlights for the period November 30, 2004 (commencement of operations) through May 31, 2005, in conformity with accounting principles generally accepted in the United States of America. These financial statements and financial highlights (hereafter referred to as “financial statements”) are the responsibility of the Fund’s management; our responsibility is to express an opinion on these financial statements based on our audit. We conducted our audit of these financial statements in accordance with the auditing standards of the Public Company Accounting Oversight Board (United States). Those standards require that we plan and perform the audit to obtain reasonable assurance about whether the financial statements are free of material misstatement. An audit includes examining, on a test basis, evidence supporting the amounts and disclosures in the financial statements, assessing the accounting principles used and significant estimates made by management, and evaluating the overall financial statement presentation. We believe that our audit, which included confirmation of securities at May 31, 2005 by correspondence with the custodian and brokers, provides a reasonable basis for our opinion.
PricewaterhouseCoopers LLP
Baltimore, Maryland
July 12, 2005
| Information on Proxy Voting Policies, Procedures, and Records |
A description of the policies and procedures used by T. Rowe Price funds and portfolios to determine how to vote proxies relating to portfolio securities is available in each fund’s Statement of Additional Information, which you may request by calling 1-800-225-5132 or by accessing the SEC’s Web site, www.sec.gov. The description of our proxy voting policies and procedures is also available on our Web site, www.troweprice.com. To access it, click on the words “Company Info” at the top of our homepage for individual investors. Then, in the window that appears, click on the “Proxy Voting Policy” navigation button in the top left corner.Each fund’s most recent annual proxy voting record is available on our Web site and through the SEC’s Web site. To access it through our Web site, follow the directions above, then click on the words “Proxy Voting Record” at the bottom of the Proxy Voting Policy page.
| How to Obtain Quarterly Portfolio Holdings |
The fund files a complete schedule of portfolio holdings with the Securities and Exchange Commission for the first and third quarters of each fiscal year on Form N-Q. The fund’s Form N-Q is available electronically on the SEC’s Web site (www.sec.gov); hard copies may be reviewed and copied at the SEC’s Public Reference Room, 450 Fifth St. N.W., Washington, DC 20549. For more information on the Public Reference Room, call 1-800-SEC-0330.
| Approval of Investment Management Agreement |
On March 2, 2005, the fund’s Board of Directors unanimously approved the investment advisory contract (“Contract”) between the fund and its investment manager, T. Rowe Price Associates, Inc. (“Manager”). The Board considered a variety of factors in connection with its review of the Contract, also taking into account information provided by the Manager during the course of the year, as discussed below:Services Provided by the Manager
The Board considered the nature, quality, and extent of the services provided to the fund by the Manager. These services included, but were not limited to, management of the fund’s portfolio and a variety of activities related to portfolio management. The Board also reviewed the background and experience of the Manager’s senior management team and investment personnel involved in the management of the fund. The Board concluded that it was satisfied with the nature, quality, and extent of the services provided by the Manager.
Investment Performance of the Fund
The fund commenced operations in December 2004; as a result, it did not yet have meaningful performance results as of March 2, 2005, and the Board accordingly did not review any fund performance information.
Costs, Benefits, Profits, and Economies of Scale
The Board reviewed detailed information regarding the revenues received by the Manager under the Contract and other benefits that the Manager (and its affiliates) may have realized from its relationship with the fund, including research received under “soft dollar” agreements. The Board also received information on the estimated costs incurred and profits realized by the Manager and its affiliates from advising T. Rowe Price mutual funds. Because the Manager is currently waiving its fee for this particular fund, the Board was not provided with estimates of the gross profits realized from managing this fund. The Board concluded that the Manager’s profits from advising T. Rowe Price mutual funds were reasonable in light of the services provided to the fund. The Board also considered whether the fund or other funds benefit under the fee levels set forth in the Contract from any economies of scale realized by the Manager. The Board noted that, under the Contract, the fund pays the Manager a single fee based on the fund’s assets and the Manager, in turn, pays all expenses of the fund, with certain exceptions. The Board concluded that, based on the profitability data it reviewed and consistent with this single fee structure, the Contract provided for a reasonable sharing of any benefits from economies of scale with the fund.
Fees
The Board reviewed the fund’s single-fee structure and compared the rate to fees and expenses of other comparable funds based on information and data supplied by Lipper. The information provided to the Board showed that the fund’s single fee rate was generally below the median management fee rate and expense ratio of comparable funds. The Board also reviewed the fee schedules for comparable privately managed accounts of the Manager and its affiliates. Management informed the Board that the Manager’s responsibilities for privately managed accounts are more limited than its responsibilities for the fund and other T. Rowe Price mutual funds that it or its affiliates advise. On the basis of the information provided, the Board concluded that the fees paid by the fund under the Contract were reasonable.
Approval of the Contract
As noted, the Board approved the continuation of the Contract. No single factor was considered in isolation or to be determinative to the decision. Rather, the Board concluded, in light of a weighting and balancing of all factors considered, that it was in the best interests of the fund to approve the continuation of the Contract, including the fees to be charged for services thereunder.
| About the Fund’s Directors and Officers |
Your fund is governed by a Board of Directors that meets regularly to review investments, performance, expenses, and other business matters, and is responsible for protecting the interests of shareholders. The majority of the fund’s directors are independent of T. Rowe Price Associates, Inc. (T. Rowe Price); “inside” directors are officers of T. Rowe Price. The Board of Directors elects the fund’s officers, who are listed in the final table. The business address of each director and officer is 100 East Pratt Street, Baltimore, MD 21202. The Statement of Additional Information includes additional information about the fund directors and is available without charge by calling a T. Rowe Price representative at 1-800-638-8790.
| Independent Directors | |
| |
| Name | |
| (Year of Birth) | |
| Year Elected* | Principal Occupation(s) During Past 5 Years and Directorships of Other Public Companies |
| |
| Anthony W. Deering | Chairman, Exeter Capital, LLC, a private investment firm (2004 to present); Director, Chairman of the Board, and |
| (1945) | Chief Executive Officer, The Rouse Company, real estate developers (1997 to 2004); Director, Mercantile Bank |
| 2002 | (4/03 to present) |
| |
| Donald W. Dick, Jr. | Principal, EuroCapital Advisors, LLC, an acquisition and management advisory firm; Chairman, President, and |
| (1943) | Chief Executive Officer, The Haven Group, a custom manufacturer of modular homes (1/04 to present) |
| 2002 | |
| |
| David K. Fagin | Chairman and President, Nye Corporation (6/88 to present); Director, Canyon Resources Corporation and Golden |
| (1938) | Star Resources Ltd. (5/00 to present), and Pacific Rim Mining Corp. (2/02 to present) |
| 2002 | |
| |
| Karen N. Horn | Managing Director and President, Global Private Client Services, Marsh Inc. (1999 to 2003); Managing Director and |
| (1943) | Head of International Private Banking, Bankers Trust (1996 to 1999); Director, Eli Lilly and Company and Georgia |
| 2003 | Pacific |
| |
| F. Pierce Linaweaver | President, F. Pierce Linaweaver & Associates, Inc., consulting environmental and civil engineers |
| (1934) | |
| 2002 | |
| |
| Theo C. Rodgers** | President, A&R Development Corporation |
| (1941) | |
| 2005 | |
| |
| John G. Schreiber | Owner/President, Centaur Capital Partners, Inc., a real estate investment company; Partner, Blackstone Real Estate |
| (1946) | Advisors, L.P.; Director, AMLI Residential Properties Trust |
| 2002 | |
| |
| * Each independent director oversees 112 T. Rowe Price portfolios and serves until retirement, resignation, or election of a successor. |
| ** Elected effective April 1, 2005. |
| Inside Directors | |
| |
| Name | |
| (Year of Birth) | |
| Year Elected* | |
| [Number of T. Rowe Price | |
| Portfolios Overseen] | Principal Occupation(s) During Past 5 Years and Directorships of Other Public Companies |
| |
| Mary J. Miller, CFA | Director and Vice President, T. Rowe Price; Vice President, T. Rowe Price Group, Inc.; |
| (1955) | President, Institutional Income Funds |
| 2004 | |
| [37] | |
| |
| James S. Riepe | Director and Vice President, T. Rowe Price; Vice Chairman of the Board, Director, and Vice President, T. Rowe Price |
| (1943) | Group, Inc.; Chairman of the Board and Director, T. Rowe Price Global Asset Management Limited, T. Rowe Price |
| 2002 | Global Investment Services Limited, T. Rowe Price Investment Services, Inc., T. Rowe Price Retirement Plan Services, |
| [112] | Inc., and T. Rowe Price Services, Inc.; Chairman of the Board, Director, President, and Trust Officer, T. Rowe Price |
| | Trust Company; Director, T. Rowe Price International, Inc.; Director, The Nasdaq Stock Market, Inc. |
| |
| * Each inside director serves until retirement, resignation, or election of a successor. |
| Officers | |
| |
| Name (Year of Birth) | |
| Title and Fund(s) Served | Principal Occupation(s) |
| |
| Connice A. Bavely, CFA (1951) | Vice President, T. Rowe Price and T. Rowe Price Group, Inc. |
| Vice President, Institutional Income Funds | |
| |
| Brian J. Brennan, CFA (1964) | Vice President, T. Rowe Price, T. Rowe Price Group, Inc., and T. Rowe |
| Executive Vice President, Institutional Income Funds | Price Trust Company |
| |
| Andrew M. Brooks (1956) | Vice President, T. Rowe Price and T. Rowe Price Group, Inc. |
| Vice President, Institutional Income Funds | |
| |
| Joseph A. Carrier, CPA (1960) | Vice President, T. Rowe Price, T. Rowe Price Group, Inc., T. Rowe Price |
| Treasurer, Institutional Income Funds | Investment Services, Inc., and T. Rowe Price Trust Company |
| |
| Michael J. Conelius, CFA (1964) | Vice President, T. Rowe Price, T. Rowe Price Group, Inc., and T. Rowe |
| Vice President, Institutional Income Funds | Price International, Inc. |
| |
| Roger L. Fiery III, CPA (1959) | Vice President, T. Rowe Price, T. Rowe Price Group, Inc., T. Rowe Price |
| Vice President, Institutional Income Funds | International, Inc., and T. Rowe Price Trust Company |
| |
| Robert N. Gensler (1957) | Vice President, T. Rowe Price, T. Rowe Price Group, Inc., and T. Rowe |
| Vice President, Institutional Income Funds | Price International, Inc. |
| |
| John R. Gilner (1961) | Chief Compliance Officer and Vice President, T. Rowe Price; Vice |
| Chief Compliance Officer, Institutional Income Funds | President, T. Rowe Price Group, Inc. and T. Rowe Price Investment |
| | Services, Inc. |
| |
| Gregory S. Golczewski (1966) | Vice President, T. Rowe Price and T. Rowe Price Trust Company |
| Vice President, Institutional Income Funds | |
| | |
| Henry H. Hopkins (1942) | Director and Vice President, T. Rowe Price Investment Services, Inc., |
| Vice President, Institutional Income Funds | T. Rowe Price Services, Inc., and T. Rowe Price Trust Company; Vice |
| | President, T. Rowe Price, T. Rowe Price Group, Inc., T. Rowe Price |
| | International, Inc., and T. Rowe Price Retirement Plan Services, Inc. |
| |
| Paul A. Karpers, CFA (1967) | Vice President, T. Rowe Price and T. Rowe Price Group, Inc. |
| Vice President, Institutional Income Funds | |
| |
| Ian Kelson (1956) | Vice President, T. Rowe Price, T. Rowe Price Group, Inc., and T. Rowe |
| Vice President, Institutional Income Funds | Price International, Inc. |
| |
| Patricia B. Lippert (1953) | Assistant Vice President, T. Rowe Price and T. Rowe Price Investment |
| Secretary, Institutional Income Funds | Services, Inc. |
| |
| Kevin P. Loome, CFA (1967) | Vice President, T. Rowe Price, T. Rowe Price Group, Inc., and T. Rowe |
| Vice President, Institutional Income Funds | Price International, Inc. |
| |
| Michael J. McGonigle (1966) | Vice President, T. Rowe Price and T. Rowe Price Group, Inc. |
| Vice President, Institutional Income Funds | |
| |
| Daniel O. Shackelford, CFA (1958) | Vice President, T. Rowe Price, T. Rowe Price Group, Inc., and T. Rowe |
| Vice President, Institutional Income Funds | Price Trust Company |
| |
| Walter P. Stuart III, CFA (1960) | Vice President, T. Rowe Price and T. Rowe Price Group, Inc. |
| Vice President, Institutional Income Funds | |
| |
| Thomas E. Tewksbury (1961) | Vice President, T. Rowe Price and T. Rowe Price Group, Inc. |
| Vice President, Institutional Income Funds | |
| |
| David A. Tiberii, CFA (1965) | Vice President, T. Rowe Price and T. Rowe Price Group, Inc. |
| Vice President, Institutional Income Funds | |
| |
| Mark J. Vaselkiv (1958) | Vice President, T. Rowe Price and T. Rowe Price Group, Inc. |
| Executive Vice President, Institutional Income Funds | |
| |
| Julie L. Waples (1970) | Vice President, T. Rowe Price |
| Vice President, Institutional Income Funds | |
| |
| Thea N. Williams (1961) | Vice President, T. Rowe Price and T. Rowe Price Group, Inc. |
| Vice President, Institutional Income Funds | |
| |
| Unless otherwise noted, officers have been employees of T. Rowe Price or T. Rowe Price International for at least five years. |
Item 2. Code of Ethics.
The registrant has adopted a code of ethics, as defined in Item 2 of Form N-CSR, applicable to its principal executive officer, principal financial officer, principal accounting officer or controller, or persons performing similar functions. A copy of this code of ethics is filed as an exhibit to this Form N-CSR. No substantive amendments were approved or waivers were granted to this code of ethics during the period covered by this report.
Item 3. Audit Committee Financial Expert.
The registrant’s Board of Directors/Trustees has determined that Mr. David K. Fagin qualifies as an audit committee financial expert, as defined in Item 3 of Form N-CSR. Mr. Fagin is considered independent for purposes of Item 3 of Form N-CSR.
Item 4. Principal Accountant Fees and Services.
(a) – (d) Aggregate fees billed to the registrant for the last two fiscal years for professional services rendered by the registrant’s principal accountant were as follows:
| | 2005 | 2004 |
| Audit Fees | $7,486 | $- |
| Audit-Related Fees | 64 | - |
| Tax Fees | 2,288 | - |
| All Other Fees | 165 | - |
Audit fees include amounts related to the audit of the registrant’s annual financial statements and services normally provided by the accountant in connection with statutory and regulatory filings. Audit-related fees include amounts reasonably related to the performance of the audit of the registrant’s financial statements, specifically the issuance of a report on internal controls. Tax fees include amounts related to tax compliance, tax planning, and tax advice. Other fees include the registrant’s pro-rata share of amounts for agreed-upon procedures in conjunction with service contract approvals by the registrant’s Board of Directors/Trustees.
(e)(1) The registrant’s audit committee has adopted a policy whereby audit and non-audit services performed by the registrant’s principal accountant for the registrant, its investment adviser, and any entity controlling, controlled by, or under common control with the investment adviser that provides ongoing services to the registrant require pre-approval in advance at regularly scheduled audit committee meetings. If such a service is required between regularly scheduled audit committee meetings, pre-approval may be authorized by one audit committee member with ratification at the next scheduled audit committee meeting. Waiver of pre-approval for audit or non-audit services requiring fees of a de minimis amount is not permitted.
(2) No services included in (b) – (d) above were approved pursuant to paragraph (c)(7)(i)(C) of Rule 2-01 of Regulation S-X.
(f) Less than 50 percent of the hours expended on the principal accountant’s engagement to audit the registrant’s financial statements for the most recent fiscal year were attributed to work performed by persons other than the principal accountant’s full-time, permanent employees.
(g) The aggregate fees billed for the most recent fiscal year and the preceding fiscal year by the registrant’s principal accountant for non-audit services rendered to the registrant, its investment adviser, and any entity controlling, controlled by, or under common control with the investment adviser that provides ongoing services to the registrant were $903,000 and $821,000, respectively, and were less than the aggregate fees billed for those same periods by the registrant’s principal accountant for audit services rendered to the T. Rowe Price Funds.
(h) All non-audit services rendered in (g) above were pre-approved by the registrant’s audit committee. Accordingly, these services were considered by the registrant’s audit committee in maintaining the principal accountant’s independence.Item 5. Audit Committee of Listed Registrants.
Not applicable.
Item 6. Schedule of Investments.
Not applicable. The complete schedule of investments is included in Item 1 of this Form N-CSR.
Item 7. Disclosure of Proxy Voting Policies and Procedures for Closed-End Management Investment Companies.
Not applicable.
Item 8. Portfolio Managers of Closed-End Management Investment Companies.
Not applicable.
Item 9. Purchases of Equity Securities by Closed-End Management Investment Company and Affiliated Purchasers.
Not applicable.
Item 10. Submission of Matters to a Vote of Security Holders.
Not applicable.
Item 11. Controls and Procedures.
(a) The registrant’s principal executive officer and principal financial officer have evaluated the registrant’s disclosure controls and procedures within 90 days of this filing and have concluded that the registrant’s disclosure controls and procedures were effective, as of that date, in ensuring that information required to be disclosed by the registrant in this Form N-CSR was recorded, processed, summarized, and reported timely.
(b) The registrant’s principal executive officer and principal financial officer are aware of no change in the registrant’s internal control over financial reporting that occurred during the registrant’s second fiscal quarter covered by this report that has materially affected, or is reasonably likely to materially affect, the registrant’s internal control over financial reporting.
Item 12. Exhibits.
(a)(1) The registrant’s code of ethics pursuant to Item 2 of Form N-CSR is attached.
(2) Separate certifications by the registrant's principal executive officer and principal financial officer, pursuant to Section 302 of the Sarbanes-Oxley Act of 2002 and required by Rule 30a-2(a) under the Investment Company Act of 1940, are attached.
(3) Written solicitation to repurchase securities issued by closed-end companies: not applicable.
(b) A certification by the registrant's principal executive officer and principal financial officer, pursuant to Section 906 of the Sarbanes-Oxley Act of 2002 and required by Rule 30a-2(b) under the Investment Company Act of 1940, is attached.
| SIGNATURES |
| |
| | Pursuant to the requirements of the Securities Exchange Act of 1934 and the Investment |
| Company Act of 1940, the registrant has duly caused this report to be signed on its behalf by the |
| undersigned, thereunto duly authorized. |
| |
| T. Rowe Price Institutional Income Funds, Inc. |
| |
| |
| By | /s/ James S. Riepe |
| | James S. Riepe |
| | Principal Executive Officer |
| |
| Date | July 20, 2005 |
| |
| |
| | Pursuant to the requirements of the Securities Exchange Act of 1934 and the Investment |
| Company Act of 1940, this report has been signed below by the following persons on behalf of |
| the registrant and in the capacities and on the dates indicated. |
| |
| |
| By | /s/ James S. Riepe |
| | James S. Riepe |
| | Principal Executive Officer |
| |
| Date | July 20, 2005 |
| |
| |
| |
| By | /s/ Joseph A. Carrier |
| | Joseph A. Carrier |
| | Principal Financial Officer |
| |
| Date | July 20, 2005 |