Item 1: Report to Shareholders| Institutional High Yield Fund | May 31, 2006 |
The views and opinions in this report were current as of May 31, 2006. They are not guarantees of performance or investment results and should not be taken as investment advice. Investment decisions reflect a variety of factors, and the managers reserve the right to change their views about individual stocks, sectors, and the markets at any time. As a result, the views expressed should not be relied upon as a forecast of the fund’s future investment intent. The report is certified under the Sarbanes-Oxley Act of 2002, which requires mutual funds and other public companies to affirm that, to the best of their knowledge, the information in their financial reports is fairly and accurately stated in all material respects.
Dear Investors
Despite our cautious counsel in the midyear letter, high-yield bonds were again the best-performing domestic fixed-income asset class for the past six months. Absolute returns for six months and the year rose steadily and were on par with the fund’s long-term average annual total returns. In a challenging market environment, volatility persisted but the asset class was resilient. Lower-quality bonds outperformed higher-quality credits over the past six months, which hurt our comparison with the benchmark index and peer group average in the second half of our fiscal year.
PORTFOLIO PERFORMANCE AND MARKET ENVIRONMENT
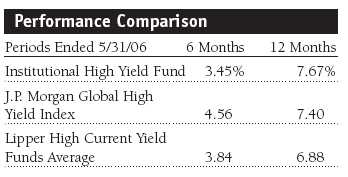
Your fund posted solid absolute returns for the past six and 12 months but underperformed the J.P. Morgan Global High Yield Index and the Lipper average of comparable funds for the past six months. We are pleased to report that we outperformed both yardsticks for the 12-month period ended May 31, 2006. The primary reason for our weak relative results in the past six months was our risk-averse investing philosophy, which emphasizes broad diversification, balanced sector allocation, and a focus on the middle and upper tiers of the high-yield market. Over the past six months, in the rising interest rate environment, low-quality (CCC rated) bonds surged, largely due to strong investor demand for higher-yielding debt instruments, higher-quality (BB and B rated) issues posted more measured gains, and investment-grade bonds declined.
High-yield bonds have been volatile over the past few quarters, which has generated investor concern about our market’s long-term direction. Six months ago, with some of the riskier names in the market trending sharply lower, we believed the long period of low-quality outperformance had come to an end. Underweighting CCC rated bonds in the second half of 2005 helped our relative performance, and we maintained a modest underweight in lower-rated credits over the past six months, but that decision hurt our relative returns, and to our surprise, lower-rated issues got a second wind and surged.
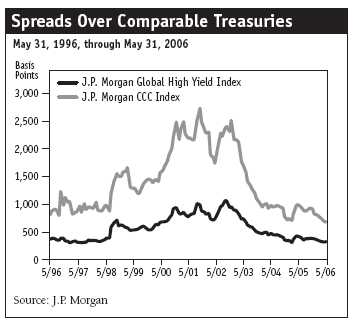
As you can see in the nearby chart, the spread (or difference in yield) between CCC rated bonds and risk-free Treasuries continued to shrink over the past 12 months, as investors’ appetite for yield and willingness to accept credit risk steadily pushed bond prices higher and yields lower. The spread in the CCC universe is narrow by historical measures, and this compression suggests that the market is expensive and could be ripe for a correction. We continue to believe the best investment opportunities in high yield are in BB and B rated bonds.
PORTFOLIO REVIEW
As mentioned earlier, over the past six months, we maintained our focus on the middle- to higher-quality tiers of the high-yield market, which has hampered our relative performance. The market’s overall fundamentals remained strong. Balance sheet quality within the high-yield market continued to improve, debt as a percent of cash flow stayed at manageable levels, and the default rate in the high-yield market was low. However, the market has performed so well for so long there is very little room for spreads to tighten much further.

As noted in the Quality Diversification chart, the portfolio’s primary focus is investing in the middle and upper tiers of the junk bond market (more than 80% of the portfolio’s assets). We were truly surprised at the performance of CCC rated bonds in the first five months of 2006 (+9.2%), while BBs and Bs advanced just 1.2% and 3.5%, respectively. Given that the credit cycle is in its late stages, the strong performance of lower-quality credits was unexpected. Over the past six months we modestly trimmed our exposure in bonds rated CCC and below, and we do not intend to chase recent “hot” performance. Rather, we expect high-quality junk to outperform lower-quality issues in coming months as we believe the Fed will continue to hike interest rates to stave off inflation and slow economic growth.
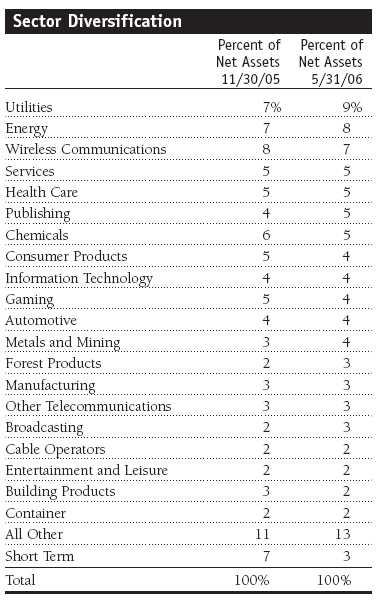
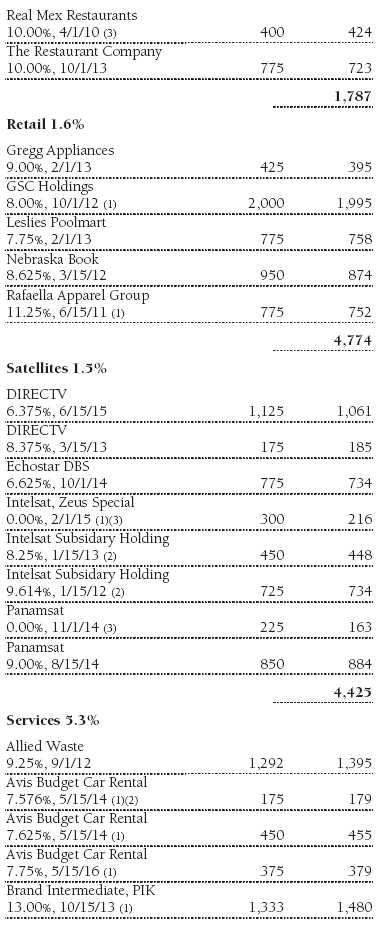
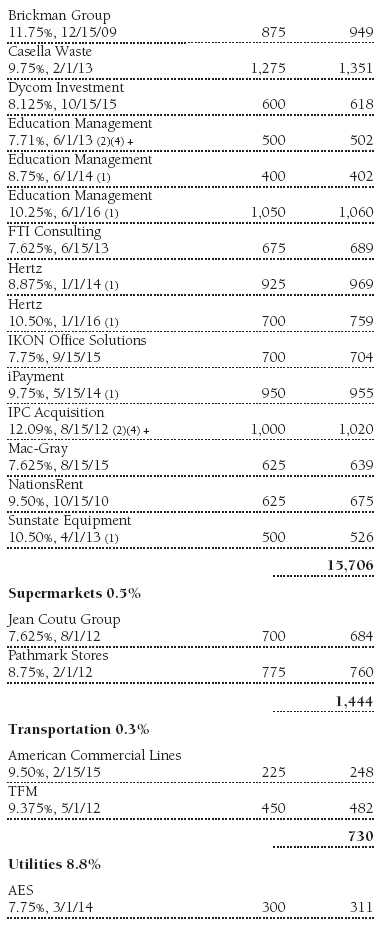
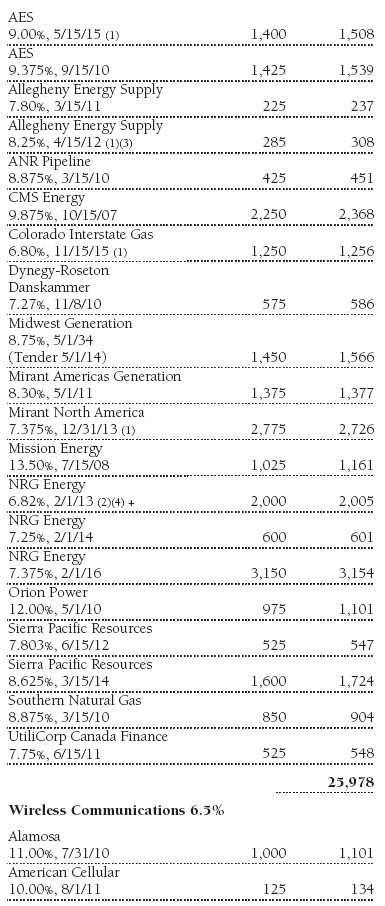
We have bolstered our defensive positioning this year. Utilities and energy were among our largest allocations six months ago because we believed they would be stable in an environment where riskier companies would start to underperform. With our recent additions, they now represent 17% of the fund. These conservative, high-quality companies with low spreads, while still positive, were unable to keep pace with higher-yielding sectors of the market. Despite their recent lackluster relative performance, we are comfortable with the positions because we think that both sectors will hold up well should the high-yield market turn lower.
Bank Debt: A Win, Win, Win Scenario
Short-term interest rates have been about the same as intermediate- and long-term rates for most of the past six months. However, the prospect of rising yields prompted us to swap out some of the bonds and into the bank debt of several of the large companies we own. Since last year, we have become active in the bank debt market, which used to be exclusively for commercial lending institutions. Funds can now buy pieces of these loans and participate in this market more easily than in the past.
Not only does bank debt diversify our holdings, but it is also secured by the assets of the company and is in line for repayment before the bonds we owned. Bank debt is a floating rate obligation that resets its yield every three months. So, unlike a bond, when interest rates move higher, the floating rate keeps pace with current rates and does not decline like a fixed-rate security. Additionally, we are getting nice current yield from the bank debt we recently purchased because rates have moved higher, and many of these secured floating-rate instruments provide us with a higher current yield than traditional unsecured fixed-rate bonds.
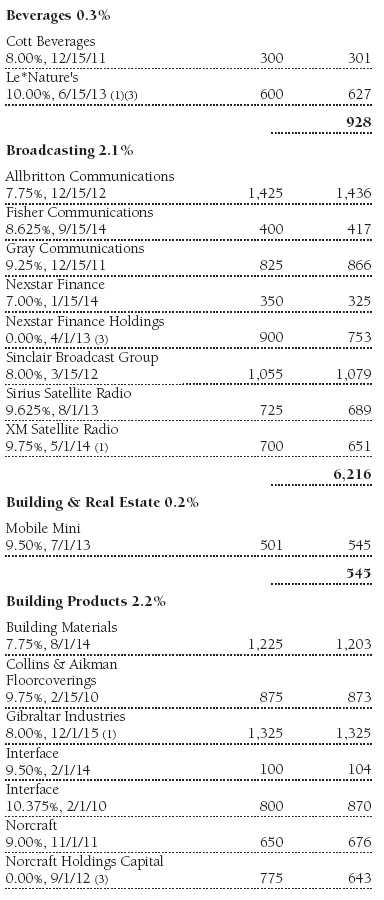
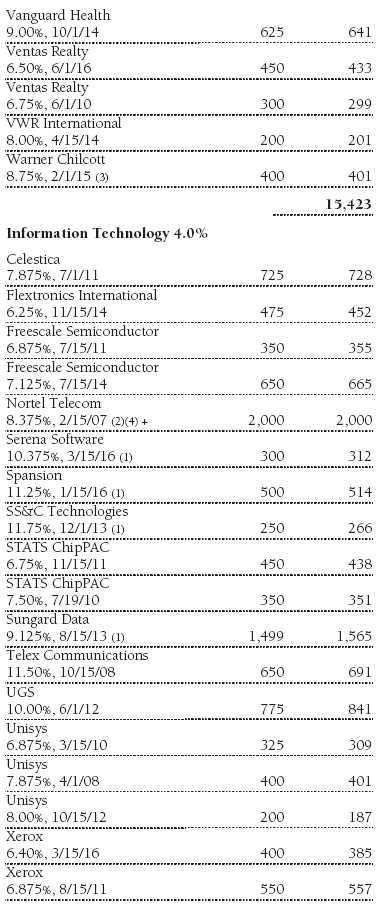
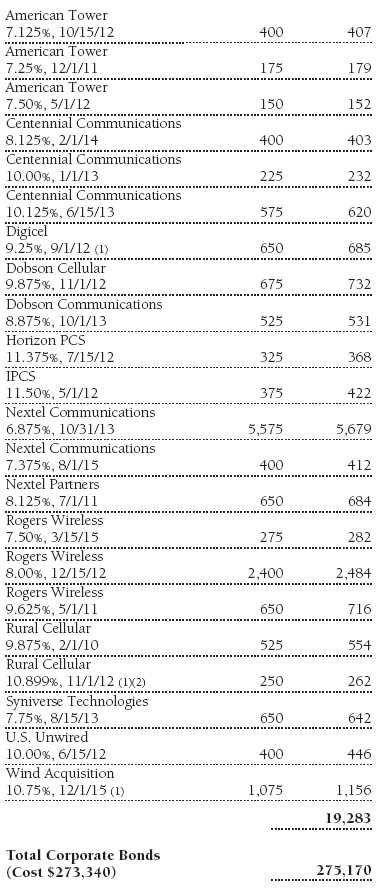
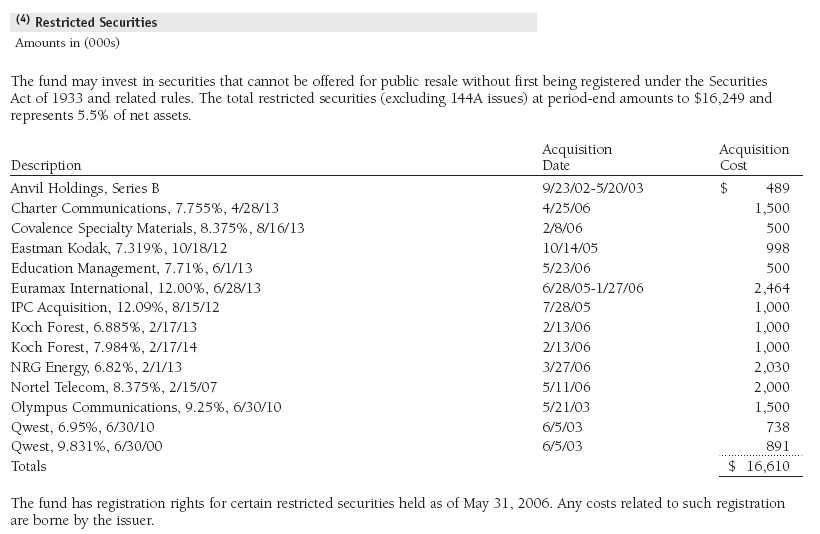
We established a position in a Nortel Networks one-year bank loan yielding 8.38%. The telecommunications equipment provider with a middle-tier credit rating was looking to refinance its balance sheet. We also improved the average quality of our holdings in Charter Communications, with the addition of its bank debt. The large cable company’s bank debt yielded 7.75% and had a higher credit rating than the bonds we already owned. We also took a position in an 8% Koch Industries bank loan backed by Georgia-Pacific. (Please refer to our portfolio of investments for a complete listing of holdings and the amount each represents in the portfolio.)
In each case we bought into large companies, and found we could get equal or greater yield owning the bank debt relative to their bonds. In addition, we picked up senior securities with floating rates that do not have the downside should rates rise. A win, win, win scenario, we think. Bank debt now totals more than 5% of the portfolio, every one of our term loans is currently priced above our cost, and we have been clipping nice coupons. We believe this is a good strategy for a rising interest rate environment.
Convertible Securities Add Appreciation Potential
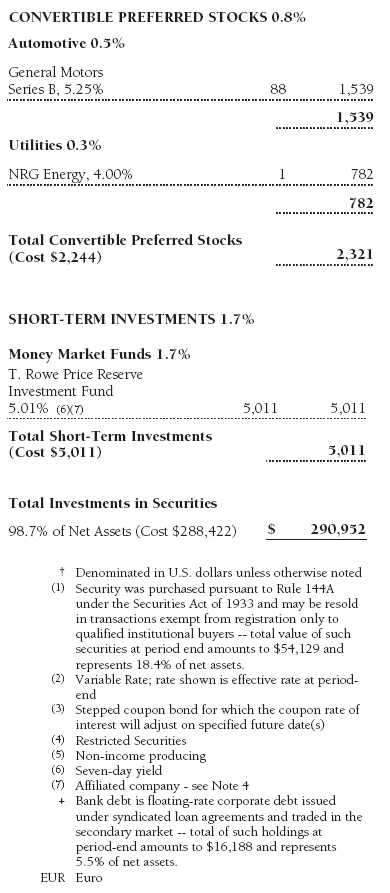
Our purchase of convertible bonds and preferred shares was another avenue we pursued this year that led to good gains. When we really like a high-yield company, we will look for alternative securities to take advantage of the good situation. Convertible securities typically generate a bit less income than a bond, but they have stock-like appreciation potential. Convertible preferred stock usually pays a larger dividend than the common stock, has preference over regular shares in the payment of liquidation assets, and is favored by risk-averse investors who like the combination of lower volatility and higher yield.
We diversified our bond holdings in NRG Energy with bank debt and purchases of its convertible preferred stock. We like the prospects for this large, independent power producer, and it has become a significant portfolio holding. It is not a traditional retail utility; rather, it’s a generating company that owns power plants and sells to utilities such as Chesapeake Energy and Florida Power & Light. NRG recently purchased longtime portfolio holding Texas Genco, generating a sizable profit for us. Its convertible preferred has a solid credit rating and has generated solid capital appreciation since we added it to the portfolio. We think there will be more consolidation in the electric utility industry, which will be good for our core holdings in the industry.
Our talented team of credit analysts is continually uncovering interesting fundamental stories in the high-yield market, and we are always on the lookout for ways to generate additional yield and capital appreciation. For example, we diversified our largest holding, GMAC bonds, with the acquisition of General Motors 5.25% convertible preferred. This security has upside if the company’s stock recovers and also has a unique feature that allows us to sell the preferred back to the company in 2014 at par value. We found it a compelling opportunity as the securities currently trade at a 30% discount to par. So, in addition to the generous current yield, we should reap solid capital gains in coming years. Because there is a scarcity of good-quality bonds for us to buy, we are willing to be creative in finding value and the best yields available in nontraditional places. Bank debt and convertibles are a good fit for our strategy. They provide us with the opportunity for high total return without the extreme valuation risk of CCC rated credits.
Merger and Acquisition Activity Slows in 2006
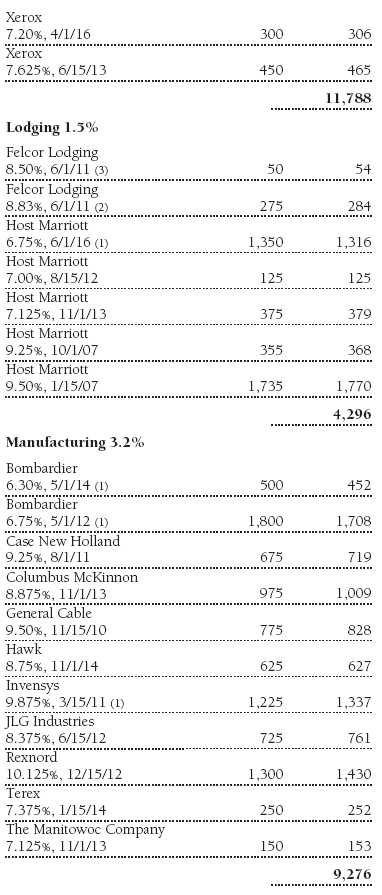
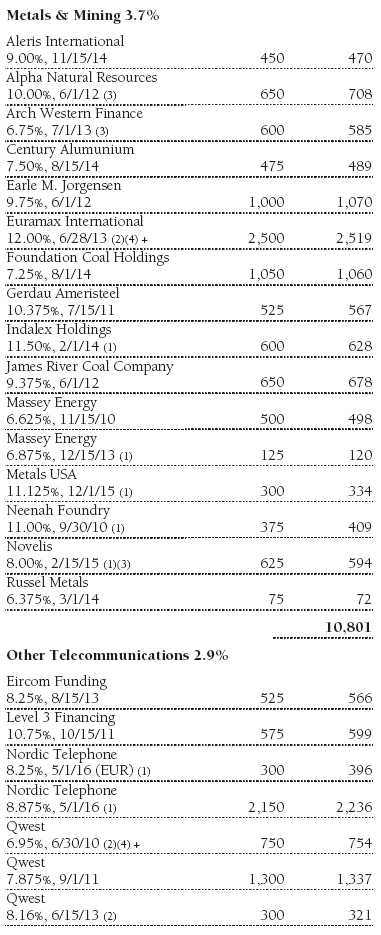
Six months ago we wrote about the acceleration in merger and acquisition (M&A) deals, and although the number of deals was underwhelming versus our expectations in the first part of 2006, we made several large purchases. As equity prices flatten out, investment-grade companies tend to pursue leveraged buyouts. These former blue chip companies, also referred to as “fallen angels,” have been attractive opportunities for us, and we expect them to continue for the remainder of the year. The most important for us thus far this year is Nordic Telephone, formerly known as TDC. It is the leading telephone company in Denmark with dominant positions in both wireless and landline operations. We established a large position in a pair of securities yielding 8.25% and 8.875% and expect to generate steady returns.
Education Management, another significant deal, is the owner of for-profit education facilities. It has a growing business in the U.S. and has been a substantial holding for many T. Rowe Price funds over the past few years. We liked the company’s prospects and established a large position at the time of its multi-billion-dollar leveraged buyout. The healthy payout is also attractive. Nutro Products presented another compelling opportunity. This little-known company manufactures high-end pet food. We bought a floating rate security with a 9.23% yield and a fixed-rate bond paying 10.75%. We anticipate more M&A activity in the coming months and are actively researching and evaluating their prospects. By and large, these deals are performing well, and we are anxious to reap the benefit of their higher coupons.
OUTLOOK
We have enjoyed a great run, but to use a baseball analogy, we think the bull market in high yield is in extra innings. However, we don’t expect a drastic move that results in significant capital depreciation for the portfolio. In our view, it is more likely that we’ll see an economic soft landing and a more traditional type of high-yield environment where coupons generate the bulk of returns. Higher interest rates will eventually be a positive for our investors, because ultimately it is the income stream that drives most of our performance. However, we want to make it clear that we feel it is the wrong point in the cycle to downgrade the portfolio and buy marginal companies.
For the past few years, the bonds we’ve owned have generated a 6% or 7% coupon. With rates moving up and credit conditions getting a little tighter, we are starting to be able to buy some 9% and 10% yields again. That will improve the portfolio’s overall income stream and, in time, make the entire high-yield market healthier. We welcome this transition, we’ve expected it, and with the help of our talented research team we hope to find attractive new deals and investment opportunities in the secondary market. While the next six months could be choppy and volatile, we think the high-yield market holds promising prospects for fixed-income investors over the intermediate and long term.
Thank you for investing with T. Rowe Price.
Respectfully submitted,
Mark J. Vaselkiv
Chairman of the fund’s Investment Advisory Committee
June 16, 2006
The committee chairman has day-to-day responsibility for managing the portfolio and works with committee members in developing and executing the fund’s investment program.
Bonds are subject to interest rate risk, the decline in bond prices that usually accompanies a rise in interest rates, and credit risk, the chance that any fund holding could have its credit rating downgraded, or that a bond issuer will default (fail to make timely payments of interest or principal), potentially reducing the fund’s income level and share price. High-yield corporate bonds could have greater price declines than funds that invest primarily in high-quality bonds. Companies issuing high-yield bonds are not as strong financially as those with higher credit ratings, so the bonds are usually considered speculative investments.
Average maturity: The weighted average of the stated maturity dates of the portfolio’s securities. In general, the longer the average maturity, the greater the fund’s sensitivity to interest rate changes. A shorter average maturity usually means less interest rate sensitivity and therefore a less volatile portfolio.
Duration: A measure of a bond or bond fund’s sensitivity to changes in interest rates. For example, a fund with a four-year duration would fall about 4% in response to a one-percentage-point rise in interest rates, and vice versa.
Federal funds rate: The interest rate charged on overnight loans of reserves by one financial institution to another in the United States. The Federal Reserve sets a target federal funds rate to affect the direction of interest rates.
J.P. Morgan Global High Yield Index: Tracks the performance of domestic and overseas noninvestment-grade corporate bonds; all are denominated in U.S. dollars.
Lipper averages: Consist of all mutual funds in a particular category as tracked by Lipper Inc.


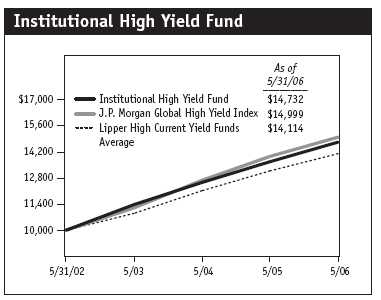
This chart shows the value of a hypothetical $10,000 investment in the fund over the past 10 fiscal year periods or since inception (for funds lacking 10-year records). The result is compared with benchmarks, which may include a broad-based market index and a peer group average or index. Market indexes do not include expenses, which are deducted from fund returns as well as mutual fund averages and indexes.
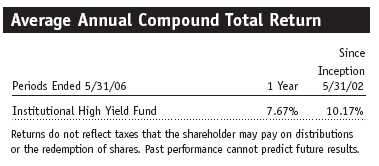
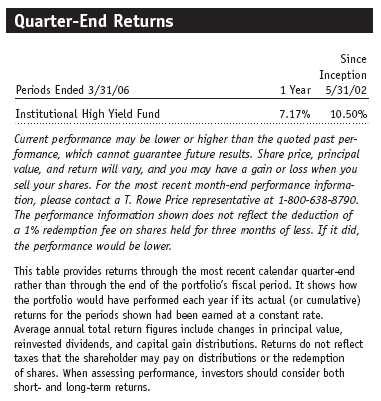
This table shows how the fund would have performed each year if its actual (or cumulative) returns for the periods shown had been earned at a constant rate.
Fund Expense Example
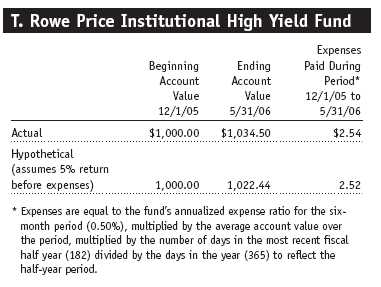
As a mutual fund shareholder, you may incur two types of costs: (1) transaction costs such as redemption fees or sales loads and (2) ongoing costs, including management fees, distribution and service (12b-1) fees, and other fund expenses. The following example is intended to help you understand your ongoing costs (in dollars) of investing in the fund and to compare these costs with the ongoing costs of investing in other mutual funds. The example is based on an investment of $1,000 invested at the beginning of the most recent six-month period and held for the entire period.
Actual Expenses
The first line of the following table (“Actual”) provides information about actual account values and actual expenses. You may use the information in this line, together with your account balance, to estimate the expenses that you paid over the period. Simply divide your account value by $1,000 (for example, an $8,600 account value divided by $1,000 = 8.6), then multiply the result by the number in the first line under the heading “Expenses Paid During Period” to estimate the expenses you paid on your account during this period.
Hypothetical Example for Comparison Purposes
The information on the second line of the table (“Hypothetical”) is based on hypothetical account values and expenses derived from the fund’s actual expense ratio and an assumed 5% per year rate of return before expenses (not the fund’s actual return). You may compare the ongoing costs of investing in the fund with other funds by contrasting this 5% hypothetical example and the 5% hypothetical examples that appear in the shareholder reports of the other funds. The hypothetical account values and expenses may not be used to estimate the actual ending account balance or expenses you paid for the period.
You should also be aware that the expenses shown in the table highlight only your ongoing costs and do not reflect any transaction costs, such as redemption fees or sales loads. Therefore, the second line of the table is useful in comparing ongoing costs only and will not help you determine the relative total costs of owning different funds. To the extent a fund charges transaction costs, however, the total cost of owning that fund is higher.
The accompanying notes are an integral part of these financial statements.


The accompanying notes are an integral part of these financial statements.
The accompanying notes are an integral part of these financial statements.

The accompanying notes are an integral part of these financial statements.

The accompanying notes are an integral part of these financial statements.
Notes to Financial Statements
T. Rowe Price Institutional High Yield Fund
May 31, 2006
NOTE 1 - SIGNIFICANT ACCOUNTING POLICIES
T. Rowe Price Institutional Income Funds, Inc. (the corporation), is registered under the Investment Company Act of 1940 (the 1940 Act). The Institutional High Yield Fund (the fund), a diversified, open-end management investment company, is one portfolio established by the corporation. The fund commenced operations on May 31, 2002. The fund seeks high current income and, secondarily, capital appreciation.
The accompanying financial statements were prepared in accordance with accounting principles generally accepted in the United States of America, which require the use of estimates made by fund management. Fund management believes that estimates and security valuations are appropriate; however actual results may differ from those estimates, and the security valuations reflected in the financial statements may differ from the value the fund ultimately realizes upon sale of the securities.
Valuation The fund values its investments and computes its net asset value per share at the close of the New York Stock Exchange (NYSE), normally 4 p.m. ET, each day that the NYSE is open for business. Debt securities are generally traded in the over-the-counter market. Securities with original maturities of one year or more are valued at prices furnished by dealers who make markets in such securities or by an independent pricing service, which considers yield or price of bonds of comparable quality, coupon, maturity, and type, as well as prices quoted by dealers who make markets in such securities. Securities with original maturities of less than one year are stated at fair value, which is determined by using a matrix system that establishes a value for each security based on bid-side money market yields.
Equity securities listed or regularly traded on a securities exchange or in the over-the-counter market are valued at the last quoted sale price or, for certain markets, the official closing price at the time the valuations are made, except for OTC Bulletin Board securities, which are valued at the mean of the latest bid and asked prices. A security that is listed or traded on more than one exchange is valued at the quotation on the exchange determined to be the primary market for such security. Listed securities not traded on a particular day are valued at the mean of the latest bid and asked prices for domestic securities and the last quoted sale price for international securities.
Investments in mutual funds are valued at the mutual fund’s closing net asset value per share on the day of valuation.
Other investments, including restricted securities, and those for which the above valuation procedures are inappropriate or are deemed not to reflect fair value are stated at fair value as determined in good faith by the T. Rowe Price Valuation Committee, established by the fund’s Board of Directors.
Most foreign markets close before the close of trading on the NYSE. If the fund determines that developments between the close of a foreign market and the close of the NYSE will, in its judgment, materially affect the value of some or all of its portfolio securities, which in turn will affect the fund’s share price, the fund will adjust the previous closing prices to reflect the fair value of the securities as of the close of the NYSE, as determined in good faith by the T. Rowe Price Valuation Committee, established by the fund’s Board of Directors. A fund may also fair value securities in other situations, such as when a particular foreign market is closed but the fund is open. In deciding whether to make fair value adjustments, the fund reviews a variety of factors, including developments in foreign markets, the performance of U.S. securities markets, and the performance of instruments trading in U.S. markets that represent foreign securities and baskets of foreign securities. The fund uses outside pricing services to provide it with closing market prices and information used for adjusting those prices. The fund cannot predict when and how often it will use closing prices and when it will adjust those prices to reflect fair value. As a means of evaluating its fair value process, the fund routinely compares closing market prices, the next day’s opening prices in the same markets, and adjusted prices.
Currency Translation Assets, including investments, and liabilities denominated in foreign currencies are translated into U.S. dollar values each day at the prevailing exchange rate, using the mean of the bid and asked prices of such currencies against U.S. dollars as quoted by a major bank. Purchases and sales of securities, income, and expenses are translated into U.S. dollars at the prevailing exchange rate on the date of the transaction. The effect of changes in foreign currency exchange rates on realized and unrealized security gains and losses is reflected as a component of security gains and losses.
Redemption Fees A 1% fee is assessed on redemptions of fund shares held less than 90 days/3 months to deter short-term trading and protect the interests of long-term shareholders. Redemption fees are withheld from proceeds that shareholders receive from the sale or exchange of fund shares. The fees are paid to the fund, and are recorded as an increase to paid-in capital. The fees may cause the redemption price per share to differ from the net asset value per share.
In-Kind Redemptions In accordance with guidelines described in the fund’s prospectus, the fund may distribute portfolio securities rather than cash as payment for a redemption of fund shares (in-kind redemption). For financial reporting purposes, the fund recognizes a gain on in-kind redemptions to the extent the value of the distributed securities on the date of redemption exceeds the cost of those securities. Gains and losses realized on in-kind redemptions are not recognized for tax purposes, and are reclassified from undistributed realized gain (loss) to paid-in capital. During the year ended May 31, 2006, the fund realized $1,594,000 of net gain on $58,400,000 of in-kind redemptions.
Investment Transactions, Investment Income, and Distributions Income and expenses are recorded on the accrual basis. Premiums and discounts on debt securities are amortized for financial reporting purposes. Dividends received from mutual fund investments are reflected as dividend income; capital gain distributions are reflected as realized gain/loss. Dividend income and capital gain distributions are recorded on the ex-dividend date. Investment transactions are accounted for on the trade date. Realized gains and losses are reported on the identified cost basis. Paydown gains and losses are recorded as an adjustment to interest income. Distributions to shareholders are recorded on the ex-dividend date. Income distributions are declared on a daily basis and paid monthly. Capital gain distributions, if any, are declared and paid by the fund, typically on an annual basis.
NOTE 2 - INVESTMENT TRANSACTIONS
Consistent with its investment objective, the fund engages in the following practices to manage exposure to certain risks or enhance performance. The investment objective, policies, program, and risk factors of the fund are described more fully in the fund’s prospectus and Statement of Additional Information.
Noninvestment-Grade Debt Securities At May 31, 2006, approximately 90% of the fund’s net assets were invested in noninvestment-grade debt securities, commonly referred to as “high-yield” or “junk” bonds. A real or perceived economic downturn or higher interest rates could adversely affect the liquidity or value, or both, of such securities because such events could lessen the ability of issuers to make principal and interest payments.
Restricted Securities The fund may invest in securities that are subject to legal or contractual restrictions on resale. Although certain of these securities may be readily sold, for example, under Rule 144A, others may be illiquid, their sale may involve substantial delays and additional costs, and prompt sale at an acceptable price may be difficult.
Other Purchases and sales of portfolio securities, other than short-term securities, aggregated $295,248,000 and $451,632,000, respectively, for the year ended May 31, 2006.
NOTE 3 - FEDERAL INCOME TAXES
No provision for federal income taxes is required since the fund intends to continue to qualify as a regulated investment company under Subchapter M of the Internal Revenue Code and distribute to shareholders all of its taxable income and gains. Federal income tax regulations differ from generally accepted accounting principles; therefore, distributions determined in accordance with tax regulations may differ significantly in amount or character from net investment income and realized gains for financial reporting purposes. Financial reporting records are adjusted for permanent book/tax differences to reflect tax character. Financial records are not adjusted for temporary differences.
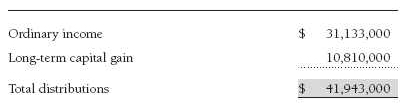
Distributions during the year ended May 31, 2006, were characterized as follows for tax purposes:
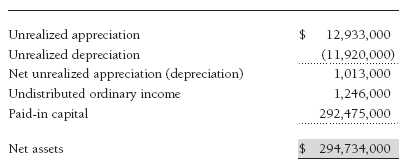
At May 31, 2006, the tax-basis components of net assets were as follows:
Pursuant to federal income tax regulations applicable to investment companies, the fund has elected to treat net capital losses realized between November 1 and May 31 of each year as occurring on the first day of the following tax year. Consequently, $929,000 of realized losses reflected in the accompanying financial statements will not be recognized for tax purposes until 2007. For federal income tax purposes, market discount is recognized as income at the time of sale in the amount of the lesser of gain or scheduled amortization. Accordingly, at May 31, 2006, amortization of $588,000 that has been recognized as income for financial reporting purposes is treated as unrealized appreciation for tax purposes.
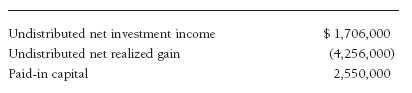
For the year ended May 31, 2006, the fund recorded the following permanent reclassifications to reflect tax character. Reclassifications to paid-in capital relate primarily to redemptions in kind and a tax practice that treats a portion of the proceeds from each redemption of capital shares as a distribution of taxable net investment income and/or realized capital gain. Reclassifications between income and gain relate primarily to differences between book/tax amortization policies. Results of operations and net assets were not affected by these reclassifications.
At May 31, 2006, the cost of investments for federal income tax purposes was $289,939,000.
NOTE 4 - RELATED PARTY TRANSACTIONS
The fund is managed by T. Rowe Price Associates, Inc. (the manager or Price Associates), a wholly owned subsidiary of T. Rowe Price Group, Inc. The investment management and administrative agreement between the fund and the manager provides for an all-inclusive annual fee equal to 0.50% of the fund’s average daily net assets. The fee is computed daily and paid monthly. The agreement provides that investment management, shareholder servicing, transfer agency, accounting, and custody services are provided to the fund, and interest, taxes, brokerage commissions, directors’ fees and expenses, and extraordinary expenses are paid directly by the fund.
The fund may invest in the T. Rowe Price Reserve Investment Fund and the T. Rowe Price Government Reserve Investment Fund (collectively, the T. Rowe Price Reserve Funds), open-end management investment companies managed by Price Associates and affiliates of the fund. The T. Rowe Price Reserve Funds are offered as cash management options to mutual funds, trusts, and other accounts managed by Price Associates and/or its affiliates, and are not available for direct purchase by members of the public. The T. Rowe Price Reserve Funds pay no investment management fees. During the year ended May 31, 2006, dividend income from the T. Rowe Price Reserve Funds totaled $559,000, and the value of shares of the T. Rowe Price Reserve Funds held at May 31, 2006, and May 31, 2005, was $5,011,000 and $11,676,000, respectively.
Mutual funds and other accounts managed by T. Rowe Price and its affiliates may invest in the fund; however, no T. Rowe Price fund may invest for the purpose of exercising management or control over the fund. At May 31, 2006, 30% of the fund’s outstanding shares were held by T. Rowe Price funds.
Report of Independent Registered Public Accounting Firm
To the Board of Directors of T. Rowe Price Institutional Income Funds, Inc. and Shareholders of T. Rowe Price Institutional High Yield Fund
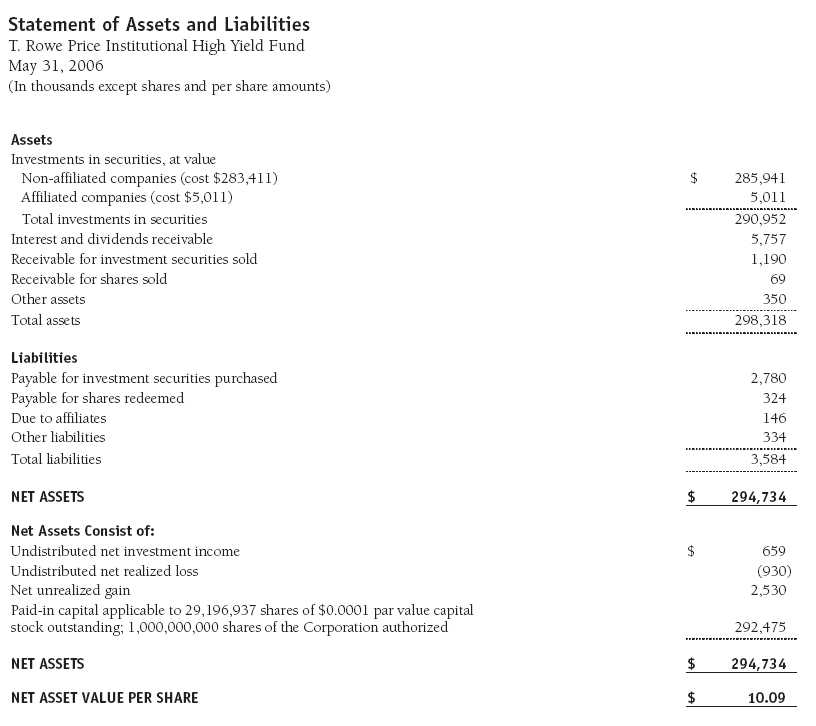
In our opinion, the accompanying statement of assets and liabilities, including the portfolio of investments, and the related statements of operations and of changes in net assets and the financial highlights present fairly, in all material respects, the financial position of T. Rowe Price Institutional High Yield Fund (one of the portfolios comprising T. Rowe Price Institutional Income Funds, Inc. hereafter referred to as the “Fund”) at May 31, 2006, the results of its operations for the year then ended, the changes in its net assets for each of the two years in the period then ended and the financial highlights for each of the periods presented, in conformity with accounting principles generally accepted in the United States of America. These financial statements and financial highlights (hereafter referred to as “financial statements”) are the responsibility of the Fund’s management; our responsibility is to express an opinion on these financial statements based on our audits. We conducted our audits of these financial statements in accordance with the standards of the Public Company Accounting Oversight Board (United States). Those standards require that we plan and perform the audit to obtain reasonable assurance about whether the financial statements are free of material misstatement. An audit includes examining, on a test basis, evidence supporting the amounts and disclosures in the financial statements, assessing the accounting principles used and significant estimates made by management, and evaluating the overall financial statement presentation. We believe that our audits, which included confirmation of securities at May 31, 2006 by correspondence with the custodian and brokers and by agreement to the underlying ownership records for T. Rowe Price Reserve Investment Fund, provide a reasonable basis for our opinion.
PricewaterhouseCoopers LLP
Baltimore, Maryland
July 12, 2006
| Tax Information (Unaudited) for the Tax Year Ended 5/31/06 |
We are providing this information as required by the Internal Revenue Code. The amounts shown may differ from those elsewhere in this report because of differences between tax and financial reporting requirements.
The fund’s distributions to shareholders included:
• $685,000 from short-term capital gains,
•$11,688,000 from long-term capital gains, subject to the 15% rate gains category
For taxable non-corporate shareholders, $298,000 of the fund’s income represents qualified dividend income subject to the 15% rate category.
For corporate shareholders, $270,000 of the fund’s income qualifies for the dividends-received deduction.
| Information on Proxy Voting Policies, Procedures, and Records |
A description of the policies and procedures used by T. Rowe Price funds and portfolios to determine how to vote proxies relating to portfolio securities is available in each fund’s Statement of Additional Information, which you may request by calling 1-800-225-5132 or by accessing the SEC’s Web site, www.sec.gov. The description of our proxy voting policies and procedures is also available on our Web site, www.troweprice.com. To access it, click on the words “Company Info” at the top of our homepage for individual investors. Then, in the window that appears, click on the “Proxy Voting Policy” navigation button in the top left corner.
Each fund’s most recent annual proxy voting record is available on our Web site and through the SEC’s Web site. To access it through our Web site, follow the directions above, then click on the words “Proxy Voting Record” at the bottom of the Proxy Voting Policy page.
| How to Obtain Quarterly Portfolio Holdings |
The fund files a complete schedule of portfolio holdings with the Securities and Exchange Commission for the first and third quarters of each fiscal year on Form N-Q. The fund’s Form N-Q is available electronically on the SEC’s Web site (www.sec.gov); hard copies may be reviewed and copied at the SEC’s Public Reference Room, 450 Fifth St. N.W., Washington, DC 20549. For more information on the Public Reference Room, call 1-800-SEC-0330.
| Approval of Investment Management Agreement |
On March 8, 2006, the fund’s Board of Directors unanimously approved the investment advisory contract (“Contract”) between the fund and its investment manager, T. Rowe Price Associates, Inc. (“Manager”). The Board considered a variety of factors in connection with its review of the Contract, also taking into account information provided by the Manager during the course of the year, as discussed below:
Services Provided by the Manager
The Board considered the nature, quality, and extent of the services provided to the fund by the Manager. These services included, but were not limited to, management of the fund’s portfolio and a variety of activities related to portfolio management. The Board also reviewed the background and experience of the Manager’s senior management team and investment personnel involved in the management of the fund. The Board concluded that it was satisfied with the nature, quality, and extent of the services provided by the Manager.
Investment Performance of the Fund
The Board reviewed the fund’s average annual total return over the one- and three-year periods as well as the fund’s year-by-year returns and compared these returns to a wide variety of previously agreed upon comparable performance measures and market data, including those supplied by Lipper and Morningstar, which are independent providers of mutual fund data. On the basis of this evaluation and the Board’s ongoing review of investment results, the Board concluded that the fund’s performance was satisfactory.
Costs, Benefits, Profits, and Economies of Scale
The Board reviewed detailed information regarding the revenues received by the Manager under the Contract and other benefits that the Manager (and its affiliates) may have realized from its relationship with the fund, including research received under “soft dollar” agreements. The Board noted that the use of soft dollars as a means of paying for third-party, non-broker research had been eliminated. The Board also received information on the estimated costs incurred and profits realized by the Manager and its affiliates from advising T. Rowe Price mutual funds, as well as estimates of the gross profits realized from managing the fund in particular. The Board concluded that the Manager’s profits were reasonable in light of the services provided to the fund. The Board also considered whether the fund or other funds benefit under the fee levels set forth in the Contract from any economies of scale realized by the Manager. The Board noted that, under the Contract, the fund pays the Manager a single fee based on the fund’s net assets and the Manager, in turn, pays all expenses of the fund, with certain exceptions. The Board concluded that, based on the profitability data it reviewed and consistent with this single fee structure, the Contract provided for a reasonable sharing of any benefits from economies of scale with the fund.
Fees
The Board reviewed the fund’s single fee structure and compared the rate to fees and expenses of other comparable funds based on information and data supplied by Lipper. The information provided to the Board showed that the fund’s single fee rate was generally at or below the median management fee rate and expense ratio for comparable funds. The Board also reviewed the fee schedules for comparable privately managed accounts of the Manager and its affiliates. Management informed the Board that the Manager’s responsibilities for privately managed accounts are more limited than its responsibilities for the fund and other T. Rowe Price mutual funds that it or its affiliates advise. On the basis of the information provided, the Board concluded that the fees paid by the fund under the Contract were reasonable.
Approval of the Contract
As noted, the Board approved the continuation of the Contract. No single factor was considered in isolation or to be determinative to the decision. Rather, the Board concluded, in light of a weighting and balancing of all factors considered, that it was in the best interests of the fund to approve the continuation of the Contract, including the fees to be charged for services thereunder.
| About the Fund’s Directors and Officers |
Your fund is governed by a Board of Directors that meets regularly to review performance, investment programs, compliance matters, advisory fees and expenses, service providers, and other business matters, and is responsible for protecting the interests of shareholders. At least 75% of the fund’s directors are independent of T. Rowe Price Associates, Inc. (T. Rowe Price); “inside” directors are officers of T. Rowe Price. The Board of Directors elects the fund’s officers, who are listed in the final table. The business address of each director and officer is 100 East Pratt Street, Baltimore, MD 21202. The Statement of Additional Information includes additional information about the fund directors and is available without charge by calling a T. Rowe Price representative at 1-800-225-5132.
| Independent Directors | |
| |
| Name (Year of Birth) | |
| Year Elected* | Principal Occupation(s) During Past 5 Years and Directorships of Other Public Companies |
| |
| Jeremiah E. Casey (1940) | Director, Allfirst Financial, Inc. (previously First Maryland Bankcorp) (1983 to 2002); Director, National Life Insurance |
| 2006 | (2001 to 2005); Director, The Rouse Company, real estate developers (1990 to 2004) |
| |
| Anthony W. Deering (1945) | Chairman, Exeter Capital, LLC, a private investment firm (2004 to present); Director, Vornado Real Estate Investment |
| 2002 | Trust (3/04 to present); Director, Mercantile Bankshares (4/03 to present); Member, Advisory Board, Deutsche Bank |
| | North America (2004 to present); Director, Chairman of the Board, and Chief Executive Officer, The Rouse Company, |
| | real estate developers (1997 to 2004) |
| |
| Donald W. Dick, Jr. (1943) | Principal, EuroCapital Advisors, LLC, an acquisition and management advisory firm; Chairman, President, and Chief |
| 2002 | Executive Officer, The Haven Group, a custom manufacturer of modular homes (1/04 to present) |
| |
| David K. Fagin (1938) | Chairman and President, Nye Corporation (6/88 to present); Director, Canyon Resources Corp. and Golden Star |
| 2002 | Resources Ltd. (5/92 to present), and Pacific Rim Mining Corp. (2/02 to present) |
| |
| Karen N. Horn (1943) | Managing Director and President, Global Private Client Services, Marsh Inc. (1999 to 2003); Managing Director and |
| 2003 | Head of International Private Banking, Bankers Trust (1996 to 1999); Director, Georgia Pacific, Eli Lilly and Company, |
| | and Simon Property Group |
| |
| Theo C. Rodgers (1941) | President, A&R Development Corporation |
| 2005 | |
| |
| John G. Schreiber (1946) | Owner/President, Centaur Capital Partners, Inc., a real estate investment company; Partner, Blackstone Real Estate |
| 2002 | Advisors, L.P.; Director, AMLI Residential Properties Trust |
* Each independent director oversees 113 T. Rowe Price portfolios and serves until retirement, resignation, or election of a successor.
| Inside Directors | |
| |
| Name (Year of Birth) | |
| Year Elected* [Number of | |
| T. Rowe Price Portfolios | |
| Overseen] | Principal Occupation(s) During Past 5 Years and Other Directorships of Public Companies |
| |
| Edward C. Bernard (1956) | Director and Vice President, T. Rowe Price and T. Rowe Price Group, Inc.; Chairman of the Board, Director, and |
| 2006 [113] | President, T. Rowe Price Investment Services, Inc.; Chairman of the Board and Director, T. Rowe Price Retirement |
| | Plan Services, Inc., T. Rowe Price Services, Inc., and T. Rowe Price Savings Bank; Director, T. Rowe Price Global Asset |
| | Management Limited and T. Rowe Price Global Investment Services Limited; Chief Executive Officer, Chairman of |
| | the Board, Director, and President, T. Rowe Price Trust Company; Chairman of the Board, all funds |
| |
| Mary J. Miller, CFA (1955) | Director and Vice President, T. Rowe Price; Vice President, T. Rowe Price Group, Inc.; President, Institutional |
| 2004 [37] | Income Funds |
* Each inside director serves until retirement, resignation, or election of a successor.
| Officers | |
| |
| Name (Date of Birth) | |
| Title and Fund(s) Served | Principal Occupation(s) |
| |
| Connice A. Bavely, CFA (1951) | Vice President, T. Rowe Price and T. Rowe Price Group, Inc. |
| Vice President, Institutional Income Funds | |
| |
| David C. Beers, CFA (1970) | Assistant Vice President, T. Rowe Price; formerly, High Yield Analyst, |
| Assistant Vice President, Institutional Income Funds | Chartwell Investment Partners and Business Analyst/Software Developer, |
| | Morgan Stanley Investment Management (to 2004) |
| |
| Brian J. Brennan, CFA (1964) | Vice President, T. Rowe Price, T. Rowe Price Group, Inc., and T. Rowe Price |
| Executive Vice President, Institutional Income Funds | Trust Company |
| |
| Andrew M. Brooks (1956) | Vice President, T. Rowe Price and T. Rowe Price Group, Inc. |
| Vice President, Institutional Income Funds | |
| |
| Joseph A. Carrier, CPA (1960) | Vice President, T. Rowe Price, T. Rowe Price Group, Inc., T. Rowe Price |
| Treasurer, Institutional Income Funds | Investment Services, Inc., and T. Rowe Price Trust Company |
| |
| Michael J. Conelius, CFA (1964) | Vice President, T. Rowe Price, T. Rowe Price Group, Inc., and T. Rowe Price |
| Vice President, Institutional Income Funds | International, Inc. |
| |
| Roger L. Fiery III, CPA (1959) | Vice President, T. Rowe Price, T. Rowe Price Group, Inc., T. Rowe Price |
| Vice President, Institutional Income Funds | International, Inc., and T. Rowe Price Trust Company |
| |
| Justin T. Gerbereux, CFA (1975) | Assistant Vice President, T. Rowe Price; formerly, Equity Research Intern, |
| Assistant Vice President, Institutional Income Funds | Mellon Growth Advisors, LLC, and Senior Investment Associate and |
| | Investment Performance Analyst, Cambridge Associates, LLC. |
| |
| John R. Gilner (1961) | Chief Compliance Officer and Vice President, T. Rowe Price; Vice President, |
| Chief Compliance Officer, Institutional Income Funds | T. Rowe Price Group, Inc., and T. Rowe Price Investment Services, Inc. |
| | |
| Gregory S. Golczewski (1966) | Vice President, T. Rowe Price and T. Rowe Price Trust Company |
| Vice President, Institutional Income Funds | |
| |
| Henry H. Hopkins (1942) | Director and Vice President, T. Rowe Price Investment Services, Inc., |
| Vice President, Institutional Income Funds | T. Rowe Price Services, Inc., and T. Rowe Price Trust Company; Vice |
| | President, T. Rowe Price, T. Rowe Price Group, Inc., T. Rowe Price |
| | International, Inc., and T. Rowe Price Retirement Plan Services, Inc. |
| |
| Paul A. Karpers, CFA (1967) | Vice President, T. Rowe Price and T. Rowe Price Group, Inc. |
| Vice President, Institutional Income Funds | |
| |
| Ian D. Kelson (1956) | Vice President, T. Rowe Price, T. Rowe Price Group, Inc., and T. Rowe Price |
| Vice President, Institutional Income Funds | International, Inc. |
| |
| Patricia B. Lippert (1953) | Assistant Vice President, T. Rowe Price and T. Rowe Price Investment |
| Secretary, Institutional Income Funds | Services, Inc. |
| |
| Kevin P. Loome, CFA (1967) | Vice President, T. Rowe Price, T. Rowe Price Group, Inc., and T. Rowe Price |
| Vice President, Institutional Income Funds | International, Inc. |
| |
| Paul M. Massaro, CFA (1975) | Assistant Vice President, T. Rowe Price; formerly, Equity Research |
| Assistant Vice President, Institutional Income Funds | Employee, Banc of America Securities and J.P. Morgan Chase |
| |
| Michael J. McGonigle (1966) | Vice President, T. Rowe Price and T. Rowe Price Group, Inc. |
| Vice President, Institutional Income Funds | |
| |
| Brian A. Rubin, CPA (1974) | Employee, T. Rowe Price |
| Assistant Vice President, Institutional Income Funds | |
| |
| Daniel O. Shackelford, CFA (1958) | Vice President, T. Rowe Price, T. Rowe Price Group, Inc., and T. Rowe Price |
| Vice President, Institutional Income Funds | Trust Company |
| |
| Walter P. Stuart III, CFA (1960) | Vice President, T. Rowe Price and T. Rowe Price Group, Inc. |
| Vice President, Institutional Income Funds | |
| |
| Thomas E. Tewksbury (1961) | Vice President, T. Rowe Price and T. Rowe Price Group, Inc. |
| Vice President, Institutional Income Funds | |
| |
| David A. Tiberii, CFA (1965) | Vice President, T. Rowe Price and T. Rowe Price Group, Inc. |
| Vice President, Institutional Income Funds | |
| |
| Mark J. Vaselkiv (1958) | Vice President, T. Rowe Price and T. Rowe Price Group, Inc. |
| Executive Vice President, Institutional Income Funds | |
| |
| Julie L. Waples (1970) | Vice President, T. Rowe Price |
| Vice President, Institutional Income Funds | |
| |
| Thea N. Williams (1961) | Vice President, T. Rowe Price and T. Rowe Price Group, Inc. |
| Vice President, Institutional Income Funds | |
Unless otherwise noted, officers have been employees of T. Rowe Price or T. Rowe Price International for at least five years.
Item 2. Code of Ethics.The registrant has adopted a code of ethics, as defined in Item 2 of Form N-CSR, applicable to its principal executive officer, principal financial officer, principal accounting officer or controller, or persons performing similar functions. A copy of this code of ethics is filed as an exhibit to this Form N-CSR. No substantive amendments were approved or waivers were granted to this code of ethics during the period covered by this report.
Item 3. Audit Committee Financial Expert.
The registrant’s Board of Directors/Trustees has determined that Mr. Donald W. Dick Jr. qualifies as an audit committee financial expert, as defined in Item 3 of Form N-CSR. Mr. Dick is considered independent for purposes of Item 3 of Form N-CSR.
Item 4. Principal Accountant Fees and Services.
(a) – (d) Aggregate fees billed to the registrant for the last two fiscal years for professional services rendered by the registrant’s principal accountant were as follows:
| | 2006 | 2005 |
| Audit Fees | $8,008 | $4,287 |
| Audit-Related Fees | 710 | 687 |
| Tax Fees | 1,327 | 754 |
| All Other Fees | 150 | 306 |
Audit fees include amounts related to the audit of the registrant’s annual financial statements and services normally provided by the accountant in connection with statutory and regulatory filings. Audit-related fees include amounts reasonably related to the performance of the audit of the registrant’s financial statements and specifically include the issuance of a report on internal controls. Tax fees include amounts related to services for tax compliance, tax planning, and tax advice. The nature of these services specifically includes the review of distribution calculations and the preparation of Federal, state, and excise tax returns. Reclassification from tax fees to audit fees of fiscal 2005 amounts related to the auditing of tax disclosures within the registrant’s annual financial statements has been made in order to conform to fiscal 2006 presentation. All other fees include the registrant’s pro-rata share of amounts for agreed-upon procedures in conjunction with service contract approvals by the registrant’s Board of Directors/Trustees.
(e)(1) The registrant’s audit committee has adopted a policy whereby audit and non-audit services performed by the registrant’s principal accountant for the registrant, its investment adviser, and any entity controlling, controlled by, or under common control with the investment adviser that provides ongoing services to the registrant require pre-approval in advance at regularly scheduled audit committee meetings. If such a service is required between regularly scheduled audit committee meetings, pre-approval may be authorized by one audit committee member with ratification at the next scheduled audit committee meeting. Waiver of pre-approval for audit or non-audit services requiring fees of a de minimis amount is not permitted.
(2) No services included in (b) – (d) above were approved pursuant to paragraph (c)(7)(i)(C) of Rule 2-01 of Regulation S-X.
(f) Less than 50 percent of the hours expended on the principal accountant’s engagement to audit the registrant’s financial statements for the most recent fiscal year were attributed to work performed by persons other than the principal accountant’s full-time, permanent employees.
(g) The aggregate fees billed for the most recent fiscal year and the preceding fiscal year by the registrant’s principal accountant for non-audit services rendered to the registrant, its investment adviser, and any entity controlling, controlled by, or under common control with the investment adviser that provides ongoing services to the registrant were $883,000 and $785,000, respectively, and were less than the aggregate fees billed for those same periods by the registrant’s principal accountant for audit services rendered to the T. Rowe Price Funds. Preceding fiscal year amount reflects the reclassification of tax fees described in (a) – (d) above.
(h) All non-audit services rendered in (g) above were pre-approved by the registrant’s audit committee. Accordingly, these services were considered by the registrant’s audit committee in maintaining the principal accountant’s independence.
Item 5. Audit Committee of Listed Registrants.
Not applicable.
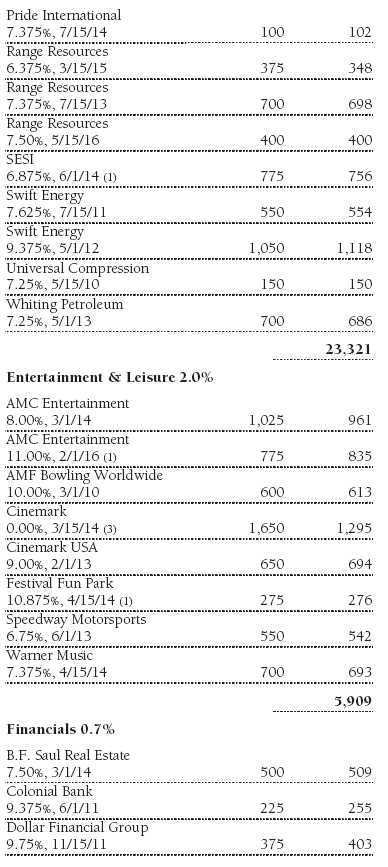
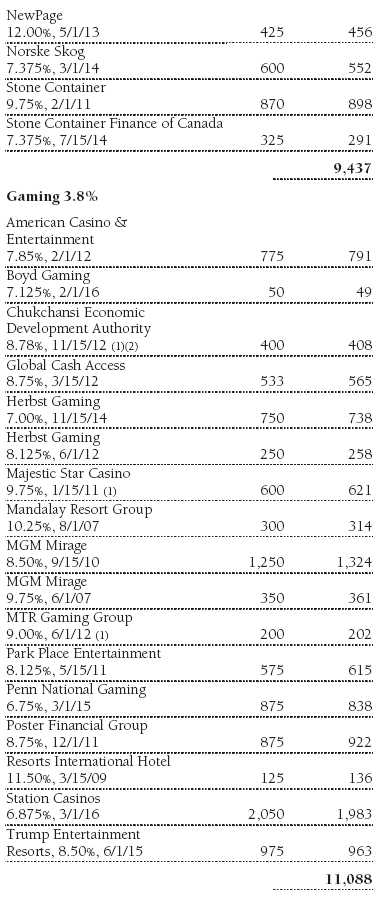
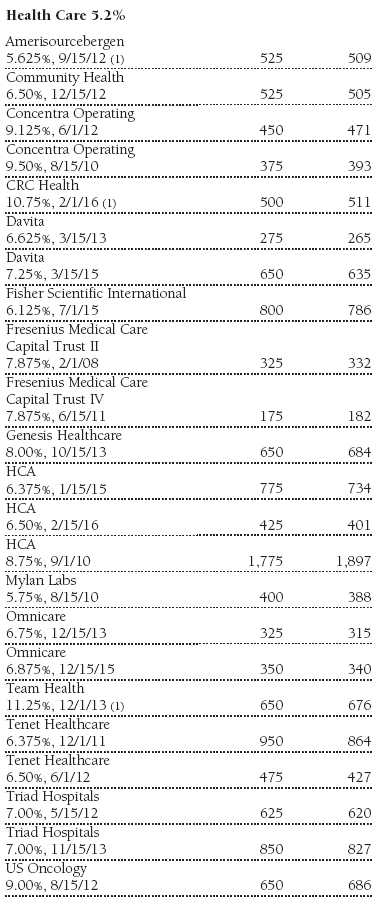
Item 6. Schedule of Investments.
Not applicable. The complete schedule of investments is included in Item 1 of this Form N-CSR.
Item 7. Disclosure of Proxy Voting Policies and Procedures for Closed-End Management Investment Companies.
Not applicable.
Item 8. Portfolio Managers of Closed-End Management Investment Companies.
Not applicable.
Item 9. Purchases of Equity Securities by Closed-End Management Investment Company and Affiliated Purchasers.
Not applicable.
Item 10. Submission of Matters to a Vote of Security Holders.
Not applicable.
Item 11. Controls and Procedures.
(a) The registrant’s principal executive officer and principal financial officer have evaluated the registrant’s disclosure controls and procedures within 90 days of this filing and have concluded that the registrant’s disclosure controls and procedures were effective, as of that date, in ensuring that information required to be disclosed by the registrant in this Form N-CSR was recorded, processed, summarized, and reported timely.
(b) The registrant’s principal executive officer and principal financial officer are aware of no change in the registrant’s internal control over financial reporting that occurred during the registrant’s second fiscal quarter covered by this report that has materially affected, or is reasonably likely to materially affect, the registrant’s internal control over financial reporting.
Item 12. Exhibits.
(a)(1) The registrant’s code of ethics pursuant to Item 2 of Form N-CSR is attached.
(2) Separate certifications by the registrant's principal executive officer and principal financial officer, pursuant to Section 302 of the Sarbanes-Oxley Act of 2002 and required by Rule 30a-2(a) under the Investment Company Act of 1940, are attached.
(3) Written solicitation to repurchase securities issued by closed-end companies: not applicable.
(b) A certification by the registrant's principal executive officer and principal financial officer, pursuant to Section 906 of the Sarbanes-Oxley Act of 2002 and required by Rule 30a-2(b) under the Investment Company Act of 1940, is attached.
| |
SIGNATURES |
| |
| | Pursuant to the requirements of the Securities Exchange Act of 1934 and the Investment |
| Company Act of 1940, the registrant has duly caused this report to be signed on its behalf by the |
| undersigned, thereunto duly authorized. |
| |
| T. Rowe Price Institutional Income Funds, Inc. |
| |
| |
| By | /s/ Edward C. Bernard |
| | Edward C. Bernard |
| | Principal Executive Officer |
| |
| Date | July 18, 2006 |
| |
| |
| | Pursuant to the requirements of the Securities Exchange Act of 1934 and the Investment |
| Company Act of 1940, this report has been signed below by the following persons on behalf of |
| the registrant and in the capacities and on the dates indicated. |
| |
| |
| By | /s/ Edward C. Bernard |
| | Edward C. Bernard |
| | Principal Executive Officer |
| |
| Date | July 18, 2006 |
| |
| |
| By | /s/ Joseph A. Carrier |
| | Joseph A. Carrier |
| | Principal Financial Officer |
| |
| Date | July 18, 2006 |