Item 1: Report to Shareholders| Institutional Core Plus Fund | May 31, 2006 |
The views and opinions in this report were current as of May 31, 2006. They are not guarantees of performance or investment results and should not be taken as investment advice. Investment decisions reflect a variety of factors, and the managers reserve the right to change their views about individual stocks, sectors, and the markets at any time. As a result, the views expressed should not be relied upon as a forecast of the fund’s future investment intent. The report is certified under the Sarbanes-Oxley Act of 2002, which requires mutual funds and other public companies to affirm that, to the best of their knowledge, the information in their financial reports is fairly and accurately stated in all material respects.
Dear Investor
Investment-grade bonds, as measured by the Lehman Brothers U.S. Aggregate Index, were basically flat for the six months ended May 31, 2006. High-yield securities appreciated, but the performance of higher-quality securities was subdued because of rising interest rates amid solid economic growth. Over the past 6- and 12-month periods, bond yields rose across almost all maturities as the Federal Reserve gradually lifted the federal funds target rate to 5.00%. This resulted in price declines for most bond categories, although these were offset by coupon return in many segments of the market. Your fund registered a small loss in this challenging environment.
MARKET ENVIRONMENT
The economy accelerated at the beginning of 2006, expanding at a robust annualized rate of 5.3% in the first quarter versus a sluggish 1.7% in the final quarter of 2005 following last year’s Gulf Coast hurricanes. Manufacturing activity was sturdy, business and consumer spending patterns appeared healthy, and the unemployment rate dipped to 4.6% in May amid strong job growth. The red-hot housing market cooled off without a significant impact, and inflation remained generally contained, with few signs that elevated energy costs have filtered through to non-energy prices.
Central bank officials have indicated their belief that stronger-than-expected economic growth and a renewed increase in energy costs have the potential to push inflation higher. In response, the Federal Reserve—led by Ben Bernanke following Alan Greenspan’s retirement at the end of January—raised the federal funds target rate in the last six months from 4.00% to 5.00%, a level the short-term benchmark has not seen in more than five years. The central bank has now lifted the target rate 16 times for a total of 400 basis points in just under two years.
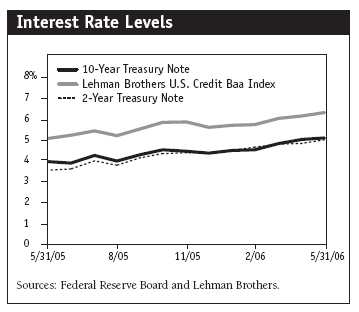
Until recently, there were growing signs that the Fed might stop raising rates—at least temporarily. According to the minutes from the Fed’s late-March monetary policy meeting, many central bank officials believed “that the end of the tightening process was likely to be near, and some expressed concerns about the dangers of tightening too much, given the lags in the effects of policy.” However, shortly after the end of the reporting period, Fed chief Bernanke warned that recent inflation trends were “unwelcome developments,” noting that core inflation has been running at approximately 3.0% and 2.3% over the past six and 12 months, respectively, well above the 1% to 2% target range. This has led many credit market analysts to believe that the Fed is not done with its tightening cycle.

As measured by various Lehman indexes, high-quality corporate and Treasury bonds were lower for both the 6- and 12-month periods ended May 31. Mortgage- and asset-backed securities produced modest gains, while high-yield bonds were the star performers in both periods, outperforming all other fixed-income securities. The Lehman Brothers U.S. Aggregate Index, a broad measure of the overall performance of the domestic investment-grade taxable bond market, returned 0.01% in the last six months and -0.48% for the one-year period.
PERFORMANCE AND INVESTMENT REVIEW
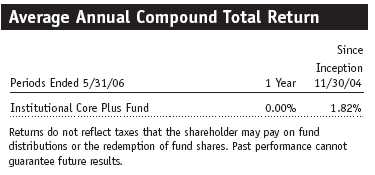
The Institutional Core Plus Fund generated a modest loss for the six-month period ended May 31, 2006, that slightly lagged the Lipper peer group average and the Lehman Brothers U.S. Aggregate Index. For the past 12 months, the fund’s return was flat but ahead of that of the Lipper average and the Lehman index. The fund’s net asset value fell $0.27 during the past six months, which was nearly offset by $0.24 paid out in dividends. For the 12-month period, dividends of $0.46 per share almost precisely offset a $0.48 decline in the fund’s net asset value.
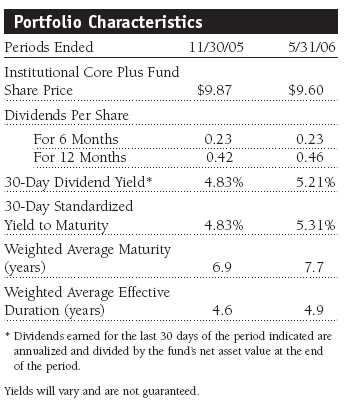
Over the past six months, we extended the portfolio’s weighted average maturity to 7.7 years from 6.9 years, and duration rose to 4.9 years from 4.6 years. As interest rates rose across the yield curve over the past six months, our overweight to longer-maturity securities hampered our relative performance, as they underperformed short maturities in the rising rate environment.

As shown in the Security Diversification chart on page 2, mortgage-backed securities account for nearly half of the fund’s assets; corporate bonds, asset-backed securities, U.S. Treasuries, foreign government bonds, and U.S. government agency securities make up much of the remainder of the portfolio. Our allocation to high-yield bonds (included in the corporate category) and foreign bond holdings helped the fund’s performance relative to the benchmark.
We approached the mortgage sector cautiously, preferring a neutral-to-underweight allocation versus the benchmark until January. Later in the period, we added to our mortgage holdings, favoring high-quality, short-term commercial mortgage-backed securities when they offered an attractive yield advantage. As the reporting period progressed, the sector performed well, benefiting from lower market volatility and the Fed’s transparency in signaling its intentions. We continue to like the sector relative to U.S. Treasuries, as foreign demand for mortgages remains strong and relative valuations appear attractive.

Holding Treasury inflation-protected securities (TIPS) was a good defensive decision in the first half of our fiscal year, particularly following last year’s late-summer spike in energy prices. However, sector selection in the last six months detracted from relative results, and our holdings significantly underperformed Treasuries in March. We sold a significant portion of our TIPS position in April and May. We took advantage of the appreciation in short-maturity issues and also sold some of our longer-dated TIPS due to concerns about inflation expectations and potentially higher interest rates, which could hurt real interest rates and dampen long-term inflation expectations.
In May, our allocation to non-U.S. dollar-denominated government bonds detracted from performance, primarily due to holdings in Mexico and Turkey, as emerging markets experienced heightened volatility due to risk aversion. We also reduced our exposure to hedged New Zealand dollar-denominated bonds after posting good performance relative to the U.S. bond market. As the reporting period came to a close, we added to positions in nondollar-denominated Polish and German government securities.
OUTLOOK
Despite the 400-basis-point increase in the fed funds rate since June 2004, the economy continues to create jobs and absorb capacity. As the overnight lending rate approaches the upper threshold of a neutral zone, and as Ben Bernanke adjusts to his role as chairman of the Federal Reserve, the market is speculating on how much longer the central bank will continue its tightening program.
Unfortunately, the Fed has sidestepped this question by saying its policy will depend on the data. Such data include timely market indicators on housing, employment, and capacity utilization. A slower housing market accompanied by moderating employment gains would help ease concerns about capacity constraints. On the other hand, persistent global growth in the face of central bank tightening, not only in the U.S. but also in Europe and Japan, could renew inflation concerns and drive real rates higher globally. Of course, higher core inflation in either scenario would keep the current tightening cycle on track.
Higher yields in this type of environment would keep us cautious on riskier sectors, such as corporate bonds. Higher financing costs would be added to our current list of concerns, which includes deteriorating credit quality, event risk, and equity buybacks. Notwithstanding our perspective on Fed policy, current valuations and fundamentals in both the investment-grade and high-yield sectors will keep us very selective on what we hold in the portfolio.
TIPS have clearly experienced the blunt edge of the Fed’s policy as real rates have soared toward 2.5% while inflation expectations have remained contained. While a hawkish Fed dampens enthusiasm for inflation protection, real yields approaching their long-term average and their highest level in three years make TIPS more appealing.
Structured securities, such as residential mortgages, commercial mortgages, and asset-backed securities, should remain attractive as higher-quality assets offer additional income. Our main concern is the possibility of higher volatility, which would hurt already stretched valuations. Nevertheless, such risks are palatable given a view that only measured, as opposed to dramatic, policy adjustments remain in the offing.
Nondollar bonds continue to offer mixed opportunities. Bond valuations are less appealing in markets such as Europe and Japan, where yields lower than those in the U.S and central banks are, or are planning on, tightening monetary policy. Nevertheless, opportunities in these markets are available as a means to benefit from a continued decline in the U.S. dollar. The Polish bond market continues to offer solid relative value, mainly on a hedged currency basis.
Markets such as Mexico, Brazil, and Turkey performed well until May, when the Fed raised rates to 5.0% and risk aversion took hold. A dramatic sell-off in both the bond and currency markets resulted as investors unwound attractive carry trades. While these markets continue to offer attractive valuations, we expect higher than normal volatility within them.
Will a Fed squeeze on inflation become a bear hug that takes real yields materially higher—toward 3%? It might, but we expect that economic activity will moderate as policy adjustments already in the pipeline start to take hold. Globalization and open trade also remain solid underpinnings for contained inflation, despite recent legislative initiatives aimed at tightening the free flow of international investment. The Fed appears certain to win its battle to contain inflation, and a tighter policy near term may continue to keep bondholders on edge. Nevertheless, higher yields resulting from a final squeeze or two from the Fed may present the most compelling buying opportunity in years for fixed-income investors.
As always, we appreciate your confidence and thank you for investing with T. Rowe Price.
Respectfully submitted,

Brian J. Brennan
Chairman of the fund’s Investment Advisory Committee
June 16, 2006
The committee chairman has day-to-day responsibility for managing the portfolio and works with committee members in developing and executing the fund’s investment program.
Bonds are subject to interest rate risk, the decline in bond prices that usually accompanies a rise in interest rates, and credit risk, the chance that any fund holding could have its credit rating downgraded or that a bond issuer will default (fail to make timely payments of interest or principal), potentially reducing the fund’s income level and share price. Mortgage-backed securities are subject to prepayment risk, particularly if falling rates lead to heavy refinancing activity, and extension risk, which is an increase in interest rates that causes a fund’s average maturity to lengthen unexpectedly due to a drop in mortgage prepayments. This could increase the fund’s sensitivity to rising interest rates and its potential for price declines.
Average maturity: The average of the stated maturity dates of a bond or money market portfolio’s securities. The average maturity for a money market fund is measured in days, whereas a bond fund’s average maturity is measured in years. In general, the longer the average maturity, the greater the fund’s sensitivity to interest rate changes, which means greater price fluctuation.
Basis point: One one-hundredth of a percentage point, or 0.01%.
Credit Suisse High Yield Index: An index that tracks the performance of domestic noninvestment-grade corporate bonds.
Duration: A measure of a bond or bond fund’s sensitivity to changes in interest rates. For example, a fund with a four-year duration would fall about 4% in response to a one-percentage-point rise in interest rates, and vice versa.
Federal funds rate: The interest rate charged on overnight loans of reserves by one financial institution to another in the United States. The Federal Reserve sets a target federal funds rate to affect the direction of interest rates.
Lehman Brothers Mortgage-Backed Securities Index: An index that tracks the performance of the mortgage-backed pass-through securities of Ginnie Mae (GNMA), Fannie Mae (FNMA), and Freddie Mac (FHLMC).
Lehman Brothers U.S. Aggregate Index: An unmanaged index that tracks domestic investment-grade bonds, including corporate, government, and mortgage-backed securities.
Lehman Brothers U.S. Credit Index (Formerly the U.S. Corporate Investment Grade Index): An unmanaged index that tracks the performance of investment-grade corporate bonds.
Lehman Brothers U.S. Treasury Index: An unmanaged index of publicly traded obligations of the U.S. Treasury.
Lipper averages: The averages of all mutual funds in a particular category as tracked by Lipper Inc.
Real interest rate: A fixed-income security’s interest rate after being adjusted for inflation. It is calculated by subtracting the inflation rate from a nominal interest rate. For example, if a 10-year Treasury note is yielding 5% and inflation is 2%, the real interest rate is 3%.
Weighted average maturity: The weighted average of the stated maturity dates of the portfolio’s securities. In general, the longer the average maturity, the greater the fund’s sensitivity to interest rate changes. A shorter average maturity usually means less interest rate sensitivity and therefore a less volatile portfolio.
Yield curve: A graphic depiction of the relationship between yields and maturity dates for a set of similar securities, such as Treasuries or municipal securities. Yield curves typically slope upward, indicating that longer maturities offer higher yields. When the yield curve is flat, there is little or no difference between the yields offered by shorter- and longer-term securities.
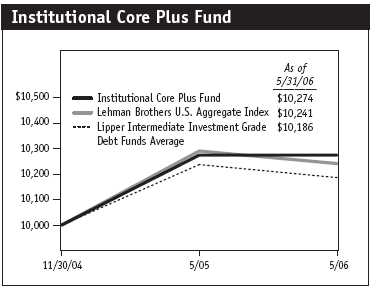
This chart shows the value of a hypothetical $10,000 investment in the fund over the past 10 fiscal year periods or since inception (for funds lacking 10-year records). The result is compared with benchmarks, which may include a broad-based market index and a peer group average or index. Market indexes do not include expenses, which are deducted from fund returns as well as mutual fund averages and indexes.
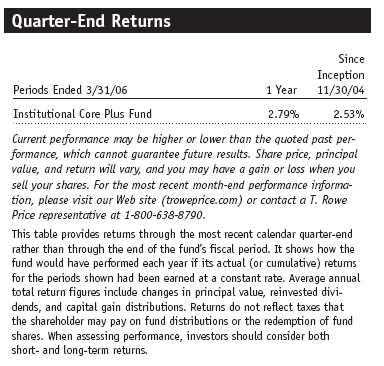
This table shows how the portfolio would have performed each year if its actual (or cumulative) returns for the periods shown had been earned at a constant rate.
Fund Expense Example
As a mutual fund shareholder, you may incur two types of costs: (1) transaction costs such as redemption fees or sales loads and (2) ongoing costs, including management fees, distribution and service (12b-1) fees, and other fund expenses. The following example is intended to help you understand your ongoing costs (in dollars) of investing in the fund and to compare these costs with the ongoing costs of investing in other mutual funds. The example is based on an investment of $1,000 invested at the beginning of the most recent six-month period and held for the entire period.
Actual Expenses
The first line of the following table (“Actual”) provides information about actual account values and actual expenses. You may use the information in this line, together with your account balance, to estimate the expenses that you paid over the period. Simply divide your account value by $1,000 (for example, an $8,600 account value divided by $1,000 = 8.6), then multiply the result by the number in the first line under the heading “Expenses Paid During Period” to estimate the expenses you paid on your account during this period.
Hypothetical Example for Comparison Purposes
The information on the second line of the table (“Hypothetical”) is based on hypothetical account values and expenses derived from the fund’s actual expense ratio and an assumed 5% per year rate of return before expenses (not the fund’s actual return). You may compare the ongoing costs of investing in the fund with other funds by contrasting this 5% hypothetical example and the 5% hypothetical examples that appear in the shareholder reports of the other funds. The hypothetical account values and expenses may not be used to estimate the actual ending account balance or expenses you paid for the period.
You should also be aware that the expenses shown in the table highlight only your ongoing costs and do not reflect any transaction costs, such as redemption fees or sales loads. Therefore, the second line of the table is useful in comparing ongoing costs only and will not help you determine the relative total costs of owning different funds. To the extent a fund charges transaction costs, however, the total cost of owning that fund is higher.


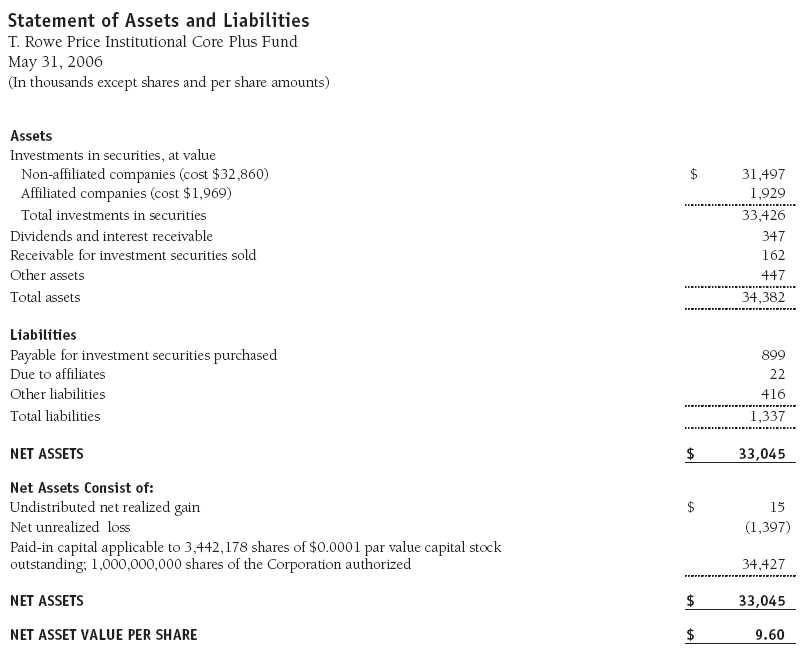
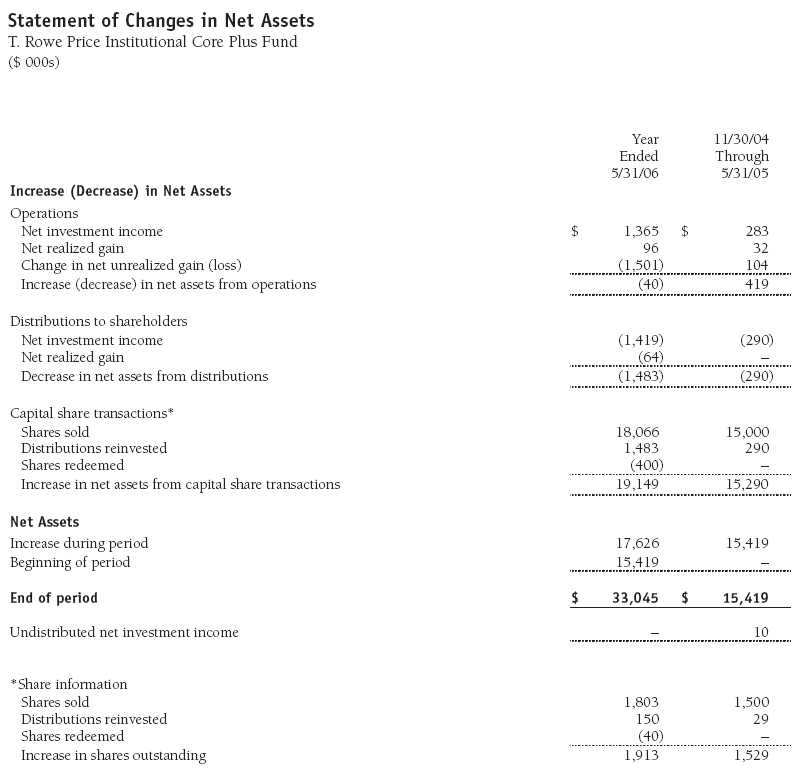
The accompanying notes are an integral part of these financial statements.


The accompanying notes are an integral part of these financial statements.
The accompanying notes are an integral part of these financial statements.

The accompanying notes are an integral part of these financial statements.
The accompanying notes are an integral part of these financial statements.
Notes to Financial Statements
T. Rowe Price Institutional Core Plus Fund May 31, 2006
NOTE 1 - SIGNIFICANT ACCOUNTING POLICIES
T. Rowe Price Institutional Income Funds, Inc. (the corporation), is registered under the Investment Company Act of 1940 (the 1940 Act). The Institutional Core Plus Fund (the fund), a diversified, open-end management investment company, is one portfolio established by the corporation. The fund commenced operations on November 30, 2004. The fund seeks to maximize total return through income and capital appreciation.
The accompanying financial statements were prepared in accordance with accounting principles generally accepted in the United States of America, which require the use of estimates made by fund management. Fund management believes that estimates and security valuations are appropriate; however, actual results may differ from those estimates, and the security valuations reflected in the financial statements may differ from the value the fund ultimately realizes upon sale of the securities.
Valuation The fund values its investments and computes its net asset value per share at the close of the New York Stock Exchange (NYSE), normally 4 p.m. ET, each day that the NYSE is open for business. Debt securities are generally traded in the over-the-counter market. Securities with original maturities of one year or more are valued at prices furnished by dealers who make markets in such securities or by an independent pricing service, which considers yield or price of bonds of comparable quality, coupon, maturity, and type, as well as prices quoted by dealers who make markets in such securities. Securities with original maturities of less than one year are stated at fair value, which is determined by using a matrix system that establishes a value for each security based on bid-side money market yields.
Investments in mutual funds are valued at the mutual fund’s closing net asset value per share on the day of valuation. Purchased and written options are valued at the mean of the closing bid and asked prices. Options on futures contracts are valued at the last sale price. Financial futures contracts are valued at closing settlement prices. Forward currency exchange contracts are valued using the prevailing forward exchange rate.
Other investments, including restricted securities, and those for which the above valuation procedures are inappropriate or are deemed not to reflect fair value are stated at fair value as determined in good faith by the T. Rowe Price Valuation Committee, established by the fund’s Board of Directors.
Most foreign markets close before the close of trading on the NYSE. If the fund determines that developments between the close of a foreign market and the close of the NYSE will, in its judgment, materially affect the value of some or all of its portfolio securities, which in turn will affect the fund’s share price, the fund will adjust the previous closing prices to reflect the fair value of the securities as of the close of the NYSE, as determined in good faith by the T. Rowe Price Valuation Committee, established by the fund’s Board of Directors. A fund may also fair value securities in other situations, such as when a particular foreign market is closed but the fund is open. In deciding whether to make fair value adjustments, the fund reviews a variety of factors, including developments in foreign markets, the performance of U.S. securities markets, and the performance of instruments trading in U.S. markets that represent foreign securities and baskets of foreign securities. The fund uses outside pricing services to provide it with closing market prices and information used for adjusting those prices. The fund cannot predict when and how often it will use closing prices and when it will adjust those prices to reflect fair value. As a means of evaluating its fair value process, the fund routinely compares closing market prices, the next day’s opening prices in the same markets, and adjusted prices.
Currency Translation Assets, including investments, and liabilities denominated in foreign currencies are translated into U.S. dollar values each day at the prevailing exchange rate, using the mean of the bid and asked prices of such currencies against U.S. dollars as quoted by a major bank. Purchases and sales of securities, income, and expenses are translated into U.S. dollars at the prevailing exchange rate on the date of the transaction. The effect of changes in foreign currency exchange rates on realized and unrealized security gains and losses is reflected as a component of security gains and losses.
Investment Transactions, Investment Income, and Distributions Income and expenses are recorded on the accrual basis. Premiums and discounts on debt securities are amortized for financial reporting purposes. Inflation adjustments to the principal amount of inflation-indexed bonds are reflected as interest income. Dividends received from mutual fund investments are reflected as dividend income; capital gain distributions are reflected as realized gain/loss. Dividend income and capital gain distributions are recorded on the ex-dividend date. Investment transactions are accounted for on the trade date. Realized gains and losses are reported on the identified cost basis. Payments (“variation margin”) made or received to settle the daily fluctuations in the value of futures contracts are recorded as unrealized gains or losses until the contracts are closed. Unsettled variation margin on futures contracts is reflected as other assets or liabilities, and unrealized gains and losses on futures contracts are reflected as the change in net unrealized gain or loss in the accompanying financial statements. Unrealized gains and losses on forward currency exchange contracts are reflected as the change in net unrealized gain or loss in the accompanying financial statements. Paydown gains and losses are recorded as an adjustment to interest income. Distributions to shareholders are recorded on the ex-dividend date. Income distributions are declared on a daily basis and paid monthly. Capital gain distributions, if any, are declared and paid by the fund, typically on an annual basis.
NOTE 2 - INVESTMENT TRANSACTIONS
Consistent with its investment objective, the fund engages in the following practices to manage exposure to certain risks or enhance performance. The investment objective, policies, program, and risk factors of the fund are described more fully in the fund’s prospectus and Statement of Additional Information.
Restricted Securities The fund may invest in securities that are subject to legal or contractual restrictions on resale. Although certain of these securities may be readily sold, for example, under Rule 144A, others may be illiquid, their sale may involve substantial delays and additional costs, and prompt sale at an acceptable price may be difficult.
Forward Currency Exchange Contracts During the year ended May 31, 2006, the fund was a party to forward currency exchange contracts under which it is obligated to exchange currencies at specified future dates and exchange rates. Risks arise from the possible inability of counterparties to meet the terms of their agreements and from movements in currency values.
Futures Contracts During the year ended May 31, 2006, the fund was a party to futures contracts, which provide for the future sale by one party and purchase by another of a specified amount of a specific financial instrument at an agreed upon price, date, time, and place. Risks arise from possible illiquidity of the futures market and from movements in security values and/or interest rates.
Options Call and put options give the holder the right to purchase or sell, respectively, a security at a specified price on a certain date. Risks arise from possible illiquidity of the options market and from movements in security values.
TBA Purchase Commitments During the year ended May 31, 2006, the fund entered into TBA (to be announced) purchase commitments, pursuant to which it agrees to purchase mortgage-backed securities for a fixed unit price, with payment and delivery at a scheduled future date beyond the customary settlement period for that security. With TBA transactions, the particular securities to be delivered are not identified at trade date; however, delivered securities must meet specified terms, including issuer, rate, and mortgage term, and be within industry-accepted “good delivery” standards. The fund generally enters into TBAs with the intention of taking possession of the underlying mortgage securities. Until settlement, the fund maintains cash reserves and liquid assets sufficient to settle its TBAs.
Dollar Rolls During the year ended May 31, 2006, the fund entered into dollar roll transactions, pursuant to which it sells a mortgage-backed TBA or security and simultaneously purchases a similar, but not identical, TBA with the same issuer, rate, and terms. The fund may execute a “roll” to obtain better underlying mortgage securities or to enhance returns. The fund generally enters into dollar roll transactions with the intention of taking possession of the underlying mortgage securities, but may close a contract prior to settlement or “roll” settlement to a later date if deemed in the best interest of shareholders. Actual mortgages received by the fund may be less favorable than those anticipated. The fund accounts for dollar roll transactions as purchases and sales, which has the effect of increasing its portfolio turnover rate.
Other Purchases and sales of portfolio securities, other than short-term and U.S. government securities, aggregated $18,494,000 and $9,747,000, respectively, for the year ended May 31, 2006. Purchases and sales of U.S. government securities aggregated $18,494,000 and $27,207,000, respectively, for the year ended May 31, 2006.
NOTE 3 - FEDERAL INCOME TAXES
No provision for federal income taxes is required since the fund intends to continue to qualify as a regulated investment company under Subchapter M of the Internal Revenue Code and distribute to shareholders all of its taxable income and gains. Federal income tax regulations differ from generally accepted accounting principles; therefore, distributions determined in accordance with tax regulations may differ significantly in amount or character from net investment income and realized gains for financial reporting purposes. Financial reporting records are adjusted for permanent book/tax differences to reflect tax character. Financial records are not adjusted for temporary differences.
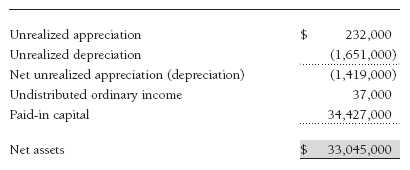
Distributions during the year ended May 31, 2006, totaled $1,483,000 and were characterized as ordinary income for tax purposes. At May 31, 2006, the tax-basis components of net assets were as follows:
Pursuant to federal income tax regulations applicable to investment companies, the fund has elected to treat net capital losses realized between November 1 and May 31 of each year as occurring on the first day of the following tax year. Consequently, $50,000 of realized losses reflected in the accompanying financial statements will not be recognized for tax purposes until 2007.
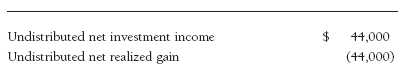
For the year ended May 31, 2006, the fund recorded the following permanent reclassifications to reflect tax character. Reclassifications between income and gain relate primarily to differences between book/tax amortization policies. Results of operations and net assets were not affected by these reclassifications.
At May 31, 2006, the cost of investments for federal income tax purposes was $34,881,000.
NOTE 4 - RELATED PARTY TRANSACTIONS
The fund is managed by T. Rowe Price Associates, Inc. (the manager or Price Associates), a wholly owned subsidiary of T. Rowe Price Group, Inc. The investment management and administrative agreement between the fund and the manager provides for an all-inclusive annual fee equal to 0.45% of the fund’s average daily net assets. The fee is computed daily and paid monthly. The agreement provides that investment management, shareholder servicing, transfer agency, accounting, and custody services are provided to the fund, and interest, taxes, brokerage commissions, directors’ fees and expenses, and extraordinary expenses are paid directly by the fund.
The fund may invest in the T. Rowe Price Reserve Investment Fund and the T. Rowe Price Government Reserve Investment Fund (collectively, the T. Rowe Price Reserve Funds), open-end management investment companies managed by Price Associates and affiliates of the fund. The T. Rowe Price Reserve Funds are offered as cash management options to mutual funds, trusts, and other accounts managed by Price Associates and/or its affiliates, and are not available for direct purchase by members of the public. The T. Rowe Price Reserve Funds pay no investment management fees. During the year ended May 31, 2006, dividend income from the T. Rowe Price Reserve Funds totaled $37,000, and the value of shares of the T. Rowe Price Reserve Funds held at May 31, 2006, and May 31, 2005, was $1,276,000 and $1,269,000, respectively.
The fund may invest in the T. Rowe Price Institutional High Yield Fund, Inc. (High Yield Fund) as a means of gaining efficient and cost-effective exposure to the high-yield bond markets. The High Yield Fund is an open-end management investment company managed by Price Associates, and an affiliate of the fund. The High Yield Fund pays an annual all-inclusive management and administrative fee to Price Associates equal to 0.50% of average daily net assets. To ensure that Institutional Core Plus does not incur duplicate fees for its assets invested in High Yield Fund, Price Associates has agreed to reduce its management fee to the fund. Accordingly, the management fee waiver reflected on the accompanying Statement of Operations includes $3,000 of management fees permanently waived pursuant to this agreement. During the year ended May 31, 2006, purchases and sales of High Yield Fund were $366,000 and $0 respectively. For the year then ended, there were no realized gains or losses on sales of Hig h Yield fund shares. Capital gain distributions from High Yield Fund totaled $20,000, and net investment income was $48,000. At May 31, 2006 and May 31, 2005, the value of shares of High Yield Fund held were $653,000 and $314,000, respectively.
As of May 31, 2006, T. Rowe Price Group, Inc., and/or its wholly owned subsidiaries owned 1,605,264 shares of the fund, representing 47% of the fund’s net assets.
Report of Independent Registered Public Accounting Firm
To the Board of Directors of T. Rowe Price Institutional Income Funds, Inc. and Shareholders of T. Rowe Price Institutional Core Plus Fund
In our opinion, the accompanying statement of assets and liabilities, including the portfolio of investments, and the related statements of operations and of changes in net assets and the financial highlights present fairly, in all material respects, the financial position of T. Rowe Price Institutional Core Plus Fund (one of the portfolios comprising T. Rowe Price Institutional Income Funds, Inc., hereafter referred to as the “Fund”) at May 31, 2006, the results of its operations for the year then ended, the changes in its net assets for each of the two years in the period then ended and the financial highlights for each of the periods indicated, in conformity with accounting principles generally accepted in the United States of America. These financial statements and financial highlights (hereafter referred to as “financial statements”) are the responsibility of the Fund’s management; our responsibility is to express an opinion on these financial statements based on our audits. We conducted our audits of these financial statements in accordance with the auditing standards of the Public Company Accounting Oversight Board (United States). Those standards require that we plan and perform the audit to obtain reasonable assurance about whether the financial statements are free of material misstatement. An audit includes examining, on a test basis, evidence supporting the amounts and disclosures in the financial statements, assessing the accounting principles used and significant estimates made by management, and evaluating the overall financial statement presentation. We believe that our audits, which included confirmation of securities at May 31, 2006 by correspondence with the custodian and brokers, and by agreement to the underlying ownership records for T. Rowe Price Reserve Investment Fund and T. Rowe Price Institutional High Yield Fund, provide a reasonable basis for our opinion.
PricewaterhouseCoopers LLP
Baltimore, Maryland
July 12, 2006
| Tax Information (Unaudited) for the Tax Year Ended 5/31/06 |
We are providing this information as required by the Internal Revenue Code. The amounts shown may differ from those elsewhere in this report because of differences between tax and financial reporting requirements.
The fund’s distributions to shareholders included:
• $61,000 from short-term capital gains,
• 3,000 from long-term capital gains, subject to the 15% rate gains category
| Information on Proxy Voting Policies, Procedures, and Records |
A description of the policies and procedures used by T. Rowe Price funds and portfolios to determine how to vote proxies relating to portfolio securities is available in each fund’s Statement of Additional Information, which you may request by calling 1-800-225-5132 or by accessing the SEC’s Web site, www.sec.gov. The description of our proxy voting policies and procedures is also available on our Web site, www.troweprice.com. To access it, click on the words “Company Info” at the top of our homepage for individual investors. Then, in the window that appears, click on the “Proxy Voting Policy” navigation button in the top left corner.
Each fund’s most recent annual proxy voting record is available on our Web site and through the SEC’s Web site. To access it through our Web site, follow the directions above, then click on the words “Proxy Voting Record” at the bottom of the Proxy Voting Policy page.
| How to Obtain Quarterly Portfolio Holdings |
The fund files a complete schedule of portfolio holdings with the Securities and Exchange Commission for the first and third quarters of each fiscal year on Form N-Q. The fund’s Form N-Q is available electronically on the SEC’s Web site (www.sec.gov); hard copies may be reviewed and copied at the SEC’s Public Reference Room, 450 Fifth St. N.W., Washington, DC 20549. For more information on the Public Reference Room, call 1-800-SEC-0330.
| Approval of Investment Management Agreement |
On March 8, 2006, the fund’s Board of Directors unanimously approved the investment advisory contract (Contract) between the fund and its investment manager, T. Rowe Price Associates, Inc. (Manager). The Board considered a variety of factors in connection with its review of the Contract, also taking into account information provided by the Manager during the course of the year, as discussed below:
Services Provided by the Manager
The Board considered the nature, quality, and extent of the services provided to the fund by the Manager. These services included, but were not limited to, management of the fund’s portfolio and a variety of activities related with portfolio management. The Board also reviewed the background and experience of the Manager’s senior management team and investment personnel involved in the management of the fund. The Board concluded that it was satisfied with the nature, quality, and extent of the services provided by the Manager.
Investment Performance of the Fund
The Board reviewed the fund’s average annual total return for the one-year and since-inception periods and compared these returns to previously agreed upon comparable performance measures and market data, including those supplied by Lipper, an independent provider of mutual fund data. On the basis of this evaluation and the Board’s ongoing review of investment results, the Board concluded that the fund’s performance was satisfactory.
Costs, Benefits, Profits, and Economies of Scale
The Board reviewed detailed information regarding the revenues received by the Manager under the Contract and other benefits that the Manager (and its affiliates) may have realized from its relationship with the fund, including research received under “soft dollar” agreements. The Board noted that the use of soft dollars as a means of paying for third-party, non-broker research had been eliminated. The Board also received information on the estimated costs incurred and profits realized by the Manager and its affiliates from advising T. Rowe Price mutual funds. The Board noted that the Manager had waived its fee for the fund. The Board concluded that the Manager’s profits from advising T. Rowe Price mutual funds were reasonable in light of the services provided to the fund. The Board also considered whether the fund or other funds benefit under the fee levels set forth in the Contract from any economies of scale realized by the Manager. The Board noted that, under the Contract, the fund pays the Manager a single fee based on the fund’s assets and the Manager, in turn, pays all expenses of the fund, with certain exceptions. The Board concluded that, based on the profitability data it reviewed and consistent with this single fee structure, the Contract provided for a reasonable sharing of any benefits from economies of scale with the fund.
Fees
The Board reviewed the fund’s single-fee structure and compared the rate to fees and expenses of other comparable funds based on information and data supplied by Lipper. The information provided to the Board showed that the fund’s single fee rate was generally below the median management fee rate and expense ratio of comparable funds. The Board also reviewed the fee schedules for comparable privately managed accounts of the Manager and its affiliates. Management informed the Board that the Manager’s responsibilities for privately managed accounts are more limited than its responsibilities for the fund and other T. Rowe Price mutual funds that it or its affiliates advise. On the basis of the information provided, the Board concluded that the fees paid by the fund under the Contract were reasonable.
Approval of the Contract
As noted, the Board approved the continuation of the Contract. No single factor was considered in isolation or to be determinative to the decision. Rather, the Board concluded, in light of a weighting and balancing of all factors considered, that it was in the best interests of the fund to approve the continuation of the Contract, including the fees to be charged for services thereunder.
| About the Fund’s Directors and Officers |
Your fund is governed by a Board of Directors that meets regularly to review performance, investment programs, compliance matters, advisory fees and expenses, service providers, and other business matters, and is responsible for protecting the interests of shareholders. At least 75% of the fund’s directors are independent of T. Rowe Price Associates, Inc. (T. Rowe Price); “inside” directors are officers of T. Rowe Price. The Board of Directors elects the fund’s officers, who are listed in the final table. The business address of each director and officer is 100 East Pratt Street, Baltimore, MD 21202. The Statement of Additional Information includes additional information about the fund directors and is available without charge by calling a T. Rowe Price representative at 1-800-225-5132.
| Independent Directors | |
| |
| Name (Year of Birth) | |
| Year Elected* | Principal Occupation(s) During Past 5 Years and Directorships of Other Public Companies |
| |
| Jeremiah E. Casey (1940) | Director, Allfirst Financial, Inc. (previously First Maryland Bankcorp) (1983 to 2002); Director, National Life Insurance |
| 2006 | (2001 to 2005); Director, The Rouse Company, real estate developers (1990 to 2004) |
| |
| Anthony W. Deering (1945) | Chairman, Exeter Capital, LLC, a private investment firm (2004 to present); Director, Vornado Real Estate Investment |
| 2002 | Trust (3/04 to present); Director, Mercantile Bankshares (4/03 to present); Member, Advisory Board, Deutsche Bank |
| | North America (2004 to present); Director, Chairman of the Board, and Chief Executive Officer, The Rouse Company, |
| | real estate developers (1997 to 2004) |
| |
| Donald W. Dick, Jr. (1943) | Principal, EuroCapital Advisors, LLC, an acquisition and management advisory firm; Chairman, President, and Chief |
| 2002 | Executive Officer, The Haven Group, a custom manufacturer of modular homes (1/04 to present) |
| |
| David K. Fagin (1938) | Chairman and President, Nye Corporation (6/88 to present); Director, Canyon Resources Corp. and Golden Star |
| 2002 | Resources Ltd. (5/92 to present), and Pacific Rim Mining Corp. (2/02 to present) |
| |
| Karen N. Horn (1943) | Managing Director and President, Global Private Client Services, Marsh Inc. (1999 to 2003); Managing Director and |
| 2003 | Head of International Private Banking, Bankers Trust (1996 to 1999); Director, Georgia Pacific, Eli Lilly and Company, |
| | and Simon Property Group |
| |
| Theo C. Rodgers (1941) | President, A&R Development Corporation |
| 2005 | |
| |
| John G. Schreiber (1946) | Owner/President, Centaur Capital Partners, Inc., a real estate investment company; Partner, Blackstone Real Estate |
| 2002 | Advisors, L.P.; Director, AMLI Residential Properties Trust |
*Each independent director oversees 113 T. Rowe Price portfolios and serves until retirement, resignation, or election of a successor.
| Inside Directors | |
| |
| Name (Year of Birth) | |
| Year Elected* [Number of | |
| T. Rowe Price Portfolios | |
| Overseen] | Principal Occupation(s) During Past 5 Years and Other Directorships of Public Companies |
| |
| Edward C. Bernard (1956) | Director and Vice President, T. Rowe Price and T. Rowe Price Group, Inc.; Chairman of the Board, Director, and |
| 2006 | President, T. Rowe Price Investment Services, Inc.; Chairman of the Board and Director, T. Rowe Price Retirement |
| [113] | Plan Services, Inc., T. Rowe Price Services, Inc., and T. Rowe Price Savings Bank; Director, T. Rowe Price Global |
| | Asset Management Limited and T. Rowe Price Global Investment Services Limited; Chief Executive Officer, Chairman |
| | of the Board, Director, and President, T. Rowe Price Trust Company; Chairman of the Board, all funds |
| |
| Mary J. Miller, CFA (1955) | Director and Vice President, T. Rowe Price; Vice President, T. Rowe Price Group, Inc.; President, Institutional Income |
| 2004 | Funds |
| [37] | |
* Each inside director serves until retirement, resignation, or election of a successor.
| Officers | |
| |
| Name (Date of Birth) | |
| Title and Fund(s) Served | Principal Occupation(s) |
| |
| Connice A. Bavely, CFA (1951) | Vice President, T. Rowe Price and T. Rowe Price Group, Inc. |
| Vice President, Institutional Income Funds | |
| |
| David C. Beers, CFA (1970) | Assistant Vice President, T. Rowe Price; formerly, High Yield Analyst, |
| Assistant Vice President, Institutional Income Funds | Chartwell Investment Partners and Business Analyst/Software Developer, |
| | Morgan Stanley Investment Management (to 2004) |
| |
| Brian J. Brennan, CFA (1964) | Vice President, T. Rowe Price, T. Rowe Price Group, Inc., and T. Rowe Price |
| Executive Vice President, Institutional Income Funds | Trust Company |
| |
| Andrew M. Brooks (1956) | Vice President, T. Rowe Price and T. Rowe Price Group, Inc. |
| Vice President, Institutional Income Funds | |
| |
| Joseph A. Carrier, CPA (1960) | Vice President, T. Rowe Price, T. Rowe Price Group, Inc., T. Rowe Price |
| Treasurer, Institutional Income Funds | Investment Services, Inc., and T. Rowe Price Trust Company |
| |
| Michael J. Conelius, CFA (1964) | Vice President, T. Rowe Price, T. Rowe Price Group, Inc., and T. Rowe Price |
| Vice President, Institutional Income Funds | International, Inc. |
| |
| Roger L. Fiery III, CPA (1959) | Vice President, T. Rowe Price, T. Rowe Price Group, Inc., T. Rowe Price |
| Vice President, Institutional Income Funds | International, Inc., and T. Rowe Price Trust Company |
| |
| Justin T. Gerbereux, CFA (1975) | Assistant Vice President, T. Rowe Price; formerly, Equity Research Intern, |
| Assistant Vice President, Institutional Income Funds | Mellon Growth Advisors, LLC, and Senior Investment Associate and |
| | Investment Performance Analyst, Cambridge Associates, LLC. |
| |
| John R. Gilner (1961) | Chief Compliance Officer and Vice President, T. Rowe Price; Vice President, |
| Chief Compliance Officer, Institutional Income Funds | T. Rowe Price Group, Inc., and T. Rowe Price Investment Services, Inc. |
| |
| |
| Gregory S. Golczewski (1966) | Vice President, T. Rowe Price and T. Rowe Price Trust Company |
| Vice President, Institutional Income Funds | |
| Henry H. Hopkins (1942) | Director and Vice President, T. Rowe Price Investment Services, Inc., |
| Vice President, Institutional Income Funds | T. Rowe Price Services, Inc., and T. Rowe Price Trust Company; Vice |
| | President, T. Rowe Price, T. Rowe Price Group, Inc., T. Rowe Price |
| | International, Inc., and T. Rowe Price Retirement Plan Services, Inc. |
| |
| Paul A. Karpers, CFA (1967) | Vice President, T. Rowe Price and T. Rowe Price Group, Inc. |
| Vice President, Institutional Income Funds | |
| |
| Ian D. Kelson (1956) | Vice President, T. Rowe Price, T. Rowe Price Group, Inc., and T. Rowe Price |
| Vice President, Institutional Income Funds | International, Inc. |
| |
| Patricia B. Lippert (1953) | Assistant Vice President, T. Rowe Price and T. Rowe Price Investment |
| Secretary, Institutional Income Funds | Services, Inc. |
| |
| Kevin P. Loome, CFA (1967) | Vice President, T. Rowe Price, T. Rowe Price Group, Inc., and T. Rowe Price |
| Vice President, Institutional Income Funds | International, Inc. |
| |
| Paul M. Massaro, CFA (1975) | Assistant Vice President, T. Rowe Price; formerly, Equity Research |
| Assistant Vice President, Institutional Income Funds | Employee, Banc of America Securities and J.P. Morgan Chase |
| |
| Michael J. McGonigle (1966) | Vice President, T. Rowe Price and T. Rowe Price Group, Inc. |
| Vice President, Institutional Income Funds | |
| |
| Brian A. Rubin, CPA (1974) | Employee, T. Rowe Price |
| Assistant Vice President, Institutional Income Funds | |
| |
| Daniel O. Shackelford, CFA (1958) | Vice President, T. Rowe Price, T. Rowe Price Group, Inc., and T. Rowe Price |
| Vice President, Institutional Income Funds | Trust Company |
| |
| Walter P. Stuart III, CFA (1960) | Vice President, T. Rowe Price and T. Rowe Price Group, Inc. |
| Vice President, Institutional Income Funds | |
| |
| Thomas E. Tewksbury (1961) | Vice President, T. Rowe Price and T. Rowe Price Group, Inc. |
| Vice President, Institutional Income Funds | |
| |
| David A. Tiberii, CFA (1965) | Vice President, T. Rowe Price and T. Rowe Price Group, Inc. |
| Vice President, Institutional Income Funds | |
| |
| Mark J. Vaselkiv (1958) | Vice President, T. Rowe Price and T. Rowe Price Group, Inc. |
| Executive Vice President, Institutional Income Funds | |
| |
| Julie L. Waples (1970) | Vice President, T. Rowe Price |
| Vice President, Institutional Income Funds | |
| |
| Thea N. Williams (1961) | Vice President, T. Rowe Price and T. Rowe Price Group, Inc. |
| Vice President, Institutional Income Funds | |
Unless otherwise noted, officers have been employees of T. Rowe Price or T. Rowe Price International for at least five years.
Item 2. Code of Ethics.
The registrant has adopted a code of ethics, as defined in Item 2 of Form N-CSR, applicable to its principal executive officer, principal financial officer, principal accounting officer or controller, or persons performing similar functions. A copy of this code of ethics is filed as an exhibit to this Form N-CSR. No substantive amendments were approved or waivers were granted to this code of ethics during the period covered by this report.
Item 3. Audit Committee Financial Expert.
The registrant’s Board of Directors/Trustees has determined that Mr. Donald W. Dick Jr. qualifies as an audit committee financial expert, as defined in Item 3 of Form N-CSR. Mr. Dick is considered independent for purposes of Item 3 of Form N-CSR.
Item 4. Principal Accountant Fees and Services.
(a) – (d) Aggregate fees billed to the registrant for the last two fiscal years for professional services rendered by the registrant’s principal accountant were as follows:
| | 2006 | 2005 |
| Audit Fees | $8,332 | $8,312 |
| Audit-Related Fees | 632 | 64 |
| Tax Fees | 1,182 | 1,461 |
| All Other Fees | 150 | 165 |
Audit fees include amounts related to the audit of the registrant’s annual financial statements and services normally provided by the accountant in connection with statutory and regulatory filings. Audit-related fees include amounts reasonably related to the performance of the audit of the registrant’s financial statements and specifically include the issuance of a report on internal controls. Tax fees include amounts related to services for tax compliance, tax planning, and tax advice. The nature of these services specifically includes the review of distribution calculations and the preparation of Federal, state, and excise tax returns. Reclassification from tax fees to audit fees of fiscal 2005 amounts related to the auditing of tax disclosures within the registrant’s annual financial statements has been made in order to conform to fiscal 2006 presentation. All other fees include the registrant’s pro-rata share of amounts for agreed-upon procedures in conjunction with service contract approvals by the registrant’s Board of Directors/Trustees.
(e)(1) The registrant’s audit committee has adopted a policy whereby audit and non-audit services performed by the registrant’s principal accountant for the registrant, its investment adviser, and any entity controlling, controlled by, or under common control with the investment adviser that provides ongoing services to the registrant require pre-approval in advance at regularly scheduled audit committee meetings. If such a service is required between regularly scheduled audit committee meetings, pre-approval may be authorized by one audit committee member with ratification at the next scheduled audit committee meeting. Waiver of pre-approval for audit or non-audit services requiring fees of a de minimis amount is not permitted.
(2) No services included in (b) – (d) above were approved pursuant to paragraph (c)(7)(i)(C) of Rule 2-01 of Regulation S-X.
(f) Less than 50 percent of the hours expended on the principal accountant’s engagement to audit the registrant’s financial statements for the most recent fiscal year were attributed to work performed by persons other than the principal accountant’s full-time, permanent employees.
(g) The aggregate fees billed for the most recent fiscal year and the preceding fiscal year by the registrant’s principal accountant for non-audit services rendered to the registrant, its investment adviser, and any entity controlling, controlled by, or under common control with the investment adviser that provides ongoing services to the registrant were $883,000 and $785,000, respectively, and were less than the aggregate fees billed for those same periods by the registrant’s principal accountant for audit services rendered to the T. Rowe Price Funds. Preceding fiscal year amount reflects the reclassification of tax fees described in (a) – (d) above.
(h) All non-audit services rendered in (g) above were pre-approved by the registrant’s audit committee. Accordingly, these services were considered by the registrant’s audit committee in maintaining the principal accountant’s independence.
Item 5. Audit Committee of Listed Registrants.
Not applicable.
Item 6. Schedule of Investments.
Not applicable. The complete schedule of investments is included in Item 1 of this Form N-CSR.
Item 7. Disclosure of Proxy Voting Policies and Procedures for Closed-End Management Investment Companies.
Not applicable.
Item 8. Portfolio Managers of Closed-End Management Investment Companies.
Not applicable.
Item 9. Purchases of Equity Securities by Closed-End Management Investment Company and Affiliated Purchasers.
Not applicable.
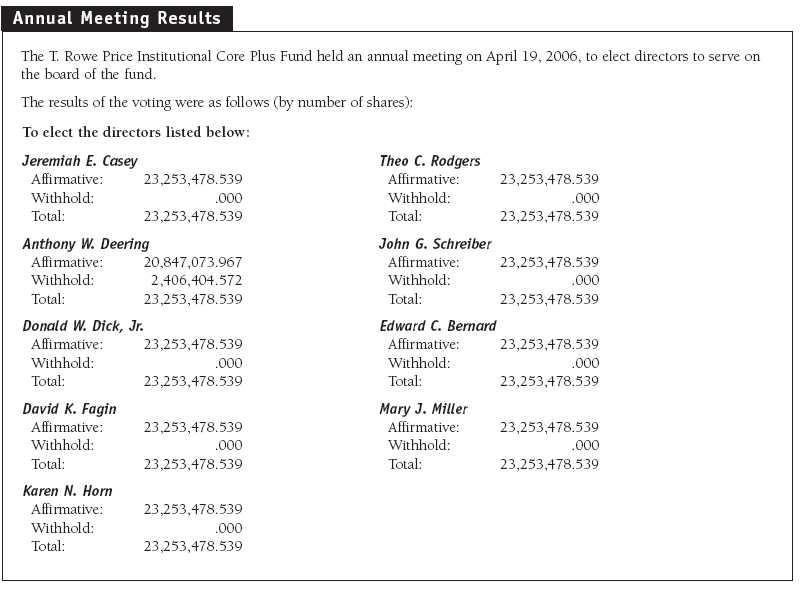
Item 10. Submission of Matters to a Vote of Security Holders.
Not applicable.
Item 11. Controls and Procedures.
(a) The registrant’s principal executive officer and principal financial officer have evaluated the registrant’s disclosure controls and procedures within 90 days of this filing and have concluded that the registrant’s disclosure controls and procedures were effective, as of that date, in ensuring that information required to be disclosed by the registrant in this Form N-CSR was recorded, processed, summarized, and reported timely.
(b) The registrant’s principal executive officer and principal financial officer are aware of no change in the registrant’s internal control over financial reporting that occurred during the registrant’s second fiscal quarter covered by this report that has materially affected, or is reasonably likely to materially affect, the registrant’s internal control over financial reporting.
Item 12. Exhibits.
(a)(1) The registrant’s code of ethics pursuant to Item 2 of Form N-CSR is attached.
(2) Separate certifications by the registrant's principal executive officer and principal financial officer, pursuant to Section 302 of the Sarbanes-Oxley Act of 2002 and required by Rule 30a-2(a) under the Investment Company Act of 1940, are attached.
(3) Written solicitation to repurchase securities issued by closed-end companies: not applicable.
(b) A certification by the registrant's principal executive officer and principal financial officer, pursuant to Section 906 of the Sarbanes-Oxley Act of 2002 and required by Rule 30a-2(b) under the Investment Company Act of 1940, is attached.
| |
SIGNATURES |
| |
| | Pursuant to the requirements of the Securities Exchange Act of 1934 and the Investment |
| Company Act of 1940, the registrant has duly caused this report to be signed on its behalf by the |
| undersigned, thereunto duly authorized. |
| |
| T. Rowe Price Institutional Income Funds, Inc. |
| |
| |
| By | /s/ Edward C. Bernard |
| | Edward C. Bernard |
| | Principal Executive Officer |
| |
| Date | July 18, 2006 |
| |
| |
| | Pursuant to the requirements of the Securities Exchange Act of 1934 and the Investment |
| Company Act of 1940, this report has been signed below by the following persons on behalf of |
| the registrant and in the capacities and on the dates indicated. |
| |
| |
| By | /s/ Edward C. Bernard |
| | Edward C. Bernard |
| | Principal Executive Officer |
| |
| Date | July 18, 2006 |
| |
| |
| By | /s/ Joseph A. Carrier |
| | Joseph A. Carrier |
| | Principal Financial Officer |
| |
| Date | July 18, 2006 |

