| UNITED STATES |
| SECURITIES AND EXCHANGE COMMISSION |
| Washington, D.C. 20549 |
| |
FORM N-CSR |
| |
CERTIFIED SHAREHOLDER REPORT OF REGISTERED |
MANAGEMENT INVESTMENT COMPANIES |
| |
| |
| |
| Investment Company Act File Number: 811-21055 |
|
| |
| T. Rowe Price Institutional Income Funds, Inc. |
|
| (Exact name of registrant as specified in charter) |
| |
| 100 East Pratt Street, Baltimore, MD 21202 |
|
| (Address of principal executive offices) |
| |
| David Oestreicher |
| 100 East Pratt Street, Baltimore, MD 21202 |
|
| (Name and address of agent for service) |
| |
| |
| Registrant’s telephone number, including area code: (410) 345-2000 |
| |
| |
| Date of fiscal year end: May 31 |
| |
| |
| Date of reporting period: May 31, 2008 |
Item 1: Report to Shareholders| Institutional Floating Rate Fund | May 31, 2008 |
The views and opinions in this report were current as of May 31, 2008. They are not guarantees of performance or investment results and should not be taken as investment advice. Investment decisions reflect a variety of factors, and the managers reserve the right to change their views about individual stocks, sectors, and the markets at any time. As a result, the views expressed should not be relied upon as a forecast of the fund’s future investment intent. The report is certified under the Sarbanes-Oxley Act, which requires mutual funds and other public companies to affirm that, to the best of their knowledge, the information in their financial reports is fairly and accurately stated in all material respects.
Manager’s Letter
T. Rowe Price Institutional Floating Rate Fund
Dear Investor
Our first reporting period saw solid gains for the portfolio. The turmoil in late 2007 and early 2008 may be remembered as one of the most remarkable and volatile periods in the history of the fixed-income markets. Although nervous investors remained comfortable holding securities with a federal government backing, they shunned a wide variety of lower-quality debt, including leveraged loans and high-yield bonds. However, in the four-month period since the fund’s launch, this trend began to reverse, and the portfolio’s holdings rallied. As a result, the fund provided a positive return that was consistent with its objectives and outperformed its benchmark.
We would like to welcome investors to the fund. As you know, the bank loan strategy seeks high current income and, secondarily, capital appreciation. Most, if not all, of the loans in which the fund invests will have below investment-grade credit ratings or may not be rated by a major credit rating agency. These bank loans are sometimes called “levered” or “leveraged” loans because the borrowing company often has significantly more debt than equity. However, the Institutional Floating Rate Fund invests in these loans on an unleveraged basis. Normally, the fund will invest the majority of its assets in senior floating-rate loans. In the event of a bankruptcy, holders of senior loans should have priority in recovering principal over the company’s subordinate creditors and shareholders. The fund also has the flexibility to invest a small portion of its assets in fixed-rate bonds.
Background on the Strategy
T. Rowe Price has 25 years of experience investing in high-yield bonds through a variety of portfolios designed for individual and institutional investors.
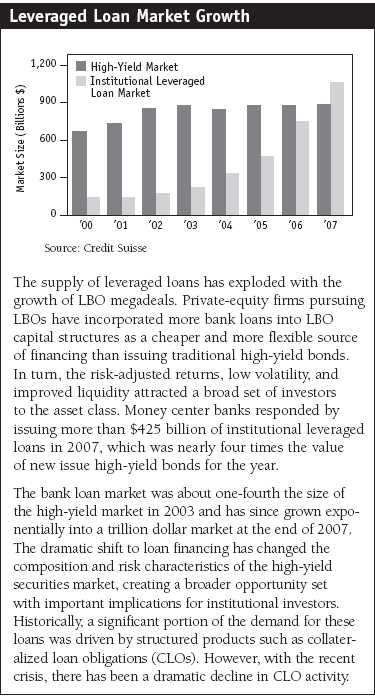
Over the past five years, we identified the leveraged loan market as a growing and important asset class in our area of expertise. At the time, we envisioned that the market would grow dramatically, and indeed, that has now come to fruition. In fact, the leveraged loan market now parallels the high-yield bond market in size.
• Private-equity leveraged buyout (LBO) activity powered exponential growth of institutional bank loans, creating a fertile opportunity for fixed-income investors.
• Bank loans offer distinct advantages over fixed-rate high-yield bonds because of their floating rates (which reset every 90 days) and senior status in the corporate capital structure. Typically, they are secured and have a shorter maturity than high-yield bonds.
• In addition to attractive risk-adjusted returns, bank loans historically have had lower volatility, higher default recovery rates, and low return correlations with other fixed-income asset classes.
Our high-yield analysts and managers have been developing expertise in buying and selling loans for many years. These loans are now held in many of the portfolios we manage, beginning initially with our high-yield strategies and permeating into other portfolios that permit investments in securities rated below investment grade. The shift began about two years ago, when we approached our institutional high-yield clients about changing the guidelines to purchase loans in the high-yield strategy. As the leveraged loan market has grown both in scope and size, we’ve found that most sophisticated high-yield investors expressed interest in a blended allocation to loans and high-yield bonds. Launching this fund demonstrates our conviction that the prospects for this asset class are appealing.
• Leveraged loans generated solid results since the fund’s inception at the end of January.
• The fund’s launch coincided with the end of one of the worst periods for the loan market and a tumultuous period for high-yield bonds.
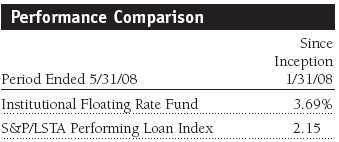
• The T. Rowe Price Institutional Floating Rate Fund outperformed its benchmark, the S&P/LSTA Performing Loan Index.
• We are optimistic about the prospects for the loan market over the coming year. On top of decent income generation, we think the portfolio can generate incremental capital appreciation in the coming months.
Portfolio Performance and Strategy Review
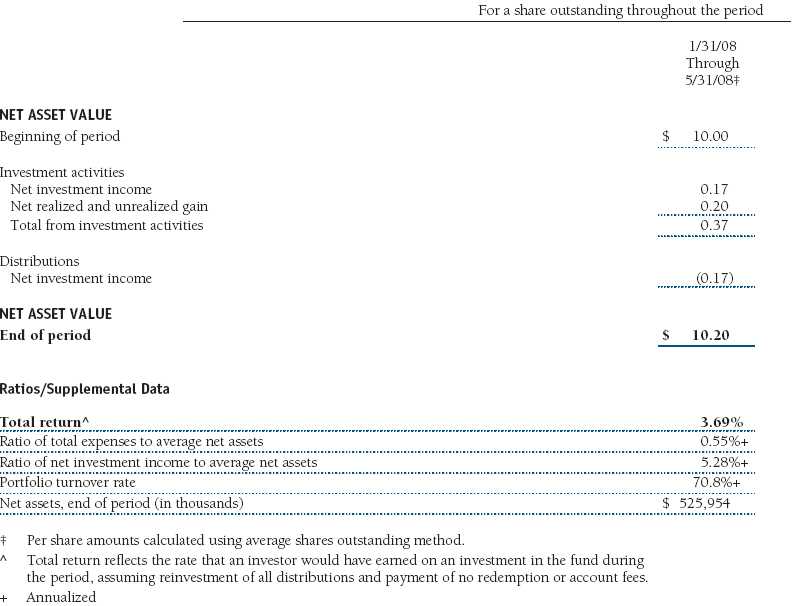
The portfolio returned 3.69% for the four-month period since its inception on January 31, 2008. Our results outperformed those of the S&P/LSTA Performing Loan Index by 1.54%. The fund’s launch coincided with one of the worst periods for the loan market and a tumultuous period for high-yield bonds.
We constructed the Institutional Floating Rate Fund’s portfolio using the same investing philosophy and intensive credit research we use for our high-yield bond strategy. Our entire high-yield analyst team is equally versed at researching loans and bonds. The team routinely assesses a company’s entire capital structure as part of our relative-value analysis to determine if we prefer a company’s loans or bonds. At the time we launched the fund, the challenges, both at the macro level—relating to the economy and capital markets—and issues specific to the asset class, created one of the worst environments we can recall for high-yield and loan investing. However, defaults across the universe of companies in which we invest remained at historically low levels.
The loan market has demonstrated low volatility, and we are attracted to the asset class for its defensive characteristics. Another key attribute of bank loans is the particularly high recovery rates in default situations—loans typically recover an average of 80 to 85 cents on the dollar after a default versus the high-yield bond recovery rate of 35 to 40 cents on the dollar.
Even so, for the first half of the decade, we saw few compelling reasons to invest in the loan market on an unleveraged basis, due to low interest rates and lack of supply and liquidity. As supply and liquidity improved, we felt it was prudent to get more involved in the asset class. After financial market volatility erupted last fall, and the loan market hit a significant supply and demand dislocation, we opportunistically launched our first loan product at the end of January. This was largely due to the asset class’s attractive pricing, which created an opportunity to generate solid income and significant capital appreciation. Because the loans traded below par value, an unleveraged portfolio of these loans should be able to generate solid returns.
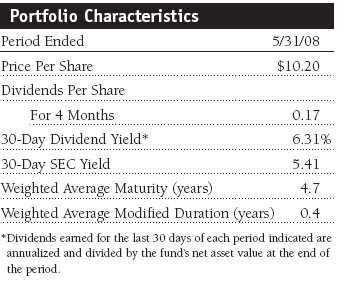
Even though the loan market was in turmoil when we launched the fund, our timing was somewhat fortunate. We generated $0.20 of appreciation and $0.17 of dividend income in the four months since the fund’s inception. We can attribute some of the appreciation to the rally in the loans following a tough period for the asset class in the final quarter of 2007 and into 2008.
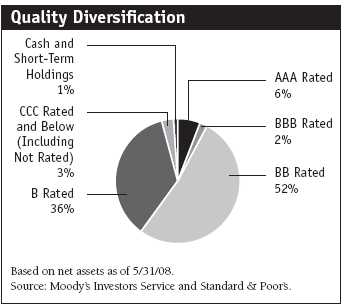
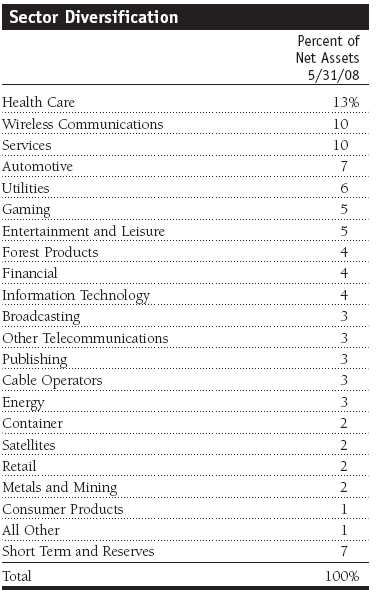
The portfolio is almost entirely invested in B and BB rated securities (88% of total net assets), and the overlap between the high-yield issuers and the leveraged loan issuers is very high. Therefore, we were able to make use of our existing high-yield research infrastructure and capabilities within our loan product. As shown in the table on page 6, our largest allocations are to health care and wireless communications. We are focused on owning solid companies that generate current income, capital appreciation potential, and sufficient asset protection to ensure a full recovery of principal in the event of a default. One of the current keys to buying loans is their attractive valuations, especially when compared with historical valuations. Many of our initial fund purchases were made in loans that traded well below par value—in the mid to high 80% range, representing some of the lowest values we have seen in the history of the asset class. Today most of those issues have appreciated into the low 90s.
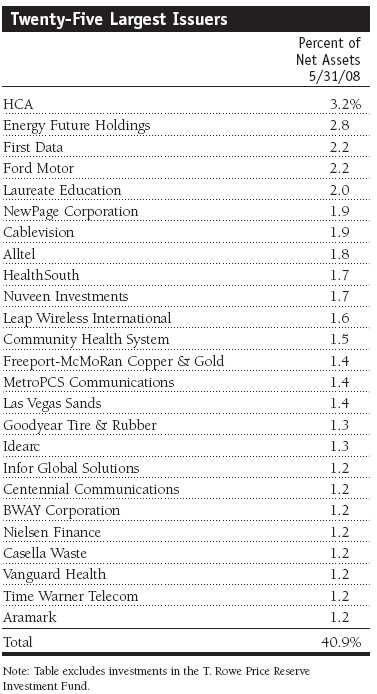
Our best contributor for the four-month period was the former TXU, now called Energy Future Holdings. It is the largest regulated utility in Texas and the portfolio’s second-largest investment. Our largest holding, and also a standout contributor, was HCA (Hospital Corporation of America). Like Energy Future Holdings, the company has very defensive characteristics, generates a steady stream of income, and has provided solid appreciation. It is the largest privately owned hospital management company in the U.S. and is a seasoned LBO that has had time to pay down some of its debt and improve its balance sheet. The four-year HCA loan was purchased at 92% of par and has an attractive amortization schedule—stipulating that each year a portion of the loan must be repaid at par. (Please refer to the portfolio of investments for a complete listing of holdings and the amount each represents in the portfolio.)
Among our other large holdings, we have built a substantial position in Laureate Education, a for-profit education company that generates a significant portion of its revenues overseas. In international markets, the majority of the tuition revenue stream is cash and carry business—meaning students pay cash rather than take out loans for their classes. This feature eliminates much of the need for and uncertainties associated with collecting student loans, thus reducing the risk of cash flow interruptions. Our cost is slightly above 91% of par, and the coupon is Libor (a bit over 3.5% at the end of the reporting period) plus 3.5%, which translates into a yield of almost 8%. It was, in our view, a solid relative value, and we believe the loans will be worth par at maturity or sooner. Another large position and strong contributor was Leap Wireless. We are attracted to the company’s fundamental characteristics and believe it could be acquired. In examining the company’s capital structure, we believe that in an acquisition scenario, Leap’s loans, and not the bonds, would be retired at par and subsequently refinanced. In this case, we would generate a few points of appreciation. In the meantime, the loan pays a competitive coupon.
Although we had only a few detractors over the past four months, Palm is worthy of mention. We paid less than 70% of par value for its floating-rate loans, meaning the purchase was rather speculative in nature. The smartphone company has faced a series of competitive challenges from its larger rivals (such as Research In Motion, the BlackBerry maker) and the securities have traded modestly lower. Palm has hired several seasoned senior managers from Apple, and we expect the company to launch its next generation of products in 2009. Even if the products are not blockbusters, we believe the company should generate enough cash flow to cover its fixed obligations, given the expected tremendous growth in the smartphone category over the next few years. Palm does not have a large market share or any profits at this juncture, but we feel a buyer could emerge for the company’s brand and intellectual property.
Outlook
We are optimistic about the prospects for the loan market for the coming year. There is a distinct possibility that interest rates will trend higher. If Libor goes up significantly over the course of the next 12 months, the fund would benefit handsomely as the floating rates reset every three months. Additionally, as of the writing of this letter, loans had comparable yields to BB rated bonds. Given the seniority and floating-rate nature of loans, we think loans are attractively valued when compared with fixed-rate BB rated bonds. Further, there is a good chance that some of our higher-quality loans will pay down a portion of their outstanding balances. We think the portfolio can generate some capital appreciation—since most of the securities in the portfolio were purchased at a discount—and good income in coming months.
The supply of new loans has receded as investment banks pared their exposure in underwritten but unsyndicated deals in recent months. At the same time, several new classes of investors have stepped into the market, including private-equity players and value-oriented equity managers who are attracted to the asset class at these valuations. Therefore, we’ve seen improvement in the technical backdrop for the loan market over the past four months. Additionally, after the large LBOs are fully distributed into long-term investors’ portfolios, we don’t see a large amount of new supply on the horizon. The market should shift from being saturated with product to a scarcity of supply, creating improved demand and stronger pricing.
Finally, given the uncertain macroeconomic backdrop, we think that a move into the most senior debt in the capital structure may be an appropriate decision, given the higher recovery rates. A rise in bankruptcy filings—which most high-yield analysts forecast—is, perversely, good for the loan market, because all of a company’s cash flow can be directed to paying down loans rather than the interest on bonds. The portfolio holds secured securities that should be repaid, even in the case of a default.
We appreciate your confidence and thank you for investing with T. Rowe Price.
Respectfully submitted,

Mark J. Vaselkiv
Chairman of the fund’s Investment Advisory Committee

Justin T. Gerbereux
Investment Advisory Committee member

Paul M. Massaro
Investment Advisory Committee member
June 20, 2008
The committee chairman has day-to-day responsibility for managing the portfolio and works with committee members in developing and executing the fund’s investment program.
| Risks of Investing in Floating-Rate Loan Funds |
Floating-rate loans are subject to credit risk, the chance that any fund holding could have its credit rating downgraded or that an issuer will default (fail to make timely payments of interest or principal), and liquidity risk, the chance that the fund may not be able to sell loans or securities at desired prices, potentially reducing the fund’s income level and share price. Like bond funds, this fund is exposed to interest rate risk, but credit and liquidity risks may often be more important.
The loans in which the fund invests are often referred to as leveraged loans because the borrowing companies have significantly more debt than equity. In many cases leveraged loans are issued in connection with recapitalizations, acquisitions, leveraged buyouts, and refinancings. Companies issuing leveraged loans typically have a below investment-grade credit rating or may not be rated by a major credit rating agency. Leveraged loan funds could have greater price declines than funds that invest primarily in high-quality bonds, so the securities are usually considered speculative investments.
30-day dividend yield: Dividends earned for the last 30 days of the period indicated are annualized and divided by the fund’s net asset value at the end of the period.
30-day SEC yield: A method of calculating a fund’s yield that assumes all portfolio securities are held until maturity. The Securities and Exchange Commission (SEC) requires all bond funds to calculate this yield. Yield will vary and is not guaranteed.
Duration: A measure of a bond or bond fund’s sensitivity to changes in interest rates. For example, a fund with a one-year duration would fall about 1% in response to a one-percentage-point rise in interest rates, and vice versa.
Federal funds rate: The interest rate charged on overnight loans of reserves by one financial institution to another in the United States. The Federal Reserve sets a target federal funds rate to affect the direction of interest rates.
London Interbank Offered Rate (Libor): The interest rate at which banks loan money to each other in the London wholesale market, which is also known as the interbank market.
S&P/LSTA Performing Loan Index: A benchmark that tracks the performance of the leveraged loan market.
Weighted average maturity: The weighted average of the stated maturity dates of the portfolio’s securities. In general, the longer the average maturity, the greater the fund’s sensitivity to interest rate changes. A shorter average maturity usually means less interest rate sensitivity and therefore a less volatile portfolio.
Portfolio Highlights
Performance and Expenses
T. Rowe Price Institutional Floating Rate Fund
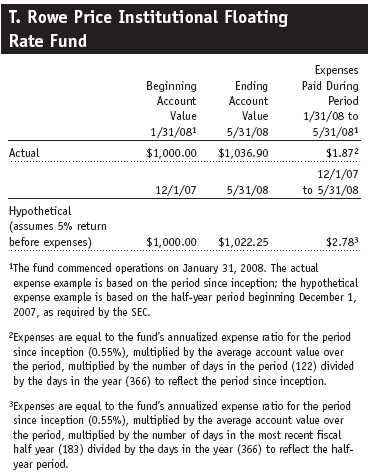
Fund Expense Example
As a mutual fund shareholder, you may incur two types of costs: (1) transaction costs, such as redemption fees or sales loads, and (2) ongoing costs, including management fees, distribution and service (12b-1) fees, and other fund expenses. The following example is intended to help you understand your ongoing costs (in dollars) of investing in the fund and to compare these costs with the ongoing costs of investing in other mutual funds. The example is based on an investment of $1,000 invested at the beginning of the most recent six-month period and held for the entire period.
Actual Expenses
The first line of the following table (“Actual”) provides information about actual account values and actual expenses. You may use the information in this line, together with your account balance, to estimate the expenses that you paid over the period. Simply divide your account value by $1,000 (for example, an $8,600 account value divided by $1,000 = 8.6), then multiply the result by the number in the first line under the heading “Expenses Paid During Period” to estimate the expenses you paid on your account during this period.
Hypothetical Example for Comparison Purposes
The information on the second line of the table (“Hypothetical”) is based on hypothetical account values and expenses derived from the fund’s actual expense ratio and an assumed 5% per year rate of return before expenses (not the fund’s actual return). You may compare the ongoing costs of investing in the fund with other funds by contrasting this 5% hypothetical example and the 5% hypothetical examples that appear in the shareholder reports of the other funds. The hypothetical account values and expenses may not be used to estimate the actual ending account balance or expenses you paid for the period.
You should also be aware that the expenses shown in the table highlight only your ongoing costs and do not reflect any transaction costs, such as redemption fees or sales loads. Therefore, the second line of the table is useful in comparing ongoing costs only and will not help you determine the relative total costs of owning different funds. To the extent a fund charges transaction costs, however, the total cost of owning that fund is higher.
Financial Highlights
T. Rowe Price Institutional Floating Rate Fund
The accompanying notes are an integral part of these financial statements.
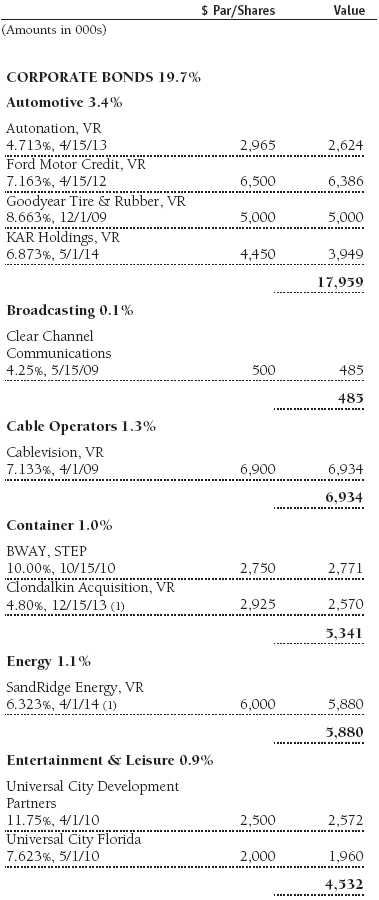
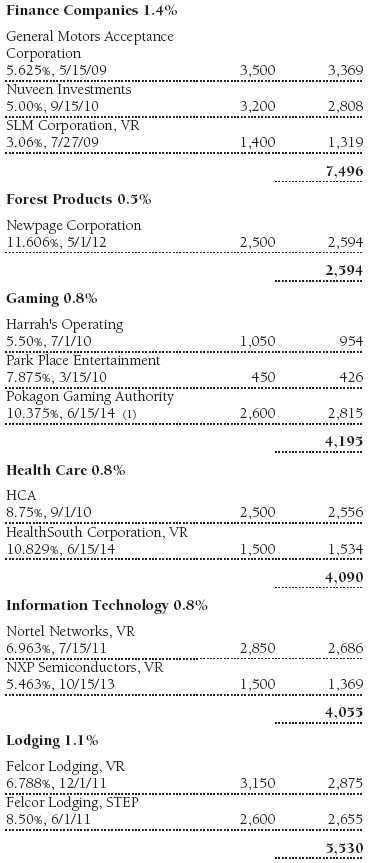
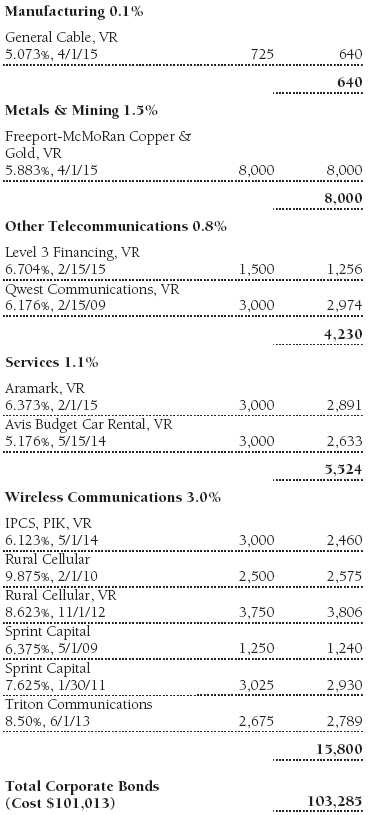
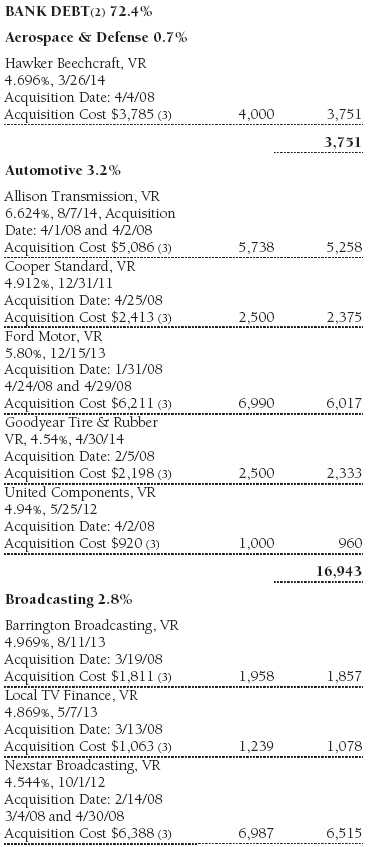
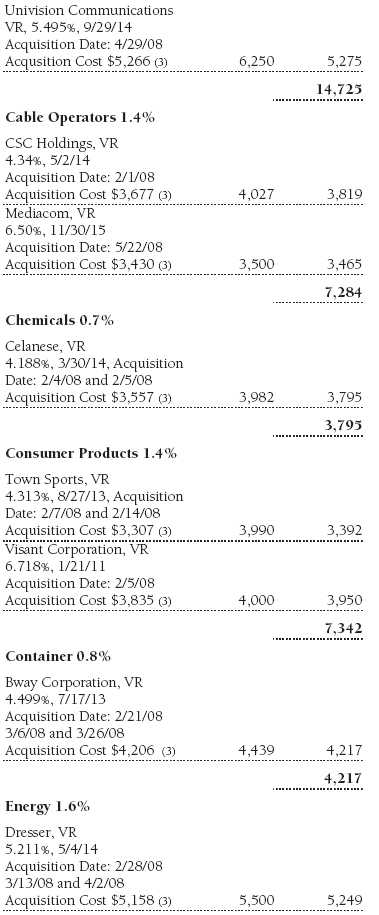
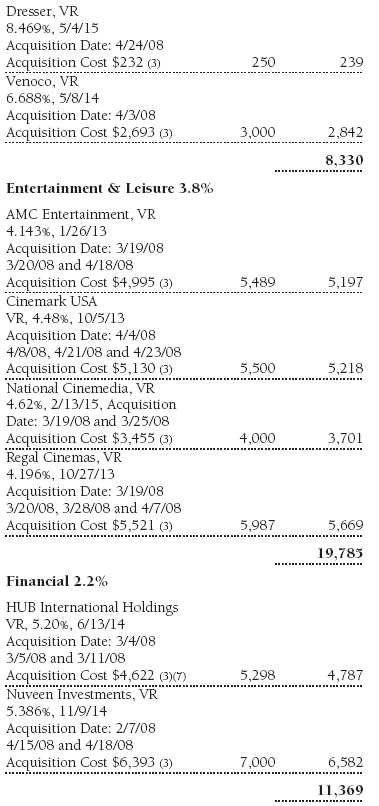
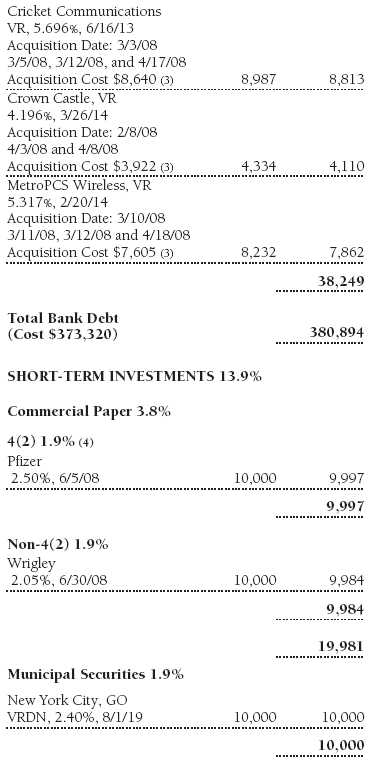
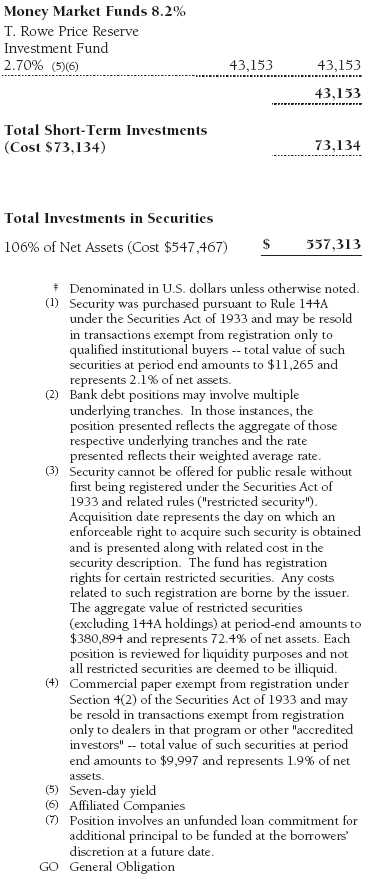
Portfolio of Investments ‡
T. Rowe Price Institutional Floating Rate Fund
May 31, 2008
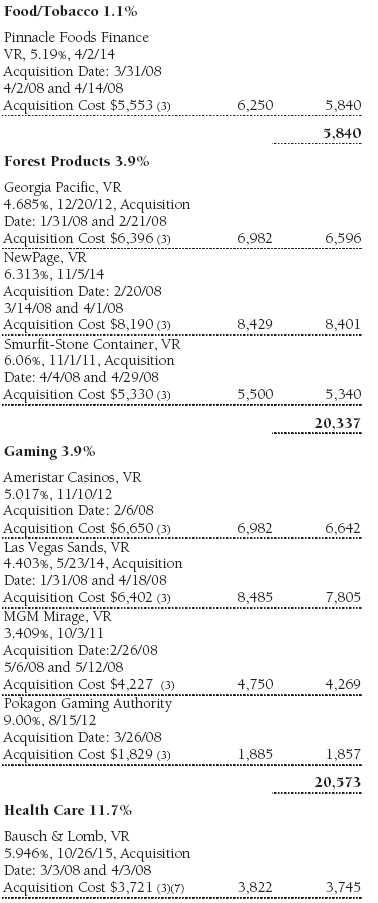
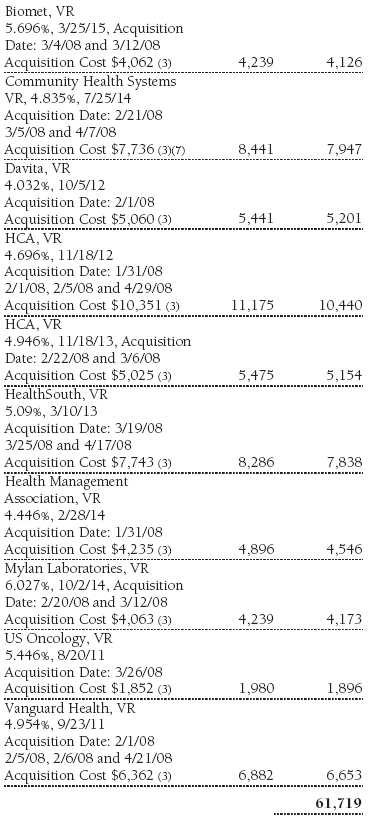
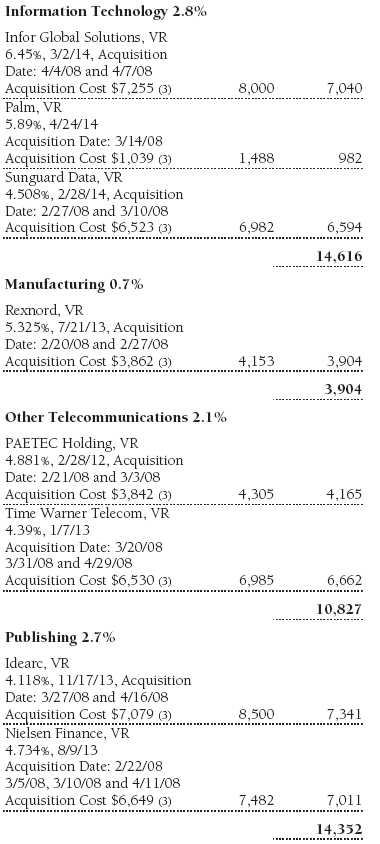
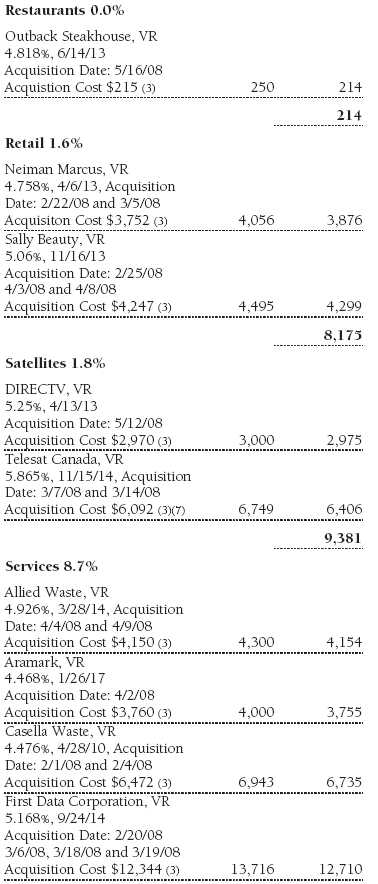

The accompanying notes are an integral part of these financial statements.
Statement of Assets and Liabilities
T. Rowe Price Institutional Floating Rate Fund
May 31, 2008
($000s, except shares and per share amounts)

The accompanying notes are an integral part of these financial statements.
Statement of Operations
T. Rowe Price Institutional Floating Rate Fund
($000s)

The accompanying notes are an integral part of these financial statements.
Statement of Changes in Net Assets
T. Rowe Price Institutional Floating Rate Fund
($000s)
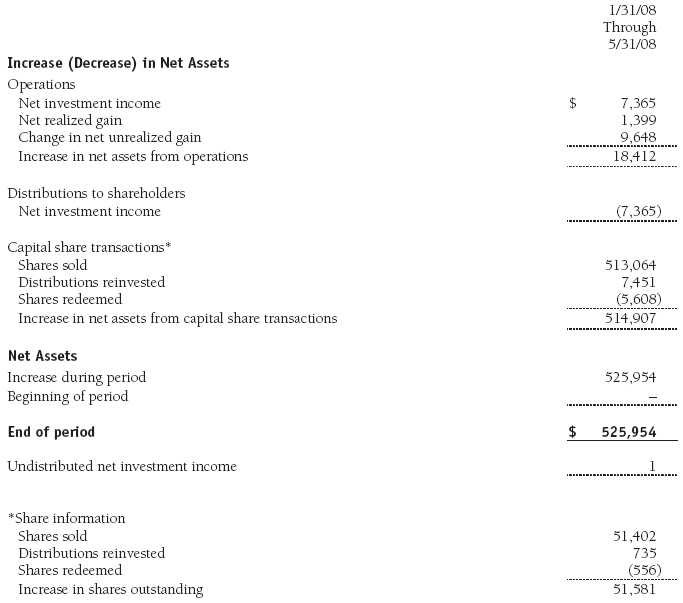
The accompanying notes are an integral part of these financial statements.
Notes to Financial Statements
T. Rowe Price Institutional Floating Rate Fund
May 31, 2008
T. Rowe Price Institutional Income Funds, Inc. (the corporation), is registered under the Investment Company Act of 1940 (the 1940 Act). The Institutional Floating Rate Fund (the fund), a diversified, open-end management investment company, is one portfolio established by the corporation. The fund commenced operations on January 31, 2008. The fund seeks high current income and, secondarily, capital appreciation.
NOTE 1 - SIGNIFICANT ACCOUNTING POLICIES
Basis of Preparation The accompanying financial statements were prepared in accordance with accounting principles generally accepted in the United States of America, which require the use of estimates made by fund management. Fund management believes that estimates and security valuations are appropriate; however, actual results may differ from those estimates, and the security valuations reflected in the financial statements may differ from the value the fund ultimately realizes upon sale of the securities.
Investment Transactions, Investment Income, and Distributions Income and expenses are recorded on the accrual basis. Premiums and discounts on debt securities are amortized for financial reporting purposes. Dividends received from mutual fund investments are reflected as dividend income; capital gain distributions are reflected as realized gain/loss. Dividend income and capital gain distributions are recorded on the ex-dividend date. Income tax-related interest and penalties, if incurred, would be recorded as income tax expense. Investment transactions are accounted for on the trade date. Realized gains and losses are reported on the identified cost basis. Distributions to shareholders are recorded on the ex-dividend date. Income distributions are declared on a daily basis and paid monthly. Capital gain distributions, if any, are declared and paid by the fund, typically on an annual basis.
Redemption Fees A 1% fee is assessed on redemptions of fund shares held for 90 days or less to deter short-term trading and to protect the interests of long-term shareholders. Redemption fees are withheld from proceeds that shareholders receive from the sale or exchange of fund shares. The fees are paid to the fund, and are recorded as an increase to paid-in capital. The fees may cause the redemption price per share to differ from the net asset value per share.
New Accounting Pronouncements The fund adopted Financial Accounting Standards Board (FASB) Interpretation No. 48 (FIN 48), Accounting for Uncertainty in Income Taxes, a clarification of FASB Statement No. 109, Accounting for Income Taxes. FIN 48 establishes financial accounting and disclosure requirements for recognition and measurement of tax positions taken or expected to be taken on an income tax return. The adoption of FIN 48 had no impact on the fund’s net assets or results of operations.
In September 2006, the Financial Accounting Standards Board (FASB) released Statement of Financial Accounting Standards No. 157 (FAS 157), Fair Value Measurements. FAS 157 defines fair value, establishes the framework for measuring fair value, and expands the disclosure of fair value measurements in the financial statements. It is effective for the fund’s fiscal year beginning June 1, 2008. Management expects adoption of FAS 157 will have no material impact on the fund’s net assets or results of operations.
In March 2008, the Financial Accounting Standards Board issued Statement of Financial Accounting Standards No. 161, Disclosures about Derivative Instruments and Hedging Activities (FAS 161), which is effective for fiscal years and interim periods beginning after November 15, 2008. FAS 161 requires enhanced disclosures about derivative and hedging activities, including how such activities are accounted for and their effect on financial position, performance and cash flows. Management is currently evaluating the impact the adoption of FAS 161 will have on the fund’s financial statements and related disclosures.
NOTE 2 - VALUATION
The fund values its investments and computes its net asset value per share at the close of the New York Stock Exchange (NYSE), normally 4 p.m. ET, each day that the NYSE is open for business.
Debt securities are generally traded in the over-the-counter (OTC) market. Securities with remaining maturities of one year or more at the time of acquisition are valued at prices furnished by dealers who make markets in such securities or by an independent pricing service, which considers the yield or price of bonds of comparable quality, coupon, maturity, and type, as well as prices quoted by dealers who make markets in such securities. Securities with remaining maturities of less than one year at the time of acquisition generally use amortized cost in local currency to approximate fair value. However, if amortized cost is deemed not to reflect fair value or the fund holds a significant amount of such securities with remaining maturities of more than 60 days, the securities are valued at prices furnished by dealers who make markets in such securities or by an independent pricing service.
Investments in mutual funds are valued at the mutual fund’s closing net asset value per share on the day of valuation.
Other investments, including restricted securities, and those for which the above valuation procedures are inappropriate or are deemed not to reflect fair value are stated at fair value as determined in good faith by the T. Rowe Price Valuation Committee, established by the fund’s Board of Directors.
NOTE 3 - INVESTMENT TRANSACTIONS
Consistent with its investment objective, the fund engages in the following practices to manage exposure to certain risks or to enhance performance. The investment objective, policies, program, and risk factors of the fund are described more fully in the fund’s prospectus and Statement of Additional Information.
Noninvestment-Grade Debt Securities At May 31, 2008, approximately 87% of the fund’s net assets were invested, directly or through its investment in T. Rowe Price institutional funds, in noninvestment-grade debt securities, commonly referred to as “high-yield” or “junk” bonds. A real or perceived economic downturn or higher interest rates could adversely affect the liquidity or value, or both, of such securities because such events could lessen the ability of issuers to make principal and interest payments.
Unfunded Loan Commitments The fund may enter into certain credit agreements that require additional principal to be funded by the borrowers’ discretion upon a later date (“unfunded commitments”). The fund reflects such agreements in the Portfolio of Investments upon funding and separately records any unrealized appreciation (depreciation) on that portion that remains unfunded. At May 31, 2008, the total principal amount and market value of all unfunded commitments, including those agreements that are fully unfunded, totaled $2,902,000 and $2,704,000, respectively.
Restricted Securities The fund may invest in securities that are subject to legal or contractual restrictions on resale. Prompt sale of such securities at an acceptable price may be difficult and may involve substantial delays and additional costs.
Other Purchases and sales of portfolio securities, other than short-term securities, aggregated $548,376,000 and $73,725,000, respectively, for the year ended May 31, 2008.
NOTE 4 - FEDERAL INCOME TAXES
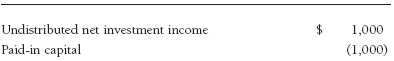
No provision for federal income taxes is required since the fund intends to continue to qualify as a regulated investment company under Subchapter M of the Internal Revenue Code and distribute to shareholders all of its taxable income and gains. Distributions are determined in accordance with Federal income tax regulations, which differ from generally accepted accounting principles, and, therefore, may differ significantly in amount or character from net investment income and realized gains for financial reporting purposes. Financial reporting records are adjusted for permanent book/tax differences to reflect tax character but are not adjusted for temporary differences.
Reclassifications to paid-in capital relate primarily to nondeductible organizational expenses. For the year ended May 31, 2008, the following reclassifications, which had no impact on results of operations or net assets, were recorded to reflect tax character:
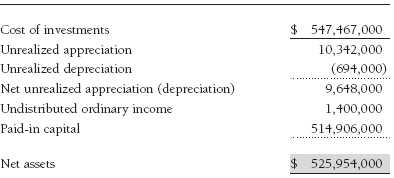
Distributions during the period ended May 31, 2008, totaled $7,365,000, and were characterized as ordinary income for tax purposes. At May 31, 2008, the tax-basis cost of investments and components of net assets were as follows:
NOTE 5 - RELATED PARTY TRANSACTIONS
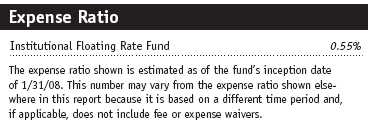
The fund is managed by T. Rowe Price Associates, Inc. (the manager or Price Associates), a wholly owned subsidiary of T. Rowe Price Group, Inc. The investment management and administrative agreement between the fund and the manager provides for an all-inclusive annual fee equal to 0.55% of the fund’s average daily net assets. The fee is computed daily and paid monthly. The agreement provides that investment management, shareholder servicing, transfer agency, accounting, custody services, and directors’ fees and expenses are provided to the fund, and interest, taxes, brokerage commissions, and extraordinary expenses are paid directly by the fund.
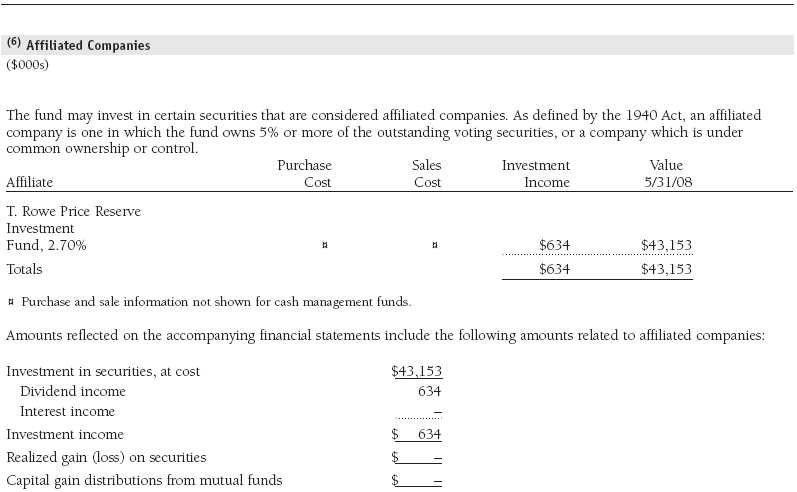
The fund may invest in the T. Rowe Price Reserve Investment Fund and the T. Rowe Price Government Reserve Investment Fund (collectively, the T. Rowe Price Reserve Investment Funds), open-end management investment companies managed by Price Associates and considered affiliates of the fund. The T. Rowe Price Reserve Investment Funds are offered as cash management options to mutual funds, trusts, and other accounts managed by Price Associates and/or its affiliates and are not available for direct purchase by members of the public. The T. Rowe Price Reserve Investment Funds pay no investment management fees.
Mutual funds and other accounts managed by T. Rowe Price and its affiliates (collectively, T. Rowe Price funds) may invest in the fund; however, no T. Rowe Price fund may invest for the purpose of exercising management or control over the fund. At May 31, 2008, approximately 99% of the fund’s outstanding shares were held by T. Rowe Price funds.
Report of Independent Registered Public Accounting Firm
To the Board of Directors of T. Rowe Price Institutional Income Funds, Inc. and
Shareholders of T. Rowe Price Institutional Floating Rate Fund
In our opinion, the accompanying statement of assets and liabilities, including the portfolio of investments, and the related statements of operations and of changes in net assets and the financial highlights present fairly, in all material respects, the financial position of T. Rowe Price Institutional Floating Rate Fund (one of the portfolios comprising T. Rowe Price Institutional Income Funds, Inc., hereafter referred to as the “Fund”) at May 31, 2008, the results of its operations, the changes in its net assets and the financial highlights for the period January 31, 2008 (commencement of operations), through May 31, 2008, in conformity with accounting principles generally accepted in the United States of America. These financial statements and financial highlights (hereafter referred to as “financial statements”) are the responsibility of the Fund’s management; our responsibility is to express an opinion on these financial statements based on our audits. We conducted our audit of these financial statements in accordance with the auditing standards of the Public Company Accounting Oversight Board (United States). Those standards require that we plan and perform the audit to obtain reasonable assurance about whether the financial statements are free of material misstatement. An audit includes examining, on a test basis, evidence supporting the amounts and disclosures in the financial statements, assessing the accounting principles used and significant estimates made by management, and evaluating the overall financial statement presentation. We believe that our audit, which included confirmation of securities at May 31, 2008, by correspondence with the custodian, brokers, and confirmation of the underlying fund by correspondence with the transfer agent, provides a reasonable basis for our opinion.
PricewaterhouseCoopers LLP
Baltimore, Maryland
July 11, 2008
| Information on Proxy Voting Policies, Procedures, and Records |
A description of the policies and procedures used by T. Rowe Price funds and portfolios to determine how to vote proxies relating to portfolio securities is available in each fund’s Statement of Additional Information, which you may request by calling 1-800-225-5132 or by accessing the SEC’s Web site, www.sec.gov. The description of our proxy voting policies and procedures is also available on our Web site, www.troweprice.com. To access it, click on the words “Company Info” at the top of our homepage for individual investors. Then, in the window that appears, click on the “Proxy Voting Policy” navigation button in the top left corner.
Each fund’s most recent annual proxy voting record is available on our Web site and through the SEC’s Web site. To access it through our Web site, follow the directions above, then click on the words “Proxy Voting Record” at the bottom of the Proxy Voting Policy page.
| How to Obtain Quarterly Portfolio Holdings |
The fund files a complete schedule of portfolio holdings with the Securities and Exchange Commission for the first and third quarters of each fiscal year on Form N-Q. The fund’s Form N-Q is available electronically on the SEC’s Web site (www.sec.gov); hard copies may be reviewed and copied at the SEC’s Public Reference Room, 450 Fifth St. N.W., Washington, DC 20549. For more information on the Public Reference Room, call 1-800-SEC-0330.
| About the Fund’s Directors and Officers |
Your fund is governed by a Board of Directors (Board) that meets regularly to review a wide variety of matters affecting the fund, including performance, investment programs, compliance matters, advisory fees and expenses, service providers, and other business affairs. The Board elects the fund’s officers, who are listed in the final table. At least 75% of Board members are independent of T. Rowe Price Associates, Inc. (T. Rowe Price), and T. Rowe Price International, Inc. (T. Rowe Price International); “inside” or “interested” directors are employees or officers of T. Rowe Price. The business address of each director and officer is 100 East Pratt Street, Baltimore, Maryland 21202. The Statement of Additional Information includes additional information about the fund directors and is available without charge by calling a T. Rowe Price representative at 1-800-225-5132.
| Independent Directors | |
| |
| Name (Year of Birth) | |
| Year Elected* | Principal Occupation(s) During Past Five Years and Directorships of Other Public Companies |
| |
| Jeremiah E. Casey (1940) | Director, National Life Insurance (2001 to 2005); Director, The Rouse Company, real estate developers |
| 2006 | (1990 to 2004) |
| |
| Anthony W. Deering (1945) | Chairman, Exeter Capital, LLC, a private investment firm (2004 to present); Director, Vornado Real Estate Investment |
| 2002 | Trust (3/04 to present); Director, Mercantile Bankshares (2002 to 2007); Member, Advisory Board, Deutsche Bank |
| | North America (2004 to present); Director, Chairman of the Board, and Chief Executive Officer, The Rouse Company, |
| | real estate developers (1997 to 2004) |
| |
| Donald W. Dick, Jr. (1943) | Principal, EuroCapital Advisors, LLC, an acquisition and management advisory firm (10/95 to present); Chairman, |
| 2002 | The Haven Group, a custom manufacturer of modular homes (1/04 to present) |
| |
| David K. Fagin (1938) | Chairman and President, Nye Corporation (6/88 to present); Chairman, Canyon Resources Corp. (8/07 to 3/08); |
| 2002 | Director, Golden Star Resources Ltd. (5/92 to present); Director, Pacific Rim Mining Corp. (2/02 to present); |
| | Director, B.C. Corporation (3/08 to present) |
| |
| Karen N. Horn (1943) | Director, Federal National Mortgage Association (9/06 to present); Director, Norfolk Southern (2/08 to present); |
| 2003 | Director, Eli Lilly and Company (1987 to present); Director, Simon Property Group (2004 to present); Managing |
| | Director and President, Global Private Client Services, Marsh Inc. (1999 to 2003); Director, Georgia Pacific |
| | (5/04 to 12/05) |
| |
| Theo C. Rodgers (1941) | President, A&R Development Corporation (1977 to present) |
| 2005 | |
| |
| John G. Schreiber (1946) | Owner/President, Centaur Capital Partners, Inc., a real estate investment company (1991 to present); Partner, |
| 2002 | Blackstone Real Estate Advisors, L.P. (10/92 to present) |
| |
| *Each independent director oversees 123 T. Rowe Price portfolios and serves until retirement, resignation, or election of a successor. |
| Inside Directors | |
| |
| Name (Year of Birth) | |
| Year Elected* [Number of | |
| T. Rowe Price Portfolios | |
| Overseen] | Principal Occupation(s) During Past Five Years and Directorships of Other Public Companies |
| |
| Edward C. Bernard (1956) | Director and Vice President, T. Rowe Price; Vice Chairman of the Board, Director, and Vice President, T. Rowe Price |
| 2006 [123] | Group, Inc.; Chairman of the Board, Director, and President, T. Rowe Price Investment Services, Inc.; Chairman of |
| | the Board and Director, T. Rowe Price Global Asset Management Limited, T. Rowe Price Global Investment Services |
| | Limited, T. Rowe Price Retirement Plan Services, Inc., T. Rowe Price Savings Bank, and T. Rowe Price Services, Inc.; |
| | Director, T. Rowe Price International, Inc.; Chief Executive Officer, Chairman of the Board, Director, and President, |
| | T. Rowe Price Trust Company; Chairman of the Board, all funds |
| |
| Mary J. Miller, CFA (1955) | Director, T. Rowe Price Trust Company; Director and Vice President, T. Rowe Price; Vice President, T. Rowe Price |
| 2004 [38] | Group, Inc.; President, Institutional Income Funds |
| |
| *Each inside director serves until retirement, resignation, or election of a successor. |
| Officers | |
| |
| Name (Year of Birth) | |
| Title and Fund(s) Served | Principal Occupation(s) |
| |
| David C. Beers, CFA (1970) | Vice President, T. Rowe Price; formerly High Yield Analyst, Chartwell |
| Assistant Vice President, Institutional Income Funds | Investment Partners and Business Analyst/Software Developer, Morgan |
| | Stanley Investment Management (to 2004) |
| |
| Brian J. Brennan, CFA (1964) | Vice President, T. Rowe Price, T. Rowe Price Group, Inc., and T. Rowe Price |
| Executive Vice President, Institutional Income Funds | Trust Company |
| |
| Andrew M. Brooks (1956) | Vice President, T. Rowe Price and T. Rowe Price Group, Inc. |
| Vice President, Institutional Income Funds | |
| |
| Michael J. Conelius, CFA (1964) | Vice President, T. Rowe Price, T. Rowe Price Group, Inc., and T. Rowe Price |
| Vice President, Institutional Income Funds | International, Inc. |
| |
| Roger L. Fiery III, CPA (1959) | Vice President, T. Rowe Price, T. Rowe Price Group, Inc., T. Rowe Price |
| Vice President, Institutional Income Funds | International, Inc., and T. Rowe Price Trust Company |
| |
| Justin T. Gerbereux, CFA (1975) | Vice President, T. Rowe Price and T. Rowe Price Group, Inc.; formerly |
| Assistant Vice President, Institutional Income Funds | student, Mary Washington College and Darden School of Business |
| | Administration, University of Virginia (to 2003) |
| |
| John R. Gilner (1961) | Chief Compliance Officer and Vice President, T. Rowe Price; Vice President, |
| Chief Compliance Officer, Institutional Income Funds | T. Rowe Price Group, Inc., and T. Rowe Price Investment Services, Inc. |
| |
| |
| Gregory S. Golczewski (1966) | Vice President, T. Rowe Price and T. Rowe Price Trust Company |
| Vice President, Institutional Income Funds | |
| |
| Gregory K. Hinkle, CPA (1958) | Vice President, T. Rowe Price and T. Rowe Price Group, Inc.; formerly |
| Treasurer, Institutional Income Funds | Partner, PricewaterhouseCoopers, LLP (to 2007) |
| Steven C. Huber, CFA (1958) | Vice President, T. Rowe Price Group, Inc. |
| Vice President, Institutional Income Funds | |
| |
| Paul A. Karpers, CFA (1967) | Vice President, T. Rowe Price and T. Rowe Price Group, Inc. |
| Executive Vice President, Institutional Income Funds | |
| |
| Ian D. Kelson (1956) | Vice President, T. Rowe Price, T. Rowe Price Group, Inc., and T. Rowe Price |
| Vice President, Institutional Income Funds | International, Inc. |
| |
| Patricia B. Lippert (1953) | Assistant Vice President, T. Rowe Price and T. Rowe Price Investment |
| Secretary, Institutional Income Funds | Services, Inc. |
| |
| Paul M. Massaro, CFA (1975) | Vice President, T. Rowe Price and T. Rowe Price Group, Inc.; formerly stu- |
| Assistant Vice President, Institutional Income Funds | dent, The Wharton Business School, University of Pennsylvania (to 2003) |
| |
| Andrew McCormick (1960) | Vice President, T. Rowe Price and T. Rowe Price Group, Inc.; formerly |
| Vice President, Institutional Income Funds | Chief Investment Officer, IMPAC Mortgage Holdings (to 2006); Senior |
| | Portfolio Manager, Avenue Capital Group, and Senior Vice President, |
| | Portfolio Transactions, Federal National Mortgage Association (to 2005) |
| |
| Michael J. McGonigle (1966) | Vice President, T. Rowe Price and T. Rowe Price Group, Inc. |
| Vice President, Institutional Income Funds | |
| |
| David Oestreicher (1967) | Director and Vice President, T. Rowe Price Investment Services, Inc., |
| Vice President, Institutional Income Funds | and T. Rowe Price Trust Company; Vice President, T. Rowe Price, T. Rowe |
| | Price Global Asset Management Limited, T. Rowe Price Global Investment |
| | Services Limited, T. Rowe Price Group, Inc., and T. Rowe Price |
| | International, Inc. |
| |
| Brian A. Rubin, CPA (1974) | Vice President, T. Rowe Price and T. Rowe Price Trust Company |
| Assistant Vice President, Institutional Income Funds | |
| |
| Daniel O. Shackelford, CFA (1958) | Vice President, T. Rowe Price, T. Rowe Price Group, Inc., and T. Rowe Price |
| Vice President, Institutional Income Funds | Trust Company |
| |
| Walter P. Stuart III, CFA (1960) | Vice President, T. Rowe Price and T. Rowe Price Group, Inc. |
| Vice President, Institutional Income Funds | |
| |
| Thomas E. Tewksbury (1961) | Vice President, T. Rowe Price, T. Rowe Price Group, Inc., and T. Rowe Price |
| Vice President, Institutional Income Funds | Trust Company |
| |
| David A. Tiberii, CFA (1965) | Vice President, T. Rowe Price and T. Rowe Price Group, Inc. |
| Vice President, Institutional Income Funds | |
| |
| Mark J. Vaselkiv (1958) | Vice President, T. Rowe Price and T. Rowe Price Group, Inc. |
| Vice President, Institutional Income Funds | |
| |
| Julie L. Waples (1970) | Vice President, T. Rowe Price |
| Vice President, Institutional Income Funds | |
| |
| Thea N. Williams (1961) | Vice President, T. Rowe Price, T. Rowe Price Group, Inc., and T. Rowe Price |
| Vice President, Institutional Income Funds | Trust Company |
| |
| Unless otherwise noted, officers have been employees of T. Rowe Price or T. Rowe Price International for at least five years. |
Item 2. Code of Ethics.
The registrant has adopted a code of ethics, as defined in Item 2 of Form N-CSR, applicable to its principal executive officer, principal financial officer, principal accounting officer or controller, or persons performing similar functions. A copy of this code of ethics is filed as an exhibit to this Form N-CSR. No substantive amendments were approved or waivers were granted to this code of ethics during the period covered by this report.
Item 3. Audit Committee Financial Expert.
The registrant’s Board of Directors/Trustees has determined that Ms. Karen N. Horn qualifies as an audit committee financial expert, as defined in Item 3 of Form N-CSR. Ms. Horn is considered independent for purposes of Item 3 of Form N-CSR.
Item 4. Principal Accountant Fees and Services.
(a) – (d) Aggregate fees billed to the registrant for the last two fiscal years for professional services rendered by the registrant’s principal accountant were as follows:
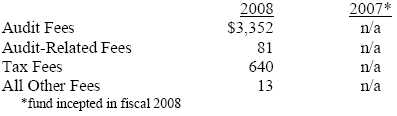
Audit fees include amounts related to the audit of the registrant’s annual financial statements and services normally provided by the accountant in connection with statutory and regulatory filings. Audit-related fees include amounts reasonably related to the performance of the audit of the registrant’s financial statements and specifically include the issuance of a report on internal controls and, if applicable, agreed-upon procedures related to fund acquisitions. Tax fees include amounts related to services for tax compliance, tax planning, and tax advice. The nature of these services specifically includes the review of distribution calculations and the preparation of Federal, state, and excise tax returns. All other fees include the registrant’s pro-rata share of amounts for agreed-upon procedures in conjunction with service contract approvals by the registrant’s Board of Directors/Trustees.
(e)(1) The registrant’s audit committee has adopted a policy whereby audit and non-audit services performed by the registrant’s principal accountant for the registrant, its investment adviser, and any entity controlling, controlled by, or under common control with the investment adviser that provides ongoing services to the registrant require pre-approval in advance at regularly scheduled audit committee meetings. If such a service is required between regularly scheduled audit committee meetings, pre-approval may be authorized by one audit committee member with ratification at the next scheduled audit committee meeting. Waiver of pre-approval for audit or non-audit services requiring fees of a de minimis amount is not permitted.
(2) No services included in (b) – (d) above were approved pursuant to paragraph (c)(7)(i)(C) of Rule 2-01 of Regulation S-X.
(f) Less than 50 percent of the hours expended on the principal accountant’s engagement to audit the registrant’s financial statements for the most recent fiscal year were attributed to work performed by persons other than the principal accountant’s full-time, permanent employees.
(g) The aggregate fees billed for the most recent fiscal year and the preceding fiscal year by the registrant’s principal accountant for non-audit services rendered to the registrant, its investment adviser, and any entity controlling, controlled by, or under common control with the investment adviser that provides ongoing services to the registrant were $1,529,000 and $1,201,000, respectively, and were less than the aggregate fees billed for those same periods by the registrant’s principal accountant for audit services rendered to the T. Rowe Price Funds.
(h) All non-audit services rendered in (g) above were pre-approved by the registrant’s audit committee. Accordingly, these services were considered by the registrant’s audit committee in maintaining the principal accountant’s independence.
Item 5. Audit Committee of Listed Registrants.
Not applicable.
Item 6. Investments.
(a) Not applicable. The complete schedule of investments is included in Item 1 of this Form N-CSR.
(b) Not applicable.
Item 7. Disclosure of Proxy Voting Policies and Procedures for Closed-End Management Investment Companies.
Not applicable.
Item 8. Portfolio Managers of Closed-End Management Investment Companies.
Not applicable.
Item 9. Purchases of Equity Securities by Closed-End Management Investment Company and Affiliated Purchasers.
Not applicable.
Item 10. Submission of Matters to a Vote of Security Holders.
Not applicable.
Item 11. Controls and Procedures.
(a) The registrant’s principal executive officer and principal financial officer have evaluated the registrant’s disclosure controls and procedures within 90 days of this filing and have concluded that the registrant’s disclosure controls and procedures were effective, as of that date, in ensuring that information required to be disclosed by the registrant in this Form N-CSR was recorded, processed, summarized, and reported timely.
(b) The registrant’s principal executive officer and principal financial officer are aware of no change in the registrant’s internal control over financial reporting that occurred during the registrant’s second fiscal quarter covered by this report that has materially affected, or is reasonably likely to materially affect, the registrant’s internal control over financial reporting.
Item 12. Exhibits.
(a)(1) The registrant’s code of ethics pursuant to Item 2 of Form N-CSR is attached.
(2) Separate certifications by the registrant's principal executive officer and principal financial officer, pursuant to Section 302 of the Sarbanes-Oxley Act of 2002 and required by Rule 30a-2(a) under the Investment Company Act of 1940, are attached.
(3) Written solicitation to repurchase securities issued by closed-end companies: not applicable.
(b) A certification by the registrant's principal executive officer and principal financial officer, pursuant to Section 906 of the Sarbanes-Oxley Act of 2002 and required by Rule 30a-2(b) under the Investment Company Act of 1940, is attached.
| | |
SIGNATURES |
| |
| | Pursuant to the requirements of the Securities Exchange Act of 1934 and the Investment |
| Company Act of 1940, the registrant has duly caused this report to be signed on its behalf by the |
| undersigned, thereunto duly authorized. |
| |
| T. Rowe Price Institutional Income Funds, Inc. |
| |
| |
| By | /s/ Edward C. Bernard |
| | Edward C. Bernard |
| | Principal Executive Officer |
| |
| Date | July 22, 2008 |
| |
| |
| |
| | Pursuant to the requirements of the Securities Exchange Act of 1934 and the Investment |
| Company Act of 1940, this report has been signed below by the following persons on behalf of |
| the registrant and in the capacities and on the dates indicated. |
| |
| |
| By | /s/ Edward C. Bernard |
| | Edward C. Bernard |
| | Principal Executive Officer |
| |
| Date | July 22, 2008 |
| |
| |
| |
| By | /s/ Gregory K. Hinkle |
| | Gregory K. Hinkle |
| | Principal Financial Officer |
| |
| Date | July 22, 2008 |