| UNITED STATES |
| SECURITIES AND EXCHANGE COMMISSION |
| Washington, D.C. 20549 |
| |
FORM N-CSR |
| |
CERTIFIED SHAREHOLDER REPORT OF REGISTERED |
MANAGEMENT INVESTMENT COMPANIES |
| |
| |
| |
| Investment Company Act File Number: 811-21055 |
|
| |
| T. Rowe Price Institutional Income Funds, Inc. |
|
| (Exact name of registrant as specified in charter) |
| |
| 100 East Pratt Street, Baltimore, MD 21202 |
|
| (Address of principal executive offices) |
| |
| David Oestreicher |
| 100 East Pratt Street, Baltimore, MD 21202 |
|
| (Name and address of agent for service) |
| |
| |
| Registrant’s telephone number, including area code: (410) 345-2000 |
| |
| |
| Date of fiscal year end: May 31 |
| |
| |
| Date of reporting period: May 31, 2009 |
Item 1: Report to Shareholders| Institutional Floating Rate Fund | May 31, 2009 |
• The leveraged loan market generated excellent results for the last six months but posted losses for the full year.
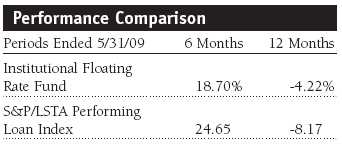
• The Institutional Floating Rate Fund outperformed the S&P/LSTA Performing Loan Index for the 12-month period ended May 31, 2009, but lagged the index during the second-half rally.
• We are pleased to report a dramatic turnaround across the entire bank loan market. Many of our favored sectors and several of our largest positions have rallied in recent months.
• We are confident that the loan market can continue to generate gains over the remainder of the calendar year.
The views and opinions in this report were current as of May 31, 2009. They are not guarantees of performance or investment results and should not be taken as investment advice. Investment decisions reflect a variety of factors, and the managers reserve the right to change their views about individual stocks, sectors, and the markets at any time. As a result, the views expressed should not be relied upon as a forecast of the fund’s future investment intent. The report is certified under the Sarbanes-Oxley Act, which requires mutual funds and other public companies to affirm that, to the best of their knowledge, the information in their financial reports is fairly and accurately stated in all material respects.
Manager’s Letter
T. Rowe Price Institutional Floating Rate Fund
Dear Investor
The environment for bank loans turned decidedly better in the second half of our fiscal year. Institutional forced selling of collateralized loan obligations caused weak performance for the asset class in the first half; however, bank debt rallied late in the reporting period as the credit markets improved and new money came into the asset class. Nevertheless, we are disappointed to report a loss for the 12-month period.
Investment Tenets
Most of the loans in which the fund invests have below investment-grade credit ratings, and some are not rated by a major credit rating agency. These bank loans are called “levered” or “leveraged” loans because the borrowing company often has significantly more debt than equity. However, the Institutional Floating Rate Fund invests in these loans on an unleveraged basis. Normally, the fund will invest the majority of its assets in senior secured floating-rate loans. In the event of a bankruptcy, holders of senior loans should have priority in recovering principal over the company’s subordinated creditors and shareholders. The fund also has the flexibility to invest a small portion of its assets in fixed- or floating-rate unsecured bonds.
Market Environment
The U.S. economy experienced one of its sharpest downturns on record during our fiscal year. We’ve seen the worst consecutive quarters of economic performance since the late 1950s—gross domestic product contracted at an annualized rate of 6.3% in the fourth quarter of 2008 and 5.5% in the first quarter of 2009, according to the latest estimates. As businesses closed or scaled back, the unemployment rate shot upward, from 7.2% in December to 9.4% in May, and most experts anticipated that it would continue to rise. The depth of the contraction led many to argue that the economy was in the midst of the worst recession since World War II.
Despite the negative economic backdrop, there have been several positive developments for the loan market. After last year’s horrendous sell-off, investors started coming back to our market, sensing attractive valuations in the asset class. Simultaneously, there was only a limited amount of new issuance. The subsequent supply and demand imbalance caused loan prices to move significantly higher. In the final few months of our reporting period, several companies were able to issue new loans. We were generally encouraged by the quality of the new supply, which typically contained Libor floors, which means the loan always maintains a minimum yield above the Libor rate, and strong covenants. We believe this trend can continue as companies repair their balance sheets by rolling over maturing debt and recapitalizing their balance sheets.
Portfolio Performance
The portfolio returned 18.70% in the six-month period and -4.22% for the year ended May 31, 2009. Despite strong results in the leveraged loan markets over the last six months, it was not enough to overcome the losses in the first half. Your fund performed better than the S&P/LSTA Performing Loan Index during the sell-off, but it failed to rally as much as the index when the market recovered. However, the outcome was consistent with our core tenet of outperforming throughout a credit cycle.
The fund’s underperformance in the last six months was attributable to several factors. First, our portfolio is more conservatively structured than the index. Much of the index is made up of loans originated in 2006 and 2007, a time when many leveraged buyouts were being financed. These loans were often highly leveraged and had few covenants, often called “covenant-lite” loans. The recent rally has been broad-based due to its technical nature, and therefore has not discerned between good or bad companies. We have remained defensively postured throughout the entire year, which helped our comparison with the index during the one-year period.
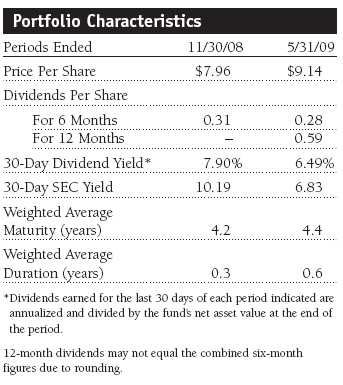
As shown in the Portfolio Characteristics table, the portfolio’s share price gained $1.18 in the past six months, and dividend income added $0.28, slightly less than the $0.31 earned in the prior period. Since our holdings are largely floating rate and reset every 90 days, falling interest rates have caused the portfolio’s dividend and SEC yields to decline over the past six months.
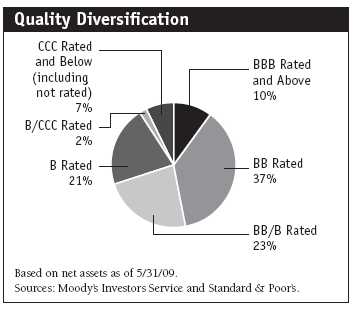
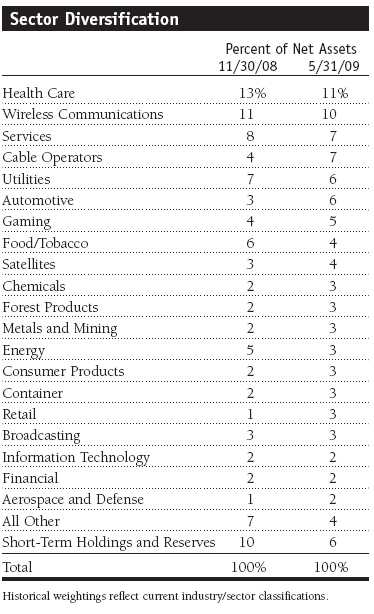
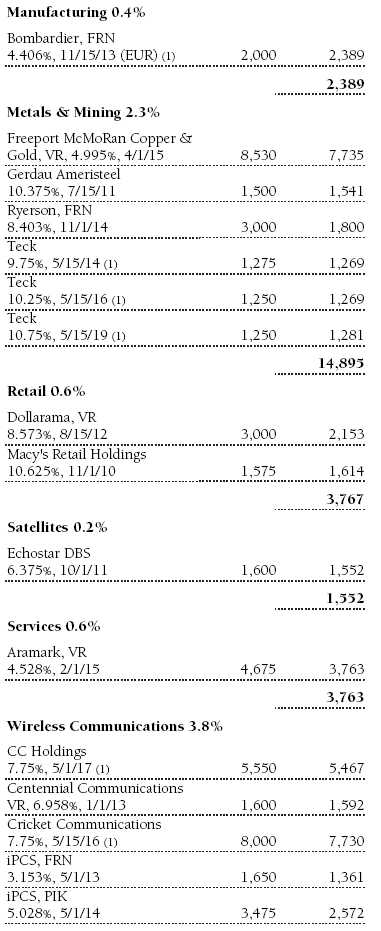
We remain focused on asset-rich companies that are generally in less-cyclical sectors such as health care, wireless communications, and utilities. We also prefer to own companies with tangible valuations. It is important for us to be able to assess the value of a company’s assets with a high degree of certainty in order to understand our downside protection. Finally, we continue to favor shorter-maturity loans—those due in 2011 and 2012—and have avoided many of the weaker loans sold in 2006 and 2007. Although this positioning aided our full-year comparison, it hurt our relative results in the past six months. Despite the market’s rally, we intend to remain defensively postured from an industry and a quality standpoint. Finally, at the end of the reporting period, our average credit was rated BB-, and the portfolio’s average maturity was 4.4 years.
Portfolio Review
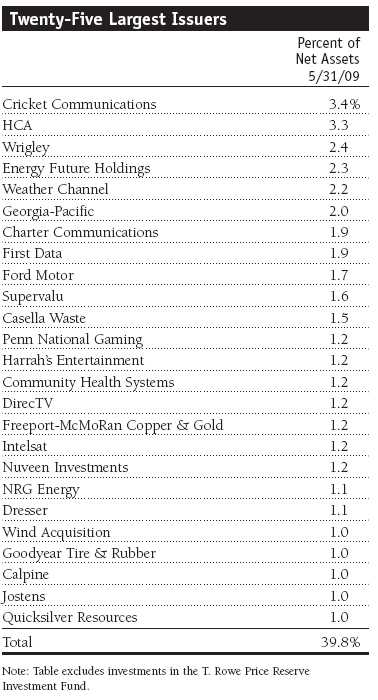
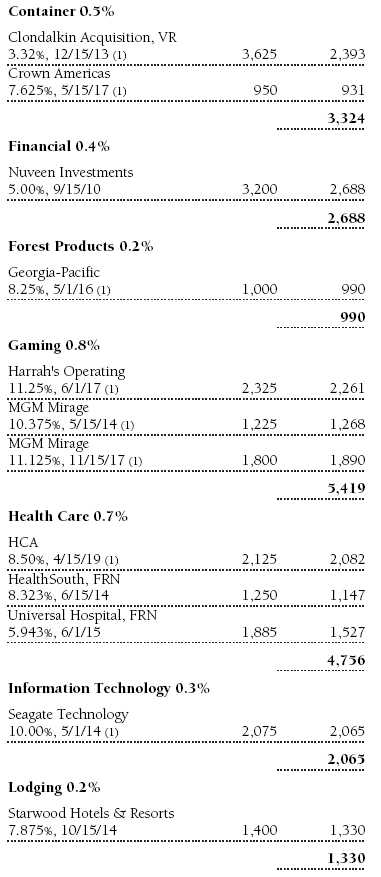
The portfolio is almost entirely invested in securities rated B and higher (90% of total net assets). We are focused on owning solid companies that generate current income, offer capital appreciation potential, and have sufficient asset protection to ensure a full recovery of principal in the event of a default. As shown in the table on page 6, our largest sector allocations are health care and wireless communications. One of the current keys to buying loans is their attractive dollar prices, especially when compared with historical levels. During the period, almost all of our purchases were made in loans that were trading well below par value.
Although we are focused on defensive sectors, we have recently started adding a little more risk to the portfolio, buying securities that we perceive as undervalued and should perform well even in the event of a bankruptcy restructuring. We are willing to buy distressed securities, on a case-by-case basis, if our rigorous analysis shows there is substantial upside. We’ve continued adding to our holdings in term Loan A securities that are trading below par. These securities allow us to capture a portion of the discount before the loan’s maturity—a portion (5% to 20%) of the investment is repaid, typically every three months, at par. We also look for loans with Libor floors because we like the enhanced dividend. Another theme that we are pursuing and have tried to exploit is the increased issuance of senior secured bonds to retire loans at par. We think that the 2011 and 2012 vintage loans are prime candidates and can benefit from this recapitalization trend.
Notable Contributors and Detractors
One of our best contributors in the last six months was the General Motors secured loan. We purchased GM in mid-May at approximately 68% of par value, even though the company was set to file for bankruptcy on June 1. Our research team discovered that in order for the government to enact its reorganization plan of separating the company, GM would most likely have to pay off the bank debt at par. As it turns out, the secured bank debt we own will be paid off at par in mid-July when the debtor-in-possession (DIP) financing comes into place. Shortly after the government stepped in, the bank debt surged more than 40%, to 96% of par. It is a prime example of opportunistically purchasing a security, even though it was likely to default. (Please refer to the portfolio of investments for a complete listing of holdings and the amount each represents in the portfolio.)
Another large position that has performed exceptionally well is Wind Acquisition, which highlights the benefit of our collaboration with our high-yield research analysts. Both strategies own the parts of the Italian telecom provider’s capital structure. Wind is the third-largest Italian wireless company, with approximately 13 million customers and a state-of-the-art network. The company has been executing its business strategy very well and has paid down about two billion euros of its debt over the past two years. The company has a sizable loan maturity coming up in 2011, which we think is attractive on a relative value basis because the company generates good cash flow and is not overly leveraged.
We are also willing to overweight portfolio holdings that we believe will retire their bank debt with high-yield bonds. One prominent example is HCA, the largest for-profit hospital company in America, which has about $13 billion of bank debt maturing in 2013. It has started aggressively working that down and recently issued over $1 billion of secured high-yield bonds. At the time of the offering, the loans were trading at about 88% of par value, so we captured about 12 points of appreciation on a portion of the bank debt we owned.
We also added some of the new issue HCA high-yield bonds because they are at the same priority level within the capital structure as the bank debt. However, the new bonds come with a much better coupon than our bank debt—HCA’s new bonds have an 8.5% coupon versus the bank debt yielding about 3.2% (Libor plus 2.5%). HCA is the portfolio’s second-largest position. We have owned the company since the fund’s inception, but we significantly increased our allocation earlier this year in anticipation of this trend.
In our effort to add more yield to the portfolio, we purchased senior secured high-yield bonds issued by Teck Resources, a Canadian resources conglomerate with operations in mining. The company’s bonds are senior secured, much like bank debt, and generate an excellent coupon—10.25% for the eight-year bonds and 9.75% for the seven-year bonds. They were also priced at a discount to par and have subsequently traded up a few points. Although these securities were issued in the high-yield market, we would contend that they are very similar to loans because they are at the top of the capital structure, secured, and have strong covenants. Further upside can be generated if the company is able to attain an investment-grade rating. While we have been willing to add incremental yield at the margin, the portfolio is still over 80% invested in bank debt. We remain steadfast to our core investment tenets, holding the debt of good companies in defensive industries that have lower leverage and trade at a discount.
For the most part, the portfolio’s largest relative performance detractors were the loans that we did not own. We were significantly underweight in retail, which looked like it would continue to languish in the recession. Many retailers had loans priced at 30% or 40% of par, but they have rallied significantly in recent months. Although we benefited from not owning them last year, our underweight hurt our relative results in the last six months. Fundamentally, it was an area that we decided to avoid because consumers are strapped, unemployment is rising, and people are spending less and saving more. Additionally, most retailing companies are highly leveraged and, historically, there have been low recovery rates after a default.
Our largest detractor among the securities we owned was MGM Mirage. We sold our MGM loans earlier this year because we thought the company was going to have trouble refinancing its balance sheet. The fundamentals of the company were extremely poor. Casinos in Las Vegas were suffering from overcapacity, and the recession had hurt the convention business. We sold the covenant-lite loans because we thought that MGM might file for bankruptcy. Subsequently, the company was able to do a bond deal and issue equity, which, at the time, seemed highly unlikely. It hasn’t totally fixed itself, but it was able to extend its runway for a couple of years, and that fueled good performance in the loans.
Outlook
We are confident that the loan market can continue to generate gains over the remainder of the calendar year. However, trading is likely to remain volatile because it appears that the market’s advance could be a bit ahead of its fundamentals. However, we have seen significant balance sheet repair and new issuance coming back to the loan market. These are encouraging signs after such a tough back half in 2008. It is highly unlikely that we can repeat the same magnitude of gains that we posted in the past six months. Although corporate earnings are likely to remain weak for a while, the probability of bankruptcy filings for many of our companies has dropped appreciably.
Thank you for investing with T. Rowe Price.
Respectfully submitted,

Justin T. Gerbereux
Cochairman of the fund’s Investment Advisory Committee

Paul M. Massaro
Cochairman of the fund’s Investment Advisory Committee
June 10, 2009
The committee chairmen have day-to-day responsibility for managing the portfolio and work with committee members in developing and executing the fund’s investment program.
| Risks of Investing in Floating-Rate Loan Funds |
Floating-rate loans are subject to credit risk, the chance that any fund holding could have its credit rating downgraded or that an issuer will default (fail to make timely payments of interest or principal), and liquidity risk, the chance that the fund may not be able to sell loans or securities at desired prices, potentially reducing the fund’s income level and share price. Like bond funds, this fund is exposed to interest rate risk, but credit and liquidity risks may often be more important.
The loans in which the fund invests are often referred to as “leveraged loans” because the borrowing companies have significantly more debt than equity. In many cases leveraged loans are issued in connection with recapitalizations, acquisitions, leveraged buyouts, and refinancings. Companies issuing leveraged loans typically have a below investment-grade credit rating or may not be rated by a major credit rating agency. Leveraged loan funds could have greater price declines than funds that invest primarily in high-quality bonds, so the securities are usually considered speculative investments.
30-day dividend yield: Dividends earned for the last 30 days of the period indicated are annualized and divided by the fund’s net asset value at the end of the period.
30-day SEC yield: A method of calculating a fund’s yield that assumes all portfolio securities are held until maturity. The Securities and Exchange Commission (SEC) requires all bond funds to calculate this yield. Yield will vary and is not guaranteed.
Duration: A measure of a bond or bond fund’s sensitivity to changes in interest rates. For example, a fund with a one-year duration would fall about 1% in response to a one-percentage-point rise in interest rates, and vice versa.
Federal funds rate: The interest rate charged on overnight loans of reserves by one financial institution to another in the United States. The Federal Reserve sets a target federal funds rate to affect the direction of interest rates.
London Interbank Offered Rate (Libor): The interest rate at which banks loan money to each other in the London wholesale market, which is also known as the interbank market.
S&P/LSTA Performing Loan Index: A benchmark that tracks the performance of the leveraged-loan market.
Weighted average maturity: The weighted average of the stated maturity dates of the portfolio’s securities. In general, the longer the average maturity, the greater the fund’s sensitivity to interest rate changes. A shorter average maturity usually means less interest rate sensitivity and therefore a less volatile portfolio.
Portfolio Highlights
Performance and Expenses
T. Rowe Price Institutional Floating Rate Fund
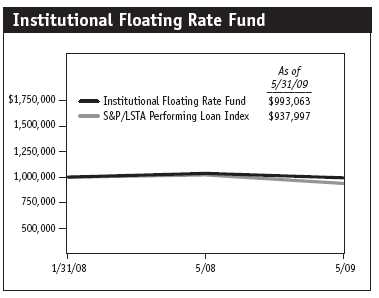
This chart shows the value of a hypothetical $1 million investment in the fund over the past 10 fiscal year periods or since inception (for funds lacking 10-year records). The result is compared with benchmarks, which may include a broad-based market index and a peer group average or index. Market indexes do not include expenses, which are deducted from fund returns as well as mutual fund averages and indexes.
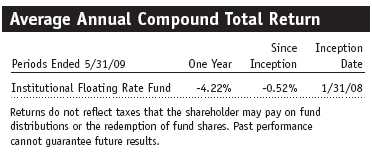
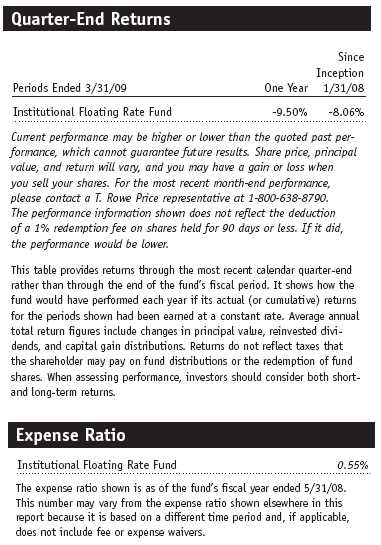
This table shows how the fund would have performed each year if its actual (or cumulative) returns for the periods shown had been earned at a constant rate.
Fund Expense Example
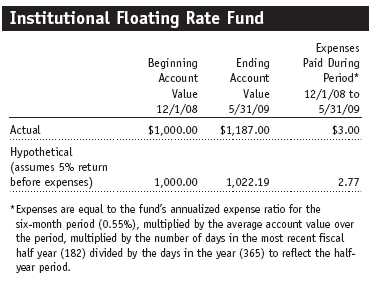
As a mutual fund shareholder, you may incur two types of costs: (1) transaction costs, such as redemption fees or sales loads, and (2) ongoing costs, including management fees, distribution and service (12b-1) fees, and other fund expenses. The following example is intended to help you understand your ongoing costs (in dollars) of investing in the fund and to compare these costs with the ongoing costs of investing in other mutual funds. The example is based on an investment of $1,000 invested at the beginning of the most recent six-month period and held for the entire period.
Actual Expenses
The first line of the following table (“Actual”) provides information about actual account values and actual expenses. You may use the information in this line, together with your account balance, to estimate the expenses that you paid over the period. Simply divide your account value by $1,000 (for example, an $8,600 account value divided by $1,000 = 8.6), then multiply the result by the number in the first line under the heading “Expenses Paid During Period” to estimate the expenses you paid on your account during this period.
Hypothetical Example for Comparison Purposes
The information on the second line of the table (“Hypothetical”) is based on hypothetical account values and expenses derived from the fund’s actual expense ratio and an assumed 5% per year rate of return before expenses (not the fund’s actual return). You may compare the ongoing costs of investing in the fund with other funds by contrasting this 5% hypothetical example and the 5% hypothetical examples that appear in the shareholder reports of the other funds. The hypothetical account values and expenses may not be used to estimate the actual ending account balance or expenses you paid for the period.
You should also be aware that the expenses shown in the table highlight only your ongoing costs and do not reflect any transaction costs, such as redemption fees or sales loads. Therefore, the second line of the table is useful in comparing ongoing costs only and will not help you determine the relative total costs of owning different funds. To the extent a fund charges transaction costs, however, the total cost of owning that fund is higher.
Financial Highlights
T. Rowe Price Institutional Floating Rate Fund
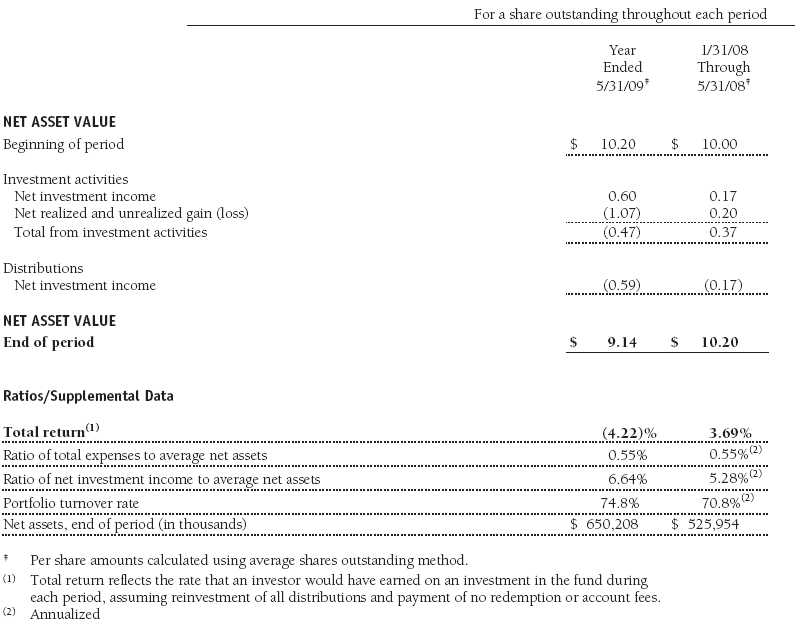
The accompanying notes are an integral part of these financial statements.
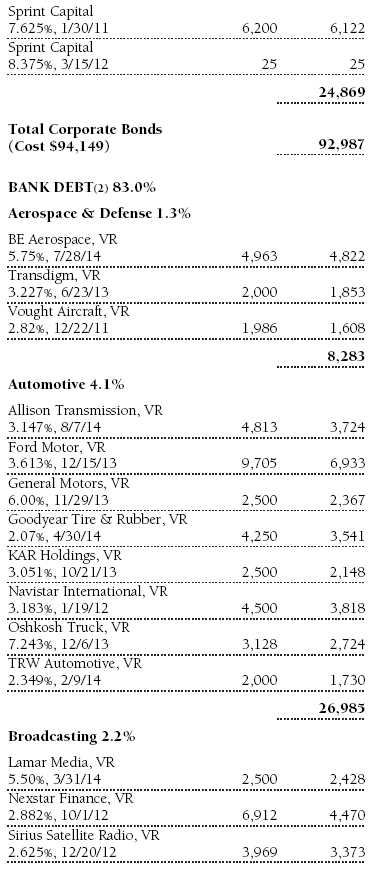
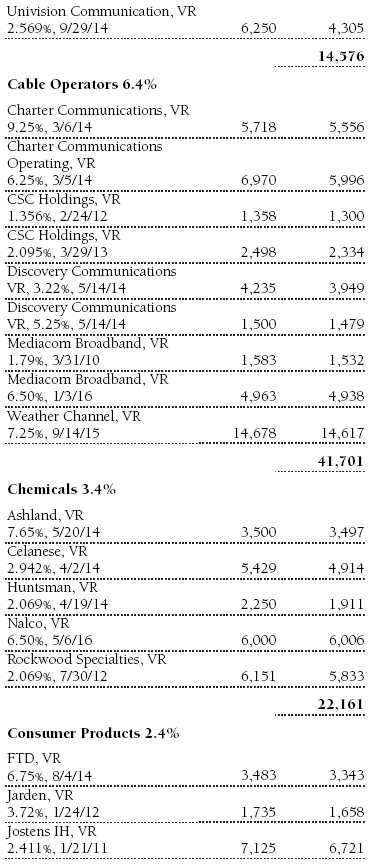
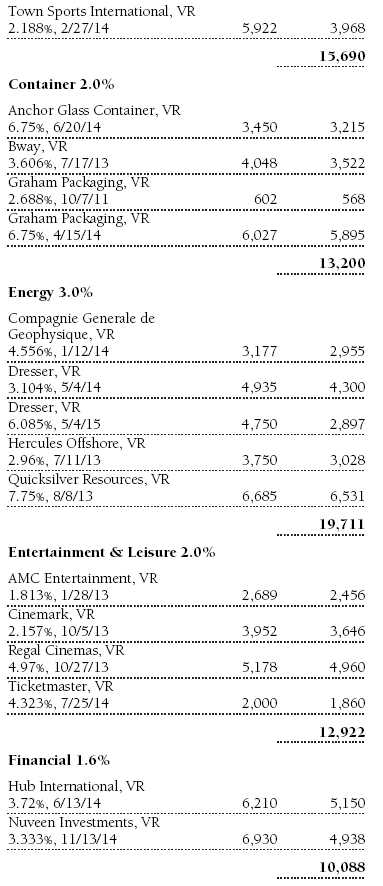
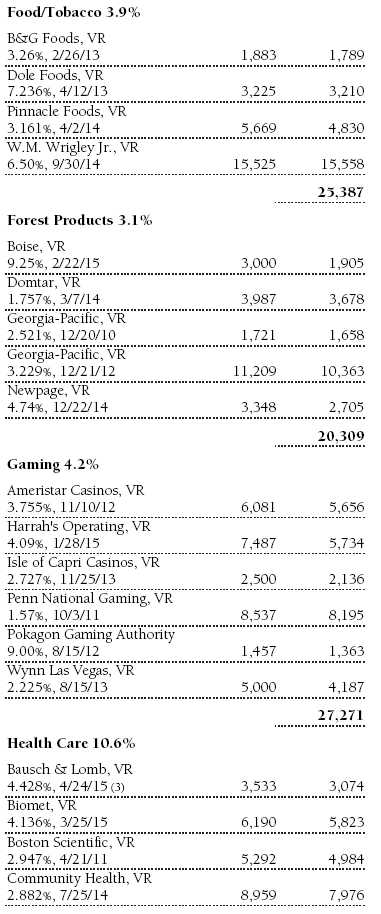
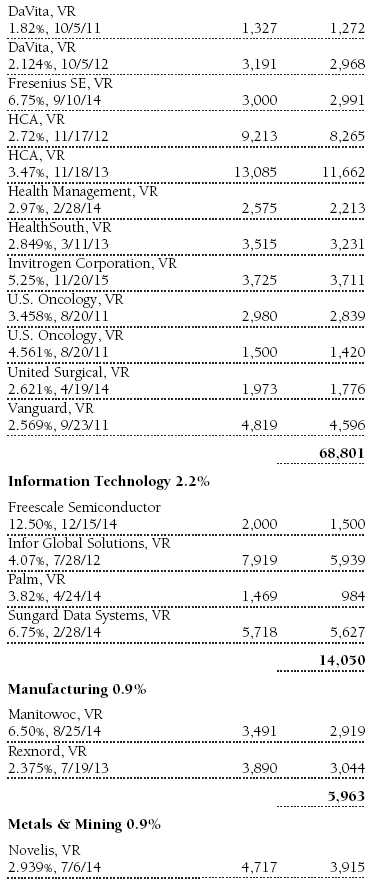
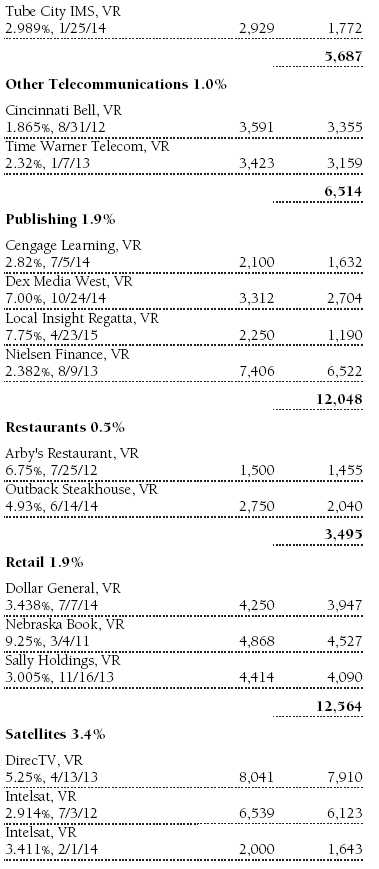
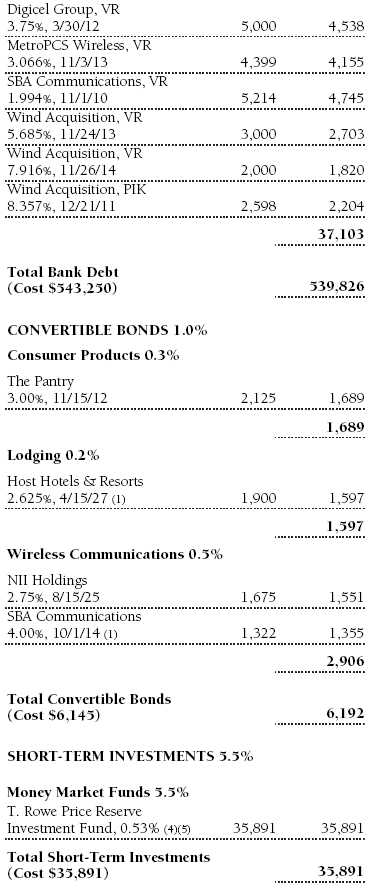
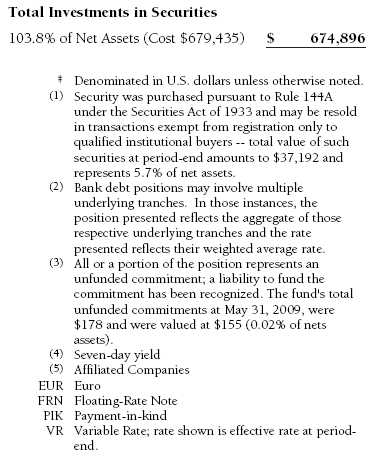
Portfolio of Investments ‡
T. Rowe Price Institutional Floating Rate Fund
May 31, 2009


The accompanying notes are an integral part of these financial statements.
Statement of Assets and Liabilities
T. Rowe Price Institutional Floating Rate Fund
May 31, 2009
($000s except shares and per share amounts)
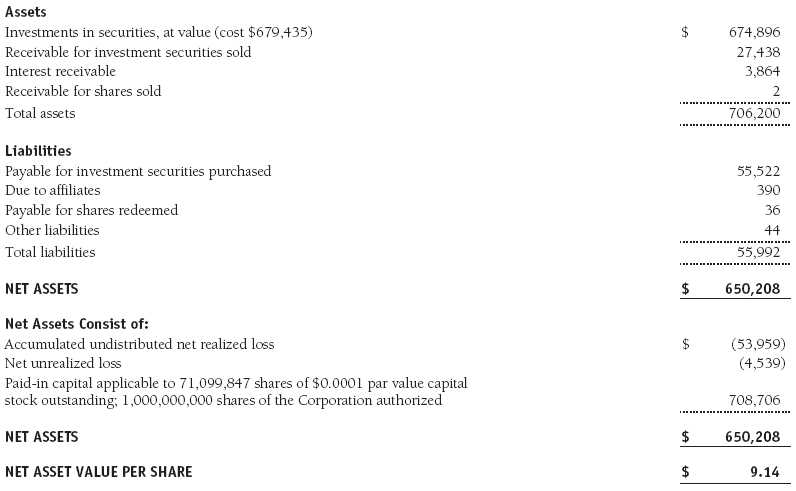
The accompanying notes are an integral part of these financial statements.
Statement of Operations
T. Rowe Price Institutional Floating Rate Fund
($000s)
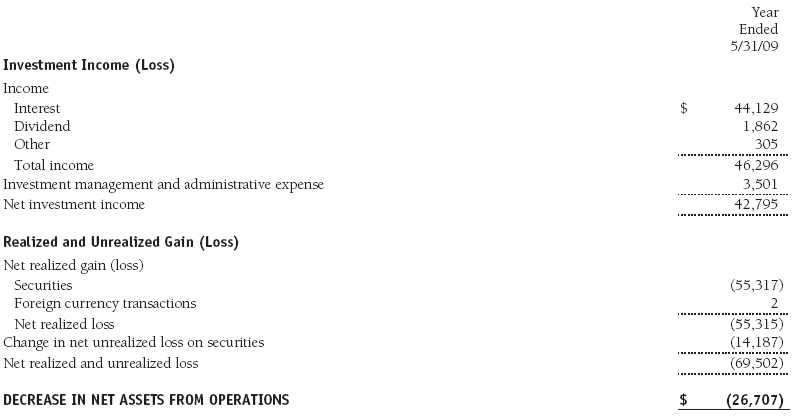
The accompanying notes are an integral part of these financial statements.
Statement of Changes in Net Assets
T. Rowe Price Institutional Floating Rate Fund
($000s)
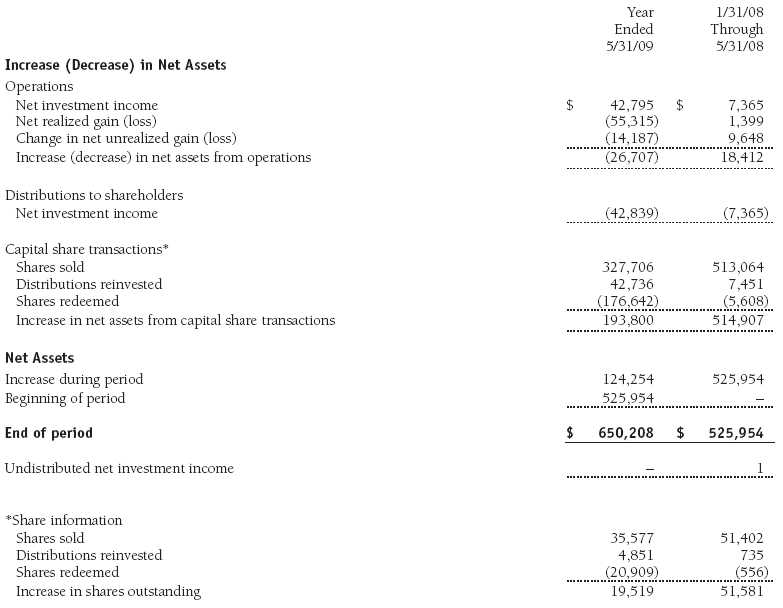
The accompanying notes are an integral part of these financial statements.
Notes to Financial Statements
T. Rowe Price Institutional Floating Rate Fund
May 31, 2009
T. Rowe Price Institutional Income Funds, Inc. (the corporation), is registered under the Investment Company Act of 1940 (the 1940 Act). The Institutional Floating Rate Fund (the fund), a diversified, open-end management investment company, is one portfolio established by the corporation. The fund commenced operations on January 31, 2008. The fund seeks high current income and, secondarily, capital appreciation.
NOTE 1 - SIGNIFICANT ACCOUNTING POLICIES
Basis of Preparation The accompanying financial statements were prepared in accordance with accounting principles generally accepted in the United States of America, which require the use of estimates made by fund management. Fund management believes that estimates and security valuations are appropriate; however, actual results may differ from those estimates, and the security valuations reflected in the financial statements may differ from the value the fund ultimately realizes upon sale of the securities.
Investment Transactions, Investment Income, and Distributions Income and expenses are recorded on the accrual basis. Premiums and discounts on debt securities are amortized for financial reporting purposes. Dividends received from mutual fund investments are reflected as dividend income; capital gain distributions are reflected as realized gain/loss. Dividend income and capital gain distributions are recorded on the ex-dividend date. Income tax-related interest and penalties, if incurred, would be recorded as income tax expense. Investment transactions are accounted for on the trade date. Realized gains and losses are reported on the identified cost basis. Distributions to shareholders are recorded on the ex-dividend date. Income distributions are declared on a daily basis and paid monthly. Capital gain distributions, if any, are declared and paid by the fund, typically on an annual basis.
Currency Translation Assets, including investments, and liabilities denominated in foreign currencies are translated into U.S. dollar values each day at the prevailing exchange rate, using the mean of the bid and asked prices of such currencies against U.S. dollars as quoted by a major bank. Purchases and sales of securities, income, and expenses are translated into U.S. dollars at the prevailing exchange rate on the date of the transaction. The effect of changes in foreign currency exchange rates on realized and unrealized security gains and losses is reflected as a component of security gains and losses.
Redemption Fees A 1% fee is assessed on redemptions of fund shares held for 90 days or less to deter short-term trading and to protect the interests of long-term shareholders. Redemption fees are withheld from proceeds that shareholders receive from the sale or exchange of fund shares. The fees are paid to the fund and are recorded as an increase to paid-in capital. The fees may cause the redemption price per share to differ from the net asset value per share.
New Accounting Pronouncements On June 1, 2008, the fund adopted Statement of Financial Accounting Standards No. 157 (FAS 157), Fair Value Measurements. FAS 157 defines fair value, establishes the framework for measuring fair value, and expands the disclosures of fair value measurements in the financial statements. Adoption of FAS 157 did not have a material impact on the fund’s net assets or results of operations.
On December 1, 2008, the fund adopted Statement of Financial Accounting Standards No. 161 (FAS 161), Disclosures about Derivative Instruments and Hedging Activities. FAS 161 requires enhanced disclosures about derivative and hedging activities, including how such activities are accounted for and their effect on financial position, performance and cash flows. Adoption of FAS 161 had no impact on the fund’s net assets or results of operations.
NOTE 2 - VALUATION
The fund’s investments are reported at fair value as defined under FAS 157. The fund values its investments and computes its net asset value per share at the close of the New York Stock Exchange (NYSE), normally 4 p.m. ET, each day that the NYSE is open for business.
Valuation Method Debt securities are generally traded in the over-the-counter (OTC) market. Securities with remaining maturities of one year or more at the time of acquisition are valued at prices furnished by dealers who make markets in such securities or by an independent pricing service, which considers the yield or price of bonds of comparable quality, coupon, maturity, and type, as well as prices quoted by dealers who make markets in such securities. Securities with remaining maturities of less than one year at the time of acquisition generally use amortized cost in local currency to approximate fair value. However, if amortized cost is deemed not to reflect fair value or the fund holds a significant amount of such securities with remaining maturities of more than 60 days, the securities are valued at prices furnished by dealers who make markets in such securities or by an independent pricing service.
Investments in mutual funds are valued at the mutual fund’s closing net asset value per share on the day of valuation.
Other investments, including restricted securities, and those for which the above valuation procedures are inappropriate or are deemed not to reflect fair value are stated at fair value as determined in good faith by the T. Rowe Price Valuation Committee, established by the fund’s Board of Directors.
For valuation purposes, the last quoted prices of non-U.S. equity securities may be adjusted under the circumstances described below. If the fund determines that developments between the close of a foreign market and the close of the NYSE will, in its judgment, materially affect the value of some or all of its portfolio securities, the fund will adjust the previous closing prices to reflect what it believes to be the fair value of the securities as of the close of the NYSE. In deciding whether it is necessary to adjust closing prices to reflect fair value, the fund reviews a variety of factors, including developments in foreign markets, the performance of U.S. securities markets, and the performance of instruments trading in U.S. markets that represent foreign securities and baskets of foreign securities. A fund may also fair value securities in other situations, such as when a particular foreign market is closed but the fund is open. The fund uses outside pricing services to provide it with closing prices and information to evaluate and/or adjust those prices. The fund cannot predict how often it will use closing prices and how often it will determine it necessary to adjust those prices to reflect fair value. As a means of evaluating its security valuation process, the fund routinely compares closing prices, the next day’s opening prices in the same markets, and adjusted prices.
Valuation Inputs Various inputs are used to determine the value of the fund’s investments. These inputs are summarized in the three broad levels listed below:
Level 1 – quoted prices in active markets for identical securities
Level 2 – observable inputs other than Level 1 quoted prices (including, but not limited to, quoted prices for similar securities, interest rates, prepayment speeds, credit risk)
Level 3 – unobservable inputs
Observable inputs are those based on market data obtained from sources independent of the fund, and unobservable inputs reflect the fund’s own assumptions based on the best information available. The input levels are not necessarily an indication of the risk or liquidity associated with investments at that level. For example, non-U.S. equity securities actively traded in foreign markets generally are reflected in Level 2 despite the availability of closing prices because the fund evaluates and determines whether those closing prices reflect fair value at the close of the NYSE or require adjustment, as described above. The following table summarizes the fund’s investments, based on the inputs used to determine their values on May 31, 2009:

NOTE 3 - OTHER INVESTMENT TRANSACTIONS
Consistent with its investment objective, the fund engages in the following practices to manage exposure to certain risks or to enhance performance. The investment objective, policies, program, and risk factors of the fund are described more fully in the fund’s prospectus and Statement of Additional Information.
Noninvestment-Grade Debt Securities At May 31, 2009, approximately 89% of the fund’s net assets were invested, directly or through its investment in T. Rowe Price institutional funds, in noninvestment-grade debt securities, commonly referred to as “high-yield” or “junk” bonds. A real or perceived economic downturn or higher interest rates could adversely affect the liquidity or value, or both, of such securities because such events could lessen the ability of issuers to make principal and interest payments.
Restricted Securities The fund may invest in securities that are subject to legal or contractual restrictions on resale. Prompt sale of such securities at an acceptable price may be difficult and may involve substantial delays and additional costs.
Bank Loans The fund may invest in bank loans, which represent interests in amounts owed by various borrowers to lenders or lending syndicates. A bank or other financial institution (lender) typically acts as agent for all holders and administers the bank loan in accordance with the credit agreement. Investments in bank loans may be in the form of loan assignments or loan participations. A loan assignment transfers direct ownership of all or a portion of specified third-party loans from the lender to the fund. Although loan assignments continue to be administered by the lender, the fund acquires direct rights against the borrower. In contrast, a loan participation generally entitles the fund to receive payments of principal, interest, and any fees that the lender is entitled to receive from the borrower; however, the lender continues to own and administer the loan. As a result, with loan participations, the fund generally has no right to enforce compliance with the terms of the credit agreement with the borrower and the fund is subject to the credit risk of both the borrower and the lender. A portion of the fund’s bank loans may require additional principal to be funded at the borrowers’ discretion at a later date (unfunded commitments). The fund reflects both the funded bank loan as well as any unfunded commitment in the Portfolio of Investments. At May 31, 2009, the total value of all unfunded commitments was $155,000.
Other Purchases and sales of portfolio securities other than short-term and U.S. government securities aggregated $641,539,000 and $433,224,000, respectively, for the year ended May 31, 2009. Purchases and sales of U.S. government securities aggregated $3,131,000 and $0, respectively, for the year ended May 31, 2009.
NOTE 4 - FEDERAL INCOME TAXES
No provision for federal income taxes is required since the fund intends to continue to qualify as a regulated investment company under Subchapter M of the Internal Revenue Code and distribute to shareholders all of its taxable income and gains. Distributions are determined in accordance with federal income tax regulations, which differ from generally accepted accounting principles, and, therefore, may differ significantly in amount or character from net investment income and realized gains for financial reporting purposes. Financial reporting records are adjusted for permanent book/tax differences to reflect tax character but are not adjusted for temporary differences.
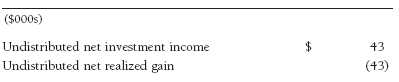
For the year ended May 31, 2009, the following reclassifications, which had no impact on results of operations or net assets, were recorded to reflect tax character:
Distributions during the years ended May 31, 2009 and May 31, 2008, totaled $42,839,000 and $7,365,000, respectively, and were characterized as ordinary income for tax purposes. At May 31, 2009, the tax-basis cost of investments and components of net assets were as follows:
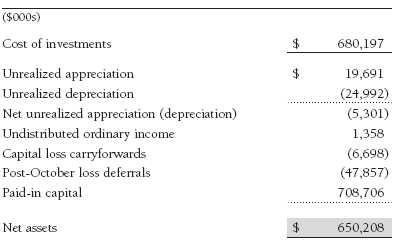
The difference between book-basis and tax-basis net unrealized appreciation (depreciation) is attributable to the deferral of losses from wash sales for tax purposes. The fund intends to retain realized gains to the extent of available capital loss carryforwards. As of May 31, 2009, all unused capital loss carryforwards expire in fiscal 2017. Pursuant to federal income tax regulations applicable to investment companies, recognition of capital losses on certain transactions is deferred until the subsequent tax year. Consequently, realized losses reflected in the accompanying financial statements include net capital losses realized between November 1 and the fund’s fiscal year-end that have not been recognized for tax purposes (Post-October loss deferrals).
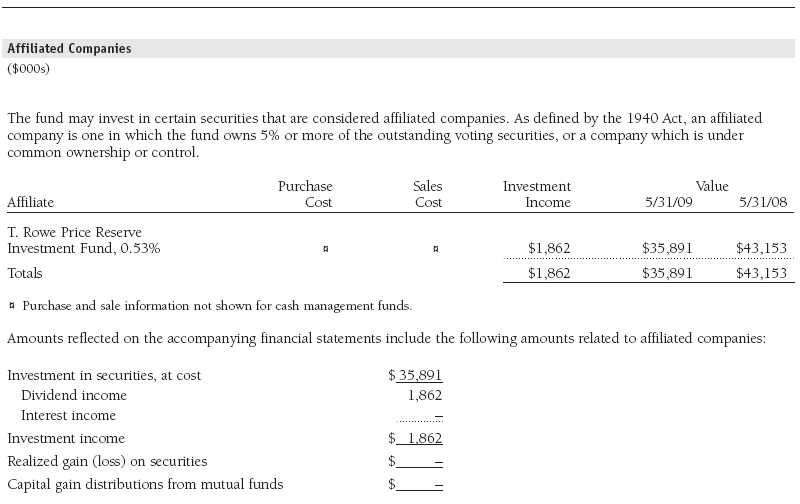
NOTE 5 - RELATED PARTY TRANSACTIONS
The fund is managed by T. Rowe Price Associates, Inc. (the manager or Price Associates), a wholly owned subsidiary of T. Rowe Price Group, Inc. The investment management and administrative agreement between the fund and the manager provides for an all-inclusive annual fee equal to 0.55% of the fund’s average daily net assets. The fee is computed daily and paid monthly. The agreement provides that investment management, shareholder servicing, transfer agency, accounting, custody services, and directors’ fees and expenses are provided to the fund, and interest, taxes, brokerage commissions, and extraordinary expenses are paid directly by the fund.
The fund may invest in the T. Rowe Price Reserve Investment Fund and the T. Rowe Price Government Reserve Investment Fund (collectively, the T. Rowe Price Reserve Investment Funds), open-end management investment companies managed by Price Associates and considered affiliates of the fund. The T. Rowe Price Reserve Investment Funds are offered as cash management options to mutual funds, trusts, and other accounts managed by Price Associates and/or its affiliates and are not available for direct purchase by members of the public. The T. Rowe Price Reserve Investment Funds pay no investment management fees.
Mutual funds and other accounts managed by T. Rowe Price and its affiliates (collectively, T. Rowe Price funds) may invest in the fund; however, no T. Rowe Price fund may invest for the purpose of exercising management or control over the fund. At May 31, 2009, approximately 85% of the fund’s outstanding shares were held by T. Rowe Price funds.
Report of Independent Registered Public Accounting Firm
To the Board of Directors of T. Rowe Price Institutional Income Funds, Inc. and
Shareholders of T. Rowe Price Institutional Floating Rate Fund
In our opinion, the accompanying statement of assets and liabilities, including the portfolio of investments, and the related statements of operations and of changes in net assets and the financial highlights present fairly, in all material respects, the financial position of T. Rowe Price Institutional Floating Rate Fund (one of the portfolios comprising T. Rowe Price Institutional Income Funds, Inc., hereafter referred to as the “Fund”) at May 31, 2009, the results of its operations for the year then ended, the changes in its net assets and the financial highlights for the year then ended and for the period January 31, 2008 through May 31, 2008 in conformity with accounting principles generally accepted in the United States of America. These financial statements and financial highlights (hereafter referred to as "financial statements") are the responsibility of the Fund’s management. Our responsibility is to express an opinion on these financial statements based on our audits. We conducted our audits of these statements in accordance with the standards of the Public Company Accounting Oversight Board (United States). Those standards require that we plan and perform the audit to obtain reasonable assurance about whether the financial statements are free of material misstatement. An audit includes examining, on a test basis, evidence supporting the amounts and disclosures in the financial statements, assessing the accounting principles used and significant estimates made by management, and evaluating the overall financial statement presentation. We believe that our audits, which included confirmation of securities at May 31, 2009 by correspondence with the custodian and brokers, and confirmation of the underlying fund by correspondence with the transfer agent, provide a reasonable basis for our opinion.
PricewaterhouseCoopers LLP
Baltimore, Maryland
July 13, 2009
| Tax Information (Unaudited) for the Tax Year Ended 5/31/09 |
We are providing this information as required by the Internal Revenue Code. The amounts shown may differ from those elsewhere in this report because of differences between tax and financial reporting requirements.
The fund’s distributions to shareholders included $43,000 from short-term capital gains.
| Information on Proxy Voting Policies, Procedures, and Records |
A description of the policies and procedures used by T. Rowe Price funds and portfolios to determine how to vote proxies relating to portfolio securities is available in each fund’s Statement of Additional Information, which you may request by calling 1-800-225-5132 or by accessing the SEC’s Web site, www.sec.gov. The description of our proxy voting policies and procedures is also available on our Web site, www.troweprice.com. To access it, click on the words “Our Company” at the top of our corporate homepage. Then, when the next page appears, click on the words “Proxy Voting Policies” on the left side of the page.
Each fund’s most recent annual proxy voting record is available on our Web site and through the SEC’s Web site. To access it through our Web site, follow the directions above, then click on the words “Proxy Voting Records” on the right side of the Proxy Voting Policies page.
| How to Obtain Quarterly Portfolio Holdings |
The fund files a complete schedule of portfolio holdings with the Securities and Exchange Commission for the first and third quarters of each fiscal year on Form N-Q. The fund’s Form N-Q is available electronically on the SEC’s Web site (www.sec.gov); hard copies may be reviewed and copied at the SEC’s Public Reference Room, 450 Fifth St. N.W., Washington, DC 20549. For more information on the Public Reference Room, call 1-800-SEC-0330.
| Approval of Investment Management Agreement |
On March 10, 2009, the fund’s Board of Directors (Board) unanimously approved the investment advisory contract (Contract) between the fund and its investment manager, T. Rowe Price Associates, Inc. (Manager). The Board considered a variety of factors in connection with its review of the Contract, also taking into account information provided by the Manager during the course of the year, as discussed below:
Services Provided by the Manager
The Board considered the nature, quality, and extent of the services provided to the fund by the Manager. These services included, but were not limited to, management of the fund’s portfolio and a variety of related activities as well as financial and administrative services, reporting, and communications. The Board also reviewed the background and experience of the Manager’s senior management team and investment personnel involved in the management of the fund. The Board concluded that it was satisfied with the nature, quality, and extent of the services provided by the Manager.
Investment Performance of the Fund
The Board reviewed the fund’s total returns over the three-month and since-inception periods and compared these returns with a wide variety of previously agreed upon comparable performance measures and market data, including those supplied by Lipper and Morningstar, which are independent providers of mutual fund data. On the basis of this evaluation, and factoring in the severity of market turmoil in 2008, the Board concluded that the fund’s performance was satisfactory.
Costs, Benefits, Profits, and Economies of Scale
The Board reviewed detailed information regarding the revenues received by the Manager under the Contract and other benefits that the Manager (and its affiliates) may have realized from its relationship with the fund, including research received under “soft dollar” agreements. The Board noted that soft dollars were not used to pay for third-party, non-broker research during 2008. The Board also received information on the estimated costs incurred and profits realized by the Manager and its affiliates from advising T. Rowe Price mutual funds. The Board did not review information regarding profits realized from managing the fund in particular because the fund had not achieved sufficient scale in terms of portfolio asset size to produce meaningful profit margin percentages. The Board concluded that the Manager’s profits were reasonable in light of the services provided to the fund. The Board also considered whether the fund or other funds benefit under the fee levels set forth in the Contract from any economies of scale realized by the Manager. The Board noted that, under the Contract, the fund pays the Manager a single fee based on the fund’s net assets and the Manager, in turn, pays all expenses of the fund, with certain exceptions. The Board concluded that, consistent with this single-fee structure, the Contract provided for a reasonable sharing of any benefits from economies of scale with the fund.
Fees
The Board reviewed the fund’s single-fee structure and compared the rate with fees and expenses of other comparable funds based on information and data supplied by Lipper. The information provided to the Board indicated that the fund’s management fee and expense ratio were below the median for comparable funds. (For these purposes, the Board assumed the management fee was equal to the single fee less the fund’s operating expenses.) The Board also reviewed the fee schedules for comparable privately managed accounts of the Manager and its affiliates. Management informed the Board that the Manager’s responsibilities for privately managed accounts are more limited than its responsibilities for the fund and other T. Rowe Price mutual funds that it or its affiliates advise. On the basis of the information provided, the Board concluded that the fees paid by the fund under the Contract were reasonable.
Approval of the Contract
As noted, the Board approved the continuation of the Contract. No single factor was considered in isolation or to be determinative to the decision. Rather, the Board concluded, in light of a weighting and balancing of all factors considered, that it was in the best interests of the fund to approve the continuation of the Contract, including the fees to be charged for services thereunder.
| About the Fund’s Directors and Officers |
Your fund is governed by a Board of Directors (Board) that meets regularly to review a wide variety of matters affecting the fund, including performance, investment programs, compliance matters, advisory fees and expenses, service providers, and other business affairs. The Board elects the fund’s officers, who are listed in the final table. At least 75% of Board members are independent of T. Rowe Price Associates, Inc. (T. Rowe Price), and T. Rowe Price International, Inc. (T. Rowe Price International); “inside” or “interested” directors are employees or officers of T. Rowe Price. The business address of each director and officer is 100 East Pratt Street, Baltimore, Maryland 21202. The Statement of Additional Information includes additional information about the fund directors and is available without charge by calling a T. Rowe Price representative at 1-800-225-5132.
| Independent Directors | |
| |
| Name (Year of Birth) | |
| Year Elected* | Principal Occupation(s) During Past Five Years and Directorships of Other Public Companies |
| |
| Jeremiah E. Casey (1940) | Director, National Life Insurance (2001 to 2005); Director, The Rouse Company, real estate developers (1990 |
| 2006 | to 2004) |
| |
| Anthony W. Deering (1945) | Chairman, Exeter Capital, LLC, a private investment firm (2004 to present); Director, Under Armour (2008 to |
| 2002 | present); Director, Vornado Real Estate Investment Trust (2004 to present); Director, Mercantile Bankshares |
| | (2002 to 2007); Member, Advisory Board, Deutsche Bank North America (2004 to present); Director, Chairman |
| | of the Board, and Chief Executive Officer, The Rouse Company, real estate developers (1997 to 2004) |
| |
| Donald W. Dick, Jr. (1943) | Principal, EuroCapital Advisors, LLC, an acquisition and management advisory firm (1995 to present) |
| 2002 | |
| |
| Karen N. Horn (1943) | Director, Eli Lilly and Company (1987 to present); Director, Simon Property Group (2004 to present); Director, |
| 2003 | Norfolk Southern (2008 to present); Director, Georgia Pacific (2004 to 2005) |
| |
| Theo C. Rodgers (1941) | President, A&R Development Corporation (1977 to present) |
| 2005 | |
| |
| John G. Schreiber (1946) | Owner/President, Centaur Capital Partners, Inc., a real estate investment company (1991 to present); Partner, |
| 2002 | Blackstone Real Estate Advisors, L.P. (1992 to present) |
| |
| Mark R. Tercek (1957) | President and Chief Executive Officer, The Nature Conservancy (2008 to present); Managing Director, The Goldman |
| 2009 | Sachs Group, Inc. (1984 to 2008) |
| |
| *Each independent director oversees 125 T. Rowe Price portfolios and serves until retirement, resignation, or election of a successor. |
| Inside Directors | |
| |
| Name (Year of Birth) | |
| Year Elected* [Number | |
| of T. Rowe Price | |
| Portfolios Overseen] | Principal Occupation(s) During Past Five Years and Directorships of Other Public Companies |
| |
| Edward C. Bernard (1956) | Director and Vice President, T. Rowe Price; Vice Chairman of the Board, Director, and Vice President, T. Rowe Price |
| 2006 [125] | Group, Inc.; Chairman of the Board, Director, and President, T. Rowe Price Investment Services, Inc.; Chairman of |
| | the Board and Director, T. Rowe Price Global Asset Management Limited, T. Rowe Price Global Investment Services |
| | Limited, T. Rowe Price Retirement Plan Services, Inc., T. Rowe Price Savings Bank, and T. Rowe Price Services, Inc.; |
| | Director, T. Rowe Price International, Inc.; Chief Executive Officer, Chairman of the Board, Director, and President, |
| | T. Rowe Price Trust Company; Chairman of the Board, all funds |
| |
| Mary J. Miller, CFA (1955) | Director, T. Rowe Price Trust Company; Director and Vice President, T. Rowe Price; Vice President, T. Rowe Price |
| 2004 [39] | Group, Inc. |
| |
| *Each inside director serves until retirement, resignation, or election of a successor. |
| Officers | |
| |
| Name (Year of Birth) | |
| Position Held With Institutional Income Funds | Principal Occupation(s) |
| |
| David C. Beers, CFA (1970) | Vice President, T. Rowe Price |
| Assistant Vice President | |
| |
| Brian J. Brennan, CFA (1964) | Vice President, T. Rowe Price, T. Rowe Price Global Investment Services |
| Executive Vice President | Limited, T. Rowe Price Group, Inc., and T. Rowe Price Trust Company |
| |
| Andrew M. Brooks (1956) | Vice President, T. Rowe Price and T. Rowe Price Group, Inc. |
| Vice President | |
| |
| Michael J. Conelius, CFA (1964) | Vice President, T. Rowe Price, T. Rowe Price Global Investment Services |
| Vice President | Limited, T. Rowe Price Group, Inc., T. Rowe Price International, Inc., and |
| | T. Rowe Price Trust Company |
| |
| Roger L. Fiery III, CPA (1959) | Vice President, T. Rowe Price, T. Rowe Price Group, Inc., T. Rowe Price |
| Vice President | International, Inc., and T. Rowe Price Trust Company |
| |
| Justin T. Gerbereux, CFA (1975) | Vice President, T. Rowe Price and T. Rowe Price Group, Inc. |
| Executive Vice President | |
| |
| John R. Gilner (1961) | Chief Compliance Officer and Vice President, T. Rowe Price; Vice President, |
| Chief Compliance Officer | T. Rowe Price Group, Inc., and T. Rowe Price Investment Services, Inc. |
| |
| Gregory S. Golczewski (1966) | Vice President, T. Rowe Price and T. Rowe Price Trust Company |
| Vice President | |
| |
| Gregory K. Hinkle, CPA (1958) | Vice President, T. Rowe Price, T. Rowe Price Group, Inc., and T. Rowe Price |
| Treasurer | Trust Company; formerly Partner, PricewaterhouseCoopers LLP (to 2007) |
| |
| Steven C. Huber, CFA, FSA (1958) | Vice President, T. Rowe Price and T. Rowe Price Group, Inc.; formerly |
| Vice President | Chief Investment Officer, Maryland State Retirement Agency pension fund |
| | (to 2006) |
| |
| Paul A. Karpers, CFA (1967) | Vice President, T. Rowe Price and T. Rowe Price Group, Inc. |
| Executive Vice President | |
| | |
| Ian D. Kelson (1956) | Vice President, T. Rowe Price, T. Rowe Price Global Investment Services |
| Vice President | Limited, T. Rowe Price Group, Inc., and T. Rowe Price International, Inc. |
| |
| Patricia B. Lippert (1953) | Assistant Vice President, T. Rowe Price and T. Rowe Price Investment |
| Secretary | Services, Inc. |
| |
| Paul M. Massaro, CFA (1975) | Vice President, T. Rowe Price and T. Rowe Price Group, Inc. |
| Executive Vice President | |
| |
| Andrew McCormick (1960) | Vice President, T. Rowe Price, T. Rowe Price Group, Inc., and T. Rowe |
| Vice President | Price Trust Company; formerly Chief Investment Officer, IMPAC Mortgage |
| | Holdings (to 2008); Senior Portfolio Manager, Avenue Capital Group (to |
| | 2006); and Senior Vice President, Portfolio Transactions, Federal National |
| | Mortgage Association (to 2005) |
| |
| Michael J. McGonigle (1966) | Vice President, T. Rowe Price and T. Rowe Price Group, Inc. |
| Vice President | |
| |
| David Oestreicher (1967) | Director and Vice President, T. Rowe Price Investment Services, Inc., |
| Vice President | T. Rowe Price Trust Company, and T. Rowe Price Services, Inc.; Vice |
| | President, T. Rowe Price, T. Rowe Price Global Asset Management Limited, |
| | T. Rowe Price Global Investment Services Limited, T. Rowe Price Group, |
| | Inc., T. Rowe Price International, Inc., and T. Rowe Price Retirement Plan |
| | Services, Inc. |
| |
| Brian A. Rubin, CPA (1974) | Vice President, T. Rowe Price and T. Rowe Price Trust Company |
| Assistant Vice President | |
| |
| Deborah D. Seidel (1962) | Vice President, T. Rowe Price Investment Services, Inc., and T. Rowe Price |
| Vice President | Services, Inc. |
| |
| Daniel O. Shackelford, CFA (1958) | Vice President, T. Rowe Price, T. Rowe Price Group, Inc., and T. Rowe Price |
| Vice President | Trust Company |
| |
| Walter P. Stuart III, CFA (1960) | Vice President, T. Rowe Price and T. Rowe Price Group, Inc. |
| Vice President | |
| |
| Thomas E. Tewksbury (1961) | Vice President, T. Rowe Price, T. Rowe Price Group, Inc., and T. Rowe Price |
| Vice President | Trust Company |
| |
| David A. Tiberii, CFA (1965) | Vice President, T. Rowe Price, T. Rowe Price Global Investment Services |
| Vice President | Limited, and T. Rowe Price Group, Inc. |
| |
| Mark J. Vaselkiv (1958) | Vice President, T. Rowe Price, T. Rowe Price Group, Inc., and T. Rowe Price |
| President | Trust Company |
| |
| Julie L. Waples (1970) | Vice President, T. Rowe Price |
| Vice President | |
| |
| Thea N. Williams (1961) | Vice President, T. Rowe Price, T. Rowe Price Group, Inc., and T. Rowe Price |
| Vice President | Trust Company |
| |
| Unless otherwise noted, officers have been employees of T. Rowe Price or T. Rowe Price International for at least five years. |
Item 2. Code of Ethics.
The registrant has adopted a code of ethics, as defined in Item 2 of Form N-CSR, applicable to its principal executive officer, principal financial officer, principal accounting officer or controller, or persons performing similar functions. A copy of this code of ethics is filed as an exhibit to this Form N-CSR. No substantive amendments were approved or waivers were granted to this code of ethics during the period covered by this report.
Item 3. Audit Committee Financial Expert.
The registrant’s Board of Directors/Trustees has determined that Ms. Karen N. Horn qualifies as an audit committee financial expert, as defined in Item 3 of Form N-CSR. Ms. Horn is considered independent for purposes of Item 3 of Form N-CSR.
Item 4. Principal Accountant Fees and Services.
(a) – (d) Aggregate fees billed to the registrant for the last two fiscal years for professional services rendered by the registrant’s principal accountant were as follows:
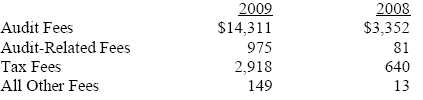
Audit fees include amounts related to the audit of the registrant’s annual financial statements and services normally provided by the accountant in connection with statutory and regulatory filings. Audit-related fees include amounts reasonably related to the performance of the audit of the registrant’s financial statements and specifically include the issuance of a report on internal controls and, if applicable, agreed-upon procedures related to fund acquisitions. Tax fees include amounts related to services for tax compliance, tax planning, and tax advice. The nature of these services specifically includes the review of distribution calculations and the preparation of Federal, state, and excise tax returns. All other fees include the registrant’s pro-rata share of amounts for agreed-upon procedures in conjunction with service contract approvals by the registrant’s Board of Directors/Trustees.
(e)(1) The registrant’s audit committee has adopted a policy whereby audit and non-audit services performed by the registrant’s principal accountant for the registrant, its investment adviser, and any entity controlling, controlled by, or under common control with the investment adviser that provides ongoing services to the registrant require pre-approval in advance at regularly scheduled audit committee meetings. If such a service is required between regularly scheduled audit committee meetings, pre-approval may be authorized by one audit committee member with ratification at the next scheduled audit committee meeting. Waiver of pre-approval for audit or non-audit services requiring fees of a de minimis amount is not permitted.
(2) No services included in (b) – (d) above were approved pursuant to paragraph (c)(7)(i)(C) of Rule 2-01 of Regulation S-X.
(f) Less than 50 percent of the hours expended on the principal accountant’s engagement to audit the registrant’s financial statements for the most recent fiscal year were attributed to work performed by persons other than the principal accountant’s full-time, permanent employees.
(g) The aggregate fees billed for the most recent fiscal year and the preceding fiscal year by the registrant’s principal accountant for non-audit services rendered to the registrant, its investment adviser, and any entity controlling, controlled by, or under common control with the investment adviser that provides ongoing services to the registrant were $1,922,000 and $1,529,000, respectively.
(h) All non-audit services rendered in (g) above were pre-approved by the registrant’s audit committee. Accordingly, these services were considered by the registrant’s audit committee in maintaining the principal accountant’s independence.
Item 5. Audit Committee of Listed Registrants.
Not applicable.
Item 6. Investments.
(a) Not applicable. The complete schedule of investments is included in Item 1 of this Form N-CSR.
(b) Not applicable.
Item 7. Disclosure of Proxy Voting Policies and Procedures for Closed-End Management Investment Companies.
Not applicable.
Item 8. Portfolio Managers of Closed-End Management Investment Companies.
Not applicable.
Item 9. Purchases of Equity Securities by Closed-End Management Investment Company and Affiliated Purchasers.
Not applicable.
Item 10. Submission of Matters to a Vote of Security Holders.
Not applicable.
Item 11. Controls and Procedures.
(a) The registrant’s principal executive officer and principal financial officer have evaluated the registrant’s disclosure controls and procedures within 90 days of this filing and have concluded that the registrant’s disclosure controls and procedures were effective, as of that date, in ensuring that information required to be disclosed by the registrant in this Form N-CSR was recorded, processed, summarized, and reported timely.
(b) The registrant’s principal executive officer and principal financial officer are aware of no change in the registrant’s internal control over financial reporting that occurred during the registrant’s second fiscal quarter covered by this report that has materially affected, or is reasonably likely to materially affect, the registrant’s internal control over financial reporting.
Item 12. Exhibits.
(a)(1) The registrant’s code of ethics pursuant to Item 2 of Form N-CSR is attached.
(2) Separate certifications by the registrant's principal executive officer and principal financial officer, pursuant to Section 302 of the Sarbanes-Oxley Act of 2002 and required by Rule 30a-2(a) under the Investment Company Act of 1940, are attached.
(3) Written solicitation to repurchase securities issued by closed-end companies: not applicable.
(b) A certification by the registrant's principal executive officer and principal financial officer, pursuant to Section 906 of the Sarbanes-Oxley Act of 2002 and required by Rule 30a-2(b) under the Investment Company Act of 1940, is attached.
| | |
SIGNATURES |
| |
| | Pursuant to the requirements of the Securities Exchange Act of 1934 and the Investment |
| Company Act of 1940, the registrant has duly caused this report to be signed on its behalf by the |
| undersigned, thereunto duly authorized. |
| |
| T. Rowe Price Institutional Income Funds, Inc. |
| |
| |
| |
| By | /s/ Edward C. Bernard |
| | Edward C. Bernard |
| | Principal Executive Officer |
| |
| Date | July 21, 2009 |
| |
| |
| |
| | Pursuant to the requirements of the Securities Exchange Act of 1934 and the Investment |
| Company Act of 1940, this report has been signed below by the following persons on behalf of |
| the registrant and in the capacities and on the dates indicated. |
| |
| |
| By | /s/ Edward C. Bernard |
| | Edward C. Bernard |
| | Principal Executive Officer |
| |
| Date | July 21, 2009 |
| |
| |
| |
| By | /s/ Gregory K. Hinkle |
| | Gregory K. Hinkle |
| | Principal Financial Officer |
| |
| Date | July 21, 2009 |