| UNITED STATES |
| SECURITIES AND EXCHANGE COMMISSION |
| Washington, D.C. 20549 |
| |
FORM N-CSR |
| |
CERTIFIED SHAREHOLDER REPORT OF REGISTERED |
MANAGEMENT INVESTMENT COMPANIES |
| |
| |
| |
| Investment Company Act File Number: 811-21055 |
|
| |
| T. Rowe Price Institutional Income Funds, Inc. |
|
| (Exact name of registrant as specified in charter) |
| |
| 100 East Pratt Street, Baltimore, MD 21202 |
|
| (Address of principal executive offices) |
| |
| David Oestreicher |
| 100 East Pratt Street, Baltimore, MD 21202 |
|
| (Name and address of agent for service) |
| |
| |
| Registrant’s telephone number, including area code: (410) 345-2000 |
| |
| |
| Date of fiscal year end: May 31 |
| |
| |
| Date of reporting period: May 31, 2010 |
Item 1: Report to Shareholders| Institutional Core Plus Fund | May 31, 2010 |
• U.S. bond markets performed reasonably well over the past six months and added to their gains for the year, although investors grew more cautious as our reporting period ended.
• The Institutional Core Plus Fund recorded good returns in both periods and outpaced its benchmark. The fund outpaced its Lipper peer group average over the past six months but trailed it over the year.
• The fund’s performance was bolstered by an emphasis on higher-yielding issues, such as commercial mortgage-backed securities, as well as an allocation to high yield issues and bank loans, which are not held in the benchmark.
• Although events in Europe and other factors have increased volatility, corporate fundamentals remain strong, and we expect continued slow growth in the U.S.
The views and opinions in this report were current as of May 31, 2010. They are not guarantees of performance or investment results and should not be taken as investment advice. Investment decisions reflect a variety of factors, and the managers reserve the right to change their views about individual stocks, sectors, and the markets at any time. As a result, the views expressed should not be relied upon as a forecast of the fund’s future investment intent. The report is certified under the Sarbanes-Oxley Act, which requires mutual funds and other public companies to affirm that, to the best of their knowledge, the information in their financial reports is fairly and accurately stated in all material respects.
Manager’s Letter
T. Rowe Price Institutional Core Plus Fund
Dear Investor
Bonds offered moderate overall returns over the past six months and added to their more substantial gains over the past year. Evidence of economic recovery in the U.S. and the promise of strong growth in emerging markets encouraged investors to seek out riskier securities. Support measures on the part of the Federal Reserve also helped repair markets for securitized assets. As a result, yields fell sharply and prices rose for a range of higher-risk fixed income securities. The outlook for credit markets became somewhat clouded at the end of the period as sovereign debt problems that began in Greece spread to other European nations and resulted in a steep drop in the euro and higher yields on many euro zone bonds. Nevertheless, the Institutional Core Plus Fund was able to record good returns in this environment and outpace its benchmark index.
Market Environment
Most signs indicated that the U.S. economy continued recovering over the past six months, albeit at an uneven pace. Businesses resumed hiring in earnest in March and April for the first time in over two years, although the pace of private-sector job creation fell back sharply in May, and the unemployment rate remained elevated. Consumer spending continued to inch higher, and gauges of consumer confidence suggested that Americans were becoming somewhat more optimistic about the economy’s direction. The housing sector appeared to have stabilized, thanks in part to homebuyer tax incentives. Manufacturing seemed to be leading the way in the recovery, due partly to healthy export markets.
In a sign that the Federal Reserve was confident that U.S. credit markets were faring better, the central bank took its first step in removing extraordinary policy accommodation. On February 18, 2010, the Fed announced that it was raising the discount rate it charges member banks for emergency loans by a quarter of a percentage point, to 0.75%. The Fed took pains to assure investors, however, that the more influential federal funds rate—which directly affects consumer and business lending rates—would not be increased in the near future. The short-term inflation threat appeared well contained. The year-over-year increase in core inflation, which excludes volatile food and energy prices, fell to its lowest level in over 40 years.
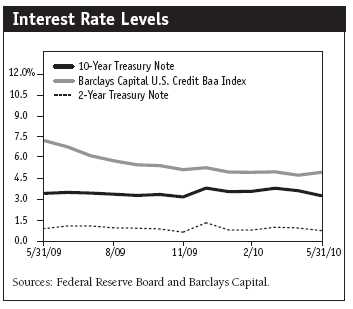
Worries over sovereign debt markets dominated bond headlines toward the end of the period. Disturbing echoes of the 2008 financial crisis appeared in the form of growing concerns about spiraling deficits in Portugal, Spain, and, in particular, Greece. Although most observers agreed that outright defaults on sovereign debt were highly unlikely, many worried that the Continent would slide back into recession as debt-laden nations undertook austerity measures to improve their fiscal situation. Concerns about European debt problems boosted demand for the relative safe haven of U.S. Treasuries but also caused some widening in the difference in yields between higher-risk debt and Treasuries of equal duration—a relationship known as the yield spread.
The steep drop in Treasury yields in late April and May resulted in modest gains in Treasury prices for the six-month period. Conversely, higher-risk securities such as high yield bonds endured price declines as the period ended, but these were not enough to offset very strong performance earlier in the year.
Performance and Investment Review
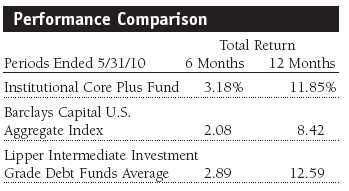
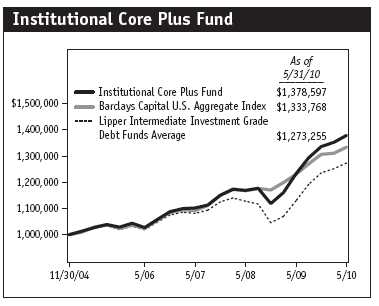
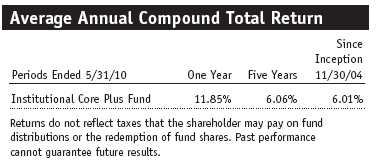
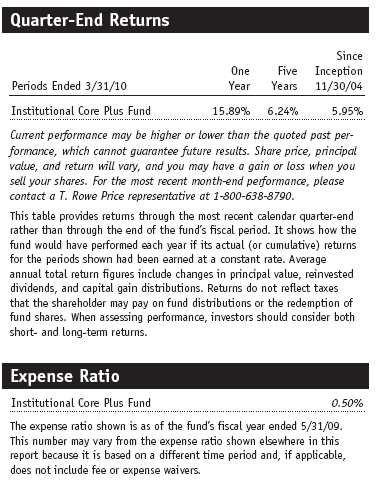
The Institutional Core Plus Fund returned 3.18% for the six-month period and 11.85% for the 12-month period ended May 31, 2010. Our returns outperformed the Barclays Capital U.S. Aggregate Index, while we outpaced the Lipper Intermediate Investment Grade Debt Funds Average over six months but lagged it over the full year. The Institutional Core Plus Fund continued to compare favorably to its peer group over longer periods. Based on cumulative total return, Lipper ranked the Institutional Core Plus Fund 293 out of 549, 73 out of 462, and 40 out of 391 funds in the intermediate investment grade debt funds universe for the one-, three-, and five-year periods ended May 31, 2010, respectively. Results will vary for other periods. Past performance cannot guarantee future results.
The fund’s favorable performance relative to the broad Barclays index was due in large part to its allocation to high yield bonds, which are not included in the benchmark. High yield bonds enjoyed one of their best streaks on record over the past year, although they lost some of their momentum as our reporting period wound down. Improving profits and the ability to refinance high-cost debt have helped solidify the balance sheets of high yield issuers, and high yield bonds benefited throughout much of the past year from investors’ thirst for better yields. As investors bid up prices, however, we judged the risk/reward ratio to be less favorable, and we reduced our exposure to the sector a bit. During the period, we rotated some of our high yield exposure into bank loans, which offer investors lower risk given that companies are obligated to pay off lenders before bondholders.
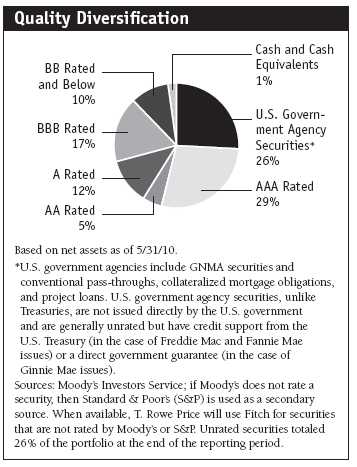
The fund also benefited from its emphasis on commercial mortgage-backed securities (CMBS), which are included in the benchmark to a lesser extent. CMBS yields spiked and prices fell during the financial crisis as the steep recession emptied office space and banks sought to unload commercial property holdings at fire-sale prices in order to raise capital. Despite the slow pace of the employment recovery, fundamentals within the commercial real estate sector have improved somewhat in recent months, helping CMBS prices. Investors have also flocked to the sector as yields on other securities have fallen off sharply, and a lack of new CMBS issuance has meant supply has not risen to meet demand. We remain concerned about fundamentals in the sector, however, and we have largely restricted our buying to AAA “super duper” issues, which (as suggested somewhat exaggeratedly by their name) offer the highest credit quality to buyers. Our emphasis on higher-quality CMBS detracted a bit from our favorable overweight in the sector as lower-quality issues performed best.
Conversely, we have remained underweight in mortgage-backed securities (MBS), which form the lion’s share of the U.S. investment-grade bond market. In an effort to provide support to the housing sector and boost credit markets, the Federal Reserve undertook a massive program of purchasing MBS beginning in late 2008. The Fed’s purchases brought down MBS yields sharply but, in our opinion, also wrung much of the value out of the sector for private investors. Along with others, we were cautious about the implications of the end of Fed purchases in March. As it turned out, the sector has fared relatively well to date as limited new issuance has kept supply and demand for MBS in equilibrium. We have recently begun adding to our holdings as yields have become somewhat more favorable relative to Treasuries.
The fund’s investment-grade corporate bond holdings also performed well, although an even larger allocation would have boosted performance, as evidenced by the strong performance of the more narrowly focused Lipper Corporate Debt Funds A Rated Average. Cost-cutting, an improvement in business conditions, and other factors have bolstered corporate balance sheets. The recovery among financial issuers has been particularly strong as banks have raised capital to offset bad loans on their books.
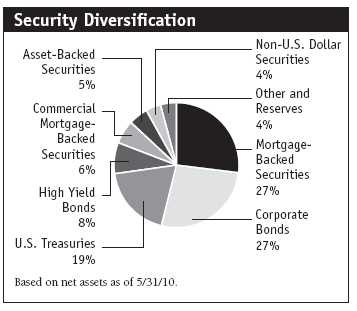
The portfolio also benefited from our decision to remain significantly underweight in Treasuries relative to the Barclays index over the past year. In part, this reflected our view that Treasury yields had been bid to unattractive levels as a result of the financial crisis, which increased their appeal as a relative “safe haven” investment. In addition, we believed that we could locate attractive credit-sensitive securities in other sectors with the help of our in-house research staff. As yields in riskier sectors have come down, however, we have increased our Treasury allocation somewhat, from 12% to 19% of the portfolio—still well below the roughly 30% allocation in the Barclays benchmark.
Finally, the portfolio includes a modest allocation to foreign currencies. We have small holdings of Scandinavian as well as Asian currencies, such as the Swedish krona, the Indian rupee, and the South Korean won. Our performance in recent months benefited from a decision to hedge against the faltering euro, which fell sharply as a result of the European debt crisis.
Outlook
Sovereign debt concerns and severe fiscal austerity measures in many European countries are likely to reduce global growth expectations and weigh on market sentiment in the near term. The potential for financial reform in the U.S. to hurt banks’ credit ratings may also fuel volatility, although we believe reform ultimately will improve banking system stability. In this context, investors’ recent flight from riskier assets is understandable, especially given the strong rally in higher-risk assets that began a little over a year ago. We expect further volatility to emanate from abroad this year given both the situation in Europe and the potential for higher inflation in the overheating Chinese economy.
The upside of the turmoil overseas for both the U.S. economy as a whole and bond investors in particular is that long-term interest rates have remained contained. Although corporate bond yields have increased relative to Treasury yields, they have remained roughly stable on an absolute basis, minimizing price declines. While longer-term Treasury yields are eventually likely to rise due to the government’s immense borrowing needs, we believe caution and a “flight to quality” will keep them low in the coming months. Given that inflationary pressures are likely to remain very low in the near future, the Fed is likely to keep official short-term interest rates near zero, perhaps into 2011. In general, we continue to expect this year to be a “coupon clipping” environment—one in which U.S. bond investors get most of their gains from income rather than price appreciation.
Despite recent turmoil in global equity and bond markets, corporate fundamentals are strong, and domestic economic data remain largely encouraging. Having tactically reduced risk in April and May, we believe we are well positioned to take advantage of improved valuations for corporate bonds and other higher-risk issues when we find them. To uncover the most appealing investment opportunities, our fixed income investment professionals are working closely with our in-house research teams located around the world. We remain committed to the risk-conscious, fundamentally based investment approach and long-term perspective that have helped us weather volatile market conditions in the past.
As always, we appreciate your confidence and thank you for investing with T. Rowe Price.
Respectfully submitted,

Brian J. Brennan
Chairman of the fund’s Investment Advisory Committee
June 11, 2010
The committee chairman has day-to-day responsibility for managing the portfolio and works with committee members in developing and executing the fund’s investment program.
Bonds are subject to interest rate risk, the decline in bond prices that usually accompanies a rise in interest rates, and credit risk, the chance that any fund holding could have its credit rating downgraded or that a bond issuer will default (fail to make timely payments of interest or principal), potentially reducing the fund’s income level and share price. Mortgage-backed securities are subject to prepayment risk, particularly if falling rates lead to heavy refinancing activity, and extension risk, which is an increase in interest rates that causes a fund’s average maturity to lengthen unexpectedly due to a drop in mortgage prepayments. This could increase the fund’s sensitivity to rising interest rates and its potential for price declines.
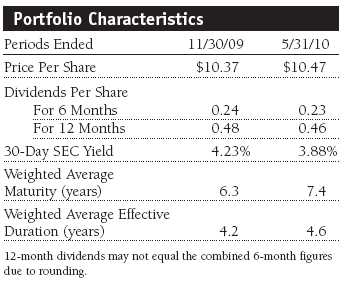
30-day SEC yield: A method of calculating a fund’s yield that assumes all portfolio securities are held until maturity. Yield will vary and is not guaranteed.
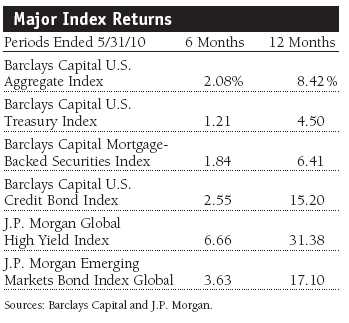
Barclays Capital Mortgage-Backed Securities Index: An unmanaged index that tracks the performance of the mortgage-backed pass-through securities of Ginnie Mae, Fannie Mae, and Freddie Mac.
Barclays Capital U.S. Aggregate Index: An unmanaged index that tracks domestic investment-grade bonds, including corporate, government, and mortgage-backed securities.
Barclays Capital U.S. Credit Baa Index: A measure of corporate and non-corporate fixed income securities that are rated investment grade (Baa by Moody’s Investors Service and BBB by Standard & Poor’s) and have at least 10 years to final maturity.
Barclays Capital U.S. Credit Bond Index: An unmanaged index that tracks the performance of domestic investment-grade corporate bonds.
Barclays Capital U.S. Treasury Index: An unmanaged index of publicly traded obligations of the U.S. Treasury.
Basis point: One one-hundredth of a percentage point, or 0.01%.
Duration: A measure of a bond or bond fund’s sensitivity to changes in interest rates. For example, a fund with a four-year duration would fall about 4% in response to a one-percentage-point rise in interest rates, and vice versa.
Federal funds rate: The interest rate charged on overnight loans of reserves by one financial institution to another in the United States. The Federal Reserve sets a target federal funds rate to affect the direction of interest rates.
J.P. Morgan Emerging Markets Bond Index Global: Tracks U.S. dollar government bonds of 31 foreign countries.
J.P. Morgan Global High Yield Index: Tracks the investable universe of the U.S. dollar-denominated global high yield corporate debt market, including domestic and international issues.
Lipper averages: The averages of all mutual funds in a particular category as tracked by Lipper Inc.
Real interest rate: A fixed income security’s interest rate after being adjusted for inflation. It is calculated by subtracting the inflation rate from a nominal interest rate. For example, if a 10-year Treasury note is yielding 5% and inflation is 2%, the real interest rate is 3%.
Weighted average maturity: The weighted average maturity is a measure of a fund’s interest rate sensitivity. In general, the longer the average maturity, the greater the fund’s sensitivity to interest rate changes. The weighted average maturity may take into account the interest rate readjustment dates for certain securities.
Yield curve: A graphic depiction of the relationship between yields and maturity dates for a set of similar securities, such as Treasuries or municipal securities. Yield curves typically slope upward, indicating that longer maturities offer higher yields. When the yield curve is flat, there is little or no difference between the yields offered by shorter- and longer-term securities.
Performance and Expenses
T. Rowe Price Institutional Core Plus Fund
This chart shows the value of a hypothetical $1 million investment in the fund over the past 10 fiscal year periods or since inception (for funds lacking 10-year records). The result is compared with benchmarks, which may include a broad-based market index and a peer group average or index. Market indexes do not include expenses, which are deducted from fund returns as well as mutual fund averages and indexes.
This table shows how the fund would have performed each year if its actual (or cumulative) returns for the periods shown had been earned at a constant rate.
Fund Expense Example
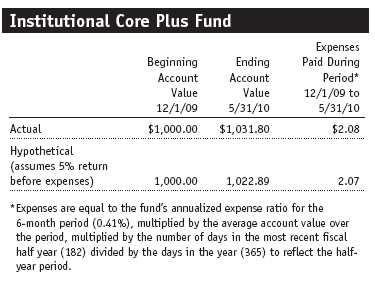
As a mutual fund shareholder, you may incur two types of costs: (1) transaction costs, such as redemption fees or sales loads, and (2) ongoing costs, including management fees, distribution and service (12b-1) fees, and other fund expenses. The following example is intended to help you understand your ongoing costs (in dollars) of investing in the fund and to compare these costs with the ongoing costs of investing in other mutual funds. The example is based on an investment of $1,000 invested at the beginning of the most recent six-month period and held for the entire period.
Actual Expenses
The first line of the following table (“Actual”) provides information about actual account values and actual expenses. You may use the information in this line, together with your account balance, to estimate the expenses that you paid over the period. Simply divide your account value by $1,000 (for example, an $8,600 account value divided by $1,000 = 8.6), then multiply the result by the number in the first line under the heading “Expenses Paid During Period” to estimate the expenses you paid on your account during this period.
Hypothetical Example for Comparison Purposes
The information on the second line of the table (“Hypothetical”) is based on hypothetical account values and expenses derived from the fund’s actual expense ratio and an assumed 5% per year rate of return before expenses (not the fund’s actual return). You may compare the ongoing costs of investing in the fund with other funds by contrasting this 5% hypothetical example and the 5% hypothetical examples that appear in the shareholder reports of the other funds. The hypothetical account values and expenses may not be used to estimate the actual ending account balance or expenses you paid for the period.
You should also be aware that the expenses shown in the table highlight only your ongoing costs and do not reflect any transaction costs, such as redemption fees or sales loads. Therefore, the second line of the table is useful in comparing ongoing costs only and will not help you determine the relative total costs of owning different funds. To the extent a fund charges transaction costs, however, the total cost of owning that fund is higher.
Financial Highlights
T. Rowe Price Institutional Core Plus Fund
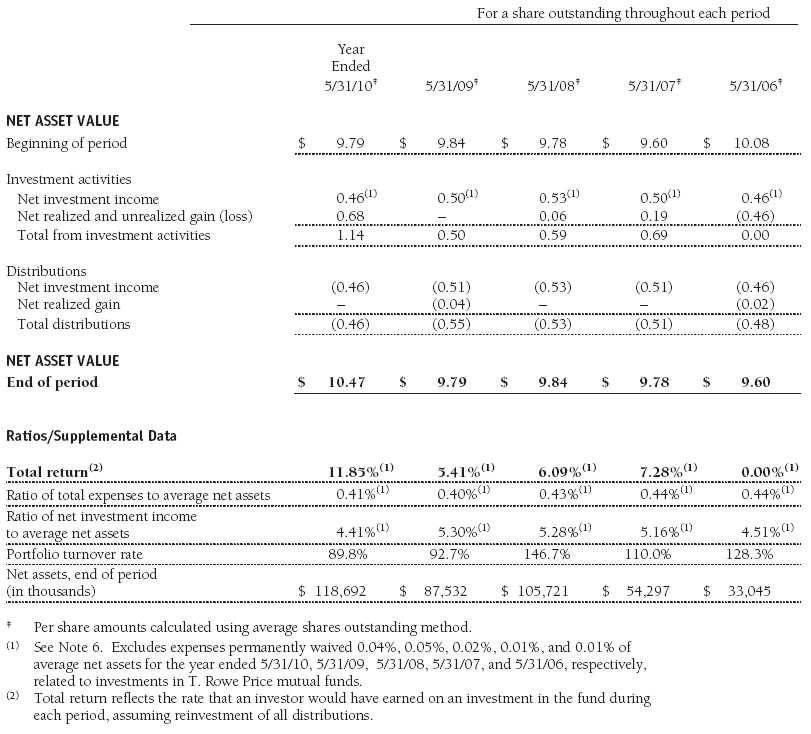
The accompanying notes are an integral part of these financial statements.
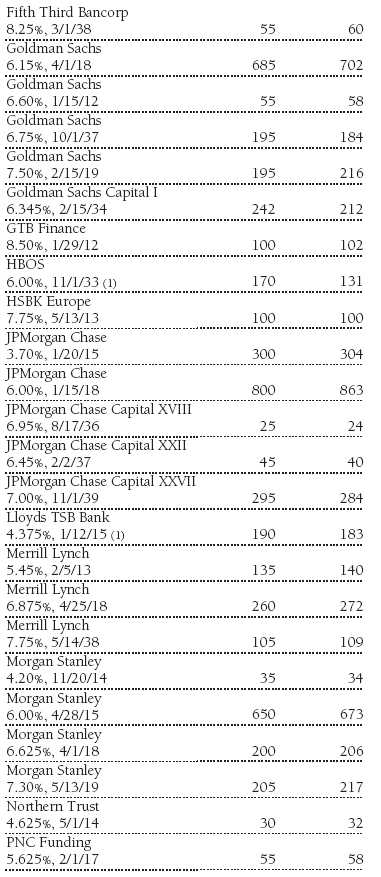
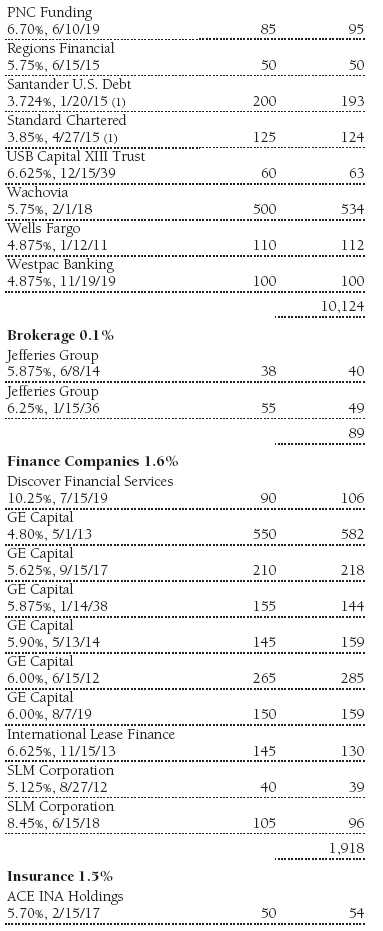
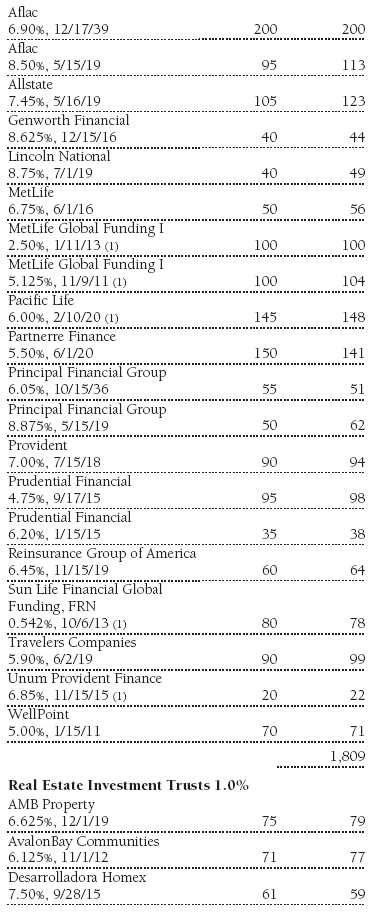
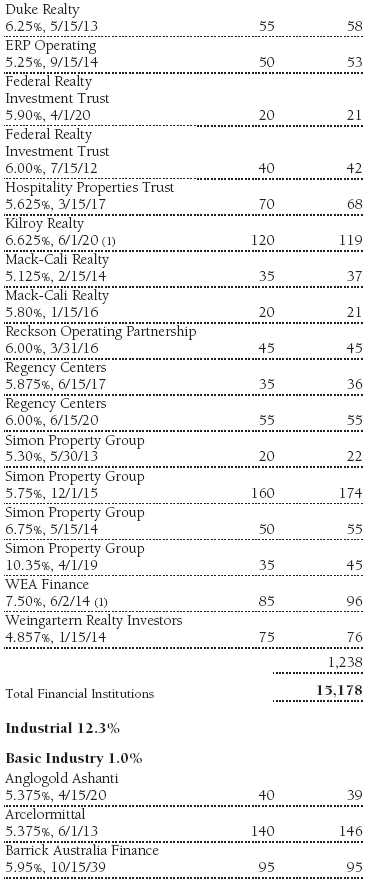
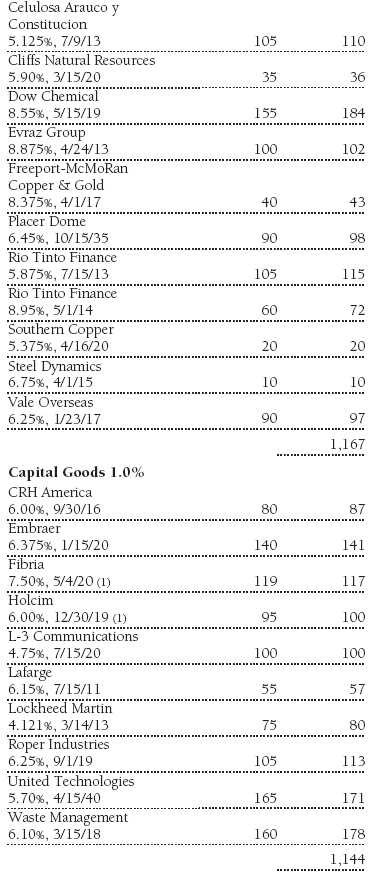
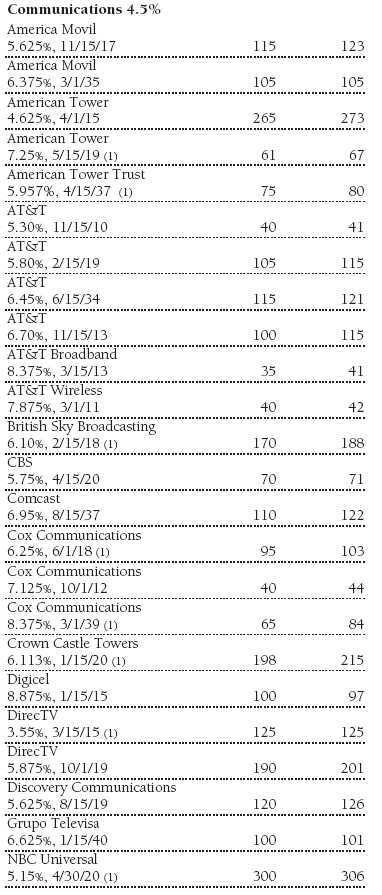
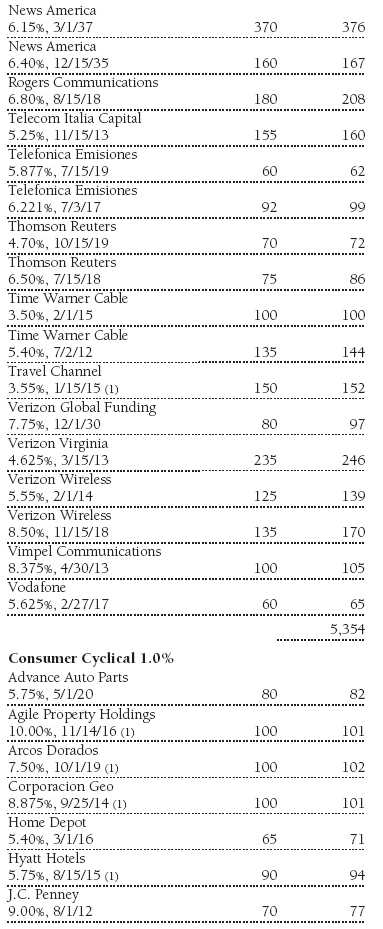
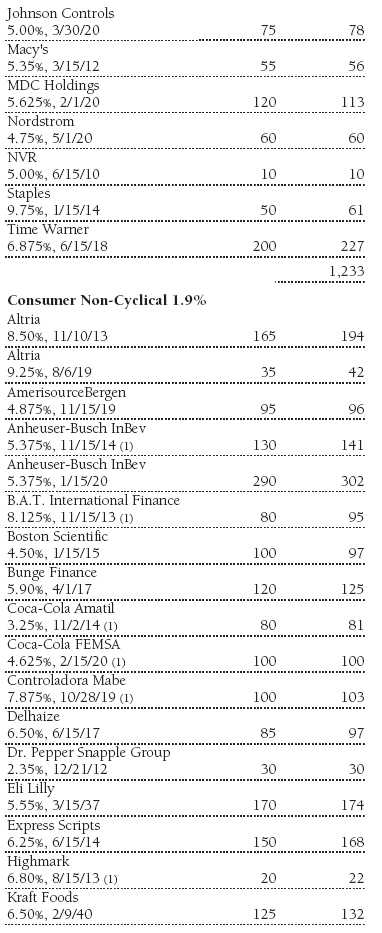
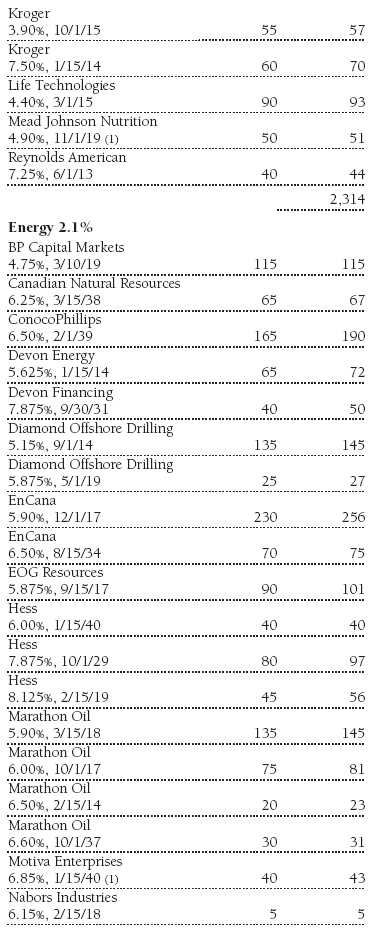
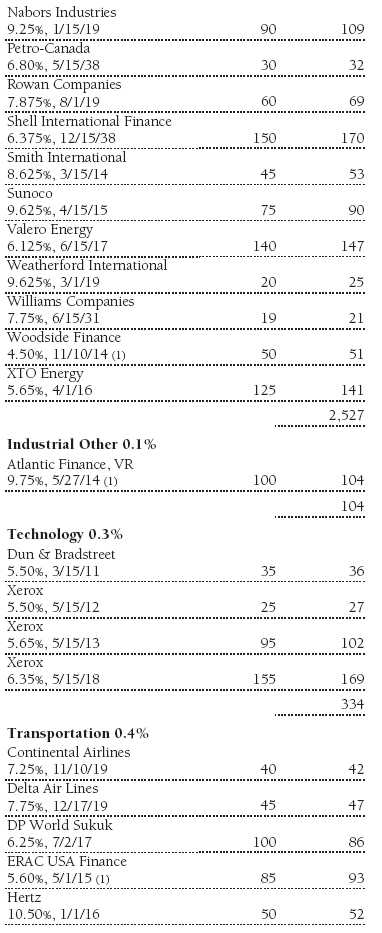
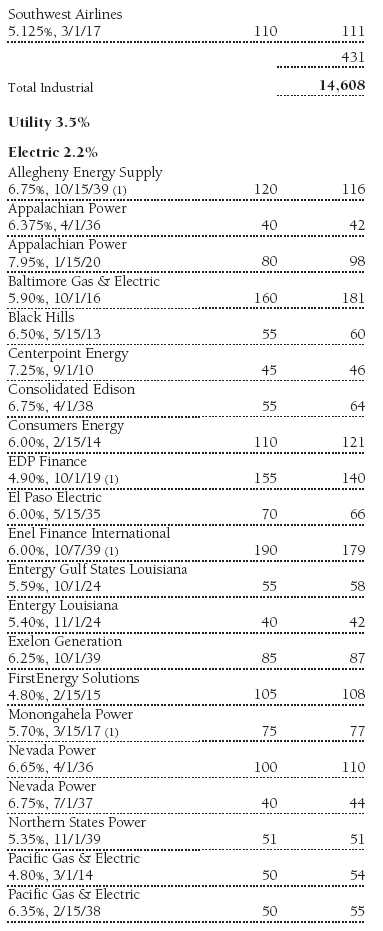
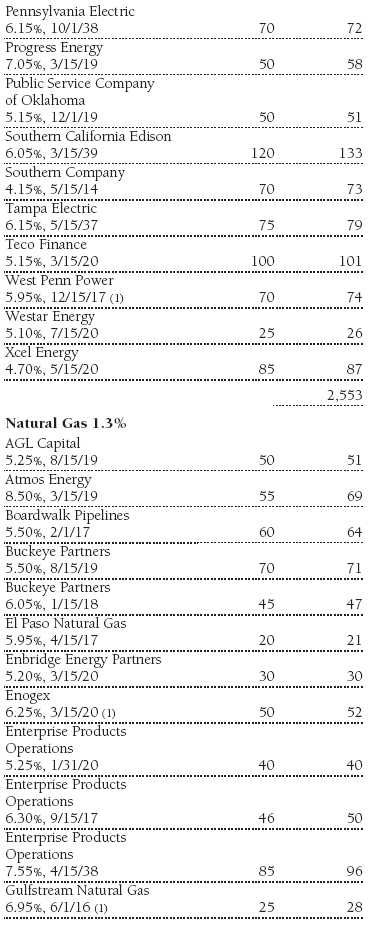
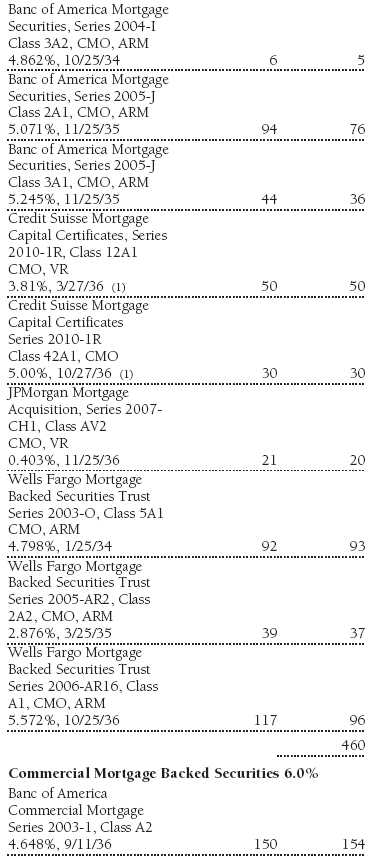
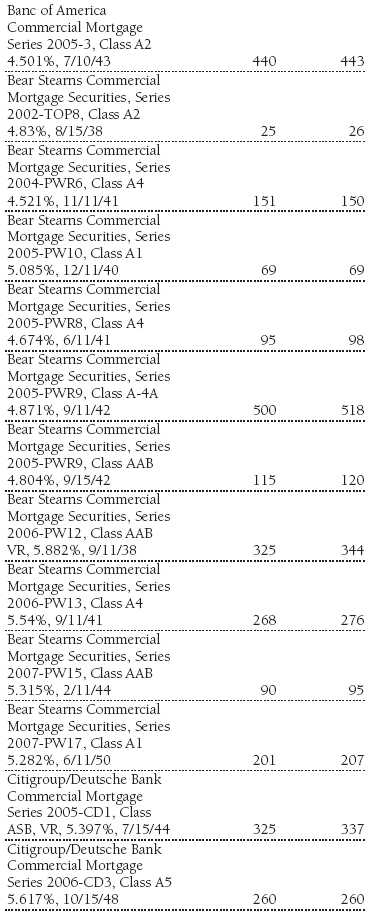
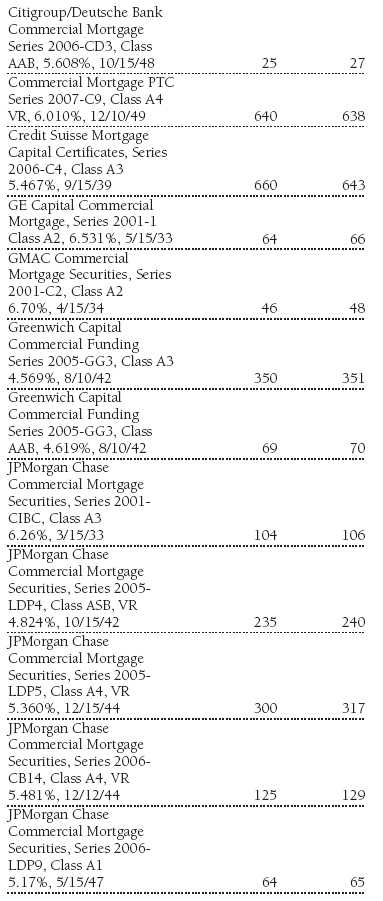
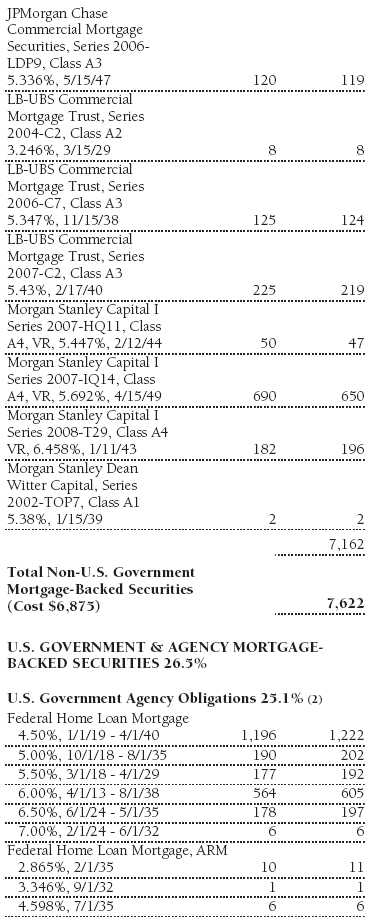
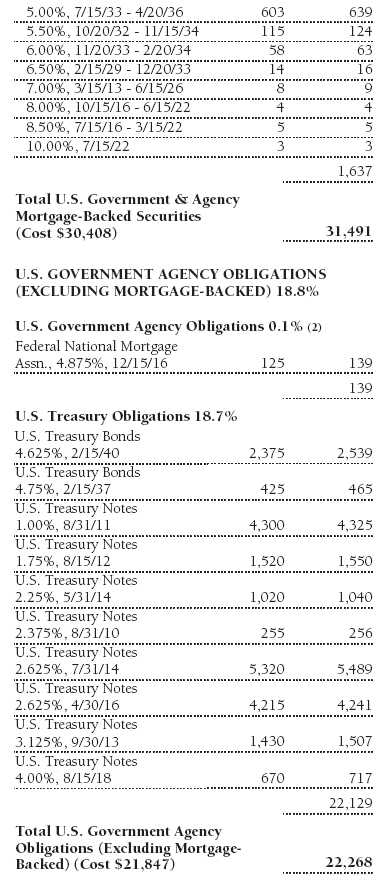
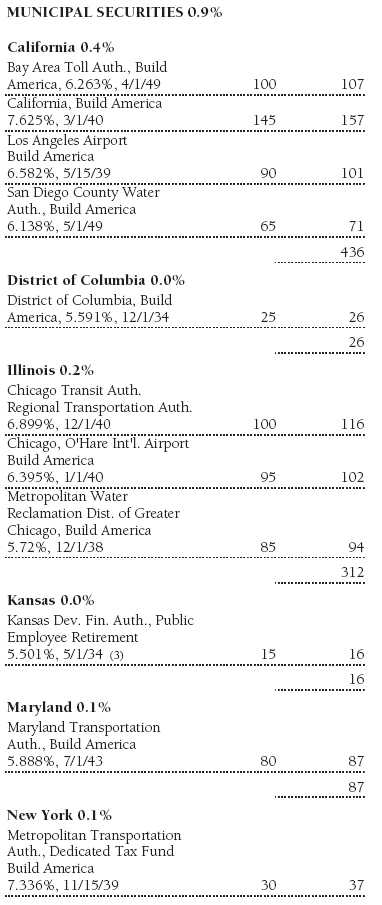
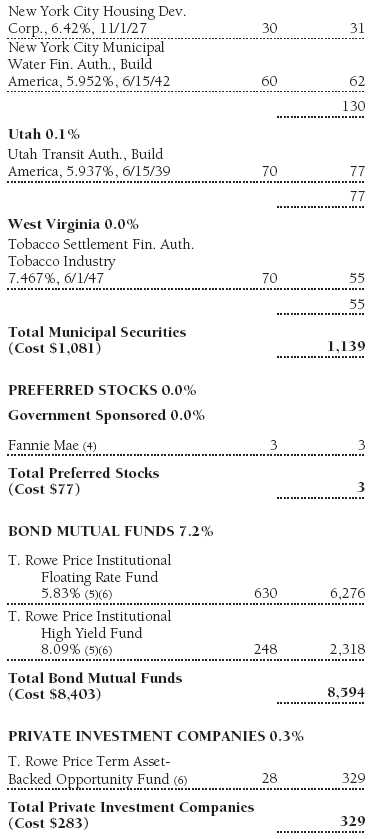
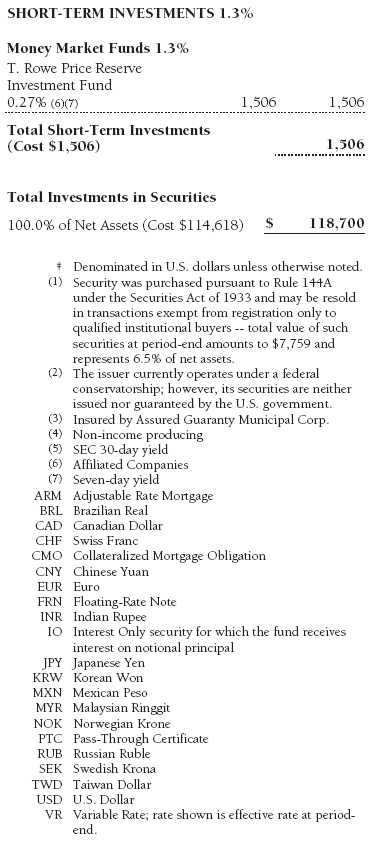
Portfolio of Investments‡
T. Rowe Price Institutional Core Plus Fund
May 31, 2010
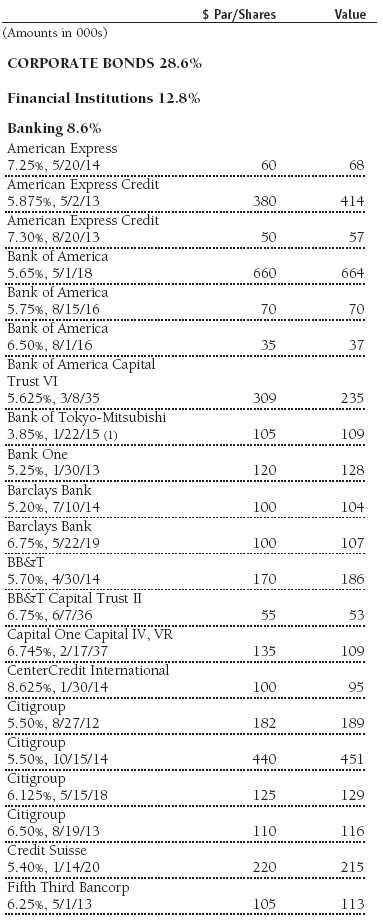
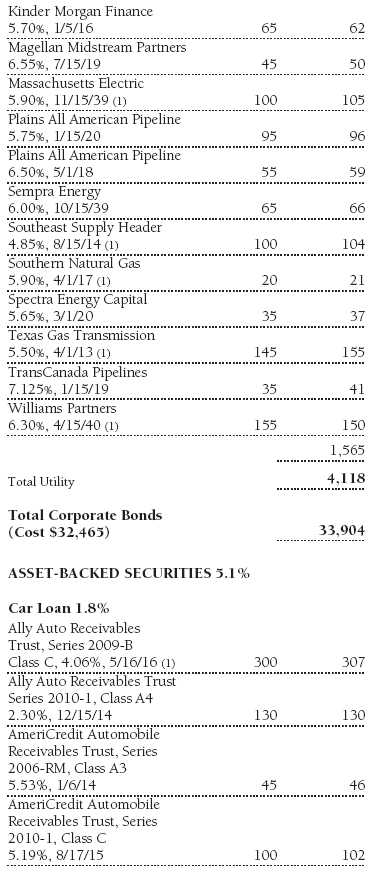
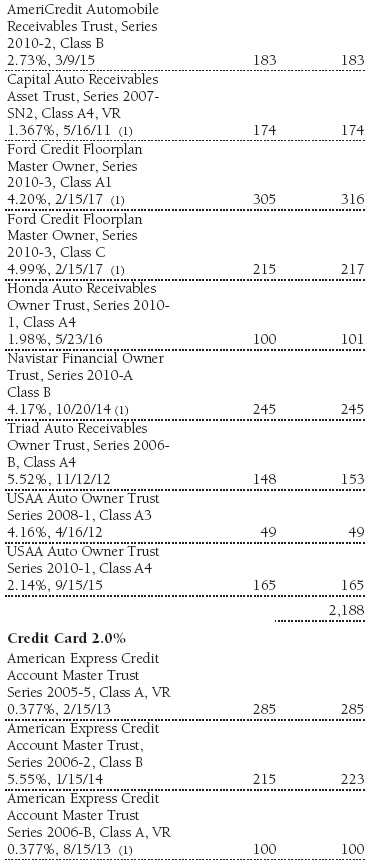
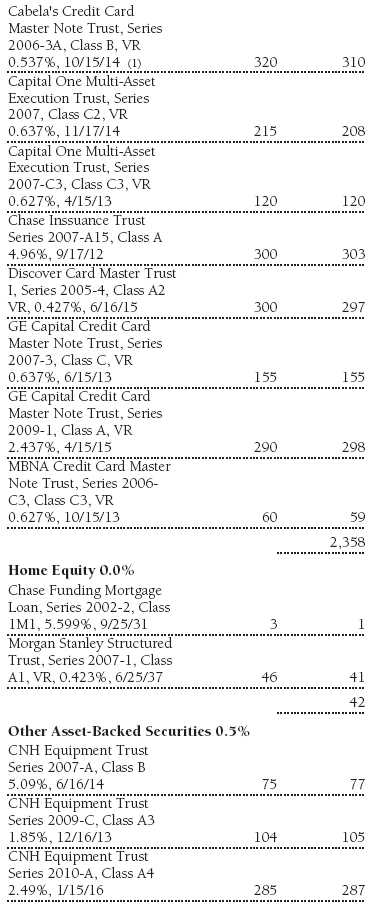
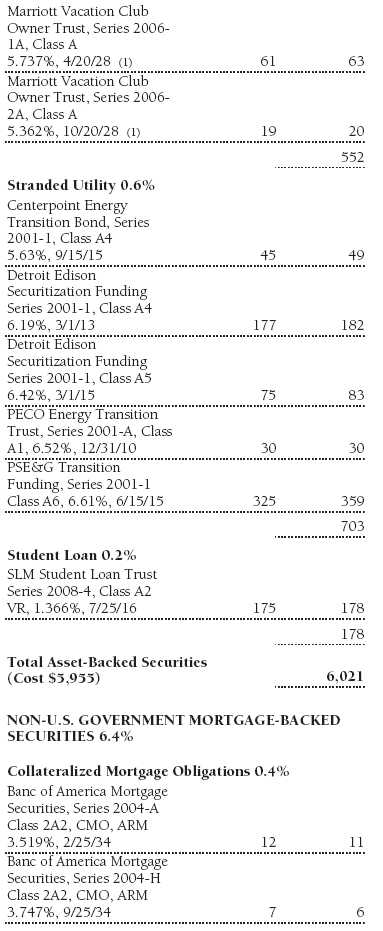


The accompanying notes are an integral part of these financial statements.
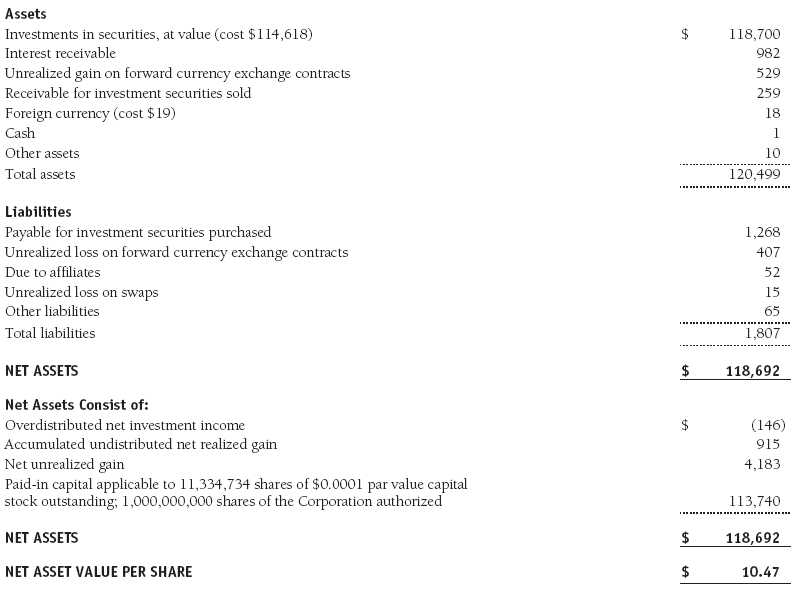
Statement of Assets and Liabilities
T. Rowe Price Institutional Core Plus Fund
May 31, 2010
($000s, except shares and per share amounts)
The accompanying notes are an integral part of these financial statements.
Statement of Operations
T. Rowe Price Institutional Core Plus Fund
($000s)
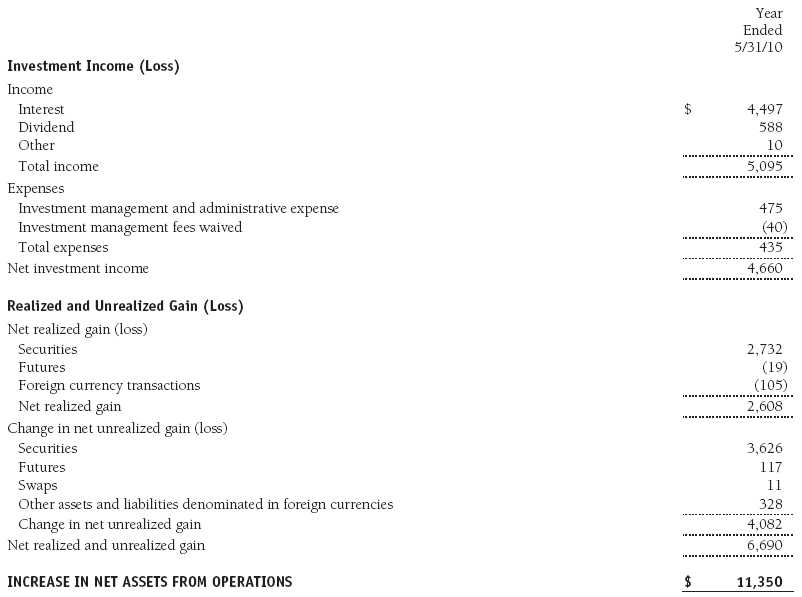
The accompanying notes are an integral part of these financial statements.
Statement of Changes in Net Assets
T. Rowe Price Institutional Core Plus Fund
($000s)
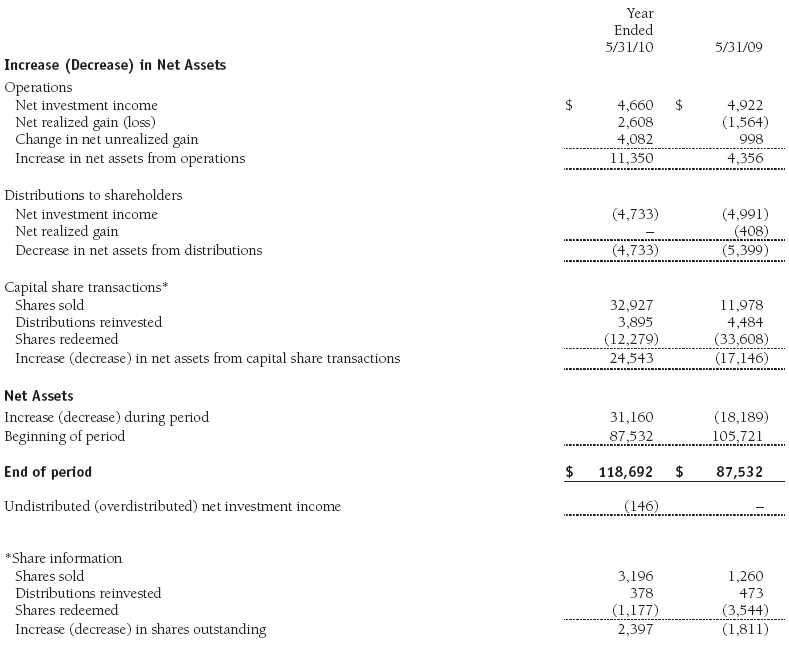
The accompanying notes are an integral part of these financial statements.
Notes to Financial Statements
T. Rowe Price Institutional Core Plus Fund
May 31, 2010
T. Rowe Price Institutional Income Funds, Inc. (the corporation), is registered under the Investment Company Act of 1940 (the 1940 Act). The Institutional Core Plus Fund (the fund), a diversified, open-end management investment company, is one portfolio established by the corporation. The fund commenced operations on November 30, 2004. The fund seeks to maximize total return through income and capital appreciation.
NOTE 1 - SIGNIFICANT ACCOUNTING POLICIES
Basis of Preparation The accompanying financial statements were prepared in accordance with accounting principles generally accepted in the United States of America (GAAP), which require the use of estimates made by fund management. Fund management believes that estimates and valuations are appropriate; however, actual results may differ from those estimates, and the valuations reflected in the accompanying financial statements may differ from the value ultimately realized upon sale of securities.
Investment Transactions, Investment Income, and Distributions Income and expenses are recorded on the accrual basis. Premiums and discounts on debt securities are amortized for financial reporting purposes. Paydown gains and losses are recorded as an adjustment to interest income. Dividends received from mutual fund investments are reflected as dividend income; capital gain distributions are reflected as realized gain/loss. Earnings on investments recognized as partnerships for federal income tax purposes reflect the tax character of such earnings. Dividend income and capital gain distributions are recorded on the ex-dividend date. Income tax-related interest and penalties, if incurred, would be recorded as income tax expense. Investment transactions are accounted for on the trade date. Realized gains and losses are reported on the identified cost basis. Distributions to shareholders are recorded on the ex-dividend date. Income distributions are declared daily and paid monthly. Capital gain distributions, if any, are generally declared and paid by the fund annually.
Currency Translation Assets, including investments, and liabilities denominated in foreign currencies are translated into U.S. dollar values each day at the prevailing exchange rate, using the mean of the bid and asked prices of such currencies against U.S. dollars as quoted by a major bank. Purchases and sales of securities, income, and expenses are translated into U.S. dollars at the prevailing exchange rate on the date of the transaction. The effect of changes in foreign currency exchange rates on realized and unrealized security gains and losses is reflected as a component of security gains and losses.
New Accounting Pronouncement In January 2010, new accounting guidance was issued that requires enhanced disclosures about fair value measurements in the financial statements; it is effective for fiscal years and interim periods beginning after December 15, 2009. Management expects that adoption of this guidance will have no impact on the fund’s net assets or results of operations.
NOTE 2 - VALUATION
The fund’s investments are reported at fair value as defined by GAAP. The fund determines the values of its assets and liabilities and computes its net asset value per share at the close of the New York Stock Exchange (NYSE), normally 4 p.m. ET, each day that the NYSE is open for business. Values in the accompanying Portfolio of Investments are as of May 28, 2010, the last business day in the fund’s fiscal year ended May 31, 2010. Some foreign markets were open between May 28 and the close of the reporting period on May 31, but any differences in investment values and foreign exchange rates subsequent to May 28 through May 31 were immaterial to the fund’s financial statements.
Valuation Methods Debt securities are generally traded in the over-the-counter (OTC) market. Securities with remaining maturities of one year or more at the time of acquisition are valued at prices furnished by dealers who make markets in such securities or by an independent pricing service, which considers the yield or price of bonds of comparable quality, coupon, maturity, and type, as well as prices quoted by dealers who make markets in such securities. Securities with remaining maturities of less than one year at the time of acquisition generally use amortized cost in local currency to approximate fair value. However, if amortized cost is deemed not to reflect fair value or the fund holds a significant amount of such securities with remaining maturities of more than 60 days, the securities are valued at prices furnished by dealers who make markets in such securities or by an independent pricing service.
Equity securities listed or regularly traded on a securities exchange or in the OTC market are valued at the last quoted sale price or, for certain markets, the official closing price at the time the valuations are made, except for OTC Bulletin Board securities, which are valued at the mean of the latest bid and asked prices. A security that is listed or traded on more than one exchange is valued at the quotation on the exchange determined to be the primary market for such security. Listed securities not traded on a particular day are valued at the mean of the latest bid and asked prices for domestic securities and the last quoted sale price for international securities.
Investments in mutual funds are valued at the mutual fund’s closing net asset value per share on the day of valuation. Investments in private investment companies are valued at the entity’s net asset value (or equivalent) as of the valuation date. Forward currency exchange contracts are valued using the prevailing forward exchange rate. Swaps are valued at prices furnished by independent swap dealers or by an independent pricing service.
Other investments, including restricted securities, and those financial instruments for which the above valuation procedures are inappropriate or are deemed not to reflect fair value are stated at fair value as determined in good faith by the T. Rowe Price Valuation Committee, established by the fund’s Board of Directors.
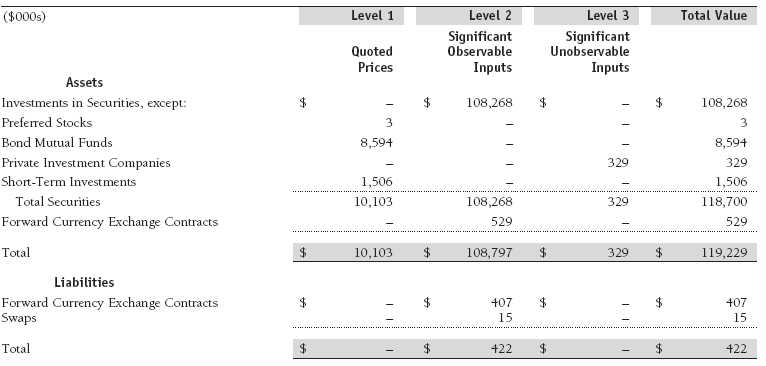
Valuation Inputs Various inputs are used to determine the value of the fund’s financial instruments. These inputs are summarized in the three broad levels listed below:
Level 1 – quoted prices in active markets for identical financial instruments
Level 2 – observable inputs other than Level 1 quoted prices (including, but not limited to, quoted prices for similar financial instruments, interest rates, prepayment speeds, and credit risk)
Level 3 – unobservable inputs
Observable inputs are those based on market data obtained from sources independent of the fund, and unobservable inputs reflect the fund’s own assumptions based on the best information available. The input levels are not necessarily an indication of the risk or liquidity associated with financial instruments at that level. The following table summarizes the fund’s financial instruments, based on the inputs used to determine their values on May 31, 2010:
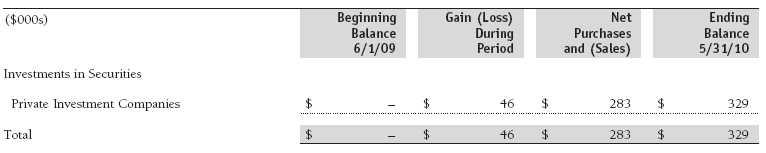
Following is a reconciliation of the fund’s Level 3 holdings for the year ended May 31, 2010. Gain (loss) reflects both realized and change in unrealized gain (loss) on Level 3 holdings during the period, if any, and is included on the accompanying Statement of Operations. The change in unrealized gain/loss on Level 3 instruments held at May 31, 2010, totaled $46,000 for the year ended May 31, 2010.
NOTE 3 - DERIVATIVE INSTRUMENTS
During the year ended May 31, 2010, the fund invested in derivative instruments. As defined by GAAP, a derivative is a financial instrument whose value is derived from an underlying security price, foreign exchange rate, interest rate, index of prices or rates, or other variable; it requires little or no initial investment and permits or requires net settlement. The fund invests in derivatives only if the expected risks and rewards are consistent with its investment objectives, policies, and overall risk profile, as described in its prospectus and Statement of Additional Information. The fund may use derivatives for a variety of purposes, such as seeking to hedge against declines in principal value, increase yield, invest in an asset with greater efficiency and at a lower cost than is possible through direct investment, or to adjust portfolio duration and credit exposure. The risks associated with the use of derivatives are different from, and potentially much greater than, the risks associated with investing directly in the instruments on which the derivatives are based. Investments in derivatives can magnify returns positively or negatively; however, the fund at all times maintains sufficient cash reserves, liquid assets, or other SEC-permitted asset types to cover the settlement obligations under its open derivative contracts.
The fund values its derivatives at fair value, as described below and in Note 2, and recognizes changes in fair value currently in its results of operations. Accordingly, the fund does not follow hedge accounting, even for derivatives employed as economic hedges. The fund does not offset the fair value of derivative instruments and the right to reclaim or obligation to return collateral executed with the same counterparty under a master netting arrangement. The following table summarizes the fair value of the fund’s derivative instruments held as of May 31, 2010, and the related location on the accompanying Statement of Assets and Liabilities, presented by primary underlying risk exposure:

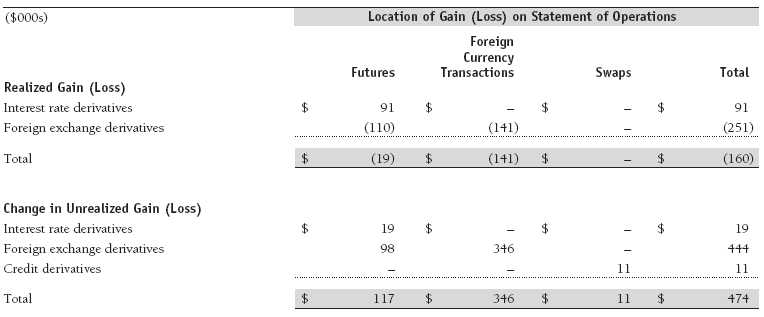
Additionally, the amount of gains and losses on derivative instruments recognized in fund earnings during the year ended May 31, 2010, and the related location on the accompanying Statement of Operations is summarized in the following table by primary underlying risk exposure:
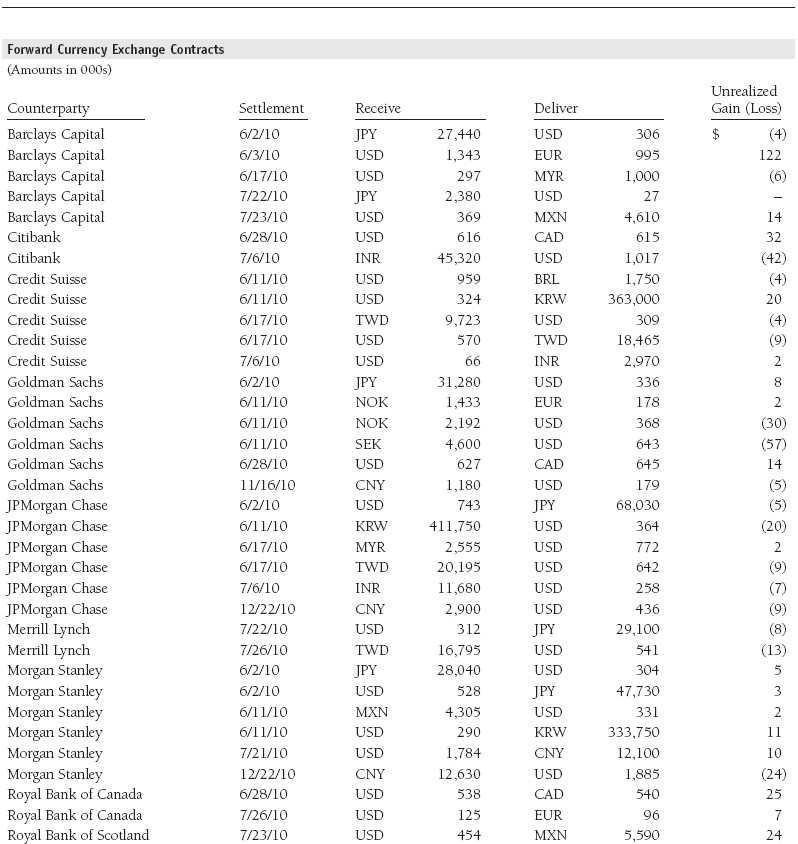
Forward Currency Exchange Contracts The fund is subject to foreign currency exchange rate risk in the normal course of pursuing its investment objectives. It uses forward currency exchange contracts (forwards) primarily to protect its non-U.S. dollar-denominated securities from adverse currency movements relative to the U.S. dollar. A forward involves an obligation to purchase or sell a fixed amount of a specific currency on a future date at a price set at the time of the contract. Although certain forwards may be settled by exchanging only the net gain or loss on the contract, most forwards are settled with the exchange of the underlying currencies in accordance with the specified terms. Forwards are valued at the unrealized gain or loss on the contract, which reflects the net amount the fund either is entitled to receive or obligated to deliver, as measured by the difference between the forward exchange rates at the date of entry into the contract and the forward rates at the reporting date. Appreciated forwards are reflected as assets, and depreciated forwards are reflected as liabilities on the accompanying Statement of Assets and Liabilities. Risks related to the use of forwards include the possible failure of counterparties to meet the terms of the agreements; that anticipated currency movements will not occur, thereby reducing the fund’s total return; and the potential for losses in excess of the fund’s initial investment. During the year ended May 31, 2010, the fund’s exposure to forwards, based on underlying notional amounts, was generally between 6% and 13% of net assets.
Futures Contracts The fund is subject to interest rate risk and/or foreign currency exchange rate risk in the normal course of pursuing its investment objectives and uses futures contracts to help manage such risks. The fund may enter into futures contracts to manage exposure to interest rate and yield curve movements, security prices, foreign currencies, credit quality, and mortgage prepayments; as an efficient means of adjusting exposure to all or part of a target market; to enhance income; as a cash management tool; and/or to adjust portfolio duration and credit exposure. A futures contract provides for the future sale by one party and purchase by another of a specified amount of a particular underlying financial instrument at an agreed-upon price, date, time, and place. The fund currently invests only in exchange-traded futures, which generally are standardized as to maturity date, underlying financial instrument, and other contract terms. Upon entering into a futures contract, the fund is required to deposit with the broker cash or securities in an amount equal to a certain percentage of the contract value (initial margin deposit); the margin deposit must then be maintained at the established level over the life of the contract. Subsequent payments are made or received by the fund each day to settle daily fluctuations in the value of the contract (variation margin), which reflect changes in the value of the underlying financial instrument. Variation margin is recorded as unrealized gain or loss until the contract is closed. The value of a futures contract included in net assets is the amount of unsettled variation margin; net variation margin receivable is reflected as an asset, and net variation margin payable is reflected as a liability on the accompanying Statement of Assets and Liabilities. Risks related to the use of futures contracts include possible illiquidity of the futures markets, contract prices that can be highly volatile and imperfectly correlated to movements in hedged security values and/or interest rates and/or currency values, and potential losses in excess of the fund’s initial investment. During the year ended May 31, 2010, the fund’s exposure to futures, based on underlying notional amounts, was generally between 0% and 3% of net assets.
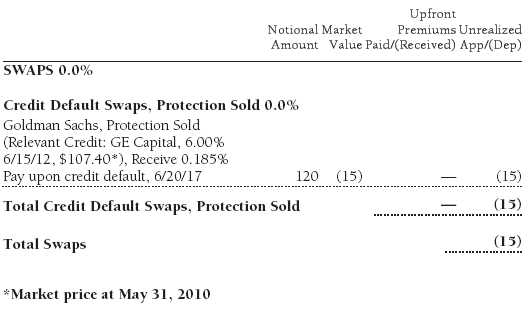
Credit Default Swaps The fund is subject to credit risk in the normal course of pursuing its investment objectives and uses swap contracts to help manage such risk. The fund may use swaps in an effort to manage exposure to changes in interest rates and credit quality, to adjust overall exposure to certain markets, to enhance total return or protect the value of portfolio securities, to serve as a cash management tool, and/or to adjust portfolio duration or credit exposure. Credit default swaps are agreements where one party (the protection buyer) agrees to make periodic payments to another party (the protection seller) in exchange for protection against specified credit events, such as certain defaults and bankruptcies related to an underlying credit instrument, index, or issuer thereof. Upon occurrence of a specified credit event, the protection seller is required to pay the buyer the difference between the notional amount of the swap and the value of the underlying credit, either in the form of a net cash settlement or by paying the gross notional amount and accepting delivery of the relevant underlying credit. Generally, the payment risk for the seller of protection is inversely related to the current market price of the underlying credit; therefore, the payment risk increases as the price of the relevant underlying credit declines due to market valuations of credit quality. As of May 31, 2010, the notional amount of protection sold by the fund totaled $120,000 (0.1% of net assets), which reflects the maximum potential amount the fund could be required to pay under such contracts. The value of a swap included in net assets is the unrealized gain or loss on the contract plus or minus any unamortized premiums paid or received, respectively. Appreciated swaps and premiums paid are reflected as assets, and depreciated swaps and premiums received are reflected as liabilities on the accompanying Statement of Assets and Liabilities. Net periodic receipts or payments required by swaps are accrued daily and are recorded as realized gain or loss for financial reporting purposes; fluctuations in the fair value of swaps are reflected in the change in net unrealized gain or loss and are reclassified to realized gain or loss upon termination prior to maturity or cash settlement. Risks related to the use of credit default swaps include the possible inability of the fund to accurately assess the current and future creditworthiness of underlying issuers, the possible failure of a counterparty to perform in accordance with the terms of the swap agreements, potential government regulation that could adversely affect the fund’s swap investments, and potential losses in excess of the fund’s initial investment. During the year ended May 31, 2010, the fund’s exposure to swaps, based on underlying notional amounts, was generally between 0% and 1% of net assets.
Counterparty Risk and Collateral The fund has entered into collateral agreements with certain counterparties to mitigate counterparty risk associated with over-the-counter (OTC) derivatives, including swaps and forward currency exchange contracts. Subject to certain minimum exposure requirements (which range from $100,000 to $500,000), collateral generally is determined based on the net aggregate unrealized gain or loss on all OTC derivative contracts with a particular counterparty. Collateral, both pledged by and for the benefit of the fund, is held in a segregated account by a third-party agent and can be in the form of cash or debt securities issued by the U.S. government or related agencies. Securities posted as collateral by the fund are so noted in the accompanying Portfolio of Investments and remain in the fund’s net assets. As of May 31, 2010, no collateral was pledged by either the fund or counterparties.
At any point in time, the fund’s risk of loss from counterparty credit risk on OTC derivatives is the aggregate unrealized gain on appreciated contracts in excess of any collateral pledged by the counterparty for the benefit of the fund. In accordance with standard derivatives agreements, counterparties to OTC derivatives may be able to terminate derivative contracts prior to maturity in the event the fund fails to maintain sufficient asset coverage; its net assets decline by stated percentages; or it otherwise fails to meet the terms of its agreements, which would cause the fund to accelerate payment of any net liability owed to the counterparty under the contract.
NOTE 4 - OTHER INVESTMENT TRANSACTIONS
Consistent with its investment objective, the fund engages in the following practices to manage exposure to certain risks and/or to enhance performance. The investment objective, policies, program, and risk factors of the fund are described more fully in the fund’s prospectus and Statement of Additional Information.
Noninvestment-Grade Debt Securities At May 31, 2010, approximately 10% of the fund’s net assets were invested, either directly or through its investment in T. Rowe Price institutional funds, in noninvestment-grade debt securities, commonly referred to as “high yield” or “junk” bonds. The noninvestment-grade bond market may experience sudden and sharp price swings due to a variety of factors, including changes in economic forecasts, stock market activity, large sustained sales by major investors, a high-profile default, or a change in the market’s psychology. These events may decrease the ability of issuers to make principal and interest payments and adversely affect the liquidity or value, or both, of such securities.
Restricted Securities The fund may invest in securities that are subject to legal or contractual restrictions on resale. Prompt sale of such securities at an acceptable price may be difficult and may involve substantial delays and additional costs.
TBA Purchase Commitments During the year ended May 31, 2010, the fund entered into to be announced (TBA) purchase commitments, pursuant to which it agrees to purchase mortgage-backed securities for a fixed unit price, with payment and delivery at a scheduled future date beyond the customary settlement period for that security. With TBA transactions, the particular securities to be delivered are not identified at the trade date; however, delivered securities must meet specified terms, including issuer, rate, and mortgage term, and be within industry-accepted “good delivery” standards. The fund generally enters into TBA transactions with the intention of taking possession of the underlying mortgage securities. Until settlement, the fund maintains cash reserves and liquid assets sufficient to settle its TBA commitments.
T. Rowe Price Term Asset-Backed Opportunity Fund, L.L.C. During the year ended May 31, 2010, the fund invested in the T. Rowe Price Term Asset-Backed Opportunity Fund, L.L.C. (private fund), a private investment company managed by Price Associates that participates in the Term Asset-Backed Securities Loan Facility (TALF) program created and administered by the Federal Reserve Bank of New York (FRBNY). The TALF program provides eligible borrowers with term loans secured by eligible asset-backed securities and/or commercial mortgage-backed securities, which are either owned by the borrower or purchased by the borrower and subsequently pledged as collateral for a TALF loan. TALF loans generally are nonrecourse in nature. The private fund is treated as a partnership for federal income tax purposes. It has a limited life extending five years from final termination of the TALF program, currently scheduled for June 30, 2010, with two possible one-year extensions. Invested capital generally will be returned to investors as underlying securities are liquidated and the TALF loans mature, with the balance paid at maturity of the private fund. Ownership interests in the private fund may not be redeemed, sold, or assigned. As of May 31, 2010, the fund had outstanding capital commitments in the amount of $196,000, which may be called at the discretion of the private fund’s manager.
Other Purchases and sales of portfolio securities other than short-term and U.S. government securities aggregated $44,016,000 and $38,611,000, respectively, for the year ended May 31, 2010. Purchases and sales of U.S. government securities aggregated $72,956,000 and $51,480,000, respectively, for the year ended May 31, 2010.
NOTE 5 - FEDERAL INCOME TAXES
No provision for federal income taxes is required since the fund intends to continue to qualify as a regulated investment company under Subchapter M of the Internal Revenue Code and distribute to shareholders all of its taxable income and gains. Distributions determined in accordance with federal income tax regulations may differ in amount or character from net investment income and realized gains for financial reporting purposes. Financial reporting records are adjusted for permanent book/tax differences to reflect tax character but are not adjusted for temporary differences.
The fund files U.S. federal, state, and local tax returns as required. The fund’s tax returns are subject to examination by the relevant tax authorities until expiration of the applicable statute of limitations, which is generally three years after filing of the tax return but could be longer in certain circumstances.
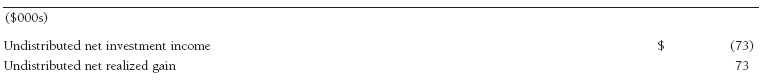
Reclassifications between income and gain relate primarily to the character of currency gains and losses. For the year ended May 31, 2010, the following reclassifications were recorded to reflect tax character; there was no impact on results of operations or net assets:
Distributions during the years ended May 31, 2010 and May 31, 2009, totaled $4,733,000 and $5,399,000, respectively, and were characterized as ordinary income for tax purposes. At May 31, 2010, the tax-basis cost of investments and components of net assets were as follows:
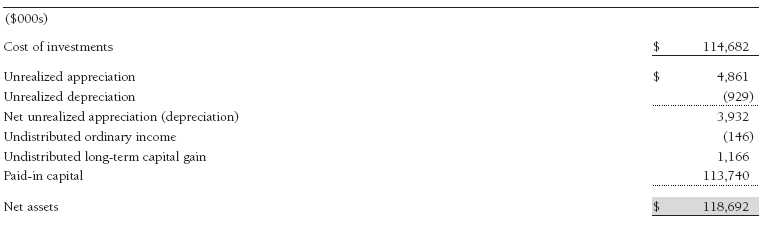
The difference between book-basis and tax-basis net unrealized appreciation (depreciation) is attributable to the realization of unrealized gains/losses on certain open derivative contracts for tax purposes.
NOTE 6 - RELATED PARTY TRANSACTIONS
The fund is managed by T. Rowe Price Associates, Inc. (the manager or Price Associates), a wholly owned subsidiary of T. Rowe Price Group, Inc. The investment management and administrative agreement between the fund and the manager provides for an all-inclusive annual fee equal to 0.45% of the fund’s average daily net assets. The fee is computed daily and paid monthly. The agreement provides that investment management, shareholder servicing, transfer agency, accounting, custody services, and directors’ fees and expenses are provided to the fund, and interest, taxes, brokerage commissions, and extraordinary expenses are paid directly by the fund.
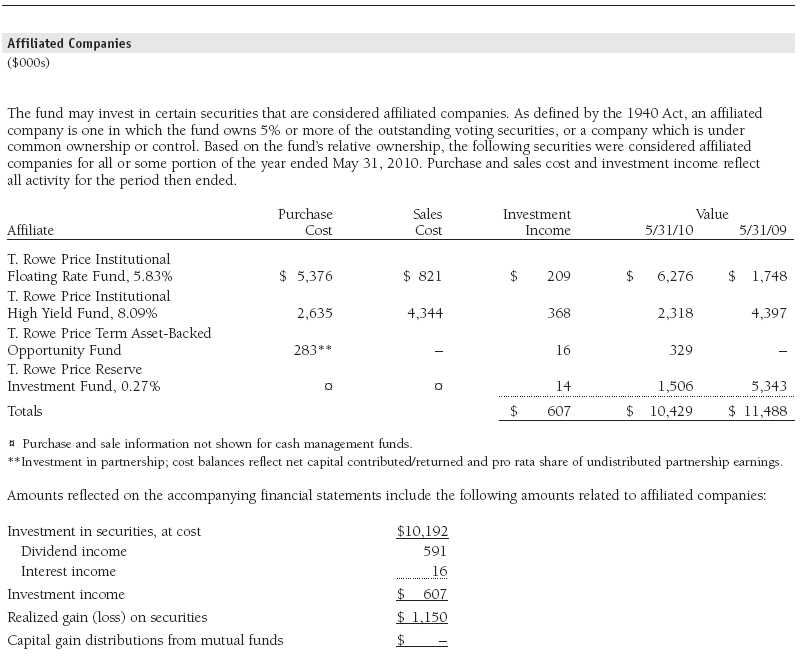
The fund may invest in the T. Rowe Price Reserve Investment Fund and the T. Rowe Price Government Reserve Investment Fund (collectively, the T. Rowe Price Reserve Investment Funds), open-end management investment companies managed by Price Associates and considered affiliates of the fund. The T. Rowe Price Reserve Investment Funds are offered as cash management options to mutual funds, trusts, and other accounts managed by Price Associates and/or its affiliates and are not available for direct purchase by members of the public. The T. Rowe Price Reserve Investment Funds pay no investment management fees.
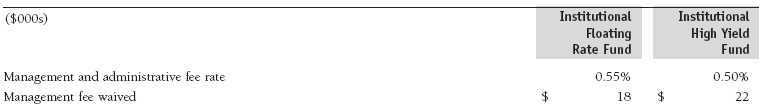
The fund may also invest in certain T. Rowe Price institutional funds (underlying institutional funds) as a means of gaining efficient and cost-effective exposure to certain markets. The underlying institutional funds are open-end management investment companies managed by Price Associates and/or T. Rowe Price International, Inc. (collectively, the Price managers) and are considered affiliates of the fund. Each underlying institutional fund pays an all-inclusive management and administrative fee to its Price manager. To ensure that the fund does not incur duplicate fees, each Price manager has agreed to permanently waive a portion of its management fee charged to the fund in an amount sufficient to fully offset the fees paid by the underlying institutional funds related to fund assets invested therein. Accordingly, the accompanying Statement of Operations includes management fees permanently waived pursuant to this agreement. Annual fee rates and amounts waived within the accompanying Statement of Operations related to shares of the underlying institutional funds for the year ended May 31, 2010, are as follows:
As of May 31, 2010, T. Rowe Price Group, Inc., and/or its wholly owned subsidiaries owned 1,814,848 shares of the fund, representing 16% of the fund’s net assets.
Report of Independent Registered Public Accounting Firm
To the Board of Trustees of T. Rowe Price Institutional Income Funds, Inc. and
Shareholders of T. Rowe Price Institutional Core Plus Fund
In our opinion, the accompanying statement of assets and liabilities, including the portfolio of investments, and the related statements of operations and of changes in net assets and the financial highlights present fairly, in all material respects, the financial position of T. Rowe Price Institutional Core Plus Fund (one of the portfolios comprising T. Rowe Price Institutional Income Funds, Inc., hereafter referred to as the “Fund”) at May 31, 2010, the results of its operations for the five years then ended, the changes in its net assets for each of the two years in the period then ended and the financial highlights for each of the fiscal years presented, in conformity with accounting principles generally accepted in the United States of America. These financial statements and financial highlights (hereafter referred to as “financial statements”) are the responsibility of the Fund’s management; our responsibility is to express an opinion on these financial statements based on our audits. We conducted our audits of these financial statements in accordance with the standards of the Public Company Accounting Oversight Board (United States). Those standards require that we plan and perform the audit to obtain reasonable assurance about whether the financial statements are free of material misstatement. An audit includes examining, on a test basis, evidence supporting the amounts and disclosures in the financial statements, assessing the accounting principles used and significant estimates made by management, and evaluating the overall financial statement presentation. We believe that our audits, which included confirmation of securities at May 31, 2010 by correspondence with the custodian and brokers, and confirmation of the underlying funds by correspondence with the transfer agent and recordkeeper, provide a reasonable basis for our opinion.
PricewaterhouseCoopers LLP
Baltimore, Maryland
July 16, 2010
| Information on Proxy Voting Policies, Procedures, and Records |
A description of the policies and procedures used by T. Rowe Price funds and portfolios to determine how to vote proxies relating to portfolio securities is available in each fund’s Statement of Additional Information, which you may request by calling 1-800-225-5132 or by accessing the SEC’s Web site, www.sec.gov. The description of our proxy voting policies and procedures is also available on our Web site, www.troweprice.com. To access it, click on the words “Our Company” at the top of our corporate homepage. Then, when the next page appears, click on the words “Proxy Voting Policies” on the left side of the page.
Each fund’s most recent annual proxy voting record is available on our Web site and through the SEC’s Web site. To access it through our Web site, follow the directions above, then click on the words “Proxy Voting Records” on the right side of the Proxy Voting Policies page.
| How to Obtain Quarterly Portfolio Holdings |
The fund files a complete schedule of portfolio holdings with the Securities and Exchange Commission for the first and third quarters of each fiscal year on Form N-Q. The fund’s Form N-Q is available electronically on the SEC’s Web site (www.sec.gov); hard copies may be reviewed and copied at the SEC’s Public Reference Room, 450 Fifth St. N.W., Washington, DC 20549. For more information on the Public Reference Room, call 1-800-SEC-0330.
| Approval of Investment Management Agreement |
On March 9, 2010, the fund’s Board of Directors (Board) unanimously approved the continuation of the investment advisory contract (Contract) between the fund and its investment manager, T. Rowe Price Associates, Inc. (Adviser). The Board considered a variety of factors in connection with its review of the Contract, also taking into account information provided by the Adviser during the course of the year, as discussed below:
Services Provided by the Adviser
The Board considered the nature, quality, and extent of the services provided to the fund by the Adviser. These services included, but were not limited to, management of the fund’s portfolio and a variety of related activities, as well as financial and administrative services, reporting, and communications. The Board also reviewed the background and experience of the Adviser’s senior management team and investment personnel involved in the management of the fund. The Board concluded that it was satisfied with the nature, quality, and extent of the services provided by the Adviser.
Investment Performance of the Fund
The Board reviewed the fund’s average annual total returns over the one-, three-, and five-year and since-inception periods, as well as the fund’s year-by-year returns, and compared these returns with a wide variety of previously agreed upon comparable performance measures and market data, including those supplied by Lipper and Morningstar, which are independent providers of mutual fund data. On the basis of this evaluation and the Board’s ongoing review of investment results, and factoring in the severity of the market turmoil during 2008 and 2009, the Board concluded that the fund’s performance was satisfactory.
Costs, Benefits, Profits, and Economies of Scale
The Board reviewed detailed information regarding the revenues received by the Adviser under the Contract and other benefits that the Adviser (and its affiliates) may have realized from its relationship with the fund, including research received under “soft dollar” agreements and commission-sharing arrangements with broker-dealers. The Board considered that the Adviser may receive some benefit from its soft-dollar arrangements pursuant to which it receives research from broker-dealers that execute the applicable fund’s portfolio transactions. The Board also received information on the estimated costs incurred and profits realized by the Adviser and its affiliates from advising T. Rowe Price mutual funds. The Board did not review information regarding profits realized from managing the fund in particular because the fund had not achieved sufficient scale in terms of portfolio asset size to produce meaningful profit margin percentages. The Board concluded that the Adviser’s profits from advising T. Rowe Price mutual funds were reasonable in light of the services provided to the fund. The Board also considered whether the fund or other funds benefit under the fee levels set forth in the Contract from any economies of scale realized by the Adviser. The Board noted that, under the Contract, the fund pays the Adviser a single fee based on the fund’s assets and that the Adviser, in turn, pays all expenses of the fund, with certain exceptions. The Board concluded that, based on the profitability data it reviewed and consistent with this single-fee structure, the Contract provided for a reasonable sharing of any benefits from economies of scale with the fund.
Fees
The Board reviewed the fund’s single-fee structure and compared it with fees and expenses of other comparable funds based on information and data supplied by Lipper. The information provided to the Board indicated that the fund’s management fee rate and the fund’s total expense ratio were below the median for comparable funds. (For these purposes, the Board assumed the fund’s management fee rate was equal to the single fee less the fund’s operating expenses and after including any reductions of the management fee rate as a result of any applicable fee waivers or expenses paid by the Adviser.) The Board also reviewed the fee schedules for institutional accounts of the Adviser and its affiliates with smaller mandates. Management informed the Board that the Adviser’s responsibilities for institutional accounts are more limited than its responsibilities for the fund and other T. Rowe Price mutual funds that it or its affiliates advise and that the Adviser performs significant additional services and assumes greater risk for the fund and other T. Rowe Price mutual funds that it advises than it does for institutional accounts. On the basis of the information provided, the Board concluded that the fees paid by the fund under the Contract were reasonable.
Approval of the Contract
As noted, the Board approved the continuation of the Contract. No single factor was considered in isolation or to be determinative to the decision. Rather, the Board was assisted by the advice of independent legal counsel and concluded, in light of a weighting and balancing of all factors considered, that it was in the best interests of the fund to approve the continuation of the Contract, including the fees to be charged for services thereunder.
| About the Fund’s Directors and Officers |
Your fund is overseen by a Board of Directors (Board) that meets regularly to review a wide variety of matters affecting the fund, including performance, investment programs, compliance matters, advisory fees and expenses, service providers, and other business affairs. The Board elects the fund’s officers, who are listed in the final table. At least 75% of Board members are independent of T. Rowe Price Associates, Inc. (T. Rowe Price), and T. Rowe Price International, Inc. (T. Rowe Price International); “inside” or “interested” directors are employees or officers of T. Rowe Price. The business address of each director and officer is 100 East Pratt Street, Baltimore, Maryland 21202. The Statement of Additional Information includes additional information about the fund directors and is available without charge by calling a T. Rowe Price representative at 1-800-225-5132.
| Independent Directors | |
| |
| Name (Year of Birth) | |
| Year Elected* | Principal Occupation(s) During Past Five Years and Directorships of Other Public Companies |
| | |
| William R. Brody (1944) | President and Trustee, Salk Institute for Biological Studies (2009 to present); Director, Novartis, Inc. (2009 |
| 2009 | to present); Director, IBM (2007 to present); President and Trustee, Johns Hopkins University (1996 to 2009); |
| | Chairman of Executive Committee and Trustee, Johns Hopkins Health System (1996 to 2009) |
| | |
| Jeremiah E. Casey (1940) | Director, National Life Insurance (2001 to 2005); Director, NLV Financial Corporation (2004 to 2005) |
| 2006 | |
| | |
| Anthony W. Deering (1945) | Chairman, Exeter Capital, LLC, a private investment firm (2004 to present); Director, Under Armour (2008 to |
| 2002 | present); Director, Vornado Real Estate Investment Trust (2004 to present); Director, Mercantile Bankshares |
| | (2002 to 2007); Member, Advisory Board, Deutsche Bank North America (2004 to present) |
| | |
| Donald W. Dick, Jr. (1943) | Principal, EuroCapital Partners, LLC, an acquisition and management advisory firm (1995 to present) |
| 2002 | |
| | |
| Karen N. Horn (1943) | Senior Managing Director, Brock Capital Group, an advisory and investment banking firm (2004 to present); |
| 2003 | Director, Eli Lilly and Company (1987 to present); Director, Simon Property Group (2004 to present); Director, |
| | Norfolk Southern (2008 to present); Director, Georgia Pacific (2004 to 2005); Director, Fannie Mae (2006 to 2008) |
| | |
| Theo C. Rodgers (1941) | President, A&R Development Corporation (1977 to present) |
| 2005 | |
| | |
| John G. Schreiber (1946) | Owner/President, Centaur Capital Partners, Inc., a real estate investment company (1991 to present); Cofounder |
| 2002 | and Partner, Blackstone Real Estate Advisors, L.P. (1992 to present) |
| | |
| Mark R. Tercek (1957) | President and Chief Executive Officer, The Nature Conservancy (2008 to present); Managing Director, The Goldman |
| 2009 | Sachs Group, Inc. (1984 to 2008) |
| |
| *Each independent director oversees 125 T. Rowe Price portfolios and serves until retirement, resignation, or election of a successor. |
| | |
| Inside Directors | |
| |
| Name (Year of Birth) | |
| Year Elected* [Number of | |
| T. Rowe Price Portfolios | |
| Overseen] | Principal Occupation(s) During Past Five Years and Other Directorships of Public Companies |
| | |
| Edward C. Bernard (1956) | Director and Vice President, T. Rowe Price; Vice Chairman of the Board, Director, and Vice President, T. Rowe Price |
| 2006 [125] | Group, Inc.; Chairman of the Board, Director, and President, T. Rowe Price Investment Services, Inc.; Chairman of |
| | the Board and Director, T. Rowe Price Global Asset Management Limited, T. Rowe Price Global Investment Services |
| | Limited, T. Rowe Price Retirement Plan Services, Inc., T. Rowe Price Savings Bank, and T. Rowe Price Services, |
| | Inc.; Director, T. Rowe Price International, Inc.; Chief Executive Officer, Chairman of the Board, Director, and |
| | President, T. Rowe Price Trust Company; Chairman of the Board, all funds |
| | |
| Michael C. Gitlin (1970) | Vice President, T. Rowe Price, T. Rowe Price Global Investment Services Limited, T. Rowe Price Group, Inc., and |
| 2010 [39] | T. Rowe Price International, Inc.; Director of Fixed Income, T. Rowe Price (2009 to present); Global Head of |
| | Trading, T. Rowe Price (2007 to 2009); formerly Head of U.S. Equity Sales, Citigroup Global Markets (2005 to 2007) |
| |
| *Each inside director serves until retirement, resignation, or election of a successor. |
| Officers | |
| |
| Name (Year of Birth) | |
| Position Held With Institutional Income Funds | Principal Occupation(s) |
| | |
| David C. Beers, CFA (1970) | Vice President, T. Rowe Price and T. Rowe Price Group, Inc. |
| Assistant Vice President | |
| | |
| Brian J. Brennan, CFA (1964) | Vice President, T. Rowe Price, T. Rowe Price Global Investment Services |
| Executive Vice President | Limited, T. Rowe Price Group, Inc., and T. Rowe Price Trust Company |
| | |
| Andrew M. Brooks (1956) | Vice President, T. Rowe Price and T. Rowe Price Group, Inc. |
| Vice President | |
| | |
| Michael J. Conelius, CFA (1964) | Vice President, T. Rowe Price, T. Rowe Price Global Investment Services |
| Vice President | Limited, T. Rowe Price Group, Inc., T. Rowe Price International, Inc., and |
| | T. Rowe Price Trust Company |
| | |
| Roger L. Fiery III, CPA (1959) | Vice President, T. Rowe Price, T. Rowe Price Group, Inc., T. Rowe Price |
| Vice President | International, Inc., and T. Rowe Price Trust Company |
| | |
| Justin T. Gerbereux, CFA (1975) | Vice President, T. Rowe Price and T. Rowe Price Group, Inc. |
| Executive Vice President | |
| | |
| John R. Gilner (1961) | Chief Compliance Officer and Vice President, T. Rowe Price; Vice President, |
| Chief Compliance Officer | T. Rowe Price Group, Inc., and T. Rowe Price Investment Services, Inc. |
| | |
| Gregory S. Golczewski (1966) | Vice President, T. Rowe Price and T. Rowe Price Trust Company |
| Vice President | |
| | |
| Gregory K. Hinkle, CPA (1958) | Vice President, T. Rowe Price, T. Rowe Price Group, Inc., and T. Rowe Price |
| Treasurer | Trust Company; formerly Partner, PricewaterhouseCoopers LLP (to 2007) |
| | |
| Steven C. Huber, CFA, FSA (1958) | Vice President, T. Rowe Price and T. Rowe Price Group, Inc.; formerly |
| Vice President | Chief Investment Officer, Maryland State Retirement Agency pension fund |
| | (to 2006) |
| | |
| Paul A. Karpers, CFA (1967) | Vice President, T. Rowe Price and T. Rowe Price Group, Inc. |
| Executive Vice President | |
| | |
| Ian D. Kelson (1956) | Vice President, T. Rowe Price, T. Rowe Price Global Investment Services |
| Vice President | Limited, T. Rowe Price Group, Inc., and T. Rowe Price International, Inc. |
| | |
| Patricia B. Lippert (1953) | Assistant Vice President, T. Rowe Price and T. Rowe Price Investment |
| Secretary | Services, Inc. |
| | |
| Paul M. Massaro, CFA (1975) | Vice President, T. Rowe Price and T. Rowe Price Group, Inc. |
| Executive Vice President | |
| | |
| Andrew McCormick (1960) | Vice President, T. Rowe Price, T. Rowe Price Group, Inc., and T. Rowe Price |
| Vice President | Trust Company; formerly Chief Investment Officer, IMPAC Mortgage Holdings |
| | (to 2008); Senior Portfolio Manager, Avenue Capital Group (to 2006); and |
| | Senior Vice President, Portfolio Transactions, Federal National Mortgage |
| | Association (to 2005) |
| | |
| Michael J. McGonigle (1966) | Vice President, T. Rowe Price and T. Rowe Price Group, Inc. |
| Vice President | |
| | |
| David Oestreicher (1967) | Director and Vice President, T. Rowe Price Investment Services, Inc., |
| Vice President | T. Rowe Price Trust Company, and T. Rowe Price Services, Inc.; Vice |
| | President, T. Rowe Price, T. Rowe Price Global Asset Management Limited, |
| | T. Rowe Price Global Investment Services Limited, T. Rowe Price Group, |
| | Inc., T. Rowe Price International, Inc., and T. Rowe Price Retirement Plan |
| | Services, Inc. |
| | |
| Brian A. Rubin, CPA (1974) | Vice President, T. Rowe Price and T. Rowe Price Trust Company |
| Assistant Vice President | |
| | |
| Deborah D. Seidel (1962) | Vice President, T. Rowe Price, T. Rowe Price Investment Services, Inc., and |
| Vice President | T. Rowe Price Services, Inc. |
| | |
| Daniel O. Shackelford, CFA (1958) | Vice President, T. Rowe Price, T. Rowe Price Group, Inc., and T. Rowe Price |
| Vice President | Trust Company |
| | |
| Walter P. Stuart III, CFA (1960) | Vice President, T. Rowe Price and T. Rowe Price Group, Inc. |
| Vice President | |
| | |
| Thomas E. Tewksbury (1961) | Vice President, T. Rowe Price, T. Rowe Price Group, Inc., and T. Rowe Price |
| Vice President | Trust Company |
| |
| David A. Tiberii, CFA (1965) | Vice President, T. Rowe Price, T. Rowe Price Global Investment Services |
| Vice President | Limited, and T. Rowe Price Group, Inc. |
| | |
| Mark J. Vaselkiv (1958) | Vice President, T. Rowe Price, T. Rowe Price Group, Inc., T. Rowe Price |
| President | International, Inc., and T. Rowe Price Trust Company |
| | |
| Julie L. Waples (1970) | Vice President, T. Rowe Price |
| Vice President | |
| | |
| Thea N. Williams (1961) | Vice President, T. Rowe Price, T. Rowe Price Group, Inc., and T. Rowe Price |
| Vice President | Trust Company |
| |
| Unless otherwise noted, officers have been employees of T. Rowe Price or T. Rowe Price International for at least five years. |
Item 2. Code of Ethics.
The registrant has adopted a code of ethics, as defined in Item 2 of Form N-CSR, applicable to its principal executive officer, principal financial officer, principal accounting officer or controller, or persons performing similar functions. A copy of this code of ethics is filed as an exhibit to this Form N-CSR. No substantive amendments were approved or waivers were granted to this code of ethics during the period covered by this report.
Item 3. Audit Committee Financial Expert.
The registrant’s Board of Directors/Trustees has determined that Mr. Anthony W. Deering qualifies as an audit committee financial expert, as defined in Item 3 of Form N-CSR. Mr. Deering is considered independent for purposes of Item 3 of Form N-CSR.
Item 4. Principal Accountant Fees and Services.
(a) – (d) Aggregate fees billed to the registrant for the last two fiscal years for professional services rendered by the registrant’s principal accountant were as follows:
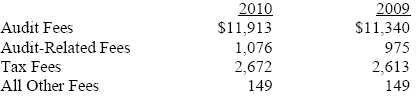
Audit fees include amounts related to the audit of the registrant’s annual financial statements and services normally provided by the accountant in connection with statutory and regulatory filings. Audit-related fees include amounts reasonably related to the performance of the audit of the registrant’s financial statements and specifically include the issuance of a report on internal controls and, if applicable, agreed-upon procedures related to fund acquisitions. Tax fees include amounts related to services for tax compliance, tax planning, and tax advice. The nature of these services specifically includes the review of distribution calculations and the preparation of Federal, state, and excise tax returns. All other fees include the registrant’s pro-rata share of amounts for agreed-upon procedures in conjunction with service contract approvals by the registrant’s Board of Directors/Trustees.
(e)(1) The registrant’s audit committee has adopted a policy whereby audit and non-audit services performed by the registrant’s principal accountant for the registrant, its investment adviser, and any entity controlling, controlled by, or under common control with the investment adviser that provides ongoing services to the registrant require pre-approval in advance at regularly scheduled audit committee meetings. If such a service is required between regularly scheduled audit committee meetings, pre-approval may be authorized by one audit committee member with ratification at the next scheduled audit committee meeting. Waiver of pre-approval for audit or non-audit services requiring fees of a de minimis amount is not permitted.
(2) No services included in (b) – (d) above were approved pursuant to paragraph (c)(7)(i)(C) of Rule 2-01 of Regulation S-X.
(f) Less than 50 percent of the hours expended on the principal accountant’s engagement to audit the registrant’s financial statements for the most recent fiscal year were attributed to work performed by persons other than the principal accountant’s full-time, permanent employees.
(g) The aggregate fees billed for the most recent fiscal year and the preceding fiscal year by the registrant’s principal accountant for non-audit services rendered to the registrant, its investment adviser, and any entity controlling, controlled by, or under common control with the investment adviser that provides ongoing services to the registrant were $1,879,000 and $1,922,000, respectively.
(h) All non-audit services rendered in (g) above were pre-approved by the registrant’s audit committee. Accordingly, these services were considered by the registrant’s audit committee in maintaining the principal accountant’s independence.
Item 5. Audit Committee of Listed Registrants.
Not applicable.
Item 6. Investments.
(a) Not applicable. The complete schedule of investments is included in Item 1 of this Form N-CSR.
(b) Not applicable.
Item 7. Disclosure of Proxy Voting Policies and Procedures for Closed-End Management Investment Companies.
Not applicable.
Item 8. Portfolio Managers of Closed-End Management Investment Companies.
Not applicable.
Item 9. Purchases of Equity Securities by Closed-End Management Investment Company and Affiliated Purchasers.
Not applicable.
Item 10. Submission of Matters to a Vote of Security Holders.
Not applicable.
Item 11. Controls and Procedures.
(a) The registrant’s principal executive officer and principal financial officer have evaluated the registrant’s disclosure controls and procedures within 90 days of this filing and have concluded that the registrant’s disclosure controls and procedures were effective, as of that date, in ensuring that information required to be disclosed by the registrant in this Form N-CSR was recorded, processed, summarized, and reported timely.
(b) The registrant’s principal executive officer and principal financial officer are aware of no change in the registrant’s internal control over financial reporting that occurred during the registrant’s second fiscal quarter covered by this report that has materially affected, or is reasonably likely to materially affect, the registrant’s internal control over financial reporting.
Item 12. Exhibits.
(a)(1) The registrant’s code of ethics pursuant to Item 2 of Form N-CSR is attached.
(2) Separate certifications by the registrant's principal executive officer and principal financial officer, pursuant to Section 302 of the Sarbanes-Oxley Act of 2002 and required by Rule 30a-2(a) under the Investment Company Act of 1940, are attached.
(3) Written solicitation to repurchase securities issued by closed-end companies: not applicable.
(b) A certification by the registrant's principal executive officer and principal financial officer, pursuant to Section 906 of the Sarbanes-Oxley Act of 2002 and required by Rule 30a-2(b) under the Investment Company Act of 1940, is attached.
| | |
SIGNATURES |
| |
| | Pursuant to the requirements of the Securities Exchange Act of 1934 and the Investment |
| Company Act of 1940, the registrant has duly caused this report to be signed on its behalf by the |
| undersigned, thereunto duly authorized. |
| |
| T. Rowe Price Institutional Income Funds, Inc. |
| |
| |
| By | /s/ Edward C. Bernard |
| | Edward C. Bernard |
| | Principal Executive Officer |
| |
| Date | July 16, 2010 |
| |
| |
| |
| | Pursuant to the requirements of the Securities Exchange Act of 1934 and the Investment |
| Company Act of 1940, this report has been signed below by the following persons on behalf of |
| the registrant and in the capacities and on the dates indicated. |
| |
| |
| By | /s/ Edward C. Bernard |
| | Edward C. Bernard |
| | Principal Executive Officer |
| |
| Date | July 16, 2010 |
| |
| |
| |
| By | /s/ Gregory K. Hinkle |
| | Gregory K. Hinkle |
| | Principal Financial Officer |
| |
| Date | July 16, 2010 |