| UNITED STATES |
| SECURITIES AND EXCHANGE COMMISSION |
| Washington, D.C. 20549 |
| |
FORM N-CSR |
| |
CERTIFIED SHAREHOLDER REPORT OF REGISTERED |
MANAGEMENT INVESTMENT COMPANIES |
| |
| |
| |
| Investment Company Act File Number: 811-21055 |
|
| |
| T. Rowe Price Institutional Income Funds, Inc. |
|
| (Exact name of registrant as specified in charter) |
| |
| 100 East Pratt Street, Baltimore, MD 21202 |
|
| (Address of principal executive offices) |
| |
| David Oestreicher |
| 100 East Pratt Street, Baltimore, MD 21202 |
|
| (Name and address of agent for service) |
| |
| |
| Registrant’s telephone number, including area code: (410) 345-2000 |
| |
| |
| Date of fiscal year end: May 31 |
| |
| |
| Date of reporting period: May 31, 2010 |
Item 1: Report to Shareholders| Institutional Floating Rate Fund | May 31, 2010 |
• The environment for bank debt was positive for the six months and year ended May 31, 2010, although a measure of uncertainty crept into the market as the reporting period came to a close.
• The Institutional Floating Rate Fund generated good absolute returns but trailed the S&P/LSTA Performing Loan Index due to credit selection.
• Following a yearlong rally, the loan market traded lower in May in part due to the debt crisis in Europe and uncertainty surrounding the global economic recovery, which led to heightened volatility and risk aversion.
• We believe that leveraged loan issuance will continue to increase with investor demand, the credit quality of companies in our universe will gradually improve, and defaults will steadily trend lower.
The views and opinions in this report were current as of May 31, 2010. They are not guarantees of performance or investment results and should not be taken as investment advice. Investment decisions reflect a variety of factors, and the managers reserve the right to change their views about individual stocks, sectors, and the markets at any time. As a result, the views expressed should not be relied upon as a forecast of the fund’s future investment intent. The report is certified under the Sarbanes-Oxley Act, which requires mutual funds and other public companies to affirm that, to the best of their knowledge, the information in their financial reports is fairly and accurately stated in all material respects.
Manager’s Letter
T. Rowe Price Institutional Floating Rate Fund
Dear Investor
The environment for floating rate loans improved significantly over the year. Our asset class generated solid gains over the six and 12 months ended May 31, 2010. For much of the reporting period, evidence of economic recovery in the U.S., the low interest rate environment, and declining default rate expectations prompted investors to seek out higher-yielding investments. Except for volatility toward the end of the period—when jitters about the European debt crisis caused markets to stumble—the leveraged loan market enjoyed a nearly uninterrupted year of strong returns.
Portfolio Performance
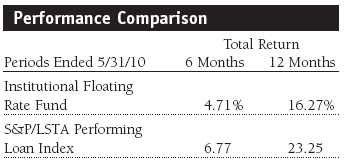
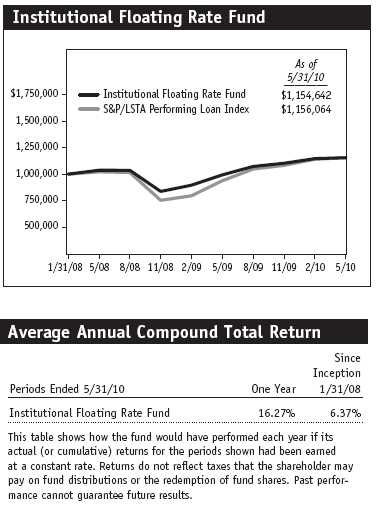
The portfolio gained 4.71% in the last six months and 16.27% for 12 months ended May 31, 2010. Our performance trailed the S&P/LSTA Performing Loan Index in both periods. Although allocation decisions were beneficial, credit selection led to the underperformance versus our benchmark index. We continued to add exposure to lower-rated securities during the period, which narrowed the relative performance gap. However, the fund’s primary focus remains on the higher-quality tiers of our investment universe.
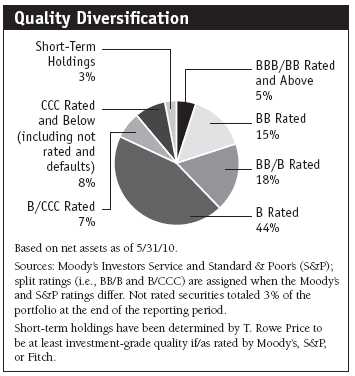
Your portfolio is more conservatively structured than the S&P/LSTA index. Much of the index is made up of loans that originated in 2006 and 2007, when many leveraged buyouts were being financed. These loans were often highly leveraged and had few covenants. This year’s rally was broad-based. As default expectations improved, lower-rated securities rebounded. As evidence, the CCC rated segment in the performing loan index posted an outstanding 17% gain for the last six months.
As shown in the Portfolio Characteristics table, the portfolio’s share price gained $0.14 in the six-month period, and dividend income remained stable at $0.32. The portfolio’s 30-day SEC yield was little changed since our midyear report and ended the period at 5.83%.
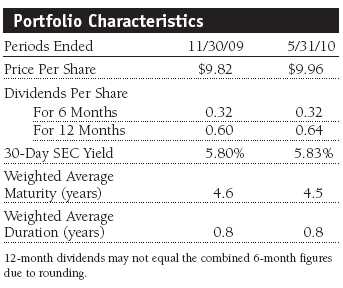
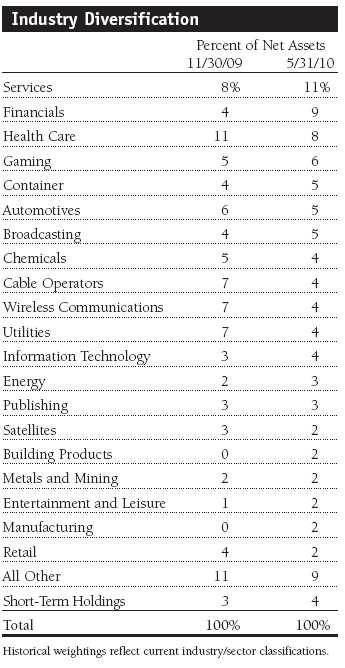
We remain focused on asset-rich companies that are generally in less-cyclical sectors, including services and health care. It is important for us to be able to assess the value of a company’s assets with a high degree of certainty in order to understand our downside protection. Finally, we continue to favor shorter-maturity loans—those due in 2012 and 2013—and have avoided many of the weaker and more speculative loans sold in 2006 and 2007. At the end of the reporting period, the fund’s weighted average maturity was 4.5 years, modestly lower than six months ago.
Market Environment
For most of the past 12 months, the loan market was firm. The asset class benefited from steady cash inflows, positive sentiment, and significant price appreciation as the economy improved and default expectations waned. Investors gravitated to the asset class to capture higher yields than were available in other short-duration investments. In the low interest rate environment, new issuance surged. Approximately $12 billion of leveraged loan transactions closed in May, capping the strongest two months of issuance in more than two years. With company fundamentals improving, default rates trended sharply lower. We believe the default rate in our market could dip to around 4% by the end of 2010 from about 11% in 2009.
Although loan performance was weak in May (the portfolio returned -2.71%), the asset class posted good gains for the six-month period. The S&P/LSTA Performing Loan Index generated a 6.77% advance on the strength in B, CCC, and not rated securities, which earned 7.16%, 17.01%, and 7.85%, respectively. The BB rated issues in the index lagged, gaining just 4.42% since the end of November. Despite the sell-off in May, just two loans defaulted in the month, totaling less than $500 million, and only 17 loan issuers have defaulted for the year to date (totaling $6.5 billion). This pace is well below the same period last year when defaults totaled more than $58 billion. The capital markets and the fundamentals of the underlying issuers in the asset class are improving in what seems to be a broad-based, albeit uneven, economic recovery.
Investment Themes
We have actively positioned the portfolio to benefit from several trends in our market. The first, which we refer to as “amend to extend,” is a theme that we have addressed in prior shareholder letters and believe should continue to be a major focus for us over the next several years. The loan market has a large amount of bank debt scheduled to mature in 2013 and 2014. When a company has a large tranche of debt maturing, it may ask creditors to extend the maturity date on part or all of the outstanding loan in exchange for a higher coupon (two percentage points is fairly common) plus an amendment fee.
Another way issuers can reduce maturing debt is by issuing senior secured bonds to retire existing bank loans. Companies have been willing to pay a higher interest rate on new bonds rather than risk being unable to refinance an existing loan in the near future. We have had several of our loan holdings retired at par via this route. The portfolio has the flexibility to opportunistically invest in senior secured bond issues, which generally pay higher interest income, for the same level of risk.
Bond-for-loan takeouts are the biggest and most prevailing theme in our market now and, in our opinion, for the foreseeable future. Although new issuance has slowed a bit in recent months, it is likely to revive in the not-too-distant future because there are a substantial amount of loans coming due in the next three or four years. At this point, it seems that corporations are attempting to be a bit more opportunistic because of all the progress that has been made over the past year in extending maturities for troubled capital structures. Those that can wait for better market conditions are hoping to issue bonds with lower coupons. The loan market still needs to shrink, and we believe that a majority of the refinancing will occur with senior secured bonds. Looking at new issue yields in the senior secured portion of both markets, we think that the income premium for similar-quality senior secured bonds is currently attractive.
Another theme that has generated gains is buying the debt of companies that are willing and able to issue equity. We owned a handful of companies that have recently issued common stock, which is at the bottom of the capital structure, to pay off loans at the top of the capital structure. In the last six months, MGM Mirage sold about $1 billion of convertible bonds. Hertz also did a sizable deal that materially improved its balance sheet and the company’s overall credit quality. (Please refer to the fund’s portfolio of investments for a complete listing of holdings and the amount each represents of the portfolio.)
Merger and acquisition (M&A) activity has slowed somewhat recently because of the market turmoil but should reemerge as a large issuance driver in the coming quarters. We think that strategic acquisition activity will rise because many investment-grade companies have large cash reserves and are looking to put that money to work. Several of the management teams that we have talked with are saying it is a good time to buy because equity valuations are still relatively low. However, because of economic uncertainties and heightened market volatility, we believe that M&A could be de-emphasized in the near term.
Portfolio Review
The portfolio is largely invested in securities rated B or higher (85% of total net assets). We are focused on owning solid companies that generate current income, offer capital appreciation potential, and have sufficient asset protection to ensure a full recovery of principal in the event of a default. Although we maintain core holdings within traditionally defensive sectors, we have continued to add a measured amount of risk to the portfolio by selectively increasing our allocation to higher-yielding securities. At the same time, we remained focused on our rigorous fundamental research process and collaboration with our equity and other internal fixed income counterparts to take a comprehensive investment approach to adding new names to the portfolio.
During the last six months, our largest industry additions were in the financials and services industries. Historically, financials has been a relatively small part of our market, but it has increased since the debt crisis unfolded in 2008. Many once-mighty financial firms have become fallen angels—investment-grade companies that have been downgraded into the high yield universe. We think that most of the financial firms that were downgraded are unlikely to remain rated below investment grade. Although several were forced to file for bankruptcy protection, many have emerged with more manageable debt loads. We will opportunistically purchase companies coming out of bankruptcy when we think their business prospects and ability to repay debt has vastly improved.
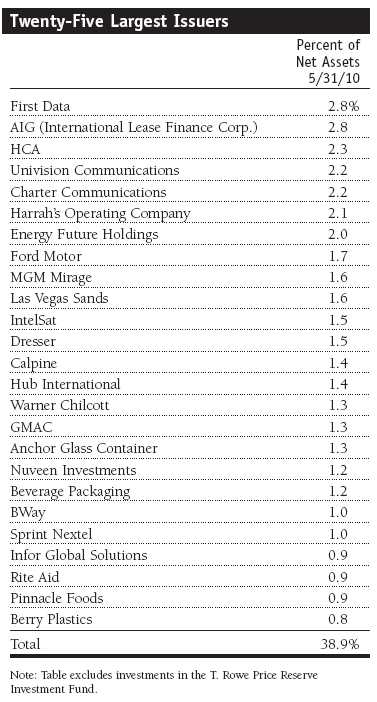
We own one of American International Group’s (AIG) most prominent subsidiaries, International Lease Finance Corporation (ILFC), which leases commercial jets. It is one of the largest companies in its market. We think it is a solid company that could potentially be sold if AIG needed to take drastic measures to repay government loans. ILFC did a lot of refinancing this year, and we recently bought some of its new bank loans. The issue was priced at 99% of par, with call protection and a coupon of Libor plus 500 basis points (5%) with a 2% Libor floor. Call protection is something we rarely see in our universe because loans are generally callable at par at any time. Anytime a loan is trading above par, investors are at risk of having them redeemed and losing the premium. However, if our ILFC loans are called, we would receive par plus 2% in the first year, and par plus 1% in the second. We like loans with call protection because it allows the security to generate capital appreciation above par during that period.
Our decision to buy ILFC was very detailed, as the company and its securities are complex. Our high yield, investment-grade, and equity analyst teams worked together and scrutinized the company from almost every available perspective. This is an excellent example of a T. Rowe Price collaborative research effort.
Like ILFC, CIT Group (another fallen angel) came into our market because of the disruptions in the credit markets. CIT went bankrupt and wiped out a lot of its debt burden, but we think it could eventually return to investment-grade status. We took a moderate position in a CIT loan with a coupon of Libor plus 7.5% and a 2% Libor floor. We are earning about a 9.5% current yield on a company that we think should be a BB credit and is an acquisition candidate.
One of the portfolio’s larger positions and a solid performer in the last six months was GMAC (the company changed its name to Ally Financial in mid-May). It used to be the financial services arm and a wholly owned subsidiary of General Motors. GMAC has been a large loan and high yield bond issuer for quite some time. Its recent troubles stemmed from its foray into the sub-prime mortgage lending space. Its ResCap subsidiary was losing about $1.5 billion per quarter when the mortgage crisis was at its height. However, GMAC took the serious measures needed to stem the losses. It has ceased its mortgage lending operations and is now refocused on its traditional auto lending business, which is improving. The U.S. government holds a majority stake in GMAC and AIG, and our thesis is that neither is likely to fail as a result.
Other Notable Contributors and Detractors
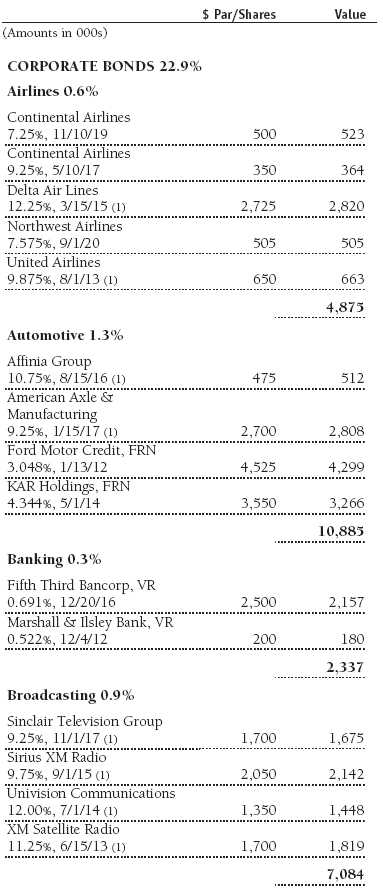
We hold a large stake in Ford Motor bank loans, which had fallen to 33 cents on the dollar. We think Ford is one of the strongest companies in the auto sector as it did not default or take government rescue money. The company is taking market share from Toyota (due to a series of recalls), and we believe it could pay down a portion of its outstanding debt from Volvo asset sale proceeds. Ford’s loans traded near 90% of par at the end of our reporting period, making it a top six-month contributor.
Sirius XM Radio was another top contributor over the past six months. Part of the company’s success was tied to the recovery of the auto industry, where it excels in the new car market. Many cars now come with a factory-installed Sirius radio and three months of free service. Sirius is rapidly growing its subscriber base through this initiative and fortifying its already-solid market position. A series of debt refinancings throughout 2009 has also reduced the company’s overall interest costs and improved its maturity profile. We believe that, over the next 12 to 18 months, the company’s cash flow is going to improve significantly and it could be upgraded to a BB rating.
The portfolio benefited from its underweight allocation in publishing. The industry is struggling due to the decline in consumer discretionary spending and falling newspaper and magazine readership. Similarly, the Internet continues to gain ground as a source for news and is siphoning off advertising revenues from print media. VNU (formerly a subsidiary of the Nielson Company) was one of our positive performers in the group. It is owned by a group of private-equity firms that we think are likely to bring the company public again in the near future. The company generates strong free cash flow, and if it does an initial public offering the proceeds could be used to pay down its bonds and loans.
SuperMedia, formerly know as Idearc—the publisher of SuperYellowPages and Superpages—was our largest detractor for the past six months. The company emerged from bankruptcy in December 2009. Idearc went into the bankruptcy process with approximately $9 billion of debt and exited with $2.9 billion of debt. Although some of its markets are showing signs of improvement, the company’s loans experienced declines that were generally in line with other publishing and advertising companies. While we are disappointed with the loans’ recent performance, we think the company is well positioned to generate better results with the continued economic recovery. Similarly, our position in Clear Channel, a highly leveraged radio and outdoor advertising company, fell despite reporting good first-quarter sales and earnings results. It was our second-largest detractor since the end of November.
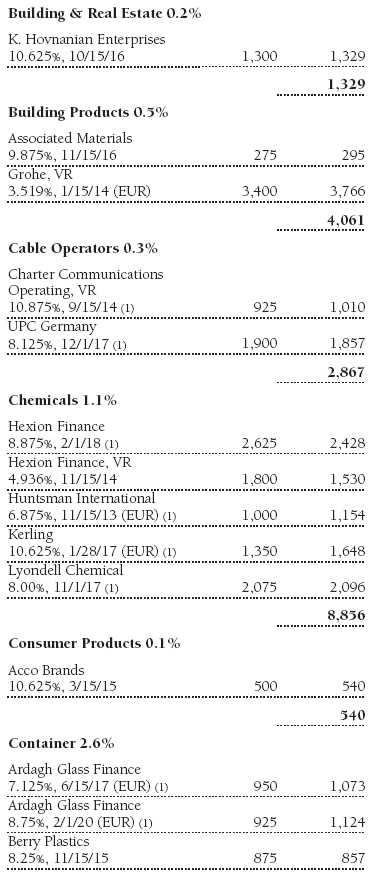
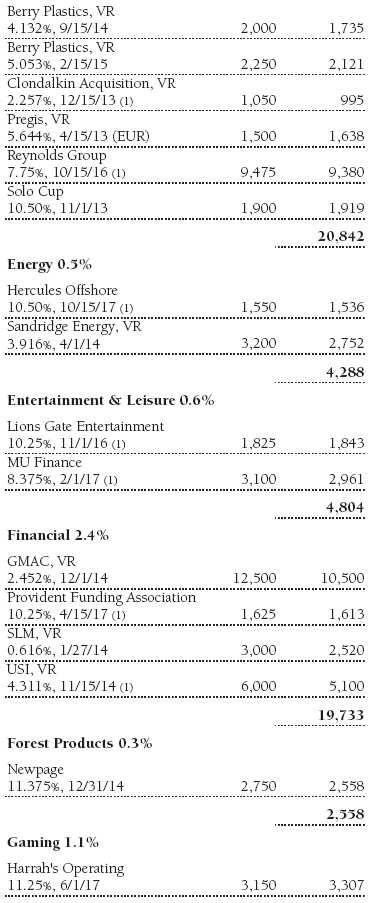
We also owned several euro-denominated loans in the packaging and container industries that were among our poorest performers. Ardagh Glass, a beer bottle manufacturer, and Pregis, a protective packaging manufacturer, were detractors for the past six months. Both are conservative companies that generate solid cash flow to support their debt but were punished by the uncertainty about growth prospects in Europe and, to a larger extent, the euro’s decline versus the dollar.
Outlook
We remain positive on the intermediate- and longer-term prospects for the companies in the loan market. However, sovereign debt concerns and severe fiscal austerity measures in peripheral European countries are likely to reduce global growth expectations and weigh on market sentiment in the near term. The potential for U.S. financial reform to impact banks’ credit ratings may also fuel volatility, although we believe reform ultimately will improve banking system stability. In this context, investors’ recent flight from riskier assets is understandable, especially given the strong rally in higher-risk assets that began more than a year ago. Nevertheless, even in the short run, there are more positives than negatives within our market. For example, we’re seeing progress on the bond-for-loans takeout theme, and M&A activity should increase over time. We expect more high yield bond issuance and solid demand for securities with above-average yields in this low interest rate environment. When interest rates begin to rise from these historically low levels, the floating rate nature of our holdings should not only attract investors, but the asset class could generate outstanding performance on an absolute basis and relative to other fixed income products.
We think the companies we hold in the portfolio are solid investments based on their risk-to-reward potential, and many are taking actions to improve their fundamental characteristics. At the same time, most of the analysts covering our asset class agree that the loan market is cheap based on a comparison of current yield versus the market’s expected default rate. The worst-case scenario for our market would be a double-dip recession, which is unlikely, in our view. Although we fear that we are in for a bumpy ride this summer, with volatility remaining elevated, long-term investors that stay the course should be rewarded. While we are reluctant to make a prediction on default rates more than a year from now, the trend is lower. After the pullback in May, we think we are getting more value in the loan market for what we think will be an unchanged fundamental picture through the end of the year.
While the low interest rate environment has benefited the companies in our market, we anticipate that rates will start to rise when signs of inflation begin to appear. Rising interest rate expectations could make the coming year good for the loan market. We believe that investors will be much more excited about the asset class when the floating rate feature becomes a bigger part of the returns. The fund should be well positioned when this happens because as rates rise, floating rates will provide increasing income for our shareholders. We view floating rate loans as an excellent asset class for diversification, as well as a hedge against inflation in a rising interest rate environment.
We appreciate your confidence and thank you for investing with T. Rowe Price.
Respectfully submitted,

Justin T. Gerbereux
Cochairman of the fund’s Investment Advisory Committee

Paul M. Massaro
Cochairman of the fund’s Investment Advisory Committee
June 15, 2010
The committee chairmen have day-to-day responsibility for managing the portfolio and work with committee members in developing and executing the fund’s investment program.
| Risks of Investing in Floating Rate Loan Funds |
Floating rate loans are subject to credit risk, the chance that any fund holding could have its credit rating downgraded, or that a issuer will default (fail to make timely payments of interest or principal) and liquidity risk, the chance that the fund may not be able to sell loans or securities at desired prices, potentially reducing the fund’s income level and share price. Like bond funds, this fund is exposed to interest rate risk, but credit and liquidity risks may often be more important.
The loans in which the fund invests are often referred to as “leveraged loans” because the borrowing companies have significantly more debt than equity. In many cases, leveraged loans are issued in connection with recapitalizations, acquisitions, leveraged buyouts, and refinancings. Companies issuing leveraged loans typically have a below investment-grade credit rating or may not be rated by a major credit rating agency. Leveraged loan funds could have greater price declines than funds that invest primarily in high-quality bonds, so the securities are usually considered speculative investments.
30-day SEC yield: A method of calculating a fund’s yield that assumes all portfolio securities are held until maturity. Yield will vary and is not guaranteed.
Basis point: One one-hundredth of a percentage point, or 0.01%.
Duration: A measure of a bond or bond fund’s sensitivity to changes in interest rates. For example, a fund with a one-year duration would fall about 1% in response to a one-percentage-point rise in interest rates, and vice versa.
Federal funds rate: The interest rate charged on overnight loans of reserves by one financial institution to another in the United States. The Federal Reserve sets a target federal funds rate to affect the direction of interest rates.
London Interbank Offered Rate (Libor): The interest rate at which banks loan money to each other in London wholesale market, which is also known as the interbank market.
S&P/LSTA Performing Loan Index: A benchmark that tracks the performance of the leveraged-loan market.
Weighted average maturity: A measure of a fund’s interest rate sensitivity. In general, the longer the average maturity, the greater the fund’s sensitivity to interest rate changes. The weighted average maturity may take into account the interest rate readjustment dates for certain securities.
Portfolio Highlights
Performance and Expenses
T. Rowe Price Institutional Floating Rate Fund
This chart shows the value of a hypothetical $1 million investment in the fund over the past 10 fiscal year periods or since inception (for funds lacking 10-year records). The result is compared with benchmarks, which may include a broad-based market index and a peer group average or index. Market indexes do not include expenses, which are deducted from fund returns as well as mutual fund averages and indexes.
Fund Expense Example
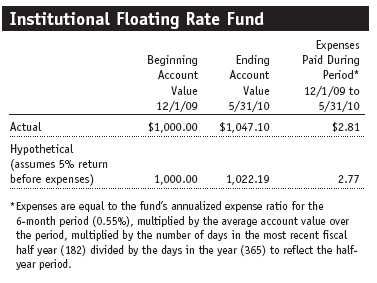
As a mutual fund shareholder, you may incur two types of costs: (1) transaction costs, such as redemption fees or sales loads, and (2) ongoing costs, including management fees, distribution and service (12b-1) fees, and other fund expenses. The following example is intended to help you understand your ongoing costs (in dollars) of investing in the fund and to compare these costs with the ongoing costs of investing in other mutual funds. The example is based on an investment of $1,000 invested at the beginning of the most recent six-month period and held for the entire period.
Actual Expenses
The first line of the following table (“Actual”) provides information about actual account values and actual expenses. You may use the information in this line, together with your account balance, to estimate the expenses that you paid over the period. Simply divide your account value by $1,000 (for example, an $8,600 account value divided by $1,000 = 8.6), then multiply the result by the number in the first line under the heading “Expenses Paid During Period” to estimate the expenses you paid on your account during this period.
Hypothetical Example for Comparison Purposes
The information on the second line of the table (“Hypothetical”) is based on hypothetical account values and expenses derived from the fund’s actual expense ratio and an assumed 5% per year rate of return before expenses (not the fund’s actual return). You may compare the ongoing costs of investing in the fund with other funds by contrasting this 5% hypothetical example and the 5% hypothetical examples that appear in the shareholder reports of the other funds. The hypothetical account values and expenses may not be used to estimate the actual ending account balance or expenses you paid for the period.
You should also be aware that the expenses shown in the table highlight only your ongoing costs and do not reflect any transaction costs, such as redemption fees or sales loads. Therefore, the second line of the table is useful in comparing ongoing costs only and will not help you determine the relative total costs of owning different funds. To the extent a fund charges transaction costs, however, the total cost of owning that fund is higher.
Financial Highlights
T. Rowe Price Institutional Floating Rate Fund
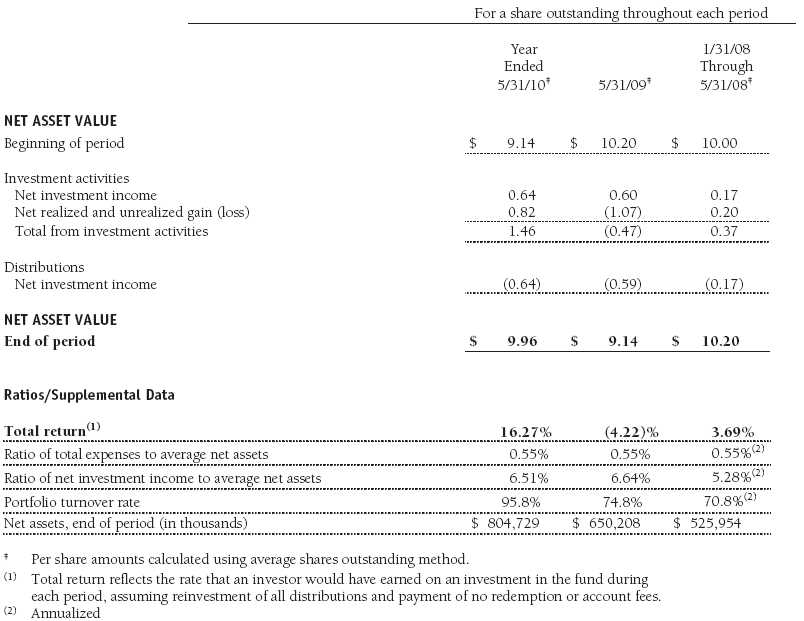
The accompanying notes are an integral part of these financial statements.
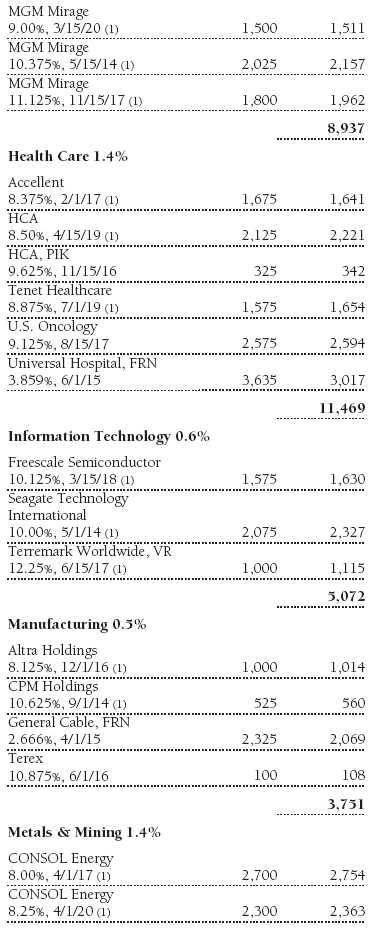
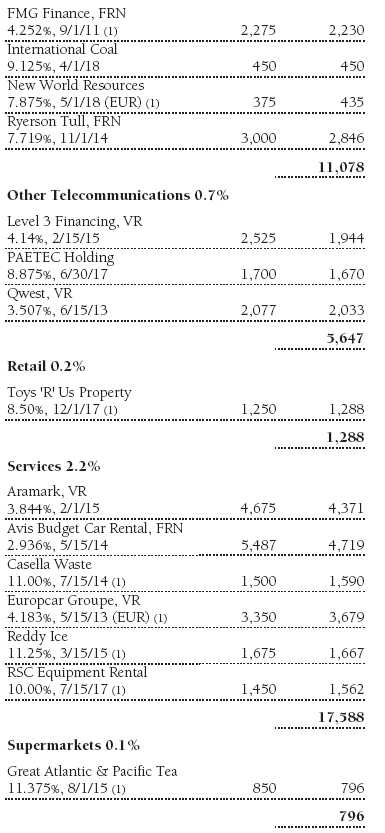
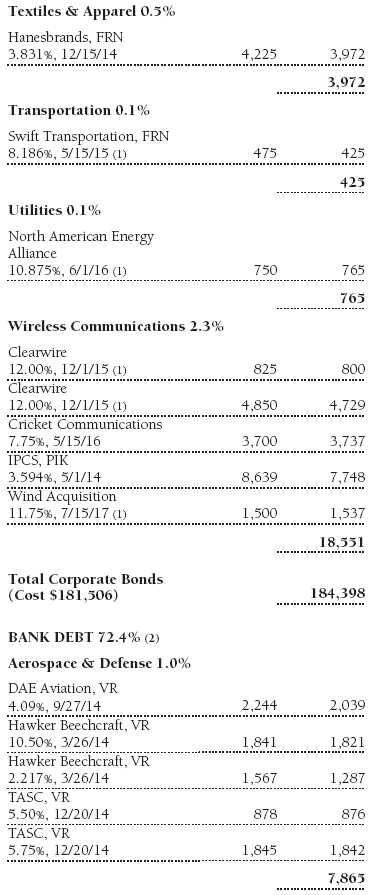
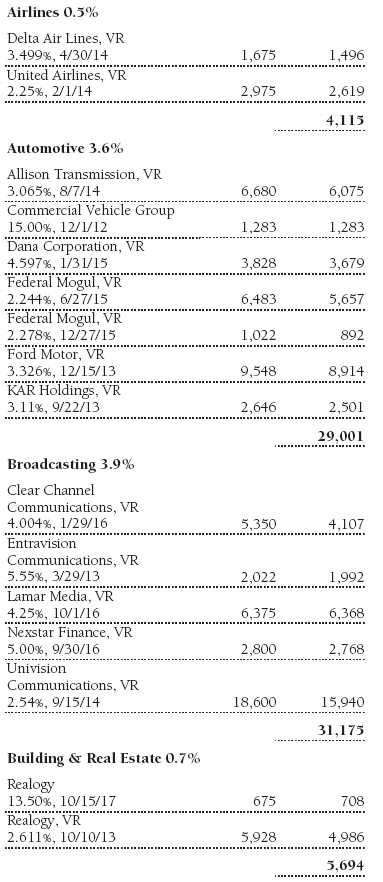
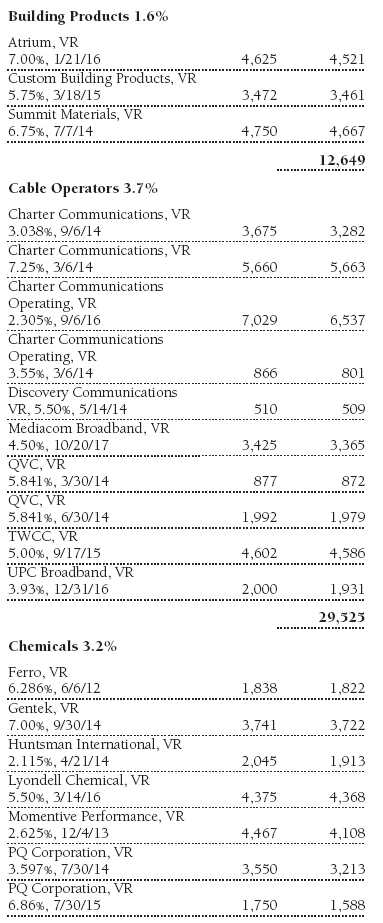
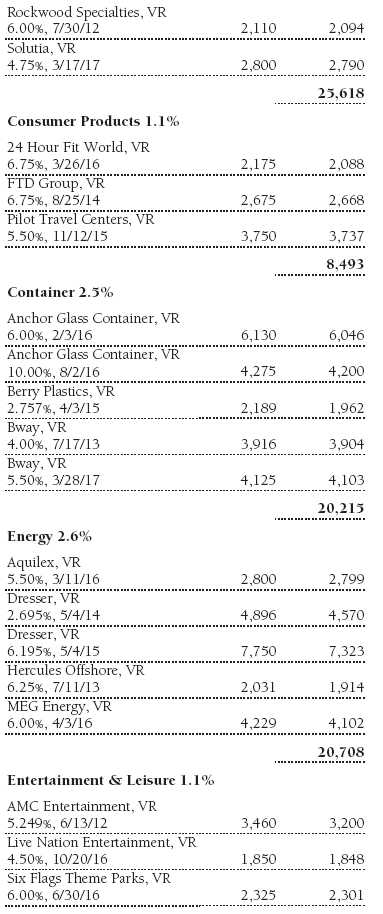
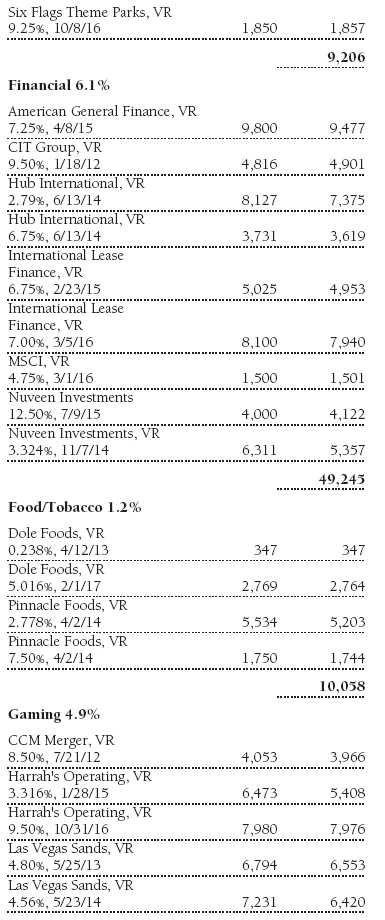
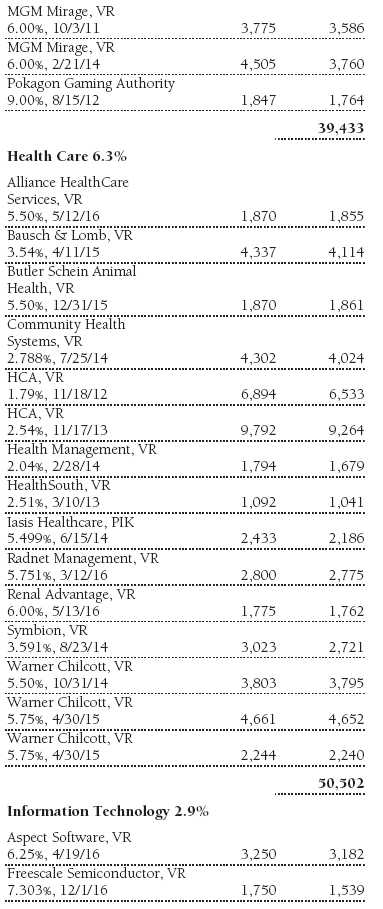
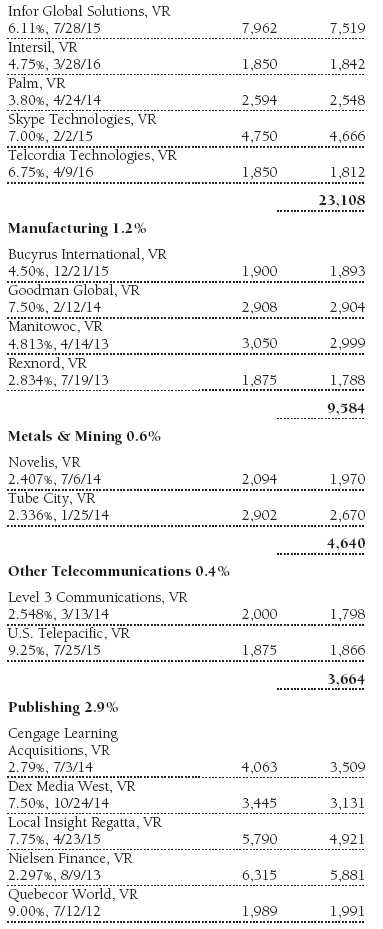
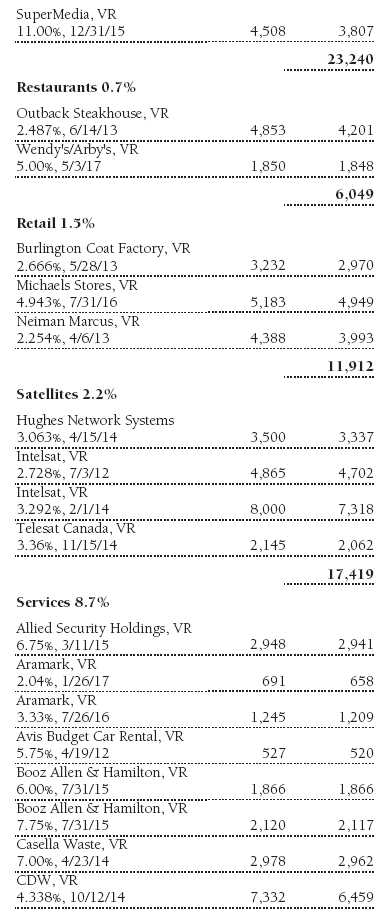
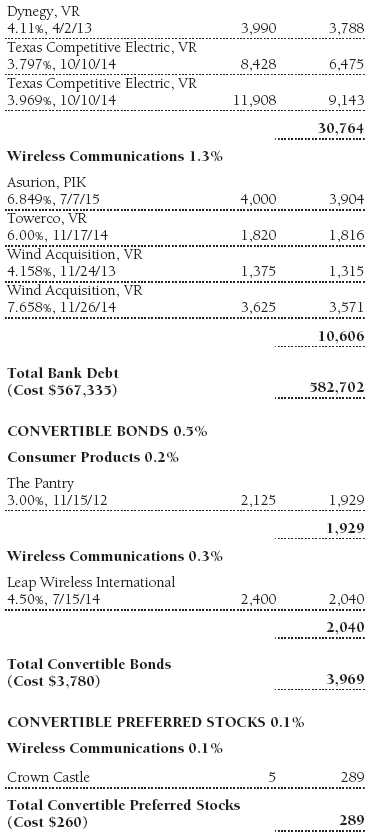
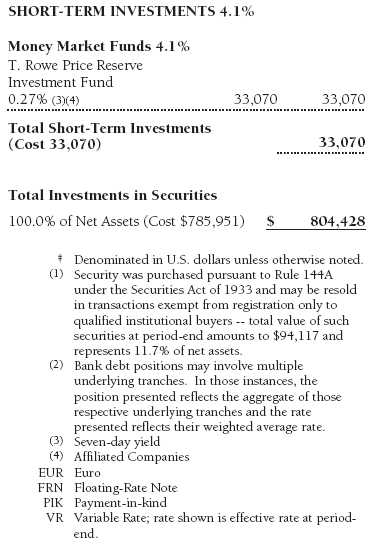
Portfolio of Investments‡
T. Rowe Price Institutional Floating Rate Fund
May 31, 2010

The accompanying notes are an integral part of these financial statements.
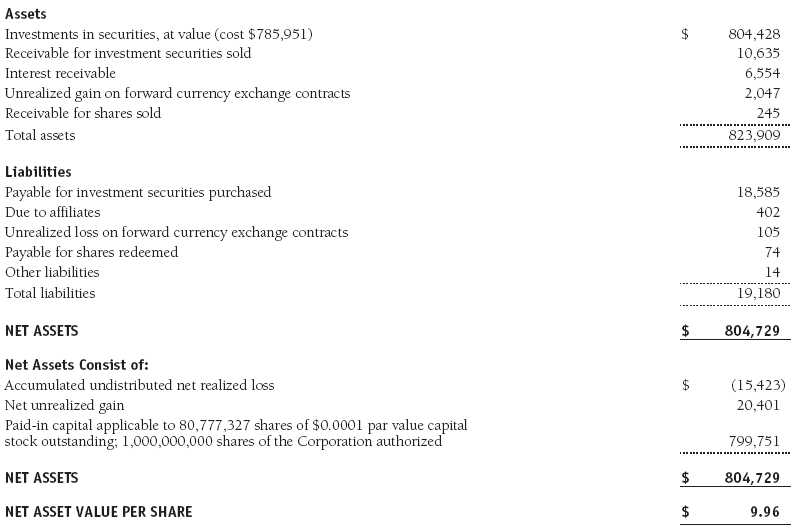
Statement of Assets and Liabilities
T. Rowe Price Institutional Floating Rate Fund
May 31, 2010
($000s, except shares and per share amounts)
The accompanying notes are an integral part of these financial statements.
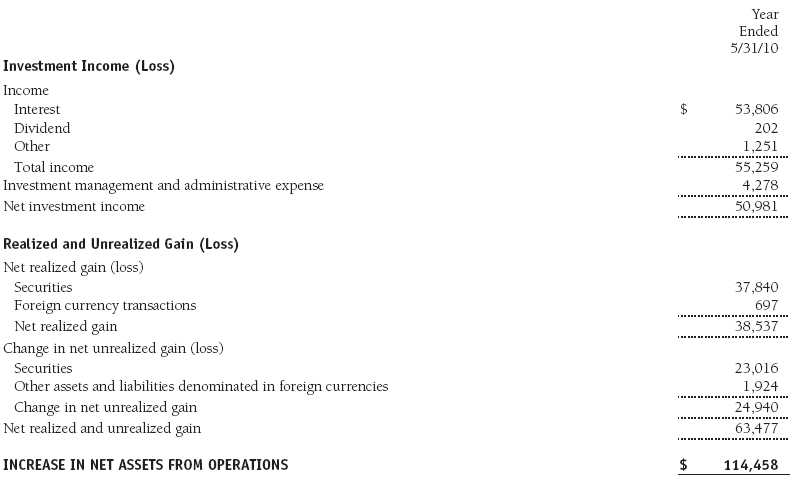
Statement of Operations
T. Rowe Price Institutional Floating Rate Fund
($000s)
The accompanying notes are an integral part of these financial statements.
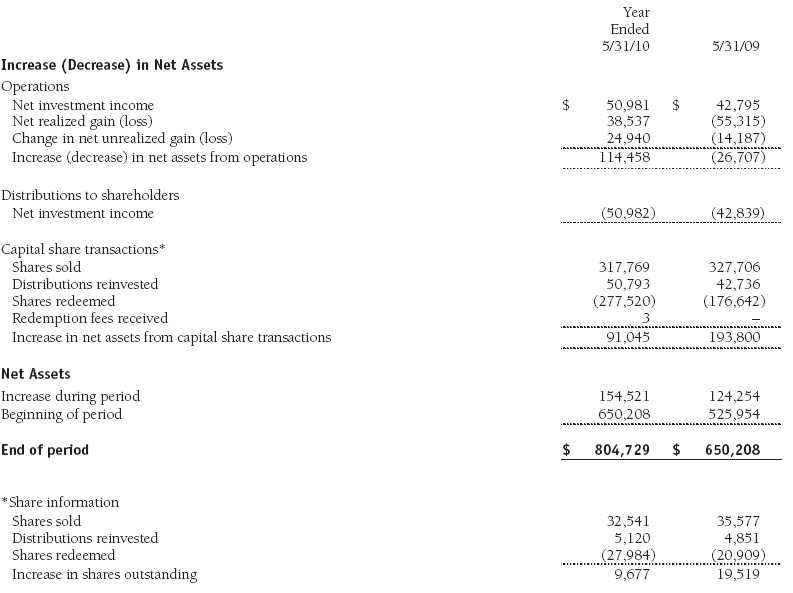
Statement of Changes in Net Assets
T. Rowe Price Institutional Floating Rate Fund
($000s)
The accompanying notes are an integral part of these financial statements.
Notes to Financial Statements
T. Rowe Price Institutional Floating Rate Fund
May 31, 2010
T. Rowe Price Institutional Income Funds, Inc. (the corporation), is registered under the Investment Company Act of 1940 (the 1940 Act). The Institutional Floating Rate Fund (the fund), a diversified, open-end management investment company, is one portfolio established by the corporation. The fund commenced operations on January 31, 2008. The fund seeks high current income and, secondarily, capital appreciation.
NOTE 1 - SIGNIFICANT ACCOUNTING POLICIES
Basis of Preparation The accompanying financial statements were prepared in accordance with accounting principles generally accepted in the United States of America (GAAP), which require the use of estimates made by fund management. Fund management believes that estimates and valuations are appropriate; however, actual results may differ from those estimates, and the valuations reflected in the accompanying financial statements may differ from the value ultimately realized upon sale of securities.
Investment Transactions, Investment Income, and Distributions Income and expenses are recorded on the accrual basis. Premiums and discounts on debt securities are amortized for financial reporting purposes. Dividends received from mutual fund investments are reflected as dividend income; capital gain distributions are reflected as realized gain/loss. Dividend income and capital gain distributions are recorded on the ex-dividend date. Income tax-related interest and penalties, if incurred, would be recorded as income tax expense. Investment transactions are accounted for on the trade date. Realized gains and losses are reported on the identified cost basis. Distributions to shareholders are recorded on the ex-dividend date. Income distributions are declared daily and paid monthly. Capital gain distributions, if any, are generally declared and paid by the fund annually.
Currency Translation Assets, including investments, and liabilities denominated in foreign currencies are translated into U.S. dollar values each day at the prevailing exchange rate, using the mean of the bid and asked prices of such currencies against U.S. dollars as quoted by a major bank. Purchases and sales of securities, income, and expenses are translated into U.S. dollars at the prevailing exchange rate on the date of the transaction. The effect of changes in foreign currency exchange rates on realized and unrealized security gains and losses is reflected as a component of security gains and losses.
Redemption Fees A 1% fee is assessed on redemptions of fund shares held for 90 days or less to deter short-term trading and to protect the interests of long-term shareholders. Redemption fees are withheld from proceeds that shareholders receive from the sale or exchange of fund shares. The fees are paid to the fund and are recorded as an increase to paid-in capital. The fees may cause the redemption price per share to differ from the net asset value per share.
New Accounting Pronouncement In January 2010, new accounting guidance was issued that requires enhanced disclosures about fair value measurements in the financial statements; it is effective for fiscal years and interim periods beginning after December 15, 2009. Management expects that adoption of this guidance will have no impact on the fund’s net assets or results of operations.
NOTE 2 - VALUATION
The fund’s investments are reported at fair value as defined by GAAP. The fund determines the values of its assets and liabilities and computes its net asset value per share at the close of the New York Stock Exchange (NYSE), normally 4 p.m. ET, each day that the NYSE is open for business. Values in the accompanying Portfolio of Investments are as of May 28, 2010, the last business day in the fund’s fiscal year ended May 31, 2010. Some foreign markets were open between May 28 and the close of the reporting period on May 31, but any differences in investment values and foreign exchange rates subsequent to May 28 through May 31 were immaterial to the fund’s financial statements.
Valuation Methods Debt securities are generally traded in the over-the-counter (OTC) market. Securities with remaining maturities of one year or more at the time of acquisition are valued at prices furnished by dealers who make markets in such securities or by an independent pricing service, which considers the yield or price of bonds of comparable quality, coupon, maturity, and type, as well as prices quoted by dealers who make markets in such securities. Securities with remaining maturities of less than one year at the time of acquisition generally use amortized cost in local currency to approximate fair value. However, if amortized cost is deemed not to reflect fair value or the fund holds a significant amount of such securities with remaining maturities of more than 60 days, the securities are valued at prices furnished by dealers who make markets in such securities or by an independent pricing service.
Equity securities listed or regularly traded on a securities exchange or in the OTC market are valued at the last quoted sale price or, for certain markets, the official closing price at the time the valuations are made, except for OTC Bulletin Board securities, which are valued at the mean of the latest bid and asked prices. A security that is listed or traded on more than one exchange is valued at the quotation on the exchange determined to be the primary market for such security. Listed securities not traded on a particular day are valued at the mean of the latest bid and asked prices for domestic securities and the last quoted sale price for international securities.
Investments in mutual funds are valued at the mutual fund’s closing net asset value per share on the day of valuation. Forward currency exchange contracts are valued using the prevailing forward exchange rate.
Other investments, including restricted securities, and those financial instruments for which the above valuation procedures are inappropriate or are deemed not to reflect fair value are stated at fair value as determined in good faith by the T. Rowe Price Valuation Committee, established by the fund’s Board of Directors.
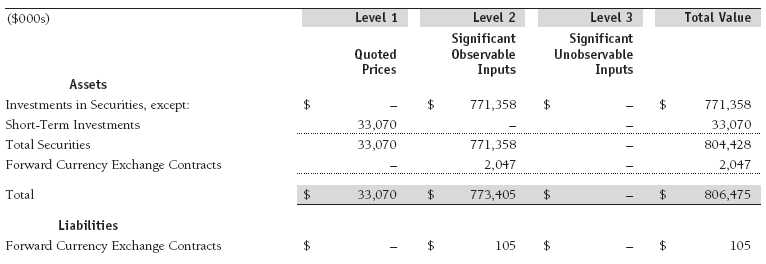
Valuation Inputs Various inputs are used to determine the value of the fund’s financial instruments. These inputs are summarized in the three broad levels listed below:
Level 1 – quoted prices in active markets for identical financial instruments
Level 2 – observable inputs other than Level 1 quoted prices (including, but not limited to, quoted prices for similar financial instruments, interest rates, prepayment speeds, and credit risk)
Level 3 – unobservable inputs
Observable inputs are those based on market data obtained from sources independent of the fund, and unobservable inputs reflect the fund’s own assumptions based on the best information available. The input levels are not necessarily an indication of the risk or liquidity associated with financial instruments at that level. The following table summarizes the fund’s financial instruments, based on the inputs used to determine their values on May 31, 2010:
NOTE 3 - DERIVATIVE INSTRUMENTS
During the year ended May 31, 2010, the fund invested in derivative instruments. As defined by GAAP, a derivative is a financial instrument whose value is derived from an underlying security price, foreign exchange rate, interest rate, index of prices or rates, or other variable; it requires little or no initial investment and permits or requires net settlement. The fund invests in derivatives only if the expected risks and rewards are consistent with its investment objectives, policies, and overall risk profile, as described in its prospectus and Statement of Additional Information. The fund may use derivatives for a variety of purposes, such as seeking to hedge against declines in principal value, increase yield, invest in an asset with greater efficiency and at a lower cost than is possible through direct investment, or to adjust portfolio duration and credit exposure. The risks associated with the use of derivatives are different from, and potentially much greater than, the risks associated with investing directly in the instruments on which the derivatives are based. Investments in derivatives can magnify returns positively or negatively; however, the fund at all times maintains sufficient cash reserves, liquid assets, or other SEC-permitted asset types to cover the settlement obligations under its open derivative contracts.
The fund values its derivatives at fair value, as described below and in Note 2, and recognizes changes in fair value currently in its results of operations. Accordingly, the fund does not follow hedge accounting, even for derivatives employed as economic hedges. The fund does not offset the fair value of derivative instruments and the right to reclaim or obligation to return collateral executed with the same counterparty under a master netting arrangement. As of May 31, 2010, the fund held foreign exchange derivatives with a fair value of $2,047,000, included in Unrealized gain on forward currency exchange contracts, and $105,000, included in Unrealized loss on forward currency exchange contracts, on the accompanying Statement of Assets and Liabilities.
Additionally, during the year ended May 31, 2010, the fund recognized $685,000 of realized gain on Foreign Currency Transactions and a $1,924,000 change in unrealized gain on Foreign Currency Transactions related to its investments in foreign exchange derivatives; such amounts are included on the accompanying Statement of Operations.
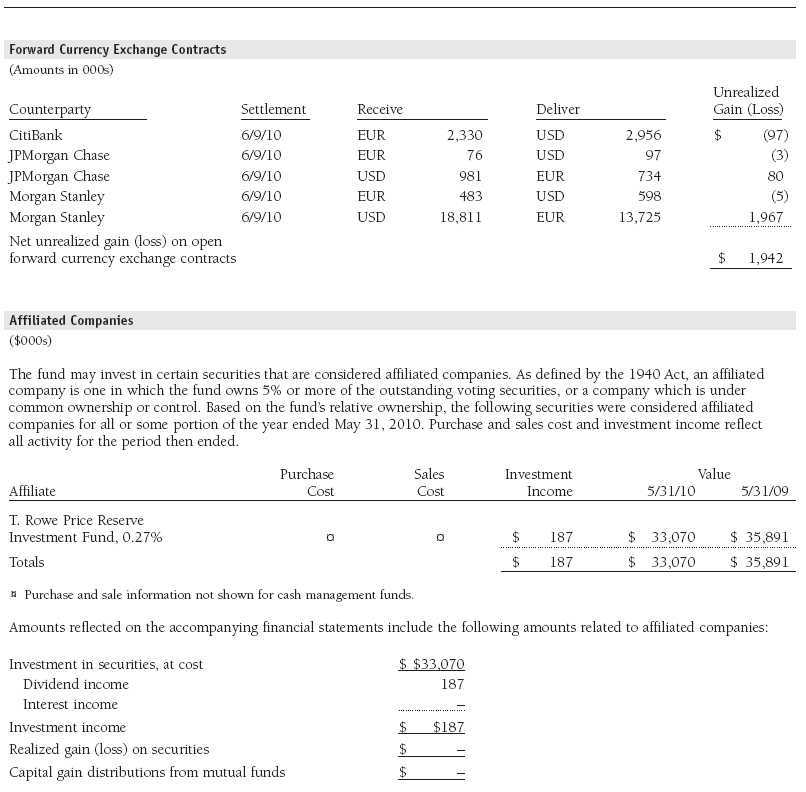
Forward Currency Exchange Contracts The fund is subject to foreign currency exchange rate risk in the normal course of pursuing its investment objectives. It uses forward currency exchange contracts (forwards) primarily to protect its non-U.S. dollar-denominated securities from adverse currency movements relative to the U.S. dollar. A forward involves an obligation to purchase or sell a fixed amount of a specific currency on a future date at a price set at the time of the contract. Although certain forwards may be settled by exchanging only the net gain or loss on the contract, most forwards are settled with the exchange of the underlying currencies in accordance with the specified terms. Forwards are valued at the unrealized gain or loss on the contract, which reflects the net amount the fund either is entitled to receive or obligated to deliver, as measured by the difference between the forward exchange rates at the date of entry into the contract and the forward rates at the reporting date. Appreciated forwards are reflected as assets, and depreciated forwards are reflected as liabilities on the accompanying Statement of Assets and Liabilities. Risks related to the use of forwards include the possible failure of counterparties to meet the terms of the agreements; that anticipated currency movements will not occur, thereby reducing the fund’s total return; and the potential for losses in excess of the fund’s initial investment. During the year ended May 31, 2010, the fund’s exposure to forwards, based on underlying notional amounts, was generally between 0% and 3% of net assets.
Counterparty Risk and Collateral The fund has entered into collateral agreements with certain counterparties to mitigate counterparty risk associated with over-the-counter (OTC) derivatives, including swaps and forward currency exchange contracts. Subject to certain minimum exposure requirements (which range from $100,000 to $500,000), collateral generally is determined based on the net aggregate unrealized gain or loss on all OTC derivative contracts with a particular counterparty. Collateral, both pledged by and for the benefit of the fund, is held in a segregated account by a third-party agent and can be in the form of cash or debt securities issued by the U.S. government or related agencies. Securities posted as collateral by the fund are so noted in the accompanying Portfolio of Investments and remain in the fund’s net assets. As of May 31, 2010, no collateral was pledged by either the fund or counterparties.
At any point in time, the fund’s risk of loss from counterparty credit risk on OTC derivatives is the aggregate unrealized gain on appreciated contracts in excess of any collateral pledged by the counterparty for the benefit of the fund. In accordance with standard derivatives agreements, counterparties to OTC derivatives may be able to terminate derivative contracts prior to maturity in the event the fund fails to maintain sufficient asset coverage; its net assets decline by stated percentages; or it otherwise fails to meet the terms of its agreements, which would cause the fund to accelerate payment of any net liability owed to the counterparty under the contract.
NOTE 4 - OTHER INVESTMENT TRANSACTIONS
Consistent with its investment objective, the fund engages in the following practices to manage exposure to certain risks and/or to enhance performance. The investment objective, policies, program, and risk factors of the fund are described more fully in the fund’s prospectus and Statement of Additional Information.
Noninvestment-Grade Debt Securities At May 31, 2010, approximately 95% of the fund’s net assets were invested, either directly or through its investment in T. Rowe Price institutional funds, in noninvestment-grade debt securities, commonly referred to as “high yield” or “junk” bonds. The noninvestment-grade bond market may experience sudden and sharp price swings due to a variety of factors, including changes in economic forecasts, stock market activity, large sustained sales by major investors, a high-profile default, or a change in the market’s psychology. These events may decrease the ability of issuers to make principal and interest payments and adversely affect the liquidity or value, or both, of such securities.
Restricted Securities The fund may invest in securities that are subject to legal or contractual restrictions on resale. Prompt sale of such securities at an acceptable price may be difficult and may involve substantial delays and additional costs.
Bank Loans The fund may invest in bank loans, which represent interests in amounts owed by various borrowers to lenders or lending syndicates. A bank or other financial institution (lender) typically acts as agent for all holders and administers the bank loan in accordance with the credit agreement. Investments in bank loans may be in the form of loan assignments or loan participations. A loan assignment transfers direct ownership of all or a portion of specified third-party loans from the lender to the fund. Although loan assignments continue to be administered by the lender, the fund acquires direct rights against the borrower. In contrast, a loan participation generally entitles the fund to receive payments of principal, interest, and any fees that the lender is entitled to receive from the borrower; however, the lender continues to own and administer the loan. As a result, with loan participations, the fund generally has no right to enforce compliance with the terms of the credit agreement with the borrower, and the fund is subject to the credit risk of both the borrower and the lender. A portion of the fund’s bank loans may require additional principal to be funded at the borrowers’ discretion at a later date (unfunded commitments). The fund reflects both the funded portion of the bank loan as well as any unfunded commitment on the loan in the Portfolio of Investments. Certain credit agreements provide no initial funding, but require the full principal commitment to be funded at a future date at the borrower’s discretion. Such agreements are not reflected in the Portfolio of Investments until funded. At May 31, 2010, the fund’s total unfunded commitments were $4,000,000.
Other Purchases and sales of portfolio securities other than short-term and U.S. government securities aggregated $20,855,000 and $23,485,000, respectively, for the year ended May 31, 2010.
NOTE 5 - FEDERAL INCOME TAXES
No provision for federal income taxes is required since the fund intends to continue to qualify as a regulated investment company under Subchapter M of the Internal Revenue Code and distribute to shareholders all of its taxable income and gains. Distributions determined in accordance with federal income tax regulations may differ in amount or character from net investment income and realized gains for financial reporting purposes. Financial reporting records are adjusted for permanent book/tax differences to reflect tax character but are not adjusted for temporary differences.
The fund files U.S. federal, state, and local tax returns as required. The fund’s tax returns are subject to examination by the relevant tax authorities until expiration of the applicable statute of limitations, which is generally three years after filing of the tax return but could be longer in certain circumstances.
Reclassifications between income and gain relate primarily to the recharacterization of distributions. For the year ended May 31, 2010, the following reclassifications were recorded to reflect tax character; there was no impact on results of operations or net assets:

Distributions during the years ended May 31, 2010 and May 31, 2009, totaled $50,982,000 and $42,839,000, respectively, and were characterized as ordinary income for tax purposes. At May 31, 2010, the tax-basis cost of investments and components of net assets were as follows:
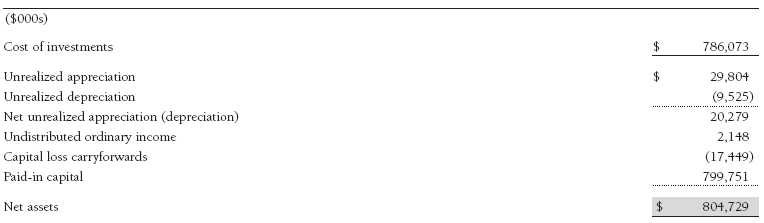
The fund intends to retain realized gains to the extent of available capital loss carryforwards. The fund’s unused capital loss carryforwards as of May 31, 2010, expire: $6,699,000 in fiscal 2017 and $10,750,000 in fiscal 2018.
NOTE 6 - RELATED PARTY TRANSACTIONS
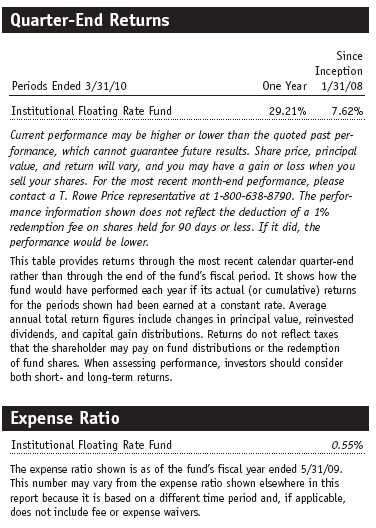
The fund is managed by T. Rowe Price Associates, Inc. (the manager or Price Associates), a wholly owned subsidiary of T. Rowe Price Group, Inc. The investment management and administrative agreement between the fund and the manager provides for an all-inclusive annual fee equal to 0.55% of the fund’s average daily net assets. The fee is computed daily and paid monthly. The agreement provides that investment management, shareholder servicing, transfer agency, accounting, custody services, and directors’ fees and expenses are provided to the fund, and interest, taxes, brokerage commissions, and extraordinary expenses are paid directly by the fund.
The fund may invest in the T. Rowe Price Reserve Investment Fund and the T. Rowe Price Government Reserve Investment Fund (collectively, the T. Rowe Price Reserve Investment Funds), open-end management investment companies managed by Price Associates and considered affiliates of the fund. The T. Rowe Price Reserve Investment Funds are offered as cash management options to mutual funds, trusts, and other accounts managed by Price Associates and/or its affiliates and are not available for direct purchase by members of the public. The T. Rowe Price Reserve Investment Funds pay no investment management fees.
Mutual funds and other accounts managed by T. Rowe Price and its affiliates (collectively, T. Rowe Price funds) may invest in the fund; however, no T. Rowe Price fund may invest for the purpose of exercising management or control over the fund. At May 31, 2010, approximately 86% of the fund’s outstanding shares were held by T. Rowe Price funds.
Report of Independent Registered Public Accounting Firm
To the Board of Directors of T. Rowe Price Institutional Income Funds, Inc. and
Shareholders of T. Rowe Price Institutional Floating Rate Fund
In our opinion, the accompanying statement of assets and liabilities, including the portfolio of investments, and the related statements of operations and of changes in net assets and the financial highlights present fairly, in all material respects, the financial position of T. Rowe Price Institutional Floating Rate Fund (one of the portfolios comprising T. Rowe Price Institutional Income Funds, Inc., hereafter referred to as the “Fund”) at May 31, 2010, the results of its operations for the year then ended, the changes in its net assets for each of the two years in the period then ended and the financial highlights for each of the fiscal periods presented, in conformity with accounting principles generally accepted in the United States of America. These financial statements and financial highlights (hereafter referred to as “financial statements”) are the responsibility of the Fund’s management; our responsibility is to express an opinion on these financial statements based on our audits. We conducted our audits of these financial statements in accordance with the standards of the Public Company Accounting Oversight Board (United States). Those standards require that we plan and perform the audit to obtain reasonable assurance about whether the financial statements are free of material misstatement. An audit includes examining, on a test basis, evidence supporting the amounts and disclosures in the financial statements, assessing the accounting principles used and significant estimates made by management, and evaluating the overall financial statement presentation. We believe that our audits, which included confirmation of securities at May 31, 2010 by correspondence with the custodian and brokers, and confirmation of the underlying fund by correspondence with the transfer agent, provide a reasonable basis for our opinion.
PricewaterhouseCoopers LLP
Baltimore, Maryland
July 16, 2010
| Tax Information (Unaudited) for the Tax Year Ended 5/31/10 |
We are providing this information as required by the Internal Revenue Code. The amounts shown may differ from those elsewhere in this report because of differences between tax and financial reporting requirements.
The fund’s distributions to shareholders included $1,000 from short-term capital gains.
| Information on Proxy Voting Policies, Procedures, and Records |
A description of the policies and procedures used by T. Rowe Price funds and portfolios to determine how to vote proxies relating to portfolio securities is available in each fund’s Statement of Additional Information, which you may request by calling 1-800-225-5132 or by accessing the SEC’s Web site, www.sec.gov. The description of our proxy voting policies and procedures is also available on our Web site, www.troweprice.com. To access it, click on the words “Our Company” at the top of our corporate homepage. Then, when the next page appears, click on the words “Proxy Voting Policies” on the left side of the page.
Each fund’s most recent annual proxy voting record is available on our Web site and through the SEC’s Web site. To access it through our Web site, follow the directions above, then click on the words “Proxy Voting Records” on the right side of the Proxy Voting Policies page.
| How to Obtain Quarterly Portfolio Holdings |
The fund files a complete schedule of portfolio holdings with the Securities and Exchange Commission for the first and third quarters of each fiscal year on Form N-Q. The fund’s Form N-Q is available electronically on the SEC’s Web site (www.sec.gov); hard copies may be reviewed and copied at the SEC’s Public Reference Room, 450 Fifth St. N.W., Washington, DC 20549. For more information on the Public Reference Room, call 1-800-SEC-0330.
| Approval of Investment Management Agreement |
On March 9, 2010, the fund’s Board of Directors (Board) unanimously approved the continuation of the investment advisory contract (Contract) between the fund and its investment manager, T. Rowe Price Associates, Inc. (Adviser). The Board considered a variety of factors in connection with its review of the Contract, also taking into account information provided by the Adviser during the course of the year, as discussed below:
Services Provided by the Adviser
The Board considered the nature, quality, and extent of the services provided to the fund by the Adviser. These services included, but were not limited to, management of the fund’s portfolio and a variety of related activities, as well as financial and administrative services, reporting, and communications. The Board also reviewed the background and experience of the Adviser’s senior management team and investment personnel involved in the management of the fund. The Board concluded that it was satisfied with the nature, quality, and extent of the services provided by the Adviser.
Investment Performance of the Fund
The Board reviewed the fund’s average annual total returns over the one-year and since-inception periods, and compared these returns with a wide variety of previously agreed upon comparable performance measures and market data, including those supplied by Lipper and Morningstar, which are independent providers of mutual fund data. On the basis of this evaluation and the Board’s ongoing review of investment results, and factoring in the severity of the market turmoil during 2008 and 2009, the Board concluded that the fund’s performance was satisfactory.
Costs, Benefits, Profits, and Economies of Scale
The Board reviewed detailed information regarding the revenues received by the Adviser under the Contract and other benefits that the Adviser (and its affiliates) may have realized from its relationship with the fund, including research received under “soft dollar” agreements and commission-sharing arrangements with broker-dealers. The Board considered that the Adviser may receive some benefit from its soft-dollar arrangements pursuant to which it receives research from broker-dealers that execute the applicable fund’s portfolio transactions. The Board also received information on the estimated costs incurred and profits realized by the Adviser and its affiliates from advising T. Rowe Price mutual funds. The Board concluded that the Adviser’s profits from advising T. Rowe Price mutual funds were reasonable in light of the services provided to the fund. The Board also considered whether the fund or other funds benefit under the fee levels set forth in the Contract from any economies of scale realized by the Adviser. The Board noted that, under the Contract, the fund pays the Adviser a single fee based on the fund’s assets and that the Adviser, in turn, pays all expenses of the fund, with certain exceptions. The Board concluded that, based on the profitability data it reviewed and consistent with this single fee structure, the Contract provided for a reasonable sharing of any benefits from economies of scale with the fund.
Fees
The Board reviewed the fund’s single-fee structure and compared it with fees and expenses of other comparable funds based on information and data supplied by Lipper. The information provided to the Board indicated that the fund’s management fee rate was at or below the median for comparable funds, and the fund’s total expense ratio was below the median for comparable funds. (For these purposes, the Board assumed the fund’s management fee rate was equal to the single fee less the fund’s operating expenses.) The Board also reviewed the fee schedules for institutional accounts of the Adviser and its affiliates with smaller mandates. Management informed the Board that the Adviser’s responsibilities for institutional accounts are more limited than its responsibilities for the fund and other T. Rowe Price mutual funds that it or its affiliates advise and that the Adviser performs significant additional services and assumes greater risk for the fund and other T. Rowe Price mutual funds that it advises than it does for institutional accounts. On the basis of the information provided, the Board concluded that the fees paid by the fund under the Contract were reasonable.
Approval of the Contract
As noted, the Board approved the continuation of the Contract. No single factor was considered in isolation or to be determinative to the decision. Rather, the Board was assisted by the advice of independent legal counsel and concluded, in light of a weighting and balancing of all factors considered, that it was in the best interests of the fund to approve the continuation of the Contract, including the fees to be charged for services thereunder.
| About the Fund’s Directors and Officers |
Your fund is overseen by a Board of Directors (Board) that meets regularly to review a wide variety of matters affecting the fund, including performance, investment programs, compliance matters, advisory fees and expenses, service providers, and other business affairs. The Board elects the fund’s officers, who are listed in the final table. At least 75% of Board members are independent of T. Rowe Price Associates, Inc. (T. Rowe Price), and T. Rowe Price International, Inc. (T. Rowe Price International); “inside” or “interested” directors are employees or officers of T. Rowe Price. The business address of each director and officer is 100 East Pratt Street, Baltimore, Maryland 21202. The Statement of Additional Information includes additional information about the fund directors and is available without charge by calling a T. Rowe Price representative at 1-800-225-5132.
| Independent Directors | |
| |
| Name (Year of Birth) | |
| Year Elected* | Principal Occupation(s) During Past Five Years and Directorships of Other Public Companies |
| | |
| William R. Brody (1944) | President and Trustee, Salk Institute for Biological Studies (2009 to present); Director, Novartis, Inc. (2009 |
| 2009 | to present); Director, IBM (2007 to present); President and Trustee, Johns Hopkins University (1996 to 2009); |
| | Chairman of Executive Committee and Trustee, Johns Hopkins Health System (1996 to 2009) |
| | |
| Jeremiah E. Casey (1940) | Director, National Life Insurance (2001 to 2005); Director, NLV Financial Corporation (2004 to 2005) |
| 2006 | |
| | |
| Anthony W. Deering (1945) | Chairman, Exeter Capital, LLC, a private investment firm (2004 to present); Director, Under Armour (2008 to |
| 2002 | present); Director, Vornado Real Estate Investment Trust (2004 to present); Director, Mercantile Bankshares |
| | (2002 to 2007); Member, Advisory Board, Deutsche Bank North America (2004 to present) |
| | |
| Donald W. Dick, Jr. (1943) | Principal, EuroCapital Partners, LLC, an acquisition and management advisory firm (1995 to present) |
| 2002 | |
| | |
| Karen N. Horn (1943) | Senior Managing Director, Brock Capital Group, an advisory and investment banking firm (2004 to present); |
| 2003 | Director, Eli Lilly and Company (1987 to present); Director, Simon Property Group (2004 to present); Director, |
| | Norfolk Southern (2008 to present); Director, Georgia Pacific (2004 to 2005); Director, Fannie Mae (2006 to 2008) |
| | |
| Theo C. Rodgers (1941) | President, A&R Development Corporation (1977 to present) |
| 2005 | |
| | |
| John G. Schreiber (1946) | Owner/President, Centaur Capital Partners, Inc., a real estate investment company (1991 to present); Cofounder |
| 2002 | and Partner, Blackstone Real Estate Advisors, L.P. (1992 to present) |
| | |
| Mark R. Tercek (1957) | President and Chief Executive Officer, The Nature Conservancy (2008 to present); Managing Director, The Goldman |
| 2009 | Sachs Group, Inc. (1984 to 2008) |
| |
| *Each independent director oversees 125 T. Rowe Price portfolios and serves until retirement, resignation, or election of a successor. |
| |
| Inside Directors | |
| |
| Name (Year of Birth) | |
| Year Elected* [Number of | |
| T. Rowe Price Portfolios | |
| Overseen] | Principal Occupation(s) During Past Five Years and Other Directorships of Public Companies |
| | |
| Edward C. Bernard (1956) | Director and Vice President, T. Rowe Price; Vice Chairman of the Board, Director, and Vice President, T. Rowe Price |
| 2006 [125] | Group, Inc.; Chairman of the Board, Director, and President, T. Rowe Price Investment Services, Inc.; Chairman of |
| | the Board and Director, T. Rowe Price Global Asset Management Limited, T. Rowe Price Global Investment Services |
| | Limited, T. Rowe Price Retirement Plan Services, Inc., T. Rowe Price Savings Bank, and T. Rowe Price Services, |
| | Inc.; Director, T. Rowe Price International, Inc.; Chief Executive Officer, Chairman of the Board, Director, and |
| | President, T. Rowe Price Trust Company; Chairman of the Board, all funds |
| | |
| Michael C. Gitlin (1970) | Vice President, T. Rowe Price, T. Rowe Price Global Investment Services Limited, T. Rowe Price Group, Inc., and |
| 2010 [39] | T. Rowe Price International, Inc.; Director of Fixed Income, T. Rowe Price (2009 to present); Global Head of |
| | Trading, T. Rowe Price (2007 to 2009); formerly Head of U.S. Equity Sales, Citigroup Global Markets (2005 to 2007) |
| |
| *Each inside director serves until retirement, resignation, or election of a successor. |
| Officers | |
| |
| Name (Year of Birth) | |
| Position Held With Institutional Income Funds | Principal Occupation(s) |
| | |
| David C. Beers, CFA (1970) | Vice President, T. Rowe Price and T. Rowe Price Group, Inc. |
| Assistant Vice President | |
| | |
| Brian J. Brennan, CFA (1964) | Vice President, T. Rowe Price, T. Rowe Price Global Investment Services |
| Executive Vice President | Limited, T. Rowe Price Group, Inc., and T. Rowe Price Trust Company |
| | |
| Andrew M. Brooks (1956) | Vice President, T. Rowe Price and T. Rowe Price Group, Inc. |
| Vice President | |
| | |
| Michael J. Conelius, CFA (1964) | Vice President, T. Rowe Price, T. Rowe Price Global Investment Services |
| Vice President | Limited, T. Rowe Price Group, Inc., T. Rowe Price International, Inc., and |
| | T. Rowe Price Trust Company |
| | |
| Roger L. Fiery III, CPA (1959) | Vice President, T. Rowe Price, T. Rowe Price Group, Inc., T. Rowe Price |
| Vice President | International, Inc., and T. Rowe Price Trust Company |
| | |
| Justin T. Gerbereux, CFA (1975) | Vice President, T. Rowe Price and T. Rowe Price Group, Inc. |
| Executive Vice President | |
| | |
| John R. Gilner (1961) | Chief Compliance Officer and Vice President, T. Rowe Price; Vice President, |
| Chief Compliance Officer | T. Rowe Price Group, Inc., and T. Rowe Price Investment Services, Inc. |
| | |
| Gregory S. Golczewski (1966) | Vice President, T. Rowe Price and T. Rowe Price Trust Company |
| Vice President | |
| | |
| Gregory K. Hinkle, CPA (1958) | Vice President, T. Rowe Price, T. Rowe Price Group, Inc., and T. Rowe Price |
| Treasurer | Trust Company; formerly Partner, PricewaterhouseCoopers LLP (to 2007) |
| | |
| Steven C. Huber, CFA, FSA (1958) | Vice President, T. Rowe Price and T. Rowe Price Group, Inc.; formerly |
| Vice President | Chief Investment Officer, Maryland State Retirement Agency Pension Fund |
| | (to 2006) |
| | |
| Paul A. Karpers, CFA (1967) | Vice President, T. Rowe Price and T. Rowe Price Group, Inc. |
| Executive Vice President | |
| | |
| Ian D. Kelson (1956) | Vice President, T. Rowe Price, T. Rowe Price Global Investment Services |
| Vice President | Limited, T. Rowe Price Group, Inc., and T. Rowe Price International, Inc. |
| | |
| Patricia B. Lippert (1953) | Assistant Vice President, T. Rowe Price and T. Rowe Price Investment |
| Secretary | Services, Inc. |
| | |
| Paul M. Massaro, CFA (1975) | Vice President, T. Rowe Price and T. Rowe Price Group, Inc. |
| Executive Vice President | |
| | |
| Andrew McCormick (1960) | Vice President, T. Rowe Price, T. Rowe Price Group, Inc., and T. Rowe Price |
| Vice President | Trust Company; formerly Chief Investment Officer, IMPAC Mortgage Holdings |
| | (to 2008); Senior Portfolio Manager, Avenue Capital Group (to 2006); and |
| | Senior Vice President, Portfolio Transactions, Federal National Mortgage |
| | Association (to 2005) |
| | |
| Michael J. McGonigle (1966) | Vice President, T. Rowe Price and T. Rowe Price Group, Inc. |
| Vice President | |
| | |
| David Oestreicher (1967) | Director and Vice President, T. Rowe Price Investment Services, Inc., |
| Vice President | T. Rowe Price Trust Company, and T. Rowe Price Services, Inc.; Vice |
| | President, T. Rowe Price, T. Rowe Price Global Asset Management Limited, |
| | T. Rowe Price Global Investment Services Limited, T. Rowe Price Group, |
| | Inc., T. Rowe Price International, Inc., and T. Rowe Price Retirement Plan |
| | Services, Inc. |
| | |
| Brian A. Rubin, CPA (1974) | Vice President, T. Rowe Price and T. Rowe Price Trust Company |
| Assistant Vice President | |
| | |
| Deborah D. Seidel (1962) | Vice President, T. Rowe Price, T. Rowe Price Investment Services, Inc., and |
| Vice President | T. Rowe Price Services, Inc. |
| | |
| Daniel O. Shackelford, CFA (1958) | Vice President, T. Rowe Price, T. Rowe Price Group, Inc., and T. Rowe Price |
| Vice President | Trust Company |
| | |
| Walter P. Stuart III, CFA (1960) | Vice President, T. Rowe Price and T. Rowe Price Group, Inc. |
| Vice President | |
| | |
| Thomas E. Tewksbury (1961) | Vice President, T. Rowe Price, T. Rowe Price Group, Inc., and T. Rowe Price |
| Vice President | Trust Company |
| | |
| David A. Tiberii, CFA (1965) | Vice President, T. Rowe Price, T. Rowe Price Global Investment Services |
| Vice President | Limited, and T. Rowe Price Group, Inc. |
| | |
| Mark J. Vaselkiv (1958) | Vice President, T. Rowe Price, T. Rowe Price Group, Inc., T. Rowe Price |
| President | International, Inc., and T. Rowe Price Trust Company |
| | |
| Julie L. Waples (1970) | Vice President, T. Rowe Price |
| Vice President | |
| | |
| Thea N. Williams (1961) | Vice President, T. Rowe Price, T. Rowe Price Group, Inc., and T. Rowe Price |
| Vice President | Trust Company |
| |
| Unless otherwise noted, officers have been employees of T. Rowe Price or T. Rowe Price International for at least five years. |
Item 2. Code of Ethics.
The registrant has adopted a code of ethics, as defined in Item 2 of Form N-CSR, applicable to its principal executive officer, principal financial officer, principal accounting officer or controller, or persons performing similar functions. A copy of this code of ethics is filed as an exhibit to this Form N-CSR. No substantive amendments were approved or waivers were granted to this code of ethics during the period covered by this report.
Item 3. Audit Committee Financial Expert.
The registrant’s Board of Directors/Trustees has determined that Mr. Anthony W. Deering qualifies as an audit committee financial expert, as defined in Item 3 of Form N-CSR. Mr. Deering is considered independent for purposes of Item 3 of Form N-CSR.
Item 4. Principal Accountant Fees and Services.
(a) – (d) Aggregate fees billed to the registrant for the last two fiscal years for professional services rendered by the registrant’s principal accountant were as follows:
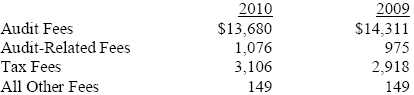
Audit fees include amounts related to the audit of the registrant’s annual financial statements and services normally provided by the accountant in connection with statutory and regulatory filings. Audit-related fees include amounts reasonably related to the performance of the audit of the registrant’s financial statements and specifically include the issuance of a report on internal controls and, if applicable, agreed-upon procedures related to fund acquisitions. Tax fees include amounts related to services for tax compliance, tax planning, and tax advice. The nature of these services specifically includes the review of distribution calculations and the preparation of Federal, state, and excise tax returns. All other fees include the registrant’s pro-rata share of amounts for agreed-upon procedures in conjunction with service contract approvals by the registrant’s Board of Directors/Trustees.
(e)(1) The registrant’s audit committee has adopted a policy whereby audit and non-audit services performed by the registrant’s principal accountant for the registrant, its investment adviser, and any entity controlling, controlled by, or under common control with the investment adviser that provides ongoing services to the registrant require pre-approval in advance at regularly scheduled audit committee meetings. If such a service is required between regularly scheduled audit committee meetings, pre-approval may be authorized by one audit committee member with ratification at the next scheduled audit committee meeting. Waiver of pre-approval for audit or non-audit services requiring fees of a de minimis amount is not permitted.
(2) No services included in (b) – (d) above were approved pursuant to paragraph (c)(7)(i)(C) of Rule 2-01 of Regulation S-X.
(f) Less than 50 percent of the hours expended on the principal accountant’s engagement to audit the registrant’s financial statements for the most recent fiscal year were attributed to work performed by persons other than the principal accountant’s full-time, permanent employees.
(g) The aggregate fees billed for the most recent fiscal year and the preceding fiscal year by the registrant’s principal accountant for non-audit services rendered to the registrant, its investment adviser, and any entity controlling, controlled by, or under common control with the investment adviser that provides ongoing services to the registrant were $1,879,000 and $1,922,000, respectively.
(h) All non-audit services rendered in (g) above were pre-approved by the registrant’s audit committee. Accordingly, these services were considered by the registrant’s audit committee in maintaining the principal accountant’s independence.
Item 5. Audit Committee of Listed Registrants.
Not applicable.
Item 6. Investments.
(a) Not applicable. The complete schedule of investments is included in Item 1 of this Form N-CSR.
(b) Not applicable.
Item 7. Disclosure of Proxy Voting Policies and Procedures for Closed-End Management Investment Companies.
Not applicable.
Item 8. Portfolio Managers of Closed-End Management Investment Companies.
Not applicable.
Item 9. Purchases of Equity Securities by Closed-End Management Investment Company and Affiliated Purchasers.
Not applicable.
Item 10. Submission of Matters to a Vote of Security Holders.
Not applicable.
Item 11. Controls and Procedures.
(a) The registrant’s principal executive officer and principal financial officer have evaluated the registrant’s disclosure controls and procedures within 90 days of this filing and have concluded that the registrant’s disclosure controls and procedures were effective, as of that date, in ensuring that information required to be disclosed by the registrant in this Form N-CSR was recorded, processed, summarized, and reported timely.
(b) The registrant’s principal executive officer and principal financial officer are aware of no change in the registrant’s internal control over financial reporting that occurred during the registrant’s second fiscal quarter covered by this report that has materially affected, or is reasonably likely to materially affect, the registrant’s internal control over financial reporting.
Item 12. Exhibits.
(a)(1) The registrant’s code of ethics pursuant to Item 2 of Form N-CSR is attached.
(2) Separate certifications by the registrant's principal executive officer and principal financial officer, pursuant to Section 302 of the Sarbanes-Oxley Act of 2002 and required by Rule 30a-2(a) under the Investment Company Act of 1940, are attached.
(3) Written solicitation to repurchase securities issued by closed-end companies: not applicable.
(b) A certification by the registrant's principal executive officer and principal financial officer, pursuant to Section 906 of the Sarbanes-Oxley Act of 2002 and required by Rule 30a-2(b) under the Investment Company Act of 1940, is attached.
| | |
SIGNATURES |
| |
| | Pursuant to the requirements of the Securities Exchange Act of 1934 and the Investment |
| Company Act of 1940, the registrant has duly caused this report to be signed on its behalf by the |
| undersigned, thereunto duly authorized. |
| |
| T. Rowe Price Institutional Income Funds, Inc. |
| |
| |
| By | /s/ Edward C. Bernard |
| | Edward C. Bernard |
| | Principal Executive Officer |
| |
| Date | July 16, 2010 |
| |
| |
| |
| | Pursuant to the requirements of the Securities Exchange Act of 1934 and the Investment |
| Company Act of 1940, this report has been signed below by the following persons on behalf of |
| the registrant and in the capacities and on the dates indicated. |
| |
| |
| By | /s/ Edward C. Bernard |
| | Edward C. Bernard |
| | Principal Executive Officer |
| |
| Date | July 16, 2010 |
| |
| |
| |
| By | /s/ Gregory K. Hinkle |
| | Gregory K. Hinkle |
| | Principal Financial Officer |
| |
| Date | July 16, 2010 |