(Exact name of registrant as specified in charter)
100 East Pratt Street, Baltimore, MD 21202
(Address of principal executive offices)
David Oestreicher
100 East Pratt Street, Baltimore, MD 21202
(Name and address of agent for service)
Registrant’s telephone number, including area code: (410) 345-2000
Date of fiscal year end: May 31
Date of reporting period: May 31, 2010
Item 1: Report to Shareholders
Institutional High Yield Fund
May 31, 2010
Highlights
• High yield bonds generated good gains for the 6- and 12-month periods ended May 31, 2010, boosted by improving economic conditions, ample liquidity, and moderating default rate assumptions.
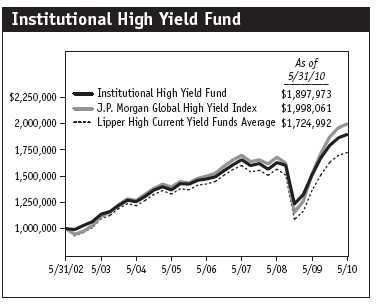
• The Institutional High Yield Fund posted solid gains for the year but underperformed the J.P. Morgan Global High Yield Index.
• Following a yearlong rally, the junk bond market traded lower in May due to the debt crisis in Europe and uncertainty about the global economic recovery, which led to heightened volatility and risk aversion.
• We remain bullish on the intermediate- and longer-term outlook for high yield bonds. We believe that credit quality for our companies will continue to improve and the default rate in the high yield market will continue to trend lower.
The views and opinions in this report were current as of May 31, 2010. They are not guarantees of performance or investment results and should not be taken as investment advice. Investment decisions reflect a variety of factors, and the managers reserve the right to change their views about individual stocks, sectors, and the markets at any time. As a result, the views expressed should not be relied upon as a forecast of the fund’s future investment intent. The report is certified under the Sarbanes-Oxley Act, which requires mutual funds and other public companies to affirm that, to the best of their knowledge, the information in their financial reports is fairly and accurately stated in all material respects.
Manager’s Letter T. Rowe Price Institutional High Yield Fund
Dear Investor
The high yield market posted another six months of good performance and generated exceptionally robust returns for the past year. The overall environment for sub-investment-grade companies remained favorable thanks to improving corporate balance sheets, abundant liquidity, and cost-cutting measures. Additionally, an upturn in business activity and strength in the broad economy led to higher revenues for many consumer-sensitive sectors and industries. Except for a few weeks in January, February, and May—when jitters about the European debt crisis caused markets to stumble—the high yield market enjoyed a nearly uninterrupted year of smooth sailing and strong returns.
Portfolio Performance
The high yield market generated solid gains during the last six months and exceptionally strong results for our fiscal year ended May 31, 2010. Despite the market weakness at the end of the reporting period, high yield bonds were the best-performing fixed income asset class by a wide margin in both periods. However, the portfolio underperformed the J.P. Morgan Global High Yield Index in the 6- and 12-month periods due to credit selection.
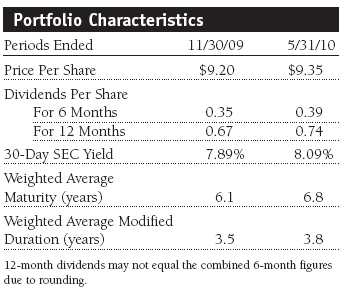
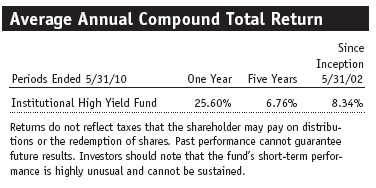
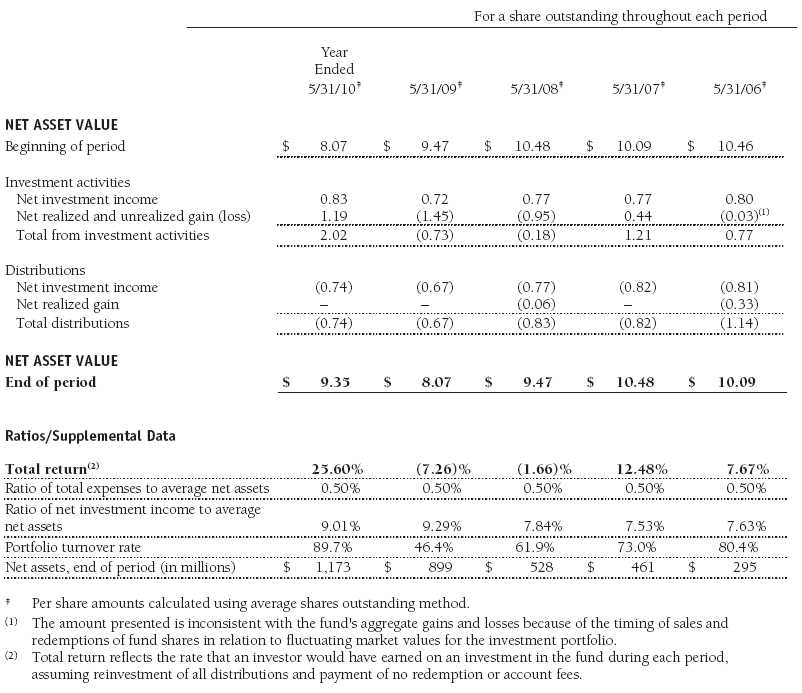
The fund’s share price advanced $1.25 over the past 12 months, to $9.35 from $8.07. During that period, the portfolio also generated $0.74 of dividend income for a 25.60% total return. In the last six months, capital appreciation was more muted, but dividend income totaling $0.39 remained strong. The fund’s SEC standardized yield at the end of the period was 8.09%. (See the glossary for definitions of these terms.) Our longer-term returns are shown in the table on page 8.
High Yield Market Environment
For 11 of the past 12 months, the high yield market was very strong. From May 31, 2009, through April 30, 2010, junk bonds moved steadily higher and on several occasions recorded monthly gains of better than 3%. The asset class benefited from huge investor cash inflows, positive sentiment, and significant price appreciation as the economy improved and default expectations waned. Investors flocked to the asset class to capture yields that were double or triple those of comparable-maturity Treasuries. In the low interest rate environment, new issuance surged and was well received—March and April were the two largest months for high yield bond issuance on record, totaling close to $74 billion. Most of the money was used to refinance existing bonds (extending the maturities on debt coming due), to bolster balance sheets, and, to a lesser extent, for mergers and acquisitions (leveraged buyout activity). With company fundamentals improving, default rates trended sharply lower. We believe the default rate in our market could dip to 2% by the end of 2010 and remain near that level in 2011.
During the month of May, investors looked past the recent positive U.S. economic news—the manufacturing sector continued its solid recovery, consumer spending increased, and housing data were reasonably encouraging—and focused on the sharp decline in the euro and continued stress and possible contagion from European bond markets. As investors grew skittish, they dumped risky assets in favor of the relative safety of U.S.Treasuries and other high-quality securities.
Although the high yield market pulled back in May (the fund fell approximately 4%), the loss merely turned a great six-month period into a good six months. The bears are arguing a sea change because many U.S. corporations with European operations could be hurt. However, we remain in the bullish camp and expect strong financial performance from the companies we own. As well, most of our large positions have very little exposure to European markets. We view the recent pullback as a good opportunity for buying because many companies that are delivering stable cash flows and improving profits are even more attractively priced. We may have a soft patch in the economy in the short term, which could produce a measure of investor angst, but we do not expect another recessionary period. At current prices and yields, we believe that investors are being compensated for a soft economic climate, and companies, for the most part, have improved their balance sheets.
Portfolio Review
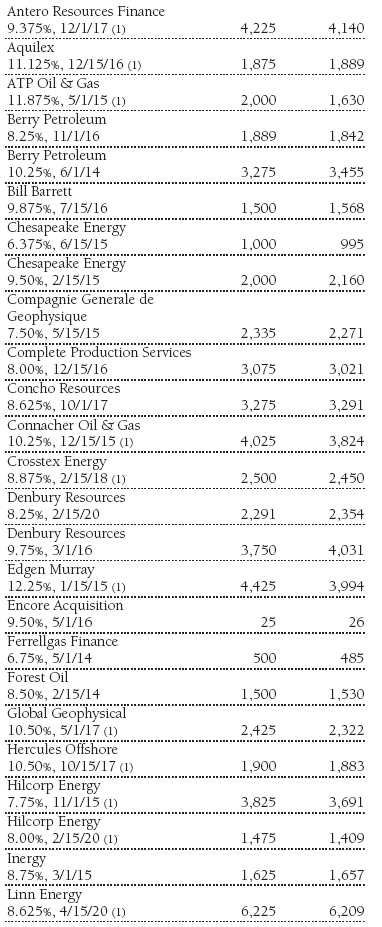
We generated strong gains from our holdings in automotives, broadcasting, financials, information technology, wireless communications, and energy. The largest allocation move during the last six months was into financials. The shift brings the portfolio’s financials holdings in line with our benchmark—several large investment-grade financial companies were downgraded, increasing the sector’s weighting in the benchmark. In addition to financials, the fund’s core holdings remain invested in stable sectors, such as energy, wireless communications, services, health care, and automotives.
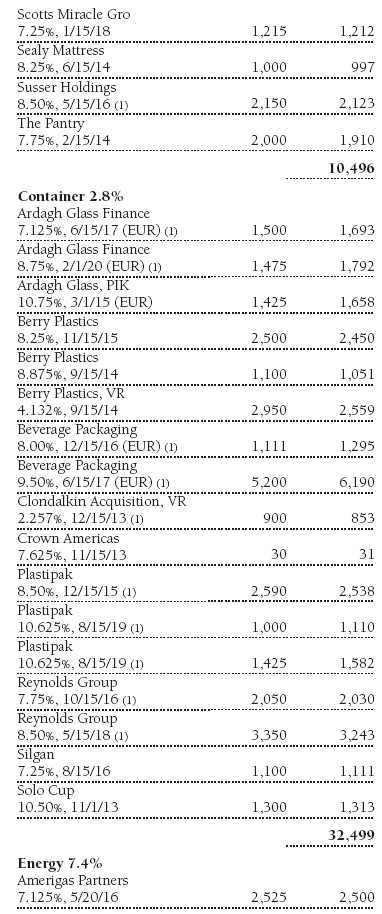
Although the period was very good for the high yield market, we made a few missteps. Our holdings in the container industry, which represented about 3% of the fund, declined. We also had small positions in the supermarkets and the textiles and apparel industries that fell, although the pair represented less than 2% of the portfolio.
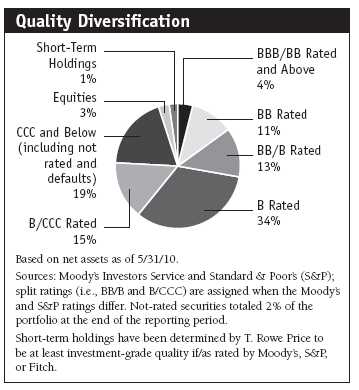
After positioning the portfolio defensively in late 2008 and early 2009, we saw improvement in the high yield market as our fiscal year progressed. Over the past 12 months, we systematically reduced our holdings in high-rated bonds (BBB/BB and BB) and bank debt and increased our exposure to the lower credit tiers (B, B/CCC, and CCC and below). For much of the period, we had as much as 8% of the fund in common stock, preferreds, and convertible securities. However, at the end of April, we trimmed our equity exposure. Those positions had appreciated dramatically, riding the tail-wind of strong stock market performance. Nevertheless, it became clear in the final month of the reporting period that equities were in for a rocky ride. So we reduced our stock and equity-linked holdings to about 3%. As we trimmed our exposure to those more volatile securities, we added the proceeds to bonds with above-average yields in an effort to raise our dividend payout.
Bankruptcy Ain’t Always All Bad
If we think of the high default rate environment over the past 18 months as storm clouds, we are finding silver linings in them. Several of the companies that recently filed for bankruptcy protection have emerged with more manageable debt loads and, in many cases, in great financial shape. In other words, good companies with bad balance sheets that declare bankruptcy can emerge as good companies with better balance sheets and excellent growth potential. Our high yield analyst team does not simply scratch companies off its coverage list because they have declared bankruptcy. We will opportunistically purchase companies coming out of bankruptcy that we view as diamonds in the rough. In fact, in the last six months, we have purchased several companies that recently emerged from bankruptcy because their business prospects and ability to repay debt has vastly improved.
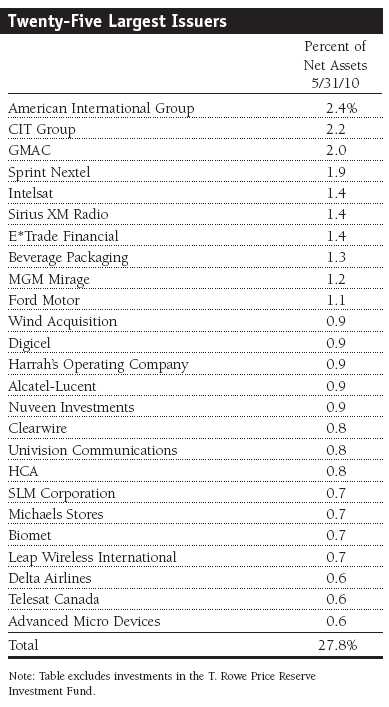
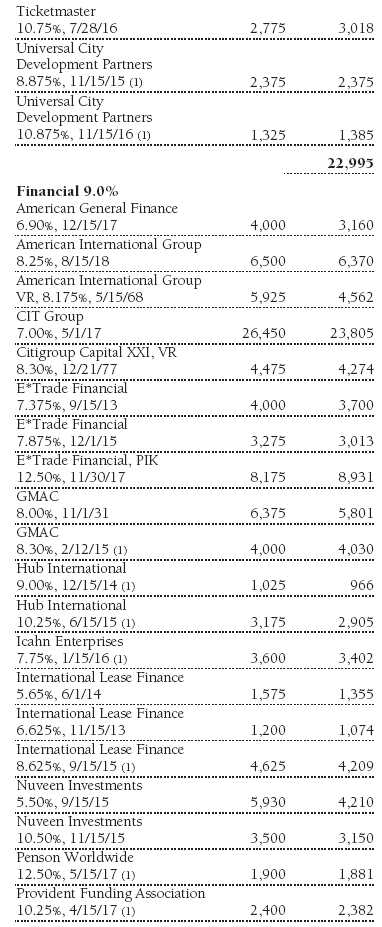
CIT Group is a great example of a company that exited from bankruptcy in solid financial condition. As shown in the table on page 7, the company was our second-largest holding—2.2% of the fund at the end of the reporting period. CIT went into bankruptcy in the second half of 2009. We had owned CIT earlier in 2009, but we sold our bonds before the company filed for bankruptcy (as noted in the November 30, 2009, shareholder letter). However our analysts kept following it because they liked the company’s business prospects, and we have confidence in its management team. (Please refer to the fund’s portfolio of investments for a complete listing of holdings and the amount each represents of the portfolio.)
When CIT emerged from bankruptcy in mid-December, we took a very substantial position in its bonds, which yield better than 9%. Relative to other financial services companies, it is extremely well capitalized—the company’s tangible equity ratio is much higher than at most large banks. CIT operates in a very profitable niche, lending to small and medium-sized retailers, industrial companies, and other businesses. We believe that either the debt will be refinanced at lower interest rates or the holding company will be acquired by a money center bank. The company could be a very attractive target for a larger bank that can borrow money at much lower levels. We have confidence in CIT’s chairman and seasoned market veteran John Thain, formerly the chairman of Merrill Lynch. We believe that his goal is to get the company back on a profitable tack and find a buyer.
Lyondell Petrochemical also recently emerged from bankruptcy. It filed Chapter 11 with $21 billion of debt and after restructuring, emerged with $7 billion of debt. Because it wasn’t paying interest during the process, the company amassed a $2 billion cash reserve. We think it is now on solid footing, and its bonds can perform well. General Motors (GM) was another top performer in the past six months. We bought GM’s bonds at 15% of par value after it emerged from bankruptcy. We think it is a solid company with improving fundamentals, and our holdings in the company have approximately doubled since we made our initial investment. GM, CIT, and Lyondell are good examples of how we took advantage of the market’s high default rate by cherry-picking strong companies that are making substantial improvements.
Financials: Down but Definitely Not Out
Historically, financials have been a relatively small part of the high yield market. However, the debt crisis that unfolded in 2008 turned many once-mighty financial firms such as CIT, into fallen angels—investment-grade companies that have been downgraded into the high yield universe. American International Group (AIG) is another huge bond issuer that had its debt lowered to below investment-grade status. At the end of the reporting period, AIG was the fund’s largest holding, and it was among our best performers for the past six months.
We own several different securities within AIG’s vast empire. One of its most prominent subsidiaries, International Lease Finance Corporation (ILFC), leases commercial jets. It is one of the largest companies in its market, and many view ILFC as AIG’s crown jewel. We think it is a solid company that could potentially be sold if AIG needed to take drastic measures to repay government loans. ILFC did a lot of refinancing this year, and we recently bought some of its new issue bonds and bank loans. We also own some of the company’s older debt and hybrid securities that mature in 2068. Our decision to buy was very involved, as the company and its securities are complex. Our high yield, investment-grade, and equity analyst teams worked together and scrutinized the company from every perspective. There may be no better recent example of T. Rowe Price collaborative research—it was an all-hands-on-deck effort, and it has produced excellent results.
The portfolio’s third-largest position and one of our top contributors in the last six months was GMAC (the company changed its name to Ally Financial in mid-May). It used to be the financial services arm and a wholly owned subsidiary of General Motors. GMAC has been a large high yield market issuer for quite some time. Its troubles stemmed from its foray into the sub-prime mortgage lending space. Its ResCap subsidiary was losing about $1.5 billion per quarter when the mortgage crisis was at its worst. However, GMAC took the serious measures needed to stem the losses. It has ceased its mortgage lending operations and cauterized the wounds from that business and is now refocused on traditional auto lending, which is looking up again.
One of the interesting things about GMAC and AIG is that both are majority owned by the U.S. government. Our thesis is that the government is not going to let either of these companies fail—it has too much money at stake. We like that we are effectively partnering with U.S. government-controlled operations, and our bonds are structurally senior to the government’s investments.
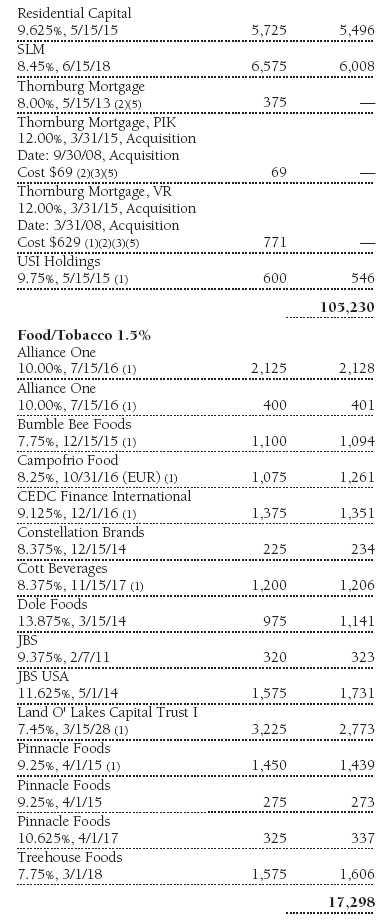
We own several other fallen angels in the financials segment, including Citigroup, Bank of America, and SLM Corporation (Sallie Mae). The credit crisis resulted in financials becoming one of the largest sectors in the high yield universe and the largest in your fund. Sallie Mae was among our best performers for the past six months. The bonds are BBB/BB rated, near the top of the junk bond universe, and we are earning an effective yield of almost 10% based on our purchase price.
The portfolio has owned Sallie Mae bonds for several years, and we also recorded solid gains in its convertible securities. Because of our research and our analysts’ belief in the health of the company, it has become a high-conviction name throughout the T. Rowe Price complex—several of our firm’s value-oriented equity funds have substantial positions in the common stock. In our view, financial services companies that are below investment grade don’t stay that way forever. These companies generate profits by borrowing at low rates and lending at higher rates. Therefore, financial firms will do whatever they can to raise their credit rating, which generally lowers their borrowing costs and improves profit margins. Over the past six months, we more than doubled the portfolio’s financials allocation to 13%.
Other Notable Contributors and Detractors
We like the prospects for the automotives sector, and we have added truck suppliers such as American Axle because we expect a new growth cycle. We bought American Axle bonds at 73% of par, and they have traded up to 88%. We invested in Tenneco, the muffler company, when its bonds were trading 30% to 40% below their face value, and they now trade at par. We own Goodyear Tire & Rubber, a very conservative company, because we also see a strong replacement cycle in tires. Overall, the sector generated good results over the past six months. We also hold Ford Motor bank loans, which had fallen to 33 cents on the dollar. We think Ford is one of the strongest companies in the sector—it did not default or take government rescue money. Ford’s loans traded near 90% of par value at the end of our reporting period, and it was a top six-month contributor. Automotives companies accounted for a handful of our 20 best contributors in the last six months.
Our wireless communications industry holdings were also good contributors. Sprint Nextel is the portfolio’s fourth-largest holding (1.9% of the fund) and was a top performer for the past six months. MetroPCS was another strong contributor. We also bought a substantial position in Clearwire, which is a wireless broadband spectrum provider—Sprint’s 4G WiMax network (Xohm) merged with Clearwire’s existing Wimax broadband network in May, and Sprint now owns a majority stake in the company. We have a 0.75% position in Clearwire, and we like the current yield on the 12% bonds due in 2015. Sprint was the first to launch a 4G phone, which has Internet, video, and many attractive available options; we think the technology is great, and both companies are positioned to perform well.
Sirius XM Radio was the portfolio’s best contributor over the past six months. We own the company’s bonds and convertibles—both performed extremely well. It is still one of our largest holdings, although we took profits on our position in the common stock, which we bought at $0.45 and sold for approximately $1.00. Part of the company’s success was tied to the recovery of the auto industry. Sirius is excelling in the car market. Many vehicles now come with a factory-installed Sirius radio, and buyers get three months of free service. Sirius is rapidly growing its subscriber base through this initiative and fortifying its already-solid market position. We believe that over the next 12 to 18 months the company’s cash flow is going to improve significantly.
In our last shareholder letter, we said we added a few European high yield bonds—conservative companies that offered solid value. However, in the last six months, several euro-denominated holdings were among our poorest performers. Beverage Packaging (the company that own Reynolds Wrap) and Ardagh Glass, a beer bottle manufacturer, were among our largest detractors. Although this proved a tactical mistake in the short run, at least, we made a good decision to hedge all of our euro currency holdings in February. Although the bonds traded lower, solely because of the euro’s decline, we offset the loss with gains from the hedge—as the euro fell from about $1.50 to near $1.20 versus the dollar. At the peak, our combined European bond holdings represented less than 3% of the portfolio.
We added to our position in Ohio-based NewPage in early 2010, but the timing of our purchase was not good, and the bonds detracted from returns in the last six months. The company is North America’s largest manufacturer of coated paper for magazines and corporate reports, and we believed that the market for its products was about to turn higher. NewPage’s customers had significantly reduced inventory levels during the recession, and coated paper prices appeared to be at unsustainably low levels. We believed that as demand recovered, pricing would quickly improve. What we failed to appreciate was that the company, facing tight liquidity conditions, had increased its fourth-quarter shipments to raise cash. The deliveries came sooner than the pickup in demand and therefore, NewPage was unable to increase its prices as quickly as our earlier projections. Additionally, the company’s CEO unexpectedly resigned, adding more uncertainty about the company’s future. These factors, and questions about the sustainability of the company’s capital structure, hurt our NewPage holdings in 2010.
Outlook
Earlier in the year, we thought the high yield market spread—the difference between the average yield on high yield bonds and comparable-maturity Treasuries—could tighten to 500 basis points (5%) based on the improving fundamental environment and falling default rate expectations. The high yield spread dipped to less than 600 basis points for a time, but in May, high yield bond prices fell sharply and the spread widened. At the end of the reporting period, the high yield market yielded 9.2%, which we think is compelling. In our opinion, the May sell-off in the asset class was too severe given the improving fundamentals of the companies in the market. Despite the recent negative shift in global investor sentiment in response to euro zone fiscal challenges, pending U.S. financial reform, policy tightening in China, and the Gulf oil spill, our tenured investment team is optimistic that credit spreads will again move tighter against the backdrop of stronger corporate earnings, limited defaults, and the significant amount of balance sheet improvement that has occurred over the last year.
We want to reiterate that we believe high yield bond market cycles of outperformance are enduring, often lasting several years, so we expect good results from our asset class in 2010 and 2011. The weakness we witnessed in May was in part attributable to the asset class becoming a “crowded trade.” Investors who piled into junk bonds in 2009 have done well. The market has generated excellent performance, and some profit taking was inevitable. We believe the market could be somewhat rocky in the summer months, and we believe this is not the time to panic and exit positions.
We intend to closely monitor the overall risk level in our portfolio. We also recognize that new deal structures have started to become less favorable as the tremendous demand for bonds has presented underwriters with opportunities to relax covenants and flex pricing. For this reason, we will remain vigilant in our research and will not compromise our credit standards. As always, we are committed to the disciplined investment approach and long-term perspective that have helped us generate attractive risk-adjusted performance in past market cycles.
Thank you for investing with T. Rowe Price.
Respectfully submitted,
Paul A. Karpers Chairman of the fund’s Investment Advisory Committee
June 10, 2010
The committee chairman has day-to-day responsibility for managing the portfolio and works with committee members in developing and executing the fund’s investment program.
Risks of Bond Investing
Bonds are subject to interest rate risk, the decline in bond prices that usually accompanies a rise in interest rates, and credit risk, the chance that any fund holding could have its credit rating downgraded or that a bond issuer will default (fail to make timely payments of interest or principal), potentially reducing the fund’s income level and share price. High yield corporate bonds could have greater price declines than funds that invest primarily in high-quality bonds. Companies issuing high yield bonds are not as strong financially as those with higher credit ratings, so the bonds are usually considered speculative investments.
Glossary
30-day SEC yield: A method of calculating a fund’s yield that assumes all portfolio securities are held until maturity. Yield will vary and is not guaranteed.
Duration: The average time (expressed in years) needed for an investor to receive the present value of the future cash flows on a fixed income investment. It is used to measure a bond or bond fund’s sensitivity to interest rate changes. For example, a fund with a three-year duration would fall about 3% in price in response to a one-percentage-point increase in interest rates, and vice versa. Modified duration provides a more accurate estimate of the fund’s price sensitivity based solely on changes in real interest rates.
J.P. Morgan Global High Yield Index: Tracks the performance of domestic and overseas noninvestment-grade corporate bonds; all are denominated in U.S. dollars.
Lipper averages: Consist of all mutual funds in a particular category as tracked by Lipper Inc.
Weighted average maturity: The weighted average maturity is a measure of a fund’s interest rate sensitivity. In general, the longer the average maturity, the greater the fund’s sensitivity to interest rate changes. The weighted average maturity may take into account the interest rate readjustment dates for certain securities.
Portfolio Highlights
Performance and Expenses T. Rowe Price Institutional High Yield Fund
Performance Comparison
This chart shows the value of a hypothetical $1 million investment in the fund over the past 10 fiscal year periods or since inception (for funds lacking 10-year records). The result is compared with benchmarks, which may include a broad-based market index and a peer group average or index. Market indexes do not include expenses, which are deducted from fund returns as well as mutual fund averages and indexes.
This table shows how the fund would have performed each year if its actual (or cumulative) returns for the periods shown had been earned at a constant rate.
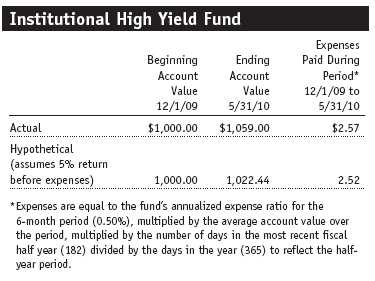
Fund Expense Example
As a mutual fund shareholder, you may incur two types of costs: (1) transaction costs, such as redemption fees or sales loads, and (2) ongoing costs, including management fees, distribution and service (12b-1) fees, and other fund expenses. The following example is intended to help you understand your ongoing costs (in dollars) of investing in the fund and to compare these costs with the ongoing costs of investing in other mutual funds. The example is based on an investment of $1,000 invested at the beginning of the most recent six-month period and held for the entire period.
Actual Expenses The first line of the following table (“Actual”) provides information about actual account values and actual expenses. You may use the information in this line, together with your account balance, to estimate the expenses that you paid over the period. Simply divide your account value by $1,000 (for example, an $8,600 account value divided by $1,000 = 8.6), then multiply the result by the number in the first line under the heading “Expenses Paid During Period” to estimate the expenses you paid on your account during this period.
Hypothetical Example for Comparison Purposes The information on the second line of the table (“Hypothetical”) is based on hypothetical account values and expenses derived from the fund’s actual expense ratio and an assumed 5% per year rate of return before expenses (not the fund’s actual return). You may compare the ongoing costs of investing in the fund with other funds by contrasting this 5% hypothetical example and the 5% hypothetical examples that appear in the shareholder reports of the other funds. The hypothetical account values and expenses may not be used to estimate the actual ending account balance or expenses you paid for the period.
You should also be aware that the expenses shown in the table highlight only your ongoing costs and do not reflect any transaction costs, such as redemption fees or sales loads. Therefore, the second line of the table is useful in comparing ongoing costs only and will not help you determine the relative total costs of owning different funds. To the extent a fund charges transaction costs, however, the total cost of owning that fund is higher.
Financial Highlights T. Rowe Price Institutional High Yield Fund
The accompanying notes are an integral part of these financial statements.
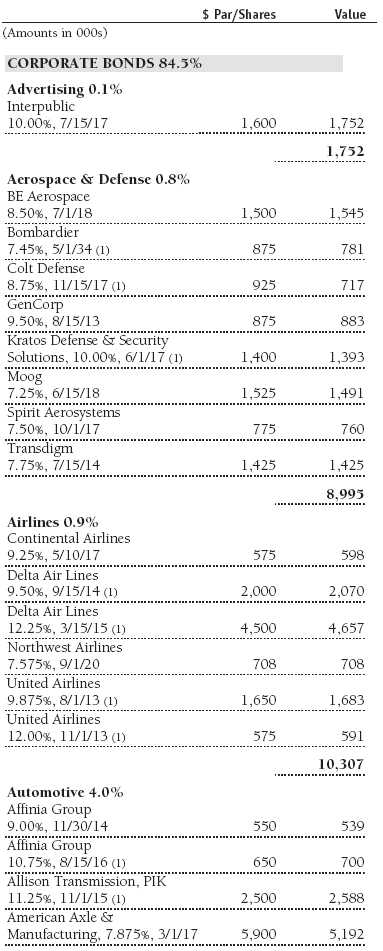
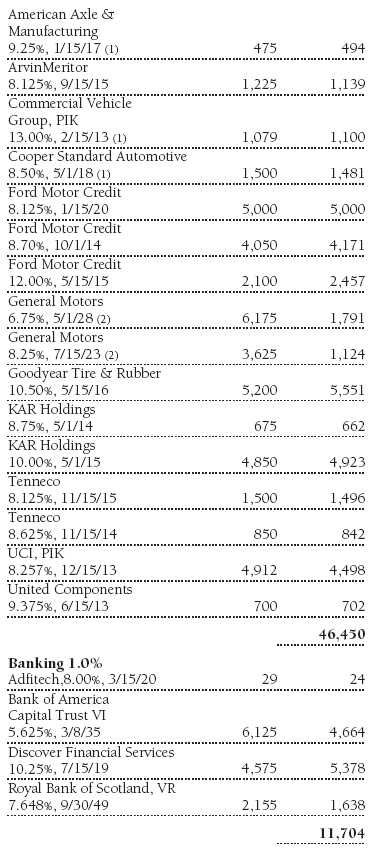
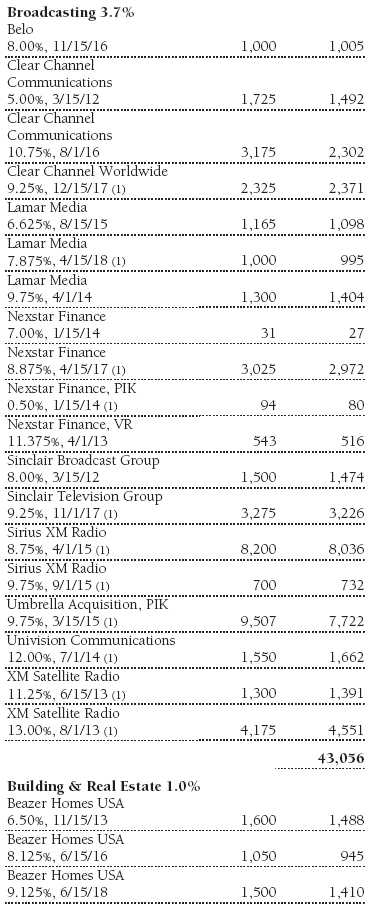
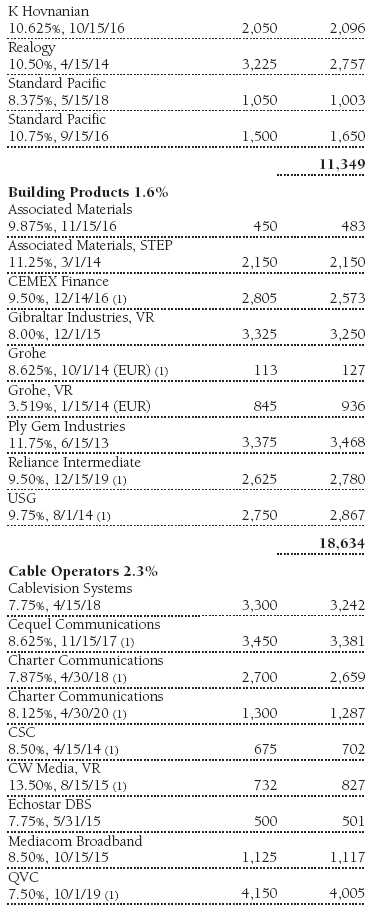
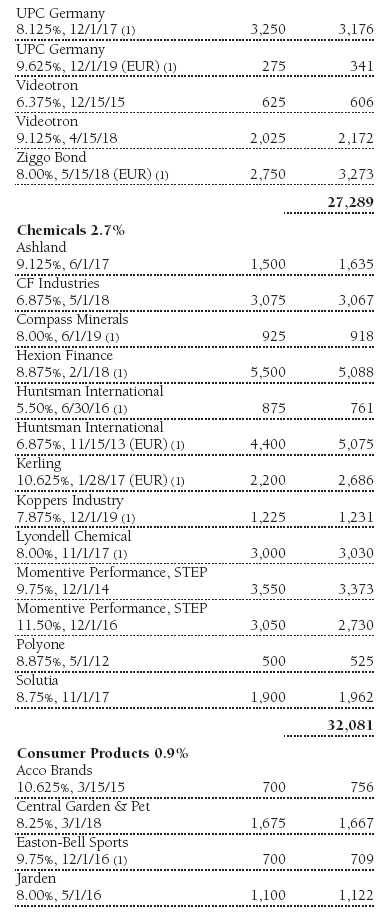
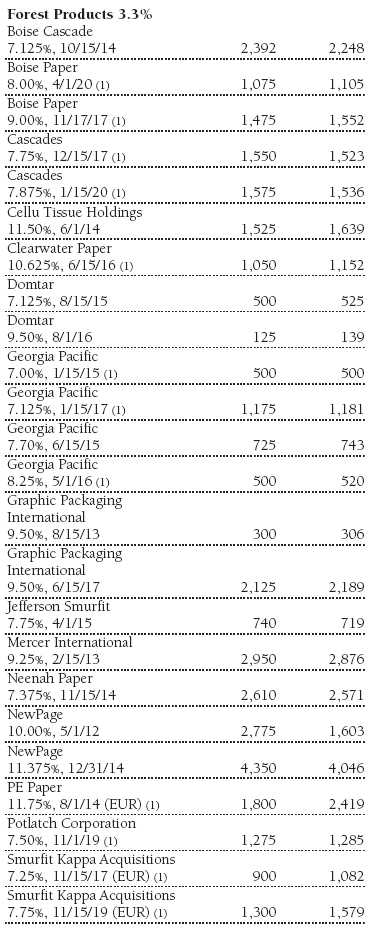
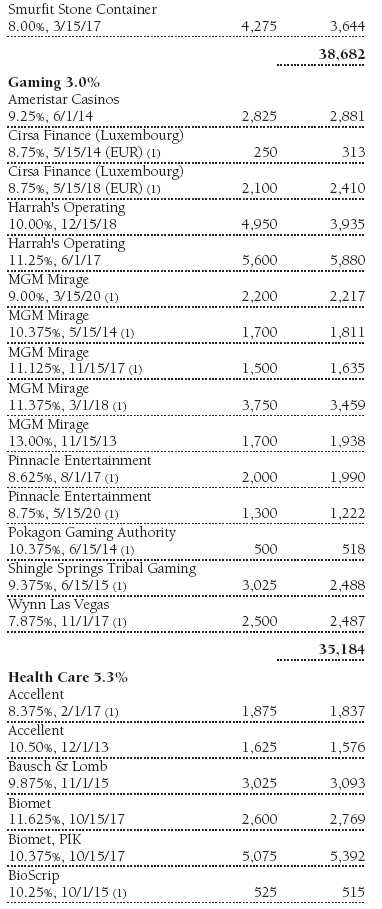
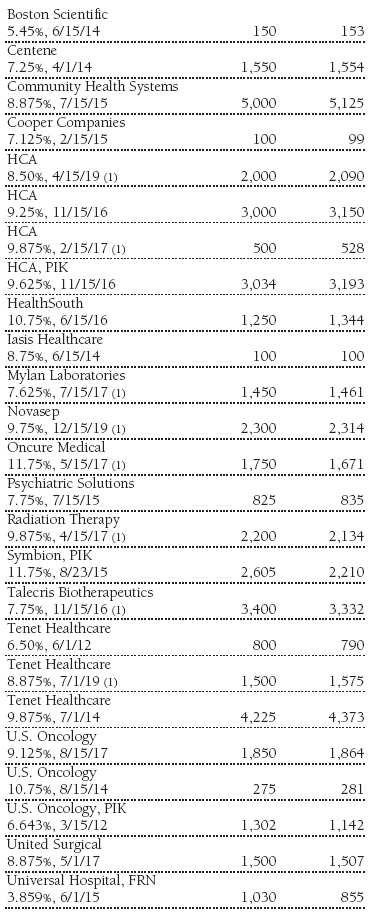
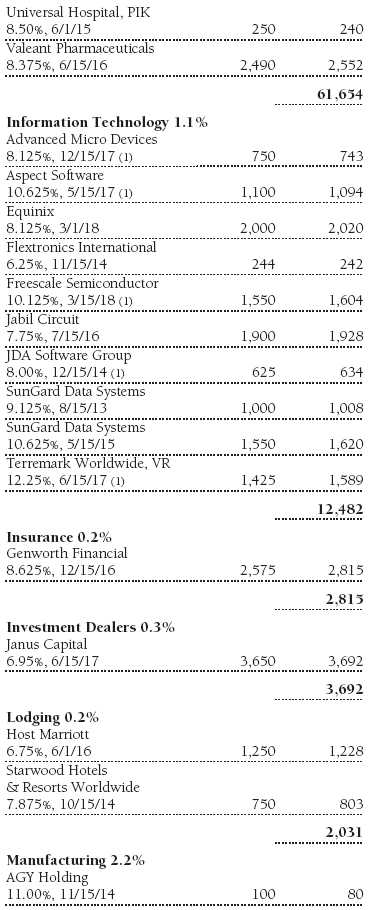
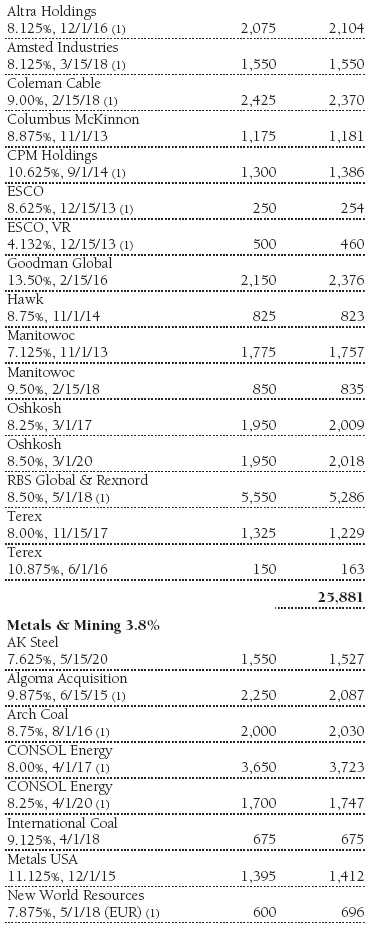
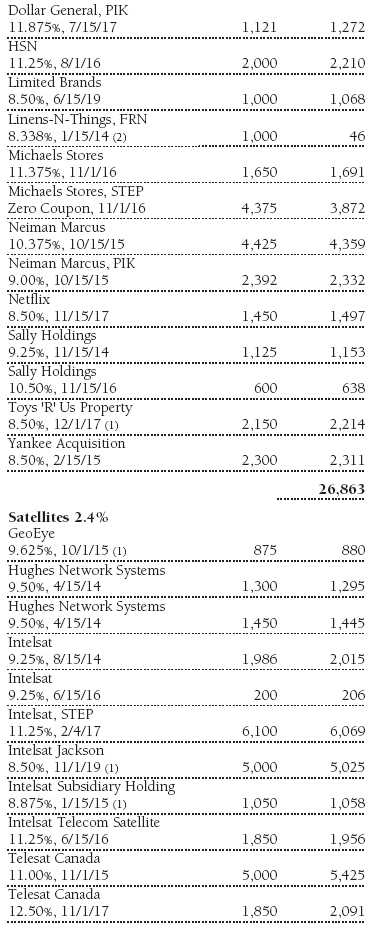
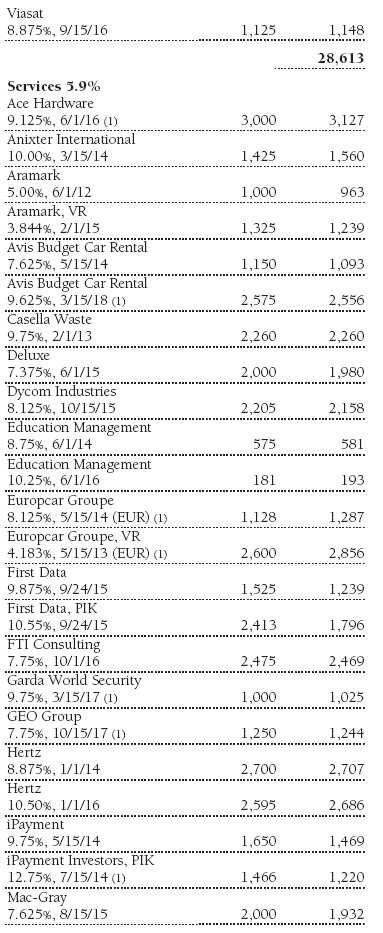
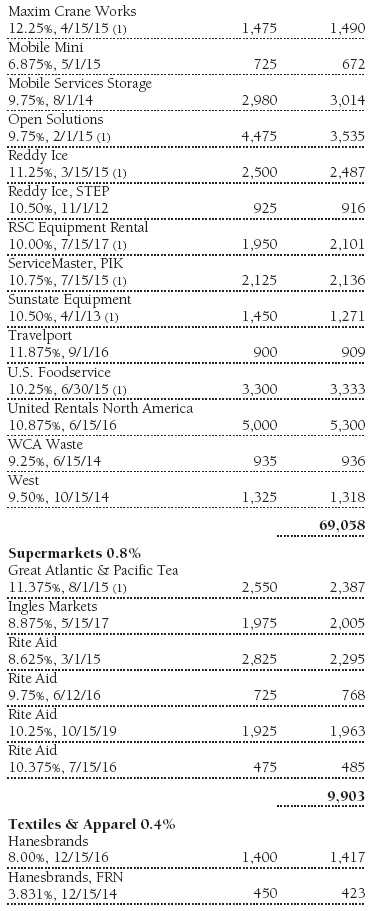
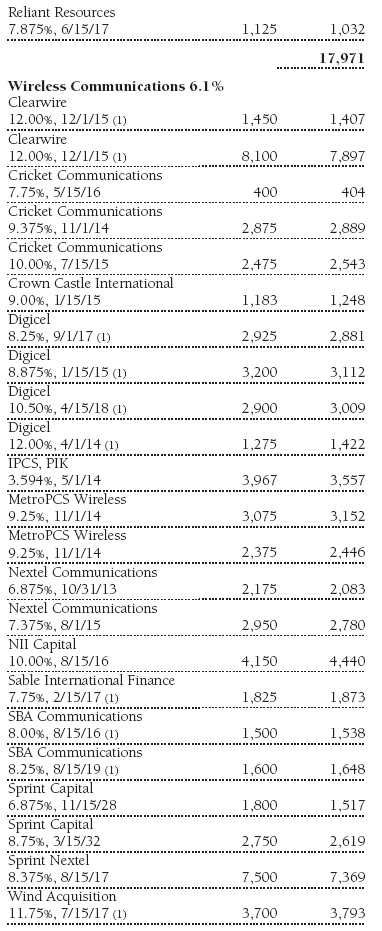
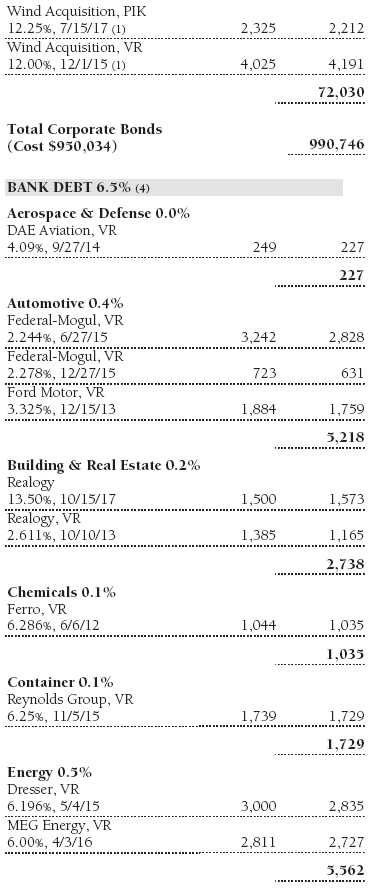
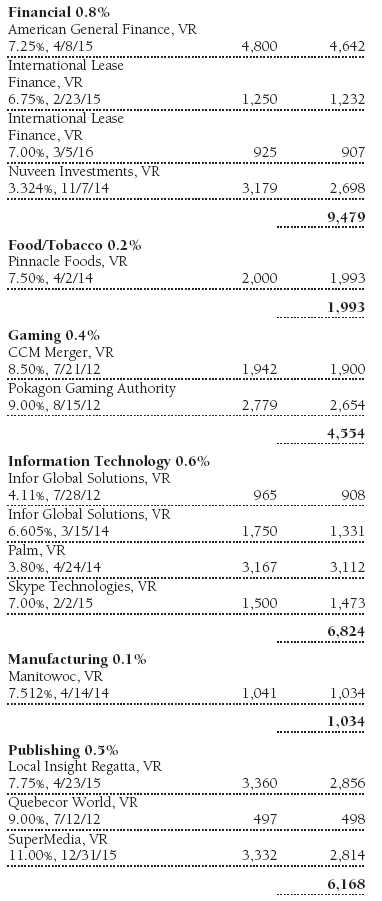
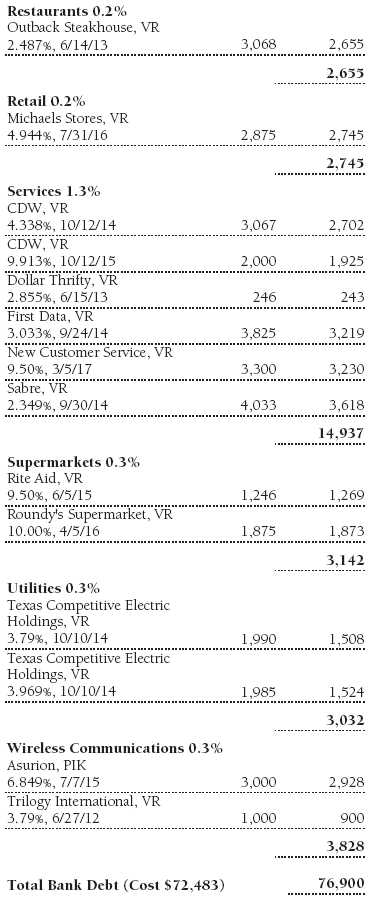
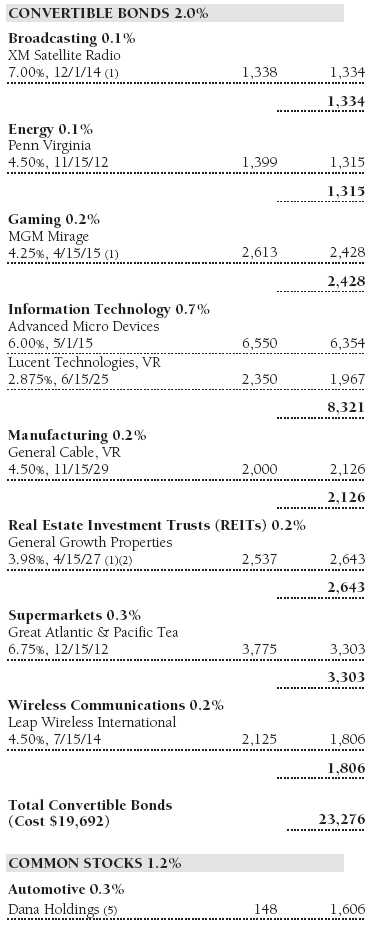
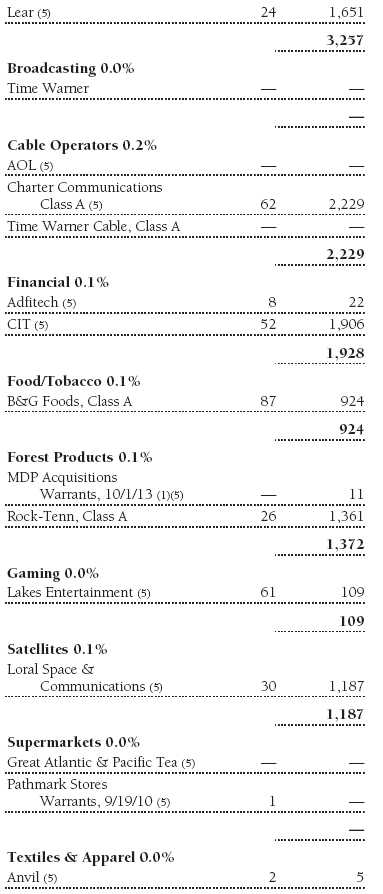
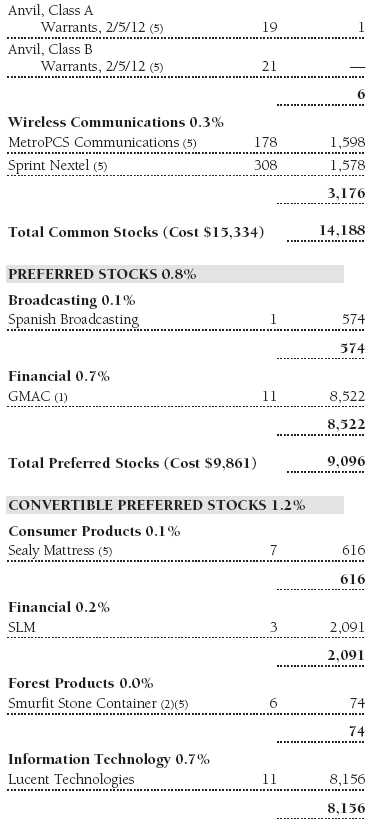
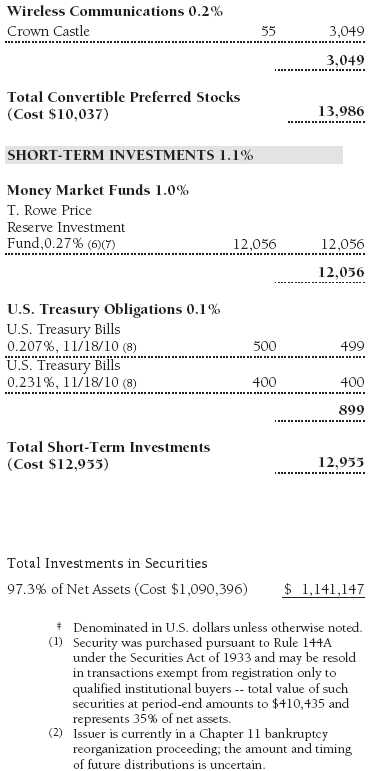
Portfolio of Investments‡ T. Rowe Price Institutional High Yield Fund May 31, 2010
The accompanying notes are an integral part of these financial statements.
Statement of Assets and Liabilities T. Rowe Price Institutional High Yield Fund May 31, 2010 ($000s, except shares and per share amounts)
The accompanying notes are an integral part of these financial statements.
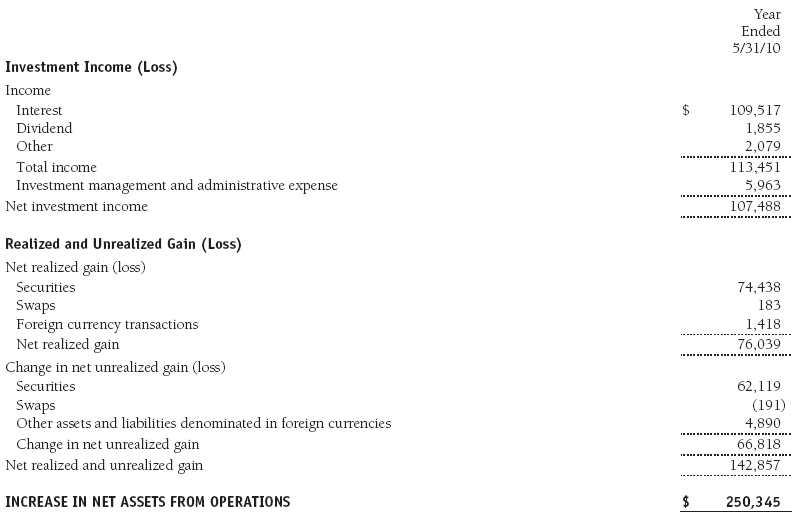
Statement of Operations T. Rowe Price Institutional High Yield Fund ($000s)
The accompanying notes are an integral part of these financial statements.
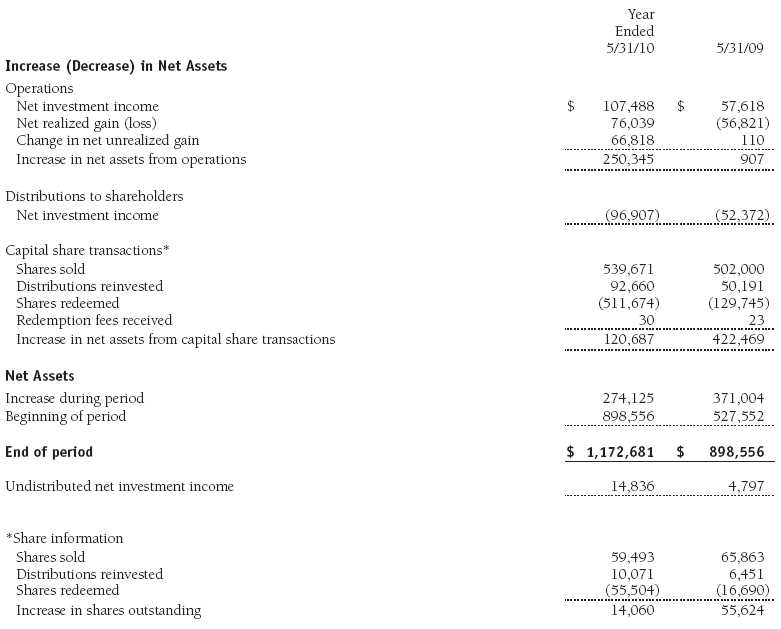
Statement of Changes in Net Assets T. Rowe Price Institutional High Yield Fund ($000s)
The accompanying notes are an integral part of these financial statements.
Notes to Financial Statements T. Rowe Price Institutional High Yield Fund May 31, 2010
T. Rowe Price Institutional Income Funds, Inc. (the corporation), is registered under the Investment Company Act of 1940 (the 1940 Act). The Institutional High Yield Fund (the fund), a diversified, open-end management investment company, is one portfolio established by the corporation. The fund commenced operations on May 31, 2002. The fund seeks high current income and, secondarily, capital appreciation.
NOTE 1 - SIGNIFICANT ACCOUNTING POLICIES
Basis of Preparation The accompanying financial statements were prepared in accordance with accounting principles generally accepted in the United States of America (GAAP), which require the use of estimates made by fund management. Fund management believes that estimates and valuations are appropriate; however, actual results may differ from those estimates, and the valuations reflected in the accompanying financial statements may differ from the value ultimately realized upon sale of securities.
Investment Transactions, Investment Income, and Distributions Income and expenses are recorded on the accrual basis. Premiums and discounts on debt securities are amortized for financial reporting purposes. Paydown gains and losses are recorded as an adjustment to interest income. Dividends received from mutual fund investments are reflected as dividend income; capital gain distributions are reflected as realized gain/loss. Dividend income and capital gain distributions are recorded on the ex-dividend date. Income tax-related interest and penalties, if incurred, would be recorded as income tax expense. Investment transactions are accounted for on the trade date. Realized gains and losses are reported on the identified cost basis. Distributions to shareholders are recorded on the ex-dividend date. Income distributions are declared daily and paid monthly. Capital gain distributions, if any, are generally declared and paid by the fund annually.
Currency Translation Assets, including investments, and liabilities denominated in foreign currencies are translated into U.S. dollar values each day at the prevailing exchange rate, using the mean of the bid and asked prices of such currencies against U.S. dollars as quoted by a major bank. Purchases and sales of securities, income, and expenses are translated into U.S. dollars at the prevailing exchange rate on the date of the transaction. The effect of changes in foreign currency exchange rates on realized and unrealized security gains and losses is reflected as a component of security gains and losses.
Redemption Fees A 1% fee is assessed on redemptions of fund shares held for 90 days or less to deter short-term trading and to protect the interests of long-term shareholders. Redemption fees are withheld from proceeds that shareholders receive from the sale or exchange of fund shares. The fees are paid to the fund and are recorded as an increase to paid-in capital. The fees may cause the redemption price per share to differ from the net asset value per share.
New Accounting Pronouncement In January 2010, new accounting guidance was issued that requires enhanced disclosures about fair value measurements in the financial statements; it is effective for fiscal years and interim periods beginning after December 15, 2009. Management expects that adoption of this guidance will have no impact on the fund’s net assets or results of operations.
NOTE 2 - VALUATION
The fund’s investments are reported at fair value as defined by GAAP. The fund determines the values of its assets and liabilities and computes its net asset value per share at the close of the New York Stock Exchange (NYSE), normally 4 p.m. ET, each day that the NYSE is open for business. Values in the accompanying Portfolio of Investments are as of May 28, 2010, the last business day in the fund’s fiscal year ended May 31, 2010. Some foreign markets were open between May 28 and the close of the reporting period on May 31, but any differences in investment values and foreign exchange rates subsequent to May 28 through May 31 were immaterial to the fund’s financial statements.
Valuation Methods Debt securities are generally traded in the over-the-counter (OTC) market. Securities with remaining maturities of one year or more at the time of acquisition are valued at prices furnished by dealers who make markets in such securities or by an independent pricing service, which considers the yield or price of bonds of comparable quality, coupon, maturity, and type, as well as prices quoted by dealers who make markets in such securities. Securities with remaining maturities of less than one year at the time of acquisition generally use amortized cost in local currency to approximate fair value. However, if amortized cost is deemed not to reflect fair value or the fund holds a significant amount of such securities with remaining maturities of more than 60 days, the securities are valued at prices furnished by dealers who make markets in such securities or by an independent pricing service.
Equity securities listed or regularly traded on a securities exchange or in the OTC market are valued at the last quoted sale price or, for certain markets, the official closing price at the time the valuations are made, except for OTC Bulletin Board securities, which are valued at the mean of the latest bid and asked prices. A security that is listed or traded on more than one exchange is valued at the quotation on the exchange determined to be the primary market for such security. Listed securities not traded on a particular day are valued at the mean of the latest bid and asked prices for domestic securities and the last quoted sale price for international securities.
Investments in mutual funds are valued at the mutual fund’s closing net asset value per share on the day of valuation. Forward currency exchange contracts are valued using the prevailing forward exchange rate. Swaps are valued at prices furnished by independent swap dealers or by an independent pricing service.
Other investments, including restricted securities, and those financial instruments for which the above valuation procedures are inappropriate or are deemed not to reflect fair value are stated at fair value as determined in good faith by the T. Rowe Price Valuation Committee, established by the fund’s Board of Directors.
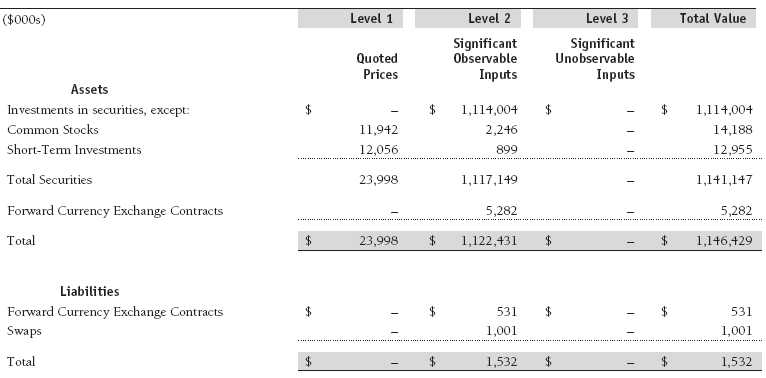
Valuation Inputs Various inputs are used to determine the value of the fund’s financial instruments. These inputs are summarized in the three broad levels listed below:
Level 1 – quoted prices in active markets for identical financial instruments
Level 2 – observable inputs other than Level 1 quoted prices (including, but not limited to, quoted prices for similar financial instruments, interest rates, prepayment speeds, and credit risk)
Level 3 – unobservable inputs
Observable inputs are those based on market data obtained from sources independent of the fund, and unobservable inputs reflect the fund’s own assumptions based on the best information available. The input levels are not necessarily an indication of the risk or liquidity associated with financial instruments at that level. The following table summarizes the fund’s financial instruments, based on the inputs used to determine their values on May 31, 2010:
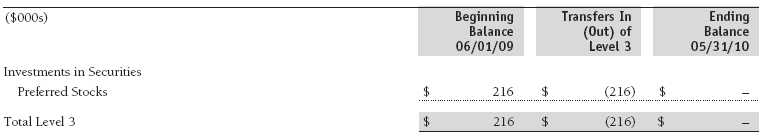
Following is a reconciliation of the fund’s Level 3 holdings for the year ended May 31, 2010. Transfers into and out of Level 3 are reflected at the value of the financial instrument at the beginning of the period.
NOTE 3 - DERIVATIVE INSTRUMENTS
During the year ended May 31, 2010, the fund invested in derivative instruments. As defined by GAAP, a derivative is a financial instrument whose value is derived from an underlying security price, foreign exchange rate, interest rate, index of prices or rates, or other variable; it requires little or no initial investment and permits or requires net settlement. The fund invests in derivatives only if the expected risks and rewards are consistent with its investment objectives, policies, and overall risk profile, as described in its prospectus and Statement of Additional Information. The fund may use derivatives for a variety of purposes, such as seeking to hedge against declines in principal value, increase yield, invest in an asset with greater efficiency and at a lower cost than is possible through direct investment, or to adjust portfolio duration and credit exposure. The risks associated with the use of derivatives are different from, and potentially much greater than, the risks associated with investing directly in the instruments on which the derivatives are based. Investments in derivatives can magnify returns positively or negatively; however, the fund at all times maintains sufficient cash reserves, liquid assets, or other SEC-permitted asset types to cover the settlement obligations under its open derivative contracts.
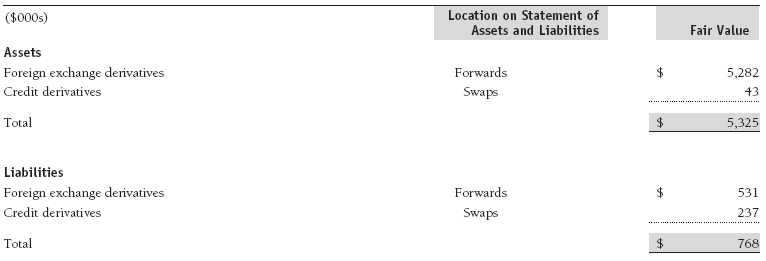
The fund values its derivatives at fair value, as described below and in Note 2, and recognizes changes in fair value currently in its results of operations. Accordingly, the fund does not follow hedge accounting, even for derivatives employed as economic hedges. The fund does not offset the fair value of derivative instruments and the right to reclaim or obligation to return collateral executed with the same counterparty under a master netting arrangement. The following table summarizes the fair value of the fund’s derivative instruments held as of May 31, 2010, and the related location on the accompanying Statement of Assets and Liabilities, presented by primary underlying risk exposure:
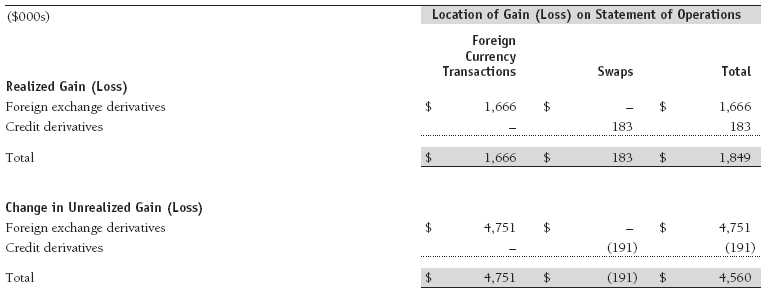
Additionally, the amount of gains and losses on derivative instruments recognized in fund earnings during the year ended May 31, 2010, and the related location on the accompanying Statement of Operations is summarized in the following table by primary underlying risk exposure:
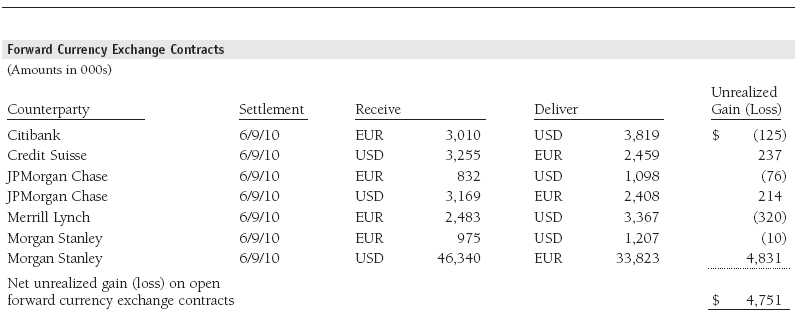
Forward Currency Exchange Contracts The fund is subject to foreign currency exchange rate risk in the normal course of pursuing its investment objectives. It uses forward currency exchange contracts (forwards) primarily to protect its non-U.S. dollar-denominated securities from adverse currency movements relative to the U.S. dollar. A forward involves an obligation to purchase or sell a fixed amount of a specific currency on a future date at a price set at the time of the contract. Although certain forwards may be settled by exchanging only the net gain or loss on the contract, most forwards are settled with the exchange of the underlying currencies in accordance with the specified terms. Forwards are valued at the unrealized gain or loss on the contract, which reflects the net amount the fund either is entitled to receive or obligated to deliver, as measured by the difference between the forward exchange rates at the date of entry into the contract and the forward rates at the reporting date. Appreciated forwards are reflected as assets, and depreciated forwards are reflected as liabilities on the accompanying Statement of Assets and Liabilities. Risks related to the use of forwards include the possible failure of counterparties to meet the terms of the agreements; that anticipated currency movements will not occur, thereby reducing the fund’s total return; and the potential for losses in excess of the fund’s initial investment. During the year ended May 31, 2010, the fund’s exposure to forwards, based on underlying notional amounts, was generally between 0% and 4% of net assets.
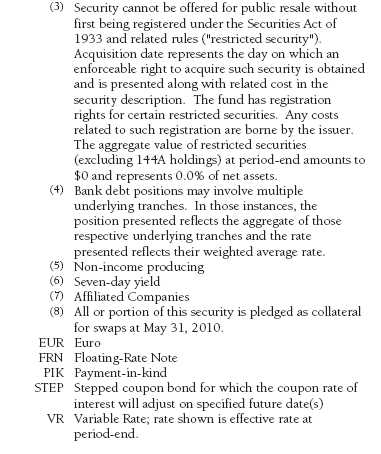
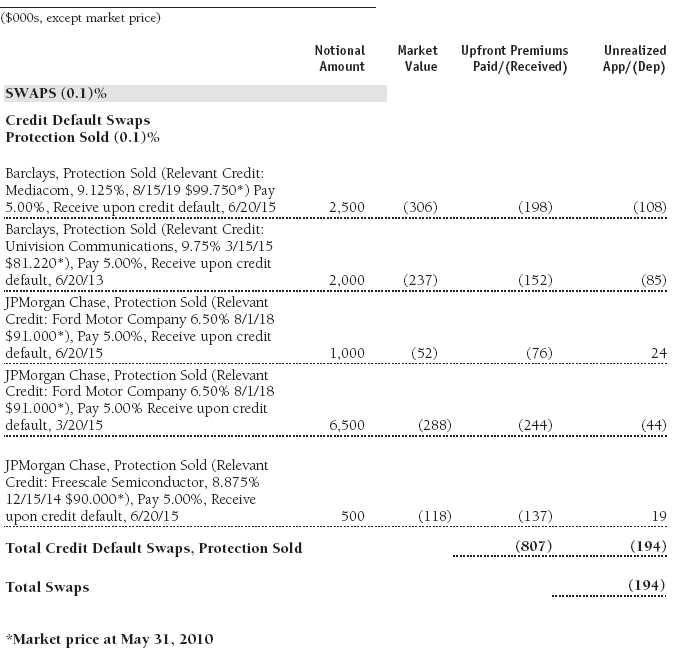
Credit Default Swaps The fund is subject to credit risk in the normal course of pursuing its investment objectives and uses swap contracts to help manage such risk. The fund may use swaps in an effort to manage exposure to changes in interest rates and credit quality, to adjust overall exposure to certain markets, to enhance total return or protect the value of portfolio securities, to serve as a cash management tool, and/or to adjust portfolio duration or credit exposure. Credit default swaps are agreements where one party (the protection buyer) agrees to make periodic payments to another party (the protection seller) in exchange for protection against specified credit events, such as certain defaults and bankruptcies related to an underlying credit instrument, index, or issuer thereof. Upon occurrence of a specified credit event, the protection seller is required to pay the buyer the difference between the notional amount of the swap and the value of the underlying credit, either in the form of a net cash settlement or by paying the gross notional amount and accepting delivery of the relevant underlying credit. Generally, the payment risk for the seller of protection is inversely related to the current market price of the underlying credit; therefore, the payment risk increases as the price of the relevant underlying credit declines due to market valuations of credit quality. As of May 31, 2010, the notional amount of protection sold by the fund totaled $12,500,000 (1.1% of net assets), which reflects the maximum potential amount the fund could be required to pay under such contracts. The value of a swap included in net assets is the unrealized gain or loss on the contract plus or minus any unamortized premiums paid or received, respectively. Appreciated swaps and premiums paid are reflected as assets, and depreciated swaps and premiums received are reflected as liabilities on the accompanying Statement of Assets and Liabilities. Net periodic receipts or payments required by swaps are accrued daily and are recorded as realized gain or loss for financial reporting purposes; fluctuations in the fair value of swaps are reflected in the change in net unrealized gain or loss and are reclassified to realized gain or loss upon termination prior to maturity or cash settlement. Risks related to the use of credit default swaps include the possible inability of the fund to accurately assess the current and future creditworthiness of underlying issuers, the possible failure of a counterparty to perform in accordance with the terms of the swap agreements, potential government regulation that could adversely affect the fund’s swap investments, and potential losses in excess of the fund’s initial investment. During the year ended May 31, 2010, the fund’s exposure to swaps, based on underlying notional amounts, was generally between 0% and 2% of net assets.
Counterparty Risk and Collateral The fund has entered into collateral agreements with certain counterparties to mitigate counterparty risk associated with over-the-counter (OTC) derivatives, including swaps and forward currency exchange contracts. Subject to certain minimum exposure requirements (which range from $100,000 to $500,000), collateral generally is determined based on the net aggregate unrealized gain or loss on all OTC derivative contracts with a particular counterparty. Collateral, both pledged by and for the benefit of the fund, is held in a segregated account by a third-party agent and can be in the form of cash or debt securities issued by the U.S. government or related agencies. Securities posted as collateral by the fund are so noted in the accompanying Portfolio of Investments and remain in the fund’s net assets. As of May 31, 2010, securities valued at $802,000 had been posted by the fund for the benefit of counterparties and securities valued at $4,946,000 were pledged as collateral by counterparties for the benefit of the fund.
At any point in time, the fund’s risk of loss from counterparty credit risk on OTC derivatives is the aggregate unrealized gain on appreciated contracts in excess of any collateral pledged by the counterparty for the benefit of the fund. In accordance with standard derivatives agreements, counterparties to OTC derivatives may be able to terminate derivative contracts prior to maturity in the event the fund fails to maintain sufficient asset coverage; its net assets decline by stated percentages; or it otherwise fails to meet the terms of its agreements, which would cause the fund to accelerate payment of any net liability owed to the counterparty under the contract.
NOTE 4 - OTHER INVESTMENT TRANSACTIONS
Consistent with its investment objective, the fund engages in the following practices to manage exposure to certain risks and/or to enhance performance. The investment objective, policies, program, and risk factors of the fund are described more fully in the fund’s prospectus and Statement of Additional Information.
Noninvestment-Grade Debt Securities At May 31, 2010, approximately 90% of the fund’s net assets were invested, either directly or through its investment in T. Rowe Price institutional funds, in noninvestment-grade debt securities, commonly referred to as “high yield” or “junk” bonds. The noninvestment-grade bond market may experience sudden and sharp price swings due to a variety of factors, including changes in economic forecasts, stock market activity, large sustained sales by major investors, a high-profile default, or a change in the market’s psychology. These events may decrease the ability of issuers to make principal and interest payments and adversely affect the liquidity or value, or both, of such securities.
Restricted Securities The fund may invest in securities that are subject to legal or contractual restrictions on resale. Prompt sale of such securities at an acceptable price may be difficult and may involve substantial delays and additional costs.
Bank Loans The fund may invest in bank loans, which represent interests in amounts owed by various borrowers to lenders or lending syndicates. A bank or other financial institution (lender) typically acts as agent for all holders and administers the bank loan in accordance with the credit agreement. Investments in bank loans may be in the form of loan assignments or loan participations. A loan assignment transfers direct ownership of all or a portion of specified third-party loans from the lender to the fund. Although loan assignments continue to be administered by the lender, the fund acquires direct rights against the borrower. In contrast, a loan participation generally entitles the fund to receive payments of principal, interest, and any fees that the lender is entitled to receive from the borrower; however, the lender continues to own and administer the loan. As a result, with loan participations, the fund generally has no right to enforce compliance with the terms of the credit agreement with the borrower, and the fund is subject to the credit risk of both the borrower and the lender. A portion of the fund’s bank loans may require additional principal to be funded at the borrowers’ discretion at a later date (unfunded commitments). The fund reflects both the funded portion of the bank loan as well as any unfunded commitment on the loan in the Portfolio of Investments. Certain credit agreements provide no initial funding, but require the full principal commitment to be funded at a future date at the borrower’s discretion. Such agreements are not reflected in the Portfolio of Investments until funded. At May 31, 2010, the fund’s total unfunded commitments were $7,000,000.
Other Purchases and sales of portfolio securities other than short-term securities aggregated $1,121,081,000 and $1,009,964,000, respectively, for the year ended May 31, 2010.
NOTE 5 - FEDERAL INCOME TAXES
No provision for federal income taxes is required since the fund intends to continue to qualify as a regulated investment company under Subchapter M of the Internal Revenue Code and distribute to shareholders all of its taxable income and gains. Distributions determined in accordance with federal income tax regulations may differ in amount or character from net investment income and realized gains for financial reporting purposes. Financial reporting records are adjusted for permanent book/tax differences to reflect tax character but are not adjusted for temporary differences.
The fund files U.S. federal, state, and local tax returns as required. The fund’s tax returns are subject to examination by the relevant tax authorities until expiration of the applicable statute of limitations, which is generally three years after filing of the tax return but could be longer in certain circumstances.
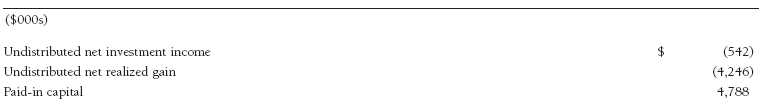
Reclassifications to paid-in capital relate primarily to a tax practice that treats a portion of the proceeds from each redemption of capital shares as a distribution of taxable net investment income and/or realized capital gain. Reclassifications between income and gain relate primarily to differences between book/tax amortization policies. For the year ended May 31, 2010, the following reclassifications were recorded to reflect tax character; there was no impact on results of operations or net assets:
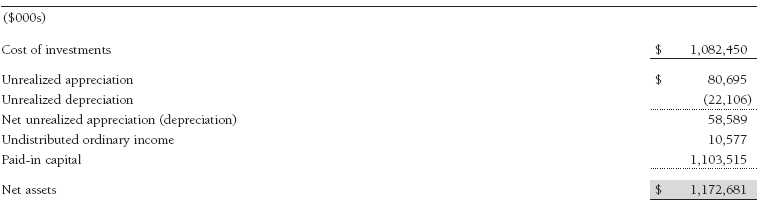
Distributions during the years ended May 31, 2010 and May 31, 2009, totaled $96,907,000 and $52,372,000, respectively, and were characterized as ordinary income for tax purposes. At May 31, 2010, the tax-basis cost of investments and components of net assets were as follows:
The difference between book-basis and tax-basis net unrealized appreciation (depreciation) is attributable to the deferral of losses from certain derivative contracts, and the recognition of market discount amortization.
NOTE 6 - RELATED PARTY TRANSACTIONS
The fund is managed by T. Rowe Price Associates, Inc. (the manager or Price Associates), a wholly owned subsidiary of T. Rowe Price Group, Inc. The investment management and administrative agreement between the fund and the manager provides for an all-inclusive annual fee equal to 0.50% of the fund’s average daily net assets. The fee is computed daily and paid monthly. The agreement provides that investment management, shareholder servicing, transfer agency, accounting, custody services, and directors’ fees and expenses are provided to the fund, and interest, taxes, brokerage commissions, and extraordinary expenses are paid directly by the fund.
The fund may invest in the T. Rowe Price Reserve Investment Fund and the T. Rowe Price Government Reserve Investment Fund (collectively, the T. Rowe Price Reserve Investment Funds), open-end management investment companies managed by Price Associates and considered affiliates of the fund. The T. Rowe Price Reserve Investment Funds are offered as cash management options to mutual funds, trusts, and other accounts managed by Price Associates and/or its affiliates and are not available for direct purchase by members of the public. The T. Rowe Price Reserve Investment Funds pay no investment management fees.
Mutual funds and other accounts managed by T. Rowe Price and its affiliates (collectively, T. Rowe Price funds) may invest in the fund; however, no T. Rowe Price fund may invest for the purpose of exercising management or control over the fund. At May 31, 2010, approximately 35% of the fund’s outstanding shares were held by T. Rowe Price funds.
Report of Independent Registered Public Accounting Firm
To the Board of Directors of T. Rowe Price Institutional Income Funds, Inc. and Shareholders of T. Rowe Price Institutional High Yield Fund
In our opinion, the accompanying statement of assets and liabilities, including the portfolio of investments, and the related statements of operations and of changes in net assets and the financial highlights present fairly, in all material respects, the financial position of T. Rowe Price Institutional High Yield Fund (one of the portfolios comprising T. Rowe Price Institutional Income Funds, Inc., hereafter referred to as the “Fund”) at May 31, 2010, the results of its operations for the year then ended, the changes in its net assets for each of the two years in the period then ended and the financial highlights for each of the five years in the period then ended, in conformity with accounting principles generally accepted in the United States of America. These financial statements and financial highlights (hereafter referred to as “financial statements”) are the responsibility of the Fund’s management; our responsibility is to express an opinion on these financial statements based on our audits. We conducted our audits of these financial statements in accordance with the standards of the Public Company Accounting Oversight Board (United States). Those standards require that we plan and perform the audit to obtain reasonable assurance about whether the financial statements are free of material misstatement. An audit includes examining, on a test basis, evidence supporting the amounts and disclosures in the financial statements, assessing the accounting principles used and significant estimates made by management, and evaluating the overall financial statement presentation. We believe that our audits, which included confirmation of securities at May 31, 2010 by correspondence with the custodian and brokers, and confirmation of the underlying funds by correspondence with the transfer agent, provide a reasonable basis for our opinion.
PricewaterhouseCoopers LLP Baltimore, Maryland July 16, 2010
Tax Information (Unaudited) for the Tax Year Ended 5/31/10
We are providing this information as required by the Internal Revenue Code. The amounts shown may differ from those elsewhere in this report because of differences between tax and financial reporting requirements.
The fund’s distributions to shareholders included $4,788,000 from short-term capital gains.
For taxable non-corporate shareholders, $811,000 of the fund’s income represents qualified dividend income subject to the 15% rate category.
For corporate shareholders, $811,000 of the fund’s income qualifies for the dividends-received deduction.
Information on Proxy Voting Policies, Procedures, and Records
A description of the policies and procedures used by T. Rowe Price funds and portfolios to determine how to vote proxies relating to portfolio securities is available in each fund’s Statement of Additional Information, which you may request by calling 1-800-225-5132 or by accessing the SEC’s Web site, www.sec.gov. The description of our proxy voting policies and procedures is also available on our Web site, www.troweprice.com. To access it, click on the words “Our Company” at the top of our corporate homepage. Then, when the next page appears, click on the words “Proxy Voting Policies” on the left side of the page.
Each fund’s most recent annual proxy voting record is available on our Web site and through the SEC’s Web site. To access it through our Web site, follow the directions above, then click on the words “Proxy Voting Records” on the right side of the Proxy Voting Policies page.
How to Obtain Quarterly Portfolio Holdings
The fund files a complete schedule of portfolio holdings with the Securities and Exchange Commission for the first and third quarters of each fiscal year on Form N-Q. The fund’s Form N-Q is available electronically on the SEC’s Web site (www.sec.gov); hard copies may be reviewed and copied at the SEC’s Public Reference Room, 450 Fifth St. N.W., Washington, DC 20549. For more information on the Public Reference Room, call 1-800-SEC-0330.
Approval of Investment Management Agreement
On March 9, 2010, the fund’s Board of Directors (Board) unanimously approved the continuation of the investment advisory contract (Contract) between the fund and its investment manager, T. Rowe Price Associates, Inc. (Adviser). The Board considered a variety of factors in connection with its review of the Contract, also taking into account information provided by the Adviser during the course of the year, as discussed below:
Services Provided by the Adviser The Board considered the nature, quality, and extent of the services provided to the fund by the Adviser. These services included, but were not limited to, management of the fund’s portfolio and a variety of related activities, as well as financial and administrative services, reporting, and communications. The Board also reviewed the background and experience of the Adviser’s senior management team and investment personnel involved in the management of the fund. The Board concluded that it was satisfied with the nature, quality, and extent of the services provided by the Adviser.
Investment Performance of the Fund The Board reviewed the fund’s average annual total returns over the one-, three-, and five-year periods, as well as the fund’s year-by-year returns, and compared these returns with a wide variety of previously agreed upon comparable performance measures and market data, including those supplied by Lipper and Morningstar, which are independent providers of mutual fund data. On the basis of this evaluation and the Board’s ongoing review of investment results, and factoring in the severity of the market turmoil during 2008 and 2009, the Board concluded that the fund’s performance was satisfactory.
Costs, Benefits, Profits, and Economies of Scale The Board reviewed detailed information regarding the revenues received by the Adviser under the Contract and other benefits that the Adviser (and its affiliates) may have realized from its relationship with the fund, including research received under “soft dollar” agreements and commission-sharing arrangements with broker-dealers. The Board considered that the Adviser may receive some benefit from its soft-dollar arrangements pursuant to which it receives research from broker-dealers that execute the applicable fund’s portfolio transactions. The Board also received information on the estimated costs incurred and profits realized by the Adviser and its affiliates from advising T. Rowe Price mutual funds, as well as estimates of the gross profits realized from managing the fund in particular. The Board concluded that the Adviser’s profits were reasonable in light of the services provided to the fund. The Board also considered whether the fund or other funds benefit under the fee levels set forth in the Contract from any economies of scale realized by the Adviser. The Board noted that, under the Contract, the fund pays the Adviser a single fee based on the fund’s assets and that the Adviser, in turn, pays all expenses of the fund, with certain exceptions. The Board concluded that, based on the profitability data it reviewed and consistent with this single-fee structure, the Contract provided for a reasonable sharing of any benefits from economies of scale with the fund.
Fees The Board reviewed the fund’s single-fee structure and compared it with fees and expenses of other comparable funds based on information and data supplied by Lipper. The information provided to the Board indicated that the fund’s management fee rate was at or below the median for comparable funds, and the fund’s total expense ratio was below the median for comparable funds. (For these purposes, the Board assumed the fund’s management fee rate was equal to the single fee less the fund’s operating expenses.) The Board also reviewed the fee schedules for institutional accounts of the Adviser and its affiliates with smaller mandates. Management informed the Board that the Adviser’s responsibilities for institutional accounts are more limited than its responsibilities for the fund and other T. Rowe Price mutual funds that it or its affiliates advise and that the Adviser performs significant additional services and assumes greater risk for the fund and other T. Rowe Price mutual funds that it advises than it does for institutional accounts. On the basis of the information provided, the Board concluded that the fees paid by the fund under the Contract were reasonable.
Approval of the Contract As noted, the Board approved the continuation of the Contract. No single factor was considered in isolation or to be determinative to the decision. Rather, the Board was assisted by the advice of independent legal counsel and concluded, in light of a weighting and balancing of all factors considered, that it was in the best interests of the fund to approve the continuation of the Contract, including the fees to be charged for services thereunder.
About the Fund’s Directors and Officers
Your fund is overseen by a Board of Directors (Board) that meets regularly to review a wide variety of matters affecting the fund, including performance, investment programs, compliance matters, advisory fees and expenses, service providers, and other business affairs. The Board elects the fund’s officers, who are listed in the final table. At least 75% of Board members are independent of T. Rowe Price Associates, Inc. (T. Rowe Price), and T. Rowe Price International, Inc. (T. Rowe Price International); “inside” or “interested” directors are employees or officers of T. Rowe Price. The business address of each director and officer is 100 East Pratt Street, Baltimore, Maryland 21202. The Statement of Additional Information includes additional information about the fund directors and is available without charge by calling a T. Rowe Price representative at 1-800-225-5132.
Independent Directors
Name (Year of Birth)
Year Elected*
Principal Occupation(s) During Past Five Years and Directorships of Other Public Companies
William R. Brody (1944)
President and Trustee, Salk Institute for Biological Studies (2009 to present); Director, Novartis, Inc. (2009
2009
to present); Director, IBM (2007 to present); President and Trustee, Johns Hopkins University (1996 to 2009);
Chairman of Executive Committee and Trustee, Johns Hopkins Health System (1996 to 2009)
Jeremiah E. Casey (1940)
Director, National Life Insurance (2001 to 2005); Director, NLV Financial Corporation (2004 to 2005)
2006
Anthony W. Deering (1945)
Chairman, Exeter Capital, LLC, a private investment firm (2004 to present); Director, Under Armour (2008 to
2002
present); Director, Vornado Real Estate Investment Trust (2004 to present); Director, Mercantile Bankshares
(2002 to 2007); Member, Advisory Board, Deutsche Bank North America (2004 to present)
Donald W. Dick, Jr. (1943)
Principal, EuroCapital Partners, LLC, an acquisition and management advisory firm (1995 to present)
2002
Karen N. Horn (1943)
Senior Managing Director, Brock Capital Group, an advisory and investment banking firm (2004 to present);
2003
Director, Eli Lilly and Company (1987 to present); Director, Simon Property Group (2004 to present); Director,
Norfolk Southern (2008 to present); Director, Georgia Pacific (2004 to 2005); Director, Fannie Mae (2006 to 2008)
Theo C. Rodgers (1941)
President, A&R Development Corporation (1977 to present)
2005
John G. Schreiber (1946)
Owner/President, Centaur Capital Partners, Inc., a real estate investment company (1991 to present); Cofounder
2002
and Partner, Blackstone Real Estate Advisors, L.P. (1992 to present)
Mark R. Tercek (1957)
President and Chief Executive Officer, The Nature Conservancy (2008 to present); Managing Director, The Goldman
2009
Sachs Group, Inc. (1984 to 2008)
*Each independent director oversees 125 T. Rowe Price portfolios and serves until retirement, resignation, or election of a successor.
Inside Directors
Name (Year of Birth)
Year Elected* [Number of
T. Rowe Price Portfolios
Overseen]
Principal Occupation(s) During Past Five Years and Other Directorships of Public Companies
Edward C. Bernard (1956)
Director and Vice President, T. Rowe Price; Vice Chairman of the Board, Director, and Vice President, T. Rowe Price
2006 [125]
Group, Inc.; Chairman of the Board, Director, and President, T. Rowe Price Investment Services, Inc.; Chairman of
the Board and Director, T. Rowe Price Global Asset Management Limited, T. Rowe Price Global Investment Services
Limited, T. Rowe Price Retirement Plan Services, Inc., T. Rowe Price Savings Bank, and T. Rowe Price Services,
Inc.; Director, T. Rowe Price International, Inc.; Chief Executive Officer, Chairman of the Board, Director, and
President, T. Rowe Price Trust Company; Chairman of the Board, all funds
Michael C. Gitlin (1970)
Vice President, T. Rowe Price, T. Rowe Price Global Investment Services Limited, T. Rowe Price Group, Inc., and
2010 [39]
T. Rowe Price International, Inc.; Director of Fixed Income, T. Rowe Price (2009 to present); Global Head of
Trading, T. Rowe Price (2007 to 2009); formerly Head of U.S. Equity Sales, Citigroup Global Markets (2005 to 2007)
*Each inside director serves until retirement, resignation, or election of a successor.
Officers
Name (Year of Birth)
Position Held With Institutional Income Funds
Principal Occupation(s)
David C. Beers, CFA (1970)
Vice President, T. Rowe Price and T. Rowe Price Group, Inc.
Assistant Vice President
Brian J. Brennan, CFA (1964)
Vice President, T. Rowe Price, T. Rowe Price Global Investment Services
Executive Vice President
Limited, T. Rowe Price Group, Inc., and T. Rowe Price Trust Company
Andrew M. Brooks (1956)
Vice President, T. Rowe Price and T. Rowe Price Group, Inc.
Vice President
Michael J. Conelius, CFA (1964)
Vice President, T. Rowe Price, T. Rowe Price Global Investment Services
Vice President
Limited, T. Rowe Price Group, Inc., T. Rowe Price International, Inc., and
T. Rowe Price Trust Company
Roger L. Fiery III, CPA (1959)
Vice President, T. Rowe Price, T. Rowe Price Group, Inc., T. Rowe Price
Vice President
International, Inc., and T. Rowe Price Trust Company
Justin T. Gerbereux, CFA (1975)
Vice President, T. Rowe Price and T. Rowe Price Group, Inc.
Executive Vice President
John R. Gilner (1961)
Chief Compliance Officer and Vice President, T. Rowe Price; Vice President,
Chief Compliance Officer
T. Rowe Price Group, Inc., and T. Rowe Price Investment Services, Inc.
Gregory S. Golczewski (1966)
Vice President, T. Rowe Price and T. Rowe Price Trust Company
Vice President
Gregory K. Hinkle, CPA (1958)
Vice President, T. Rowe Price, T. Rowe Price Group, Inc., and T. Rowe Price
(to 2008); Senior Portfolio Manager, Avenue Capital Group (to 2006); and
Senior Vice President, Portfolio Transactions, Federal National Mortgage
Association (to 2005)
Michael J. McGonigle (1966)
Vice President, T. Rowe Price and T. Rowe Price Group, Inc.
Vice President
David Oestreicher (1967)
Director and Vice President, T. Rowe Price Investment Services, Inc.,
Vice President
T. Rowe Price Trust Company, and T. Rowe Price Services, Inc.; Vice
President, T. Rowe Price, T. Rowe Price Global Asset Management Limited,
T. Rowe Price Global Investment Services Limited, T. Rowe Price Group,
Inc., T. Rowe Price International, Inc., and T. Rowe Price Retirement Plan
Services, Inc.
Brian A. Rubin, CPA (1974)
Vice President, T. Rowe Price and T. Rowe Price Trust Company
Assistant Vice President
Deborah D. Seidel (1962)
Vice President, T. Rowe Price, T. Rowe Price Investment Services, Inc., and
Vice President
T. Rowe Price Services, Inc.
Daniel O. Shackelford, CFA (1958)
Vice President, T. Rowe Price, T. Rowe Price Group, Inc., and T. Rowe Price
Vice President
Trust Company
Walter P. Stuart III, CFA (1960)
Vice President, T. Rowe Price and T. Rowe Price Group, Inc.
Vice President
Thomas E. Tewksbury (1961)
Vice President, T. Rowe Price, T. Rowe Price Group, Inc., and T. Rowe Price
Vice President
Trust Company
David A. Tiberii, CFA (1965)
Vice President, T. Rowe Price, T. Rowe Price Global Investment Services
Vice President
Limited, and T. Rowe Price Group, Inc.
Mark J. Vaselkiv (1958)
Vice President, T. Rowe Price, T. Rowe Price Group, Inc., T. Rowe Price
President
International, Inc., and T. Rowe Price Trust Company
Julie L. Waples (1970)
Vice President, T. Rowe Price
Vice President
Thea N. Williams (1961)
Vice President, T. Rowe Price, T. Rowe Price Group, Inc., and T. Rowe Price
Vice President
Trust Company
Unless otherwise noted, officers have been employees of T. Rowe Price or T. Rowe Price International for at least five years.
Item 2. Code of Ethics.
The registrant has adopted a code of ethics, as defined in Item 2 of Form N-CSR, applicable to its principal executive officer, principal financial officer, principal accounting officer or controller, or persons performing similar functions. A copy of this code of ethics is filed as an exhibit to this Form N-CSR. No substantive amendments were approved or waivers were granted to this code of ethics during the period covered by this report.
Item 3. Audit Committee Financial Expert.
The registrant’s Board of Directors/Trustees has determined that Mr. Anthony W. Deering qualifies as an audit committee financial expert, as defined in Item 3 of Form N-CSR. Mr. Deering is considered independent for purposes of Item 3 of Form N-CSR.
Item 4. Principal Accountant Fees and Services.
(a) – (d) Aggregate fees billed to the registrant for the last two fiscal years for professional services rendered by the registrant’s principal accountant were as follows:
Audit fees include amounts related to the audit of the registrant’s annual financial statements and services normally provided by the accountant in connection with statutory and regulatory filings. Audit-related fees include amounts reasonably related to the performance of the audit of the registrant’s financial statements and specifically include the issuance of a report on internal controls and, if applicable, agreed-upon procedures related to fund acquisitions. Tax fees include amounts related to services for tax compliance, tax planning, and tax advice. The nature of these services specifically includes the review of distribution calculations and the preparation of Federal, state, and excise tax returns. All other fees include the registrant’s pro-rata share of amounts for agreed-upon procedures in conjunction with service contract approvals by the registrant’s Board of Directors/Trustees.
(e)(1) The registrant’s audit committee has adopted a policy whereby audit and non-audit services performed by the registrant’s principal accountant for the registrant, its investment adviser, and any entity controlling, controlled by, or under common control with the investment adviser that provides ongoing services to the registrant require pre-approval in advance at regularly scheduled audit committee meetings. If such a service is required between regularly scheduled audit committee meetings, pre-approval may be authorized by one audit committee member with ratification at the next scheduled audit committee meeting. Waiver of pre-approval for audit or non-audit services requiring fees of a de minimis amount is not permitted.
(2) No services included in (b) – (d) above were approved pursuant to paragraph (c)(7)(i)(C) of Rule 2-01 of Regulation S-X.
(f) Less than 50 percent of the hours expended on the principal accountant’s engagement to audit the registrant’s financial statements for the most recent fiscal year were attributed to work performed by persons other than the principal accountant’s full-time, permanent employees.
(g) The aggregate fees billed for the most recent fiscal year and the preceding fiscal year by the registrant’s principal accountant for non-audit services rendered to the registrant, its investment adviser, and any entity controlling, controlled by, or under common control with the investment adviser that provides ongoing services to the registrant were $1,879,000 and $1,922,000, respectively.
(h) All non-audit services rendered in (g) above were pre-approved by the registrant’s audit committee. Accordingly, these services were considered by the registrant’s audit committee in maintaining the principal accountant’s independence.
Item 5. Audit Committee of Listed Registrants.
Not applicable.
Item 6. Investments.
(a) Not applicable. The complete schedule of investments is included in Item 1 of this Form N-CSR.
(b) Not applicable.
Item 7. Disclosure of Proxy Voting Policies and Procedures for Closed-End Management Investment Companies.
Not applicable.
Item 8. Portfolio Managers of Closed-End Management Investment Companies.
Not applicable.
Item 9. Purchases of Equity Securities by Closed-End Management Investment Company and Affiliated Purchasers.
Not applicable.
Item 10. Submission of Matters to a Vote of Security Holders.
Not applicable.
Item 11. Controls and Procedures.
(a) The registrant’s principal executive officer and principal financial officer have evaluated the registrant’s disclosure controls and procedures within 90 days of this filing and have concluded that the registrant’s disclosure controls and procedures were effective, as of that date, in ensuring that information required to be disclosed by the registrant in this Form N-CSR was recorded, processed, summarized, and reported timely.
(b) The registrant’s principal executive officer and principal financial officer are aware of no change in the registrant’s internal control over financial reporting that occurred during the registrant’s second fiscal quarter covered by this report that has materially affected, or is reasonably likely to materially affect, the registrant’s internal control over financial reporting.
Item 12. Exhibits.
(a)(1) The registrant’s code of ethics pursuant to Item 2 of Form N-CSR is attached.
(2) Separate certifications by the registrant's principal executive officer and principal financial officer, pursuant to Section 302 of the Sarbanes-Oxley Act of 2002 and required by Rule 30a-2(a) under the Investment Company Act of 1940, are attached.
(3) Written solicitation to repurchase securities issued by closed-end companies: not applicable.
(b) A certification by the registrant's principal executive officer and principal financial officer, pursuant to Section 906 of the Sarbanes-Oxley Act of 2002 and required by Rule 30a-2(b) under the Investment Company Act of 1940, is attached.
SIGNATURES
Pursuant to the requirements of the Securities Exchange Act of 1934 and the Investment
Company Act of 1940, the registrant has duly caused this report to be signed on its behalf by the
undersigned, thereunto duly authorized.
T. Rowe Price Institutional Income Funds, Inc.
By
/s/ Edward C. Bernard
Edward C. Bernard
Principal Executive Officer
Date
July 16, 2010
Pursuant to the requirements of the Securities Exchange Act of 1934 and the Investment
Company Act of 1940, this report has been signed below by the following persons on behalf of
the registrant and in the capacities and on the dates indicated.
By
/s/ Edward C. Bernard
Edward C. Bernard
Principal Executive Officer
Date
July 16, 2010
By
/s/ Gregory K. Hinkle
Gregory K. Hinkle
Principal Financial Officer
Date
July 16, 2010
We use cookies on this site to provide a more responsive and personalized service. Continuing to browse, clicking I Agree, or closing this banner indicates agreement. See our Cookie Policy for more information.