| UNITED STATES |
| SECURITIES AND EXCHANGE COMMISSION |
| Washington, D.C. 20549 |
| |
FORM N-CSR |
| |
CERTIFIED SHAREHOLDER REPORT OF REGISTERED |
MANAGEMENT INVESTMENT COMPANIES |
| |
| |
| |
| Investment Company Act File Number: 811-21055 |
|
| |
| T. Rowe Price Institutional Income Funds, Inc. |
|
| (Exact name of registrant as specified in charter) |
| |
| 100 East Pratt Street, Baltimore, MD 21202 |
|
| (Address of principal executive offices) |
| |
| David Oestreicher |
| 100 East Pratt Street, Baltimore, MD 21202 |
|
| (Name and address of agent for service) |
| |
| |
| Registrant’s telephone number, including area code: (410) 345-2000 |
| |
| |
| Date of fiscal year end: May 31 |
| |
| |
| Date of reporting period: May 31, 2008 |
Item 1: Report to Shareholders| Institutional High Yield Fund | May 31, 2008 |
The views and opinions in this report were current as of May 31, 2008. They are not guarantees of performance or investment results and should not be taken as investment advice. Investment decisions reflect a variety of factors, and the managers reserve the right to change their views about individual stocks, sectors, and the markets at any time. As a result, the views expressed should not be relied upon as a forecast of the fund’s future investment intent. The report is certified under the Sarbanes-Oxley Act, which requires mutual funds and other public companies to affirm that, to the best of their knowledge, the information in their financial reports is fairly and accurately stated in all material respects.
Manager’s Letter
T. Rowe Price Institutional High Yield Fund
Dear Investor
The environment for junk bonds turned ugly over the past six months. The challenges at the macro level—relating to the economy and capital markets—and issues specific to the asset class, created the worst environment for high-yield investing in more than two decades. Although defaults remained at historically low levels, yields on high-yield bonds surged to a wide premium over risk-free Treasuries, and your fund posted its first and only fiscal year loss. Over the past 12 months, high-yield bonds were the worst-performing fixed-income asset class.
• High-yield bonds performed poorly during the past six and 12 months.
• Although defaults remained at historically low levels, yields on high-yield bonds surged to a wide premium over risk-free Treasuries.
• The T. Rowe Price Institutional High Yield Fund’s returns trailed its benchmark, the J.P. Morgan Global High Yield Index in both periods.
• We have positioned the portfolio defensively to withstand the challenging market environment, and we intend to remain vigilant on risks to both the economy and to individual companies in the portfolio.
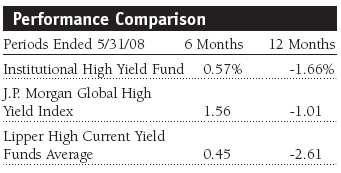
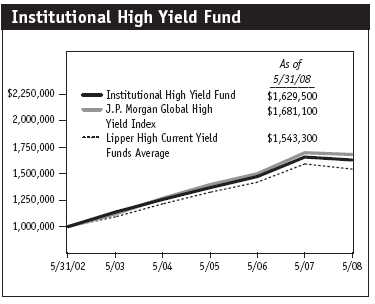
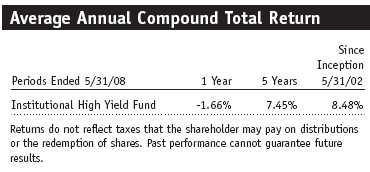
In our last shareholder report, we noted the uncertainty in the high-yield market and the likelihood that the asset class would take its cues from the overall economic trends related to housing, consumer spending, employment, and interest rates. Problems on Wall Street also moved front and center as major concerns. Your fund generated a modest 0.57% six-month gain and a 1.66% loss for the 12 months ended May 31, 2008, as shown in the table above. The fund’s modest positive return for the past six months belies the underlying volatility in our market, which included approximately a 4% first-quarter loss and a monster rally in April that brought our returns back into positive territory. These are wild swings unlike anything we have experienced in the past. In both periods, we trailed the performance of the J.P. Morgan Global High Yield Index and modestly outperformed the Lipper High Current Yield Funds Average.

In this environment, the fund’s share price declined $0.38 for the past six months to $9.47. In the past six months, the portfolio paid $0.40 of dividend income and $0.06 in capital gains, providing a modest positive return. The fund’s dividend yield at the end of the reporting period stood at 7.61% and the SEC standardized yield was 8.10%. Our longer-term returns are shown in the table on page 7.
Market Environment
As the fallout of subprime mortgage defaults and delinquencies spread from mortgage companies to big Wall Street firms and major commercial banks, liquidity in the financial markets quickly evaporated. The credit market problems prompted investors to sell riskier investments and seek out the relative safety of U.S. Treasury securities.
Several major issues created headwinds for the performance of the high-yield market during the last six months. Foremost was the housing market meltdown, which has caused a contraction in consumer spending and resulted in an economic slowdown, if not an outright recession. Related to the turmoil in housing was Wall Street’s excessive risk taking, particularly in the subprime mortgage market, which has shaken the confidence of the financial system. Global investment banks have incurred losses totaling approximately $250 billion on financial engineering transactions such as structured products. This problem came to a head with the near collapse of Bear Stearns in March. However, there is lingering anxiety that other financial institutions are also in bad shape. Lehman Brothers, shortly after the end of our reporting period, reported a $3 billion second-quarter loss, largely due to write-downs and derivatives transactions.
Another industry-specific concern was the explosion of supply of new issues driven by private-equity transactions. Several of the largest leveraged buyouts (LBOs) in U.S. history could not be sold and ended up on the balance sheets of the underwriters—t he major investment banks—and some of them are still on the books waiting to get distributed. It is important to understand that there are now effectively two high-yield markets: the traditional high-yield bond market and the leveraged loan market, which is essentially the bank debt of the companies in the asset class. Private-equity sponsors use loans and high-yield bonds extensively to finance LBOs. Although they rank differently in capital structures, both are about trillion-dollar markets and suffered in this environment.
Derivatives
The biggest change from previous bear markets, and the primary reason for the fixed-income markets’ volatility, is the advent of hedge funds and derivatives into our world—a problem that is relevant across the entire bond market but specifically impacts high-yield investors. Derivatives, especially credit default swaps (CDS), have exploded in notional value. They are one of the most highly utilized vehicles for trading credit risk in the bond market with an aggregate market value of approximately $60 trillion. CDS contracts, which are typically five years, can provide very broad coverage or have a narrow focus on specific credit events.
We believe T. Rowe Price has a competitive advantage in this market due to the strength and breadth of our fundamental research team. We are well positioned to use our proprietary credit research to estimate companies’ relative potential. Buying or selling CDS enables us to mitigate or amplify exposure to a single corporate issuer or credit index and is an efficient means to express our credit convictions, hedge risk, and potentially enhance total return.
Unlike the traditional high-yield market, where there is a fixed amount of debt issued by a company, in the derivatives world, an infinite amount of contracts can be written. As long as investment banks are willing to write the contracts and there are willing parties for both sides of the trade, the sky’s the limit. The net impact of derivatives over the past 12 months has been to dramatically increase volatility in the credit markets. In the old days, demand from buyers and sellers, typically long-term buy-and-hold investors, created volatility, but today business is conducted by hedge funds that have a much shorter-term focus.
Portfolio Review
At the end of the reporting period, we held about 10% of the portfolio in bank debt “leveraged loans” and another 5% in floating-rate bonds. For most of 2007, our floating-rate bonds paid about 2% to 3% more than the 5% to 5.25% Libor rate. We were earning more for floating-rate bonds than we would have received on 10-year fixed-rate bonds because the yield curve was inverted. In the last six months, this positioning hasn’t worked out as short-terms rates, including Libor, plummeted. Another reason for owning leveraged loans is that they are senior in the capital structure to a company’s bonds and outrank virtually all high-yield debt.
We felt it prudent to build our position in floating-rate securities a year ago. At the time, it made sense because they provided a hedge against the possibility of rising interest rates and paid more yield in 2007 than comparable fixed-rate bonds. However, the decision hurt us when the Fed decided to aggressively slash rates. Floating-rate bonds and leveraged loans adjust their coupons every three months, effectively eliminating interest rate risk in a rising rate environment, but in a falling interest rate environment our holdings in these securities performed poorly. Despite their recent poor performance, we believe they are attractive because of the weakness in the economy, higher inflation, and the distinct possibility of rising rates.
Sector Allocation
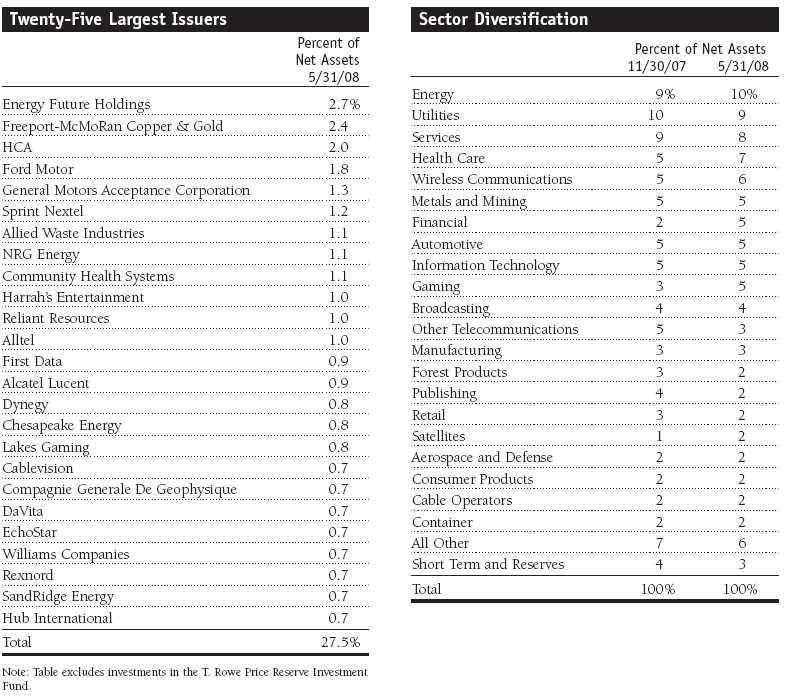
In this challenging environment, several sectors and industries have come under pressure, making the fund’s positioning an important part of our strategy. At the end of May, our largest industry exposure was energy, accounting for about 10% of the portfolio. This was a good decision because our energy holdings generated nearly a 4% gain, while the high-yield market was basically flat for the past six months. Similarly, our holdings in utilities, historically a conservative industry, gained more than 5%. Services and health care were our next-largest industry exposures, at 8% and 7%, respectively. We have attempted to keep high exposures in areas that are fundamentally sound and less economically sensitive.
Conversely, several areas in the high-yield market got shellacked, including almost everything consumer related. Housing, for example, where we have very little exposure, was down 15% for the past 12 months. We have a low exposure to retailing and consumer products, and virtually no holdings in supermarkets, beverages, advertising, and textiles.
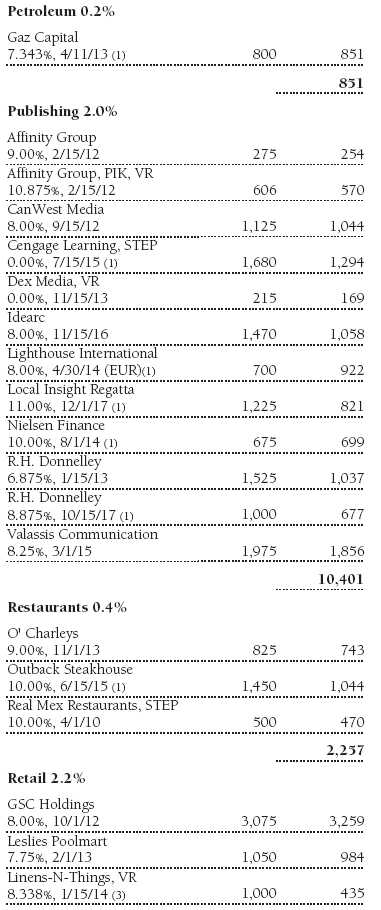
The fund’s worst-performing industry exposure for the past six months was publishing. We were concerned about the consumer-dependent areas of the economy but were somewhat surprised by the decline in advertising spending. Historically, the yellow pages companies we have owned, including Idearc and R.H. Donnelly, have been good defensive companies. However, these firms cater to a lot of small and mid-size businesses, many of which are housing related—electricians, plumbers, craftsmen, title insurers, and mortgage companies—and have been hurt by the cyclical downturn. (Please refer to the portfolio of investments for a complete listing of holdings and the amount each represents in the portfolio.)
We remain confident that neither Idearc nor Donnelly will go bankrupt in the next several years, and we think that they should have no problem making their interest payments. Both continue to generate high levels of cash flow and they have minimal capital spending requirements—they just have a large amount of outstanding debt. However, there is a growing body of opinion that the yellow pages are a dying business because much of the information they provide can be found online. We trimmed our exposure to both as they rallied in the April/May period.
Short-Term Issues Boast Solid Yields
The volatility created some great investing opportunities in short-dated securities, which has helped us to implement our defensive strategy. Earlier this year, we added several securities that we believe can generate double-digit returns and mature in about one year. For example, in April we bought one-year Sallie Mae bonds at 93 cents on the dollar with a 3% coupon. We think we can earn about a 10% return on the holding in a year (3% from the coupon and 7% from appreciation).
We were able to enhance the return potential of the Sallie Mae position with a one-year CDS contract that should generate another 5%. We will only make this sort of a trade when we have strong conviction in a company’s ability to repay its debt. Although we are not extremely bullish on the longer-term prospects for the student loan industry, we are extremely confident that Sallie Mae will not default on its debt in the next 12 months. In the exotic world of derivatives, this would be considered a relatively conservative trade. We rigorously monitor our CDS exposure, which in aggregate represents less than 1% of the portfolio, and we are vigilant in adjusting our positions to properly reflect and capitalize on current market conditions. While the economic environment remains challenging, we see opportunity in the use of CDS as a means to help manage corporate credit risk.
Another large purchase of short-dated securities was in General Motors Acceptance Corporation (GMAC). We bought GMAC 5.625% bonds that mature in May 2009 at about 92 cents on the dollar. We anticipate earning 5.6% of income and 8% in appreciation for almost a 14% total return. Our increasing focus on short-term securities, which currently boast solid yields, has helped relative performance because in times of extreme volatility one- and two-year bonds have been much more stable than long-term bonds.
Fallen Angels and Rising Stars
It has been an interesting year for fallen angels—investment-grade bonds that have been downgraded into the high-yield bond universe. (Rising stars are junk bonds that are upgraded to investment grade.) We recently purchased intermediate- and longer-term Sprint Nextel bonds, which were downgraded to junk bond status. This was as significant an event as Ford’s and General Motors’ downgrades in 2005. Sprint is now the third-largest issuer of high-yield bonds behind the auto giants. We think the troubles at Sprint are reversible and think the company has good long-term potential. Additionally, there are rumors that the company will be acquired.
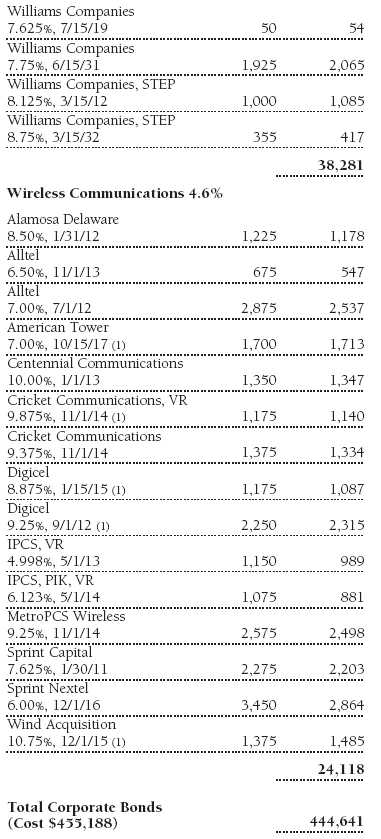
Over the last few quarters, we have been systematically rotating out of traditional wireline telecommunications holdings, which are looking a bit like dinosaurs, and into wireless telecoms. The entire wireless segment has been generating strong gains in revenues and earnings, and it has been a profitable area for the fund for a long time. What we saw happen in publishing led us to the conclusion that wireline telecom was at a similar risk. The fund’s two largest holdings in the wireless sector, Alltel and Sprint, which we view as solid growth-oriented companies, have produced good results.
They’re Up, They’re Down, They’re LBOs
LBOs were a mixed bag for performance, because these lower-rated securities have been extremely volatile. As always, our focus is on long-term performance, and while some of our LBO investments have worked out well, others have underperformed.
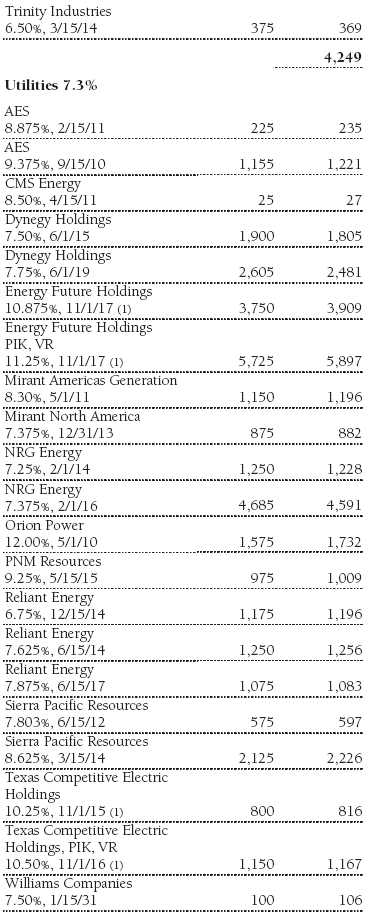
The former TXU, now called Energy Future Holdings, has been one of our most successful investments over the past 6- and 12-month periods. It is the largest regulated utility in Texas and the portfolio’s largest investment. HCA (Hospital Corporation of America) is another issue that generates a steady stream of income and has provided solid appreciation. It is the largest privately owned hospital management company in the U.S. and is a seasoned LBO that has had time to pay down some of its debt and improve its balance sheet. Like Energy Future Holdings, it generates strong cash flow.
Bausch & Lomb was also a good performer. It suffered a couple of years ago when its contact lens solution caused a number of customers to develop serious eye problems. After the stock plummeted, the company was taken private. The company now appears to have righted the ship. Nuveen Investments, a Chicago-based money management firm, went through a rough patch this year but recovered nicely in the April rally. The firm manages many closed-end municipal bond funds that rely on issuing auction-rate securities, and investors panicked when the auction-rate market melted down earlier this year. We used the weakness to buy more Nuveen bonds because we think it will come out of the recent slump in good shape. We like the characteristics of the money management industry, and the company continues to generate good cash flow.
On the negative side of the ledger, we owned Univision Communications, the largest Spanish-language broadcasting company in the U.S., with a preeminent portfolio of television and radio stations in top markets including New York, Miami, and Los Angeles. Although the company is the leader in Spanish broadcasting, the LBO was done at a very high multiple. We invested in its bonds too early, and they have subsequently traded down. Outback Steakhouse, one of our few consumer holdings, was another detractor. It may have the best franchise in the sector but has come under pressure due to fears of a downturn in dining out. Nevertheless, it continues to execute reasonably well in a tough economy. Our position in First Data, the largest credit card processor in the U.S., also hurt results. Fundamentally, we don’t see any problems, but because it was big issue and the bonds are relatively liquid, it has come under selling pressure.
Outlook
Our outlook for the high-yield market remains cautious. We think that after the April rally, the market moved ahead too far, too fast. The high-yield market’s spread (its yield advantage over Treasuries) dropped back to the 6.5% range at the end of the reporting period from nearly 8.4% in March. Another concern that we see for the market is rising default rates. Although we believe we will not experience sharply higher defaults in 2008, we expect a greater percentage of issuers to become insolvent in 2009. S&P, Moody’s, and high-yield strategists are forecasting a 6.5% default rate next year. If that scenario plays out, the market should return to about an 8% spread.
Valuations in the high-yield market appear to be discounting a mild recession for 2009, which may be overly optimistic. We think the market may have gotten a little bit too excited that the Wall Street crisis is over. Sentiment about the high-yield market improved dramatically in response to the bailout of Bear Stearns, and when the Fed opened the discount window to brokers for the first time (in addition to member banks) it ignited a rally in the sector.
We see two major issues for our market today. One is a Wall Street problem and the other is a Main Street problem. To use a baseball analogy, the Wall Street problem is in the middle to later innings. We still see uncertainties in the financial services sector, and there is significant duress in the insurance and mortgage industries. The other serious, and likely more lingering, issue is the Main Street problem, which we think may be in the early innings. The consumer has taken a huge whack from the loss of credit availability and declining home values. Some face the possibility of home foreclosures. Add in higher gasoline, heating oil, and food costs, and the average consumer is facing a serious problem. As a result, the market environment is likely to be very challenging at least through 2008 and maybe into 2009.
Your portfolio management team has been hard at work repositioning the portfolio more defensively, rethinking our assumptions about any marginal holdings, and double-checking our riskier exposures and any securities where we think we may have been a bit too optimistic. The Institutional High Yield Fund now has a reasonably conservative structure that should help it weather a tough environment.
The biggest problem for the fund in the last year was caused by a bad interest rate call, not by credit problems. That situation should resolve itself; we expect rates to be higher in a year, and leveraged loans and floating-rate bonds should perform well in that environment. Nevertheless, after April’s strong rally, the market looks expensive, and we do not expect a sustained rally in our market over the next 12 months.
We appreciate your confidence and thank you for investing with T. Rowe Price.
Respectfully submitted,

Paul A. Karpers
Chairman of the fund’s Investment Advisory Committee
June 13, 2008
The committee chairman has day-to-day responsibility for managing the portfolio and works with committee members in developing and executing the fund’s investment program.
30-day dividend yield: Dividends earned for the last 30 days of the period indicated are annualized and divided by the fund’s net asset value at the end of the period.
30-day SEC yield: A method of calculating a fund’s yield that assumes all portfolio securities are held until maturity. The Securities and Exchange Commission (SEC) requires all bond funds to calculate this yield. Yield will vary and is not guaranteed.
J.P. Morgan Global High Yield Index: Tracks the performance of domestic and overseas noninvestment-grade corporate bonds; all are denominated in U.S. dollars.
Duration: A measure of a bond or bond fund’s sensitivity to changes in interest rates. For example, a fund with a four-year duration would fall about 4% in response to a one-percentage-point rise in interest rates, and vice versa.
Federal funds rate: The interest rate charged on overnight loans of reserves by one financial institution to another in the United States. The Federal Reserve sets a target federal funds rate to affect the direction of interest rates.
Lehman Brothers U.S. Aggregate Index: An unmanaged index that tracks domestic investment-grade bonds, including corporate, government, and mortgage-backed securities.
Lipper averages: Consist of all mutual funds in a particular category as tracked by Lipper Inc.
London Interbank Offered Rate (Libor): The interest rate at which banks loan money to each other in the London wholesale market, which is also known as the interbank market.
Weighted average maturity: The weighted average of the stated maturity dates of the portfolio’s securities. In general, the longer the average maturity, the greater the fund’s sensitivity to interest rate changes. A shorter average maturity usually means less interest rate sensitivity and therefore a less volatile portfolio.
Portfolio Highlights
Performance and Expenses
T. Rowe Price Institutional High Yield Fund
This chart shows the value of a hypothetical $1 million investment in the fund over the past 10 fiscal year periods or since inception (for funds lacking 10-year records). The result is compared with benchmarks, which may include a broad-based market index and a peer group average or index. Market indexes do not include expenses, which are deducted from fund returns as well as mutual fund averages and indexes.
This table shows how the fund would have performed each year if its actual (or cumulative) returns for the periods shown had been earned at a constant rate.
Fund Expense Example
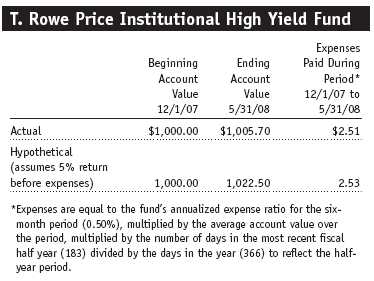
As a mutual fund shareholder, you may incur two types of costs: (1) transaction costs, such as redemption fees or sales loads, and (2) ongoing costs, including management fees, distribution and service (12b-1) fees, and other fund expenses. The following example is intended to help you understand your ongoing costs (in dollars) of investing in the fund and to compare these costs with the ongoing costs of investing in other mutual funds. The example is based on an investment of $1,000 invested at the beginning of the most recent six-month period and held for the entire period.
Actual Expenses
The first line of the following table (“Actual”) provides information about actual account values and actual expenses. You may use the information in this line, together with your account balance, to estimate the expenses that you paid over the period. Simply divide your account value by $1,000 (for example, an $8,600 account value divided by $1,000 = 8.6), then multiply the result by the number in the first line under the heading “Expenses Paid During Period” to estimate the expenses you paid on your account during this period.
Hypothetical Example for Comparison Purposes
The information on the second line of the table (“Hypothetical”) is based on hypothetical account values and expenses derived from the fund’s actual expense ratio and an assumed 5% per year rate of return before expenses (not the fund’s actual return). You may compare the ongoing costs of investing in the fund with other funds by contrasting this 5% hypothetical example and the 5% hypothetical examples that appear in the shareholder reports of the other funds. The hypothetical account values and expenses may not be used to estimate the actual ending account balance or expenses you paid for the period.
You should also be aware that the expenses shown in the table highlight only your ongoing costs and do not reflect any transaction costs, such as redemption fees or sales loads. Therefore, the second line of the table is useful in comparing ongoing costs only and will not help you determine the relative total costs of owning different funds. To the extent a fund charges transaction costs, however, the total cost of owning that fund is higher.
Financial Highlights
T. Rowe Price Institutional High Yield Fund
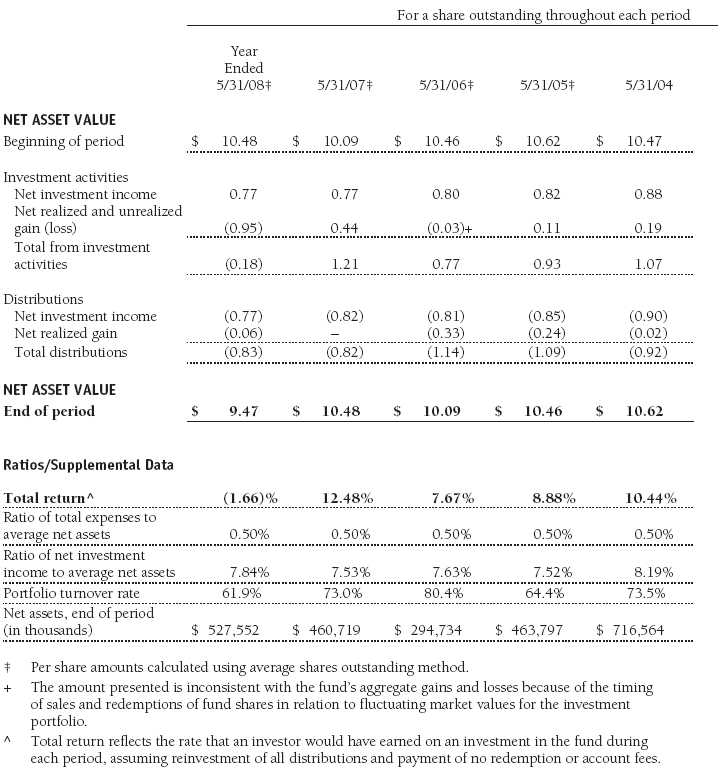
The accompanying notes are an integral part of these financial statements.
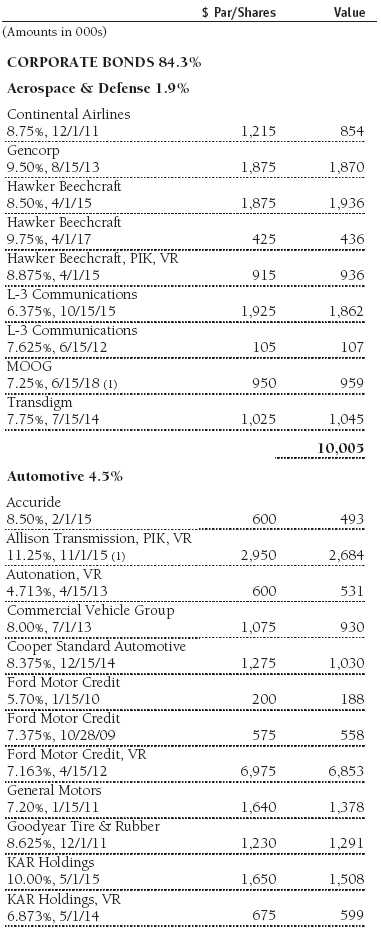
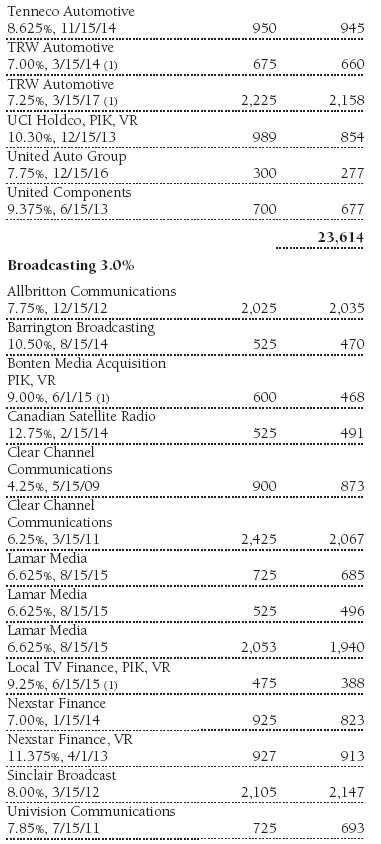
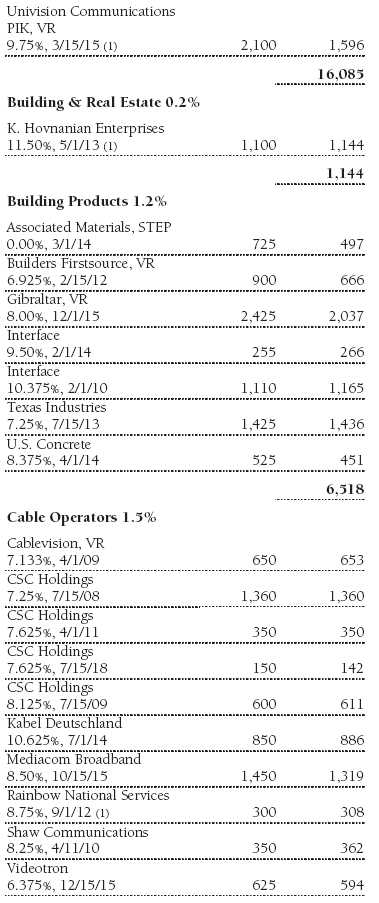
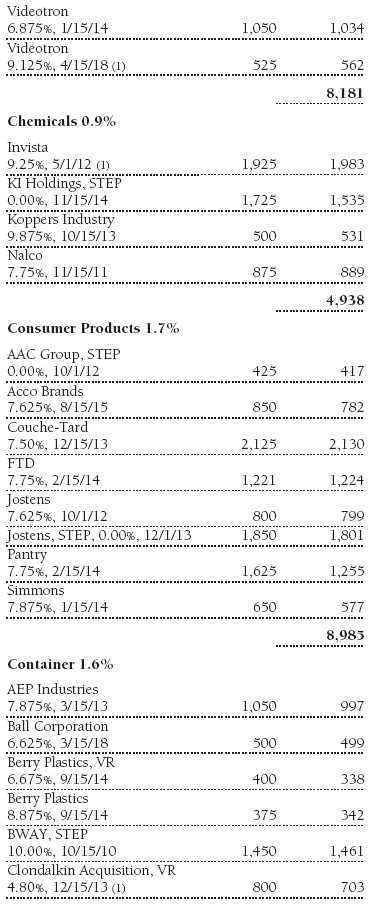
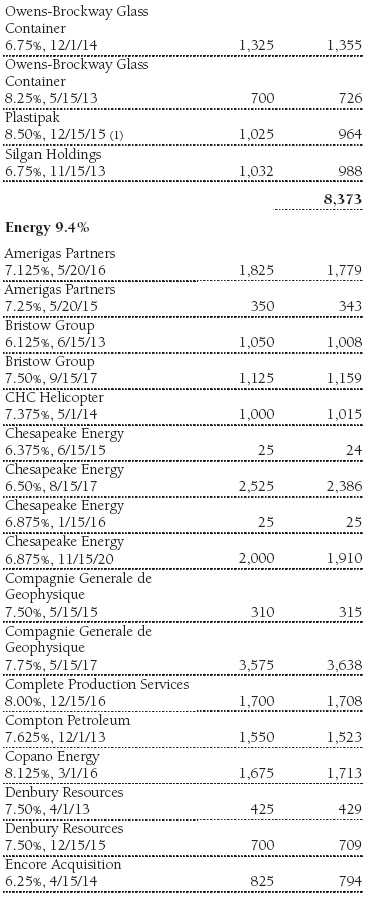
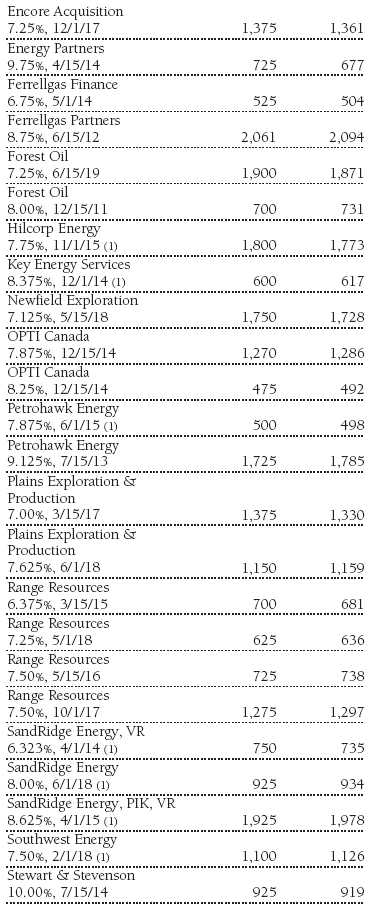
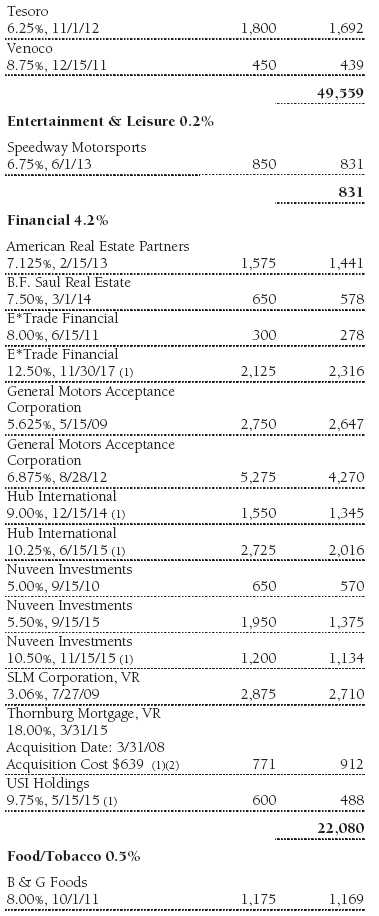
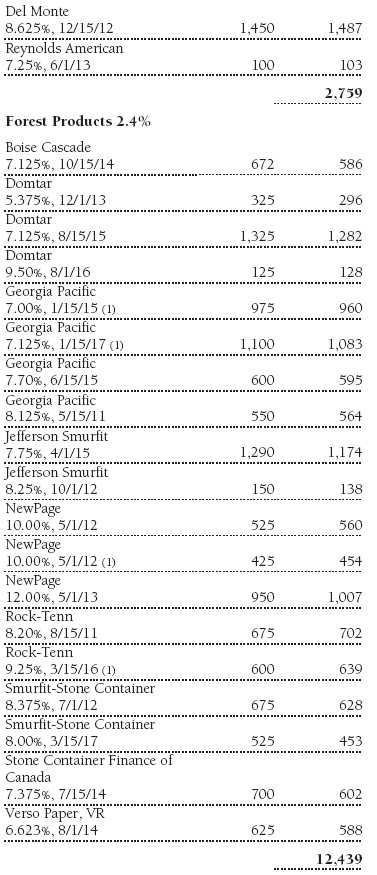
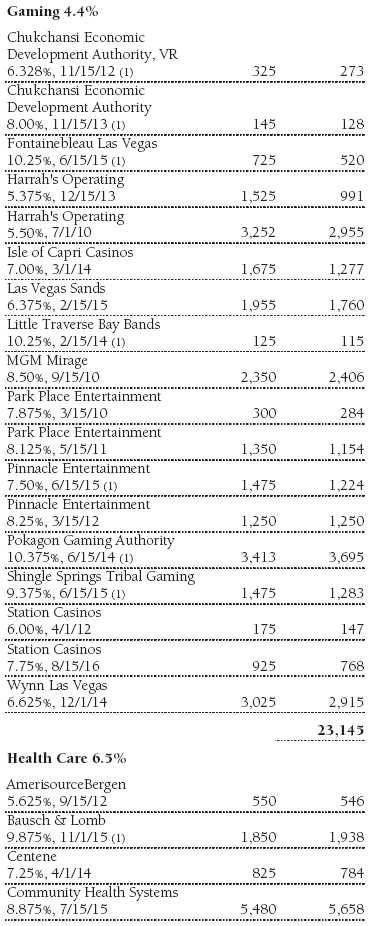
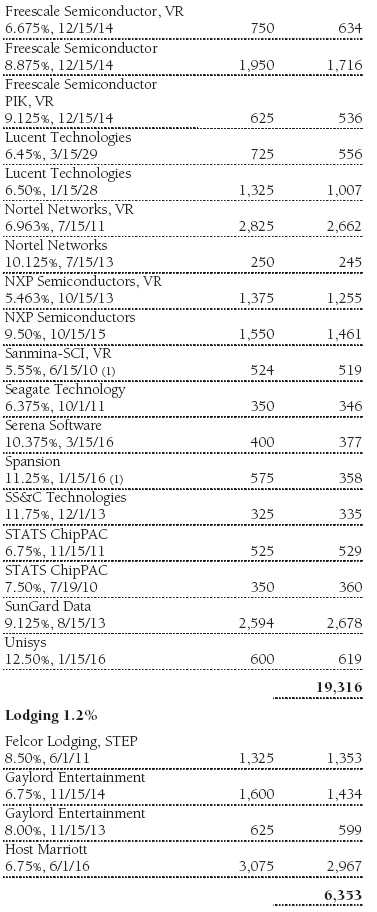
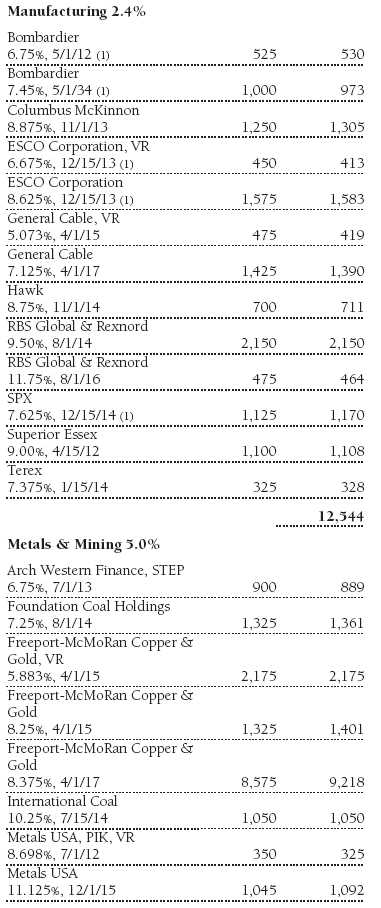
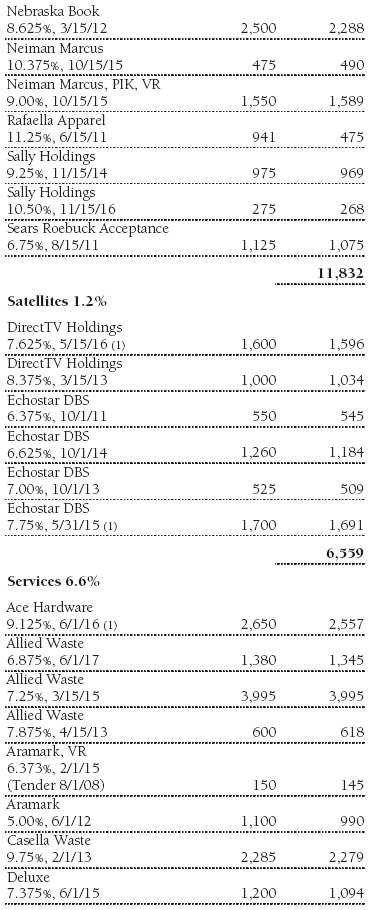
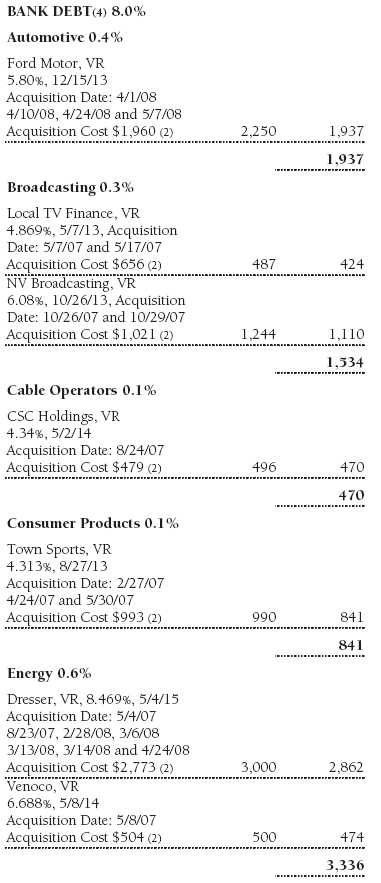
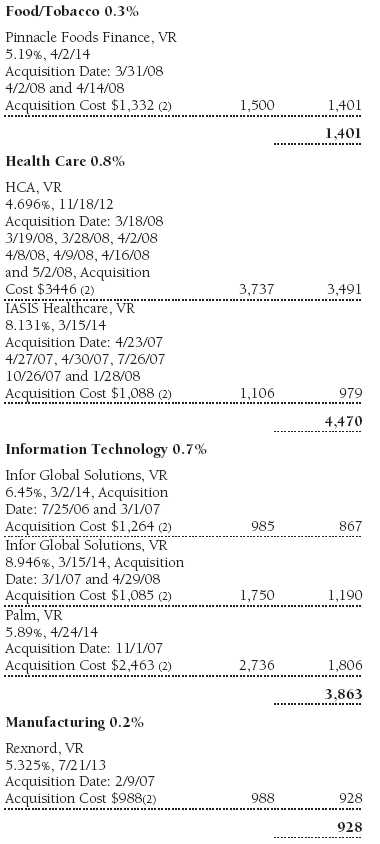
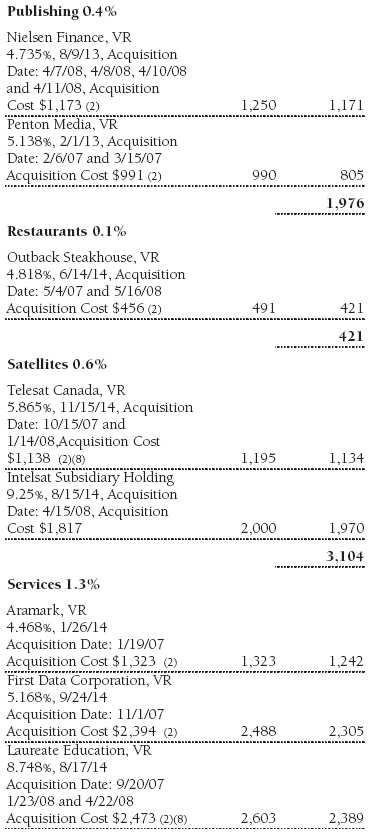
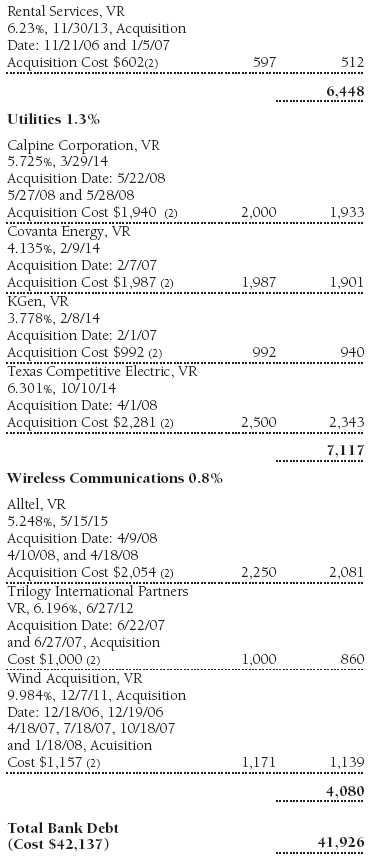
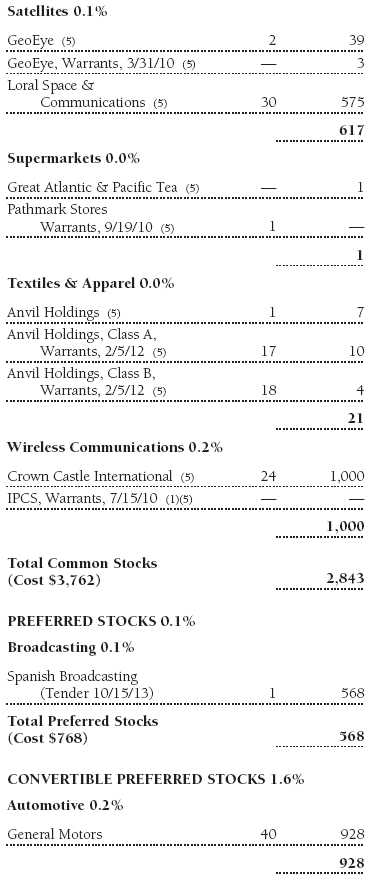
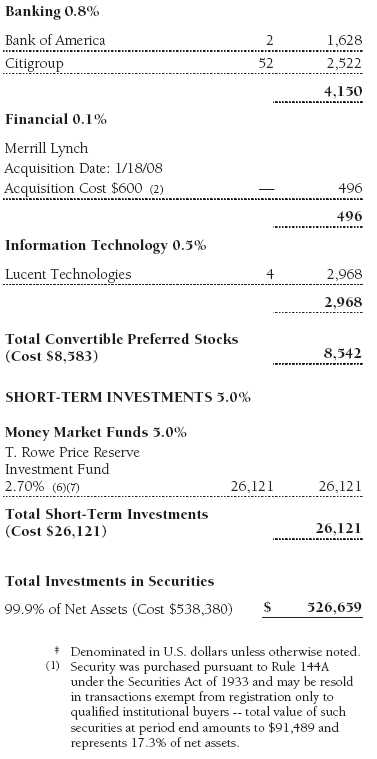
Portfolio of Investments ‡
T. Rowe Price Institutional High Yield Fund
May 31, 2008


The accompanying notes are an integral part of these financial statements.
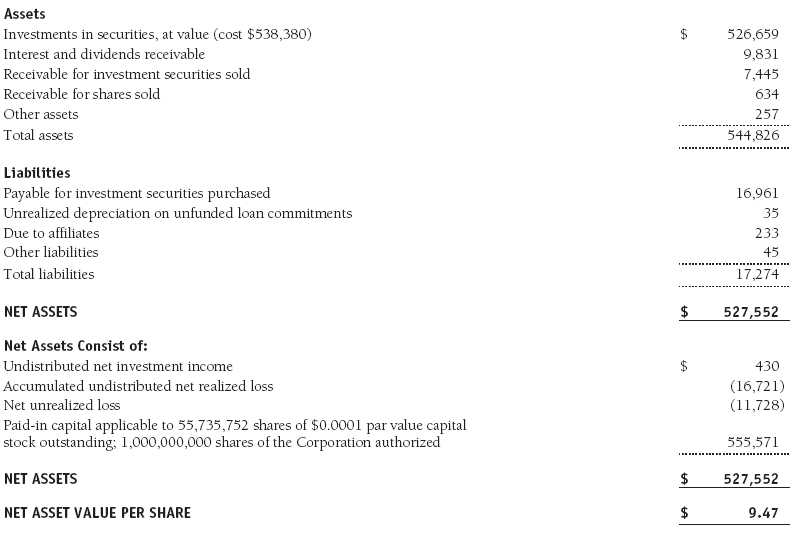
Statement of Assets and Liabilities
T. Rowe Price Institutional High Yield Fund
May 31, 2008
($000s, except shares and per share amounts)
The accompanying notes are an integral part of these financial statements.
Statement of Operations
T. Rowe Price Institutional High Yield Fund
($000s)
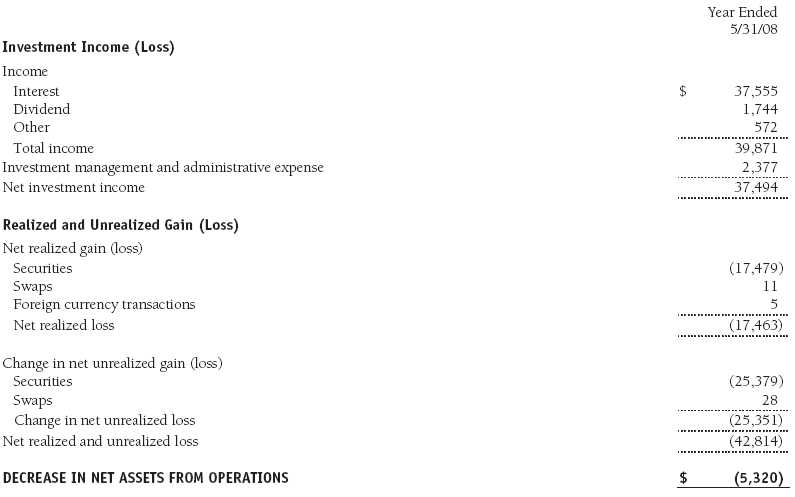
The accompanying notes are an integral part of these financial statements.
Statement of Changes in Net Assets
T. Rowe Price Institutional High Yield Fund
($000s)
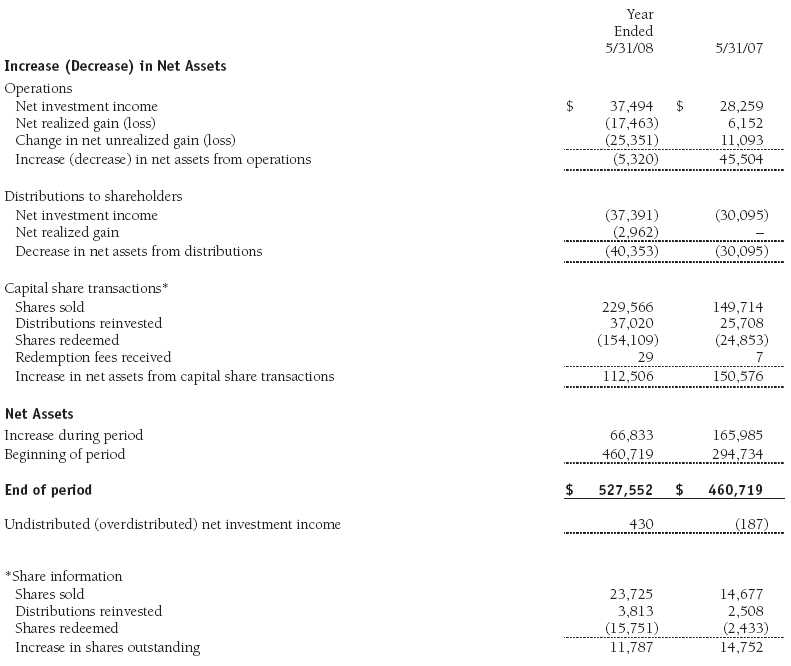
The accompanying notes are an integral part of these financial statements.
Notes to Financial Statements
T. Rowe Price Institutional High Yield Fund
May 31, 2008
T. Rowe Price Institutional Income Funds, Inc. (the corporation), is registered under the Investment Company Act of 1940 (the 1940 Act). The Institutional High Yield Fund (the fund), a diversified, open-end management investment company, is one portfolio established by the corporation. The fund commenced operations on May 31, 2002. The fund seeks high current income and, secondarily, capital appreciation.
NOTE 1 - SIGNIFICANT ACCOUNTING POLICIES
Basis of Preparation The accompanying financial statements were prepared in accordance with accounting principles generally accepted in the United States of America, which require the use of estimates made by fund management. Fund management believes that estimates and security valuations are appropriate; however, actual results may differ from those estimates, and the security valuations reflected in the financial statements may differ from the value the fund ultimately realizes upon sale of the securities.
Investment Transactions, Investment Income, and Distributions Income and expenses are recorded on the accrual basis. Premiums and discounts on debt securities are amortized for financial reporting purposes. Dividends received from mutual fund investments are reflected as dividend income; capital gain distributions are reflected as realized gain/loss. Dividend income and capital gain distributions are recorded on the ex-dividend date. Income tax-related interest and penalties, if incurred, would be recorded as income tax expense. Investment transactions are accounted for on the trade date. Realized gains and losses are reported on the identified cost basis. Net periodic receipts or payments required by swaps are accrued daily and recorded as realized gain or loss in the accompanying financial statements. Fluctuations in the fair value of swaps are reflected in the change in net unrealized gain or loss and are reclassified to realized gain or loss upon termination prior to maturity. Distributions to shareholders are recorded on the ex-dividend date. Income distributions are declared on a daily basis and paid monthly. Capital gain distributions, if any, are declared and paid by the fund, typically on an annual basis.
Currency Translation Assets, including investments, and liabilities denominated in foreign currencies are translated into U.S. dollar values each day at the prevailing exchange rate, using the mean of the bid and asked prices of such currencies against U.S. dollars as quoted by a major bank. Purchases and sales of securities, income, and expenses are translated into U.S. dollars at the prevailing exchange rate on the date of the transaction. The effect of changes in foreign currency exchange rates on realized and unrealized security gains and losses is reflected as a component of security gains and losses.
Redemption Fees A 1% fee is assessed on redemptions of fund shares held for 90 days or less to deter short-term trading and to protect the interests of long-term shareholders. Redemption fees are withheld from proceeds that shareholders receive from the sale or exchange of fund shares. The fees are paid to the fund, and are recorded as an increase to paid-in capital. The fees may cause the redemption price per share to differ from the net asset value per share.
In-Kind Subscriptions Under certain circumstances and when considered in the best interest of the fund, the fund may accept portfolio securities rather than cash as payment for the purchase of fund shares (in-kind subscription). For financial reporting and tax purposes, the cost basis of contributed securities is equal to the market value of the securities on the date of contribution. In-kind subscriptions result in no gain or loss and no tax consequences for the fund. During the year ended May 31, 2008, the fund accepted $11,985,000 of in-kind subscriptions, including $0 from other T. Rowe Price funds.
New Accounting Pronouncements Effective November 30, 2007, the fund adopted Financial Accounting Standards Board (FASB) Interpretation No. 48 (FIN 48), Accounting for Uncertainty in Income Taxes, a clarification of FASB Statement No. 109, Accounting for Income Taxes. FIN 48 establishes financial accounting and disclosure requirements for recognition and measurement of tax positions taken or expected to be taken on an income tax return. The adoption of FIN 48 had no impact on the fund’s net assets or results of operations.
In September 2006, the Financial Accounting Standards Board (FASB) released Statement of Financial Accounting Standards No. 157 (FAS 157), Fair Value Measurements. FAS 157 defines fair value, establishes the framework for measuring fair value, and expands the disclosure of fair value measurements in the financial statements. It is effective for the fund’s fiscal year beginning June 1, 2008. Management expects adoption of FAS 157 will have no material impact on the fund’s net assets or results of operations.
In March 2008, the Financial Accounting Standards Board issued Statement of Financial Accounting Standards No. 161, Disclosures about Derivative Instruments and Hedging Activities (FAS 161), which is effective for fiscal years and interim periods beginning after November 15, 2008. FAS 161 requires enhanced disclosures about derivative and hedging activities, including how such activities are accounted for and their effect on financial position, performance and cash flows. Management is currently evaluating the impact the adoption of FAS 161 will have on the fund’s financial statements and related disclosures.
NOTE 2 - VALUATION
The fund values its investments and computes its net asset value per share at the close of the New York Stock Exchange (NYSE), normally 4 p.m. ET, each day that the NYSE is open for business.
Debt securities are generally traded in the over-the-counter (OTC) market. Securities with remaining maturities of one year or more at the time of acquisition are valued at prices furnished by dealers who make markets in such securities or by an independent pricing service, which considers the yield or price of bonds of comparable quality, coupon, maturity, and type, as well as prices quoted by dealers who make markets in such securities. Securities with remaining maturities of less than one year at the time of acquisition generally use amortized cost in local currency to approximate fair value. However, if amortized cost is deemed not to reflect fair value or the fund holds a significant amount of such securities with remaining maturities of more than 60 days, the securities are valued at prices furnished by dealers who make markets in such securities or by an independent pricing service.
Equity securities listed or regularly traded on a securities exchange or in the OTC market are valued at the last quoted sale price or, for certain markets, the official closing price at the time the valuations are made, except for OTC Bulletin Board securities, which are valued at the mean of the latest bid and asked prices. A security that is listed or traded on more than one exchange is valued at the quotation on the exchange determined to be the primary market for such security. Listed securities not traded on a particular day are valued at the mean of the latest bid and asked prices for domestic securities and the last quoted sale price for international securities.
Investments in mutual funds are valued at the mutual fund’s closing net asset value per share on the day of valuation. Swaps are valued at net present value of the contract as furnished by counterparties or by an independent pricing service.
Other investments, including restricted securities, and those for which the above valuation procedures are inappropriate or are deemed not to reflect fair value are stated at fair value as determined in good faith by the T. Rowe Price Valuation Committee, established by the fund’s Board of Directors.
For valuation purposes, the last quoted prices of non-U.S. equity securities may be adjusted under the circumstances described below. If the fund determines that developments between the close of a foreign market and the close of the NYSE will, in its judgment, materially affect the value of some or all of its portfolio securities, the fund will adjust the previous closing prices to reflect what it believes to be the fair value of the securities as of the close of the NYSE. In deciding whether it is necessary to adjust closing prices to reflect fair value, the fund reviews a variety of factors, including developments in foreign markets, the performance of U.S. securities markets, and the performance of instruments trading in U.S. markets that represent foreign securities and baskets of foreign securities. A fund may also fair value securities in other situations, such as when a particular foreign market is closed but the fund is open. The fund uses outside pricing services to provide it with closing prices and information to evaluate and/or adjust those prices. The fund cannot predict how often it will use closing prices and how often it will determine it necessary to adjust those prices to reflect fair value. As a means of evaluating its security valuation process, the fund routinely compares closing prices, the next day’s opening prices in the same markets, and adjusted prices.
NOTE 3 - INVESTMENT TRANSACTIONS
Consistent with its investment objective, the fund engages in the following practices to manage exposure to certain risks or to enhance performance. The investment objective, policies, program, and risk factors of the fund are described more fully in the fund’s prospectus and Statement of Additional Information.
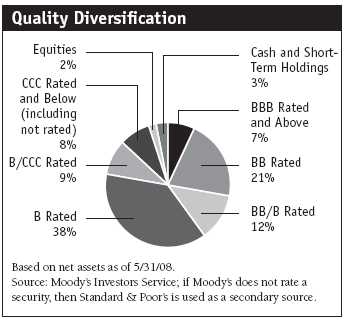
Noninvestment-Grade Debt Securities At May 31, 2008, approximately 87% of the fund’s net assets were invested, directly or through its investment in T. Rowe Price institutional funds, in noninvestment-grade debt securities, commonly referred to as “high-yield” or “junk” bonds. A real or perceived economic downturn or higher interest rates could adversely affect the liquidity or value, or both, of such securities because such events could lessen the ability of issuers to make principal and interest payments.
Restricted Securities The fund may invest in securities that are subject to legal or contractual restrictions on resale. Prompt sale of such securities at an acceptable price may be difficult and may involve substantial delays and additional costs.
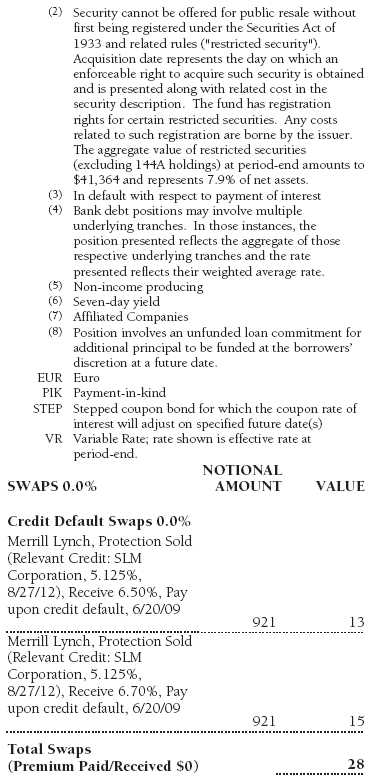
Swaps During the year ended May 31, 2008, the fund was a party to credit default swaps under which it buys or sells credit protection against a defined-issuer credit event. Upon a defined-issuer credit event, the fund is required to either deliver the notional amount of the contract in cash and take delivery of the relevant credit or deliver cash approximately equal to the notional amount of the contract less market value of the relevant credit at the time of the credit event. Risks arise from the possible inability of counterparties to meet the terms of their agreements and from changes in creditworthiness of the relevant underlying issuer. In order to mitigate counterparty risk and subject to specific contractual arrangements, the fund may receive eligible security collateral from such counterparties upon unrealized gain amounts reaching certain thresholds. Eligible security collateral generally includes debt securities issued by the U.S. government or related agencies. At May 31, 2008, no such collateral was received.
Unfunded Loan Commitments The fund may enter into certain credit agreements that require additional principal to be funded at the borrowers’ discretion upon a later date (“unfunded commitments”). The fund reflects such agreements in the Portfolio of Investments upon funding and separately records any unrealized appreciation (depreciation) on that portion that remains unfunded. At May 31, 2008, the total principal amount and market value of all unfunded commitments, including those agreements that are fully unfunded, totaled $440,000 and $405,000, respectively.
Other Purchases and sales of portfolio securities, other than short-term securities, aggregated $386,048,000 and $278,549,000, respectively, for the year ended May 31, 2008.
NOTE 4 - FEDERAL INCOME TAXES
No provision for federal income taxes is required since the fund intends to continue to qualify as a regulated investment company under Subchapter M of the Internal Revenue Code and distribute to shareholders all of its taxable income and gains. Distributions are determined in accordance with Federal income tax regulations, which differ from generally accepted accounting principles, and, therefore, may differ significantly in amount or character from net investment income and realized gains for financial reporting purposes. Financial reporting records are adjusted for permanent book/tax differences to reflect tax character but are not adjusted for temporary differences.
Reclassifications between income and gain relate primarily to differences between book/tax amortization policies. For the year ended May 31, 2008, the following reclassifications, which had no impact on results of operations or net assets, were recorded to reflect tax character:
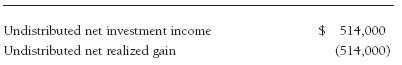
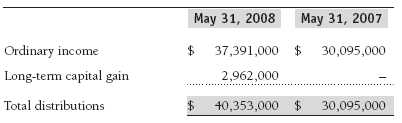
Distributions during the years ended May 31, 2008, and May 31, 2007, were characterized for tax purposes as follows:
At May 31, 2008, the tax-basis cost of investments and components of net assets were as follows:

The fund intends to retain realized gains to the extent of available capital loss carryforwards. As of May 31, 2008, all unused capital loss carryforwards expire in fiscal 2016.
Pursuant to federal income tax regulations applicable to investment companies, recognition of capital losses on certain transactions is deferred until the subsequent tax year. Consequently, realized losses reflected in the accompanying financial statements include net capital losses realized between November 1 and the fund’s fiscal year-end that have not been recognized for tax purposes (Post-October loss deferrals).
NOTE 5 - RELATED PARTY TRANSACTIONS
The fund is managed by T. Rowe Price Associates, Inc. (the manager or Price Associates), a wholly owned subsidiary of T. Rowe Price Group, Inc. The investment management and administrative agreement between the fund and the manager provides for an all-inclusive annual fee equal to 0.50% of the fund’s average daily net assets. The fee is computed daily and paid monthly. The agreement provides that investment management, shareholder servicing, transfer agency, accounting, custody services, and directors’ fees and expenses are provided to the fund, and interest, taxes, brokerage commissions, and extraordinary expenses are paid directly by the fund.
The fund may invest in the T. Rowe Price Reserve Investment Fund and the T. Rowe Price Government Reserve Investment Fund (collectively, the T. Rowe Price Reserve Investment Funds), open-end management investment companies managed by Price Associates and considered affiliates of the fund. The T. Rowe Price Reserve Investment Funds are offered as cash management options to mutual funds, trusts, and other accounts managed by Price Associates and/or its affiliates and are not available for direct purchase by members of the public. The T. Rowe Price Reserve Investment Funds pay no investment management fees.
Mutual funds and other accounts managed by T. Rowe Price and its affiliates (collectively, T. Rowe Price funds) may invest in the fund; however, no T. Rowe Price fund may invest for the purpose of exercising management or control over the fund. At May 31, 2008, approximately 52% of the fund’s outstanding shares were held by T. Rowe Price funds.
Report of Independent Registered Public Accounting Firm
To the Board of Directors of T. Rowe Price Institutional Income Funds, Inc., and Shareholders of T. Rowe Price Institutional High Yield Fund
In our opinion, the accompanying statement of assets and liabilities, including the portfolio of investments, and the related statements of operations and of changes in net assets and the financial highlights present fairly, in all material respects, the financial position of T. Rowe Price Institutional High Yield Fund (one of the portfolios comprising T. Rowe Price Institutional Income Funds, Inc., hereafter referred to as the “Fund”) at May 31, 2008, the results of its operations for the year then ended, the changes in its net assets for each of the two years in the period then ended and the financial highlights for each of the five years in the period then ended, in conformity with accounting principles generally accepted in the United States of America. These financial statements and financial highlights (hereafter referred to as “financial statements”) are the responsibility of the Fund’s management; our responsibility is to express an opinion on these financial statements based on our audits. We conducted our audits of these financial statements in accordance with the auditing standards of the Public Company Accounting Oversight Board (United States). Those standards require that we plan and perform the audit to obtain reasonable assurance about whether the financial statements are free of material misstatement. An audit includes examining, on a test basis, evidence supporting the amounts and disclosures in the financial statements, assessing the accounting principles used and significant estimates made by management, and evaluating the overall financial statement presentation. We believe that our audits, which included confirmation of securities at May 31, 2008, by correspondence with the custodian and brokers, and confirmation of the underlying fund by correspondence with the transfer agent, provide a reasonable basis for our opinion.
PricewaterhouseCoopers LLP
Baltimore, Maryland
July 11, 2008
| Tax Information (Unaudited) for the Tax Year Ended 5/31/08 |
We are providing this information as required by the Internal Revenue Code. The amounts shown may differ from those elsewhere in this report because of differences between tax and financial reporting requirements.
The fund’s distributions to shareholders included $2,971,000 from long-term capital gains, subject to the 15% rate gains category.
For taxable non-corporate shareholders, $238,000 of the fund’s income represents qualified dividend income subject to the 15% rate category.
For corporate shareholders, $238,000 of the fund’s income qualifies for the dividends-received deduction.
| Information on Proxy Voting Policies, Procedures, and Records |
A description of the policies and procedures used by T. Rowe Price funds and portfolios to determine how to vote proxies relating to portfolio securities is available in each fund’s Statement of Additional Information, which you may request by calling 1-800-225-5132 or by accessing the SEC’s Web site, www.sec.gov. The description of our proxy voting policies and procedures is also available on our Web site, www.troweprice.com. To access it, click on the words “Company Info” at the top of our homepage for individual investors. Then, in the window that appears, click on the “Proxy Voting Policy” navigation button in the top left corner.
Each fund’s most recent annual proxy voting record is available on our Web site and through the SEC’s Web site. To access it through our Web site, follow the directions above, then click on the words “Proxy Voting Record” at the bottom of the Proxy Voting Policy page.
| How to Obtain Quarterly Portfolio Holdings |
The fund files a complete schedule of portfolio holdings with the Securities and Exchange Commission for the first and third quarters of each fiscal year on Form N-Q. The fund’s Form N-Q is available electronically on the SEC’s Web site (www.sec.gov); hard copies may be reviewed and copied at the SEC’s Public Reference Room, 450 Fifth St. N.W., Washington, DC 20549. For more information on the Public Reference Room, call 1-800-SEC-0330.
| Approval of Investment Management Agreement |
On March 4, 2008, the fund’s Board of Directors (Board) unanimously approved the investment advisory contract (Contract) between the fund and its investment manager, T. Rowe Price Associates, Inc. (Manager). The Board considered a variety of factors in connection with its review of the Contract, also taking into account information provided by the Manager during the course of the year, as discussed below:
Services Provided by the Manager
The Board considered the nature, quality, and extent of the services provided to the fund by the Manager. These services included, but were not limited to, management of the fund’s portfolio and a variety of related activities, as well as financial and administrative services, reporting, and communications. The Board also reviewed the background and experience of the Manager’s senior management team and investment personnel involved in the management of the fund. The Board concluded that it was satisfied with the nature, quality, and extent of the services provided by the Manager.
Investment Performance of the Fund
The Board reviewed the fund’s average annual total returns over the one-, three-, and five-year and since-inception periods as well as the fund’s year-by-year returns and compared these returns with a wide variety of previously agreed upon comparable performance measures and market data, including those supplied by Lipper and Morningstar, which are independent providers of mutual fund data. On the basis of this evaluation and the Board’s ongoing review of investment results, the Board concluded that the fund’s performance was satisfactory.
Costs, Benefits, Profits, and Economies of Scale
The Board reviewed detailed information regarding the revenues received by the Manager under the Contract and other benefits that the Manager (and its affiliates) may have realized from its relationship with the fund, including research received under “soft dollar” agreements. The Board noted that soft dollars were not used to pay for third-party, non-broker research. The Board also received information on the estimated costs incurred and profits realized by the Manager and its affiliates from advising T. Rowe Price mutual funds, as well as estimates of the gross profits realized from managing the fund in particular. The Board concluded that the Manager’s profits were reasonable in light of the services provided to the fund. The Board also considered whether the fund or other funds benefit under the fee levels set forth in the Contract from any economies of scale realized by the Manager. The Board noted that, under the Contract, the fund pays the Manager a single fee based on the fund’s net assets and the Manager, in turn, pays all expenses of the fund, with certain exceptions. The Board concluded that, based on the profitability data it reviewed and consistent with this single fee structure, the Contract provided for a reasonable sharing of any benefits from economies of scale with the fund.
Fees
The Board reviewed the fund’s single fee structure and compared the rate with fees and expenses of other comparable funds based on information and data supplied by Lipper. The information provided to the Board showed that the fund’s management fee and expense ratio were below the median for comparable funds. (For these purposes, the Board assumed the management fee was equal to the single fee less the fund’s operating expenses.) The Board also reviewed the fee schedules for comparable privately managed accounts of the Manager and its affiliates. Management informed the Board that the Manager’s responsibilities for privately managed accounts are more limited than its responsibilities for the fund and other T. Rowe Price mutual funds that it or its affiliates advise. On the basis of the information provided, the Board concluded that the fees paid by the fund under the Contract were reasonable.
Approval of the Contract
As noted, the Board approved the continuation of the Contract. No single factor was considered in isolation or to be determinative to the decision. Rather, the Board concluded, in light of a weighting and balancing of all factors considered, that it was in the best interests of the fund to approve the continuation of the Contract, including the fees to be charged for services thereunder.
| About the Fund’s Directors and Officers |
Your fund is governed by a Board of Directors (Board) that meets regularly to review a wide variety of matters affecting the fund, including performance, investment programs, compliance matters, advisory fees and expenses, service providers, and other business affairs. The Board elects the fund’s officers, who are listed in the final table. At least 75% of Board members are independent of T. Rowe Price Associates, Inc. (T. Rowe Price), and T. Rowe Price International, Inc. (T. Rowe Price International); “inside” or “interested” directors are employees or officers of T. Rowe Price. The business address of each director and officer is 100 East Pratt Street, Baltimore, Maryland 21202. The Statement of Additional Information includes additional information about the fund directors and is available without charge by calling a T. Rowe Price representative at 1-800-225-5132.
| Independent Directors | |
| |
| Name | |
| (Year of Birth) | |
| Year Elected* | Principal Occupation(s) During Past Five Years and Directorships of Other Public Companies |
| |
| Jeremiah E. Casey | Director, National Life Insurance (2001 to 2005); Director, The Rouse Company, real estate developers (1990 to 2004) |
| (1940) | |
| 2006 | |
| |
| Anthony W. Deering | Chairman, Exeter Capital, LLC, a private investment firm (2004 to present); Director, Vornado Real Estate Investment |
| (1945) | Trust (3/04 to present); Director, Mercantile Bankshares (2002 to 2007); Member, Advisory Board, Deutsche Bank |
| 2002 | North America (2004 to present); Director, Chairman of the Board, and Chief Executive Officer, The Rouse Company, |
| | real estate developers (1997 to 2004) |
| |
| Donald W. Dick, Jr. | Principal, EuroCapital Advisors, LLC, an acquisition and management advisory firm (10/95 to present); Chairman, |
| (1943) | The Haven Group, a custom manufacturer of modular homes (1/04 to present) |
| 2002 | |
| |
| David K. Fagin | Chairman and President, Nye Corporation (6/88 to present); Chairman, Canyon Resources Corp. (8/07 to 3/08); |
| (1938) | Director, Golden Star Resources Ltd. (5/92 to present); Director, Pacific Rim Mining Corp. (2/02 to present); Director, |
| 2002 | B.C. Corporation (3/08 to present) |
| |
| Karen N. Horn | Director, Federal National Mortgage Association (9/06 to present); Director, Norfolk Southern (2/08 to |
| (1943) | present); Director, Eli Lilly and Company (1987 to present); Director, Simon Property Group (2004 to present); |
| 2003 | Managing Director and President, Global Private Client Services, Marsh Inc. (1999 to 2003); Director, Georgia |
| | Pacific (5/04 to 12/05) |
| |
| Theo C. Rodgers | President, A&R Development Corporation (1977 to present) |
| (1941) | |
| 2005 | |
| |
| John G. Schreiber | Owner/President, Centaur Capital Partners, Inc., a real estate investment company (1991 to present); Partner, |
| (1946) | Blackstone Real Estate Advisors, L.P. (10/92 to present) |
| 2002 | |
| |
| *Each independent director oversees 123 T. Rowe Price portfolios and serves until retirement, resignation, or election of a successor. |
| Inside Directors | |
| |
| Name (Year of Birth) | |
| Year Elected* [Number of | |
| T. Rowe Price Portfolios | |
| Overseen] | Principal Occupation(s) During Past Five Years and Directorships of Other Public Companies |
| |
| Edward C. Bernard | Director and Vice President, T. Rowe Price; Vice Chairman of the Board, Director, and Vice President, T. Rowe Price |
| (1956) | Group, Inc.; Chairman of the Board, Director, and President, T. Rowe Price Investment Services, Inc.; Chairman of |
| 2006 | the Board and Director, T. Rowe Price Global Asset Management Limited, T. Rowe Price Global Investment Services |
| [123] | Limited, T. Rowe Price Retirement Plan Services, Inc., T. Rowe Price Savings Bank, and T. Rowe Price Services, Inc.; |
| | Director, T. Rowe Price International, Inc.; Chief Executive Officer, Chairman of the Board, Director, and President, |
| | T. Rowe Price Trust Company; Chairman of the Board, all funds |
| |
| Mary J. Miller, CFA | Director, T. Rowe Price Trust Company; Director and Vice President, T. Rowe Price; Vice President, T. Rowe Price |
| (1955) | Group, Inc.; President, Institutional Income Funds |
| 2004 | |
| [38] | |
| |
| *Each inside director serves until retirement, resignation, or election of a successor. |
| Officers | |
| |
| Name (Year of Birth) | |
| Title and Fund(s) Served | Principal Occupation(s) |
| |
| David C. Beers, CFA (1970) | Vice President, T. Rowe Price; formerly High Yield Analyst, Chartwell |
| Assistant Vice President, Institutional Income Funds | Investment Partners and Business Analyst/Software Developer, Morgan |
| | Stanley Investment Management (to 2004) |
| |
| Brian J. Brennan, CFA (1964) | Vice President, T. Rowe Price, T. Rowe Price Group, Inc., and T. Rowe Price |
| Executive Vice President, Institutional Income Funds | Trust Company |
| |
| Andrew M. Brooks (1956) | Vice President, T. Rowe Price and T. Rowe Price Group, Inc. |
| Vice President, Institutional Income Funds | |
| |
| Michael J. Conelius, CFA (1964) | Vice President, T. Rowe Price, T. Rowe Price Group, Inc., and T. Rowe Price |
| Vice President, Institutional Income Funds | International, Inc. |
| |
| Roger L. Fiery III, CPA (1959) | Vice President, T. Rowe Price, T. Rowe Price Group, Inc., T. Rowe Price |
| Vice President, Institutional Income Funds | International, Inc., and T. Rowe Price Trust Company |
| |
| Justin T. Gerbereux, CFA (1975) | Vice President, T. Rowe Price and T. Rowe Price Group, Inc.; formerly |
| Assistant Vice President, Institutional Income Funds | student, Mary Washington College and Darden School of Business |
| | Administration, University of Virginia (to 2003) |
| |
| John R. Gilner (1961) | Chief Compliance Officer and Vice President, T. Rowe Price; Vice President, |
| Chief Compliance Officer, Institutional Income Funds | T. Rowe Price Group, Inc., and T. Rowe Price Investment Services, Inc. |
| |
| Gregory S. Golczewski (1966) | Vice President, T. Rowe Price and T. Rowe Price Trust Company |
| Vice President, Institutional Income Funds | |
| |
| Gregory K. Hinkle, CPA (1958) | Vice President, T. Rowe Price and T. Rowe Price Group, Inc.; formerly |
| Treasurer, Institutional Income Funds | Partner, PricewaterhouseCoopers, LLP (to 2007) |
| Steven C. Huber, CFA (1958) | Vice President, T. Rowe Price Group, Inc. |
| Vice President, Institutional Income Funds | |
| |
| Paul A. Karpers, CFA (1967) | Vice President, T. Rowe Price and T. Rowe Price Group, Inc. |
| Executive Vice President, Institutional Income Funds | |
| |
| Ian D. Kelson (1956) | Vice President, T. Rowe Price, T. Rowe Price Group, Inc., and T. Rowe Price |
| Vice President, Institutional Income Funds | International, Inc. |
| |
| Patricia B. Lippert (1953) | Assistant Vice President, T. Rowe Price and T. Rowe Price Investment |
| Secretary, Institutional Income Funds | Services, Inc. |
| |
| Paul M. Massaro, CFA (1975) | Vice President, T. Rowe Price and T. Rowe Price Group, Inc.; formerly stu- |
| Assistant Vice President, Institutional Income Funds | dent, The Wharton Business School, University of Pennsylvania (to 2003) |
| |
| Andrew McCormick (1960) | Vice President, T. Rowe Price and T. Rowe Price Group, Inc.; formerly Chief |
| Vice President, Institutional Income Funds | Investment Officer, IMPAC Mortgage Holdings (to 2006); Senior Portfolio |
| | Manager, Avenue Capital Group, and Senior Vice President, Portfolio |
| | Transactions, Federal National Mortgage Association (to 2005) |
| |
| Michael J. McGonigle (1966) | Vice President, T. Rowe Price and T. Rowe Price Group, Inc. |
| Vice President, Institutional Income Funds | |
| |
| David Oestreicher (1967) | Director and Vice President, T. Rowe Price Investment Services, Inc., and |
| Vice President, Institutional Income Funds | T. Rowe Price Trust Company; Vice President, T. Rowe Price, T. Rowe Price |
| | Global Asset Management Limited, T. Rowe Price Global Investment |
| | Services Limited, T. Rowe Price Group, Inc., and T. Rowe Price |
| | International, Inc. |
| |
| Brian A. Rubin, CPA (1974) | Vice President, T. Rowe Price and T. Rowe Price Trust Company |
| Assistant Vice President, Institutional Income Funds | |
| |
| Daniel O. Shackelford, CFA (1958) | Vice President, T. Rowe Price, T. Rowe Price Group, Inc., and T. Rowe Price |
| Vice President, Institutional Income Funds | Trust Company |
| |
| Walter P. Stuart III, CFA (1960) | Vice President, T. Rowe Price and T. Rowe Price Group, Inc. |
| Vice President, Institutional Income Funds | |
| |
| Thomas E. Tewksbury (1961) | Vice President, T. Rowe Price, T. Rowe Price Group, Inc., and T. Rowe Price |
| Vice President, Institutional Income Funds | Trust Company |
| |
| David A. Tiberii, CFA (1965) | Vice President, T. Rowe Price and T. Rowe Price Group, Inc. |
| Vice President, Institutional Income Funds | |
| |
| Mark J. Vaselkiv (1958) | Vice President, T. Rowe Price and T. Rowe Price Group, Inc. |
| Vice President, Institutional Income Funds | |
| |
| Julie L. Waples (1970) | Vice President, T. Rowe Price |
| Vice President, Institutional Income Funds | |
| |
| Thea N. Williams (1961) | Vice President, T. Rowe Price, T. Rowe Price Group, Inc., and T. Rowe Price |
| Vice President, Institutional Income Funds | Trust Company |
| |
| Unless otherwise noted, officers have been employees of T. Rowe Price or T. Rowe Price International for at least five years. |
Item 2. Code of Ethics.
The registrant has adopted a code of ethics, as defined in Item 2 of Form N-CSR, applicable to its principal executive officer, principal financial officer, principal accounting officer or controller, or persons performing similar functions. A copy of this code of ethics is filed as an exhibit to this Form N-CSR. No substantive amendments were approved or waivers were granted to this code of ethics during the period covered by this report.
Item 3. Audit Committee Financial Expert.
The registrant’s Board of Directors/Trustees has determined that Ms. Karen N. Horn qualifies as an audit committee financial expert, as defined in Item 3 of Form N-CSR. Ms. Horn is considered independent for purposes of Item 3 of Form N-CSR.
Item 4. Principal Accountant Fees and Services.
(a) – (d) Aggregate fees billed to the registrant for the last two fiscal years for professional services rendered by the registrant’s principal accountant were as follows:
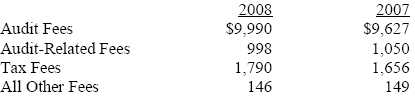
Audit fees include amounts related to the audit of the registrant’s annual financial statements and services normally provided by the accountant in connection with statutory and regulatory filings. Audit-related fees include amounts reasonably related to the performance of the audit of the registrant’s financial statements and specifically include the issuance of a report on internal controls and, if applicable, agreed-upon procedures related to fund acquisitions. Tax fees include amounts related to services for tax compliance, tax planning, and tax advice. The nature of these services specifically includes the review of distribution calculations and the preparation of Federal, state, and excise tax returns. All other fees include the registrant’s pro-rata share of amounts for agreed-upon procedures in conjunction with service contract approvals by the registrant’s Board of Directors/Trustees.
(e)(1) The registrant’s audit committee has adopted a policy whereby audit and non-audit services performed by the registrant’s principal accountant for the registrant, its investment adviser, and any entity controlling, controlled by, or under common control with the investment adviser that provides ongoing services to the registrant require pre-approval in advance at regularly scheduled audit committee meetings. If such a service is required between regularly scheduled audit committee meetings, pre-approval may be authorized by one audit committee member with ratification at the next scheduled audit committee meeting. Waiver of pre-approval for audit or non-audit services requiring fees of a de minimis amount is not permitted.
(2) No services included in (b) – (d) above were approved pursuant to paragraph (c)(7)(i)(C) of Rule 2-01 of Regulation S-X.
(f) Less than 50 percent of the hours expended on the principal accountant’s engagement to audit the registrant’s financial statements for the most recent fiscal year were attributed to work performed by persons other than the principal accountant’s full-time, permanent employees.
(g) The aggregate fees billed for the most recent fiscal year and the preceding fiscal year by the registrant’s principal accountant for non-audit services rendered to the registrant, its investment adviser, and any entity controlling, controlled by, or under common control with the investment adviser that provides ongoing services to the registrant were $1,529,000 and $1,201,000, respectively, and were less than the aggregate fees billed for those same periods by the registrant’s principal accountant for audit services rendered to the T. Rowe Price Funds.
(h) All non-audit services rendered in (g) above were pre-approved by the registrant’s audit committee. Accordingly, these services were considered by the registrant’s audit committee in maintaining the principal accountant’s independence.
Item 5. Audit Committee of Listed Registrants.
Not applicable.
Item 6. Investments.
(a) Not applicable. The complete schedule of investments is included in Item 1 of this Form N-CSR.
(b) Not applicable.
Item 7. Disclosure of Proxy Voting Policies and Procedures for Closed-End Management Investment Companies.
Not applicable.
Item 8. Portfolio Managers of Closed-End Management Investment Companies.
Not applicable.
Item 9. Purchases of Equity Securities by Closed-End Management Investment Company and Affiliated Purchasers.
Not applicable.
Item 10. Submission of Matters to a Vote of Security Holders.
Not applicable.
Item 11. Controls and Procedures.
(a) The registrant’s principal executive officer and principal financial officer have evaluated the registrant’s disclosure controls and procedures within 90 days of this filing and have concluded that the registrant’s disclosure controls and procedures were effective, as of that date, in ensuring that information required to be disclosed by the registrant in this Form N-CSR was recorded, processed, summarized, and reported timely.
(b) The registrant’s principal executive officer and principal financial officer are aware of no change in the registrant’s internal control over financial reporting that occurred during the registrant’s second fiscal quarter covered by this report that has materially affected, or is reasonably likely to materially affect, the registrant’s internal control over financial reporting.
Item 12. Exhibits.
(a)(1) The registrant’s code of ethics pursuant to Item 2 of Form N-CSR is attached.
(2) Separate certifications by the registrant's principal executive officer and principal financial officer, pursuant to Section 302 of the Sarbanes-Oxley Act of 2002 and required by Rule 30a-2(a) under the Investment Company Act of 1940, are attached.
(3) Written solicitation to repurchase securities issued by closed-end companies: not applicable.
(b) A certification by the registrant's principal executive officer and principal financial officer, pursuant to Section 906 of the Sarbanes-Oxley Act of 2002 and required by Rule 30a-2(b) under the Investment Company Act of 1940, is attached.
| | |
SIGNATURES |
| |
| | Pursuant to the requirements of the Securities Exchange Act of 1934 and the Investment |
| Company Act of 1940, the registrant has duly caused this report to be signed on its behalf by the |
| undersigned, thereunto duly authorized. |
| |
| T. Rowe Price Institutional Income Funds, Inc. |
| |
| |
| By | /s/ Edward C. Bernard |
| | Edward C. Bernard |
| | Principal Executive Officer |
| |
| Date | July 22, 2008 |
| |
| |
| |
| | Pursuant to the requirements of the Securities Exchange Act of 1934 and the Investment |
| Company Act of 1940, this report has been signed below by the following persons on behalf of |
| the registrant and in the capacities and on the dates indicated. |
| |
| |
| By | /s/ Edward C. Bernard |
| | Edward C. Bernard |
| | Principal Executive Officer |
| |
| Date | July 22, 2008 |
| |
| |
| |
| By | /s/ Gregory K. Hinkle |
| | Gregory K. Hinkle |
| | Principal Financial Officer |
| |
| Date | July 22, 2008 |