| UNITED STATES |
| SECURITIES AND EXCHANGE COMMISSION |
| Washington, D.C. 20549 |
| |
FORM N-CSR |
| |
CERTIFIED SHAREHOLDER REPORT OF REGISTERED |
MANAGEMENT INVESTMENT COMPANIES |
| |
| |
| |
| Investment Company Act File Number: 811-21055 |
|
| |
| T. Rowe Price Institutional Income Funds, Inc. |
|
| (Exact name of registrant as specified in charter) |
| |
| 100 East Pratt Street, Baltimore, MD 21202 |
|
| (Address of principal executive offices) |
| |
| David Oestreicher |
| 100 East Pratt Street, Baltimore, MD 21202 |
|
| (Name and address of agent for service) |
| |
| |
| Registrant’s telephone number, including area code: (410) 345-2000 |
| |
| |
| Date of fiscal year end: May 31 |
| |
| |
| Date of reporting period: May 31, 2008 |
Item 1: Report to Shareholders| Institutional Core Plus Fund | May 31, 2008 |
The views and opinions in this report were current as of May 31, 2008. They are not guarantees of performance or investment results and should not be taken as investment advice. Investment decisions reflect a variety of factors, and the managers reserve the right to change their views about individual stocks, sectors, and the markets at any time. As a result, the views expressed should not be relied upon as a forecast of the fund’s future investment intent. The report is certified under the Sarbanes-Oxley Act, which requires mutual funds and other public companies to affirm that, to the best of their knowledge, the information in their financial reports is fairly and accurately stated in all material respects.
Manager’s Letter
T. Rowe Price Institutional Core Plus Fund
Dear Investor
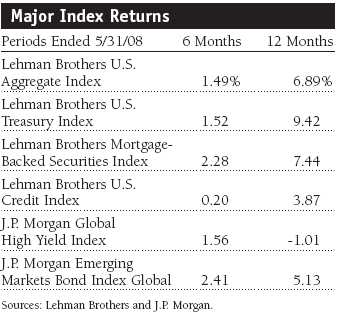
The modest return of the broad Lehman Brothers U.S. Aggregate Index over the past six months masked a period of remarkable volatility in the fixed-income markets. Early in the period, Treasuries produced strong returns as nervous investors sought a safe haven, while bonds carrying any degree of credit risk endured sharp declines as investors liquidated their holdings at steep losses. In April and May, this pattern reversed, and Treasuries felt the impact of rising interest rates while higher-risk issues fared better as liquidity improved and investors became more confident. The broadly diversified Institutional Core Plus Fund felt the impact of all these fluctuations, but our shift away from the overvalued Treasury market in the spring proved fruitful and allowed us to outperform our Lipper peer group by a wide margin.
• Despite substantial turmoil in the credit markets, bonds were able to record modest overall returns in the past six months; 12-month returns were substantially better.
• The Institutional Core Plus Fund had a small gain over the past six months and substantially outperformed its Lipper peer group over both the 6- and 12-month periods.
• The fund’s relative results benefited from an opportunistic shift in the spring away from Treasuries and toward corporate, mortgage-backed, and foreign government securities.
• Inflation appears to have replaced the credit crunch as the primary concern facing the bond market, but the Fed may be reluctant to raise interest rates until the housing sector improves.
Market Environment
The U.S. economy slowed substantially in late 2007 and early 2008. The job situation worsened considerably, as payrolls declined in the first five months of 2008. The unemployment rate increased to 5.5% by the end of the period. What some viewed as the worst housing crisis since the Great Depression showed few signs of ending, with new home construction continuing to decline and housing prices falling at the fastest levels on record. Turmoil in housing spilled over into the credit markets, resulting in steep losses for Wall Street firms as they discovered that many mortgage-backed securities in their portfolios were worth considerably less than originally estimated. Consumer sentiment gauges fell to their lowest levels in years, and consumer spending appeared to be falling victim to cautious attitudes and tightened family budgets.
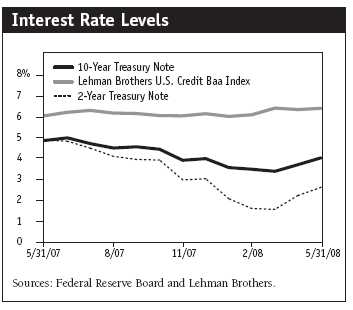
In late winter and early spring, economic troubles gave way to a growing liquidity crisis on Wall Street. The difference in yields between riskier assets and Treasuries—known as credit or yield spreads—widened considerably during the period. The markets for some types of credit instruments stopped functioning, as traders became unwilling to take assets onto their books. In other cases, large institutional investors sold securities at significant discounts in order to meet lending obligations.
The Federal Reserve took a number of steps to address the “credit crunch” and the significant economic slowdown. Most prominently, the Fed reduced short-term interest rates five times, bringing the federal funds rate to 2.00% from 4.50% at the beginning of December. When adjusted for core inflation, the Fed’s “real” target interest rate is now at or below 0%. Aside from lowering short-term borrowing costs, the Fed rate cuts have helped ease concerns over the millions of adjustable-rate mortgages that might otherwise reset to much higher rates, adding another burden to the frail housing market.
In addition to lowering interest rates, the Fed took several extraordinary steps to restore confidence and stabilize the credit markets. The Fed coordinated action with other central banks to address liquidity concerns in the money markets. The central bank also introduced new forms of lending to financial institutions or changed the terms of existing programs to increase liquidity in the marketplace. Beginning last December, the Fed introduced significant new programs designed to provide additional liquidity to depository institutions and primary dealers, such as the Primary Dealer Credit Facility.
By late March, the Fed’s intervention appeared to have brought some stability to Wall Street. Deepening inflation concerns began to weigh on bond prices, however. In particular, investors worried about the continued march of oil prices to record highs and signs that high food and energy prices were causing consumers to expect higher inflation in the coming months. On several occasions over the preceding months, Fed officials had cited “well-anchored” inflation expectations as providing the central bank leeway in cutting interest rates—even as short-term inflation risks remained elevated due to the weakening dollar and related rises in energy and commodity prices. Investors began to shed bonds on the theory that a slipping anchor would cause the Fed to increase rates later this year, even if the economy remains troubled.
Performance and Investment Review
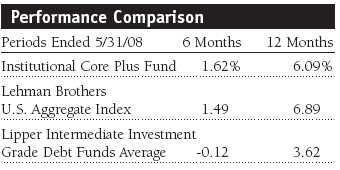
The Institutional Core Plus Fund generated a 1.62% return for the six-month period ended May 31, 2008. Our results handily outperformed the Lipper Intermediate Investment Grade Debt Funds Average and were in line with the Lehman Brothers U.S. Aggregate Index. Over the full fiscal year, the fund substantially outperformed the Lipper peer group while slightly trailing the Lehman index.
The Institutional Core Plus Fund continued to compare quite favorably relative to its peer group. Lipper ranked the fund in the top quartile of its universe for the past one- and three-year periods ended May 31, 2008. (Based on cumulative total return, Lipper ranked the Institutional Core Plus Fund 138 out of 551 and 34 out of 463 funds in the intermediate investment-grade debt funds universe for the one- and three-year periods ended May 31, 2008, respectively. Results will vary for other time periods. Past performance cannot guarantee future results.)
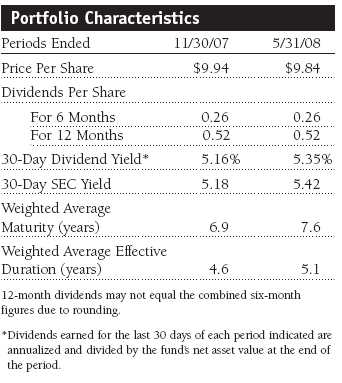
The fund’s structure changed modestly over the past six months. Net asset value (NAV) declined by $0.10 as interest rates rose in April and May. The decline in NAV helped yield increase, even as dividends remained constant. The portfolio’s weighted average maturity increased from 6.9 years to 7.6 years, and duration increased from 4.6 to 5.1 years, meaning that the fund became somewhat more sensitive to changes in interest rates. Both maturity and duration remained broadly in line with the benchmark.
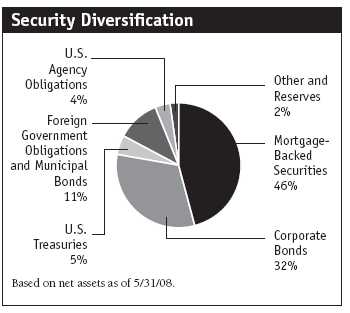
As described above, the widespread risk aversion that gripped investors over the past six months resulted in a flight—if not a stampede—to Treasury securities, which typically become a safe haven in times of market stress. This resulted in very high valuations for the sector. In the spring, we began to decrease our holdings in Treasuries and became significantly underweight relative to the benchmark. At the end of last November, Treasuries accounted for 21% of the portfolio; as shown in the Security Diversification chart below, that portion declined to only 5% by the end of May.
Conversely, as risk became more attractively rewarded, in our opinion, we began to take larger positions in spread sectors. We initiated a position in bank loans through the T. Rowe Price Institutional Floating Rate Fund. We also added to our exposure to high-quality mortgage-backed securities, leaving us overweight relative to the benchmark. We augmented our corporate exposure during the period by adding holdings in well-positioned finance companies that we feel can weather additional market turmoil. Finally, we added slightly to our modest position in high-yield issues.
Our decision to invest in battered sectors—along with the flexibility provided by the “plus” portion of the portfolio—was rewarded after a significant shift in investor sentiment in April. Inflation concerns and expectations that the Federal Reserve’s easing cycle had reached its end led investors away from U.S. Treasuries and into higher-risk, higher-yielding asset classes. As a result, all major spread sectors outperformed Treasury securities in April following several months of underperformance.
Our holdings in foreign bonds also helped returns. Bonds denominated in foreign currencies did well as the U.S. dollar declined. Particularly helpful was our allocation to bonds denominated in Asian currencies (Taiwan, Malaysia, and Singapore), and dollar-denominated emerging market debt also contributed. Our unhedged exposure to bonds from Mexico and Poland was also favorable.
Outlook
The last few months have been marked by aggressive actions from the Federal Reserve and broad-based and successful recapitalization among U.S. banks and brokerage firms, which leads us to believe that the worst of the financial crisis has passed. Bond investors have hardly had time to celebrate, however, as inflation issues—mainly driven by recent spikes in commodity prices—have moved to the forefront in global markets.
Despite reasonable worries over inflation expectations, the Fed may be reluctant to raise interest rates before the housing market has stabilized and employment growth has resumed. Futures contracts currently indicate that investors expect the Fed to begin raising interest rates before the end of the year, but this may be premature.
In the meantime, increased volatility and better liquidity should provide opportunities to place meaningful tactical and strategic bets over the next six months. Having missed the worst of the credit crisis and subprime melt-down, we generally want to remain in a position to add risk to the portfolio as opportunities become available. Such opportunities may include domestic credit as well as foreign bond allocations.
As always, we appreciate your confidence and thank you for investing with T. Rowe Price.
Respectfully submitted,

Brian J. Brennan
Chairman of the fund’s Investment Advisory Committee
June 20, 2008
The committee chairman has day-to-day responsibility for managing the portfolio and works with committee members in developing and executing the fund’s investment program.
Bonds are subject to interest rate risk, the decline in bond prices that usually accompanies a rise in interest rates, and credit risk, the chance that any fund holding could have its credit rating downgraded or that a bond issuer will default (fail to make timely payments of interest or principal), potentially reducing the fund’s income level and share price. Mortgage-backed securities are subject to prepayment risk, particularly if falling rates lead to heavy refinancing activity, and extension risk, which is an increase in interest rates that causes a fund’s average maturity to lengthen unexpectedly due to a drop in mortgage prepayments. This could increase the fund’s sensitivity to rising interest rates and its potential for price declines.
30-day SEC yield: A method of calculating a fund’s yield that assumes all portfolio securities are held until maturity. The Securities and Exchange Commission (SEC) requires all bond funds to calculate this yield. Yield will vary and is not guaranteed.
Average maturity: The average of the stated maturity dates of a bond or money market portfolio’s securities. The average maturity for a money market fund is measured in days, whereas a bond fund’s average maturity is measured in years. In general, the longer the average maturity, the greater the fund’s sensitivity to interest rate changes, which means greater price fluctuation.
Basis point: One one-hundredth of a percentage point, or 0.01%.
Duration: A measure of a bond or bond fund’s sensitivity to changes in interest rates. For example, a fund with a four-year duration would fall about 4% in response to a one-percentage-point rise in interest rates, and vice versa.
Federal funds rate: The interest rate charged on overnight loans of reserves by one financial institution to another in the United States. The Federal Reserve sets a target federal funds rate to affect the direction of interest rates.
J.P. Morgan Emerging Markets Bond Index Global: Tracks U.S. dollar government bonds of 31 foreign countries.
J.P. Morgan Global High-Yield Index: An unmanaged index that tracks the performance of the high-yield bond market.
Lehman Brothers Mortgage-Backed Securities Index: An unmanaged index that tracks the performance of the mortgage-backed pass-through securities of Ginnie Mae (GNMA), Fannie Mae (FNMA), and Freddie Mac (FHLMC).
Lehman Brothers U.S. Aggregate Index: An unmanaged index that tracks domestic investment-grade bonds, including corporate, government, and mortgage-backed securities.
Lehman Brothers U.S. Credit Index: An unmanaged index that tracks the performance of domestic investment-grade corporate bonds.
Lehman Brothers U.S. Credit Baa Index: A measure of corporate and noncorporate fixed-income securities that are rated investment grade (Baa by Moody’s Investors Service and BBB by Standard & Poor’s) and have at least 10 years to final maturity.
Lehman Brothers U.S. Treasury Index: An unmanaged index of publicly traded obligations of the U.S. Treasury.
Lipper averages: The averages of all mutual funds in a particular category as tracked by Lipper Inc.
Real interest rate: A fixed-income security’s interest rate after being adjusted for inflation. It is calculated by subtracting the inflation rate from a nominal interest rate. For example, if a 10-year Treasury note is yielding 5% and inflation is 2%, the real interest rate is 3%.
Weighted average maturity: The weighted average of the stated maturity dates of the portfolio’s securities. In general, the longer the average maturity, the greater the fund’s sensitivity to interest rate changes. A shorter average maturity usually means less interest rate sensitivity and therefore a less volatile portfolio.
Yield curve: A graphic depiction of the relationship between yields and maturity dates for a set of similar securities, such as Treasuries or municipal securities. Yield curves typically slope upward, indicating that longer maturities offer higher yields. When the yield curve is flat, there is little or no difference between the yields offered by shorter- and longer-term securities.
Performance and Expenses
T. Rowe Price Institutional Core Plus Fund
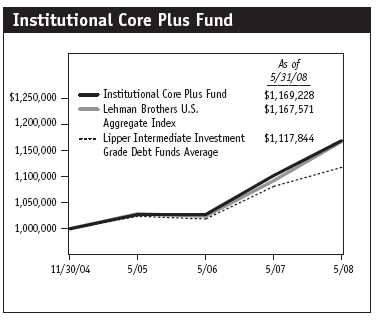
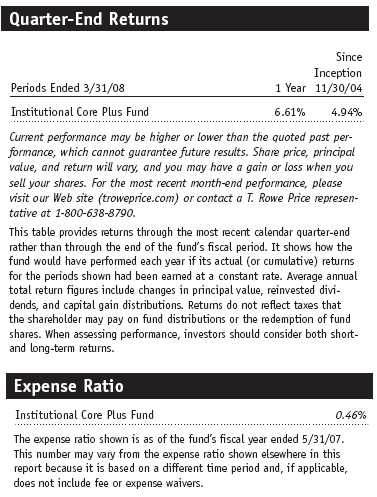
This chart shows the value of a hypothetical $1 million investment in the fund over the past 10 fiscal year periods or since inception (for funds lacking 10-year records). The result is compared with benchmarks, which may include a broad-based market index and a peer group average or index. Market indexes do not include expenses, which are deducted from fund returns as well as mutual fund averages and indexes.
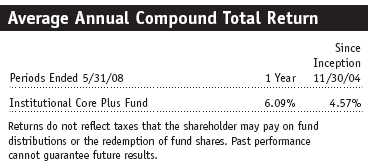
This table shows how the fund would have performed each year if its actual (or cumulative) returns for the periods shown had been earned at a constant rate.
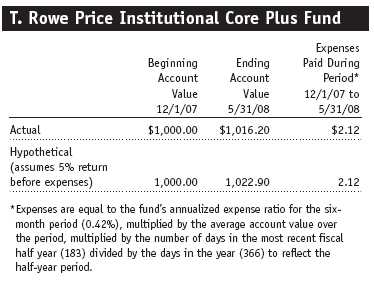
Fund Expense Example
As a mutual fund shareholder, you may incur two types of costs: (1) transaction costs, such as redemption fees or sales loads, and (2) ongoing costs, including management fees, distribution and service (12b-1) fees, and other fund expenses. The following example is intended to help you understand your ongoing costs (in dollars) of investing in the fund and to compare these costs with the ongoing costs of investing in other mutual funds. The example is based on an investment of $1,000 invested at the beginning of the most recent six-month period and held for the entire period.
Actual Expenses
The first line of the following table (“Actual”) provides information about actual account values and actual expenses. You may use the information in this line, together with your account balance, to estimate the expenses that you paid over the period. Simply divide your account value by $1,000 (for example, an $8,600 account value divided by $1,000 = 8.6), then multiply the result by the number in the first line under the heading “Expenses Paid During Period” to estimate the expenses you paid on your account during this period.
Hypothetical Example for Comparison Purposes
The information on the second line of the table (“Hypothetical”) is based on hypothetical account values and expenses derived from the fund’s actual expense ratio and an assumed 5% per year rate of return before expenses (not the fund’s actual return). You may compare the ongoing costs of investing in the fund with other funds by contrasting this 5% hypothetical example and the 5% hypothetical examples that appear in the shareholder reports of the other funds. The hypothetical account values and expenses may not be used to estimate the actual ending account balance or expenses you paid for the period.
You should also be aware that the expenses shown in the table highlight only your ongoing costs and do not reflect any transaction costs, such as redemption fees or sales loads. Therefore, the second line of the table is useful in comparing ongoing costs only and will not help you determine the relative total costs of owning different funds. To the extent a fund charges transaction costs, however, the total cost of owning that fund is higher.
Financial Highlights
T. Rowe Price Institutional Core Plus Fund
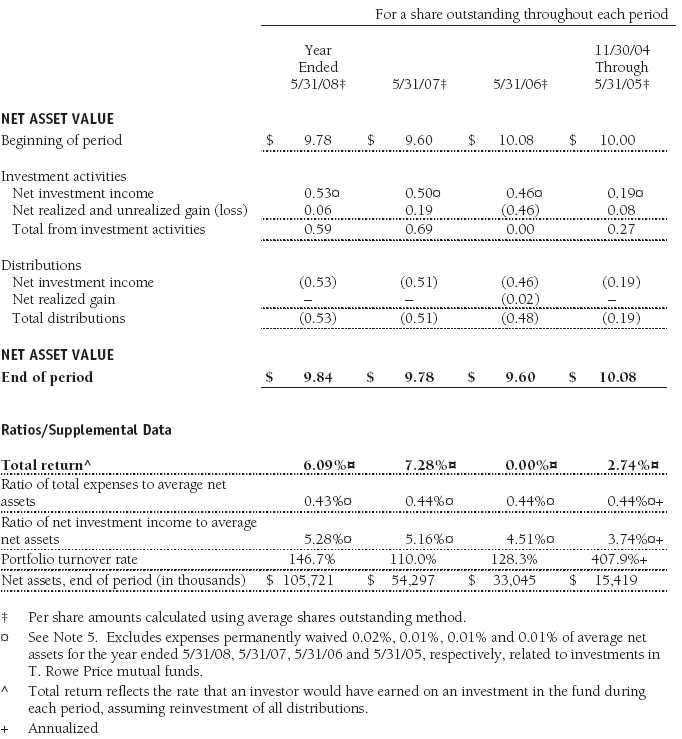
The accompanying notes are an integral part of these financial statements.
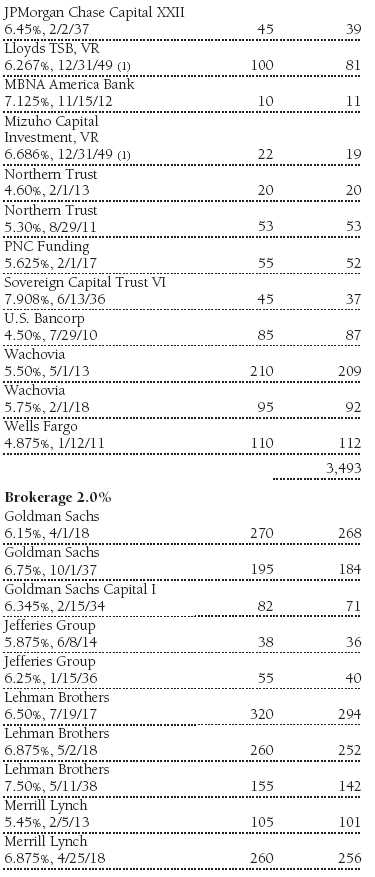
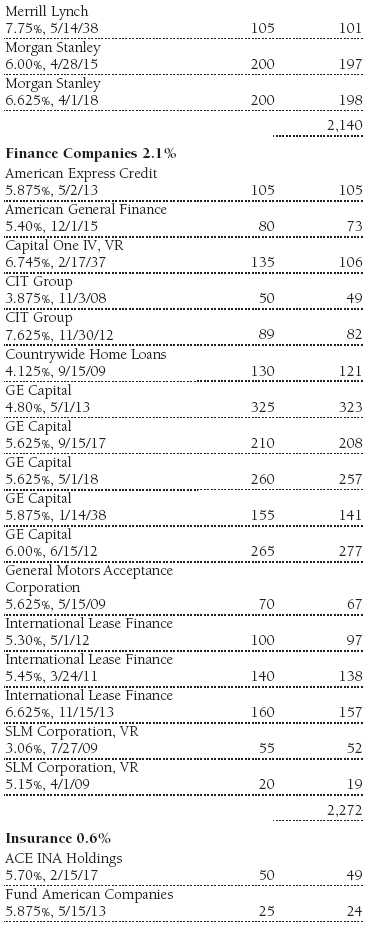
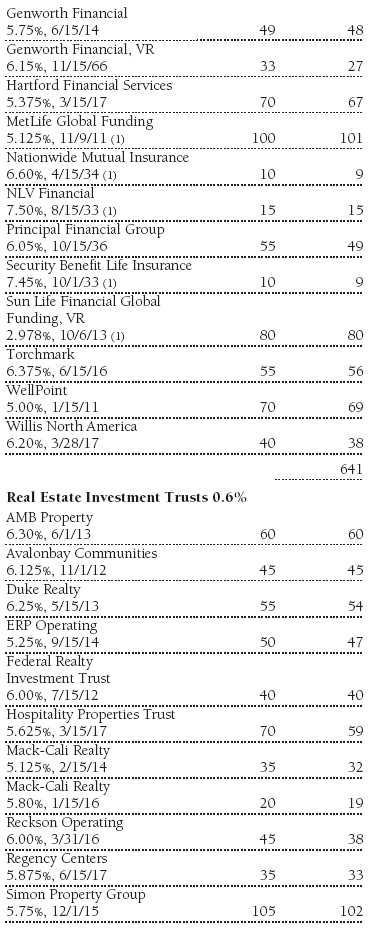
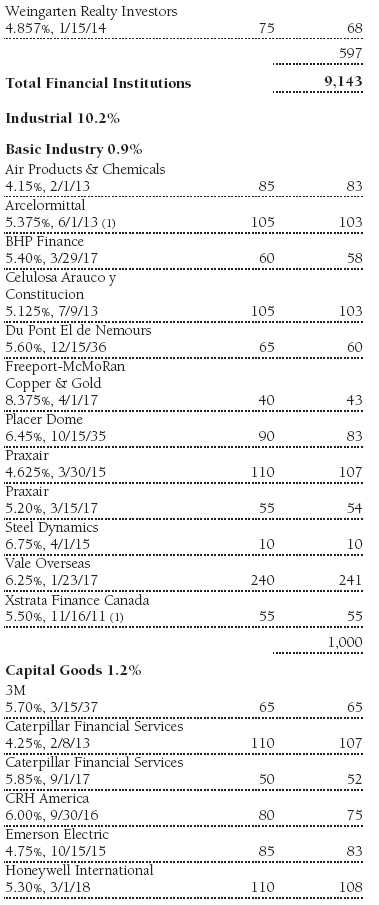
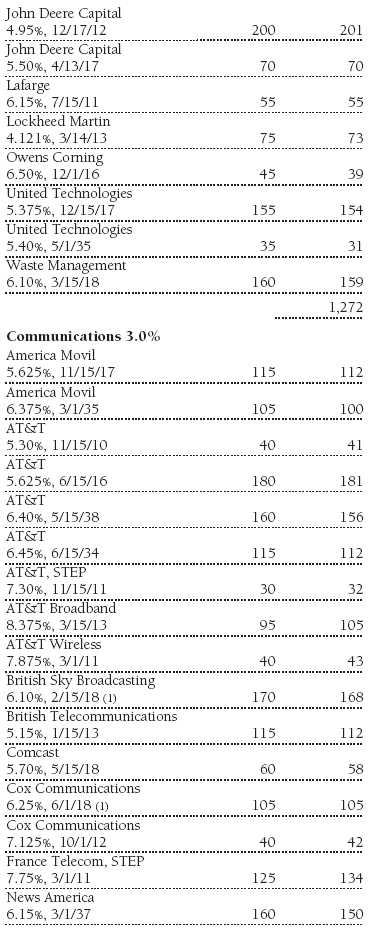
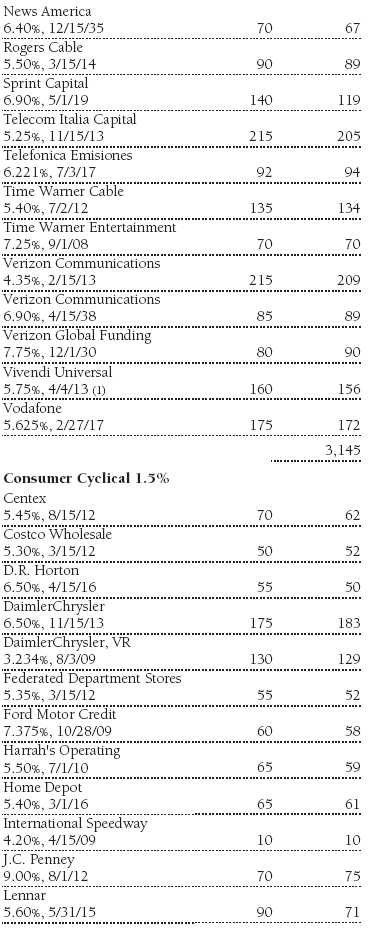
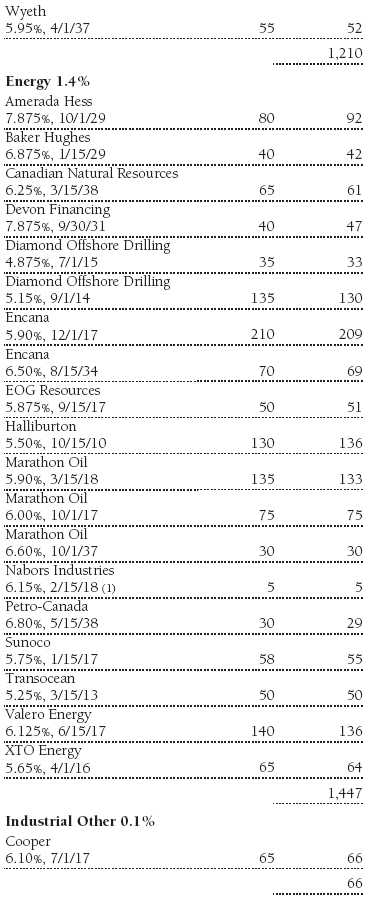
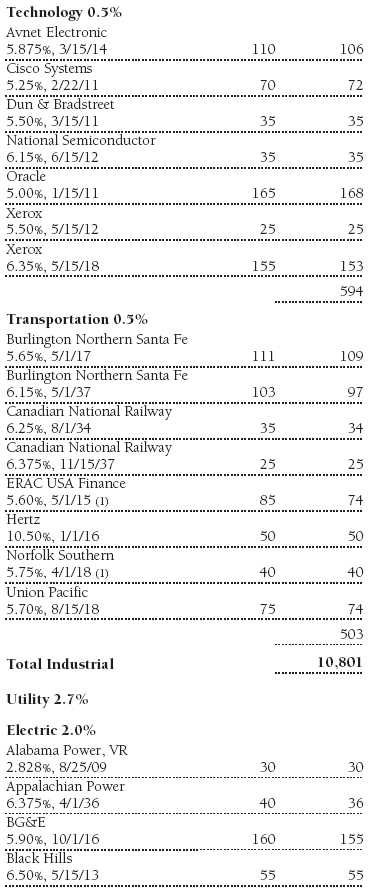
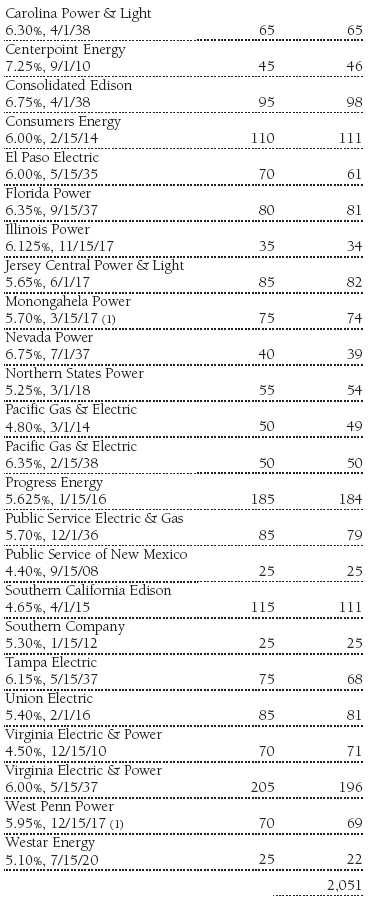
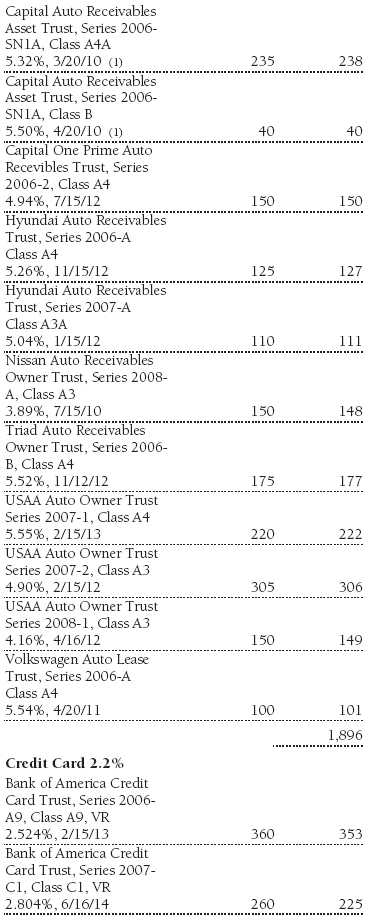
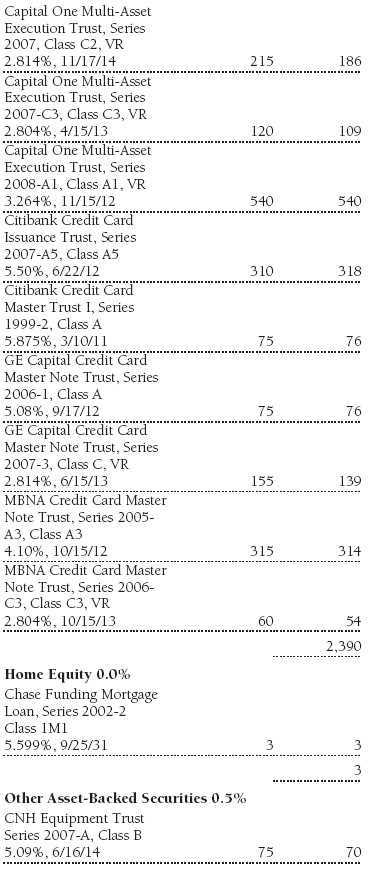
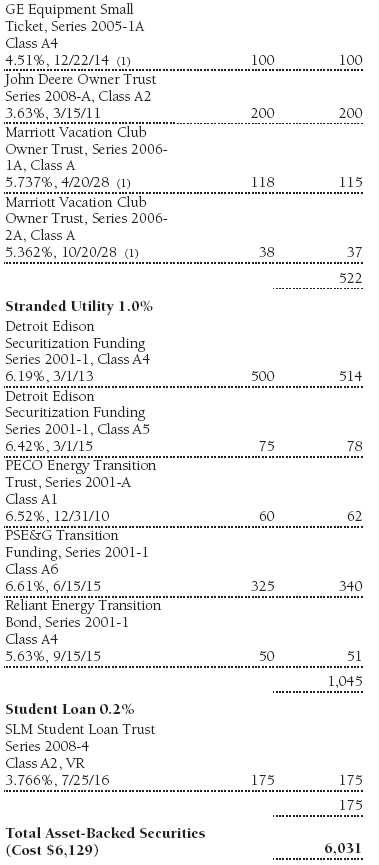
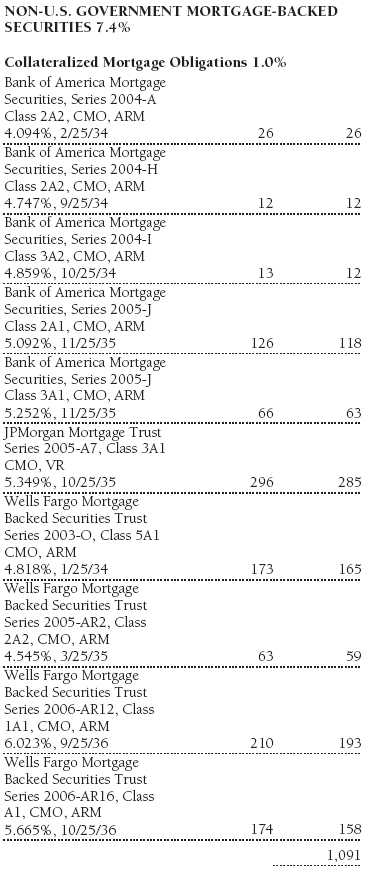
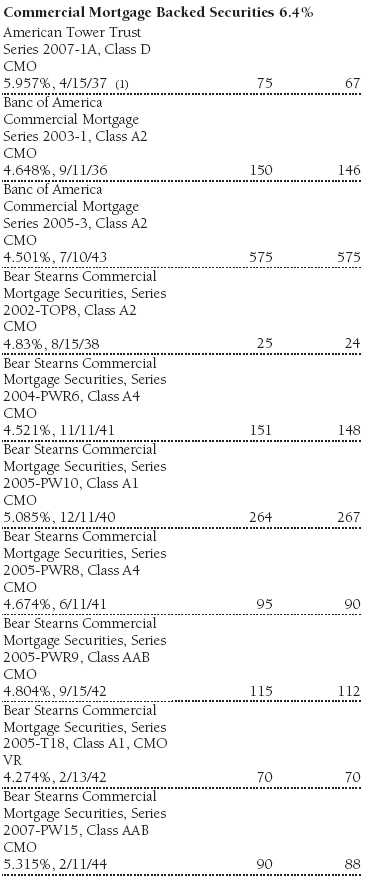
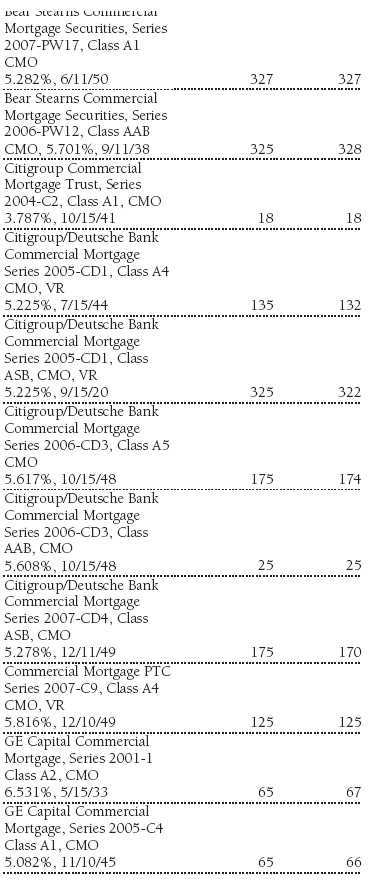
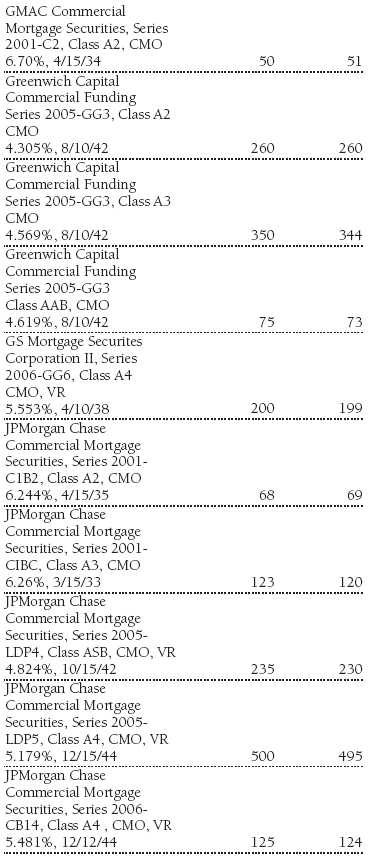
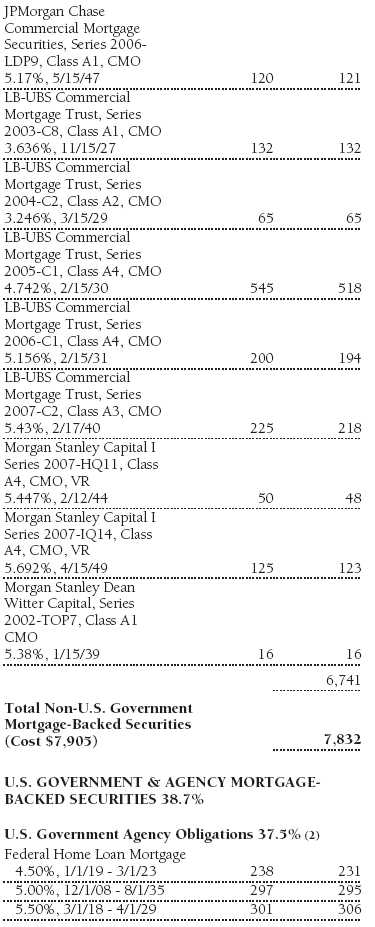
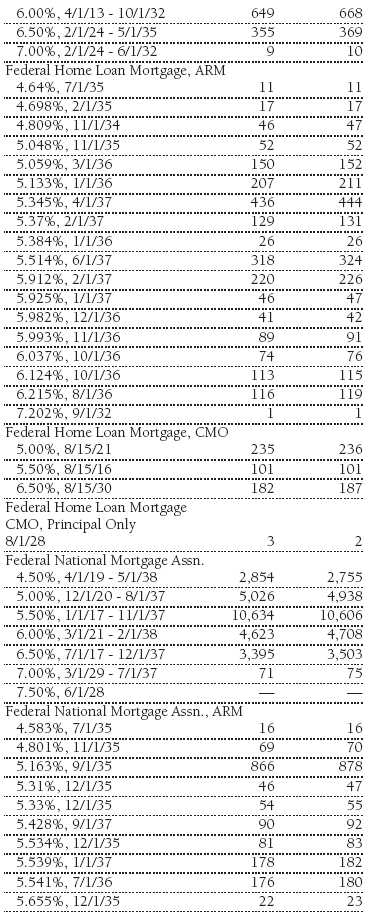
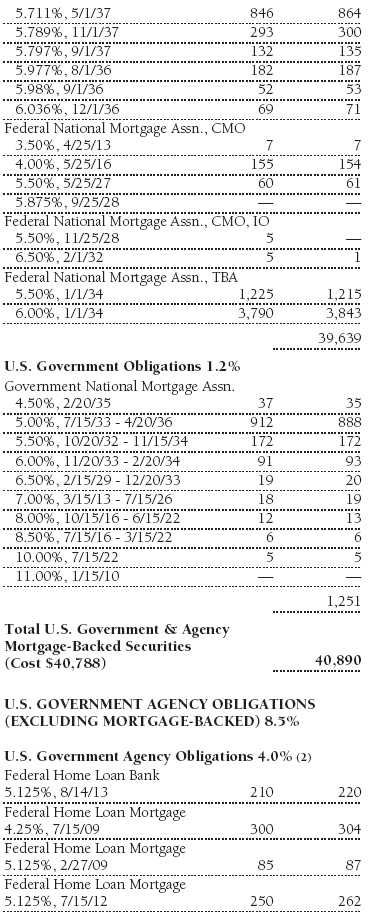
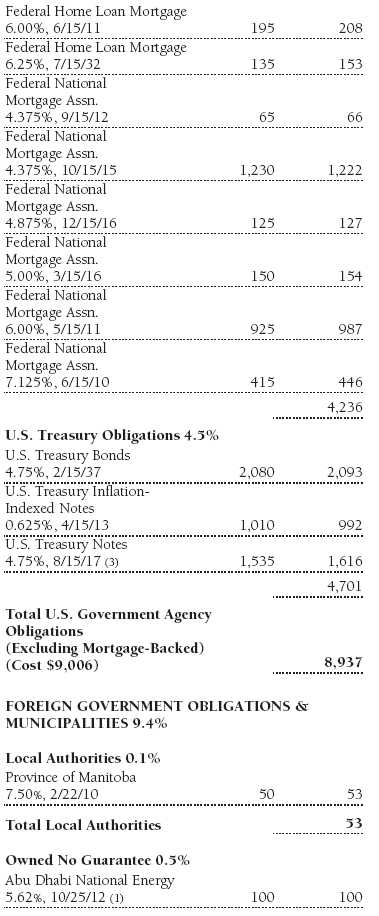
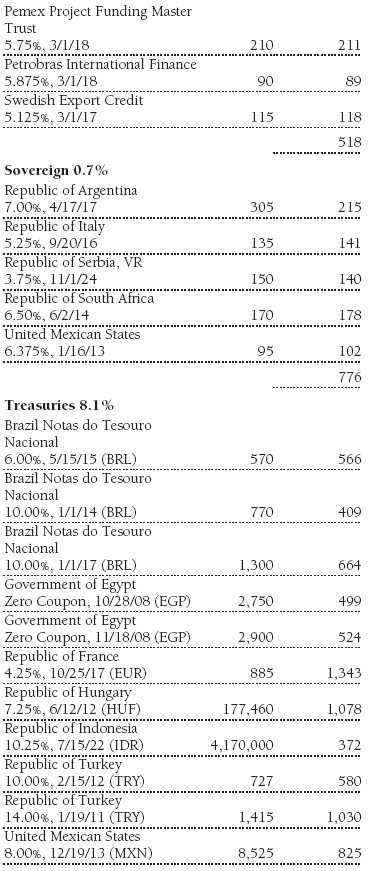
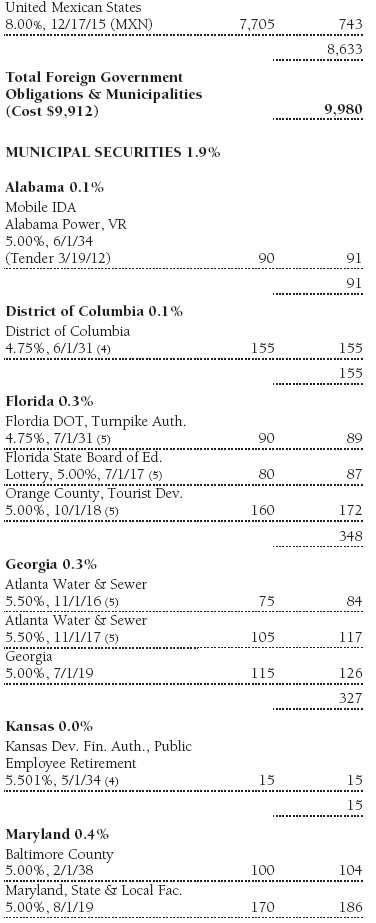
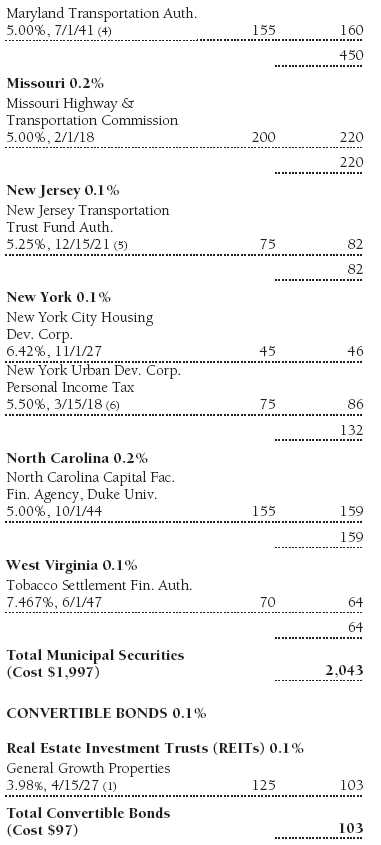
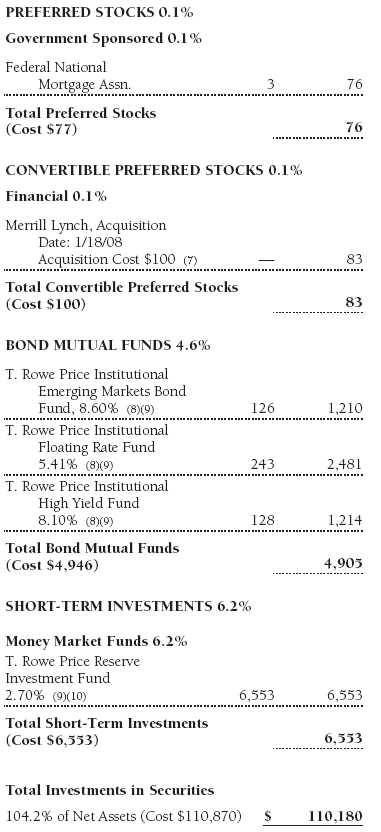
Portfolio of Investments ‡
T. Rowe Price Institutional Core Plus Fund
May 31, 2008
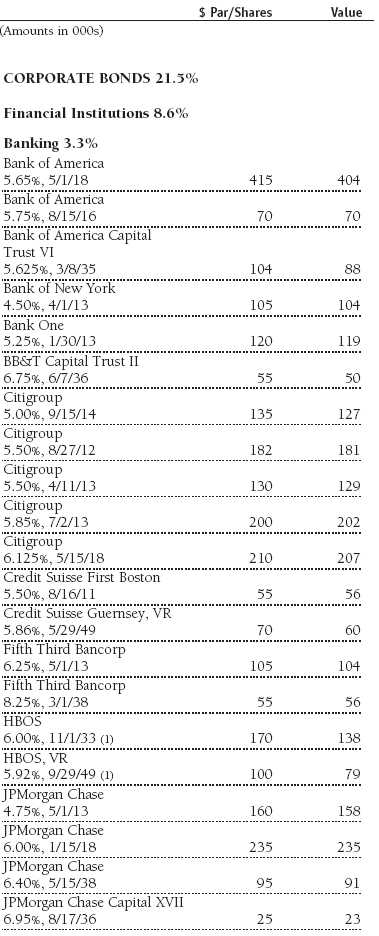


The accompanying notes are an integral part of these financial statements.
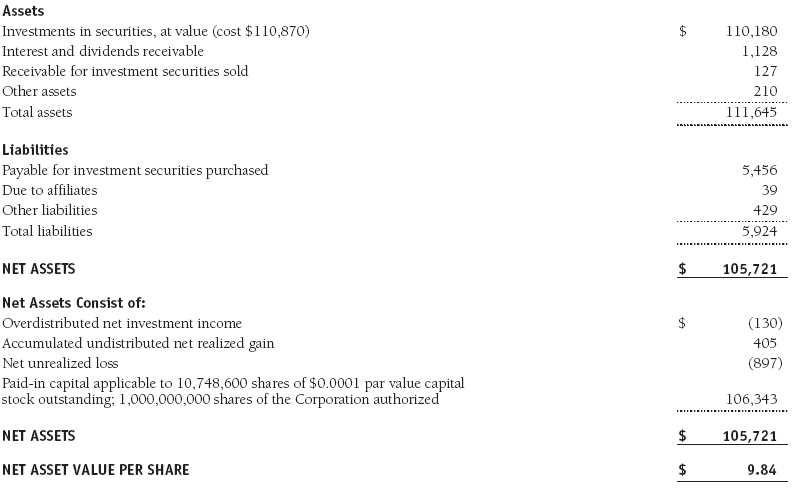
Statement of Assets and Liabilities
T. Rowe Price Institutional Core Plus Fund
May 31, 2008
($000s except shares and per share amounts)
The accompanying notes are an integral part of these financial statements.
Statement of Operations
T. Rowe Price Institutional Core Plus Fund
($000s)
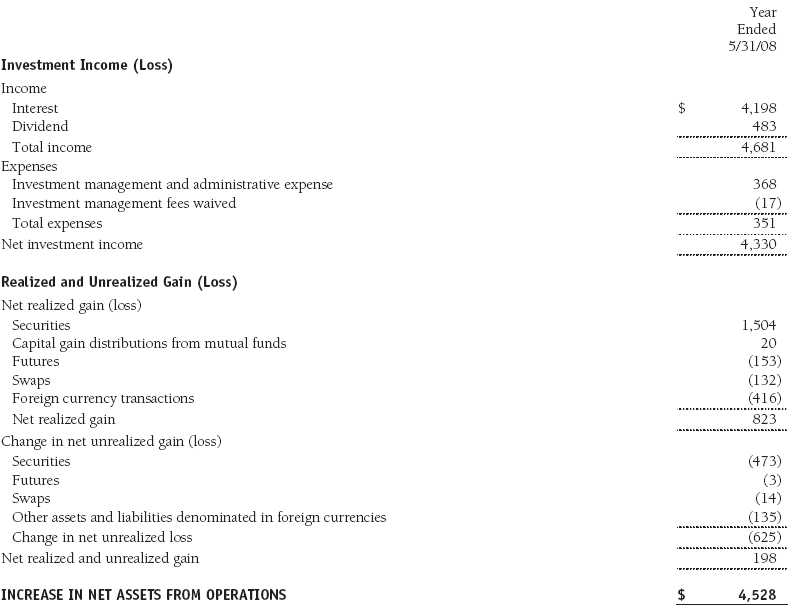
The accompanying notes are an integral part of these financial statements.
Statement of Changes in Net Assets
T. Rowe Price Institutional Core Plus Fund
($000s)
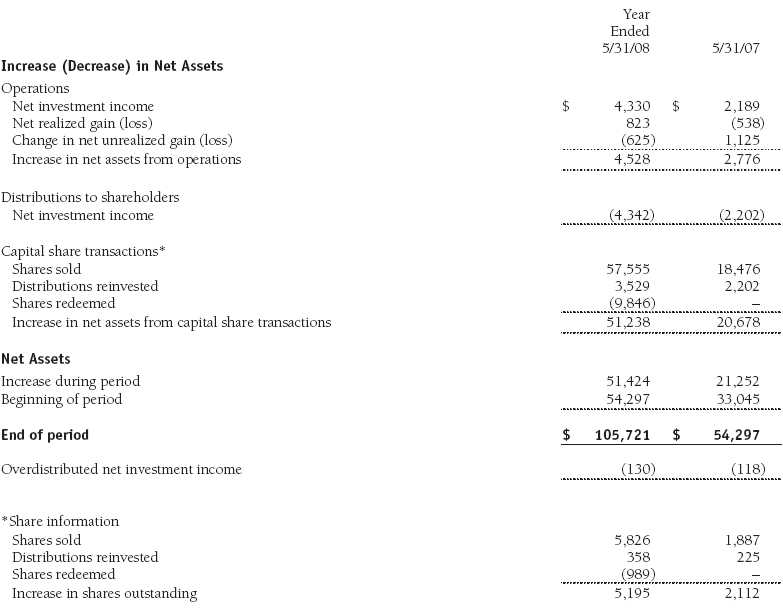
The accompanying notes are an integral part of these financial statements.
Notes to Financial Statements
T. Rowe Price Institutional Core Plus Fund
May 31, 2008
T. Rowe Price Institutional Income Funds, Inc. (the corporation), is registered under the Investment Company Act of 1940 (the 1940 Act). The Institutional Core Plus Fund (the fund), a diversified, open-end management investment company, is one portfolio established by the corporation. The fund commenced operations on November 30, 2004. The fund seeks to maximize total return through income and capital appreciation.
NOTE 1 - SIGNIFICANT ACCOUNTING POLICIES
Basis of Preparation The accompanying financial statements were prepared in accordance with accounting principles generally accepted in the United States of America, which require the use of estimates made by fund management. Fund management believes that estimates and security valuations are appropriate; however, actual results may differ from those estimates, and the security valuations reflected in the financial statements may differ from the value the fund ultimately realizes upon sale of the securities.
Investment Transactions, Investment Income, and Distributions Income and expenses are recorded on the accrual basis. Premiums and discounts on debt securities are amortized for financial reporting purposes. Inflation adjustments to the principal amount of inflation-indexed bonds are reflected as interest income. Dividends received from mutual fund investments are reflected as dividend income; capital gain distributions are reflected as realized gain/loss. Dividend income and capital gain distributions are recorded on the ex-dividend date. Income tax-related interest and penalties, if incurred, would be recorded as income tax expense. Investment transactions are accounted for on the trade date. Realized gains and losses are reported on the identified cost basis. Payments (“variation margin”) made or received to settle the daily fluctuations in the value of futures contracts are recorded as unrealized gains or losses until the contracts are closed. Unsettled variation margin on futures contracts is reflected as other assets or liabilities, and unrealized gains and losses on futures contracts are reflected as the change in net unrealized gain or loss in the accompanying financial statements. Unrealized gains and losses on forward currency exchange contracts are reflected as the change in net unrealized gain or loss in the accompanying financial statements. Net periodic receipts or payments required by swaps are accrued daily and recorded as realized gain or loss in the accompanying financial statements. Fluctuations in the fair value of swaps are reflected in the change in net unrealized gain or loss and are reclassified to realized gain or loss upon termination prior to maturity. Paydown gains and losses are recorded as an adjustment to interest income. Distributions to shareholders are recorded on the ex-dividend date. Income distributions are declared on a daily basis and paid monthly. Capital gain distributions, if any, are declared and paid by the fund, typically on an annual basis.
Currency Translation Assets, including investments, and liabilities denominated in foreign currencies are translated into U.S. dollar values each day at the prevailing exchange rate, using the mean of the bid and asked prices of such currencies against U.S. dollars as quoted by a major bank. Purchases and sales of securities, income, and expenses are translated into U.S. dollars at the prevailing exchange rate on the date of the transaction. The effect of changes in foreign currency exchange rates on realized and unrealized security gains and losses is reflected as a component of security gains and losses.
In-Kind Subscriptions Under certain circumstances and when considered in the best interest of the fund, the fund may accept portfolio securities rather than cash as payment for the purchase of fund shares (in-kind subscription). For financial reporting and tax purposes, the cost basis of contributed securities is equal to the market value of the securities on the date of contribution. In-kind subscriptions result in no gain or loss and no tax consequences for the fund. During the year ended May 31, 2008, the fund accepted $11,919,000 of in-kind subscriptions, including $0 from other T. Rowe Price Funds.
New Accounting Pronouncements Effective November 30, 2007, the fund adopted Financial Accounting Standards Board (FASB) Interpretation No. 48 (FIN 48), Accounting for Uncertainty in Income Taxes, a clarification of FASB Statement No. 109, Accounting for Income Taxes. FIN 48 establishes financial accounting and disclosure requirements for recognition and measurement of tax positions taken or expected to be taken on an income tax return. The adoption of FIN 48 had no impact on the fund’s net assets or results of operations.
In September 2006, the Financial Accounting Standards Board (FASB) released Statement of Financial Accounting Standards No. 157 (FAS 157), Fair Value Measurements. FAS 157 defines fair value, establishes the framework for measuring fair value, and expands the disclosure of fair value measurements in the financial statements. It is effective for the fund’s fiscal year beginning June 1, 2008. Management expects adoption of FAS 157 will have no material impact on the fund’s net assets or results of operations.
In March 2008, the Financial Accounting Standards Board issued Statement of Financial Accounting Standards No. 161, Disclosures about Derivative Instruments and Hedging Activities (FAS 161), which is effective for fiscal years and interim periods beginning after November 15, 2008. FAS 161 requires enhanced disclosures about derivative and hedging activities, including how such activities are accounted for and their effect on financial position, performance and cash flows. Management is currently evaluating the impact the adoption of FAS 161 will have on the fund’s financial statements and related disclosures.
NOTE 2 - VALUATION
The fund values its investments and computes its net asset value per share at the close of the New York Stock Exchange (NYSE), normally 4 p.m. ET, each day that the NYSE is open for business.
Debt securities are generally traded in the over-the-counter (OTC) market. Securities with remaining maturities of one year or more at the time of acquisition are valued at prices furnished by dealers who make markets in such securities or by an independent pricing service, which considers the yield or price of bonds of comparable quality, coupon, maturity, and type, as well as prices quoted by dealers who make markets in such securities. Securities with remaining maturities of less than one year at the time of acquisition generally use amortized cost in local currency to approximate fair value. However, if amortized cost is deemed not to reflect fair value or the fund holds a significant amount of such securities with remaining maturities of more than 60 days, the securities are valued at prices furnished by dealers who make markets in such securities or by an independent pricing service.
Equity securities listed or regularly traded on a securities exchange or in the OTC market are valued at the last quoted sale price or, for certain markets, the official closing price at the time the valuations are made, except for OTC Bulletin Board securities, which are valued at the mean of the latest bid and asked prices. A security that is listed or traded on more than one exchange is valued at the quotation on the exchange determined to be the primary market for such security. Listed securities not traded on a particular day are valued at the mean of the latest bid and asked prices for domestic securities and the last quoted sale price for international securities.
Investments in mutual funds are valued at the mutual fund’s closing net asset value per share on the day of valuation. Financial futures contracts are valued at closing settlement prices. Forward currency exchange contracts are valued using the prevailing forward exchange rate. Swaps are valued at net present value of the contract as furnished by counterparties or by an independent pricing service.
Other investments, including restricted securities, and those for which the above valuation procedures are inappropriate or are deemed not to reflect fair value are stated at fair value as determined in good faith by the T. Rowe Price Valuation Committee, established by the fund’s Board of Directors.
For valuation purposes, the last quoted prices of non-U.S. equity securities may be adjusted under the circumstances described below. If the fund determines that developments between the close of a foreign market and the close of the NYSE will, in its judgment, materially affect the value of some or all of its portfolio securities, the fund will adjust the previous closing prices to reflect what it believes to be the fair value of the securities as of the close of the NYSE. In deciding whether it is necessary to adjust closing prices to reflect fair value, the fund reviews a variety of factors, including developments in foreign markets, the performance of U.S. securities markets, and the performance of instruments trading in U.S. markets that represent foreign securities and baskets of foreign securities. A fund may also fair value securities in other situations, such as when a particular foreign market is closed but the fund is open. The fund uses outside pricing services to provide it with closing prices and information to evaluate and/or adjust those prices. The fund cannot predict how often it will use closing prices and how often it will determine it necessary to adjust those prices to reflect fair value. As a means of evaluating its security valuation process, the fund routinely compares closing prices, the next day’s opening prices in the same markets, and adjusted prices.
NOTE 3 - INVESTMENT TRANSACTIONS
Consistent with its investment objective, the fund engages in the following practices to manage exposure to certain risks or to enhance performance. The investment objective, policies, program, and risk factors of the fund are described more fully in the fund’s prospectus and Statement of Additional Information.
Restricted Securities The fund may invest in securities that are subject to legal or contractual restrictions on resale. Prompt sale of such securities at an acceptable price may be difficult and may involve substantial delays and additional costs.
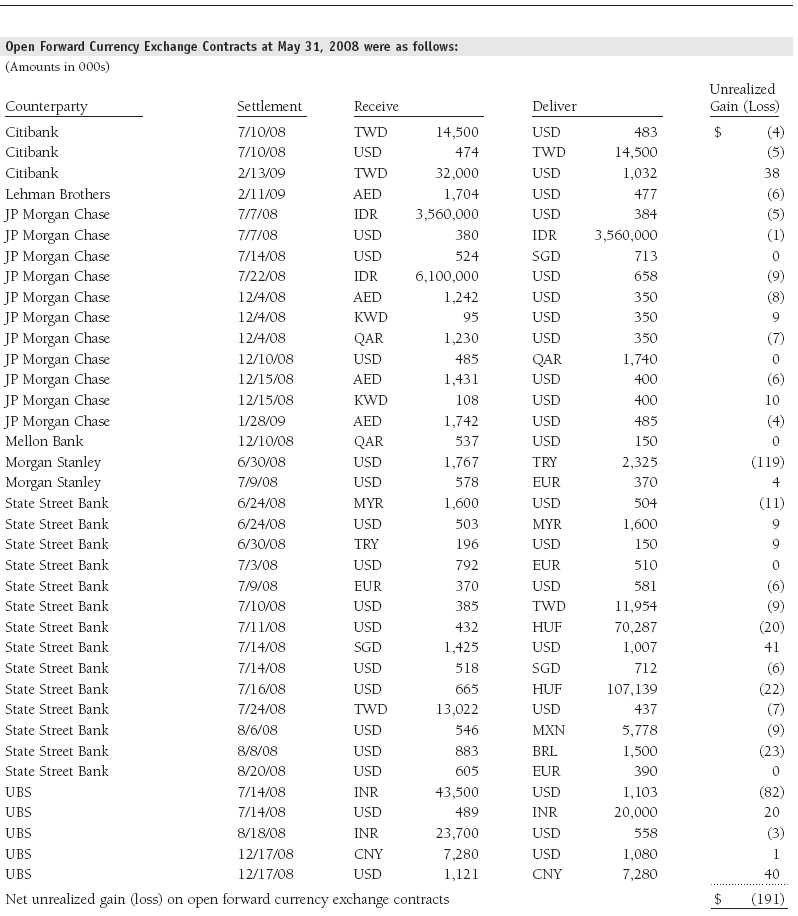
Forward Currency Exchange Contracts During the year ended May 31, 2008, the fund was a party to forward currency exchange contracts under which it is obligated to exchange currencies at specified future dates and exchange rates. Risks arise from the possible inability of counterparties to meet the terms of their agreements and from movements in currency values.
Futures Contracts During the year ended May 31, 2008, the fund was a party to futures contracts, which provide for the future sale by one party and purchase by another of a specified amount of a specific financial instrument at an agreed upon price, date, time, and place. Risks arise from possible illiquidity of the futures market and from movements in security values and/or interest rates.
Options Call and put options on futures contracts give the holder the right to purchase and sell, respectively, a particular futures contract at a specified price on or until a certain date. Risks arise from possible illiquidity of the options market and from movements in underlying futures prices.
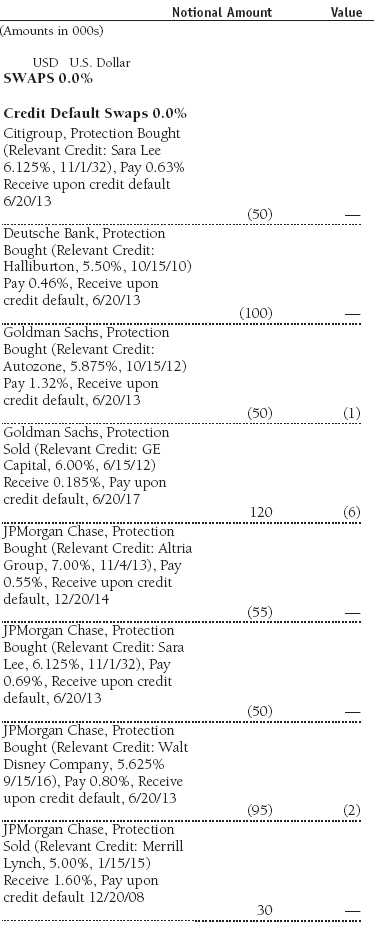
Swaps During the year ended May 31, 2008, the fund was a party to credit default swaps under which it buys or sells credit protection against a defined-issuer credit event. Upon a defined-issuer credit event, the fund is required to either deliver the notional amount of the contract in cash and take delivery of the relevant credit or deliver cash approximately equal to the notional amount of the contract less market value of the relevant credit at the time of the credit event. Risks arise from the possible inability of counterparties to meet the terms of their agreements and from changes in creditworthiness of the relevant underlying issuer. In order to mitigate counterparty risk and subject to specific contractual arrangements, the fund may receive eligible security collateral from such counterparties upon unrealized gain amounts reaching certain thresholds. Eligible security collateral generally includes debt securities issued by the U.S. government or related agencies. At May 31, 2008, no such collateral was received.
TBA Purchase Commitments During the year ended May 31, 2008, the fund entered into to be announced (TBA) purchase commitments, pursuant to which it agrees to purchase mortgage-backed securities for a fixed unit price, with payment and delivery at a scheduled future date beyond the customary settlement period for that security. With TBA transactions, the particular securities to be delivered are not identified at the trade date; however, delivered securities must meet specified terms, including issuer, rate, and mortgage term, and be within industry-accepted “good delivery” standards. The fund generally enters into TBAs with the intention of taking possession of the underlying mortgage securities. Until settlement, the fund maintains cash reserves and liquid assets sufficient to settle its TBAs.
Other Purchases and sales of portfolio securities, other than short-term and U.S. government securities, aggregated $43,958,000 and $15,647,000, respectively, for the year ended May 31, 2008. Purchases and sales of U.S. government securities aggregated $115,582,000 and $99,425,000, respectively, for the year ended May 31, 2008.
NOTE 4 - FEDERAL INCOME TAXES
No provision for federal income taxes is required since the fund intends to continue to qualify as a regulated investment company under Subchapter M of the Internal Revenue Code and distribute to shareholders all of its taxable income and gains. Distributions are determined in accordance with Federal income tax regulations, which differ from generally accepted accounting principles, and, therefore, may differ significantly in amount or character from net investment income and realized gains for financial reporting purposes. Financial reporting records are adjusted for permanent book/tax differences to reflect tax character but are not adjusted for temporary differences.
Distributions during the years ended May 31, 2008, and May 31, 2007 totaled $4,342,000 and $2,202,000, respectively, and were characterized as ordinary income for tax purposes. At May 31, 2008, the tax-basis cost of investments and components of net assets were as follows:
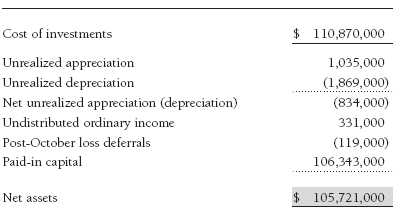
The difference between book-basis and tax-basis net unrealized appreciation (depreciation) is attributable to, the realization of unrealized gains/losses on certain open derivative contracts, for tax purposes. The fund intends to retain realized gains to the extent of available capital loss carryforwards. During the year ended May 31, 2008, the fund utilized $203,000 of capital loss carryforwards. Pursuant to federal income tax regulations applicable to investment companies, recognition of capital losses on certain transactions is deferred until the subsequent tax year. Consequently, realized losses reflected in the accompanying financial statements include net capital losses realized between November 1 and the fund’s fiscal year-end that have not been recognized for tax purposes (post-October loss deferrals).
NOTE 5 - RELATED PARTY TRANSACTIONS
The fund is managed by T. Rowe Price Associates, Inc. (the manager or Price Associates), a wholly owned subsidiary of T. Rowe Price Group, Inc. The investment management and administrative agreement between the fund and the manager provides for an all-inclusive annual fee equal to 0.45% of the fund’s average daily net assets. The fee is computed daily and paid monthly. The agreement provides that investment management, shareholder servicing, transfer agency, accounting, custody services, and directors’ fees and expenses are provided to the fund, and interest, taxes, brokerage commissions, and extraordinary expenses are paid directly by the fund.
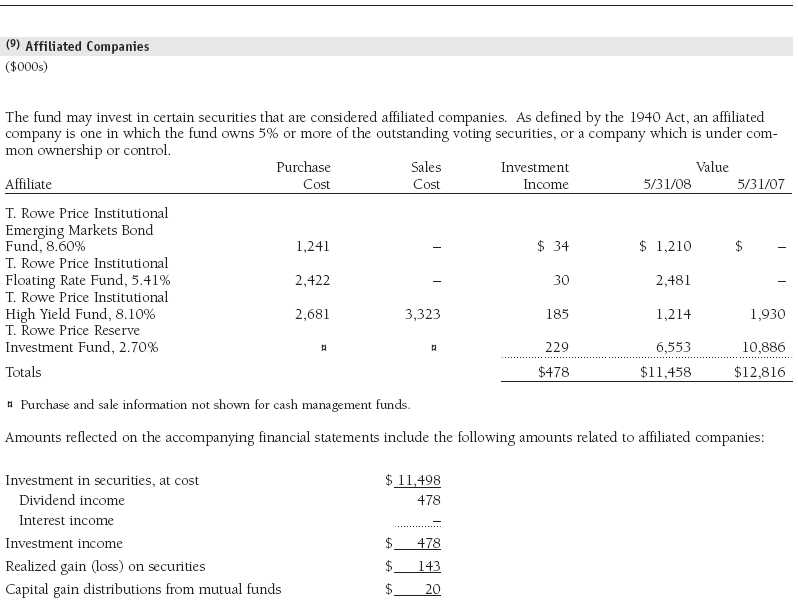
The fund may invest in the T. Rowe Price Reserve Investment Fund and the T. Rowe Price Government Reserve Investment Fund (collectively, the T. Rowe Price Reserve Investment Funds), open-end management investment companies managed by Price Associates and considered affiliates of the fund. The T. Rowe Price Reserve Investment Funds are offered as cash management options to mutual funds, trusts, and other accounts managed by Price Associates and/or its affiliates and are not available for direct purchase by members of the public. The T. Rowe Price Reserve Investment Funds pay no investment management fees.
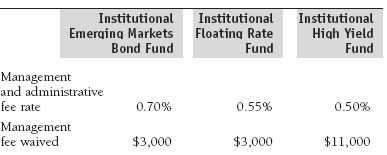
The fund may also invest in certain T. Rowe Price institutional funds (underlying institutional funds) as a means of gaining efficient and cost-effective exposure to certain markets. The underlying institutional funds are open-end management investment companies managed by Price Associates and/or T. Rowe Price International, Inc. (collectively, the Price managers) and are considered affiliates of the fund. Each underlying institutional fund pays an all-inclusive management and administrative fee to its Price manager. To ensure that the fund does not incur duplicate fees, each Price manager has agreed to permanently waive a portion of its management fee charged to the fund in an amount sufficient to fully offset the fees paid by the underlying institutional funds related to fund assets invested therein. Accordingly, the accompanying Statement of Operations includes management fees permanently waived pursuant to this agreement. Annual fee rates and amounts waived within the accompanying Statement of Operations related to shares of the underlying institutional funds for the period ended May 31, 2008, are as follows:
As of May 31, 2008, T. Rowe Price Group, Inc., and/or its wholly owned subsidiaries owned 1,782,360 shares of the fund, representing 17% of the fund’s net assets.
Report of Independent Registered Public Accounting Firm
To the Board of Directors of T. Rowe Price Institutional Income Funds, Inc. and Shareholders of T. Rowe Price Institutional Core Plus Fund
In our opinion, the accompanying statement of assets and liabilities, including the portfolio of investments, and the related statements of operations and of changes in net assets and the financial highlights present fairly, in all material respects, the financial position of T. Rowe Price Institutional Core Plus Fund (one of the portfolios comprising T. Rowe Price Institutional Income Funds, Inc., hereafter referred to as the “Fund”) at May 31, 2008, the results of its operations for the year then ended, the changes in its net assets for each of the two years in the period then ended and the financial highlights for each of the fiscal periods presented, in conformity with accounting principles generally accepted in the United States of America. These financial statements and financial highlights (hereafter referred to as “financial statements”) are the responsibility of the Fund’s management; our responsibility is to express an opinion on these financial statements based on our audits. We conducted our audits of these financial statements in accordance with the auditing standards of the Public Company Accounting Oversight Board (United States). Those standards require that we plan and perform the audit to obtain reasonable assurance about whether the financial statements are free of material misstatement. An audit includes examining, on a test basis, evidence supporting the amounts and disclosures in the financial statements, assessing the accounting principles used and significant estimates made by management, and evaluating the overall financial statement presentation. We believe that our audits, which included confirmation of securities at May 31, 2008, by correspondence with the custodian and brokers, and confirmation of the underlying funds, by correspondence with the transfer agent, provide a reasonable basis for our opinion.
PricewaterhouseCoopers LLP
Baltimore, Maryland
July 11, 2008
| Tax Information (Unaudited) for the Tax Year Ended 5/31/08 |
We are providing this information as required by the Internal Revenue Code. The amounts shown may differ from those elsewhere in this report because of differences between tax and financial reporting requirements.
For taxable non-corporate shareholders, $7,000 of the fund’s income represents qualified dividend income subject to the 15% rate category.
For corporate shareholders, $7,000 of the fund’s income qualifies for the dividends-received deduction.
| Information on Proxy Voting Policies, Procedures, and Records |
A description of the policies and procedures used by T. Rowe Price funds and portfolios to determine how to vote proxies relating to portfolio securities is available in each fund’s Statement of Additional Information, which you may request by calling 1-800-225-5132 or by accessing the SEC’s Web site, www.sec.gov. The description of our proxy voting policies and procedures is also available on our Web site, www.troweprice.com. To access it, click on the words “Company Info” at the top of our homepage for individual investors. Then, in the window that appears, click on the “Proxy Voting Policy” navigation button in the top left corner.
Each fund’s most recent annual proxy voting record is available on our Web site and through the SEC’s Web site. To access it through our Web site, follow the directions above, then click on the words “Proxy Voting Record” at the bottom of the Proxy Voting Policy page.
| How to Obtain Quarterly Portfolio Holdings |
The fund files a complete schedule of portfolio holdings with the Securities and Exchange Commission for the first and third quarters of each fiscal year on Form N-Q. The fund’s Form N-Q is available electronically on the SEC’s Web site (www.sec.gov); hard copies may be reviewed and copied at the SEC’s Public Reference Room, 450 Fifth St. N.W., Washington, DC 20549. For more information on the Public Reference Room, call 1-800-SEC-0330.
| Approval of Investment Management Agreement |
On March 4, 2008, the fund’s Board of Directors (Board) unanimously approved the investment advisory contract (Contract) between the fund and its investment manager, T. Rowe Price Associates, Inc. (Manager). The Board considered a variety of factors in connection with its review of the Contract, also taking into account information provided by the Manager during the course of the year, as discussed below:
Services Provided by the Manager
The Board considered the nature, quality, and extent of the services provided to the fund by the Manager. These services included, but were not limited to, management of the fund’s portfolio and a variety of related activities, as well as financial and administrative services, reporting, and communications. The Board also reviewed the background and experience of the Manager’s senior management team and investment personnel involved in the management of the fund. The Board concluded that it was satisfied with the nature, quality, and extent of the services provided by the Manager.
Investment Performance of the Fund
The Board reviewed the fund’s average annual total return for the one-year, three-year, and since-inception periods as well as the fund’s year-by-year returns and compared these returns with previously agreed upon comparable performance measures and market data, including those supplied by Lipper, an independent provider of mutual fund data. On the basis of this evaluation and the Board’s ongoing review of investment results, the Board concluded that the fund’s performance was satisfactory.
Costs, Benefits, Profits, and Economies of Scale
The Board reviewed detailed information regarding the revenues received by the Manager under the Contract and other benefits that the Manager (and its affiliates) may have realized from its relationship with the fund, including research received under “soft dollar” agreements. The Board noted that soft dollars were not used to pay for third-party, non-broker research. The Board also received information on the estimated costs incurred and profits realized by the Manager and its affiliates from advising T. Rowe Price mutual funds. The Board concluded that the Manager’s profits from advising T. Rowe Price mutual funds were reasonable in light of the services provided to the fund. The Board also considered whether the fund or other funds benefit under the fee levels set forth in the Contract from any economies of scale realized by the Manager. The Board noted that, under the Contract, the fund pays the Manager a single fee based on the fund’s assets and the Manager, in turn, pays all expenses of the fund, with certain exceptions. The Board concluded that, based on the profitability data it reviewed and consistent with this single fee structure, the Contract provided for a reasonable sharing of any benefits from economies of scale with the fund.
Fees
The Board reviewed the fund’s single-fee structure and compared the rate with fees and expenses of other comparable funds based on information and data supplied by Lipper. The information provided to the Board showed that the fund’s management fee and expense ratio were below the median for comparable funds. (For these purposes, the Board assumed the management fee was equal to the single fee less the fund’s operating expenses.) The Board also reviewed the fee schedules for comparable privately managed accounts of the Manager and its affiliates. Management informed the Board that the Manager’s responsibilities for privately managed accounts are more limited than its responsibilities for the fund and other T. Rowe Price mutual funds that it or its affiliates advise. On the basis of the information provided, the Board concluded that the fees paid by the fund under the Contract were reasonable.
Approval of the Contract
As noted, the Board approved the continuation of the Contract. No single factor was considered in isolation or to be determinative to the decision. Rather, the Board concluded, in light of a weighting and balancing of all factors considered, that it was in the best interests of the fund to approve the continuation of the Contract, including the fees to be charged for services thereunder.
| About the Fund’s Directors and Officers |
Your fund is governed by a Board of Directors (Board) that meets regularly to review a wide variety of matters affecting the fund, including performance, investment programs, compliance matters, advisory fees and expenses, service providers, and other business affairs. The Board elects the fund’s officers, who are listed in the final table. At least 75% of Board members are independent of T. Rowe Price Associates, Inc. (T. Rowe Price), and T. Rowe Price International, Inc. (T. Rowe Price International); “inside” or “interested” directors are employees or officers of T. Rowe Price. The business address of each director and officer is 100 East Pratt Street, Baltimore, Maryland 21202. The Statement of Additional Information includes additional information about the fund directors and is available without charge by calling a T. Rowe Price representative at 1-800-225-5132.
| Independent Directors | |
| |
| Name (Year of Birth) | |
| Year Elected* | Principal Occupation(s) During Past Five Years and Directorships of Other Public Companies |
| |
| Jeremiah E. Casey (1940) | Director, National Life Insurance (2001 to 2005); Director, The Rouse Company, real estate developers (1990 to 2004) |
| 2006 | |
| |
| |
| Anthony W. Deering (1945) | Chairman, Exeter Capital, LLC, a private investment firm (2004 to present); Director, Vornado Real Estate Investment |
| 2002 | Trust (3/04 to present); Director, Mercantile Bankshares (2002 to 2007); Member, Advisory Board, Deutsche Bank |
| | North America (2004 to present); Director, Chairman of the Board, and Chief Executive Officer, The Rouse Company, |
| | real estate developers (1997 to 2004) |
| |
| Donald W. Dick, Jr. (1943) | Principal, EuroCapital Advisors, LLC, an acquisition and management advisory firm (10/95 to present); Chairman, |
| 2002 | The Haven Group, a custom manufacturer of modular homes (1/04 to present) |
| |
| David K. Fagin (1938) | Chairman and President, Nye Corporation (6/88 to present); Chairman, Canyon Resources Corp. (8/07 to 3/08); |
| 2002 | Director, Golden Star Resources Ltd. (5/92 to present); Director, Pacific Rim Mining Corp. (2/02 to present); |
| | Director, B.C. Corporation (3/08 to present) |
| |
| Karen N. Horn (1943) | Director, Federal National Mortgage Association (9/06 to present); Director, Norfolk Southern (2/08 to present); |
| 2003 | Director, Eli Lilly and Company (1987 to present); Director, Simon Property Group (2004 to present); Managing |
| | Director and President, Global Private Client Services, Marsh Inc. (1999 to 2003); Director, Georgia Pacific (5/04 |
| | to 12/05) |
| |
| Theo C. Rodgers (1941) | President, A&R Development Corporation (1977 to present) |
| 2005 | |
| |
| John G. Schreiber (1946) | Owner/President, Centaur Capital Partners, Inc., a real estate investment company (1991 to present); Partner, |
| 2002 | Blackstone Real Estate Advisors, L.P. (10/92 to present) |
| |
| *Each independent director oversees 123 T. Rowe Price portfolios and serves until retirement, resignation, or election of a successor. |
| Inside Directors | |
| |
| Name (Year of Birth) | |
| Year Elected* [Number of | |
| T. Rowe Price Portfolios | |
| Overseen] | Principal Occupation(s) During Past Five Years and Directorships of Other Public Companies |
| |
| Edward C. Bernard (1956) | Director and Vice President, T. Rowe Price; Vice Chairman of the Board, Director, and Vice President, T. Rowe Price |
| 2006 [123] | Group, Inc.; Chairman of the Board, Director, and President, T. Rowe Price Investment Services, Inc.; Chairman of |
| | the Board and Director, T. Rowe Price Global Asset Management Limited, T. Rowe Price Global Investment Services |
| | Limited, T. Rowe Price Retirement Plan Services, Inc., T. Rowe Price Savings Bank, and T. Rowe Price Services, Inc.; |
| | Director, T. Rowe Price International, Inc.; Chief Executive Officer, Chairman of the Board, Director, and President, |
| | T. Rowe Price Trust Company; Chairman of the Board, all funds |
| |
| Mary J. Miller, CFA (1955) | Director, T. Rowe Price Trust Company; Director and Vice President, T. Rowe Price; Vice President, T. Rowe Price |
| 2004 [38] | Group, Inc.; President, Institutional Income Funds |
| |
| *Each inside director serves until retirement, resignation, or election of a successor. |
| Officers | |
| |
| Name (Year of Birth) | |
| Title and Fund(s) Served | Principal Occupation(s) |
| |
| David C. Beers, CFA (1970) | Vice President, T. Rowe Price; formerly High Yield Analyst, Chartwell |
| Assistant Vice President, Institutional Income Funds | Investment Partners and Business Analyst/Software Developer, Morgan |
| | Stanley Investment Management (to 2004) |
| |
| Brian J. Brennan, CFA (1964) | Vice President, T. Rowe Price, T. Rowe Price Group, Inc., and T. Rowe Price |
| Executive Vice President, Institutional Income Funds | Trust Company |
| |
| Andrew M. Brooks (1956) | Vice President, T. Rowe Price and T. Rowe Price Group, Inc. |
| Vice President, Institutional Income Funds | |
| |
| Michael J. Conelius, CFA (1964) | Vice President, T. Rowe Price, T. Rowe Price Group, Inc., and T. Rowe Price |
| Vice President, Institutional Income Funds | International, Inc. |
| |
| Roger L. Fiery III, CPA (1959) | Vice President, T. Rowe Price, T. Rowe Price Group, Inc., T. Rowe Price |
| Vice President, Institutional Income Funds | International, Inc., and T. Rowe Price Trust Company |
| |
| Justin T. Gerbereux, CFA (1975) | Vice President, T. Rowe Price and T. Rowe Price Group, Inc.; formerly |
| Assistant Vice President, Institutional Income Funds | student, Mary Washington College and Darden School of Business |
| | Administration, University of Virginia (to 2003) |
| |
| John R. Gilner (1961) | Chief Compliance Officer and Vice President, T. Rowe Price; Vice President, |
| Chief Compliance Officer, Institutional Income Funds | T. Rowe Price Group, Inc., and T. Rowe Price Investment Services, Inc. |
| |
| Gregory S. Golczewski (1966) | Vice President, T. Rowe Price and T. Rowe Price Trust Company |
| Vice President, Institutional Income Funds | |
| |
| Gregory K. Hinkle, CPA (1958) | Vice President, T. Rowe Price and T. Rowe Price Group, Inc.; formerly |
| Treasurer, Institutional Income Funds | Partner, PricewaterhouseCoopers, LLP (to 2007) |
| Steven C. Huber, CFA (1958) | Vice President, T. Rowe Price Group, Inc. |
| Vice President, Institutional Income Funds | |
| |
| Paul A. Karpers, CFA (1967) | Vice President, T. Rowe Price and T. Rowe Price Group, Inc. |
| Executive Vice President, Institutional Income Funds | |
| |
| Ian D. Kelson (1956) | Vice President, T. Rowe Price, T. Rowe Price Group, Inc., and T. Rowe Price |
| Vice President, Institutional Income Funds | International, Inc. |
| |
| Patricia B. Lippert (1953) | Assistant Vice President, T. Rowe Price and T. Rowe Price Investment |
| Secretary, Institutional Income Funds | Services, Inc. |
| |
| Paul M. Massaro, CFA (1975) | Vice President, T. Rowe Price and T. Rowe Price Group, Inc.; formerly stu- |
| Assistant Vice President, Institutional Income Funds | dent, The Wharton Business School, University of Pennsylvania (to 2003) |
| |
| Andrew McCormick (1960) | Vice President, T. Rowe Price and T. Rowe Price Group, Inc.; formerly |
| Vice President, Institutional Income Funds | Chief Investment Officer, IMPAC Mortgage Holdings (to 2006); Senior |
| | Portfolio Manager, Avenue Capital Group, and Senior Vice President, |
| | Portfolio Transactions, Federal National Mortgage Association (to 2005) |
| |
| Michael J. McGonigle (1966) | Vice President, T. Rowe Price and T. Rowe Price Group, Inc. |
| Vice President, Institutional Income Funds | |
| |
| David Oestreicher (1967) | Director and Vice President, T. Rowe Price Investment Services, Inc., |
| Vice President, Institutional Income Funds | and T. Rowe Price Trust Company; Vice President, T. Rowe Price, |
| | T. Rowe Price Global Asset Management Limited, T. Rowe Price Global |
| | Investment Services Limited, T. Rowe Price Group, Inc., and T. Rowe |
| | Price International, Inc. |
| |
| Brian A. Rubin, CPA (1974) | Vice President, T. Rowe Price and T. Rowe Price Trust Company |
| Assistant Vice President, Institutional Income Funds | |
| |
| Daniel O. Shackelford, CFA (1958) | Vice President, T. Rowe Price, T. Rowe Price Group, Inc., and T. Rowe Price |
| Vice President, Institutional Income Funds | Trust Company |
| |
| Walter P. Stuart III, CFA (1960) | Vice President, T. Rowe Price and T. Rowe Price Group, Inc. |
| Vice President, Institutional Income Funds | |
| |
| Thomas E. Tewksbury (1961) | Vice President, T. Rowe Price, T. Rowe Price Group, Inc., and T. Rowe Price |
| Vice President, Institutional Income Funds | Trust Company |
| |
| David A. Tiberii, CFA (1965) | Vice President, T. Rowe Price and T. Rowe Price Group, Inc. |
| Vice President, Institutional Income Funds | |
| |
| Mark J. Vaselkiv (1958) | Vice President, T. Rowe Price and T. Rowe Price Group, Inc. |
| Vice President, Institutional Income Funds | |
| |
| Julie L. Waples (1970) | Vice President, T. Rowe Price |
| Vice President, Institutional Income Funds | |
| |
| Thea N. Williams (1961) | Vice President, T. Rowe Price, T. Rowe Price Group, Inc., and T. Rowe Price |
| Vice President, Institutional Income Funds | Trust Company |
| |
| Unless otherwise noted, officers have been employees of T. Rowe Price or T. Rowe Price International for at least five years. |
Item 2. Code of Ethics.
The registrant has adopted a code of ethics, as defined in Item 2 of Form N-CSR, applicable to its principal executive officer, principal financial officer, principal accounting officer or controller, or persons performing similar functions. A copy of this code of ethics is filed as an exhibit to this Form N-CSR. No substantive amendments were approved or waivers were granted to this code of ethics during the period covered by this report.
Item 3. Audit Committee Financial Expert.
The registrant’s Board of Directors/Trustees has determined that Ms. Karen N. Horn qualifies as an audit committee financial expert, as defined in Item 3 of Form N-CSR. Ms. Horn is considered independent for purposes of Item 3 of Form N-CSR.
Item 4. Principal Accountant Fees and Services.
(a) – (d) Aggregate fees billed to the registrant for the last two fiscal years for professional services rendered by the registrant’s principal accountant were as follows:
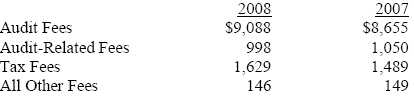
Audit fees include amounts related to the audit of the registrant’s annual financial statements and services normally provided by the accountant in connection with statutory and regulatory filings. Audit-related fees include amounts reasonably related to the performance of the audit of the registrant’s financial statements and specifically include the issuance of a report on internal controls and, if applicable, agreed-upon procedures related to fund acquisitions. Tax fees include amounts related to services for tax compliance, tax planning, and tax advice. The nature of these services specifically includes the review of distribution calculations and the preparation of Federal, state, and excise tax returns. All other fees include the registrant’s pro-rata share of amounts for agreed-upon procedures in conjunction with service contract approvals by the registrant’s Board of Directors/Trustees.
(e)(1) The registrant’s audit committee has adopted a policy whereby audit and non-audit services performed by the registrant’s principal accountant for the registrant, its investment adviser, and any entity controlling, controlled by, or under common control with the investment adviser that provides ongoing services to the registrant require pre-approval in advance at regularly scheduled audit committee meetings. If such a service is required between regularly scheduled audit committee meetings, pre-approval may be authorized by one audit committee member with ratification at the next scheduled audit committee meeting. Waiver of pre-approval for audit or non-audit services requiring fees of a de minimis amount is not permitted.
(2) No services included in (b) – (d) above were approved pursuant to paragraph (c)(7)(i)(C) of Rule 2-01 of Regulation S-X.
(f) Less than 50 percent of the hours expended on the principal accountant’s engagement to audit the registrant’s financial statements for the most recent fiscal year were attributed to work performed by persons other than the principal accountant’s full-time, permanent employees.
(g) The aggregate fees billed for the most recent fiscal year and the preceding fiscal year by the registrant’s principal accountant for non-audit services rendered to the registrant, its investment adviser, and any entity controlling, controlled by, or under common control with the investment adviser that provides ongoing services to the registrant were $1,529,000 and $1,201,000, respectively, and were less than the aggregate fees billed for those same periods by the registrant’s principal accountant for audit services rendered to the T. Rowe Price Funds.
(h) All non-audit services rendered in (g) above were pre-approved by the registrant’s audit committee. Accordingly, these services were considered by the registrant’s audit committee in maintaining the principal accountant’s independence.
Item 5. Audit Committee of Listed Registrants.
Not applicable.
Item 6. Investments.
(a) Not applicable. The complete schedule of investments is included in Item 1 of this Form N-CSR.
(b) Not applicable.
Item 7. Disclosure of Proxy Voting Policies and Procedures for Closed-End Management Investment Companies.
Not applicable.
Item 8. Portfolio Managers of Closed-End Management Investment Companies.
Not applicable.
Item 9. Purchases of Equity Securities by Closed-End Management Investment Company and Affiliated Purchasers.
Not applicable.
Item 10. Submission of Matters to a Vote of Security Holders.
Not applicable.
Item 11. Controls and Procedures.
(a) The registrant’s principal executive officer and principal financial officer have evaluated the registrant’s disclosure controls and procedures within 90 days of this filing and have concluded that the registrant’s disclosure controls and procedures were effective, as of that date, in ensuring that information required to be disclosed by the registrant in this Form N-CSR was recorded, processed, summarized, and reported timely.
(b) The registrant’s principal executive officer and principal financial officer are aware of no change in the registrant’s internal control over financial reporting that occurred during the registrant’s second fiscal quarter covered by this report that has materially affected, or is reasonably likely to materially affect, the registrant’s internal control over financial reporting.
Item 12. Exhibits.
(a)(1) The registrant’s code of ethics pursuant to Item 2 of Form N-CSR is attached.
(2) Separate certifications by the registrant's principal executive officer and principal financial officer, pursuant to Section 302 of the Sarbanes-Oxley Act of 2002 and required by Rule 30a-2(a) under the Investment Company Act of 1940, are attached.
(3) Written solicitation to repurchase securities issued by closed-end companies: not applicable.
(b) A certification by the registrant's principal executive officer and principal financial officer, pursuant to Section 906 of the Sarbanes-Oxley Act of 2002 and required by Rule 30a-2(b) under the Investment Company Act of 1940, is attached.
| | |
SIGNATURES |
| |
| | Pursuant to the requirements of the Securities Exchange Act of 1934 and the Investment |
| Company Act of 1940, the registrant has duly caused this report to be signed on its behalf by the |
| undersigned, thereunto duly authorized. |
| |
| T. Rowe Price Institutional Income Funds, Inc. |
| |
| |
| By | /s/ Edward C. Bernard |
| | Edward C. Bernard |
| | Principal Executive Officer |
| |
| Date | July 22, 2008 |
| |
| |
| |
| | Pursuant to the requirements of the Securities Exchange Act of 1934 and the Investment |
| Company Act of 1940, this report has been signed below by the following persons on behalf of |
| the registrant and in the capacities and on the dates indicated. |
| |
| |
| By | /s/ Edward C. Bernard |
| | Edward C. Bernard |
| | Principal Executive Officer |
| |
| Date | July 22, 2008 |
| |
| |
| |
| By | /s/ Gregory K. Hinkle |
| | Gregory K. Hinkle |
| | Principal Financial Officer |
| |
| Date | July 22, 2008 |