UNITED STATES
SECURITIES AND EXCHANGE COMMISSION
Washington, D.C. 20549
FORM N-CSR
CERTIFIED SHAREHOLDER REPORT OF REGISTERED MANAGEMENT
INVESTMENT COMPANIES
Investment Company Act file number 811-21113
Touchstone Institutional Funds Trust
(Exact name of registrant as specified in charter)
303 Broadway, Suite 1100
Cincinnati, Ohio 45202-4203
(Address of principal executive offices) (Zip code)
Jill T. McGruder
303 Broadway, Suite 1100
Cincinnati, Ohio 45202-4203
(Name and address of agent for service)
Registrant's telephone number, including area code:800-638-8194
Date of fiscal year end:December 31
Date of reporting period:December 31, 2019
Form N-CSR is to be used by management investment companies to file reports with the Commission not later than 10 days after the transmission to stockholders of any report that is required to be transmitted to stockholders under Rule 30e-1 under the Investment Company Act of 1940 (17 CFR 270.30e-1). The Commission may use the information provided on Form N-CSR in its regulatory, disclosure review, inspection, and policymaking roles.
A registrant is required to disclose the information specified by Form N-CSR, and the Commission will make this information public. A registrant is not required to respond to the collection of information contained in Form N-CSR unless the Form displays a currently valid Office of Management and Budget ("OMB") control number. Please direct comments concerning the accuracy of the information collection burden estimate and any suggestions for reducing the burden to Secretary, Securities and Exchange Commission, 450 Fifth Street, NW, Washington, DC 20549-0609. The OMB has reviewed this collection of information under the clearance requirements of 44 U.S.C. § 3507.
Item 1. Reports to Stockholders.
The Report to Shareholders is attached herewith.
December 31, 2019
Annual Report
| Touchstone Institutional Funds Trust |
| Touchstone Sands Capital Institutional Growth Fund |
IMPORTANT NOTE: Beginning on January 1, 2021, as permitted by regulations adopted by the Securities and Exchange Commission, paper copies of the Touchstone Funds’ annual and semi-annual shareholder reports will no longer be sent by mail, unless you specifically request paper copies of the shareholder reports from Touchstone Funds or from your financial intermediary, such as a broker-dealer or bank. Instead, annual and semi-annual shareholder reports will be available on the Touchstone Funds’ website (TouchstoneInvestments.com/Resources), and you will be notified by mail each time a report is posted and provided with a website link to access the report.
You may elect to receive all future annual and semi-annual shareholder reports in paper, free of charge. If you already elected to receive shareholder reports electronically, you will not be affected by this change and you need not take any action. To elect to receive paper copies of shareholder reports through the mail or otherwise change your delivery method, contact your financial intermediary or, if you hold your shares directly through Touchstone Funds, visit TouchstoneInvestments.com/Resources/Edelivery or call Touchstone Funds toll-free at 1.800.543.0407. Your election to receive shareholder reports in paper will apply to all Touchstone Funds that you hold through the financial intermediary, or directly with Touchstone.

Table of Contents
This report identifies the Fund's investments on December 31, 2019. These holdings are subject to change. Not all investments in the Fund performed the same, nor is there any guarantee that these investments will perform as well in the future. Market forecasts provided in this report may not occur.
2
Dear Shareholder:
We are pleased to provide you with the Touchstone Institutional Funds Trust Annual Report. Inside you will find key financial information, as well as the manager commentary for the Fund, for the 12 months ended December 31, 2019.
Over the course of 2019, global markets reacted strongly to trade-related rhetoric between the U.S. and China. By year end the U.S.-China trade rhetoric took a more constructive tone, culminating in an announcement of a Phase One Trade Agreement signed in early 2020 coinciding with a reduction in overall tariff levels. Aside from this key geopolitical event, the U.S. economy continued its steady pace, driven by strong employment data and solid consumer spending, offsetting some of the adverse impact from the aforementioned U.S.-China trade dispute on manufacturing and capital spending. Outside the U.S., economic growth in developed markets such as the U.K., European Union and Japan continued their slow pace, all while the central banks of each continued to maintain low-to-zero overnight interest rates. Joining the accommodative monetary policy stance of other developed market central banks, the U.S. Federal Reserve Board (Fed) reversed course from a tightening stance in 2018 to an accommodative one, cutting the overnight Fed Funds rate three times during the second half of 2019. Against this economic backdrop, U.S. equities recorded their best year since 2013. Outside of the U.S. and developed markets, emerging markets continued to show overall weakness, driven by the U.S.-China trade slowdown and lower-than-expected Indian economic growth.
The S&P 500® Index recorded a significant gain for the year, led by Information Technology stocks. Regardless of style and market capitalization, U.S. equity returns were strong for the calendar year. Nevertheless, U.S. growth stocks continued their dominance over value stocks in 2019, as has been the case through most of the post-Credit Crisis bull market. Despite large caps topping market returns for the year, mid-cap stocks notably held their own in 2019 as well.
Non-U.S. developed equity markets trailed the U.S. in 2019, but still posted solid returns for investors. Developed markets in Western Europe, namely the U.K., Switzerland, France and Germany, were aided by accommodative monetary policy and Brexit certainty following the December re-election of Boris Johnson as U.K. Prime Minister. Similar to the U.S., Information Technology stocks were leading contributors in developed markets along with Financials. In emerging markets, equities posted solid returns, boosted late in the year by the announcement of a U.S.-China trade accord.
Periods such as these remind us of the importance of the steady hands of financial professionals, trust in one’s investment strategy, and the risks that accompany trying to time the market. Furthermore, we believe that more volatile environments create more opportunity for active managers to add value, especially those that are Distinctively Active® with high active share.
We greatly value your continued support. Thank you for including Touchstone as part of your investment plan.
Sincerely,

Jill T. McGruder
President
Touchstone Institutional Funds Trust
3
Management's Discussion of Fund Performance(Unaudited)
Touchstone Sands Capital Institutional Growth Fund
Sub-Advised by Sands Capital Management, LLC
Investment Philosophy
The Touchstone Sands Capital Institutional Growth Fund seeks long-term capital appreciation.The Fund primarily invests in common stocks of large capitalization U.S. companies that are believed by Sands Capital Management, LLC (“Sands Capital”) to have above-average potential for revenue and earnings growth. The Fund typically invests in 25 to 35 companies. Sands Capital generally seeks to invest in stocks with sustainable above-average earnings growth and capital appreciation potential. In addition, Sands Capital looks for companies that have a significant competitive advantage, a leadership position or proprietary niche, a clear mission in an understandable business, financial strength and are valued rationally in relation to comparable companies, the market and the business prospects for that particular company.
Fund Performance
The Touchstone Sands Capital Institutional Growth Fund underperformed its benchmark, the Russell 1000® Growth Index, for the 12-month period ended December 31, 2019. The Fund’s total return was 32.92 percent while the total return of the benchmark was 36.39 percent.
Market Environment
The Russell 1000® Growth Index’s strong returns in 2019 reflected easing recession fears and underscored the strength of the U.S. economy. In fact, all the major domestic equity indices ended the year at or near all-time highs. The healthy returns of the equity market are supported by strong or stable economic activity including low unemployment, rising wages, and healthy consumer spending and business investments. The U.S. economy’s expansion makes it the longest on record in U.S. history, and many anticipate another year of solid fundamentals.
Portfolio Review
The largest contributors to relative investment results were ServiceNow Inc., Alibaba Group Holding Ltd., Visa Inc., CoStar Inc., and Match Group Inc. CoStar has continued to successfully drive user growth, market share gains, and improved monetization across its flagship data, analytics, and online marketing offerings for the U.S. commercial real estate industry. The company reported strong results, highlighted by acceleration in net new bookings and constructive forward-looking updates on near-term business momentum, as well as several medium- and long-term growth initiatives. We believe Apartments.com’s growing audience gap versus competition, combined with enthusiastic uptake of new ad formats, is driving much of the recent share price appreciation. The bookings strength flowed through to strong financial results with double-digit year-over-year revenue, earnings before interest, taxes, depreciation and amortization (EBITDA), and earnings per share (EPS) growth, as well as raised full-year guidance. Management expressed confidence in the company’s ability to scale its sales force and new bookings to support robust growth into 2020 and beyond. We believe CoStar has considerable runway still ahead of it to drive penetration, share gains, and monetization as it focuses on digitizing the commercial real estate industry.
Among the detractors from relative investment results were Abiomed Inc., Regeneron Pharmaceuticals Inc., BioMarin Pharmaceutical Inc., Twilio Inc., Sea Ltd. and Texas Instruments Inc. Texas Instruments reported worse than expected results, with revenues and EPS each declining , and management providing guidance for a revenue decline in the fourth quarter. The third quarter marked the fourth consecutive quarter of earnings decline on a year-over-year basis. In looking at Texas Instruments’ 30-year history, semiconductor cycles can vary, but down cycles typically last four to five quarters before returning to growth. However, this current down
4
Management's Discussion of Fund Performance(Unaudited) (Continued)
cycle may persist longer due to macro weakness and uncertainty among the company’s end markets, particularly communication equipment, industrial, automotive, and personal electronics.
Despite the quarterly results, Texas Instruments continued to focus on free cash flow (FCF) generation and returning cash to shareholders. Even with the quarterly revenue and EPS decline, the company increased FCF/share. During the trailing 12 months, the company returned $7.4 billion of cash to shareholders through a combination of dividends and stock repurchases. We believe this FCF strength underlines the quality of Texas Instruments’ competitive moat, particularly its pricing power. While this semiconductor down cycle is expected to last longer than most previous cycles, there is no change in our view on the quality of and long-term opportunity for the business. Despite the cyclical nature of the semiconductor space, we believe Texas Instruments’ growth is tied to some of the most powerful long-term secular trends, including factory automation, smart buildings, and advanced driver-assistance systems. Meanwhile, a significant portion of its business is exposed to more stable/established spaces such as aerospace, medical, and vehicle lighting.
During the year, the Fund purchased Twilio Inc., Intuit Inc., Zoetis Inc., Mirati Therapeutics Inc., Microsoft Corp., Texas Instruments Inc., and Sea Ltd.
Twilio Inc. is a leading software-enabled communication platform that allows app developers to integrate critical features such as voice, messaging, and video with relative ease. Many mobile users benefit from Twilio’s solution daily without even knowing. For example, Twilio enables the functionality to call an Uber from a proxy number, receive a text notification when a package is delivered, or receive confirmation texts when a person pays a bill or makes a reservation. While these features are ubiquitous and seem simple, the ability to build these functions within an app is challenging to accomplish seamlessly at scale. Twilio has essentially removed the underlying complexity for app developers by creating a software that leverages the worldwide carrier networks and packaging it into a single line of code that can be integrated into an app. We believe Twilio’s innovation comes at a critical time, as businesses of all sizes are embracing digital transformation, and mobile and internet usage continue to proliferate. We believe that the modernization of the communication capabilities is a $1.5 trillion market, and it remains in the early innings in terms of total users, volume, and breadth of offerings. Twilio is the clear leader in this large and growing market, in our view, which should allow it to grow at above-average rates over the long term.
Intuit Inc. is a leading provider of financial software for small businesses, individuals, and tax professionals. The company sells two core products: QuickBooks (accounting software for small businesses) and TurboTax (personal tax preparation software). Both are dominant within their respective categories, with approximately 90 percent market share for QuickBooks and 60 percent of U.S. tax filings for TurboTax. Intuit also provides payroll and payment processing software for small businesses. We believe these offerings will be important growth drivers going forward, as small businesses continue to replace manual, paper-based processes with digital solutions. QuickBooks is also in the midst of transitioning from desktop software to a cloud-based, software-as-a-service (SaaS) model, which we believe should enable the company to further penetrate and improve monetization in existing markets, as well as open new growth channels and geographies. Furthermore, we believe the transition to a SaaS model will lead to strong recurring revenue streams, greater pricing power, and higher margins over time, as software businesses tend to have low incremental costs.
Zoetis Inc. is a leader in the development, manufacture, and commercialization of animal health medicines for livestock and companion animals. The company’s business is broad-based, with more than 300 product lines across eight core species and five therapeutic categories. Zoetis is the dominant market share leader (based on revenues) in a consolidated industry, enabling it to drive revenue growth through its exposure to durable secular trends, including rising demand for diets that include animal proteins, growing needs to improve livestock productivity, and increasing ownership and spending on companion animals. We believe the diversified nature of the company’s portfolio will support stable growth over the long term. Further enhancing the industry’s
5
Management's Discussion of Fund Performance(Unaudited) (Continued)
attractiveness is the fact that animal health has less exposure to government reimbursement pressure and generic competition relative to human health products. As the only independent, large-scale animal health company, we believe Zoetis has several competitive advantages, including increased management focus, optimized capital allocation, strategic flexibility, a dedicated direct salesforce, and deep research and development capabilities. Over the next five years, we believe Zoetis will grow revenues in the high-single digits, with possible upside from its deep product pipeline, potential geographic expansion, and/or targeted acquisitions. Together with ongoing cost-reduction initiatives, we believe the company can ultimately achieve mid-teens earnings growth.
Mirati Therapeutics Inc. is an emerging leader in the development of genetically targeted cancer therapies. The company develops drugs that selectively target specific mutations in genetically driven cancers. Today Mirati has two clinical-stage assets with a combined potential addressable market of nearly $10 billion. The largest opportunity is MRTX849, which targets the KRAS G12C mutation found in many cancers. Researchers often refer to KRAS as the “Holy Grail” of cancer targets, given the number of affected patients and the high unmet need. Many drugs targeting comparable driver mutations in lung cancer have been successful, creating a set of precedents that provide us with confidence in the ultimate approval and commercialization of MRTX849. Beyond MRTX849, Mirati’s drug sitravatinib is undergoing Phase 3 trials. The drug’s encouraging Phase 2 data gives us confidence that it will succeed in its pivotal trial, potentially unlocking an additional $1 billion in revenue. Beyond these two opportunities, we believe Mirati’s earlier-stage work focuses on other targets with high unmet need and adds significant upside potential.
Microsoft Corp. is a leading global software business. Nearly every enterprise in the world uses Microsoft products, positioning the company to sell next-generation cloud services into a massive, global installed base. Over the last several years, the business has pivoted from a focus on Windows to a focus on cloud computing, built on its Azure cloud service. Office 365 is a leading cloud application software business, while Azure is the world’s second-largest infrastructure-as-a-service and platform-as-a-service business by revenue (after Amazon Web Services). We believe Office’s move to the cloud should allow Microsoft to capture more value from each user, while also unlocking new growth via market expansion and faster product innovation. In our view, Azure should benefit from enterprises shifting on-premises IT workloads to the cloud. We believe Office 365 and Azure are the keys to our investment case, but profit stability from legacy business lines (e.g., Windows for personal computers) and upside potential from newer business lines (e.g., LinkedIn) should support durable growth over the long term.
Texas Instruments Inc. is the leading manufacturer of analog semiconductors by market share. We view analog as one of the most attractive segments of the semiconductor industry for several reasons, including long product life cycles, low capital intensity, and single sourcing. Within this segment, Texas Instruments is over twice as large as its next competitor. We also believe that, in addition to its scale advantages, its product catalog (the industry’s largest), distribution capabilities, and low manufacturing costs are key competitive differentiators. Over our investment horizon, we believe steady, long-duration revenue growth and modest margin expansion, will result in sustainable earnings improvement. The company has revenue exposure to some of technology’s fastest-growing areas—including factory automation, smart buildings, and advanced driver-assistance systems—and is bolstered by its exposure to more stable areas, including aerospace, medical, and vehicle lighting. We believe growth in the high-margin industrial and automotive segments, along with increased 300mm wafer production, should support overall margin expansion for Texas Instrument.
Sea Ltd. is a leading internet company in Southeast Asia that operates Garena, a popular video game publishing platform, and Shopee, an emerging ecommerce platform. The region benefits from several secular trends—including rising consumer wealth, ecommerce adoption, and gaming engagement—that we believe will support strong growth for Sea’s core businesses. Garena is the region’s top game publisher in terms of revenue and user base, with exclusive regional distribution rights for several popular titles. Garena is also the leading regional advocate and organizer of eSports—large organized gaming competitions—which are experiencing rapid traction globally.
6
Management's Discussion of Fund Performance(Unaudited) (Continued)
In addition to Garena, Shopee provides an additional long-term growth opportunity. Shopee has become one of Southeast Asia’s largest ecommerce platforms in terms of gross merchandise volume and has taken a leadership position in several high-margin and fast-growing categories.
During the 12-month period, the Fund sold Loxo Oncology Inc., Booking Holdings Inc., Alexion Pharmaceuticals Inc. Splunk Inc., Regeneron Pharmaceuticals Inc., Palo Alto Networks Inc., and BioMarin Pharmaceutical Inc.
Loxo Oncology Inc. was sold after Eli Lilly announced it will acquire the business for approximately $8 billion. This represents a significant premium to the prior market value. Beyond the numbers, this acquisition validated our initial view on the business, the management team, and the long-term opportunity for LOXO-292 in cancers with rearranged during transfection (RET) mutations. Our view of this program diverged substantially from the consensus view of the market when we initiated the Fund’s position in Loxo. We believe this deal will significantly improve the lives of many patients. Eli Lilly already has a significant presence in the targeted oncology space, especially in the lung cancer arena, where many patients with RET mutations will be found. Closing this gap has been a prime driver of Loxo’s success, in our view.
Booking Holdings Inc. was sold in the first quarter. Due to the compelling value proposition and lack of friction with online hotel bookings, competition increased, and the penetration of online hotel bookings is now greater than other internet categories, such as advertising or ecommerce. This resulted in a natural growth deceleration for Booking, and the company entering a more mature stage of its growth lifecycle.
Alexion Pharmaceuticals Inc., a leading developer of biological treatments for rare diseases, was sold during the period. The business continued to perform well, led by its blockbuster Soliris franchise. It also continued to invest in credible initiatives, including improvements to its complement disease franchise and broader pipeline expansion. However, we believe growth will decelerate as the business naturally matures in the coming years. Soliris’s core indications, which account for the bulk of Alexion’s revenue, have already slowed to single-digit growth rates. While newer Soliris indications and other drugs are growing faster, they account for less than 20 percent of Alexion’s overall revenue, and will likely decelerate in the coming years as these newer markets become more penetrated. Not uncommon in the biopharmaceutical industry, Alexion is becoming a victim of its own success, with its large existing revenue base overwhelming the potential impact from newer drugs and indications. We continued to view Alexion favorably, but decided to reinvest in earlier-stage businesses we believe have higher growth and value-creation potential.
Splunk Inc. was sold in the second quarter. Splunk’s software collects and analyzes machine-generated data, with a number of use cases across a variety of industries. We continued to favorably view the business and its earnings potential. However, we believe it is the weakest criteria fit among the Fund’s existing software holdings. Including Splunk, the Fund owned 10 software businesses, accounting for a significant portion of the Fund’s portfolio. This sale will provide us with the flexibility to opportunistically add to our existing software holdings, or to potentially accommodate new businesses.
Regeneron Pharmaceuticals Inc. was sold during the period. The business remains one of the world’s strongest research franchises, in our view, and has produced major blockbuster drugs during the Fund’s ownership. However, we no longer believe it fits within the highly concentrated portfolio. We believe its growth will decelerate as the business naturally matures in the coming years. As drug companies get larger, it becomes increasingly difficult for them to grow, because the large existing revenue base overwhelms the potential impact of new drugs and indications. We continued to view Regeneron favorably, but believe there are other businesses that are better fits with our investment criteria.
Palo Alto Networks Inc. was sold during the period. We continued to believe Palo Alto Networks is a good business with long-term growth opportunities. The next generation cloud business appears to be well positioned
7
Management's Discussion of Fund Performance(Unaudited) (Continued)
to drive growth, but the traditional firewall business has been facing more operational challenges. Execution challenges have also become a broader concern over the last 18 months. These challenges include management turnover, uncertainty from channel partners, changes to compensation plans, and increasing acquisition activity. In weighing the risk-reward profile against opportunities in cloud software, we believe there are other higher quality businesses that better fit our investment criteria.
BioMarin Pharmaceutical Inc., a leading developer of biologic and gene-therapy treatments for genetic rare diseases, was sold during the period. Clinical data for the company’s next material growth driver—a gene therapy in hemophilia A—turned out noisier than we anticipated, and will likely take longer to create value than initially expected. We still see meaningful value in BioMarin’s new drug pipeline, which includes treatments for achondroplasia (genetic dwarfism) and phenylketonuria (a genetic neurological disorder), but we also believe there will be increased competition, as there are now more companies developing therapies in these disease indications. In addition to these fundamental issues that are weakening BioMarin’s fit with our criteria, the business will also likely contend with the political overhang on the biopharmaceutical sector, which we believe will persist for some time. While innovative rare-disease companies like BioMarin are less vulnerable to political scrutiny and pricing pressure than other biopharma businesses, they are still likely susceptible to price-to-earnings (P/E) multiple compression.
Outlook
We view secular trends, innovation, and company-specific competitive advantages as key to driving growth through a variety of economic environments. For a business to possess the above-average earnings growth potential we require, it is often a key innovator or vital facilitator within an attractive industry that is benefiting from positive secular change. Secular trends are distinct from short-term economic factors as they tend to persist through market cycles and can provide powerful structural tailwinds that enhance the sustainability of a business’s growth for many years. We believe our long-term investment horizon allows us to capture the benefit of these characteristics and realize the ultimate earnings power of a company, while weathering volatility over shorter periods. Furthermore, our approach—active, concentrated, and benchmark-agnostic—enables us to have outsized exposure to companies within this sphere that we believe are the best fits with our six investment criteria.
We believe the majority of businesses in the Fund’s portfolio benefit from one or more secular trends. However, we have identified four broad trends that together comprise a majority of the portfolio:
| • | Retail Revolution: Ecommerce - Ecommerce is the fastest growing segment of retail sales, but only accounts for about seven percent of the total worldwide retail market. Brands now can directly interact with consumers through novel mediums, such as social media and lifestyle apps, and become embedded in their daily routines. Tools such as Amazon Prime and Visa Checkout reduce the friction associated with online payment. |
| • | Union of Healthcare and Technology - Major areas of unmet need continue to exist in the treatment of disease. However, improved understanding of disease biology and new approaches to treatment are enabling more productive drug development. Additionally, we believe genomic sequencing and health care information systems will facilitate precision medicine, enabling physicians to provide more targeted care. We are also witnessing the rise of minimally invasive surgical technologies, which have quality of life advantages for the patient and efficiency benefits for providers, leading them to increasingly become the standard of care. |
| • | Software-as-a-Service (SaaS) - In our view, information technology spending is shifting toward innovations that make enterprises more agile and efficient. Cloud-based software is a key facilitator of this shift. Fast deployment, scalability, easy and frequent updates, and lower total cost of ownership create a compelling customer value proposition. SaaS businesses tend to benefit from revenue visibility, “sticky” clientele, margin leverage opportunities, and low customer acquisition costs. |
8
Management's Discussion of Fund Performance(Unaudited) (Continued)
| • | Data-Driven Decision Making - We believe companies with large, proprietary pools of consumer data and tools that use this data to create unique content have sizable monetization opportunities. Advertising is already well on its way toward transformation, as access to consumer data is enabling companies to create targeted, more effective ads. At the micro level, companies are beginning to use predictive analytics to generate insights from their own pools of data. |
In a volatile market, stock prices tend to move in tandem, which can result in a disconnection between valuations and long-term growth prospects. When volatility is driven by fear, investors’ time horizons tend to shorten, and fast-growing, disruptive companies that are investing in their growth, and therefore unlikely to realize their full potential for years (i.e., the kinds of businesses we seek to own), often suffer from outsized pressure. During these periods, some investors appear inclined to trade a potentially larger long-term total return for the near-term surety of stable cash flows, dividends, and/or lower, more secure growth. Drug pipelines, potential new products, and other types of future optionality are often ignored. A company that is under-earning its full potential today in order to become larger tomorrow can suddenly be viewed as less valuable than one that is growing more slowly, further along the maturity curve, and not investing in its own growth.
We believe the Fund owns companies that are positioned to deliver strong business results and earnings growth over our five- to ten-year investment horizon. Our focus on the sustainability of a business’s future earnings growth typically steers us toward companies we believe are benefiting from secular trends that should provide powerful growth tailwinds throughout economic cycles. We have high conviction in the long-term growth estimates for the Fund’s portfolio companies.
The Fund’s positioning is a byproduct of our bottom-up, fundamental approach. Our six investment criteria typically lead us to innovative businesses that are creating new or disrupting existing markets, and/or benefiting from powerful secular tailwinds. Our approach to investment research, portfolio construction, and risk management results in a portfolio that we believe is naturally diversified across industries and businesses at different stages of their respective growth lifecycles. We believe the Fund will continue to have higher weights in key growth sectors, including Consumer, Life Sciences, and Information Technology, and lower weights in highly-cyclical sectors such as Energy, Industrials, and Financials.
9
Management's Discussion of Fund Performance(Unaudited) (Continued)
Comparison of the Change in Value of a $500,000 Investment in the Touchstone Sands Capital Institutional Growth Fund and the Russell 1000®Growth Index
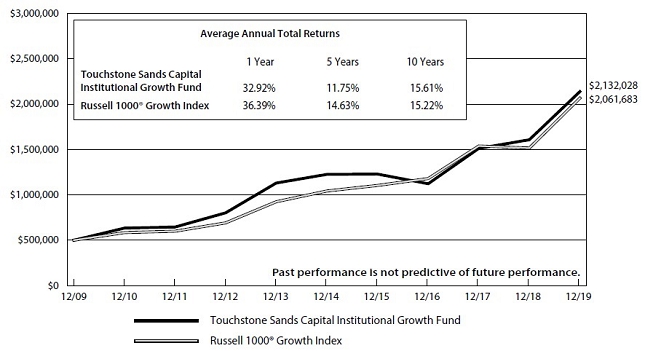
The performance of the Fund does not reflect the deduction of taxes that a shareholder would pay on Fund distributions or the redemption of Fund shares.
The inception date of the Fund was January 21, 2005.
Note to Chart
Russell 1000® Growth Index measures the performance of those Russell 1000 companies with higher price-to-book ratios and higher forecasted growth values.
The Frank Russell Company (FRC) is the source and owner of the Index data contained or reflected in this material and all trademarks and copyrights related thereto. The material may contain confidential information and unauthorized use, disclosure, copying, dissemination or redistribution is strictly prohibited. This is a Touchstone Investments presentation of the data, and FRC is not responsible for the formatting or configuration of this material or for any inaccuracy in the presentation thereof.
10
Tabular Presentation of Portfolio of Investments(Unaudited)
December 31, 2019
The table below provides the Fund’s sector allocation. We hope it will be useful to shareholders as it summarizes key information about the Fund’s investments.
| Touchstone Sands Capital Institutional Growth | ||||
| Sector Allocation* | (% of Net Assets) | |||
| Information Technology | 36.5 | % | ||
| Communication Services | 21.2 | |||
| Health Care | 17.0 | |||
| Consumer Discretionary | 13.6 | |||
| Industrials | 4.5 | |||
| Consumer Staples | 2.7 | |||
| Short-Term InvestmentFunds | 9.9 | |||
| Other Assets/Liabilities (Net) | (5.4 | ) | ||
| Total | 100.0 | % | ||
* Sector Classifications are based upon the Global Industry Classification Standard (GICS®).
11
Touchstone Sands Capital Institutional Growth Fund –December 31, 2019
| Market | ||||||||
| Shares | Value | |||||||
| Common Stocks — 95.5% | ||||||||
| Information Technology — 36.5% | ||||||||
| Adobe, Inc.* | 259,585 | $ | 85,613,729 | |||||
| Atlassian Corp. PLC (Australia) - Class A* | 180,143 | 21,678,409 | ||||||
| Intuit, Inc. | 267,598 | 70,091,944 | ||||||
| Microsoft Corp. | 454,748 | 71,713,760 | ||||||
| salesforce.com, Inc.* | 371,682 | 60,450,360 | ||||||
| ServiceNow, Inc.* | 433,193 | 122,299,048 | ||||||
| Texas Instruments, Inc. | 350,196 | 44,926,645 | ||||||
| Twilio, Inc. - Class A* | 202,528 | 19,904,452 | ||||||
| Visa, Inc. - Class A | 875,879 | 164,577,664 | ||||||
| Workday, Inc. - Class A* | 174,879 | 28,758,851 | ||||||
| 690,014,862 | ||||||||
| Communication Services — 21.2% | ||||||||
| Activision Blizzard, Inc. | 560,430 | 33,300,751 | ||||||
| Alphabet, Inc. - Class A* | 71,344 | 95,557,440 | ||||||
| Facebook, Inc. - Class A* | 380,144 | 78,024,556 | ||||||
| Match Group, Inc.*† | 1,192,423 | 97,909,852 | ||||||
| Netflix, Inc.* | 265,189 | 85,807,205 | ||||||
| Sea Ltd. (Singapore) ADR*† | 250,882 | 10,090,474 | ||||||
| 400,690,278 | ||||||||
| Health Care — 17.0% | ||||||||
| ABIOMED, Inc.* | 99,270 | 16,934,469 | ||||||
| Align Technology, Inc.* | 164,523 | 45,908,498 | ||||||
| Edwards Lifesciences Corp.* | 318,532 | 74,310,330 | ||||||
| Illumina, Inc.* | 201,924 | 66,986,268 | ||||||
| Mirati Therapeutics, Inc.* | 182,308 | 23,492,209 | ||||||
| Sarepta Therapeutics, Inc.* | 231,328 | 29,850,565 | ||||||
| Zoetis, Inc. | 486,636 | 64,406,275 | ||||||
| 321,888,614 | ||||||||
| Consumer Discretionary — 13.6% | ||||||||
| Alibaba Group Holding Ltd. | ||||||||
| (China) ADR* | 374,920 | 79,520,532 | ||||||
| Amazon.com, Inc.* | 73,266 | 135,383,845 | ||||||
| Floor & Decor Holdings, Inc. - Class A* | 827,346 | 42,037,450 | ||||||
| 256,941,827 | ||||||||
| Industrials — 4.5% | ||||||||
| CoStar Group, Inc.* | 141,936 | 84,920,309 | ||||||
| Consumer Staples — 2.7% | ||||||||
| Monster Beverage Corp.* | 799,852 | 50,830,595 | ||||||
| Total Common Stocks | $ | 1,805,286,485 | ||||||
| Short-Term Investment Funds — 9.9% | ||||||||
| Dreyfus Government Cash Management, Institutional Shares,1.51%¥W | 89,565,300 | $ | 89,565,300 | |||||
| Invesco Government & AgencyPortfolio, Institutional Class, 1.50%**¥W | 97,704,300 | 97,704,300 | ||||||
| Total Short-Term Investment Funds | $ | 187,269,600 | ||||||
| Total Investment Securities —105.4% | ||||||||
| (Cost $1,109,870,312) | $ | 1,992,556,085 | ||||||
| Liabilities in Excess of Other Assets — (5.4%) | (102,081,253 | ) | ||||||
| Net Assets — 100.0% | $ | 1,890,474,832 | ||||||
| * Non-income producing security. | |||||||
| ** Represents collateral for securities loaned. | |||||||
| † All or a portion of the security is on loan. The total market value of the securities on loan as of December 31, 2019 was $94,771,239. | |||||||
| ¥ Open-End Fund. | |||||||
| W Represents the 7-day SEC yield as of December 31, 2019. | |||||||
| Portfolio Abbreviations: | |||||||
| ADR - American Depositary Receipt | |||||||
| PLC - Public Limited Company | |||||||
Other Information:
The inputs or methodology used for valuing securities may not be an indication of the risk associated with investing in those securities. For more information on valuation inputs, and their aggregation into the levels used in the table below, please refer to the security valuation section in the accompanying Notes to Financial Statements.
| Valuation Inputs at Reporting Date: | ||||||||||||||||
| Description | Level 1 | Level 2 | Level 3 | Total | ||||||||||||
| Common Stocks | $ | 1,805,286,485 | $ | — | $ | — | $ | 1,805,286,485 | ||||||||
| Short-Term Investment Funds | 187,269,600 | — | — | 187,269,600 | ||||||||||||
| Total | $ | 1,992,556,085 | $ | — | $ | — | $ | 1,992,556,085 | ||||||||
See accompanying Notes to Financial Statements.
12
Statement of Assets and Liabilities
December 31, 2019
| Touchstone | ||||
| Sands Capital | ||||
| Institutional | ||||
| Growth | ||||
| Fund | ||||
| Assets | ||||
| Investments, at cost | $ | 1,109,870,312 | ||
| Investments, at market value(A) | $ | 1,992,556,085 | ||
| Cash | 166 | |||
| Receivable for capital shares sold | 2,702,948 | |||
| Securities lending income receivable | 175,840 | |||
| Other assets | 52,284 | |||
| Total Assets | 1,995,487,323 | |||
| Liabilities | ||||
| Payable for return of collateral for securities on loan | 97,704,300 | |||
| Payable for capital shares redeemed | 5,950,264 | |||
| Payable to Advisor | 1,239,752 | |||
| Other accrued expenses and liabilities | 118,175 | |||
| Total Liabilities | 105,012,491 | |||
| Net Assets | $ | 1,890,474,832 | ||
| Net assets consist of: | ||||
| Paid-in capital | $ | 961,833,432 | ||
| Distributable earnings (deficit) | 928,641,400 | |||
| Net assets | $ | 1,890,474,832 | ||
| Shares of beneficial interest outstanding (unlimited number of shares authorized, no par value) | 84,654,395 | |||
| Net asset value, offering price and redemption price per share | $ | 22.33 | ||
| (A) Includes market value of securities on loan of: | $ | 94,771,239 | ||
See accompanying Notes to Financial Statements.
13
For the Year Ended December 31, 2019
| Touchstone | ||||
| Sands Capital | ||||
| Institutional | ||||
| Growth | ||||
| Fund | ||||
| Investment Income | ||||
| Dividends(A) | $ | 3,546,644 | ||
| Interest | 25,766 | |||
| Income from securities loaned | 666,050 | |||
| Total Investment Income | 4,238,460 | |||
| Expenses | ||||
| Unified management fee | 14,580,394 | |||
| Registration fees | 55,468 | |||
| Other expenses | 455,589 | |||
| Total Expenses | 15,091,451 | |||
| Net Investment Loss | (10,852,991 | ) | ||
| Realized and Unrealized Gains (Losses) on Investments | ||||
| Net realized gains on investments(B) | 345,934,730 | |||
| Net change in unrealized appreciation (depreciation) on investments | 173,493,229 | |||
| Net Realized and Unrealized Gains (Losses) on Investments | 519,427,959 | |||
| Change in Net Assets Resulting from Operations | $ | 508,574,968 | ||
| (A) Net of foreign tax withholding of: | $ | 15,416 | ||
| (B) The Fund had redemptions-in-kind of securities in the amount of $169,072,941. Net realized gains on investments includes the realized gain on the transactions of $96,808,896 which will not be realized by the Fund for tax purposes. | ||||
See accompanying Notes to Financial Statements.
14
Statements of Changes in Net Assets
| Touchstone | ||||||||
| Sands Capital | ||||||||
| Institutional | ||||||||
| Growth | ||||||||
| Fund | ||||||||
| For the | For the | |||||||
| Year | Year | |||||||
| Ended | Ended | |||||||
| December 31, | December 31, | |||||||
| 2019 | 2018 | |||||||
| From Operations | ||||||||
| Net investment loss | $ | (10,852,991 | ) | $ | (12,165,054 | ) | ||
| Net realized gains on investments | 345,934,730 | 372,604,702 | ||||||
| Net change in unrealized appreciation (depreciation) on investments | 173,493,229 | (212,417,981 | ) | |||||
| Change in Net Assets from Operations | 508,574,968 | 148,021,667 | ||||||
| Distributed earnings | (211,596,989 | ) | (235,222,799 | ) | ||||
| Share Transactions | ||||||||
| Proceeds from shares sold | 393,630,348 | 370,020,395 | ||||||
| Reinvestment of distributions | 201,963,371 | 222,870,998 | ||||||
| Cost of shares redeemed | (583,686,291 | ) | (755,384,421 | ) | ||||
| Change in Net Assets from Share Transactions | 11,907,428 | (162,493,028 | ) | |||||
| Total Increase (Decrease) in Net Assets | 308,885,407 | (249,694,160 | ) | |||||
| Net Assets | ||||||||
| Beginning of period | 1,581,589,425 | 1,831,283,585 | ||||||
| End of period | $ | 1,890,474,832 | $ | 1,581,589,425 | ||||
| Share Transactions | ||||||||
| Shares issued | 17,242,347 | 16,060,365 | ||||||
| Shares reinvested | 9,477,399 | 11,044,152 | ||||||
| Shares redeemed | (25,536,605 | ) | (32,637,642 | ) | ||||
| Change in Shares Outstanding | 1,183,141 | (5,533,125 | ) | |||||
See accompanying Notes to Financial Statements.
15
Touchstone Sands Capital Institutional Growth Fund
Selected Data for a Share Outstanding Throughout Each Period
| Year Ended December 31, | ||||||||||||||||||||
| 2019 | 2018 | 2017 | 2016 | 2015 | ||||||||||||||||
| Net asset value at beginning of period | $ | 18.95 | $ | 20.58 | $ | 18.30 | $ | 21.18 | $ | 22.25 | ||||||||||
| Income (loss) from investment operations: | ||||||||||||||||||||
| Net investment loss | (0.13 | ) | (0.15 | ) | (0.13 | ) | (0.12 | ) | (0.09 | ) | ||||||||||
| Net realized and unrealized gains (losses) on investments | 6.24 | 1.63 | 6.49 | (1.69 | ) | 0.13 | ||||||||||||||
| Total from investment operations | 6.11 | 1.48 | 6.36 | (1.81 | ) | 0.04 | ||||||||||||||
| Distributions from: | ||||||||||||||||||||
| Realized capital gains | (2.73 | ) | (3.11 | ) | (4.08 | ) | (1.07 | ) | (1.11 | ) | ||||||||||
| Net asset value at end of period | $ | 22.33 | $ | 18.95 | $ | 20.58 | $ | 18.30 | $ | 21.18 | ||||||||||
| Total return | 32.92 | % | 6.27 | % | 34.74 | % | (8.65 | %) | 0.22 | % | ||||||||||
| Net assets at end of period (000's) | $ | 1,890,475 | $ | 1,581,589 | $ | 1,831,284 | $ | 2,093,949 | $ | 3,366,892 | ||||||||||
| Ratio to average net assets: | ||||||||||||||||||||
| Net expenses (including liquidityprovider expenses)(A) | 0.81 | % | 0.80 | % | 0.80 | % | 0.79 | % | 0.79 | % | ||||||||||
| Gross expenses (including liquidityprovider expenses)(A) | 0.81 | % | 0.80 | % | 0.80 | % | 0.79 | % | 0.79 | % | ||||||||||
| Net investment loss | (0.58 | %) | (0.63 | %) | (0.54 | %) | (0.54 | %) | (0.37 | %) | ||||||||||
| Portfolio turnover rate | 25 | %(B) | 22 | %(B) | 20 | %(B) | 40 | % | 33 | % | ||||||||||
| (A) | The ratio of net and gross expenses to average net assets excluding liquidity provider expenses was 0.79% for the years ended December 31, 2019, 2018 and 2017. There were no liquidity provider expenses prior to 2017. | |
| (B) | Portfolio turnover excludes securities delivered from processing redemptions-in-kind. |
See accompanying Notes to Financial Statements.
16
December 31, 2019
1. Organization
The Touchstone Institutional Funds Trust (the “Trust”) is registered under the Investment Company Act of 1940, as amended (the “1940 Act”), as an open-end management investment company. The Trust was established as a Delaware statutory trust pursuant to an Agreement and Declaration of Trust dated May 30, 2002. The Trust consists of one fund, the Touchstone Sands Capital Institutional Growth Fund (“Sands Capital Institutional Growth Fund” or the “Fund”), which is an open-end, non-diversified management investment company.
The Agreement and Declaration of Trust permits the Trust to issue an unlimited number of shares of beneficial interest of the Fund. The Fund offers a single class of shares. The Fund’s prospectus provides a description of the Fund’s investment goal, policies, and strategies along with information on the class of shares currently being offered.
2. Significant Accounting Policies
The following is a summary of the Fund’s significant accounting policies:
The Fund is an investment company that follows the accounting and reporting guidance of Accounting Standards Codification Topic 946 applicable to investment companies.
Security valuation and fair value measurements —U.S. generally accepted accounting principles (“U.S. GAAP”) define fair value as the price the Fund would receive to sell an asset or pay to transfer a liability in an orderly transaction between market participants at the measurement date. All investments in securities are recorded at their fair value. The Fund defines the term “market value”, as used throughout this report, as the estimated fair value. The Fund uses various methods to measure fair value of its portfolio securities on a recurring basis. U.S. GAAP fair value measurement standards require disclosure of a hierarchy that prioritizes inputs to valuation methods. These inputs are summarized in the three broad levels listed below:
| • | Level 1 – quoted prices in active markets for identical securities |
| • | Level 2 – other significant observable inputs (including quoted prices for similar securities, interest rates, prepayment speeds, credit risk, etc.) |
| • | Level 3 – significant unobservable inputs (including a Fund’s own assumptions in determining the fair value of investments) |
The inputs or methodology used for valuing securities are not necessarily an indication of the risk associated with investing in those securities.
The aggregate value by input level, as of December 31, 2019, for the Fund’s investments is included in the Fund’s Portfolio of Investments, which also includes a breakdown of the Fund’s investments by sector allocation. The Fund did not hold or transfer any Level 3 categorized securities during the year ended December 31, 2019.
Changes in valuation techniques may result in transfers into or out of an investment’s assigned level within the hierarchy.
The Fund’s portfolio securities are valued as of the close of the regular session of trading on the New York Stock Exchange (“NYSE”) (currently 4:00 p.m., Eastern time or at the time as of which the NYSE establishes official closing prices). Portfolio securities traded on stock exchanges are valued at the last reported sale price, official close price, or last bid price if no sales are reported. Portfolio securities quoted by NASDAQ are valued at the NASDAQ Official Closing Price (“NOCP”) or from the primary exchange on which the security trades. To the extent these securities are actively traded, they are categorized in Level 1 of the fair value hierarchy. Shares of mutual funds in which the Fund invests are valued at their respective net asset value (“NAV”) as reported by the underlying funds (the “Underlying Funds”) and are categorized in Level 1.
17
Notes to Financial Statements(Continued)
Securities mainly traded on a non-U.S. exchange or denominated in foreign currencies are generally valued according to the preceding closing values on that exchange, translated to U.S. dollars using currency exchange rates as of the close of regular trading on the NYSE, and are generally categorized in Level 1. However, if an event that may change the value of a security occurs after the time that the closing value on the non-U.S. exchange was determined, but before the close of regular trading on the NYSE, the security may be priced based on fair value and is generally categorized in Level 2. This may cause the value of the security, if held on the books of the Fund, to be different from the closing value on the non-U.S. exchange and may affect the calculation of the Fund’s NAV. The Fund may use fair value pricing under the following circumstances, among others:
| • | If the value of a security has been materially affected by events occurring before the Fund’s pricing time but after the close of the primary markets on which the security is traded. |
| • | If the exchange on which a portfolio security is principally traded closes early or if trading in a particular portfolio security was halted during the day and did not resume prior to the Fund’s NAV calculation. |
| • | If a security is so thinly traded that reliable market quotations are unavailable due to infrequent trading. |
| • | If the validity of market quotations is not reliable. |
Securities held by the Fund that do not have readily available market quotations, significant observable inputs, or securities for which the available market quotations are not reliable, are priced at their estimated fair value using procedures approved by the Fund’s Board of Trustees (the “Board”) and are generally categorized in Level 3.
Investment companies —The Fund may invest in securities of other investment companies, including exchange-traded funds (“ETFs”), open-end funds and closed-end funds. Open-end funds are investment companies that issue new shares continuously and redeem shares daily. Closed-end funds are investment companies that typically issue a fixed number of shares that trade on a securities exchange or over-the-counter (“OTC”). An ETF is an investment company that typically seeks to track the performance of an index by holding in its portfolio shares of all the companies, or a representative sample of the companies, that are components of a particular index. ETF shares are traded on a securities exchange based on their market value. The risks of investment in other investment companies typically reflect the risks of the types of securities in which the other investment companies invest. Investments in ETFs and closed-end funds are subject to the additional risk that their shares may trade at a premium or discount to their NAV. When the Fund invests in another investment company, shareholders of the Fund indirectly bear their proportionate share of the other investment company’s fees and expenses, including operating, registration, trustee, licensing and marketing, as well as their share of the Fund’s fees and expenses.
Portfolio securities loaned —The Fund may lend its portfolio securities. Lending portfolio securities exposes the Fund to the risk that the borrower may fail to return the loaned securities or may not be able to provide additional collateral or that the Fund may experience delays in recovery of the loaned securities or loss of rights in the collateral if the borrower fails financially. To minimize these risks, the borrower must agree to maintain cash collateral with the Fund’s custodian. The loaned securities are secured by collateral valued at least equal, at all times, to the market value of the loaned securities plus accrued interest, if any. When the collateral falls below specified amounts, the lending agent will use its best effort to obtain additional collateral on the next business day to meet required amounts under the security lending agreement. The cash collateral is reinvested by the Fund’s custodian into an approved short-term investment vehicle. The approved short-term investment vehicle is subject to market risk.
18
Notes to Financial Statements(Continued)
As of December 31, 2019, the Fund loaned securities and received collateral as follows:
Fund |
|
Security Type |
| Market Value of Securities Loaned* |
|
| Market Value of Collateral Received** |
|
|
Net Amount*** |
| |||
| Sands Capital Institutional Growth Fund | Common Stock | $ | 94,771,239 | $ | 97,704,300 | $ | 2,933,061 | |||||||
| * | The remaining contractual maturity is overnight for all securities. | |
| ** | Gross amounts of recognized liabilities for securities lending is included in the Statement of Assets and Liabilities. | |
| *** | Net amount represents the net amount payable due to the borrower in the event of default. |
All cash collateral is received, held, and administered by the Fund’s custodian for the benefit of the lending Fund in its custody account or other account established for the purpose of holding collateral in cash equivalents.
By participating in securities lending, the Fund receives compensation in the form of fees. Securities lending income is derived from lending long securities from the Fund to creditworthy approved borrowers at rates that are determined based on daily trading volumes, float, short-term interest rates and market liquidity and is shown net of fees on the Statement of Operations. When the Fund lends securities, it retains the interest or dividends on the investment of any cash received as collateral, and the Fund continues to receive interest or dividends on the loaned securities.
Unrealized gain or loss on the market value of the loaned securities that may occur during the term of the loan is recognized by the Fund. The Fund has the right under the lending agreement to recover any loaned securities from the borrower on demand.
Share valuation —The NAV per share of the Fund is calculated daily by dividing the total value of the Fund’s assets, less liabilities, by its number of outstanding shares.
Investment income —Dividend income from securities is recognized on the ex-dividend date, net of foreign withholding taxes, if any, which are reduced by any amounts reclaimable by the Fund, where applicable. Interest income from securities is recorded on the basis of interest accrued, premium amortized and discount accreted.
Distributions to shareholders —The Fund intends to distribute to its shareholders substantially all of its income and capital gains. The Fund declares and distributes net investment income, if any, quarterly as a dividend to shareholders. The Fund makes distributions of capital gains, if any, at least annually, net of applicable capital loss carryforwards. Income distributions and capital gain distributions are determined in accordance with income tax regulations. Recognition of the Fund’s net investment income from investments in Underlying Funds is affected by the timing of dividend declarations by the Underlying Funds.
Allocations —Expenses not directly billed to the Fund are allocated proportionally among the Trust and, if applicable, Touchstone Funds Group Trust, Touchstone Strategic Trust and Touchstone Variable Series Trust (collectively with the Trust, “Touchstone Fund Complex”), daily in relation to net assets of each Fund or another reasonable measure.
Security transactions —Security transactions are reflected for financial reporting purposes as of the trade date. Realized gains and losses on sales of portfolio securities are calculated using the identified cost basis.
Estimates —The preparation of financial statements in conformity with U.S. GAAP requires management to make estimates and assumptions that affect the reported amounts of assets and liabilities and disclosure of contingent assets and liabilities at the date of the financial statements and the reported amounts of income and expenses during the reporting period. Actual results could differ from those estimates.
19
Notes to Financial Statements(Continued)
3. Investment Transactions
Investment transactions (excluding short-term investments and U.S. Government securities) were as follows for the year ended December 31, 2019:
| Sands Capital | ||||
| Institutional | ||||
| Growth Fund* | ||||
| Purchases of investment securities | $ | 446,660,332 | ||
| Proceeds from sales and maturities | $ | 546,556,477 | ||
* The Fund had redemptions-in-kind which resulted in redemptions out of the Fund of $200,955,451 and is excluded from the proceeds from sales and maturities. The redemptions were comprised of securities and cash in the amount of $169,072,941 and $31,882,510, respectively.
There were no purchases or proceeds from sales and maturities of U.S. Government securities by the Fund for the year ended December 31, 2019.
4. Transactions with Affiliates and Other Related Parties
Certain officers of the Trust are also officers of Touchstone Advisors, Inc. (“Advisor” or “Administrator”),Touchstone Securities, Inc. (the “Underwriter”), or The Bank of New York Mellon, the Sub-Administrator to the Fund, and BNY Mellon Investment Servicing (U.S.) Inc., the Transfer Agent to the Fund (collectively referenced to herein as “BNY Mellon”). Such officers receive no compensation from the Trust. The Advisor and the Underwriter are each wholly-owned subsidiaries of Western & Southern Financial Group, Inc.
On behalf of the Fund, the Advisor pays each Independent Trustee a quarterly retainer plus additional retainers to the Lead Independent Trustee and the chairs of each standing committee. Interested Trustees do not receive compensation from the Fund. Each Independent Trustee will also receive compensation for each Board meeting and committee meeting attended. Each standing committee chair will receive additional compensation for each committee meeting that he or she oversees.
MANAGEMENT & EXPENSE LIMITATION AGREEMENTS
The Advisor provides general investment supervisory services for the Fund, under the terms of a management agreement (the “Advisory Agreement”). Under the Advisory Agreement, the Fund pays the Advisor a unified fee, which is computed and accrued daily and paid monthly, at an annual rate of 0.78% of the average daily net assets of the Fund. Under the unified fee arrangement, the Advisor is responsible for compensating any third-party engaged to provide services under its supervision, including sub-advisors, sub-administrators, transfer and dividend disbursing agents, and custodians. The Advisor is also responsible for payment of the fees of the Independent Trustees, the independent registered public accounting firm and legal counsel (excluding costs in connection with certain litigation or administrative actions). The Fund will pay all state registration fees, liquidity fees, interest, taxes, dues, fees, or similar costs, brokerage commissions or other transaction costs, certain extraordinary expenses, and expenses related to printing and mailing of prospectuses, statements of additional information, proxy solicitation material, shareholder reports and EDGAR filings.
The Advisor has entered into an investment sub-advisory agreement with Sands Capital Management, LLC (the “Sub-Advisor”), an investment advisor registered with the Securities and Exchange Commission (the “SEC”). The Advisor pays sub-advisory fees to the Sub-Advisor from its advisory fee.
The Advisor entered into an expense limitation agreement (the “Expense Limitation Agreement”) to contractually limit the annual operating expenses of the Fund, excluding: dividend and interest expenses relating to short sales; interest; taxes; brokerage commissions and other transaction costs; portfolio transaction and investment related expenses, including expenses associated with the Fund’s liquidity providers; other expenditures which
20
Notes to Financial Statements(Continued)
are capitalized in accordance with U.S. GAAP; the cost of “Acquired Fund Fees and Expenses”, if any; and other extraordinary expenses not incurred in the ordinary course of business. The maximum annual operating expense limit in any year with respect to the Fund, as a percentage of the average daily net assets of the Fund, is 0.80%. The Advisor has agreed to waive advisory fees and reimburse expenses in order to maintain the expense limitation for the Fund through at least April 29, 2020. For the year ended December 31, 2019, the Advisor did not waive advisory fees or reimburse any operating expenses.
Under the terms of the Expense Limitation Agreement, the Advisor is entitled to recover, subject to approval by the Fund’s Board, such amounts waived or reimbursed for a period of up to three years from the date on which the Advisor reduced its compensation or assumed expenses for the Fund. The Fund will make repayments to the Advisor only if such repayment does not cause the Fund’s operating expenses (after the repayment is taken into account) to exceed the Fund’s expense limit in place when such amounts were waived or reimbursed by the Advisor and the Fund’s current expense limitation. Since the effective date, the Advisor has not waived or reimbursed any expenses, therefore there are no amounts currently eligible for recoupment.
INTERFUND TRANSACTIONS
Pursuant to Rule 17a-7 under the 1940 Act, the Fund may engage in purchase and sale transactions with funds that have a common investment advisor (or affiliated investment advisors), common Trustees and/or common Officers. During the year ended December 31, 2019, the Fund did not engage in any Rule 17a-7 transactions.
5. Liquidity
ReFlow Fund LLC—The Fund may participate in the ReFlow Fund LLC liquidity program (“ReFlow”), which is designed to provide an alternative liquidity source for funds experiencing redemptions. In order to pay cash to shareholders who redeem their shares on a given day, a fund typically must hold cash in its portfolio, liquidate portfolio securities, or borrow money. ReFlow provides participating funds with another source of cash by standing ready to purchase shares from a fund up to the amount of the fund’s net redemptions on a given day, cumulatively limited to 3% of the outstanding voting shares of the Fund. ReFlow then generally redeems those shares (in cash or in-kind) when the Fund experiences net sales, at the end of a maximum holding period determined by ReFlow, or at other times at ReFlow’s discretion. In return for this service, the Fund will pay a fee to ReFlow at a rate determined by a daily auction with other participating mutual funds.
During the year ended December 31, 2019, the Fund utilized ReFlow. ReFlow subscribed to 8,580,348 shares of the Fund during the period and had redemptions-in-kind of $169,072,941. The resulting fee is included in Other expenses on the Statement of Operations.
Interfund Lending—Pursuant to an Exemptive Order issued by the SEC on March 28, 2017, the Fund, along with certain other funds in the Touchstone Fund Complex, may participate in an interfund lending program. The interfund lending program provides an alternate credit facility that allows the Fund to lend to or borrow from other participating funds in the Touchstone Fund Complex, subject to the conditions of the Exemptive Order. The Fund may not borrow under the facility for leverage purposes and the loan’s duration may be no more than 7 days.
During the year ended December 31, 2019, the Fund participated as a lender in the interfund lending program. The daily average amount loaned, weighted average interest rate and interest income were as follows:
| Daily Average | Weighted Average | |||||||||||
| Amount | Interest | Interest | ||||||||||
| Fund | Loaned | Rate | Income* | |||||||||
| Sands Capital Institutional Growth Fund | $ | 929,583 | 2.78 | % | $ | 25,766 | ||||||
*Included in Interest in the Statement of Operations.
21
Notes to Financial Statements(Continued)
6. Federal Tax Information
Federal Income Tax —It is the Fund’s policy to continue to comply with the special provisions of the Internal Revenue Code applicable to regulated investment companies. As provided therein, in any fiscal year in which the Fund so qualifies and distributes at least 90% of its investment company taxable income, the Fund (but not the shareholders) will be relieved of federal income tax on the income distributed. It is the Fund’s policy to distribute all of its taxable income and accordingly, no provision for income taxes has been made.
In order to avoid imposition of the excise tax applicable to regulated investment companies, it is also the Fund’s intention to declare and pay as dividends in each calendar year at least 98% of its investment company taxable income (earned during the calendar year) and 98.2% of its net realized capital gains (earned during the twelve months ending October 31) plus undistributed amounts from prior years.
The tax character of distributions paid for the years ended December 31, 2019 and December 31, 2018 are as follows:
| Sands Capital | ||||||||
| Institutional | ||||||||
| Growth Fund | ||||||||
| 2019 | 2018 | |||||||
| From ordinary income | $ | — | $ | — | ||||
| From long-term capital gains | 211,596,989 | 235,222,799 | ||||||
| Total distributions | $ | 211,596,989 | $ | 235,222,799 | ||||
The following information is computed on a tax basis for each item as of December 31, 2019:
| Sands Capital | ||||
| Institutional | ||||
| Growth Fund | ||||
| Tax cost of portfolio investments | $ | 1,114,001,107 | ||
| Gross unrealized appreciation on investments | 905,622,176 | |||
| Gross unrealized depreciation on investments | (27,067,198 | ) | ||
| Net unrealized appreciation on investments | 878,554,978 | |||
| Undistributed long-term capital gains | 50,086,422 | |||
| Distributable earnings (deficit) | $ | 928,641,400 | ||
The difference between the tax cost of portfolio investments and the financial statement cost is primarily due to wash sale loss deferrals and non-taxable distributions from corporate stock.
As of December 31, 2019, the Fund did not have any capital loss carryforwards for federal income tax purposes.
Under current laws, certain capital losses realized after October 31 and ordinary losses realized after December 31 may be deferred (and certain ordinary losses after October and/or December 31 may be deferred) and treated as occurring on the first day of the following fiscal year. For the year ended December 31, 2019, the Fund did not elect to defer any losses.
The Fund has analyzed its tax positions taken or to be taken on federal income tax returns for all open tax years (tax years ended December 31, 2016 through 2019) and has concluded that no provision for income tax is required in its financial statements.
22
Notes to Financial Statements(Continued)
Certain reclassifications, the result of permanent differences between financial statement and income tax reporting requirements, have been made to the components of capital. These reclassifications have no impact on the net assets or NAV per share of the Fund. The following reclassifications, which are primarily attributed to deemed distributions on shareholder redemptions, current year reclass of net operating losses and in-kind distributions for shareholder redemptions have been made to the Fund for the year ended December 31, 2019:
| Paid-In | Distributable | |||||||
| Capital | Earnings | |||||||
| Sands Capital Institutional Growth Fund | $ | 120,331,608 | $ | (120,331,608 | ) | |||
7. Commitments and Contingencies
The Fund indemnifies the Trust’s officers and Trustees for certain liabilities that might arise from their performance of their duties to the Fund. Additionally, in the normal course of business, the Fund enters into contracts that contain a variety of representations and warranties and which provide general indemnifications. The Fund’s maximum exposure under these arrangements is unknown, as this would involve future claims that may be made against the Fund.
8. Principal Risks
Risks Associated with Sector Concentration —The Fund may invest a high percentage of its assets in specific sectors of the market in order to achieve a potentially greater investment return. As a result, the Fund may be more susceptible to economic, political, and regulatory developments in a particular sector of the market, positive or negative, and may experience increased volatility in the Fund’s NAV and magnified effect on the total return.
Please see the Fund’s prospectus for a complete discussion of this and other risks.
9. Subsequent Events
Subsequent events occurring after the date of this report have been evaluated for potential impact to this report through the date the financial statements were issued.There were no subsequent events that necessitated recognition or disclosure in the Fund’s financial statements.
23
Report of Independent Registered Public Accounting Firm
To the Shareholders and Board of Trustees of Touchstone Institutional Funds Trust
Opinion on the Financial Statements
We have audited the accompanying statement of assets and liabilities of Touchstone Institutional Funds Trust (the “Trust”) (comprising the Touchstone Sands Capital Institutional Growth Fund (the “Fund”)), including the portfolio of investments, as of December 31, 2019, and the related statement of operations for the year then ended, the statements of changes in net assets for each of the two years in the period then ended, the financial highlights for each of the five years in the period then ended and the related notes (collectively referred to as the “financial statements”). In our opinion, the financial statements present fairly, in all material respects, the financial position of the Fund comprising Touchstone Institutional Funds Trust at December 31, 2019, the results of its operations for the year then ended, the changes in its net assets for each of the two years in the period then ended and its financial highlights for each of the five years in the period then ended, in conformity with U.S. generally accepted accounting principles.
Basis for Opinion
These financial statements are the responsibility of the Trust’s management. Our responsibility is to express an opinion on the Fund’s financial statements based on our audits. We are a public accounting firm registered with the Public Company Accounting Oversight Board (United States) (“PCAOB”) and are required to be independent with respect to the Trust in accordance with the U.S. federal securities laws and the applicable rules and regulations of the Securities and Exchange Commission and the PCAOB.
We conducted our audits in accordance with the standards of the PCAOB. Those standards require that we plan and perform the audit to obtain reasonable assurance about whether the financial statements are free of material misstatement, whether due to error or fraud. The Trust is not required to have, nor were we engaged to perform, an audit of the Trust’s internal control over financial reporting. As part of our audits, we are required to obtain an understanding of internal control over financial reporting but not for the purpose of expressing an opinion on the effectiveness of the Trust’s internal control over financial reporting. Accordingly, we express no such opinion.
Our audits included performing procedures to assess the risks of material misstatement of the financial statements, whether due to error or fraud, and performing procedures that respond to those risks. Such procedures included examining, on a test basis, evidence regarding the amounts and disclosures in the financial statements. Our procedures included confirmation of securities owned as of December 31, 2019, by correspondence with the custodian, transfer agent, and brokers or by other appropriate auditing procedures where replies from brokers were not received. Our audits also included evaluating the accounting principles used and significant estimates made by management, as well as evaluating the overall presentation of the financial statements. We believe that our audits provide a reasonable basis for our opinion.

We have served as the auditor for one or more Touchstone Investments’ investment companies since 1999.
Cincinnati, Ohio
February 20, 2020
24
Supplemental Tax Information
The information set forth below is for the Fund’s fiscal year as required by federal income tax laws. Shareholders, however, must report distributions on a calendar year basis for income tax purposes, which may include distributions for portions of two fiscal years of the Fund. Accordingly, the information needed by shareholders for income tax purposes will be sent to them in February of each year. Please consult your tax advisor for proper treatment of this information.
For the fiscal year ended December 31, 2019, the Fund designated $242,105,561 as long-term capital gains.
Proxy Voting Guidelines and Proxy Voting Records
The Sub-Advisor is responsible for exercising the voting rights associated with the securities purchased and held by the Fund. A description of the policies and procedures that the Sub-Advisor uses in fulfilling this responsibility is available as an appendix to the most recent Statement of Additional Information, which can be obtained without charge by calling toll free 1.800.543.0407 or by visiting the Touchstone website at TouchstoneInvestments.com or on the Securities and Exchange Commission’s (the “Commission”) website at sec.gov. Information regarding how those proxies were voted during the most recent twelve-month period ended June 30, which will be filed by August 31 of that year, is also available without charge by calling toll free 1.800.543.0407 or on the Commission’s website at sec.gov.
Quarterly Portfolio Disclosure
The Fund’s holdings as of the end of the third month of every fiscal quarter will be disclosed on Form N-PORT within 60 days of the end of the fiscal quarter. The complete listing of the Fund’s portfolio holdings is available on the Commission’s website and will be made available to shareholders upon request by calling 1.800.543.0407.
Schedule of Shareholder Expenses
As a shareholder of the Fund, you incur two types of costs: (1) transaction costs; and (2) ongoing costs, including investment advisory fee and other Fund expenses. This example is intended to help you understand your ongoing costs (in dollars) of investing in the Fund and to compare these costs with the ongoing costs of investing in other mutual funds. The example is based on an investment of $1,000 invested at the beginning of the period and held for the entire period (July 1, 2019 through December 31, 2019).
Actual Expenses
The first line of the table below provides information about actual account values and actual expenses. You may use the information in this line, together with the amount you invested, to estimate the expenses that you paid over the period. Simply divide your account value by $1,000 (for example, an $8,600 account value divided by $1,000 = 8.6), then multiply the result by the number in the first line under the heading entitled “Expenses Paid During the Six Months Ended December 31, 2019” to estimate the expenses you paid on your account during this period.
Hypothetical Example for Comparison Purposes
The second line of the table below provides information about hypothetical account values and hypothetical expenses based on the Fund’s actual expense ratio and an assumed rate of return of 5% per year before expenses, which is not the Fund’s actual return. The hypothetical account values and expenses may not be used to estimate the actual ending account balance or expenses you paid for the period. You may use this information to compare
25
Other Items(Unaudited) (Continued)
the ongoing costs of investing in the Fund and other funds. To do so, compare this 5% hypothetical example with the 5% hypothetical examples that appear in the shareholder reports of the other funds.
Please note that the expenses shown in the table below are meant to highlight your ongoing costs only and do not reflect any transactional costs. Therefore, the second line of the table below is useful in comparing ongoing costs only, and will not help you determine the relative total costs of owning different funds.
| Expenses | ||||||||||||||||
| Net Expense | Beginning | Ending | Paid During | |||||||||||||
| Ratio | Account | Account | the Six Months | |||||||||||||
| Annualized | Value | Value | Ended | |||||||||||||
| December 31, | July 1, | December 31, | December 31, | |||||||||||||
| 2019 | 2019 | 2019 | 2019* | |||||||||||||
| Touchstone Sands Capital Institutional Growth Fund | ||||||||||||||||
| Actual | 0.81 | % | $ | 1,000.00 | $ | 1,047.30 | $ | 4.18 | ** | |||||||
| Hypothetical | 0.81 | % | $ | 1,000.00 | $ | 1,021.12 | $ | 4.13 | ** | |||||||
| * | Expenses are equal to the Fund's annualized expense ratio, multiplied by the average account value over the period, multiplied by 184/365 (to reflect one-half year period). | |
| ** | Excluding liquidity provider expenses, your actual cost of investment in the Fund would be $4.08 and your hypothetical cost of investment in the Fund would be $4.02. |
Management and Sub-Advisory Agreement Approval Disclosure
At a meeting held on November 21, 2019, the Board of Trustees (the “Board” or “Trustees”) of the Touchstone Institutional Funds Trust (the “Trust”), and by a separate vote, the Independent Trustees of the Trust, approved the continuance of the Management Agreement between the Trust and the Advisor with respect to the Fund, and the continuance of the Sub-Advisory Agreement between the Advisor and the Sub-Advisor.
In determining whether to approve the continuation of the Management Agreement and the Sub-Advisory Agreement, the Advisor furnished information necessary for a majority of the Independent Trustees to make the determination that the continuance of the Management Agreement and the Sub-Advisory Agreement was in the best interests of the Fund and its shareholders. The information provided to the Board included: (1) industry data comparing advisory fees and total expense ratios of comparable funds; (2) comparative performance information; (3) the Advisor’s and its affiliates’ revenues and costs of providing services to the Fund; and (4) information about the Advisor’s and Sub-Advisor’s personnel. Prior to voting, the Independent Trustees reviewed the proposed continuance of the Management Agreement and the Sub-Advisory Agreement with management and experienced independent legal counsel and received materials from such counsel discussing the legal standards for their consideration of the proposed continuation of the Management Agreement and the Sub-Advisory Agreement with respect to the Fund. The Independent Trustees also reviewed the proposed continuation of the Management Agreement and the Sub-Advisory Agreement with respect to the Fund with independent legal counsel in private sessions at which no representatives of management were present.
In approving the Fund’s Management Agreement, the Board considered various factors, among them: (1) the nature, extent and quality of services provided to the Fund, including the personnel providing such services; (2) the Advisor’s compensation and profitability; (3) a comparison of fees and performance with comparable funds; (4) economies of scale; and (5) the terms of the Management Agreement. The Board’s analysis of these factors is set forth below. The Independent Trustees were advised by independent legal counsel throughout the process.
Nature, Extent and Quality of Advisor Services.The Board considered the level and depth of knowledge of the Advisor, including the professional experience and qualifications of senior personnel. In evaluating the quality of services provided by the Advisor, the Board took into account its familiarity with the Advisor’s senior management through Board meetings, discussions and reports during the preceding year. The Board also took into account
26
Other Items(Unaudited) (Continued)
the Advisor’s compliance policies and procedures. The quality of administrative and other services, including the Advisor’s role in coordinating the activities of the Fund’s other service providers, was also considered. The Board also considered the Advisor’s relationship with its affiliates and the resources available to them, as well as any potential conflicts of interest.
The Board discussed the Advisor’s effectiveness in monitoring the performance of the Sub-Advisor and the Advisor’s timeliness in responding to performance issues.The Board considered the Advisor’s process for monitoring the Sub-Advisor, which includes an examination of both qualitative and quantitative elements of the Sub-Advisor’s organization, personnel, procedures, investment discipline, infrastructure and performance. The Board considered that the Advisor conducts periodic compliance due diligence of the Sub-Advisor, during which the Advisor examines a wide variety of factors, such as the financial condition of the Sub-Advisor, the quality of the Sub-Advisor’s systems, the effectiveness of the Sub-Advisor’s disaster recovery programs, trade allocation and execution procedures, compliance with the Sub-Advisor’s policies and procedures, results of regulatory examinations and any other factors that might affect the quality of services that the Sub-Advisor provides to the Fund. The Board noted that the Advisor’s compliance monitoring processes also include quarterly reviews of compliance certifications, and that any issues arising from such reports and the Advisor’s compliance visits to the Sub-Advisor are reported to the Board.
The Trustees concluded that they were satisfied with the nature, extent and quality of services provided to the Fund by the Advisor under the Management Agreement.
Advisor’s Compensation and Profitability.The Board took into consideration the financial condition and profitability of the Advisor and its affiliates and the direct and indirect benefits derived by the Advisor and its affiliates from the Advisor’s relationship with the Fund. The information considered by the Board included operating profit margin information for the Advisor’s business as a whole. The Board noted that the Advisor pays the Sub-Advisor’s sub-advisory fee out of the advisory fee the Advisor receives from the Fund. The Board reviewed the profitability of the Advisor’s relationship with the Fund both before and after tax expenses, and also considered whether the Advisor has the financial wherewithal to continue to provide services to the Fund, noting the ongoing commitment of the Advisor’s parent company with respect to providing support and resources as needed. The Board also noted that the Advisor derives benefits to its reputation and other benefits from its association with the Fund.
The Board recognized that the Advisor should be entitled to earn a reasonable level of profits in exchange for the level of services it provides to the Fund and the entrepreneurial risk that it assumes as Advisor. Based upon their review, the Trustees concluded that the Advisor’s level of profitability from its relationship with the Fund was reasonable and not excessive.
Expenses and Performance.The Board compared the advisory fee and total expense ratio for the Fund with various comparative data, including the median and average advisory fees and total expense ratios of the Fund’s peer group. The Board also considered, among other data, the Fund’s performance results during the six-month, twelve-month, and thirty-six month periods ended September 30, 2019, and noted that the Board reviews on a quarterly basis detailed information about the Fund’s performance results, portfolio composition and investment strategies. The Board also took into account current market conditions and their effect on the Fund’s performance.
The Board also considered the effect of the Fund’s growth and size on its performance and expenses. The Board noted that the sub-advisory fee under the Sub-Advisory Agreement was paid by the Advisor out of the advisory fee it receives from the Fund and considered the impact of such sub-advisory fee on the profitability of the Advisor. In reviewing the total expense ratio and performance of the Fund, the Board also took into account the nature, extent and quality of the services provided by the Advisor and its affiliates.
27
Other Items(Unaudited) (Continued)
The Board considered, among other data, the specific factors and related conclusions set forth below:
Touchstone Sands Capital Institutional Growth Fund. The Fund’s advisory fee and total expense ratio were above the median of its peer group. The Board took into account management’s discussion of the Fund’s expenses and the Fund’s advisory fee structure. The Fund’s performance for the six-month period ended September 30, 2019 was in the 5th quintile of its peer group, the Fund’s performance for the twelve-month period ended September 30, 2019 was in the 4th quintile of its peer group, and the Fund’s performance for the thirty-six-month period ended September 30, 2019 was in the 2nd quintile of its peer group. The Board noted management’s discussion of the Fund’s performance, including both its recent and long-term performance. Based upon their review, the Trustees concluded that the Fund’s overall performance was satisfactory relative to the performance of funds with similar investment objectives and relevant indices, and that the advisory fee was reasonable in light of the services received by the Fund from the Advisor and the other factors considered.
Economies of Scale.The Board considered the effect of the Fund’s current size and potential growth on its performance and expenses. The Board took into account management’s discussion of the Fund’s advisory fee structure. The Board also noted that if the Fund’s assets increased over time, the Fund might realize other economies of scale if assets increased proportionally more than certain other expenses.
Conclusion.In considering the renewal of the Fund’s Management Agreement, the Board, including the Independent Trustees, did not identify any single factor as controlling, and each Trustee may have attributed different weights to the various factors. The Board reached the following conclusions regarding the Fund’s Management Agreement with the Advisor, among others: (a) the Advisor demonstrated that it possesses the capability and resources to perform the duties required of it under the Management Agreement; (b) the Advisor maintains an appropriate compliance program; (c) the Fund’s overall performance is satisfactory relative to the performance of funds with similar investment objectives and relevant indices; and (d) the Fund’s advisory fee is reasonable in light of the services received by the Fund from the Advisor and the other factors considered. Based on their conclusions, the Trustees determined that continuation of the Management Agreement was in the best interests of the Fund and its shareholders.
In approving the Fund’s Sub-Advisory Agreement, the Board considered various factors with respect to the Fund and its Sub-Advisory Agreement, among them: (1) the nature, extent and quality of services provided to the Fund, including the personnel providing such services; (2) the Sub-Advisor’s compensation; (3) a comparison of the sub-advisory fee and performance with comparable funds; and (4) the terms of the Sub-Advisory Agreement. The Board’s analysis of these factors is set forth below. The Independent Trustees were advised by independent legal counsel throughout the process.
Nature, Extent and Quality of Services Provided; Investment Personnel.The Board considered information provided by the Advisor regarding the services provided by the Sub-Advisor, including information presented periodically throughout the previous year. The Board noted that, on a periodic basis, the Board meets with portfolio managers of the Sub-Advisor to discuss their performance and investment processes and strategies. The Board considered the Sub-Advisor’s level of knowledge and investment style. The Board reviewed the experience and credentials of the investment personnel who are responsible for managing the investment of portfolio securities for the Fund. The Board also noted the Sub-Advisor’s brokerage practices.
Sub-Advisor’s Compensation, Profitability and Economies of Scale.The Board also took into consideration the financial condition of the Sub-Advisor and any indirect benefits derived by the Sub-Advisor and its affiliates from the Sub-Advisor’s relationship with the Fund. In considering the profitability to the Sub-Advisor of its relationship with the Fund, the Board noted that the sub-advisory fee under the Sub-Advisory Agreement was paid by the Advisor out of the advisory fee that it receives under the Management Agreement and is negotiated at arms-length. As a consequence, the profitability to the Sub-Advisor of its relationship with the Fund was
28
Other Items(Unaudited) (Continued)
not a substantial factor in the Board’s deliberations. For similar reasons, the Board did not consider the potential economies of scale in the Sub-Advisor’s management of the Fund to be a substantial factor in its consideration.
Sub-Advisory Fee and Fund Performance.The Board considered that the Fund pays an advisory fee to the Advisor and that the Advisor pays the sub-advisory fee to the Sub-Advisor out of the advisory fee it receives from the Fund. The Board also compared the sub-advisory fee paid by the Advisor to fees charged by the Sub-Advisor to manage comparable institutional separate accounts. The Board considered the amount retained by the Advisor and the sub-advisory fee paid to the Sub-Advisor with respect to the various services provided by the Advisor and the Sub-Advisor. The Board reviewed the sub-advisory fee in relation to various comparative data, including the median and average sub-advisory fees of the Fund’s peer group, and considered the following information:
Touchstone Sands Capital Institutional Growth Fund. The Fund’s sub-advisory fee was above the median of its peer group. Based upon their review, the Trustees concluded that the sub-advisory fee was reasonable in light of the services received by the Fund from the Sub-Advisor and the other factors considered.
As noted above, the Board considered the Fund’s performance during the six-month, twelve-month, and thirty-six-month periods ended September 30, 2019, as compared to the Fund’s peer group and noted that the Board reviews on a quarterly basis detailed information about the Fund’s performance results, portfolio composition and investment strategies. The Board also noted the Advisor’s expertise and resources in monitoring the performance, investment style and risk-adjusted performance of the Sub-Advisor. The Board also was mindful of the Advisor’s ongoing monitoring of the Sub-Advisor’s performance.
Conclusion.In considering the renewal of the Sub-Advisory Agreement, the Board, including the Independent Trustees, did not identify any single factor as controlling, and each Trustee may have attributed different weights to the various factors. The Board reached the following conclusions regarding the Sub-Advisory Agreement, among others: (a) the Sub-Advisor is qualified to manage the Fund’s assets in accordance with the Fund’s investment objectives and policies; (b) the Sub-Advisor maintains an appropriate compliance program; (c) the Fund’s overall performance is satisfactory relative to the performance of funds with similar investment objectives and relevant indices; (d) the Fund’s sub-advisory fee is reasonable in light of the services received by the Fund from the Sub-Advisor and the other factors considered; and (e) the Sub-Advisor’s investment strategies are appropriate for pursuing the investment goals of the Fund. Based on its conclusions, the Board determined that approval of the Sub-Advisory Agreement was in the best interests of the Fund and its shareholders.
29
Management of the Trust(Unaudited)
Listed below is required information regarding the Trustees and principal officers of the Trust. The Trust’s Statement of Additional Information includes additional information about the Trustees and is available, without charge, upon request by calling 1.800.543.0407 or by visiting the Touchstone website at TouchstoneInvestments.com.
Interested Trustee1:
| Number | |||||
| of Funds | |||||
| Overseen | |||||
| Term of | in the | ||||
| Name | Position(s) | Office And | Touchstone | Other | |
| Address | Held with | Length of | Principal Occupation(s) | Fund | Directorships |
| Year of Birth | Trust | Time Served | During Past 5 Years | Complex2 | Held During the Past 5 Years3 |
| Jill T. McGruder Touchstone Advisors, Inc. 303 Broadway Suite 1100 Cincinnati, Ohio 45202 Year of Birth: 1955 | Trustee and President | Until retirement at age 75 or until she resigns or is removed Trustee since 1999 | President, Director and CEO of IFS Financial Services, Inc. (a holding company) since 1999; and Senior Vice President and Chief Marketing Officer of Western & Southern Financial Group, Inc. (a financial services company) since 2016. | 40 | Director, Integrity Life Insurance Co. and National Integrity Life Insurance Co. since 2005; Director, Touchstone Securities (the Distributor) since 1999; Director, Touchstone Advisors (the Advisor) since 1999; Director, W&S Brokerage Services, Inc. since 1999; Director, W&S Financial Group Distributors, Inc. since 1999; Director, Insurance Profillment Solutions LLC since 2014; Director, Columbus Life Insurance Co. since 2016; Director, The Lafayette Life Insurance Co. since 2016; Director, Gerber Life Insurance Company since 2019; Director, Western & Southern Agency, Inc. since 2018; and Director, LL Global, Inc. (not-for-profit trade organization with operating divisions LIMRA and LOMA) since 2016. |
| Independent Trustees: |
| Karen Carnahan c/o Touchstone Advisors, Inc. 303 Broadway Suite 1100 Cincinnati, Ohio 45202 Year of Birth: 1954 | Trustee | Until retirement at age 75 or until she resigns or is removed Trustee since 2019 | Treasurer of Clinical Supply Company (a dental supply company) since 1994; formerly Chief Operating Officer of Shred-it (a business services company) from 2014 to 2015. | 40 | Director, Cintas Corporation since 2019; Director, Boys & Girls Club of West Chester/Liberty since 2016; and Board of Advisors, Best Upon Request since 2020. |
| Phillip R. Cox c/o Touchstone Advisors, Inc. 303 Broadway Suite 1100 Cincinnati, Ohio 45202 Year of Birth: 1947 | Trustee | Until retirement at age 75 or until he resigns or is removed Trustee since 1999 | President and CEO of Cox Financial Corp. (a financial services company) since 1971. | 40 | Director, Cincinnati Bell from 1994 to 2019; Director, Bethesda Inc. (hospital) since 2005; Director, Timken Co. (manufacturing) from 2004 to 2014; Director, TimkenSteel from 2014 to 2019; Director, Diebold, Inc. (technology solutions) since 2004; and Director, Ohio Business Alliance for Higher Education and the Economy since 2005. |
30
Management of the Trust(Unaudited) (Continued)
Independent Trustees (Continued):
| Number | |||||
| of Funds | |||||
| Overseen | |||||
| Term of | in the | ||||
| Name | Position(s) | Office And | Touchstone | Other | |
| Address | Held with | Length of | Principal Occupation(s) | Fund | Directorships |
| Year of Birth | Trust | Time Served | During Past 5 Years | Complex2 | Held During the Past 5 Years3 |
| William C. Gale | Trustee | Until retirement | Retired; formerly Senior Vice | 40 | None. |
| c/o Touchstone Advisors, Inc. | at age 75 or until | President and Chief Financial | |||
| 303 Broadway | he resigns or is | Officer of Cintas Corporation (a | |||
| Suite 1100 | removed | business services company) from | |||
| Cincinnati, Ohio 45202 | Trustee since | 1995 to 2015. | |||
| Year of Birth: 1952 | 2013 | ||||
| Susan J. Hickenlooper, CFA | Trustee | Until retirement | Retired from investment | 40 | Trustee, Episcopal Diocese of |
| c/o Touchstone Advisors, Inc. | at age 75 or until | management. | Southern Ohio from 2014 to 2018. | ||
| 303 Broadway | she resigns or is | ||||
| Suite 1100 | removed | ||||
| Cincinnati, Ohio 45202 | Trustee since | ||||
| Year of Birth: 1946 | 2013 | ||||
| Kevin A. Robie | Trustee | Until retirement | Retired; formerly Vice President of | 40 | Director, SaverSystems, Inc. since |
| c/o Touchstone Advisors, Inc. | at age 75 or until | Portfolio Management at Soin LLC | 2015; Director, Buckeye EcoCare, | ||
| 303 Broadway | he resigns or is | (private multinational holding | Inc. from 2013 to 2018; Director, | ||
| Suite 1100 | removed | company and family office) from | Turner Property Services Group, Inc. | ||
| Cincinnati, Ohio 45202 | Trustee since | 2004 to 2020. | since 2017; Trustee, Dayton Region | ||
| Year of Birth: 1956 | 2013 | New Market Fund, LLC (private | |||
| fund) since 2010; and Trustee, | |||||
| Entrepreneurs Center, Inc. (business | |||||
| incubator) since 2006. | |||||
| William H. Zimmer III | Trustee | Until retirement | Independent Treasury Consultant | 40 | Director, Deaconess Associations, Inc. |
| c/o Touchstone Advisors, Inc. | at age 75 or until | since 2014. | (healthcare) since 2001; Trustee, | ||
| 303 Broadway | he resigns or is | Huntington Funds (mutual funds) | |||
| Suite 1100 | removed | from 2006 to 2015; and Director, | |||
| Cincinnati, Ohio 45202 | Trustee since | National Association of Corporate | |||
| Year of Birth: 1953 | 2019 | Treasurers from 2011 to 2015. |
| 1 | Ms. McGruder, as a director of the Advisor and the Distributor, and an officer of affiliates of the Advisor and the Distributor, is an “interested person” of the Trust within the meaning of Section 2(a) (19) of the 1940 Act. |
| 2 | As of December 31, 2019, the Touchstone Fund Complex consisted of 1 series of the Trust, 13 series of Touchstone Funds Group Trust, 19 series of Touchstone Strategic Trust, and 7 variable annuity series of Touchstone Variable Series Trust. |
| 3 | Each Trustee is also a Trustee of Touchstone Funds Group Trust, Touchstone Strategic Trust, and Touchstone Variable Series Trust. |
31
Management of the Trust(Unaudited) (Continued)
Principal Officers:
| Name | Position(s) | ||
| Address | Held with | Term of Office and | Principal Occupation(s) |
| Year of Birth | Trust1 | Length of Time Served | During Past 5 Years |
| Jill T. McGruder | President | Until resignation, removal or disqualification | See biography above. |
| Touchstone Advisors, Inc. | and Trustee | President since 2006 | |
| 303 Broadway | |||
| Suite 1100 | |||
| Cincinnati, Ohio 45202 | |||
| Year of Birth: 1955 | |||
| Steven M. Graziano | Vice | Until resignation, removal or disqualification | President of Touchstone Advisors, Inc. |
| Touchstone Advisors, Inc. | President | Vice President since 2009 | |
| 303 Broadway | |||
| Suite 1100 | |||
| Cincinnati, Ohio 45202 | |||
| Year of Birth: 1954 | |||
| Timothy D. Paulin | Vice | Until resignation, removal or disqualification | Senior Vice President of Investment Research and |
| Touchstone Advisors, Inc. | President | Vice President since 2010 | Product Management of Touchstone Advisors, Inc. |
| 303 Broadway | |||
| Suite 1100 | |||
| Cincinnati, Ohio 45202 | |||
| Year of Birth: 1963 | |||
| Timothy S. Stearns | Chief | Until resignation, removal or disqualification | Chief Compliance Officer of Touchstone Advisors, Inc. |
| Touchstone Advisors, Inc. | Compliance | Chief Compliance Officer since 2013 | |
| 303 Broadway | Officer | ||
| Suite 1100 | |||
| Cincinnati, Ohio 45202 | |||
| Year of Birth: 1963 | |||
| Terrie A. Wiedenheft | Controller | Until resignation, removal or disqualification | Senior Vice President, Chief Financial Officer, and |
| Touchstone Advisors, Inc. | and | Controller and Treasurer since 2006 | Chief Operations Officer of IFS Financial Services, Inc. |
| 303 Broadway | Treasurer | (a holding company). | |
| Suite 1100 | |||
| Cincinnati, Ohio 45202 | |||
| Year of Birth: 1962 | |||
| Meredyth A. Whitford | Secretary | Until resignation, removal or disqualification | Counsel - Securities/Mutual Funds of Western & |
| Western & Southern | Secretary since 2018 | Southern Financial Group (2015 to present); Associate | |
Financial Group | at Morgan Lewis & Bockius LLP (law firm) (2014 to | ||
| 400 Broadway | 2015); Associate at Bingham McCutchen LLP (law | ||
| Cincinnati, Ohio 45202 | firm) (2008 to 2014). | ||
| Year of Birth: 1981 |
| 1 | Each officer also holds the same office with Touchstone Funds Group Trust, Touchstone Strategic Trust and Touchstone Variable Series Trust. |
32
This page intentionally left blank.
This page intentionally left blank.
We Respect Your Privacy
Thank you for your decision to invest with us. Touchstone and its affiliates have always placed a high value on the trust and confidence our clients place in us. We believe that confidence must be earned and validated through time. In today’s world, when technology allows the sharing of information at light speeds, trust must be reinforced by our sincere pledge to take the steps necessary to ensure that the information you share with us is treated with respect and confidentiality.
Our Pledge to Our Clients
| • | We collect only the information we need to service your account and administer our business. |
| • | We are committed to keeping your information confidential and we place strict limits and controls on the use and sharing of your information. |
| • | We make every effort to ensure the accuracy of your information. |
We Collect the Following Nonpublic Personal Information About You:
| • | Information we receive from you on or in applications or other forms, correspondence, or conversations, including, but not limited to, your name, address, phone number, social security number, assets, income and date of birth; and |
| • | Information about your transactions with us, our affiliates, or others, including, but not limited to, your account number and balance, payment history, parties to transactions, cost basis information, and other financial information. |
Categories of Information We Disclose and Parties to Whom We Disclose
We do not disclose any nonpublic personal information about our current or former clients to nonaffiliated third parties, except as required or permitted by law.
We Place Strict Limits and Controls on the Use and Sharing of Your Information
| • | We restrict access to nonpublic personal information about you to authorized employees who need the information to administer your business. |
| • | We maintain physical, electronic and procedural safeguards that comply with federal standards to protect this information. |
| • | We do not disclose any nonpublic personal information about our current or former clients to anyone, except as required or permitted by law or as described in this document. |
| • | We will not sell your personal information to anyone. |
We May Provide Information to Service Your Account
Sometimes it is necessary to provide information about you to various companies such as transfer agents, custodians, broker-dealers and marketing service firms to facilitate the servicing of your account. These organizations have a legitimate business need to see some of your personal information in order for us to provide service to you. We may disclose to these various companies the information that we collect as described above. We require that these companies, including our own subsidiaries and affiliates, strictly maintain the confidentiality of this information and abide by all applicable laws. Companies within our corporate family that may receive this information are financial service providers and insurance companies. We do not permit these associated companies to sell the information for their own purposes, and we never sell our customer information.
This policy is applicable to the following affiliated companies: Touchstone Funds Group Trust, Touchstone Strategic Trust, Touchstone Variable Series Trust, Touchstone Institutional Funds Trust, Touchstone Securities, Inc.,* and W&S Brokerage Services, Inc.
* Touchstone Securities, Inc. serves as the underwriter to the Touchstone Funds.
A Member of Western & Southern Financial Group®
The Privacy Protection Policy is not part of the Annual Report.
| 35 |


Touchstone Investments
Distributor
Touchstone Securities, Inc.*
303 Broadway
Cincinnati, Ohio 45202-4203
800.638.8194
www.touchstoneinvestments.com
Investment Advisor
Touchstone Advisors, Inc.*
303 Broadway
Cincinnati, Ohio 45202-4203
Transfer Agent
BNY Mellon Investment Servicing (US) Inc.
4400 Computer Drive
Westborough, Massachusetts 01581
Shareholder Service
800.543.0407
* A Member of Western & Southern Financial Group
TSF-1105-TIFT-AR-1912
| 36 |
Item 2. Code of Ethics.
| (a) | The registrant, as of the end of the period covered by this report, has adopted a code of ethics that applies to the registrant’s principal executive officer, principal financial officer, principal accounting officer or controller, or persons performing similar functions, regardless of whether these individuals are employed by the registrant or a third party. |
| (c) | There have been no amendments, during the period covered by this report, to a provision of the code of ethics that applies to the registrant’s principal executive officer, principal financial officer, principal accounting officer or controller, or persons performing similar functions, regardless of whether these individuals are employed by the registrant or a third party, and that relates to any element of the code of ethics description. |
| (d) | The registrant has not granted any waivers, including an implicit waiver, from a provision of the code of ethics that applies to the registrant’s principal executive officer, principal financial officer, principal accounting officer or controller, or persons performing similar functions, regardless of whether these individuals are employed by the registrant or a third party, that relates to one or more of the items set forth in paragraph (b) of this item’s instructions. |
| (e) | Not applicable. |
| (f) | A copy of the code of ethics is attached hereto as Exhibit 13(a)(1). |
Item 3. Audit Committee Financial Expert.
The registrant’s Board of Trustees has determined that the registrant has at least one audit committee financial expert serving on its audit committee. Mr. William Gale is the registrant’s audit committee financial expert and is an independent trustee within the meaning of the Investment Company Act of 1940, as amended (the “1940 Act”).
Item 4. Principal Accountant Fees and Services.
Audit Fees
| (a) | Audit fees for Touchstone Institutional Funds Trust totaled $18,000 and $16,750 for the fiscal years ended December 31, 2019 and December 31, 2018, respectively, including fees associated with the annual audits and filings of Form N-1A and Form N-CEN. |
Audit-Related Fees
| (b) | The aggregate fees billed in each of the last two fiscal years for assurance and related services by the principal accountant that are reasonably related to the performance of the audit of the registrant's financial statements and are not reported under paragraph (a) of this Item are $0 and $0 for the fiscal years ended December 31, 2019 and December 31, 2018, respectively. |
Tax Fees
| (c) | The aggregate fees billed in each of the last two fiscal years for professional services rendered by the principal accountant for tax compliance, tax advice, and tax planning were $4,100 and $5,999 for the fiscal years ended December 31, 2019 and December 31, 2018, respectively. The fees relate to the preparation of federal income and excise tax returns, review of capital gains distribution calculations and out of scope tax services. |
All Other Fees
| (d) | The aggregate fees billed in each of the last two fiscal years for products and services provided by the principal accountant, other than the services reported in paragraphs (a) through (c) of this Item are $416 and $267 for the fiscal years ended December 31, 2019 and December 31, 2018, respectively. The fees relate to the PFIC analyzer and Global Withholding Tax Reporter subscriptions. |
| (e)(1) | Disclose the audit committee's pre-approval policies and procedures described in paragraph (c)(7) of Rule 2-01 of Regulation S-X. |
The Audit Committee’s pre-approval policies describe the types of audit, audit-related, tax and other services that have the general pre-approval of the Audit Committee. The pre-approval policies provide that annual audit service fees, tax services not specifically granted pre-approval, services exceeding pre-approved cost levels and other services that have not received general pre-approval will be subject to specific pre-approval by the Audit Committee. The pre-approval policies further provide that the Committee may grant general pre-approval to other audit services (statutory audits and services associated with SEC registration statements, periodic reports and other documents filed with the SEC or other documents issued in connection with securities offerings), audit-related services (accounting consultations related to accounting, financial reporting or disclosure matters not classified as “audit services,” assistance with understanding and implementing new accounting and financial reporting guidance from rulemaking authorities, agreed-upon or expanded audit procedures related to accounting and/or billing records required to respond to or comply with financial, accounting or regulatory reporting matters and assistance with internal control reporting requirements under Form N-CSR), tax services that have historically been provided by the auditor that the Committee believes would not impair the independence of the auditor and are consistent with the SEC’s rules on auditor independence and permissible non-audit services classified as “all other services” that are routine and recurring services.
| (e)(2) | All of the services described in paragraphs (b) through (d) of Item 4 were approved by the Audit Committee. |
| (f) | The percentage of hours expended on the principal accountant's engagement to audit the registrant's financial statements for the most recent fiscal year that were attributed to work performed by persons other than the principal accountant's full-time, permanent employees was less than fifty percent. |
| (g) | The aggregate non-audit fees for Touchstone Institutional Funds Trust and certain entities*, totaled approximately $731,002 and $848,296 for the fiscal years ended December 31, 2019 and December 31, 2018, respectively. |
| * These include the advisors (excluding non-affiliated sub-advisors) and any entity controlling, controlled by or under common control with the advisors that provides ongoing services to the registrant (Funds). |
| (h) | The registrant's audit committee of the board of trustees has considered whether the provision of non-audit services that were rendered to the registrant's investment adviser (not including any sub-adviser whose role is primarily portfolio management and is subcontracted with or overseen by another investment adviser), and any entity controlling, controlled by, or under common control with the investment adviser that provides ongoing services to the registrant that were not pre-approved pursuant to paragraph (c)(7)(ii) of Rule 2-01 of Regulation S-X is compatible with maintaining the principal accountant's independence. |
Item 5. Audit Committee of Listed Registrants.
Not applicable.
Item 6. Investments.
| (a) | Schedule of Investments in securities of unaffiliated issuers as of the close of the reporting period is included as part of the report to shareholders filed under Item 1 of this form. |
| (b) | Not applicable. |
Item 7. Disclosure of Proxy Voting Policies and Procedures for Closed-End Management Investment Companies.
Not applicable.
Item 8. Portfolio Managers of Closed-End Management Investment Companies.
Not applicable.
Item 9. Purchases of Equity Securities by Closed-End Management Investment Company and Affiliated Purchasers.
Not applicable.
Item 10. Submission of Matters to a Vote of Security Holders.
There have been no material changes to the procedures by which the shareholders may recommend nominees to the registrant’s board of trustees, where those changes were implemented after the registrant last provided disclosure in response to the requirements of Item 407(c)(2)(iv) of Regulation S-K (17 CFR 229.407) (as required by Item 22(b)(15) of Schedule 14A (17 CFR 240.14a-101)), or this Item.
Item 11. Controls and Procedures.
| (a) | The registrant’s principal executive and principal financial officers, or persons performing similar functions, have concluded that the registrant’s disclosure controls and procedures (as defined in Rule 30a-3(c) under the Investment Company Act of 1940, as amended (the “1940 Act”) (17 CFR 270.30a-3(c))) are effective, as of a date within 90 days of the filing date of the report that includes the disclosure required by this paragraph, based on their evaluation of these controls and procedures required by Rule 30a-3(b) under the 1940 Act (17 CFR 270.30a-3(b)) and Rules 13a-15(b) or 15d-15(b) under the Securities Exchange Act of 1934, as amended (17 CFR 240.13a-15(b) or 240.15d-15(b)). |
| (b) | There were no changes in the registrant’s internal control over financial reporting (as defined in Rule 30a-3(d) under the 1940 Act (17 CFR 270.30a-3(d))) that occurred during the period covered by this report that has materially affected, or is reasonably likely to materially affect, the registrant’s internal control over financial reporting. |
Item 12. Disclosure of Securities Lending Activities for Closed-End Management Investment Companies.
Not applicable.
Item 13. Exhibits.
| (a)(1) | Code of ethics, and any amendment thereto, that is the subject of disclosure required by Item 2 is attached hereto. |
| (a)(2) | Certifications pursuant to Rule 30a-2(a) under the 1940 Act and Section 302 of the Sarbanes-Oxley Act of 2002 are attached hereto. |
| (a)(3) | Not applicable. |
| (a)(4) | Not applicable. |
| (b) | Certifications pursuant to Rule 30a-2(b) under the 1940 Act and Section 906 of the Sarbanes- Oxley Act of 2002 are attached hereto. |
SIGNATURES
Pursuant to the requirements of the Securities Exchange Act of 1934 and the Investment Company Act of 1940, the registrant has duly caused this report to be signed on its behalf by the undersigned, thereunto duly authorized.
(Registrant) Touchstone Institutional Funds Trust
By (Signature and Title)* /s/Jill T. McGruder
Jill T. McGruder, President
(principal executive officer)
DateFebruary 28, 2020
Pursuant to the requirements of the Securities Exchange Act of 1934 and the Investment Company Act of 1940, this report has been signed below by the following persons on behalf of the registrant and in the capacities and on the dates indicated.
By (Signature and Title)* /s/ Jill T. McGruder
Jill T. McGruder, President
(principal executive officer)
Date February 28, 2020
By (Signature and Title)* /s/ Terrie A. Wiedenheft
Terrie A. Wiedenheft, Controller and Treasurer
(principal financial officer)
Date February 28, 2020
*Print the name and title of each signing officer under his or her signature.