UNITED STATES
SECURITIES AND EXCHANGE COMMISSION
Washington, D.C. 20549
FORM N-CSR
CERTIFIED SHAREHOLDER REPORT OF REGISTERED MANAGEMENT INVESTMENT COMPANIES
Investment Company Act file number 811-21113
Touchstone Institutional Funds Trust
(Exact name of registrant as specified in charter)
303 Broadway, Suite 1100
Cincinnati, Ohio 45202-4203
(Address of principal executive offices) (Zip code)
Jill T. McGruder
303 Broadway, Suite 1100
Cincinnati, Ohio 45202-4203
(Name and address of agent for service)
Registrant's telephone number, including area code: 800-638-8194
Date of fiscal year end: December 31
Date of reporting period: December 31, 2016
Form N-CSR is to be used by management investment companies to file reports with the Commission not later than 10 days after the transmission to stockholders of any report that is required to be transmitted to stockholders under Rule 30e-1 under the Investment Company Act of 1940 (17 CFR 270.30e-1). The Commission may use the information provided on Form N-CSR in its regulatory, disclosure review, inspection, and policymaking roles.
A registrant is required to disclose the information specified by Form N-CSR, and the Commission will make this information public. A registrant is not required to respond to the collection of information contained in Form N-CSR unless the Form displays a currently valid Office of Management and Budget ("OMB") control number. Please direct comments concerning the accuracy of the information collection burden estimate and any suggestions for reducing the burden to Secretary, Securities and Exchange Commission, 450 Fifth Street, NW, Washington, DC 20549-0609. The OMB has reviewed this collection of information under the clearance requirements of 44 U.S.C. § 3507.
Item 1. Reports to Stockholders.
The Report to Shareholders is attached herewith.
December 31, 2016
Annual Report
Touchstone Institutional Funds Trust
Touchstone Sands Capital Institutional Growth Fund

This report identifies the Fund's investments on December 31, 2016. These holdings are subject to change. Not all investments in the Fund performed the same, nor is there any guarantee that these investments will perform as well in the future. Market forecasts provided in this report may not occur.
Letter from the President
Dear Shareholder:
We are pleased to provide you with the Touchstone Institutional Funds Trust Annual Report. Inside you will find key financial information, as well as the manager commentary, for the 12 months ended December 31, 2016.
The fiscal year was eventful, featuring volatility in energy and commodity prices, the United Kingdom’s historic vote to leave the European Union and Donald Trump’s unexpected victory in the U.S. presidential election. The U.S. economy maintained steady but moderate growth. While overall growth in gross domestic product was restrained by continued weakness in business investment, strong gains in the labor market buoyed consumer confidence and spending. With the U.S. economy already on solid ground, expectations for growth have shifted higher as a result of the incoming administration’s proposed agenda of reduced regulations, tax cuts and fiscal stimulus. Outside of the U.S., however, the economic landscape was less positive. Growth in Europe and Japan remained anemic despite monetary policy intervention from central banks. Concern over a slowdown in China’s economy led to declines in commodity prices, weakness for emerging markets and increased volatility in capital markets during early 2016.
From their mid-February bottom to the end of the year, equity markets enjoyed broad gains. The surprise outcome of the U.S. presidential election fueled a late rally in equities and other risk assets, as investors priced in higher growth driven by the new administration’s plans to lower taxes and increase fiscal spending. Small capitalization stocks in particular benefited from renewed optimism, notching significant gains and outperforming their large capitalization peers.
After the Federal Reserve raised interest rates in December 2015, it went on to make dovish statements in early 2016 surrounding the pace of future rate hikes. Given weak growth and continued quantitative easing in Europe and Japan, interest rates fell throughout the first half of 2016, eventually bottoming at historic lows in early July. Federal Reserve forecasts for a late year rate hike and improved economic data provided the impetus for a rebound in rates in the second half of 2016. Following the presidential election, the rise in bond yields accelerated in the fourth quarter amid expectations for higher economic growth and inflation. Consistent with the risk-on environment in 2016, corporate bonds outperformed Treasuries, with High Yield bonds generating especially strong gains during the period.
After a year of strong returns across many asset classes, we believe that now is a good time to evaluate your financial situation. While determining an appropriate risk/return profile and portfolio allocation is always difficult, the advice of a financial advisor can help illuminate the path to addressing your long-term investment goals.
We appreciate the opportunity you have given us and hope to remain part of your investment plan in the years to come.
Sincerely,

Jill T. McGruder
President
Touchstone Institutional Funds Trust
Management's Discussion of Fund Performance (Unaudited)
Touchstone Sands Capital Institutional Growth Fund
Sub-Advised by Sands Capital Management LLC
Investment Philosophy
The Touchstone Sands Capital Institutional Growth Fund primarily invests in common stocks of large capitalization U.S. companies that are believed by Sands Capital Management LLC (“Sands Capital”) to have above-average potential for revenue and earnings growth. The Fund typically invests in 25 to 35 companies. Sands Capital generally seeks stocks with sustainable above-average earnings growth and capital appreciation potential. In addition, Sands Capital looks for companies that have a significant competitive advantage, a leadership position or proprietary niche, a clear mission in an understandable business, financial strength and are valued rationally in relation to comparable companies, the market and the business prospects for that particular company.
Fund Performance
Touchstone Sands Capital Institutional Growth Fund underperformed its benchmark, the Russell 1000® Growth Index, for the 12-month period ended December 31, 2016. The Fund’s total return was -8.65 percent while the total return of the benchmark was 7.08 percent.
Market Environment
Uncertainty surrounding a number of macroeconomic issues, including the pace of U.S. interest rate hikes, fluctuation of energy prices, subdued global economic growth, a strong U.S. dollar and ramifications of the U.S. presidential election contributed to an acceleration of the risk aversion that was seen in 2015. The markets rewarded defensive sectors in the first half of the year, then, after a brief return to fundamentals during the third quarter, rotated into cyclically sensitive companies that theoretically could benefit from promised expansionary fiscal policies, deregulations and tax reform.
Meanwhile, share prices and valuations slumped for a number of faster growing companies, particularly following the U.S. presidential election. This can be seen in the defensive and cyclical sectors – such as Utilities and Energy – which now have significantly elevated price-to-earnings (P/E) multiples relative to historical levels. In contrast, the Information Technology and Health Care sectors are trading at a significant discount to historical levels. Perhaps even more remarkable, more than 50 percent of the top twenty companies that contributed to the Russell 1000®Growth Index in 2016 are also in the Russell 1000® Value Index.
On a broader level, within the Russell 1000® Growth Index, the fastest growing companies underperformed the slowest growers by almost 1200 basis points; the companies most sensitive to market volatility as measured by beta1, underperformed the least sensitive stocks by more than 600 basis points; and, companies with lower dividend yields – which is often viewed as a proxy for safety and near-term certainty – underperformed companies with higher yields by more than 1500 basis points. Given these dynamics, we concluded that 2016 was a year in which the Fund’s strategy that we were hired to execute – to find leading, true growth companies – was challenged by an acute “value tilt” in the market.
As long-term investors, we believe the current macro-driven uncertainties reinforce the benefits of thoroughly understanding individual companies and secular trends from which they may benefit. Regardless of the macro environment, the foundation of our investment process will always remain our bottom-up analysis of business fundamentals. Because the only certainty in financial markets might be the constant of change, we expect that selectively owning the right businesses will be the main driver of our ability to add value for clients with prudence over time.
Management's Discussion of Fund Performance (Unaudited) (Continued)
Portfolio Review
On a relative basis, the top five contributors to the Fund for calendar year 2016 were Facebook Inc., The Priceline Group Inc., Schlumberger Ltd., Edwards Lifesciences Corp. and Amazon.com Inc. Priceline remains a leader in the worldwide online travel accommodation reservation market. The company facilitates the booking of travel services by connecting consumers with travel service providers through its various platforms, including Booking.com, priceline.com and agoda.com (all brands within the Priceline Group Inc.). Its business continues to benefit from the secular growth of travel bookings shifting to web and mobile. In its most recent earnings report, the company reported robust revenue and earnings growth, with strong results across its various businesses, service offerings and key geographies. We expect the company’s build-out into mobile and ongoing global expansion to drive long-term growth. We believe Priceline’s business model is attractive, highly scalable and maintains unusually high margins. As the secular shift to online travel reservations continues, we believe the company can generate earnings growth in the mid-teens over the next five years.
The top five relative detractors from performance for the period were Regeneron Pharmaceuticals Inc., Alexion Pharmaceuticals Inc., LinkedIn Corp., LendingClub Corp. and Illumina Inc. LendingClub is the world’s largest online marketplace-lending platform with over $6 billion in cumulative loan originations since its founding in 2006. In 2016, the company faced improper loan securitization packaging that affected less than one percent of loan origination, causing investors on its platform to temporarily pause investment activity. Since then, the company took quick initiatives and has seen re-engaged investors and business momentum. LendingClub does not hold credit risk or have a levered balance sheet. Its ad-valorem, fee-based business model allows it to maintain pricing power regardless of the interest rate or debt issuance environment. We believe LendingClub is a leader and founding member of the nascent marketplace-lending industry, which we estimate is growing in excess of 100 percent per year. Approximately 70 percent of LendingClub’s cumulative loan originations was used for U.S. prime credit card refinancing, which is roughly a $350 billion market. We believe LendingClub has the opportunity to expand into all areas of the approximately $12 trillion U.S. consumer finance market over time.
We diligently monitor and continually evaluate the long-term growth prospects for the Fund’s companies while simultaneously seeking opportunities to add compelling new businesses. In the past year positions were initiated in two companies: ServiceNow Inc. and Monster Beverage Corp. Over the same time period four positions were eliminated: FMC Technologies Inc., LinkedIn Corp., Monsanto Co. and Cerner Corp.
ServiceNow Inc. is an innovative software-as-a-service provider to large enterprises focused on the information technology service management (ITSM) space. At a high level, ServiceNow’s ITSM products enable customers to manage, track and automate the services workflow between a requestor and fulfiller. While ServiceNow got its start developing IT help desk applications, the company has been able to grow beyond the help desk to use cases in human resources, facilities management, finance and customer service, among others. In our view, ServiceNow is the leading ITSM provider, as the competitive environment is fairly benign. More recently, the company has been expanding into IT operations management (ITOM), which we believe increases its total addressable market. We believe ITOM, which encompasses everything related to the day-to-day operations of IT infrastructure, is a natural complement to ServiceNow’s ITSM offering. Given its dominant position in ITSM and early-stage opportunities in ITOM, we believe ServiceNow can grow revenue approximately 30 percent per year over the next five years, on average.
Monster Beverage Corp. is a leading specialty beverage company, focused exclusively on energy drinks. Our research indicates that energy drinks will remain one of the industry’s fastest-growing and most attractive categories, and Monster is the market leader in the U.S. with approximately a 40 percent share. Monster’s prospects are also favorable internationally, where we believe energy drink consumption will continue to rise consistently over the next decade, led by emerging market consumers in countries like China, India, Russia, Mexico and Brazil. We believe that Monster’s strong brand, marketing skills, competitive pricing strategy, proven ability
Management's Discussion of Fund Performance (Unaudited) (Continued)
to innovate with new products and global distribution partnership with The Coca-Cola Co. will allow the company to grow its share in this expanding market. Altogether, we expect these factors to support consistent low- to mid-teens revenue growth. Meanwhile, we believe Monster’s capital-light business model and the high-incremental margins it generates with scale should translate into even faster growth in earnings and cash flow. We expect approximately 20 percent annualized earnings growth from Monster over the next five years.
While FMC Technologies Inc. remains a leading, global provider of subsea equipment used to produce and process oil and gas from offshore wells, we no longer believe its fundamentals are strong enough to insulate it from negative sentiment and commodity price cycles, two factors that can have an outsized impact on the business results of energy companies. At the onset of the current energy downcycle, we recognized that FMC’s growth would likely be pressured, but believed the differentiated nature of its technology and its sizable backlog would be sufficient to drive continued growth. However, we believe the duration of the downturn, coupled with FMC’s significant exposure to capital-intensive projects and its longer-cycle business model, means it will likely take several years for the company to return to profitable growth, even after oil prices and upstream capital expenditures rebound to more sustainable levels.
We sold LinkedIn Corp. due to its pending acquisition by Microsoft Corp., which was completed in December of 2016. In our view, Microsoft’s interest confirms two assessments we had made of LinkedIn: first, the company’s data is a unique and strategically valuable asset and, second, the path to capturing the value of that data would continue to be volatile. LinkedIn’s largest business line, Talent Solutions, is maturing, while its marketing and sales businesses are progressing slower than expected. Although we expect each business to become larger over time, we expect the growth path will be uneven. We were willing to accept this volatility given the sizable long-term potential; however, LinkedIn’s willingness to sell suggests the volatility might be even greater than we believed. While we are disappointed we can no longer invest in LinkedIn, we believe Microsoft’s offer was fair.
We sold Monsanto Co. due to the uncertainty surrounding its acquisition by Bayer AG. We expect a lengthy regulatory process and, even if the deal materializes, the timing of the actual transaction remains ambiguous. In the interim, we believe the company’s share price could be subject to heightened volatility, as incremental news surrounding the deal’s regulatory approval will weigh heavily on investors’ minds. Our research indicates that there are better opportunities that are more aligned with our investment criteria.
We sold Cerner Corp. due to its maturing growth profile and increased industry uncertainties that we believe create risk to the sustainability of its above-average growth. Although Cerner’s competitive position has strengthened, our research indicates that the long-term secular tailwinds that have benefitted health care information technology (HCIT) for the last several years are coming under pressure. The regulatory requirements to achieve Meaningful Use—a government incentive program to spur HCIT adoption—have recently been reduced, making this a less important driver of demand going forward. In addition, greater uncertainty around hospitals’ futures—such as changes in reimbursement models or potential changes in the Affordable Care Act—may contribute to HCIT purchasing delays. While we are optimistic about the long-term opportunity for Cerner’s new Population Health solutions, we believe this segment is still too small to drive growth right now, and it could be several years before it becomes financially meaningful. Given the volatility in the markets, we believe there are better opportunities that are more aligned with our investment criteria currently.
Outlook
We view secular trends, innovation and company-specific competitive advantages as key to driving growth through a variety of economic environments. For a business to possess the above-average earnings growth potential we require, it is often a key innovator or vital facilitator within an attractive industry that is benefitting from positive secular change. Secular trends are distinct from short-term economic factors as they tend to persist through market cycles and can provide powerful structural tailwinds that enhance the sustainability of a business’s
Management's Discussion of Fund Performance (Unaudited) (Continued)
growth for many years. We believe our long-term investment horizon allows us to capture the benefit of these characteristics and realize the ultimate earnings power of a company, while weathering volatility over shorter periods. Furthermore, our approach—active, concentrated and benchmark-agnostic—enables us to have outsized exposure to companies within this sphere that are the best fits with our six investment criteria. We believe the majority of businesses in the Fund’s portfolio benefit from one or more secular trends. However, we have identified four broad trends that together comprise a majority of the portfolio:
| • | Retail Revolution – E-commerce: E-commerce is the fastest growing segment of retail sales, but only accounts for about seven percent of the total worldwide retail market. As a proportion of total retail sales, e-commerce is expected to nearly double by 2019. Brands now have the ability to directly interact with consumers through novel mediums, such as social media and lifestyle apps, and become embedded in their daily routines. Tools such as Amazon Prime and Visa Checkout reduce the friction associated with online payment. Fund beneficiaries include Alibaba Group Holding Ltd., Amazon.com Inc., Facebook Inc., The Priceline Group Inc. and Visa Inc. |
| • | Union of Healthcare and Technology: Major areas of unmet need continue to exist in the treatment of disease. However, improved understanding of disease biology and new approaches to treatment are enabling more productive drug development. Additionally, we expect genomic sequencing and health care information systems to facilitate precision medicine, enabling physicians to provide more targeted care. We are also witnessing the rise of minimally invasive surgical technologies, which have quality of life advantages for the patient and efficiency benefits for providers, leading them to increasingly become the standard of care. Portfolio beneficiaries include Alexion Pharmaceuticals Inc., BioMarin Pharmaceutical Inc., Edwards Lifesciences Corp., Illumina Inc. and Regeneron Pharmaceuticals Inc. |
| • | Software-as-a-Service (SaaS): In our view, information technology spending is shifting toward innovations that make enterprises more agile and efficient. Cloud-based software is a key facilitator of this shift. We believe fast deployment, scalability, easy and frequent updates and lower total cost of ownership create a compelling customer value proposition. SaaS businesses tend to benefit from revenue visibility, “sticky” clientele, margin leverage opportunities and low customer acquisition costs. Fund beneficiaries include Adobe Systems Inc., Amazon.com Inc., athenahealth Inc., Palo Alto Networks Inc. and Splunk Inc. |
| • | Data-Driven Decision Making: We believe companies with large, proprietary pools of consumer data and tools that use this data to create unique content have sizable monetization opportunities. Advertising is already well on its way toward transformation, as access to consumer data is enabling companies to create targeted, more effective ads. At the micro level, companies are beginning to use predictive analytics to generate insights from their own pools of data. Fund beneficiaries include Alphabet Inc., Baidu Inc., Facebook Inc., Netflix Inc. and Splunk Inc. |
In a volatile market, stock prices tend to move together as a group, which can result in valuations becoming disconnected from businesses’ long-term growth prospects. When volatility is driven by fear, investors’ time horizons tend to shorten, and fast-growing, disruptive companies that are investing in their growth and therefore unlikely to realize their full potential for years (i.e., the kinds of businesses the Fund seeks to own), often suffer from outsized pressure. During these periods, some investors appear inclined to trade a potentially larger long-term total return for the near-term surety of stable cash flows, dividends and/or lower, more secure growth. Drug pipelines, potential new products and other types of future optionality are often ignored. A company that is under-earning its full potential today in order to become larger tomorrow can suddenly be viewed as less valuable than one that is growing more slowly, further along the maturity curve, and not investing in its own growth.
We believe the Fund owns companies that are positioned to deliver strong business results and earnings growth over a five- to ten-year investment horizon. Our focus on the sustainability of a business’s future earnings growth typically steers us toward companies we believe are benefiting from secular trends that should provide powerful
Management's Discussion of Fund Performance (Unaudited) (Continued)
growth tailwinds throughout economic cycles. We have high conviction in the long-term growth estimates for the Fund’s portfolio companies and believe they can deliver the growth necessary to support above average relative and absolute returns over the next several years.
The Fund’s sector allocations are a residual of our bottom-up, fundamental approach. Our six investment criteria typically lead us to innovative businesses that are creating new or disrupting existing markets, and/or benefiting from powerful secular tailwinds. Our approach to investment research, portfolio construction and risk management results in a Fund that we believe is naturally diversified across industries and businesses at different stages of their respective growth lifecycles. We expect to continue to have higher weights in key growth sectors, including Consumer, Health Care and Information Technology, and lower weights in highly-cyclical sectors such as Energy, Industrials and Financials.
1Beta is a measure of the volatility of a portfolio relative to its benchmark.
Management's Discussion of Fund Performance (Unaudited) (Continued)
Comparison of the Change in Value of a $500,000 Investment in the
Touchstone Sands Capital Institutional Growth Fund and the Russell 1000® Growth Index
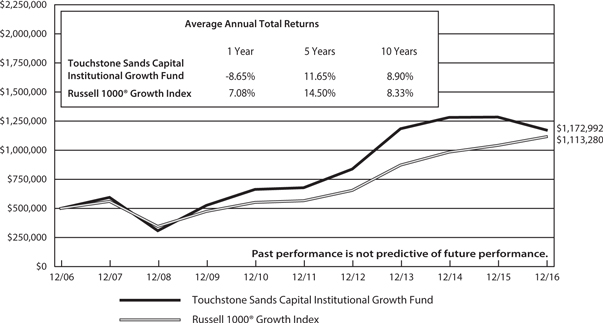
The performance of the above Fund does not reflect the deduction of taxes that a shareholder would pay on Fund distributions or the redemption of Fund shares.
The inception date of the Fund was January 21, 2005.
Note to Chart
Russell 1000® Growth Index measures the performance of those Russell 1000 companies with higher price-to-book ratios and higher forecasted growth values.
The Frank Russell Company (FRC) is the source and owner of the Index data contained or reflected in this material and all trademarks and copyrights related thereto. The material may contain confidential information and unauthorized use, disclosure, copying, dissemination or redistribution is strictly prohibited. This is a Touchstone Investments presentation of the data, and FRC is not responsible for the formatting or configuration of this material or for any inaccuracy in the presentation thereof.
Tabular Presentation of Portfolio of Investments (Unaudited)
December 31, 2016
The table below provides the Fund’s sector allocation. We hope it will be useful to shareholders as it summarizes key information about the Fund’s investments.
| Touchstone Sands Capital Institutional Growth Fund |
| Sector Allocation* | (% of Net Assets) | |
| Information Technology | | 48.1 | % |
| Consumer Discretionary | | 20.5 | |
| Health Care | | 19.0 | |
| Financials | | 4.1 | |
| Consumer Staples | | 3.0 | |
| Energy | | 2.3 | |
| Investment Funds | | 3.7 | |
| Other Assets/Liabilities (Net) | | (0.7 | ) |
| Total | | 100.0 | % |
| | | |
* Sector Classifications are based upon the Global Industry Classification Standard (GICS®).
Portfolio of Investments
Touchstone Sands Capital Institutional Growth Fund – December 31, 2016
| | | | | | Market | |
| �� | | Shares | | | Value | |
| | | | | | | |
| Common Stocks — 97.0% | | | | | | | | |
| | | | | | | | | |
| Information Technology — 48.1% | | | | | | | | |
| Adobe Systems, Inc.* | | | 907,074 | | | $ | 93,383,268 | |
| Alibaba Group Holding Ltd. ADR* | | | 1,025,083 | | | | 90,012,538 | |
| Alphabet, Inc. - Class A* | | | 127,050 | | | | 100,680,772 | |
| Alphabet, Inc. - Class C* | | | 48,000 | | | | 37,047,360 | |
| Baidu, Inc. ADR* | | | 405,266 | | | | 66,629,783 | |
| Facebook, Inc. - Class A* | | | 1,163,770 | | | | 133,891,738 | |
| Mobileye NV (Israel)* | | | 878,652 | | | | 33,494,214 | |
| Palo Alto Networks, Inc.* | | | 407,655 | | | | 50,977,258 | |
| salesforce.com, Inc.* | | | 1,753,195 | | | | 120,023,730 | |
| ServiceNow, Inc.* | | | 414,000 | | | | 30,776,760 | |
| Splunk Inc.* | | | 1,077,621 | | | | 55,120,314 | |
| Visa, Inc. - Class A | | | 2,487,901 | | | | 194,106,036 | |
| | | | | | | | 1,006,143,771 | |
| | | | | | | | | |
| Consumer Discretionary — 20.5% | | | | | | | | |
| Amazon.com, Inc.* | | | 174,590 | | | | 130,919,803 | |
| Chipotle Mexican Grill, Inc.* | | | 128,000 | | | | 48,296,960 | |
| Netflix, Inc.* | | | 697,000 | | | | 86,288,600 | |
| Priceline Group, Inc. (The)* | | | 91,002 | | | | 133,414,392 | |
| Under Armour, Inc. - Class A*† | | | 568,000 | | | | 16,500,400 | |
| Under Armour, Inc. - Class C* | | | 571,287 | | | | 14,379,294 | |
| | | | | | | | 429,799,449 | |
| | | | | | | | | |
| Health Care — 19.0% | | | | | | | | |
| Alexion Pharmaceuticals, Inc.* | | | 600,896 | | | | 73,519,626 | |
| athenahealth, Inc.* | | | 289,234 | | | | 30,418,740 | |
| Biogen, Inc.* | | | 161,508 | | | | 45,800,439 | |
| BioMarin Pharmaceutical, Inc.* | | | 656,928 | | | | 54,419,916 | |
| Edwards Lifesciences Corp.* | | | 527,314 | | | | 49,409,322 | |
| Illumina, Inc.* | | | 395,589 | | | | 50,651,216 | |
| Incyte Corp.* | | | 393,182 | | | | 39,424,359 | |
| Regeneron Pharmaceuticals, Inc.* | | | 148,761 | | | | 54,608,675 | |
| | | | | | | | 398,252,293 | |
| | | | | | | | | |
| Financials — 4.1% | | | | | | | | |
| Charles Schwab Corp. (The) | | | 1,792,500 | | | | 70,749,975 | |
| LendingClub Corp.* | | | 3,070,000 | | | | 16,117,500 | |
| | | | | | | | 86,867,475 | |
| | | | | | | | | |
| Consumer Staples — 3.0% | | | | | | | | |
| Monster Beverage Corp.* | | | 1,398,023 | | | | 61,988,340 | |
| | | | | | | | | |
| Energy — 2.3% | | | | | | | | |
| Schlumberger Ltd. (Curacao) | | | 566,672 | | | | 47,572,115 | |
| Total Common Stocks | | | | | | $ | 2,030,623,443 | |
| | | | | | | | | |
| Investment Funds — 3.7% | | | | | | | | |
| Dreyfus Government Cash | | | | | | | | |
| Management, Institutional Shares, | | | | | | | | |
| 0.45%∞Ω | | | 60,440,020 | | | $ | 60,440,020 | |
| Invesco Government & Agency | | | | | | | | |
| Portfolio, Institutional Class, | | | | | | | | |
| 0.43%**∞Ω | | | 16,925,062 | | | | 16,925,062 | |
| Total Investment Funds | | | | | | $ | 77,365,082 | |
| | | | | | | | | |
| Total Investment Securities — 100.7% | | | | | | | | |
| (Cost $1,378,193,965) | | | | | | $ | 2,107,988,525 | |
| | | | | | | | | |
| Liabilities in Excess of Other Assets — (0.7%) | | | | | | | (14,039,674 | ) |
| | | | | | | | | |
| Net Assets — 100.0% | | | | | | $ | 2,093,948,851 | |
| * | Non-income producing security. |
| ** | Represents collateral for securities loaned. |
| † | All or a portion of the security is on loan. The total market value of the securities on loan as of December31,2016 was $16,454,966. |
| Ω | Represents the 7-day SEC yield as of December 31, 2016. |
Portfolio Abbreviations:
ADR - American Depositary Receipt
Other Information:
The inputs or methodology used for valuing securities may not be an indication of the risk associated with investing in those securities. For more information on valuation inputs, and their aggregation into the levels used in the table below, please refer to the security valuation section in the accompanying Notes to Financial Statements.
| Valuation Inputs at Reporting Date: | |
| Description | | Level 1 | | | Level 2 | | | Level 3 | | | Total | |
| Common Stocks | | $ | 2,030,623,443 | | | $ | — | | | $ | — | | | $ | 2,030,623,443 | |
| Investment Funds | | | 77,365,082 | | | | — | | | | — | | | | 77,365,082 | |
| Total | | $ | 2,107,988,525 | | | $ | — | | | $ | — | | | $ | 2,107,988,525 | |
See accompanying Notes to Financial Statements.
Statement of Assets and Liabilities
December 31, 2016
| | | Touchstone | |
| | | Sands Capital | |
| | | Institutional | |
| | | Growth | |
| | | Fund | |
| Assets | | | | |
| Investments, at cost | | $ | 1,378,193,965 | |
| Investments, at market value (A) | | $ | 2,107,988,525 | |
| Dividends receivable | | | 316,836 | |
| Receivable for capital shares sold | | | 4,009,991 | |
| Receivable for investments sold | | | 12,729,846 | |
| Receivable for securities lending income | | | 153,293 | |
| Other assets | | | 35,751 | |
| Total Assets | | | 2,125,234,242 | |
| | | | | |
| Liabilities | | | | |
| Payable for return of collateral for securities on loan | | | 16,925,062 | |
| Payable for capital shares redeemed | | | 6,953,267 | |
| Payable for investments purchased | | | 5,906,138 | |
| Payable to Advisor | | | 1,452,265 | |
| Other accrued expenses and liabilities | | | 48,659 | |
| Total Liabilities | | | 31,285,391 | |
| | | | | |
| Net Assets | | $ | 2,093,948,851 | |
| | | | | |
| Net assets consist of: | | | | |
| Paid-in capital | | $ | 1,337,217,802 | |
| Accumulated net realized gains on investments | | | 26,936,489 | |
| Net unrealized appreciation on investments | | | 729,794,560 | |
| Net assets applicable to shares outstanding | | $ | 2,093,948,851 | |
| | | | | |
| Shares of beneficial interest outstanding (unlimited number of shares authorized, no par value) | | | 114,439,584 | |
| Net asset value, offering price and redemption price per share | | $ | 18.30 | |
| | | | | |
| (A) Includes market value of securities on loan of: | | $ | 16,454,966 | |
See accompanying Notes to Financial Statements.
Statement of Operations
For the Year Ended December 31, 2016
| | | Touchstone | |
| | | Sands Capital | |
| | | Institutional | |
| | | Growth | |
| | | Fund | |
| Investment Income | | | | |
| Dividends(A) | | $ | 5,741,543 | |
| Income from securities loaned | | | 729,341 | |
| Total Investment Income | | | 6,470,884 | |
| | | | | |
| Expenses | | | | |
| Unified management fee | | | 20,349,864 | |
| Registration fees | | | 76,252 | |
| Other expenses | | | 116,160 | |
| Net Expenses | | | 20,542,276 | |
| | | | | |
| Net Investment Loss | | | (14,071,392 | ) |
| | | | | |
| Realized and Unrealized Gains (Losses) on Investments | | | | |
| Net realized gains on investments | | | 63,066,070 | |
| Net change in unrealized appreciation (depreciation) on investments | | | (338,927,057 | ) |
| | | | | |
| Net Realized and Unrealized Loss on Investments | | | (275,860,987 | ) |
| | | | | |
| Change in Net Assets Resulting from Operations | | $ | (289,932,379 | ) |
| | | | | |
| (A) Net of foreign tax withholding of: | | $ | 34,347 | |
See accompanying Notes to Financial Statements.
Statements of Changes in Net Assets
| | | Touchstone | |
| | | Sands Capital | |
| | | Institutional | |
| | | Growth | |
| | | Fund | |
| | | For the | | | For the | |
| | | Year | | | Year | |
| | | Ended | | | Ended | |
| | | December 31, | | | December 31, | |
| | | 2016 | | | 2015 | |
| From Operations | | | | | | | | |
| Net investment loss | | $ | (14,071,392 | ) | | $ | (13,703,131 | ) |
| Net realized gains on investments | | | 63,066,070 | | | | 230,724,219 | |
| Net change in unrealized appreciation (depreciation) on investments | | | (338,927,057 | ) | | | (207,683,794 | ) |
| Change in Net Assets from Operations | | | (289,932,379 | ) | | | 9,337,294 | |
| | | | | | | | | |
| Distributions to Shareholders from: | | | | | | | | |
| Net realized gains | | | (121,557,240 | ) | | | (170,743,963 | ) |
| | | | | | | | | |
| Share Transactions | | | | | | | | |
| Proceeds from shares sold | | | 296,156,563 | | | | 506,976,686 | |
| Reinvestment of distributions | | | 118,395,240 | | | | 164,306,117 | |
| Cost of shares redeemed | | | (1,276,005,461 | ) | | | (1,057,782,895 | ) |
| Change in Net Assets from Share Transactions | | | (861,453,658 | ) | | | (386,500,092 | ) |
| | | | | | | | | |
| Total Decrease in Net Assets | | | (1,272,943,277 | ) | | | (547,906,761 | ) |
| | | | | | | | | |
| Net Assets | | | | | | | | |
| Beginning of period | | | 3,366,892,128 | | | | 3,914,798,889 | |
| End of period | | $ | 2,093,948,851 | | | $ | 3,366,892,128 | |
| | | | | | | | | |
| Accumulated Net Investment Income (Loss) | | $ | — | | | $ | — | |
| | | | | | | | | |
| Share Transactions | | | | | | | | |
| Shares issued | | | 15,495,843 | | | | 22,912,225 | |
| Shares reinvested | | | 6,331,296 | | | | 7,837,712 | |
| Shares redeemed | | | (66,354,054 | ) | | | (47,715,980 | ) |
| Change in Shares Outstanding | | | (44,526,915 | ) | | | (16,966,043 | ) |
See accompanying Notes to Financial Statements.
Financial Highlights
Touchstone Sands Capital Institutional Growth Fund
Selected Data for a Share Outstanding Throughout Each Period
| | | Year Ended December 31, | |
| | | 2016 | | | 2015 | | | 2014 | | | 2013 | | | 2012 | |
| Net asset value at beginning of period | | $ | 21.18 | | | $ | 22.25 | | | $ | 22.34 | | | $ | 17.12 | | | $ | 14.36 | |
| Income (loss) from investment operations: | | | | | | | | | | | | | | | | | | | | |
| Net investment income (loss) | | | (0.12 | ) | | | (0.09 | ) | | | (0.08 | ) | | | (0.07 | ) | | | 0.01 | |
| Net realized and unrealized gains (losses) on investments | | | (1.69 | ) | | | 0.13 | | | | 1.93 | | | | 7.06 | | | | 3.40 | |
| Total from investment operations | | | (1.81 | ) | | | 0.04 | | | | 1.85 | | | | 6.99 | | | | 3.41 | |
| Distributions from: | | | | | | | | | | | | | | | | | | | | |
| Net investment income | | | — | | | | — | | | | — | | | | (— | )(A) | | | (0.01 | ) |
| Realized capital gains | | | (1.07 | ) | | | (1.11 | ) | | | (1.94 | ) | | | (1.77 | ) | | | (0.64 | ) |
| Total distributions | | | (1.07 | ) | | | (1.11 | ) | | | (1.94 | ) | | | (1.77 | ) | | | (0.65 | ) |
| Net asset value at end of period | | $ | 18.30 | | | $ | 21.18 | | | $ | 22.25 | | | $ | 22.34 | | | $ | 17.12 | |
| Total return | | | (8.65 | %) | | | 0.22 | % | | | 8.39 | % | | | 41.28 | % | | | 23.75 | % |
| Net assets at end of period (000's) | | $ | 2,093,949 | | | $ | 3,366,892 | | | $ | 3,914,799 | | | $ | 3,800,645 | | | $ | 2,250,073 | |
| Ratio to average net assets: | | | | | | | | | | | | | | | | | | | | |
| Net expenses | | | 0.79 | % | | | 0.79 | % | | | 0.79 | % | | | 0.80 | % | | | 0.79 | % |
| Gross expenses | | | 0.79 | % | | | 0.79 | % | | | 0.79 | % | | | 0.80 | % | | | 0.79 | % |
| Net investment income (loss) | | | (0.54 | %) | | | (0.37 | %) | | | (0.35 | %) | | | (0.40 | %) | | | 0.06 | % |
| Portfolio turnover rate | | | 40 | % | | | 33 | % | | | 27 | % | | | 37 | % | | | 31 | % |
(A) Less than $0.005 per share.
See accompanying Notes to Financial Statements.
Notes to Financial Statements
December 31, 2016
1. Organization
The Touchstone Institutional Funds Trust (the “Trust”) is registered under the Investment Company Act of 1940, as amended (the “1940 Act”), as an open-end management investment company. The Trust was established as a Delaware statutory trust pursuant to an Agreement and Declaration of Trust dated May 30, 2002. The Trust consists of one fund, the Touchstone Sands Capital Institutional Growth Fund (“Sands Capital Institutional Growth Fund” or the “Fund”), which is an open-end, non-diversified management investment company.
The Agreement and Declaration of Trust permits the Trust to issue an unlimited number of shares of beneficial interest of the Fund. The Fund offers a single class of shares. The Fund’s prospectus provides a description of the Fund’s investment goals, policies, and strategies along with information on the class of shares currently being offered.
2. Significant Accounting Policies
The following is a summary of the Fund’s significant accounting policies:
The Fund is an investment company that follows the accounting and reporting guidance of Accounting Standards Codification Topic 946 applicable to investment companies.
Security valuation and fair value measurements — U.S. generally accepted accounting principles (“U.S. GAAP”) define fair value as the price the Fund would receive to sell an asset or pay to transfer a liability in an orderly transaction between market participants at the measurement date. All investments in securities are recorded at their fair value. The Fund defines the term “market value”, as used throughout this report, as the estimated fair value. The Fund uses various methods to measure fair value of its portfolio securities on a recurring basis. U.S. GAAP fair value measurement standards require disclosure of a hierarchy that prioritizes inputs to valuation methods.
These inputs are summarized in the three broad levels listed below:
| • Level 1 – | quoted prices in active markets for identical securities |
| | |
| • Level 2 – | other significant observable inputs (including quoted prices for similar securities, interest rates, prepayment speeds, credit risk, etc.) |
| | |
| • Level 3 – | significant unobservable inputs (including the Fund’s own assumptions in determining the fair value of investments) |
The inputs or methodology used for valuing securities are not necessarily an indication of the risk associated with investing in those securities.
The aggregate value by input level, as of December 31, 2016, for the Fund’s investments, as well as a reconciliation of assets for which significant unobservable inputs (Level 3) were used in determining value, if applicable, is included in the Fund’s Portfolio of Investments, which also includes a breakdown of the Fund’s investments by sector allocation. The Fund did not hold any Level 3 categorized securities during the year ended December 31, 2016.
Changes in valuation techniques may result in transfers into or out of an investment’s assigned level within the hierarchy. All transfers in and out of the levels are recognized at the value at the end of the period. During the year ended December 31, 2016, there were no transfers between Levels 1, 2 and 3 for the Fund.
The Fund’s portfolio securities are valued as of the close of the regular session of trading on the New York Stock Exchange (“NYSE”) (currently 4:00 p.m., Eastern time). Portfolio securities traded on stock exchanges are valued at the last reported sale price, official close price, or last bid price if no sales are reported. Portfolio securities quoted by NASDAQ are valued at the NASDAQ Official Closing Price (“NOCP”) or from the
Notes to Financial Statements (Continued)
primary exchange on which the security trades. To the extent these securities are actively traded, they are categorized in Level 1 of the fair value hierarchy. Shares of mutual funds in which the Fund invests are valued at their respective net asset values (“NAV”) as reported by the underlying funds (the “Underlying Funds”) and are categorized in Level 1.
Securities mainly traded on a non-U.S. exchange or denominated in foreign currencies are generally valued according to the preceding closing values on that exchange, translated to U.S. dollars using currency exchange rates as of the close of regular trading on the NYSE, and are generally categorized in Level 1. However, if an event that may change the value of a security occurs after the time that the closing value on the non-U.S. exchange was determined, but before the close of regular trading on the NYSE, the security may be priced based on fair value and generally categorized in Level 2. This may cause the value of the security, if held on the books of the Fund, to be different from the closing value on the non-U.S. exchange and may affect the calculation of the Fund’s NAV.
The Fund may use fair value pricing under the following circumstances, among others:
| • | If the value of a security has been materially affected by events occurring before the Fund’s pricing time but after the close of the primary markets on which the security is traded. |
| • | If the exchange on which a portfolio security is principally traded closes early or if trading in a particular portfolio security was halted during the day and did not resume prior to the Fund’s NAV calculation. |
| • | If a security is so thinly traded that reliable market quotations are unavailable due to infrequent trading. |
| • | If the validity of market quotations is not reliable. |
Securities held by the Fund that do not have readily available market quotations, significant observable inputs, or securities for which the available market quotations are not reliable, are priced at their estimated fair value using procedures approved by the Fund’s Board of Trustees and are generally categorized in Level 3.
Investment companies — The Fund may invest in securities of other investment companies, including exchange-traded funds (“ETFs”), open-end funds and closed-end funds. Open-end funds are investment companies that issue new shares continuously and redeem shares daily. Closed-end funds are investment companies that typically issue a fixed number of shares that trade on a securities exchange or over-the-counter (“OTC”). An ETF is an investment company that typically seeks to track the performance of an index by holding in its portfolio shares of all the companies, or a representative sample of the companies, that are components of a particular index. ETF shares are traded on a securities exchange based on their market value. The risks of investment in other investment companies typically reflect the risks of the types of securities in which the other investment companies invest. Investments in ETFs and closed-end funds are subject to the additional risk that their shares may trade at a premium or discount to their NAV. When the Fund invests in another investment company, shareholders of the Fund indirectly bear their proportionate share of the other investment company’s fees and expenses, including operating, registration, trustee, licensing and marketing, as well as their share of the Fund’s fees and expenses.
Portfolio securities loaned — The Fund may lend its portfolio securities. Lending portfolio securities exposes the Fund to the risk that the borrower may fail to return the loaned securities or may not be able to provide additional collateral or that the Fund may experience delays in recovery of the loaned securities or loss of rights in the collateral if the borrower fails financially. To minimize these risks, the borrower must agree to maintain cash collateral with the Fund’s custodian. The loaned securities are secured by collateral valued at least equal, at all times, to the market value of the loaned securities plus accrued interest, if any. When the collateral falls below specified amounts, the lending agent will use its best effort to obtain additional collateral on the next business day to meet required amounts under the security lending agreement. The cash collateral is reinvested by the Fund’s custodian into an approved investment vehicle. The approved investment vehicle is subject to market risk.
Notes to Financial Statements (Continued)
As of December 31, 2016, the Fund loaned securities and received collateral as follows:
| | | | | Market | | | Market | | | | |
| | | | | Value of | | | Value of | | | | |
| | | | | Securities | | | Collateral | | | | |
| | | Security Type | | Loaned* | | | Received** | | | Net Amount | |
| Sands Capital Institutional Growth Fund | | Common Stock | | $ | 16,454,966 | | | $ | 16,925,062 | | | $ | 470,096 | |
* The remaining contractual maturity is overnight for all securities.
** Gross amounts of recognized liabilities for securities lending is included in the Statement of Assets and Liabilities.
All cash collateral is received, held, and administered by the Fund’s custodian for the benefit of the lending Fund in its custody account or other account established for the purpose of holding collateral.
By participating in securities lending, the Fund receives compensation in the form of fees. Securities lending income is derived from lending long securities from the Fund to creditworthy approved borrowers at rates that are determined based on daily trading volumes, float, short-term interest rates and market liquidity. When the Fund lends securities, it retains the interest or dividends on the investment of any cash received as collateral, and the Fund continues to receive interest or dividends on the loaned securities.
Unrealized gain or loss on the market value of the loaned securities that may occur during the term of the loan is recognized by the Fund. The Fund has the right under the lending agreement to recover any loaned securities from the borrower on demand.
Share valuation — The NAV per share of the Fund is calculated daily by dividing the total value of the Fund’s assets, less liabilities, by its number of outstanding shares.
Investment income — Dividend income from securities is recognized on the ex-dividend date, net of foreign withholding taxes, if any, which are reduced by any amounts reclaimable by the Fund, where applicable. Interest income from securities is recorded on the basis of interest accrued, premium amortized and discount accreted.
Distributions to shareholders — The Fund intends to distribute to its shareholders substantially all of its income and capital gains. The Fund declares and distributes net investment income, if any, quarterly as a dividend to shareholders. The Fund makes distributions of capital gains, if any, at least annually, net of applicable capital loss carryforwards. Income distributions and capital gain distributions are determined in accordance with income tax regulations. Recognition of the Fund’s net investment income from investments in Underlying Funds is affected by the timing of dividend declarations by the Underlying Funds.
Allocations — Expenses not directly billed to the Fund are allocated proportionally among all the Funds in the Trust, and, if applicable, Touchstone Funds Group Trust, Touchstone Investment Trust, Touchstone Strategic Trust and Touchstone Variable Series Trust, (collectively with the Trust, “Touchstone Fund Complex”), daily in relation to net assets of each Fund or another reasonable measure.
Security transactions — Security transactions are reflected for financial reporting purposes as of the trade date. Realized gains and losses on sales of portfolio securities are calculated using the identified cost basis.
Estimates — The preparation of financial statements in conformity with U.S. GAAP requires management to make estimates and assumptions that affect the reported amounts of assets and liabilities and disclosure of contingent assets and liabilities at the date of the financial statements and the reported amounts of income and expenses during the reporting period. Actual results could differ from those estimates.
Expenses — The Fund pays a unified management fee to Touchstone Advisors, Inc. (“Advisor” or “Administrator”) for providing or procuring advisory, administration and other services. The Advisor is responsible for compensating any third party engaged to provide services under its supervision and is also responsible for payment of the
Notes to Financial Statements (Continued)
fees of the independent Trustees, custodian, independent auditor, legal counsel (excluding costs in connection with certain litigation or administrative actions), and the transfer and dividend disbursing agent. The Fund will pay all state registration fees, interest, taxes, dues, fees, or similar costs, brokerage or other transaction costs, and certain extraordinary expenses.
Regulatory Updates— In October 2016, the Securities and Exchange Commission released its Final Rule on Investment Company Reporting Modernization (the “Rule”). The Rule contains amendments to Regulation S-X which impact financial statement presentation, particularly the presentation of derivative investments. Although still evaluating the impact of the Rule, management believes that many of the Regulation S-X amendments are consistent with the Fund’s current financial statement presentation and expects that the Fund will comply with the Rule’s Regulation S-X amendments by the August 1, 2017 compliance date.
3. Investment Transactions
Investment transactions (excluding short-term investments and U.S. Government securities) were as follows for the year ended December 31, 2016:
| | | Sands Capital | |
| | | Institutional | |
| | | Growth Fund | |
| Purchases of investment securities | | $ | 1,027,603,583 | |
| Proceeds from sales and maturities | | $ | 2,050,250,501 | |
There were no purchases or proceeds from sales and maturities of U.S. Government securities by the Fund for the year ended December 31, 2016.
4. Transactions with Affiliates and Other Related Parties
Certain officers of the Trust are also officers of the Advisor, Touchstone Securities, Inc. (the “Underwriter”) or BNY Mellon Investment Servicing (U.S.) Inc. (“BNY Mellon”), the Sub-Administrator and Transfer Agent to the Fund. Such officers receive no compensation from the Trust. The Advisor and the Underwriter are each wholly-owned, indirect subsidiaries of Western & Southern Financial Group, Inc.
On behalf of the Fund, the Advisor pays each Independent Trustee a quarterly retainer plus additional retainers to the Lead Independent Trustee and the chairs of each standing committee. Interested Trustees do not receive compensation from the Fund. Each Independent Trustee will also receive compensation for each board meeting and committee meeting attended. Each standing committee chair will receive additional compensation for each committee meeting that he or she oversees.
MANAGEMENT & EXPENSE LIMITATION AGREEMENTS
The Advisor provides general investment supervisory services for the Fund, under terms of an advisory agreement (the “Advisory Agreement”). Under the Advisory Agreement, the Fund pays the Advisor a fee, which is computed and accrued daily and paid monthly, at an annual rate of 0.78% of the average daily net assets of the Fund. Under the Advisory Agreement, the Advisor also provides administrative services to the Trust and pays all operating expenses on the Trust’s behalf, excluding state registration fees, interest, taxes, dues, fees, or similar costs, brokerage commissions; other expenditures which are capitalized in accordance with U.S. GAAP; the cost of “Acquired Fund Fees and Expenses”, if any; and other extraordinary expenses not incurred in the ordinary course of business.
The Advisor has entered into an investment sub-advisory agreement with Sands Capital Management, LLC (the “Sub-Advisor”), a Securities and Exchange Commission (“SEC”) registered investment advisor. The Advisor, not the Fund, pays sub-advisory fees to the Sub-Advisor.
Notes to Financial Statements (Continued)
The Advisor entered into an expense limitation agreement (the “Expense Limitation Agreement”) to contractually limit the annual operating expenses of the Fund, excluding: dividend and interest expenses relating to short sales; interest; taxes; brokerage commissions and other transaction costs; portfolio transactions and investment related expenses; other expenditures which are capitalized in accordance with U.S. GAAP; the cost of “Acquired Fund Fees and Expenses”, if any; and other extraordinary expenses not incurred in the ordinary course of business. The maximum annual operating expense limit in any year with respect to the Fund, as a percentage of the average daily net assets of the Fund, is 0.80%. The Advisor has agreed to waive advisory fees and reimburse expenses in order to maintain the expense limitation for the Fund through at least April 29, 2017. For the year ended December 31, 2016, the Advisor did not waive advisory fees or reimburse any operating expenses.
Under the terms of the Expense Limitation Agreement, the Advisor is entitled to recover, subject to approval by the Fund’s Board, such amounts waived or reimbursed for a period of up to three years from the year in which the Advisor reduced its compensation or assumed expenses for the Fund. No recoupment will occur unless the Fund’s operating expenses are below the expense limitation amount in effect at the time of the waiver or reimbursement. Since the effective date, the Advisor has not waived or reimbursed any expenses, therefore there are no amounts currently eligible for recoupment.
INTERFUND TRANSACTIONS
The Fund may engage in purchase and sale transactions with funds that have a common investment advisor (or affiliated investment advisors), common Trustees and/or common Officers. During the year ended December 31, 2016, the Fund did not engage in any Rule 17a-7 transactions under the 1940 Act.
5. Federal Tax Information
Federal income tax — It is the Fund’s policy to continue to comply with the special provisions of the Internal Revenue Code applicable to regulated investment companies. As provided therein, in any fiscal year in which the Fund so qualifies and distributes at least 90% of its investment company taxable income, the Fund (but not the shareholders) will be relieved of federal income tax on the income distributed. It is the Fund’s policy to distribute all of its taxable income and accordingly, no provision for income taxes has been made.
In order to avoid imposition of the excise tax applicable to regulated investment companies, it is also the Fund’s intention to declare and pay as dividends in each calendar year at least 98% of its investment company taxable income (earned during the calendar year) and 98.2% of its net realized capital gains (earned during the twelve months ending October 31) plus undistributed amounts from prior years.
The tax character of distributions paid for the years ended December 31, 2016 and December 31, 2015 are as follows:
| | | Sands Capital | |
| | | Institutional | |
| | | Growth Fund | |
| | | 2016 | | | 2015 | |
| From ordinary income | | $ | — | | | $ | 5,650,305 | |
| From long-term capital gains | | | 121,557,240 | | | | 165,093,658 | |
| Total distributions | | $ | 121,557,240 | | | $ | 170,743,963 | |
Notes to Financial Statements (Continued)
The following information is computed on a tax basis for each item as of December 31, 2016:
| | | Sands Capital | |
| | | Institutional | |
| | | Growth Fund | |
| Tax cost of portfolio investments | | $ | 1,393,674,475 | |
| Gross unrealized appreciation | | | 778,362,970 | |
| Gross unrealized depreciation | | | (64,048,920 | ) |
| Net unrealized appreciation | | | 714,314,050 | |
| Undistributed ordinary income | | | — | |
| Undistributed long-term capital gains | | | 42,416,999 | |
| Accumulated earnings | | $ | 756,731,049 | |
The difference between the tax cost of portfolio investments and the financial statement cost is primarily due to wash sale loss deferrals.
As of December 31, 2016, the Fund did not have any capital loss carryforwards for federal income tax purposes.
Under current laws, certain capital losses realized after October 31 and ordinary losses realized after December 31 may be deferred (and certain ordinary losses after October and/or December 31 may be deferred) and treated as occurring on the first day of the following fiscal year. For the year ended December 31, 2016, the Fund did not elect to defer any losses.
The Fund has analyzed its tax positions taken on federal income tax returns for all open tax years (tax years ended December 31, 2013 through 2016) and has concluded that no provision for income tax is required in its financial statements.
Certain reclassifications, the result of permanent differences between financial statement and income tax reporting requirements, have been made to the components of capital. These reclassifications have no impact on the net assets or NAV per share of the Fund. The following reclassifications, which are primarily attributed to deemed distributions on shareholder redemptions utilized and current year reclass of net operating losses, have been made to the Fund for the year ended December 31, 2016:
| | | | | | Accumulated | | | Accumulated | |
| | | Paid-In | | | Net Investment | | | Net Realized | |
| | | Capital | | | Income(Loss) | | | Gains(Losses) | |
| Sands Capital Institutional Growth Fund | | $ | 1,578,490 | | | $ | 14,071,392 | | | $ | (15,649,882 | ) |
6. Commitments and Contingencies
The Fund indemnifies the Trust’s officers and Trustees for certain liabilities that might arise from their performance of their duties to the Fund. Additionally, in the normal course of business, the Fund enters into contracts that contain a variety of representations and warranties and which provide general indemnifications. The Fund’s maximum exposure under these arrangements is unknown, as this would involve future claims that may be made against the Fund.
7. Principal Risks
Risks Associated with Concentration — The Fund may invest a high percentage of its assets in specific sectors of the market in order to achieve a potentially greater investment return. As a result, the Fund may be more susceptible to economic, political, and regulatory developments in a particular sector of the market, positive or negative, and may experience increased volatility on the Fund’s NAV and magnified effect on the total return.
Notes to Financial Statements (Continued)
Please see the Fund’s prospectus for a complete discussion of this and other risks.
8. Subsequent Events
Subsequent events occurring after the date of this report have been evaluated for potential impact to this report through the date the financial statements were issued. There were no subsequent events that necessitated recognition or disclosure in the Fund’s financial statements.
Report of Independent Registered Public Accounting Firm
The Board of Trustees and Shareholders of Touchstone Institutional Funds Trust
We have audited the accompanying statement of assets and liabilities, including the portfolio of investments, of Touchstone Institutional Funds Trust (comprising, Touchstone Sands Capital Institutional Growth Fund) (the “Fund”) as of December 31, 2016, and the related statement of operations for the year then ended, the statements of changes in net assets for each of the two years in the period then ended and the financial highlights for each of the five years in the period then ended. These financial statements and financial highlights are the responsibility of the Fund’s management. Our responsibility is to express an opinion on these financial statements and financial highlights based on our audits.
We conducted our audits in accordance with the standards of the Public Company Accounting Oversight Board (United States). Those standards require that we plan and perform the audit to obtain reasonable assurance about whether the financial statements and financial highlights are free of material misstatement. We were not engaged to perform an audit of the Fund’s internal control over financial reporting. Our audits included consideration of internal control over financial reporting as a basis for designing audit procedures that are appropriate in the circumstances, but not for the purpose of expressing an opinion on the effectiveness of the Fund’s internal control over financial reporting. Accordingly, we express no such opinion. An audit also includes examining, on a test basis, evidence supporting the amounts and disclosures in the financial statements and financial highlights, assessing the accounting principles used and significant estimates made by management, and evaluating the overall financial statement presentation. Our procedures included confirmation of securities owned as of December 31, 2016, by correspondence with the custodian and brokers or by other appropriate auditing procedures where replies from brokers were not received. We believe that our audits provide a reasonable basis for our opinion.
In our opinion, the financial statements and financial highlights referred to above present fairly, in all material respects, the financial position of Touchstone Sands Capital Institutional Growth Fund at December 31, 2016, the results of its operations for the year then ended, the changes in its net assets for each of the two years in the period then ended and the financial highlights for each of the five years in the period then ended, in conformity with U.S generally accepted accounting principles.

Cincinnati, Ohio
February 17, 2017
Other Items (Unaudited)
Tax Information
For the fiscal year ended December 31, 2016, the Fund designated $121,557,240 as long-term capital gains.
Proxy Voting Guidelines and Proxy Voting Records
The Sub-Advisor is responsible for exercising the voting rights associated with the securities purchased and held by the Fund. A description of the policies and procedures that the Sub-Advisor uses in fulfilling this responsibility is available as an appendix to the most recent Statement of Additional Information, which can be obtained without charge by calling toll free 1.800.543.0407 or by visiting the Touchstone website at TouchstoneInvestments.com or on the Securities and Exchange Commission’s (the “Commission”) website at sec.gov. Information regarding how those proxies were voted during the most recent twelve-month period ended June 30 is also available without charge by calling toll free 1.800.543.0407 or on the Commission’s website at sec.gov.
Quarterly Portfolio Disclosure
The Trust files a complete listing of portfolio holdings for the Fund as of the end of the first and third quarters of each fiscal year on Form N-Q. The complete listing (i) is available on the Commission’s website; (ii) may be reviewed and copied at the Commission’s Public Reference Room in Washington, DC; or (iii) will be made available to shareholders upon request by calling 1.800.543.0407. Information on the operation of the Public Reference Room may be obtained by calling 1.800.SEC.0330.
Schedule of Shareholder Expenses
As a shareholder of the Fund, you incur two types of costs: (1) transaction costs, including reinvested dividends or other distributions; and (2) ongoing costs, including investment advisory fees; and other Fund expenses. This example is intended to help you understand your ongoing costs (in dollars) of investing in the Fund and to compare these costs with the ongoing costs of investing in other mutual funds.
The example is based on an investment of $1,000 invested at the beginning of the period and held for the entire period (July 1, 2016 through December 31, 2016).
Actual Expenses
The first line of the table below provides information about actual account values and actual expenses. You may use the information in this line, together with the amount you invested, to estimate the expenses that you paid over the period. Simply divide your account value by $1,000 (for example, an $8,600 account value divided by $1,000 = 8.6), then multiply the result by the number in the first line under the heading entitled “Expenses Paid During the Six Months Ended December 31, 2016” to estimate the expenses you paid on your account during this period.
Hypothetical Example for Comparison Purposes
The second line of the table below provides information about hypothetical account values and hypothetical expenses based on the Fund’s actual expense ratio and an assumed rate of return of 5% per year before expenses, which is not the Fund’s actual return. The hypothetical account values and expenses may not be used to estimate the actual ending account balance or expenses you paid for the period. You may use this information to compare the ongoing costs of investing in the Fund and other funds. To do so, compare this 5% hypothetical example with the 5% hypothetical examples that appear in the shareholder reports of the other funds.
Please note that the expenses shown in the table below are meant to highlight your ongoing costs only and do not reflect any transactional costs, such as sales charges (loads), redemption fees, or exchange fees. Therefore, the second line of the table below is useful in comparing ongoing costs only, and will not help you determine
Other Items (Unaudited) (Continued)
the relative total costs of owning different funds. In addition, if these transactional costs were included, your costs would have been higher.
| | | | | | | | | | | | Expenses | |
| | | Net Expense | | | Beginning | | | Ending | | | Paid During | |
| | | Ratio | | | Account | | | Account | | | the Six Months | |
| | | Annualized | | | Value | | | Value | | | Ended | |
| | | December 31, | | | July 1, | | | December 31, | | | December 31, | |
| | | 2016 | | | 2016 | | | 2016 | | | 2016* | |
| Touchstone Sands Capital Institutional Growth Fund | | | | | | | | | | | | | | | | |
| Actual | | | 0.79 | % | | $ | 1,000.00 | | | $ | 1,021.60 | | | $ | 4.01 | |
| Hypothetical | | | 0.79 | % | | $ | 1,000.00 | | | $ | 1,021.17 | | | $ | 4.01 | |
* Expenses are equal to the Fund's annualized expense ratio, multiplied by the average account value over the period, multiplied by 184/366 (to reflect one-half year period).
Management and Sub-Advisory Agreement Approval Disclosure
At a meeting held on November 17, 2016, the Board of Trustees (the “Board” or “Trustees”) of the Touchstone Institutional Funds Trust (the “Trust”), and by a separate vote, the Independent Trustees of the Trust, approved the continuance of the Management Agreement between the Trust and the Advisor with respect to the Fund, and the continuance of the Sub-Advisory Agreement between the Advisor and the Sub-Advisor.
In determining whether to approve the continuation of the Management Agreement and the Sub-Advisory Agreement, the Advisor furnished information necessary for a majority of the Independent Trustees to make the determination that the continuance of the Management Agreement and the Sub-Advisory Agreement was in the best interests of the Fund and its shareholders. The information provided to the Board included: (1) industry data comparing advisory fees and expense ratios of comparable investment companies; (2) comparative performance information; (3) the Advisor’s and its affiliates’ revenues and costs of providing services to the Fund; and (4) information about the Advisor’s and Sub-Advisor’s personnel. Prior to voting, the Independent Trustees reviewed the proposed continuance of the Management Agreement and the Sub-Advisory Agreement with management and experienced independent legal counsel and received materials from such counsel discussing the legal standards for their consideration of the proposed continuation of the Management Agreement and the Sub-Advisory Agreement with respect to the Fund. The Independent Trustees also reviewed the proposed continuation of the Management Agreement and the Sub-Advisory Agreement with respect to the Fund with independent legal counsel in private sessions at which no representatives of management were present.
In approving the Fund’s Management Agreement, the Board considered various factors, among them: (1) the nature, extent and quality of services provided to the Fund, including the personnel providing such services; (2) the Advisor’s compensation and profitability; (3) a comparison of fees and performance with other advisers; (4) economies of scale; and (5) the terms of the Management Agreement. The Board’s analysis of these factors is set forth below. The Independent Trustees were advised by independent legal counsel throughout the process.
Nature, Extent and Quality of Advisor Services. The Board considered the level and depth of knowledge of the Advisor, including the professional experience and qualifications of senior personnel. In evaluating the quality of services provided by the Advisor, the Board took into account its familiarity with the Advisor’s senior management through Board meetings, discussions and reports during the preceding year. The Board also took into account the Advisor’s compliance policies and procedures. The quality of administrative and other services, including the Advisor’s role in coordinating the activities of the Fund’s other service providers, was also considered. The Board also considered the Advisor’s relationship with its affiliates and the resources available to them, as well as any potential conflicts of interest.
Other Items (Unaudited) (Continued)
The Board discussed the Advisor’s effectiveness in monitoring the performance of the Sub-Advisor and the Advisor’s timeliness in responding to performance issues. The Board considered the Advisor’s process for monitoring the Sub-Advisor, which includes an examination of both qualitative and quantitative elements of the Sub-Advisor’s organization, personnel, procedures, investment discipline, infrastructure and performance. The Board considered that the Advisor conducts regular on-site compliance visits with the Sub-Advisor, during which the Advisor examines a wide variety of factors, such as the financial condition of the Sub-Advisor, the quality of the Sub-Advisor’s systems, the effectiveness of the Sub-Advisor’s disaster recovery programs, trade allocation and execution procedures, compliance with the Sub-Advisor’s policies and procedures, results of regulatory examinations and any other factors that might affect the quality of services that the Sub-Advisor provides to the Fund. The Board noted that the Advisor’s compliance monitoring processes also include quarterly reviews of compliance reports, and that any significant issues arising from such reports and the Advisor’s compliance visits to the Sub-Advisor are reported to the Board.
The Trustees concluded that they were satisfied with the nature, extent and quality of services provided to the Fund by the Advisor under the Management Agreement.
Advisor’s Compensation and Profitability. The Board took into consideration the financial condition and profitability of the Advisor and its affiliates and the direct and indirect benefits derived by the Advisor and its affiliates from the Advisor’s relationship with the Fund. The information considered by the Board included operating profit margin information for the Advisor’s business as a whole. The Board noted that the Advisor pays the Sub-Advisor’s sub-advisory fee out of the advisory fee the Advisor receives from the Fund. The Board reviewed the profitability of the Advisor’s relationship with the Fund both before and after tax expenses, and also considered whether the Advisor has the financial wherewithal to continue to provide services to the Fund, noting the ongoing commitment of the Advisor’s parent company with respect to providing support and resources as needed. The Board also noted that the Advisor derives benefits to its reputation and other benefits from its association with the Fund.
The Board recognized that the Advisor should be entitled to earn a reasonable level of profits in exchange for the level of services it provides to the Fund and the entrepreneurial risk that it assumes as Advisor. Based upon their review, the Trustees concluded that the Advisor’s level of profitability from its relationship with the Fund was reasonable and not excessive.
Expenses and Performance. The Board compared the advisory fee and total expense ratio for the Fund with various comparative data, including the median and average advisory fees and total expense ratios of the Fund’s peer group. The Board also considered, among other data, the Fund’s performance results during the six-month, twelve-month, and thirty-six month periods ended June 30, 2016, and noted that the Board reviews on a quarterly basis detailed information about the Fund’s performance results, portfolio composition and investment strategies. The Board also took into account current market conditions and their effect on the Fund’s performance.
The Board also considered the effect of the Fund’s growth and size on its performance and expenses. The Board noted that the sub-advisory fee under the Sub-Advisory Agreement was paid by the Advisor out of the advisory fee it receives from the Fund and considered the impact of such sub-advisory fee on the profitability of the Advisor. In reviewing the expense ratio and performance of the Fund, the Board also took into account the nature, extent and quality of the services provided by the Advisor and its affiliates.
The Board considered, among other data, the specific factors and related conclusions set forth below:
The Fund’s advisory fee and total expense ratio were above the median of its peer group. The Board took into account management’s discussion of the Fund’s expenses and the Fund’s advisory fee structure. The Fund’s performance for the six-, twelve- and thirty-six-month periods ended June 30, 2016 was in the 5th quintile of its peer group. The Board considered management’s discussion of the Fund’s performance, including both its
Other Items (Unaudited) (Continued)
recent and long-term performance, and its continued monitoring of the Fund’s performance. Based upon their review, the Trustees concluded that the Fund’s performance is being addressed, and that the advisory fee was reasonable in light of the services received by the Fund from the Advisor and the other factors considered.
Economies of Scale. The Board considered the effect of the Fund’s current size and potential growth on its performance and expenses. The Board took into account management’s discussion of the Fund’s advisory fee structure. The Board also noted that if the Fund’s assets increased over time, the Fund might realize other economies of scale if assets increased proportionally more than certain other expenses.
Conclusion. In considering the renewal of the Fund’s Management Agreement, the Board, including the Independent Trustees, did not identify any single factor as controlling, and each Trustee may have attributed different weights to the various factors. The Board reached the following conclusions regarding the Fund’s Management Agreement with the Advisor, among others: (a) the Advisor demonstrated that it possesses the capability and resources to perform the duties required of it under the Management Agreement; (b) the Advisor maintains an appropriate compliance program; (c) the Fund’s performance is being addressed; and (d) the Fund’s advisory fee is reasonable in light of the services received by the Fund from the Advisor and the other factors considered. Based on their conclusions, the Trustees determined that continuation of the Management Agreement was in the best interests of the Fund and its shareholders.
In approving the Fund’s Sub-Advisory Agreement, the Board considered various factors with respect to the Fund and its Sub-Advisory Agreement, among them: (1) the nature, extent and quality of services provided to the Fund, including the personnel providing such services; (2) the Sub-Advisor’s compensation; (3) a comparison of the sub-advisory fee and performance with other advisers; and (4) the terms of the Sub-Advisory Agreement. The Board’s analysis of these factors is set forth below. The Independent Trustees were advised by independent legal counsel throughout the process.
Nature, Extent and Quality of Services Provided; Investment Personnel. The Board considered information provided by the Advisor regarding the services provided by the Sub-Advisor, including information presented periodically throughout the previous year. The Board noted that, on a periodic basis, the Board meets with portfolio managers of the Sub-Advisor to discuss their performance and investment processes and strategies. The Board considered the Sub-Advisor’s level of knowledge and investment style. The Board reviewed the experience and credentials of the investment personnel who are responsible for managing the investment of portfolio securities for the Fund.
Sub-Advisor’s Compensation, Profitability and Economies of Scale. The Board also took into consideration the financial condition of the Sub-Advisor and any indirect benefits derived by the Sub-Advisor and its affiliates from the Sub-Advisor’s relationship with the Fund. In considering the profitability to the Sub-Advisor of its relationship with the Fund, the Board noted that the sub-advisory fee under the Sub-Advisory Agreement was paid by the Advisor out of the advisory fee that it receives under the Management Agreement and is negotiated at arms-length. As a consequence, the profitability to the Sub-Advisor of its relationship with the Fund was not a substantial factor in the Board’s deliberations. For similar reasons, the Board did not consider the potential economies of scale in the Sub-Advisor’s management of the Fund to be a substantial factor in its consideration.
Sub-Advisory Fee and Fund Performance. The Board considered that the Fund pays an advisory fee to the Advisor and that the Advisor pays the sub-advisory fee to the Sub-Advisor out of the advisory fee it receives from the Fund. The Board also compared the sub-advisory fee paid by the Advisor to fees charged by the Sub-Advisor to manage comparable institutional separate accounts. The Board considered the amount retained by the Advisor and the sub-advisory fee paid to the Sub-Advisor with respect to the various services provided by the Advisor and the Sub-Advisor. The Board reviewed the sub-advisory fee in relation to various comparative data, including the median and average sub-advisory fees of the Fund’s peer group, and considered the following information:
Other Items (Unaudited) (Continued)
The Fund’s sub-advisory fee was above the median of its peer group. Based upon their review, the Trustees concluded that the sub-advisory fee was reasonable in light of the services received by the Fund from the Sub-Advisor and the other factors considered.
As noted above, the Board considered the Fund’s performance during the six-month, twelve-month, and thirty-six month periods ended June 30, 2016, as compared to the Fund’s peer group and noted that the Board reviews on a quarterly basis detailed information about the Fund’s performance results, portfolio composition and investment strategies. The Board also noted the Advisor’s expertise and resources in monitoring the performance, investment style and risk-adjusted performance of the Sub-Advisor. The Board also was mindful of the Advisor’s ongoing monitoring of the Sub-Advisor’s performance.
Conclusion. In considering the renewal of the Sub-Advisory Agreement, the Board, including the Independent Trustees, did not identify any single factor as controlling, and each Trustee may have attributed different weights to the various factors. The Board reached the following conclusions regarding the Sub-Advisory Agreement, among others: (a) the Sub-Advisor is qualified to manage the Fund’s assets in accordance with the Fund’s investment objectives and policies; (b) the Sub-Advisor maintains an appropriate compliance program; (c) the Fund’s performance is being addressed; (d) the Fund’s sub-advisory fee is reasonable in light of the services received by the Fund from the Sub-Advisor and the other factors considered; and (e) the Sub-Advisor’s investment strategies are appropriate for pursuing the investment goals of the Fund. Based on its conclusions, the Board determined that approval of the Sub-Advisory Agreement was in the best interests of the Fund and its shareholders.
Management of the Trust (Unaudited)
Listed below is required information regarding the Trustees and principal officers of the Trust. The Trust’s Statement of Additional Information includes additional information about the Trustees and is available, without charge, upon request by calling 1.800.543.0407 or by visiting the Touchstone website at TouchstoneInvestments.com.
| Interested Trustee1: | | | | | |
| | | | | Number | |
| �� | | | | of Funds | |
| | | | | Overseen | |
| | | Term of | | in the | |
| Name | Position(s) | Office And | | Touchstone | Other |
| Address | Held with | Length of | Principal Occupation(s) | Fund | Directorships |
| Age | Trust | Time Served | During Past 5 Years | Complex2 | Held During the Past 5 Years3 |
Jill T. McGruder Touchstone Advisors, Inc. 303 Broadway Suite 1100 Cincinnati, OH 45202 Year of Birth: 1955 | Trustee and President | Until retirement at age 75 or until she resigns or is removed
Trustee since 1999 | President and CEO of IFS Financial Services, Inc. (a holding company). | 41 | IFS Financial Services, Inc. (a holding company) from 1999 to the present; Integrity and National Integrity Life Insurance Co. from 2005 to the present; Touchstone Securities (the Trust’s distributor) from 1999 to the present; Touchstone Advisors (the Trust’s investment advisor and administrator) from 1999 to the present; W&S Brokerage Services (a brokerage company) from 1999 to the present; W&S Financial Group Distributors (a distribution company) from 1999 to the present; Cincinnati Analysts, Inc. from 2012 to the present; Columbus Life Insurance Co. from 2016 to the present; Every Child Succeeds (a social services agency) from 2007 to the present; Taft Museum of Art from 2007 to the present; and YWCA of Greater Cincinnati from 2012 to the present. |
| Independent Trustees: | | |
Phillip R. Cox c/o Touchstone Advisors, Inc. 303 Broadway Suite 1100 Cincinnati, OH 45202 Year of Birth: 1947 | Trustee | Until retirement at age 75 or until he resigns or is removed
Trustee since 1999 | President and Chief Executive Officer of Cox Financial Corp. (a financial services company) from 1971 to the present. | 41 | Director of Cincinnati Bell (a communications company) from 1994 to the present; Bethesda Inc. (a hospital) from 2005 to the present; Timken Co. (a manufacturing company) from 2004 to 2014; TimkenSteel from 2014 to the present; Diebold, Inc. (a technology solutions company) from 2004 to the present; and Ohio Business Alliance for Higher Education and the Economy from 2005 to the present. |
| | | | | | |
William C. Gale c/o Touchstone Advisors, Inc. 303 Broadway Suite 1100 Cincinnati, OH 45202 Year of Birth: 1952 | Trustee | Until retirement at age 75 or until he resigns or is removed
Trustee since 2013 | Retired; formerly Senior Vice President and Chief Financial Officer (from 2003 to January 2015) of Cintas Corporation (a business services company). | 41 | None. |
Management of the Trust (Unaudited) (Continued)
| Independent Trustees (Continued): | |
| | | | | Number | |
| | | | | of Funds | |
| | | | | Overseen | |
| | | Term of | | in the | |
| Name | Position(s) | Office And | | Touchstone | Other |
| Address | Held with | Length of | Principal Occupation(s) | Fund | Directorships |
| Age | Trust | Time Served | During Past 5 Years | Complex2 | Held During the Past 5 Years3 |
Susan J. Hickenlooper c/o Touchstone Advisors, Inc. 303 Broadway Suite 1100 Cincinnati, OH 45202 Year of Birth: 1946 | Trustee | Until retirement at age 75 or until she resigns or is removed
Trustee since 2009 | Retired; formerly Financial Analyst for Impact 100 (charitable organization) from November 2012 to 2013. | 41 | Trustee of Diocese of Southern Ohio from 2014 to the present; and Trustee of Cincinnati Parks Foundation from 2000 to 2016. |
| | | | | | |
Kevin A. Robie c/o Touchstone Advisors, Inc. 303 Broadway Suite 1100 Cincinnati, OH 45202 Year of Birth: 1956 | Trustee | Until retirement at age 75 or until he resigns or is removed
Trustee since 2013 | Vice President of Portfolio Management at Soin International LLC (a private multinational holding company) from 2004 to the present. | 41 | SaverSystems Inc. from 2015 to the present; Director of Buckeye EcoCare, Inc. (a lawn care company) from 2013 to the present; Trustee of Dayton Region New Market Fund, LLC (a private fund) from 2010 to the present; and Trustee of the Entrepreneurs Center, Inc. (a small business incubator) from 2006 to the present. |
| | | | | | |
Edward J. VonderBrink c/o Touchstone Advisors, Inc. 303 Broadway Suite 1100 Cincinnati, OH 45202 Year of Birth: 1944 | Trustee | Until retirement at age 75 or until he resigns or is removed
Trustee since 2013 | Consultant, VonderBrink Consulting LLC from 2000 to the present. | 41 | Director of Streamline Health Solutions, Inc. (healthcare IT) from 2006 to 2015; Mercy Health from 2013 to the present; Mercy Health Foundation (healthcare nonprofit) from 2008 to the present; Al Neyer Inc. (a construction company) from 2013 to the present; and BASCO Shower Door from 2011 to the present. |
| 1 | Ms. McGruder, as a director of the Advisor and the Distributor, and an officer of affiliates of the Advisor and the Distributor, is an “interested person” of the Trust within the meaning of Section 2(a) (19) of the 1940 Act. |
| 2 | As of December 31, 2016, the Touchstone Fund Complex consists of 1 series of the Trust, 11 series of Touchstone Funds Group Trust, 2 series of Touchstone Investment Trust, 21 series of Touchstone Strategic Trust, and 6 variable annuity series of Touchstone Variable Series Trust. |
| 3 | As of December 31, 2016, each Trustee is also a Trustee of Touchstone Funds Group Trust, Touchstone Investment Trust, Touchstone Strategic Trust, and Touchstone Variable Series Trust. |
Management of the Trust (Unaudited) (Continued)
The following is a list of the Principal Officers of the Trusts, the length of time served, and principal occupations for the past five years.
| Principal Officers: | | | |
| | | Term of | |
| Name | Position(s) | Office And | |
| Address | Held with | Length of | Principal Occupation(s) |
| Age | Trust1 | Time Served | During the Past 5 Years |
Jill T. McGruder Touchstone Advisors, Inc. 303 Broadway Suite 1100 Cincinnati, OH 45202 Year of Birth: 1955 | President and Trustee | Until resignation, removal or disqualification
President since 2006 | See biography above. |
| | | | |
Steven M. Graziano Touchstone Advisors, Inc. 303 Broadway Suite 1100 Cincinnati, OH 45202 Year of Birth: 1954 | Vice President | Until resignation, removal or disqualification Vice
President since 2009 | President of Touchstone Advisors, Inc. |
| | | | |
Timothy D. Paulin Touchstone Advisors, Inc. 303 Broadway Suite 1100 Cincinnati, OH 45202 Year of Birth: 1963 | Vice President | Until resignation, removal or disqualification Vice
President since 2010 | Senior Vice President of Investment Research and Product Management of Touchstone Advisors, Inc. |
| | | | |
Timothy S. Stearns Touchstone Advisors, Inc. 303 Broadway Suite 1100 Cincinnati, OH 45202 Year of Birth: 1963 | Chief Compliance Officer | Until resignation, removal or disqualification
Chief Compliance Officer since 2013 | Chief Compliance Officer of Touchstone Advisors, Inc.; Chief Compliance Officer of Envestnet Asset Management, Inc. (2009 to 2013). |
| | | | |
Terrie A. Wiedenheft Touchstone Advisors, Inc. 303 Broadway Suite 1100 Cincinnati, OH 45202 Year of Birth: 1962 | Controller and Treasurer | Until resignation, removal or disqualification
Controller and Treasurer since 2006 | Senior Vice President, Chief Financial Officer and Chief Operations Officer, of IFS Financial Services, Inc. (a holding company). |
| | | | |
Ellen Blanchard BNY Mellon Investment Servicing (US) Inc. 201 Washington St, 34th Fl. Boston, MA 02108 Year of Birth: 1973 | Secretary | Until resignation, removal or disqualification
Secretary since 2015 | Director of BNY Mellon Investment Servicing (US) Inc. |
| 1 | Each officer also holds the same office with Touchstone Funds Group Trust, Touchstone Investment Trust, Touchstone Strategic Trust and Touchstone Variable Series Trust. |
This page intentionally left blank.
This page intentionally left blank.
This page intentionally left blank.
PRIVACY PROTECTION POLICY
We Respect Your Privacy
Thank you for your decision to invest with us. Touchstone and its affiliates have always placed a high value on the trust and confidence our clients place in us. We believe that confidence must be earned and validated through time. In today’s world, when technology allows the sharing of information at light speeds, trust must be reinforced by our sincere pledge to take the steps necessary to ensure that the information you share with us is treated with respect and confidentiality.
Our Pledge to Our Clients
| • | We collect only the information we need to service your account and administer our business. |
| • | We are committed to keeping your information confidential and we place strict limits and controls on the use and sharing of your information. |
| • | We make every effort to ensure the accuracy of your information. |
We Collect the Following Nonpublic Personal Information About You:
| • | Information we receive from you on or in applications or other forms, correspondence, or conversations, including, but not limited to, your name, address, phone number, social security number, assets, income and date of birth; and |
| • | Information about your transactions with us, our affiliates, or others, including, but not limited to, your account number and balance, payment history, parties to transactions, cost basis information, and other financial information. |
Categories of Information We Disclose and Parties to Whom We Disclose
We do not disclose any nonpublic personal information about our current or former clients to nonaffiliated third parties, except as required or permitted by law.
We Place Strict Limits and Controls on the Use and Sharing of Your Information
| • | We restrict access to nonpublic personal information about you to authorized employees who need the information to administer your business. |
| • | We maintain physical, electronic and procedural safeguards that comply with federal standards to protect this information. |
| • | We do not disclose any nonpublic personal information about our current or former clients to anyone, except as required or permitted by law or as described in this document. |
| • | We will not sell your personal information to anyone. |
We May Provide Information to Service Your Account
Sometimes it is necessary to provide information about you to various companies such as transfer agents, custodians, broker-dealers and marketing service firms to facilitate the servicing of your account. These organizations have a legitimate business need to see some of your personal information in order for us to provide service to you. We may disclose to these various companies the information that we collect as described above. We require that these companies, including our own subsidiaries and affiliates, strictly maintain the confidentiality of this information and abide by all applicable laws. Companies within our corporate family that may receive this information are financial service providers and insurance companies. We do not permit these associated companies to sell the information for their own purposes, and we never sell our customer information.
This policy is applicable to the following affiliated companies: Touchstone Funds Group Trust, Touchstone Investment Trust, Touchstone Strategic Trust, Touchstone Tax-Free Trust, Touchstone Variable Series Trust, Touchstone Institutional Funds Trust, Touchstone Securities, Inc.,* and W&S Brokerage Services, Inc.
* Touchstone Securities, Inc. serves as the underwriter to the Touchstone Funds.
A Member of Western & Southern Financial Group®
The Privacy Protection Policy is not part of the Annual Report.


Go paperless, sign up today at:
www.touchstoneinvestments.com
Touchstone Investments
Distributor
Touchstone Securities, Inc.*
303 Broadway
Cincinnati, Ohio 45202-4203 800.638.8194
www.touchstoneinvestments.com
Investment Advisor
Touchstone Advisors, Inc.*
303 Broadway
Cincinnati, Ohio 45202-4203
Transfer Agent
BNY Mellon Investment Servicing (US) Inc.
4400 Computer Drive
Westborough, MA 01581
Shareholder Service
800.543.0407
* A Member of Western & Southern Financial Group
TSF-1105-TIFT-AR-1612
Item 2. Code of Ethics.
| (a) | The registrant, as of the end of the period covered by this report, has adopted a code of ethics that applies to the registrant’s principal executive officer, principal financial officer, principal accounting officer or controller, or persons performing similar functions, regardless of whether these individuals are employed by the registrant or a third party. |
| (c) | There have been no amendments, during the period covered by this report, to a provision of the code of ethics that applies to the registrant’s principal executive officer, principal financial officer, principal accounting officer or controller, or persons performing similar functions, regardless of whether these individuals are employed by the registrant or a third party, and that relates to any element of the code of ethics description. |
| (d) | The registrant has not granted any waivers, including an implicit waiver, from a provision of the code of ethics that applies to the registrant’s principal executive officer, principal financial officer, principal accounting officer or controller, or persons performing similar functions, regardless of whether these individuals are employed by the registrant or a third party, that relates to one or more of the items set forth in paragraph (b) of this item’s instructions. |
Item 3. Audit Committee Financial Expert.
The registrant’s Board of Trustees has determined that the registrant has at least one audit committee financial expert serving on its audit committee. Mr. William Gale is the registrant’s audit committee financial expert and is an independent trustee within the meaning of the Investment Company Act of 1940, as amended (the “1940 Act”).
Item 4. Principal Accountant Fees and Services.
Audit Fees
| (a) | Audit fees for Touchstone Institutional Funds Trust totaled $15,350 and $14,950 in fiscal 2016 and 2015, respectively, including fees associated with the annual audit and filing of Form N-1A and Form N-SAR. |
Audit-Related Fees
| (b) | There were no audit-related fees for the 2016 and 2015 fiscal years. |
Tax Fees
| (c) | Fees for tax compliance services totaled $3,680 and $3,570 in fiscal 2016 and 2015, respectively. Fees relate to the preparation of federal income and excise tax returns and review of capital gains distribution calculations. |
All Other Fees
| (d) | The aggregate fees billed in each of the last two fiscal years for products and services provided by the principal accountant, other than the services reported in paragraphs (a) through (c) of this Item are $463 for 2016 and $512 for 2015, respectively. The fees are related to the PFIC Analyzer and Global Withholding Tax Reporter subscriptions. |
| (e)(1) | Disclose the audit committee's pre-approval policies and procedures described in paragraph (c)(7) of Rule 2-01 of Regulation S-X. |
The Audit Committee’s pre-approval policies describe the types of audit, audit-related, tax and other services that have the general pre-approval of the Audit Committee. The pre-approval policies provide that annual audit service fees, tax services not specifically granted pre-approval, services exceeding pre-approved cost levels and other services that have not received general pre-approval will be subject to specific pre-approval by the Audit Committee. The pre-approval policies further provide that the Committee may grant general pre-approval to other audit services (statutory audits and services associated with SEC registration statements, periodic reports and other documents filed with the SEC or other documents issued in connection with securities offerings), audit-related services (accounting consultations related to accounting, financial reporting or disclosure matters not classified as “audit services,” assistance with understanding and implementing new accounting and financial reporting guidance from rulemaking authorities, agreed-upon or expanded audit procedures related to accounting and/or billing records required to respond to or comply with financial, accounting or regulatory reporting matters and assistance with internal control reporting requirements under Form N-SAR and Form N-CSR), tax services that have historically been provided by the auditor that the Committee believes would not impair the independence of the auditor and are consistent with the SEC’s rules on auditor independence and permissible non-audit services classified as “all other services” that are routine and recurring services.
| (e)(2) | All services described in paragraphs (b) through (d) of Item 4 were approved by the Audit Committee. |
| (f) | The percentage of hours expended on the principal accountant's engagement to audit the registrant's financial statements for the most recent fiscal year that were attributed to work performed by persons other than the principal accountant's full-time, permanent employees was less than fifty percent. |
| (g) | The aggregate non-audit fees for Touchstone Institutional Funds Trust and certain entities*, totaled approximately $4,143 and $4,082, in 2016 and 2015, respectively. |
* These include the advisors (excluding sub-advisors) and any entity controlling, controlled by or under common control with the advisors that provides ongoing services to the registrant (Funds).
| (h) | The registrant's audit committee of the board of trustees has considered whether the provision of non-audit services that were rendered to the registrant's investment adviser (not including any sub-adviser whose role is primarily portfolio management and is subcontracted with or overseen by another investment adviser), and any entity controlling, controlled by, or under common control with the investment adviser that provides ongoing services to the registrant that were not pre-approved pursuant to paragraph (c)(7)(ii) of Rule 2-01 of Regulation S-X is compatible with maintaining the principal accountant's independence. |
Item 5. Audit Committee of Listed Registrants.
Not applicable.
Item 6. Investments.
| (a) | Schedule of Investments in securities of unaffiliated issuers as of the close of the reporting period is included as part of the report to shareholders filed under Item 1 of this form. |
Item 7. Disclosure of Proxy Voting Policies and Procedures for Closed-End Management Investment Companies.
Not applicable.
Item 8. Portfolio Managers of Closed-End Management Investment Companies.
Not applicable.
Item 9. Purchases of Equity Securities by Closed-End Management Investment Company and Affiliated Purchasers.
Not applicable.
Item 10. Submission of Matters to a Vote of Security Holders.
There have been no material changes to the procedures by which the shareholders may recommend nominees to the registrant’s board of trustees, where those changes were implemented after the registrant last provided disclosure in response to the requirements of Item 407(c)(2)(iv) of Regulation S-K (17 CFR 229.407) (as required by Item 22(b)(15) of Schedule 14A (17 CFR 240.14a-101)), or this item.
Item 11. Controls and Procedures.
| (a) | The registrant’s principal executive and principal financial officers, or persons performing similar functions, have concluded that the registrant’s disclosure controls and procedures (as defined in Rule 30a-3(c) under the Investment Company Act of 1940, as amended (the “1940 Act”) (17 CFR 270.30a-3(c))) are effective, as of a date within 90 days of the filing date of the report that includes the disclosure required by this paragraph, based on their evaluation of these controls and procedures required by Rule 30a-3(b) under the 1940 Act (17 CFR 270.30a-3(b)) and Rules 13a-15(b) or 15d-15(b) under the Securities Exchange Act of 1934, as amended (17 CFR 240.13a-15(b) or 240.15d-15(b)). |
| (b) | There were no changes in the registrant’s internal control over financial reporting (as defined in Rule 30a-3(d) under the 1940 Act (17 CFR 270.30a-3(d))) that occurred during the registrant’s second fiscal quarter of the period covered by this report that has materially affected, or is reasonably likely to materially affect, the registrant’s internal control over financial reporting. |
Item 12. Exhibits.
| (a)(1) | Code of ethics, or any amendment thereto, that is the subject of disclosure required by Item 2 is attached hereto. |
| (a)(2) | Certifications pursuant to Rule 30a-2(a) under the 1940 Act and Section 302 of the Sarbanes-Oxley Act of 2002 are attached hereto. |
| (b) | Certifications pursuant to Rule 30a-2(b) under the 1940 Act and Section 906 of the Sarbanes- Oxley Act of 2002 are attached hereto. |
| (12.other) | Not applicable. |
SIGNATURES
Pursuant to the requirements of the Securities Exchange Act of 1934 and the Investment Company Act of 1940, the registrant has duly caused this report to be signed on its behalf by the undersigned, thereunto duly authorized.
(Registrant) Touchstone Institutional Funds Trust
By (Signature and Title)* /s/ Jill T. McGruder
Jill T. McGruder, President
(principal executive officer)
Date 2/17/2017
Pursuant to the requirements of the Securities Exchange Act of 1934 and the Investment Company Act of 1940, this report has been signed below by the following persons on behalf of the registrant and in the capacities and on the dates indicated.
By (Signature and Title)* /s/ Jill T. McGruder
Jill T. McGruder, President
(principal executive officer)
Date 2/17/2017
By (Signature and Title)* /s/ Terrie A. Wiedenheft
Terrie A. Wiedenheft, Controller and Treasurer
(principal financial officer)
Date 2/17/2017
* Print the name and title of each signing officer under his or her signature.