UNITED STATES
SECURITIES AND EXCHANGE COMMISSION
Washington, D.C. 20549
FORM N-CSR
CERTIFIED SHAREHOLDER REPORT OF REGISTERED MANAGEMENT INVESTMENT COMPANIES
| Investment Company Act file number | 811-21113 |
| Touchstone Institutional Funds Trust |
| (Exact name of registrant as specified in charter) |
| 303 Broadway, Suite 1100 |
| Cincinnati, Ohio 45202-4203 |
| (Address of principal executive offices) (Zip code) |
| Jill T. McGruder |
| 303 Broadway, Suite 1100 |
| Cincinnati, Ohio 45202-4203 |
| (Name and address of agent for service) |
Registrant's telephone number, including area code: 800-638-8194
Date of fiscal year end: December 31
Date of reporting period: December 31, 2015
Form N-CSR is to be used by management investment companies to file reports with the Commission not later than 10 days after the transmission to stockholders of any report that is required to be transmitted to stockholders under Rule 30e-1 under the Investment Company Act of 1940 (17 CFR 270.30e-1). The Commission may use the information provided on Form N-CSR in its regulatory, disclosure review, inspection, and policymaking roles.
A registrant is required to disclose the information specified by Form N-CSR, and the Commission will make this information public. A registrant is not required to respond to the collection of information contained in Form N-CSR unless the Form displays a currently valid Office of Management and Budget ("OMB") control number. Please direct comments concerning the accuracy of the information collection burden estimate and any suggestions for reducing the burden to Secretary, Securities and Exchange Commission, 100 F Street, NE, Washington, DC 20549. The OMB has reviewed this collection of information under the clearance requirements of 44 U.S.C. § 3507.
Item 1. Reports to Stockholders.
The Report to Shareholders is attached herewith.
December 31, 2015
Annual Report
Touchstone Institutional Funds Trust
Touchstone Sands Capital Institutional Growth Fund

Table of Contents
This report identifies the Fund’s investments on December 31, 2015. These holdings are subject to change. Not all investments in the Fund performed the same, nor is there any guarantee that these investments will perform as well in the future. Market forecasts provided in this report may not occur.
Letter from the President
Dear Shareholder:
We are pleased to provide you with the Touchstone Institutional Funds Trust Annual Report. Inside you will find key financial information, as well as the manager commentary, for the 12 months ended December 31, 2015.
During the fiscal year, volatility descended on the global markets driven by macroeconomic concerns, diverging monetary policies and the resulting secondary effects. Fears of a Greek default during the second quarter and concerns about an economic slowdown in China during the third quarter clouded the outlook for global economic growth and sparked brief sell-offs in risk assets. Each time, these losses were quickly reversed with the announcement of accommodative central bank action. Meanwhile, investors in the U.S. have spent the year carefully parsing U.S. Federal Reserve Board (Fed) language around the timing and path of potential hikes in short-term rates. Slower economic growth and the divergence in monetary policy between the U.S. and other major economies resulted in weaker commodity prices, further appreciation in the U.S. dollar and poor returns for emerging market equities.
U.S. equity markets exhibited mixed performance during the 12-month period. Amid increased volatility, the U.S. markets generally favored larger capitalization stocks and companies with stronger growth characteristics. Developed non-U.S. equities and emerging market equities, which were already in negative territory, declined further as a U.S. dollar that continued to appreciate erased local currency gains.
Shorter-term interest rates rose throughout the year as the market began to assume a greater likelihood that the Fed would begin to raise rates during the second half of 2015. As a result, by the time the Fed raised rates in December, most of the movement had been priced into the markets.
In today’s uncertain market, we believe that focusing on the long-term composition of your investment portfolio is essential to balancing risk and return. We recommend that you work with your financial professional on a regular basis to assess and adjust your asset allocation and diversification strategy as needed to help keep your financial goals on track.
We greatly appreciate your continued support. Thank you for including Touchstone as part of your investment plan.
Sincerely,

Jill T. McGruder
President
Touchstone Institutional Funds Trust
Management’s Discussion of Fund Performance (Unaudited)
Touchstone Sands Capital Institutional Growth Fund
Sub-Advised by Sands Capital Management LLC
Investment Philosophy
The Touchstone Sands Capital Institutional Growth Fund primarily invests in common stocks of large capitalization U.S. companies that are believed by Sands Capital Management LLC (“Sands Capital”) to have above-average potential for revenue or earnings growth. The Fund invests in 25 to 30 companies that are generally high-quality seasoned and growing businesses, spread across an array of attractive and growing industries. Sands Capital generally seeks stocks with sustainable above average earnings growth and capital appreciation potential. In addition, Sands Capital looks for companies that have a significant competitive advantage, a leadership position or proprietary niche, a clear mission in an understandable business, financial strength, and are valued rationally in relation to comparable companies, the market and the business prospects for that particular company.
Fund Performance
The Touchstone Sands Capital Institutional Growth Fund underperformed its benchmark, the Russell 1000® Growth Index, for the 12-month period ended December 31, 2015. The Fund’s total return was 0.22 percent while the total return of the benchmark was 5.67 percent.
Market Environment
U.S. equity markets have had much to contend with over the past year—continued low interest rates, depressed commodity prices, rising geopolitical tensions, a strong U.S. dollar and growing fears of a prolonged economic slowdown in China, to name a few. In our view, the combined effect of all these factors created an environment of uncertainty, which in many case sled to a disconnection between companies’ stock prices and business fundamentals. Heightened risk aversion seemed to cause the market’s collective focus to skew decidedly toward the near term, particularly for companies undergoing investment cycles, where the long-term payoff is often at the expense of short-term profit. Companies owned by the Fund were not immune to these influences. However, during the fourth quarter, Sands Capital believes strong business results drove a narrowing of the gap between market fears and fundamentals for a number of businesses in which the Fund invests, including Alphabet Inc., athenahealth Inc., LinkedIn Corp. and Salesforce.com Inc., among others.
The core of Sands Capital’s investment approach rests on the philosophy that sustainable earnings growth is correlated to stock price appreciation over time. As a result, Sands Capital’s business-focused and criteria-driven investment process is centered on identifying the few truly exceptional businesses that Sands Capital believes can deliver above-average earnings growth over our investment horizon (three to five years, or longer). Sands Capital believes by owning leading businesses with significant competitive advantages, strong management teams and powerful secular tail winds, Sands Capital can confidently look beyond periods of short-term volatility.
Portfolio Review
The top five contributors to relative investment results were Regeneron Pharmaceuticals Inc. (Health Care sector), Visa Inc., Salesforce.com Inc. (both Information Technology sector), Nike Inc. (Consumer Discretionary sector) and Facebook Inc. (Information Technology sector). Throughout the year, Facebook reported results that exceeded Sands Capital’s expectations across all key metrics: engagement, ad revenue growth and mobile monetization. Since the Fund made its initial investment in the company in 2012, Facebook’s main priority has been making the transition from the desktop to mobile. Mobile now accounts for over 50 percent of advertising dollars so, with this initiative winding down, the company is focused on executing three-, five- and ten-year strategic plans. For at least the next three years, Sands Capital believes the company’s advertising business should remain the key driver of growth. Over the next five years, management has four primary goals. These include
Management’s Discussion of Fund Performance (Unaudited) (Continued)
improving the experience on both Facebook Messenger and WhatsApp, helping developers build better experiences on the Facebook platform, expanding usage of the Facebook Audience Network among developers and publishers and improving the “App Link” technology for mobile apps. Looking beyond our investment horizon, over the next ten years, Facebook plans to leverage its recent acquisition of Oculus Innovative Sciences Inc. to build a next-generation computing platform. The company also aims to extend the reach of Internet.org, its partnership with mobile carriers, to increase the number of worldwide users with Internet access, which could further entrench its platform around the globe. Sands Capital is pleased management is taking a long-term approach and continues to believe there is broad opportunity for Facebook to sustain above-averagegrowth, both with in Sands Capital’sfive-year investment horizon, and beyond.
The top five detractors from relative investment results were LendingClub Corp. (Financials sector), Chipotle Mexican Grill Inc. (Consumer Discretionary sector), Whole Foods Market Inc. (Consumer Staples sector), FMC Technologies Inc. (Energy sector) and Alibaba Group Holding Ltd. (Information Technology sector). Chipotle reported strong business results throughout the year, however, during the fourth quarter, the company reported a series of food safety incidents. Restaurants in Washington,Oregon,Kansas, North Dakota and Pennsylvania were connected to outbreaks of E. coli, and a restaurant in Boston was linked to an incident of norovirus. Chipotle temporarily closed locations in some areas as a result, and negative publicity has affected nationwide sales. The company is in the process of implementing new food safety and testing measures to mitigate potential contamination in the future, but it is important to note, Sands Capital believes its standards were already best-in-class and outbreaks are fairly common in the industry. While Sands Capital expects these events to have an impact on the company’s short-term results, Sands Capital remains positive on Chipotle’s long-term prospects. Sands Capital believes the company is one of a small number of high-quality consumer companies with a strong brand that still has a long runway for growth. Additionally, Sands Capital believes management is taking the necessary steps to improve food safety and communicate these efforts to customers. Furthermore, Chipotle continues to both benefit from, and drive, the shift to fast-casual restaurants. In Sands Capital’s view, the U.S. is still in the early innings of a secular shift toward increased spending on fast-casual dining, and Sands Capital believes Chipotle is a prime beneficiary of this trend.
In the past year, Sands Capital initiated positions in eight businesses: Amazon.com Inc. (Consumer Discretionary sector), Edwards Life sciences Corp., Illumina Inc. and Incyte Corp. (all Health Care sector), Mobileye NV (Information Techology sector), Netflix Inc. (Consumer Discretionary sector), Palo Alto Networks Inc. (Information Technology sector) and Under Armour Inc. (Consumer Discretionary sector). Over the same period, Sands Capital eliminated eight businesses: ARM Holdings PLC, ASML Holding NV (both Information Technology sector), Las Vegas Sands Corp. (Consumer Discretionary sector), National Oil well Varco Inc. (Energy sector), Nike Inc. (Consumer Discretionary sector), Southwestern Energy Co. (Energy sector), Twenty-First Century Fox Inc. (Consumer Discretionary sector) and Whole Foods Market Inc. (Consumer Staples sector).
Outlook
A strong U.S. dollar affects many U.S.-domiciled businesses that derive meaningful revenue outside of the U.S. Given our three- to five-year investment horizon, Sands Capital believes business fundamentals will be the most important driver of long-term earnings growth. However, over shorter time periods, currency movements can create temporary headwinds and tailwinds for the Fund’s portfolio companies. In recent quarters, many of the Fund’s holdings have reported that the strengthening dollar has pressured earnings. At the same time, many have also reported that this headwind has been somewhat offset by improving growth prospects for the U.S. economy relative to other areas around the globe. With the benefit of a five-year lens, Sands Capital is decidedly enthusiastic about companies that are experiencing global adoption and accessing new markets.
Sands Capital believes the Fund’s portfolio companies are positioned to deliver strong business results and earnings growth over its three- to five-year investment horizon. Sands Capital’s focus on the sustainability of
Management’s Discussion of Fund Performance (Unaudited) (Continued)
a business’s future earnings growth typically steers us toward companies Sands Capital believes are benefiting from secular trends that should provide powerful growth tailwinds throughout economic cycles. Sands Capital has high conviction in the long-term growth estimates for the Fund’s companies and believes they can deliver the growth necessary to support above average relative and absolute returns over the next several years.
The Fund’s sector allocations are a residual of our bottom-up, fundamental approach. Sands Capital’s six investment criteria typically leads Sands Capital to innovative businesses that are creating new or disrupting existing markets, and/or benefiting from powerful secular tailwinds. Sands Capital’s approach to investment research, portfolio construction and risk management results in a Fund that Sands Capital believes is naturally diversified across industries and businesses at different stages of their respective growth lifecycles. Sands Capital expects to continue to have higher weights in key growth sectors, including Consumer, Life Sciences and Information Technology, and lower weights in highly-cyclical sectors such as Energy, Industrials and Financials.
Management’s Discussion of Fund Performance (Unaudited) (Continued)
Comparison of the Change in Value of a $500,000 Investment in the
Touchstone Sands Capital Institutional Growth Fund and the Russell 1000® Growth Index
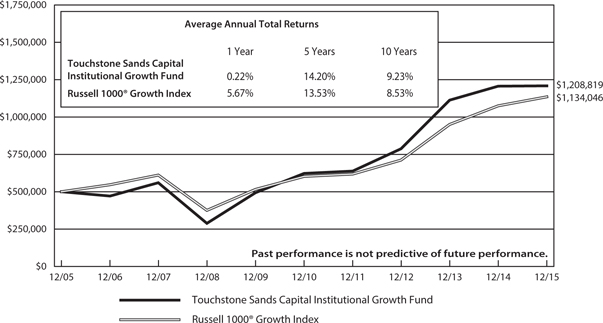
The performance of the above Fund does not reflect the deduction of taxes that a shareholder would pay on Fund distributions or the redemption of Fund shares.
The inception date of the Fund was January 21, 2005.
Note to Chart
The Russell 1000® Growth Index measures the performance of those Russell 1000 companies with higher price-to-book ratios and higher forecasted growth values.
Tabular Presentation of Portfolio of Investments (Unaudited)
December 31, 2015
The table below provides the Fund’s sector allocation. We hope it will be useful to shareholders as it summarizes key information about the Fund’s investments.
Touchstone Sands Capital Institutional Growth
Fund | |
| Sector Allocation* | (% of Net Assets) | |
| Information Technology | 38.0 | % |
| Health Care | 30.1 | |
| Consumer Discretionary | 18.2 | |
| Energy | 4.0 | |
| Financials | 5.3 | |
| Materials | 3.3 | |
| Investment Funds | 5.7 | |
| Other Assets/Liabilities (Net) | (4.6 | ) |
| Total | 100.0 | % |
* Sector Classifications are based upon the Global Industry Classification Standard (GICS®).
Portfolio of Investments
Touchstone Sands Capital Institutional Growth Fund – December 31, 2015
| | | | | | Market | |
| | | Shares | | | Value | |
| | | | | | | | | |
| Common Stocks — 98.9% | | | | | | | | |
| | | | | | | | | |
| Information Technology — 38.0% | | | | | | | | |
| Adobe Systems, Inc.* | | | 869,000 | | | $ | 81,633,860 | |
| Alibaba Group Holding Ltd. ADR* | | | 1,233,000 | | | | 100,205,910 | |
| Alphabet, Inc. - Class A* | | | 130,000 | | | | 101,141,300 | |
| Alphabet, Inc. - Class C* | | | 21,000 | | | | 15,936,480 | |
| Baidu, Inc. ADR* | | | 533,000 | | | | 100,758,320 | |
| Facebook, Inc. - Class A* | | | 1,223,000 | | | | 127,999,180 | |
| LinkedIn Corp. - Class A* | | | 384,000 | | | | 86,430,720 | |
| Mobileye N.V. (Netherlands)*† | | | 1,713,000 | | | | 72,425,640 | |
| Palo Alto Networks, Inc.* | | | 284,000 | | | | 50,023,760 | |
| Salesforce.com, Inc.* | | | 1,482,000 | | | | 116,188,800 | |
| Splunk, Inc.* | | | 875,000 | | | | 51,458,750 | |
| Visa, Inc. - Class A | | | 4,829,000 | | | | 374,488,950 | |
| | | | | | | | 1,278,691,670 | |
| | | | | | | | | |
| Health Care — 30.1% | | | | | | | | |
| Alexion Pharmaceuticals, Inc.* | | | 822,000 | | | | 156,796,500 | |
| athenahealth, Inc.*† | | | 560,000 | | | | 90,143,200 | |
| Biogen, Inc.* | | | 311,000 | | | | 95,274,850 | |
| BioMarin Pharmaceutical, Inc.* | | | 1,140,000 | | | | 119,426,400 | |
| Cerner Corp.* | | | 1,433,000 | | | | 86,223,610 | |
| Edwards Lifesciences Corp.* | | | 1,021,000 | | | | 80,638,580 | |
| Illumina, Inc.* | | | 615,000 | | | | 118,046,175 | |
| Incyte Corp. Ltd.* | | | 604,000 | | | | 65,503,800 | |
| Regeneron Pharmaceuticals, Inc.* | | | 373,000 | | | | 202,490,510 | |
| | | | | | | | 1,014,543,625 | |
| | | | | | | | | |
| Consumer Discretionary — 18.2% | | | | | | | | |
| Amazon.com, Inc.* | | | 229,000 | | | | 154,778,810 | |
| Chipotle Mexican Grill, Inc.* | | | 214,000 | | | | 102,687,900 | |
| Netflix, Inc.* | | | 1,024,000 | | | | 117,125,120 | |
| Priceline Group, Inc. (The)* | | | 125,000 | | | | 159,368,750 | |
| Under Armour, Inc. - Class A*† | | | 951,000 | | | | 76,660,110 | |
| | | | | | | | 610,620,690 | |
| | | | | | | | | |
| Financials — 5.3% | | | | | | | | |
| Charles Schwab Corp. (The) | | | 3,464,000 | | | | 114,069,520 | |
| LendingClub Corp.*† | | | 5,922,000 | | | | 65,438,100 | |
| | | | | | | | 179,507,620 | |
| | | | | | | | | |
| Energy — 4.0% | | | | | | | | |
| FMC Technologies, Inc.* | | | 1,892,000 | | | | 54,886,920 | |
| Schlumberger Ltd. (Curacao) | | | 1,160,000 | | | | 80,910,000 | |
| | | | | | | | 135,796,920 | |
| | | | | | | | | |
| Materials — 3.3% | | | | | | | | |
| Monsanto Co. | | | 1,118,000 | | | | 110,145,360 | |
| Total Common Stocks | | | | | | $ | 3,329,305,885 | |
| | | | | | | | | |
| Investment Funds — 5.7% | | | | | | | | |
| Dreyfus Cash Management, Institutional Shares, 0.22%∞Ω | | | 10,995,195 | | | | 10,995,195 | |
| Invesco Government & Agency Portfolio, Institutional Class, 0.13%**∞Ω | | | 182,053,843 | | | | 182,053,843 | |
| Total Investment Funds | | | | | | $ | 193,049,038 | |
| | | | | | | | | |
| Total Investment Securities —104.6% | | | | | | | | |
| (Cost $2,453,633,306) | | | | | | $ | 3,522,354,923 | |
| | | | | | | | | |
| Liabilities in Excess of Other Assets — (4.6%) | | | | | | | (155,462,795 | ) |
| | | | | | | | | |
| Net Assets — 100.0% | | | | | | $ | 3,366,892,128 | |
| * | Non-income producing security. |
| ** | Represents collateral for securities loaned. |
| † | All or a portion of the security is on loan. The total market value of the securities on loan as of December 31,2015 was $177,997,045. |
| Ω | Represents the 7-day SEC yield as of December 31, 2015. |
Portfolio Abbreviations:
ADR - American Depositary Receipt
Other Information:
The inputs or methodology used for valuing securities may not be an indication of the risk associated with investing in those securities. For more information on valuation inputs, and their aggregation into the levels used in the table below, please refer to the security valuation section in the accompanying Notes to Financial Statements.
| Valuation Inputs at Reporting Date: |
| Description | | Level 1 | | | Level 2 | | | Level 3 | | | Total | |
| Common Stocks | | $ | 3,329,305,885 | | | $ | — | | | $ | — | | | $ | 3,329,305,885 | |
| Investment Funds | | | 193,049,038 | | | | — | | | | — | | | | 193,049,038 | |
| Total | | $ | 3,522,354,923 | | | $ | — | | | $ | — | | | $ | 3,522,354,923 | |
See accompanying Notes to Financial Statements.
Statement of Assets and Liabilities
December 31, 2015
| | | Touchstone | |
| | | Sands Capital | |
| | | Institutional | |
| | | Growth | |
| | | Fund | |
| Assets | | | | |
| Investments, at cost | | $ | 2,453,633,306 | |
| Investments, at market value (A) | | $ | 3,522,354,923 | |
| Dividends and interest receivable | | | 597,000 | |
| Receivable for capital shares sold | | | 6,173,879 | |
| Receivable for investments sold | | | 25,894,439 | |
| Receivable for securities lending income | | | 89,591 | |
| Other assets | | | 29,167 | |
| Total Assets | | | 3,555,138,999 | |
| | | | | |
| Liabilities | | | | |
| Payable for return of collateral for securities on loan | | | 182,053,843 | |
| Payable for capital shares redeemed | | | 3,842,250 | |
| Payable to Advisor | | | 2,286,079 | |
| Other accrued expenses and liabilities | | | 64,699 | |
| Total Liabilities | | | 188,246,871 | |
| | | | | |
| Net Assets | | $ | 3,366,892,128 | |
| | | | | |
| Net assets consist of: | | | | |
| Paid-in capital | | $ | 2,197,092,970 | |
| Accumulated net realized gains on investments | | | 101,077,541 | |
| Net unrealized appreciation on investments | | | 1,068,721,617 | |
| Net assets applicable to shares outstanding | | $ | 3,366,892,128 | |
| | | | | |
| Shares of beneficial interest outstanding (unlimited number of shares authorized, no par value) | | | 158,966,499 | |
| Net asset value, offering price and redemption price per share | | $ | 21.18 | |
| | | | | |
| (A) Includes market value of securities on loan of: | | $ | 177,997,045 | |
See accompanying Notes to Financial Statements.
Statement of Operations
For the Year Ended December 31, 2015
| | | Touchstone | |
| | | Sands Capital | |
| | | Institutional | |
| | | Growth | |
| | | Fund | |
| Investment Income | | | | |
| Dividends from affiliated securities | | $ | 2,377 | |
| Dividends from non-affiliated securities(A) | | | 14,793,822 | |
| Income from securities loaned | | | 502,581 | |
| Total Investment Income | | | 15,298,780 | |
| | | | | |
| Expenses | | | | |
| Unified management fee | | | 28,735,815 | |
| Registration fees | | | 68,030 | |
| Other expenses | | | 198,066 | |
| Net Expenses | | | 29,001,911 | |
| | | | | |
| Net Investment Loss | | | (13,703,131 | ) |
| | | | | |
| Realized and Unrealized Gains (Losses) on Investments | | | | |
| Net realized gains on investments | | | 230,724,219 | |
| Net change in unrealized appreciation (depreciation) on investments | | | (207,683,794 | ) |
| | | | | |
| Net Realized and Unrealized Gains on Investments | | | 23,040,425 | |
| | | | | |
| Change in Net Assets Resulting from Operations | | $ | 9,337,294 | |
| | | | | |
| (A) Net of foreign tax withholding of: | | $ | 227,292 | |
See accompanying Notes to Financial Statements.
Statements of Changes in Net Assets
| | | Touchstone | |
| | | Sands Capital | |
| | | Institutional | |
| | | Growth | |
| | | Fund | |
| | | For the | | | For the | |
| | | Year | | | Year | |
| | | Ended | | | Ended | |
| | | December 31, | | | December 31, | |
| | | 2015 | | | 2014 | |
| From Operations | | | | | | | | |
| Net investment loss | | $ | (13,703,131 | ) | | $ | (13,485,591 | ) |
| Net realized gains on investments | | | 230,724,219 | | | | 328,303,048 | |
| Net change in unrealized appreciation (depreciation) on investments | | | (207,683,794 | ) | | | (2,731,557 | ) |
| Change in Net Assets from Operations | | | 9,337,294 | | | | 312,085,900 | |
| | | | | | | | | |
| Distributions to Shareholders from: | | | | | | | | |
| Net realized gains | | | (170,743,963 | ) | | | (321,779,018 | ) |
| | | | | | | | | |
| Share Transactions | | | | | | | | |
| Proceeds from shares sold | | | 506,976,686 | | | | 758,742,172 | |
| Reinvestment of distributions | | | 164,306,117 | | | | 308,452,514 | |
| Cost of shares redeemed | | | (1,057,782,895 | ) | | | (943,347,275 | ) |
| Change in Net Assets from Share Transactions | | | (386,500,092 | ) | | | 123,847,411 | |
| | | | | | | | | |
| Total Increase (Decrease) in Net Assets | | | (547,906,761 | ) | | | 114,154,293 | |
| | | | | | | | | |
| Net Assets | | | | | | | | |
| Beginning of period | | | 3,914,798,889 | | | | 3,800,644,596 | |
| End of period | | $ | 3,366,892,128 | | | $ | 3,914,798,889 | |
| | | | | | | | | |
| Accumulated Net Investment Income (Loss) | | $ | — | | | $ | — | |
| | | | | | | | | |
| Share Transactions | | | | | | | | |
| Shares issued | | | 22,912,225 | | | | 33,520,873 | |
| Shares reinvested | | | 7,837,712 | | | | 14,007,834 | |
| Shares redeemed | | | (47,715,980 | ) | | | (41,723,970 | ) |
| Change in Shares Outstanding | | | (16,966,043 | ) | | | 5,804,737 | |
See accompanying Notes to Financial Statements.
Financial Highlights
Touchstone Sands Capital Institutional Growth Fund
Selected Data for a Share Outstanding Throughout Each Period
| | | Year Ended December 31, | |
| | | 2015 | | | 2014 | | | 2013 | | | 2012 | | | 2011 | |
| Net asset value at beginning of period | | $ | 22.25 | | | $ | 22.34 | | | $ | 17.12 | | | $ | 14.36 | | | $ | 14.04 | |
| Income (loss) from investment operations: | | | | | | | | | | | | | | | | | | | | |
| Net investment income (loss) | | | (0.09 | ) | | | (0.08 | ) | | | (0.07 | ) | | | 0.01 | | | | (0.04 | ) |
| Net realized and unrealized gains on investments | | | 0.13 | | | | 1.93 | | | | 7.06 | | | | 3.40 | | | | 0.36 | |
| Total from investment operations | | | 0.04 | | | | 1.85 | | | | 6.99 | | | | 3.41 | | | | 0.32 | |
| Distributions from: | | | | | | | | | | | | | | | | | | | | |
| Net investment income | | | — | | | | — | | | | — | (A) | | | (0.01 | ) | | | — | |
| Realized capital gains | | | (1.11 | ) | | | (1.94 | ) | | | (1.77 | ) | | | (0.64 | ) | | | — | |
| Total distributions | | | (1.11 | ) | | | (1.94 | ) | | | (1.77 | ) | | | (0.65 | ) | | | — | |
| Net asset value at end of period | | $ | 21.18 | | | $ | 22.25 | | | $ | 22.34 | | | $ | 17.12 | | | $ | 14.36 | |
| Total return | | | 0.22 | % | | | 8.39 | % | | | 41.28 | % | | | 23.75 | % | | | 2.28 | % |
| Net assets at end of period (000’s) | | $ | 3,366,892 | | | $ | 3,914,799 | | | $ | 3,800,645 | | | $ | 2,250,073 | | | $ | 1,490,474 | |
| Ratio to average net assets: | | | | | | | | | | | | | | | | | | | | |
| Net expenses | | | 0.79 | % | | | 0.79 | % | | | 0.80 | % | | | 0.79 | % | | | 0.80 | % |
| Gross expenses | | | 0.79 | % | | | 0.79 | % | | | 0.80 | % | | | 0.79 | % | | | 0.80 | % |
| Net investment income (loss) | | | (0.37 | )% | | | (0.35 | )% | | | (0.40 | )% | | | 0.06 | % | | | (0.28 | )% |
| Portfolio turnover rate | | | 33 | % | | | 27 | % | | | 37 | % | | | 31 | % | | | 18 | % |
(A) Less than $0.005 per share.
See accompanying Notes to Financial Statements.
Notes to Financial Statements
December 31, 2015
1. Organization
The Touchstone Institutional Funds Trust (the “Trust”) is registered under the Investment Company Act of 1940, as amended (the “1940 Act”), as an open-end management investment company. The Trust was established as a Delaware statutory trust pursuant to an Agreement and Declaration of Trust dated May 30, 2002. The Trust consists of one fund, the Touchstone Sands Capital Institutional Growth Fund (“Sands Capital Institutional Growth Fund” or the “Fund”), which is an open-end, non-diversified management investment company.
The Agreement and Declaration of Trust permits the Trust to issue an unlimited number of shares of beneficial interest of the Fund. The Fund offers a single class of shares. The Fund’s prospectus provides a description of the Fund’s investment goals, policies, and strategies along with information on the class of shares currently being offered.
2. Significant Accounting Policies
The following is a summary of the Fund’s significant accounting policies:
The Fund is an investment company that follows the accounting and reporting guidance of Accounting Standards Codification Topic 946 applicable to investment companies.
Security valuation and fair value measurements — U.S. generally accepted accounting principles (“U.S. GAAP”) define fair value as the price the Fund would receive to sell an asset or pay to transfer a liability in an orderly transaction between market participants at the measurement date. All investments in securities are recorded at their estimated fair value. The Fund defines the term “market value”, as used throughout this report, as the estimated fair value. The Fund uses various methods to measure fair value of its portfolio securities on a recurring basis. U.S. GAAP fair value measurement standards require disclosure of a hierarchy that prioritizes inputs to valuation methods. These inputs are summarized in the three broad levels
isted below:
| · | Level 1 – | quoted prices in active markets for identical securities |
| | | |
| · | Level 2 – | other significant observable inputs (including quoted prices for similar securities, interest rates, prepayment speeds, credit risk, etc.) |
| | | |
| · | Level 3 – | significant unobservable inputs (including the Fund’s own assumptions in determining the fair value of investments) |
The inputs or methodology used for valuing securities are not necessarily an indication of the risk associated with investing in those securities.
The aggregate value by input level, as of December 31, 2015, for the Fund’s investments, as well as a reconciliation of assets for which significant unobservable inputs (Level 3) were used in determining value, if applicable, is included in the Fund’s Portfolio of Investments, which also includes a breakdown of the Fund’s investments by sector allocation. The Fund did not hold any Level 3 categorized securities during the year ended December 31, 2015.
Changes in valuation techniques may result in transfers into or out of an investment’s assigned level within the hierarchy. All transfers in and out of the levels are recognized at the value at the end of the period. During the year ended December 31, 2015, there were no transfers between Levels 1, 2 and 3 for the Fund.
The Fund’s portfolio securities are valued as of the close of the regular session of trading on the New York Stock Exchange (“NYSE”) (currently 4:00 p.m., Eastern time). Portfolio securities traded on stock exchanges are valued at the last reported sale price, official close price, or last bid price if no sales are reported. Portfolio securities quoted by NASDAQ are valued at the NASDAQ Official Closing Price (“NOCP”) or from the primary exchange on which the security trades. To the extent these securities are actively traded, they are categorized
Notes to Financial Statements (Continued)
in Level 1 of the fair value hierarchy. Shares of open-end mutual funds in which the Fund invests are valued at their respective net asset values (“NAV”) as reported by the underlying funds (the “Underlying Funds”) and are categorized in Level 1.
Securities mainly traded on a non-U.S. exchange or denominated in foreign currencies are generally valued according to the preceding closing values on that exchange, translated to U.S. dollars using currency exchange rates as of the close of regular trading on the NYSE, and generally categorized in Level 1. However, if an event that may change the value of a security occurs after the time that the closing value on the non-U.S. exchange was determined, but before the close of regular trading on the NYSE, the security may be priced based on fair value and generally categorized in Level 2. This may cause the value of the security, if held on the books of the Fund to be different from the closing value on the non-U.S. exchange and may affect the calculation of the Fund’s NAV.
The Fund may use fair value pricing under the following circumstances, among others:
| · | If the value of a security has been materially affected by events occurring before the Fund’s pricing time but after the close of the primary markets on which the security is traded. |
| · | If the exchange on which a portfolio security is principally traded closes early or if trading in a particular portfolio security was halted during the day and did not resume prior to the Fund’s NAV calculation. |
| · | If a security is so thinly traded that reliable market quotations are unavailable due to infrequent trading. |
| · | If the validity of market quotations is not reliable. |
Securities held by the Fund that do not have readily available market quotations, significant observable inputs, or securities for which the available market quotations are not reliable, are priced at their estimated fair value using procedures approved by the Fund’s Board of Trustees and are generally categorized in Level 3.
Investment companies — The Fund may invest in securities of other investment companies, including exchange-traded funds (“ETFs”), open-end funds and closed-end funds. Open-end funds are investment companies that issue new shares continuously and redeem shares daily. Closed-end funds are investment companies that typically issue a fixed number of shares that trade on a securities exchange or over-the-counter. An ETF is an investment company that typically seeks to track the performance of an index by holding in its portfolio shares of all the companies, or a representative sample of the companies, that are components of a particular index. ETF shares are traded on a securities exchange based on their market value. The risks of investment in other investment companies typically reflect the risks of the types of securities in which the other investment companies invest. Investments in ETFs and closed-end funds are subject to the additional risk that their shares may trade at a premium or discount to their NAV. When the Fund invests in another investment company, shareholders of the Fund indirectly bear their proportionate share of the other investment company’s fees and expenses, including operating, registration, trustee, licensing and marketing, as well as their share of the Fund’s fees and expenses.
Portfolio securities loaned — The Fund may lend its portfolio securities. Lending portfolio securities exposes the Fund to the risk that the borrower may fail to return the loaned securities or may not be able to provide additional collateral or that the Fund may experience delays in recovery of the loaned securities or loss of rights in the collateral if the borrower fails financially. To minimize these risks, the borrower must agree to maintain cash collateral with the Fund’s custodian. The loaned securities are secured by collateral valued at least equal, at all times, to the market value of the loaned securities plus accrued interest, if any. When the collateral falls below specified amounts, the lending agent will use its best effort to obtain additional collateral on the next business day to meet required amounts under the security lending agreement. The cash collateral is reinvested by the Fund’s custodian into an approved investment vehicle. The approved investment vehicle is subject to market risk.
Notes to Financial Statements (Continued)
As of December 31, 2015, the Fund loaned securities and received collateral as follows:
| | | | | Market | | | Market | | | | |
| | | | | Value of | | | Value of | | | | |
| | | | | Securities | | | Collateral | | | | |
| Fund | | Security Type | | Loaned* | | | Received** | | | Net Amount | |
| Sands Capital Institutional Growth Fund | | Common Stock | | $ | 177,997,045 | | | $ | 182,053,843 | | | $ | 4,056,798 | |
* The remaining contractual maturity is overnight for all securities.
** Gross amounts of recognized liabilities for securities lending is included in the Statement of Assets and Liabilities.
All cash collateral is received, held, and administered by the Fund’s custodian for the benefit of the lending Fund in its custody account or other account established for the purpose of holding collateral.
By participating in securities lending, the Fund receives compensation in the form of fees. Securities lending income is derived from lending long securities from the Fund to creditworthy approved borrowers at rates that are determined based on daily trading volumes, float, short-term interest rates and market liquidity. When the Fund lends securities, it retains the interest or dividends on the investment of any cash received as collateral, and the Fund continues to receive interest or dividends on the loaned securities.
Unrealized gain or loss on the market value of the loaned securities that may occur during the term of the loan is recognized by the Fund. The Fund has the right under the lending agreement to recover any loaned securities from the borrower on demand.
Share valuation — The NAV per share of the Fund is calculated daily by dividing any value of the Fund’s assets, less liabilities, by its number of outstanding shares.
Investment income — Dividend income from securities is recognized on the ex-dividend date, net of foreign withholding taxes, if any, which are reduced by any amounts reclaimable by the Fund, where applicable. Interest income from securities is recorded on the basis of interest accrued, premium amortized and discount accreted.
Distributions to shareholders — The Fund intends to distribute to its shareholders substantially all of its income and capital gains. The Fund declares and distributes net investment income, if any, quarterly as a dividend to shareholders. The Fund makes distributions of capital gains, if any, at least annually, net of applicable capital loss carryforwards. Income distributions and capital gain distributions are determined in accordance with income tax regulations. Recognition of the Fund’s net investment income from investments in Underlying Funds is affected by the timing of dividend declaration by Underlying Funds.
Allocations — Expenses not directly billed to the Fund are allocated proportionally among the Trust and, if applicable, Touchstone Funds Group Trust, Touchstone Investment Trust, Touchstone Strategic Trust, Touchstone Tax-Free Trust, and Touchstone Variable Series Trust (collectively with the Trust, “Touchstone Fund Complex”), daily in relation to net assets of each Fund or another reasonable measure.
Security transactions — Security transactions are reflected for financial reporting purposes as of the trade date. Realized gains and losses on sales of portfolio securities are calculated using the identified cost basis.
Estimates — The preparation of financial statements in conformity with U.S. GAAP requires management to make estimates and assumptions that affect the reported amounts of assets and liabilities and disclosure of contingent assets and liabilities at the date of the financial statements and the reported amounts of income and expenses during the reporting period. Actual results could differ from those estimates.
Expenses — The Fund pays a unified management fee to Touchstone Advisors, Inc. (“Advisor” or “Administrator”) for providing or procuring advisory, administration and other services. The Advisor is responsible for compensating any third party engaged to provide services under its supervision and is also responsible for payment of the
Notes to Financial Statements (Continued)
fees of the independent Trustees, custodian, independent auditor, legal counsel (excluding costs in connection with certain litigation or administrative actions), and the transfer and dividend disbursing agent. The Fund will pay all state registration fees, interest, taxes, dues, fees, or similar costs, brokerage or other transaction costs, and certain extraordinary expenses.
3. Investment Transactions
Investment transactions (excluding short-term investments and U.S. Government securities) were as follows for the year ended December 31, 2015:
| | | Sands Capital | |
| | | Institutional | |
| | | Growth Fund | |
| Purchases of investment securities | | $ | 1,203,231,655 | |
| Proceeds from sales and maturities | | $ | 1,752,640,096 | |
There were no purchases or proceeds from sales and maturities of U.S. Government securities by the Fund for the year ended December 31, 2015.
4. Transactions with Affiliates and Other Related Parties
Certain officers of the Trust are also officers of the Advisor, Touchstone Securities, Inc. (the “Underwriter”) or BNY Mellon Investment Servicing (U.S.) Inc. (“BNY Mellon”), the Sub-Administrator and Transfer Agent to the Fund. Such officers receive no compensation from the Trust. The Advisor and the Underwriter are each wholly-owned, indirect subsidiaries of Western & Southern Financial Group, Inc.
On behalf of the Fund, the Advisor pays each Independent Trustee a quarterly retainer plus additional retainers to the Lead Independent Trustee and the chairs of each standing committee. Interested Trustees do not receive compensation from the Fund. Each Independent Trustee will also receive compensation for each board meeting and committee meeting attended. Each standing committee chair will receive additional compensation for each committee meeting that he or she oversees.
MANAGEMENT & EXPENSE LIMITATION AGREEMENTS
The Advisor provides general investment supervisory services for the Fund, under terms of an advisory agreement (the “Advisory Agreement”). Under the Advisory Agreement, the Fund pays the Advisor a fee, which is computed and accrued daily and paid monthly, at an annual rate of 0.78% of the average daily net assets of the Fund. Under the Advisory Agreement, the Advisor also provides administrative services to the Trust and pays all operating expenses on the Trust’s behalf, excluding state registration fees, interest, taxes, dues, fees, or similar costs, brokerage commissions; other expenditures which are capitalized in accordance with U.S. GAAP; the cost of “Acquired Fund Fees and Expenses”, if any; and other extraordinary expenses not incurred in the ordinary course of business.
The Advisor has entered into an investment sub-advisory agreement with Sands Capital Management, LLC (the “Sub-Advisor”), a Securities and Exchange Commission (“SEC”) registered investment advisor. The Advisor, not the Fund, pays sub-advisory fees to the Sub-Advisor.
The Advisor entered into an expense limitation agreement (the “Expense Limitation Agreement”) to contractually limit the annual operating expenses of the Fund, excluding: dividend and interest expenses relating to short sales; interest; taxes; brokerage commissions and other transaction costs; portfolio transactions and investment related expenses; other expenditures which are capitalized in accordance with U.S. GAAP; the cost of “Acquired Fund Fees and Expenses”, if any; and other extraordinary expenses not incurred in the ordinary course of business. The maximum annual operating expense limit in any year with respect to the Fund, as a percentage of the average
Notes to Financial Statements (Continued)
daily net assets of the Fund, is 0.80%. The Advisor has agreed to waive advisory fees and reimburse expenses in order to maintain the expense limitation for the Fund through at least April 29, 2016. For the year ended December 31, 2015, the Advisor did not waive advisory fees or reimburse any operating expenses.
Under the terms of the Expense Limitation Agreement, the Advisor is entitled to recover, subject to approval by the Fund’s Board, such amounts waived or reimbursed for a period of up to three years from the year in which the Advisor reduced its compensation or assumed expenses for the Fund. No recoupment will occur unless the Fund’s operating expenses are below the expense limitation amount in effect at the time of the waiver or reimbursement. Since the effective date, the Advisor has not waived or reimbursed any expenses, therefore there are no amounts currently eligible for recoupment.
AFFILIATED INVESTMENTS
The Fund may have invested in the Touchstone Institutional Money Market Fund through June 19, 2015, subject to compliance with several conditions set forth in an exemptive order received by the Trust from the SEC. To the extent that the Fund was invested in the Touchstone Institutional Money Market Fund, the Advisor and Administrator were paid additional fees from the Touchstone Institutional Money Market Fund that were not waived or reimbursed.
A summary of the Fund’s investment in the Touchstone Institutional Money Market Fund for the year ended December 31, 2015, is as follows:
| | | Share Activity | | | | | | | |
| | | Balance | | | | | | | | | Balance | | | | | | Value | |
| | | 12/31/14 | | | Purchases | | | Sales | | | 12/31/15 | | | Dividends | | | 12/31/15 | |
| Sands Capital Institutional Growth Fund | | | 90,273,689 | | | | 377,258,393 | | | | (467,532,082 | ) | | | — | | | $ | 2,377 | | | $ | — | |
At a meeting of the Board of Trustees (the “Board”) of the Trust held on February 12, 2015, the Board approved an Agreement and Plan of Reorganization between the Institutional Money Market Fund and the Dreyfus Cash Management Fund advised by The Dreyfus Corporation (“Dreyfus”), pursuant to which the Institutional Money Market Fund would be reorganized on a tax-free basis with and into the Dreyfus Cash Management Fund.
At a special meeting of shareholders of the Institutional Money Market Fund, held on May 8, 2015, shareholders voted to approve the Agreement and Plan of Reorganization. The reorganization took place on June 19, 2015.
5. Federal Tax Information
Federal income tax — It is the Fund’s policy to continue to comply with the special provisions of the Internal Revenue Code applicable to regulated investment companies. As provided therein, in any fiscal year in which the Fund so qualifies and distributes at least 90% of its investment company taxable income, the Fund (but not the shareholders) will be relieved of federal income tax on the income distributed. It is the Fund’s policy to distribute all of its taxable income and accordingly, no provision for income taxes has been made.
In order to avoid imposition of the excise tax applicable to regulated investment companies, it is also the Fund’s intention to declare and pay as dividends in each calendar year at least 98% of its investment company taxable income (earned during the calendar year) and 98.2% of its net realized capital gains (earned during the twelve months ending October 31) plus undistributed amounts from prior years.
Notes to Financial Statements (Continued)
The tax character of distributions paid for the years ended December 31, 2015 and December 31, 2014 are as follows:
| | | Sands Capital | |
| | | Institutional | |
| | | Growth Fund | |
| | | 2015 | | | 2014 | |
| From ordinary income | | $ | 5,650,305 | | | $ | — | |
| From long-term capital gains | | | 165,093,658 | | | | 321,779,018 | |
| Total distributions | | $ | 170,743,963 | | | $ | 321,779,018 | |
The following information is computed on a tax basis for each item as of December 31, 2015:
| | | Sands Capital | |
| | | Institutional | |
| | | Growth Fund | |
| Tax cost of portfolio investments | | $ | 2,474,111,896 | |
| Gross unrealized appreciation | | | 1,155,697,398 | |
| Gross unrealized depreciation | | | (107,454,371 | ) |
| Net unrealized appreciation | | | 1,048,243,027 | |
| Undistributed ordinary income | | | — | |
| Undistributed long-term capital gains | | | 121,556,131 | |
| Accumulated earnings | | $ | 1,169,799,158 | |
The difference between the tax cost of portfolio investments and the financial statement cost is primarily due to wash sale loss deferrals.
As of December 31, 2015, the Fund did not have any capital loss carryforwards for federal income tax purposes.
Under current laws, certain capital losses realized after October 31 and ordinary losses realized after December 31 may be deferred (and certain ordinary losses after October and/or December 31 may be deferred) and treated as occurring on the first day of the following fiscal year. For the year ended December 31, 2015, the Fund did not elect to defer any losses.
The Fund has analyzed its tax positions taken on federal income tax returns for all open tax years (tax years ended December 31, 2012 through 2015) and has concluded that no provision for income tax is required in its financial statements.
Certain reclassifications, the result of permanent differences between financial statement and income tax reporting requirements, have been made to the components of capital. These reclassifications have no impact on the net assets or NAV per share of the Fund. The following reclassifications, which are primarily attributed to deemed distributions on shareholder redemptions utilized and current year write-off of net operating losses, have been made to the Fund for the year ended December 31, 2015.
| | | | | | Accumulated | | | Accumulated | |
| | | Paid-In | | | Net Investment | | | Net Realized | |
| Fund | | Capital | | | Income(Loss) | | | Gains(Losses) | |
| Sands Capital Institutional Growth Fund | | $ | 5,818,382 | | | $ | 13,703,131 | | | $ | (19,521,513 | ) |
6. Commitments and Contingencies
The Fund indemnifies the Trust’s officers and Trustees for certain liabilities that might arise from their performance of their duties to the Fund. Additionally, in the normal course of business, the Fund enters into contracts that contain a variety of representations and warranties and which provide general indemnifications. The Fund’s
Notes to Financial Statements (Continued)
maximum exposure under these arrangements is unknown, as this would involve future claims that may be made against the Fund.
7. Principal Risks
Risk Associated with Concentration — The Fund may invest a high percentage of its assets in specific sectors of the market in order to achieve a potentially greater investment return. As a result, the Fund may be more susceptible to economic, political, and regulatory developments in a particular sector of the market, positive or negative, and may experience increased volatility on the Fund’s NAV and magnified effect on the total return.
Please see the Fund’s prospectus for a complete discussion of this and other risks.
8. Subsequent Events
Subsequent events occurring after the date of this report have been evaluated for potential impact to this report through the date the financial statements were issued. There were no subsequent events that necessitated recognition or disclosure in the Fund’s financial statements.
Report of Independent Registered Public Accounting Firm
The Board of Trustees and Shareholders of Touchstone Institutional Funds Trust
We have audited the accompanying statement of assets and liabilities, including the portfolio of investments, of Touchstone Institutional Funds Trust (comprising, Touchstone Sands Capital Institutional Growth Fund) (the “Fund”) as of December 31, 2015, and the related statement of operations for the year then ended, the statements of changes in net assets for each of the two years in the period then ended and the financial highlights for each of the five years in the period then ended. These financial statements and financial highlights are the responsibility of the Fund’s management. Our responsibility is to express an opinion on these financial statements and financial highlights based on our audits.
We conducted our audits in accordance with the standards of the Public Company Accounting Oversight Board (United States). Those standards require that we plan and perform the audit to obtain reasonable assurance about whether the financial statements and financial highlights are free of material misstatement. We were not engaged to perform an audit of the Fund’s internal control over financial reporting. Our audits included consideration of internal control over financial reporting as a basis for designing audit procedures that are appropriate in the circumstances, but not for the purpose of expressing an opinion on the effectiveness of the Fund’s internal control over financial reporting. Accordingly, we express no such opinion. An audit also includes examining, on a test basis, evidence supporting the amounts and disclosures in the financial statements and financial highlights, assessing the accounting principles used and significant estimates made by management, and evaluating the overall financial statement presentation. Our procedures included confirmation of securities owned as of December 31, 2015, by correspondence with the custodian, transfer agent, and brokers or by other appropriate auditing procedures where replies from brokers were not received. We believe that our audits provide a reasonable basis for our opinion.
In our opinion, the financial statements and financial highlights referred to above present fairly, in all material respects, the financial position of Touchstone Sands Capital Institutional Growth Fund at December 31, 2015, the results of its operations for the year then ended, the changes in its net assets for each of the two years in the period then ended and the financial highlights for each of the five years in the period then ended, in conformity with U.S generally accepted accounting principles.

Cincinnati, Ohio
February 19, 2016
Other Items (Unaudited)
Qualified Dividend Income
Under the Jobs and Growth Tax Relief Reconciliation Act of 2003 (the “Act”), the following percentages of ordinary dividends paid during the fiscal year ended December 31, 2015 are designated as “qualified dividend income,” as defined in the Act, and are subject to reduced tax rates. The Fund intends to pass through the maximum allowable percentage for Form 1099 Div.
| Sands Capital Institutional Growth Fund | | | 100.00 | % |
Dividend Received Deduction
For corporate shareholders, the following ordinary distributions paid during the current fiscal year ended December 31, 2015 qualify for the corporate dividends received deduction. The Fund intends to pass through the maximum allowable percentage.
| Sands Capital Institutional Growth Fund | | | 100.00 | % |
For the fiscal year ended December 31, 2015, the Fund designated $226,614,739 as long-term capital gains.
Proxy Voting Guidelines and Proxy Voting Records
The Sub-Advisor is responsible for exercising the voting rights associated with the securities purchased and held by the Fund. A description of the policies and procedures that the Sub-Advisor uses in fulfilling this responsibility is available as an appendix to the most recent Statement of Additional Information, which can be obtained without charge by calling toll free 1.800.543.0407 or by visiting the Touchstone website at touchstoneinvestments.com or on the Securities and Exchange Commission’s (the “Commission”) website at sec.gov. Information regarding how those proxies were voted during the most recent twelve-month period ended June 30 is also available without charge by calling toll free 1.800.543.0407 or on the Commission’s website at sec.gov.
Quarterly Portfolio Disclosure
The Trust files a complete listing of portfolio holdings for the Fund as of the end of the first and third quarters of each fiscal year on Form N-Q. The complete listing (i) is available on the Commission’s website; (ii) may be reviewed and copied at the Commission’s Public Reference Room in Washington, DC; or (iii) will be made available to shareholders upon request by calling 1.800.543.0407. Information on the operation of the Public Reference Room may be obtained by calling 1.800.SEC.0330.
Schedule of Shareholder Expenses
As a shareholder of the Fund, you incur two types of costs: (1) transaction costs, including reinvested dividends or other distributions; and (2) ongoing costs, including investment advisory fees; and other Fund expenses. This example is intended to help you understand your ongoing costs (in dollars) of investing in the Fund and to compare these costs with the ongoing costs of investing in other mutual funds.
The example is based on an investment of $1,000 invested at the beginning of the period and held for the entire period (July 1, 2015 through December 31, 2015).
Actual Expenses
The first line of the table below provides information about actual account values and actual expenses. You may use the information in this line, together with the amount you invested, to estimate the expenses that you paid over the period. Simply divide your account value by $1,000 (for example, an $8,600 account value divided by $1,000 = 8.6), then multiply the result by the number in the first line under the heading entitled “Expenses
Other Items (Unaudited) (Continued)
Paid During the Six Months Ended December 31, 2015” to estimate the expenses you paid on your account during this period.
Hypothetical Example for Comparison Purposes
The second line of the table below provides information about hypothetical account values and hypothetical expenses based on the Fund’s actual expense ratio and an assumed rate of return of 5% per year before expenses, which is not the Fund’s actual return. The hypothetical account values and expenses may not be used to estimate the actual ending account balance or expenses you paid for the period. You may use this information to compare the ongoing costs of investing in the Fund and other funds. To do so, compare this 5% hypothetical example with the 5% hypothetical examples that appear in the shareholder reports of the other funds.
Please note that the expenses shown in the table below are meant to highlight your ongoing costs only and do not reflect any transactional costs, such as sales charges (loads), redemption fees, or exchange fees. Therefore, the second line of the table below is useful in comparing ongoing costs only, and will not help you determine the relative total costs of owning different funds. In addition, if these transactional costs were included, your costs would have been higher.
| | | | | | | | | | | | Expenses | |
| | | Net Expense | | | Beginning | | | Ending | | | Paid During | |
| | | Ratio | | | Account | | | Account | | | the Six Months | |
| | | Annualized | | | Value | | | Value | | | Ended | |
| | | December 31, | | | July 1, | | | December 31, | | | December 31, | |
| | | 2015 | | | 2015 | | | 2015 | | | 2015* | |
| Touchstone Sands Capital Institutional Growth Fund | | | | | | | | | | | | | | | | |
| Actual | | | 0.79 | % | | $ | 1,000.00 | | | $ | 999.50 | | | $ | 3.98 | |
| Hypothetical | | | 0.79 | % | | $ | 1,000.00 | | | $ | 1,021.22 | | | $ | 4.02 | |
| * | Expenses are equal to the Fund’s annualized expense ratio, multiplied by the average account value over the period, multiplied by 184/365 (to reflect one-half year period). |
Management and Sub-Advisory Agreement Approval Disclosure
At a meeting held on November 19, 2015, the Board of Trustees (the “Board” or “Trustees”) of the Touchstone Institutional Funds Trust (the “Trust”), and by a separate vote, the Independent Trustees of the Trust, approved the continuance of the Management Agreement between the Trust and the Advisor with respect to the Fund, and the continuance of the Sub-Advisory Agreement between the Advisor and the Sub-Advisor.
In determining whether to approve the continuation of the Management Agreement and the Sub-Advisory Agreement, the Advisor furnished information necessary for a majority of the Independent Trustees to make the determination that the continuance of the Management Agreement and the Sub-Advisory Agreement was in the best interests of the Fund and its shareholders. The information provided to the Board included: (1) industry data comparing advisory fees and expense ratios of comparable investment companies; (2) comparative performance information; (3) the Advisor’s and its affiliates’ revenues and costs of providing services to the Fund; and (4) information about the Advisor’s and Sub-Advisor’s personnel. Prior to voting, the Independent Trustees reviewed the proposed continuance of the Management Agreement and the Sub-Advisory Agreement with management and experienced independent legal counsel and received materials from such counsel discussing the legal standards for their consideration of the proposed continuation of the Management Agreement and the Sub-Advisory Agreement with respect to the Fund. The Independent Trustees also reviewed the proposed continuation of the Management Agreement and the Sub-Advisory Agreement with respect to the Fund with independent legal counsel in private sessions at which no representatives of management were present.
In approving the Fund’s Management Agreement, the Board considered various factors, among them: (1) the nature, extent and quality of services provided to the Fund, including the personnel providing such services; (2) the Advisor’s compensation and profitability; (3) a comparison of fees and performance with other advisors;
Other Items (Unaudited) (Continued)
(4) economies of scale; and (5) the terms of the Management Agreement. The Board’s analysis of these factors is set forth below. The Independent Trustees were advised by independent legal counsel throughout the process.
Nature, Extent and Quality of Advisor Services. The Board considered the level and depth of knowledge of the Advisor, including the professional experience and qualifications of senior personnel. In evaluating the quality of services provided by the Advisor, the Board took into account its familiarity with the Advisor’s senior management through Board meetings, discussions and reports during the preceding year. The Board also took into account the Advisor’s compliance policies and procedures. The quality of administrative and other services, including the Advisor’s role in coordinating the activities of the Fund’s other service providers, was also considered. The Board also considered the Advisor’s relationship with its affiliates and the resources available to them, as well as any potential conflicts of interest.
The Board discussed the Advisor’s effectiveness in monitoring the performance of the Sub-Advisor and the Advisor’s timeliness in responding to performance issues. The Board considered the Advisor’s process for monitoring the Sub-Advisor, which includes an examination of both qualitative and quantitative elements of the Sub-Advisor’s organization, personnel, procedures, investment discipline, infrastructure and performance. The Board considered that the Advisor conducts regular on-site compliance visits with the Sub-Advisor, during which the Advisor examines a wide variety of factors, such as the financial condition of the Sub-Advisor, the quality of the Sub-Advisor’s systems, the effectiveness of the Sub-Advisor’s disaster recovery programs, trade allocation and execution procedures, compliance with the Sub-Advisor’s policies and procedures, results of regulatory examinations and any other factors that might affect the quality of services that the Sub-Advisor provides to the Fund. The Board noted that the Advisor’s compliance monitoring processes also include quarterly reviews of compliance reports, and that any significant issues arising from such reports and the Advisor’s compliance visits to the Sub-Advisor are reported to the Board.
The Trustees concluded that they were satisfied with the nature, extent and quality of services provided to the Fund by the Advisor under the Management Agreement.
Advisor’s Compensation and Profitability. The Board took into consideration the financial condition and profitability of the Advisor and its affiliates and the direct and indirect benefits derived by the Advisor and its affiliates from the Advisor’s relationship with the Fund. The information considered by the Board included operating profit margin information for the Advisor’s business as a whole. The Board noted that the Advisor pays the Sub-Advisor’s sub-advisory fee out of the advisory fee the Advisor receives from the Fund. The Board reviewed the profitability of the Advisor’s relationship with the Fund both before and after tax expenses, and also considered whether the Advisor has the financial wherewithal to continue to provide services to the Fund, noting the ongoing commitment of the Advisor’s parent company with respect to providing support and resources as needed. The Board also noted that the Advisor derives benefits to its reputation and other benefits from its association with the Fund.
The Board recognized that the Advisor should be entitled to earn a reasonable level of profits in exchange for the level of services it provides to the Fund and the entrepreneurial risk that it assumes as Advisor. Based upon their review, the Trustees concluded that the Advisor’s level of profitability from its relationship with the Fund was reasonable and not excessive.
Expenses and Performance. The Board compared the advisory fee and total expense ratio for the Fund with various comparative data, including the median and average advisory fees and total expense ratios of the Fund’s peer group. The Board also considered, among other data, the Fund’s performance results during the six-month, twelve-month, and thirty-six month periods ended June 30, 2015, and noted that the Board reviews on a quarterly basis detailed information about the Fund’s performance results, portfolio composition and investment strategies. The Board also took into account current market conditions and their effect on the Fund’s performance.
Other Items (Unaudited) (Continued)
The Board also considered the effect of the Fund’s growth and size on its performance and expenses. The Board noted that the sub-advisory fee under the Sub-Advisory Agreement was paid by the Advisor out of the advisory fee it receives from the Fund and considered the impact of such sub-advisory fee on the profitability of the Advisor. In reviewing the expense ratio and performance of the Fund, the Board also took into account the nature, extent and quality of the services provided by the Advisor and its affiliates.
The Board considered, among other data, the specific factors and related conclusions set forth below:
Touchstone Sands Capital Institutional Growth Fund. The Fund’s advisory fee and total expense ratio were above the median of its peer group. The Board took into account management’s discussion of the Fund’s expenses and the Fund’s advisory fee structure. The Fund’s performance for the six-month period ended June 30, 2015 was in the 5th quintile of its peer group. The Fund’s performance for the twelve-month period ended June 30, 2015 was in the 4th quintile of its peer group, and the Fund’s performance was in the 3rd quintile for the thirty-six-month period ended June 30, 2015. The Board considered management’s discussion of the Fund’s performance, including both its recent and long-term performance. Based upon their review, the Trustees concluded that the overall performance of the Fund is satisfactory in relation to the performance of funds with similar investment objectives and relevant indices, and that the advisory fee was reasonable in light of the services received by the Fund from the Advisor and the other factors considered.
Economies of Scale. The Board considered the effect of the Fund’s current size and potential growth on its performance and expenses. The Board took into account management’s discussion of the Fund’s advisory fee structure. The Board also noted that if the Fund’s assets increased over time, the Fund might realize other economies of scale if assets increased proportionally more than certain other expenses.
Conclusion. In considering the renewal of the Fund’s Management Agreement, the Board, including the Independent Trustees, did not identify any single factor as controlling, and each Trustee may have attributed different weights to the various factors. The Board reached the following conclusions regarding the Fund’s Management Agreement with the Advisor, among others: (a) the Advisor demonstrated that it possesses the capability and resources to perform the duties required of it under the Management Agreement; (b) the Advisor maintains an appropriate compliance program; (c) the overall performance of the Fund is satisfactory in relation to the performance of funds with similar investment objectives and relevant indices; and (d) the Fund’s advisory fee is reasonable in light of the services received by the Fund from the Advisor and the other factors considered. Based on their conclusions, the Trustees determined that continuation of the Management Agreement was in the best interests of the Fund and its shareholders.
In approving the Fund’s Sub-Advisory Agreement, the Board considered various factors with respect to the Fund and its Sub-Advisory Agreement, among them: (1) the nature, extent and quality of services provided to the Fund, including the personnel providing such services; (2) the Sub-Advisor’s compensation; (3) a comparison of the sub-advisory fee and performance with other advisors; and (4) the terms of the Sub-Advisory Agreement. The Board’s analysis of these factors is set forth below. The Independent Trustees were advised by independent legal counsel throughout the process.
Nature, Extent and Quality of Services Provided; Investment Personnel. The Board considered information provided by the Advisor regarding the services provided by the Sub-Advisor, including information presented periodically throughout the previous year. The Board noted that, on a periodic basis, the Board meets with portfolio managers of the Sub-Advisor to discuss their performance and investment processes and strategies. The Board considered the Sub-Advisor’s level of knowledge and investment style. The Board reviewed the experience and credentials of the investment personnel who are responsible for managing the investment of portfolio securities for the Fund.
Other Items (Unaudited) (Continued)
Sub-Advisor’s Compensation, Profitability and Economies of Scale. The Board also took into consideration the financial condition of the Sub-Advisor and any indirect benefits derived by the Sub-Advisor and its affiliates from the Sub-Advisor’s relationship with the Fund. In considering the profitability to the Sub-Advisor of its relationship with the Fund, the Board noted that the sub-advisory fee under the Sub-Advisory Agreement was paid by the Advisor out of the advisory fee that it receives under the Management Agreement and is negotiated at arms-length. As a consequence, the profitability to the Sub-Advisor of its relationship with the Fund was not a substantial factor in the Board’s deliberations. For similar reasons, the Board did not consider the potential economies of scale in the Sub-Advisor’s management of the Fund to be a substantial factor in its consideration.
Sub-Advisory Fee and Fund Performance. The Board considered that the Fund pays an advisory fee to the Advisor and that the Advisor pays the sub-advisory fee to the Sub-Advisor out of the advisory fee it receives from the Fund. The Board also compared the sub-advisory fee paid by the Advisor to fees charged by the Sub-Advisor to manage comparable institutional separate accounts. The Board considered the amount retained by the Advisor and the sub-advisory fee paid to the Sub-Advisor with respect to the various services provided by the Advisor and the Sub-Advisor. The Board reviewed the sub-advisory fee in relation to various comparative data, including the median and average sub-advisory fees of the Fund’s peer group, and considered the following information:
Touchstone Sands Capital Institutional Growth Fund. The Fund’s sub-advisory fee was above the median of its peer group. Based upon their review, the Trustees concluded that the sub-advisory fee was reasonable in light of the services received by the Fund from the Sub-Advisor and the other factors considered.
As noted above, the Board considered the Fund’s performance during the six-month, twelve-month, and thirty-six month periods ended June 30, 2015, as compared to the Fund’s peer group and noted that the Board reviews on a quarterly basis detailed information about the Fund’s performance results, portfolio composition and investment strategies. The Board also noted the Advisor’s expertise and resources in monitoring the performance, investment style and risk-adjusted performance of the Sub-Advisor. The Board also was mindful of the Advisor’s ongoing monitoring of the Sub-Advisor’s performance.
Conclusion. In considering the renewal of the Sub-Advisory Agreement, the Board, including the Independent Trustees, did not identify any single factor as controlling, and each Trustee may have attributed different weights to the various factors. The Board reached the following conclusions regarding the Sub-Advisory Agreement, among others: (a) the Sub-Advisor is qualified to manage the Fund’s assets in accordance with the Fund’s investment objectives and policies; (b) the Sub-Advisor maintains an appropriate compliance program; (c) the overall performance of the Fund is satisfactory in relation to the performance of funds with similar investment objectives and relevant indices; (d) the Fund’s sub-advisory fee is reasonable in light of the services received by the Fund from the Sub-Advisor and the other factors considered; and (e) the Sub-Advisor’s investment strategies are appropriate for pursuing the investment goals of the Fund. Based on its conclusions, the Board determined that approval of the Sub-Advisory Agreement was in the best interests of the Fund and its shareholders.
Management of the Trust (Unaudited)
Listed below is required information regarding the Trustees and principal officers of the Trust. The Trust’s Statement of Additional Information includes additional information about the Trustees and is available, without charge, upon request by calling 1.800.543.0407, or by visiting the Touchstone website at TouchstoneInvestments.com.
| Interested Trustees1: |
| | | | | | | | | Number | | |
| | | | | | | | | of Funds | | |
| | | | | | | | | Overseen | | |
| | | | | Term of | | | | in the | | |
| Name | | Position(s) | | Office And | | | | Touchstone | | Other |
| Address | | Held with | | Length of | | Principal Occupation(s) | | Fund | | Directorships |
| Age | | Trust | | Time Served | | During Past 5 Years | | Complex2 | | Held During the Past 5 Years3 |
Jill T. McGruder c/o Touchstone Advisors, Inc 303 Broadway Suite 1100 Cincinnati, OH 45202 Year of Birth: 1955 | | President and Trustee | | Until retirement at age 75 or until she resigns or is removed Trustee since 1999 | | President and CEO of IFS Financial Services, Inc. (a holding company). | | 39 | | Director of LaRosa’s, Inc. (a restaurant chain) from 1999 to 2011; IFS Financial Services, Inc. (a holding company) from 1999 to the present; Integrity and National Integrity Life Insurance Co. from 2005 to the present; Touchstone Securities (the Trust’s distributor) from 1999 to the present; Touchstone Advisors (the Trust’s investment advisor and administrator) from 1999 to the present; W&S Brokerage Services (a brokerage company) from 1999 to the present; W&S Financial Group Distributors (a distribution company) from 1999 to the present; Every Child Succeeds (a social services agency) from 2007 to the present; Taft Museum of Art from 2007 to the present; and YWCA of Greater Cincinnati from 2012 to the present. |
| Independent Trustees: | | | | | | | | | | |
Phillip R. Cox c/o Touchstone Advisors, Inc. 303 Broadway Suite 1100 Cincinnati, OH 45202 Year of Birth: 1947 | | Trustee | | Until retirement at age 75 or until he resigns or is removed Trustee since 1999 | | President and Chief Executive Officer of Cox Financial Corp. (a financial services company) from 1971 to the present. | | 39 | | Director of Cincinnati Bell (a communications company) from 1994 to the present; Bethesda Inc. (a hospital) from 2005 to the present; Timken Co. (a manufacturing company) from 2004 to 2014; TimkenSteel from 2014 to the present; Diebold, Inc. (a technology solutions company) from 2004 to the present; and Ohio Business Alliance for Higher Education and the Economy from 2005 to the present. |
William C. Gale c/o Touchstone Advisors, Inc. 303 Broadway Suite 1100 Cincinnati, OH 45202 Year of Birth: 1952 | | Trustee | | Until retirement at age 75 or until he resigns or is removed Trustee since 2013 | | Senior Vice President and Chief Financial Officer (from 2003 to January 2015) of Cintas Corporation (a business services company). | | 39 | | None. |
Susan J. Hickenlooper c/o Touchstone Advisors, Inc. 303 Broadway Suite 1100 Cincinnati, OH 45202 Year of Birth: 1946 | | Trustee | | Until retirement at age 75 or until she resigns or is removed Trustee since 2009 | | Financial Analyst for Impact 100 (charitable organization) from 2012 to 2013. | | 39 | | Trustee of Diocese of Southern Ohio from 2014 to the present; and Trustee of Episcopal Retirement Homes Foundation from 1998 to 2011 (a charitable organization). |
Management of the Trust (Unaudited) (Continued)
| Independent Trustees (Continued): |
| | | | | | | | | Number | | |
| | | | | | | | | of Funds | | |
| | | | | | | | | Overseen | | |
| | | | | Term of | | | | in the | | |
| Name | | Position(s) | | Office And | | | | Touchstone | | Other |
| Address | | Held with | | Length of | | Principal Occupation(s) | | Fund | | Directorships |
| Age | | Trust | | Time Served | | During Past 5 Years | | Complex2 | | Held During the Past 5 Years3 |
Kevin A. Robie c/o Touchstone Advisors, Inc. 303 Broadway Suite 1100 Cincinnati, OH 45202 Year of Birth: 1956 | | Trustee | | Until retirement at age 75 or until he resigns or is removed Trustee since 2013 | | Vice President of Portfolio Management at Soin International LLC (a multinational holding company) from 2004 to the present. | | 39 | | Director of Buckeye EcoCare, Inc. (a lawn care company) from 2013 to the present; Trustee of Dayton Region New Market Fund, LLC (a private fund) from 2010 to the present; Trustee of the Entrepreneurs Center, Inc. (a small business incubator) from 2006 to the present; and Director of Interventional Imaging, Inc. (a medical device company) from 2004 to 2011. |
Edward J. VonderBrink c/o Touchstone Advisors, Inc. 303 Broadway Suite 1100 Cincinnati, OH 45202 Year of Birth: 1944 | | Trustee | | Until retirement at age 75 or until he resigns or is removed Trustee since 2013 | | Consultant, VonderBrink Consulting LLC from 2000 to the present. | | 39 | | Director of Streamline Health Solutions, Inc. (healthcare IT) from 2006 to the present; Mercy Health from 2013 to the present; Mercy Health Foundation (healthcare nonprofit) from 2008 to the present; and Al Neyer Inc. (a construction company) from 2013 to the present. |
| 1 | Ms. McGruder, as a director of the Advisor and the Distributor, and an officer of affiliates of the Advisor and the Trust’s Distributor, is an “interested person” of the Trust within the meaning of Section 2(a)(19) of the 1940 Act. |
| 2 | As of December 31, 2015, the Touchstone Fund Complex consists of 1 series of the Trust, 12 series of Touchstone Funds Group Trust, 2 series of Touchstone Investment Trust, 17 series of Touchstone Strategic Trust, 1 series of Touchstone Tax-Free Trust, and 6 variable annuity series of Touchstone Variable Series Trust. |
| 3 | Each Trustee is also a Trustee of Touchstone Funds Group Trust, Touchstone Investment Trust, Touchstone Strategic Trust, Touchstone Tax-Free Trust, and Touchstone Variable Series Trust. |
Management of the Trust (Unaudited) (Continued)
The following is a list of the Principal Officers of the Trusts, the length of time served, and principal occupations for the past five years.
| Principal Officers: | | | | | | |
| | | | | Term of | | |
| Name | | Position(s) | | Office And | | |
| Address | | Held with | | Length of | | Principal Occupation(s) |
| Age | | Trust1 | | Time Served | | During the Past 5 Years |
Jill T. McGruder
Touchstone Advisors, Inc.
303 Broadway
Suite 1100
Cincinnati, OH 45202
Year of Birth: 1955 | | President and Trustee | | Until resignation, removal or disqualification President since 2006 | | See biography above. |
| | | | | | | |
Steven M. Graziano
Touchstone Advisors, Inc.
303 Broadway
Suite 1100
Cincinnati, OH 45202
Year of Birth: 1954 | | Vice President | | Until resignation, removal or disqualification Vice President since 2009 | | President of Touchstone Advisors, Inc. |
| | | | | | | |
Timothy D. Paulin
Touchstone Advisors, Inc.
303 Broadway
Suite 1100
Cincinnati, OH 45202
Year of Birth: 1963 | | Vice President | | Until resignation, removal or disqualification Vice President since 2010 | | Senior Vice President of Investment Research and Product Management of Touchstone Advisors, Inc.; Director of Product Design of Klein Decisions, Inc. (2003 – 2010). |
| | | | | | | |
Timothy S. Stearns
Touchstone Advisors, Inc.
303 Broadway
Suite 1100
Cincinnati, OH 45202
Year of Birth: 1963 | | Chief Compliance Officer | | Until resignation, removal or disqualification Chief Compliance Officer since 2013 | | Chief Compliance Officer of Touchstone Advisors, Inc.; Chief Compliance Officer of Envestnet Asset Management, Inc. (2009 to 2013). |
| | | | | | | |
Terrie A. Wiedenheft
Touchstone Advisors, Inc.
303 Broadway
Suite 1100
Cincinnati, OH 45202
Year of Birth: 1962 | | Controller and Treasurer | | Until resignation, removal or disqualification Controller and Treasurer since 2006 | | Senior Vice President, Chief Financial Officer and Chief Operations Officer of IFS Financial Services, Inc. (a holding company). |
| | | | | | | |
Ellen Blanchard
BNY Mellon
201 Washington St, 34th Fl.
Boston, MA 02108
Year of Birth: 1973 | | Secretary | | Until resignation, removal or disqualification Secretary since 2015 | | Director and Senior Counsel of BNY Mellon Investment Servicing (US) Inc. |
|
1 | Each officer also holds the same office with the Touchstone Group Funds Trust, Touchstone Investment Trust, Touchstone Strategic Trust, Touchstone Tax-Free Trust, and Touchstone Variable Series Trust. |
This page intentionally left blank.
PRIVACY PROTECTION POLICY
We Respect Your Privacy
Thank you for your decision to invest with us. Touchstone and its affiliates have always placed a high value on the trust and confidence our clients place in us. We believe that confidence must be earned and validated through time. In today’s world, when technology allows the sharing of information at light speeds, trust must be reinforced by our sincere pledge to take the steps necessary to ensure that the information you share with us is treated with respect and confidentiality.
Our Pledge to Our Clients
| · | We collect only the information we need to service your account and administer our business. |
| | |
| · | We are committed to keeping your information confidential and we place strict limits and controls on the use and sharing of your information. |
| | |
| · | We make every effort to ensure the accuracy of your information. |
We Collect the Following Nonpublic Personal Information About You:
| · | Information we receive from you on or in applications or other forms, correspondence, or conversations, including, but not limited to, your name, address, phone number, social security number, assets, income and date of birth; and |
| | |
| · | Information about your transactions with us, our affiliates, or others, including, but not limited to, your account number and balance, payment history, parties to transactions, cost basis information, and other financial information. |
Categories of Information We Disclose and Parties to Whom We Disclose
We do not disclose any nonpublic personal information about our current or former clients to nonaffiliated third parties, except as required or permitted by law.
We Place Strict Limits and Controls on the Use and Sharing of Your Information
| · | We restrict access to nonpublic personal information about you to authorized employees who need the information to administer your business. |
| | |
| · | We maintain physical, electronic and procedural safeguards that comply with federal standards to protect this information. |
| | |
| · | We do not disclose any nonpublic personal information about our current or former clients to anyone, except as required or permitted by law or as described in this document. |
| | |
| · | We will not sell your personal information to anyone. |
We May Provide Information to Service Your Account
Sometimes it is necessary to provide information about you to various companies such as transfer agents, custodians, broker-dealers and marketing service firms to facilitate the servicing of your account. These organizations have a legitimate business need to see some of your personal information in order for us to provide service to you. We may disclose to these various companies the information that we collect as described above. We require that these companies, including our own subsidiaries and affiliates, strictly maintain the confidentiality of this information and abide by all applicable laws. Companies within our corporate family that may receive this information are financial service providers and insurance companies. We do not permit these associated companies to sell the information for their own purposes, and we never sell our customer information.
This policy is applicable to the following affiliated companies: Touchstone Funds Group Trust, Touchstone Investment Trust, Touchstone Strategic Trust, Touchstone Tax-Free Trust, Touchstone Variable Series Trust, Touchstone Institutional Funds Trust, Touchstone Securities, Inc.,* and W&S Brokerage Services, Inc.
* Touchstone Securities, Inc. serves as the underwriter to the Touchstone Funds.
A Member of Western & Southern Financial Group®
The Privacy Protection Policy is not part of the Annual Report.


Touchstone Investments
Distributor
Touchstone Securities, Inc.*
303 Broadway
Cincinnati, Ohio 45202-4203 800.638.8194
www.touchstoneinvestments.com
Investment Advisor
Touchstone Advisors, Inc.*
303 Broadway
Cincinnati, Ohio 45202-4203
Transfer Agent
BNY Mellon Investment Servicing (US) Inc.
4400 Computer Drive
Westborough, MA 01581
Shareholder Service
800.543.0407
* A Member of Western & Southern Financial Group
TSF-1105-TIFT-AR-1512
Item 2. Code of Ethics.
| (a) | The registrant, as of the end of the period covered by this report, has adopted a code of ethics that applies to the registrant’s principal executive officer, principal financial officer, principal accounting officer or controller, or persons performing similar functions, regardless of whether these individuals are employed by the registrant or a third party. |
| (c) | There have been no amendments, during the period covered by this report, to a provision of the code of ethics that applies to the registrant’s principal executive officer, principal financial officer, principal accounting officer or controller, or persons performing similar functions, regardless of whether these individuals are employed by the registrant or a third party, and that relates to any element of the code of ethics description. |
| (d) | The registrant has not granted any waivers, including an implicit waiver, from a provision of the code of ethics that applies to the registrant’s principal executive officer, principal financial officer, principal accounting officer or controller, or persons performing similar functions, regardless of whether these individuals are employed by the registrant or a third party, that relates to one or more of the items set forth in paragraph (b) of this item’s instructions. |
Item 3. Audit Committee Financial Expert.
The registrant’s Board of Trustees has determined that the registrant has at least one audit committee financial expert serving on its audit committee. Mr. William Gale is the registrant’s audit committee financial expert and is an independent trustee within the meaning of the Investment Company Act of 1940, as amended (the “1940 Act”).
Item 4. Principal Accountant Fees and Services.
Audit Fees
| (a) | Audit fees for Touchstone Institutional Funds Trust totaled $14,950 and $13,000 in fiscal 2015 and 2014, respectively, including fees associated with the annual audit and filing of Form N-1A and Form N-SAR. |
Audit-Related Fees
| (b) | There were no audit-related fees for the 2015 and 2014 fiscal years. |
Tax Fees
| (c) | Fees for tax compliance services totaled $3,570 and $3,400 in fiscal 2015 and 2014, respectively. Fees for both 2015 and 2014 relate to the preparation of federal income and excise tax returns and review of capital gains distribution calculations. |
All Other Fees
| (d) | The aggregate fees billed in each of the last two fiscal years for products and services provided by the principal accountant, other than the services reported in paragraphs (a) through (c) of this Item are $512 for 2015 and $219 for 2014, respectively. The fees are related to the PFIC Analyzer and Global Withholding Tax Reporter subscriptions. |
| (e)(1) | Disclose the audit committee's pre-approval policies and procedures described in paragraph (c)(7) of Rule 2-01 of Regulation S-X. |
The Audit Committee’s pre-approval policies describe the types of audit, audit-related, tax and other services that have the general pre-approval of the Audit Committee. The pre-approval policies provide that annual audit service fees, tax services not specifically granted pre-approval, services exceeding pre-approved cost levels and other services that have not received general pre-approval will be subject to specific pre-approval by the Audit Committee. The pre-approval policies further provide that the Committee may grant general pre-approval to other audit services (statutory audits and services associated with SEC registration statements, periodic reports and other documents filed with the SEC or other documents issued in connection with securities offerings), audit-related services (accounting consultations related to accounting, financial reporting or disclosure matters not classified as “audit services,” assistance with understanding and implementing new accounting and financial reporting guidance from rulemaking authorities, agreed-upon or expanded audit procedures related to accounting and/or billing records required to respond to or comply with financial, accounting or regulatory reporting matters and assistance with internal control reporting requirements under Form N-SAR and Form N-CSR), tax services that have historically been provided by the auditor that the Committee believes would not impair the independence of the auditor and are consistent with the SEC’s rules on auditor independence and permissible non-audit services classified as “all other services” that are routine and recurring services.
| (e)(2) | All services described in paragraphs (c) through (d) of Item 4 were approved by the Audit Committee. Not applicable for paragraph (b) of Item 4. |
| (f) | The percentage of hours expended on the principal accountant's engagement to audit the registrant's financial statements for the most recent fiscal year that were attributed to work performed by persons other than the principal accountant's full-time, permanent employees was less than fifty percent. |
| (g) | The aggregate non-audit fees for Touchstone Institutional Funds Trust and certain entities*, totaled approximately $4,082 and $3,619, in 2015 and 2014, respectively. |
* These include the advisors (excluding sub-advisors) and any entity controlling, controlled by or under common control with the advisors that provides ongoing services to the registrant (Funds).
| (h) | The registrant's audit committee of the board of trustees has considered whether the provision of non-audit services that were rendered to the registrant's investment adviser (not including any sub-adviser whose role is primarily portfolio management and is subcontracted with or overseen by another investment adviser), and any entity controlling, controlled by, or under common control with the investment adviser that provides ongoing services to the registrant that were not pre-approved pursuant to paragraph (c)(7)(ii) of Rule 2-01 of Regulation S-X is compatible with maintaining the principal accountant's independence. |
Item 5. Audit Committee of Listed Registrants.
Not applicable.
Item 6. Investments.
| (a) | Schedule of Investments in securities of unaffiliated issuers as of the close of the reporting period is included as part of the report to shareholders filed under Item 1 of this form. |
Item 7. Disclosure of Proxy Voting Policies and Procedures for Closed-End Management Investment Companies.
Not applicable.
Item 8. Portfolio Managers of Closed-End Management Investment Companies.
Not applicable.
Item 9. Purchases of Equity Securities by Closed-End Management Investment Company and Affiliated Purchasers.
Not applicable.
Item 10. Submission of Matters to a Vote of Security Holders.
There have been no material changes to the procedures by which the shareholders may recommend nominees to the registrant’s board of trustees, where those changes were implemented after the registrant last provided disclosure in response to the requirements of Item 407(c)(2)(iv) of Regulation S-K (17 CFR 229.407) (as required by Item 22(b)(15) of Schedule 14A (17 CFR 240.14a-101)), or this item.
Item 11. Controls and Procedures.
| (a) | The registrant’s principal executive and principal financial officers, or persons performing similar functions, have concluded that the registrant’s disclosure controls and procedures (as defined in Rule 30a-3(c) under the Investment Company Act of 1940, as amended (the “1940 Act”) (17 CFR 270.30a-3(c))) are effective, as of a date within 90 days of the filing date of the report that includes the disclosure required by this paragraph, based on their evaluation of these controls and procedures required by Rule 30a-3(b) under the 1940 Act (17 CFR 270.30a-3(b)) and Rules 13a-15(b) or 15d-15(b) under the Securities Exchange Act of 1934, as amended (17 CFR 240.13a-15(b) or 240.15d-15(b)). |
| (b) | There were no changes in the registrant’s internal control over financial reporting (as defined in Rule 30a-3(d) under the 1940 Act (17 CFR 270.30a-3(d))) that occurred during the registrant’s second fiscal quarter of the period covered by this report that has materially affected, or is reasonably likely to materially affect, the registrant’s internal control over financial reporting. |
Item 12. Exhibits.
| (a)(1) | Code of ethics, or any amendment thereto, that is the subject of disclosure required by Item 2 is attached hereto. |
| (a)(2) | Certifications pursuant to Rule 30a-2(a) under the 1940 Act and Section 302 of the Sarbanes-Oxley Act of 2002 are attached hereto. |
| (b) | Certifications pursuant to Rule 30a-2(b) under the 1940 Act and Section 906 of the Sarbanes- Oxley Act of 2002 are attached hereto. |
| (12.other) | Not applicable. |
SIGNATURES
Pursuant to the requirements of the Securities Exchange Act of 1934 and the Investment Company Act of 1940, the registrant has duly caused this report to be signed on its behalf by the undersigned, thereunto duly authorized.
| (Registrant) | Touchstone Institutional Funds Trust |
| By (Signature and Title)* | /s/ Jill T. McGruder |
| | Jill T. McGruder, President |
| | (principal executive officer) |
Pursuant to the requirements of the Securities Exchange Act of 1934 and the Investment Company Act of 1940, this report has been signed below by the following persons on behalf of the registrant and in the capacities and on the dates indicated.
| By (Signature and Title)* | /s/ Jill T. McGruder |
| | Jill T. McGruder, President |
| | (principal executive officer) |
| By (Signature and Title)* | /s/ Terrie A. Wiedenheft |
| | Terrie A. Wiedenheft, Controller and Treasurer |
| | (principal financial officer) |
* Print the name and title of each signing officer under his or her signature.