UNITED STATES
SECURITIES AND EXCHANGE COMMISSION
Washington, D.C. 20549
FORM N-CSR
CERTIFIED SHAREHOLDER REPORT OF REGISTERED MANAGEMENT INVESTMENT COMPANIES
Investment Company Act file number 811-21113
Touchstone Institutional Funds Trust
(Exact name of registrant as specified in charter)
303 Broadway, Suite 1100
Cincinnati, Ohio 45202-4203
(Address of principal executive offices) (Zip code)
Jill T. McGruder
303 Broadway, Suite 1100
Cincinnati, Ohio 45202-4203
(Name and address of agent for service)
Registrant's telephone number, including area code: 800-638-8194
Date of fiscal year end: December 31
Date of reporting period: December 31, 2012
Form N-CSR is to be used by management investment companies to file reports with the Commission not later than 10 days after the transmission to stockholders of any report that is required to be transmitted to stockholders under Rule 30e-1 under the Investment Company Act of 1940 (17 CFR 270.30e-1). The Commission may use the information provided on Form N-CSR in its regulatory, disclosure review, inspection, and policymaking roles.
A registrant is required to disclose the information specified by Form N-CSR, and the Commission will make this information public. A registrant is not required to respond to the collection of information contained in Form N-CSR unless the Form displays a currently valid Office of Management and Budget ("OMB") control number. Please direct comments concerning the accuracy of the information collection burden estimate and any suggestions for reducing the burden to Secretary, Securities and Exchange Commission, 100 F Street, NE, Washington, DC 20549. The OMB has reviewed this collection of information under the clearance requirements of 44 U.S.C. § 3507.
Item 1. Reports to Stockholders.
The Report to Shareholders is attached herewith.
December 31, 2012
Annual Report
Touchstone Institutional Funds Trust
Touchstone Sands Capital Institutional Growth Fund

Table of Contents
| | Page |
| Letter from the President | 3 |
| Management's Discussion of Fund Performance (Unaudited) | 5 - 9 |
| Tabular Presentation of Portfolio of Investments (Unaudited) | 10 |
| Portfolio of Investments: | |
| Touchstone Sands Capital Institutional Growth Fund | 11 |
| Statement of Assets and Liabilities | 12 |
| Statement of Operations | 13 |
| Statements of Changes in Net Assets | 14 |
| Financial Highlights | 15 |
| Notes to Financial Statements | 16 - 21 |
| Report of Independent Registered Public Accounting Firm | 22 |
| Other Items (Unaudited) | 23 - 27 |
| Management of the Trust (Unaudited) | 28 - 30 |
| Privacy Protection Policy | 31 |
Letter from the President
Dear Shareholder:
We are pleased to provide you with the Touchstone Institutional Funds Trust Annual Report. Inside you will find key financial information, as well as manager commentary for the year ended December 31, 2012.
Broad U.S. equity markets posted slight gains in the fourth quarter and generated double-digit returns for the year, despite 2012 being overshadowed by our nation’s fiscal crisis, slow global economic growth and geopolitical uncertainty. The devastation of Hurricane Sandy in October along with disappointing corporate earnings ended a four-month winning streak for the broader market, while the pending U.S. Presidential election and subsequent budget negotiations weighed on domestic markets through year-end.
Overall, the U.S. equity markets had a surprisingly strong year against this economic backdrop. From an investment style and market capitalization perspective, U.S. value equities slightly outperformed their growth counterparts, while there was little disparity in returns across market capitalizations for the period (as measured by the Russell benchmarks). U.S. equities were slightly bested by those of emerging markets during the year, and collectively performed in-line with developed global equities. Additionally, bonds also performed relatively well with high yield and corporate bonds producing higher returns than the broad fixed income market, as represented by the Barclays U.S. Aggregate Bond Index.
Employment growth picked up again after a slowdown mid-year, as the unemployment rate dropped to 7.8 percent in December, its lowest level in four years and down from 8.5 percent at the beginning of the year. For its part, the Federal Reserve (Fed) embarked on a new round of quantitative easing, focused on mortgage-backed securities and U.S. Treasuries. The Fed also indicated that it was likely to maintain accommodative policy even as the economy recovers, implying that they are willing to accept a higher level of inflation over the medium-term. This marks a significant change in Fed policy and may ultimately result in sharply higher long-term interest rates if the pace of economic growth accelerates.
There is much uncertainty going forward. The U.S. is still faced with overcoming a large fiscal cliff of tax increases and spending cuts which risks weakening the U.S. economic recovery. Traditional income investors have benefited from strong bond returns, but the low yields from fixed income may cause investors to seek yield from other areas, including equities. U.S. and international equities are facing a slow growth environment that will create challenges in the year ahead.
Letter from the President (Continued)
Touchstone Investments is committed to helping investors achieve their financial goals by providing access to a distinctive selection of institutional asset managers who are known and respected for proficiency in their specific area of expertise. Recognizing that the mastery of all investment disciplines is beyond the scope of any one firm, the use of sub-advisors allows Touchstone to offer an array of strategically focused mutual funds across styles and asset classes. Touchstone employs a rigorous due-diligence process in sub-advisor selection and performs robust oversight and monitoring of its current sub-advisors.
As unforeseen events and uncertainty continue to impact the markets, we continue to believe that diversification is essential to balancing risk and return. We recommend that you consult with your financial professional to build a diversified portfolio of stock, bond, alternative and money market mutual funds.
We greatly appreciate your continued support. Thank you for including Touchstone as part of your investment plan.
Sincerely,

Jill T. McGruder
President
Touchstone Institutional Funds Trust
Management's Discussion of Fund Performance (Unaudited)
Touchstone Sands Capital Institutional Growth Fund
Sub-Advised by Sands Capital Management LLC
Investment Philosophy and Process
TheTouchstone Sands Capital Institutional Growth Fund primarily invests in common stocks of large capitalization U.S. companies that are believed by Sands Capital to have above-average potential for revenue or earnings growth. The Fund invests in 25 to 30 companies that are generally high-quality seasoned and growing businesses, spread across an array of attractive and growing industries. Sands Capital generally seeks stocks with sustainable above average earnings growth and capital appreciation potential. In addition, Sands Capital looks for companies that have a significant competitive advantage, a leadership position or proprietary niche, a clear mission in an understandable business, financial strength, and are valued rationally in relation to comparable companies, the market, and the business prospects for that particular company.
Fund Performance and Market Overview
The Touchstone Sands Capital Institutional Growth Fund outperformed its benchmark, the Russell 1000 Growth Index, for the 12-month period ended December 31, 2012. The Fund’s total return was 23.75 percent while the benchmark returned 15.26 percent for the same period.
While the U.S. and the world seemed to be facing a period of slower overall growth, this does not mean that growth investors had to struggle. At its core, growth investing is about finding businesses that are either driving or benefiting from “change.”This never-ending cycle of creative destruction governs both economic and non-economic drivers of the global business landscape. We believe there will always be opportunities for diligent and selective growth investors to identify quality investments, whether a region is experiencing accelerating or decelerating growth.
We seek to find what are believed to be special businesses that can succeed in a period of depressed growth. Despite the broad global economic malaise, our experience, deep fundamental research, and long-term concentrated approach should continue to position us to find leading growth businesses and achieve our mission of adding value and enhancing the wealth of our clients with prudence over time.
Portfolio Review
On a relative basis, the top five contributors to performance for the year ended December 31, 2012 were salesforce.com, Inc., Visa, Inc., Regeneron Pharmaceuticals, Inc., Amazon.com, Inc., and Illumina, Inc. The top five relative detractors from performance were Facebook, Inc., FMC Technologies, Inc., Netflix, Inc., Coach, Inc., and C.H. Robinson Worldwide, Inc.
We initiated positions in five companies over the past year: athenahealth, Inc., Cerner Corporation, Facebook, Inc., BioMarin Pharmaceutical, Inc., and Chipotle Mexican Grill, Inc. athenahealth, Inc. is a leading “software-enabled-service” provider in healthcare information technology. The company offers a subscription-based integrated suite of services to physician practices. The services include a web-based practice management system, a service for outsourcing back office billing, and a proprietary “live” payer rules database for reimbursement. We view this database as the company’s key asset, as it is currently the most comprehensive tool available to physician practices to ensure that insurance claims are submitted properly. The database has been developed over the past decade, is continuously updated, and we believe will be very difficult to replicate. In addition, athenahealth recently launched an electronic medical records platform and we anticipate a significant cross-selling opportunity. The company’s attractive business model scales well, and we believe will generate long-term earnings growth.
Management's Discussion of Fund Performance (Unaudited) (Continued)
Cerner is a leading global provider of integrated clinical information systems. We believe Cerner’s flagship product, the Cerner Millennium software suite, provides the most comprehensive set of clinical applications designed to improve safety, quality, and efficiency in the hospital setting. In our view, Cerner’s organically-built Millennium architecture, broad product portfolio, and strong global franchise uniquely position it to benefit from the robust secular tailwinds driving the adoption of clinical information systems. Furthermore, Cerner provides a variety of value-added services around its core Millennium offering. These services include off-site hosting capabilities, operational management, and revenue cycle management, which should provide a solid recurring revenue stream and opportunities to deepen relationships with current clients.
Facebook is the clear leader in social networking with over 900 million active users and accounts for more time spent online than any other destination on the web. Facebook’s broad application for users—e.g., communicating with friends, sharing news, photos, organizing events, etc.—creates a platform that captures unparalleled knowledge of human connections (i.e., the “social graph”). We think this platform is building the foundation to revolutionize online advertising by allowing marketers to mine its data to more effectively target and engage with brand advocates in ways previously not possible. As online advertising continues to evolve, Facebook’s platform offers significant optionality as its competitive advantages should allow it to develop a number of important revenue generating opportunities in the future.
BioMarin Pharmaceutical is a pioneer and a leader in the development of protein-based drugs for rare genetic diseases. We believe these drugs are long duration growth opportunities that provide a clear and powerful benefit to the patient. With operations in over 40 countries, we think BioMarin has the global commercial infrastructure and deep clinical relationships in place to effectively grow its business over time. The company already commercializes a portfolio of leading therapies in addition to developing a compelling mid-to-late stage pipeline that we expect will drive significant operating leverage and earnings growth long term. In our opinion, BioMarin has been the most consistently prolific innovator in the rare disease space over the last five years, measured by the number of new molecules entering clinical trials. It has four drugs on the market today, with the primary products being treatments for lysosomal storage disorders (LSD). These drugs provide a major improvement to the quality of life for patients who have no other viable treatment options. We do not think BioMarin faces meaningful competition with these drugs as it is difficult to capture economic share from the first mover given each individual geographic market is small. The complexity of using living cells to produce protein-based drugs means that it is nearly impossible to create true generic forms, and we see the potential threat of biosimilar competition over the long term as very low.
Chipotle Mexican Grill is a leading developer and operator of fast-casual Mexican restaurants in the United States. Its highly customizable menu includes tacos, burritos, bowls, and salads. The company strives to source the highest quality ingredients, prepare food fresh using classic culinary techniques, and serve it fast, all at a reasonable price relative to its peers. In our view, Chipotle’s innovative business model (restaurant ownership structure, format, assembly line ordering, and incentive systems) provides a durable competitive advantage that has led to industry leading operating margins and returns on invested capital. Replication by competitors would require an overhaul of food sourcing, restaurant setup, menus, and operational schedules. We think this would be difficult to accomplish while maintaining the same price point, and without facing margin compression. The core U.S. Chipotle concept is still early in its growth lifecycle and in our view the store base can roughly triple over the next decade. Importantly, we think Chipotle has the right management team in place to drive this growth over the next five to ten years.
We eliminated six positions over the past year: C.H. Robinson Worldwide, Inc., Illumina, Inc., OpenTable, Inc., Charles Schwab Corp., Netflix, Inc., and W.W. Grainger, Inc. We sold C.H. Robinson during the first quarter of 2012. While we believe C.H. Robinson remains the leading provider of third party logistics services in the U.S., we no longer had confidence in its ability to generate sustainable above average earnings growth over time.
Management's Discussion of Fund Performance (Unaudited) (Continued)
Illumina is a global leader in the fast-growing genomic research tools space. Genetics are accountable for a significant component of human disease, but due to previous technological limitations scientists and researchers currently possess a very small fraction of this relevant genetic information. Roche, which is a global leader in clinical diagnostics, made a bid to acquire Illumina, recognizing the importance of sequencing technology for the future of medical diagnostics and Illumina’s leadership in this space. While Illumina continues to dominate high-throughput sequencing, the market continues to evolve rapidly, with new competitors putting incremental pressure on overall market share and pricing for instruments and reagents. While there was potential for Roche to increase its bid price, we believed that significant further stock appreciation was limited, and chose to sell the Fund’s position in Illumina and reallocate those funds to what we believed were more attractive long-term investments.
In the first quarter 2012, the Fund exited its position in OpenTable. We originally invested in OpenTable due to what we believed was a significant opportunity for the company to take advantage of the shift to online restaurant reservations, the potential to develop new products, as well as to expand into new markets outside the U.S. However, since our initial investment we observed several negative developments that lowered our conviction in OpenTable’s ability to capitalize on these opportunities. Senior level management changes lowered our confidence in the company’s ability to execute, international growth experienced slower adoption than originally expected, new product development and delivery had been disappointing, and increasing competition pressured pricing.
The Fund sold Charles Schwab primarily as a source of funds to add to businesses in which we had a higher-conviction. We believe Charles Schwab remains a good business that generally meets our six investment criteria. However, the company faces a critical “headwind” that may be longer-term in nature, notably the current near zero short-term interest rate environment. This historically low Federal Funds Rate environment forces money market fund managers like Charles Schwab to implement fee waivers that significantly pressure net interest margins. We view this headwind in the following manner: 1) the current low rate environment is completely beyond management’s control; 2) short term rates could remain low for a long time; and 3) we have limited ability to forecast the direction, timing or magnitude of interest rates changes (although we acknowledge that rates will likely increase over time). Despite continued strong results in its core business, we decided to sell Charles Schwab to allocate funds to businesses we believed to have a more attractive growth profile.
The Fund exited its position in Netflix during the third quarter 2012 because we no longer had conviction that the business met our investment criteria. Specifically, we had concerns with management’s ability to execute, the company’s ultimate growth potential, and the durability of its competitive advantages. In our view, several actions taken by Netflix’s management had been poorly executed, most notably the major change to its pricing plans and the announcement and subsequent reversal of Qwikster, a short-lived idea to spin off the DVD business.
The Fund sold W.W. Grainger in the fourth quarter of 2012. Though Grainger remains a dominant full-line supplier to the Maintenance Repair and Operations (MRO) industry, we no longer had conviction in its ability to generate sustained above-average earnings growth. Our Grainger investment case was built on three primary drivers: volume growth from share gains; sustained pricing power derived from Grainger’s competitive advantages, specifically a world-class supply chain and multi-channel business model; and margin expansion. Since our purchase in 2010, the dynamics of the MRO industry have evolved and our ongoing research has highlighted several developments that we think have the potential to negatively impact our investment case.
Strategy and Outlook
As long-term investors in business enterprises, not traders of stocks, Sands Capital does not actively ‘reposition’ portfolios on an ongoing basis. Clearly macro challenges persist–China’s slowdown, the European recession,
Management's Discussion of Fund Performance (Unaudited) (Continued)
continued deleveraging, geopolitical risks, and U.S. election uncertainty−but as a group, our portfolio companies continue to execute and deliver solid business results.
We diligently monitor and continually evaluate the long-term growth prospects for our portfolio companies while simultaneously seeking opportunities to add compelling new businesses to the portfolio.
History has shown that in the long run, companies generating sustainable above-average earnings growth have been rewarded with significant stock price appreciation. This is why our process is predicated on using our six key investment criteria to 1) identify companies with business models that we believe will generate above-average earnings growth (typically companies with significant competitive advantages, strong leadership positions in attractive business spaces, and solid balance sheets); and 2) purchase these companies at what we believe to be rational valuations. While we acknowledge that over shorter-term periods there may be disconnects between stock prices and business fundamentals, we believe that our patient, disciplined and consistent investment philosophy will result in above-average returns for our investors over time.
Management's Discussion of Fund Performance (Unaudited) (Continued)
Comparison of the Change in Value of a $500,000 Investment in the Touchstone Sands Capital
Institutional Growth Fund and the Russell 1000® Growth Index
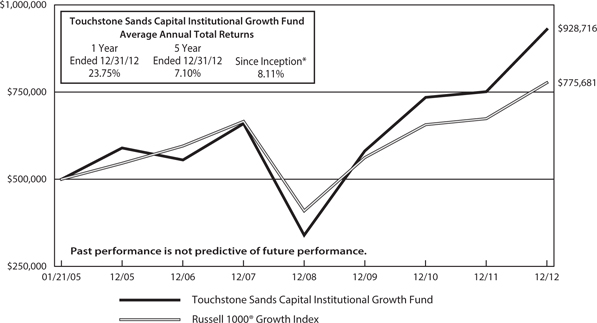
* The initial public offering commenced on January 21, 2005.
The performance of the above Fund does not reflect the deduction of taxes that a shareholder would pay on Fund distributions or the redemption of Fund shares.
Note to Chart
The Russell 1000® Growth Index measures the performance of those Russell 1000 companies with higher price-to-book ratios and higher forecasted growth values.
Tabular Presentation of Portfolio of Investments (Unaudited)
December 31, 2012
The table below provides the Fund’s sector allocation. We hope it will be useful to shareholders as it summarizes key information about the Fund’s investments.
Touchstone Sands Capital Institutional Growth Fund
| Sector Allocation* | | (% of Net Assets) | |
| Information Technology | | | 42.2 | % |
| Consumer Discretionary | | | 24.5 | |
| Health Care | | | 17.6 | |
| Energy | | | 9.4 | |
| Materials | | | 2.9 | |
| Financials | | | 2.2 | |
| Investment Funds | | | 5.5 | |
| Other Assets/Liabilities (Net) | | | (4.3 | ) |
| Total | | | 100.0 | % |
* Sector Classifications are based upon the Global Industry Classification Standard (GICS®).
Portfolio of Investments
Touchstone Sands Capital Institutional Growth Fund – December 31, 2012
| | | | | | Market | |
| | | Shares | | | Value | |
| | | | | | | |
| Common Stocks — 98.8% | | | | | | | | |
| | | | | | | | | |
| Information Technology — 42.2% | | | | | | | | |
| Apple, Inc. | | | 327,000 | | | $ | 174,300,810 | |
| ASML Holding NV† | | | 1,191,880 | | | | 76,768,992 | |
| F5 Networks, Inc.* | | | 633,000 | | | | 61,495,950 | |
| Facebook, Inc. - Class A* | | | 2,296,980 | | �� | | 61,168,576 | |
| Google, Inc. - Class A* | | | 226,000 | | | | 160,317,620 | |
| QUALCOMM, Inc. | | | 1,260,000 | | | | 78,145,200 | |
| Salesforce.com, Inc.* | | | 945,000 | | | | 158,854,500 | |
| Visa, Inc. - Class A | | | 1,173,000 | | | | 177,803,340 | |
| | | | | | | | 948,854,988 | |
| | | | | | | | | |
| Consumer Discretionary — 24.5% | | | | | | | | |
| Amazon.com, Inc.* | | | 693,000 | | | | 174,040,020 | |
| Chipotle Mexican Grill, Inc.* | | | 231,000 | | | | 68,713,260 | |
| Coach, Inc. | | | 1,077,000 | | | | 59,784,270 | |
| Las Vegas Sands Corp. | | | 1,187,000 | | | | 54,791,920 | |
| NIKE, Inc. - Class B | | | 1,280,000 | | | | 66,048,000 | |
| priceline.com, Inc.* | | | 114,000 | | | | 70,816,800 | |
| Starbucks Corp. | | | 1,059,000 | | | | 56,783,580 | |
| | | | | | | | 550,977,850 | |
| | | | | | | | | |
| Health Care — 17.6% | | | | | | | | |
| Alexion Pharmaceuticals, Inc.* | | | 801,000 | | | | 75,141,811 | |
| Allergan, Inc./ United States | | | 1,042,000 | | | | 95,582,660 | |
| athenahealth, Inc.†* | | | 322,000 | | | | 23,650,900 | |
| BioMarin Pharmaceutical, Inc.* | | | 750,000 | | | | 36,937,500 | |
| Cerner Corp.* | | | 817,000 | | | | 63,431,880 | |
| Intuitive Surgical, Inc.* | | | 96,000 | | | | 47,075,520 | |
| Regeneron Pharmaceuticals, Inc.* | | | 322,000 | | | | 55,084,540 | |
| | | | | | | | 396,904,811 | |
| | | | | | | | | |
| Energy — 9.4% | | | | | | | | |
| FMC Technologies, Inc.* | | | 1,147,000 | | | | 49,126,010 | |
| National Oilwell Varco, Inc. | | | 793,000 | | | | 54,201,550 | |
| Schlumberger Ltd. | | | 1,039,000 | | | | 71,992,310 | |
| Southwestern Energy Co.* | | | 1,098,000 | | | | 36,684,180 | |
| | | | | | | | 212,004,050 | |
| | | | | | | | | |
| Materials — 2.9% | | | | | | | | |
| Praxair, Inc. | | | 598,000 | | | | 65,451,100 | |
| | | | | | | | | |
| Financials — 2.2% | | | | | | | | |
| IntercontinentalExchange, Inc.* | | | 396,000 | | | | 49,028,760 | |
| Total Common Stocks | | | | | | $ | 2,223,221,559 | |
| | | | | | | | | |
| Investment Funds — 5.5% | | | | | | | | |
| Invesco Government & Agency Portfolio** | | | 94,033,116 | | | $ | 94,033,116 | |
| Touchstone Institutional Money Market Fund^ | | | 28,658,717 | | | | 28,658,717 | |
| Total Investment Funds | | | | | | $ | 122,691,833 | |
| | | | | | | | | |
| Total Investment Securities —104.3% | | | | | | | | |
| (Cost $1,807,375,820) | | | | | | $ | 2,345,913,392 | |
| | | | | | | | | |
| Liabilities in Excess of Other Assets — (4.3%) | | | | | | | (95,840,396 | ) |
| | | | | | | | | |
| Net Assets — 100.0% | | | | | | $ | 2,250,072,996 | |
| † | All or a portion of the security is on loan. The total value of the securities on loan as of December 31, 2012 was $93,817,243. |
| * | Non-income producing security. |
| ** | Represents collateral for securities loaned. |
| ^ | AffiliatedFund. SeeNote4inNotestoFinancialStatements. |
Other Information:
The inputs or methodology used for valuing securities may not be an indication of the risk associated with investing in those securities. For more information on valuation inputs, and their aggregation into the levels used in the table below, please refer to the security valuation section in the accompanying Notes to Financial Statements.
|
| | | Valuation Inputs at Reporting Date: | |
| Description | | Level 1 | | | Level 2 | | | Level 3 | | | Total | |
| Common Stocks | | $ | 2,223,221,559 | | | $ | — | | | $ | — | | | $ | 2,223,221,559 | |
| Investment Funds | | | 122,691,833 | | | | — | | | | — | | | | 122,691,833 | |
| | | | | | | | | | | | | | | $ | 2,345,913,392 | |
See accompanying Notes to Financial Statements.
Statements of Assets and Liabilities
December 31, 2012
| | | Touchstone | |
| | | Sands Capital | |
| | | Institutional | |
| | | Growth | |
| | | Fund | |
| Assets | | | |
| Investments, at cost | | $ | 1,807,375,820 | |
| Affiliated securities, at market value | | $ | 28,658,717 | |
| Non-affiliated securities, at market value | | | 2,317,254,675 | |
| Investments, at market value (A) | | $ | 2,345,913,392 | |
| Dividends and interest receivable | | | 348,085 | |
| Receivable for capital shares sold | | | 18,032,434 | |
| Receivable for investments sold | | | 4,592,834 | |
| Receivable for securities lending income | | | 49,121 | |
| Other assets | | | 48,933 | |
| Total Assets | | | 2,368,984,799 | |
| | | | | |
| Liabilities | | | | |
| Bank overdrafts | | | 63,460 | |
| Payable for return of collateral for securities on loan | | | 94,033,116 | |
| Payable for capital shares redeemed | | | 8,337,969 | |
| Payable for investments purchased | | | 14,957,852 | |
| Payable to Advisor | | | 1,450,874 | |
| Other accrued expenses and liabilities | | | 68,532 | |
| Total Liabilities | | | 118,911,803 | |
| | | | | |
| Net Assets | | $ | 2,250,072,996 | |
| | | | | |
| Net assets consist of: | | | | |
| Paid-in capital | | $ | 1,703,682,686 | |
| Accumulated net investment income | | | 165,541 | |
| Accumulated net realized gains on investments | | | 7,687,197 | |
| Net unrealized appreciation on investments | | | 538,537,572 | |
| Net assets applicable to shares outstanding | | $ | 2,250,072,996 | |
| | | | | |
| Shares of beneficial interest outstanding (unlimited number of shares authorized, no par value) | | | 131,450,461 | |
| Net asset value, offering price and redemption price per share | | $ | 17.12 | |
| | | | | |
| (A) Includes market value of securities on loan of: | | $ | 93,817,243 | |
See accompanying Notes to Financial Statements.
Statements of Operations
For the Year Ended December 31, 2012
| | | Touchstone | |
| | | Sands Capital | |
| | | Institutional | |
| | | Growth | |
| | | Fund | |
| Investment Income | | | | |
| Dividends from affiliated securities | | $ | 48,203 | |
| Dividends from non-affiliated securities(A) | | | 16,197,853 | |
| Income from securities loaned | | | 317,049 | |
| Total Investment Income | | | 16,563,105 | |
| | | | | |
| Expenses | | | | |
| Unified management fee | | | 15,126,321 | |
| Registration fees | | | 86,261 | |
| Other expenses | | | 184,917 | |
| Net Expenses | | | 15,397,499 | |
| | | | | |
| Net Investment Income | | | 1,165,606 | |
| | | | | |
| Realized and Unrealized Gain on Investments | | | | |
| Net realized gain on investments | | | 139,021,774 | |
| Net change in unrealized appreciation (depreciation) on investments | | | 220,854,465 | |
| | | | | |
| Net Realized and Unrealized Gain on Investments | | | 359,876,239 | |
| | | | | |
| Change in Net Assets Resulting from Operations | | $ | 361,041,845 | |
| | | | | |
| (A) Net of foreign tax withholding of: | | $ | 98,906 | |
See accompanying Notes to Financial Statements.
Statements of Changes in Net Assets
| | | Touchstone | |
| | | Sands Capital | |
| | | Institutional | |
| | | Growth | |
| | | Fund | |
| | | For the | | | For the | |
| | | Year | | | Year | |
| | | Ended | | | Ended | |
| | | December 31, | | | December 31, | |
| | | 2012 | | | 2011 | |
| From Operations | | | | | | | | |
| Net investment income (loss) | | $ | 1,165,606 | | | $ | (3,996,934 | ) |
| Net realized gain on investments | | | 139,021,774 | | | | 57,506,132 | |
| Net change in unrealized appreciation (depreciation) on investments | | | 220,854,465 | | | | (28,906,668 | ) |
| Change in Net Assets from Operations | | | 361,041,845 | | | | 24,602,530 | |
| | | | | | | | | |
| Distributions to Shareholders from | | | | | | | | |
| Net investment income | | | (1,000,065 | ) | | | — | |
| Net realized gains | | | (80,390,498 | ) | | | — | |
| Total Distributions | | | (81,390,563 | ) | | | — | |
| | | | | | | | | |
| Share Transactions | | | | | | | | |
| Proceeds from shares sold | | | 1,099,505,237 | | | | 632,539,398 | |
| Reinvestment of distributions | | | 78,554,327 | | | | — | |
| Cost of shares redeemed | | | (698,112,199 | ) | | | (397,627,619 | ) |
| Change in Net Assets from Share Transactions | | | 479,947,365 | | | | 234,911,779 | |
| | | | | | | | | |
| Total Increase in Net Assets | | | 759,598,647 | | | | 259,514,309 | |
| | | | | | | | | |
| Net Assets | | | | | | | | |
| Beginning of period | | | 1,490,474,349 | | | | 1,230,960,040 | |
| End of period | | $ | 2,250,072,996 | | | $ | 1,490,474,349 | |
| | | | | | | | | |
| Accumulated Net Investment Income | | $ | 165,541 | | | $ | — | |
| | | | | | | | | |
| Share Transactions | | | | | | | | |
| Shares issued | | | 64,149,493 | | | | 43,685,073 | |
| Shares reinvested | | | 4,605,020 | | | | — | |
| Shares redeemed | | | (41,078,250 | ) | | | (27,562,046 | ) |
| Change from Share Transactions | | | 27,676,263 | | | | 16,123,027 | |
See accompanying Notes to Financial Statements.
Financial Highlights
Touchstone Sands Capital Institutional Growth Fund
Selected Data for a Share Outstanding Throughout Each Period
| | | Year Ended December 31, | |
| | | 2012 | | | 2011 | | | 2010 | | | 2009 | | | 2008 | |
| Net asset value at beginning of period | | $ | 14.36 | | | $ | 14.04 | | | $ | 11.12 | | | $ | 6.50 | | | $ | 13.18 | |
| Income (loss) from investment operations: | | | | | | | | | | | | | | | | | | | | |
| Net investment income (loss) | | | 0.01 | | | | (0.04 | ) | | | (0.03 | ) | | | (0.01 | ) | | | (0.04 | ) |
| Net realized and unrealized gains (losses) on investments | | | 3.40 | | | | 0.36 | | | | 2.95 | | | | 4.63 | | | | (6.35 | ) |
| Total from investment operations | | | 3.41 | | | | 0.32 | | | | 2.92 | | | | 4.62 | | | | (6.39 | ) |
| Distributions from: | | | | | | | | | | | | | | | | | | | | |
| Net investment income | | | (0.01 | ) | | | — | | | | — | | | | — | | | | — | |
| Realized capital gains | | | (0.64 | ) | | | — | | | | — | | | | — | | | | (0.29 | ) |
| Total Distributions | | | (0.65 | ) | | | — | | | | — | | | | — | | | | (0.29 | ) |
| Net asset value at end of period | | $ | 17.12 | | | $ | 14.36 | | | $ | 14.04 | | | $ | 11.12 | | | $ | 6.50 | |
| Total return | | | 23.75 | % | | | 2.28 | % | | | 26.26 | % | | | 71.08 | % | | | (48.45 | %) |
| Net assets at end of period (000's) | | $ | 2,250,073 | | | $ | 1,490,474 | | | $ | 1,230,960 | | | $ | 1,003,897 | | | $ | 591,557 | |
| Ratio to average net assets: | | | | | | | | | | | | | | | | | | | | |
| Net expenses | | | 0.79 | % | | | 0.80 | % | | | 0.80 | % | | | 0.80 | % | | | 0.80 | % |
| Gross expenses | | | 0.79 | % | | | 0.80 | % | | | 0.80 | % | | | 0.80 | % | | | 0.80 | % |
| Net investment income (loss) | | | 0.06 | % | | | (0.28 | %) | | | (0.26 | %) | | | (0.13 | %) | | | (0.37 | %) |
| Portfolio turnover rate | | | 31 | % | | | 18 | % | | | 41 | % | | | 34 | % | | | 44 | % |
See accompanying Notes to Financial Statements.
Notes to Financial Statements
December 31, 2012
1. Organization
The Touchstone Institutional Funds Trust (the “Trust”) is registered under the Investment Company Act of 1940, as amended (the “1940 Act”), as an open-end management investment company, and was organized as a Delaware statutory trust on May 29, 2002. The Trust consists of one fund, the Touchstone Sands Capital Institutional Growth Fund (“Sands Capital Institutional Growth Fund” or the “Fund”), which is an open-end, non-diversified management investment company.
The Declaration of Trust permits the Trust to issue an unlimited number of shares of beneficial interest of the Fund. The Fund offers a single class of shares. The assets of the Fund are segregated, and a shareholder’s interest is limited to the Fund in which shares are held. The Fund’s prospectus provides a description of the Fund’s investment goals, policies, and strategies along with information on the class of shares currently being offered.
2. Significant Accounting Policies
The following is a summary of the Fund’s significant accounting policies:
Security valuation and fair value measurements— All investments in securities are recorded at their estimated fair value. The Fund defines the term “market value”, as used throughout this annual report, as the estimated fair value. The Fund uses various methods to measure fair value of its portfolio securities on a recurring basis. Generally accepted accounting principles in the United States (“U.S. GAAP”) establish a hierarchy that prioritizes inputs to valuation methods. These inputs are summarized in the three broad levels listed below:
| • | Level 1 – quoted prices in active markets for identical securities |
| • | Level 2 – other significant observable inputs (including quoted prices for similar securities, interest rates, prepayment speeds, credit risk, etc.) |
| • | Level 3 – significant unobservable inputs (including the Fund’s own assumptions in determining the fair value of investments) |
The inputs or methodology used for valuing securities are not necessarily an indication of the risk associated with investing in those securities. For example, money market instruments are valued using amortized cost, in accordance with rules under the 1940 Act. Generally, amortized cost approximates the current fair value of a security, but since the value is not obtained from a quoted price in an active market, such securities are reflected as Level 2.
The aggregate value by input level, as of December 31, 2012, for the Fund’s investments, as well as a reconciliation of assets for which significant unobservable inputs (Level 3) were used in determining value, if applicable, is included in the Fund’s Portfolio of Investments, which also includes a breakdown of the Fund’s investments by sector concentration. The Fund did not hold any Level 3 categorized securities during the year ended or as of December 31, 2012.
All transfers in and out of the levels are recognized at the value at the end of the period. During the year ended December 31, 2012, there were no transfers between Levels 1, 2 and 3 for the Fund.
The Fund’s portfolio securities are valued as of the close of the regular session of trading on the New York Stock Exchange (“NYSE”) (currently 4:00 p.m., Eastern time). Portfolio securities traded on stock exchanges are valued at the last sale price, and to the extent these securities are actively traded, they are categorized in Level 1 of the fair value hierarchy. Portfolio securities quoted by NASDAQ are valued at the NASDAQ Official Closing Price (“NOCP”). Securities not traded on a particular day, or for which the last sale price is not readily available, are valued at their last broker-quoted bid prices as obtained from one or more of the major market makers for such securities by an independent pricing service and are categorized in Level 2. Debt securities for which market quotations are readily available are valued at their most recent bid prices as obtained from one
Notes to Financial Statements (Continued)
or more of the major market makers for such securities by an independent pricing service and are categorized in Level 2. Money market instruments and other debt securities with a remaining maturity of less than 60 days are valued at amortized cost, which approximates market values, and are categorized in Level 2. Securities for which market quotations or the NOCP are not readily available are fair valued as determined by or under the direction of the Board of Trustees and are categorized in Level 3. Shares of open end mutual funds in which the Fund invests are valued at their respective net asset values (“NAV”) as reported by the underlying funds and are categorized in Level 1. The prices for foreign securities are reported in local currency and translated into U.S. dollars using currency exchange rates.
Level 2 Valuation— Securities mainly traded on a non-U.S. exchange are generally valued according to the preceding closing values on that exchange. However, if an event that may change the value of a security occurs after the time that the closing value on the non-U.S. exchange was determined, but before the close of regular trading on the NYSE, the security may be priced based on fair value. This may cause the value of the security on the books of the Fund to be significantly different from the closing value on the non-U.S. exchange and may affect the calculation of the NAV of the Fund. Any debt securities held by the Fund for which market quotations are not readily available are generally priced at their most recent bid prices as obtained from one or more of the major market makers for such securities.
Level 3 Valuation— Securities held by the Fund that do not have readily available market quotations, or securities for which the available market quotations are not reliable, are priced at their fair value using procedures approved by the Fund’s Board of Trustees. The Fund may use fair value pricing under the following circumstances, among others:
• If the value of a security has been materially affected by events occurring before the Fund’s pricing time but after the close of the primary markets on which the security is traded.
• If the exchange on which a portfolio security is principally traded closes early or if trading in a particular portfolio security was halted during the day and did not resume prior to the Fund’s NAV calculation.
• If a security is so thinly traded that reliable market quotations are unavailable due to infrequent trading.
• If the validity of market quotations is not reliable
New accounting pronouncements— In December 2011, the Financial Accounting Standards Board issued Accounting Standards Update (“ASU”) No. 2011-11, Disclosures about Offsetting Assets and Liabilities. ASU No. 2011-11 requires disclosures to make financial statements that are prepared under U.S. GAAP more comparable to those prepared under International Financial Reporting Standards . The new disclosure requirements mandate that entities disclose both gross and net information about instruments and transactions eligible for offset in the statement of assets and liabilities, as well as instruments and transactions subject to an agreement similar to a master netting arrangement. In addition, ASU No. 2011-11 requires disclosure of collateral received and posted in connection with master netting agreements or similar arrangements. New disclosures are required for annual reporting periods beginning on or after January 1, 2013, and interim periods within those annual periods. Management is evaluating the impact of ASU No. 2011-11 on the financial statements and disclosures.
Portfolio securities loaned— The Fund may lend its portfolio securities. Lending portfolio securities exposes the Fund to the risk that the borrower may fail to return the loaned securities or may not be able to provide additional collateral or that the Fund may experience delays in recovery of the loaned securities or loss of rights in the collateral if the borrower fails financially. To minimize these risks, the borrower must agree to maintain cash collateral with the Fund’s custodian in an amount at least equal to the market value of the loaned securities. The loaned securities are secured by collateral valued at least equal, at all times, to the market value of the securities loaned plus accrued interest, if any. When the collateral falls below specified amounts the lending agent will use its best effort to obtain additional collateral on the next business day to meet required amounts
Notes to Financial Statements (Continued)
under the security lending agreement. The cash collateral is reinvested by the Fund’s custodian into an approved investment vehicle.
As of December 31, 2012, the Fund loaned securities and received collateral as follows:
| | | Market Value of | | Market Value of |
| | | Securities | | Collateral |
| Fund | | Loaned | | Received |
| Sands Capital Institutional Growth Fund | | $ | 93,817,243 | | | $ | 94,033,116 | |
All collateral received as cash is received, held and administered by the Fund’s custodian for the benefit of the Fund in the applicable custody account or other account established for the purpose of holding collateral.
By participating in securities lending, the Fund receives compensation in the form of fees, or retains a portion of interest or dividends on the investment of any cash received as collateral. The Fund also continues to receive interest or dividends on the securities loaned.
Unrealized gain or loss on the market value of the securities loaned that may occur during the term of the loan is recognized by the Fund. The Fund has the right under the lending agreement to recover the securities from the borrower on demand.
Share valuation—The NAV per share is calculated daily by dividing the total value of the Fund’s assets, less liabilities, by its number of outstanding shares.
Investment income— Dividend income from securities is recognized on the ex-dividend date, net of foreign withholding taxes, if any, which are reduced by any amounts reclaimable by the Fund, where applicable. Interest income from securities is recorded on the basis of interest accrued, premium amortized and discount accreted.
Distributions to shareholders— The Fund intends to distribute to its shareholders substantially all of its income and capital gains. The Fund declares and distributes net investment income, if any, quarterly as a dividend to shareholders. The Fund makes distributions of capital gains, if any, at least annually, net of applicable capital loss carryforwards. Income distributions and capital gain distributions are determined in accordance with income tax regulations.
Security transactions— Security transactions are reflected for financial reporting purposes as of the trade date, which may cause the NAV as stated in the accompanying financial statements to be different than the NAV applied to Fund share transactions. Realized gains and losses on sales of portfolio securities are calculated using the identified cost basis.
Estimates— The preparation of financial statements in conformity with U.S. GAAP requires management to make estimates and assumptions that affect the reported amounts of assets and liabilities and disclosure of contingent assets and liabilities at the date of the financial statements and the reported amounts of income and expenses during the reporting period. Actual results could differ from those estimates.
Expenses— The Fund pays a unified management fee to Touchstone Advisors, Inc. (“Advisor” or “Administrator”) for providing or procuring advisory, administration and other services. The Advisor is responsible for compensating any third party engaged to provide services under its supervision and is also responsible for payment of the fees of the independent Trustees, custodian, independent auditor, legal counsel (excluding costs in connection with certain litigation or administrative actions), and the transfer and dividend disbursing agent. The Fund will pay all state registration fees, interest, taxes, dues, fees, or similar costs, brokerage or other transaction costs, and certain extraordinary expenses.
Notes to Financial Statements (Continued)
3. Investment Transactions
Investment transactions (excluding short-term investments and U.S. Government securities) were as follows for the year end December 31, 2012:
| | | Sands Capital |
| | | Institutional |
| | | Growth Fund |
| Purchases of investment securities | | $ | 988,951,118 | |
| Proceeds from sales and maturities | | | 596,812,775 | |
During the year ended December 31, 2012, there were no purchases or sales of U.S. Government securities.
4. Transactions with Affiliates and Other Related Parties
Certain officers of the Trust are also officers of the Advisor, Touchstone Securities, Inc. (the “Underwriter”) and/or BNY Mellon Investment Servicing (US) Inc. (“BNY Mellon”), the Sub-Administrator and Transfer Agent to the Fund. The Advisor and Underwriter are each wholly owned, indirect subsidiaries of The Western and Southern Life Insurance Company (“Western-Southern”).
MANAGEMENT & EXPENSE LIMITATIONS AGREEMENTS
The Advisor provides general investment supervisory services for the Fund, under terms of a management agreement (“Management Agreement”). Under the Management Agreement, the Fund pays the Advisor a fee, which is computed and accrued daily and paid monthly, at an annual rate of 0.78% of the average daily net assets of the Fund. Under the Management Agreement, the Advisor also provides administrative services to the Trust and pays all operating expenses on the Trust’s behalf, excluding state registration fees, interest, taxes, dues, fees, or similar costs, brokerage or other transaction costs, and certain extraordinary expenses.
The Advisor has entered into an investment sub-advisory agreement with Sands Capital Management, LLC (“Sub-Advisor”), a Securities and Exchange Commission (“SEC”) registered investment advisor.
The Advisor, not the Fund, pays the Sub-Advisor a fee for their services.
The Advisor entered into an expense limitation agreement (“Expense Limitation Agreement”) to contractually limit operating expenses of the Fund, excluding dividend expenses on short sales, interest, taxes, brokerage commissions, other expenditures which are capitalized in accordance with generally accepted accounting principles, the cost of “Acquired Fund fees and expenses” if any, and other extraordinary expenses not incurred in the ordinary course of business. The maximum operating expense limit in any year with respect to the Fund, as a percentage of the average daily net assets of the Fund, is 0.80%. The Advisor has agreed to waive advisory fees and reimburse expenses in order to maintain the expense limitation for the Fund through at least April 28, 2013. During the year ended December 31, 2012, the Advisor did not reimburse any operating expenses.
Effective April 29, 2012, under the terms of the Expense Limitation Agreement, the Advisor is entitled to recover, subject to approval by the Fund’s Board of Trustees, such amounts waived or reimbursed for a period of up to three years from the year in which the Advisor reduced its compensation and/or assumed expenses for the Fund. No recoupment will occur unless the Fund’s operating expenses are below the maximum operating expense limit. The Advisor did not recoup any amounts it previously waived or reimbursed during the period April 29, 2012 through December 31, 2012.
AFFILIATED INVESTMENTS
The Fund may invest in the Touchstone Institutional Money Market Fund, subject to compliance with several conditions set forth in an exemptive order received by the Trust from the SEC. To the extent that the other
Notes to Financial Statements (Continued)
Touchstone Funds, including the Fund, are invested in the Touchstone Institutional Money Market Fund, the Advisor and Administrator will be paid additional fees from the Touchstone Institutional Money Market Fund that will not be waived or reimbursed.
A summary of the Fund’s investment in the Touchstone Institutional Money Market Fund for the year ended December 31, 2012, is as follows:
| | | Share Activity | | | | |
| | | Balance | | | | | | Balance | | | | Value |
| | | 12/31/11 | | Purchases | | Sales | | 12/31/12 | | Dividends | | 12/31/12 |
| Sands Capital Institutional Growth Fund | | | 14,987,026 | | | | 717,997,489 | | | | (704,325,798 | ) | | | 28,658,717 | | | $ | 48,203 | | | $ | 28,658,717 | |
5. Federal Tax Information
Federal income tax— It is the Fund’s policy to continue to comply with the special provisions of the Internal Revenue Code applicable to regulated investment companies. As provided therein, in any fiscal year in which the Fund so qualifies and distributes at least 90% of its investment company taxable income, the Fund (but not the shareholders) will be relieved of federal income tax on the income distributed. Accordingly, no provision for income taxes has been made.
In order to avoid imposition of the excise tax applicable to regulated investment companies, it is also the Fund’s intention to declare and pay as dividends in each calendar year at least 98% of its investment company taxable income (earned during the calendar year) and 98.2% of its net realized capital gains (earned during the twelve months ending October 31) plus undistributed amounts from prior years.
The tax character of distributions paid for the year ended December 31, 2012 and December 31, 2011 was as follows:
| | | Sands Capital |
| | | Institutional |
| | | Growth Fund |
| | | 2012 | | 2011 |
| From ordinary income | | $ | 1,000,065 | | | $ | — | |
| From long-term capital gains | | | 80,390,498 | | | | — | |
| | | $ | 81,390,563 | | | $ | — | |
The following information is computed on a tax basis for each item as of December 31, 2012:
| | | Sands Capital |
| | | Institutional |
| | | Growth Fund |
| Tax cost of portfolio investments | | $ | 1,836,821,266 | |
| Gross unrealized appreciation | | | 564,574,063 | |
| Gross unrealized depreciation | | | (55,481,937 | ) |
| Net unrealized appreciation | | | 509,092,126 | |
| Accumulated capital and other losses | | | 37,132,643 | |
| Post October and qualified late-year losses | | | — | |
| Undistributed ordinary income | | | 165,541 | |
| Accumulated earnings | | | 546,390,310 | |
The difference between the tax cost of portfolio investments and the financial statement cost is primarily due to wash sale deferrals.
Notes to Financial Statements (Continued)
As of December 31, 2012, the Fund did not have any capital loss carryforwards for federal income tax purposes.
During the period ended December 31, 2012, the Fund utilized $14,047,079 of capital loss carryforwards:
The Fund has analyzed its tax positions taken on Federal income tax returns for all open tax years (tax years ended December 31, 2009 through 2012) and has concluded that no provision for income tax is required in its financial statements.
6. Commitments and Contingencies
The Fund indemnifies the Trust’s officers and Trustees for certain liabilities that might arise from their performance of their duties to the Fund. Additionally, in the normal course of business, the Fund enters into contracts that contain a variety of representations and warranties and which provide general indemnifications. The Fund’s maximum exposure under these arrangements is unknown, as this would involve future claims that may be made against the Fund that have not yet occurred. However, based on experience, the Fund expects the risk of loss to be remote.
7. Sector Risk
The Fund may invest a high percentage of its assets in specific sectors of the market in order to achieve a potentially greater investment return. As a result, the Fund may be more susceptible to economic, political, and regulatory developments in a particular sector of the market, positive or negative, and may experience increased volatility on the Fund’s NAV and magnified effect on the total return.
8. Subsequent Events
Subsequent events occurring after the date of this report have been evaluated for potential impact to this report through the date the financial statements were issued. There were no subsequent events to report that would have a material impact on the Fund’s financial statements.
Report of Independent Registered Public Accounting Firm
To the Board of Trustees and Shareholders of Touchstone Institutional Funds Trust
We have audited the accompanying statements of assets and liabilities, including the portfolio of investments, of Touchstone Institutional Funds Trust, comprised of Touchstone Sands Capital Institutional Growth Fund (the “Fund”) as of December 31, 2012, and the related statement of operations for the year then ended, the statement of changes in net assets for each of the two years in the period then ended, and the financial highlights for each of the five years in the period then ended. These financial statements and financial highlights are the responsibility of the Fund’s management. Our responsibility is to express an opinion on these financial statements and financial highlights based on our audits.
We conducted our audits in accordance with the standards of the Public Company Accounting Oversight Board (United States). Those standards require that we plan and perform the audits to obtain reasonable assurance about whether the financial statements are free of material misstatement. We were not engaged to perform an audit of the Fund’s internal control over financial reporting. Our audits included consideration of internal control over financial reporting as a basis for designing audit procedures that are appropriate in the circumstances, but not for the purpose of expressing an opinion on the effectiveness of the Fund’s internal control over financial reporting. Accordingly, we express no such opinion. An audit also includes examining, on a test basis, evidence supporting the amounts and disclosures in the financial statements, assessing the accounting principles used and significant estimates made by management, and evaluating the overall financial statement presentation. Our procedures included confirmation of securities owned as of December 31, 2012, by correspondence with the custodian, transfer agent, and brokers or by other appropriate auditing procedures where replies from brokers were not received. We believe that our audits provide a reasonable basis for our opinion.
In our opinion, the financial statements and financial highlights referred to above present fairly, in all material respects, the financial position of Touchstone Sands Capital Institutional Growth Fund at December 31, 2012, the results of its operations for the year then ended, the changes in its net assets for each of the two years in the period then ended, and its financial highlights for each of the five years in the period then ended, in conformity with accounting principles generally accepted in the United States.

Cincinnati, Ohio
February 25, 2013
Other Items (Unaudited)
Qualified Dividend Income
Under the Jobs and Growth Tax Relief Reconciliation Act of 2003 (the “Act”), the following percentages of ordinary dividends paid during the fiscal year ended December 31, 2012 are designated as “qualified dividend income,” as defined in the Act, and are subject to reduced tax rates. The Fund intends to pass through the maximum allowable percentage for 1099s.
| Sands Capital Institutional Growth Fund | 100% |
Dividend Received Deduction
For corporate shareholders, the following ordinary distributions paid during the current fiscal year ended December 31, 2012 qualify for the corporate dividends received deduction.The Fund intends to pass through the maximum allowable percentage for 1099s.
| Sands Capital Institutional Growth Fund | 100% |
For the fiscal year ended December 31, 2012 the Fund designates $117,523,141 as long-term capital gains.
Proxy Voting
The Sub-Advisor is responsible for exercising the voting rights associated with the securities purchased and held by the Fund. A description of the policies and procedures that the Sub-Advisor uses in fulfilling this responsibility and information regarding how those proxies were voted during the twelve month period ended June 30 are available as an exhibit to the most recent Statement of Additional Information which can be obtained without charge by calling toll free 1.800.543.0407.These items are also available on the Securities and Exchange Commission’s (the Commission) website at http://www.sec.gov.
Quarterly Portfolio Disclosure
The Trust files a complete listing of portfolio holdings for the Fund as of the end of the first and third quarters of each fiscal year on Form N-Q. The complete listing (i) is available on the Commission’s website; (ii) may be reviewed and copied at the Commission’s Public Reference Room in Washington, DC; and (iii) will be made available to shareholders upon request by calling 1.800.543.0407. Information on the operation of the Public Reference Room may be obtained by calling 1.800.SEC.0330.
Schedule of Shareholder Expenses
As a shareholder of the Fund, you incur two types of costs: (1) transaction costs, including reinvested dividends or other distributions; and (2) ongoing costs, including investment advisory fees; distribution (12b-1) fees; and other Fund expenses. This example is intended to help you understand your ongoing costs (in dollars) of investing in the Fund and to compare these costs with the ongoing costs of investing in other mutual funds.
The example is based on an investment of $1,000 invested at the beginning of the period and held for the entire period (July 1, 2012 through December 31, 2012).
Actual Expenses
The first line of the table below provides information about actual account values and actual expenses. You may use the information in this line, together with the amount you invested, to estimate the expenses that you paid over the period. Simply divide your account value by $1,000 (for example, an $8,600 account value divided by $1,000 = 8.6), then multiply the result by the number in the first line under the heading entitled “Expenses Paid During the Year Ended December 31, 2012” to estimate the expenses you paid on your account during this period.
Other Items (Unaudited) (Continued)
Hypothetical Example for Comparison Purposes
The second line of the table below provides information about hypothetical account values and hypothetical expenses based on the Fund’s actual expense ratio and an assumed rate of return of 5% per year before expenses, which is not the Fund’s actual return. The hypothetical account values and expenses may not be used to estimate the actual ending account balance or expenses you paid for the period. You may use this information to compare the ongoing costs of investing in the Fund and other funds. To do so, compare this 5% hypothetical example with the 5% hypothetical examples that appear in the shareholder reports of the other funds.
| | | | | | | | | | | | Expenses | |
| | | Net Expense | | | Beginning | | | Ending | | | Paid During | |
| | | Ratio | | | Account | | | Account | | | the Six Months | |
| | | Annualized | | | Value | | | Value | | | Ended | |
| | | December 31, | | | July 1, | | | December 31, | | | December 31, | |
| | | 2012 | | | 2012 | | | 2012 | | | 2012* | |
| Touchstone Sands Capital Institutional Growth Fund | | | | | | | | | | | | | | | | |
| Actual | | | 0.79 | % | | $ | 1,000.00 | | | $ | 1,071.20 | | | $ | 4.11 | |
| Hypothetical | | | 0.79 | % | | $ | 1,000.00 | | | $ | 1,021.70 | | | $ | 4.01 | |
| * | Expenses are equal to the Fund's annualized expense ratio, multiplied by the average account value over the period, multiplied by 184/366 (to reflect one-half year period). |
Advisory Agreement Approval Disclosure
At a meeting held on November 15, 2012, the Board of Trustees (the “Board” or “Trustees”) of the Touchstone Institutional Funds Trust (the “Trust”), and by a separate vote, the Independent Trustees of the Trust, approved the continuance of the Management Agreement between the Trust and the Advisor with respect to the Fund, and the continuance of the Sub-Advisory Agreement between the Advisor and the Sub-Advisor.
In determining whether to approve the continuation of the Management Agreement and the Sub-Advisory Agreement, the Advisor furnished information necessary for a majority of the Independent Trustees to make the determination that the continuance of the Management Agreement and the Sub-Advisory Agreement was in the best interests of the Fund and its shareholders. The information provided to the Board included: (1) industry data comparing advisory fees and expense ratios of comparable investment companies; (2) comparative performance information; (3) the Advisor’s and its affiliates’ revenues and costs of providing services to the Fund; and (4) information about the Advisor’s and Sub-Advisor’s personnel. Prior to voting, the Independent Trustees reviewed the proposed continuance of the Management Agreement and the Sub-Advisory Agreement with management and experienced independent legal counsel and received materials from such counsel discussing the legal standards for their consideration of the proposed continuation of the Management Agreement and the Sub-Advisory Agreement with respect to the Fund. The Independent Trustees also reviewed the proposed continuation of the Management Agreement and the Sub-Advisory Agreement with respect to the Fund with independent legal counsel in private sessions at which no representatives of management were present.
In approving the Fund’s Management Agreement, the Board considered various factors, among them: (1) the nature, extent and quality of services provided to the Fund, including the personnel providing services; (2) the Advisor’s compensation and profitability; (3) a comparison of fees and performance with other advisors; (4) economies of scale; and (5) the terms of the Management Agreement. The Board’s analysis of these factors is set forth below. The Independent Trustees were advised by independent legal counsel throughout the process.
Nature, Extent and Quality of Advisor Services. The Board considered the level and depth of knowledge of the Advisor, including the professional experience and qualifications of senior personnel. In evaluating the quality of services provided by the Advisor, the Board took into account its familiarity with the Advisor’s senior management through Board meetings, discussions and reports during the preceding year. The Board also took into account the Advisor’s compliance policies and procedures. The quality of administrative and other services, including
Other Items (Unaudited) (Continued)
the Advisor’s role in coordinating the activities of the Fund’s other service providers, was also considered. The Board also considered the Advisor’s relationship with its affiliates and the resources available to them, as well as any potential conflicts of interest.
The Board discussed the Advisor’s effectiveness in monitoring the performance of the Sub-Advisor and the Advisor’s timeliness in responding to performance issues. The Board considered the Advisor’s process for monitoring the Sub-Advisor, which includes an examination of both qualitative and quantitative elements of the Sub-Advisor’s organization, personnel, procedures, investment discipline, infrastructure and performance. The Board considered that the Advisor conducts regular on-site compliance visits with the Sub-Advisor, during which the Advisor examines a wide variety of factors, such as the financial condition of the Sub-Advisor, the quality of the Sub-Advisor’s systems, the effectiveness of the Sub-Advisor’s disaster recovery programs, trade allocation and execution procedures, compliance with the Sub-Advisor’s policies and procedures, results of regulatory examinations and any other factors that might affect the quality of services that the Sub-Advisor provides to the Fund. The Board noted that the Advisor’s compliance monitoring processes also include quarterly reviews of compliance reports, and that any issues arising from such reports and the Advisor’s compliance visits to the Sub-Advisor are reported to the Board.
��
The Trustees concluded that they were satisfied with the nature, extent and quality of services provided to the Fund by the Advisor under the Management Agreement.
Advisor’s Compensation and Profitability. The Board took into consideration the financial condition and profitability of the Advisor and its affiliates and the direct and indirect benefits derived by the Advisor and its affiliates from the Advisor’s relationship with the Fund. The information considered by the Board included operating profit margin information for the Advisor’s business as a whole. The Board noted that the Advisor pays the Sub-Advisor’s sub-advisory fee out of the advisory fee the Advisor receives from the Fund. The Board reviewed the profitability of the Advisor’s relationship with the Fund both before and after tax expenses, and also considered whether the Advisor has the financial wherewithal to continue to provide a high level of services to the Fund, noting the ongoing commitment of the Advisor’s parent company with respect to providing support and resources as needed. The Board considered that the Fund’s distributor, an affiliate of the Advisor, receives a portion of the sales charges on sales or redemptions of certain classes of shares. The Board also noted that the Advisor derives benefits to its reputation and other benefits from its association with the Fund.
The Board recognized that the Advisor should be entitled to earn a reasonable level of profits in exchange for the level of services it provides to the Fund and the entrepreneurial risk that it assumes as Advisor. Based upon their review, the Trustees concluded that the Advisor’s level of profitability from its relationship with the Fund was reasonable and not excessive.
Expenses and Performance. The Board compared the advisory fee and total expense ratio for the Fund with various comparative data, including the median and average advisory fees and total expense ratios of the Fund’s peer group. The Board also considered, among other data, the Fund’s performance results during the six-month, twelve-month, and thirty-six month periods ended June 30, 2012 and noted that the Board reviews on a quarterly basis detailed information about the Fund’s performance results, portfolio composition and investment strategies. The Board also took into account current market conditions and their effect on the Fund’s performance.
The Board also considered the effect of the Fund’s growth and size on its performance and expenses. The Board noted that the sub-advisory fee under the Sub-Advisory Agreement was paid by the Advisor out of the advisory fee it receives from the Fund and considered the impact of such sub-advisory fee on the profitability of the Advisor. In reviewing the expense ratio and performance of the Fund, the Board also took into account the nature, extent and quality of the services provided by the Advisor and its affiliates.
The Board considered, among other data, the specific factors and related conclusions set forth below:
Other Items (Unaudited) (Continued)
Touchstone Sands Capital Institutional Growth Fund.The Fund’s advisory fee and total expense ratio were above the median of its peer group. The Board took into account management’s discussion of the Fund’s expenses and the Fund’s advisory fee structure. The Fund’s performance for the six-month, twelve-month and thirty-six month periods ended June 30, 2012 was in the 1st quintile of its peer group. Based upon their review, the Trustees concluded that the Fund’s performance was satisfactory in relation to the performance of funds with similar investment objectives and relevant indices and that the advisory fee was reasonable in light of the high quality of services received by the Fund from the Advisor and the other factors considered.
Economies of Scale. The Board considered the effect of the Fund’s current size and potential growth on its performance and fees. The Board took into account management’s discussion of the Fund’s advisory fee structure. The Board also noted that if the Fund’s assets increased over time, the Fund might realize other economies of scale if assets increased proportionally more than certain other expenses.
Conclusion. In considering the renewal of the Fund’s Management Agreement, the Board, including the Independent Trustees, did not identify any single factor as controlling, and each Trustee may have attributed different weights to the various factors. The Board reached the following conclusions regarding the Fund’s Management Agreement with the Advisor, among others: (a) the Advisor demonstrated that it possesses the capability and resources to perform the duties required of it under the Management Agreement; (b) the Advisor maintains an appropriate compliance program; (c) the performance of the Fund is satisfactory in relation to the performance of funds with similar investment objectives and relevant indices; and (d) the Fund’s advisory fee is reasonable in relation to those of similar funds and the services to be provided by the Advisor. Based on their conclusions, the Trustees determined that continuation of the Management Agreement was in the best interests of the Fund and its shareholders.
In approving the Fund’s Sub-Advisory Agreement, the Board considered various factors with respect to the Fund and its Sub-Advisory Agreement, among them: (1) the nature, extent and quality of services provided to the Fund, including the personnel providing services; (2) the Sub-Advisor’s compensation; (3) a comparison of the sub-advisory fee and performance with other advisors; and (4) the terms of the Sub-Advisory Agreement. The Board’s analysis of these factors is set forth below. The Independent Trustees were advised by independent legal counsel throughout the process.
Nature, Extent and Quality of Services Provided; Investment Personnel. The Board considered information provided by the Advisor regarding the services provided by the Sub-Advisor, including information presented periodically throughout the previous year. The Board noted that, on a periodic basis, the Board meets with portfolio managers of the Sub-Advisor to discuss their performance and investment processes and strategies. The Board considered the Sub-Advisor’s level of knowledge and investment style. The Board reviewed the experience and credentials of the investment personnel who are responsible for managing the investment of portfolio securities for the Fund. The Board also noted the Sub-Advisor’s brokerage practices.
Sub-Advisor’s Compensation. The Board also took into consideration the financial condition of the Sub-Advisor and any indirect benefits derived by the Sub-Advisor and its affiliates from the Sub-Advisor’s relationship with the Fund. In considering the profitability to the Sub-Advisor of its relationship with the Fund, the Board noted that the sub-advisory fee under the Sub-Advisory Agreement was paid by the Advisor out of the advisory fee that it receives under the Management Agreement and is negotiated at arms-length. As a consequence, the profitability to the Sub-Advisor of its relationship with the Fund was not a substantial factor in the Board’s deliberations. For similar reasons, the Board did not consider the potential economies of scale in the Sub-Advisor’s management of the Fund to be a substantial factor in its consideration.
Sub-Advisory Fee and Fund Performance. The Board considered that the Fund pays an advisory fee to the Advisor and that the Advisor pays the sub-advisory fee to the Sub-Advisor out of the advisory fee it receives from the Fund. The Board also compared the sub-advisory fee paid by the Advisor to fees charged by the Sub-Advisor
Other Items (Unaudited) (Continued)
to manage comparable institutional separate accounts. The Board considered the amount retained by the Advisor and the sub-advisory fee paid to the Sub-Advisor with respect to the various services provided by the Advisor and the Sub-Advisor. The Board reviewed the sub-advisory fee in relation to various comparative data, including the median and average sub-advisory fees of the Fund’s peer group, and considered the following information:
Touchstone Sands Capital Institutional Growth Fund . The Fund’s sub-advisory fee was above the median of its peer group. Based upon their review, the Trustees concluded that the sub-advisory fee was reasonable in light of the quality of services received by the Fund from the Sub-Advisor and the other factors considered.
As noted above, the Board considered the Fund’s performance during the six-month, twelve-month, and thirty-six month periods ended June 30, 2012 as compared to the Fund’s peer group and noted that the Board reviews on a quarterly basis detailed information about the Fund’s performance results, portfolio composition and investment strategies. The Board also noted the Advisor’s expertise and resources in monitoring the performance, investment style and risk-adjusted performance of the Sub-Advisor. The Board also was mindful of the Advisor’s ongoing monitoring of the Sub-Advisor’s performance.
Conclusion. In considering the renewal of the Sub-Advisory Agreement, the Board, including the Independent Trustees, did not identify any single factor as controlling, and each Trustee may have attributed different weights to the various factors. The Board reached the following conclusions regarding the Sub-Advisory Agreement, among others: (a) the Sub-Advisor is qualified to manage the Fund’s assets in accordance with the Fund’s investment objectives and policies; (b) the Sub-Advisor maintains an appropriate compliance program; (c) the performance of the Fund is satisfactory in relation to the performance of funds with similar investment objectives and relevant indices; (d) the Fund’s advisory fee is reasonable in relation to those of similar funds and the services to be provided by the Advisor and the Sub-Advisor; and (e) the Sub-Advisor’s investment strategies are appropriate for pursuing the investment objectives of the Fund. Based on its conclusions, the Board determined that approval of the Sub-Advisory Agreement was in the best interests of the Fund and its shareholders.
Management of the Trust (Unaudited)
Listed below is basic information regarding the Trustees and principal officers of the Trust. The Trust’s Statement of Additional Information includes additional information about the Trustees and is available, without charge, upon request by calling 1.800.543.0407.
| Interested Trustees1: |
| | | | | Number | |
| | | | | of Funds | |
| | | | | Overseen | |
| | | Term of | | in the | |
| Name | Position(s) | Office2 And | | Touchstone | |
| Address | Held with | Length of | Principal Occupation(s) | Fund | Other Directorships Held |
| Age | Trust | Time Served | During Past 5 Years | Complex3 | During Past 5 Years4 |
Jill T. McGruder
Touchstone Advisors, Inc
303 Broadway
Cincinnati, OH
Year of Birth: 1955 | Trustee and President | Until retirement at age 75 or until she resigns or is removed Trustee since 1999 | President and CEO of IFS Financial Services, Inc. (a holding company). | 58 | Director of LaRosa’s (a restaurant chain),Capital Analysts Incorporated (an investment advisor and broker- dealer),IFS Financial Services, Inc. (a holding company), Integrity and National Integrity Life Insurance Co., Touchstone Securities (the Trust’s distributor), Touchstone Advisors (the Trust’s investment advisor and administrator), W&S Brokerage Services (a brokerage company) and W&S Financial Group Distributors (a distribution company). |
| Independent Trustees: | | | | | |
Phillip R. Cox
105 East Fourth Street
Cincinnati, OH
Year of Birth: 1947 | Trustee | Until retirement at age 75 or until he resigns or is removed Trustee since 1999 | President and Chief Executive Officer of Cox Financial Corp. (a financial services company). | 58 | Director of Cincinnati Bell (a communications company), Bethesda Inc. (a hospital), Timken Co. (a manufacturing company), Diebold (a technology solutions company), and Ohio Business Alliance for Higher Education. Director of Duke Energy from 1994-2008. |
H. Jerome Lerner
c/o Touchstone Advisors, Inc.
303 Broadway
Cincinnati, OH
Year of Birth: 1938 | Trustee | Until retirement at age 75 or until he resigns or is removed Trustee since 1989 | None | 58 | BASCO Shower Enclosures (a design and manufacturing company) from 2000 to present; Hebrew Union College- Jewish Institute of Religion from 1990 to present. |
Management of the Trust (Unaudited) (Continued)
| Independent Trustees (Continued): |
| | | | | Number | |
| | | | | of Funds | |
| | | | | Overseen | |
| | | Term of | | in the | |
| Name | Position(s) | Office2 And | | Touchstone | |
| Address | Held with | Length of | Principal Occupation(s) | Fund | Other Directorships Held |
| Age | Trust | Time Served | During Past 5 Years | Complex3 | During Past 5 Years4 |
Donald C. Siekmann
c/o Touchstone Advisors, Inc.
303 Broadway Cincinnati, OH
Year of Birth: 1938 | Trustee | Until retirement at age 75 or until he resigns or is removed Trustee since 2005 | Executive for Duro Bag Manufacturing Co. (a bag manufacturer) from 2002-2008. | 58 | Riverfront Mutual Funds (until 2008). |
John P. Zanotti
c/o Touchstone Advisors, Inc.
303 Broadway
Cincinnati, OH
Year of Birth: 1948 | Trustee | Until retirement at age 75 or until he resigns or is removed Trustee since 2002 | Chairman of Integrated Media Technologies (a media company). | 58 | Cincinnati Children’s Hospital from 1994-2010. |
Susan J. Hickenlooper
c/o Touchstone Advisors, Inc.
303 Broadway
Cincinnati, OH
Year of Birth: 1946 | Trustee | Until retirement at age 75 or until he resigns or is removed Trustee since 2009 | Financial Analyst for Impact 100 (charitable organization) from 2012 to present. | 58 | Trustee of Gateway Trust (a mutual fund) from 2006-2009. Trustee of Cincinnati Parks Foundation (a charitable organization) from 2000- present; Trustee of Episcopal Retirement Homes Foundation from 1998-2011. |
| 1 | Ms. McGruder, as a director of the Advisor and the Trust's Underwriter, and an officer of affiliates of the Advisor and the Trust's Underwriter, is an “interested person” of the Trust within the meaning of Section 2(a)(19) of the 1940 Act. |
2 Each Trustee is elected to serve until the age of 75 or until he or she sooner resigns or is removed.
| 3 | The Touchstone Fund Complex consists of 1 series of the Trust, 3 series of Touchstone Tax-Free Trust, 17 series of Touchstone Funds Group Trust, 4 series of Touchstone Investment Trust, 22 series of Touchstone Strategic Trust, and 11 variable annuity series of Touchstone Variable Series Trust. |
| 4 | Each Trustee is also a Trustee of Touchstone Funds Group Trust, Touchstone Tax-Free Trust, Touchstone Investment Trust, Touchstone Strategic Trust, and Touchstone Variable Series Trust. |
Management of the Trust (Unaudited) (Continued)
| Principal Officers1: |
| | | Term of | |
| Name | Position(s) | Office And | |
| Address | Held with | Length of | Principal Occupation(s) |
| Age | Trust | Time Served | During Past 5 Years |
Jill T. McGruder
Touchstone Advisors, Inc.
303 Broadway
Cincinnati, OH
Year of Birth: 1955 | President | Until resignation, removal or disqualification President since 2004; President from 2000-2002 | See biography above. |
Steven M. Graziano
Touchstone Advisors, Inc.
303 Broadway
Cincinnati, OH
Year of Birth: 1954 | Vice President | Until resignation, removal or disqualification Vice President since 2009 | President of Touchstone Advisors, Inc.; Executive Vice President of Pioneer Investment Management, Head of Retail Distribution and Strategic Marketing 2007- 2008; Executive Vice President of Pioneer Investment Management, Chief Marketing Officer 2002-2007. |
Timothy D. Paulin
Touchstone Advisors, Inc.
303 Broadway
Cincinnati, OH
Year of Birth: 1963 | Vice President | Until resignation, removal or disqualification Vice President since 2010 | Senior Vice President of Investment Research and Product Management of Touchstone Advisors, Inc.; Director of Klein Decisions, Inc. 2003 – 2010. |
Michael R. Moser3:
Western & Southern Financial Group
400 Broadway
Cincinnati, OH
Year of Birth: 1968 | Chief Compliance Officer | Until resignation, removal or disqualification Chief Compliance Officer since 2010 | Vice President and Chief Compliance Officer of the Western & Southern Financial Group and Chief Compliance Officer of Touchstone Advisors. |
Terrie A. Wiedenheft
Touchstone Advisors, Inc.
303 Broadway
Cincinnati, OH
Year of Birth: 1962 | Controller and Treasurer | Until resignation, removal or disqualification Controller and Treasurer since 2006 | Chief Operations Officer, Chief Financial Officer and Senior Vice President of IFS Financial Services, Inc. |
Elizabeth R. Freeman
BNY Mellon
201 Washington Street
Boston, MA
Year of Birth: 1962 | Secretary | Until resignation, removal or disqualification. Secretary since 2011 | Managing Director and Senior Counsel at BNY Mellon Investment Servicing (US) Inc. |
| 1 | Each officer also holds the same office with Touchstone Funds Group Trust, Touchstone Tax-Free Trust, Touchstone Investment Trust, Touchstone Tax-Free Trust, and Touchstone Variable Series Trust. |
| 2 | The Touchstone Fund Complex consists of 1 series of the Trust, 3 series of Touchstone Tax-Free Trust, 17 series of Touchstone Funds Group Trust, 4 series of Touchstone Investment Trust, 22 series of Touchstone Strategic Trust, and 11 variable annuity series of Touchstone Variable Series Trust. |
| 3 | Joseph Melcher resigned as Chief Compliance Officer effective September 5, 2012. |
PRIVACY PROTECTION POLICY
We Respect Your Privacy
Thank you for your decision to invest with us. Touchstone and its affiliates have always placed a high value on the trust and confidence our clients place in us. We believe that confidence must be earned and validated through time. In today’s world, when technology allows the sharing of information at light speeds, trust must be reinforced by our sincere pledge to take the steps necessary to ensure that the information you share with us is treated with respect and confidentiality.
Our Pledge to Our Clients
| • | We collect only the information we need to service your account and administer our business. |
| • | We are committed to keeping your information confidential and we place strict limits and controls on the use and sharing of your information. |
| • | We make every effort to ensure the accuracy of your information. |
We Collect the Following Nonpublic Personal Information About You:
| • | Information we receive from you on or in applications or other forms, correspondence, or conversations, including, but not limited to, your name, address, phone number, social security number, assets, income and date of birth; and |
| • | Information about your transactions with us, our affiliates, or others, including, but not limited to, your account number and balance, payment history, parties to transactions, cost basis information, and other financial information. |
Categories of Information We Disclose and Parties to Whom We Disclose
We do not disclose any nonpublic personal information about our current or former clients to nonaffiliated third parties, except as required or permitted by law.
We Place Strict Limits and Controls on the Use and Sharing of Your Information
| • | We restrict access to nonpublic personal information about you to authorized employees who need the information to administer your business. |
| • | We maintain physical, electronic and procedural safeguards that comply with federal standards to protect this information. |
| • | We do not disclose any nonpublic personal information about our current or former clients to anyone, except as required or permitted by law or as described in this document. |
| • | We will not sell your personal information to anyone. |
We May Provide Information to Service Your Account
Sometimes it is necessary to provide information about you to various companies such as transfer agents, custodians, broker-dealers and marketing service firms to facilitate the servicing of your account. These organizations have a legitimate business need to see some of your personal information in order for us to provide service to you. We may disclose to these various companies the information that we collect as described above. We require that these companies, including our own subsidiaries and affiliates, strictly maintain the confidentiality of this information and abide by all applicable laws. Companies within our corporate family that may receive this information are financial service providers and insurance companies. We do not permit these associated companies to sell the information for their own purposes, and we never sell our customer information.
This policy is applicable to the following affiliated companies: Touchstone Funds Group Trust, Touchstone Investment Trust, Touchstone Strategic Trust, Touchstone Tax-Free Trust, Touchstone Variable Series Trust, Touchstone Institutional Funds Trust, Touchstone Securities, Inc.,* and W&S Brokerage Services, Inc.
* Touchstone Securities, Inc. serves as the underwriter to the Touchstone Funds.
A Member of Western & Southern Financial Group®
The Privacy Protection Policy is not part of the Annual Report.


Touchstone Investments
Distributor
Touchstone Securities, Inc.*
303 Broadway
Cincinnati, Ohio 45202-4203 800.638.8194
www.touchstoneinvestments.com
Investment Advisor
Touchstone Advisors, Inc.*
303 Broadway
Cincinnati, Ohio 45202-4203
Transfer Agent
BNY Mellon Investment Servicing (US) Inc.
4400 Computer Drive
Westborough, MA 01581
Shareholder Service
800.543.0407
* A Member of Western & Southern Financial Group
TSF-1105-TIFT-AR-1212
Item 2. Code of Ethics.
| (a) | The registrant, as of the end of the period covered by this report, has adopted a code of ethics that applies to the registrant’s principal executive officer, principal financial officer, principal accounting officer or controller, or persons performing similar functions, regardless of whether these individuals are employed by the registrant or a third party. |
| (c) | There have been no amendments, during the period covered by this report, to a provision of the code of ethics that applies to the registrant’s principal executive officer, principal financial officer, principal accounting officer or controller, or persons performing similar functions, regardless of whether these individuals are employed by the registrant or a third party, and that relates to any element of the code of ethics description. |
| (d) | The registrant has not granted any waivers, including an implicit waiver, from a provision of the code of ethics that applies to the registrant’s principal executive officer, principal financial officer, principal accounting officer or controller, or persons performing similar functions, regardless of whether these individuals are employed by the registrant or a third party, that relates to one or more of the items set forth in paragraph (b) of this item’s instructions. |
Item 3. Audit Committee Financial Expert.
The registrant’s Board of Trustees has determined that the registrant has at least one audit committee financial expert serving on its audit committee. Mr. Donald Siekmann is the registrant’s audit committee financial expert and is an independent trustee within the meaning of the Investment Company Act of 1940, as amended (the “1940 Act”).
Item 4. Principal Accountant Fees and Services.
Audit Fees
| (a) | Audit fees for Touchstone Institutional Funds Trust totaled $13,000 and $13,000 in fiscal 2012 and 2011, respectively, including fees associated with the annual audit and filing of Form N-1A and Form N-SAR. |
Audit-Related Fees
| (b) | Audit-related fees totaled $0 and $650 in fiscal 2012 and 2011, respectively. The 2011 fees related to conversion testing from the Trust’s former fund accountant and transfer agent (JPMorgan) to the Trust’s current fund accountant and transfer agent (BNY Mellon). |
Tax Fees
| (c) | Fees for tax compliance services totaled $3,400 and $3,400 in fiscal 2012 and 2011, respectively. Fees for 2012 relate to the preparation of federal income and excise tax returns and review of capital gains distribution calculations. |
All Other Fees
| (d) | There were no fees for all other services to Touchstone Institutional Funds Trust not included above. |
| (e)(1) | Disclose the audit committee's pre-approval policies and procedures described in paragraph (c)(7) of Rule 2-01 of Regulation S-X. |
| | The Audit Committee’s pre-approval policies describe the types of audit, audit-related, tax and other services that have the general pre-approval of the Audit Committee. The pre-approval policies provide that annual audit service fees, tax services not specifically granted pre-approval, services exceeding pre-approved cost levels and other services that have not received general pre-approval will be subject to specific pre-approval by the Audit Committee. The pre-approval policies further provide that the Committee may grant general pre-approval to other audit services (statutory audits and services associated with SEC registration statements, periodic reports and other documents filed with the SEC or other documents issued in connection with securities offerings), audit-related services (accounting consultations related to accounting, financial reporting or disclosure matters not classified as “audit services,” assistance with understanding and implementing new accounting and financial reporting guidance from rulemaking authorities, agreed-upon or expanded audit procedures related to accounting and/or billing records required to respond to or comply with financial, accounting or regulatory reporting matters and assistance with internal control reporting requirements under Form N-SAR and Form N-CSR), tax services that have historically been provided by the auditor that the Committee believes would not impair the independence of the auditor and are consistent with the SEC’s rules on auditor independence and permissible non-audit services classified as “all other services” that are routine and recurring services. |
| (e)(2) | All services described in paragraphs (c) through (d) of Item 4 were approved by the Audit Committee. Not applicable for paragraph (b) of Item 4. |
| (f) | The percentage of hours expended on the principal accountant's engagement to audit the registrant's financial statements for the most recent fiscal year that were attributed to work performed by persons other than the principal accountant's full-time, permanent employees was less than fifty percent. |
| (g) | The aggregate non-audit fees for Touchstone Institutional Funds Trust and certain entities*, totaled approximately $44,900 and $35,200, in 2012 and 2011, respectively. |
| | * These include the advisors (excluding sub-advisors) and any entity controlling, controlled by or under common control with the advisors that provides ongoing services to the registrant (Funds). |
| (h) | The registrant's audit committee of the board of trustees has considered whether the provision of non-audit services that were rendered to the registrant's investment adviser (not including any sub-adviser whose role is primarily portfolio management and is subcontracted with or overseen by another investment adviser), and any entity controlling, controlled by, or under common control with the investment adviser that provides ongoing services to the registrant that were not pre-approved pursuant to paragraph (c)(7)(ii) of Rule 2-01 of Regulation S-X is compatible with maintaining the principal accountant's independence. |
Item 5. Audit Committee of Listed registrants.
Not applicable.
Item 6. Investments.
| (a) | Schedule of Investments in securities of unaffiliated issuers as of the close of the reporting period is included as part of the report to shareholders filed under Item 1 of this form. |
Item 7. Disclosure of Proxy Voting Policies and Procedures for Closed-End Management Investment Companies.
Not applicable.
Item 8. Portfolio Managers of Closed-End Management Investment Companies.
Not applicable.
Item 9. Purchases of Equity Securities by Closed-End Management Investment Company and Affiliated Purchasers.
Not applicable.
Item 10. Submission of Matters to a Vote of Security Holders.
There have been no material changes to the procedures by which the shareholders may recommend nominees to the registrant’s board of trustees, where those changes were implemented after the registrant last provided disclosure in response to the requirements of Item 407(c)(2)(iv) of Regulation S-K (17 CFR 229.407) (as required by Item 22(b)(15) of Schedule 14A (17 CFR 240.14a-101)), or this Item.
Item 11. Controls and Procedures.
| (a) | The registrant’s principal executive and principal financial officers, or persons performing similar functions, have concluded that the registrant’s disclosure controls and procedures (as defined in Rule 30a-3(c) under the Investment Company Act of 1940, as amended (the “1940 Act”) (17 CFR 270.30a-3(c))) are effective, as of a date within 90 days of the filing date of the report that includes the disclosure required by this paragraph, based on their evaluation of these controls and procedures required by Rule 30a-3(b) under the 1940 Act (17 CFR 270.30a-3(b)) and Rules 13a-15(b) or 15d-15(b) under the Securities Exchange Act of 1934, as amended (17 CFR 240.13a-15(b) or 240.15d-15(b)). |
| (b) | There were no changes in the registrant’s internal control over financial reporting (as defined in Rule 30a-3(d) under the 1940 Act (17 CFR 270.30a-3(d)) that occurred during the registrant’s second fiscal quarter of the period covered by this report that has materially affected, or is reasonably likely to materially affect, the registrant’s internal control over financial reporting. |
Item 12. Exhibits.
| (a)(1) | Code of ethics, or any amendment thereto, that is the subject of disclosure required by Item 2 is attached hereto. |
| (a)(2) | Certifications pursuant to Rule 30a-2(a) under the 1940 Act and Section 302 of the Sarbanes-Oxley Act of 2002 are attached hereto. |
| (b) | Certifications pursuant to Rule 30a-2(b) under the 1940 Act and Section 906 of the Sarbanes- Oxley Act of 2002 are attached hereto. |
SIGNATURES
Pursuant to the requirements of the Securities Exchange Act of 1934 and the Investment Company Act of 1940, the registrant has duly caused this report to be signed on its behalf by the undersigned, thereunto duly authorized.
| (Registrant) | Touchstone Institutional Funds Trust | |
| By (Signature and Title)* | /s/ Jill T. McGruder | |
| | Jill T. McGruder, President | |
| | (principal executive officer) | |
Pursuant to the requirements of the Securities Exchange Act of 1934 and the Investment Company Act of 1940, this report has been signed below by the following persons on behalf of the registrant and in the capacities and on the dates indicated.
| By (Signature and Title)* | /s/ Jill T. McGruder | |
| | Jill T. McGruder, President | |
| | (principal executive officer) | |
| By (Signature and Title)* | /s/ Terrie A. Wiedenheft | |
| | Terrie A. Wiedenheft, Controller and Treasurer | |
| | (principal financial officer) | |
* Print the name and title of each signing officer under his or her signature.