UNITED STATES
SECURITIES AND EXCHANGE COMMISSION
Washington, D.C. 20549
FORM N-CSR
CERTIFIED SHAREHOLDER REPORT OF REGISTERED MANAGEMENT INVESTMENT COMPANIES
Investment Company Act file number 811-21113
| Touchstone Institutional Funds Trust |
| (Exact name of registrant as specified in charter) |
| |
| 303 Broadway, Suite 1100 |
| Cincinnati, Ohio 45202- 4203 |
| (Address of principal executive offices) (Zip code) |
| |
| Jill T. McGruder |
| 303 Broadway, Suite 1100 |
| Cincinnati, Ohio 45202- 4203 |
| (Name and address of agent for service) |
Registrant's telephone number, including area code: 800-638-8194
Date of fiscal year end: December 31
Date of reporting period: December 31, 2011
Form N-CSR is to be used by management investment companies to file reports with the Commission not later than 10 days after the transmission to stockholders of any report that is required to be transmitted to stockholders under Rule 30e-1 under the Investment Company Act of 1940 (17 CFR 270.30e-1). The Commission may use the information provided on Form N-CSR in its regulatory, disclosure review, inspection, and policymaking roles.
A registrant is required to disclose the information specified by Form N-CSR, and the Commission will make this information public. A registrant is not required to respond to the collection of information contained in Form N-CSR unless the Form displays a currently valid Office of Management and Budget ("OMB") control number. Please direct comments concerning the accuracy of the information collection burden estimate and any suggestions for reducing the burden to Secretary, Securities and Exchange Commission, 100 F Street, NE, Washington, DC 20549. The OMB has reviewed this collection of information under the clearance requirements of 44 U.S.C. § 3507.
Item 1. Reports to Stockholders.
The Report to Shareholders is attached herewith.
December 31, 2011
Annual Report
Touchstone Institutional Funds Trust
Touchstone Sands Capital Institutional Growth Fund

Table of Contents
| | Page |
| Letter from the President | 3 |
| Management's Discussion of Fund Performance (Unaudited) | 4 - 6 |
| Tabular Presentation of Portfolios of Investments (Unaudited) | 7 |
| Portfolio Investments: | |
| Touchstone Sands Capital Institutional Growth Fund | 8 |
| Statement of Assets and Liabilities | 9 |
| Statement of Operations | 10 |
| Statement of Changes in Net Assets | 11 |
| Financial Highlights | 12 |
| Notes to Financial Statements | 13 - 18 |
| Report of Independent Registered Public Accounting Firm | 19 |
| Other Items (Unaudited) | 20 - 24 |
| Management of the Trust (Unaudited) | 25 - 27 |
| Privacy Protection Policy | 28 |
Letter from the President
Dear Shareholder:
We are pleased to provide you with the Touchstone Institutional Funds Trust Annual Report. Inside you will find key financial information, as well as manager commentary for the year ended December 31, 2011.
2011 was a challenging environment for investors. From a market capitalization and style perspective, large cap outpaced both small and mid-cap stocks, while growth outperformed across most asset classes. The U.S. equity markets outperformed both the developed and emerging international markets for the year. Interest rates remain low and are forecasted to stay low throughout the next year.
In the third quarter, U.S. and world equity markets suffered their worst losses since the 2008-09 financial crisis, while treasury yields fell to their lowest levels since that period. For many investors, the key issues impacting markets were whether the U.S. economy is headed for a “double dip” recession, what can policymakers do to avert one, and can the financial crisis in Europe be contained.
It is thought that the U.S. economy is not on the brink of recession. The equity market is pricing in a mild recession already but certainly not a severe recession along the lines of 2008-2009. It is generally believed, however, that risks have increased and the outcome will be dictated by policy responses in the U.S. and Europe. The myriad of forces at play, which have been building throughout this year, could reach a climax soon depending on the outcome of U.S. budget deliberations and actions European policymakers take to halt financial contagion.
Touchstone is committed to helping investors achieve their financial goals by providing access to a distinctive selection of institutional asset managers who are known and respected for proficiency in their specific area of expertise. We hope that you will find the enclosed commentary helpful.
We greatly appreciate your continued support. Thank you for including Touchstone as part of your investment plan.
Sincerely,

Jill T. McGruder
President
Touchstone Institutional Funds Trust
Management's Discussion of Fund Performance (Unaudited)
Touchstone Sands Capital Institutional Growth Fund
Sub-Advised by Sands Capital Management LLC
Investment Philosophy and Process
TheTouchstone Sands Capital Institutional Growth Fund primarily invests in common stocks of large capitalization U.S. companies that are believed to have above-average potential for revenue or earnings growth. The Fund invests in 25 to 30 companies that are generally high-quality seasoned and growing businesses, spread across an array of attractive and growing industries. Sands Capital generally seeks stocks with sustainable above average earnings growth and capital appreciation potential. In addition, Sands Capital looks for companies that have a significant competitive advantage, a leadership position or proprietary niche, a clear mission in an understandable business, financial strength, and are valued rationally in relation to comparable companies, the market, and the business prospects for that particular company.
Fund Performance and Market Overview
The total return of the Touchstone Sands Capital Institutional Growth Fund was 2.28% for the year ended December 31, 2011. The total return of the Russell 1000 Growth Index was 2.64% for the same period.
Given the ever-changing currents of the global economy, fear and uncertainty has caused many investors to reduce their investment time horizon. According to the Wall Street Journal, intra-market correlations have risen to levels not seen since the crash of 1987 primarily as a result of “macro” forces that have resulted in “risk on/risk-off” behavior, as investors shift into stocks on positive news and shift out when news is negative. In our experience, timing activities such as this ultimately prove to be an exercise in futility. When stock prices move in concert, it can mean that business fundamentals such as earnings and growth rates are overlooked in favor of other factors. In our view, successful investing is a long-term endeavor that requires ongoing rigorous due diligence, patience and discipline. This mindset enables us to look beyond short-term events and yesterday’s stock price movement, to think creatively about and focus on the key drivers of a company’s long-term business fundamentals and its ability to generate sustainable above-average earnings growth.
History has shown that in the long run, companies that generate sustainable above average earnings growth are rewarded with significant stock price appreciation. Our process is predicated on using our six key investment criteria to identify companies with business models that generate above average earnings growth (typically companies with significant competitive advantages, strong leadership positions in attractive business spaces and solid balance sheets), and to purchase them at rational valuations. These criteria possess a timeless quality and serve as a tested and repeatable analytical framework that enables our research team to remain objective and identify lasting investments independent of short-term investor sentiment.
Portfolio Review
The Fund’s results for the year ending December 31, 2011 were attributable to the portfolio’s sector allocations and security selection.
The largest individual contributors to the portfolio’s relative return for 2011 wereVisa, Inc. (InformationTechnology sector), Intuitive Surgical, Inc. and Alexion Pharmaceuticals, Inc. (Health Care sector), Starbucks Corp. (Consumer Discretionary sector) and W.W. Grainger, Inc (Industrials sector).The largest detractors from relative performance during the year were Illumina, Inc. (Health Care), Salesforce.com, Inc., Cree Inc, which was sold during the year and OpenTable, Inc. (Information Technology) and Netflix, Inc. (Consumer Discretionary).
While sector allocations contributed to relative performance during the year, this is a residual decision in our process as we primarily focus on owning high quality growth businesses. Underweight exposure to the Industrials and Materials sectors were the largest contributors to relative performance. Also positively impacting relative
Management's Discussion of Fund Performance (Continued)
performance were overweight positions in the Health Care and Consumer Discretionary sectors. The largest detractor to relative performance from a sector perspective was the lack of exposure to the Consumer Staples sector.
Strategy and Outlook
We are not simply looking for growth in an absolute sense; we are very focused on the quality and duration of that growth. The types of businesses we own tend to be differentiated leaders in their space with significant competitive advantages. They also tend to be “game-changing” businesses that are creating new markets or innovating within existing markets. Opportunities to own these special wealth-creating businesses are rare so when we find them and have conviction, we want to own them in a meaningful way. It has been our experience that periods of volatility and persistent headwinds to growth often create significant opportunities for investors that take a longer view, distinguish between business results and market “noise,” and concentrate investments in high-quality companies operating in pockets of the economy undergoing structural growth.
As volatility and risk fatigue persist, heavily influencing investor behavior, it is impossible to divine what the future holds. However, we believe that uncertainty relating to various global economic conditions has created numerous opportunities for today’s long-term investor. As such, all we can do is focus on what has worked for Sands Capital over the course of the previous two decades, knowing that despite the broad global economic malaise, our experience, deep fundamental research, and long-term concentrated approach, should position us well to continue to find leading growth businesses and achieve our mission of adding value and enhancing the wealth of our clients with prudence over time.
Management's Discussion of Fund Performance (Continued)
Comparison of the Change in Value of a $500,000 Investment in the
Touchstone Sands Capital Institutional Growth Fund and the Russell 1000® Growth Index
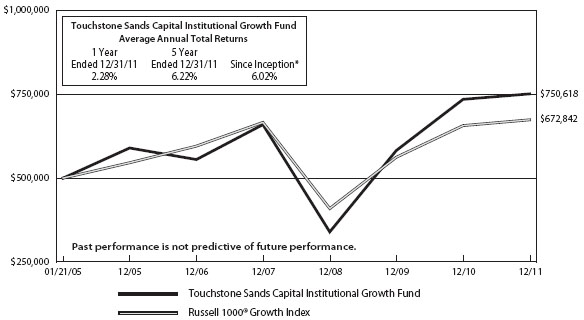
* The initial public offering commenced on January 21, 2005.
The performance of the above Fund does not reflect the deduction of taxes that a shareholder would pay on Fund distributions or the redemption of Fund shares.
Tabular Presentation of Portfolio of Investments (Unaudited)
December 31, 2011
The illustration below provides the Fund’s sector allocation. We hope it will be useful to shareholders as it summarizes key information about the Fund’s investments.
Touchstone Sands Capital Institutional Growth Fund
| Touchstone Sands Capital Institutional Growth Fund |
| Sector Allocation | (% of Net Assets) | |
| Information Technology | 39.1 | % |
| Consumer Discretionary | 21.8 | |
| Health Care | 14.1 | |
| Energy | 11.6 | |
| Industrials | 4.9 | |
| Financials | 4.5 | |
| Materials | 2.7 | |
| Investment Funds | 1.7 | |
| Other Assets/Liabilities (Net) | (0.4 | ) |
| Total | 100.0 | % |
Portfolio of Investments
Touchstone Sands Capital Institutional Growth Fund – December 31, 2011
| | | Shares | | | Market
Value | |
| | | | | | | |
| Common Stocks — 98.7% | | | | | | | | |
| | | | | | | | | |
| Information Technology — 39.1% | | | | | | | | |
| Apple, Inc.* | | | 272,000 | | | $ | 110,160,000 | |
| ASML Holding NV | | | 1,010,000 | | | | 42,207,900 | |
| F5 Networks, Inc.* | | | 471,000 | | | | 49,982,520 | |
| Google, Inc. - Class A* | | | 145,000 | | | | 93,655,500 | |
| OpenTable, Inc.†* | | | 228,000 | | | | 8,921,640 | |
| QUALCOMM, Inc. | | | 1,419,000 | | | | 77,619,300 | |
| Salesforce.com, Inc.* | | | 791,000 | | | | 80,254,860 | |
| Visa, Inc. - Class A | | | 1,179,000 | | | | 119,703,870 | |
| | | | | | | | 582,505,590 | |
| | | | | | | | | |
| Consumer Discretionary — 21.8% | | | | | | | | |
| Amazon.com, Inc.* | | | 463,000 | | | | 80,145,300 | |
| Coach, Inc. | | | 567,000 | | | | 34,609,680 | |
| Las Vegas Sands Corp.* | | | 1,048,000 | | | | 44,781,040 | |
| Netflix, Inc.* | | | 197,000 | | | | 13,650,130 | |
| NIKE, Inc. - Class B | | | 532,000 | | | | 51,268,840 | |
| Priceline.com, Inc.* | | | 95,000 | | | | 44,432,450 | |
| Starbucks Corp. | | | 1,203,000 | | | | 55,350,030 | |
| | | | | | | | 324,237,470 | |
| | | | | | | | | |
| Health Care — 14.1% | | | | | | | | |
| Alexion Pharmaceuticals, Inc.* | | | 837,000 | | | | 59,845,500 | |
| Allergan, Inc./United States | | | 558,000 | | | | 48,958,920 | |
| Illumina, Inc.†* | | | 1,050,000 | | | | 32,004,000 | |
| Intuitive Surgical, Inc.* | | | 120,000 | | | | 55,561,200 | |
| Regeneron Pharmaceuticals, Inc.* | | | 263,000 | | | | 14,578,090 | |
| | | | | | | | 210,947,710 | |
| | | | | | | | | |
| Energy — 11.6% | | | | | | | | |
| FMC Technologies, Inc.* | | | 950,000 | | | | 49,618,500 | |
| National Oilwell Varco., Inc. | | | 659,000 | | | | 44,805,410 | |
| Schlumberger Ltd. | | | 734,000 | | | | 50,139,540 | |
| Southwestern Energy Co.* | | | 910,000 | | | | 29,065,400 | |
| | | | | | | | 173,628,850 | |
| | | | | | | | | |
| Industrials — 4.9% | | | | | | | | |
| CH Robinson Worldwide, Inc. | | | 362,000 | | | | 25,260,360 | |
| W.W. Grainger, Inc. | | | 252,000 | | | | 47,171,880 | |
| | | | | | | | 72,432,240 | |
| | | | | | | | | |
| Financials — 4.5% | | | | | | | | |
| Charles Schwab Corp. (The) | | | 2,465,000 | | | | 27,755,900 | |
| IntercontinentalExchange, Inc.* | | | 330,000 | | | | 39,781,500 | |
| | | | | | | | 67,537,400 | |
| | | | | | | | | |
| Materials — 2.7% | | | | | | | | |
| Praxair, Inc. | | | 374,000 | | | | 39,980,600 | |
| Total Common Stocks | | | | | | $ | 1,471,269,860 | |
| | | | | | | | | |
| Investment Funds — 1.7% | | | | | | | | |
| Invesco Liquid Assets Portfolio** | | | 9,885,751 | | | | 9,885,751 | |
| Touchstone Institutional Money Market Fund^ | | | 14,987,026 | | | | 14,987,026 | |
| Total Investment Funds | | | | | | $ | 24,872,777 | |
| | | | | | | | | |
| Total Investment Securities — 100.4% | | | | | | | | |
| (Cost $1,178,459,530) | | | | | | $ | 1,496,142,637 | |
| | | | | | | | | |
| Liabilities in Excess of Other Assets — (0.4)% | | | | | | | (5,668,288 | ) |
| | | | | | | | | |
| Net Assets — 100.0% | | | | | | $ | 1,490,474,349 | |
| † | All or a portion of the security is on loan. The total value of the securites on loan as of December 31, 2011 was $9,627,952. |
| * | Non-income producing security. |
| ** | Represents collateral for securities loaned. |
| ^ | Affiliated Fund, sub-advised by Fort Washington Investment Advisors, Inc. See Note 4 in Notes to Financial Statements. |
Other Information:
The inputs or methodology used for valuing securities may not be an indication of the risk associated with investing in those securities. For more information on valuation inputs, and their aggregation into the levels used in the table below, please refer to the security valuation section in the accompanying notes to financial statements.
Valuation Inputs at Reporting Date:
| Description | | Level 1 | | | Level 2 | | | Level 3 | | | Total | |
| Common Stocks | | $ | 1,471,269,860 | | | $ | — | | | $ | — | | | $ | 1,471,269,860 | |
| Investment Funds | | | 24,872,777 | | | | — | | | | — | | | | 24,872,777 | |
| | | | | | | | | | | | | | | $ | 1,496,142,637 | |
The accompanying notes are an integral part of the financial statements.
Statements of Assets and Liabilities
December 31, 2011
| | | Touchstone
Sands Capital
Institutional
Growth
Fund | |
| Assets | | | | |
| Investments, at cost | | $ | 1,178,459,530 | |
| Affiliated securities, at market value | | $ | 14,987,026 | |
| Non-affiliated securities, at market value | | | 1,481,155,611 | |
| Investments, at value(A) | | $ | 1,496,142,637 | |
| Cash | | | 3,107 | |
| Dividends and interest receivable | | | 620,525 | |
| Receivable for capital shares sold | | | 6,036,408 | |
| Receivable for securities lending income | | | 67,344 | |
| Other assets | | | 27,875 | |
| Total Assets | | | 1,502,897,896 | |
| | | | | |
| Liabilities | | | | |
| Payable for return of collateral for securities on loan | | | 9,885,751 | |
| Payable for capital shares redeemed | | | 1,503,064 | |
| Payable to Advisor | | | 977,108 | |
| Other accrued expenses and liabilities | | | 57,624 | |
| Total Liabilities | | | 12,423,547 | |
| | | | | |
| Net Assets | | $ | 1,490,474,349 | |
| | | | | |
| Net assets consist of: | | | | |
| Paid-in capital | | $ | 1,223,735,321 | |
| Accumulated net realized losses on investments | | | (50,944,079 | ) |
| Net unrealized appreciation on investments | | | 317,683,107 | |
| Net assets applicable to shares outstanding | | $ | 1,490,474,349 | |
| | | | | |
| Shares of beneficial interest outstanding (unlimited number of shares authorized, no par value) | | | 103,774,198 | |
| Net asset value, offering price and redemption price per share | | $ | 14.36 | |
| | | | | |
| (A) Includes market value of securities on loan of: | | $ | 9,627,952 | |
See accompanying notes to financial statements.
Statements of Operations
For the Year Ended December 31, 2011
| | | Touchstone
Sands Capital
Institutional
Growth
Fund | |
| Investment Income | | | | |
| Dividends from affiliated securities | | $ | 28,063 | |
| Dividends from non-affiliated securities | | | 7,171,164 | |
| Income from securities loaned | | | 138,712 | |
| Total Investment Income | | | 7,337,939 | |
| | | | | |
| Expenses | | | | |
| Unified management fee | | | 11,098,060 | |
| Registration fees | | | 71,052 | |
| Other expenses | | | 165,761 | |
| Net Expenses | | | 11,334,873 | |
| | | | | |
| Net Investment Loss | | | (3,996,934 | ) |
| | | | | |
| Realized and Unrealized Gain (Loss) on Investments | | | | |
| Net realized gain on investments | | | 57,506,132 | |
| Net change in unrealized appreciation (depreciation) on investments | | | (28,906,668 | ) |
| | | | | |
| Net Realized and Unrealized Gain on Investments | | | 28,599,464 | |
| | | | | |
| Change in Net Assets Resulting from Operations | | $ | 24,602,530 | |
See accompanying notes to financial statements.
Statements of Changes in Net Assets
| | | Touchstone
Sands Capital
Institutional
Growth
Fund | |
| | | For the
Year
Ended
December 31,
2011 | | | For the
Year
Ended
December 31,
2010 | |
| From Operations | | | | | | | | |
| Net investment loss | | $ | (3,996,934 | ) | | $ | (2,592,612 | ) |
| Net realized gain on investments | | | 57,506,132 | | | | 46,624,982 | |
| Net change in unrealized appreciation (depreciation) on investments | | | (28,906,668 | ) | | | 196,622,705 | |
| Change in Net Assets from Operations | | | 24,602,530 | | | | 240,655,075 | |
| | | | | | | | | |
| Share Transactions | | | | | | | | |
| Proceeds from shares sold | | | 632,539,398 | | | | 361,655,579 | |
| Cost of shares redeemed | | | (397,627,619 | ) | | | (375,247,965 | ) |
| Change in Net Assets from Share Transactions | | | 234,911,779 | | | | (13,592,386 | ) |
| | | | | | | | | |
| Total Increase in Net Assets | | | 259,514,309 | | | | 227,062,689 | |
| | | | | | | | | |
| Net Assets | | | | | | | | |
| Beginning of period | | | 1,230,960,040 | | | | 1,003,897,351 | |
| End of period | | $ | 1,490,474,349 | | | $ | 1,230,960,040 | |
See accompanying notes to financial statements.
Financial Highlights
Touchstone Sands Capital Institutional Growth Fund
Per Share Data for a Share Outstanding Throughout Each Period
| | | Year Ended December 31, |
| | | 2011 | | | 2010 | | | 2009 | | | 2008 | | | 2007 | |
| Net asset value at beginning of period | | $ | 14.04 | | | $ | 11.12 | | | $ | 6.50 | | | $ | 13.18 | | | $ | 11.10 | |
| Income (loss) from investment operations: | | | | | | | | | | | | | | | | | | | | |
| Net investment loss | | | (0.04 | ) | | | (0.03 | ) | | | (0.01 | ) | | | (0.04 | ) | | | (0.04 | ) |
Net realized and unrealized gains
(losses) on investments | | | 0.36 | | | | 2.95 | | | | 4.63 | | | | (6.35 | ) | | | 2.12 | |
| Total from investment operations | | | 0.32 | | | | 2.92 | | | | 4.62 | | | | (6.39 | ) | | | 2.08 | |
| Distributions from net realized gains | | | — | | | | — | | | | — | | | | (0.29 | ) | | | — | |
| Net asset value at end of period | | $ | 14.36 | | | $ | 14.04 | | | $ | 11.12 | | | $ | 6.50 | | | $ | 13.18 | |
| Total return | | | 2.28 | % | | | 26.26 | % | | | 71.08 | % | | | (48.45 | %) | | | 18.74 | % |
| Net assets at end of period (000's) | | $ | 1,490,474 | | | $ | 1,230,960 | | | $ | 1,003,897 | | | $ | 591,557 | | | $ | 1,375,494 | |
| Ratio to average net assets: | | | | | | | | | | | | | | | | | | | | |
| Net expenses | | | 0.80 | % | | | 0.80 | % | | | 0.80 | % | | | 0.80 | % | | | 0.80 | % |
| Gross expenses | | | 0.80 | % | | | 0.80 | % | | | 0.80 | % | | | 0.80 | % | | | 0.80 | % |
| Net investment loss | | | (0.28 | %) | | | (0.26 | %) | | | (0.13 | %) | | | (0.37 | %) | | | (0.31 | %) |
| Portfolio turnover rate | | | 18 | % | | | 41 | % | | | 34 | % | | | 44 | % | | | 36 | % |
See accompanying notes to financial statements.
Notes to Financial Statements
December 31, 2011
1. Organization
The Touchstone Institutional Funds Trust (the “Trust”) is registered under the Investment Company Act of 1940 (the “1940 Act”), as amended, as an open-end management investment company, and was organized as a Delaware statutory trust on May 29, 2002. The Trust consists of one fund, the Touchstone Sands Capital Institutional Growth Fund (“Sands Capital Institutional Growth Fund” or the “Fund”), which is an open-end, non-diversified management investment company.
The Declaration of Trust permits the Trust to issue an unlimited number of shares of beneficial interest of the Fund. The Fund offers a single class of shares. The assets of the Fund are segregated, and a shareholder’s interest is limited to the Fund in which shares are held. The Fund’s prospectus provides a description of the Fund’s investment objectives, policies, and strategies along with information on the class of shares currently being offered.
2. Significant Accounting Policies
The following is a summary of the Fund’s significant accounting policies:
Security valuation and fair value measurements — All investments in securities are recorded at their estimated fair value. The Fund uses various methods to measure fair value of its portfolio securities on a recurring basis. U.S. GAAP establishes a hierarchy that prioritizes inputs to valuation methods. These inputs are summarized in the three broad levels listed below:
| • | Level 1 | – | quoted prices in active markets for identical securities |
| | | | |
| • | Level 2 | – | other significant observable inputs (including quoted prices for similar securities, interest rates, prepayment speeds, credit risk, etc.) |
| | | | |
| • | Level 3 | – | significant unobservable inputs (including the Fund’s own assumptions in determining the fair value of investments) |
The inputs or methodology used for valuing securities are not necessarily an indication of the risk associated with investing in those securities. For example, money market instruments are valued using amortized cost, in accordance with rules under the Investment Company Act of 1940. Generally, amortized cost approximates the current fair value of a security, but since the value is not obtained from a quoted price in an active market, such securities are reflected as Level 2.
The aggregate value by input level, as of December 31, 2011, for the Fund’s investments, as well as a reconciliation of assets for which significant unobservable inputs (Level 3) were used in determining value, if applicable, is included in the Fund’s Portfolio of Investments, which also includes a breakdown of the Fund’s investments by sector. The Fund did not hold any Level 3 categorized securities during the year ended or as of December 31, 2011.
During the year ended December 31, 2011, there were no significant transfers between Levels 1, 2 and 3.
The Fund’s portfolio securities are valued as of the close of the regular session of trading on the New York Stock Exchange (currently 4:00 p.m., Eastern time). Portfolio securities traded on stock exchanges are valued at the last sale price, and to the extent these securities are actively traded, they are categorized in Level 1 of the fair value hierarchy. Portfolio securities quoted by NASDAQ are valued at the NASDAQ Official Closing Price (“NOCP”). Securities not traded on a particular day, or for which the last sale price is not readily available, are valued at their last broker-quoted bid prices as obtained from one or more of the major market makers for such securities by an independent pricing service and are categorized in Level 2. Debt securities for which market quotations are readily available are valued at their most recent bid prices as obtained from one or more of the major market makers for such securities by an independent pricing service and are categorized in Level
Notes to Financial Statements (Continued)
2. Money market instruments and other debt securities with a remaining maturity of less than 60 days are valued at amortized cost, which approximates market values, and are categorized in Level 2. Securities for which market quotations or the NOCP are not readily available are valued based on fair value as determined by or under the direction of the Board of Trustees and are categorized in Level 3. Shares of open end mutual funds in which the Fund invests are valued at their respective net asset values (NAV) as reported by the underlying funds and are categorized in Level 1. The prices for foreign securities are reported in local currency and converted to U.S. dollars using currency exchange rates.
New accounting pronouncements — In December 2011, the Financial Accounting Standards Board (FASB) issued Accounting Standards Update No. 2011-11, Disclosures about Offsetting Assets and Liabilities (“ASU 2011-11”). ASU 2011-11 requires disclosures to make financial statements that are prepared under U.S. GAAP more comparable to those prepared under International Financial Reporting Standards. The new disclosure requirements mandate that entities disclose both gross and net information about instruments and transactions eligible for offset in the statement of assets and liabilities as well as instruments and transactions subject to an agreement similar to a master netting arrangement. In addition, ASU 2011-11 requires disclosure of collateral received and posted in connection with master netting agreements or similar arrangements. New disclosures are required for annual reporting periods beginning on or after January 1, 2013, and interim periods within those annual periods. Management is evaluating the impact of ASU 2011-11 on the financial statements and disclosures.
In May 2011, FASB issued Accounting Standards Update (ASU) No. 2011-04 “Amendments to Achieve Common Fair Value Measurement and Disclosure Requirements in GAAP and the International Financial Reporting Standards (IFRS)”(“ASU 2011-04”). ASU 2011-04 includes common requirements for measurement of and disclosure about fair value between U.S. GAAP and IFRS. ASU 2011-04 will require reporting entities to categorize within Level 3 of the fair value hierarchy: quantitative information about the unobservable inputs used in the fair value measurement, the valuation processes used by the reporting entity and a narrative description of the sensitivity of the fair value measurement to changes in unobservable inputs and the interrelationships between those unobservable inputs. In addition, ASU 2011-04 will require reporting entities to make disclosures about amounts and reasons for all transfers in and out of Level 1 and Level 2 fair value measurements. The new and revised disclosures are effective for fiscal years beginning after December 15, 2011 and for interim periods within those fiscal years. Management is currently evaluating the implications of ASU 2011-04 and its impact on the financial statements.
Portfolio securities loaned — The Fund may lend its portfolio securities. Lending portfolio securities exposes the Fund to the risk that the borrower may fail to return the loaned securities or may not be able to provide additional collateral or that the Fund may experience delays in recovery of the loaned securities or loss of rights in the collateral if the borrower fails financially. To minimize these risks, the borrower must agree to maintain cash collateral with the Fund’s custodian in an amount at least equal to the market value of the loaned securities. The cash collateral is reinvested by the Fund’s custodian into an approved investment vehicle.
As of December 31, 2011, the Fund loaned securities and received collateral as follows:
| Fund | | Fair Value of
Securities
Loaned | | | Value of
Collateral
Received | |
| Sands Capital Institutional Growth Fund | | $ | 9,627,952 | | | $ | 9,885,751 | |
All collateral received as cash is received, held and administered by the Fund’s custodian for the benefit of the Fund in the applicable custody account or other account established for the purpose of holding collateral.
By participating in securities lending, the Fund receives compensation in the form of fees, or retains a portion of interest or dividends on the investment of any cash received as collateral. The Fund also continues to receive
Notes to Financial Statements (Continued)
interest or dividends on the securities loaned. The loaned securities are secured by collateral valued at least equal, at all times, to the fair value of the securities loaned plus accrued interest.
Unrealized gain or loss on the fair value of the securities loaned that may occur during the term of the loan is recognized by the Fund. The Fund has the right under the lending agreement to recover the securities from the borrower on demand.
Share valuation — The NAV per share is calculated daily by dividing the total value of the Fund’s assets, less liabilities, by its number of outstanding shares.
Investment income — Dividend income from securities is recognized on the ex-dividend date, net of foreign withholding taxes, if any, which are reduced by any amounts reclaimable by the Fund, where applicable. Interest income from securities is recorded on the basis of interest accrued, premium amortized and discount accreted.
Distributions to shareholders — The Fund declares and distributes net investment income, if any, quarterly as a dividend to shareholders. Any realized capital gains on sales of securities for the Fund, net of applicable capital loss carryforwards, are distributed to shareholders at least annually. Income distributions and capital gain distributions are determined in accordance with income tax regulations.
Security transactions — Security transactions are reflected for financial reporting purposes as of the trade date,which may cause the NAV as stated in the accompanying financial statements to be different than the NAV applied to Fund share transactions. Realized gains and losses on sales of portfolio securities are calculated using the identified cost basis.
Estimates — The preparation of financial statements in conformity with U.S. GAAP requires management to make estimates and assumptions that affect the reported amounts of assets and liabilities and disclosure of contingent assets and liabilities at the date of the financial statements and the reported amounts of income and expenses during the reporting period. Actual results could differ from those estimates.
Expenses — The Fund pays a unified management fee to Touchstone Advisors, Inc. (the Advisor and Administrator) for providing or procuring advisory, administration and other services. The Advisor is responsible for compensating any third party engaged to provide services under its supervision and is also responsible for payment of the fees of the independent Trustees, custodian, independent auditor, legal counsel (excluding costs in connection with certain litigation or administrative actions), and the transfer and dividend disbursing agent. The Fund will pay all state registration fees, interest, taxes, dues, fees, or similar costs, brokerage or other transaction costs, and certain extraordinary expenses.
3. Investment Transactions
Investment transactions (excluding short-term investments and U.S. Government securities) were as follows for the year ended December 31, 2011:
| | | Sands Capital
Institutional
Growth Fund | |
| Purchases of investment securities | | $ | 477,993,705 | |
| Proceeds from sales and maturities | | $ | 255,604,589 | |
4. Transactions with Affiliates and Other Related Parties
Certain officers of the Trust are also officers of the Advisor, the Underwriter (Touchstone Securities, Inc.) and/or BNY Mellon Investment Servicing (US) Inc. (“BNY Mellon”) the Sub-Administrator and Transfer Agent to the Fund. The Advisor and Underwriter are each wholly owned, indirect subsidiaries of The Western and Southern Life Insurance Company (“Western-Southern”).
Notes to Financial Statements (Continued)
MANAGEMENT & EXPENSE LIMITATIONS AGREEMENTS
The Advisor provides general investment supervisory services for the Fund, under terms of an Advisory Agreement. Under the Advisory Agreement, the Fund pays the Advisor a fee, which is computed and accrued daily and paid monthly, at an annual rate of 0.78% of the average daily net assets of the Fund. Under the management agreement, the Advisor also provides administrative services to the Trust and pays all operating expenses on the Trust’s behalf, excluding state registration fees, interest, taxes, dues, fees, or similar costs, brokerage or other transaction costs, and certain extraordinary expenses.
The Advisor has entered into an investment sub-advisory agreements with Sands Capital Management, LLC, an Securities and Exchange Commission (SEC) registered investment advisor.
The Advisor, (not the Fund), pays the Sub-Advisor a fee for their services.
The Advisor entered into an Expense Limitation Agreement to contractually limit operating expenses of the Fund. The maximum operating expense limit in any year with respect to the Fund, as a percentage of the average daily net assets of the Fund, is 0.80%. The Advisor has agreed to waive advisory fees and reimburse expenses in order to maintain the expense limitation for the Fund through at least April 29, 2012. During the year ended December 31, 2011, the Advisor did not reimburse any operating expenses.
AFFILIATED INVESTMENTS
The Fund may invest in the Touchstone Institutional Money Market Fund, subject to compliance with several conditions set forth in an order received by the Trust from the SEC. To the extent that the other Touchstone Funds are invested in the Touchstone Institutional Money Market Fund, the Advisor and Administrator will be paid additional fees from the Touchstone Institutional Money Market Fund that will not be waived or reimbursed.
A summary of the Fund’s investment in the Touchstone Institutional Money Market Fund for the year ended December 31, 2011, is as follows:
| | | Share Activity | | | | | | | |
| | | Balance
12/31/10 | | | Purchases | | | Sales | | | Balance
12/31/11 | | | Dividends | | | Value
12/31/11 | |
| Sands Capital Institutional Growth Fund | | | 9,658,328 | | | | 351,066,631 | | | | (345,737,933 | ) | | | 14,987,026 | | | $ | 28,063 | | | $ | 14,987,026 | |
5. Capital Share Transactions
Proceeds and payments on capital shares as shown in the Statement of Changes in Net Assets are the result of the following capital share transactions for the periods shown:
| | | Sands Capital Institutional
Growth Fund | |
| | | Year
Ended
December 31,
2011 | | | Year
Ended
December 31,
2010 | |
| Shares issued | | | 43,685,073 | | | | 29,665,546 | |
| Shares redeemed | | | (27,562,046 | ) | | | (32,287,696 | ) |
| Change in shares outstanding | | | 16,123,027 | | | | (2,622,150 | ) |
| Shares outstanding, beginning of period | | | 87,651,171 | | | | 90,273,321 | |
| Shares outstanding, end of period | | | 103,774,198 | | | | 87,651,171 | |
Notes to Financial Statements (Continued)
6. Federal Tax Information
Federal income tax — It is the Fund’s policy to continue to comply with the special provisions of the Internal Revenue Code applicable to regulated investment companies. As provided therein, in any fiscal year in which a Fund so qualifies and distributes at least 90% of its investment company taxable income, the Fund (but not the shareholders) will be relieved of federal income tax on the income distributed. Accordingly, no provision for income taxes has been made.
In order to avoid imposition of the excise tax applicable to regulated investment companies, it is also the Fund’s intention to declare and pay as dividends in each calendar year at least 98% of its investment company taxable income (earned during the calendar year) and 98.2% of its net realized capital gains (earned during the twelve months ending October 31) plus undistributed amounts from prior years.
The Fund paid no distributions for the years ended December 31, 2011 and 2010
The following information is computed on a tax basis for each item as of December 31, 2011:
| | | Sands Capital
Institutional
Growth Fund | |
| Tax cost of portfolio investments | | $ | 1,215,303,706 | |
| Gross unrealized appreciation | | | 400,871,699 | |
| Gross unrealized depreciation | | | (120,032,768 | ) |
| Net unrealized appreciation | | | 280,838,931 | |
| Accumulated capital and other losses | | | (14,047,079 | ) |
| Post October and qualified late-year losses | | | (52,824 | ) |
| Undistributed ordinary income | | | — | |
| Accumulated earnings | | | 266,739,028 | |
The difference between the tax cost of portfolio investments and the financial statement cost is primarily due to wash sale deferrals.
To the extent that the Funds’ net realized capital gains, if any, can be offset by capital loss carryforwards, it is the policy of the Funds not to distribute such gains.The Regulated Investment Company (“RIC”) Modernization Act of 2010 (the “Act”) became effective for the Funds on January 1, 2011. The Act modernizes several of the federal income and exise tax provisions related to RICs to carry forward capital losses indefinitely and to retain the character of capital loss carryforwards as short-term or long-term (“Post-Enactment”). Rules in effect previously limited the carryforward period to eight years and all carryforwards were considered short-term in character (“Pre-Enactment”). Although the Act provides several benefits, including the unlimited carryover of future capital losses, there may be a greater likelihood that all or a portion of each Fund’s Pre-Enactment capital loss carryovers may expire without being utilized due to the fact that Post-Enactment capital losses get utilized before Pre-Enactment capital loss carryovers. As of December 31, 2011 the Funds had no Post-Enactment capital loss carryforwards.
As of December 31, 2011, the Fund had the following capital loss carryforwards for federal income tax purposes:
| Fund | | Amount | | | Expires
December 31, | |
| Sands Capital Institutional Growth Fund | | $ | 14,047,079 | | | | 2017 | |
During the year ended December 31, 2011, the Fund utilized $ 55,813,396 of capital loss carryforwards.
Certain reclassifications, the result of permanent differences between financial statement and income tax reporting requirements, have been made to the components of capital. These reclassifications have no impact on the net
Notes to Financial Statements (Continued)
assets or NAV per share of the Fund and are designed to present the Fund’s capital accounts on a tax basis. The following reclassifications, which are primarily attributed to the tax treatment of net investment loss have been made to the Fund for the year ended December 31, 2011:
| Fund | | Accumulated
Net Investment
Income | | | Accumulated
Net Realized
Gains (Losses) | | | Paid-In
Capital | |
| Sands Capital Institutional Growth Fund | | $ | 3,996,934 | | | $ | 135,425 | | | $ | (4,132,359 | ) |
The Fund has analyzed its tax positions taken on Federal income tax returns for all open tax years (tax years ended December 31, 2008 through 2011) and has concluded that no provision for income tax is required in its financial statements.
The Regulated Investment Company Modernization Act of 2010 (the “Act”) was enacted on December 22, 2010. The Act makes changes to several tax rules impacting the Fund. In general, the provisions of the Act will be effective for the Fund’s fiscal year ending December 31, 2011. Although the Act provides several benefits, including the unlimited carryover of future capital losses, there may be a greater likelihood that all or a portion of the Fund’s pre-enactment capital loss carryovers may expire without being utilized due to the fact that post-enactment capital losses get utilized before pre-enactment capital loss carryovers.
7. Commitments and Contingencies
The Fund indemnifies the Trust’s officers and Trustees for certain liabilities that might arise from their performance of their duties to the Fund. Additionally, in the normal course of business, the Fund enters into contracts that contain a variety of representations and warranties and which provide general indemnifications. The Fund’s maximum exposure under these arrangements is unknown, as this would involve future claims that may be made against the Fund that have not yet occurred. However, based on experience, the Fund expects the risk of loss to be remote.
8. Sector Risk
The Fund may invest a high percentage of its assets in specific sectors of the market in order to achieve a potentially greater investment return. As a result, the Fund may be more susceptible to economic, political, and regulatory developments in a particular sector of the market, positive or negative, and may experience increased volatility on the Fund’s NAV and magnified effect on the total return.
9. Subsequent Events
Subsequent events occurring after the date of this report have been evaluated for potential impact to this report through the date the financial statement were issued. There were no subsequent events to report that would have a material impact on the Fund’s financial statements.
Report of Independent Registered Public Accounting Firm
To the Board of Trustees and Shareholders of Touchstone Institutional Funds Trust
We have audited the accompanying statement of assets and liabilities, including the portfolio of investments, of Touchstone Institutional Funds Trust, (comprised of the Touchstone Sands Capital Institutional Growth Fund) (the “Fund”), as of December 31, 2011, and the related statement of operations for the year then ended, the statements of changes in net assets for each of the two years in the period then ended, and financial highlights for each of the five years in the period then ended. These financial statements and financial highlights are the responsibility of the Fund’s management. Our responsibility is to express an opinion on these financial statements and financial highlights based on our audits.
We conducted our audits in accordance with the standards of the Public Company Accounting Oversight Board (United States). Those standards require that we plan and perform the audits to obtain reasonable assurance about whether the financial statements are free of material misstatement. We were not engaged to perform an audit of the Fund’s internal control over financial reporting. Our audits included consideration of internal control over financial reporting as a basis for designing audit procedures that are appropriate in the circumstances, but not for the purpose of expressing an opinion on the effectiveness of the Fund’s internal control over financial reporting. Accordingly, we express no such opinion. An audit also includes examining, on a test basis, evidence supporting the amounts and disclosures in the financial statements, assessing the accounting principles used and significant estimates made by management, and evaluating the overall financial statement presentation. Our procedures included confirmation of securities owned as of December 31, 2011, by correspondence with the custodian. We believe that our audits provide a reasonable basis for our opinion.
In our opinion, the financial statements and financial highlights referred to above present fairly, in all material respects, the financial position of the Touchstone Sands Capital Institutional Growth Fund at December 31, 2011, the results of its operations for the year then ended, the changes in its net assets for each of the two years in the period then ended, and the financial highlights for each of the five years in the period then ended, in conformity with U.S. generally accepted accounting principles.

Cincinnati, Ohio
February 23, 2012
Other Items (Unaudited)
Proxy Voting
The Sub-Advisor is responsible for exercising the voting rights associated with the securities purchased and held by the Fund. A description of the policies and procedures that the Sub-Advisor uses in fulfilling this responsibility and information regarding how those proxies were voted during the twelve month period ended June 30 are available without charge upon request by calling toll free 1.800.543.0407. These items are also available on the Securities and Exchange Commission’s (SEC) website at http://www.sec.gov.
Quarterly Portfolio Disclosure
The Trust files a complete listing of portfolio holdings for the Fund as of the end of the first and third quarters of each fiscal year on Form N-Q. The complete listing (i) is available on the SEC’s website; (ii) may be reviewed and copied at the SEC’s Public Reference Room in Washington, DC; and (iii) will be made available to shareholders upon request by calling 1.800.543.0407. Information on the operation of the Public Reference Room may be obtained by calling 1-800-SEC-0330.
Schedule of Shareholder Expenses
As a shareholder of the Fund, you incur two types of costs: (1) transaction costs, including reinvested dividends or other distributions; and (2) ongoing costs, including investment advisory fees; distribution (12b-1) fees; and other Fund expenses. This example is intended to help you understand your ongoing costs (in dollars) of investing in the Fund and to compare these costs with the ongoing costs of investing in other mutual funds.
The example is based on an investment of $1,000 invested at the beginning of the period and held for the entire period (July 1, 2011 through December 31, 2011).
Actual Expenses
The first line of the table below provides information about actual account values and actual expenses. You may use the information in this line, together with the amount you invested, to estimate the expenses that you paid over the period. Simply divide your account value by $1,000 (for example, an $8,600 account value divided by $1,000 = 8.6), then multiply the result by the number in the first line under the heading entitled “Expenses Paid During the Six Months Ended December 31, 2011” to estimate the expenses you paid on your account during this period.
Hypothetical Example for Comparison Purposes
The second line of the table below provides information about hypothetical account values and hypothetical expenses based on the Fund’s actual expense ratio and an assumed rate of return of 5% per year before expenses, which is not the Fund’s actual return. The hypothetical account values and expenses may not be used to estimate the actual ending account balance or expenses you paid for the period. You may use this information to compare the ongoing costs of investing in the Fund and other funds. To do so, compare this 5% hypothetical example with the 5% hypothetical examples that appear in the shareholder reports of the other funds.
| | | Net Expense
Rato
Annualized
December 31,
2011 | | | Beginning
Account
Value
July 1,
2011 | | | Ending
Account
Value
December 31,
2011 | | | Expenses Paid During
the Six Months
December 31,
2011* | |
| Touchstone Sands Capital Institutional Growth Fund | | | | | | | | | | | | | | | | |
| Actual | | | 0.79 | % | | $ | 1,000.00 | | | $ | 947.20 | | | $ | 3.88 | |
| Hypothetical | | | 0.79 | % | | $ | 1,000.00 | | | $ | 1,021.22 | | | $ | 4.02 | |
| * | Expenses are equal to the Fund's annualized expense ratio, multiplied by the average account value over the period, multiplied by [number of days in most recent fiscal half-year/365 [or 366]] (to reflect one-half year period). |
Other Items (Continued)
Advisory Agreement Approval Disclosure
At a meeting held on November 17, 2011, the Board of Trustees (the “Board” or “Trustees”) of the Touchstone Institutional Funds Trust (the “Trust”), and by a separate vote, the Independent Trustees of the Trust, approved the continuance of the Management Agreement between the Trust and the Advisor with respect to the Fund, and the continuance of the Sub-Advisory Agreement between the Advisor and the Sub-Advisor.
In determining whether to approve the continuation of the Management Agreement and the Sub-Advisory Agreement, the Advisor furnished information necessary for a majority of the Independent Trustees to make the determination that the continuance of the Management Agreement and the Sub-Advisory Agreement was in the best interests of the Fund and its shareholders. The information provided to the Board included: (1) industry data comparing advisory fees and expense ratios of comparable investment companies; (2) comparative performance information; (3) the Advisor’s and its affiliates’ revenues and costs of providing services to the Fund; and (4) information about the Advisor’s and Sub-Advisor’s personnel. Prior to voting, the Independent Trustees reviewed the proposed continuance of the Management Agreement and the Sub-Advisory Agreement with management and with experienced independent legal counsel and received materials from such counsel discussing the legal standards for their consideration of the proposed continuation of the Management Agreement and the Sub-Advisory Agreement with respect to the Fund. The IndependentTrustees also reviewed the proposed continuation of the Management Agreement and the Sub-Advisory Agreement with respect to the Fund with independent legal counsel in private sessions at which no representatives of management were present.
In approving the Fund’s Management Agreement, the Board considered various factors, among them: (1) the nature, extent and quality of services provided to the Fund, including the personnel providing services; (2) the Advisor’s compensation and profitability; (3) a comparison of fees and performance with other advisers; (4) economies of scale; and (5) the terms of the Management Agreement. The Board’s analysis of these factors is set forth below. The Independent Trustees were advised by independent legal counsel throughout the process.
Nature, Extent and Quality of Advisor Services. The Board considered the level and depth of knowledge of the Advisor, including the professional experience and qualifications of senior personnel. In evaluating the quality of services provided by the Advisor, the Board took into account its familiarity with the Advisor’s senior management through Board meetings, discussions and reports during the preceding year. The Board also took into account the Advisor’s compliance policies and procedures. The quality of administrative and other services, including the Advisor’s role in coordinating the activities of the Fund’s other service providers, was also considered. The Board also considered the Advisor’s relationship with its affiliates and the resources available to them, as well as any potential conflicts of interest.
The Board discussed the Advisor’s effectiveness in monitoring the performance of the Sub-Advisor and the Advisor’s timeliness in responding to performance issues. The Board considered the Advisor’s process for monitoring the Sub-Advisor, which includes an examination of both qualitative and quantitative elements of the Sub-Advisor’s organization, personnel, procedures, investment discipline, infrastructure and performance. The Board considered that the Advisor conducts regular on-site compliance visits with the Sub-Advisor, during which the Advisor examines a wide variety of factors, such as the financial condition of the Sub-Advisor, the quality of the Sub-Advisor’s systems, the effectiveness of the Sub-Advisor’s disaster recovery programs, trade allocation and execution procedures, compliance with the Sub-Advisor’s policies and procedures, results of regulatory examinations and any other factors that might affect the quality of services that the Sub-Advisor provides to the Fund. The Board noted that the Advisor’s compliance monitoring processes also include quarterly reviews of compliance reports, and that any issues arising from such reports and the Advisor’s compliance visits to the Sub-Advisor are reported to the Board.
Other Items (Continued)
The Trustees concluded that they were satisfied with the nature, extent and quality of services provided to the Fund by the Advisor under the Management Agreement.
Advisor’s Compensation and Profitability. The Board took into consideration the financial condition and profitability of the Advisor and its affiliates and the direct and indirect benefits derived by the Advisor and its affiliates from the Advisor’s relationship with the Fund. The information considered by the Board included operating profit margin information for the Advisor’s business as a whole. The Board noted that the Advisor pays the Sub-Advisor’s sub-advisory fee out of the advisory fee the Advisor receives from the Fund. The Board reviewed the profitability of the Advisor’s relationship with the Fund both before and after tax expenses, and also considered whether the Advisor has the financial wherewithal to continue to provide a high level of services to the Fund, noting the ongoing commitment of the Advisor’s parent company with respect to providing support and resources as needed. The Board considered that the Fund’s distributor, an affiliate of the Advisor, receives Rule 12b-1 distribution fees from the Fund and receives a portion of the sales charges on sales or redemptions of certain classes of shares. The Board also noted that the Advisor derives benefits to its reputation and other benefits from its association with the Fund.
The Board recognized that the Advisor should be entitled to earn a reasonable level of profits in exchange for the level of services it provides to the Fund and the entrepreneurial risk that it assumes as Advisor. Based upon their review, the Trustees concluded that the Advisor’s level of profitability from its relationship with the Fund was reasonable and not excessive.
Expenses and Performance. The Board compared the advisory fee and total expense ratio for the Fund with various comparative data, including the median and average advisory fees and total expense ratios of the Fund’s peer group. The Board also considered, among other data, the Fund’s performance results during the six-month, twelve-month, and thirty-six month periods ended June 30, 2011 and noted that the Board reviews on a quarterly basis detailed information about the Fund’s performance results, portfolio composition and investment strategies. The Board also took into account current market conditions and their effect on the Fund’s performance.
The Board also considered the effect of the Fund’s growth and size on its performance and expenses. The Board noted that the sub-advisory fee under the Sub-Advisory Agreement was paid by the Advisor out of the advisory fee it receives from the Fund and considered the impact of such sub-advisory fee on the profitability of the Advisor. In reviewing the expense ratio and performance of the Fund, the Board also took into account the nature, extent and quality of the services provided by the Advisor and its affiliates.
The Board considered, among other data, the specific factors and related conclusions set forth below:
Touchstone Sands Capital Institutional Growth Fund. The Fund’s advisory fee and total expense ratio were above the median of its peer group. The Board took into account management’s discussion of the Fund’s expenses and the Fund’s advisory fee structure. The Fund’s performance for the six-month, twelve-month and thirty-six month periods ended June 30, 2011 was in the 1st quintile of its peer group. Based upon their review, theTrustees concluded that the Fund’s performance was satisfactory and that the advisory fee was reasonable in light of the high quality of services received by the Fund from the Advisor and the other factors considered.
Economies of Scale. The Board considered the effect of the Fund’s current size and potential growth on its performance and fees. The Board took into account management’s discussion of the Fund’s advisory fee structure. The Board also noted that if the Fund’s assets increased over time, the Fund might realize other economies of scale if assets increased proportionally more than certain other expenses.
Conclusion. In considering the renewal of the Fund’s Management Agreement, the Board, including the Independent Trustees, did not identify any single factor as controlling, and each Trustee may have attributed different weights to the various factors. The Board reached the following conclusions regarding the Fund’s Management Agreement
Other Items (Continued)
with the Advisor, among others: (a) the Advisor demonstrated that it possesses the capability and resources to perform the duties required of it under the Management Agreement; (b) the Advisor maintains an appropriate compliance program; (c) the performance of the Fund is satisfactory in relation to the performance of funds with similar investment objectives and relevant indices; and (d) the Fund’s advisory fee is reasonable in relation to those of similar funds and the services to be provided by the Advisor. Based on their conclusions, the Trustees determined that continuation of the Management Agreement was in the best interests of the Fund and its shareholders.
In approving the Fund’s Sub-Advisory Agreement, the Board considered various factors with respect to the Fund and its Sub-Advisory Agreement, among them: (1) the nature, extent and quality of services provided to the Fund, including the personnel providing services; (2) the Sub-Advisor’s compensation; (3) a comparison of the sub-advisory fee and performance with other advisers; and (4) the terms of the Sub-Advisory Agreement. The Board’s analysis of these factors is set forth below. The Independent Trustees were advised by independent legal counsel throughout the process.
Nature, Extent and Quality of Services Provided; Investment Personnel. The Board considered information provided by the Advisor regarding the services provided by the Sub-Advisor, including information presented periodically throughout the previous year. The Board noted that, on a periodic basis, the Board meets with portfolio managers of the Sub-Advisor to discuss their performance and investment processes and strategies. The Board considered the Sub-Advisor’s level of knowledge and investment style. The Board reviewed the experience and credentials of the investment personnel who are responsible for managing the investment of portfolio securities for the Fund. The Board also noted the Sub-Advisor’s brokerage practices.
Sub-Advisor’s Compensation. The Board also took into consideration the financial condition of the Sub-Advisor and any indirect benefits derived by the Sub-Advisor and its affiliates from the Sub-Advisor’s relationship with the Fund. In considering the profitability to the Sub-Advisor of its relationship with the Fund, the Board noted that the sub-advisory fee under the Sub-Advisory Agreement was paid by the Advisor out of the advisory fee that it receives under the Management Agreement and is negotiated at arms-length. As a consequence, the profitability to the Sub-Advisor of its relationship with the Fund was not a substantial factor in the Board’s deliberations. For similar reasons, the Board did not consider the potential economies of scale in the Sub-Advisor’s management of the Fund to be a substantial factor in its consideration.
Sub-Advisory Fee and Fund Performance. The Board considered that the Fund pays an advisory fee to the Advisor and that the Advisor pays the sub-advisory fee to the Sub-Advisor out of the advisory fee it receives from the Fund. The Board also compared the sub-advisory fee paid by the Advisor to fees charged by the Sub-Advisor to manage comparable institutional separate accounts. The Board considered the amount retained by the Advisor and the sub-advisory fee paid to the Sub-Advisor with respect to the various services provided by the Advisor and the Sub-Advisor. The Board reviewed the sub-advisory fee in relation to various comparative data, including the median and average sub-advisory fees of the Fund’s peer group, and considered the following information:
Touchstone Sands Capital Institutional Growth Fund. The Fund’s sub-advisory fee was at the median of its peer group. Based upon their review, the Trustees concluded that the sub-advisory fee was reasonable in light of the quality of services received by the Fund from the Sub-Advisor and the other factors considered.
As noted above, the Board considered the Fund’s performance during the six-month, twelve-month, and thirty-six month periods ended June 30, 2011 as compared to the Fund’s peer group and noted that the Board reviews on a quarterly basis detailed information about the Fund’s performance results, portfolio composition and investment strategies. The Board also noted the Advisor’s expertise and resources in monitoring the performance, investment style and risk-adjusted performance of the Sub-Advisor. The Board also was mindful of the Advisor’s focus on the Sub-Advisor’s performance and the Advisor’s ways of addressing underperformance.
Other Items (Continued)
Conclusion. In considering the renewal of the Sub-Advisory Agreement, the Board, including the Independent Trustees, did not identify any single factor as controlling, and each Trustee may have attributed different weights to the various factors. The Board reached the following conclusions regarding the Sub-Advisory Agreement, among others: (a) the Sub-Advisor is qualified to manage the Fund’s assets in accordance with the Fund’s investment objectives and policies; (b) the Sub-Advisor maintains an appropriate compliance program; (c) the performance of the Fund is satisfactory in relation to the performance of funds with similar investment objectives and relevant indices; (d) the Fund’s advisory fee is reasonable in relation to those of similar funds and the services to be provided by the Advisor and the Sub-Advisor; and (e) the Sub-Advisor’s investment strategies are appropriate for pursuing the investment objectives of the Fund. Based on its conclusions, the Board determined that approval of the Sub-Advisory Agreement was in the best interests of the Fund and its shareholders.
Management of the Trust (Unaudited)
Listed below is basic information regarding theTrustees and principal officers of theTrust.TheTrust’s Statement of Additional Information includes additional information about the Trustees and is available, without charge, upon request by calling 1.800.543.0407.
| Interested Trustees1: | | | | | |
Name Address Age | Position(s) Held with Trust | Term of Office2 And Length of Time Served | Principal Occupation(s) During Past 5 Years | Number of Funds Overseen in the Touchstone Fund Complex3 | Other Directorships Held4 |
Jill T. McGruder Touchstone Advisors, Inc 303 Broadway Cincinnati, OH Year of Birth: 1955 | Trustee and President | Until retirement at age 75 or until she resigns or is removed Trustee since 1999 | President and CEO of IFS Financial Services, Inc. (a holding company). | 43 | Director of LaRosa’s (a restaurant chain), Capital Analysts Incorporated (an investment advisor and broker-dealer), IFS Financial Services, Inc. (a holding company), Integrity and National Integrity Life Insurance Co., Touchstone Securities (the Trust’s distributor), Touchstone Advisors (the Trust’s investment advisor and administrator) and W&S Financial Group Distributors (a distribution company). |
| Independent Trustees: | | | | | |
Phillip R. Cox 105 East Fourth Street Cincinnati, OH Year of Birth: 1947 | Trustee | Until retirement at age 75 or until he resigns or is removed Trustee since 1999 | President and Chief Executive Officer of Cox Financial Corp. (a financial services company). | 43 | Director of Cincinnati Bell (a communications company), Bethesda Inc. (a hospital), Timken Co. (a manufacturing company), Diebold (a technology solutions company), and Ohio Business Alliance for Higher Education. Director of Duke Energy from 1994-2008. |
H. Jerome Lerner c/o Touchstone Advisors, Inc. 303 Broadway Cincinnati, OH Year of Birth: 1938 | Trustee | Until retirement at age 75 or until he resigns or is removed Trustee since 1989 | Principal of HJL Enterprises (a privately held investment company). | 43 | None |
Management of the Trust (Continued)
| Independent Trustees (Continued): | | | |
Name Address Age | Position(s) Held with Trust | Term of Office2 And Length of Time Served | Principal Occupation(s) During Past 5 Years | Number of Funds Overseen in the Touchstone Fund Complex3 | Other Directorships Held4 |
Donald C. Siekmann c/o Touchstone Advisors, Inc. 303 Broadway Cincinnati, OH Year of Birth: 1938 | Trustee | Until retirement at age 75 or until he resigns or is removed Trustee since 2005 | Executive for Duro Bag Manufacturing Co. (a bag manufacturer) from 2002-2008. | 43 | None |
John P. Zanotti c/o Touchstone Advisors, Inc. 303 Broadway Cincinnati, OH Year of Birth: 1948 | Trustee | Until retirement at age 75 or until he resigns or is removed Trustee since 2002 | CEO, Chairman and Director of Avaton, Inc. (a wireless entertainment company) until 2006. President of Cincinnati Biomedical (a life science and economic development company) from 2003-2007. Chairman of Integrated Media Technologies (a media company) | 43 | Director of Q Med (a health care management company) from 2004-2007. |
Susan J. Hickenlooper c/o Touchstone Advisors, Inc. 303 Broadway Cincinnati, OH Year of Birth: 1946 | Trustee | Until retirement at age 75 or until he resigns or is removed Trustee since 2009 | Trustee of Episcopal Retirement Homes Foundation | 43 | Trustee of Gateway Trust from 2006-2008, Trustee of Cincinnati Parks Foundation (a charitable organization). |
| 1 | Ms. McGruder, as a director of the Advisor and the Trust's Distributor, and an officer of affiliates of the Advisor and the Trust's Distributor, is an “interested person” of the Trust within the meaning of Section 2(a)(19) of the 1940 Act. |
| 2 | Each Trustee is elected to serve until the age of 75 or until he or she sooner resigns or is removed. |
| 3 | The Touchstone Fund Complex consists of 1 series of the Trust, 3 series of Touchstone Tax-Free Trust, 20 series of Touchstone Funds Group Trust, 4 series of Touchstone Investment Trust, 4 series of Touchstone Strategic Trust, and 11 variable annuity series of Touchstone Variable Series Trust. |
| 4 | Each Trustee is also a Trustee of Touchstone Funds Group Trust, Touchstone Tax-Free Trust, Touchstone Investment Trust, Touchstone Strategic Trust, and Touchstone Variable Series Trust. |
Management of the Trust (Continued)
| Principal Officers1: | | | | | |
Name Address Age | Position(s) Held with Trust | Term of Office2 And Length of Time Served | Principal Occupation(s) During Past 5 Years | Number of Funds Overseen in the Touchstone Fund Complex2 | Other Directorships Held |
Jill T. McGruder Touchstone Advisors, Inc. 303 Broadway Cincinnati, OH Year of Birth: 1955 | President | Until resignation, removal or disqualification President since 2004; President from 2000-2002 | See biography above. | 43 | See biography above. |
Brian E. Hirsch Touchstone Advisors, Inc. 303 Broadway Cincinnati, OH Year of Birth: 1956 | Vice President | Until resignation, removal or disqualification Vice President since 2003 | Senior Vice President of Compliance and Fund Administration of IFS Financial Services, Inc. | 43 | None |
Steven M. Graziano Touchstone Advisors, Inc. 303 Broadway Cincinnati, OH Year of Birth: 1954 | Vice President | Until resignation, removal or disqualification Vice President since 2009 | President of Touchstone Advisors, Inc.; Executive Vice President of Pioneer Investment Management, Head of Retail Distribution and Strategic Marketing 2007-2008; Executive Vice President of Pioneer Investment Management, Chief Marketing Officer 2002-2007. | 43 | None |
Timothy D. Paulin Touchstone Advisors, Inc. 303 Broadway Cincinnati, OH Year of Birth: 1963 | Vice President | Until resignation, removal or disqualification Vice President since 2010 | Vice President of Investment Research; Principal of Klein Decisions | 43 | None |
Joseph Melcher Touchstone Advisors, Inc. 303 Broadway Cincinnati, OH Year of Birth: 1973 | Chief Compliance Officer | Until resignation, removal or disqualification Chief Compliance Officer since 2010 | Vice President of Compliance of IFS Financial Services (a holding company); Assistant Vice President of Compliance of IFS Financial Services 2005-2010. | 43 | None |
Terrie A. Wiedenheft Touchstone Advisors, Inc. 303 Broadway Cincinnati, OH Year of Birth: 1962 | Controller and Treasurer | Until resignation, removal or disqualification Controller since 2000 Treasurer since 2003 | Chief Financial Officer and Senior Vice President of IFS Financial Services, Inc. | 43 | None |
Elizabeth R. Freeman BNY Mellon 201 Washington Street Boston, MA Year of Birth: 1962 | Secretary | Until resignation, removal or disqualification. Secretary since 2011 | Managing Director and Senior Counsel at BNY Mellon Investment Servicing (US) Inc. | 43 | None |
| 1 | Each officer also holds the same office with Touchstone Funds Group Trust, Touchstone Tax-Free Trust, Touchstone Investment Trust, Touchstone Tax-Free Trust, and Touchstone Variable Series Trust. |
| 2 | The Touchstone Fund Complex consists of 1 series of the Trust, 3 series of Touchstone Tax-Free Trust, 19 series of Touchstone Funds Group Trust, 4 series of Touchstone Investment Trust, 4 series of Touchstone Strategic Trust, and 11 variable annuity series of Touchstone Variable Series Trust. |
PRIVACY PROTECTION POLICY
We Respect Your Privacy
Thank you for your decision to invest with us. Touchstone and its affiliates have always placed a high value on the trust and confidence our clients place in us. We believe that confidence must be earned and validated through time. In today’s world, when technology allows the sharing of information at light speeds, trust must be reinforced by our sincere pledge to take the steps necessary to ensure that the information you share with us is treated with respect and confidentiality.
Our Pledge to Our Clients
| • | We collect only the information we need to service your account and administer our business. |
| • | We are committed to keeping your information confidential and we place strict limits and controls on the use and sharing of your information. |
| • | We make every effort to ensure the accuracy of your information. |
We Collect the Following Nonpublic Personal Information About You:
| • | Information we receive from you on or in applications or other forms, correspondence, or conversations, including, but not limited to, your name, address, phone number, social security number, assets, income and date of birth; and |
| • | Information about your transactions with us, our affiliates, or others, including, but not limited to, your account number and balance, payment history, parties to transactions, cost basis information, and other financial information. |
Categories of Information We Disclose and Parties to Whom We Disclose
We do not disclose any nonpublic personal information about our current or former clients to nonaffiliated third parties, except as required or permitted by law.
We Place Strict Limits and Controls on the Use and Sharing of Your Information
| • | We restrict access to nonpublic personal information about you to authorized employees who need the information to administer your business. |
| • | We maintain physical, electronic and procedural safeguards that comply with federal standards to protect this information. |
| • | We do not disclose any nonpublic personal information about our current or former clients to anyone, except as required or permitted by law or as described in this document. |
| • | We will not sell your personal information to anyone. |
We May Provide Information to Service Your Account
Sometimes it is necessary to provide information about you to various companies such as transfer agents, custodians, broker-dealers and marketing service firms to facilitate the servicing of your account.These organizations have a legitimate business need to see some of your personal information in order for us to provide service to you. We may disclose to these various companies the information that we collect as described above. We require that these companies, including our own subsidiaries and affiliates, strictly maintain the confidentiality of this information and abide by all applicable laws. Companies within our corporate family that may receive this information are financial service providers and insurance companies. We do not permit these associated companies to sell the information for their own purposes, and we never sell our customer information.
This policy is applicable to the following affiliated companies: Touchstone Funds Group Trust, Touchstone Investment Trust, Touchstone Strategic Trust, Touchstone Tax-Free Trust, Touchstone Variable Series Trust, Touchstone Institutional Funds Trust, Touchstone Securities, Inc.,* Capital Analysts Incorporated and W&S Brokerage Services, Inc.
* Touchstone Securities, Inc. serves as the underwriter to the Touchstone Funds.
A Member of Western & Southern Financial Group®
The Privacy Protection Policy is not part of the Annual Report.
This page intentionally left blank.
This page intentionally left blank.
This page intentionally left blank.
303 Broadway, Suite 1100
Cincinnati, OH 45202-4203

Go paperless, sign up today at:
www.touchstoneinvestments.com/home
Touchstone Investments
Distributor
Touchstone Securities, Inc.*
303 Broadway
Cincinnati, Ohio 45202-4203 800.638.8194
www.touchstoneinvestments.com
Investment Advisor
Touchstone Advisors, Inc.*
303 Broadway
Cincinnati, Ohio 45202-4203
Transfer Agent
BNY Mellon Investment Servicing (US) Inc.
4400 Computer Drive
Westborough, MA 01581
Shareholder Service
800.543.0407
* A Member of Western & Southern Financial Group
TSF-1105-TIFT-AR-1112
Item 2. Code of Ethics.
| (a) | The registrant, as of the end of the period covered by this report, has adopted a code of ethics that applies to the registrant’s principal executive officer, principal financial officer, principal accounting officer or controller, or persons performing similar functions, regardless of whether these individuals are employed by the registrant or a third party. |
| (c) | There have been no amendments, during the period covered by this report, to a provision of the code of ethics that applies to the registrant’s principal executive officer, principal financial officer, principal accounting officer or controller, or persons performing similar functions, regardless of whether these individuals are employed by the registrant or a third party, and that relates to any element of the code of ethics description. |
| (d) | The registrant has not granted any waivers, including an implicit waiver, from a provision of the code of ethics that applies to the registrant’s principal executive officer, principal financial officer, principal accounting officer or controller, or persons performing similar functions, regardless of whether these individuals are employed by the registrant or a third party, that relates to one or more of the items set forth in paragraph (b) of this item’s instructions. |
Item 3. Audit Committee Financial Expert.
The registrant’s Board of Trustees has determined that the registrant has at least one audit committee financial expert serving on its audit committee. Mr. Donald Siekmann is the registrant’s audit committee financial expert and is an independent trustee within the meaning of the Investment Company Act of 1940, as amended (the “1940 Act”).
Item 4. Principal Accountant Fees and Services.
Audit Fees
| (a) | Audit fees for Touchstone Institutional Funds Trust totaled $13,000 and $13,000 in fiscal 2011 and 2010, respectively, including fees associated with the annual audit and filing of Form N-1A and Form N-SAR. |
Audit-Related Fees
| (b) | Audit-related fees totaled $650 and $0 in fiscal 2011 and 2010, respectively, relating to conversion testing from the Trust’s former fund accountant and transfer agent (JP Morgan) to the Trust’s current fund accountant and transfer agent (BNY Mellon). |
Tax Fees
| (c) | Fees for tax compliance services totaled $3,400 and $9,800 in fiscal 2011 and 2010, respectively. |
All Other Fees
| (d) | There were no other fees for the December 31, 2011 or December 31, 2010 fiscal years. |
Audit Committee Pre-Approval Policies.
| (e)(1) | The Audit Committee’s pre-approval policies describe the types of audit, audit-related, tax and other services that have the general pre-approval of the Audit Committee. The pre-approval policies provide that annual audit service fees, tax services not specifically granted pre-approval, services exceeding pre-approved cost levels and other services that have not received general pre-approval will be subject to specific pre-approval by the Audit Committee. The pre-approval policies further provide that the Committee may grant general pre-approval to other audit services (statutory audits and services associated with SEC registration statements, periodic reports and other documents filed with the SEC or other documents issued in connection with securities offerings), audit-related services (accounting consultations related to accounting, financial reporting or disclosure matters not classified as “audit services,” assistance with understanding and implementing new accounting and financial reporting guidance from rulemaking authorities, agreed-upon or expanded audit procedures related to accounting and/or billing records required to respond to or comply with financial, accounting or regulatory reporting matters and assistance with internal control reporting requirements under Form N-SAR and Form N-CSR), tax services that have historically been provided by the auditor that the Committee believes would not impair the independence of the auditor and are consistent with the SEC’s rules on auditor independence and permissible non-audit services classified as “all other services” that are routine and recurring services. |
| (e)(2) | All services described in paragraphs (b) through (d) of Item 4 were approved by the Audit Committee. |
| (g) | The aggregate non-audit fees billed by the registrant's accountant for services rendered to the registrant, and rendered to the registrant's investment adviser (not including any sub-adviser whose role is primarily portfolio management and is subcontracted with or overseen by another investment adviser), and any entity controlling, controlled by, or under common control with the adviser that provides ongoing services to the registrant for each of the last two fiscal years of the registrant was $35,200 for 2011 and $39,800 for 2010. |
| (h) | The registrant's audit committee of the board of directors has considered whether the provision of non-audit services that were rendered to the registrant's investment adviser (not including any sub-adviser whose role is primarily portfolio management and is subcontracted with or overseen by another investment adviser), and any entity controlling, controlled by, or under common control with the investment adviser that provides ongoing services to the registrant that were not pre-approved pursuant to paragraph (c)(7)(ii) of Rule 2-01 of Regulation S-X is compatible with maintaining the principal accountant's independence. |
Item 5. Audit Committee of Listed registrants.
Not applicable.
Item 6. Investments.
| (a) | Schedule of Investments in securities of unaffiliated issuers as of the close of the reporting period is included as part of the report to shareholders filed under Item 1 of this form. |
Item 7. Disclosure of Proxy Voting Policies and Procedures for Closed-End Management Investment Companies.
Not applicable.
Item 8. Portfolio Managers of Closed-End Management Investment Companies.
Not applicable.
Item 9. Purchases of Equity Securities by Closed-End Management Investment Company and Affiliated Purchasers.
Not applicable.
Item 10. Submission of Matters to a Vote of Security Holders.
There have been no material changes to the procedures by which the shareholders may recommend nominees to the registrant’s board of directors, where those changes were implemented after the registrant last provided disclosure in response to the requirements of Item 407(c)(2)(iv) of Regulation S-K (17 CFR 229.407) (as required by Item 22(b)(15) of Schedule 14A (17 CFR 240.14a-101)), or this Item.
Item 11. Controls and Procedures.
| (a) | The registrant’s principal executive and principal financial officers, or persons performing similar functions, have concluded that the registrant’s disclosure controls and procedures (as defined in Rule 30a-3(c) under the Investment Company Act of 1940, as amended (the “1940 Act”) (17 CFR 270.30a-3(c))) are effective, as of a date within 90 days of the filing date of the report that includes the disclosure required by this paragraph, based on their evaluation of these controls and procedures required by Rule 30a-3(b) under the 1940 Act (17 CFR 270.30a-3(b)) and Rules 13a-15(b) or 15d-15(b) under the Securities Exchange Act of 1934, as amended (17 CFR 240.13a-15(b) or 240.15d-15(b)). |
| (b) | There were no changes in the registrant’s internal control over financial reporting (as defined in Rule 30a-3(d) under the 1940 Act (17 CFR 270.30a-3(d)) that occurred during the registrant’s second fiscal quarter of the period covered by this report that has materially affected, or is reasonably likely to materially affect, the registrant’s internal control over financial reporting. |
Item 12. Exhibits.
| (a)(1) | Code of ethics, or any amendment thereto, that is the subject of disclosure required by Item 2 is attached hereto. |
| (a)(2) | Certifications pursuant to Rule 30a-2(a) under the 1940 Act and Section 302 of the Sarbanes-Oxley Act of 2002 are attached hereto. |
| (b) | Certifications pursuant to Rule 30a-2(b) under the 1940 Act and Section 906 of the Sarbanes- Oxley Act of 2002 are attached hereto. |
SIGNATURES
Pursuant to the requirements of the Securities Exchange Act of 1934 and the Investment Company Act of 1940, the registrant has duly caused this report to be signed on its behalf by the undersigned, thereunto duly authorized.
(registrant) Touchstone Institutional Funds Trust
| By (Signature and Title)* | /s/ Jill T. McGruder |
| | Jill T. McGruder, President |
| | (principal executive officer) |
Date 2/29/12
Pursuant to the requirements of the Securities Exchange Act of 1934 and the Investment Company Act of 1940, this report has been signed below by the following persons on behalf of the registrant and in the capacities and on the dates indicated.
| By (Signature and Title)* | /s/ Jill T. McGruder |
| | Jill T. McGruder, President |
| | (principal executive officer) |
Date 2/29/12
| By (Signature and Title)* | /s/ Terrie Wiedenheft |
| | Terrie Wiedenheft, Controller and Treasurer |
| | (principal financial officer) |
Date 2/29/12
* Print the name and title of each signing officer under his or her signature.