UNITED STATES
SECURITIES AND EXCHANGE COMMISSION
Washington, D.C. 20549
FORM N-CSR
CERTIFIED SHAREHOLDER REPORT OF REGISTERED MANAGEMENT INVESTMENT COMPANIES
Investment Company Act file number 811-21113
Touchstone Institutional Funds Trust
(Exact name of registrant as specified in charter)
303 Broadway, Suite 1100
Cincinnati, Ohio 45202-4203
(Address of principal executive offices) (Zip code)
Jill T. McGruder
303 Broadway, Suite 1100
Cincinnati, Ohio 45202-4203
(Name and address of agent for service)
Registrant's telephone number, including area code: 800-638-8194
Date of fiscal year end: December 31
Date of reporting period: December 31, 2017
Form N-CSR is to be used by management investment companies to file reports with the Commission not later than 10 days after the transmission to stockholders of any report that is required to be transmitted to stockholders under Rule 30e-1 under the Investment Company Act of 1940 (17 CFR 270.30e-1). The Commission may use the information provided on Form N-CSR in its regulatory, disclosure review, inspection, and policymaking roles.
A registrant is required to disclose the information specified by Form N-CSR, and the Commission will make this information public. A registrant is not required to respond to the collection of information contained in Form N-CSR unless the Form displays a currently valid Office of Management and Budget ("OMB") control number. Please direct comments concerning the accuracy of the information collection burden estimate and any suggestions for reducing the burden to Secretary, Securities and Exchange Commission, 450 Fifth Street, NW, Washington, DC 20549-0609. The OMB has reviewed this collection of information under the clearance requirements of 44 U.S.C. § 3507.
Item 1. Reports to Stockholders.
The Report to Shareholders is attached herewith.
December 31, 2017
Annual Report
Touchstone Institutional Funds Trust
Touchstone Sands Capital Institutional Growth Fund

Table of Contents
This report identifies the Fund's investments on December 31, 2017. These holdings are subject to change. Not all investments in the Fund performed the same, nor is there any guarantee that these investments will perform as well in the future. Market forecasts provided in this report may not occur.
Letter from the President
Dear Shareholder:
We are pleased to provide you with the Touchstone Institutional Funds Trust Annual Report. Inside you will find key financial information, as well as the manager commentary for the 12 months ended December 31, 2017.
Nearly ten years after the 2008 Credit Crisis, the economic recovery finally seemed to have taken hold in calendar year 2017. Economists and market strategists trumpeted the start of a “synchronized global expansion” as economic growth in the U.S., Japan, Europe and China aligned to provide a powerful impetus for a broader acceleration in global growth. While economic strength was synchronized across the world, monetary policies experienced further divergence. The Bank of Japan and the European Central Bank maintained accommodative stances, providing ample stimulus in an effort to sustain recent positive GDP growth trends after years of economic fragility. Meanwhile, with solid growth entrenched in the U.S., the U.S. Federal Reserve Board (Fed) continued moving toward its goal of monetary policy normalization by raising rates in March, June and December and announcing plans to reduce the size of its balance sheet.
Global equities posted strong double-digit returns across most broad U.S. and non-U.S. equity indexes. Growth-oriented stocks led U.S. equity markets over their value-oriented counterparts, while large capitalization stocks outperformed small and mid-capitalization stocks. Outside the U.S., emerging market equities generated very strong returns followed closely by developed market equities.
The new year provides a natural point to assess the recent past and to look toward the future. From a financial perspective, it has been yet another period of strong returns across many asset classes. This makes it a particularly timely juncture to assess your current financial situation, and with the help of your financial advisor, re-assess your plans for the year – and years ahead.
We greatly appreciate your continued support. Thank you for including Touchstone as part of your investment plan.
| Sincerely, | |
| | |
 | |
| | |
| Jill T. McGruder | |
| President | |
| Touchstone Institutional Funds Trust | |
Management's Discussion of Fund Performance (Unaudited)
Touchstone Sands Capital Institutional Growth Fund
Sub-Advised by Sands Capital Management LLC
Investment Philosophy
The Touchstone Sands Capital Institutional Growth Fund primarily invests in common stocks of large capitalization U.S. companies that are believed by Sands Capital Management LLC (“Sands Capital”) to have above-average potential for revenue or earnings growth. The Fund typically invests in 25 to 35 companies. Sands Capital generally seeks stocks with sustainable above-average earnings growth and capital appreciation potential. In addition, Sands Capital looks for companies that have a significant competitive advantage, a leadership position or proprietary niche, a clear mission in an understandable business, financial strength and are valued rationally in relation to comparable companies, the market and the business prospects for that particular company.
Fund Performance
The Touchstone Sands Capital Institutional Growth Fund outperformed its benchmark, the Russell 1000® Growth Index, for the 12-month period ended December 31, 2017. The Fund’s total return was 34.74 percent, while the total return of the benchmark was 30.21 percent.
Market Environment
We believe the biggest factor that impacted the Fund during the year was a continued focus on fundamentals. We believe strengthening underlying economic data—including employment, durable goods and home sales—and strong business fundamentals propelled the continued rise in U.S. growth equities.
The Information Technology sector was the market’s top performer, as spending by both small/mid-sized businesses and large enterprises remained healthy, and semiconductor demand remained high. This spending environment—combined with the secular trend of increased mobile and internet usage for commerce, content and communication—will likely support continued strong growth rates from the technology sector. Meanwhile, slower growing and/or cyclical sectors, including Energy and Consumer Staples, lagged.
Portfolio Review
On a relative basis, the largest contributors to the Fund’s investment results for calendar year 2017 were Alibaba Group Holding Ltd., Visa Inc., Amazon.com Inc., Facebook Inc. and Adobe Systems Inc. In 2016, Alibaba’s share price was pressured by negative macro sentiment, as well as self-imposed business disruptions from platform enhancement initiatives. The Fund continued to own the business because we believed the disruptions were transitory and that the company’s efforts to set a clear standard of service, improve logistics and overhaul its advertising system could lead to higher, more sustainable growth over the long-term.
Over the past several quarters, Alibaba executed on these initiatives, which we believe has translated into strong overall business performance. These improvements could be just the beginning, as we believe Alibaba is building a unique platform that is transforming the massive retail market in China. Furthermore, we believe that the company is at the forefront globally of bringing a completely integrated omni-channel experience at scale, which should expand Alibaba’s addressable market to all of retail, both online and offline. Starting with categories that have traditionally low online penetration, such as large appliances and fresh produce, Alibaba started to help retail partners reconfigure existing stores and build new prototypes with digitized back-end operations and optimized storefronts. These new concepts increased productivity, and we expect more retailers will adopt this approach over time. Throughout the process, Alibaba has amassed vast amounts of rich data. Currently, this data is used to help monetization by increasing the algorithm’s targeting accuracy. Over time, we believe Alibaba could generate additional revenue from this data by providing retailers and brands with valuable consumer intelligence.
Management's Discussion of Fund Performance (Unaudited) (Continued)
While many growth drivers remain for its domestic e-commerce revenue, Alibaba is also investing in earlier-stage assets that we believe could further extend its growth runway. For example, it is already a leader in the public cloud in China and formalized e-commerce in Southeast Asia. It is also the main channel for Chinese merchants to export to world consumers. All of these businesses experienced strong revenue growth and could contribute to Alibaba growing at above-average rates for many years to come.
The largest detractors from investment results during the 12-month period were Snap Inc., Under Armour Inc., Incyte Corp., Chipotle Mexican Grill Inc. and Schlumberger Ltd. Snap’s share price was pressured as a pending user application redesign, along with stronger competition from Instagram (Facebook ecosystem), presented significant challenges to user growth in our opinion. We initially expected the intimate nature of Snap’s application to be a key differentiator, but we underestimated the effectiveness of Facebook’s Instagram Stories at copying some of Snap’s features and driving user engagement, thereby limiting Snap’s ability to expand beyond its core young millennial user base.
During calendar year 2017, positions were purchased in five businesses:
Snap Inc. is a leading social media company that allows users to creatively express themselves through short videos, pictures and messages. Sands Capital views the company’s predominantly young user base as a competitive advantage that should provide a sizable monetization opportunity as the migration of advertising spend to digital channels continues.
CoStar Group Inc. is the leading provider of data, analytics and online marketing services to the U.S. commercial real estate industry. Its competitive advantage is its comprehensive proprietary dataset, collected by 1,600 researchers for more than 25 years. We believe CoStar Group should increase revenue per capita in newer markets and expand margins over its investment horizon.
Starbucks Corp. is a leading specialty coffee chain with a prominent worldwide presence. We believe several key factors should drive continued earnings and cash flow growth, including increasing same-store-sales through improved food offerings and drink innovation, expanding the international store footprint, and innovating through technology (e.g. Mobile Order & Pay).
Activision Blizzard Inc. is a leading developer and publisher of interactive entertainment across video game consoles, personal computers and mobile platforms. We believe Activision is one of the businesses best positioned to benefit as the gaming industry shifts from physical retail distribution to digital delivery. We expect Activision to generate above-average revenue and earnings growth over our investment horizon.
Loxo Oncology Inc. is an emerging leader in genetically targeted cancer therapy development. We believe Loxo has a compelling overall research and development (R&D) strategy, focused on developing highly selective therapies for genetically defined cancer subgroups. Over the long term, we expect above-average earnings growth as Loxo commercializes drugs and continues to execute on its focused R&D strategy.
During calendar year 2017, positions in six businesses were sold:
The Fund’s position in Mobileye B.V. was sold due to its pending acquisition by Intel Corp., which closed at the end of 2017. In our view, Intel’s interest confirms two assessments we made of Mobileye: first, that Mobileye has the key technology, relationships with car manufacturers and building blocks to provide a fully autonomous platform by 2021; and second, the company has meaningful advanced driver assistance systems (ADAS) revenues to support earnings and free cash flow accretion.
While Schlumberger Ltd. remains in the Fund and in our view, a clear leader in the energy sector, we came to the conclusion that its linkage to commodity prices makes its long-term growth profile less attractive relative to other businesses in its opportunity set.
Management's Discussion of Fund Performance (Unaudited) (Continued)
The Fund owned Athenahealth Inc. for more than five years. During that time, the company moved further up the growth S-curve and now possesses a more mature profile. We believe the company will grow at a decelerated rate going forward. While we continue to view Athenahealth as one of the software leaders in the Health Care sector, we believe the Fund’s portfolio is better positioned with faster-growing software businesses.
Both industry and company-specific factors negatively affected Under Armour Inc.’s share price over the past several quarters. We believe Under Armour will fix many of its issues over time, and will retain its status as a leading sports apparel brand. However, we believe execution of the company’s strategic initiatives could be challenging, and may take longer to materialize than what we initially assumed. Given our lowered conviction, we decided it was more prudent to exit the position than to rebuild a meaningful position.
Snap Inc. was sold after we lost conviction in its ability to meaningfully grow its user base, which was the key swing factor for our investment case. A pending user application redesign, along with stronger competition from Instagram (Facebook ecosystem), present many challenges to user growth in our opinion, and we are not confident in Snap’s ability to successfully navigate these hurdles. We initially expected the intimate nature of Snap’s application to be a key differentiator, but we underestimated the effectiveness of Facebook’s Instagram Stories at copying some of Snap’s features and driving user engagement, thereby limiting Snap’s ability to expand beyond its core young millennial user base. The Fund’s small weight in Snap reflected this competitive risk from Facebook, as well as the operational risks associated with a young company early in its growth cycle. We continue to view Snap as a strategic social asset with a highly engaged user base—and will continue to monitor the company’s progress—but we no longer believe Snap meets our criteria as a leading growth business.
While we believe LendingClub Corp. remains a decent business with a novel method of distributing credit, it is no longer a strong fit with our six investment criteria. Over the past several quarters, the company has worked to heal itself from the control violations in May of 2016. However, loan growth recovery is slower than we expected, and we do not foresee revenue and earnings returning to the hyper-growth rates that we anticipated. Additionally, management turnover lowered our conviction in the company’s leadership. It appears to us that the new management team is less willing to be innovative, and therefore will be unable to accelerate growth in a meaningful way.
Outlook
We view secular trends, innovation and company-specific competitive advantages as key to driving growth through a variety of economic environments. For a business to possess the above-average earnings growth potential we require, it is often a key innovator or vital facilitator within an attractive industry that is benefiting from positive secular change. Secular trends are distinct from short-term economic factors as we believe they tend to persist through market cycles and can provide powerful structural tailwinds that enhance the sustainability of a business’s growth for many years. We believe our long-term investment horizon allows us to capture the benefit of these characteristics and realize the ultimate earnings power of a company, while weathering volatility over shorter periods. Furthermore, our approach—active, concentrated and benchmark-agnostic—enables us to have outsized exposure to companies within this sphere that we believe are the best fits with our six investment criteria.
We believe the majority of businesses in the Fund’s portfolio benefit from one or more secular trends. However, we have identified four broad trends that together comprise a majority of the portfolio:
| · | Retail Revolution – E-commerce: E-commerce is the fastest growing segment of retail sales, but only accounts for about seven percent of the total worldwide retail market. As a proportion of total retail sales, e-commerce is expected to nearly double by 2019. Brands now have the ability to directly interact with consumers through novel mediums, such as social media and lifestyle apps, and become embedded in their daily routines. Tools |
Management's Discussion of Fund Performance (Unaudited) (Continued)
such as Amazon Prime and Visa Checkout reduce the friction associated with online payment. Fund beneficiaries include Alibaba Group Holding Ltd., Amazon.com Inc., Facebook Inc., The Priceline Group Inc. and Visa Inc.
| · | Union of Healthcare and Technology: Major areas of unmet need continue to exist in the treatment of disease. However, improved understanding of disease biology and new approaches to treatment are enabling more productive drug development. Additionally, we expect genomic sequencing and health care information systems to facilitate precision medicine, enabling physicians to provide more targeted care. We are also witnessing the rise of minimally invasive surgical technologies, which have quality of life advantages for the patient and efficiency benefits for providers, leading them to increasingly become the standard of care. Fund beneficiaries include Alexion Pharmaceuticals Inc., BioMarin Pharmaceutical Inc., Edwards Lifesciences Corp., Illumina Inc. and Regeneron Pharmaceuticals Inc. |
| · | Software-as-a-Service (SaaS): In our view, Information Technology spending is shifting toward innovations that make enterprises more agile and efficient. Cloud-based software is a key facilitator of this shift. Fast deployment, scalability, easy and frequent updates and lower total cost of ownership create a compelling customer value proposition. SaaS businesses tend to benefit from revenue visibility, “sticky” clientele, margin leverage opportunities and low customer acquisition costs. Fund beneficiaries include Adobe Systems Inc., Amazon.com Inc., Palo Alto Networks Inc., ServiceNow Inc. and Splunk Inc. |
| · | Data-Driven Decision Making: We believe companies with large, proprietary pools of consumer data and tools that use this data to create unique content have sizable monetization opportunities. Advertising is already well on its way toward transformation, as access to consumer data is enabling companies to create targeted, more effective ads. At the micro level, companies are beginning to use predictive analytics to generate insights from their own pools of data. Fund beneficiaries include Alphabet Inc., Baidu Inc., Facebook Inc., Netflix Inc. and Splunk Inc. |
In a volatile market, stock prices tend to move together as a group, which can result in a disconnection between valuations and long-term growth prospects. When volatility is driven by fear, investors’ time horizons tend to shorten, and fast-growing, disruptive companies that are investing in their growth, and therefore unlikely to realize their full potential for years (i.e., the kinds of businesses we seek to own), often suffer from outsized pressure. During these periods, some investors appear inclined to trade a potentially larger long-term total return for the near-term surety of stable cash flows, dividends and/or lower, more secure growth. Drug pipelines, potential new products and other types of future optionality are often ignored. A company that is under-earning its full potential today in order to become larger tomorrow can suddenly be viewed as less valuable than one that is growing more slowly, further along the maturity curve, and not investing in its own growth.
We believe the Fund owns companies that are positioned to deliver strong business results and earnings growth over a five-to ten-year investment horizon. Our focus on the sustainability of a business’s future earnings growth typically steers us toward companies we believe are benefiting from secular trends that should provide powerful growth tailwinds throughout economic cycles. We have high conviction in the long-term growth estimates for the Fund’s portfolio companies and believe they can deliver the growth necessary to support above average relative and absolute returns over the next several years.
The Fund’s sector allocations are a residual of our bottom-up, fundamental approach. Our six investment criteria typically lead us to innovative businesses that are creating new or disrupting existing markets, and/or benefiting from powerful secular tailwinds. Our approach to investment research, portfolio construction and risk management results in a Fund that we believe is naturally diversified across industries and businesses at different stages of their respective growth lifecycles. We expect the Fund to continue to have higher weights in key growth sectors, including Consumer, Health Care and Information Technology, and lower weights in highly-cyclical sectors such as Energy, Industrials and Financials.
Management's Discussion of Fund Performance (Unaudited) (Continued)
Comparison of the Change in Value of a $500,000 Investment in the
Touchstone Sands Capital Institutional Growth Fund and the Russell 1000® Growth Index
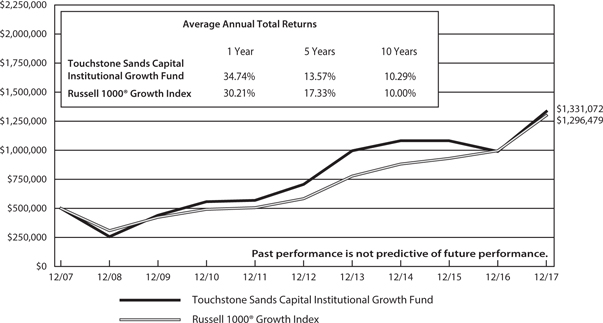
The performance of the above Fund does not reflect the deduction of taxes that a shareholder would pay on Fund distributions or the redemption of Fund shares.
The inception date of the Fund was January 21, 2005.
Note to Chart
Russell 1000® Growth Index measures the performance of those Russell 1000 companies with higher price-to-book ratios and higher forecasted growth values.
The Frank Russell Company (FRC) is the source and owner of the Index data contained or reflected in this material and all trademarks and copyrights related thereto. The material may contain confidential information and unauthorized use, disclosure, copying, dissemination or redistribution is strictly prohibited. This is a Touchstone Investments presentation of the data, and FRC is not responsible for the formatting or configuration of this material or for any inaccuracy in the presentation thereof.
Tabular Presentation of Portfolio of Investments (Unaudited)
December 31, 2017
The table below provides the Fund’s sector allocation. We hope it will be useful to shareholders as it summarizes key information about the Fund’s investments.
| Touchstone Sands Capital Institutional Growth Fund | | | |
| Sector Allocation* | | (% of Net Assets) | |
| Information Technology | | | 55.0 | % |
| Consumer Discretionary | | | 18.5 | |
| Health Care | | | 17.5 | |
| Financials | | | 3.2 | |
| Consumer Staples | | | 3.1 | |
| Short-Term Investment Fund | | | 3.3 | |
| Other Assets/Liabilities (Net) | | | (0.6 | ) |
| Total | | | 100.0 | % |
| | | | | |
* Sector Classifications are based upon the Global Industry Classification Standard (GICS®).
Portfolio of Investments
Touchstone Sands Capital Institutional Growth Fund – December 31, 2017
| | | | | | Market | |
| | | Shares | | | Value | |
| | | | | | | |
| Common Stocks — 97.3% | | | | | | | | |
| | | | | | | | | |
| Information Technology — 55.0% | | | | | | | | |
| Activision Blizzard, Inc. | | | 556,000 | | | $ | 35,205,920 | |
| Adobe Systems, Inc.* | | | 516,153 | | | | 90,450,652 | |
| Alibaba Group Holding Ltd. ADR* | | | 629,610 | | | | 108,563,652 | |
| Alphabet, Inc. - Class A* | | | 85,270 | | | | 89,823,418 | |
| Alphabet, Inc. - Class C* | | | 11,592 | | | | 12,129,869 | |
| Baidu, Inc. ADR* | | | 328,731 | | | | 76,992,088 | |
| CoStar Group, Inc.* | | | 127,785 | | | | 37,945,756 | |
| Facebook, Inc. - Class A* | | | 648,006 | | | | 114,347,139 | |
| Palo Alto Networks, Inc.* | | | 350,655 | | | | 50,823,936 | |
| salesforce.com, Inc.* | | | 1,113,438 | | | | 113,826,767 | |
| ServiceNow, Inc.* | | | 713,000 | | | | 92,968,070 | |
| Splunk, Inc.* | | | 541,621 | | | | 44,867,884 | |
| Visa, Inc. - Class A | | | 1,227,754 | | | | 139,988,511 | |
| | | | | | | | 1,007,933,662 | |
| | | | | | | | | |
| Consumer Discretionary — 18.5% | | | | | | | | |
| Amazon.com, Inc.* | | | 118,460 | | | | 138,535,416 | |
| Chipotle Mexican Grill, Inc.* | | | 25,346 | | | | 7,325,754 | |
| Netflix, Inc.* | | | 443,239 | | | | 85,084,158 | |
| Priceline Group, Inc. (The)* | | | 43,918 | | | | 76,318,065 | |
| Starbucks Corp. | | | 536,000 | | | | 30,782,480 | |
| | | | | | | | 338,045,873 | |
| | | | | | | | | |
| Health Care — 17.5% | | | | | | | | |
| Alexion Pharmaceuticals, Inc.* | | | 406,823 | | | | 48,651,963 | |
| Biogen, Inc.* | | | 102,057 | | | | 32,512,298 | |
| BioMarin Pharmaceutical, Inc.* | | | 417,283 | | | | 37,209,125 | |
| Edwards Lifesciences Corp.* | | | 334,151 | | | | 37,662,159 | |
| Illumina, Inc.* | | | 251,089 | | | | 54,860,436 | |
| Incyte Corp.* | | | 466,182 | | | | 44,152,097 | |
| Loxo Oncology, Inc.* | | | 207,575 | | | | 17,473,663 | |
| Regeneron Pharmaceuticals, Inc.* | | | 125,852 | | | | 47,315,318 | |
| | | | | | | | 319,837,059 | |
| | | | | | | | | |
| Financials — 3.2% | | | | | | | | |
| Charles Schwab Corp. (The) | | | 1,135,325 | | | | 58,321,645 | |
| | | | | | | | | |
| Consumer Staples — 3.1% | | | | | | | | |
| Monster Beverage Corp.* | | | 904,000 | | | | 57,214,160 | |
| Total Common Stocks | | | | | | $ | 1,781,352,399 | |
| | | | | | | |
| Short-Term Investment Fund — 3.3% | | | | | | | | |
| Dreyfus Government Cash | | | | | | | | |
| Management, Institutional Shares, | | | | | | | | |
| 1.19%∞Ω | | | 61,032,769 | | | $ | 61,032,769 | |
| | | | | | | | | |
| Total Investment Securities —100.6% | | | | | | | | |
| (Cost $920,774,643) | | | | | | $ | 1,842,385,168 | |
| | | | | | | | | |
| Liabilities in Excess of Other Assets — (0.6%) | | | | | | | (11,101,583 | ) |
| | | | | | | | | |
| Net Assets — 100.0% | | | | | | $ | 1,831,283,585 | |
| * | Non-income producing security. |
| Ω | Represents the 7-day SEC yield as of December 31, 2017. |
Portfolio Abbreviation:
ADR - American Depositary Receipt
Other Information:
The inputs or methodology used for valuing securities may not be an indication of the risk associated with investing in those securities. For more information on valuation inputs, and their aggregation into the levels used in the table below, please refer to the security valuation section in the accompanying Notes to Financial Statements.
| Valuation Inputs at Reporting Date: |
| Description | | Level 1 | | | Level 2 | | | Level 3 | | | Total | |
| Common Stocks | | $ | 1,781,352,399 | | | $ | — | | | $ | — | | | $ | 1,781,352,399 | |
| Short-Term Investment Fund | | | 61,032,769 | | | | — | | | | — | | | | 61,032,769 | |
| Total | | $ | 1,842,385,168 | | | $ | — | | | $ | — | | | $ | 1,842,385,168 | |
See accompanying Notes to Financial Statements.
Statement of Assets and Liabilities
December 31, 2017
| | | Touchstone | |
| | | Sands Capital | |
| | | Institutional | |
| | | Growth | |
| | | Fund | |
| Assets | | | | |
| Investments, at cost | | $ | 920,774,643 | |
| Investments, at market value | | $ | 1,842,385,168 | |
| Receivable for capital shares sold | | | 3,402,014 | |
| Receivable for investments sold | | | 888,580 | |
| Other assets | | | 22,852 | |
| Total Assets | | | 1,846,698,614 | |
| | | | | |
| Liabilities | | | | |
| Payable for capital shares redeemed | | | 14,138,426 | |
| Payable to Advisor | | | 1,239,710 | |
| Other accrued expenses and liabilities | | | 36,893 | |
| Total Liabilities | | | 15,415,029 | |
| | | | | |
| Net Assets | | $ | 1,831,283,585 | |
| | | | | |
| Net assets consist of: | | | | |
| Paid-in capital | | $ | 884,017,870 | |
| Accumulated net realized gains on investments | | | 25,655,190 | |
| Net unrealized appreciation on investments | | | 921,610,525 | |
| Net assets applicable to shares outstanding | | $ | 1,831,283,585 | |
| | | | | |
| Shares of beneficial interest outstanding (unlimited number of shares authorized, no par value) | | | 89,004,379 | |
| Net asset value, offering price and redemption price per share | | $ | 20.58 | |
See accompanying Notes to Financial Statements.
Statement of Operations
For the Year Ended December 31, 2017
| | | Touchstone | |
| | | Sands Capital | |
| | | Institutional | |
| | | Growth | |
| | | Fund | |
| Investment Income | | | | |
| Dividends(A) | | $ | 2,789,332 | |
| Income from securities loaned | | | 2,823,253 | |
| Total Investment Income | | | 5,612,585 | |
| | | | | |
| Expenses | | | | |
| Unified management fee | | | 16,811,951 | |
| Registration fees | | | 63,746 | |
| Other expenses | | | 321,895 | |
| Total Expenses | | | 17,197,592 | |
| | | | | |
| Net Investment Loss | | | (11,585,007 | ) |
| | | | | |
| Realized and Unrealized Gains on Investments | | | | |
| Net realized gains on investments(B) | | | 474,661,414 | |
| Net change in unrealized appreciation (depreciation) on investments | | | 191,815,965 | |
| | | | | |
| Net Realized and Unrealized Gains on Investments | | | 666,477,379 | |
| | | | | |
| Change in Net Assets Resulting from Operations | | $ | 654,892,372 | |
| | | | | |
| (A) Net of foreign tax withholding of: | | $ | 27,896 | |
(B) The Fund had redemptions-in-kind of securities in the amount of $142,427,347. Net realized gains on investments includes the realized gain on the transactions of $102,878,232 which will not be realized by the Fund for tax purposes.
See accompanying Notes to Financial Statements.
Statements of Changes in Net Assets
| | | Touchstone | |
| | | Sands Capital | |
| | | Institutional | |
| | | Growth | |
| | | Fund | |
| | | For the | | | For the | |
| | | Year | | | Year | |
| | | Ended | | | Ended | |
| | | December 31, | | | December 31, | |
| | | 2017 | | | 2016 | |
| From Operations | | | | | | | | |
| Net investment loss | | $ | (11,585,007 | ) | | $ | (14,071,392 | ) |
| Net realized gains on investments | | | 474,661,414 | | | | 63,066,070 | |
| Net change in unrealized appreciation (depreciation) on investments | | | 191,815,965 | | | | (338,927,057 | ) |
| Change in Net Assets from Operations | | | 654,892,372 | | | | (289,932,379 | ) |
| | | | | | | | | |
| Distributions to Shareholders from: | | | | | | | | |
| Net realized gains | | | (318,541,383 | ) | | | (121,557,240 | ) |
| | | | | | | | | |
| Share Transactions | | | | | | | | |
| Proceeds from shares sold | | | 302,565,905 | | | | 296,156,563 | |
| Reinvestment of distributions | | | 309,245,683 | | | | 118,395,240 | |
| Cost of shares redeemed | | | (1,210,827,843 | ) | | | (1,276,005,461 | ) |
| Change in Net Assets from Share Transactions | | | (599,016,255 | ) | | | (861,453,658 | ) |
| | | | | | | | | |
| Total Increase (Decrease) in Net Assets | | | (262,665,266 | ) | | | (1,272,943,277 | ) |
| | | | | | | | | |
| Net Assets | | | | | | | | |
| Beginning of period | | | 2,093,948,851 | | | | 3,366,892,128 | |
| End of period | | $ | 1,831,283,585 | | | $ | 2,093,948,851 | |
| | | | | | | | | |
| Accumulated Net Investment Income (Loss) | | $ | — | | | $ | — | |
| | | | | | | | | |
| Share Transactions | | | | | | | | |
| Shares issued | | | 13,610,071 | | | | 15,495,843 | |
| Shares reinvested | | | 15,026,515 | | | | 6,331,296 | |
| Shares redeemed | | | (54,071,791 | ) | | | (66,354,054 | ) |
| Change in Shares Outstanding | | | (25,435,205 | ) | | | (44,526,915 | ) |
See accompanying Notes to Financial Statements.
Financial Highlights
| Touchstone Sands Capital Institutional Growth Fund |
| Selected Data for a Share Outstanding Throughout Each Period |
| | | Year Ended December 31, | |
| | | 2017 | | | 2016 | | | 2015 | | | 2014 | | | 2013 | |
| Net asset value at beginning of period | | $ | 18.30 | | | $ | 21.18 | | | $ | 22.25 | | | $ | 22.34 | | | $ | 17.12 | |
| Income (loss) from investment operations: | | | | | | | | | | | | | | | | | | | | |
| Net investment loss | | | (0.13 | ) | | | (0.12 | ) | | | (0.09 | ) | | | (0.08 | ) | | | (0.07 | ) |
| Net realized and unrealized gains (losses) on investments | | | 6.49 | | | | (1.69 | ) | | | 0.13 | | | | 1.93 | | | | 7.06 | |
| Total from investment operations | | | 6.36 | | | | (1.81 | ) | | | 0.04 | | | | 1.85 | | | | 6.99 | |
| Distributions from: | | | | | | | | | | | | | | | | | | | | |
| Net investment income | | | — | | | | — | | | | — | | | | — | | | | (— | )(A) |
| Realized capital gains | | | (4.08 | ) | | | (1.07 | ) | | | (1.11 | ) | | | (1.94 | ) | | | (1.77 | ) |
| Total distributions | | | (4.08 | ) | | | (1.07 | ) | | | (1.11 | ) | | | (1.94 | ) | | | (1.77 | ) |
| Net asset value at end of period | | $ | 20.58 | | | $ | 18.30 | | | $ | 21.18 | | | $ | 22.25 | | | $ | 22.34 | |
| Total return | | | 34.74 | % | | | (8.65 | %) | | | 0.22 | % | | | 8.39 | % | | | 41.28 | % |
| Net assets at end of period (000's) | | $ | 1,831,284 | | | $ | 2,093,949 | | | $ | 3,366,892 | | | $ | 3,914,799 | | | $ | 3,800,645 | |
| Ratio to average net assets: | | | | | | | | | | | | | | | | | | | | |
| Net expenses (including liquidity provider expenses)(B) | | | 0.80 | % | | | 0.79 | % | | | 0.79 | % | | | 0.79 | % | | | 0.80 | % |
| Gross expenses (including liquidity provider expenses)(B) | | | 0.80 | % | | | 0.79 | % | | | 0.79 | % | | | 0.79 | % | | | 0.80 | % |
| Net investment loss | | | (0.54 | %) | | | (0.54 | %) | | | (0.37 | %) | | | (0.35 | %) | | | (0.40 | %) |
| Portfolio turnover rate | | | 20 | %(C) | | | 40 | % | | | 33 | % | | | 27 | % | | | 37 | % |
| (A) | Less than $0.005 per share. |
| (B) | The ratio of net and gross expenses to average net assets excluding liquidity provider expenses was 0.79% for the year ended December 31, 2017. There were no liquidity provider expenses prior to 2017. |
| (C) | Portfolio turnover rate excludes securities delivered from processing redemptions-in-kind. |
See accompanying Notes to Financial Statements.
Notes to Financial Statements
December 31, 2017
1. Organization
The Touchstone Institutional Funds Trust (the “Trust”) is registered under the Investment Company Act of 1940, as amended (the “1940 Act”), as an open-end management investment company. The Trust was established as a Delaware statutory trust pursuant to an Agreement and Declaration of Trust dated May 30, 2002. The Trust consists of one fund, the Touchstone Sands Capital Institutional Growth Fund (“Sands Capital Institutional Growth Fund” or the “Fund”), which is an open-end, non-diversified management investment company.
The Agreement and Declaration of Trust permits the Trust to issue an unlimited number of shares of beneficial interest of the Fund. The Fund offers a single class of shares. The Fund’s prospectus provides a description of the Fund’s investment goals, policies, and strategies along with information on the class of shares currently being offered.
2. Significant Accounting Policies
The following is a summary of the Fund’s significant accounting policies:
The Fund is an investment company that follows the accounting and reporting guidance of Accounting Standards Codification Topic 946 applicable to investment companies.
Security valuation and fair value measurements — U.S. generally accepted accounting principles (“U.S. GAAP”) define fair value as the price the Fund would receive to sell an asset or pay to transfer a liability in an orderly transaction between market participants at the measurement date. All investments in securities are recorded at their fair value. The Fund defines the term “market value”, as used throughout this report, as the estimated fair value. The Fund uses various methods to measure fair value of its portfolio securities on a recurring basis. U.S. GAAP fair value measurement standards require disclosure of a hierarchy that prioritizes inputs to valuation methods.
These inputs are summarized in the three broad levels listed below:
| · | Level 1 – | quoted prices in active markets for identical securities |
| | | |
| · | Level 2 – | other significant observable inputs (including quoted prices for similar securities, interest rates, prepayment speeds, credit risk, etc.) |
| | | |
| · | Level 3 – | significant unobservable inputs (including the Fund’s own assumptions in determining the fair value of investments) |
The inputs or methodology used for valuing securities are not necessarily an indication of the risk associated with investing in those securities.
The aggregate value by input level, as of December 31, 2017, for the Fund’s investments, as well as a reconciliation of assets for which significant unobservable inputs (Level 3) were used in determining value, if applicable, is included in the Fund’s Portfolio of Investments, which also includes a breakdown of the Fund’s investments by sector allocation. The Fund did not hold any Level 3 categorized securities during the year ended December 31, 2017.
Changes in valuation techniques may result in transfers into or out of an investment’s assigned level within the hierarchy. All transfers in and out of the levels are recognized at the value at the end of the period. At December 31, 2017, there were no transfers between Levels 1, 2 and 3 for the Fund.
During the year ended December 31, 2017, there were no material changes to the valuation policies and techniques.
Notes to Financial Statements (Continued)
The Fund’s portfolio securities are valued as of the close of the regular session of trading on the New York Stock Exchange (“NYSE”) (currently 4:00 p.m., Eastern time). Portfolio securities traded on stock exchanges are valued at the last reported sale price, official close price, or last bid price if no sales are reported. Portfolio securities quoted by NASDAQ are valued at the NASDAQ Official Closing Price (“NOCP”) or from the primary exchange on which the security trades. To the extent these securities are actively traded, they are categorized in Level 1 of the fair value hierarchy. Shares of mutual funds in which the Fund invests are valued at their respective net asset values (“NAV”) as reported by the underlying funds (the “Underlying Funds”) and are categorized in Level 1.
Securities mainly traded on a non-U.S. exchange or denominated in foreign currencies are generally valued according to the preceding closing values on that exchange, translated to U.S. dollars using currency exchange rates as of the close of regular trading on the NYSE, and are generally categorized in Level 1. However, if an event that may change the value of a security occurs after the time that the closing value on the non-U.S. exchange was determined, but before the close of regular trading on the NYSE, the security may be priced based on fair value and generally categorized in Level 2. This may cause the value of the security, if held on the books of the Fund, to be different from the closing value on the non-U.S. exchange and may affect the calculation of the Fund’s NAV.
The Fund may use fair value pricing under the following circumstances, among others:
| · | If the value of a security has been materially affected by events occurring before the Fund’s pricing time but after the close of the primary markets on which the security is traded. |
| · | If the exchange on which a portfolio security is principally traded closes early or if trading in a particular portfolio security was halted during the day and did not resume prior to the Fund’s NAV calculation. |
| · | If a security is so thinly traded that reliable market quotations are unavailable due to infrequent trading. |
| · | If the validity of market quotations is not reliable. |
Securities held by the Fund that do not have readily available market quotations, significant observable inputs, or securities for which the available market quotations are not reliable, are priced at their estimated fair value using procedures approved by the Fund’s Board of Trustees and are generally categorized in Level 3.
Investment companies — The Fund may invest in securities of other investment companies, including exchange-traded funds (“ETFs”), open-end funds and closed-end funds. Open-end funds are investment companies that issue new shares continuously and redeem shares daily. Closed-end funds are investment companies that typically issue a fixed number of shares that trade on a securities exchange or over-the-counter (“OTC”). An ETF is an investment company that typically seeks to track the performance of an index by holding in its portfolio shares of all the companies, or a representative sample of the companies, that are components of a particular index. ETF shares are traded on a securities exchange based on their market value. The risks of investment in other investment companies typically reflect the risks of the types of securities in which the other investment companies invest. Investments in ETFs and closed-end funds are subject to the additional risk that their shares may trade at a premium or discount to their NAV. When the Fund invests in another investment company, shareholders of the Fund indirectly bear their proportionate share of the other investment company’s fees and expenses, including operating, registration, trustee, licensing and marketing, as well as their share of the Fund’s fees and expenses.
Portfolio securities loaned — The Fund may lend its portfolio securities. Lending portfolio securities exposes the Fund to the risk that the borrower may fail to return the loaned securities or may not be able to provide additional collateral or that the Fund may experience delays in recovery of the loaned securities or loss of rights in the collateral if the borrower fails financially. To minimize these risks, the borrower must agree to maintain cash collateral with the Fund’s custodian. The loaned securities are secured by collateral valued at least equal, at all times, to the market value of the loaned securities plus accrued interest, if any. When the collateral falls below
Notes to Financial Statements (Continued)
specified amounts, the lending agent will use its best effort to obtain additional collateral on the next business day to meet required amounts under the security lending agreement. The cash collateral is reinvested by the Fund’s custodian into an approved short-term investment vehicle. The approved short-term investment vehicle is subject to market risk.
As of December 31, 2017, the Fund did not have any securities on loan.
All cash collateral is received, held, and administered by the Fund’s custodian for the benefit of the lending Fund in its custody account or other account established for the purpose of holding collateral.
By participating in securities lending, the Fund receives compensation in the form of fees. Securities lending income is derived from lending long securities from the Fund to creditworthy approved borrowers at rates that are determined based on daily trading volumes, float, short-term interest rates and market liquidity and is shown net of fees on the Statement of Operations. When the Fund lends securities, it retains the interest or dividends on the investment of any cash received as collateral, and the Fund continues to receive interest or dividends on the loaned securities.
Unrealized gain or loss on the market value of the loaned securities that may occur during the term of the loan is recognized by the Fund. The Fund has the right under the lending agreement to recover any loaned securities from the borrower on demand.
Share valuation — The NAV per share of the Fund is calculated daily by dividing the total value of the Fund’s assets, less liabilities, by its number of outstanding shares.
Investment income — Dividend income from securities is recognized on the ex-dividend date, net of foreign withholding taxes, if any, which are reduced by any amounts reclaimable by the Fund, where applicable. Interest income from securities is recorded on the basis of interest accrued, premium amortized and discount accreted.
Distributions to shareholders — The Fund intends to distribute to its shareholders substantially all of its income and capital gains. The Fund declares and distributes net investment income, if any, quarterly as a dividend to shareholders. The Fund makes distributions of capital gains, if any, at least annually, net of applicable capital loss carryforwards. Income distributions and capital gain distributions are determined in accordance with income tax regulations. Recognition of the Fund’s net investment income from investments in Underlying Funds is affected by the timing of dividend declarations by the Underlying Funds.
Allocations — Expenses not directly billed to the Fund are allocated proportionally among the Trust and, if applicable, Touchstone Funds Group Trust, Touchstone Strategic Trust and Touchstone Variable Series Trust (collectively with the Trust, “Touchstone Fund Complex”), daily in relation to net assets of each Fund or another reasonable measure.
Security transactions — Security transactions are reflected for financial reporting purposes as of the trade date. Realized gains and losses on sales of portfolio securities are calculated using the identified cost basis.
Estimates — The preparation of financial statements in conformity with U.S. GAAP requires management to make estimates and assumptions that affect the reported amounts of assets and liabilities and disclosure of contingent assets and liabilities at the date of the financial statements and the reported amounts of income and expenses during the reporting period. Actual results could differ from those estimates.
Expenses — The Fund pays a unified management fee to Touchstone Advisors, Inc. (“Advisor” or “Administrator”) for providing or procuring advisory, administration and other services. The Advisor is responsible for compensating any third party engaged to provide services under its supervision and is also responsible for payment of the fees of the independent Trustees, custodian, independent auditor, legal counsel (excluding costs in connection with certain litigation or administrative actions), and the transfer and dividend disbursing agent. The Fund
Notes to Financial Statements (Continued)
will pay all state registration fees, liquidity fees, interest, taxes, dues, fees, or similar costs, brokerage or other transaction costs, and certain extraordinary expenses.
3. Investment Transactions
Investment transactions (excluding short-term investments and U.S. Government securities) were as follows for the year ended December 31, 2017:
| | | Sands Capital | |
| | | Institutional | |
| | | Growth Fund* | |
| Purchases of investment securities | | $ | 410,062,652 | |
| Proceeds from sales and maturities | | $ | 1,183,309,440 | |
* The Fund had redemptions-in-kind of securities in the amount of $142,427,347 which is excluded from the proceeds from sales and maturities.
There were no purchases or proceeds from sales and maturities of U.S. Government securities by the Fund for the year ended December 31, 2017.
4. Transactions with Affiliates and Other Related Parties
Certain officers of the Trust are also officers of the Advisor, Touchstone Securities, Inc. (the “Underwriter”), or The Bank of New York Mellon, the Sub-Administrator to the Fund and BNY Mellon Investment Servicing (U.S.) Inc., the Transfer Agent to the Fund (collectively referenced to herein as “BNY Mellon”). Such officers receive no compensation from the Trust. The Advisor and the Underwriter are each wholly-owned, indirect subsidiaries of Western & Southern Financial Group, Inc.
On behalf of the Fund, the Advisor pays each Independent Trustee a quarterly retainer plus additional retainers to the Lead Independent Trustee and the chairs of each standing committee. Interested Trustees do not receive compensation from the Fund. Each Independent Trustee will also receive compensation for each board meeting and committee meeting attended. Each standing committee chair will receive additional compensation for each committee meeting that he or she oversees.
MANAGEMENT & EXPENSE LIMITATION AGREEMENTS
The Advisor provides general investment supervisory services for the Fund, under terms of a management agreement (the “Advisory Agreement”). Under the Advisory Agreement, the Fund pays the Advisor a fee, which is computed and accrued daily and paid monthly, at an annual rate of 0.78% of the average daily net assets of the Fund. Under the Advisory Agreement, the Advisor also provides administrative services to the Trust and pays all operating expenses on the Trust’s behalf, excluding state registration fees, liquidity fees, interest, taxes, dues, fees, or similar costs, brokerage commissions; other expenditures which are capitalized in accordance with U.S. GAAP; the cost of “Acquired Fund Fees and Expenses”, if any; and other extraordinary expenses not incurred in the ordinary course of business.
The Advisor has entered into an investment sub-advisory agreement with Sands Capital Management, LLC (the “Sub-Advisor”), an investment advisor registered with the SEC. The Advisor, not the Fund, pays sub-advisory fees to the Sub-Advisor.
The Advisor entered into an expense limitation agreement (the “Expense Limitation Agreement”) to contractually limit the annual operating expenses of the Fund, excluding: dividend and interest expenses relating to short sales; interest; taxes; brokerage commissions and other transaction costs; portfolio transaction and investment related expenses including expenses associated with the Fund’s liquidity providers; other expenditures which are capitalized in accordance with U.S. GAAP; the cost of “Acquired Fund Fees and Expenses”, if any; and
Notes to Financial Statements (Continued)
other extraordinary expenses not incurred in the ordinary course of business. The maximum annual operating expense limit in any year with respect to the Fund, as a percentage of the average daily net assets of the Fund, is 0.80%. The Advisor has agreed to waive advisory fees and reimburse expenses in order to maintain the expense limitation for the Fund through at least April 29, 2018. For the year ended December 31, 2017, the Advisor did not waive advisory fees or reimburse any operating expenses.
Under the terms of the Expense Limitation Agreement, the Advisor is entitled to recover, subject to approval by the Fund’s Board, such amounts waived or reimbursed for a period of up to three years from the date on which the Advisor reduced its compensation or assumed expenses for the Fund. No recoupment will occur unless the Fund’s operating expenses are below the expense limitation amount in effect at the time of the waiver or reimbursement and the Fund’s current expense limitation. Since the effective date, the Advisor has not waived or reimbursed any expenses, therefore there are no amounts currently eligible for recoupment.
INTERFUND TRANSACTIONS
The Fund may engage in purchase and sale transactions with funds that have a common investment advisor (or affiliated investment advisors), common Trustees and/or common Officers. During the year ended December 31, 2017, the Fund did not engage in any Rule 17a-7 transactions under the 1940 Act.
5. Liquidity
ReFlow Fund LLC— The Fund may participate in the ReFlow Fund LLC liquidity program (“ReFlow”), which is designed to provide an alternative liquidity source for funds experiencing redemptions. In order to pay cash to shareholders who redeem their shares on a given day, a fund typically must hold cash in its portfolio, liquidate portfolio securities, or borrow money. ReFlow provides participating funds with another source of cash by standing ready to purchase shares from a fund up to the amount of the fund’s net redemptions on a given day, cumulatively limited to 3% of the outstanding voting shares of the Fund. ReFlow then generally redeems those shares when the Fund experiences net sales. In return for this service, the Fund will pay a fee to ReFlow at a rate determined by a daily auction with other participating mutual funds.
During the year ended December 31, 2017, the Fund utilized ReFlow. ReFlow subscribed 4,978,810 shares of the Fund during the year and had redemptions-in-kind of $115,421,257. The resulting fee is recorded in other expenses on the Statement of Operations.
Interfund lending— Pursuant to an Exemptive Order issued by the SEC on March 28, 2017, the Fund, along with certain other funds in the Touchstone Fund Complex, may participate in an interfund lending program. The interfund lending program provides an alternate credit facility that allows the Fund to lend to or borrow from other participating funds in the Touchstone Fund Complex, subject to the conditions of the Exemptive Order. The Fund may not borrow under the facility for leverage purposes and the loan’s duration may be no more than 7 days.
During the year ended December 31, 2017, the program was not utilized.
6. Federal Tax Information
Federal income tax — It is the Fund’s policy to continue to comply with the special provisions of the Internal Revenue Code applicable to regulated investment companies. As provided therein, in any fiscal year in which the Fund so qualifies and distributes at least 90% of its investment company taxable income, the Fund (but not the shareholders) will be relieved of federal income tax on the income distributed. It is the Fund’s policy to distribute all of its taxable income and accordingly, no provision for income taxes has been made.
In order to avoid imposition of the excise tax applicable to regulated investment companies, it is also the Fund’s intention to declare and pay as dividends in each calendar year at least 98% of its investment company taxable
Notes to Financial Statements (Continued)
income (earned during the calendar year) and 98.2% of its net realized capital gains (earned during the twelve months ending October 31) plus undistributed amounts from prior years.
The tax character of distributions paid for the years ended December 31, 2017 and December 31, 2016 are as follows:
| | | Sands Capital | |
| | | Institutional | |
| | | Growth Fund | |
| | | 2017 | | | 2016 | |
| From ordinary income | | $ | 11,922,764 | | | $ | — | |
| From long-term capital gains | | | 306,618,619 | | | | 121,557,240 | |
| Total distributions | | $ | 318,541,383 | | | $ | 121,557,240 | |
The following information is computed on a tax basis for each item as of December 31, 2017:
| | | Sands Capital | |
| | | Institutional | |
| | | Growth Fund | |
| Tax cost of portfolio investments | | $ | 928,375,629 | |
| Gross unrealized appreciation | | | 925,767,387 | |
| Gross unrealized depreciation | | | (11,757,848 | ) |
| Net unrealized appreciation | | | 914,009,539 | |
| Qualified late-year losses | | | (6,837,488 | ) |
| Undistributed long-term capital gains | | | 40,093,664 | |
| Accumulated earnings | | $ | 947,265,715 | |
The difference between the tax cost of portfolio investments and the financial statement cost is primarily due to wash sale loss deferrals.
As of December 31, 2017, the Fund did not have any capital loss carryforwards for federal income tax purposes.
Under current laws, certain capital losses realized after October 31 and ordinary losses realized after December 31 may be deferred (and certain ordinary losses after October and/or December 31 may be deferred) and treated as occurring on the first day of the following fiscal year. For the year ended December 31, 2017, the Fund elected to defer $6,837,488 of realized capital losses.
The Fund has analyzed its tax positions taken on federal income tax returns for all open tax years (tax years ended December 31, 2014 through 2017) and has concluded that no provision for income tax is required in its financial statements.
Certain reclassifications, the result of permanent differences between financial statement and income tax reporting requirements, have been made to the components of capital. These reclassifications have no impact on the net assets or NAV per share of the Fund. The following reclassifications, which are primarily attributed to deemed distributions on shareholder redemptions, current year reclass of net operating losses and in-kind distributions for shareholder redemptions, have been made to the Fund for the year ended December 31, 2017:
| | | | | | Accumulated | | | Accumulated | |
| | | Paid-In | | | Net Investment | | | Net Realized | |
| | | Capital | | | Income(Loss) | | | Gains(Losses) | |
| Sands Capital Institutional Growth Fund | | $ | 145,816,323 | | | $ | 11,585,007 | | | $ | (157,401,330 | ) |
Notes to Financial Statements (Continued)
7. Commitments and Contingencies
The Fund indemnifies the Trust’s officers and Trustees for certain liabilities that might arise from their performance of their duties to the Fund. Additionally, in the normal course of business, the Fund enters into contracts that contain a variety of representations and warranties and which provide general indemnifications. The Fund’s maximum exposure under these arrangements is unknown, as this would involve future claims that may be made against the Fund.
8. Principal Risks
Risks Associated with Concentration — The Fund may invest a high percentage of its assets in specific sectors of the market in order to achieve a potentially greater investment return. As a result, the Fund may be more susceptible to economic, political, and regulatory developments in a particular sector of the market, positive or negative, and may experience increased volatility on the Fund’s NAV and magnified effect on the total return.
Please see the Fund’s prospectus for a complete discussion of this and other risks.
9. Subsequent Events
Subsequent events occurring after the date of this report have been evaluated for potential impact to this report through the date the financial statements were issued. There were no subsequent events that necessitated recognition or disclosure in the Fund’s financial statements.
Report of Independent Registered Public Accounting Firm
To the Shareholders and the Board of Trustees of Touchstone Institutional Funds Trust
Opinion on the Financial Statements
We have audited the accompanying statement of assets and liabilities of Touchstone Institutional Funds Trust (the “Trust”) (comprising the Touchstone Sands Capital Institutional Growth Fund (the “Fund”)), including the portfolio of investments, as of December 31, 2017, and the related statement of operations for the year then ended, the statements of changes in net assets for each of the two years in the period then ended, the financial highlights for each of the five years in the period then ended and the related notes (collectively referred to as the “financial statements”). In our opinion, the financial statements present fairly, in all material respects, the financial position of the Fund comprising Touchstone Institutional Funds Trust at December 31, 2017, the results of its operations for the year then ended, the changes in its net assets for each of the two years in the period then ended and its financial highlights for each of the five years in the period then ended, in conformity with U.S. generally accepted accounting principles.
Basis for Opinion
These financial statements are the responsibility of the Trust’s management. Our responsibility is to express an opinion on the Fund’s financial statements based on our audits. We are a public accounting firm registered with the Public Company Accounting Oversight Board (United States) (“PCAOB”) and are required to be independent with respect to the Trust in accordance with the U.S. federal securities laws and the applicable rules and regulations of the Securities and Exchange Commission and the PCAOB.
We conducted our audits in accordance with the standards of the PCAOB. Those standards require that we plan and perform the audit to obtain reasonable assurance about whether the financial statements are free of material misstatement, whether due to error or fraud. The Trust is not required to have, nor were we engaged to perform, an audit of the Trust’s internal control over financial reporting. As part of our audits, we are required to obtain an understanding of internal control over financial reporting, but not for the purpose of expressing an opinion on the effectiveness of the Trust’s internal control over financial reporting. Accordingly, we express no such opinion.
Our audits included performing procedures to assess the risks of material misstatement of the financial statements, whether due to error or fraud, and performing procedures that respond to those risks. Such procedures included examining, on a test basis, evidence regarding the amounts and disclosures in the financial statements. Our procedures included confirmation of securities owned as of December 31, 2017, by correspondence with the custodian and brokers or by other appropriate auditing procedures where replies from brokers were not received. Our audits also included evaluating the accounting principles used and significant estimates made by management, as well as evaluating the overall presentation of the financial statements. We believe that our audits provide a reasonable basis for our opinion.

We have served as the auditor for one or more Touchstone Investments’ investment companies since 1999.
Cincinnati, Ohio
February 16, 2018
Other Items (Unaudited)
Qualified Dividend Income
Under the Jobs and Growth Tax Relief Reconciliation Act of 2003 (the “Act”), the following percentages of ordinary dividends paid during the fiscal year ended December 31, 2017 are designated as “qualified dividend income,” as defined in the Act, and are subject to reduced tax rates. The Fund intends to pass through the maximum allowable percentage for Form 1099 Div.
| Sands Capital Institutional Growth Fund | | | 21.26 | % |
Dividend Received Deduction
For corporate shareholders, the following ordinary distributions paid during the current fiscal year ended December 31, 2017 qualify for the corporate dividends received deduction. The Fund intends to pass through the maximum allowable percentage.
| Sands Capital Institutional Growth Fund | | | 19.01 | % |
For the fiscal year ended December 31, 2017, the Fund designated $350,739,722 as long-term capital gains.
Proxy Voting Guidelines and Proxy Voting Records
The Sub-Advisor is responsible for exercising the voting rights associated with the securities purchased and held by the Fund. A description of the policies and procedures that the Sub-Advisor uses in fulfilling this responsibility is available as an appendix to the most recent Statement of Additional Information, which can be obtained without charge by calling tollfree 1.800.543.0407 or by visiting the Touchstone website at TouchstoneInvestments.com or on the Securities and Exchange Commission’s (the “Commission”) website at sec.gov. Information regarding how those proxies were voted during the most recent twelve-month period ended June 30 is also available without charge by calling toll free 1.800.543.0407 or on the Commission’s website at sec.gov.
Quarterly Portfolio Disclosure
The Trust files a complete listing of portfolio holdings for the Fund as of the end of the first and third quarters of each fiscal year on Form N-Q. The complete listing (i) is available on the Commission’s website; (ii) may be reviewed and copied at the Commission’s Public Reference Room in Washington, DC; or (iii) will be made available to shareholders upon request by calling 1.800.543.0407. Information on the operation of the Public Reference Room may be obtained by calling 1.800.SEC.0330.
Schedule of Shareholder Expenses
As a shareholder of the Fund, you incur two types of costs: (1) transaction costs, including reinvested dividends or other distributions; and (2) ongoing costs, including investment advisory fees; and other Fund expenses. This example is intended to help you understand your ongoing costs (in dollars) of investing in the Fund and to compare these costs with the ongoing costs of investing in other mutual funds.
The example is based on an investment of $1,000 invested at the beginning of the period and held for the entire period (July 1, 2017 through December 31, 2017).
Actual Expenses
The first line of the table below provides information about actual account values and actual expenses. You may use the information in this line, together with the amount you invested, to estimate the expenses that you paid over the period. Simply divide your account value by $1,000 (for example, an $8,600 account value divided by $1,000 = 8.6), then multiply the result by the number in the first line under the heading entitled “Expenses
Other Items (Unaudited) (Continued)
Paid During the Six Months Ended December 31, 2017” to estimate the expenses you paid on your account during this period.
Hypothetical Example for Comparison Purposes
The second line of the table below provides information about hypothetical account values and hypothetical expenses based on the Fund’s actual expense ratio and an assumed rate of return of 5% per year before expenses, which is not the Fund’s actual return. The hypothetical account values and expenses may not be used to estimate the actual ending account balance or expenses you paid for the period. You may use this information to compare the ongoing costs of investing in the Fund and other funds. To do so, compare this 5% hypothetical example with the 5% hypothetical examples that appear in the shareholder reports of the other funds.
Please note that the expenses shown in the table below are meant to highlight your ongoing costs only and do not reflect any transactional costs, such as sales charges (loads), redemption fees, or exchange fees. Therefore, the second line of the table below is useful in comparing ongoing costs only, and will not help you determine the relative total costs of owning different funds. In addition, if these transactional costs were included, your costs would have been higher.
| | | | | | | | | | | | Expenses | |
| | | Net Expense | | | Beginning | | | Ending | | | Paid During | |
| | | Ratio | | | Account | | | Account | | | the Six Months | |
| | | Annualized | | | Value | | | Value | | | Ended | |
| | | December 31, | | | July 1, | | | December 31, | | | December 31, | |
| | | 2017 | | | 2017 | | | 2017 | | | 2017* | |
| Touchstone Sands Capital Institutional Growth Fund | | | | | | | | | | | | | | | | |
| Actual | | | 0.81 | % | | $ | 1,000.00 | | | $ | 1,105.23 | | | $ | 4.30 | ** |
| Hypothetical | | | 0.81 | % | | $ | 1,000.00 | | | $ | 1,021.22 | | | $ | 4.13 | ** |
| * | Expenses are equal to the Fund's annualized expense ratio, multiplied by the average account value over the period, multiplied by 184/365 (to reflect one-half year period). |
| ** | Excluding liquidity provider expenses, your actual cost of investment in the Fund would be $4.19 and your hypothetical cost of investment in the Fund would be $4.02. |
Management and Sub-Advisory Agreement Approval Disclosure
At a meeting held on November 16, 2017, the Board of Trustees (the “Board” or “Trustees”) of the Touchstone Institutional Funds Trust (the “Trust”), and by a separate vote, the Independent Trustees of the Trust, approved the continuance of the Management Agreement between the Trust and the Advisor with respect to the Fund, and the continuance of the Sub-Advisory Agreement between the Advisor and the Sub-Advisor.
In determining whether to approve the continuation of the Management Agreement and the Sub-Advisory Agreement, the Advisor furnished information necessary for a majority of the Independent Trustees to make the determination that the continuance of the Management Agreement and the Sub-Advisory Agreement was in the best interests of the Fund and its shareholders. The information provided to the Board included: (1) industry data comparing advisory fees and total expense ratios of comparable funds; (2) comparative performance information; (3) the Advisor’s and its affiliates’ revenues and costs of providing services to the Fund; and (4) information about the Advisor’s and Sub-Advisor’s personnel. Prior to voting, the Independent Trustees reviewed the proposed continuance of the Management Agreement and the Sub-Advisory Agreement with management and experienced independent legal counsel and received materials from such counsel discussing the legal standards for their consideration of the proposed continuation of the Management Agreement and the Sub-Advisory Agreement with respect to the Fund. The Independent Trustees also reviewed the proposed continuation of the Management Agreement and the Sub-Advisory Agreement with respect to the Fund with independent legal counsel in private sessions at which no representatives of management were present.
Other Items (Unaudited) (Continued)
In approving the Fund’s Management Agreement, the Board considered various factors, among them: (1) the nature, extent and quality of services provided to the Fund, including the personnel providing such services; (2) the Advisor’s compensation and profitability; (3) a comparison of fees and performance with comparable funds; (4) economies of scale; and (5) the terms of the Management Agreement. The Board’s analysis of these factors is set forth below. The Independent Trustees were advised by independent legal counsel throughout the process.
Nature, Extent and Quality of Advisor Services. The Board considered the level and depth of knowledge of the Advisor, including the professional experience and qualifications of senior personnel. In evaluating the quality of services provided by the Advisor, the Board took into account its familiarity with the Advisor’s senior management through Board meetings, discussions and reports during the preceding year. The Board also took into account the Advisor’s compliance policies and procedures. The quality of administrative and other services, including the Advisor’s role in coordinating the activities of the Fund’s other service providers, was also considered. The Board also considered the Advisor’s relationship with its affiliates and the resources available to them, as well as any potential conflicts of interest.
The Board discussed the Advisor’s effectiveness in monitoring the performance of the Sub-Advisor and the Advisor’s timeliness in responding to performance issues. The Board considered the Advisor’s process for monitoring the Sub-Advisor, which includes an examination of both qualitative and quantitative elements of the Sub-Advisor’s organization, personnel, procedures, investment discipline, infrastructure and performance. The Board considered that the Advisor conducts regular on-site compliance visits with the Sub-Advisor, during which the Advisor examines a wide variety of factors, such as the financial condition of the Sub-Advisor, the quality of the Sub-Advisor’s systems, the effectiveness of the Sub-Advisor’s disaster recovery programs, trade allocation and execution procedures, compliance with the Sub-Advisor’s policies and procedures, results of regulatory examinations and any other factors that might affect the quality of services that the Sub-Advisor provides to the Fund. The Board noted that the Advisor’s compliance monitoring processes also include quarterly reviews of compliance reports, and that any issues arising from such reports and the Advisor’s compliance visits to the Sub-Advisor are reported to the Board.
The Trustees concluded that they were satisfied with the nature, extent and quality of services provided to the Fund by the Advisor under the Management Agreement.
Advisor’s Compensation and Profitability. The Board took into consideration the financial condition and profitability of the Advisor and its affiliates and the direct and indirect benefits derived by the Advisor and its affiliates from the Advisor’s relationship with the Fund. The information considered by the Board included operating profit margin information for the Advisor’s business as a whole. The Board noted that the Advisor pays the Sub-Advisor’s sub-advisory fee out of the advisory fee the Advisor receives from the Fund. The Board reviewed the profitability of the Advisor’s relationship with the Fund both before and after tax expenses, and also considered whether the Advisor has the financial wherewithal to continue to provide services to the Fund, noting the ongoing commitment of the Advisor’s parent company with respect to providing support and resources as needed. The Board also noted that the Advisor derives benefits to its reputation and other benefits from its association with the Fund.
The Board recognized that the Advisor should be entitled to earn a reasonable level of profits in exchange for the level of services it provides to the Fund and the entrepreneurial risk that it assumes as Advisor. Based upon their review, the Trustees concluded that the Advisor’s level of profitability from its relationship with the Fund was reasonable and not excessive.
Expenses and Performance. The Board compared the advisory fee and total expense ratio for the Fund with various comparative data, including the median and average advisory fees and total expense ratios of the Fund’s peer group. The Board also considered, among other data, the Fund’s performance results during the six-month,
Other Items (Unaudited) (Continued)
twelve-month, and thirty-six month periods ended June 30, 2017, and noted that the Board reviews on a quarterly basis detailed information about the Fund’s performance results, portfolio composition and investment strategies. The Board also took into account current market conditions and their effect on the Fund’s performance.
The Board also considered the effect of the Fund’s growth and size on its performance and expenses. The Board noted that the sub-advisory fee under the Sub-Advisory Agreement was paid by the Advisor out of the advisory fee it receives from the Fund and considered the impact of such sub-advisory fee on the profitability of the Advisor. In reviewing the total expense ratio and performance of the Fund, the Board also took into account the nature, extent and quality of the services provided by the Advisor and its affiliates.
The Board considered, among other data, the specific factors and related conclusions set forth below:
Touchstone Sands Capital Institutional Growth Fund. The Fund’s advisory fee and total expense ratio were above the median and at the median, respectively, of its peer group. The Board took into account management’s discussion of the Fund’s expenses and the Fund’s advisory fee structure. The Fund’s performance for the six-month period ended June 30, 2017 was in the 1st quintile of its peer group. The Fund’s performance for the twelve-month period ended June 30, 2017 was in the 3rd quintile of its peer group, and the Fund’s performance for the thirty-six-month period ended June 30, 2017 was in the 5th quintile of its peer group. The Board considered management’s discussion of the Fund’s performance, including both its recent and long-term performance. Based upon their review, the Trustees concluded that the Fund’s overall performance was satisfactory relative to the performance of funds with similar investment objectives and relevant indices, and that the advisory fee was reasonable in light of the services received by the Fund from the Advisor and the other factors considered.
Economies of Scale. The Board considered the effect of the Fund’s current size and potential growth on its performance and expenses. The Board took into account management’s discussion of the Fund’s advisory fee structure. The Board also noted that if the Fund’s assets increased over time, the Fund might realize other economies of scale if assets increased proportionally more than certain other expenses.
Conclusion. In considering the renewal of the Fund’s Management Agreement, the Board, including the Independent Trustees, did not identify any single factor as controlling, and each Trustee may have attributed different weights to the various factors. The Board reached the following conclusions regarding the Fund’s Management Agreement with the Advisor, among others: (a) the Advisor demonstrated that it possesses the capability and resources to perform the duties required of it under the Management Agreement; (b) the Advisor maintains an appropriate compliance program; (c) the Fund’s overall performance is satisfactory relative to the performance of funds with similar investment objectives and relevant indices; and (d) the Fund’s advisory fee is reasonable in light of the services received by the Fund from the Advisor and the other factors considered. Based on their conclusions, the Trustees determined that continuation of the Management Agreement was in the best interests of the Fund and its shareholders.
In approving the Fund’s Sub-Advisory Agreement, the Board considered various factors with respect to the Fund and its Sub-Advisory Agreement, among them: (1) the nature, extent and quality of services provided to the Fund, including the personnel providing such services; (2) the Sub-Advisor’s compensation; (3) a comparison of the sub-advisory fee and performance with comparable funds; and (4) the terms of the Sub-Advisory Agreement. The Board’s analysis of these factors is set forth below. The Independent Trustees were advised by independent legal counsel throughout the process.
Nature, Extent and Quality of Services Provided; Investment Personnel. The Board considered information provided by the Advisor regarding the services provided by the Sub-Advisor, including information presented periodically throughout the previous year. The Board noted that, on a periodic basis, the Board meets with portfolio managers of the Sub-Advisor to discuss their performance and investment processes and strategies. The Board considered
Other Items (Unaudited) (Continued)
the Sub-Advisor’s level of knowledge and investment style. The Board reviewed the experience and credentials of the investment personnel who are responsible for managing the investment of portfolio securities for the Fund.
Sub-Advisor’s Compensation, Profitability and Economies of Scale. The Board also took into consideration the financial condition of the Sub-Advisor and any indirect benefits derived by the Sub-Advisor and its affiliates from the Sub-Advisor’s relationship with the Fund. In considering the profitability to the Sub-Advisor of its relationship with the Fund, the Board noted that the sub-advisory fee under the Sub-Advisory Agreement was paid by the Advisor out of the advisory fee that it receives under the Management Agreement and is negotiated at arms-length. As a consequence, the profitability to the Sub-Advisor of its relationship with the Fund was not a substantial factor in the Board’s deliberations. For similar reasons, the Board did not consider the potential economies of scale in the Sub-Advisor’s management of the Fund to be a substantial factor in its consideration.
Sub-Advisory Fee and Fund Performance. The Board considered that the Fund pays an advisory fee to the Advisor and that the Advisor pays the sub-advisory fee to the Sub-Advisor out of the advisory fee it receives from the Fund. The Board also compared the sub-advisory fee paid by the Advisor to fees charged by the Sub-Advisor to manage comparable institutional separate accounts. The Board considered the amount retained by the Advisor and the sub-advisory fee paid to the Sub-Advisor with respect to the various services provided by the Advisor and the Sub-Advisor. The Board reviewed the sub-advisory fee in relation to various comparative data, including the median and average sub-advisory fees of the Fund’s peer group, and considered the following information:
Touchstone Sands Capital Institutional Growth Fund. The Fund’s sub-advisory fee was above the median of its peer group. Based upon their review, the Trustees concluded that the sub-advisory fee was reasonable in light of the services received by the Fund from the Sub-Advisor and the other factors considered.
As noted above, the Board considered the Fund’s performance during the six-month, twelve-month, and thirty-six month periods ended June 30, 2017, as compared to the Fund’s peer group and noted that the Board reviews on a quarterly basis detailed information about the Fund’s performance results, portfolio composition and investment strategies. The Board also noted the Advisor’s expertise and resources in monitoring the performance, investment style and risk-adjusted performance of the Sub-Advisor. The Board also was mindful of the Advisor’s ongoing monitoring of the Sub-Advisor’s performance.
Conclusion. In considering the renewal of the Sub-Advisory Agreement, the Board, including the Independent Trustees, did not identify any single factor as controlling, and each Trustee may have attributed different weights to the various factors. The Board reached the following conclusions regarding the Sub-Advisory Agreement, among others: (a) the Sub-Advisor is qualified to manage the Fund’s assets in accordance with the Fund’s investment objectives and policies; (b) the Sub-Advisor maintains an appropriate compliance program; (c) the Fund’s overall performance is satisfactory relative to the performance of funds with similar investment objectives and relevant indices; (d) the Fund’s sub-advisory fee is reasonable in light of the services received by the Fund from the Sub-Advisor and the other factors considered; and (e) the Sub-Advisor’s investment strategies are appropriate for pursuing the investment goals of the Fund. Based on its conclusions, the Board determined that approval of the Sub-Advisory Agreement was in the best interests of the Fund and its shareholders.
Management of the Trust (Unaudited)
Listed below is required information regarding the Trustees and principal officers of the Trust. The Trust’s Statement of Additional Information includes additional information about the Trustees and is available, without charge, upon request by calling 1.800.543.0407 or by visiting the Touchstone website at TouchstoneInvestments.com.
| Interested Trustee1: |
| |
| | | | | Number | |
| | | | | of Funds | |
| | | | | Overseen | |
| Name | | Term of | | in the | |
| Address | Position | Office And | | Touchstone | Other |
| Age | Held with | Length of | Principal Occupation(s) | Fund | Directorships |
| Year of Birth | Trust | Time Served | During Past 5 Years | Complex2 | Held During the Past 5 Years3 |
| | | | | | |
Jill T. McGruder
Touchstone Advisors, Inc.
303 Broadway
Suite 1100
Cincinnati, Ohio 45202
Year of Birth: 1955 | Trustee and President | Until retirement at age 75 or until she resigns or is removed Trustee since 1999 | President and CEO of IFS Financial Services, Inc. (a holding company). | 49 | IFS Financial Services, Inc. (a holding company) from 1999 to the present; Integrity and National Integrity Life Insurance Co. from 2005 to the present; Touchstone Securities (the Trust’s distributor) from 1999 to the present; Touchstone Advisors, Inc. (the Trust’s investment advisor and administrator) from 1999 to the present; W&S Brokerage Services (a brokerage company) from 1999 to the present; W&S Financial Group Distributors (a distribution company) from 1999 to the present; Cincinnati Analysts, Inc. from 2012 to the present; Columbus Life Insurance Co. from 2016 to the present; The Lafayette Life Insurance Co. from 2016 to the present; Taft Museum of Art from 2007 to the present; YWCA of Greater Cincinnati from 2012 to the present; and LL Global, Inc. from 2016 to the present. |
| | | | | | |
| Independent Trustees: | | | | | |
| | | | | | |
Phillip R. Cox
c/o Touchstone Advisors, Inc.
303 Broadway
Suite 1100
Cincinnati, Ohio 45202
Year of Birth: 1947 | Trustee | Until retirement at age 75 or until he resigns or is removed Trustee since 1999 | President and Chief Executive Officer of Cox Financial Corp. (a financial services company) from 1971 to the present. | 49 | Director of Cincinnati Bell (a communications company) from 1994 to the present; Bethesda Inc. (a hospital) from 2005 to the present; Timken Co. (a manufacturing company) from 2004 to 2014; TimkenSteel from 2014 to the present; Diebold, Inc. (a technology solutions company) from 2004 to the present; and Ohio Business Alliance for Higher Education and the Economy from 2005 to the present. |
| | | | | | |
William C. Gale
c/o Touchstone Advisors, Inc.
303 Broadway
Suite 1100
Cincinnati, Ohio 45202
Year of Birth: 1952 | Trustee | Until retirement at age 75 or until he resigns or is removed Trustee since 2013 | Retired; formerly Senior Vice President and Chief Financial Officer (from 2003 to January 2015) of Cintas Corporation (a business services company). | 49 | None. |
Management of the Trust (Unaudited) (Continued)
| Independent Trustees (Continued): |
| |
| | | | | Number | |
| | | | | of Funds | |
| | | | | Overseen | |
| | | Term of | | in the | |
| Name | Position(s) | Office And | | Touchstone | Other |
| Address | Held with | Length of | Principal Occupation(s) | Fund | Directorships |
| Year of Birth | Trust | Time Served | During Past 5 Years | Complex2 | Held During the Past 5 Years3 |
| | | | | | |
Susan J. Hickenlooper
c/o Touchstone Advisors, Inc.
303 Broadway
Suite 1100
Cincinnati, Ohio 45202
Year of Birth: 1946 | Trustee | Until retirement at age 75 or until she resigns or is removed Trustee since 2009 | Retired; formerly Financial Analyst for Impact 100 (charitable organization) from November 2012 to 2013. | 49 | Trustee of Diocese of Southern Ohio from 2014 to the present; and Trustee of Cincinnati Parks Foundation from 2000 to 2016. |
| | | | | | |
Kevin A. Robie
c/o Touchstone Advisors, Inc.
303 Broadway
Suite 1100
Cincinnati, Ohio 45202
Year of Birth: 1956 | Trustee | Until retirement at age 75 or until he resigns or is removed Trustee since 2013 | Vice President of Portfolio Management at Soin International LLC (a private multinational holding company) from 2004 to the present. | 49 | SaverSystems, Inc. from 2015 to the present; Director of Buckeye EcoCare, Inc. (a lawn care company) from 2013 to the present; Trustee of Dayton Region New Market Fund, LLC (a private fund) from 2010 to the present; and Trustee of the Entrepreneurs Center, Inc. (a small business incubator) from 2006 to the present. |
| | | | | | |
Edward J. VonderBrink
c/o Touchstone Advisors, Inc.
303 Broadway
Suite 1100
Cincinnati, Ohio 45202
Year of Birth: 1944 | Trustee | Until retirement at age 75 or until he resigns or is removed Trustee since 2013 | Consultant, VonderBrink Consulting LLC from 2000 to the present. | 49 | Director of Streamline Health Solutions, Inc. (healthcare IT) from 2006 to 2015; Mercy Health from 2013 to the present; Mercy Health Foundation (healthcare nonprofit) from 2008 to the present; Al Neyer Inc. (a construction company) from 2013 to the present; and BASCO Shower Door from 2011 to the present. |
| 1 | Ms. McGruder, as a director of the Advisor and the Distributor, and an officer of affiliates of the Advisor and the Distributor, is an “interested person” of the Trust within the meaning of Section 2(a) (19) of the 1940 Act. |
| 2 | As of December 31, 2017, the Touchstone Fund Complex consists of 1 Series of the Trust, 13 series of Touchstone Funds Group Trust, 25 series of Touchstone Strategic Trust, and 10 variable annuity series of Touchstone Variable Series Trust. |
| 3 | Each Trustee is also a Trustee of Touchstone Funds Group Trust, Touchstone Strategic Trust, and Touchstone Variable Series Trust. |
Management of the Trust (Unaudited) (Continued)
| Principal Officers: | | | |
| | | | |
| | | Term of | |
| Name | Position | Office and | |
| Address | Held with | Length of | Principal Occupation(s) |
| Year of Birth | Trust1 | Time Served | During the Past 5 Years |
| | | | |
Jill T. McGruder
Touchstone Advisors, Inc.
303 Broadway
Suite 1100
Cincinnati, Ohio 45202
Year of Birth: 1955 | President and Trustee | Until resignation, removal or disqualification President since 2006 | See biography above. |
| | | | |
Steven M. Graziano
Touchstone Advisors, Inc.
303 Broadway
Suite 1100
Cincinnati, Ohio 45202
Year of Birth: 1954 | Vice President | Until resignation, removal or disqualification Vice President since 2009 | President of Touchstone Advisors, Inc. |
| | | | |
Timothy D. Paulin
Touchstone Advisors, Inc.
303 Broadway
Suite 1100
Cincinnati, Ohio 45202
Year of Birth: 1963 | Vice President | Until resignation, removal or disqualification Vice President since 2010 | Senior Vice President of Investment Research and Product Management of Touchstone Advisors, Inc. |
| | | | |
Timothy S. Stearns
Touchstone Advisors, Inc.
303 Broadway
Suite 1100
Cincinnati, Ohio 45202
Year of Birth: 1963 | Chief Compliance Officer | Until resignation, removal or disqualification Chief Compliance Officer since 2013 | Chief Compliance Officer of Touchstone Advisors, Inc.; Chief Compliance Officer of Envestnet Asset Management, Inc. (2009 to 2013). |
| | | | |
Terrie A. Wiedenheft
Touchstone Advisors, Inc.
303 Broadway
Suite 1100
Cincinnati, Ohio 45202
Year of Birth: 1962 | Controller and Treasurer | Until resignation, removal or disqualification Controller and Treasurer since 2006 | Senior Vice President, Chief Financial Officer and Chief Operations Officer of IFS Financial Services, Inc. (a holding company). |
| | | | |
Ellen Blanchard
The Bank of New York
Mellon
201 Washington Street, 13th
Floor
Boston,
Massachusetts 02108
Year of Birth: 1973 | Secretary | Until resignation, removal or disqualification Secretary since 2015 | Director of The Bank of New York Mellon. |
| 1 | Each officer also holds the same office with Touchstone Funds Group Trust, Touchstone Strategic Trust and Touchstone Variable Series Trust. |
PRIVACY PROTECTION POLICY
We Respect Your Privacy
Thank you for your decision to invest with us. Touchstone and its affiliates have always placed a high value on the trust and confidence our clients place in us. We believe that confidence must be earned and validated through time. In today’s world, when technology allows the sharing of information at light speeds, trust must be reinforced by our sincere pledge to take the steps necessary to ensure that the information you share with us is treated with respect and confidentiality.
Our Pledge to Our Clients
| · | We collect only the information we need to service your account and administer our business. |
| · | We are committed to keeping your information confidential and we place strict limits and controls on the use and sharing of your information. |
| · | We make every effort to ensure the accuracy of your information. |
We Collect the Following Nonpublic Personal Information About You:
| · | Information we receive from you on or in applications or other forms, correspondence, or conversations, including, but not limited to, your name, address, phone number, social security number, assets, income and date of birth; and |
| · | Information about your transactions with us, our affiliates, or others, including, but not limited to, your account number and balance, payment history, parties to transactions, cost basis information, and other financial information. |
Categories of Information We Disclose and Parties to Whom We Disclose
We do not disclose any nonpublic personal information about our current or former clients to nonaffiliated third parties, except as required or permitted by law.
We Place Strict Limits and Controls on the Use and Sharing of Your Information
| · | We restrict access to nonpublic personal information about you to authorized employees who need the information to administer your business. |
| · | We maintain physical, electronic and procedural safeguards that comply with federal standards to protect this information. |
| · | We do not disclose any nonpublic personal information about our current or former clients to anyone, except as required or permitted by law or as described in this document. |
| · | We will not sell your personal information to anyone. |
We May Provide Information to Service Your Account
Sometimes it is necessary to provide information about you to various companies such as transfer agents, custodians, broker-dealers and marketing service firms to facilitate the servicing of your account. These organizations have a legitimate business need to see some of your personal information in order for us to provide service to you. We may disclose to these various companies the information that we collect as described above. We require that these companies, including our own subsidiaries and affiliates, strictly maintain the confidentiality of this information and abide by all applicable laws. Companies within our corporate family that may receive this information are financial service providers and insurance companies. We do not permit these associated companies to sell the information for their own purposes, and we never sell our customer information.
This policy is applicable to the following affiliated companies: Touchstone Funds Group Trust, Touchstone Strategic Trust, Touchstone Variable Series Trust, Touchstone Institutional Funds Trust, Touchstone Securities, Inc.,* and W&S Brokerage Services, Inc.
* Touchstone Securities, Inc. serves as the underwriter to the Touchstone Funds.
A Member of Western & Southern Financial Group®
The Privacy Protection Policy is not part of the Annual Report.


Go paperless, sign up today at:
www.touchstoneinvestments.com
Touchstone Investments
Distributor
Touchstone Securities, Inc.*
303 Broadway
Cincinnati, Ohio 45202-4203
800.638.8194
www.touchstoneinvestments.com
Investment Advisor
Touchstone Advisors, Inc.*
303 Broadway
Cincinnati, Ohio 45202-4203
Transfer Agent
BNY Mellon Investment Servicing (US) Inc.
4400 Computer Drive
Westborough, Massachusetts 01581
Shareholder Service
800.543.0407
* A Member of Western & Southern Financial Group
TSF-1105-TIFT-AR-1712
Item 2. Code of Ethics.
| (a) | The registrant, as of the end of the period covered by this report, has adopted a code of ethics that applies to the registrant’s principal executive officer, principal financial officer, principal accounting officer or controller, or persons performing similar functions, regardless of whether these individuals are employed by the registrant or a third party. |
| (c) | There have been no amendments, during the period covered by this report, to a provision of the code of ethics that applies to the registrant’s principal executive officer, principal financial officer, principal accounting officer or controller, or persons performing similar functions, regardless of whether these individuals are employed by the registrant or a third party, and that relates to any element of the code of ethics description. |
| (d) | The registrant has not granted any waivers, including an implicit waiver, from a provision of the code of ethics that applies to the registrant’s principal executive officer, principal financial officer, principal accounting officer or controller, or persons performing similar functions, regardless of whether these individuals are employed by the registrant or a third party, that relates to one or more of the items set forth in paragraph (b) of this item’s instructions. |
Item 3. Audit Committee Financial Expert.
The registrant’s Board of Trustees has determined that the registrant has at least one audit committee financial expert serving on its audit committee. Mr. William Gale is the registrant’s audit committee financial expert and is an independent trustee within the meaning of the Investment Company Act of 1940, as amended (the “1940 Act”).
Item 4. Principal Accountant Fees and Services.
Audit Fees
| (a) | Audit fees for Touchstone Institutional Funds Trust totaled $15,800 and $15,350 for the fiscal years ended December 31, 2017 and 2016, respectively, including fees associated with the annual audit and filing of Form N-1A and Form N-SAR. |
Audit-Related Fees
| (b) | There were no audit related fees for the fiscal years ended December 31, 2017 and 2016. |
Tax Fees
| (c) | The fees for tax compliance services totaled $3,790 and $3,680 for the fiscal years ended December 31, 2017 and 2016, respectively. The fees relate to the preparation of federal income and excise tax returns and review of capital gains distribution calculations. |
All Other Fees
| (d) | The aggregate fees billed in each of the last two fiscal years ended December 31, 2017 and 2016 for products and services provided by the principal accountant, other than the services reported in paragraphs (a) through (c) of this Item are $354 and $463 for the fiscal years ended December 31, 2017 and 2016, respectively. The fees relate to the PFIC Analyzer subscription. |
| (e)(1) | Disclose the audit committee's pre-approval policies and procedures described in paragraph (c)(7) of Rule 2-01 of Regulation S-X. |
The Audit Committee’s pre-approval policies describe the types of audit, audit-related, tax and other services that have the general pre-approval of the Audit Committee. The pre-approval policies provide that annual audit service fees, tax services not specifically granted pre-approval, services exceeding pre-approved cost levels and other services that have not received general pre-approval will be subject to specific pre-approval by the Audit Committee. The pre-approval policies further provide that the Committee may grant general pre-approval to other audit services (statutory audits and services associated with SEC registration statements, periodic reports and other documents filed with the SEC or other documents issued in connection with securities offerings), audit-related services (accounting consultations related to accounting, financial reporting or disclosure matters not classified as “audit services,” assistance with understanding and implementing new accounting and financial reporting guidance from rulemaking authorities, agreed-upon or expanded audit procedures related to accounting and/or billing records required to respond to or comply with financial, accounting or regulatory reporting matters and assistance with internal control reporting requirements under Form N-SAR and Form N-CSR), tax services that have historically been provided by the auditor that the Committee believes would not impair the independence of the auditor and are consistent with the SEC’s rules on auditor independence and permissible non-audit services classified as “all other services” that are routine and recurring services.
| (e)(2) | All of the services described in paragraphs (c) through (d) of Item 4 were approved by the Audit Committee. |
| (f) | The percentage of hours expended on the principal accountant's engagement to audit the registrant's financial statements for the most recent fiscal year that were attributed to work performed by persons other than the principal accountant's full-time, permanent employees was less than fifty percent. |
| (g) | The aggregate non-audit fees for Touchstone Institutional Funds Trust and certain entities*, totaled approximately $4,144 and $4,143, for the fiscal years ended December 31, 2017 and 2016, respectively. |
* These include the advisors (excluding sub-advisors) and any entity controlling, controlled by or under common control with the advisors that provides ongoing services to the registrant (Funds).
| (h) | The registrant's audit committee of the board of directors has considered whether the provision of non-audit services that were rendered to the registrant's investment adviser (not including any sub-adviser whose role is primarily portfolio management and is subcontracted with or overseen by another investment adviser), and any entity controlling, controlled by, or under common control with the investment adviser that provides ongoing services to the registrant that were not pre-approved pursuant to paragraph (c)(7)(ii) of Rule 2-01 of Regulation S-X is compatible with maintaining the principal accountant's independence. |
Item 5. Audit Committee of Listed Registrants.
Not applicable.
Item 6. Investments.
| (a) | Schedule of Investments in securities of unaffiliated issuers as of the close of the reporting period is included as part of the report to shareholders filed under Item 1 of this form. |
Item 7. Disclosure of Proxy Voting Policies and Procedures for Closed-End Management Investment Companies.
Not applicable.
Item 8. Portfolio Managers of Closed-End Management Investment Companies.
Not applicable.
Item 9. Purchases of Equity Securities by Closed-End Management Investment Company and Affiliated Purchasers.
Not applicable.
Item 10. Submission of Matters to a Vote of Security Holders.
There have been no material changes to the procedures by which the shareholders may recommend nominees to the registrant’s board of trustees, where those changes were implemented after the registrant last provided disclosure in response to the requirements of Item 407(c)(2)(iv) of Regulation S-K (17 CFR 229.407) (as required by Item 22(b)(15) of Schedule 14A (17 CFR 240.14a-101)), or this Item.
Item 11. Controls and Procedures.
| (a) | The registrant’s principal executive and principal financial officers, or persons performing similar functions, have concluded that the registrant’s disclosure controls and procedures (as defined in Rule 30a-3(c) under the Investment Company Act of 1940, as amended (the “1940 Act”) (17 CFR 270.30a-3(c))) are effective, as of a date within 90 days of the filing date of the report that includes the disclosure required by this paragraph, based on their evaluation of these controls and procedures required by Rule 30a-3(b) under the 1940 Act (17 CFR 270.30a-3(b)) and Rules 13a-15(b) or 15d-15(b) under the Securities Exchange Act of 1934, as amended (17 CFR 240.13a-15(b) or 240.15d-15(b)). |
| (b) | There were no changes in the registrant’s internal control over financial reporting (as defined in Rule 30a-3(d) under the 1940 Act (17 CFR 270.30a-3(d))) that occurred during the registrant’s last fiscal quarter that has materially affected, or is reasonably likely to materially affect, the registrant’s internal control over financial reporting. |
Item 12. Disclosure of Securities Lending Activities for Closed-End Management Investment Companies.
Not applicable.
Item 13. Exhibits.
| (a)(1) | Code of ethics, or any amendment thereto, that is the subject of disclosure required by Item 2 is attached hereto. |
| (a)(2) | Certifications pursuant to Rule 30a-2(a) under the 1940 Act and Section 302 of the Sarbanes-Oxley Act of 2002 are attached hereto. |
| (b) | Certifications pursuant to Rule 30a-2(b) under the 1940 Act and Section 906 of the Sarbanes- Oxley Act of 2002 are attached hereto. |
SIGNATURES
Pursuant to the requirements of the Securities Exchange Act of 1934 and the Investment Company Act of 1940, the registrant has duly caused this report to be signed on its behalf by the undersigned, thereunto duly authorized.
(Registrant) Touchstone Institutional Funds Trust
By (Signature and Title)* /s/ Jill T. McGruder
Jill T. McGruder, President
(principal executive officer)
Date 2/28/2018
Pursuant to the requirements of the Securities Exchange Act of 1934 and the Investment Company Act of 1940, this report has been signed below by the following persons on behalf of the registrant and in the capacities and on the dates indicated.
By (Signature and Title)* /s/ Jill T. McGruder
Jill T. McGruder, President
(principal executive officer)
Date 2/28/2018
By (Signature and Title)* /s/ Terrie A. Wiedenheft
Terrie A. Wiedenheft, Controller and Treasurer
(principal financial officer)
Date 2/28/2018
* Print the name and title of each signing officer under his or her signature.