UNITED STATES
SECURITIES AND EXCHANGE COMMISSION
Washington, D.C. 20549
FORM N-CSR
CERTIFIED SHAREHOLDER REPORT OF REGISTERED
MANAGEMENT INVESTMENT COMPANIES
| Investment Company Act file number | 811-21120 | | |
| Conestoga Funds |
| (Exact name of registrant as specified in charter) |
| 550 E. Swedesford Road, Suite 120 Wayne, PA | 19087 |
| (Address of principal executive offices) | (Zip code) |
| Conestoga Capital Advisors 550 E. Swedesford Road, Suite 120 Wayne, PA 19087 |
| (Name and address of agent for service) |
| |
| With Copy To: |
| Josh Deringer, Esq. |
| Faegre Drinker Biddle & Reath LLP |
| One Logan Square, Suite 2000 |
| Philadelphia, PA 19103 |
| Registrant's telephone number, including area code: | (800) 320-7790 | |
| Date of fiscal year end: | September 30 | |
| | | |
| Date of reporting period: | September 30, 2022 | | |
Form N-CSR is to be used by management investment companies to file reports with the Commission not later than 10 days after the transmission to stockholders of any report that is required to be transmitted to stockholders under Rule 30e-1 under the Investment Company Act of 1940 (17 CFR 270.30e-1). The Commission may use the information provided on Form N-CSR in its regulatory, disclosure review, inspection, and policymaking roles. A registrant is required to disclose the information specified by Form N-CSR, and the Commission will make this information public.
A registrant is not required to respond to the collection of information contained in Form N-CSR unless the Form displays a currently valid Office of Management and Budget (“OMB”) control number. Please direct comments concerning the accuracy of the information collection burden estimate and any suggestions for reducing the burden to Secretary, Securities and Exchange Commission, 450 Fifth Street, NW, Washington, DC 20549-0609. The OMB has reviewed this collection of information under the clearance requirements of 44 U.S.C. § 3507.
Item 1. Reports to Stockholders.
Conestoga Funds
SMALL CAP FUND
SMID CAP FUND
MID CAP FUND
MICRO CAP FUND
M a n a g e d B y

ANNUAL REPORT
September 30, 2022
CONESTOGA FUNDS
CHAIRMAN’S LETTER (Unaudited) | November 28, 2022 |
Dear Fellow Shareholders of the Conestoga Funds,
U.S. equity markets have moved sharply lower over the Conestoga Funds’ fiscal year ended September 30, 2022. Inflation has been higher and more persistent than the Federal Reserve forecasted, and they now find themselves playing catch up with increasing interest rates. Higher rates pushed the U.S. dollar significantly higher versus major currencies, and emerging markets’ currencies were hit even harder. There have been few places to hide – bonds, like stocks, have generated negative returns as interest rates move higher.
Investors’ confidence has been shaken by the combination of an uncertain economic outlook and tighter monetary policy. Earnings forecasts for the remainder of 2022 and the full year 2023 have been trimmed (and may need to be reduced further) as the likelihood of a recession rises. Further, continued inflationary pressures are expected to dampen profit margins as companies may be challenged to pass along higher prices to their customers.
The performance of the four Conestoga Funds over the last twelve months has been mixed. Relative to their respective benchmarks, our Micro Cap Fund outperformed, our Small Cap Fund modestly outperformed, and our SMid Cap Fund and Mid Cap Fund modestly underperformed. In the Managers’ Letters that follow, we discuss in detail the factors that led to the relative performance, but broadly speaking, we note that the unusual nature of this downdraft has impacted our results. Surging commodity prices have benefited the sectors that in turn sell these goods and services: Energy, Basic Materials, and Utilities. Meanwhile, the more traditional growth sectors of Technology, Health Care, and Consumer Discretionary have lagged the broad market indices.
Our Conestoga Small Cap Fund remains in soft close and is only available to shareholders and advisors with current investments in the Small Cap Fund. The Small Cap Fund has experienced modest net outflows of just over $50 million over the fiscal year ended September 30, 2022. The SMid Cap Fund received net inflows of $36 million over the fiscal year ended September 30, 2022. Our relatively new Micro Cap Fund and Mid Cap Fund have been mostly flat, with small inflows over the fiscal year ended September 30, 2022. The total net assets of the Conestoga Funds was $3.3 billion as of September 30, 2022.
While the past year has been challenging, I have every confidence in our team at Conestoga. We continue to implement our high-quality and conservative growth investment strategy, and we seek to build on our successful long-term track record.
We thank you for your investment in the Conestoga Funds, it is greatly appreciated.
Sincerely,
Robert M. Mitchell.
Robert M. Mitchell
Chairman and Chief Executive Officer
1
CONESTOGA FUNDS
MANAGER’S LETTER (Unaudited) | November 28, 2022 |
Dear Fellow Shareholders,
A combination of persistent inflation, rising interest rates, recessionary signals and geopolitical uncertainty has put strong downward pressure on equity markets over the Conestoga Funds’ fiscal year ended September 30, 2022. Valuations for growth equities – particularly the traditional growth sectors of Technology, Health Care and Consumer Discretionary – have fallen significantly, impacting the holdings of the Conestoga Funds. Meanwhile, the smaller-weighted Energy, Basic Materials and Utilities sectors have generally outperformed as they are more easily able to pass along the underlying commodity inflation to their customer base.
The uneven performance of small and mid capitalization stocks over the last 12 months has been accompanied by historic levels of volatility. Through the first nine months of 2022, 63% of trading days in the Russell 2000 Index were either up or down more than +/- 1%. Only 2008 has seen more days of positive/negative 1% swings in the index (source: Furey Research Partners). These elevated levels of volatility combined with an unprecedented spike in 10-year Treasury yields, narrow sector leadership, and the recent outperformance of loss-makers has made this an increasingly difficult environment to navigate. The Conestoga Funds have not been immune to this less-than-ideal backdrop for active equity managers. Our Funds have experienced higher-than-usual swings in daily relative performance as evidenced by the number of times the Funds outperform or underperform their respective indices by more than 1% in a single day. We expect this type of market volatility to persist until there is more clarity on when the Fed will pause their current tightening cycle, bond yields begin to normalize, and profitable companies assume market leadership.
While we aspire to outperform in volatile and down markets such as the past year, this has been more challenging in the current environment. Relative to their respective benchmarks, the Conestoga Micro Cap Fund (Micro Cap Fund) outperformed, the Conestoga Small Cap Fund (Small Cap Fund) modestly outperformed, and the Conestoga SMid Cap Fund (SMid Cap Fund) and the Conestoga Mid Cap Fund (Mid Cap Fund) modestly underperformed. We detail the factors behind our relative performance in the sections that follow.
SMALL CAP FUND PERFORMANCE REVIEW
For the twelve months ended September 30, 2022, the Conestoga Small Cap Fund (Investors Class Shares) modestly outperformed the Russell 2000 Growth Index. The Small Cap Fund declined -28.78% versus the Russell 2000 Growth Index decline of -29.27%. Most of the outperformance for the year was due to positive sector allocation effects while stock selection effects were mixed. The biggest contributions to relative performance came from the Technology, Telecommunications and Utilities sectors with Industrials and Energy being the largest laggards.
Stock selection was most positive in the Technology sector with our positions in Model N. Inc. (MODN), Simulations Plus, Inc. (SLP), and Paycor HCM, Inc. (PYCR) being the most additive. MODN has outperformed after noting that the strength in bookings have
2
come from new logos and cross-sells to customers, providing a nice compliment to SaaS transitions, of which there were three new signings during the year. The strategy also benefited from an underweight to the poorly performing semiconductor industry.
Our lone position in the Telecommunications sector, Vocera Communications, Inc. (VCRA), was up sharply after announcing a definitive agreement to be acquired by Stryker Corp. (SYK) in an all-cash transaction for $79.25. This price represented a 27% premium to the prior day’s close. The acquisition closed on February 23, 2022. Utilities was another bright spot in the portfolio with our positions in Casella Waste Systems, Inc. (CWST) and Evoqua Water Technologies Corp. (AQUA) both adding value to the portfolio.
The Industrials sector was the biggest detractor from relative returns with our positions in Trex Company, Inc. (TREX) and Mesa Laboratories, Inc. (MLAB) declining the most. TREX has corrected due to concerns about the housing market given higher interest rates and the pull forward in demand during the pandemic. In addition, our lack of exposure to the strong performing Energy sector was a headwind for relative results.
SMID CAP FUND PERFORMANCE REVIEW
The Conestoga SMid Cap Fund (Investors Class Shares) declined -31.46% over the twelve months ended September 30, 2022. This modestly trails the Russell 2500 Growth Index decline of -29.39%. The underperformance for the year was largely attributable to negative stock selection effects while sector allocation effects were slightly positive. The biggest detractors from relative performance came from the Energy and Health Care sectors with Industrials and Utilities being the largest contributors.
The Fund’s lack of exposure to the Energy sector continues to weigh on relative returns as it was the Index’s best performer for the trailing 12 months and now makes up more than 6% of the benchmark. The SMid Cap Fund has no holdings in the Energy sector. We typically find limited candidates for investment in the types of profitable and sustainable growth companies we seek for the Fund, and we shy away from companies that are dependent on a commodity price input (such as oil or natural gas).
Negative stock selection effects within the Health Care sector were broad-based with 9 of 12 portfolio holdings detracting from relative returns. Neogen Corp. (NEOG), CareDx, Inc. (CDNA), and Definitive Healthcare Corp. (DH) were the biggest laggards. Long-time holding Neogen Corp. (NEOG) was down significantly as earnings declined more than expected and the company continues to work through the operational issues of its food safety business merger with 3M. DH continues to be impacted by macroeconomic factors such as lengthened sales cycles, particularly when signing new business. Demand for the company’s offerings remain strong, but the near-term continues to be impacted by the increased scrutiny on each deal.
On the positive side, the Industrials sector benefited from positive stock selection, particularly from our positions in Jack Henry & Associates, Inc. (JKHY) and Fair Isaac Corp. (FICO). Casella Waste Systems, Inc. (CWST), our lone holding in the Utilities sector, was also additive over the Fund’s fiscal year.
3
MID CAP FUND PERFORMANCE REVIEW
The Conestoga Mid Cap Fund (Investors Class Shares) declined -31.33% over the 12 months ended September 30, 2022. This trailed the Russell Midcap Growth Index return of -29.50%. Sector allocations detracted from relative returns, while stock selection effects were modestly positive.
The lower growth-oriented sectors of the benchmark Russell Midcap Growth Index outperformed over the Fund’s fiscal year, led by the Energy sector, which rose over 40% during the period. While the Energy sector represents less than 5% of the Index, it contributed significantly to return in a sharply down period. The Conestoga Mid Cap Fund has no positions in this sector, which we typically underweight given its slower growth and dependence on an underlying commodity price.
The Health Care sector was the most difficult sector from a stock selection perspective. Our position in Align Technology Inc. (ALGN), maker of the Invisalign clear aligner systems, fell as demand dropped for their elective/non-essential offerings. Other positions in the Health Care sector which lagged the Index Health Care returns included Masimo Corp. (MASI), IDEXX Laboratories Inc. (IDXX), and Teleflex Inc. (TFX). A bright spot in the sector was our long-time position Repligen Corp. (RGEN), which we originally purchased in the Small Cap Fund in 2014.
Stock selection effects were most positive in the Consumer Discretionary sector, led by Rollins Inc. (ROL). The parent company of Orkin Pest Control and Western Pest Services continued to grow its revenues and earnings and benefited from a more recession-proof industry. We originally purchased ROL into the Small Cap Fund nearly 20 years ago, and we are pleased that the stock still has a home in our Mid Cap Fund. Also benefiting relative return in the Consumer Discretionary sector was Tractor Supply Co. (TSCO), a retailer that has delivered better-than-expected revenues and earnings despite a challenging macro environment.
Other better performing sectors include the Utilities, Basic Materials and Consumer Staples sectors, each of which hold companies which benefited from underlying inflation in the goods they sell and/or have more defensive positions. The Mid Cap Fund does have one position in the Utilities sector – Waste Connections Inc. (WCN) – a waste hauler with a strong competitive position.
MICRO CAP FUND PERFORMANCE REVIEW
The Conestoga Micro Cap Fund (Investors Class Shares) outperformed the Russell Microcap Growth Index over the Fund’s fiscal year ended September 30, 2022. The Micro Cap Fund (Investors Class) declined -31.88% versus the Russell Microcap Growth Index decline of -37.06%. We expect our investment strategy to outperform in down markets, and we are pleased that the Micro Cap Fund was able to achieve this goal. The outperformance was largely driven by stock selection, although sector allocations also added to relative return.
Stock selection was strongest in the Telecommunications sector, where the Fund’s two positions both experienced sharp appreciation. Vocera Communications Inc. (VCRA) was acquired by Stryker Corp. (SYK) in an all-cash transaction at a 27% premium to VCRA’s
4
closing price prior to the announcement. Digi International Inc. (DGII) rose over 40% during the third quarter of 2022 after reporting quarterly results which included higher levels of recurring revenue.
The Technology sector also provided significant positive stock selection effects, led by the Fund’s positions in SiTime Corporation (SITM) and Simulations Plus Inc. (SLP). SITM has benefited from the restructuring of the global supply chain, as many manufacturers shift from quartz to the more widely available and scalable silicon timing solutions. Partially offsetting these positive effects was the weaker performance of UserTesting Inc. (USER), which had reported revenue and earnings below investor expectations. We note that USER announced a plan to become a private company in October, after the Fund’s fiscal year-end, and the stock appreciated significantly.
Stock selection proved most challenging in the Health Care sector. Among the laggards was Alpha Teknova Inc. (TKNO) which declined on weaker-than-expected revenues and earnings as its customer base (early-stage biotechnology and pharmaceutical companies) deferred orders due to macroeconomic and funding uncertainty. Health Catalyst Inc. (HCAT), a provider of data analytics to healthcare systems, moved steadily lower over the Fund’s fiscal year as hospitals tighten their budgets. On the positive side, the Fund’s position in IntriCon Corporation (IIN) rose sharply following the announcement of an agreement to be acquired by private equity firm Altaris Capital in the first quarter of 2022.
Our position in Laird Superfood Inc. (LSF), our sole holding in the Consumer Staples sector, also detracted from relative returns over the Fund’s fiscal year. LSF’s use of cash as it seeks to grow its specialty plant-based foods business became a drag on its results and we removed the stock from the Fund in early 2022.
OUR OUTLOOK
With equity markets at multi-year lows and the outlook for the economy uncertain, we remain focused on identifying those companies that we believe can grow their earnings through the business cycle. In our opinion, there is growing reason for optimism for investing in small and mid capitalization stocks. The price-earnings ratio of the Russell 2000 Growth stands near 10-year lows. After underperforming large capitalization stocks for over ten years (largely due to the outsized performance of the mega capitalization FAANG technology stocks), small capitalization stocks’ relative valuation is also at historically low levels. While the economic outlook, inflation, and global events may cause continuing investor frustration in the near- to mid-term, we believe small capitalization stocks are beginning to look much more attractive for long-term investors.
5
On behalf of all the members of Conestoga Capital Advisors, we thank you for your investment in the Funds.
Sincerely,
Robert M. Mitchell, CFA | Joseph F. Monahan III, CFA |
Managing Partner – Co-Portfolio Manager | Managing Partner – Co-Portfolio Manager |
Small and SMid Cap Funds | Small, SMid and Micro Cap Funds |
| | |
Derek S. Johnston, CFA | David R. Neiderer, CFA |
Partner – Co-Portfolio Manager | Partner – Co-Portfolio Manager |
SMid and Mid Cap Funds | Micro Cap Fund |
| | |
Ted Chang | |
Co-Portfolio Manager | |
Mid Cap Fund | |
6
CONESTOGA SMALL CAP FUND - INSTITUTIONAL CLASS
PERFORMANCE INFORMATION
September 30, 2022 (Unaudited) |
Comparison of the Change in Value of a $250,000 Investment in
Conestoga Small Cap Fund – Institutional Class (since inception on 08/13/2014)
versus the Russell 2000® Growth Index

Average Annual Total Returns for the Periods Ended September 30, 2022 |
| | 1 Year | 3 Years | 5 Years | Since
Inception
(8/13/2014) | |
Conestoga Small Cap Fund - Institutional Class | -28.62% | 2.86% | 6.25% | 10.06% | |
Russell 2000® Growth Index | -29.27% | 2.94% | 3.60% | 6.29% | |
The Fund’s past performance does not predict its future performance. The graph and table shown above do not reflect the deduction of taxes that a shareholder would pay on Fund distributions or the redemption of Fund shares but do reflect the reinvestment of all dividends and distributions. The Fund’s benchmark, the Russell 2000® Growth Index, measures the performance of the small-cap growth segment of the U.S. equity universe. It includes those Russell 2000® companies with higher price-to-value ratios and higher forecasted growth values. The Russell 2000® Index measures the performance of the small-cap segment of the U.S. equity universe. The Russell 2000® Index is a subset of the Russell 3000® Index representing approximately 10% of the total market capitalization of that index. It includes approximately 2000 of the smallest securities in the Russell 3000® Index based on a combination of their market capitalization and current index membership.
7
CONESTOGA SMALL CAP FUND - INVESTORS CLASS
PERFORMANCE INFORMATION
September 30, 2022 (Unaudited) |
10 Year Comparison of the Change in Value of a $10,000
Investment in Conestoga Small Cap Fund – Investors Class
versus the Russell 2000® Growth Index

Average Annual Total Returns for the Periods Ended September 30, 2022 |
| | 1 Year | 3 Years | 5 Years | 10 Years | 15 Years | Since
Inception
(10/1/2002) | |
Conestoga Small Cap Fund - Investors Class | -28.78% | 2.65% | 6.03% | 10.98% | 9.06% | 10.74% | |
Russell 2000® Growth Index | -29.27% | 2.94% | 3.60% | 8.81% | 6.82% | 9.60% | |
The Fund’s past performance does not predict its future performance. The graph and table shown above do not reflect the deduction of taxes that a shareholder would pay on Fund distributions or the redemption of Fund shares but do reflect the reinvestment of all dividends and distributions. The Fund’s benchmark, the Russell 2000® Growth Index, measures the performance of the small-cap growth segment of the U.S. equity universe. It includes those Russell 2000® companies with higher price-to-value ratios and higher forecasted growth values. The Russell 2000® Index measures the performance of the small-cap segment of the U.S. equity universe. The Russell 2000® Index is a subset of the Russell 3000® Index representing approximately 10% of the total market capitalization of that index. It includes approximately 2000 of the smallest securities in the Russell 3000® Index based on a combination of their market capitalization and current index membership.
8
CONESTOGA SMID CAP FUND - INSTITUTIONAL CLASS
PERFORMANCE INFORMATION
September 30, 2022 (Unaudited) |
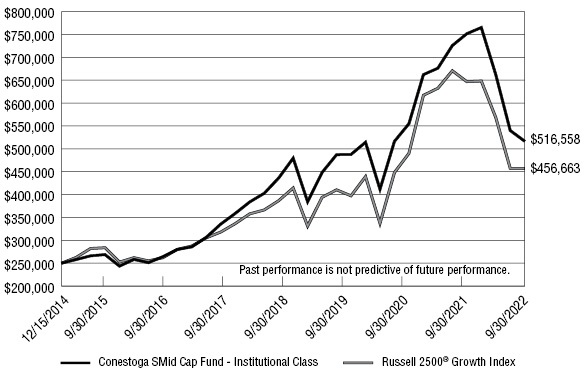
Comparison of the Change in Value of a $250,000 Investment in
Conestoga SMid Cap Fund – Institutional Class (since inception on 12/15/2014)
versus the Russell 2500® Growth Index
Average Annual Total Returns for the Periods Ended September 30, 2022 |
| | 1 Year | 3 Years | 5 Years | Since
Inception
(12/15/2014) | |
Conestoga SMid Cap Fund - Institutional Class | -31.27% | 1.94% | 7.56% | 9.76% | |
Russell 2500® Growth Index | -29.39% | 4.76% | 6.30% | 8.04% | |
The Fund’s past performance does not predict its future performance. The graph and table shown above do not reflect the deduction of taxes that a shareholder would pay on Fund distributions or the redemption of Fund shares but do reflect the reinvestment of all dividends and distributions. The Fund’s benchmark, the Russell 2500® Growth Index, measures the performance of the small- to mid-cap growth segment of the U.S. equity universe. It includes those Russell 2500® companies with higher growth earnings potential as defined by Russell’s leading style methodology. The Russell 2500® Index measures the performance of the small- to mid-cap segment of the U.S. equity universe, commonly referred to as “smid” cap. The Russell 2500® Index is a subset of the Russell 3000® Index. It includes approximately 2500 of the smallest securities in the Russell 3000® Index based on a combination of their market capitalization and current index membership.
9
CONESTOGA SMID CAP FUND - INVESTORS CLASS
PERFORMANCE INFORMATION
September 30, 2022 (Unaudited) |
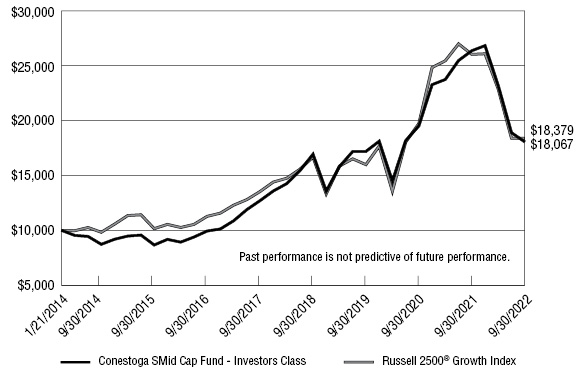
Comparison of the Change in Value of a $10,000 Investment in
Conestoga SMid Cap Fund – Investors Class (since inception on 01/21/2014)
versus the Russell 2500® Growth Index
Average Annual Total Returns for the Periods Ended September 30, 2022 |
| | 1 Year | 3 Years | 5 Years | Since
Inception
(1/21/2014) | |
Conestoga SMid Cap Fund - Investors Class | -31.46% | 1.67% | 7.29% | 7.04% | |
Russell 2500® Growth Index | -29.39% | 4.76% | 6.30% | 7.25% | |
The Fund’s past performance does not predict its future performance. The graph and table shown above do not reflect the deduction of taxes that a shareholder would pay on Fund distributions or the redemption of Fund shares but do reflect the reinvestment of all dividends and distributions. The Fund’s benchmark, the Russell 2500® Growth Index, measures the performance of the small- to mid-cap growth segment of the U.S. equity universe. It includes those Russell 2500® companies with higher growth earnings potential as defined by Russell’s leading style methodology. The Russell 2500® Index measures the performance of the small- to mid-cap segment of the U.S. equity universe, commonly referred to as “smid” cap. The Russell 2500® Index is a subset of the Russell 3000® Index. It includes approximately 2500 of the smallest securities in the Russell 3000® Index based on a combination of their market capitalization and current index membership.
10
CONESTOGA MID CAP FUND - INSTITUTIONAL CLASS
PERFORMANCE INFORMATION
September 30, 2022 (Unaudited) |
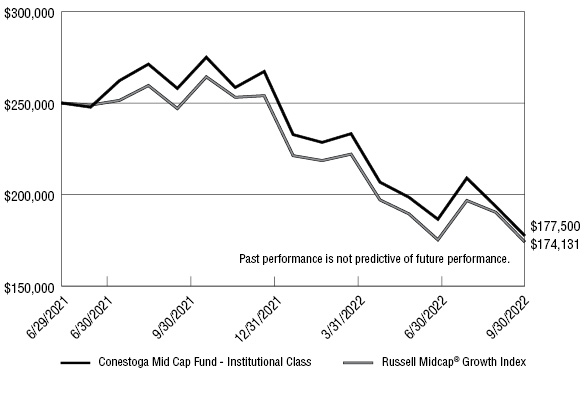
Comparison of the Change in Value of a $250,000 Investment in
Conestoga Mid Cap Fund – Institutional Class (since inception on 6/29/2021)
versus the Russell Midcap® Growth Index
Average Annual Total Returns for the Periods Ended September 30, 2022 |
| | | | 1 Year | Since
Inception
(06/29/2021) | |
Conestoga Mid Cap Fund - Institutional Class | | | -31.20% | -23.89% | |
Russell Midcap® Growth Index | | | -29.50% | -25.04% | |
The Fund’s past performance does not predict its future performance. The graph and table shown above do not reflect the deduction of taxes that a shareholder would pay on Fund distributions or the redemption of Fund shares but do reflect the reinvestment of all dividends and distributions. The Fund’s benchmark, the Russell Midcap® Growth Index, measures the performance of the mid-cap growth segment of the U.S. equity universe. It includes those Russell Midcap® Index companies with higher price-to-book ratios and higher forecasted growth values. The Russell Midcap® Growth Index is constructed to provide a comprehensive and unbiased barometer of the mid-cap growth market. The index is completely reconstituted annually to ensure larger stocks do not distort the performance and characteristics of the true mid-cap growth market.
11
CONESTOGA MID CAP FUND - INVESTORS CLASS
PERFORMANCE INFORMATION
September 30, 2022 (Unaudited) |
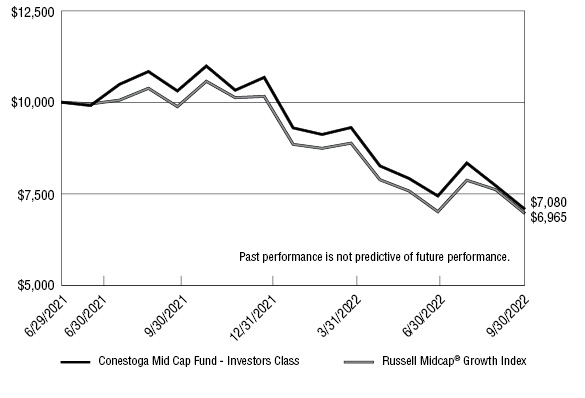
Comparison of the Change in Value of a $10,000 Investment in
Conestoga Mid Cap Fund – Investors Class (since inception on 6/29/2021)
versus the Russell Midcap® Growth Index
Average Annual Total Returns for the Periods Ended September 30, 2022 |
| | | | 1 Year | Since
Inception
(06/29/2021) | |
Conestoga Mid Cap Fund - Investors Class | | | -31.33% | -24.06% | |
Russell Midcap® Growth Index | | | -29.50% | -25.04% | |
The Fund’s past performance does not predict its future performance. The graph and table shown above do not reflect the deduction of taxes that a shareholder would pay on Fund distributions or the redemption of Fund shares but do reflect the reinvestment of all dividends and distributions. The Fund’s benchmark, the Russell Midcap® Growth Index, measures the performance of the mid-cap growth segment of the U.S. equity universe. It includes those Russell Midcap® Index companies with higher price-to-book ratios and higher forecasted growth values. The Russell Midcap® Growth Index is constructed to provide a comprehensive and unbiased barometer of the mid-cap growth market. The index is completely reconstituted annually to ensure larger stocks do not distort the performance and characteristics of the true mid-cap growth market.
12
CONESTOGA MICRO CAP FUND - INSTITUTIONAL CLASS
PERFORMANCE INFORMATION
September 30, 2022 (Unaudited) |
Comparison of the Change in Value of a $250,000 Investment in
Conestoga Micro Cap Fund – Institutional Class (since inception on 11/30/2018)
versus the Russell Microcap® Growth Index
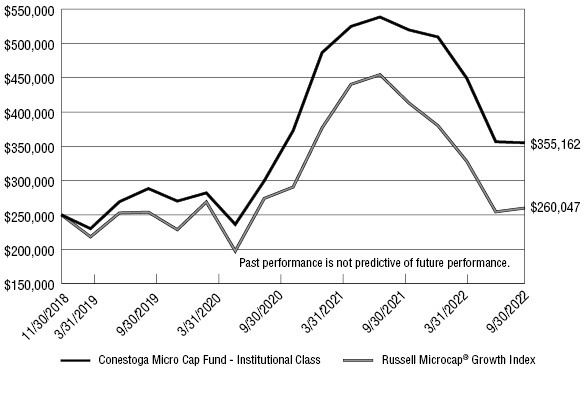
Average Annual Total Returns for the Periods Ended September 30, 2022 |
| | 1 Year | 3 Years | Since
Inception
(11/30/2018) | |
Conestoga Micro Cap Fund - Institutional Class | -31.65% | 9.54% | 9.59% | |
Russell Microcap® Growth Index | -37.06% | 4.40% | 1.03% | |
The Fund commenced operations as a series of Conestoga Funds on December 20, 2021, when all of the assets of Conestoga Micro Cap Fund, LP (the “Predecessor Fund”) transferred to Institutional Class and Investors Class shares of the Fund. The Fund’s investment objectives, policies, guidelines and restrictions are in all material respects equivalent to those of the Predecessor Fund, and the investment adviser and portfolio managers for the Fund are the same as those of the Predecessor Fund. Accordingly, the performance information shown for periods prior to December 20, 2021 is that of the Predecessor Fund. The Predecessor Fund was not registered under the Investment Company Act of 1940, as amended (the “1940 Act”), and thus was not subject to certain investment and operational restrictions that are imposed by the 1940 Act. If the Predecessor Fund had been registered under the 1940 Act, its performance may have been adversely affected. Accordingly, future Fund performance may be different than the Predecessor Fund’s restated past performance. The graph and table shown above do not reflect the deduction of taxes that a shareholder would pay on Fund distributions or the redemption of Fund shares but do reflect the reinvestment of all dividends and distributions. The Fund’s benchmark, the Russell Microcap® Growth Index, measures the performance of those Russell Microcap® companies with higher price-to-book ratios and higher forecasted growth values.
13
CONESTOGA MICRO CAP FUND - INVESTORS CLASS
PERFORMANCE INFORMATION
September 30, 2022 (Unaudited) |
Comparison of the Change in Value of a $10,000 Investment in
Conestoga Micro Cap Fund – Investors Class (since inception on 11/30/2018)
versus the Russell Microcap® Growth Index

Average Annual Total Returns for the Periods Ended September 30, 2022 |
| | 1 Year | 3 Years | Since
Inception
(11/30/2018) | |
Conestoga Micro Cap Fund - Investors Class | -31.88% | 9.23% | 9.29% | |
Russell Microcap® Growth Index | -37.06% | 4.40% | 1.03% | |
The Fund commenced operations as a series of Conestoga Funds on December 20, 2021, when all of the assets of Conestoga Micro Cap Fund, LP (the “Predecessor Fund”) transferred to Institutional Class and Investors Class shares of the Fund. The Fund’s investment objectives, policies, guidelines and restrictions are in all material respects equivalent to those of the Predecessor Fund, and the investment adviser and portfolio managers for the Fund are the same as those of the Predecessor Fund. Accordingly, the performance information shown for periods prior to December 20, 2021 is that of the Predecessor Fund. The Predecessor Fund was not registered under the Investment Company Act of 1940, as amended (the “1940 Act”), and thus was not subject to certain investment and operational restrictions that are imposed by the 1940 Act. If the Predecessor Fund had been registered under the 1940 Act, its performance may have been adversely affected. Accordingly, future Fund performance may be different than the Predecessor Fund’s restated past performance. The graph and table shown above do not reflect the deduction of taxes that a shareholder would pay on Fund distributions or the redemption of Fund shares but do reflect the reinvestment of all dividends and distributions. The Fund’s benchmark, the Russell Microcap® Growth Index, measures the performance of those Russell Microcap® companies with higher price-to-book ratios and higher forecasted growth values.
14
CONESTOGA SMALL CAP FUND
PORTFOLIO HOLDINGS
September 30, 2022 (Unaudited) |
Diversification*
(% of Net Assets)
Top Ten Equity Holdings
Security Description | | % of Net Assets |
Casella Waste Systems, Inc. - Class A | | 4.5% |
Exponent, Inc. | | 4.1% |
SPS Commerce, Inc. | | 4.1% |
Descartes Systems Group, Inc. (The) | | 3.9% |
Model N, Inc. | | 3.8% |
Novanta, Inc. | | 3.3% |
AAON, Inc. | | 3.1% |
Fox Factory Holding Corporation | | 3.0% |
FirstService Corporation | | 3.0% |
Omnicell, Inc. | | 2.8% |
* | Industry categories represent the industry assigned at the time of purchase. See Note 7 of the Notes to Financial Statements. |
15
CONESTOGA SMALL CAP FUND
SCHEDULE OF INVESTMENTS
September 30, 2022 |
COMMON STOCKS — 95.9% | | Shares | | | Value | |
Basic Materials — 6.4% | | | | | | | | |
Metal Fabricting — 3.8% | | | | | | | | |
Omega Flex, Inc. | | | 373,109 | | | $ | 34,557,356 | |
RBC Bearings, Inc. (a) | | | 389,675 | | | | 80,978,362 | |
| | | | | | | | 115,535,718 | |
Specialty Chemicals — 2.6% | | | | | | | | |
Balchem Corporation | | | 638,560 | | | | 77,636,125 | |
| | | | | | | | | |
Consumer Discretionary — 5.2% | | | | | | | | |
Home Improvement Retailers — 2.2% | | | | | | | | |
SiteOne Landscape Supply, Inc. (a) | | | 646,330 | | | | 67,308,806 | |
| | | | | | | | | |
Recreational Products — 3.0% | | | | | | | | |
Fox Factory Holding Corporation (a) | | | 1,146,388 | | | | 90,656,363 | |
| | | | | | | | | |
Consumer Staples — 1.2% | | | | | | | | |
Nondurable Household Products — 1.2% | | | | | | | | |
WD-40 Company | | | 200,351 | | | | 35,209,685 | |
| | | | | | | | | |
Financials — 0.9% | | | | | | | | |
Financial Data Providers — 0.9% | | | | | | | | |
Clearwater Analytics Holdings, Inc. - Class A (a) | | | 1,612,683 | | | | 27,076,948 | |
| | | | | | | | | |
Health Care — 13.0% | | | | | | | | |
Biotechnology — 0.5% | | | | | | | | |
Vericel Corporation (a) | | | 703,540 | | | | 16,322,128 | |
| | | | | | | | | |
Health Care Management Services — 0.7% | | | | | | | | |
National Research Corporation | | | 503,399 | | | | 20,035,280 | |
| | | | | | | | | |
Health Care Services — 2.8% | | | | | | | | |
Omnicell, Inc. (a) | | | 956,105 | | | | 83,209,818 | |
| | | | | | | | | |
Medical Equipment — 6.7% | | | | | | | | |
LeMaitre Vascular, Inc. (b) | | | 1,275,696 | | | | 64,652,273 | |
Merit Medical Systems, Inc. (a) | | | 1,200,295 | | | | 67,828,670 | |
Repligen Corporation (a) | | | 360,810 | | | | 67,511,159 | |
| | | | | | | | 199,992,102 | |
Medical Services — 0.0% (c) | | | | | | | | |
CareDx, Inc. (a) | | | 5,064 | | | | 86,189 | |
16
CONESTOGA SMALL CAP FUND
SCHEDULE OF INVESTMENTS (Continued) |
COMMON STOCKS — 95.9% (Continued) | | Shares | | | Value | |
Health Care — 13.0% (Continued) | | | | | | | | |
Medical Supplies — 2.3% | | | | | | | | |
Neogen Corporation (a) | | | 2,438,566 | | | $ | 34,066,767 | |
Stevanato Group S.p.A. (b) | | | 2,040,000 | | | | 34,557,600 | |
| | | | | | | | 68,624,367 | |
Industrials — 27.7% | | | | | | | | |
Building Materials: Other — 3.7% | | | | | | | | |
Simpson Manufacturing Company, Inc. | | | 856,790 | | | | 67,172,336 | |
Trex Company, Inc. (a) | | | 978,485 | | | | 42,994,631 | |
| | | | | | | | 110,166,967 | |
Building: Climate Control — 3.1% | | | | | | | | |
AAON, Inc. | | | 1,752,325 | | | | 94,415,271 | |
| | | | | | | | | |
Construction — 2.6% | | | | | | | | |
Construction Partners, Inc. - Class A (a)(b) | | | 3,035,866 | | | | 79,630,765 | |
| | | | | | | | | |
Defense — 4.0% | | | | | | | | |
Axon Enterprise, Inc. (a) | | | 573,110 | | | | 66,337,482 | |
Mercury Systems, Inc. (a) | | | 1,313,898 | | | | 53,344,259 | |
| | | | | | | | 119,681,741 | |
Diversified Industrials — 1.7% | | | | | | | | |
ESCO Technologies, Inc. | | | 676,430 | | | | 49,677,019 | |
| | | | | | | | | |
Electronic Equipment: Control & Filter — 1.8% | | | | | | | | |
Helios Technologies, Inc. | | | 1,068,183 | | | | 54,050,060 | |
| | | | | | | | | |
Electronic Equipment: Gauges & Meters — 2.7% | | | | | | | | |
Mesa Laboratories, Inc. (b) | | | 325,555 | | | | 45,847,911 | |
Transcat, Inc. (a)(b) | | | 483,824 | | | | 36,620,639 | |
| | | | | | | | 82,468,550 | |
Engineering & Contracting Services — 4.1% | | | | | | | | |
Exponent, Inc. | | | 1,418,105 | | | | 124,325,265 | |
| | | | | | | | | |
Industrial Suppliers — 1.0% | | | | | | | | |
Hillman Solutions Corporation (a) | | | 3,824,750 | | | | 28,838,615 | |
| | | | | | | | | |
Machinery: Construction & Handling — 1.4% | | | | | | | | |
Douglas Dynamics, Inc. (b) | | | 1,472,915 | | | | 41,271,078 | |
| | | | | | | | | |
Machinery: Industrial — 1.6% | | | | | | | | |
John Bean Technologies Corporation | | | 546,830 | | | | 47,027,380 | |
17
CONESTOGA SMALL CAP FUND
SCHEDULE OF INVESTMENTS (Continued) |
COMMON STOCKS — 95.9% (Continued) | | Shares | | | Value | |
Real Estate — 3.0% | | | | | | | | |
Real Estate Services — 3.0% | | | | | | | | |
FirstService Corporation | | | 750,235 | | | $ | 89,285,467 | |
| | | | | | | | | |
Technology — 32.5% | | | | | | | | |
Computer Services — 2.6% | | | | | | | | |
Computer Services, Inc. | | | 765,289 | | | | 42,664,862 | |
Workiva, Inc. (a) | | | 465,085 | | | | 36,183,613 | |
| | | | | | | | 78,848,475 | |
Consumer Digital Services — 0.7% | | | | | | | | |
Definitive Healthcare Corporation - Class A (a) | | | 1,319,354 | | | | 20,502,761 | |
Shutterstock, Inc. | | | 5,000 | | | | 250,850 | |
| | | | | | | | 20,753,611 | |
Production Technology Equipment — 4.5% | | | | | | | | |
Azenta, Inc. | | | 891,215 | | | | 38,197,475 | |
Novanta, Inc. (a) | | | 844,165 | | | | 97,627,682 | |
| | | | | | | | 135,825,157 | |
Software — 24.7% | | | | | | | | |
Altair Engineering, Inc. - Class A (a) | | | 1,466,230 | | | | 64,836,691 | |
BlackLine, Inc. (a) | | | 969,915 | | | | 58,097,908 | |
Descartes Systems Group, Inc. (The) (a) | | | 1,850,196 | | | | 117,542,952 | |
Model N, Inc. (a)(b) | | | 3,314,719 | | | | 113,462,831 | |
Paycor HCM, Inc. (a) | | | 2,794,930 | | | | 82,618,131 | |
PROS Holdings, Inc. (a) | | | 1,829,665 | | | | 45,192,726 | |
Q2 Holdings, Inc. (a) | | | 1,082,765 | | | | 34,865,033 | |
Simulations Plus, Inc. (b) | | | 1,510,746 | | | | 73,331,611 | |
SPS Commerce, Inc. (a) | | | 999,180 | | | | 124,128,131 | |
Vertex, Inc. - Class A (a) | | | 1,869,290 | | | | 25,553,194 | |
| | | | | | | | 739,629,208 | |
18
CONESTOGA SMALL CAP FUND
SCHEDULE OF INVESTMENTS (Continued) |
COMMON STOCKS — 95.9% (Continued) | | Shares | | | Value | |
Utilities — 6.0% | | | | | | | | |
Waste & Disposal Services — 4.5% | | | | | | | | |
Casella Waste Systems, Inc. - Class A (a) | | | 1,755,035 | | | $ | 134,067,124 | |
| | | | | | | | | |
Water — 1.5% | | | | | | | | |
Evoqua Water Technologies Corporation (a) | | | 1,337,075 | | | | 44,217,070 | |
| | | | | | | | | |
Total Investments at Value — 95.9% (Cost $2,237,490,138) | | | | | | $ | 2,875,872,352 | |
| | | | | | | | | |
Other Assets in Excess of Liabilities — 4.1% | | | | | | | 124,506,911 | |
| | | | | | | | | |
Net Assets — 100.0% | | | | | | $ | 3,000,379,263 | |
(a) | Non-income producing security. |
(b) | The Fund owned 5% or more of the company’s outstanding voting shares thereby making the company an affiliate of the Fund as that term is defined in the Investment Company Act of 1940 (Note 5). |
(c) | Percentage rounds to less than 0.1%. |
Schedule of Investments uses the Russell ICB Industry and Sector classification. |
See accompanying notes to financial statements. |
19
CONESTOGA SMID CAP FUND
PORTFOLIO HOLDINGS
September 30, 2022 (Unaudited) |
Diversification*
(% of Net Assets)

Top Ten Equity Holdings
Security Description | | % of Net Assets |
Casella Waste Systems, Inc. - Class A | | 4.6% |
Exponent, Inc. | | 3.6% |
FirstService Corporation | | 3.5% |
Repligen Corporation | | 3.4% |
Rollins, Inc. | | 3.2% |
Jack Henry & Associates, Inc. | | 3.2% |
Omnicell, Inc. | | 3.0% |
Descartes Systems Group, Inc. (The) | | 2.9% |
Pool Corporation | | 2.8% |
RBC Bearings, Inc. | | 2.8% |
* | Industry categories represent the industry assigned at the time of purchase. See Note 7 of the Notes to Financial Statements. |
20
CONESTOGA SMID CAP FUND
SCHEDULE OF INVESTMENTS
September 30, 2022 |
COMMON STOCKS — 97.0% | | Shares | | | Value | |
Basic Materials — 4.5% | | | | | | | | |
Metal Fabricating — 2.8% | | | | | | | | |
RBC Bearings, Inc. (a) | | | 41,991 | | | $ | 8,726,150 | |
| | | | | | | | | |
Specialty Chemicals — 1.7% | | | | | | | | |
Balchem Corporation | | | 45,185 | | | | 5,493,592 | |
| | | | | | | | | |
Consumer Discretionary — 12.0% | | | | | | | | |
Consumer Services: Miscellaneous — 3.2% | | | | | | | | |
Rollins, Inc. | | | 296,787 | | | | 10,292,573 | |
| | | | | | | | | |
Education Services — 1.3% | | | | | | | | |
Bright Horizons Family Solutions, Inc. (a) | | | 71,145 | | | | 4,101,509 | |
| | | | | | | | | |
Home Improvement Retailers — 1.4% | | | | | | | | |
SiteOne Landscape Supply, Inc. (a) | | | 43,665 | | | | 4,547,273 | |
| | | | | | | | | |
Hotels & Motels — 2.0% | | | | | | | | |
Vail Resorts, Inc. | | | 28,670 | | | | 6,182,399 | |
| | | | | | | | | |
Recreational Products — 2.8% | | | | | | | | |
Pool Corporation | | | 28,095 | | | | 8,940,110 | |
| | | | | | | | | |
Leisure Goods — 1.3% | | | | | | | | |
LCI Industries | | | 38,850 | | | | 3,941,721 | |
| | | | | | | | | |
Financials — 0.9% | | | | | | | | |
Financial Data Providers — 0.9% | | | | | | | | |
Clearwater Analytics Holdings, Inc. - Class A (a) | | | 165,800 | | | | 2,783,782 | |
| | | | | | | | | |
Health Care — 16.2% | | | | | | | | |
Health Care Services — 3.0% | | | | | | | | |
Omnicell, Inc. (a) | | | 108,520 | | | | 9,444,496 | |
| | | | | | | | | |
Medical Equipment — 5.8% | | | | | | | | |
Merit Medical Systems, Inc. (a) | | | 132,108 | | | | 7,465,423 | |
Repligen Corporation (a) | | | 57,440 | | | | 10,747,598 | |
| | | | | | | | 18,213,021 | |
Medical Services — 0.4% | | | | | | | | |
CareDx, Inc. (a) | | | 81,489 | | | | 1,386,943 | |
21
CONESTOGA SMID CAP FUND
SCHEDULE OF INVESTMENTS (Continued) |
COMMON STOCKS — 97.0% (Continued) | | Shares | | | Value | |
Health Care — 16.2% (Continued) | | | | | | | | |
Medical Supplies — 7.0% | | | | | | | | |
Bio-Techne Corporation | | | 23,110 | | | $ | 6,563,240 | |
Neogen Corporation (a) | | | 183,561 | | | | 2,564,347 | |
Stevanato Group S.p.A. | | | 191,120 | | | | 3,237,573 | |
Teleflex, Inc. | | | 22,190 | | | | 4,470,397 | |
West Pharmaceutical Services, Inc. | | | 21,589 | | | | 5,312,621 | |
| | | | | | | | 22,148,178 | |
Industrials — 33.7% | | | | | | | | |
Aerospace — 2.4% | | | | | | | | |
HEICO Corporation - Class A | | | 65,430 | | | | 7,499,587 | |
| | | | | | | | | |
Building Materials: Other — 3.2% | | | | | | | | |
Simpson Manufacturing Company, Inc. | | | 50,000 | | | | 3,920,000 | |
Trex Company, Inc. (a) | | | 144,455 | | | | 6,347,353 | |
| | | | | | | | 10,267,353 | |
Building: Climate Control — 2.3% | | | | | | | | |
Watsco, Inc. | | | 28,005 | | | | 7,210,167 | |
| | | | | | | | | |
Construction — 2.4% | | | | | | | | |
Construction Partners, Inc. - Class A (a) | | | 289,140 | | | | 7,584,142 | |
| | | | | | | | | |
Defense — 4.0% | | | | | | | | |
Axon Enterprise, Inc. (a) | | | 57,720 | | | | 6,681,090 | |
Mercury Systems, Inc. (a) | | | 149,910 | | | | 6,086,346 | |
| | | | | | | | 12,767,436 | |
Electrical Equipment: Gauges & Meters — 1.3% | | | | | | | | |
Cognex Corporation | | | 100,000 | | | | 4,145,000 | |
| | | | | | | | | |
Engineering & Contracting Services — 3.6% | | | | | | | | |
Exponent, Inc. | | | 130,405 | | | | 11,432,606 | |
| | | | | | | | | |
Industrial Suppliers — 1.2% | | | | | | | | |
Hillman Solutions Corporation (a) | | | 515,895 | | | | 3,889,848 | |
| | | | | | | | | |
Machinery: Construction & Handling — 1.6% | | | | | | | | |
Douglas Dynamics, Inc. | | | 176,782 | | | | 4,953,432 | |
| | | | | | | | | |
Machinery: Engines — 0.9% | | | | | | | | |
Generac Holdings, Inc. (a) | | | 16,040 | | | | 2,857,366 | |
22
CONESTOGA SMID CAP FUND
SCHEDULE OF INVESTMENTS (Continued) |
COMMON STOCKS — 97.0% (Continued) | | Shares | | | Value | |
Industrials — 33.7% (Continued) | | | | | | | | |
Machinery: Industrial — 2.9% | | | | | | | | |
EVI Industries, Inc. (a) | | | 270,917 | | | $ | 4,914,434 | |
John Bean Technologies Corporation | | | 48,805 | | | | 4,197,230 | |
| | | | | | | | 9,111,664 | |
Machinery: Specialty — 2.1% | | | | | | | | |
Graco, Inc. | | | 112,915 | | | | 6,769,254 | |
| | | | | | | | | |
Professional Business Support Services — 2.6% | | | | | | | | |
Fair Isaac Corporation (a) | | | 20,295 | | | | 8,361,743 | |
| | | | | | | | | |
Transaction Processing Services — 3.2% | | | | | | | | |
Jack Henry & Associates, Inc. | | | 54,920 | | | | 10,010,268 | |
| | | | | | | | | |
Real Estate — 3.5% | | | | | | | | |
Real Estate Services — 3.5% | | | | | | | | |
FirstService Corporation | | | 93,575 | | | | 11,136,361 | |
| | | | | | | | | |
Technology — 21.6% | | | | | | | | |
Computer Services — 3.1% | | | | | | | | |
Gartner, Inc. (a) | | | 20,840 | | | | 5,766,220 | |
Workiva, Inc. (a) | | | 51,483 | | | | 4,005,377 | |
| | | | | | | | 9,771,597 | |
Consumer Digital Services — 1.2% | | | | | | | | |
Definitive Healthcare Corporation - Class A (a) | | | 257,755 | | | | 4,005,513 | |
| | | | | | | | | |
Production Technology Equipment — 2.5% | | | | | | | | |
Novanta, Inc. (a) | | | 68,645 | | | | 7,938,794 | |
| | | | | | | | | |
Software — 14.8% | | | | | | | | |
Altair Engineering, Inc. - Class A (a) | | | 84,070 | | | | 3,717,576 | |
Descartes Systems Group, Inc. (The) (a) | | | 145,075 | | | | 9,216,615 | |
Five9, Inc. (a) | | | 50,000 | | | | 3,749,000 | |
Guidewire Software, Inc. (a) | | | 69,445 | | | | 4,276,423 | |
Lightspeed Commerce, Inc. (a) | | | 110,000 | | | | 1,933,800 | |
Paycor HCM, Inc. (a) | | | 132,925 | | | | 3,929,263 | |
Q2 Holdings, Inc. (a) | | | 128,105 | | | | 4,124,981 | |
SPS Commerce, Inc. (a) | | | 68,334 | | | | 8,489,133 | |
Tyler Technologies, Inc. (a) | | | 21,205 | | | | 7,368,738 | |
| | | | | | | | 46,805,529 | |
23
CONESTOGA SMID CAP FUND
SCHEDULE OF INVESTMENTS (Continued) |
COMMON STOCKS — 97.0% (Continued) | | Shares | | | Value | |
Utilities — 4.6% | | | | | | | | |
Waste & Disposal Services — 4.6% | | | | | | | | |
Casella Waste Systems, Inc. - Class A (a) | | | 192,505 | | | $ | 14,705,457 | |
| | | | | | | | | |
Total Investments at Value — 97.0% (Cost $293,305,734) | | | | | | $ | 307,424,864 | |
| | | | | | | | | |
Other Assets in Excess of Liabilities — 3.0% | | | | | | | 9,381,043 | |
| | | | | | | | | |
Net Assets — 100.0% | | | | | | $ | 316,805,907 | |
(a) | Non-income producing security. |
Schedule of Investments uses the Russell ICB Industry and Sector classification. |
See accompanying notes to financial statements. |
24
CONESTOGA MID CAP FUND
PORTFOLIO HOLDINGS
September 30, 2022 (Unaudited) |
Diversification*
(% of Net Assets)
Top Ten Equity Holdings
Security Description | | % of Net Assets |
Rollins, Inc. | | 4.6% |
Waste Connections, Inc. | | 4.5% |
CoStar Group, Inc. | | 4.4% |
Copart, Inc. | | 4.3% |
Tyler Technologies, Inc. | | 4.1% |
HEICO Corporation - Class A | | 4.0% |
Gartner, Inc. | | 3.9% |
Jack Henry & Associates, Inc. | | 3.9% |
Verisk Analytics, Inc. | | 3.8% |
Pool Corporation | | 3.7% |
* | Industry categories represent the industry assigned at the time of purchase. See Note 7 of the Notes to Financial Statements. |
25
CONESTOGA MID CAP FUND
SCHEDULE OF INVESTMENTS
September 30, 2022 |
COMMON STOCKS — 98.7% | | Shares | | | Value | |
Consumer Discretionary — 18.1% | | | | | | | | |
Consumer Services: Miscellaneous — 8.9% | | | | | | | | |
Copart, Inc. (a) | | | 720 | | | $ | 76,608 | |
Rollins, Inc. | | | 2,395 | | | | 83,059 | |
| | | | | | | | 159,667 | |
Education Services — 1.5% | | | | | | | | |
Bright Horizons Family Solutions, Inc. (a) | | | 465 | | | | 26,807 | |
| | | | | | | | | |
Hotels & Motels — 2.3% | | | | | | | | |
Vail Resorts, Inc. | | | 195 | | | | 42,050 | |
| | | | | | | | | |
Recreational Products — 3.7% | | | | | | | | |
Pool Corporation | | | 210 | | | | 66,824 | |
| | | | | | | | | |
Specialty Retail — 1.7% | | | | | | | | |
Tractor Supply Company | | | 165 | | | | 30,670 | |
| | | | | | | | | |
Financials — 2.8% | | | | | | | | |
Financial Data Providers- 2.8% | | | | | | | | |
FactSet Research Systems, Inc. | | | 125 | | | | 50,014 | |
| | | | | | | | | |
Health Care — 20.5% | | | | | | | | |
Health Care Services — 3.2% | | | | | | | | |
Veeva Systems, Inc. - Class A (a) | | | 355 | | | | 58,532 | |
| | | | | | | | | |
Medical Equipment — 7.6% | | | | | | | | |
IDEXX Laboratories, Inc. (a) | | | 150 | | | | 48,870 | |
Repligen Corporation (a) | | | 320 | | | | 59,875 | |
STERIS plc | | | 170 | | | | 28,268 | |
| | | | | | | | 137,013 | |
Medical Supplies — 9.7% | | | | | | | | |
Align Technology, Inc. (a) | | | 120 | | | | 24,853 | |
Bio-Techne Corporation | | | 205 | | | | 58,220 | |
Teleflex, Inc. | | | 140 | | | | 28,204 | |
West Pharmaceutical Services, Inc. | | | 255 | | | | 62,751 | |
| | | | | | | | 174,028 | |
Industrials — 23.7% | | | | | | | | |
Aerospace — 4.0% | | | | | | | | |
HEICO Corporation - Class A | | | 625 | | | | 71,638 | |
26
CONESTOGA MID CAP FUND
SCHEDULE OF INVESTMENTS (Continued) |
COMMON STOCKS — 98.7% (Continued) | | Shares | | | Value | |
Industrials — 23.7% (Continued) | | | | | | | | |
Building: Climate Control — 1.7% | | | | | | | | |
Watsco, Inc. | | | 120 | | | $ | 30,895 | |
| | | | | | | | | |
Containers & Packaging — 1.5% | | | | | | | | |
Ball Corporation | | | 570 | | | | 27,542 | |
| | | | | | | | | |
Electronic Equipment: Gauges & Meters — 1.2% | | | | | | | | |
Cognex Corporation | | | 540 | | | | 22,383 | |
| | | | | | | | | |
Electrical Equipment: Pollution Control — 1.5% | | | | | | | | |
Xylem, Inc. | | | 315 | | | | 27,518 | |
| | | | | | | | | |
Machinery: Engines — 1.5% | | | | | | | | |
Generac Holdings, Inc. (a) | | | 150 | | | | 26,721 | |
| | | | | | | | | |
Machinery: Specialty — 3.1% | | | | | | | | |
Graco, Inc. | | | 915 | | | | 54,854 | |
| | | | | | | | | |
Professional Business Support Services — 5.3% | | | | | | | | |
TransUnion | | | 450 | | | | 26,771 | |
Verisk Analytics, Inc. | | | 400 | | | | 68,212 | |
| | | | | | | | 94,983 | |
Transaction Processing Services — 3.9% | | | | | | | | |
Jack Henry & Associates, Inc. | | | 385 | | | | 70,174 | |
| | | | | | | | | |
Real Estate — 4.4% | | | | | | | | |
Real Estate Services — 4.4% | | | | | | | | |
CoStar Group, Inc. (a) | | | 1,135 | | | | 79,053 | |
| | | | | | | | | |
Technology — 24.7% | | | | | | | | |
Computer Services — 3.9% | | | | | | | | |
Gartner, Inc. (a) | | | 255 | | | | 70,556 | |
| | | | | | | | | |
Software — 20.8% | | | | | | | | |
ANSYS, Inc. (a) | | | 255 | | | | 56,534 | |
Avalara, Inc. (a) | | | 200 | | | | 18,360 | |
Coupa Software, Inc. (a) | | | 340 | | | | 19,992 | |
Five9, Inc. (a) | | | 275 | | | | 20,620 | |
Fortinet, Inc. (a) | | | 1,250 | | | | 61,413 | |
Guidewire Software, Inc. (a) | | | 395 | | | | 24,324 | |
27
CONESTOGA MID CAP FUND
SCHEDULE OF INVESTMENTS (Continued) |
COMMON STOCKS — 98.7% (Continued) | | Shares | | | Value | |
Technology — 24.7% (Continued) | | | | | | | | |
Software — 20.8% (Continued) | | | | | | | | |
Lightspeed Commerce, Inc. (a) | | | 1,075 | | | $ | 18,899 | |
Qualtrics International, Inc. - Class A (a) | | | 1,830 | | | | 18,629 | |
Roper Technologies, Inc. | | | 175 | | | | 62,937 | |
Tyler Technologies, Inc. (a) | | | 210 | | | | 72,974 | |
| | | | | | | | 374,682 | |
Utilities — 4.5% | | | | | | | | |
Waste & Disposal Services — 4.5% | | | | | | | | |
Waste Connections, Inc. | | | 595 | | | | 80,402 | |
| | | | | | | | | |
Total Investments at Value — 98.7% (Cost $2,361,572) | | | | | | $ | 1,777,006 | |
| | | | | | | | | |
Other Assets in Excess of Liabilities — 1.3% | | | | | | | 24,465 | |
| | | | | | | | | |
Net Assets — 100.0% | | | | | | $ | 1,801,471 | |
(a) | Non-income producing security. |
Schedule of Investments uses the Russell ICB Industry and Sector classification. |
See accompanying notes to financial statements. |
28
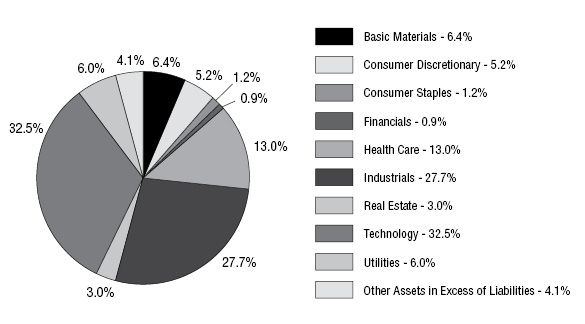
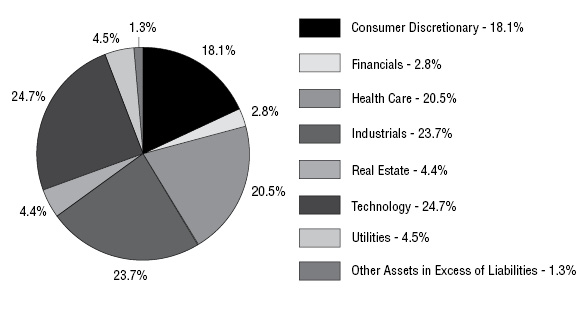
CONESTOGA MICRO CAP FUND
PORTFOLIO HOLDINGS
September 30, 2022 (Unaudited) |
Diversification*
(% of Net Assets)

Top Ten Equity Holdings
Security Description | | % of Net Assets |
Digi International, Inc. | | 5.2% |
Model N, Inc. | | 5.1% |
Palomar Holdings, Inc. | | 4.8% |
NV5 Global, Inc. | | 4.7% |
Transcat, Inc. | | 4.6% |
Construction Partners, Inc. - Class A | | 4.5% |
Computer Services, Inc. | | 4.5% |
BioLife Solutions, Inc. | | 4.2% |
Simulations Plus, Inc. | | 3.8% |
OrthoPediatrics Corporation | | 3.7% |
* | Industry categories represent the industry assigned at the time of purchase. See Note 7 of the Notes to Financial Statements. |
29
CONESTOGA MICRO CAP FUND
SCHEDULE OF INVESTMENTS
September 30, 2022 |
COMMON STOCKS — 98.9% | | Shares | | | Value | |
Basic Materials — 1.9% | | | | | | | | |
Metal Fabricating — 1.9% | | | | | | | | |
Omega Flex, Inc. | | | 471 | | | $ | 43,624 | |
| | | | | | | | | |
Consumer Discretionary — 3.4% | | | | | | | | |
Entertainment — 3.4% | | | | | | | | |
Thunderbird Entertainment Group, Inc. (a) | | | 33,801 | | | | 75,190 | |
| | | | | | | | | |
Financials — 4.8% | | | | | | | | |
Property & Casualty Insurance — 4.8% | | | | | | | | |
Palomar Holdings, Inc. (a) | | | 1,296 | | | | 108,501 | |
| | | | | | | | | |
Health Care — 25.1% | | | | | | | | |
Biotechnology — 8.3% | | | | | | | | |
Alpha Teknova, Inc. (a) | | | 11,311 | | | | 37,779 | |
Codexis, Inc. (a) | | | 4,071 | | | | 24,670 | |
NanoString Technologies, Inc. (a) | | | 4,230 | | | | 54,017 | |
Vericel Corporation (a) | | | 3,049 | | | | 70,737 | |
| | | | | | | | 187,203 | |
Health Care Facilities — 3.1% | | | | | | | | |
U.S. Physical Therapy, Inc. | | | 924 | | | | 70,242 | |
| | | | | | | | | |
Health Care Services — 2.0% | | | | | | | | |
Health Catalyst, Inc. (a) | | | 4,502 | | | | 43,669 | |
| | | | | | | | | |
Medical Equipment — 10.4% | | | | | | | | |
BioLife Solutions, Inc. (a) | | | 4,199 | | | | 95,527 | |
OrthoPediatrics Corporation (a) | | | 1,829 | | | | 84,390 | |
Semler Scientific, Inc. (a) | | | 1,471 | | | | 55,236 | |
| | | | | | | | 235,153 | |
Medical Services — 1.3% | | | | | | | | |
CareDx, Inc. (a) | | | 1,750 | | | | 29,785 | |
| | | | | | | | | |
Industrials — 34.5% | | | | | | | | |
Construction — 4.5% | | | | | | | | |
Construction Partners, Inc. - Class A (a) | | | 3,853 | | | | 101,064 | |
30
CONESTOGA MICRO CAP FUND
SCHEDULE OF INVESTMENTS (Continued) |
COMMON STOCKS — 98.9% (Continued) | | Shares | | | Value | |
Industrials — 34.5% (Continued) | | | | | | | | |
Electronic Equipment: Gauges & Meters — 6.9% | | | | | | | | |
Mesa Laboratories, Inc. | | | 371 | | | $ | 52,248 | |
Transcat, Inc. (a) | | | 1,365 | | | | 103,317 | |
| | | | | | | | 155,565 | |
Engineering & Contracting Services — 2.0% | | | | | | | | |
Willdan Group, Inc. (a) | | | 3,061 | | | | 45,333 | |
| | | | | | | | | |
Industrial Suppliers — 4.1% | | | | | | | | |
CryoPort, Inc. (a) | | | 2,432 | | | | 59,244 | |
Hillman Solutions Corporation (a) | | | 4,520 | | | | 34,081 | |
| | | | | | | | 93,325 | |
Machinery: Construction & Handling — 2.5% | | | | | | | | |
Douglas Dynamics, Inc. | | | 2,047 | | | | 57,357 | |
| | | | | | | | | |
Industrial Suppliers — 7.6% | | | | | | | | |
Montrose Environmental Group, Inc. (a) | | | 1,940 | | | | 65,281 | |
NV5 Global, Inc. (a) | | | 849 | | | | 105,123 | |
| | | | | | | | 170,404 | |
Security Services — 3.5% | | | | | | | | |
ShotSpotter, Inc. (a) | | | 2,740 | | | | 78,802 | |
| | | | | | | | | |
Transaction Processing Services — 3.4% | | | | | | | | |
I3 Verticals, Inc. - Class A (a) | | | 3,852 | | | | 77,156 | |
| | | | | | | | | |
Technology — 24.0% | | | | | | | | |
Industrial Suppliers — 4.5% | | | | | | | | |
Computer Services, Inc. | | | 1,807 | | | | 100,740 | |
| | | | | | | | | |
Software — 19.5% | | | | | | | | |
Model N, Inc. (a) | | | 3,363 | | | | 115,116 | |
Olo, Inc. - Class A (a) | | | 5,765 | | | | 45,544 | |
PROS Holdings, Inc. (a) | | | 3,053 | | | | 75,409 | |
Simulations Plus, Inc. | | | 1,753 | | | | 85,091 | |
TECSYS, Inc. | | | 2,925 | | | | 61,835 | |
UserTesting, Inc. (a) | | | 14,975 | | | | 58,702 | |
| | | | | | | | 441,697 | |
31
CONESTOGA MICRO CAP FUND
SCHEDULE OF INVESTMENTS (Continued) |
COMMON STOCKS — 98.9% (Continued) | | Shares | | | Value | |
Telecommunications — 5.2% | | | | | | | | |
Telecommunications Equipment — 5.2% | | | | | | | | |
Digi International, Inc. (a) | | | 3,405 | | | $ | 117,711 | |
| | | | | | | | | |
Total Investments at Value — 98.9% (Cost $2,435,592) | | | | | | $ | 2,232,521 | |
| | | | | | | | | |
Other Assets in Excess of Liabilities — 1.1% | | | | | | | 25,741 | |
| | | | | | | | | |
Net Assets — 100.0% | | | | | | $ | 2,258,262 | |
(a) | Non-income producing security. |
Schedule of Investments uses the Russell ICB Industry and Sector classification. |
See accompanying notes to financial statements. |
32
CONESTOGA FUNDS
STATEMENTS OF ASSETS AND LIABILITIES
September 30, 2022 |
| | Conestoga
Small Cap Fund | | | Conestoga
SMid Cap Fund | |
ASSETS | | | | | | | | |
Investments in unaffiliated securities, at cost | | $ | 1,796,601,252 | | | $ | 293,305,734 | |
Investments in affiliated securities, at cost | | | 440,888,886 | | | | — | |
Total investments, at cost | | $ | 2,237,490,138 | | | $ | 293,305,734 | |
Investments in unaffiliated securities, at value (Note 2) | | $ | 2,386,497,644 | | | $ | 307,424,864 | |
Investments in affiliated securities, at value (Notes 2 & 5) | | | 489,374,708 | | | | — | |
Total investments, at value | | | 2,875,872,352 | | | | 307,424,864 | |
Cash (Note 2) | | | 131,590,372 | | | | 12,477,770 | |
Receivable for capital shares sold | | | 703,020 | | | | 192,170 | |
Receivable for investment securities sold | | | 444,209 | | | | 2,937,438 | |
Dividends and interest receivable | | | 377,458 | | | | 22,210 | |
Other assets | | | 40,665 | | | | 14,622 | |
Total assets | | | 3,009,028,076 | | | | 323,069,074 | |
| | | | | | | | | |
LIABILITIES | | | | | | | | |
Payable for capital shares redeemed | | | 3,332,555 | | | | 497,503 | |
Payable for investment securities purchased | | | 2,953,329 | | | | 5,487,219 | |
Payable to Adviser (Note 4) | | | 2,066,555 | | | | 162,967 | |
Accrued distribution fees (Note 4) | | | 116,439 | | | | 5,911 | |
Accrued Trustees’ fees (Note 4) | | | 50,175 | | | | 50,175 | |
Payable to administrator (Note 4) | | | 46,898 | | | | 10,217 | |
Other accrued expenses | | | 82,862 | | | | 49,175 | |
Total liabilities | | | 8,648,813 | | | | 6,263,167 | |
| | | | | | | | | |
NET ASSETS | | $ | 3,000,379,263 | | | $ | 316,805,907 | |
| | | | | | | | | |
NET ASSETS CONSIST OF: | | | | | | | | |
Paid-in capital | | $ | 2,263,635,293 | | | $ | 311,985,572 | |
Distributable earnings | | | 736,743,970 | | | | 4,820,335 | |
NET ASSETS | | $ | 3,000,379,263 | | | $ | 316,805,907 | |
| | | | | | | | | |
NET ASSET VALUE PER SHARE: | | | | | | | | |
INSTITUTIONAL CLASS | | | | | | | | |
Net assets applicable to Institutional Class | | $ | 2,358,873,956 | | | $ | 272,623,201 | |
Institutional Class shares of beneficial interest outstanding (unlimited number of shares authorized, no par value) | | | 39,943,448 | | | | 15,183,345 | |
Net asset value, offering price and redemption price per share (Note 2) | | $ | 59.06 | | | $ | 17.96 | |
INVESTORS CLASS | | | | | | | | |
Net assets applicable to Investors Class | | $ | 641,505,307 | | | $ | 44,182,706 | |
Investors Class shares of beneficial interest outstanding (unlimited number of shares authorized, no par value) | | | 11,065,566 | | | | 2,510,307 | |
Net asset value, offering price and redemption price per share (Note 2) | | $ | 57.97 | | | $ | 17.60 | |
See accompanying notes to financial statements. |
33
CONESTOGA FUNDS
STATEMENTS OF ASSETS AND LIABILITIES
September 30, 2022 (Continued) |
| | Conestoga
Mid Cap Fund | | | Conestoga
Micro Cap Fund | |
ASSETS | | | | | | | | |
Investments in unaffiliated securities, at cost | | $ | 2,361,572 | | | $ | 2,435,592 | |
Investments in unaffiliated securities, at value (Note 2) | | $ | 1,777,006 | | | $ | 2,232,521 | |
Cash (Note 2) | | | 80,704 | | | | 70,694 | |
Receivable due from Adviser (Note 4) | | | 13,995 | | | | 9,789 | |
Receivable for capital shares sold | | | 200 | | | | 100 | |
Receivable for investment securities sold | | | 32,498 | | | | 37,653 | |
Dividends and interest receivable | | | 94 | | | | 257 | |
Other assets | | | 13,624 | | | | 4,429 | |
Total assets | | | 1,918,121 | | | | 2,355,443 | |
| | | | | | | | | |
LIABILITIES | | | | | | | | |
Payable for investment securities purchased | | | 74,522 | | | | 57,188 | |
Accrued distribution fees (Note 4) | | | 2,548 | | | | 1,371 | |
Accrued Trustees’ fees (Note 4) | | | 483 | | | | 594 | |
Payable to administrator (Note 4) | | | 6,640 | | | | 4,270 | |
Other accrued expenses | | | 32,457 | | | | 33,758 | |
Total liabilities | | | 116,650 | | | | 97,181 | |
| | | | | | | | | |
NET ASSETS | | $ | 1,801,471 | | | $ | 2,258,262 | |
| | | | | | | | | |
NET ASSETS CONSIST OF: | | | | | | | | |
Paid-in capital | | $ | 2,426,445 | | | $ | 2,514,920 | |
Accumulated deficit | | | (624,974 | ) | | | (256,658 | ) |
NET ASSETS | | $ | 1,801,471 | | | $ | 2,258,262 | |
| | | | | | | | | |
NET ASSET VALUE PER SHARE: | | | | | | | | |
INSTITUTIONAL CLASS | | | | | | | | |
Net assets applicable to Institutional Class | | $ | 1,406,321 | | | $ | 2,074,576 | |
Institutional Class shares of beneficial interest outstanding (unlimited number of shares authorized, no par value) | | | 197,957 | | | | 293,611 | |
Net asset value, offering price and redemption price per share (Note 2) | | $ | 7.10 | | | $ | 7.07 | |
INVESTORS CLASS | | | | | | | | |
Net assets applicable to Investors Class | | $ | 395,150 | | | $ | 183,686 | |
Investors Class shares of beneficial interest outstanding (unlimited number of shares authorized, no par value) | | | 55,809 | | | | 26,046 | |
Net asset value, offering price and redemption price per share (Note 2) | | $ | 7.08 | | | $ | 7.05 | |
See accompanying notes to financial statements. |
34
CONESTOGA FUNDS
STATEMENTS OF OPERATIONS
For the Year Ended September 30, 2022 |
| | Conestoga
Small Cap Fund | | | Conestoga
SMid Cap Fund | |
INVESTMENT INCOME | | | | | | | | |
Dividend income from unaffiliated investments | | $ | 7,331,606 | | | $ | 1,661,860 | |
Dividend income from affiliated investments (Note 5) | | | 3,114,449 | | | | — | |
Foreign withholding taxes on dividends | | | (89,173 | ) | | | (9,656 | ) |
Interest | | | 232,461 | | | | 26,946 | |
Total investment income | | | 10,589,343 | | | | 1,679,150 | |
| | | | | | | | | |
EXPENSES | | | | | | | | |
Investment advisory fees (Note 4) | | | 34,109,594 | | | | 3,254,573 | |
Distribution fees - Investors Class (Note 4) | | | 2,053,133 | | | | 146,221 | |
Shareholder Servicing Fees (Note 4) | | | | | | | | |
Institutional Class | | | 1,484,477 | | | | 247,776 | |
Investors Class | | | 410,639 | | | | 29,245 | |
Trustees’ fees and expenses (Note 4) | | | 199,520 | | | | 199,520 | |
Transfer agent fees (Note 4) | | | 331,726 | | | | 41,230 | |
Fund accounting fees (Note 4) | | | 265,371 | | | | 89,266 | |
Custody and bank service fees | | | 191,409 | | | | 29,998 | |
Registration and filing fees | | | 136,202 | | | | 67,465 | |
Legal fees | | | 92,903 | | | | 92,903 | |
Postage and supplies | | | 105,871 | | | | 15,238 | |
Insurance expense | | | 35,536 | | | | 3,467 | |
Audit and tax services fees | | | 16,000 | | | | 14,500 | |
Shareholder reporting expenses | | | 12,824 | | | | 6,229 | |
Administration fees (Note 4) | | | 3,000 | | | | 3,000 | |
Borrowing expenses | | | 633 | | | | 1,083 | |
Other expenses | | | 21,154 | | | | 16,888 | |
Total expenses | | | 39,469,992 | | | | 4,258,602 | |
Fee reductions and expense reimbursements by the Adviser (Note 4) | | | (3,721,883 | ) | | | (857,808 | ) |
Net expenses | | | 35,748,109 | | | | 3,400,794 | |
| | | | | | | | | |
NET INVESTMENT LOSS | | | (25,158,766 | ) | | | (1,721,644 | ) |
| | | | | | | | | |
REALIZED AND UNREALIZED GAINS (LOSSES) ON INVESTMENTS | | | | | | | | |
Net realized gains (losses) from unaffiliated investments | | | 156,639,891 | | | | (5,628,511 | ) |
Net realized losses from affiliated investments (Note 5) | | | (16,370,774 | ) | | | — | |
Net change in unrealized appreciation (depreciation) on unaffiliated investments | | | (1,277,413,788 | ) | | | (133,534,114 | ) |
Net change in unrealized appreciation (depreciation) on affiliated investments (Note 5) | | | (75,680,351 | ) | | | — | |
NET REALIZED AND UNREALIZED LOSSES ON INVESTMENTS | | | (1,212,825,022 | ) | | | (139,162,625 | ) |
| | | | | | | | | |
NET DECREASE IN NET ASSETS RESULTING FROM OPERATIONS | | $ | (1,237,983,788 | ) | | $ | (140,884,269 | ) |
See accompanying notes to financial statements. |
35
CONESTOGA FUNDS
STATEMENTS OF OPERATIONS
For the Year or Period Ended September 30, 2022 (Continued) |
| | Conestoga
Mid Cap Fund | | | Conestoga
Micro Cap Fund(a) | |
INVESTMENT INCOME | | | | | | | | |
Dividend income from unaffiliated investments | | $ | 7,829 | | | $ | 6,547 | |
Foreign withholding taxes on dividends | | | (67 | ) | | | — | |
Interest | | | 439 | | | | 520 | |
Total investment income | | | 8,201 | | | | 7,067 | |
| | | | | | | | | |
EXPENSES | | | | | | | | |
Legal fees | | | 97,653 | | | | 68,458 | |
Fund accounting fees (Note 4) | | | 38,059 | | | | 28,652 | |
Registration and filing fees | | | 30,605 | | | | 10,688 | |
Investment advisory fees (Note 4) | | | 14,828 | | | | 19,898 | |
Audit and tax services fees | | | 14,736 | | | | 14,000 | |
Transfer agent fees (Note 4) | | | 12,500 | | | | 9,550 | |
Shareholder reporting expenses | | | 4,370 | | | | 7,581 | |
Postage and supplies | | | 3,629 | | | | 2,830 | |
Administration fees (Note 4) | | | 3,000 | | | | 2,371 | |
Trustees’ fees and expenses (Note 4) | | | 1,987 | | | | 2,275 | |
Custody and bank service fees | | | 2,456 | | | | 1,577 | |
Shareholder Servicing Fees (Note 4) | | | | | | | | |
Institutional Class | | | 1,362 | | | | 1,857 | |
Investors Class | | | 246 | | | | 67 | |
Distribution fees - Investors Class (Note 4) | | | 1,229 | | | | 333 | |
Borrowing expenses | | | — | | | | 8 | |
Other expenses | | | 15,961 | | | | 16,600 | |
Total expenses | | | 242,621 | | | | 186,745 | |
Fee reductions and expense reimbursements by the Adviser (Note 4) | | | (226,565 | ) | | | (161,532 | ) |
Net expenses | | | 16,056 | | | | 25,213 | |
| | | | | | | | | |
NET INVESTMENT LOSS | | | (7,855 | ) | | | (18,146 | ) |
| | | | | | | | | |
REALIZED AND UNREALIZED GAINS (LOSSES) ON INVESTMENTS | | | | | | | | |
Net realized losses from unaffiliated investments | | | (34,733 | ) | | | (36,215 | ) |
Net change in unrealized appreciation (depreciation) on unaffiliated investments | | | (621,587 | ) | | | (854,041 | ) |
NET REALIZED AND UNREALIZED LOSSES ON INVESTMENTS | | | (656,320 | ) | | | (890,256 | ) |
| | | | | | | | | |
NET DECREASE IN NET ASSETS RESULTING FROM OPERATIONS | | $ | (664,175 | ) | | $ | (908,402 | ) |
(a) | Represents the period from commencement of operations (December 20, 2021) through September 30, 2022. |
See accompanying notes to financial statements. |
36
CONESTOGA SMALL CAP FUND
STATEMENTS OF CHANGES IN NET ASSETS |
| | Year Ended
September 30,
2022 | | | Year Ended
September 30,
2021 | |
FROM OPERATIONS | | | | | | | | |
Net investment loss | | $ | (25,158,766 | ) | | $ | (29,204,414 | ) |
Net realized gains from investments | | | 140,269,117 | | | | 229,435,633 | |
Net change in unrealized appreciation (depreciation) on investments | | | (1,353,094,139 | ) | | | 962,102,100 | |
Net increase (decrease) in net assets resulting from operations | | | (1,237,983,788 | ) | | | 1,162,333,319 | |
| | | | | | | | | |
DISTRIBUTIONS TO SHAREHOLDERS (Note 2) | | | | | | | | |
Institutional Class | | | (174,426,787 | ) | | | — | |
Investors Class | | | (51,042,164 | ) | | | — | |
Decrease in net assets from distributions to shareholders | | | (225,468,951 | ) | | | — | |
| | | | | | | | | |
CAPITAL SHARE TRANSACTIONS (Note 6) | | | | | | | | |
Institutional Class | | | | | | | | |
Proceeds from shares sold | | | 685,880,670 | | | | 783,876,197 | |
Reinvestment of distributions to shareholders | | | 115,710,799 | | | | — | |
Payments for shares redeemed | | | (683,555,542 | ) | | | (470,707,498 | ) |
Net increase in Institutional Class net assets from capital share transactions | | | 118,035,927 | | | | 313,168,699 | |
| | | | | | | | | |
Investors Class | | | | | | | | |
Proceeds from shares sold | | | 125,440,330 | | | | 118,468,533 | |
Reinvestment of distributions to shareholders | | | 45,633,567 | | | | — | |
Payments for shares redeemed | | | (179,700,944 | ) | | | (248,225,990 | ) |
Net decrease in Investors Class net assets from capital share transactions | | | (8,627,047 | ) | | | (129,757,457 | ) |
| | | | | | | | | |
TOTAL INCREASE (DECREASE) IN NET ASSETS | | | (1,354,043,859 | ) | | | 1,345,744,561 | |
| | | | | | | | |
NET ASSETS | | | | | | | | |
Beginning of year | | | 4,354,423,122 | | | | 3,008,678,561 | |
End of year | | $ | 3,000,379,263 | | | $ | 4,354,423,122 | |
See accompanying notes to financial statements. |
37
CONESTOGA SMID CAP FUND
STATEMENTS OF CHANGES IN NET ASSETS |
| | Year Ended
September 30,
2022 | | | Year Ended
September 30,
2021 | |
FROM OPERATIONS | | | | | | | | |
Net investment loss | | $ | (1,721,644 | ) | | $ | (1,749,829 | ) |
Net realized gains (losses) from investments | | | (5,628,511 | ) | | | 7,623,945 | |
Net change in unrealized appreciation (depreciation) on investments | | | (133,534,114 | ) | | | 87,198,122 | |
Net increase (decrease) in net assets resulting from operations | | | (140,884,269 | ) | | | 93,072,238 | |
| | | | | | | | | |
CAPITAL SHARE TRANSACTIONS (Note 6) | | | | | | | | |
Institutional Class | | | | | | | | |
Proceeds from shares sold | | | 111,657,408 | | | | 144,722,264 | |
Payments for shares redeemed | | | (76,820,766 | ) | | | (51,920,798 | ) |
Net increase in Institutional Class net assets from capital share transactions | | | 34,836,642 | | | | 92,801,466 | |
| | | | | | | | | |
Investors Class | | | | | | | | |
Proceeds from shares sold | | | 31,237,466 | | | | 15,006,418 | |
Payments for shares redeemed | | | (30,051,109 | ) | | | (18,625,647 | ) |
Net increase (decrease) in Investors Class net assets from capital share transactions | | | 1,186,357 | | | | (3,619,229 | ) |
| | | | | | | | | |
TOTAL INCREASE (DECREASE) IN NET ASSETS | | | (104,861,270 | ) | | | 182,254,475 | |
| | | | | | | | | |
NET ASSETS | | | | | | | | |
Beginning of year | | | 421,667,177 | | | | 239,412,702 | |
End of year | | $ | 316,805,907 | | | $ | 421,667,177 | |
See accompanying notes to financial statements. |
38
CONESTOGA MID CAP FUND
STATEMENTS OF CHANGES IN NET ASSETS |
| | Year Ended
September 30,
2022 | | | Period Ended
September 30,
2021(a) | |
FROM OPERATIONS | | | | | | | | |
Net investment loss | | $ | (7,855 | ) | | $ | (2,357 | ) |
Net realized gains (losses) from investments | | | (34,733 | ) | | | 95 | |
Net change in unrealized appreciation (depreciation) on investments | | | (621,587 | ) | | | 37,021 | |
Net increase (decrease) in net assets resulting from operations | | | (664,175 | ) | | | 34,759 | |
| | | | | | | | | |
CAPITAL SHARE TRANSACTIONS (Note 6) | | | | | | | | |
Institutional Class | | | | | | | | |
Proceeds from shares sold | | | 727,504 | | | | 1,145,200 | |
Payments for shares redeemed | | | (1,249 | ) | | | — | |
Net increase in Institutional Class net assets from capital share transactions | | | 726,255 | | | | 1,145,200 | |
| | | | | | | | | |
Investors Class | | | | | | | | |
Proceeds from shares sold | | | 49,000 | | | | 614,658 | |
Payments for shares redeemed | | | (44,626 | ) | | | (59,600 | ) |
Net increase in Investors Class net assets from capital share transactions | | | 4,374 | | | | 555,058 | |
| | | | | | | | | |
TOTAL INCREASE IN NET ASSETS | | | 66,454 | | | | 1,735,017 | |
| | | | | | | | | |
NET ASSETS | | | | | | | | |
Beginning of period | | | 1,735,017 | | | | — | |
End of period | | $ | 1,801,471 | | | $ | 1,735,017 | |
(a) | Represents the period from commencement of operations (June 29, 2021) through September 30, 2021. |
| | |
See accompanying notes to financial statements. |
39
CONESTOGA MICRO CAP FUND
STATEMENT OF CHANGES IN NET ASSETS |
| | Period Ended
September 30,
2022(a) | |
FROM OPERATIONS | | | | |
Net investment loss | | $ | (18,146 | ) |
Net realized losses from investments | | | (36,215 | ) |
Net change in unrealized appreciation (depreciation) on investments | | | (854,041 | ) |
Net decrease in net assets resulting from operations | | | (908,402 | ) |
| | | | | |
CAPITAL SHARE TRANSACTIONS (Note 6) | | | | |
Institutional Class | | | | |
Proceeds from shares sold | | | 148,375 | |
Payments for shares redeemed | | | (15 | ) |
Shares issued in connection with Fund Reorganization (Note 1) | | | 2,777,245 | |
Net increase in Institutional Class net assets from capital share transactions | | | 2,925,605 | |
| | | | | |
Investors Class | | | | |
Proceeds from shares sold | | | 97,357 | |
Payments for shares redeemed | | | (14,117 | ) |
Shares issued in connection with Fund Reorganization (Note 1) | | | 157,819 | |
Net increase in Investors Class net assets from capital share transactions | | | 241,059 | |
| | | | | |
TOTAL INCREASE IN NET ASSETS | | | 2,258,262 | |
| | | | | |
NET ASSETS | | | | |
Beginning of period | | | — | |
End of period | | $ | 2,258,262 | |
(a) | Represents the period from commencement of operations (December 20, 2021) through September 30, 2022. |
| | |
See accompanying notes to financial statements. |
40
CONESTOGA SMALL CAP FUND
INSTITUTIONAL CLASS
FINANCIAL HIGHLIGHTS |
Per Share Data for a Share Outstanding Throughout Each Year: |
| | Year
Ended
Sept. 30,
2022 | | | Year
Ended
Sept. 30,
2021 | | | Year
Ended
Sept. 30,
2020 | | | Year
Ended
Sept. 30,
2019 | | | Year
Ended
Sept. 30,
2018 | |
Net asset value at beginning of year | | $ | 87.18 | | | $ | 63.19 | | | $ | 58.40 | | | $ | 61.27 | | | $ | 50.29 | |
| | | | | | | | | | | | | | | | | | | | | |
Income (loss) from investment operations: | | | | | | | | | | | | | | | | | | | | |
Net investment loss (a) | | | (0.45 | ) | | | (0.56 | ) | | | (0.33 | ) | | | (0.23 | ) | | | (0.19 | ) |
Net realized and unrealized gains (losses) on investments | | | (23.17 | ) | | | 24.55 | | | | 6.39 | | | | (1.93 | ) | | | 13.93 | |
Total from investment operations | | | (23.62 | ) | | | 23.99 | | | | 6.06 | | | | (2.16 | ) | | | 13.74 | |
| | | | | | | | | | | | | | | | | | | | | |
Less distributions from net realized gains | | | (4.50 | ) | | | — | | | | (1.27 | ) | | | (0.71 | ) | | | (2.76 | ) |
| | | | | | | | | | | | | | | | | | | | | |
Net asset value at end of year | | $ | 59.06 | | | $ | 87.18 | | | $ | 63.19 | | | $ | 58.40 | | | $ | 61.27 | |
| | | | | | | | | | | | | | | | | | | | | |
Total return (b) | | | (28.62 | %) | | | 37.96 | % | | | 10.53 | % | | | (3.39 | %) | | | 28.75 | % |
| | | | | | | | | | | | | | | | | | | | | |
Net assets at end of year (000,000’s) | | $ | 2,359 | | | $ | 3,386 | | | $ | 2,204 | | | $ | 1,752 | | | $ | 1,648 | |
| | | | | | | | | | | | | | | | | | | | | |
Ratios/supplementary data: | | | | | | | | | | | | | | | | | | | | |
Ratio of total expenses to average net assets | | | 0.98 | % | | | 0.98 | % | | | 1.00 | % | | | 0.99 | % | | | 0.99 | % |
Ratio of net expenses to average net assets (c) | | | 0.90 | % | | | 0.90 | % | | | 0.90 | % | | | 0.90 | % | | | 0.90 | % |
Ratio of net investment loss to average net assets (c) | | | (0.62 | %) | | | (0.69 | %) | | | (0.56 | %) | | | (0.41 | %) | | | (0.37 | %) |
Portfolio turnover rate | | | 24 | % | | | 19 | % | | | 22 | % | | | 26 | % | | | 9 | % |
(a) | Per share net investment loss has been determined on the basis of average number of shares outstanding during the period. |
(b) | Total return is a measure of the change in value of an investment in the Fund over the periods covered. The returns shown do not reflect the deduction of taxes a shareholder would pay on Fund distributions, if any, or the redemption of Fund shares. The total returns would be lower if the Adviser had not reduced advisory fees and/or reimbursed expenses (Note 4). |
(c) | Ratio was determined after advisory fee reductions and/or expense reimbursements (Note 4). |
| | |
See accompanying notes to financial statements. |
41
CONESTOGA SMALL CAP FUND
INVESTORS CLASS
FINANCIAL HIGHLIGHTS |
Per Share Data for a Share Outstanding Throughout Each Year: |
| | Year
Ended
Sept. 30,
2022 | | | Year
Ended
Sept. 30,
2021 | | | Year
Ended
Sept. 30,
2020 | | | Year
Ended
Sept. 30,
2019 | | | Year
Ended
Sept. 30,
2018 | |
Net asset value at beginning of year | | $ | 85.83 | | | $ | 62.33 | | | $ | 57.74 | | | $ | 60.70 | | | $ | 49.95 | |
| | | | | | | | | | | | | | | | | | | | | |
Income (loss) from investment operations: | | | | | | | | | | | | | | | | | | | | |
Net investment loss (a) | | | (0.59 | ) | | | (0.70 | ) | | | (0.44 | ) | | | (0.33 | ) | | | (0.30 | ) |
Net realized and unrealized gains (losses) on investments | | | (22.77 | ) | | | 24.20 | | | | 6.30 | | | | (1.92 | ) | | | 13.81 | |
Total from investment operations | | | (23.36 | ) | | | 23.50 | | | | 5.86 | | | | (2.25 | ) | | | 13.51 | |
| | | | | | | | | | | | | | | | | | | | | |
Less distributions from net realized gains | | | (4.50 | ) | | | — | | | | (1.27 | ) | | | (0.71 | ) | | | (2.76 | ) |
| | | | | | | | | | | | | | | | | | | | | |
Net asset value at end of year | | $ | 57.97 | | | $ | 85.83 | | | $ | 62.33 | | | $ | 57.74 | | | $ | 60.70 | |
| | | | | | | | | | | | | | | | | | | | | |
Total return (b) | | | (28.78 | %) | | | 37.70 | % | | | 10.30 | % | | | (3.57 | %) | | | 28.47 | % |
| | | | | | | | | | | | | | | | | | | | | |
Net assets at end of year (000,000’s) | | $ | 642 | | | $ | 968 | | | $ | 805 | | | $ | 858 | | | $ | 1,033 | |
| | | | | | | | | | | | | | | | | | | | | |
Ratios/supplementary data: | | | | | | | | | | | | | | | | | | | | |
Ratio of total expenses to average net assets | | | 1.26 | % | | | 1.25 | % | | | 1.28 | % | | | 1.27 | % | | | 1.29 | % |
Ratio of net expenses to average net assets (c) | | | 1.10 | % | | | 1.10 | % | | | 1.10 | % | | | 1.10 | % | | | 1.10 | % |
Ratio of net investment loss to average net assets (c) | | | (0.82 | %) | | | (0.89 | %) | | | (0.75 | %) | | | (0.60 | %) | | | (0.56 | %) |
Portfolio turnover rate | | | 24 | % | | | 19 | % | | | 22 | % | | | 26 | % | | | 9 | % |
(a) | Per share net investment loss has been determined on the basis of average number of shares outstanding during the period. |
(b) | Total return is a measure of the change in value of an investment in the Fund over the periods covered. The returns shown do not reflect the deduction of taxes a shareholder would pay on Fund distributions, if any, or the redemption of Fund shares. The total returns would be lower if the Adviser had not reduced advisory fees and/or reimbursed expenses (Note 4). |
(c) | Ratio was determined after advisory fee reductions and/or expense reimbursements (Note 4). |
| | |
See accompanying notes to financial statements. |
42
CONESTOGA SMID CAP FUND
INSTITUTIONAL CLASS
FINANCIAL HIGHLIGHTS |
Per Share Data for a Share Outstanding Throughout Each Year: |
| | Year
Ended
Sept. 30,
2022 | | | Year
Ended
Sept. 30,
2021 | | | Year
Ended
Sept. 30,
2020 | | | Year
Ended
Sept. 30,
2019 | | | Year
Ended
Sept. 30,
2018 | |
Net asset value at beginning of year | | $ | 26.13 | | | $ | 19.29 | | | $ | 17.18 | | | $ | 17.05 | | | $ | 12.80 | |
| | | | | | | | | | | | | | | | | | | | | |
Income (loss) from investment operations: | | | | | | | | | | | | | | | | | | | | |
Net investment loss (a) | | | (0.09 | ) | | | (0.11 | ) | | | (0.06 | ) | | | (0.03 | ) | | | (0.06 | ) |
Net realized and unrealized gains (losses) on investments | | | (8.08 | ) | | | 6.95 | | | | 2.40 | | | | 0.30 | | | | 4.35 | |
Total from investment operations | | | (8.17 | ) | | | 6.84 | | | | 2.34 | | | | 0.27 | | | | 4.29 | |
| | | | | | | | | | | | | | | | | | | | | |
Less distributions from net realized gains | | | — | | | | — | | | | (0.23 | ) | | | (0.14 | ) | | | (0.04 | ) |
| | | | | | | | | | | | | | | | | | | | | |
Net asset value at end of year | | $ | 17.96 | | | $ | 26.13 | | | $ | 19.29 | | | $ | 17.18 | | | $ | 17.05 | |
| | | | | | | | | | | | | | | | | | | | | |
Total return (b) | | | (31.27 | %) | | | 35.46 | % | | | 13.76 | % | | | 1.72 | % | | | 33.64 | % |
| | | | | | | | | | | | | | | | | | | | | |
Net assets at end of year (000’s) | | $ | 272,623 | | | $ | 357,479 | | | $ | 188,836 | | | $ | 80,814 | | | $ | 45,210 | |
| | | | | | | | | | | | | | | | | | | | | |
Ratios/supplementary data: | | | | | | | | | | | | | | | | | | | | |
Ratio of total expenses to average net assets | | | 1.07 | % | | | 1.10 | % | | | 1.26 | % | | | 1.39 | % | | | 1.62 | % |
Ratio of net expenses to average net assets (c) | | | 0.85 | % | | | 0.85 | % | | | 0.85 | % | | | 0.85 | % | | | 0.86 | %(d) |
Ratio of net investment loss to average net assets (c) | | | (0.41 | %) | | | (0.47 | %) | | | (0.34 | %) | | | (0.20 | %) | | | (0.37 | %) |
Portfolio turnover rate | | | 15 | % | | | 17 | % | | | 11 | % | | | 37 | % | | | 8 | % |
(a) | Per share net investment loss has been determined on the basis of average number of shares outstanding during the period. |
(b) | Total return is a measure of the change in value of an investment in the Fund over the periods covered. The returns shown do not reflect the deduction of taxes a shareholder would pay on Fund distributions, if any, or the redemption of Fund shares. The total returns would be lower if the Adviser had not reduced advisory fees and/or reimbursed expenses (Note 4). |
(c) | Ratio was determined after advisory fee reductions and/or expense reimbursements (Note 4). |
(d) | Effective January 31, 2018, the Adviser has agreed to reduce its advisory fees and reimburse other expenses in order to limit annual operating expenses to 0.85% of the average daily net assets allocable to Institutional Class Shares. Between January 31, 2017 and January 31, 2018, the expense limitation had been 0.90%. |
| | |
See accompanying notes to financial statements. |
43
CONESTOGA SMID CAP FUND
INVESTORS CLASS
FINANCIAL HIGHLIGHTS |
Per Share Data for a Share Outstanding Throughout Each Year: |
| | Year
Ended
Sept. 30,
2022 | | | Year
Ended
Sept. 30,
2021 | | | Year
Ended
Sept. 30,
2020 | | | Year
Ended
Sept. 30,
2019 | | | Year
Ended
Sept. 30,
2018 | |
Net asset value at beginning of year | | $ | 25.68 | | | $ | 19.01 | | | $ | 16.97 | | | $ | 16.88 | | | $ | 12.71 | |
| | | | | | | | | | | | | | | | | | | | | |
Income (loss) from investment operations: | | | | | | | | | | | | | | | | | | | | |
Net investment loss (a) | | | (0.15 | ) | | | (0.17 | ) | | | (0.10 | ) | | | (0.07 | ) | | | (0.09 | ) |
Net realized and unrealized gains (losses) on investments | | | (7.93 | ) | | | 6.84 | | | | 2.37 | | | | 0.30 | | | | 4.30 | |
Total from investment operations | | | (8.08 | ) | | | 6.67 | | | | 2.27 | | | | 0.23 | | | | 4.21 | |
| | | | | | | | | | | | | | | | | | | | | |
Less distributions from net realized gains | | | — | | | | — | | | | (0.23 | ) | | | (0.14 | ) | | | (0.04 | ) |
| | | | | | | | | | | | | | | | | | | | | |
Net asset value at end of year | | $ | 17.60 | | | $ | 25.68 | | | $ | 19.01 | | | $ | 16.97 | | | $ | 16.88 | |
| | | | | | | | | | | | | | | | | | | | | |
Total return (b) | | | (31.46 | %) | | | 35.09 | % | | | 13.52 | % | | | 1.50 | % | | | 33.25 | % |
| | | | | | | | | | | | | | | | | | | | | |
Net assets at end of year (000’s) | | $ | 44,183 | | | $ | 64,189 | | | $ | 50,577 | | | $ | 43,422 | | | $ | 38,680 | |
| | | | | | | | | | | | | | | | | | | | | |
Ratios/supplementary data: | | | | | | | | | | | | | | | | | | | | |
Ratio of total expenses to average net assets | | | 1.36 | % | | | 1.36 | % | | | 1.51 | % | | | 1.64 | % | | | 1.95 | % |
Ratio of net expenses to average net assets (c) | | | 1.10 | % | | | 1.10 | % | | | 1.10 | % | | | 1.10 | % | | | 1.10 | %(d) |
Ratio of net investment loss to average net assets (c) | | | (0.66 | %) | | | (0.71 | %) | | | (0.57 | %) | | | (0.45 | %) | | | (0.62 | %) |
Portfolio turnover rate | | | 15 | % | | | 17 | % | | | 11 | % | | | 37 | % | | | 8 | % |
(a) | Per share net investment loss has been determined on the basis of average number of shares outstanding during the period. |
(b) | Total return is a measure of the change in value of an investment in the Fund over the periods covered. The returns shown do not reflect the deduction of taxes a shareholder would pay on Fund distributions, if any, or the redemption of Fund shares. The total returns would be lower if the Adviser had not reduced advisory fees and/or reimbursed expenses (Note 4). |
(c) | Ratio was determined after advisory fee reductions and/or expense reimbursements (Note 4). |
(d) | Effective January 31, 2018, the Adviser has agreed to reduce its advisory fees and reimburse other expenses in order to limit annual operating expenses to 1.10% of the average daily net assets allocable to Investors Class Shares. Between January 31, 2017 and January 31, 2018, the expense limitation had been 1.15%. |
| | |
See accompanying notes to financial statements. |
44
CONESTOGA MID CAP FUND
INSTITUTIONAL CLASS
FINANCIAL HIGHLIGHTS |
Per Share Data for a Share Outstanding Throughout Each Period: |
| | Year
Ended
Sept. 30,
2022 | | | Period
Ended
Sept. 30,
2021(a) | |
Net asset value at beginning of period | | $ | 10.32 | | | $ | 10.00 | |
| | | | | | | | | |
Income (loss) from investment operations: | | | | | | | | |
Net investment loss (b) | | | (0.03 | ) | | | (0.01 | ) |
Net realized and unrealized gains (losses) on investments | | | (3.19 | ) | | | 0.33 | |
Total from investment operations | | | (3.22 | ) | | | 0.32 | |
| | | | | | | | | |
Net asset value at end of period | | $ | 7.10 | | | $ | 10.32 | |
| | | | | | | | | |
Total return (c) | | | (31.20 | %) | | | 3.20 | %(d) |
| | | | | | | | | |
Net assets at end of period (000’s) | | $ | 1,406 | | | $ | 1,168 | |
| | | | | | | | | |
Ratios/supplementary data: | | | | | | | | |
Ratio of total expenses to average net assets | | | 12.20 | % | | | 16.18 | %(e) |
Ratio of net expenses to average net assets (f) | | | 0.80 | % | | | 0.80 | %(e) |
Ratio of net investment loss to average net assets (f) | | | (0.36 | %) | | | (0.50 | %)(e) |
Portfolio turnover rate | | | 18 | % | | | 1 | %(d) |
(a) | Represents the period from the commencement of operations (June 29, 2021) through September 30, 2021. |
(b) | Per share net investment loss has been determined on the basis of average number of shares outstanding during the period. |
(c) | Total return is a measure of the change in value of an investment in the Fund over the period covered. The returns shown do not reflect the deduction of taxes a shareholder would pay on Fund distributions, if any, or the redemption of Fund shares. The total return would be lower if the Adviser had not reduced advisory fees and/or reimbursed expenses (Note 4). |
(d) | Not annualized. |
(e) | Annualized. |
(f) | Ratio was determined after advisory fee reductions and/or expense reimbursements (Note 4). |
| | |
See accompanying notes to financial statements. |
45
CONESTOGA MID CAP FUND
INVESTORS CLASS
FINANCIAL HIGHLIGHTS |
Per Share Data for a Share Outstanding Throughout Each Period: |
| | Year
Ended
Sept. 30,
2022 | | | Period
Ended
Sept. 30,
2021(a) | |
Net asset value at beginning of period | | $ | 10.31 | | | $ | 10.00 | |
| | | | | | | | | |
Income (loss) from investment operations: | | | | | | | | |
Net investment loss (b) | | | (0.05 | ) | | | (0.02 | ) |
Net realized and unrealized gains (losses) on investments | | | (3.18 | ) | | | 0.33 | |
Total from investment operations | | | (3.23 | ) | | | 0.31 | |
| | | | | | | | | |
Net asset value at end of period | | $ | 7.08 | | | $ | 10.31 | |
| | | | | | | | | |
Total return (c) | | | (31.33 | %) | | | 3.10 | %(d) |
| | | | | | | | | |
Net assets at end of period (000’s) | | $ | 395 | | | $ | 567 | |
| | | | | | | | | |
Ratios/supplementary data: | | | | | | | | |
Ratio of total expenses to average net assets | | | 15.54 | % | | | 17.54 | %(e) |
Ratio of net expenses to average net assets (f) | | | 1.05 | % | | | 1.05 | %(e) |
Ratio of net investment loss to average net assets (f) | | | (0.61 | %) | | | (0.73 | %)(e) |
Portfolio turnover rate | | | 18 | % | | | 1 | %(d) |
(a) | Represents the period from the commencement of operations (June 29, 2021) through September 30, 2021. |
(b) | Per share net investment loss has been determined on the basis of average number of shares outstanding during the period. |
(c) | Total return is a measure of the change in value of an investment in the Fund over the period covered. The returns shown do not reflect the deduction of taxes a shareholder would pay on Fund distributions, if any, or the redemption of Fund shares. The total return would be lower if the Adviser had not reduced advisory fees and/or reimbursed expenses (Note 4). |
(d) | Not annualized. |
(e) | Annualized. |
(f) | Ratio was determined after advisory fee reductions and/or expense reimbursements (Note 4). |
| | |
See accompanying notes to financial statements. |
46
CONESTOGA MICRO CAP FUND
INSTITUTIONAL CLASS
FINANCIAL HIGHLIGHTS |
Per Share Data for a Share Outstanding Throughout the Period: |
| | Period
Ended
Sept. 30,
2022(a) | |
Net asset value at beginning of period | | $ | 10.00 | |
| | | | | |
Loss from investment operations: | | | | |
Net investment loss (b) | | | (0.06 | ) |
Net realized and unrealized losses on investments | | | (2.87 | ) |
Total from investment operations | | | (2.93 | ) |
| | | | | |
Net asset value at end of period | | $ | 7.07 | |
| | | | | |
Total return (c) | | | (29.30 | %)(d) |
| | | | | |
Net assets at end of period (000’s) | | $ | 2,075 | |
| | | | | |
Ratios/supplementary data: | | | | |
Ratio of total expenses to average net assets | | | 9.08 | %(e) |
Ratio of net expenses to average net assets (f) | | | 1.25 | %(e) |
Ratio of net investment loss to average net assets (f) | | | (0.90 | %)(e) |
Portfolio turnover rate | | | 27 | %(d) |
(a) | Represents the period from the commencement of operations (December 20, 2021) through September 30, 2022. |
(b) | Per share net investment loss has been determined on the basis of average number of shares outstanding during the period. |
(c) | Total return is a measure of the change in value of an investment in the Fund over the period covered. The return shown does not reflect the deduction of taxes a shareholder would pay on Fund distributions, if any, or the redemption of Fund shares. The total return would be lower if the Adviser had not reduced advisory fees and/or reimbursed expenses (Note 4). |
(d) | Not annualized. |
(e) | Annualized. |
(f) | Ratio was determined after advisory fee reductions and/or expense reimbursements (Note 4). |
| | |
See accompanying notes to financial statements. |
47
CONESTOGA MICRO CAP FUND
INVESTORS CLASS
FINANCIAL HIGHLIGHTS |
Per Share Data for a Share Outstanding Throughout the Period: |
| | Period
Ended
Sept. 30,
2022(a) | |
Net asset value at beginning of period | | $ | 10.00 | |
| | | | | |
Loss from investment operations: | | | | |
Net investment loss (b) | | | (0.07 | ) |
Net realized and unrealized losses on investments | | | (2.88 | ) |
Total from investment operations | | | (2.95 | ) |
| | | | | |
Net asset value at end of period | | $ | 7.05 | |
| | | | | |
Total return (c) | | | (29.50 | %)(d) |
| | | | | |
Net assets at end of period (000’s) | | $ | 184 | |
| | | | | |
Ratios/supplementary data: | | | | |
Ratio of total expenses to average net assets | | | 13.66 | %(e) |
Ratio of net expenses to average net assets (f) | | | 1.50 | %(e) |
Ratio of net investment loss to average net assets (f) | | | (1.14 | %)(e) |
Portfolio turnover rate | | | 27 | %(d) |
(a) | Represents the period from the commencement of operations (December 20, 2021) through September 30, 2022. |
(b) | Per share net investment loss has been determined on the basis of average number of shares outstanding during the period. |
(c) | Total return is a measure of the change in value of an investment in the Fund over the period covered. The return shown does not reflect the deduction of taxes a shareholder would pay on Fund distributions, if any, or the redemption of Fund shares. The total return would be lower if the Adviser had not reduced advisory fees and/or reimbursed expenses (Note 4). |
(d) | Not annualized. |
(e) | Annualized. |
(f) | Ratio was determined after advisory fee reductions and/or expense reimbursements (Note 4). |
| | |
See accompanying notes to financial statements. |
48
CONESTOGA FUNDS
NOTES TO FINANCIAL STATEMENTS
September 30, 2022
1. Organization
Conestoga Funds (the “Trust”) was organized as a Delaware statutory trust on February 5, 2002. The Trust consists of four series, the Conestoga Small Cap Fund (the “Small Cap Fund”), the Conestoga SMid Cap Fund (the “SMid Cap Fund”), the Conestoga Mid Cap Fund (the “Mid Cap Fund”) and the Conestoga Micro Cap Fund (the “Micro Cap Fund”) (individually, a “Fund” and collectively, the “Funds”). The Trust is registered as an open-end diversified management investment company of the series type under the Investment Company Act of 1940, as amended (the “1940 Act”). Each Fund’s investment objective is to achieve long-term growth of capital. Each Fund currently offers two classes of shares, Institutional Class and Investors Class. The Mid Cap Fund commenced operations on June 29, 2021 and the Micro Cap Fund commenced operations on December 20, 2021.
Each Fund’s two classes of shares represent interests in the same portfolio of investments, and have the same rights, but the share classes differ primarily in the expenses to which they are subject and have differing investment minimums. Institutional Class shares are sold without any sales loads or distribution fees but are subject to a shareholder servicing fee of up to 0.10% of the average daily net assets allocable to Institutional Class shares and require a $250,000 initial investment. Investors Class shares are sold without any sales loads but are subject to a distribution fee of up to 0.25% and a shareholder servicing fee of up to 0.25% of the average daily net assets allocable to Investors Class shares and require a $2,500 initial investment. The Board of Trustees of the Trust (the “Board”) has determined to limit the shareholder servicing fees paid by Investors Class shares of each Fund to 0.05% of the average daily net assets allocable to Investors Class shares until at least September 30, 2022.
The organizational costs for the Mid Cap Fund totaled $4,324 and were charged to expenses as incurred. These costs are eligible for recoupment by the Conestoga Capital Advisors, LLC (the “Adviser”) within two years of the Mid Cap Fund’s commencement date of operations. During the year ended September 30, 2022, the Adviser did not recoup any organizational costs for the Mid Cap Fund.
The Micro Cap Fund is the successor to a limited partnership, the Conestoga Micro Cap Fund, L.P. (the “Predecessor Fund”), which was organized in November 2018. Effective as of the close of business on December 17, 2021, all the assets, subject to the liabilities of the Predecessor Fund, were transferred to the Micro Cap Fund in exchange for 293,507 shares at a net asset value per share (“NAV”) of $10.00 of the Micro Cap Fund to the limited partners of the Predecessor Fund. The Micro Cap Fund is a successor to the Predecessor Fund and has substantially the same investment objectives and strategies as did the Predecessor Fund. The net assets contributed resulting from these tax-free transactions on the close of business December 17, 2021, after the reorganization, was $2,935,064, including net unrealized appreciation of $650,970 and net investment cost of $2,179,789. For financial reporting purposes, assets received and shares issued were
49
CONESTOGA FUNDS
NOTES TO FINANCIAL STATEMENTS (Continued)
recorded at fair value; however, the cost basis of the investments received was carried forward to align ongoing reporting of the Micro Cap Fund’s realized and unrealized gains and losses with amounts distributable to shareholders for tax purposes.
2. Significant Accounting Policies
The following is a summary of the Funds’ significant accounting policies. These policies are in conformity with accounting principles generally accepted in the United States of America (“GAAP”). The Funds follow accounting and reporting guidance under Financial Accounting Standards Board Accounting Standards Codification Topic 946, “Financial Services – Investment Companies.”
Securities valuation – Each Fund values its portfolio securities at market value as of the close of regular trading on the New York Stock Exchange, Inc. (the “NYSE”) (normally 4:00 p.m. Eastern time) on each business day the NYSE is open for business. The Funds value their listed securities on the basis of the security’s last sale price on the security’s primary exchange, if available, otherwise at the exchange’s most recently quoted bid price. NASDAQ-listed securities are valued at the NASDAQ Official Closing Price. Investments representing shares of other open-end investment companies, including money market funds, are valued at their net asset value (“NAV”) as reported by such companies. When using a quoted price and when the market is considered active, the security will be classified as Level 1 within the fair value hierarchy (see below). In the event that market quotations are not readily available or are considered unreliable due to market or other events, the Funds value their securities and other assets at fair value, as determined in good faith by the Trust’s officers, in accordance with procedures established by and under the general supervision of the Board. Under these procedures, the securities will be classified as Level 2 or 3 within the fair value hierarchy, depending on the inputs used. Unavailable or unreliable market quotes may be due to the following factors: a substantial bid-ask spread; infrequent sales resulting in stale prices; insufficient trading volume; small trade sizes; a temporary lapse in any reliable pricing source; and actions of the securities or futures markets, such as the suspension or limitation of trading. As a result, the prices of securities used to calculate each Fund’s NAV may differ from quoted or published prices for the same securities.
GAAP establishes a single authoritative definition of fair value, sets out a framework for measuring fair value, and requires additional disclosures about fair value measurements.
Various inputs are used in determining the value of each Fund’s investments. These inputs are summarized in the three broad levels listed below:
● | Level 1 – quoted prices in active markets for identical securities |
● | Level 2 – other significant observable inputs |
● | Level 3 – significant unobservable inputs |
50
CONESTOGA FUNDS
NOTES TO FINANCIAL STATEMENTS (Continued)
The inputs or methods used for valuing securities are not necessarily an indication of the risks associated with investing in those securities. The inputs used to measure fair value may fall into different levels of the fair value hierarchy. In such cases, for disclosure purposes, the level in the fair value hierarchy within which the fair value measurement falls in its entirety is determined based on the lowest level input that is significant to the fair value measurement.
The following is a summary of the Funds’ investments based on the inputs used to value the investments as of September 30, 2022:
Conestoga Small Cap Fund | | Level 1 | | | Level 2 | | | Level 3 | | | Total | |
Common Stocks | | $ | 2,875,872,352 | | | $ | — | | | $ | — | | | $ | 2,875,872,352 | |
Total | | $ | 2,875,872,352 | | | $ | — | | | $ | — | | | $ | 2,875,872,352 | |
Conestoga SMid Cap Fund | | Level 1 | | | Level 2 | | | Level 3 | | | Total | |
Common Stocks | | $ | 307,424,864 | | | $ | — | | | $ | — | | | $ | 307,424,864 | |
Total | | $ | 307,424,864 | | | $ | — | | | $ | — | | | $ | 307,424,864 | |
Conestoga Mid Cap Fund | | Level 1 | | | Level 2 | | | Level 3 | | | Total | |
Common Stocks | | $ | 1,777,006 | | | $ | — | | | $ | — | | | $ | 1,777,006 | |
Total | | $ | 1,777,006 | | | $ | — | | | $ | — | | | $ | 1,777,006 | |
Conestoga Micro Cap Fund | | Level 1 | | | Level 2 | | | Level 3 | | | Total | |
Common Stocks | | $ | 2,232,521 | | | $ | — | | | $ | — | | | $ | 2,232,521 | |
Total | | $ | 2,232,521 | | | $ | — | | | $ | — | | | $ | 2,232,521 | |
Refer to each Fund’s Schedule of Investments for a listing of the common stocks by industry and sector type. The Funds did not hold any derivative instruments or any assets or liabilities that were measured at fair value on a recurring basis using significant unobservable inputs (Level 3) as of or during the year or period ended September 30, 2022.
New Rules to Modernize Fund Valuation Framework Take Effect
A new rule adopted by the U.S. Securities and Exchange Commission (the “SEC”) governing fund valuation practices, Rule 2a-5 under the 1940 Act, has established requirements for determining fair value in good faith for purposes of the 1940 Act. Rule 2a-5 permits fund boards to designate certain parties to perform fair value determinations, subject to board oversight and certain other conditions. Rule 2a-5 also defines when market quotations are “readily available” for purposes of Section 29(a)(41) of the 1940 Act, which requires a fund to fair value a security when market quotations are not readily
51
CONESTOGA FUNDS
NOTES TO FINANCIAL STATEMENTS (Continued)
available. Separately, new SEC Rule 31a-4 under the 1940 Act sets forth the recordkeeping requirements associated with fair value determinations. The Funds adopted Pricing and Valuation Guidelines conforming to the new rules, effective September 8, 2022, and there was no material impact to the Funds.
Share valuation – The NAV per share of each class of each Fund is calculated daily by dividing the total value of the assets attributable to that class, less liabilities attributable to that class, by the number of shares outstanding of that class. The offering price and redemption price per share of each class of each Fund is equal to the NAV per share of such class.
Cash – Each Fund’s cash is held in a bank account with balances which may exceed the amount covered by federal deposit insurance. As of September 30, 2022, the cash balances reflected on the Statements of Assets and Liabilities for each Fund represent the amount held in a deposit sweep account.
Investment income – Dividend income is recorded on the ex-dividend date. Interest income is accrued as earned. Non-cash dividends included in dividend income, if any, are recorded at the fair market value of the security received. Withholding taxes on foreign dividends have been recorded in accordance with the Funds’ understanding of the applicable country’s rules and tax rates.
Investment transactions – Investment transactions are accounted for on the trade date. Realized gains and losses on investments sold are determined on a specific identification basis.
Common expenses – Common expenses of the Trust are allocated between the Funds based on the relative net assets of each Fund or the nature of the services performed and the relative applicability to each Fund.
Distributions to shareholders – Each Fund distributes to its shareholders any net investment income dividends and net realized capital gains distributions at least once each year. The amount of such dividends and distributions are determined in accordance with federal income tax regulations, which may differ from GAAP. Dividends and distributions to shareholders are recorded on the ex-dividend date. The tax character of distributions paid to shareholders during the years or periods ended September 30, 2022 and 2021 were as follows:
Conestoga Small Cap Fund | | Ordinary
Income | | | Long Term
Capital Gain | | | Total
Distributions | |
September 30, 2022 | | $ | — | | | $ | 225,468,951 | | | $ | 225,468,951 | |
September 30, 2021 | | $ | — | | | $ | — | | | $ | — | |
52
CONESTOGA FUNDS
NOTES TO FINANCIAL STATEMENTS (Continued)
Conestoga SMid Cap Fund | | Ordinary
Income | | | Long Term
Capital Gain | | | Total | |
September 30, 2022 | | $ | — | | | $ | — | | | $ | — | |
September 30, 2021 | | $ | — | | | $ | — | | | $ | — | |
Conestoga Mid Cap Fund | | Ordinary
Income | | | Long Term
Capital Gain | | | Total | |
September 30, 2022 | | $ | — | | | $ | — | | | $ | — | |
September 30, 2021 | | $ | — | | | $ | — | | | $ | — | |
Conestoga Micro Cap Fund | | Ordinary
Income | | | Long Term
Capital Gain | | | Total | |
September 30, 2022 | | $ | — | | | $ | — | | | $ | — | |
Allocation between classes – Investment income earned, realized capital gains and losses, and unrealized appreciation and depreciation are allocated daily to each class of a Fund based upon its proportionate share of total net assets of that Fund. Class-specific expenses are charged directly to the class incurring the expense. Common expenses that are not attributable to a specific class are allocated daily to each class of shares of a Fund based upon its proportionate share of total net assets.
Estimates – The preparation of financial statements in conformity with GAAP requires management to make estimates and assumptions that affect the reported amounts of assets and liabilities and disclosure of contingent assets and liabilities as of the date of the financial statements and the reported amounts of increase (decrease) in net assets from operations during the reporting period. Actual results could differ from those estimates.
Federal income tax – Each Fund intends to or has qualified and intends to continue to qualify as a regulated investment company under the Internal Revenue Code of 1986, as amended (the “Code”). Qualification generally will relieve each Fund of liability for federal income taxes to the extent 100% of its net investment income and net realized capital gains are distributed in accordance with the Code.
In order to avoid imposition of the excise tax applicable to regulated investment companies, it is also each Fund’s intention to declare as dividends in each calendar year at least 98% of its net investment income (earned during the calendar year) and 98.2% of its net realized capital gains (earned during the twelve months ended October 31) plus undistributed amounts from prior years.
53
CONESTOGA FUNDS
NOTES TO FINANCIAL STATEMENTS (Continued)
The following information is computed on a tax basis for each item as of September 30, 2022:
| | Small Cap Fund | | | SMid Cap Fund | |
Tax cost of investments | | $ | 2,243,663,819 | | | $ | 295,392,947 | |
Gross unrealized appreciation | | $ | 902,812,901 | | | $ | 67,902,179 | |
Gross unrealized depreciation | | | (270,604,368 | ) | | | (55,870,262 | ) |
Net unrealized appreciation | | | 632,208,533 | | | | 12,031,917 | |
Undistributed long-term gains | | | 121,665,679 | | | | — | |
Accumulated capital and other losses | | | (17,130,242 | ) | | | (7,211,582 | ) |
Distributable earnings | | $ | 736,743,970 | | | $ | 4,820,335 | |
| | Mid Cap Fund | | | Micro Cap Fund | |
Tax cost of investments | | $ | 2,365,148 | | | $ | 2,444,970 | |
Gross unrealized appreciation | | $ | 29,869 | | | $ | 454,244 | |
Gross unrealized depreciation | | | (618,011 | ) | | | (666,693 | ) |
Net unrealized depreciation | | | (588,142 | ) | | | (212,449 | ) |
Accumulated capital and other losses | | | (36,832 | ) | | | (44,209 | ) |
Accumulated deficit | | $ | (624,974 | ) | | $ | (256,658 | ) |
The difference between the federal income tax cost of portfolio investments and the financial statement cost of portfolio investments for the Funds are due to certain timing differences in the recognition of capital gains or losses under income tax regulations and GAAP. These “book/tax” differences are temporary in nature and are primarily due to the tax deferral of losses on wash sales.
For the year or period ended September 30, 2022, the following reclassifications were made on the Statements of Assets and Liabilities for the Funds as a result of permanent differences between the financial statements and income tax reporting requirements:
| | Small Cap Fund | | | SMid Cap Fund | | | Mid Cap Fund | | | Micro Cap Fund | |
Paid-in capital | | $ | (31,452,360 | ) | | $ | (2,098,879 | ) | | $ | (4,442 | ) | | $ | (774 | ) |
Distributable earnings (accumulated deficit) | | | 31,452,360 | | | | 2,098,879 | | | | 4,442 | | | | 774 | |
Such reclassifications, the result of permanent differences between financial statement and income tax reporting requirements, had no effect on each Fund’s net assets or NAV per share.
54
CONESTOGA FUNDS
NOTES TO FINANCIAL STATEMENTS (Continued)
Net qualified late year ordinary losses represents losses incurred after December 31, 2021. These losses are deemed to arise on the first day of the Funds’ next taxable year. For the year or period ended September 30, 2022, the Small Cap Fund, SMid Cap Fund, Mid Cap Fund and Micro Cap Fund deferred until October 1, 2022 qualified late year ordinary losses of $17,130,242, $1,166,558, $5,675 and $17,372 for federal income tax purposes, respectively.
As of September 30, 2022, the Funds had the following capital loss carryforwards (“CLCFs”) for federal income tax purposes:
| | Small Cap Fund | | | SMid Cap Fund | | | Mid Cap Fund | | | Micro Cap Fund | |
Short-term capital loss carryforwards | | $ | — | | | $ | 5,176,877 | | | $ | 17,520 | | | $ | 26,837 | |
Long-term capital loss carryforwards | | | — | | | | 868,147 | | | | 13,637 | | | | — | |
Total | | $ | — | | | $ | 6,045,024 | | | $ | 31,157 | | | $ | 26,837 | |
These CLCFs, which do not expire, are available to offset net realized capital gains in future years, thereby reducing future taxable gain distributions.
The Funds recognize the tax benefits or expenses of uncertain tax positions only when the position is “more likely than not” of being sustained assuming examination by tax authorities. Management has reviewed each Fund’s tax positions for all open tax years (generally, three years) and has concluded that no provision for unrecognized tax benefits or expenses is required in these financial statements. The Funds identify their major tax jurisdiction as U.S. Federal.
3. Investment Transactions
During the year or period ended September 30, 2022, the cost of purchases and proceeds from sales of investment securities, other than short-term investments, were as follows:
| | Small Cap Fund | | | SMid Cap Fund | | | Mid Cap Fund | | | Micro Cap Fund | |
Purchases of investment securities | | $ | 900,145,094 | | | $ | 101,219,831 | | | $ | 1,042,411 | | | $ | 955,124 | |
Proceeds from sales of investment securities | | $ | 956,443,336 | | | $ | 55,325,789 | | | $ | 318,007 | | | $ | 663,106 | |
4. Transactions with Related Parties
INVESTMENT ADVISORY AGREEMENT
The Small Cap Fund has entered into an Investment Advisory Agreement with the Adviser to provide supervision and assistance in overall management services to the Small Cap Fund. For these services, the Small Cap Fund pays the Adviser a fee, calculated daily and paid monthly, equal to an annual rate of 0.90% of its average daily net assets. The
55
CONESTOGA FUNDS
NOTES TO FINANCIAL STATEMENTS (Continued)
Adviser has contractually agreed to limit the Small Cap Fund’s net annual operating expenses (excluding taxes, extraordinary expenses, reorganization expenses, brokerage commissions, interest, other expenditures that are capitalized in accordance with GAAP, and other extraordinary expenses not incurred in the ordinary course of such Fund’s business) to 1.10% (for the Investors Class) and 0.90% (for the Institutional Class) of average daily net assets until at least January 31, 2023. During the year ended September 30, 2022, the Adviser reduced its fees of $34,109,594 from the Small Cap Fund by $969,058 and reimbursed other operating expenses of $2,752,825 under this arrangement. In addition, if at any point during the 24 months following the date that the Adviser reduced its fees and/or made expense reimbursements, it becomes unnecessary for the Adviser to reduce its fees or make expense reimbursements, the Adviser may recapture any of its prior fee reductions or expense reimbursements to the extent such recapture does not cause the Fund’s total annual operating expenses to exceed the applicable expense limitation that was in effect at the time of the fee reduction or expense reimbursement. As of September 30, 2022, the Adviser may seek recovery of advisory fee reductions and expense reimbursements no later than the dates as stated below:
| | September 30,
2023 | | | September 30,
2024 | | | Total | |
Small Cap Fund | | $ | 3,899,668 | | | $ | 3,721,883 | | | $ | 7,621,551 | |
During the year ended September 30, 2022, the Adviser did not recover any previous fee reductions or expense reimbursements from the Small Cap Fund.
The SMid Cap Fund has entered into an Investment Advisory Agreement with the Adviser to provide supervision and assistance in overall management services to the SMid Cap Fund. For these services, the SMid Cap Fund pays the Adviser a fee, calculated daily and paid monthly, equal to an annual rate of 0.85% of its average daily net assets. The Adviser has contractually agreed to limit the SMid Cap Fund’s net annual operating expenses (excluding interest, taxes, brokerage commissions, other expenditures that are capitalized in accordance with GAAP, and other extraordinary expenses not incurred in the ordinary course of such Fund’s business) to 1.10% (for the Investors Class) and 0.85% (for the Institutional Class) of average daily net assets until at least January 31, 2023. During the year ended September 30, 2022, the Adviser reduced its fees of $3,254,573 from the SMid Cap Fund by $480,560 and reimbursed other operating expenses of $377,248 under this arrangement. In addition, if at any point during the 24 months following the date that the Adviser reduced its fees and/or made expense reimbursements, it becomes unnecessary for the Adviser to reduce its fees or make expense reimbursements, the Adviser may recapture any of its prior fee reductions or expense reimbursements to the extent such recapture does not cause the Fund’s total annual operating expenses to exceed the current expense limitation or the applicable expense limitation that was in effect at the time of
56
CONESTOGA FUNDS
NOTES TO FINANCIAL STATEMENTS (Continued)
the fee reduction or expense reimbursement. As of September 30, 2022, the Adviser may seek recovery of advisory fee reductions and expense reimbursements no later than the dates as stated below:
| | September 30,
2023 | | | September 30,
2024 | | | Total | |
SMid Cap Fund | | $ | 863,983 | | | $ | 857,808 | | | $ | 1,721,791 | |
During the year ended September 30, 2022, the Adviser did not recover any previous fee reductions or expense reimbursements from the SMid Cap Fund.
The Mid Cap Fund has entered into an Investment Advisory Agreement with the Adviser to provide supervision and assistance in overall management services to the Mid Cap Fund. For these services, the Mid Cap Fund pays the Adviser a fee, calculated daily and paid monthly, equal to an annual rate of 0.80% of its average daily net assets. The Adviser has contractually agreed to limit the Mid Cap Fund’s net annual operating expenses (excluding interest, taxes, brokerage commissions, other expenditures that are capitalized in accordance with GAAP, and other extraordinary expenses not incurred in the ordinary course of such Fund’s business) to 1.05% (for the Investors Class) and 0.80% (for the Institutional Class) of average daily net assets until at least January 31, 2023. During the year ended September 30, 2022, the Adviser did not collect any of its advisory fees of $14,828 from the Mid Cap Fund and reimbursed other operating expenses of $211,737 under this arrangement. In addition, if at any point during the 24 months following the date that the Adviser reduced its fees and/or made expense reimbursements, it becomes unnecessary for the Adviser to reduce its fees or make expense reimbursements, the Adviser may recapture any of its prior fee reductions or expense reimbursements to the extent such recapture does not cause the Fund’s total annual operating expenses to exceed the current expense limitation or the applicable expense limitation that was in effect at the time of the fee reduction or expense reimbursement. As of September 30, 2022, the Adviser may seek recovery of advisory fee reductions and expense reimbursements no later than the dates as stated below:
| | September 30,
2023 | | | September 30,
2024 | | | Total | |
Mid Cap Fund | | $ | 64,920 | | | $ | 226,565 | | | $ | 291,485 | |
The Micro Cap Fund has entered into an Investment Advisory Agreement with the Adviser to provide supervision and assistance in overall management services to the Micro Cap Fund. For these services, the Micro Cap Fund pays the Adviser a fee, calculated daily and paid monthly, equal to an annual rate of 1.00% of its average daily net assets. The Adviser has contractually agreed to limit the Micro Cap Fund’s net annual operating expenses (excluding interest, taxes, brokerage commissions, other expenditures that are capitalized
57
CONESTOGA FUNDS
NOTES TO FINANCIAL STATEMENTS (Continued)
in accordance with GAAP, and other extraordinary expenses not incurred in the ordinary course of such Fund’s business) to 1.50% (for the Investors Class) and 1.25% (for the Institutional Class) of average daily net assets until at least January 31, 2023. During the period ended September 30, 2022, the Adviser did not collect any of its advisory fees of $19,898 from the Micro Cap Fund and reimbursed other operating expenses of $141,634 under this arrangement. In addition, if at any point during the 24 months following the date that the Adviser reduced its fees and/or made expense reimbursements, it becomes unnecessary for the Adviser to reduce its fees or make expense reimbursements, the Adviser may recapture any of its prior fee reductions or expense reimbursements to the extent such recapture does not cause the Fund’s total annual operating expenses to exceed the current expense limitation or the applicable expense limitation that was in effect at the time of the fee reduction or expense reimbursement. As of September 30, 2022, the Adviser may seek recovery of advisory fee reductions and expense reimbursements no later than the date as stated below:
| | September 30,
2024 | | | Total | |
Micro Cap Fund | | $ | 161,532 | | | $ | 161,532 | |
DISTRIBUTION AND SHAREHOLDER SERVICING PLANS
The Trust, on behalf of each Fund, has adopted a distribution plan (the “Distribution Plan”), pursuant to Rule 12b-1 under the 1940 Act, which permits each Fund to pay certain expenses associated with the distribution of Investors Class shares, including, but not limited to, advertising, printing of prospectuses and reports for other than existing shareholders, preparation and distribution of advertising material and sales literature, and payments to dealers and shareholder servicing agents who enter into agreements with the Funds. The Distribution Plan provides that each Fund may reimburse the Distributor (hereinafter defined) for distribution expenses in an amount not exceeding, on an annual basis, 0.25% of the average daily net assets allocable to Investors Class shares. During the year or period ended September 30, 2022, Investors Class shares of the Small Cap Fund, SMid Cap Fund, Mid Cap Fund and Micro Cap Fund incurred fees of $2,053,133, $146,221, $1,229 and $333, respectively, under the Distribution Plan.
The Trust, on behalf of each Fund, has adopted a Shareholder Servicing Plan under which each Fund may enter into agreements with various shareholder servicing agents, including financial institutions and securities brokers. Each Fund may pay shareholder servicing fees in an amount not exceeding, on an annual basis, 0.10% of the average daily net assets allocable to the Institutional Class shares and 0.25% of the average daily net assets allocable to the Investors Class shares. The Board has approved a limitation on the shareholder servicing fees of 0.05% of the average daily net assets attributable to Investors Class shares for the year or period ended September 30, 2022. During the year ended September 30, 2022, Institutional Class shares and Investors Class shares
58
CONESTOGA FUNDS
NOTES TO FINANCIAL STATEMENTS (Continued)
of the Small Cap Fund incurred fees of $1,484,477 and $410,639, respectively, under the Shareholder Servicing Plan. During the year ended September 30, 2022, Institutional Class shares and Investors Class shares of the SMid Cap Fund incurred fees of $247,776 and $29,245, respectively, under the Shareholder Servicing Plan. During the year ended September 30, 2022, Institutional Class shares and Investors Class shares of the Mid Cap Fund incurred fees of $1,362 and $246, respectively, under the Shareholder Servicing Plan. During the period ended September 30, 2022, Institutional Class shares and Investors Class shares of the Micro Cap Fund incurred fees of $1,857 and $67, respectively, under the Shareholder Servicing Plan.
OTHER SERVICE PROVIDERS
Ultimus Fund Solutions, LLC (“Ultimus”) provides fund accounting, compliance, transfer agency and certain administration services to the Funds. Each Fund pays Ultimus fees in accordance with the agreements for such services. In addition, each Fund pays out-of-pocket expenses including, but not limited to, postage, supplies and costs related to the pricing of its portfolio securities.
Under the terms of a Distribution Agreement with the Trust, Ultimus Fund Distributors, LLC (the “Distributor”) serves as the principal underwriter to each Fund. The Distributor is a wholly-owned subsidiary of Ultimus.
Certain officers of the Trust are also officers of Ultimus and/or the Distributor. An employee of Ultimus serves as the Trust’s Anti-Money Laundering Officer.
TRUSTEE COMPENSATION
Trustees affiliated with the Adviser are not compensated by the Trust for their services. Effective January 1, 2022, each Trustee who is not an “interested person” of the Trust (“Independent Trustee”) receives a quarterly retainer of $12,500 ($19,500 for the Lead Independent Trustee and $18,350 for the Chair of the Audit Committee), a fee of $5,000 for each quarterly or special meeting attended in person, and 50% of such meeting fee for telephonic meetings attended. Prior to January 1, 2022, each Independent Trustee received from the Trust a quarterly retainer of $11,250 (except that such fee was $17,750 for the Lead Independent Trustee and $16,650 for the Chair of the Audit Committee), a fee of $5,000 for each quarterly or special meeting attended in person, and 50% of such meeting fee for telephonic meetings attended. Each Fund pays its proportionate share of such fees.
59
CONESTOGA FUNDS
NOTES TO FINANCIAL STATEMENTS (Continued)
PRINCIPAL HOLDERS OF FUND SHARES
As of September 30, 2022, the following shareholders owned of record 25% or more of the outstanding shares of each class of each Fund:
NAME OF RECORD OWNER | % Ownership |
Conestoga Small Cap Fund - Institutional Class | |
National Financial Services, LLC (for the benefit of its customers) | 27% |
Conestoga Small Cap Fund - Investors Class | |
National Financial Services, LLC (for the benefit of its customers) | 40% |
Conestoga SMid Cap Fund - Institutional Class | |
National Financial Services, LLC (for the benefit of its customers) | 39% |
Charles Schwab & Company, Inc. (for the benefit of its customers) | 35% |
Conestoga SMid Cap Fund - Investors Class | |
National Financial Services, LLC (for the benefit of its customers) | 56% |
Conestoga Mid Cap Fund - Institutional Class | |
Dominion Carolina Gas Transmission, LLC | 38% |
Conestoga Mid Cap Fund - Investors Class | |
Vanguard Brokerage Services (for the benefit of its customers) | 26% |
Conestoga Micro Cap Fund - Investors Class | |
Lauren L. Studebaker | 44% |
A beneficial owner of 25% or more of a Fund’s outstanding shares may be considered a controlling person. That shareholder’s vote could have a more significant effect on matters presented at a shareholders’ meeting.
5. Affiliated Issuers
A company is considered an affiliate of a Fund under the 1940 Act if the Fund’s holdings in that company represent 5% or more of the outstanding voting shares of the company. The industry and percentage of net assets for these holdings can be found on the Small Cap Fund’s Schedule of Investments. As of September 30, 2021, Vocera Communications, Inc. (“Vocera”) was an affiliate of the Small Cap Fund, but as of September 30, 2022, the
60
CONESTOGA FUNDS
NOTES TO FINANCIAL STATEMENTS (Continued)
Small Cap Fund does not hold a position in Vocera, which is no longer an affiliate of the Small Cap Fund. Further information on these holdings for the year ended September 30, 2022 appears below:
| | Construction
Partners, Inc. -
Class A | | | Douglas
Dynamics,
Inc. | | | LeMaitre
Vascular, Inc. | |
Percentage of Outstanding Voting Shares Owned | | | 7.37 | % | | | 6.44 | % | | | 5.81 | % |
Shares at Beginning of Year | | | 3,117,891 | | | | 1,224,465 | | | | 1,274,721 | |
Shares Purchased During the Year | | | 32,575 | | | | 479,350 | | | | 20,550 | |
Shares Sold During the Year | | | (114,600 | ) | | | (230,900 | ) | | | (19,575 | ) |
Shares at End of Year | | | 3,035,866 | | | | 1,472,915 | | | | 1,275,696 | |
Market Value at Beginning of Year | | $ | 104,044,023 | | | $ | 44,448,079 | | | $ | 67,674,938 | |
Cost of Purchases During the Year | | | 885,017 | | | | 20,674,935 | | | | 888,759 | |
Cost of Sales During the Year | | | (3,581,250 | ) | | | (10,409,498 | ) | | | (847,172 | ) |
Change in Unrealized Appreciation (Depreciation) | | | (21,717,025 | ) | | | (13,442,438 | ) | | | (3,064,252 | ) |
Market Value at End of Year | | $ | 79,630,765 | | | $ | 41,271,078 | | | $ | 64,652,273 | |
Net Realized Gains (Losses) During the Year | | $ | (295,371 | ) | | $ | (3,303,050 | ) | | $ | 33,648 | |
Dividend Income Earned During the Year | | $ | — | | | $ | 1,886,490 | | | $ | 623,499 | |
| | Mesa
Laboratories, Inc. | | | Model N, Inc. | | | Simulations Plus,
Inc. | |
Percentage of Outstanding Voting Shares Owned | | | 6.12 | % | | | 8.95 | % | | | 7.47 | % |
Shares at Beginning of Year | | | 354,081 | | | | 2,553,844 | | | | 905,596 | |
Shares Purchased During the Year | | | 5,700 | | | | 1,339,000 | | | | 796,000 | |
Shares Sold During the Year | | | (34,226 | ) | | | (578,125 | ) | | | (190,850 | ) |
Shares at End of Year | | | 325,555 | | | | 3,314,719 | | | | 1,510,746 | |
Market Value at Beginning of Year | | $ | 107,059,931 | | | $ | 85,553,774 | | | $ | 35,771,042 | |
Cost of Purchases During the Year | | | 1,568,982 | | | | 39,994,821 | | | | 41,045,816 | |
Cost of Sales During the Year | | | (9,250,703 | ) | | | (21,397,028 | ) | | | (11,442,280 | ) |
Change in Unrealized Appreciation (Depreciation) | | | (53,530,299 | ) | | | 9,311,264 | | | | 7,957,033 | |
Market Value at End of Year | | $ | 45,847,911 | | | $ | 113,462,831 | | | $ | 73,331,611 | |
Net Realized Losses During the Year | | $ | (3,084,946 | ) | | $ | (6,112,829 | ) | | $ | (3,608,226 | ) |
Dividend Income Earned During the Year | | $ | 223,068 | | | $ | — | | | $ | 328,352 | |
61
CONESTOGA FUNDS
NOTES TO FINANCIAL STATEMENTS (Continued)
| | Stevanato Group
S.p.A. | | | Transcat, Inc. | | | Total | |
Percentage of Outstanding Voting Shares Owned | | | 6.17 | % | | | 6.41 | % | | | | |
Shares at Beginning of Year | | | — | | | | — | | | | | |
Shares Purchased During the Year | | | 2,040,000 | | | | 483,824 | | | | | |
Shares Sold During the Year | | | — | | | | — | | | | | |
Shares at End of Year | | | 2,040,000 | | | | 483,824 | | | | | |
Market Value at Beginning of Year | | $ | — | | | $ | — | | | $ | 444,551,787 | |
Cost of Purchases During the Year | | | 38,033,327 | | | | 34,339,546 | | | | 177,431,203 | |
Cost of Sales During the Year | | | — | | | | — | | | | (56,927,931 | ) |
Change in Unrealized Appreciation (Depreciation) | | | (3,475,727 | ) | | | 2,281,093 | | | | (75,680,351 | ) |
Market Value at End of Year | | $ | 34,557,600 | | | $ | 36,620,639 | | | $ | 489,374,708 | |
Net Realized Losses During the Year | | $ | — | | | $ | — | | | $ | (16,370,774 | ) |
Dividend Income Earned During the Year | | $ | 53,040 | | | $ | — | | | $ | 3,114,449 | |
6. Capital Share Activity
The following table summarizes the capital share activity in Institutional Class shares of the Small Cap Fund:
| | For the Year Ended
September 30, 2022 | | | For the Year Ended
September 30, 2021 | |
| | Shares | | | Value | | | Shares | | | Value | |
Issued | | | 9,352,673 | | | $ | 685,880,670 | | | | 9,832,515 | | | $ | 783,876,197 | |
Reinvested | | | 1,377,509 | | | | 115,710,799 | | | | — | | | | — | |
Redeemed | | | (9,624,957 | ) | | | (683,555,542 | ) | | | (5,877,642 | ) | | | (470,707,498 | ) |
Total | | | 1,105,225 | | | $ | 118,035,927 | | | | 3,954,873 | | | $ | 313,168,699 | |
The following table summarizes the capital share activity in Investors Class shares of the Small Cap Fund:
| | For the Year Ended
September 30, 2022 | | | For the Year Ended
September 30, 2021 | |
| | Shares | | | Value | | | Shares | | | Value | |
Issued | | | 1,736,437 | | | $ | 125,440,330 | | | | 1,502,807 | | | $ | 118,468,533 | |
Reinvested | | | 552,464 | | | | 45,633,567 | | | | — | | | | — | |
Redeemed | | | (2,507,614 | ) | | | (179,700,944 | ) | | | (3,127,143 | ) | | | (248,225,990 | ) |
Total | | | (218,713 | ) | | $ | (8,627,047 | ) | | | (1,624,336 | ) | | $ | (129,757,457 | ) |
62
CONESTOGA FUNDS
NOTES TO FINANCIAL STATEMENTS (Continued)
The following table summarizes the capital share activity in Institutional Class shares of the SMid Cap Fund:
| | For the Year Ended
September 30, 2022 | | | For the Year Ended
September 30, 2021 | |
| | Shares | | | Value | | | Shares | | | Value | |
Issued | | | 5,063,230 | | | $ | 111,657,408 | | | | 6,081,217 | | | $ | 144,722,264 | |
Redeemed | | | (3,561,449 | ) | | | (76,820,766 | ) | | | (2,187,178 | ) | | | (51,920,798 | ) |
Total | | | 1,501,781 | | | $ | 34,836,642 | | | | 3,894,039 | | | $ | 92,801,466 | |
The following table summarizes the capital share activity in Investors Class shares of the SMid Cap Fund:
| | For the Year Ended
September 30, 2022 | | | For the Year Ended
September 30, 2021 | |
| | Shares | | | Value | | | Shares | | | Value | |
Issued | | | 1,445,829 | | | $ | 31,237,466 | | | | 645,803 | | | $ | 15,006,418 | |
Redeemed | | | (1,435,348 | ) | | | (30,051,109 | ) | | | (806,790 | ) | | | (18,625,647 | ) |
Total | | | 10,481 | | | $ | 1,186,357 | | | | (160,987 | ) | | $ | (3,619,229 | ) |
The following table summarizes the capital share activity in Institutional Class shares of the Mid Cap Fund:
| | For the Year Ended
September 30, 2022 | | | For the Period Ended
September 30, 2021(a) | |
| | Shares | | | Value | | | Shares | | | Value | |
Issued | | | 84,870 | | | $ | 727,504 | | | | 113,238 | | | $ | 1,145,200 | |
Redeemed | | | (151 | ) | | | (1,249 | ) | | | — | | | | — | |
Total | | | 84,719 | | | $ | 726,255 | | | | 113,238 | | | $ | 1,145,200 | |
(a) | Represents the period from commencement of operations (June 29, 2021) through September 30, 2021. |
The following table summarizes the capital share activity in Investors Class shares of the Mid Cap Fund:
| | For the Year Ended
September 30, 2022 | | | For the Period Ended
September 30, 2021(a) | |
| | Shares | | | Value | | | Shares | | | Value | |
Issued | | | 5,269 | | | $ | 49,000 | | | | 60,435 | | | $ | 614,658 | |
Redeemed | | | (4,435 | ) | | | (44,626 | ) | | | (5,460 | ) | | | (59,600 | ) |
Total | | | 834 | | | $ | 4,374 | | | | 54,975 | | | $ | 555,058 | |
(a) | Represents the period from commencement of operations (June 29, 2021) through September 30, 2021. |
63
CONESTOGA FUNDS
NOTES TO FINANCIAL STATEMENTS (Continued)
The following table summarizes the capital share activity in Institutional Class shares of the Micro Cap Fund:
| | For the Period Ended
September 30, 2022(a) | |
| | Shares | | | Value | |
Issued | | | 15,888 | | | $ | 148,375 | |
Redeemed | | | (2 | ) | | | (15 | ) |
Issued in connection with Fund Reorganization | | | 277,725 | | | | 2,777,245 | |
Total | | | 293,611 | | | $ | 2,925,605 | |
(a) | Represents the period from commencement of operations (December 20, 2021) through September 30, 2022. |
The following table summarizes the capital share activity in Investors Class shares of the Micro Cap Fund:
| | For the Period Ended
September 30, 2022(a) | |
| | Shares | | | Value | |
Issued | | | 11,867 | | | $ | 97,357 | |
Redeemed | | | (1,603 | ) | | | (14,117 | ) |
Issued in connection with Fund Reorganization | | | 15,782 | | | | 157,819 | |
Total | | | 26,046 | | | $ | 241,059 | |
(a) | Represents the period from commencement of operations (December 20, 2021) through September 30, 2022. |
7. Industry Risk
If a Fund has significant investments in the securities of issuers within a particular industry, any development affecting that industry will have a greater impact on the value of the net assets of the Fund than would be the case if the Fund did not have significant investments in that industry. In addition, this may increase the risk of loss in the Fund and increase the volatility of the Fund’s NAV per share. Occasionally, market conditions, regulatory changes or other developments may negatively impact a particular industry. Under the Russell ICB Industry and Sector classification, equity companies are
64
CONESTOGA FUNDS
NOTES TO FINANCIAL STATEMENTS (Continued)
categorized within 11 industries and 45 sectors and 171 subsectors. As of September 30, 2022, the Funds had a significant value of their net assets invested in stocks within the Russell ICB industries as follows:
Fund | Russell ICB Industry | % Net Assets |
Small Cap Fund | Technology | 32.5% |
| | Industrials | 27.7% |
SMid Cap Fund | Industrials | 33.7% |
| | Technology | 21.6% |
Mid Cap Fund | Technology | 24.7% |
| | Industrials | 23.7% |
| | Health Care | 20.5% |
Micro Cap Fund | Industrials | 34.5% |
| | Health Care | 25.1% |
| | Technology | 24.0% |
The Funds consider companies to be “in the same industry” for purposes of industry concentration if the companies are categorized in the same Russell ICB subsector. As of September 30, 2022, the Small Cap Fund had 24.7% of its assets invested in stocks within the Software subsector under the Russell ICB Industry and Sector classification.
8. Contingencies and Commitments
The Funds indemnify the Trust’s officers and Trustees for certain liabilities that might arise from the performance of their duties to the Funds. Additionally, in the normal course of business, the Funds enter into contracts that contain a variety of representations and warranties and that provide general indemnifications. The Funds’ maximum exposure under these arrangements is unknown, as this would involve future claims that may be made against the Funds that have not yet occurred. However, based on experience, the Funds expect the risk of loss to be remote.
9. Recent Market Risk
The COVID-19 pandemic has caused financial markets to experience significant volatility and uncertainty exists as to its long-term impact. COVID-19 has resulted in, among other things, closing borders, quarantines, disruptions to supply chains and customer activity, as well as general concern and economic uncertainty. Although vaccines for COVID-19 have become more widely available, the impact of the outbreak and its variants may last for an extended period of time, and the pace of recovery may vary from market to market. The impact of epidemics and pandemics such as COVID-19 could affect the economies of many nations, individual companies and the market in general in ways that cannot necessarily be foreseen at the present time. As a result, a Fund’s performance and the
65
CONESTOGA FUNDS
NOTES TO FINANCIAL STATEMENTS (Continued)
ability to achieve its investment objective may be adversely impacted. Management continues to monitor the development of the pandemic and to evaluate its impact on the financial position and operating results of the Funds.
In February 2022, Russia commenced a military attack on Ukraine. The outbreak of hostilities between the two countries and the threat of wider-spread hostilities could have a severe adverse effect on the region and global economies, including significant negative impacts on the markets for certain securities and commodities, such as oil and natural gas. In addition, sanctions imposed on Russia by the United States and other countries, and any sanctions imposed in the future, could have a significant adverse impact on the Russian economy and related markets. The price and liquidity of investments may fluctuate widely as a result of the conflict and related events. How long the armed conflict and related events will last cannot be predicted. These tensions and any related events could have a significant impact on the Funds’ performance and the value of the Funds’ investments, even beyond any direct exposure a Fund may have to issuers in Russia or the adjoining geographic regions.
10. Subsequent Events
The Funds are required to recognize in the financial statements the effects of all subsequent events that provide additional evidence about conditions that existed as of the date of the Statements of Assets and Liabilities. For non-recognized subsequent events that must be disclosed to keep the financial statements from being misleading, the Funds are required to disclose the nature of the event as well as an estimate of its financial effect, or a statement that such an estimate cannot be made. Management has evaluated subsequent events through the issuance of these financial statements and has noted no such events.
66
CONESTOGA FUNDS
REPORT OF INDEPENDENT REGISTERED
PUBLIC ACCOUNTING FIRM
To the Board of Trustees of Conestoga Funds
and the Shareholders of Conestoga Small Cap Fund, Conestoga SMID Cap Fund,
Conestoga Mid Cap Fund, and Conestoga Micro Cap Fund
Opinion on the Financial Statements
We have audited the accompanying statements of assets and liabilities of Conestoga Small Cap Fund, Conestoga SMID Cap Fund, Conestoga Mid Cap Fund, and Conestoga Micro Cap Fund, each a series of shares of beneficial interest in Conestoga Funds (the “Funds”), including the schedules of investments, as of September 30, 2022, and the related statements of operations and changes in net assets and the financial highlights as noted in the table below, and the related notes (collectively referred to as the “financial statements”). In our opinion, the financial statements present fairly, in all material respects, the financial position of the Funds as of September 30, 2022, and the results of their operations, the changes in their net assets and their financial highlights for each of the periods noted in the table below, in conformity with accounting principles generally accepted in the United States of America.
Fund | | Financial Statements Presented |
Conestoga Small Cap Fund | | The statement of operations for the year ended September 30, 2022, the statements of changes in net assets for each of the years in the two-year period then ended and the financial highlights for each of the years in the five-year period then ended |
Conestoga SMID Cap Fund | | The statement of operations for the year ended September 30, 2022, the statements of changes in net assets for each of the years in the two-year period then ended and the financial highlights for each of the years in the five-year period then ended |
Conestoga Mid Cap Fund | | The statement of operations for the year ended September 30, 2022 and the statements of changes in net assets and financial highlights for the year ended September 30, 2022 and for the period June 29, 2021 (commencement of operations) to September 30, 2021 |
Conestoga Micro Cap Fund | | The statements of operations and changes in net assets and the financial highlights for the period December 20, 2021 (commencement of operations) to September 30, 2022 |
Basis for Opinion
These financial statements are the responsibility of the Funds’ management. Our responsibility is to express an opinion on the Funds’ financial statements based on our audits. We are a public accounting firm registered with the Public Company Accounting Oversight Board (United States) (“PCAOB”) and are required to be independent with respect to the Funds in accordance with the U.S. federal securities law and the applicable rules and regulations of the Securities and Exchange Commission and the PCAOB.
67
CONESTOGA FUNDS
REPORT OF INDEPENDENT REGISTERED
PUBLIC ACCOUNTING FIRM (Continued)
We conducted our audits in accordance with the standards of the PCAOB. Those standards require that we plan and perform the audits to obtain reasonable assurance about whether the financial statements are free of material misstatement, whether due to error or fraud. The Funds are not required to have, nor were we engaged to perform, an audit of their internal control over financial reporting. As part of our audits we are required to obtain an understanding of internal control over financial reporting but not for the purpose of expressing an opinion on the effectiveness of the Funds’ internal control over financial reporting. Accordingly, we express no such opinion.
Our audits included performing procedures to assess the risk of material misstatement of the financial statements, whether due to error or fraud, and performing procedures that respond to those risks. Such procedures included examining, on a test basis, evidence regarding the amounts and disclosures in the financial statements. Our procedures included confirmation of securities owned as of September 30, 2022 by correspondence with the custodian, brokers, or by other appropriate auditing procedures where replies from brokers were not received. Our audits also included evaluating the accounting principles used and significant estimates made by management, as well as evaluating the overall presentation of the financial statements. We believe that our audits provide a reasonable basis for our opinion.

BBD, LLP
We have served as the auditor of one or more of the Funds in the Conestoga Funds since 2004.
Philadelphia, Pennsylvania
November 21, 2022
68
CONESTOGA FUNDS
LIQUIDITY RISK MANAGEMENT PROGRAM (Unaudited)
Each Fund has adopted a Liquidity Risk Management Program (the “Program”) as required by rule 22e-4 under the Investment Company Act of 1940, as amended. The program seeks to assess, manage and review each Fund’s Liquidity Risk. “Liquidity Risk” is defined as the risk that a Fund could not meet requests to redeem shares issued by the Fund without significant dilution of remaining investors’ interest in the Fund.
The Board has approved the designation of Conestoga Capital Advisors, LLC (the “Adviser”), the investment adviser to the Funds, as the program administrator for the Program. The Adviser has established a Liquidity Committee (the “Committee”) to implement and provide day-to-day administration and oversight of the Program.
At a meeting held on May 12, 2022, the Board received and reviewed the annual written report of the Committee, on behalf of the Adviser (the “Report”) concerning the operation of the Program for the period from April 1, 2021 through March 31, 2022 (the “Reporting Period”). The Report addressed the operation of Program and assessed its adequacy and effectiveness of implementation.
The Report summarized the operation of the Program and the information and factors considered by the Committee in reviewing the adequacy and effectiveness of the Program’s implementation with respect to each Fund. The information and factors included, among other things: (i) the liquidity risk framework used to assess, manage and periodically review each Fund’s liquidity, and the results of this assessment; (ii) the inputs used to classify the liquidity of each Fund’s portfolio investments and the Committee’s assessment that each Fund’s strategy is appropriate for an open-end mutual fund; (iii) that each Fund held primarily highly liquid assets (investments that the Fund anticipates can be converted to cash within 3 business days or less in current market conditions without significantly changing their market value); (iv) that no Fund required the establishment of a highly liquid investment minimum and the methodology for that determination; (v) confirmation that none of the Funds had breached the 15% maximum illiquid security threshold (investments that cannot be sold or disposed of in seven days or less in current market conditions without the sale of the investments significantly changing the market value of the investment) and the procedures for monitoring compliance with the limit; and (vi) information regarding shareholder concentration in each Fund. The Report also noted that no changes were made to the Program.
Based on the review, the Report concluded that the Program was being effectively implemented and that the Program was designed to assess and manage each Fund’s liquidity risk.
69
CONESTOGA FUNDS
ABOUT YOUR FUNDS’ EXPENSES (Unaudited)
We believe it is important for you to understand the impact of costs on your investment. As a shareholder of the Funds, you incur ongoing costs, including management fees, Rule 12b-1 distribution fees (if applicable), shareholder servicing fees and other operating expenses. The following examples are intended to help you understand your ongoing costs (in dollars) of investing in the Funds and to compare these costs with the ongoing costs of investing in other mutual funds.
A mutual fund’s ongoing costs are expressed as a percentage of its average net assets. This figure is known as the expense ratio. The expenses in the tables below are based on an investment of $1,000 made at the beginning of the most recent period (April 1, 2022) and held until the end of the period (September 30, 2022).
The tables below illustrate each Fund’s ongoing costs in two ways:
Actual fund return – This section helps you to estimate the actual expenses that you paid over the period. The “Ending Account Value” shown is derived from each Fund’s actual return, and the fourth column shows the dollar amount of operating expenses that would have been paid by an investor who started with $1,000 in the Funds. You may use the information here, together with the amount you invested, to estimate the expenses that you paid over the period.
To do so, simply divide your account value by $1,000 (for example, an $8,600 account value divided by $1,000 = 8.6), then multiply the result by the number given for the Fund under the heading “Expenses Paid During Period.”
Hypothetical 5% return – This section is intended to help you compare each Fund’s ongoing costs with those of other mutual funds. It assumes that each Fund had an annual return of 5% before expenses during the period shown, but that the expense ratio is unchanged. In this case, because the return used is not the Funds’ actual return, the results do not apply to your investment. The example is useful in making comparisons because the SEC requires all mutual funds to calculate expenses based on a 5% return. You can assess each Fund’s ongoing costs by comparing this hypothetical example with the hypothetical examples that appear in shareholder reports of other funds.
Note that expenses shown in the table are meant to highlight and help you compare ongoing costs only. The Funds do not charge transaction fees, such as purchase or redemption fees, nor do they carry a “sales load.”
The calculations assume no shares were bought or sold during the period. Your actual costs may have been higher or lower, depending on the amount of your investment and the timing of any purchases or redemptions.
70
CONESTOGA FUNDS
ABOUT YOUR FUNDS’ EXPENSES (Unaudited) (Continued)
More information about the Funds’ expenses can be found in this report. For additional information on operating expenses and other shareholder costs, please refer to each Fund’s prospectus.
Conestoga Small Cap Fund | Beginning
Account Value
April 1, 2022 | Ending
Account Value
September 30,
2022 | Net
Expense
Ratio(a) | Expenses
Paid During
Period(b) |
Institutional Class | | | | |
Based on Actual Fund Return | $ 1,000.00 | $ 802.20 | 0.90% | $4.07 |
Based on Hypothetical 5% Return (before expenses) | $ 1,000.00 | $ 1,020.56 | 0.90% | $4.56 |
Investors Class | | | | |
Based on Actual Fund Return | $ 1,000.00 | $ 801.20 | 1.10% | $4.97 |
Based on Hypothetical 5% Return (before expenses) | $ 1,000.00 | $ 1,019.55 | 1.10% | $5.57 |
Conestoga SMid Cap Fund | | | | |
Institutional Class | | | | |
Based on Actual Fund Return | $ 1,000.00 | $ 780.20 | 0.85% | $3.79 |
Based on Hypothetical 5% Return (before expenses) | $ 1,000.00 | $ 1,020.81 | 0.85% | $4.31 |
Investors Class | | | | |
Based on Actual Fund Return | $ 1,000.00 | $ 779.10 | 1.10% | $4.91 |
Based on Hypothetical 5% Return (before expenses) | $ 1,000.00 | $ 1,019.55 | 1.10% | $5.57 |
Conestoga Mid Cap Fund | | | | |
Institutional Class | | | | |
Based on Actual Fund Return | $ 1,000.00 | $ 761.00 | 0.80% | $3.53 |
Based on Hypothetical 5% Return (before expenses) | $ 1,000.00 | $ 1,021.06 | 0.80% | $4.05 |
Investors Class | | | | |
Based on Actual Fund Return | $ 1,000.00 | $ 760.50 | 1.05% | $4.63 |
Based on Hypothetical 5% Return (before expenses) | $ 1,000.00 | $ 1,019.80 | 1.05% | $5.32 |
71
CONESTOGA FUNDS
ABOUT YOUR FUNDS’ EXPENSES (Unaudited) (Continued)
Conestoga Micro Cap Fund | Beginning
Account Value
April 1, 2022 | Ending
Account Value
September 30,
2022 | Net
Expense
Ratio(a) | Expenses
Paid During
Period(b) |
Institutional Class | | | | |
Based on Actual Fund Return | $ 1,000.00 | $ 790.80 | 1.25% | $5.61 |
Based on Hypothetical 5% Return (before expenses) | $ 1,000.00 | $ 1,018.80 | 1.25% | $6.33 |
Investors Class | | | | |
Based on Actual Fund Return | $ 1,000.00 | $ 789.50 | 1.50% | $6.73 |
Based on Hypothetical 5% Return (before expenses) | $ 1,000.00 | $ 1,017.55 | 1.50% | $7.59 |
(a) | Annualized, based on each Fund’s most recent one-half year expenses. |
(b) | Expenses are equal to each Fund’s annualized net expense ratio multiplied by the average account value over the period, multiplied by 183/365 (to reflect the one-half year period). |
72
CONESTOGA FUNDS
OTHER INFORMATION (Unaudited)
A description of the policies and procedures that the Funds use to vote proxies relating to portfolio securities is available without charge upon request by calling toll-free 1-800-494-2755, or on the SEC’s website at sec.gov. Information regarding how the Funds voted proxies relating to portfolio securities during the most recent 12-month period ended June 30 is available without charge upon request by calling toll-free 1-800-494-2755, or on the SEC’s website at sec.gov.
The Trust files a complete listing of portfolio holdings for the Funds with the SEC as of the end of the first and third quarters of each fiscal year as an exhibit to its reports on Form N-PORT. These filings are available upon request by calling 1-800-494-2755. Furthermore, you may obtain a copy of the filings on the SEC’s website at sec.gov and on the Funds’ website conestogafunds.com.
FEDERAL TAX INFORMATION (Unaudited)
For the fiscal year ended September 30, 2022, the Small Cap Fund designated $225,468,951 as long-term capital gain distributions.
73
CONESTOGA FUNDS
BOARD OF TRUSTEES AND EXECUTIVE OFFICERS (Unaudited)
The business and affairs of the Funds are managed under the direction of the Trust’s Board of Trustees. Information pertaining to the trustees and executive officers of the Trust as of September 30, 2022 are set forth below. No Trustee of the Trust is a “member of the immediate family” of any other Trustee or officer of the Trust. A “member of the immediate family” means any parent, spouse of a parent, child, spouse of a child, spouse, brother, or sister, and includes step and adoptive relationships (as defined in the Investment Company Act of 1940, as amended).
Name
(Birth Year) | Position(s)
Held with
the Funds | Term of
Office and
Length
of Time
Served1 | Principal Occupation
During Past Five Years | Number of
Portfolios
in Fund
Complex2
Overseen by
Trustee | Other
Directorships
Held by Trustee3 |
Independent Trustees 4: |
Nicholas J. Kovich
(1956) | Lead Independent Trustee | Trustee since 2002 and Lead Independent Trustee since 2011 | Managing Director, Beach Investment Counsel, from 2011 to 2018 and from 2022 to present; President and Chief Executive Officer, Kovich Capital Management (private asset management) since 2001; Managing Director, Morgan Stanley Investment Management from 1996 to 2001; General Partner, Miller Anderson & Sherrerd from 1988 to 1996; Vice President, Waddell & Reed, Inc. from 1982 to 1988. | 4 | Trustee, the Milestone Funds
(1 Portfolio)
(2007-2011) |
James G. Logue
(1956) | Trustee | Since 2013 | Shareholder, McCausland Keen + Buckman (“MKB”) (attorneys at law) since 1991; Associate, MKB from 1987 to 1990. | 4 | None |
Denise C. Marbach
(1954) | Trustee | Since 2018 | President, Gwynedd Mercy Academy High School (2017-Present); Partner, PricewaterhouseCoopers LLP (1998-2015); Partner, Coopers & Lybrand (1987-1998). | 4 | None |
74
CONESTOGA FUNDS
BOARD OF TRUSTEES AND EXECUTIVE OFFICERS (Unaudited) (Continued)
Name
(Birth Year) | Position(s)
Held with
the Funds | Term of
Office and
Length
of Time
Served1 | Principal Occupation
During Past Five Years | Number of
Portfolios
in Fund
Complex2
Overseen by
Trustee | Other
Directorships
Held by Trustee3 |
Independent Trustees 4 (Continued): |
M. Eugenie G. Logue
(1969) | Trustee | Since 2020 | Chief Financial Officer of Xponance, Inc (formerly FIS Group, Inc.) since 2018; Managing Director, Rosemont Investment Partners, LLC since 2002. | 4 | Independent Trustee of the Cheswold Lane Fund (2005-2015) |
James R. Warren
(1969) | Trustee | Since 2020 | Chief Operating Officer of FIDx since November 2022; Chief Operating Officer of Clark Capital Management from 2021 to 2022; Vice President & Managing Director of SEI Investments from 2004 to 2021. | 4 | None |
Interested Trustees 4: | | | |
Robert M. Mitchell5
(1969) | Chairman of the Board, Chief Executive Officer & Trustee | Trustee since 2011, Chief Executive Officer since 2019 and Chairman of the Board since 2020 | Managing Partner, Co-Founder and Portfolio Manager since 2001 of Conestoga Capital Advisors, LLC; Trustee of Academy of Notre Dame de Namur (a non-profit organization) since 2018. | 4 | None |
Mark S Clewett5
(1968) | Trustee & Senior Vice President | Trustee since 2020 & Senior Vice President since 2006 | President since 2018 and Director of Institutional Sales and Client Service since 2006 of Conestoga Capital Advisors, LLC; Board member and ambassador, For You Haiti (not-for profit relief organization) since 2019. | 4 | None |
75
CONESTOGA FUNDS
BOARD OF TRUSTEES AND EXECUTIVE OFFICERS (Unaudited) (Continued)
Name and
(Birth Year) | Position(s) Held with the
Funds; Term of Office and
Length of Time Served1 | Principal Occupation
During Past Five Years |
Executive Officers: |
Robert M. Mitchell
(1969) | Chairman of the Board since 2020; Chief Executive Officer since 2019 | Trustee of the Trust since 2011, Treasurer of the Trust from 2002-2019 and Managing Partner, Co-Founder and Portfolio Manager of Conestoga Capital Advisors, LLC since 2001; Trustee of Academy of Notre Dame de Namur (a non-profit organization) since 2018. |
Duane R. D’Orazio
(1972) | Secretary since 2002; Chief Compliance Officer since 2004 | Managing Partner and Co-Founder of Conestoga Capital Advisors, LLC since 2001 and Chief Compliance Officer of Conestoga Capital Advisors, LLC since 2007. |
Mark S. Clewett
(1968) | Senior Vice President since 2006 | Trustee of the Trust since 2020; Managing Partner, President of Conestoga Capital Advisors, LLC since 2018 and Director of Institutional Sales and Client Service of Conestoga Capital Advisors, LLC since 2006. |
Joseph F. Monahan
(1959) | Senior Vice President since 2009 and Treasurer since 2019 | Managing Partner, Portfolio Manager and Research Analyst of Conestoga Capital Advisors, LLC since 2008. |
Jennifer L. Leamer
(1976) | Assistant Treasurer since 2016 | Since 2014, SVP, Fund Accounting and Business Analyst from 2007 to 2014 of Ultimus Fund Solutions, LLC. |
Daniel D. Bauer
(1977) | Assistant Treasurer since 2016 | Since 2022, VP, Fund Accounting; AVP Fund Accounting from 2015 to 2022 and Fund Accounting Manager from 2012 to 2015 of Ultimus Fund Solutions, LLC. |
Stephen L. Preston
(1966) | Assistant Vice President and Anti- Money Laundering Officer since 2021 | Since 2011, Senior Vice President, Broker Dealer Chief Compliance Officer of Ultimus Fund Solutions, LLC |
1 | The Independent Trustees have adopted a retirement policy whereby an Independent Trustee shall retire effective as of December 31 of the year he or she reaches the age of 75. The Board of Trustees may, in its sole discretion, suspend the resignation requirement or postpone the effectiveness of the resignation with respect to an individual Independent Trustee. Aside from the Independent Trustee retirement policy, there is no defined term of office for service as a Trustee or Officer. Each Trustee and Officer serves until the earlier of resignation, retirement, removal, death, or the election of a qualified successor. |
2 | The “Fund Complex” consists of the Funds. |
3 | Directorships of companies required to report to the SEC under the Securities Exchange Act of 1934, as amended (i.e., “public companies”), or other investment companies registered under the 1940 Act. |
4 | Each Trustee may be contacted by writing to the Trustee, c/o Conestoga Funds, CrossPoint at Valley Forge, 550 E. Swedesford Road, Suite 120 East, Wayne, PA 19087. |
5 | Messrs. Mitchell and Clewett are deemed to be “interested persons” of the Trust by reason of their positions with the Funds’ Adviser. |
76
CONESTOGA FUNDS
BOARD OF TRUSTEES AND EXECUTIVE OFFICERS (Unaudited) (Continued)
Additional information about members of the Board of Trustees and executive officers is available in the Statement of Additional Information (“SAI”). To obtain a free copy of the SAI, please call 1-800-494-2755.
77
Interested Trustees Robert M. Mitchell, Chairman and
Chief Executive Officer
Mark S. Clewett, Senior Vice President Independent Trustees Nicholas J. Kovich
James G. Logue
Denise C. Marbach
M. Eugenie G. Logue
James R. Warren Investment Adviser Conestoga Capital Advisors, LLC
CrossPoint at Valley Forge
550 E. Swedesford Road, Suite 120 East
Wayne, PA 19087 Dividend Paying Agent,
Shareholders’ Servicing Agent,
Transfer Agent Ultimus Fund Solutions, LLC
225 Pictoria Drive, Suite 450
Cincinnati, OH 45246 Custodian UMB Bank, NA
928 Grand Blvd.
Kansas City, MO 64106 Distributor Ultimus Fund Distributors, LLC
225 Pictoria Drive, Suite 450
Cincinnati, OH 45246 | Independent Registered Public Accounting Firm BBD, LLP
1835 Market Street 3rd Floor
Philadelphia, PA 19103 Legal Counsel Faegre Drinker Biddle & Reath LLP
One Logan Square Suite 2000
Philadelphia, PA 19103 Conestoga Funds’ Officers Robert M. Mitchell, Chairman and
Chief Executive Officer
Duane R. D’Orazio, Secretary, Chief Compliance Officer
Mark S. Clewett, Senior Vice President
Joseph F. Monahan, Senior Vice President, Treasurer
Jennifer L. Leamer, Assistant Treasurer
Daniel D. Bauer, Assistant Treasurer
Stephen L. Preston, Assistant Vice President
and Anti-Money Laundering Officer |
This report is provided for the general information of the shareholders of the Conestoga Small Cap, SMid Cap, Mid Cap and Micro Cap Funds. This report is not intended for distribution to prospective investors in the Funds, unless preceded or accompanied by an effective prospectus.
Conestoga Funds-AR-22
Item 2. Code of Ethics.
As of the end of the period covered by this report, the registrant has adopted a code of ethics that applies to the registrant’s principal executive officer, principal financial officer, principal accounting officer or controller, or persons performing similar functions, regardless of whether these individuals are employed by the registrant or a third party. Pursuant to Item 13(a)(1), a copy of registrant’s code of ethics is filed as an exhibit to this Form N-CSR. During the period covered by this report, the code of ethics has not been amended, and the registrant has not granted any waivers, including implicit waivers, from the provisions of the code of ethics.
Item 3. Audit Committee Financial Expert.
The registrant’s board of trustees has determined that the registrant has at least one audit committee financial expert serving on its audit committee. The name of the audit committee financial expert is Nicholas J. Kovich. Mr. Kovich is “independent” for purposes of this Item.
Item 4. Principal Accountant Fees and Services.
| (a) | Audit Fees. The aggregate fees billed for professional services rendered by the principal accountant for the audit of the registrant’s annual financial statements or for services that are normally provided by the accountant in connection with statutory and regulatory filings or engagements were $47,500 and $31,400 with respect to the registrant’s fiscal years ended September 30, 2022 and 2021, respectively. |
| (b) | Audit-Related Fees. No fees were billed in either of the last two fiscal years for assurance and related services by the principal accountant that are reasonably related to the performance of the audit of the registrant’s financial statements and are not reported under paragraph (a) of this Item. |
| (c) | Tax Fees. The aggregate fees billed for professional services rendered by the principal accountant for tax compliance, tax advice, and tax planning were $12,000 and $9,000 with respect to the registrant’s fiscal years ended September 30, 2022 and 2021, respectively. The services comprising these fees are the preparation of the registrant’s federal income and excise tax returns. |
| (d) | All Other Fees. No fees were billed in either of the last two fiscal years for products and services provided by the principal accountant, other than the services reported in paragraphs (a) through (c) of this Item. |
| (e)(1) | The audit committee has adopted pre-approval policies and procedures described in paragraph (c)(7) of Rule 2-01 of Regulation S-X. |
| (e)(2) | None of the services described in paragraph (b) through (d) of this Item were approved by the audit committee pursuant to paragraph (c)(7)(i)(C) of Rule 2-01 of Regulation S-X. |
| (f) | Less than 50% of hours expended on the principal accountant’s engagement to audit the registrant’s financial statements for the most recent fiscal year were attributed to work performed by persons other than the principal accountant’s full-time, permanent employees. |
| (g) | With respect to the fiscal years ended September 30, 2022 and 2021, aggregate non-audit fees of $12,000 and $9,000, respectively, were billed by the registrant’s principal accountant for services rendered to the registrant. No non-audit fees were billed in either of the last two fiscal years by the registrant’s principal accountant for services rendered to the registrant’s investment adviser (not including any sub-adviser whose role is primarily portfolio management and is subcontracted with or overseen by another investment adviser), and any entity controlling, controlled by, or under common control with the adviser that provides ongoing services to the registrant. |
| (h) | The principal accountant has not provided any non-audit services to the registrant’s investment adviser (not including any sub-adviser whose role is primarily portfolio management and is subcontracted with or overseen by another investment adviser), and any entity controlling, controlled by, or under common control with the investment adviser that provides ongoing services to the registrant. |
Item 5. Audit Committee of Listed Registrants.
Not applicable
Item 6. Schedule of Investments.
| (a) | Schedule filed with Item 1 |
Item 7. Disclosure of Proxy Voting Policies and Procedures for Closed-End Management Investment Companies.
Not applicable
Item 8. Portfolio Managers of Closed-End Management Investment Companies.
Not applicable
Item 9. Purchases of Equity Securities by Closed-End Management Investment Company and Affiliated Purchasers.
Not applicable
Item 10. Submission of Matters to a Vote of Security Holders.
The registrant has not adopted procedures by which shareholders may recommend nominees to the registrant’s board of trustees.
Item 11. Controls and Procedures.
(a) Based on their evaluation of the registrant’s disclosure controls and procedures (as defined in Rule 30a-3(c) under the Investment Company Act of 1940) as of a date within 90 days of the filing date of this report, the registrant’s principal executive officer and principal financial officer have concluded that such disclosure controls and procedures are reasonably designed and are operating effectively to ensure that material information relating to the registrant, including its consolidated subsidiaries, is made known to them by others within those entities, particularly during the period in which this report is being prepared, and that the information required in filings on Form N-CSR is recorded, processed, summarized, and reported on a timely basis.
(b) There were no changes in the registrant’s internal control over financial reporting (as defined in Rule 30a-3(d) under the Investment Company Act of 1940) that occurred during the period covered by this report that have materially affected, or are reasonably likely to materially affect, the registrant’s internal control over financial reporting.
Item 12. Disclosure of Securities Lending Activities for Closed-End Management Investment Companies.
Not applicable
Item 13. Exhibits.
File the exhibits listed below as part of this Form. Letter or number the exhibits in the sequence indicated.
(a)(1) Any code of ethics, or amendment thereto, that is the subject of the disclosure required by Item 2, to the extent that the registrant intends to satisfy the Item 2 requirements through filing of an exhibit: Attached hereto
(a)(2) A separate certification for each principal executive officer and principal financial officer of the registrant as required by Rule 30a-2(a) under the Act (17 CFR 270.30a-2(a)): Attached hereto
(a)(3) Any written solicitation to purchase securities under Rule 23c-1 under the Act (17 CFR 270.23c-1) sent or given during the period covered by the report by or on behalf of the registrant to 10 or more persons: Not applicable
(a)(4) Change in the registrant’s independent public accountants: Not applicable
(b) Certifications required by Rule 30a-2(b) under the Act (17 CFR 270.30a-2(b)): Attached hereto
Exhibit 99.CODE ETH Code of Ethics
Exhibit 99.CERT Certifications required by Rule 30a-2(a) under the Act
Exhibit 99.906CERT Certifications required by Rule 30a-2(b) under the Act
SIGNATURES
Pursuant to the requirements of the Securities Exchange Act of 1934 and the Investment Company Act of 1940, the registrant has duly caused this report to be signed on its behalf by the undersigned, thereunto duly authorized.
| (Registrant) | Conestoga Funds | | |
| | | | |
| By (Signature and Title)* | /s/ Robert M. Mitchell. | |
| | | Robert M. Mitchell, Chief Executive Officer | |
| | | | |
| Date | December 5, 2022 | | |
| | | | |
| Pursuant to the requirements of the Securities Exchange Act of 1934 and the Investment Company Act of 1940, this report has been signed below by the following persons on behalf of the registrant and in the capacities and on the dates indicated. |
| | | | |
| By (Signature and Title)* | /s/ Robert M. Mitchell | |
| | | Robert M. Mitchell, Chief Executive Officer | |
| | | | |
| Date | December 5, 2022 | | |
| | | | |
| By (Signature and Title)* | /s/ Joseph F. Monahan | |
| | | Joseph F. Monahan, Treasurer and Principal Accounting Officer | |
| | | | |
| Date | December 5, 2022 | | |
* Print the name and title of each signing officer under his or her signature.