UNITED STATES
SECURITIES AND EXCHANGE COMMISSION
Washington, D.C. 20549
FORM N-CSR
CERTIFIED SHAREHOLDER REPORT OF REGISTERED
MANAGEMENT INVESTMENT COMPANIES
| Investment Company Act file number | 811-21120 | |
| Conestoga Funds |
| (Exact name of registrant as specified in charter) |
| 550 E. Swedesford Road, Suite 120 Wayne, PA | 19087 |
| (Address of principal executive offices) | (Zip code) |
| Conestoga Capital Advisors 550 E. Swedesford Road, Suite 120 Wayne, PA 19087 |
| (Name and address of agent for service) |
| |
| With Copy To: |
| Josh Deringer, Esq. |
| Faegre Drinker Biddle & Reath LLP |
| One Logan Square, Suite 2000 |
| Philadelphia, PA 19103 |
| Registrant's telephone number, including area code: | (800) 320-7790 |
| Date of fiscal year end: | September 30 | |
| | | |
| Date of reporting period: | September 30, 2024 | |
Form N-CSR is to be used by management investment companies to file reports with the Commission not later than 10 days after the transmission to stockholders of any report that is required to be transmitted to stockholders under Rule 30e-1 under the Investment Company Act of 1940 (17 CFR 270.30e-1). The Commission may use the information provided on Form N-CSR in its regulatory, disclosure review, inspection, and policymaking roles. A registrant is required to disclose the information specified by Form N-CSR, and the Commission will make this information public.
A registrant is not required to respond to the collection of information contained in Form N-CSR unless the Form displays a currently valid Office of Management and Budget (“OMB”) control number. Please direct comments concerning the accuracy of the information collection burden estimate and any suggestions for reducing the burden to Secretary, Securities and Exchange Commission, 450 Fifth Street, NW, Washington, DC 20549-0609. The OMB has reviewed this collection of information under the clearance requirements of 44 U.S.C. § 3507.
| Item 1. | Reports to Stockholders. |
Institutional Class (CCALX)
Annual Shareholder Report - September 30, 2024
This annual shareholder report contains important information about Conestoga Small Cap Fund (the "Fund") for the period of October 1, 2023 to September 30, 2024. You can find additional information about the Fund at https://conestogacapital.com/forms-information/. You can also request this information by contacting us at (800) 494-2755.
What were the Fund’s costs for the last year?
(based on a hypothetical $10,000 investment)
| Class Name | Costs of a $10,000 investment | Costs paid as a percentage of a $10,000 investment |
|---|
| Institutional Class | $99 | 0.90% |
How did the Fund perform in the past 12 months and what affected its performance?
Equity markets moved higher over the Fund's fiscal year ended September 30, 2024. Optimism rose over the period that the economy may achieve the always elusive soft landing as economic growth and employment remained positive, while inflation moved lower, albeit stubbornly. Confident in their progress to tame inflation and to sustain growth and employment, the U.S. Federal Reserve cut the Federal Funds rate by 50 basis points at its September 2024 meeting. The S&P 500 Index reached an all-time high on September 26th, before cooling in the final trading days of the Fund's fiscal year. The Russell 2000 Index remained roughly 10% below its peak achieved in November 2021. Relative valuations between large cap and small cap stocks remain at historically wide margins. Conestoga Capital Advisors, LLC continues to believe that small and mid-capitalization stocks are well positioned to outperform large caps in the years ahead.
For the twelve months ended September 30, 2024, the Fund underperformed the Russell 3000 Total Return Index and the Russell 2000 Growth Index. The underperformance was mainly due to negative stock selection in the Technology, Health Care, and Consumer Discretionary sectors. However, positive stock selection in the Industrials and Basic Materials sectors, along with no exposure to the underperforming Energy sector, provided some offset.
In Technology, the lack of exposure to Super Micro Computer, Inc. and MicroStrategy, Inc. was the biggest detractor. Positions in PROS Holdings, Inc. and Paycor HCM, Inc. also negatively impacted performance. In Consumer Discretionary, Fox Factory, Inc. and SiteOne Landscape Supply, Inc. led the decline. In Health Care, Stevenato Group was the largest detractor.
On the positive side, stock selection in Industrials and Basic Materials was strong. AAON, Inc., Construction Partners, Inc., and CSW Industrials, Inc. were the largest contributors. Balchem Corp. was the largest contributor in the Basic Materials sector.
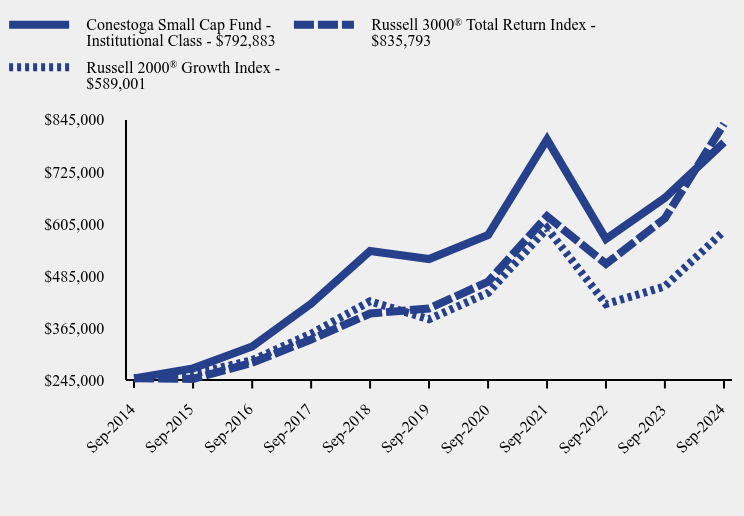
How has the Fund performed over the last ten years?
Total Return Based on $250,000 Investment
| Conestoga Small Cap Fund - Institutional Class | Russell 3000® Total Return Index | Russell 2000® Growth Index |
|---|
| Sep-2014 | $250,000 | $250,000 | $250,000 |
| Sep-2015 | $272,942 | $248,763 | $260,110 |
| Sep-2016 | $323,262 | $285,988 | $291,644 |
| Sep-2017 | $421,643 | $339,487 | $352,834 |
| Sep-2018 | $542,851 | $399,168 | $427,158 |
| Sep-2019 | $524,459 | $410,814 | $386,006 |
| Sep-2020 | $579,672 | $472,442 | $446,665 |
| Sep-2021 | $799,743 | $623,035 | $595,248 |
| Sep-2022 | $570,820 | $513,211 | $421,008 |
| Sep-2023 | $665,231 | $618,220 | $461,390 |
| Sep-2024 | $792,883 | $835,793 | $589,001 |
Average Annual Total Returns
(period ended September 30, 2024)
| 1 Year | 5 Years | 10 Years |
|---|
| Conestoga Small Cap Fund - Institutional Class | 19.19% | 8.62% | 12.23% |
Russell 3000® Total Return Index | 35.19% | 15.26% | 12.83% |
Russell 2000® Growth Index | 27.66% | 8.82% | 8.95% |
The Fund's past performance is not a good predictor of how the Fund will perform in the future. The graph and table do not reflect the deduction of taxes that a shareholder would pay on fund distributions or redemption of fund shares.
Fund Statistics
(as of September 30, 2024)
- Net Assets$4,306,073,856
- Total Number of Portfolio Holdings46
- Advisory Fee (net of waivers)$31,056,644
- Portfolio Turnover Rate16%
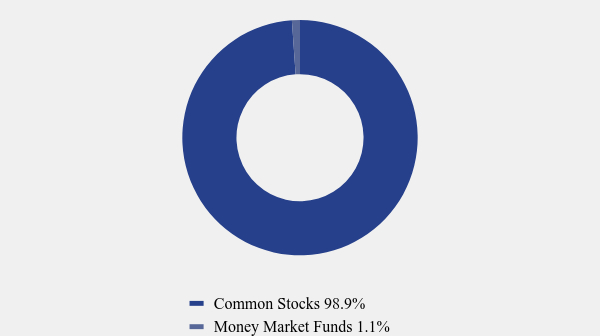
Asset Weighting (% of total investments)
(as of September 30, 2024)
| Value | Value |
|---|
| Common Stocks | 98.9% |
| Money Market Funds | 1.1% |
What did the Fund invest in?
Sector Weighting (% of net assets)
(as of September 30, 2024)
| Value | Value |
|---|
| Other Assets in Excess of Liabilities | 3.5% |
| Money Market Funds | 1.1% |
| Consumer Staples | 1.4% |
| Telecommunications | 1.4% |
| Financials | 2.4% |
| Consumer Discretionary | 3.0% |
| Real Estate | 3.5% |
| Utilities | 4.3% |
| Basic Materials | 5.9% |
| Health Care | 13.3% |
| Technology | 25.9% |
| Industrials | 34.3% |
Top 10 Holdings (% of net assets)
(as of September 30, 2024)
| Holding Name | % of Net Assets |
| Descartes Systems Group, Inc. (The) | 4.6% |
| Exponent, Inc. | 4.4% |
| Casella Waste Systems, Inc. - Class A | 4.3% |
| Simpson Manufacturing Company, Inc. | 4.0% |
| AAON, Inc. | 3.8% |
| Altair Engineering, Inc. - Class A | 3.5% |
| FirstService Corporation | 3.5% |
| SPS Commerce, Inc. | 3.4% |
| Novanta, Inc. | 3.4% |
| Construction Partners, Inc. - Class A | 3.3% |
No material changes occurred for the Fund during the year ended September 30, 2024.
To avoid sending duplicate copies of materials to households, mailings for accounts held by members of your household may be combined so that only one copy of each annual and semi-annual shareholder report will be mailed. If you prefer to receive multiple copies of the shareholder reports, you may request that by contacting us at (800) 494-2755. Householding will be stopped within 30 days after we receive your request.
Conestoga Small Cap Fund - Institutional Class (CCALX)
Annual Shareholder Report - September 30, 2024
Where can I find additional information about the Fund?
Additional information is available on the Fund's website (https://conestogacapital.com/forms-information/), including its:
Prospectus
Financial information
Holdings
Proxy voting information
Please scan to access the Fund's prospectus, financial information, and holdings.
Annual Shareholder Report - September 30, 2024
This annual shareholder report contains important information about Conestoga Small Cap Fund (the "Fund") for the period of October 1, 2023 to September 30, 2024. You can find additional information about the Fund at https://conestogacapital.com/forms-information/. You can also request this information by contacting us at (800) 494-2755.
What were the Fund’s costs for the last year?
(based on a hypothetical $10,000 investment)
| Class Name | Costs of a $10,000 investment | Costs paid as a percentage of a $10,000 investment |
|---|
| Investors Class | $120 | 1.10% |
How did the Fund perform in the past 12 months and what affected its performance?
Equity markets moved higher over the Fund's fiscal year ended September 30, 2024. Optimism rose over the period that the economy may achieve the always elusive soft landing as economic growth and employment remained positive, while inflation moved lower, albeit stubbornly. Confident in their progress to tame inflation and to sustain growth and employment, the U.S. Federal Reserve cut the Federal Funds rate by 50 basis points at its September 2024 meeting. The S&P 500 Index reached an all-time high on September 26th, before cooling in the final trading days of the Fund's fiscal year. The Russell 2000 Index remained roughly 10% below its peak achieved in November 2021. Relative valuations between large cap and small cap stocks remain at historically wide margins. Conestoga Capital Advisors, LLC continues to believe that small and mid-capitalization stocks are well positioned to outperform large caps in the years ahead.
For the twelve months ended September 30, 2024, the Fund underperformed the Russell 3000 Total Return Index and the Russell 2000 Growth Index. The underperformance was mainly due to negative stock selection in the Technology, Health Care, and Consumer Discretionary sectors. However, positive stock selection in the Industrials and Basic Materials sectors, along with no exposure to the underperforming Energy sector, provided some offset.
In Technology, the lack of exposure to Super Micro Computer, Inc. and MicroStrategy, Inc. was the biggest detractor. Positions in PROS Holdings, Inc. and Paycor HCM, Inc. also negatively impacted performance. In Consumer Discretionary, Fox Factory, Inc. and SiteOne Landscape Supply, Inc. led the decline. In Health Care, Stevenato Group was the largest detractor.
On the positive side, stock selection in Industrials and Basic Materials was strong. AAON, Inc., Construction Partners, Inc., and CSW Industrials, Inc. were the largest contributors. Balchem Corp. was the largest contributor in the Basic Materials sector.
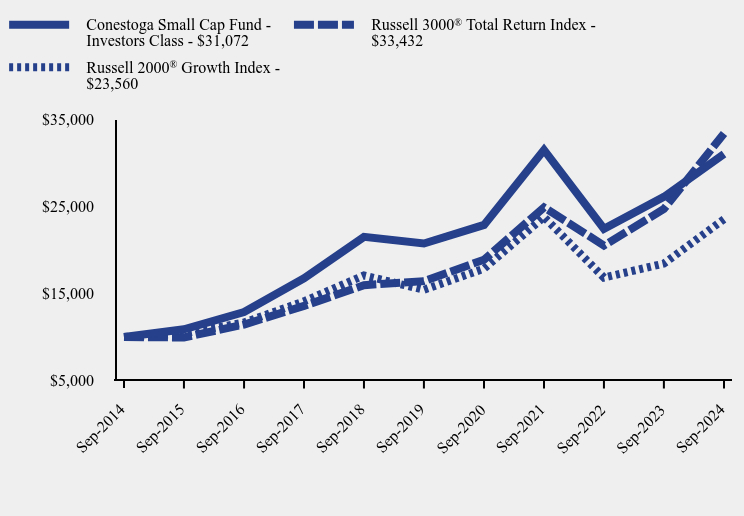
How has the Fund performed over the last ten years?
Total Return Based on $10,000 Investment
| Conestoga Small Cap Fund - Investors Class | Russell 3000® Total Return Index | Russell 2000® Growth Index |
|---|
| Sep-2014 | $10,000 | $10,000 | $10,000 |
| Sep-2015 | $10,895 | $9,951 | $10,404 |
| Sep-2016 | $12,876 | $11,440 | $11,666 |
| Sep-2017 | $16,759 | $13,579 | $14,113 |
| Sep-2018 | $21,530 | $15,967 | $17,086 |
| Sep-2019 | $20,762 | $16,433 | $15,440 |
| Sep-2020 | $22,899 | $18,898 | $17,867 |
| Sep-2021 | $31,533 | $24,921 | $23,810 |
| Sep-2022 | $22,458 | $20,528 | $16,840 |
| Sep-2023 | $26,125 | $24,729 | $18,456 |
| Sep-2024 | $31,072 | $33,432 | $23,560 |
Average Annual Total Returns
(period ended September 30, 2024)
| 1 Year | 5 Years | 10 Years |
|---|
| Conestoga Small Cap Fund - Investors Class | 18.94% | 8.40% | 12.00% |
Russell 3000® Total Return Index | 35.19% | 15.26% | 12.83% |
Russell 2000® Growth Index | 27.66% | 8.82% | 8.95% |
The Fund's past performance is not a good predictor of how the Fund will perform in the future. The graph and table do not reflect the deduction of taxes that a shareholder would pay on fund distributions or redemption of fund shares.
Fund Statistics
(as of September 30, 2024)
- Net Assets$4,306,073,856
- Total Number of Portfolio Holdings46
- Advisory Fee (net of waivers)$31,056,644
- Portfolio Turnover Rate16%
Asset Weighting (% of total investments)
(as of September 30, 2024)
| Value | Value |
|---|
| Common Stocks | 98.9% |
| Money Market Funds | 1.1% |
What did the Fund invest in?
Sector Weighting (% of net assets)
(as of September 30, 2024)
| Value | Value |
|---|
| Other Assets in Excess of Liabilities | 3.5% |
| Money Market Funds | 1.1% |
| Consumer Staples | 1.4% |
| Telecommunications | 1.4% |
| Financials | 2.4% |
| Consumer Discretionary | 3.0% |
| Real Estate | 3.5% |
| Utilities | 4.3% |
| Basic Materials | 5.9% |
| Health Care | 13.3% |
| Technology | 25.9% |
| Industrials | 34.3% |
Top 10 Holdings (% of net assets)
(as of September 30, 2024)
| Holding Name | % of Net Assets |
| Descartes Systems Group, Inc. (The) | 4.6% |
| Exponent, Inc. | 4.4% |
| Casella Waste Systems, Inc. - Class A | 4.3% |
| Simpson Manufacturing Company, Inc. | 4.0% |
| AAON, Inc. | 3.8% |
| Altair Engineering, Inc. - Class A | 3.5% |
| FirstService Corporation | 3.5% |
| SPS Commerce, Inc. | 3.4% |
| Novanta, Inc. | 3.4% |
| Construction Partners, Inc. - Class A | 3.3% |
No material changes occurred for the Fund during the year ended September 30, 2024.
To avoid sending duplicate copies of materials to households, mailings for accounts held by members of your household may be combined so that only one copy of each annual and semi-annual shareholder report will be mailed. If you prefer to receive multiple copies of the shareholder reports, you may request that by contacting us at (800) 494-2755. Householding will be stopped within 30 days after we receive your request.
Conestoga Small Cap Fund - Investors Class (CCASX)
Annual Shareholder Report - September 30, 2024
Where can I find additional information about the Fund?
Additional information is available on the Fund's website (https://conestogacapital.com/forms-information/), including its:
Prospectus
Financial information
Holdings
Proxy voting information
Please scan to access the Fund's prospectus, financial information, and holdings.
Institutional Class (CCSGX)
Annual Shareholder Report - September 30, 2024
This annual shareholder report contains important information about Conestoga SMid Cap Fund (the "Fund") for the period of October 1, 2023 to September 30, 2024. You can find additional information about the Fund at https://conestogacapital.com/forms-information/. You can also request this information by contacting us at (800) 494-2755.
What were the Fund’s costs for the last year?
(based on a hypothetical $10,000 investment)
| Class Name | Costs of a $10,000 investment | Costs paid as a percentage of a $10,000 investment |
|---|
| Institutional Class | $96 | 0.85% |
How did the Fund perform in the past 12 months and what affected its performance?
Equity markets moved higher over the Fund's fiscal year ended September 30, 2024. Optimism rose over the period that the economy may achieve the always elusive soft landing as economic growth and employment remained positive, while inflation moved lower, albeit stubbornly. Confident in their progress to tame inflation and to sustain growth and employment, the U.S. Federal Reserve cut the Federal Funds rate by 50 basis points at its September 2024 meeting. The S&P 500 Index reached an all-time high on September 26th, before cooling in the final trading days of the Funds’ fiscal year. The Russell 2000 Index remained roughly 10% below its peak achieved in November 2021. Relative valuations between large cap and small cap stocks remain at historically wide margins. Conestoga Capital Advisors, LLC continues to believe that small and mid-capitalization stocks are well positioned to outperform large caps in the years ahead.
The Fund modestly outperformed the Russell 2500 Growth Index over the year ended September 30, 2024. Outperformance was driven by positive stock selection as well as sector allocation effects. Relative to the Russell 3000 Total Return Index, which is heavily weighted to large cap stocks, the Fund underperformed due to its emphasis on smaller cap stocks, which underperformed large cap stocks over the reporting period.
Stock selection effects were most positive in the Industrials and Technology sectors. Within the Industrials sector, Fair Isaac Corporation and Construction Partners Inc. were the top contributors. Within Technology, Q2 Holdings Inc. and Guidewire Software Inc. were the leading contributors. Stock selection was challenged in the Health Care sector, where Stevenato Group SpA and West Pharmaceutical Services were the largest detractors.
Positive sector allocation was largely driven by the Fund’s zero weighting in the Energy sector. Energy was the only sector to decline over the reporting period. An overweight to the Industrials sector also added to returns relative to the Russell 2500 Growth Index.
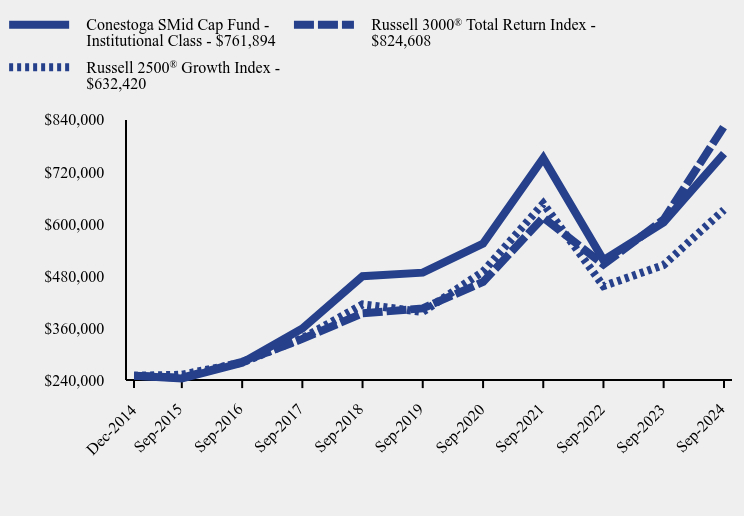
How has the Fund performed since inception?
Total Return Based on $250,000 Investment
| Conestoga SMid Cap Fund - Institutional Class | Russell 3000® Total Return Index | Russell 2500® Growth Index |
|---|
| Dec-2014 | $250,000 | $250,000 | $250,000 |
| Sep-2015 | $243,554 | $245,434 | $252,404 |
| Sep-2016 | $279,989 | $282,161 | $280,222 |
| Sep-2017 | $358,744 | $334,943 | $336,452 |
| Sep-2018 | $479,434 | $393,826 | $414,271 |
| Sep-2019 | $487,693 | $405,317 | $397,226 |
| Sep-2020 | $554,811 | $466,119 | $490,074 |
| Sep-2021 | $751,540 | $614,697 | $646,784 |
| Sep-2022 | $516,558 | $506,342 | $456,663 |
| Sep-2023 | $603,418 | $609,946 | $505,117 |
| Sep-2024 | $761,894 | $824,608 | $632,420 |
Average Annual Total Returns
(period ended September 30, 2024)
| 1 Year | 5 Years | Since Inception (December 15, 2014) |
|---|
| Conestoga SMid Cap Fund - Institutional Class | 26.26% | 9.33% | 12.05% |
Russell 3000® Total Return Index | 35.19% | 15.26% | 12.96% |
Russell 2500® Growth Index | 25.20% | 9.75% | 9.94% |
The Fund's past performance is not a good predictor of how the Fund will perform in the future. The graph and table do not reflect the deduction of taxes that a shareholder would pay on fund distributions or redemption of fund shares.
Fund Statistics
(as of September 30, 2024)
- Net Assets$754,069,962
- Total Number of Portfolio Holdings48
- Advisory Fee (net of waivers)$3,530,119
- Portfolio Turnover Rate10%
Asset Weighting (% of total investments)
(as of September 30, 2024)
| Value | Value |
|---|
| Common Stocks | 100.0% |
What did the Fund invest in?
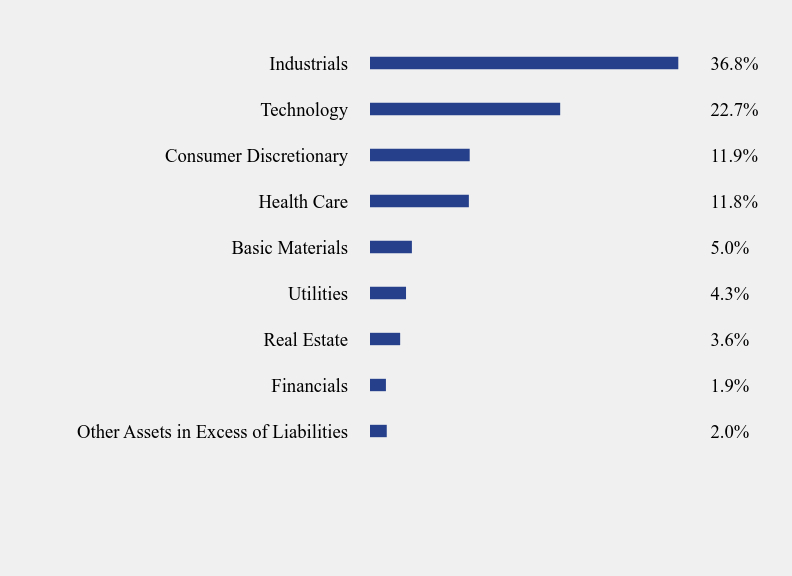
Sector Weighting (% of net assets)
(as of September 30, 2024)
| Value | Value |
|---|
| Other Assets in Excess of Liabilities | 2.0% |
| Financials | 1.9% |
| Real Estate | 3.6% |
| Utilities | 4.3% |
| Basic Materials | 5.0% |
| Health Care | 11.8% |
| Consumer Discretionary | 11.9% |
| Technology | 22.7% |
| Industrials | 36.8% |
Top 10 Holdings (% of net assets)
(as of September 30, 2024)
| Holding Name | % of Net Assets |
| Casella Waste Systems, Inc. - Class A | 4.3% |
| Exponent, Inc. | 3.7% |
| FirstService Corporation | 3.6% |
| Tyler Technologies, Inc. | 3.2% |
| Rollins, Inc. | 3.2% |
| Descartes Systems Group, Inc. (The) | 3.2% |
| Construction Partners, Inc. - Class A | 3.1% |
| Watsco, Inc. | 3.0% |
| HEICO Corporation - Class A | 2.8% |
| Merit Medical Systems, Inc. | 2.8% |
No material changes occurred for the Fund during the year ended September 30, 2024.
To avoid sending duplicate copies of materials to households, mailings for accounts held by members of your household may be combined so that only one copy of each annual and semi-annual shareholder report will be mailed. If you prefer to receive multiple copies of the shareholder reports, you may request that by contacting us at (800) 494-2755. Householding will be stopped within 30 days after we receive your request.
Conestoga SMid Cap Fund - Institutional Class (CCSGX)
Annual Shareholder Report - September 30, 2024
Where can I find additional information about the Fund?
Additional information is available on the Fund's website (https://conestogacapital.com/forms-information/), including its:
Prospectus
Financial information
Holdings
Proxy voting information
Please scan to access the Fund's prospectus, financial information, and holdings.
Annual Shareholder Report - September 30, 2024
This annual shareholder report contains important information about Conestoga SMid Cap Fund (the "Fund") for the period of October 1, 2023 to September 30, 2024. You can find additional information about the Fund at https://conestogacapital.com/forms-information/. You can also request this information by contacting us at (800) 494-2755.
What were the Fund’s costs for the last year?
(based on a hypothetical $10,000 investment)
| Class Name | Costs of a $10,000 investment | Costs paid as a percentage of a $10,000 investment |
|---|
| Investors Class | $124 | 1.10% |
How did the Fund perform in the past 12 months and what affected its performance?
Equity markets moved higher over the Fund's fiscal year ended September 30, 2024. Optimism rose over the period that the economy may achieve the always elusive soft landing as economic growth and employment remained positive, while inflation moved lower, albeit stubbornly. Confident in their progress to tame inflation and to sustain growth and employment, the U.S. Federal Reserve cut the Federal Funds rate by 50 basis points at its September 2024 meeting. The S&P 500 Index reached an all-time high on September 26th, before cooling in the final trading days of the Funds’ fiscal year. The Russell 2000 Index remained roughly 10% below its peak achieved in November 2021. Relative valuations between large cap and small cap stocks remain at historically wide margins. Conestoga Capital Advisors, LLC continues to believe that small and mid-capitalization stocks are well positioned to outperform large caps in the years ahead.
The Fund modestly outperformed the Russell 2500 Growth Index over the year ended September 30, 2024. Outperformance was driven by positive stock selection as well as sector allocation effects. Relative to the Russell 3000 Total Return Index, which is heavily weighted to large cap stocks, the Fund underperformed due to its emphasis on smaller cap stocks, which underperformed large cap stocks over the reporting period.
Stock selection effects were most positive in the Industrials and Technology sectors. Within the Industrials sector, Fair Isaac Corporation and Construction Partners Inc. were the top contributors. Within Technology, Q2 Holdings Inc. and Guidewire Software Inc. were the leading contributors. Stock selection was challenged in the Health Care sector, where Stevenato Group SpA and West Pharmaceutical Services were the largest detractors.
Positive sector allocation was largely driven by the Fund’s zero weighting in the Energy sector. Energy was the only sector to decline over the reporting period. An overweight to the Industrials sector also added to returns relative to the Russell 2500 Growth Index.
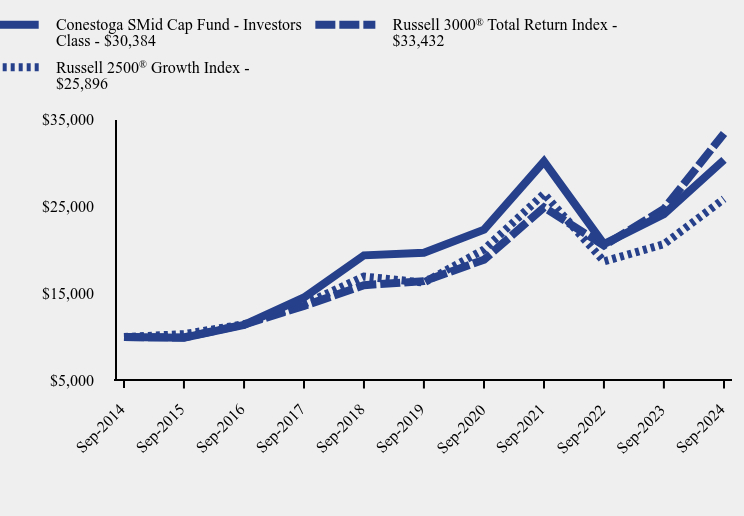
How has the Fund performed over the last ten years?
Total Return Based on $10,000 Investment
| Conestoga SMid Cap Fund - Investors Class | Russell 3000® Total Return Index | Russell 2500® Growth Index |
|---|
| Sep-2014 | $10,000 | $10,000 | $10,000 |
| Sep-2015 | $9,931 | $9,951 | $10,335 |
| Sep-2016 | $11,386 | $11,440 | $11,475 |
| Sep-2017 | $14,559 | $13,579 | $13,777 |
| Sep-2018 | $19,400 | $15,967 | $16,964 |
| Sep-2019 | $19,691 | $16,433 | $16,266 |
| Sep-2020 | $22,353 | $18,898 | $20,068 |
| Sep-2021 | $30,196 | $24,921 | $26,484 |
| Sep-2022 | $20,695 | $20,528 | $18,699 |
| Sep-2023 | $24,128 | $24,729 | $20,683 |
| Sep-2024 | $30,384 | $33,432 | $25,896 |
Average Annual Total Returns
(period ended September 30, 2024)
| 1 Year | 5 Years | 10 Years |
|---|
| Conestoga SMid Cap Fund - Investors Class | 25.93% | 9.06% | 11.75% |
Russell 3000® Total Return Index | 35.19% | 15.26% | 12.83% |
Russell 2500® Growth Index | 25.20% | 9.75% | 9.98% |
The Fund's past performance is not a good predictor of how the Fund will perform in the future. The graph and table do not reflect the deduction of taxes that a shareholder would pay on fund distributions or redemption of fund shares.
Fund Statistics
(as of September 30, 2024)
- Net Assets$754,069,962
- Total Number of Portfolio Holdings48
- Advisory Fee (net of waivers)$3,530,119
- Portfolio Turnover Rate10%
Asset Weighting (% of total investments)
(as of September 30, 2024)
| Value | Value |
|---|
| Common Stocks | 100.0% |
What did the Fund invest in?
Sector Weighting (% of net assets)
(as of September 30, 2024)
| Value | Value |
|---|
| Other Assets in Excess of Liabilities | 2.0% |
| Financials | 1.9% |
| Real Estate | 3.6% |
| Utilities | 4.3% |
| Basic Materials | 5.0% |
| Health Care | 11.8% |
| Consumer Discretionary | 11.9% |
| Technology | 22.7% |
| Industrials | 36.8% |
Top 10 Holdings (% of net assets)
(as of September 30, 2024)
| Holding Name | % of Net Assets |
| Casella Waste Systems, Inc. - Class A | 4.3% |
| Exponent, Inc. | 3.7% |
| FirstService Corporation | 3.6% |
| Tyler Technologies, Inc. | 3.2% |
| Rollins, Inc. | 3.2% |
| Descartes Systems Group, Inc. (The) | 3.2% |
| Construction Partners, Inc. - Class A | 3.1% |
| Watsco, Inc. | 3.0% |
| HEICO Corporation - Class A | 2.8% |
| Merit Medical Systems, Inc. | 2.8% |
No material changes occurred for the Fund during the year ended September 30, 2024.
To avoid sending duplicate copies of materials to households, mailings for accounts held by members of your household may be combined so that only one copy of each annual and semi-annual shareholder report will be mailed. If you prefer to receive multiple copies of the shareholder reports, you may request that by contacting us at (800) 494-2755. Householding will be stopped within 30 days after we receive your request.
Conestoga SMid Cap Fund - Investors Class (CCSMX)
Annual Shareholder Report - September 30, 2024
Where can I find additional information about the Fund?
Additional information is available on the Fund's website (https://conestogacapital.com/forms-information/), including its:
Prospectus
Financial information
Holdings
Proxy voting information
Please scan to access the Fund's prospectus, financial information, and holdings.
Institutional Class (CCMAX)
Annual Shareholder Report - September 30, 2024
This annual shareholder report contains important information about Conestoga Mid Cap Fund (the "Fund") for the period of October 1, 2023 to September 30, 2024. You can find additional information about the Fund at https://conestogacapital.com/forms-information/. You can also request this information by contacting us at (800) 494-2755.
What were the Fund’s costs for the last year?
(based on a hypothetical $10,000 investment)
| Class Name | Costs of a $10,000 investment | Costs paid as a percentage of a $10,000 investment |
|---|
| Institutional Class | $89 | 0.80% |
How did the Fund perform in the past 12 months and what affected its performance?
Equity markets moved higher over the Fund's fiscal year ended September 30, 2024. Optimism rose over the period that the economy may achieve the always elusive soft landing as economic growth and employment remained positive, while inflation moved lower, albeit stubbornly. Confident in their progress to tame inflation and to sustain growth and employment, the U.S. Federal Reserve cut the Federal Funds rate by 50 basis points at its September 2024 meeting. The S&P 500 Index reached an all-time high on September 26th, before cooling in the final trading days of the Fund's fiscal year. The Russell 2000 Index remained roughly 10% below its peak achieved in November 2021. Relative valuations between large cap and small cap stocks remain at historically wide margins. Conestoga Capital Advisors, LLC continues to believe that small and mid-capitalization stocks are well positioned to outperform large caps in the years ahead.
The Fund underperformed the Russell 3000 Total Return Index and the Russell Midcap Growth Index over the Fund's fiscal year ended September 30, 2024. Stock selection proved challenging over the period, which was the primary reason for the Fund’s underperformance.
Stock selection effects were negative in the Health Care, Industrials, Consumer Discretionary, and Real Estate sectors. Within Health Care, West Pharmaceutical Services Inc. was the leading detractor. Within Industrials, the Fund’s positions broadly performed well, within an average return of over 30% for the reporting period, but this failed to keep pace with the even stronger performance of the Russell Midcap Growth Index's Industrials holdings. This was also the case in the Consumer Discretionary sector, where the Fund’s holdings averaged a return of just under 30%, but this trailed the Russell Midcap Growth Index's Consumer Discretionary sector return of just under 40%.
Negative stock selection in the Real Estate sector was driven by a lack of exposure to real estate investment trusts which posted outsized returns, as these stocks benefited from falling interest rates.
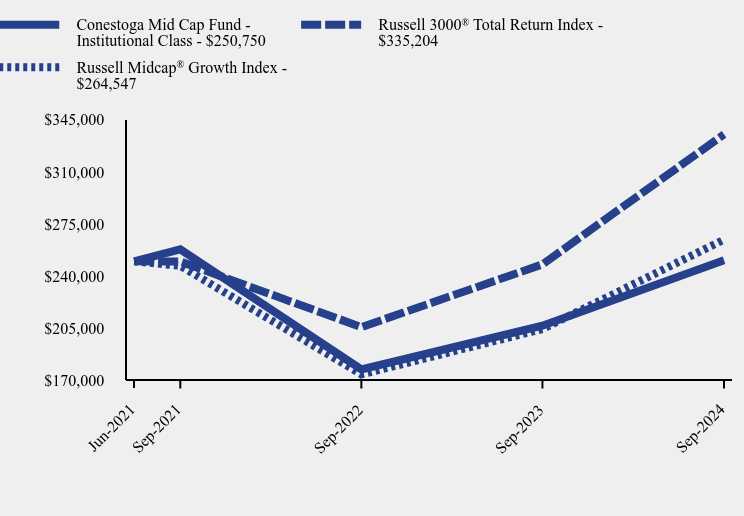
How has the Fund performed since inception?
Total Return Based on $250,000 Investment
| Conestoga Mid Cap Fund - Institutional Class | Russell 3000® Total Return Index | Russell Midcap® Growth Index |
|---|
| Jun-2021 | $250,000 | $250,000 | $250,000 |
| Sep-2021 | $258,000 | $249,875 | $246,988 |
| Sep-2022 | $177,500 | $205,829 | $174,131 |
| Sep-2023 | $206,750 | $247,944 | $204,545 |
| Sep-2024 | $250,750 | $335,204 | $264,547 |
Average Annual Total Returns
(period ended September 30, 2024)
| 1 Year | Since Inception (June 29, 2021) |
|---|
| Conestoga Mid Cap Fund - Institutional Class | 21.28% | 0.09% |
Russell 3000® Total Return Index | 35.19% | 9.43% |
Russell Midcap® Growth Index | 29.33% | 1.75% |
The Fund's past performance is not a good predictor of how the Fund will perform in the future. The graph and table do not reflect the deduction of taxes that a shareholder would pay on fund distributions or redemption of fund shares.
Fund Statistics
(as of September 30, 2024)
- Net Assets$3,155,651
- Total Number of Portfolio Holdings33
- Advisory Fee (net of waivers)$0
- Portfolio Turnover Rate5%
Asset Weighting (% of total investments)
(as of September 30, 2024)
| Value | Value |
|---|
| Common Stocks | 100.0% |
What did the Fund invest in?
Sector Weighting (% of net assets)
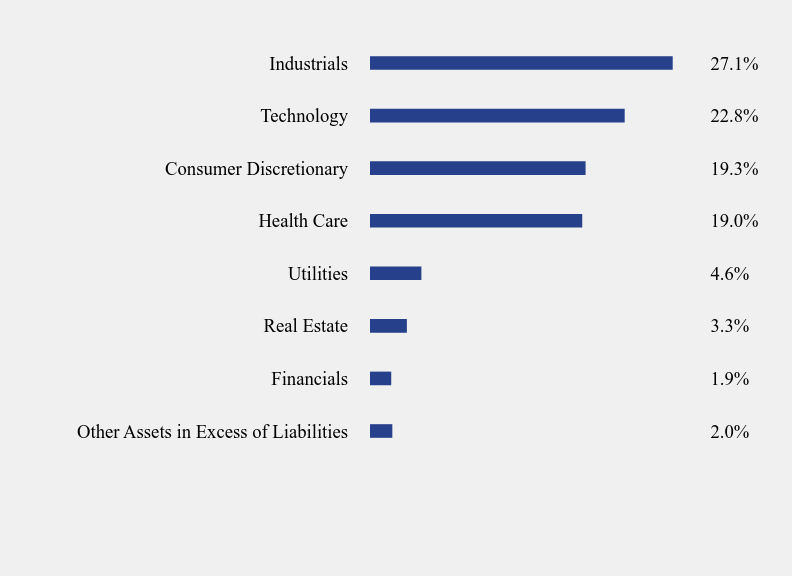
(as of September 30, 2024)
| Value | Value |
|---|
| Other Assets in Excess of Liabilities | 2.0% |
| Financials | 1.9% |
| Real Estate | 3.3% |
| Utilities | 4.6% |
| Health Care | 19.0% |
| Consumer Discretionary | 19.3% |
| Technology | 22.8% |
| Industrials | 27.1% |
Top 10 Holdings (% of net assets)
(as of September 30, 2024)
| Holding Name | % of Net Assets |
| Copart, Inc. | 5.5% |
| HEICO Corporation - Class A | 5.2% |
| Rollins, Inc. | 5.1% |
| Tyler Technologies, Inc. | 4.6% |
| Waste Connections, Inc. | 4.6% |
| Verisk Analytics, Inc. | 4.5% |
| Gartner, Inc. | 4.0% |
| Roper Technologies, Inc. | 3.5% |
| IDEXX Laboratories, Inc. | 3.4% |
| Pool Corporation | 3.3% |
No material changes occurred for the Fund during the year ended September 30, 2024.
To avoid sending duplicate copies of materials to households, mailings for accounts held by members of your household may be combined so that only one copy of each annual and semi-annual shareholder report will be mailed. If you prefer to receive multiple copies of the shareholder reports, you may request that by contacting us at (800) 494-2755. Householding will be stopped within 30 days after we receive your request.
Conestoga Mid Cap Fund - Institutional Class (CCMAX)
Annual Shareholder Report - September 30, 2024
Where can I find additional information about the Fund?
Additional information is available on the Fund's website (https://conestogacapital.com/forms-information/), including its:
Prospectus
Financial information
Holdings
Proxy voting information
Please scan to access the Fund's prospectus, financial information, and holdings.
Annual Shareholder Report - September 30, 2024
This annual shareholder report contains important information about Conestoga Mid Cap Fund (the "Fund") for the period of October 1, 2023 to September 30, 2024. You can find additional information about the Fund at https://conestogacapital.com/forms-information/. You can also request this information by contacting us at (800) 494-2755.
What were the Fund’s costs for the last year?
(based on a hypothetical $10,000 investment)
| Class Name | Costs of a $10,000 investment | Costs paid as a percentage of a $10,000 investment |
|---|
| Investors Class | $116 | 1.05% |
How did the Fund perform in the past 12 months and what affected its performance?
Equity markets moved higher over the Fund's fiscal year ended September 30, 2024. Optimism rose over the period that the economy may achieve the always elusive soft landing as economic growth and employment remained positive, while inflation moved lower, albeit stubbornly. Confident in their progress to tame inflation and to sustain growth and employment, the U.S. Federal Reserve cut the Federal Funds rate by 50 basis points at its September 2024 meeting. The S&P 500 Index reached an all-time high on September 26th, before cooling in the final trading days of the Fund's fiscal year. The Russell 2000 Index remained roughly 10% below its peak achieved in November 2021. Relative valuations between large cap and small cap stocks remain at historically wide margins. Conestoga Capital Advisors, LLC continues to believe that small and mid-capitalization stocks are well positioned to outperform large caps in the years ahead.
The Fund underperformed the Russell 3000 Total Return Index and the Russell Midcap Growth Index over the Fund's fiscal year ended September 30, 2024. Stock selection proved challenging over the period, which was the primary reason for the Fund’s underperformance.
Stock selection effects were negative in the Health Care, Industrials, Consumer Discretionary, and Real Estate sectors. Within Health Care, West Pharmaceutical Services Inc. was the leading detractor. Within Industrials, the Fund’s positions broadly performed well, within an average return of over 30% for the reporting period, but this failed to keep pace with the even stronger performance of the Russell Midcap Growth Index's Industrials holdings. This was also the case in the Consumer Discretionary sector, where the Fund’s holdings averaged a return of just under 30%, but this trailed the Russell Midcap Growth Index's Consumer Discretionary sector return of just under 40%.
Negative stock selection in the Real Estate sector was driven by a lack of exposure to real estate investment trusts which posted outsized returns, as these stocks benefited from falling interest rates.
How has the Fund performed since inception?
Total Return Based on $10,000 Investment
| Conestoga Mid Cap Fund - Investors Class | Russell 3000® Total Return Index | Russell Midcap® Growth Index |
|---|
| Jun-2021 | $10,000 | $10,000 | $10,000 |
| Sep-2021 | $10,310 | $9,995 | $9,880 |
| Sep-2022 | $7,080 | $8,233 | $6,965 |
| Sep-2023 | $8,230 | $9,918 | $8,182 |
| Sep-2024 | $9,950 | $13,408 | $10,582 |
Average Annual Total Returns
(period ended September 30, 2024)
| 1 Year | Since Inception (June 29, 2021) |
|---|
| Conestoga Mid Cap Fund - Investors Class | 20.90% | -0.15% |
Russell 3000® Total Return Index | 35.19% | 9.43% |
Russell Midcap® Growth Index | 29.33% | 1.75% |
The Fund's past performance is not a good predictor of how the Fund will perform in the future. The graph and table do not reflect the deduction of taxes that a shareholder would pay on fund distributions or redemption of fund shares.
Fund Statistics
(as of September 30, 2024)
- Net Assets$3,155,651
- Total Number of Portfolio Holdings33
- Advisory Fee (net of waivers)$0
- Portfolio Turnover Rate5%
Asset Weighting (% of total investments)
(as of September 30, 2024)
| Value | Value |
|---|
| Common Stocks | 100.0% |
What did the Fund invest in?
Sector Weighting (% of net assets)
(as of September 30, 2024)
| Value | Value |
|---|
| Other Assets in Excess of Liabilities | 2.0% |
| Financials | 1.9% |
| Real Estate | 3.3% |
| Utilities | 4.6% |
| Health Care | 19.0% |
| Consumer Discretionary | 19.3% |
| Technology | 22.8% |
| Industrials | 27.1% |
Top 10 Holdings (% of net assets)
(as of September 30, 2024)
| Holding Name | % of Net Assets |
| Copart, Inc. | 5.5% |
| HEICO Corporation - Class A | 5.2% |
| Rollins, Inc. | 5.1% |
| Tyler Technologies, Inc. | 4.6% |
| Waste Connections, Inc. | 4.6% |
| Verisk Analytics, Inc. | 4.5% |
| Gartner, Inc. | 4.0% |
| Roper Technologies, Inc. | 3.5% |
| IDEXX Laboratories, Inc. | 3.4% |
| Pool Corporation | 3.3% |
No material changes occurred for the Fund during the year ended September 30, 2024.
To avoid sending duplicate copies of materials to households, mailings for accounts held by members of your household may be combined so that only one copy of each annual and semi-annual shareholder report will be mailed. If you prefer to receive multiple copies of the shareholder reports, you may request that by contacting us at (800) 494-2755. Householding will be stopped within 30 days after we receive your request.
Conestoga Mid Cap Fund - Investors Class (CCMMX)
Annual Shareholder Report - September 30, 2024
Where can I find additional information about the Fund?
Additional information is available on the Fund's website (https://conestogacapital.com/forms-information/), including its:
Prospectus
Financial information
Holdings
Proxy voting information
Please scan to access the Fund's prospectus, financial information, and holdings.
Institutional Class (CMIRX)
Annual Shareholder Report - September 30, 2024
This annual shareholder report contains important information about Conestoga Discovery Fund (the "Fund") for the period of October 1, 2023 to September 30, 2024. You can find additional information about the Fund at https://conestogacapital.com/forms-information/. You can also request this information by contacting us at (800) 494-2755.
What were the Fund’s costs for the last year?
(based on a hypothetical $10,000 investment)
| Class Name | Costs of a $10,000 investment | Costs paid as a percentage of a $10,000 investment |
|---|
| Institutional Class | $135 | 1.25% |
How did the Fund perform in the past 12 months and what affected its performance?
Equity markets moved higher over the Fund's fiscal year ended September 30, 2024. Optimism rose over the period that the economy may achieve the always elusive soft landing as economic growth and employment remained positive, while inflation moved lower, albeit stubbornly. Confident in their progress to tame inflation and to sustain growth and employment, the U.S. Federal Reserve cut the Federal Funds rate by 50 basis points at its September 2024 meeting. The S&P 500 Index reached an all-time high on September 26th, before cooling in the final trading days of the Fund's fiscal year. The Russell 2000 Index remained roughly 10% below its peak achieved in November 2021. Relative valuations between large cap and small cap stocks remain at historically wide margins. Conestoga Capital Advisors, LLC continues to believe that small and mid-capitalization stocks are well positioned to outperform large caps in the years ahead.
For the twelve months ended September 30, 2024, the Fund underperformed the Russell 3000 Total Return Index and the Russell Micro Cap Growth Index. The underperformance was mainly due to negative stock selection in the Industrials and Health Care sectors. However, positive stock selection in the Financials sector, along with no exposure to the underperforming Basic Materials, Utilities, and Energy sectors, provided some offset.
In Industrials, our positions in SoundThinking, Inc. and Cryoport, Inc. were the biggest detractors. Positions in Montrose Environmental Group, Inc. also negatively impacted performance.
In Health Care, OrthoPediatrics Corp. and U.S. Physical Therapy, Inc. led the decline.
On the positive side, stock selection in Financials was strong. Our lone position in the space, Palomar Holdings, Inc. was the largest contributor. The Fund also benefited from being underweight the underperforming Consumer Discretionary sector.
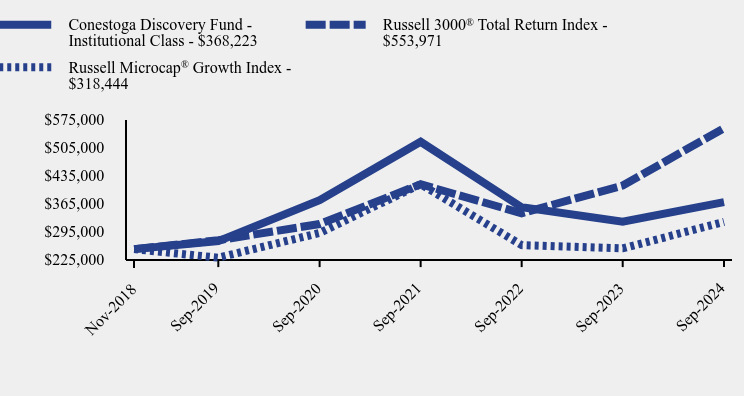
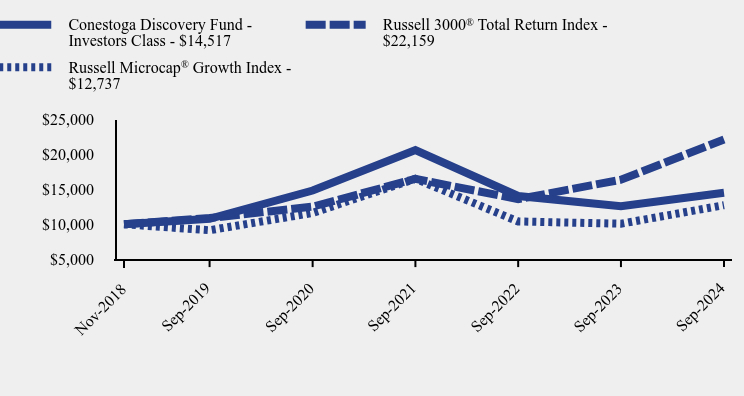
How has the Fund performed since inception?
Total Return Based on $250,000 Investment
| Conestoga Discovery Fund - Institutional Class | Russell 3000® Total Return Index | Russell Microcap® Growth Index |
|---|
| Nov-2018 | $250,000 | $250,000 | $249,999 |
| Sep-2019 | $270,213 | $272,292 | $228,531 |
| Sep-2020 | $372,904 | $313,139 | $290,702 |
| Sep-2021 | $519,635 | $412,953 | $413,116 |
| Sep-2022 | $355,162 | $340,161 | $260,047 |
| Sep-2023 | $318,993 | $409,761 | $251,975 |
| Sep-2024 | $368,223 | $553,971 | $318,444 |
Average Annual Total Returns
(period ended September 30, 2024)
| 1 Year | 5 Years | Since Inception (11/30/2018)* |
|---|
| Conestoga Discovery Fund - Institutional Class | 15.43% | 6.39% | 6.86% |
Russell 3000® Total Return Index | 35.19% | 15.26% | 14.61% |
Russell Microcap® Growth Index | 26.37% | 6.86% | 4.24% |
The Fund's past performance is not a good predictor of how the Fund will perform in the future. The graph and table do not reflect the deduction of taxes that a shareholder would pay on fund distributions or redemption of fund shares.
*Performance prior to December 20, 2021, is that of another investment vehicle (the “Predecessor Fund”) before the commencement of the Fund's operations. The Predecessor Fund was converted into the Fund on December 20, 2021. The Predecessor Fund was not registered under the Investment Company Act of 1940, as amended (the “1940 Act”), and thus was not subject to certain investment and operational restrictions that are imposed by the 1940 Act on registered investment companies and by the Internal Revenue Code of 1986 on regulated investment companies. If the Predecessor Fund had been registered under the 1940 Act, its performance may have been adversely affected. Returns for the Fund's shares reflect all charges, expenses and fees of the Predecessor Fund.
Fund Statistics
(as of September 30, 2024)
- Net Assets$4,296,435
- Total Number of Portfolio Holdings29
- Advisory Fee (net of waivers)$0
- Portfolio Turnover Rate32%
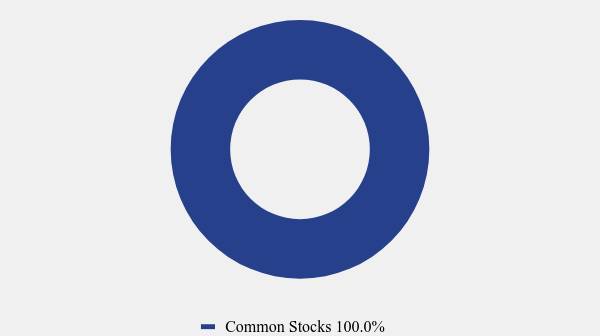
Asset Weighting (% of total investments)
(as of September 30, 2024)
| Value | Value |
|---|
| Common Stocks | 100.0% |
What did the Fund invest in?
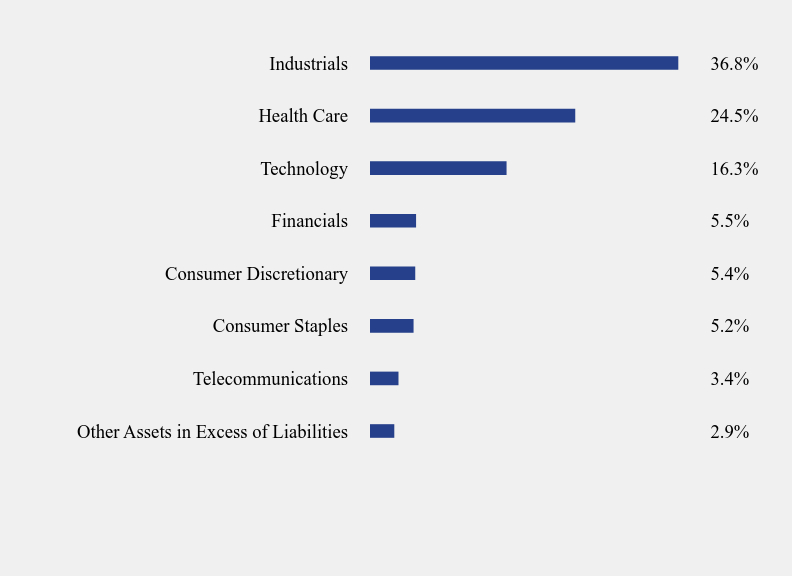
Sector Weighting (% of net assets)
(as of September 30, 2024)
| Value | Value |
|---|
| Other Assets in Excess of Liabilities | 2.9% |
| Telecommunications | 3.4% |
| Consumer Staples | 5.2% |
| Consumer Discretionary | 5.4% |
| Financials | 5.5% |
| Technology | 16.3% |
| Health Care | 24.5% |
| Industrials | 36.8% |
Top 10 Holdings (% of net assets)
(as of September 30, 2024)
| Holding Name | % of Net Assets |
| Palomar Holdings, Inc. | 5.5% |
| TECSYS, Inc. | 4.4% |
| Transcat, Inc. | 4.4% |
| Hillman Solutions Corporation | 4.4% |
| Phreesia, Inc. | 4.3% |
| Willdan Group, Inc. | 4.2% |
| Construction Partners, Inc. - Class A | 3.9% |
| BioLife Solutions, Inc. | 3.8% |
| Olo, Inc. - Class A | 3.6% |
| Energy Recovery, Inc. | 3.6% |
No material changes occurred for the Fund during the year ended September 30, 2024.
To avoid sending duplicate copies of materials to households, mailings for accounts held by members of your household may be combined so that only one copy of each annual and semi-annual shareholder report will be mailed. If you prefer to receive multiple copies of the shareholder reports, you may request that by contacting us at (800) 494-2755. Householding will be stopped within 30 days after we receive your request.
Conestoga Discovery Fund - Institutional Class (CMIRX)
Annual Shareholder Report - September 30, 2024
Where can I find additional information about the Fund?
Additional information is available on the Fund's website (https://conestogacapital.com/forms-information/), including its:
Prospectus
Financial information
Holdings
Proxy voting information
Please scan to access the Fund's prospectus, financial information, and holdings.
Annual Shareholder Report - September 30, 2024
This annual shareholder report contains important information about Conestoga Discovery Fund (the "Fund") for the period of October 1, 2023 to September 30, 2024. You can find additional information about the Fund at https://conestogacapital.com/forms-information/. You can also request this information by contacting us at (800) 494-2755.
What were the Fund’s costs for the last year?
(based on a hypothetical $10,000 investment)
| Class Name | Costs of a $10,000 investment | Costs paid as a percentage of a $10,000 investment |
|---|
| Investors Class | $161 | 1.50% |
How did the Fund perform in the past 12 months and what affected its performance?
Equity markets moved higher over the Fund's fiscal year ended September 30, 2024. Optimism rose over the period that the economy may achieve the always elusive soft landing as economic growth and employment remained positive, while inflation moved lower, albeit stubbornly. Confident in their progress to tame inflation and to sustain growth and employment, the U.S. Federal Reserve cut the Federal Funds rate by 50 basis points at its September 2024 meeting. The S&P 500 Index reached an all-time high on September 26th, before cooling in the final trading days of the Fund's fiscal year. The Russell 2000 Index remained roughly 10% below its peak achieved in November 2021. Relative valuations between large cap and small cap stocks remain at historically wide margins. Conestoga Capital Advisors, LLC continues to believe that small and mid-capitalization stocks are well positioned to outperform large caps in the years ahead.
For the twelve months ended September 30, 2024, the Fund underperformed the Russell 3000 Total Return Index and the Russell Micro Cap Growth Index. The underperformance was mainly due to negative stock selection in the Industrials and Health Care sectors. However, positive stock selection in the Financials sector, along with no exposure to the underperforming Basic Materials, Utilities, and Energy sectors, provided some offset.
In Industrials, our positions in SoundThinking, Inc. and Cryoport, Inc. were the biggest detractors. Positions in Montrose Environmental Group, Inc. also negatively impacted performance.
In Health Care, OrthoPediatrics Corp. and U.S. Physical Therapy, Inc. led the decline.
On the positive side, stock selection in Financials was strong. Our lone position in the space, Palomar Holdings, Inc. was the largest contributor. The Fund also benefited from being underweight the underperforming Consumer Discretionary sector.
How has the Fund performed since inception?
Total Return Based on $10,000 Investment
| Conestoga Discovery Fund - Investors Class | Russell 3000® Total Return Index | Russell Microcap® Growth Index |
|---|
| Nov-2018 | $10,000 | $10,000 | $9,999 |
| Sep-2019 | $10,786 | $10,892 | $9,141 |
| Sep-2020 | $14,848 | $12,526 | $11,627 |
| Sep-2021 | $20,638 | $16,518 | $16,524 |
| Sep-2022 | $14,059 | $13,606 | $10,401 |
| Sep-2023 | $12,603 | $16,390 | $10,079 |
| Sep-2024 | $14,517 | $22,159 | $12,737 |
Average Annual Total Returns
(period ended September 30, 2024)
| 1 Year | 5 Years | Since Inception (11/30/2018)* |
|---|
| Conestoga Discovery Fund - Investors Class | 15.19% | 6.12% | 6.60% |
Russell 3000® Total Return Index | 35.19% | 15.26% | 14.61% |
Russell Microcap® Growth Index | 26.37% | 6.86% | 4.24% |
The Fund's past performance is not a good predictor of how the Fund will perform in the future. The graph and table do not reflect the deduction of taxes that a shareholder would pay on fund distributions or redemption of fund shares.
*Performance prior to December 20, 2021, is that of another investment vehicle (the “Predecessor Fund”) before the commencement of the Fund's operations. The Predecessor Fund was converted into the Fund on December 20, 2021. The Predecessor Fund was not registered under the Investment Company Act of 1940, as amended (the “1940 Act”), and thus was not subject to certain investment and operational restrictions that are imposed by the 1940 Act on registered investment companies and by the Internal Revenue Code of 1986 on regulated investment companies. If the Predecessor Fund had been registered under the 1940 Act, its performance may have been adversely affected. Returns for the Fund's shares reflect all charges, expenses and fees of the Predecessor Fund.
Fund Statistics
(as of September 30, 2024)
- Net Assets$4,296,435
- Total Number of Portfolio Holdings29
- Advisory Fee (net of waivers)$0
- Portfolio Turnover Rate32%
Asset Weighting (% of total investments)
(as of September 30, 2024)
| Value | Value |
|---|
| Common Stocks | 100.0% |
What did the Fund invest in?
Sector Weighting (% of net assets)
(as of September 30, 2024)
| Value | Value |
|---|
| Other Assets in Excess of Liabilities | 2.9% |
| Telecommunications | 3.4% |
| Consumer Staples | 5.2% |
| Consumer Discretionary | 5.4% |
| Financials | 5.5% |
| Technology | 16.3% |
| Health Care | 24.5% |
| Industrials | 36.8% |
Top 10 Holdings (% of net assets)
(as of September 30, 2024)
| Holding Name | % of Net Assets |
| Palomar Holdings, Inc. | 5.5% |
| TECSYS, Inc. | 4.4% |
| Transcat, Inc. | 4.4% |
| Hillman Solutions Corporation | 4.4% |
| Phreesia, Inc. | 4.3% |
| Willdan Group, Inc. | 4.2% |
| Construction Partners, Inc. - Class A | 3.9% |
| BioLife Solutions, Inc. | 3.8% |
| Olo, Inc. - Class A | 3.6% |
| Energy Recovery, Inc. | 3.6% |
No material changes occurred for the Fund during the year ended September 30, 2024.
To avoid sending duplicate copies of materials to households, mailings for accounts held by members of your household may be combined so that only one copy of each annual and semi-annual shareholder report will be mailed. If you prefer to receive multiple copies of the shareholder reports, you may request that by contacting us at (800) 494-2755. Householding will be stopped within 30 days after we receive your request.
Conestoga Discovery Fund - Investors Class (CMCMX)
Annual Shareholder Report - September 30, 2024
Where can I find additional information about the Fund?
Additional information is available on the Fund's website (https://conestogacapital.com/forms-information/), including its:
Prospectus
Financial information
Holdings
Proxy voting information
Please scan to access the Fund's prospectus, financial information, and holdings.
As of the end of the period covered by this report, the registrant has adopted a code of ethics that applies to the registrant’s principal executive officer, principal financial officer, principal accounting officer or controller, or persons performing similar functions, regardless of whether these individuals are employed by the registrant or a third party. Pursuant to Item 12(a)(1), a copy of registrant’s code of ethics is filed as an exhibit to this Form N-CSR. During the period covered by this report, the code of ethics has not been amended, and the registrant has not granted any waivers, including implicit waivers, from the provisions of the code of ethics.
| Item 3. | Audit Committee Financial Expert. |
The registrant’s board of trustees has determined that the registrant has at least one audit committee financial expert serving on its audit committee. The name of the audit committee financial expert is Nicholas J. Kovich. Mr. Kovich is “independent” for purposes of this Item.
| Item 4. | Principal Accountant Fees and Services. |
| (a) | Audit Fees. The aggregate fees billed for professional services rendered by the principal accountant for the audit of the registrant’s annual financial statements or for services that are normally provided by the accountant in connection with statutory and regulatory filings or engagements were $53,100 and $47,500 with respect to the registrant’s fiscal years ended September 30, 2024 and 2023, respectively. |
| (b) | Audit-Related Fees. No fees were billed in either of the last two fiscal years for assurance and related services by the principal accountant that are reasonably related to the performance of the audit of the registrant’s financial statements and are not reported under paragraph (a) of this Item. |
| (c) | Tax Fees. The aggregate fees billed for professional services rendered by the principal accountant for tax compliance, tax advice, and tax planning were $12,000 and $12,000 with respect to the registrant’s fiscal years ended September 30, 2024 and 2023, respectively. The services comprising these fees are the preparation of the registrant’s federal income and excise tax returns. |
| (d) | All Other Fees. No fees were billed in either of the last two fiscal years for products and services provided by the principal accountant, other than the services reported in paragraphs (a) through (c) of this Item. |
| (e)(1) | The audit committee has not adopted pre-approval policies and procedures described in paragraph (c)(7) of Rule 2-01 of Regulation S-X. |
| (e)(2) | None of the services described in paragraph (b) through (d) of this Item were approved by the audit committee pursuant to paragraph (c)(7)(i)(C) of Rule 2-01 of Regulation S-X. |
| (f) | Less than 50% of hours expended on the principal accountant’s engagement to audit the registrant’s financial statements for the most recent fiscal year were attributed to work performed by persons other than the principal accountant’s full-time, permanent employees. |
| (g) | During the fiscal years ended September 30, 2024 and 2023, aggregate non-audit fees of $12,000 and $12,000, respectively, were billed by the registrant’s accountant for services rendered to the registrant. No non-audit fees were billed in either of the last two fiscal years by the registrant’s accountant for services rendered to the registrant’s investment adviser (not including any sub-adviser whose role is primarily portfolio management and is subcontracted with or overseen by another investment adviser), and any entity controlling, controlled by, or under common control with the adviser that provides ongoing services to the registrant. |
| (h) | The principal accountant has not provided any non-audit services to the registrant’s investment adviser (not including any sub-adviser whose role is primarily portfolio management and is subcontracted with or overseen by another investment adviser), and any entity controlling, controlled by, or under common control with the investment adviser that provides ongoing services to the registrant. |
| Item 5. | Audit Committee of Listed Registrants. |
Not applicable
| (a) | Not applicable [schedule filed under Item 7] |
| Item 7. | Financial Statements and Financial Highlights for Open-End Management Investment Companies |
(a)
Conestoga Funds
SMALL CAP FUND
SMID CAP FUND
MID CAP FUND
DISCOVERY FUND
M a n a g e d B y

ANNUAL FINANCIAL STATEMENTS
September 30, 2024
Table of Contents
Schedule of Investments | 1 |
Statements of Assets and Liabilities | 15 |
Statements of Operations | 17 |
Statements of Changes in Net Assets | 19 |
Financial Highlights | 23 |
Notes to Financial Statements | 31 |
Report of Independent Registered Public Accounting Firm | 48 |
Other Information | 50 |
Federal Tax Information | 50 |
CONESTOGA SMALL CAP FUND
SCHEDULE OF INVESTMENTS
September 30, 2024 |
COMMON STOCKS — 95.4% | | Shares | | | Value | |
Basic Materials — 5.9% | | | | | | | | |
Metal Fabricating — 3.0% | | | | | | | | |
RBC Bearings, Inc. (a) | | | 430,000 | | | $ | 128,733,400 | |
| | | | | | | | | |
Specialty Chemicals — 2.9% | | | | | | | | |
Balchem Corporation | | | 705,210 | | | | 124,116,960 | |
| | | | | | | | | |
Consumer Discretionary — 3.0% | | | | | | | | |
Home Improvement Retailers — 2.3% | | | | | | | | |
SiteOne Landscape Supply, Inc. (a) | | | 653,930 | | | | 98,684,576 | |
| | | | | | | | | |
Recreational Products — 0.7% | | | | | | | | |
Fox Factory Holding Corporation (a) | | | 748,888 | | | | 31,078,852 | |
| | | | | | | | | |
Consumer Staples — 1.4% | | | | | | | | |
Nondurable Household Products — 1.4% | | | | | | | | |
WD-40 Company | | | 233,526 | | | | 60,221,685 | |
| | | | | | | | | |
Financials — 2.4% | | | | | | | | |
Financial Data Providers — 2.4% | | | | | | | | |
Clearwater Analytics Holdings, Inc. - Class A (a) | | | 4,037,438 | | | | 101,945,310 | |
| | | | | | | | | |
Health Care — 13.3% | | | | | | | | |
Biotechnology — 1.4% | | | | | | | | |
Vericel Corporation (a) | | | 1,473,225 | | | | 62,243,756 | |
| | | | | | | | | |
Medical Equipment — 7.8% | | | | | | | | |
LeMaitre Vascular, Inc. (b) | | | 1,420,521 | | | | 131,952,196 | |
Merit Medical Systems, Inc. (a) | | | 1,330,720 | | | | 131,515,058 | |
Repligen Corporation (a) | | | 479,310 | | | | 71,330,914 | |
| | | | | | | | 334,798,168 | |
Medical Supplies — 4.1% | | | | | | | | |
Neogen Corporation (a) | | | 5,411,741 | | | | 90,971,366 | |
Stevanato Group S.p.A. (b) | | | 4,326,581 | | | | 86,531,620 | |
| | | | | | | | 177,502,986 | |
Industrials — 34.3% | | | | | | | | |
Building Materials: Other — 5.6% | | | | | | | | |
Simpson Manufacturing Company, Inc. | | | 901,090 | | | | 172,351,485 | |
Trex Company, Inc. (a) | | | 1,053,485 | | | | 70,141,031 | |
| | | | | | | | 242,492,516 | |
1
CONESTOGA SMALL CAP FUND
SCHEDULE OF INVESTMENTS (Continued) |
COMMON STOCKS — 95.4% (Continued) | | Shares | | | Value | |
Industrials — 34.3% (Continued) | | | | | | | | |
Building: Climate Control — 3.8% | | | | | | | | |
AAON, Inc. | | | 1,524,362 | | | $ | 164,387,198 | |
| | | | | | | | | |
Commercial Vehicles and Parts — 2.2% | | | | | | | | |
Federal Signal Corporation | | | 992,750 | | | | 92,782,415 | |
| | | | | | | | | |
Construction — 3.3% | | | | | | | | |
Construction Partners, Inc. - Class A (a) | | | 2,018,217 | | | | 140,871,547 | |
| | | | | | | | | |
Defense — 0.7% | | | | | | | | |
Mercury Systems, Inc. (a) | | | 771,883 | | | | 28,559,671 | |
| | | | | | | | | |
Diversified Industrials — 5.2% | | | | | | | | |
CSW Industrials, Inc. | | | 344,425 | | | | 126,193,876 | |
ESCO Technologies, Inc. | | | 753,480 | | | | 97,183,850 | |
| | | | | | | | 223,377,726 | |
Electronic Equipment Other — 1.3% | | | | | | | | |
SPX Technologies, Inc. (a) | | | 362,110 | | | | 57,742,061 | |
| | | | | | | | | |
Electronic Equipment: Control & Filter — 2.2% | | | | | | | | |
Helios Technologies, Inc. | | | 1,139,597 | | | | 54,358,777 | |
MSA Safety, Inc. | | | 233,325 | | | | 41,377,855 | |
| | | | | | | | 95,736,632 | |
Electronic Equipment: Gauges & Meters — 2.9% | | | | | | | | |
Mesa Laboratories, Inc. (b) | | | 363,985 | | | | 47,267,092 | |
Transcat, Inc. (a)(b) | | | 643,499 | | | | 77,715,374 | |
| | | | | | | | 124,982,466 | |
Engineering & Contracting Services — 4.4% | | | | | | | | |
Exponent, Inc. | | | 1,656,230 | | | | 190,930,194 | |
| | | | | | | | | |
Industrial Suppliers — 1.0% | | | | | | | | |
Hillman Solutions Corporation (a) | | | 4,142,683 | | | | 43,746,733 | |
| | | | | | | | | |
Machinery: Industrial — 1.1% | | | | | | | | |
John Bean Technologies Corporation | | | 474,080 | | | | 46,701,621 | |
| | | | | | | | | |
Professional Business Support Services — 0.6% | | | | | | | | |
UL Solutions, Inc. - Class A | | | 509,870 | | | | 25,136,591 | |
2
CONESTOGA SMALL CAP FUND
SCHEDULE OF INVESTMENTS (Continued) |
COMMON STOCKS — 95.4% (Continued) | | Shares | | | Value | |
Real Estate — 3.5% | | | | | | | | |
Real Estate Services — 3.5% | | | | | | | | |
FirstService Corporation | | | 817,435 | | | $ | 149,149,190 | |
| | | | | | | | | |
Technology — 25.9% | | | | | | | | |
Computer Services — 1.0% | | | | | | | | |
Workiva, Inc. (a) | | | 533,179 | | | | 42,185,122 | |
| | | | | | | | | |
Production Technology Equipment — 4.0% | | | | | | | | |
Azenta, Inc. (a) | | | 578,312 | | | | 28,013,433 | |
Novanta, Inc. (a) | | | 806,765 | | | | 144,346,394 | |
| | | | | | | | 172,359,827 | |
Software — 20.9% | | | | | | | | |
Agilysys, Inc. (a) | | | 205,286 | | | | 22,370,015 | |
Altair Engineering, Inc. - Class A (a) | | | 1,600,130 | | | | 152,828,416 | |
BlackLine, Inc. (a) | | | 1,264,865 | | | | 69,744,656 | |
CCC Intelligent Solutions Holdings, Inc. (a) | | | 5,508,150 | | | | 60,865,058 | |
Descartes Systems Group, Inc. (The) (a) | | | 1,929,046 | | | | 198,614,576 | |
Paycor HCM, Inc. (a) | | | 2,781,762 | | | | 39,473,203 | |
Q2 Holdings, Inc. (a) | | | 1,327,761 | | | | 105,915,495 | |
Simulations Plus, Inc. (b) | | | 1,266,380 | | | | 40,549,488 | |
SPS Commerce, Inc. (a) | | | 756,280 | | | | 146,846,888 | |
Vertex, Inc. - Class A (a) | | | 1,636,242 | | | | 63,011,679 | |
| | | | | | | | 900,219,474 | |
Telecommunications — 1.4% | | | | | | | | |
Telecommunications Equipment — 1.4% | | | | | | | | |
Digi International, Inc. (a)(b) | | | 2,276,606 | | | | 62,674,963 | |
| | | | | | | | | |
Utilities — 4.3% | | | | | | | | |
Waste & Disposal Services — 4.3% | | | | | | | | |
Casella Waste Systems, Inc. - Class A (a) | | | 1,845,335 | | | | 183,592,379 | |
| | | | | | | | | |
Total Common Stocks (Cost $2,308,945,698) | | | | | | $ | 4,106,954,019 | |
3
CONESTOGA SMALL CAP FUND
SCHEDULE OF INVESTMENTS (Continued) |
MONEY MARKET FUNDS — 1.1% | | Shares | | | Value | |
Fidelity Investments Money Market Treasury Portfolio - Class I, 4.83% (c) (Cost $46,855,155) | | | 46,855,155 | | | $ | 46,855,155 | |
| | | | | | | | | |
Total Investments at Value — 96.5% (Cost $2,355,800,853) | | | | | | $ | 4,153,809,174 | |
| | | | | | | | | |
Other Assets in Excess of Liabilities — 3.5% | | | | | | | 152,264,682 | |
| | | | | | | | | |
Net Assets — 100.0% | | | | | | $ | 4,306,073,856 | |
(a) | Non-income producing security. |
(b) | The Fund owned 5% or more of the company’s outstanding voting shares thereby making the company an affiliate of the Fund as that term is defined in the Investment Company Act of 1940 (Note 5). |
(c) | The rate shown is the 7-day effective yield as of September 30, 2024. |
Schedule of Investments uses the Russell ICB Industry and Sector classification. |
See accompanying notes to financial statements. |
4
CONESTOGA SMID CAP FUND
SCHEDULE OF INVESTMENTS
September 30, 2024 |
COMMON STOCKS — 98.0% | | Shares | | | Value | |
Basic Materials — 5.0% | | | | | | | | |
Metal Fabricating — 2.8% | | | | | | | | |
RBC Bearings, Inc. (a) | | | 69,435 | | | $ | 20,787,450 | |
| | | | | | | | | |
Specialty Chemicals — 2.2% | | | | | | | | |
Balchem Corporation | | | 94,430 | | | | 16,619,680 | |
| | | | | | | | | |
Consumer Discretionary — 11.9% | | | | | | | | |
Consumer Services: Miscellaneous — 3.2% | | | | | | | | |
Rollins, Inc. | | | 473,730 | | | | 23,961,263 | |
| | | | | | | | | |
Education Services — 2.1% | | | | | | | | |
Bright Horizons Family Solutions, Inc. (a) | | | 114,075 | | | | 15,985,330 | |
| | | | | | | | | |
Home Improvement Retailers — 2.0% | | | | | | | | |
SiteOne Landscape Supply, Inc. (a) | | | 99,580 | | | | 15,027,618 | |
| | | | | | | | | |
Hotels & Motels — 1.1% | | | | | | | | |
Vail Resorts, Inc. | | | 45,905 | | | | 8,000,782 | |
| | | | | | | | | |
Recreational Products — 2.2% | | | | | | | | |
Pool Corporation | | | 44,815 | | | | 16,886,292 | |
| | | | | | | | | |
Recreational Vehicles & Boats — 1.3% | | | | | | | | |
LCI Industries | | | 79,485 | | | | 9,581,122 | |
| | | | | | | | | |
Financials — 1.9% | | | | | | | | |
Financial Data Providers — 1.9% | | | | | | | | |
Clearwater Analytics Holdings, Inc. - Class A (a) | | | 558,280 | | | | 14,096,570 | |
| | | | | | | | | |
Health Care — 11.8% | | | | | | | | |
Medical Equipment — 5.3% | | | | | | | | |
Merit Medical Systems, Inc. (a) | | | 214,113 | | | | 21,160,788 | |
Repligen Corporation (a) | | | 129,880 | | | | 19,328,741 | |
| | | | | | | | 40,489,529 | |
5
CONESTOGA SMID CAP FUND
SCHEDULE OF INVESTMENTS (Continued) |
COMMON STOCKS — 98.0% (Continued) | | Shares | | | Value | |
Health Care — 11.8% (Continued) | | | | | | | | |
Medical Supplies — 6.5% | | | | | | | | |
Bio-Techne Corporation | | | 147,655 | | | $ | 11,802,064 | |
Neogen Corporation (a) | | | 585,496 | | | | 9,842,188 | |
Stevanato Group S.p.A. | | | 671,497 | | | | 13,429,940 | |
Teleflex, Inc. | | | 32,780 | | | | 8,107,150 | |
West Pharmaceutical Services, Inc. | | | 19,190 | | | | 5,760,070 | |
| | | | | | | | 48,941,412 | |
Industrials — 36.8% | | | | | | | | |
Aerospace — 2.8% | | | | | | | | |
HEICO Corporation - Class A | | | 104,505 | | | | 21,293,939 | |
| | | | | | | | | |
Building Materials: Other — 4.0% | | | | | | | | |
Simpson Manufacturing Company, Inc. | | | 78,400 | | | | 14,995,568 | |
Trex Company, Inc. (a) | | | 222,065 | | | | 14,785,088 | |
| | | | | | | | 29,780,656 | |
Building: Climate Control — 3.0% | | | | | | | | |
Watsco, Inc. | | | 46,205 | | | | 22,727,315 | |
| | | | | | | | | |
Construction — 3.1% | | | | | | | | |
Construction Partners, Inc. - Class A (a) | | | 337,050 | | | | 23,526,090 | |
| | | | | | | | | |
Defense — 3.1% | | | | | | | | |
Axon Enterprise, Inc. (a) | | | 46,965 | | | | 18,767,214 | |
Mercury Systems, Inc. (a) | | | 127,305 | | | | 4,710,285 | |
| | | | | | | | 23,477,499 | |
Diversified Industrials — 2.3% | | | | | | | | |
CSW Industrials, Inc. | | | 47,215 | | | | 17,299,104 | |
| | | | | | | | | |
Electronic Equipment Other — 1.3% | | | | | | | | |
SPX Technologies, Inc. (a) | | | 60,950 | | | | 9,719,087 | |
| | | | | | | | | |
Electronic Equipment: Control & Filter — 1.3% | | | | | | | | |
MSA Safety, Inc. | | | 55,850 | | | | 9,904,439 | |
| | | | | | | | | |
Electronic Equipment: Gauges & Meters — 0.8% | | | | | | | | |
Cognex Corporation | | | 155,660 | | | | 6,304,230 | |
| | | | | | | | | |
Engineering & Contracting Services — 3.7% | | | | | | | | |
Exponent, Inc. | | | 240,575 | | | | 27,733,486 | |
6
CONESTOGA SMID CAP FUND
SCHEDULE OF INVESTMENTS (Continued) |
COMMON STOCKS — 98.0% (Continued) | | Shares | | | Value | |
Industrials — 36.8% (Continued) | | | | | | | | |
Industrial Suppliers — 1.5% | | | | | | | | |
Hillman Solutions Corporation (a) | | | 1,036,295 | | | $ | 10,943,275 | |
| | | | | | | | | |
Machinery: Engines — 1.6% | | | | | | | | |
Generac Holdings, Inc. (a) | | | 74,310 | | | | 11,806,373 | |
| | | | | | | | | |
Machinery: Industrial — 2.1% | | | | | | | | |
EVI Industries, Inc. | | | 438,172 | | | | 8,469,865 | |
John Bean Technologies Corporation | | | 76,125 | | | | 7,499,074 | |
| | | | | | | | 15,968,939 | |
Machinery: Specialty — 2.3% | | | | | | | | |
Graco, Inc. | | | 201,890 | | | | 17,667,394 | |
| | | | | | | | | |
Professional Business Support Services — 1.8% | | | | | | | | |
Fair Isaac Corporation (a) | | | 6,995 | | | | 13,594,922 | |
| | | | | | | | | |
Transaction Processing Services — 2.1% | | | | | | | | |
Jack Henry & Associates, Inc. | | | 87,815 | | | | 15,502,860 | |
| | | | | | | | | |
Real Estate — 3.6% | | | | | | | | |
Real Estate Services — 3.6% | | | | | | | | |
FirstService Corporation | | | 150,130 | | | | 27,392,720 | |
| | | | | | | | | |
Technology — 22.7% | | | | | | | | |
Computer Services — 2.0% | | | | | | | | |
Gartner, Inc. (a) | | | 14,290 | | | | 7,241,600 | |
Workiva, Inc. (a) | | | 104,983 | | | | 8,306,255 | |
| | | | | | | | 15,547,855 | |
Production Technology Equipment — 2.6% | | | | | | | | |
Novanta, Inc. (a) | | | 109,605 | | | | 19,610,527 | |
| | | | | | | | | |
Software — 18.1% | | | | | | | | |
Altair Engineering, Inc. - Class A (a) | | | 143,665 | | | | 13,721,444 | |
CCC Intelligent Solutions Holdings, Inc. (a) | | | 927,395 | | | | 10,247,715 | |
Descartes Systems Group, Inc. (The) (a) | | | 231,660 | | | | 23,851,714 | |
Guidewire Software, Inc. (a) | | | 112,360 | | | | 20,555,138 | |
Paycor HCM, Inc. (a) | | | 595,295 | | | | 8,447,236 | |
Q2 Holdings, Inc. (a) | | | 209,465 | | | | 16,709,023 | |
SPS Commerce, Inc. (a) | | | 95,644 | | | | 18,571,196 | |
Tyler Technologies, Inc. (a) | | | 41,560 | | | | 24,259,403 | |
| | | | | | | | 136,362,869 | |
7
CONESTOGA SMID CAP FUND
SCHEDULE OF INVESTMENTS (Continued) |
COMMON STOCKS — 98.0% (Continued) | | Shares | | | Value | |
Utilities — 4.3% | | | | | | | | |
Waste & Disposal Services — 4.3% | | | | | | | | |
Casella Waste Systems, Inc. - Class A (a) | | | 327,125 | | | $ | 32,545,666 | |
| | | | | | | | | |
Total Investments at Value — 98.0% (Cost $535,112,855) | | | | | | $ | 739,086,293 | |
| | | | | | | | | |
Other Assets in Excess of Liabilities — 2.0% | | | | | | | 14,983,669 | |
| | | | | | | | | |
Net Assets — 100.0% | | | | | | $ | 754,069,962 | |
(a) | Non-income producing security. |
Schedule of Investments uses the Russell ICB Industry and Sector classification. |
See accompanying notes to financial statements. |
8
CONESTOGA MID CAP FUND
SCHEDULE OF INVESTMENTS
September 30, 2024 |
COMMON STOCKS — 98.0% | | Shares | | | Value | |
Consumer Discretionary — 19.3% | | | | | | | | |
Consumer Services: Miscellaneous — 10.6% | | | | | | | | |
Copart, Inc. (a) | | | 3,320 | | | $ | 173,968 | |
Rollins, Inc. | | | 3,195 | | | | 161,603 | |
| | | | | | | | 335,571 | |
Education Services — 2.5% | | | | | | | | |
Bright Horizons Family Solutions, Inc. (a) | | | 555 | | | | 77,772 | |
| | | | | | | | | |
Recreational Products — 3.3% | | | | | | | | |
Pool Corporation | | | 280 | | | | 105,504 | |
| | | | | | | | | |
Specialty Retail — 2.9% | | | | | | | | |
Tractor Supply Company | | | 310 | | | | 90,189 | |
| | | | | | | | | |
Financials — 1.9% | | | | | | | | |
Financial Data Providers — 1.9% | | | | | | | | |
FactSet Research Systems, Inc. | | | 130 | | | | 59,780 | |
| | | | | | | | | |
Health Care — 19.0% | | | | | | | | |
Health Care Services — 2.8% | | | | | | | | |
Veeva Systems, Inc. - Class A (a) | | | 420 | | | | 88,145 | |
| | | | | | | | | |
Medical Equipment — 8.4% | | | | | | | | |
IDEXX Laboratories, Inc. (a) | | | 210 | | | | 106,096 | |
Repligen Corporation (a) | | | 510 | | | | 75,898 | |
STERIS plc | | | 345 | | | | 83,677 | |
| | | | | | | | 265,671 | |
Medical Supplies — 7.8% | | | | | | | | |
Align Technology, Inc. (a) | | | 140 | | | | 35,604 | |
Bio-Techne Corporation | | | 985 | | | | 78,731 | |
Teleflex, Inc. | | | 165 | | | | 40,808 | |
West Pharmaceutical Services, Inc. | | | 305 | | | | 91,549 | |
| | | | | | | | 246,692 | |
Industrials — 27.1% | | | | | | | | |
Aerospace — 5.2% | | | | | | | | |
HEICO Corporation - Class A | | | 800 | | | | 163,008 | |
| | | | | | | | | |
Building: Climate Control — 2.9% | | | | | | | | |
Watsco, Inc. | | | 185 | | | | 90,998 | |
9
CONESTOGA MID CAP FUND
SCHEDULE OF INVESTMENTS (Continued) |
COMMON STOCKS — 98.0% (Continued) | | Shares | | | Value | |
Industrials — 27.1% (Continued) | | | | | | | | |
Electronic Equipment: Gauges & Meters — 2.0% | | | | | | | | |
Mettler-Toledo International, Inc. (a) | | | 42 | | | $ | 62,987 | |
| | | | | | | | | |
Electronic Equipment: Pollution Control — 2.1% | | | | | | | | |
Xylem, Inc. | | | 485 | | | | 65,490 | |
| | | | | | | | | |
Engineering & Contracting Services — 2.3% | | | | | | | | |
Exponent, Inc. | | | 630 | | | | 72,626 | |
| | | | | | | | | |
Machinery: Engines — 2.2% | | | | | | | | |
Generac Holdings, Inc. (a) | | | 440 | | | | 69,907 | |
| | | | | | | | | |
Machinery: Specialty — 3.0% | | | | | | | | |
Graco, Inc. | | | 1,100 | | | | 96,261 | |
| | | | | | | | | |
Professional Business Support Services — 4.5% | | | | | | | | |
Verisk Analytics, Inc. | | | 535 | | | | 143,359 | |
| | | | | | | | | |
Transaction Processing Services — 2.9% | | | | | | | | |
Jack Henry & Associates, Inc. | | | 510 | | | | 90,035 | |
| | | | | | | | | |
Real Estate — 3.3% | | | | | | | | |
Real Estate Services — 3.3% | | | | | | | | |
CoStar Group, Inc. (a) | | | 1,365 | | | | 102,976 | |
| | | | | | | | | |
Technology — 22.8% | | | | | | | | |
Computer Services — 4.0% | | | | | | | | |
Gartner, Inc. (a) | | | 250 | | | | 126,690 | |
| | | | | | | | | |
Software — 18.8% | | | | | | | | |
ANSYS, Inc. (a) | | | 210 | | | | 66,912 | |
Bentley Systems, Inc. - Class B | | | 1,180 | | | | 59,956 | |
Fortinet, Inc. (a) | | | 1,275 | | | | 98,876 | |
Guidewire Software, Inc. (a) | | | 470 | | | | 85,982 | |
Procore Technologies, Inc. (a) | | | 405 | | | | 24,997 | |
Roper Technologies, Inc. | | | 200 | | | | 111,288 | |
Tyler Technologies, Inc. (a) | | | 250 | | | | 145,930 | |
| | | | | | | | 593,941 | |
10
CONESTOGA MID CAP FUND
SCHEDULE OF INVESTMENTS (Continued) |
COMMON STOCKS — 98.0% (Continued) | | Shares | | | Value | |
Utilities — 4.6% | | | | | | | | |
Waste & Disposal Services — 4.6% | | | | | | | | |
Waste Connections, Inc. | | | 805 | | | $ | 143,950 | |
| | | | | | | | | |
Total Investments at Value — 98.0% (Cost $2,677,309) | | | | | | $ | 3,091,552 | |
| | | | | | | | | |
Other Assets in Excess of Liabilities — 2.0% | | | | | | | 64,099 | |
| | | | | | | | | |
Net Assets — 100.0% | | | | | | $ | 3,155,651 | |
(a) | Non-income producing security. |
Schedule of Investments uses the Russell ICB Industry and Sector classification. |
See accompanying notes to financial statements. |
11
CONESTOGA DISCOVERY FUND
SCHEDULE OF INVESTMENTS
September 30, 2024 |
COMMON STOCKS — 97.1% | | Shares | | | Value | |
Consumer Discretionary — 5.4% | | | | | | | | |
Education Services — 3.2% | | | | | | | | |
Universal Technical Institute, Inc. (a) | | | 8,475 | | | $ | 137,803 | |
| | | | | | | | | |
Entertainment — 2.2% | | | | | | | | |
Thunderbird Entertainment Group, Inc. (a) | | | 61,646 | | | | 92,469 | |
| | | | | | | | | |
Consumer Staples — 5.2% | | | | | | | | |
Food Products — 2.8% | | | | | | | | |
Mama’s Creations, Inc. (a) | | | 16,625 | | | | 121,362 | |
| | | | | | | | | |
Soft Drinks — 2.4% | | | | | | | | |
Vita Coco Company, Inc. (The) (a) | | | 3,600 | | | | 101,916 | |
| | | | | | | | | |
Financials — 5.5% | | | | | | | | |
Property & Casualty Insurance — 5.5% | | | | | | | | |
Palomar Holdings, Inc. (a) | | | 2,506 | | | | 237,243 | |
| | | | | | | | | |
Health Care — 24.5% | | | | | | | | |
Biotechnology — 6.7% | | | | | | | | |
Alpha Teknova, Inc. (a) | | | 30,716 | | | | 148,665 | |
Vericel Corporation (a) | | | 3,319 | | | | 140,228 | |
| | | | | | | | 288,893 | |
Health Care Facilities — 3.0% | | | | | | | | |
U.S. Physical Therapy, Inc. | | | 1,519 | | | | 128,553 | |
| | | | | | | | | |
Health Care Services — 4.3% | | | | | | | | |
Phreesia, Inc. (a) | | | 8,130 | | | | 185,283 | |
| | | | | | | | | |
Medical Equipment — 10.5% | | | | | | | | |
BioLife Solutions, Inc. (a) | | | 6,574 | | | | 164,613 | |
iRadimed Corporation | | | 2,790 | | | | 140,309 | |
OrthoPediatrics Corporation (a) | | | 5,364 | | | | 145,418 | |
| | | | | | | | 450,340 | |
12
CONESTOGA DISCOVERY FUND
SCHEDULE OF INVESTMENTS (Continued) |
COMMON STOCKS — 97.1% (Continued) | | Shares | | | Value | |
Industrials — 36.8% | | | | | | | | |
Construction — 3.9% | | | | | | | | |
Construction Partners, Inc. - Class A (a) | | | 2,403 | | | $ | 167,729 | |
| | | | | | | | | |
Electronic Equipment: Control & Filter — 3.6% | | | | | | | | |
Energy Recovery, Inc. (a) | | | 8,950 | | | | 155,641 | |
| | | | | | | | | |
Electronic Equipment: Gauges & Meters — 4.4% | | | | | | | | |
Transcat, Inc. (a) | | | 1,570 | | | | 189,609 | |
| | | | | | | | | |
Engineering & Contracting Services — 6.9% | | | | | | | | |
Bowman Consulting Group Ltd. (a) | | | 4,700 | | | | 113,176 | |
Willdan Group, Inc. (a) | | | 4,451 | | | | 182,269 | |
| | | | | | | | 295,445 | |
Industrial Suppliers — 5.7% | | | | | | | | |
CryoPort, Inc. (a) | | | 7,177 | | | | 58,205 | |
Hillman Solutions Corporation (a) | | | 17,810 | | | | 188,074 | |
| | | | | | | | 246,279 | |
Professional Business Support Services — 6.7% | | | | | | | | |
Montrose Environmental Group, Inc. (a) | | | 5,300 | | | | 139,390 | |
NV5 Global, Inc. (a) | | | 1,584 | | | | 148,072 | |
| | | | | | | | 287,462 | |
Security Services — 2.1% | | | | | | | | |
SoundThinking, Inc. (a) | | | 7,620 | | | | 88,316 | |
| | | | | | | | | |
Transaction Processing Services — 3.5% | | | | | | | | |
I3 Verticals, Inc. - Class A (a) | | | 7,052 | | | | 150,278 | |
| | | | | | | | | |
Technology — 16.3% | | | | | | | | |
Software — 16.3% | | | | | | | | |
Olo, Inc. - Class A (a) | | | 31,380 | | | | 155,645 | |
Planet Labs PBC (a) | | | 49,875 | | | | 111,221 | |
Q2 Holdings, Inc. (a) | | | 1,670 | | | | 133,216 | |
Simulations Plus, Inc. | | | 3,448 | | | | 110,405 | |
TECSYS, Inc. | | | 6,445 | | | | 190,192 | |
| | | | | | | | 700,679 | |
13
CONESTOGA DISCOVERY FUND
SCHEDULE OF INVESTMENTS (Continued) |
COMMON STOCKS — 97.1% (Continued) | | Shares | | | Value | |
Telecommunications — 3.4% | | | | | | | | |
Telecommunications Equipment — 3.4% | | | | | | | | |
Digi International, Inc. (a) | | | 5,390 | | | $ | 148,387 | |
| | | | | | | | | |
Total Investments at Value — 97.1% (Cost $3,818,117) | | | | | | $ | 4,173,687 | |
| | | | | | | | | |
Other Assets in Excess of Liabilities — 2.9% | | | | | | | 122,748 | |
| | | | | | | | | |
Net Assets — 100.0% | | | | | | $ | 4,296,435 | |
(a) | Non-income producing security. |
Schedule of Investments uses the Russell ICB Industry and Sector classification. |
See accompanying notes to financial statements. |
14
CONESTOGA FUNDS
STATEMENTS OF ASSETS AND LIABILITIES
September 30, 2024 |
| | Conestoga
Small Cap Fund | | | Conestoga
SMid Cap Fund | |
ASSETS | | | | | | | | |
Investments in unaffiliated securities, at cost | | $ | 1,986,110,640 | | | $ | 535,112,855 | |
Investments in affiliated securities, at cost | | | 369,690,213 | | | | — | |
Total investments, at cost | | $ | 2,355,800,853 | | | $ | 535,112,855 | |
Investments in unaffiliated securities, at value (Note 2) | | $ | 3,707,118,441 | | | $ | 739,086,293 | |
Investments in affiliated securities, at value (Notes 2 & 5) | | | 446,690,733 | | | | — | |
Total investments, at value | | | 4,153,809,174 | | | | 739,086,293 | |
Cash (Note 2) | | | 172,509,406 | | | | 15,783,184 | |
Receivable for capital shares sold | | | 3,264,899 | | | | 154,984 | |
Dividends and interest receivable | | | 1,225,917 | | | | 256,187 | |
Other assets | | | 58,108 | | | | 23,945 | |
Total assets | | | 4,330,867,504 | | | | 755,304,593 | |
| | | | | | | | | |
LIABILITIES | | | | | | | | |
Payable for capital shares redeemed | | | 3,871,453 | | | | 570,958 | |
Payable for investment securities purchased | | | 17,631,258 | | | | — | |
Payable to Adviser (Note 4) | | | 2,850,398 | | | | 485,186 | |
Accrued distribution and shareholder servicing fees (Note 4) | | | 237,097 | | | | 28,683 | |
Accrued Trustees’ fees (Note 4) | | | 58,199 | | | | 58,199 | |
Payable to administrator (Note 4) | | | 53,132 | | | | 11,972 | |
Accrued legal fees | | | 16,000 | | | | 16,000 | |
Accrued audit fees | | | 16,500 | | | | 15,000 | |
Accrued registration fees | | | 23,166 | | | | 37,707 | |
Other accrued expenses | | | 36,445 | | | | 10,926 | |
Total liabilities | | | 24,793,648 | | | | 1,234,631 | |
| | | | | | | | | |
CONTINGENCIES AND COMMITMENTS (NOTES 4 & 8) | | $ | — | | | $ | — | |
NET ASSETS | | $ | 4,306,073,856 | | | $ | 754,069,962 | |
| | | | | | | | | |
NET ASSETS CONSIST OF: | | | | | | | | |
Paid-in capital | | $ | 2,529,733,185 | | | $ | 570,929,355 | |
Distributable earnings | | | 1,776,340,671 | | | | 183,140,607 | |
NET ASSETS | | $ | 4,306,073,856 | | | $ | 754,069,962 | |
| | | | | | | | | |
NET ASSET VALUE PER SHARE: | | | | | | | | |
INSTITUTIONAL CLASS | | | | | | | | |
Net assets applicable to Institutional Class | | $ | 3,527,058,181 | | | $ | 711,282,744 | |
Institutional Class shares of beneficial interest outstanding (unlimited number of shares authorized, no par value) | | | 45,059,401 | | | | 26,851,158 | |
Net asset value, offering price and redemption price per share (Note 2) | | $ | 78.28 | | | $ | 26.49 | |
INVESTORS CLASS | | | | | | | | |
Net assets applicable to Investors Class | | $ | 779,015,675 | | | $ | 42,787,218 | |
Investors Class shares of beneficial interest outstanding (unlimited number of shares authorized, no par value) | | | 10,188,273 | | | | 1,655,985 | |
Net asset value, offering price and redemption price per share (Note 2) | | $ | 76.46 | | | $ | 25.84 | |
See accompanying notes to financial statements. |
15
CONESTOGA FUNDS
STATEMENTS OF ASSETS AND LIABILITIES
September 30, 2024 (Continued) |
| | Conestoga
Mid Cap Fund | | | Conestoga
Discovery Fund | |
ASSETS | | | | | | | | |
Investments in unaffiliated securities, at cost | | $ | 2,677,309 | | | $ | 3,818,117 | |
Investments in unaffiliated securities, at value (Note 2) | | $ | 3,091,552 | | | $ | 4,173,687 | |
Cash (Note 2) | | | 66,263 | | | | 149,476 | |
Receivable due from Adviser (Note 4) | | | 18,771 | | | | 4,914 | |
Receivable for capital shares sold | | | 200 | | | | — | |
Dividends and interest receivable | | | 248 | | | | 963 | |
Other assets | | | 24,312 | | | | 17,097 | |
Total assets | | | 3,201,346 | | | | 4,346,137 | |
| | | | | | | | | |
LIABILITIES | | | | | | | | |
Accrued distribution and shareholder servicing fees (Note 4) | | | 6,001 | | | | 9,396 | |
Accrued Trustees’ fees (Note 4) | | | 771 | | | | 1,080 | |
Payable to administrator (Note 4) | | | 6,330 | | | | 6,340 | |
Accrued legal fees | | | 16,000 | | | | 16,000 | |
Accrued audit fees | | | 15,000 | | | | 15,000 | |
Other accrued expenses | | | 1,593 | | | | 1,886 | |
Total liabilities | | | 45,695 | | | | 49,702 | |
| | | | | | | | | |
CONTINGENCIES AND COMMITMENTS (NOTES 4 & 8) | | $ | — | | | $ | — | |
NET ASSETS | | $ | 3,155,651 | | | $ | 4,296,435 | |
| | | | | | | | | |
NET ASSETS CONSIST OF: | | | | | | | | |
Paid-in capital | | $ | 2,955,892 | | | $ | 4,359,425 | |
Distributable earnings (accumulated deficit) | | | 199,759 | | | | (62,990 | ) |
NET ASSETS | | $ | 3,155,651 | | | $ | 4,296,435 | |
| | | | | | | | | |
NET ASSET VALUE PER SHARE: | | | | | | | | |
INSTITUTIONAL CLASS | | | | | | | | |
Net assets applicable to Institutional Class | | $ | 2,630,929 | | | $ | 2,221,541 | |
Institutional Class shares of beneficial interest outstanding (unlimited number of shares authorized, no par value) | | | 262,282 | | | | 303,257 | |
Net asset value, offering price and redemption price per share (Note 2) | | $ | 10.03 | | | $ | 7.33 | |
INVESTORS CLASS | | | | | | | | |
Net assets applicable to Investors Class | | $ | 524,722 | | | $ | 2,074,894 | |
Investors Class shares of beneficial interest outstanding (unlimited number of shares authorized, no par value) | | | 52,747 | | | | 285,100 | |
Net asset value, offering price and redemption price per share (Note 2) | | $ | 9.95 | | | $ | 7.28 | |
See accompanying notes to financial statements. |
16
CONESTOGA FUNDS
STATEMENTS OF OPERATIONS
For the Year Ended September 30, 2024 |
| | Conestoga
Small Cap Fund | | | Conestoga
SMid Cap Fund | |
INVESTMENT INCOME | | | | | | | | |
Dividend income from unaffiliated investments | | $ | 10,198,693 | | | $ | 2,565,151 | |
Dividend income from affiliated investments (Note 5) | | | 2,362,151 | | | | — | |
Foreign withholding taxes on dividends | | | (211,380 | ) | | | (32,369 | ) |
Interest | | | 4,478,886 | | | | 500,273 | |
Total investment income | | | 16,828,350 | | | | 3,033,055 | |
| | | | | | | | | |
EXPENSES | | | | | | | | |
Management fees (Note 4) | | | 34,999,231 | | | | 4,451,442 | |
Shareholder servicing fees (Note 4) | | | | | | | | |
Institutional Class | | | 1,759,557 | | | | 261,616 | |
Investors Class | | | 365,198 | | | | 21,413 | |
Distribution fees - Investors Class (Note 4) | | | 1,825,999 | | | | 107,065 | |
Trustees’ fees and expenses (Note 4) | | | 233,491 | | | | 233,491 | |
Fund accounting fees (Note 4) | | | 276,090 | | | | 105,846 | |
Transfer agent fees (Note 4) | | | | | | | | |
Institutional Class | | | 137,980 | | | | 10,454 | |
Investors Class | | | 207,129 | | | | 11,517 | |
Registration and filing fees | | | 153,874 | | | | 91,157 | |
Custody and bank service fees | | | 192,041 | | | | 40,431 | |
Legal fees | | | 81,877 | | | | 81,877 | |
Postage and supplies | | | 75,372 | | | | 12,245 | |
Insurance expense | | | 35,375 | | | | 3,892 | |
Audit and tax services fees | | | 16,932 | | | | 15,432 | |
Shareholder reporting expenses | | | 13,091 | | | | 7,049 | |
Administration fees (Note 4) | | | 5,575 | | | | 5,575 | |
Borrowing expenses | | | — | | | | 1,924 | |
Other expenses | | | 23,838 | | | | 17,401 | |
Total expenses | | | 40,402,650 | | | | 5,479,827 | |
Fee reductions and expense reimbursements by the Adviser (Note 4) | | | (3,942,587 | ) | | | (921,323 | ) |
Net expenses | | | 36,460,063 | | | | 4,558,504 | |
| | | | | | | | | |
NET INVESTMENT LOSS | | | (19,631,713 | ) | | | (1,525,449 | ) |
| | | | | | | | | |
REALIZED AND UNREALIZED GAINS (LOSSES) ON INVESTMENTS | | | | | | | | |
Net realized gains (losses) from unaffiliated investments | | | 6,739,995 | | | | (104,201 | ) |
Net realized losses from affiliated investments (Note 5) | | | (8,960,837 | ) | | | — | |
Net change in unrealized appreciation (depreciation) on unaffiliated investments | | | 587,967,346 | | | | 124,736,491 | |
Net change in unrealized appreciation (depreciation) on affiliated investments (Note 5) | | | 114,942,472 | | | | — | |
NET REALIZED AND UNREALIZED GAINS ON INVESTMENTS | | | 700,688,976 | | | | 124,632,290 | |
| | | | | | | | | |
NET INCREASE IN NET ASSETS RESULTING FROM OPERATIONS | | $ | 681,057,263 | | | $ | 123,106,841 | |
See accompanying notes to financial statements. |
17
CONESTOGA FUNDS
STATEMENTS OF OPERATIONS
For the Year Ended September 30, 2024 (Continued) |
| | Conestoga
Mid Cap Fund | | | Conestoga
Discovery Fund | |
INVESTMENT INCOME | | | | | | | | |
Dividend income from unaffiliated investments | | $ | 14,428 | | | $ | 7,082 | |
Foreign withholding taxes on dividends | | | (129 | ) | | | — | |
Interest | | | 4,028 | | | | 6,562 | |
Total investment income | | | 18,327 | | | | 13,644 | |
| | | | | | | | | |
EXPENSES | | | | | | | | |
Legal fees | | | 81,877 | | | | 81,877 | |
Fund accounting fees (Note 4) | | | 48,960 | | | | 49,050 | |
Registration and filing fees | | | 39,841 | | | | 47,185 | |
Management fees (Note 4) | | | 22,467 | | | | 37,225 | |
Audit and tax services fees | | | 15,432 | | | | 15,432 | |
Transfer agent fees (Note 4) | | | | | | | | |
Institutional Class | | | 5,814 | | | | 3,758 | |
Investors Class | | | 9,606 | | | | 11,662 | |
Shareholder reporting expenses | | | 6,572 | | | | 6,691 | |
Postage and supplies | | | 5,868 | | | | 5,778 | |
Administration fees (Note 4) | | | 5,575 | | | | 5,575 | |
Trustees’ fees and expenses (Note 4) | | | 3,535 | | | | 4,803 | |
Shareholder servicing fees (Note 4) | | | | | | | | |
Institutional Class | | | 2,325 | | | | 2,083 | |
Investors Class | | | 242 | | | | 820 | |
Distribution fees - Investors Class (Note 4) | | | 1,209 | | | | 4,099 | |
Custody and bank service fees | | | 1,362 | | | | 2,914 | |
Borrowing expenses | | | — | | | | 13 | |
Other expenses | | | 17,382 | | | | 17,950 | |
Total expenses | | | 268,067 | | | | 296,915 | |
Fee reductions and expense reimbursements by the Adviser (Note 4) | | | (244,391 | ) | | | (246,272 | ) |
Net expenses | | | 23,676 | | | | 50,643 | |
| | | | | | | | | |
NET INVESTMENT LOSS | | | (5,349 | ) | | | (36,999 | ) |
| | | | | | | | | |
REALIZED AND UNREALIZED GAINS (LOSSES) ON INVESTMENTS | | | | | | | | |
Net realized losses from unaffiliated investments | | | (96,639 | ) | | | (242,788 | ) |
Net change in unrealized appreciation (depreciation) on unaffiliated investments | | | 632,230 | | | | 658,348 | |
NET REALIZED AND UNREALIZED GAINS ON INVESTMENTS | | | 535,591 | | | | 415,560 | |
| | | | | | | | | |
NET INCREASE IN NET ASSETS RESULTING FROM OPERATIONS | | $ | 530,242 | | | $ | 378,561 | |
See accompanying notes to financial statements. |
18
CONESTOGA SMALL CAP FUND
STATEMENTS OF CHANGES IN NET ASSETS |
| | Year Ended
September 30,
2024 | | | Year Ended
September 30,
2023 | |
FROM OPERATIONS | | | | | | | | |
Net investment loss | | $ | (19,631,713 | ) | | $ | (16,290,608 | ) |
Net realized gains (losses) from investments | | | (2,220,842 | ) | | | 39,588,632 | |
Net change in unrealized appreciation (depreciation) on investments | | | 702,909,818 | | | | 456,716,289 | |
Net increase in net assets resulting from operations | | | 681,057,263 | | | | 480,014,313 | |
| | | | | | | | | |
DISTRIBUTIONS TO SHAREHOLDERS (Note 2) | | | | | | | | |
Institutional Class | | | (26,243,824 | ) | | | (95,526,570 | ) |
Investors Class | | | (6,455,571 | ) | | | (26,143,886 | ) |
Decrease in net assets from distributions to shareholders | | | (32,699,395 | ) | | | (121,670,456 | ) |
| | | | | | | | | |
CAPITAL SHARE TRANSACTIONS (Note 6) | | | | | | | | |
Institutional Class | | | | | | | | |
Proceeds from shares sold | | | 859,013,339 | | | | 636,483,743 | |
Reinvestment of distributions to shareholders | | | 19,097,244 | | | | 66,677,631 | |
Payments for shares redeemed | | | (673,945,503 | ) | | | (547,835,383 | ) |
Net increase in Institutional Class net assets from capital share transactions | | | 204,165,080 | | | | 155,325,991 | |
| | | | | | | | | |
Investors Class | | | | | | | | |
Proceeds from shares sold | | | 125,175,867 | | | | 109,107,169 | |
Reinvestment of distributions to shareholders | | | 5,572,497 | | | | 22,531,924 | |
Payments for shares redeemed | | | (176,094,660 | ) | | | (146,791,000 | ) |
Net decrease in Investors Class net assets from capital share transactions | | | (45,346,296 | ) | | | (15,151,907 | ) |
| | | | | | | | | |
TOTAL INCREASE IN NET ASSETS | | | 807,176,652 | | | | 498,517,941 | |
| | | | | | | | |
NET ASSETS | | | | | | | | |
Beginning of year | | | 3,498,897,204 | | | | 3,000,379,263 | |
End of year | | $ | 4,306,073,856 | | | $ | 3,498,897,204 | |
See accompanying notes to financial statements. |
19
CONESTOGA SMID CAP FUND
STATEMENTS OF CHANGES IN NET ASSETS |
| | Year Ended
September 30,
2024 | | | Year Ended
September 30,
2023 | |
FROM OPERATIONS | | | | | | | | |
Net investment loss | | $ | (1,525,449 | ) | | $ | (1,195,107 | ) |
Net realized losses from investments | | | (104,201 | ) | | | (11,227,870 | ) |
Net change in unrealized appreciation (depreciation) on investments | | | 124,736,491 | | | | 65,117,817 | |
Net increase in net assets resulting from operations | | | 123,106,841 | | | | 52,694,840 | |
| | | | | | | | | |
CAPITAL SHARE TRANSACTIONS (Note 6) | | | | | | | | |
Institutional Class | | | | | | | | |
Proceeds from shares sold | | | 353,429,905 | | | | 91,800,730 | |
Payments for shares redeemed | | | (96,004,772 | ) | | | (68,915,724 | ) |
Net increase in Institutional Class net assets from capital share transactions | | | 257,425,133 | | | | 22,885,006 | |
| | | | | | | | | |
Investors Class | | | | | | | | |
Proceeds from shares sold | | | 3,483,376 | | | | 12,570,141 | |
Payments for shares redeemed | | | (13,518,396 | ) | | | (21,382,886 | ) |
Net decrease in Investors Class net assets from capital share transactions | | | (10,035,020 | ) | | | (8,812,745 | ) |
| | | | | | | | | |
TOTAL INCREASE IN NET ASSETS | | | 370,496,954 | | | | 66,767,101 | |
| | | | | | | | | |
NET ASSETS | | | | | | | | |
Beginning of year | | | 383,573,008 | | | | 316,805,907 | |
End of year | | $ | 754,069,962 | | | $ | 383,573,008 | |
See accompanying notes to financial statements. |
20
CONESTOGA MID CAP FUND
STATEMENTS OF CHANGES IN NET ASSETS |
| | Year Ended
September 30,
2024 | | | Year Ended
September 30,
2023 | |
FROM OPERATIONS | | | | | | | | |
Net investment loss | | $ | (5,349 | ) | | $ | (3,596 | ) |
Net realized losses from investments | | | (96,639 | ) | | | (78,501 | ) |
Net change in unrealized appreciation (depreciation) on investments | | | 632,230 | | | | 366,579 | |
Net increase in net assets resulting from operations | | | 530,242 | | | | 284,482 | |
| | | | | | | | | |
CAPITAL SHARE TRANSACTIONS (Note 6) | | | | | | | | |
Institutional Class | | | | | | | | |
Proceeds from shares sold | | | 322,307 | | | | 351,158 | |
Payments for shares redeemed | | | (23,295 | ) | | | (86,211 | ) |
Net increase in Institutional Class net assets from capital share transactions | | | 299,012 | | | | 264,947 | |
| | | | | | | | | |
Investors Class | | | | | | | | |
Proceeds from shares sold | | | 23,250 | | | | 2,000 | |
Payments for shares redeemed | | | (34,125 | ) | | | (15,628 | ) |
Net decrease in Investors Class net assets from capital share transactions | | | (10,875 | ) | | | (13,628 | ) |
| | | | | | | | | |
TOTAL INCREASE IN NET ASSETS | | | 818,379 | | | | 535,801 | |
| | | | | | | | | |
NET ASSETS | | | | | | | | |
Beginning of year | | | 2,337,272 | | | | 1,801,471 | |
End of year | | $ | 3,155,651 | | | $ | 2,337,272 | |
See accompanying notes to financial statements. |
21
CONESTOGA DISCOVERY FUND
STATEMENTS OF CHANGES IN NET ASSETS |
| | Year Ended
September 30,
2024 | | | Year Ended
September 30,
2023 | |
FROM OPERATIONS | | | | | | | | |
Net investment loss | | $ | (36,999 | ) | | $ | (21,063 | ) |
Net realized losses from investments | | | (242,788 | ) | | | (106,006 | ) |
Net change in unrealized appreciation (depreciation) on investments | | | 658,348 | | | | (99,707 | ) |
Net increase (decrease) in net assets resulting from operations | | | 378,561 | | | | (226,776 | ) |
| | | | | | | | | |
CAPITAL SHARE TRANSACTIONS (Note 6) | | | | | | | | |
Institutional Class | | | | | | | | |
Proceeds from shares sold | | | 85,000 | | | | — | |
Payments for shares redeemed | | | (16,200 | ) | | | — | |
Net increase in Institutional Class net assets from capital share transactions | | | 68,800 | | | | — | |
| | | | | | | | | |
Investors Class | | | | | | | | |
Proceeds from shares sold | | | 2,182,550 | | | | 5,944 | |
Payments for shares redeemed | | | (337,866 | ) | | | (33,040 | ) |
Net increase (decrease) in Investors Class net assets from capital share transactions | | | 1,844,684 | | | | (27,096 | ) |
| | | | | | | | | |
TOTAL INCREASE (DECREASE) IN NET ASSETS | | | 2,292,045 | | | | (253,872 | ) |
| | | | | | | | | |
NET ASSETS | | | | | | | | |
Beginning of year | | | 2,004,390 | | | | 2,258,262 | |
End of year | | $ | 4,296,435 | | | $ | 2,004,390 | |
See accompanying notes to financial statements. |
22
CONESTOGA SMALL CAP FUND
INSTITUTIONAL CLASS
FINANCIAL HIGHLIGHTS |
Per Share Data for a Share Outstanding Throughout Each Year: |
| | Year
Ended
Sept. 30,
2024 | | | Year
Ended
Sept. 30,
2023 | | | Year
Ended
Sept. 30,
2022 | | | Year
Ended
Sept. 30,
2021 | | | Year
Ended
Sept. 30,
2020 | |
Net asset value at beginning of year | | $ | 66.27 | | | $ | 59.06 | | | $ | 87.18 | | | $ | 63.19 | | | $ | 58.40 | |
| | | | | | | | | | | | | | | | | | | | | |
Income (loss) from investment operations: | | | | | | | | | | | | | | | | | | | | |
Net investment loss (a) | | | (0.33 | ) | | | (0.29 | ) | | | (0.45 | ) | | | (0.56 | ) | | | (0.33 | ) |
Net realized and unrealized gains (losses) on investments | | | 12.95 | | | | 9.93 | | | | (23.17 | ) | | | 24.55 | | | | 6.39 | |
Total from investment operations | | | 12.62 | | | | 9.64 | | | | (23.62 | ) | | | 23.99 | | | | 6.06 | |
| | | | | | | | | | | | | | | | | | | | | |
Less distributions from net realized gains | | | (0.61 | ) | | | (2.43 | ) | | | (4.50 | ) | | | — | | | | (1.27 | ) |
| | | | | | | | | | | | | | | | | | | | | |
Net asset value at end of year | | $ | 78.28 | | | $ | 66.27 | | | $ | 59.06 | | | $ | 87.18 | | | $ | 63.19 | |
| | | | | | | | | | | | | | | | | | | | | |
Total return (b) | | | 19.19 | % | | | 16.54 | % | | | (28.62 | %) | | | 37.96 | % | | | 10.53 | % |
| | | | | | | | | | | | | | | | | | | | | |
Net assets at end of year (000,000’s) | | $ | 3,527 | | | $ | 2,796 | | | $ | 2,359 | | | $ | 3,386 | | | $ | 2,204 | |
| | | | | | | | | | | | | | | | | | | | | |
Ratios/supplementary data: | | | | | | | | | | | | | | | | | | | | |
Ratio of total expenses to average net assets | | | 0.99 | % | | | 0.98 | % | | | 0.98 | % | | | 0.98 | % | | | 1.00 | % |
Ratio of net expenses to average net assets (c) | | | 0.90 | % | | | 0.90 | % | | | 0.90 | % | | | 0.90 | % | | | 0.90 | % |
Ratio of net investment loss to average net assets (c) | | | (0.47 | %) | | | (0.44 | %) | | | (0.62 | %) | | | (0.69 | %) | | | (0.56 | %) |
Portfolio turnover rate | | | 16 | % | | | 13 | % | | | 24 | % | | | 19 | % | | | 22 | % |
(a) | Per share net investment loss has been determined on the basis of average number of shares outstanding during the year. |
(b) | Total return is a measure of the change in value of an investment in the Fund over the years covered. The returns shown do not reflect the deduction of taxes a shareholder would pay on Fund distributions, if any, or the redemption of Fund shares. The total returns would be lower if the Adviser had not reduced management fees and/or reimbursed expenses (Note 4). |
(c) | Ratio was determined after management fee reductions and/or expense reimbursements (Note 4). |
| | |
See accompanying notes to financial statements. |
23
CONESTOGA SMALL CAP FUND
INVESTORS CLASS
FINANCIAL HIGHLIGHTS |
Per Share Data for a Share Outstanding Throughout Each Year: |
| | Year
Ended
Sept. 30,
2024 | | | Year
Ended
Sept. 30,
2023 | | | Year
Ended
Sept. 30,
2022 | | | Year
Ended
Sept. 30,
2021 | | | Year
Ended
Sept. 30,
2020 | |
Net asset value at beginning of year | | $ | 64.88 | | | $ | 57.97 | | | $ | 85.83 | | | $ | 62.33 | | | $ | 57.74 | |
| | | | | | | | | | | | | | | | | | | | | |
Income (loss) from investment operations: | | | | | | | | | | | | | | | | | | | | |
Net investment loss (a) | | | (0.47 | ) | | | (0.41 | ) | | | (0.59 | ) | | | (0.70 | ) | | | (0.44 | ) |
Net realized and unrealized gains (losses) on investments | | | 12.66 | | | | 9.75 | | | | (22.77 | ) | | | 24.20 | | | | 6.30 | |
Total from investment operations | | | 12.19 | | | | 9.34 | | | | (23.36 | ) | | | 23.50 | | | | 5.86 | |
| | | | | | | | | | | | | | | | | | | | | |
Less distributions from net realized gains | | | (0.61 | ) | | | (2.43 | ) | | | (4.50 | ) | | | — | | | | (1.27 | ) |
| | | | | | | | | | | | | | | | | | | | | |
Net asset value at end of year | | $ | 76.46 | | | $ | 64.88 | | | $ | 57.97 | | | $ | 85.83 | | | $ | 62.33 | |
| | | | | | | | | | | | | | | | | | | | | |
Total return (b) | | | 18.94 | % | | | 16.33 | % | | | (28.78 | %) | | | 37.70 | % | | | 10.30 | % |
| | | | | | | | | | | | | | | | | | | | | |
Net assets at end of year (000,000’s) | | $ | 779 | | | $ | 703 | | | $ | 642 | | | $ | 968 | | | $ | 805 | |
| | | | | | | | | | | | | | | | | | | | | |
Ratios/supplementary data: | | | | | | | | | | | | | | | | | | | | |
Ratio of total expenses to average net assets | | | 1.26 | % | | | 1.26 | % | | | 1.26 | % | | | 1.25 | % | | | 1.28 | % |
Ratio of net expenses to average net assets (c) | | | 1.10 | % | | | 1.10 | % | | | 1.10 | % | | | 1.10 | % | | | 1.10 | % |
Ratio of net investment loss to average net assets (c) | | | (0.67 | %) | | | (0.64 | %) | | | (0.82 | %) | | | (0.89 | %) | | | (0.75 | %) |
Portfolio turnover rate | | | 16 | % | | | 13 | % | | | 24 | % | | | 19 | % | | | 22 | % |
(a) | Per share net investment loss has been determined on the basis of average number of shares outstanding during the year. |
(b) | Total return is a measure of the change in value of an investment in the Fund over the years covered. The returns shown do not reflect the deduction of taxes a shareholder would pay on Fund distributions, if any, or the redemption of Fund shares. The total returns would be lower if the Adviser had not reduced management fees and/or reimbursed expenses (Note 4). |
(c) | Ratio was determined after management fee reductions and/or expense reimbursements (Note 4). |
| | |
See accompanying notes to financial statements. |
24
CONESTOGA SMID CAP FUND
INSTITUTIONAL CLASS
FINANCIAL HIGHLIGHTS |
Per Share Data for a Share Outstanding Throughout Each Year: |
| | Year
Ended
Sept. 30,
2024 | | | Year
Ended
Sept. 30,
2023 | | | Year
Ended
Sept. 30,
2022 | | | Year
Ended
Sept. 30,
2021 | | | Year
Ended
Sept. 30,
2020 | |
Net asset value at beginning of year | | $ | 20.98 | | | $ | 17.96 | | | $ | 26.13 | | | $ | 19.29 | | | $ | 17.18 | |
| | | | | | | | | | | | | | | | | | | | | |
Income (loss) from investment operations: | | | | | | | | | | | | | | | | | | | | |
Net investment loss (a) | | | (0.06 | ) | | | (0.06 | ) | | | (0.09 | ) | | | (0.11 | ) | | | (0.06 | ) |
Net realized and unrealized gains (losses) on investments | | | 5.57 | | | | 3.08 | | | | (8.08 | ) | | | 6.95 | | | | 2.40 | |
Total from investment operations | | | 5.51 | | | | 3.02 | | | | (8.17 | ) | | | 6.84 | | | | 2.34 | |
| | | | | | | | | | | | | | | | | | | | | |
Less distributions from net realized gains | | | — | | | | — | | | | — | | | | — | | | | (0.23 | ) |
| | | | | | | | | | | | | | | | | | | | | |
Net asset value at end of year | | $ | 26.49 | | | $ | 20.98 | | | $ | 17.96 | | | $ | 26.13 | | | $ | 19.29 | |
| | | | | | | | | | | | | | | | | | | | | |
Total return (b) | | | 26.26 | % | | | 16.82 | % | | | (31.27 | %) | | | 35.46 | % | | | 13.76 | % |
| | | | | | | | | | | | | | | | | | | | | |
Net assets at end of year (000’s) | | $ | 711,283 | | | $ | 340,636 | | | $ | 272,623 | | | $ | 357,479 | | | $ | 188,836 | |
| | | | | | | | | | | | | | | | | | | | | |
Ratios/supplementary data: | | | | | | | | | | | | | | | | | | | | |
Ratio of total expenses to average net assets | | | 1.02 | % | | | 1.07 | % | | | 1.07 | % | | | 1.10 | % | | | 1.26 | % |
Ratio of net expenses to average net assets (c) | | | 0.85 | % | | | 0.85 | % | | | 0.85 | % | | | 0.85 | % | | | 0.85 | % |
Ratio of net investment loss to average net assets (c) | | | (0.27 | %) | | | (0.29 | %) | | | (0.41 | %) | | | (0.47 | %) | | | (0.34 | %) |
Portfolio turnover rate | | | 10 | % | | | 9 | % | | | 15 | % | | | 17 | % | | | 11 | % |
(a) | Per share net investment loss has been determined on the basis of average number of shares outstanding during the year. |
(b) | Total return is a measure of the change in value of an investment in the Fund over the years covered. The returns shown do not reflect the deduction of taxes a shareholder would pay on Fund distributions, if any, or the redemption of Fund shares. The total returns would be lower if the Adviser had not reduced management fees and/or reimbursed expenses (Note 4). |
(c) | Ratio was determined after management fee reductions and/or expense reimbursements (Note 4). |
| | |
See accompanying notes to financial statements. |
25
CONESTOGA SMID CAP FUND
INVESTORS CLASS
FINANCIAL HIGHLIGHTS |
Per Share Data for a Share Outstanding Throughout Each Year: |
| | Year
Ended
Sept. 30,
2024 | | | Year
Ended
Sept. 30,
2023 | | | Year
Ended
Sept. 30,
2022 | | | Year
Ended
Sept. 30,
2021 | | | Year
Ended
Sept. 30,
2020 | |
Net asset value at beginning of year | | $ | 20.52 | | | $ | 17.60 | | | $ | 25.68 | | | $ | 19.01 | | | $ | 16.97 | |
| | | | | | | | | | | | | | | | | | | | | |
Income (loss) from investment operations: | | | | | | | | | | | | | | | | | | | | |
Net investment loss (a) | | | (0.12 | ) | | | (0.11 | ) | | | (0.15 | ) | | | (0.17 | ) | | | (0.10 | ) |
Net realized and unrealized gains (losses) on investments | | | 5.44 | | | | 3.03 | | | | (7.93 | ) | | | 6.84 | | | | 2.37 | |
Total from investment operations | | | 5.32 | | | | 2.92 | | | | (8.08 | ) | | | 6.67 | | | | 2.27 | |
| | | | | | | | | | | | | | | | | | | | | |
Less distributions from net realized gains | | | — | | | | — | | | | — | | | | — | | | | (0.23 | ) |
| | | | | | | | | | | | | | | | | | | | | |
Net asset value at end of year | | $ | 25.84 | | | $ | 20.52 | | | $ | 17.60 | | | $ | 25.68 | | | $ | 19.01 | |
| | | | | | | | | | | | | | | | | | | | | |
Total return (b) | | | 25.93 | % | | | 16.59 | % | | | (31.46 | %) | | | 35.09 | % | | | 13.52 | % |
| | | | | | | | | | | | | | | | | | | | | |
Net assets at end of year (000’s) | | $ | 42,787 | | | $ | 42,937 | | | $ | 44,183 | | | $ | 64,189 | | | $ | 50,577 | |
| | | | | | | | | | | | | | | | | | | | | |
Ratios/supplementary data: | | | | | | | | | | | | | | | | | | | | |
Ratio of total expenses to average net assets | | | 1.34 | % | | | 1.38 | % | | | 1.36 | % | | | 1.36 | % | | | 1.51 | % |
Ratio of net expenses to average net assets (c) | | | 1.10 | % | | | 1.10 | % | | | 1.10 | % | | | 1.10 | % | | | 1.10 | % |
Ratio of net investment loss to average net assets (c) | | | (0.51 | %) | | | (0.54 | %) | | | (0.66 | %) | | | (0.71 | %) | | | (0.57 | %) |
Portfolio turnover rate | | | 10 | % | | | 9 | % | | | 15 | % | | | 17 | % | | | 11 | % |
(a) | Per share net investment loss has been determined on the basis of average number of shares outstanding during the year. |
(b) | Total return is a measure of the change in value of an investment in the Fund over the years covered. The returns shown do not reflect the deduction of taxes a shareholder would pay on Fund distributions, if any, or the redemption of Fund shares. The total returns would be lower if the Adviser had not reduced management fees and/or reimbursed expenses (Note 4). |
(c) | Ratio was determined after management fee reductions and/or expense reimbursements (Note 4). |
| | |
See accompanying notes to financial statements. |
26
CONESTOGA MID CAP FUND
INSTITUTIONAL CLASS
FINANCIAL HIGHLIGHTS |
Per Share Data for a Share Outstanding Throughout Each Period: |
| | Year
Ended
Sept. 30,
2024 | | | Year
Ended
Sept. 30,
2023 | | | Year
Ended
Sept. 30,
2022 | | | Period
Ended
Sept. 30,
2021(a) | |
Net asset value at beginning of period | | $ | 8.27 | | | $ | 7.10 | | | $ | 10.32 | | | $ | 10.00 | |
| | | | | | | | | | | | | | | | | |
Income (loss) from investment operations: | | | | | | | | | | | | | | | | |
Net investment loss (b) | | | (0.01 | ) | | | (0.01 | ) | | | (0.03 | ) | | | (0.01 | ) |
Net realized and unrealized gains (losses) on investments | | | 1.77 | | | | 1.18 | | | | (3.19 | ) | | | 0.33 | |
Total from investment operations | | | 1.76 | | | | 1.17 | | | | (3.22 | ) | | | 0.32 | |
| | | | | | | | | | | | | | | | | |
Net asset value at end of period | | $ | 10.03 | | | $ | 8.27 | | | $ | 7.10 | | | $ | 10.32 | |
| | | | | | | | | | | | | | | | | |
Total return (c) | | | 21.28 | % | | | 16.48 | % | | | (31.20 | %) | | | 3.20 | %(d) |
| | | | | | | | | | | | | | | | | |
Net assets at end of period (000’s) | | $ | 2,631 | | | $ | 1,893 | | | $ | 1,406 | | | $ | 1,168 | |
| | | | | | | | | | | | | | | | | |
Ratios/supplementary data: | | | | | | | | | | | | | | | | |
Ratio of total expenses to average net assets | | | 8.73 | % | | | 12.10 | % | | | 12.20 | % | | | 16.18 | %(e) |
Ratio of net expenses to average net assets (f) | | | 0.80 | % | | | 0.80 | % | | | 0.80 | % | | | 0.80 | %(e) |
Ratio of net investment loss to average net assets (f) | | | (0.15 | %) | | | (0.12 | %) | | | (0.36 | %) | | | (0.50 | %)(e) |
Portfolio turnover rate | | | 5 | % | | | 9 | % | | | 18 | % | | | 1 | %(d) |
(a) | Represents the period from the commencement of operations (June 29, 2021) through September 30, 2021. |
(b) | Per share net investment loss has been determined on the basis of average number of shares outstanding during the period. |
(c) | Total return is a measure of the change in value of an investment in the Fund over the periods covered. The returns shown do not reflect the deduction of taxes a shareholder would pay on Fund distributions, if any, or the redemption of Fund shares. The total returns would be lower if the Adviser had not reduced management fees and/or reimbursed expenses (Note 4). |
(d) | Not annualized. |
(e) | Annualized. |
(f) | Ratio was determined after management fee reductions and/or expense reimbursements (Note 4). |
| | |
See accompanying notes to financial statements. |
27
CONESTOGA MID CAP FUND
INVESTORS CLASS
FINANCIAL HIGHLIGHTS |
Per Share Data for a Share Outstanding Throughout Each Period: |
| | Year
Ended
Sept. 30,
2024 | | | Year
Ended
Sept. 30,
2023 | | | Year
Ended
Sept. 30,
2022 | | | Period
Ended
Sept. 30,
2021(a) | |
Net asset value at beginning of period | | $ | 8.23 | | | $ | 7.08 | | | $ | 10.31 | | | $ | 10.00 | |
| | | | | | | | | | | | | | | | | |
Income (loss) from investment operations: | | | | | | | | | | | | | | | | |
Net investment loss (b) | | | (0.04 | ) | | | (0.03 | ) | | | (0.05 | ) | | | (0.02 | ) |
Net realized and unrealized gains (losses) on investments | | | 1.76 | | | | 1.18 | | | | (3.18 | ) | | | 0.33 | |
Total from investment operations | | | 1.72 | | | | 1.15 | | | | (3.23 | ) | | | 0.31 | |
| | | | | | | | | | | | | | | | | |
Net asset value at end of period | | $ | 9.95 | | | $ | 8.23 | | | $ | 7.08 | | | $ | 10.31 | |
| | | | | | | | | | | | | | | | | |
Total return (c) | | | 20.90 | % | | | 16.24 | % | | | (31.33 | %) | | | 3.10 | %(d) |
| | | | | | | | | | | | | | | | | |
Net assets at end of period (000’s) | | $ | 525 | | | $ | 444 | | | $ | 395 | | | $ | 567 | |
| | | | | | | | | | | | | | | | | |
Ratios/supplementary data: | | | | | | | | | | | | | | | | |
Ratio of total expenses to average net assets | | | 13.47 | % | | | 17.34 | % | | | 15.54 | % | | | 17.54 | %(e) |
Ratio of net expenses to average net assets (f) | | | 1.05 | % | | | 1.05 | % | | | 1.05 | % | | | 1.05 | %(e) |
Ratio of net investment loss to average net assets (f) | | | (0.39 | %) | | | (0.37 | %) | | | (0.61 | %) | | | (0.73 | %)(e) |
Portfolio turnover rate | | | 5 | % | | | 9 | % | | | 18 | % | | | 1 | %(d) |
(a) | Represents the period from the commencement of operations (June 29, 2021) through September 30, 2021. |
(b) | Per share net investment loss has been determined on the basis of average number of shares outstanding during the period. |
(c) | Total return is a measure of the change in value of an investment in the Fund over the periods covered. The returns shown do not reflect the deduction of taxes a shareholder would pay on Fund distributions, if any, or the redemption of Fund shares. The total returns would be lower if the Adviser had not reduced management fees and/or reimbursed expenses (Note 4). |
(d) | Not annualized. |
(e) | Annualized. |
(f) | Ratio was determined after management fee reductions and/or expense reimbursements (Note 4). |
| | |
See accompanying notes to financial statements. |
28
CONESTOGA DISCOVERY FUND
INSTITUTIONAL CLASS
FINANCIAL HIGHLIGHTS |
Per Share Data for a Share Outstanding Throughout Each Period: |
| | Year
Ended
Sept. 30,
2024 | | | Year
Ended
Sept. 30,
2023 | | | Period
Ended
Sept. 30,
2022(a) | |
Net asset value at beginning of period | | $ | 6.35 | | | $ | 7.07 | | | $ | 10.00 | |
| | | | | | | | | | | | | |
Income (loss) from investment operations: | | | | | | | | | | | | |
Net investment loss (b) | | | (0.06 | ) | | | (0.06 | ) | | | (0.06 | ) |
Net realized and unrealized gains (losses) on investments | | | 1.04 | | | | (0.66 | ) | | | (2.87 | ) |
Total from investment operations | | | 0.98 | | | | (0.72 | ) | | | (2.93 | ) |
| | | | | | | | | | | | | |
Net asset value at end of period | | $ | 7.33 | | | $ | 6.35 | | | $ | 7.07 | |
| | | | | | | | | | | | | |
Total return (c) | | | 15.43 | % | | | (10.18 | %) | | | (29.30 | %)(d) |
| | | | | | | | | | | | | |
Net assets at end of period (000’s) | | $ | 2,222 | | | $ | 1,864 | | | $ | 2,075 | |
| | | | | | | | | | | | | |
Ratios/supplementary data: | | | | | | | | | | | | |
Ratio of total expenses to average net assets | | | 8.13 | % | | | 11.38 | % | | | 9.08 | %(e) |
Ratio of net expenses to average net assets (f) | | | 1.25 | % | | | 1.25 | % | | | 1.25 | %(e) |
Ratio of net investment loss to average net assets (f) | | | (0.87 | %) | | | (0.88 | %) | | | (0.90 | %)(e) |
Portfolio turnover rate | | | 32 | % | | | 23 | % | | | 27 | %(d) |
(a) | Represents the period from the commencement of operations as a series of Conestoga Funds (December 20, 2021) through September 30, 2022. |
(b) | Per share net investment loss has been determined on the basis of average number of shares outstanding during the period. |
(c) | Total return is a measure of the change in value of an investment in the Fund over the periods covered. The returns shown do not reflect the deduction of taxes a shareholder would pay on Fund distributions, if any, or the redemption of Fund shares. The total returns would be lower if the Adviser had not reduced management fees and/or reimbursed expenses (Note 4). |
(d) | Not annualized. |
(e) | Annualized. |
(f) | Ratio was determined after management fee reductions and/or expense reimbursements (Note 4). |
| | |
See accompanying notes to financial statements. |
29
CONESTOGA DISCOVERY FUND
INVESTORS CLASS
FINANCIAL HIGHLIGHTS |
Per Share Data for a Share Outstanding Throughout Each Period: |
| | Year
Ended
Sept. 30,
2024 | | | Year
Ended
Sept. 30,
2023 | | | Period
Ended
Sept. 30,
2022(a) | |
Net asset value at beginning of period | | $ | 6.32 | | | $ | 7.05 | | | $ | 10.00 | |
| | | | | | | | | | | | | |
Income (loss) from investment operations: | | | | | | | | | | | | |
Net investment loss (b) | | | (0.08 | ) | | | (0.08 | ) | | | (0.07 | ) |
Net realized and unrealized gains (losses) on investments | | | 1.04 | | | | (0.65 | ) | | | (2.88 | ) |
Total from investment operations | | | 0.96 | | | | (0.73 | ) | | | (2.95 | ) |
| | | | | | | | | | | | | |
Net asset value at end of period | | $ | 7.28 | | | $ | 6.32 | | | $ | 7.05 | |
| | | | | | | | | | | | | |
Total return (c) | | | 15.19 | % | | | (10.35 | %) | | | (29.50 | %)(d) |
| | | | | | | | | | | | | |
Net assets at end of period (000’s) | | $ | 2,075 | | | $ | 140 | | | $ | 184 | |
| | | | | | | | | | | | | |
Ratios/supplementary data: | | | | | | | | | | | | |
Ratio of total expenses to average net assets | | | 7.76 | % | | | 23.00 | % | | | 13.66 | %(e) |
Ratio of net expenses to average net assets (f) | | | 1.50 | % | | | 1.50 | % | | | 1.50 | %(e) |
Ratio of net investment loss to average net assets (f) | | | (1.15 | %) | | | (1.13 | %) | | | (1.14 | %)(e) |
Portfolio turnover rate | | | 32 | % | | | 23 | % | | | 27 | %(d) |
(a) | Represents the period from the commencement of operations as a series of Conestoga Funds (December 20, 2021) through September 30, 2022. |
(b) | Per share net investment loss has been determined on the basis of average number of shares outstanding during the period. |
(c) | Total return is a measure of the change in value of an investment in the Fund over the periods covered. The returns shown do not reflect the deduction of taxes a shareholder would pay on Fund distributions, if any, or the redemption of Fund shares. The total returns would be lower if the Adviser had not reduced management fees and/or reimbursed expenses (Note 4). |
(d) | Not annualized. |
(e) | Annualized. |
(f) | Ratio was determined after management fee reductions and/or expense reimbursements (Note 4). |
| | |
See accompanying notes to financial statements. |
30
CONESTOGA FUNDS
NOTES TO FINANCIAL STATEMENTS
September 30, 2024
1. Organization
Conestoga Funds (the “Trust”) was organized as a Delaware statutory trust on February 5, 2002. The Trust consists of four series, the Conestoga Small Cap Fund (the “Small Cap Fund”), the Conestoga SMid Cap Fund (the “SMid Cap Fund”), the Conestoga Mid Cap Fund (the “Mid Cap Fund”) and the Conestoga Discovery Fund (the “Discovery Fund”) (individually, a “Fund” and collectively, the “Funds”). The Trust is registered as an open-end diversified management investment company of the series type under the Investment Company Act of 1940, as amended (the “1940 Act”). Each Fund’s investment objective is to achieve long-term growth of capital. Each Fund currently offers two classes of shares, Institutional Class and Investors Class. The Mid Cap Fund commenced operations on June 29, 2021 and the Discovery Fund commenced operations on December 20, 2021.
Each Fund’s two classes of shares represent interests in the same portfolio of investments, and have the same rights, but the share classes differ primarily in the expenses to which they are subject and have differing investment minimums. Institutional Class shares are sold without any sales loads or distribution fees but are subject to a shareholder servicing fee of up to 0.10% of the average daily net assets allocable to Institutional Class shares and require a $250,000 initial investment. Investors Class shares are sold without any sales loads but are subject to a distribution fee of up to 0.25% and a shareholder servicing fee of up to 0.25% of the average daily net assets allocable to Investors Class shares and require a $2,500 initial investment. The Board of Trustees of the Trust (the “Board” and the members thereof, “Trustees”) has determined to limit the shareholder servicing fees paid by Investors Class shares of each Fund to 0.05% of the average daily net assets allocable to Investors Class shares until at least September 30, 2025.
2. Significant Accounting Policies
The following is a summary of the Funds’ significant accounting policies. These policies are in conformity with generally accepted accounting principles in the United States of America (“GAAP”). The Funds follow accounting and reporting guidance under Financial Accounting Standards Board Accounting Standards Codification Topic 946, “Financial Services – Investment Companies.”
Securities valuation – Each Fund values its portfolio securities at market value as of the close of regular trading on the New York Stock Exchange, Inc. (the “NYSE”) (normally 4:00 p.m. Eastern Time) on each business day the NYSE is open for business. The Funds value their listed securities on the basis of the security’s last sale price on the security’s primary exchange, if available, otherwise at the exchange’s most recently quoted bid price. NASDAQ-listed securities are valued at the NASDAQ Official Closing Price. Investments representing shares of other open-end investment companies, including money market funds, are valued at their net asset value (“NAV”) as reported by such companies. When using a quoted price and when the market is considered active, the security will be
31
CONESTOGA FUNDS
NOTES TO FINANCIAL STATEMENTS (Continued)
classified as Level 1 within the fair value hierarchy (see below). In the event that market quotations are not readily available or are considered unreliable due to market or other events, the Funds value their securities and other assets at fair value, as determined in good faith by Conestoga Capital Advisors, LLC (the “Adviser”) as the Funds’ valuation designee (in such capacity, the “Valuation Designee”), in accordance with procedures established by and under the general supervision of the Board pursuant to Rule 2a-5 under the 1940 Act. Rule 2a-5 permits fund boards to designate certain parties to perform fair value determinations, subject to board oversight and certain other conditions. Rule 2a-5 also defines when market quotations are “readily available” for purposes of Section 2(a)(41) of the 1940 Act, which requires a fund to fair value a security when market quotations are not readily available. The Funds adopted Pricing and Valuation Guidelines conforming to Rule 2a-5, effective September 8, 2022, and designated the Adviser as Valuation Designee for each of the Funds. Under these procedures, the securities will be classified as Level 2 or 3 within the fair value hierarchy, depending on the inputs used. Unavailable or unreliable market quotes may be due to the following factors: a substantial bid-ask spread; infrequent sales resulting in stale prices; insufficient trading volume; small trade sizes; a temporary lapse in any reliable pricing source; and actions of the securities or futures markets, such as the suspension or limitation of trading. As a result, the prices of securities used to calculate each Fund’s NAV may differ from quoted or published prices for the same securities.
GAAP establishes a single authoritative definition of fair value, sets out a framework for measuring fair value, and requires additional disclosures about fair value measurements.
Various inputs are used in determining the value of each Fund’s investments. These inputs are summarized in the three broad levels listed below:
| | ● | Level 1 – Unadjusted quoted prices in active markets for identical assets or liabilities |
| | ● | Level 2 – Observable inputs other than quoted prices included in Level 1 that are observable for the assets or liability, either directly or indirectly; these inputs may include quoted prices for the identical instrument on an inactive market, prices for similar instruments, interest rates, prepayment speeds, credit risks, yield curves, default rates and similar data |
| | ● | Level 3 – Unobservable inputs for the asset or liability, to the extent relevant observable inputs are not available, representing a Fund’s own assumptions about the assumptions a market participant would use in valuing the asset or liability, and based on the best information available |
The inputs or methods used for valuing securities are not necessarily an indication of the risks associated with investing in those securities. The inputs used to measure fair value may fall into different levels of the fair value hierarchy. In such cases, for disclosure
32
CONESTOGA FUNDS
NOTES TO FINANCIAL STATEMENTS (Continued)
purposes, the level in the fair value hierarchy within which the fair value measurement falls in its entirety is determined based on the lowest level input that is significant to the fair value measurement.
The following is a summary of the Funds’ investments based on the inputs used to value the investments as of September 30, 2024:
Conestoga Small Cap Fund | | Level 1 | | | Level 2 | | | Level 3 | | | Total | |
Common Stocks | | $ | 4,106,954,019 | | | $ | — | | | $ | — | | | $ | 4,106,954,019 | |
Money Market Funds | | | 46,855,155 | | | | — | | | | — | | | | 46,855,155 | |
Total | | $ | 4,153,809,174 | | | $ | — | | | $ | — | | | $ | 4,153,809,174 | |
Conestoga SMid Cap Fund | | Level 1 | | | Level 2 | | | Level 3 | | | Total | |
Common Stocks | | $ | 739,086,293 | | | $ | — | | | $ | — | | | $ | 739,086,293 | |
Total | | $ | 739,086,293 | | | $ | — | | | $ | — | | | $ | 739,086,293 | |
Conestoga Mid Cap Fund | | Level 1 | | | Level 2 | | | Level 3 | | | Total | |
Common Stocks | | $ | 3,091,552 | | | $ | — | | | $ | — | | | $ | 3,091,552 | |
Total | | $ | 3,091,552 | | | $ | — | | | $ | — | | | $ | 3,091,552 | |
Conestoga Discovery Fund | | Level 1 | | | Level 2 | | | Level 3 | | | Total | |
Common Stocks | | $ | 4,173,687 | | | $ | — | | | $ | — | | | $ | 4,173,687 | |
Total | | $ | 4,173,687 | | | $ | — | | | $ | — | | | $ | 4,173,687 | |
Refer to each Fund’s Schedule of Investments for a listing of the common stocks by industry and sector type. The Funds did not hold any derivative instruments or any assets or liabilities that were measured at fair value on a recurring basis using significant unobservable inputs (Level 3) as of or during the year ended September 30, 2024.
Share valuation – The NAV per share of each class of each Fund is calculated daily by dividing the total value of the assets attributable to that class, less liabilities attributable to that class, by the number of shares outstanding of that class. The offering price and redemption price per share of each class of each Fund is equal to the NAV per share of such class.
Cash – Each Fund’s cash is held in a bank account with balances which may exceed the Federal Deposit Insurance Corporation (“FDIC”) limit of $250,000. As of September 30, 2024, the cash balances reflected on the Statements of Assets and Liabilities for each Fund represent the amount held in a deposit sweep account.
33
CONESTOGA FUNDS
NOTES TO FINANCIAL STATEMENTS (Continued)
Investment income – Dividend income is recorded on the ex-dividend date. Interest income is accrued as earned. Non-cash dividends included in dividend income, if any, are recorded at the fair market value of the security received. Withholding taxes on foreign dividends have been recorded in accordance with the Funds’ understanding of the applicable country’s rules and tax rates.
Investment transactions – Investment transactions are accounted for on the trade date. Realized gains and losses on investments sold are determined on a specific identification basis.
Common expenses – Common expenses of the Trust are allocated between the Funds based on the relative net assets of each Fund or the nature of the services performed and the relative applicability to each Fund.
Distributions to shareholders – Each Fund distributes to its shareholders any net investment income dividends and net realized capital gains distributions at least once each year. The amount of such dividends and distributions are determined in accordance with federal income tax regulations, which may differ from GAAP. Dividends and distributions to shareholders are recorded on the ex-dividend date. The tax character of distributions paid to shareholders during the years ended September 30, 2024 and 2023 were as follows:
Conestoga Small Cap Fund | | Ordinary
Income | | | Long-Term
Capital Gain | | | Total
Distributions | |
September 30, 2024 | | $ | — | | | $ | 32,699,395 | | | $ | 32,699,395 | |
September 30, 2023 | | $ | — | | | $ | 121,670,456 | | | $ | 121,670,456 | |
Conestoga SMid Cap Fund | | Ordinary
Income | | | Long-Term
Capital Gain | | | Total | |
September 30, 2024 | | $ | — | | | $ | — | | | $ | — | |
September 30, 2023 | | $ | — | | | $ | — | | | $ | — | |
Conestoga Mid Cap Fund | | Ordinary
Income | | | Long-Term
Capital Gain | | | Total | |
September 30, 2024 | | $ | — | | | $ | — | | | $ | — | |
September 30, 2023 | | $ | — | | | $ | — | | | $ | — | |
Conestoga Discovery Fund | | Ordinary
Income | | | Long-Term
Capital Gain | | | Total | |
September 30, 2024 | | $ | — | | | $ | — | | | $ | — | |
September 30, 2023 | | $ | — | | | $ | — | | | $ | — | |
34
CONESTOGA FUNDS
NOTES TO FINANCIAL STATEMENTS (Continued)
Allocation between classes – Investment income earned, realized capital gains and losses, and unrealized appreciation and depreciation are allocated daily to each class of a Fund based upon its proportionate share of total net assets of that Fund. Class-specific expenses are charged directly to the class incurring the expense. Common expenses that are not attributable to a specific class are allocated daily to each class of shares of a Fund based upon its proportionate share of total net assets.
Estimates – The preparation of financial statements in conformity with GAAP requires management to make estimates and assumptions that affect the reported amounts of assets and liabilities and disclosure of contingent assets and liabilities as of the date of the financial statements and the reported amounts of increase (decrease) in net assets from operations during the reporting period. Actual results could differ from those estimates.
Federal income tax – Each Fund has qualified and intends to continue to qualify as a regulated investment company under the Internal Revenue Code of 1986, as amended (the “Code”). Qualification generally will relieve each Fund of liability for federal income taxes to the extent each Fund distributes substantially all of its taxable net investment income and net realized capital gains are distributed in accordance with the Code.
In order to avoid imposition of the excise tax applicable to regulated investment companies, it is also each Fund’s intention to declare as dividends in each calendar year at least 98% of its net investment income (earned during the calendar year) and 98.2% of its net realized capital gains (earned during the twelve months ended October 31) plus undistributed amounts from prior years.
The following information is computed on a tax basis for each item as of September 30, 2024:
| | Small Cap Fund | | | SMid Cap Fund | |
Tax cost of investments | | $ | 2,357,299,088 | | | $ | 537,775,790 | |
Gross unrealized appreciation | | $ | 1,921,053,684 | | | $ | 225,086,117 | |
Gross unrealized depreciation | | | (124,543,598 | ) | | | (23,775,614 | ) |
Net unrealized appreciation | | | 1,796,510,086 | | | | 201,310,503 | |
Accumulated capital and other losses | | | (20,169,415 | ) | | | (18,169,896 | ) |
Distributable earnings | | $ | 1,776,340,671 | | | $ | 183,140,607 | |
| | Mid Cap Fund | | | Discovery Fund | |
Tax cost of investments | | $ | 2,679,948 | | | $ | 3,823,719 | |
Gross unrealized appreciation | | $ | 609,186 | | | $ | 915,878 | |
Gross unrealized depreciation | | | (197,582 | ) | | | (565,910 | ) |
Net unrealized appreciation | | | 411,604 | | | | 349,968 | |
Accumulated capital and other losses | | | (211,845 | ) | | | (412,958 | ) |
Distributable earnings (accumulated deficit) | | $ | 199,759 | | | $ | (62,990 | ) |
35
CONESTOGA FUNDS
NOTES TO FINANCIAL STATEMENTS (Continued)
The difference between the federal income tax cost of investments and the financial statement cost of portfolio investments for the Funds are due to certain timing differences in the recognition of capital gains or losses under income tax regulations and GAAP. These “book/tax” differences are temporary in nature and are primarily due to the tax deferral of losses on wash sales.
For the year ended September 30, 2024, the following reclassifications were made on the Statements of Assets and Liabilities for the Funds as a result of permanent differences between the financial statements and income tax reporting requirements due in most part to net investment loss:
| | Small Cap Fund | | | SMid Cap Fund | | | Mid Cap Fund | | | Discovery Fund | |
Paid-in capital | | $ | (16,759,291 | ) | | $ | (1,188,335 | ) | | $ | (3,601 | ) | | $ | (19,203 | ) |
Distributable earnings (accumulated deficit) | | | 16,759,291 | | | | 1,188,335 | | | | 3,601 | | | | 19,203 | |
Such reclassifications, the result of permanent differences between financial statement and income tax reporting requirements, had no effect on each Fund’s net assets or NAV per share.
Net qualified late year ordinary losses represent losses incurred after December 31, 2023. These losses are deemed to arise on the first day of the Funds’ next taxable year. For the year ended September 30, 2024, the Small Cap Fund, SMid Cap Fund, Mid Cap Fund and Discovery Fund deferred until October 1, 2024 qualified late year ordinary losses of $15,336,993, $1,368,525, $4,611 and $33,551 for federal income tax purposes, respectively.
As of September 30, 2024, the SMid Cap Fund utilized short-term capital loss carryforward (“CLCFs”) of $1,004,879 against current year gains for federal income tax purposes.
As of September 30, 2024, the Funds had the following CLCFs for federal income tax purposes:
| | Small Cap Fund | | | SMid Cap Fund | | | Mid Cap Fund | | | Discovery Fund | |
Short-term capital loss carryforwards | | $ | 4,832,422 | | | $ | 4,895,650 | | | $ | 30,388 | | | $ | 69,860 | |
Long-term capital loss carryforwards | | | — | | | | 11,905,721 | | | | 176,846 | | | | 309,547 | |
Total | | $ | 4,832,422 | | | $ | 16,801,371 | | | $ | 207,234 | | | $ | 379,407 | |
These CLCFs, which do not expire, are available to offset net realized capital gains in future years, thereby reducing future taxable gain distributions.
36
CONESTOGA FUNDS
NOTES TO FINANCIAL STATEMENTS (Continued)
The Funds recognize the tax benefits or expenses of uncertain tax positions only when the position is “more likely than not” of being sustained assuming examination by tax authorities. Management has reviewed each Fund’s tax positions for all open tax years (generally, three years) and has concluded that no provision for unrecognized tax benefits or expenses is required in these financial statements. The Funds identify their major tax jurisdiction as U.S. Federal.
The Funds recognize interest and penalties, if any, related to unrecognized tax benefits as income tax expenses on the Statements of Operations. During the year ended September 30, 2024, the Funds did not incur any interest and penalties.
3. Investment Transactions
During the year ended September 30, 2024, the cost of purchases and proceeds from sales of investment securities, other than short-term investments, were as follows:
| | Small Cap Fund | | | SMid Cap Fund | | | Mid Cap Fund | | | Discovery Fund | |
Purchases of investment securities | | $ | 683,312,195 | | | $ | 294,297,578 | | | $ | 429,291 | | | $ | 2,987,753 | |
Proceeds from sales of investment securities | | $ | 599,285,426 | | | $ | 54,416,388 | | | $ | 123,825 | | | $ | 1,179,710 | |
4. Transactions with Related Parties
INVESTMENT ADVISORY AGREEMENT
The Small Cap Fund has entered into an Investment Advisory Agreement with the Adviser to provide supervision and assistance in overall management services to the Small Cap Fund. For these services, the Small Cap Fund pays the Adviser a management fee, calculated daily and paid monthly, equal to an annual rate of 0.90% of its average daily net assets. The Adviser has contractually agreed to limit the Small Cap Fund’s net annual operating expenses (excluding taxes, extraordinary expenses, reorganization expenses, brokerage commissions, interest, other expenditures that are capitalized in accordance with GAAP, and other extraordinary expenses not incurred in the ordinary course of such Fund’s business) to 1.10% (for the Investors Class) and 0.90% (for the Institutional Class) of average daily net assets until at least January 31, 2025. During the year ended September 30, 2024, the Adviser reduced its management fees of $34,999,231 from the Small Cap Fund by $990,228 and reimbursed other operating expenses of $2,952,359 under this arrangement. In addition, if at any point during the 24 months following the date that the Adviser reduced its management fees and/or made expense reimbursements, it becomes unnecessary for the Adviser to reduce its management fees or make expense reimbursements, the Adviser may recapture any of its prior management fee reductions or expense reimbursements to the extent such recapture does not cause the Fund’s total annual operating expenses to exceed the applicable expense limitation that was in effect
37
CONESTOGA FUNDS
NOTES TO FINANCIAL STATEMENTS (Continued)
at the time of the management fee reduction or expense reimbursement. As of September 30, 2024, the Adviser may seek recovery of management fee reductions and expense reimbursements no later than the dates as stated below:
| | September 30,
2025 | | | September 30,
2026 | | | Total | |
Small Cap Fund | | $ | 3,320,403 | | | $ | 3,942,587 | | | $ | 7,262,990 | |
During the year ended September 30, 2024, the Adviser did not recover any previous management fee reductions or expense reimbursements from the Small Cap Fund.
The SMid Cap Fund has entered into an Investment Advisory Agreement with the Adviser to provide supervision and assistance in overall management services to the SMid Cap Fund. For these services, the SMid Cap Fund pays the Adviser a management fee, calculated daily and paid monthly, equal to an annual rate of 0.85% of its average daily net assets. The Adviser has contractually agreed to limit the SMid Cap Fund’s net annual operating expenses (excluding interest, taxes, brokerage commissions, other expenditures that are capitalized in accordance with GAAP, and other extraordinary expenses not incurred in the ordinary course of such Fund’s business) to 1.10% (for the Investors Class) and 0.85% (for the Institutional Class) of average daily net assets until at least January 31, 2025. During the year ended September 30, 2024, the Adviser reduced its management fees of $4,451,442 from the SMid Cap Fund by $570,303 and reimbursed other operating expenses of $351,020 under this arrangement. In addition, if at any point during the 24 months following the date that the Adviser reduced its management fees and/or made expense reimbursements, it becomes unnecessary for the Adviser to reduce its management fees or make expense reimbursements, the Adviser may recapture any of its prior management fee reductions or expense reimbursements to the extent such recapture does not cause the Fund’s total annual operating expenses to exceed the current expense limitation or the applicable expense limitation that was in effect at the time of the management fee reduction or expense reimbursement. As of September 30, 2024, the Adviser may seek recovery of management fee reductions and expense reimbursements no later than the dates as stated below:
| | September 30,
2025 | | | September 30,
2026 | | | Total | |
SMid Cap Fund | | $ | 842,060 | | | $ | 921,323 | | | $ | 1,763,383 | |
During the year ended September 30, 2024, the Adviser did not recover any previous management fee reductions or expense reimbursements from the SMid Cap Fund.
The Mid Cap Fund has entered into an Investment Advisory Agreement with the Adviser to provide supervision and assistance in overall management services to the Mid Cap Fund. For these services, the Mid Cap Fund pays the Adviser a management fee, calculated
38
CONESTOGA FUNDS
NOTES TO FINANCIAL STATEMENTS (Continued)
daily and paid monthly, equal to an annual rate of 0.80% of its average daily net assets. The Adviser has contractually agreed to limit the Mid Cap Fund’s net annual operating expenses (excluding interest, taxes, brokerage commissions, other expenditures that are capitalized in accordance with GAAP, and other extraordinary expenses not incurred in the ordinary course of such Fund’s business) to 1.05% (for the Investors Class) and 0.80% (for the Institutional Class) of average daily net assets until at least January 31, 2025. During the year ended September 30, 2024, the Adviser did not collect any of its management fees of $22,467 from the Mid Cap Fund and reimbursed other operating expenses of $221,924 under this arrangement. In addition, if at any point during the 24 months following the date that the Adviser reduced its management fees and/or made expense reimbursements, it becomes unnecessary for the Adviser to reduce its management fees or make expense reimbursements, the Adviser may recapture any of its prior management fee reductions or expense reimbursements to the extent such recapture does not cause the Fund’s total annual operating expenses to exceed the current expense limitation or the applicable expense limitation that was in effect at the time of the management fee reduction or expense reimbursement. As of September 30, 2024, the Adviser may seek recovery of management fee reductions and expense reimbursements no later than the dates as stated below:
| | September 30,
2025 | | | September 30,
2026 | | | Total | |
Mid Cap Fund | | $ | 260,597 | | | $ | 244,391 | | | $ | 504,988 | |
During the year ended September 30, 2024, the Adviser did not recover any previous management fee reductions or expense reimbursements from the Mid Cap Fund.
The Discovery Fund has entered into an Investment Advisory Agreement with the Adviser to provide supervision and assistance in overall management services to the Discovery Fund. For these services, the Discovery Fund pays the Adviser a management fee, calculated daily and paid monthly, equal to an annual rate of 1.00% of its average daily net assets. The Adviser has contractually agreed to limit the Discovery Fund’s net annual operating expenses (excluding interest, taxes, brokerage commissions, other expenditures that are capitalized in accordance with GAAP, and other extraordinary expenses not incurred in the ordinary course of such Fund’s business) to 1.50% (for the Investors Class) and 1.25% (for the Institutional Class) of average daily net assets until at least January 31, 2025. During the year ended September 30, 2024, the Adviser did not collect any of its management fees of $37,225 from the Discovery Fund and reimbursed other operating expenses of $209,047 under this arrangement. In addition, if at any point during the 24 months following the date that the Adviser reduced its management fees and/or made expense reimbursements, it becomes unnecessary for the Adviser to reduce its management fees or make expense reimbursements, the Adviser may recapture any of its prior management fee reductions or expense reimbursements to the extent such
39
CONESTOGA FUNDS
NOTES TO FINANCIAL STATEMENTS (Continued)
recapture does not cause the Fund’s total annual operating expenses to exceed the current expense limitation or the applicable expense limitation that was in effect at the time of the management fee reduction or expense reimbursement. As of September 30, 2024, the Adviser may seek recovery of management fee reductions and expense reimbursements no later than the date as stated below:
| | September 30,
2025 | | | September 30,
2026 | | | Total | |
Discovery Fund | | $ | 258,435 | | | $ | 246,272 | | | $ | 504,707 | |
During the year ended September 30, 2024, the Adviser did not recover any previous management fee reductions or expense reimbursements from the Discovery Fund.
DISTRIBUTION AND SHAREHOLDER SERVICING PLANS
The Trust, on behalf of each Fund, has adopted a distribution plan (the “Distribution Plan”), pursuant to Rule 12b-1 under the 1940 Act, which permits each Fund to pay certain expenses associated with the distribution of Investors Class shares, including, but not limited to, advertising, printing of prospectuses and reports for other than existing shareholders, preparation and distribution of advertising material and sales literature, and payments to dealers and shareholder servicing agents who enter into agreements with the Funds. The Distribution Plan provides that each Fund may reimburse the Distributor (hereinafter defined) for distribution expenses in an amount not exceeding, on an annual basis, 0.25% of the average daily net assets allocable to Investors Class shares. During the year ended September 30, 2024, Investors Class shares of the Small Cap Fund, SMid Cap Fund, Mid Cap Fund and Discovery Fund incurred fees of $1,825,999, $107,065, $1,209, and $4,099, respectively, under the Distribution Plan.
The Trust, on behalf of each Fund, has adopted a Shareholder Servicing Plan under which each Fund may enter into agreements with various shareholder servicing agents, including financial institutions and securities brokers. Each Fund may pay shareholder servicing fees in an amount not exceeding, on an annual basis, 0.10% of the average daily net assets allocable to the Institutional Class shares and 0.25% of the average daily net assets allocable to the Investors Class shares. The Board has approved a limitation on the shareholder servicing fees of 0.05% of the average daily net assets attributable to Investors Class shares that will continue through at least September 30, 2025. During the year ended September 30, 2024, the Funds incurred the following fees under the Shareholder Servicing Plan:
| | Small Cap Fund | | | SMid Cap Fund | | | Mid Cap Fund | | | Discovery Fund | |
Institutional Class shares | | $ | 1,759,557 | | | $ | 261,616 | | | $ | 2,325 | | | $ | 2,083 | |
Investors Class shares | | $ | 365,198 | | | $ | 21,413 | | | $ | 242 | | | $ | 820 | |
40
CONESTOGA FUNDS
NOTES TO FINANCIAL STATEMENTS (Continued)
OTHER SERVICE PROVIDERS
Ultimus Fund Solutions, LLC (“Ultimus”) provides fund accounting, compliance, transfer agency and certain administration services to the Funds. Each Fund pays Ultimus fees in accordance with the agreements for such services. In addition, each Fund pays out-of-pocket expenses including, but not limited to, postage, supplies and costs related to the pricing of its portfolio securities.
Under the terms of a Distribution Agreement with the Trust, Ultimus Fund Distributors, LLC (the “Distributor”) serves as the principal underwriter to each Fund. The Distributor is a wholly-owned subsidiary of Ultimus.
Certain officers of the Trust are also officers of Ultimus and/or the Distributor. An employee of Ultimus serves as the Trust’s Anti-Money Laundering Officer.
TRUSTEE COMPENSATION
Trustees affiliated with the Adviser are not compensated by the Trust for their services. Effective January 1, 2024, each Trustee who is not an “interested person” of the Trust as defined in Section 2(a)(19) under the 1940 Act (“Independent Trustee”) receives a quarterly retainer of $15,625 (except that such retainer is $33,000 for the Lead Independent Trustee and $27,500 for the Chair of the Audit Committee), $5,000 per quarterly and special in-person meeting, and $2,500 per special telephonic meeting. From January 1, 2023 through December 31, 2023, each Independent Trustee received a quarterly retainer of $13,700 (except that such retainer was $21,250 for the Lead Independent Trustee and $20,000 for the Chair of the Audit Committee), $5,000 per quarterly and special in-person meeting, and $2,500 per special telephonic meeting. Each Fund pays its proportionate share of such fees.
PRINCIPAL HOLDERS OF FUND SHARES
As of September 30, 2024, the following shareholders owned of record 25% or more of the outstanding shares of each Fund:
NAME OF RECORD OWNERS | % Ownership |
Conestoga Small Cap Fund | |
Charles Schwab & Company, Inc. (for the benefit of its customers) | 29% |
National Financial Services, LLC (for the benefit of its customers) | 28% |
Conestoga SMid Cap Fund | |
National Financial Services, LLC (for the benefit of its customers) | 61% |
Conestoga Mid Cap Fund | |
Dominion Carolina Gas Transmission, LLC (for the benefit of its customers) | 41% |
Conestoga Discovery Fund | |
RBC Capital Markets, LLC (for the benefit of its customers) | 46% |
41
CONESTOGA FUNDS
NOTES TO FINANCIAL STATEMENTS (Continued)
A beneficial owner of 25% or more of a Fund’s outstanding shares may be considered a controlling person. That shareholder’s vote could have a more significant effect on matters presented at a shareholders’ meeting.
5. Affiliated Issuers
A company is considered an affiliate of a Fund under the 1940 Act if the Fund’s holdings in that company represent 5% or more of the outstanding voting shares of the company. The industry and percentage of net assets for these holdings can be found on the Small Cap Fund’s Schedule of Investments. Further information on these holdings for the year ended September 30, 2024 appears below:
| | Construction
Partners, Inc. -
Class A * | | | Digi
International,
Inc. | | | Douglas
Dynamics, Inc.** | |
Percentage of Outstanding Voting Shares Owned | | | 4.61 | % | | | 6.25 | % | | | 0.00 | % |
Shares at Beginning of Year | | | 2,616,607 | | | | 2,118,000 | | | | 1,172,834 | |
Shares Purchased During the Year | | | 114,575 | | | | 413,775 | | | | 341,200 | |
Shares Sold During the Year | | | (712,965 | ) | | | (255,169 | ) | | | (1,514,034 | ) |
Shares at End of Year | | | 2,018,217 | | | | 2,276,606 | | | | — | |
Market Value at Beginning of Year | | $ | 95,663,152 | | | $ | 57,186,000 | | | $ | 35,396,130 | |
Cost of Purchases During the Year | | | 6,780,875 | | | | 10,400,310 | | | | 10,323,759 | |
Cost of Sales During the Year | | | (14,042,369 | ) | | | (9,750,316 | ) | | | (53,462,033 | ) |
Change in Unrealized Appreciation (Depreciation) | | | 52,469,889 | | | | 4,838,969 | | | | 7,742,144 | |
Market Value at End of Year | | $ | 140,871,547 | | | $ | 62,674,963 | | | $ | — | |
Net Realized Gains (Losses) During the Year | | $ | 26,037,312 | | | $ | (3,082,568 | ) | | $ | (16,427,248 | ) |
Dividend Income Earned During the Year | | $ | — | | | $ | — | | | $ | 625,906 | |
| | LeMaitre
Vascular, Inc. | | | Mesa
Laboratories, Inc. | | | Model N, Inc.** | |
Percentage of Outstanding Voting Shares Owned | | | 6.32 | % | | | 6.73 | % | | | 0.00 | % |
Shares at Beginning of Year | | | 1,350,696 | | | | 350,206 | | | | 2,122,832 | |
Shares Purchased During the Year | | | 69,825 | | | | 55,275 | | | | 579,350 | |
Shares Sold During the Year | | | — | | | | (41,496 | ) | | | (1,400,000 | ) |
Shares Sold via Corporate Action During the Year | | | — | | | | — | | | | (1,302,182 | ) |
Shares at End of Year | | | 1,420,521 | | | | 363,985 | | | | — | |
Market Value at Beginning of Year | | $ | 73,585,918 | | | $ | 36,796,144 | | | $ | 51,818,329 | |
Cost of Purchases During the Year | | | 5,417,908 | | | | 5,450,206 | | | | 14,201,810 | |
Cost of Sales During the Year | | | — | | | | (7,757,882 | ) | | | (44,827,352 | ) |
Cost of Shares Sold via Corporate Action During the Year | | | — | | | | — | | | | (34,059,897 | ) |
Change in Unrealized Appreciation (Depreciation) | | | 52,948,370 | | | | 12,778,624 | | | | 12,867,110 | |
Market Value at End of Year | | $ | 131,952,196 | | | $ | 47,267,092 | | | $ | — | |
Net Realized Gains (Losses) During the Year | | $ | — | | | $ | (2,858,156 | ) | | $ | 1,973,696 | |
Dividend Income Earned During the Year | | $ | 851,736 | | | $ | 258,104 | | | $ | — | |
42
CONESTOGA FUNDS
NOTES TO FINANCIAL STATEMENTS (Continued)
| | Simulations Plus,
Inc. | | | Stevanato Group
S.p.A. | | | Transcat, Inc. | |
Percentage of Outstanding Voting Shares Owned | | | 6.33 | % | | | 8.74 | % | | | 7.04 | % |
Shares at Beginning of Year | | | 1,307,375 | | | | 2,767,677 | | | | 525,824 | |
Shares Purchased During the Year | | | 280,275 | | | | 2,120,510 | | | | 117,675 | |
Shares Sold During the Year | | | (321,270 | ) | | | (561,606 | ) | | | — | |
Shares at End of Year | | | 1,266,380 | | | | 4,326,581 | | | | 643,499 | |
Market Value at Beginning of Year | | $ | 54,517,538 | | | $ | 82,255,360 | | | $ | 51,514,977 | |
Cost of Purchases During the Year | | | 10,539,164 | | | | 56,521,259 | | | | 14,066,977 | |
Cost of Sales During the Year | | | (18,022,351 | ) | | | (17,893,808 | ) | | | — | |
Change in Unrealized Appreciation (Depreciation) | | | (6,484,863 | ) | | | (34,351,191 | ) | | | 12,133,420 | |
Market Value at End of Year | | $ | 40,549,488 | | | $ | 86,531,620 | | | $ | 77,715,374 | |
Net Realized Losses During the Year | | $ | (7,669,925 | ) | | $ | (6,933,948 | ) | | $ | — | |
Dividend Income Earned During the Year | | $ | 377,931 | | | $ | 248,474 | | | $ | — | |
| | | | | | | | Total | |
Market Value at Beginning of Year | | $ | 538,733,548 | |
Cost of Purchases During the Year | | | 133,702,268 | |
Cost of Sales During the Year | | | (165,756,111 | ) |
Cost of Shares Sold via Corporate Action During the Year | | | (34,059,897 | ) |
Change in Unrealized Appreciation (Depreciation) | | | 114,942,472 | |
Market Value at End of Year (with Construction Partners, Inc.) | | $ | 587,562,280 | |
Market Value at End of Year (without Construction Partners, Inc.) | | $ | 446,690,733 | |
Net Realized Losses During the Year | | $ | (8,960,837 | ) |
Dividend Income Earned During the Year | | $ | 2,362,151 | |
* | At September 30, 2024, the company was no longer defined as an affiliate, although it was an affiliate company during the Fund’s fiscal year. |
** | As of September 30, 2024, the company was no longer held by the Small Cap Fund. |
6. Capital Share Activity
The following table summarizes the capital share activity in Institutional Class shares of the Small Cap Fund:
| | For the Year Ended
September 30, 2024 | | | For the Year Ended
September 30, 2023 | |
| | Shares | | | Value | | | Shares | | | Value | |
Issued | | | 12,010,702 | | | $ | 859,013,339 | | | | 9,568,590 | | | $ | 636,483,743 | |
Reinvested | | | 280,347 | | | | 19,097,244 | | | | 1,058,207 | | | | 66,677,631 | |
Redeemed | | | (9,413,215 | ) | | | (673,945,503 | ) | | | (8,388,678 | ) | | | (547,835,383 | ) |
Total | | | 2,877,834 | | | $ | 204,165,080 | | | | 2,238,119 | | | $ | 155,325,991 | |
43
CONESTOGA FUNDS
NOTES TO FINANCIAL STATEMENTS (Continued)
The following table summarizes the capital share activity in Investors Class shares of the Small Cap Fund:
| | For the Year Ended
September 30, 2024 | | | For the Year Ended
September 30, 2023 | |
| | Shares | | | Value | | | Shares | | | Value | |
Issued | | | 1,797,536 | | | $ | 125,175,867 | | | | 1,696,286 | | | $ | 109,107,169 | |
Reinvested | | | 83,608 | | | | 5,572,497 | | | | 364,653 | | | | 22,531,924 | |
Redeemed | | | (2,534,382 | ) | | | (176,094,660 | ) | | | (2,284,994 | ) | | | (146,791,000 | ) |
Total | | | (653,238 | ) | | $ | (45,346,296 | ) | | | (224,055 | ) | | $ | (15,151,907 | ) |
The following table summarizes the capital share activity in Institutional Class shares of the SMid Cap Fund:
| | For the Year Ended
September 30, 2024 | | | For the Year Ended
September 30, 2023 | |
| | Shares | | | Value | | | Shares | | | Value | |
Issued | | | 14,669,278 | | | $ | 353,429,905 | | | | 4,494,324 | | | $ | 91,800,730 | |
Redeemed | | | (4,053,808 | ) | | | (96,004,772 | ) | | | (3,441,981 | ) | | | (68,915,724 | ) |
Total | | | 10,615,470 | | | $ | 257,425,133 | | | | 1,052,343 | | | $ | 22,885,006 | |
The following table summarizes the capital share activity in Investors Class shares of the SMid Cap Fund:
| | For the Year Ended
September 30, 2024 | | | For the Year Ended
September 30, 2023 | |
| | Shares | | | Value | | | Shares | | | Value | |
Issued | | | 151,112 | | | $ | 3,483,376 | | | | 646,012 | | | $ | 12,570,141 | |
Redeemed | | | (588,015 | ) | | | (13,518,396 | ) | | | (1,063,431 | ) | | | (21,382,886 | ) |
Total | | | (436,903 | ) | | $ | (10,035,020 | ) | | | (417,419 | ) | | $ | (8,812,745 | ) |
44
CONESTOGA FUNDS
NOTES TO FINANCIAL STATEMENTS (Continued)
The following table summarizes the capital share activity in Institutional Class shares of the Mid Cap Fund:
| | For the Year Ended
September 30, 2024 | | | For the Year Ended
September 30, 2023 | |
| | Shares | | | Value | | | Shares | | | Value | |
Issued | | | 36,169 | | | $ | 322,307 | | | | 40,866 | | | $ | 351,158 | |
Redeemed | | | (2,712 | ) | | | (23,295 | ) | | | (9,998 | ) | | | (86,211 | ) |
Total | | | 33,457 | | | $ | 299,012 | | | | 30,868 | | | $ | 264,947 | |
The following table summarizes the capital share activity in Investors Class shares of the Mid Cap Fund:
| | For the Year Ended
September 30, 2024 | | | For the Year Ended
September 30, 2023 | |
| | Shares | | | Value | | | Shares | | | Value | |
Issued | | | 2,557 | | | $ | 23,250 | | | | 243 | | | $ | 2,000 | |
Redeemed | | | (3,770 | ) | | | (34,125 | ) | | | (2,092 | ) | | | (15,628 | ) |
Total | | | (1,213 | ) | | $ | (10,875 | ) | | | (1,849 | ) | | $ | (13,628 | ) |
The following table summarizes the capital share activity in Institutional Class shares of the Discovery Fund:
| | For the Year Ended
September 30, 2024 | | | For the Year Ended
September 30, 2023 | |
| | Shares | | | Value | | | Shares | | | Value | |
Issued | | | 12,169 | | | $ | 85,000 | | | | — | | | $ | — | |
Redeemed | | | (2,523 | ) | | | (16,200 | ) | | | — | | | | — | |
Total | | | 9,646 | | | $ | 68,800 | | | | — | | | $ | — | |
The following table summarizes the capital share activity in Investors Class shares of the Discovery Fund:
| | For the Year Ended
September 30, 2024 | | | For the Year Ended
September 30, 2023 | |
| | Shares | | | Value | | | Shares | | | Value | |
Issued | | | 311,119 | | | $ | 2,182,550 | | | | 792 | | | $ | 5,944 | |
Redeemed | | | (48,200 | ) | | | (337,866 | ) | | | (4,657 | ) | | | (33,040 | ) |
Total | | | 262,919 | | | $ | 1,844,684 | | | | (3,865 | ) | | $ | (27,096 | ) |
45
CONESTOGA FUNDS
NOTES TO FINANCIAL STATEMENTS (Continued)
7. Industry Risk
If a Fund has significant investments in the securities of issuers within a particular industry, any development affecting that industry will have a greater impact on the value of the net assets of the Fund than would be the case if the Fund did not have significant investments in that industry. In addition, this may increase the risk of loss in the Fund and increase the volatility of the Fund’s NAV per share. Occasionally, market conditions, regulatory changes or other developments may negatively impact a particular industry. Under the Russell ICB Industry and Sector classification, equity companies are categorized within 11 industries and 45 sectors and 171 subsectors. As of September 30, 2024, the Funds had a significant value of their net assets invested in stocks within the Russell ICB industries as follows:
Fund | Russell ICB Industry | % Net Assets |
Small Cap Fund | Industrials | 34.3% |
| | Technology | 25.9% |
SMid Cap Fund | Industrials | 36.8% |
| | Technology | 22.7% |
Mid Cap Fund | Industrials | 27.1% |
| | Technology | 22.8% |
Discovery Fund | Industrials | 36.8% |
| | Health Care | 24.5% |
The Funds consider companies to be “in the same industry” for purposes of industry concentration if the companies are categorized in the same Russell ICB subsector. None of the Funds concentrated their investments by investing more than 25% of their net assets in a single Russell ICB subsector. As of September 30, 2024, the Small Cap Fund had 20.9% of its net assets invested in stocks within the Software subsector under the Russell ICB Industry and Sector classification.
8. Contingencies and Commitments
The Funds indemnify the Trust’s officers and Trustees for certain liabilities that might arise from the performance of their duties to the Funds. Additionally, in the normal course of business, the Funds enter into contracts that contain a variety of representations and warranties and that provide general indemnifications. The Funds’ maximum exposure under these arrangements is unknown, as this would involve future claims that may be made against the Funds that have not yet occurred. However, based on experience, the Funds expect the risk of loss to be remote.
46
CONESTOGA FUNDS
NOTES TO FINANCIAL STATEMENTS (Continued)
9. Recent Market Risk
International war or conflicts (including Russia’s invasion of Ukraine and the Israel-Hamas war) and geopolitical events in foreign countries, along with instability in regions such as Asia, Eastern Europe and the Middle East, possible terrorist attacks in the United States or around the world, and other similar events could adversely affect the U.S. and foreign financial markets. As a result, whether or not the Funds invest in securities located in or with significant exposure to the countries directly affected, the value and liquidity of the Funds’ investments may be negatively impacted. Further, due to closures of certain markets and restrictions on trading certain securities, the value of certain securities held by the Funds could be significantly impacted.
The impairment or failure of one or more banks with whom the Funds transact may inhibit a Fund’s ability to access depository accounts. In such cases, the Funds may be forced to delay or forgo investments, resulting in lower Fund performance. In the event of such a failure of a banking institution where the Funds hold depository accounts, access to such accounts could be restricted and FDIC protection may not be available for balances in excess of amounts insured by the FDIC. In such instances, the Funds may not recover such excess, uninsured amounts.
10. Subsequent Events
The Funds are required to recognize in the financial statements the effects of all subsequent events that provide additional evidence about conditions that existed as of the date of the Statements of Assets and Liabilities. For non-recognized subsequent events that must be disclosed to keep the financial statements from being misleading, the Funds are required to disclose the nature of the event as well as an estimate of its financial effect, or a statement that such an estimate cannot be made. Management has evaluated subsequent events through the issuance of these financial statements and has noted no such events.
47
CONESTOGA FUNDS
REPORT OF INDEPENDENT REGISTERED
PUBLIC ACCOUNTING FIRM
To the Shareholders and Board of Trustees of
Conestoga Funds
Opinion on the Financial Statements
We have audited the accompanying statements of assets and liabilities, including the schedules of investments, of Conestoga Funds comprising Conestoga Small Cap Fund, Conestoga SMid Cap Fund, Conestoga Mid Cap Fund, and Conestoga Discovery Fund (the “Funds”) as of September 30, 2024, the related statements of operations for the year then ended, the statements of changes in net assets and the financial highlights for each of the two years in the period then ended, and the related notes (collectively referred to as the “financial statements”). In our opinion, the financial statements present fairly, in all material respects, the financial position of each of the Funds as of September 30, 2024, the results of their operations for the year then ended, and the changes in net assets and the financial highlights for each of the two years in the period then ended, in conformity with accounting principles generally accepted in the United States of America.
The Funds’ financial highlights for the years ended September 30, 2022, and prior, were audited by other auditors whose report dated November 21, 2022, expressed an unqualified opinion on those financial highlights.
Basis for Opinion
These financial statements are the responsibility of the Funds’ management. Our responsibility is to express an opinion on the Funds’ financial statements based on our audits. We are a public accounting firm registered with the Public Company Accounting Oversight Board (United States) (“PCAOB”) and are required to be independent with respect to the Funds in accordance with the U.S. federal securities laws and the applicable rules and regulations of the Securities and Exchange Commission and the PCAOB.
We conducted our audits in accordance with the standards of the PCAOB. Those standards require that we plan and perform the audit to obtain reasonable assurance about whether the financial statements are free of material misstatement whether due to error or fraud.
Our audits included performing procedures to assess the risks of material misstatement of the financial statements, whether due to error or fraud, and performing procedures that respond to those risks. Such procedures included examining, on a test basis, evidence regarding the amounts and disclosures in the financial statements. Our procedures included confirmation of securities owned as of September 30, 2024, by correspondence with the custodian and brokers; when replies were not received from brokers, we performed other auditing procedures. Our audits also included evaluating the accounting
48
CONESTOGA FUNDS
REPORT OF INDEPENDENT REGISTERED
PUBLIC ACCOUNTING FIRM (Continued)
principles used and significant estimates made by management, as well as evaluating the overall presentation of the financial statements. We believe that our audits provide a reasonable basis for our opinion.
We have served as the Funds’ auditor since 2023.

COHEN & COMPANY, LTD.
Philadelphia, Pennsylvania
November 25, 2024
49
CONESTOGA FUNDS
Other Information (Unaudited)
A description of the policies and procedures that the Funds use to vote proxies relating to portfolio securities is available without charge upon request by calling toll-free 1-800-494-2755, or on the SEC’s website at sec.gov. Information regarding how the Funds voted proxies relating to portfolio securities during the most recent 12-month period ended June 30 is available without charge upon request by calling toll-free 1-800-494-2755, or on the SEC’s website at sec.gov.
The Trust files a complete listing of portfolio holdings for the Funds with the SEC as of the end of the first and third quarters of each fiscal year as an exhibit to its reports on Form N-PORT. These filings are available upon request by calling 1-800-494-2755. Furthermore, you may obtain a copy of the filings on the SEC’s website at sec.gov and on the Funds’ website conestogafunds.com.
Federal Tax Information (Unaudited)
For the fiscal year ended September 30, 2024, the Small Cap Fund designated $32,698,140 as long-term capital gain distributions.
50
This page intentionally left blank.
This page intentionally left blank.
This page intentionally left blank.
Interested Trustees Robert M. Mitchell, Chairman and
Chief Executive Officer
Mark S. Clewett, Senior Vice President Independent Trustees Nicholas J. Kovich, Lead Independent Trustee
James G. Logue
Denise C. Marbach
M. Eugenie G. Logue
James R. Warren Investment Adviser Conestoga Capital Advisors, LLC
CrossPoint at Valley Forge
550 E. Swedesford Road, Suite 120
Wayne, PA 19087 Dividend Paying Agent,
Shareholders’ Servicing Agent,
Transfer Agent Ultimus Fund Solutions, LLC
225 Pictoria Drive, Suite 450
Cincinnati, OH 45246 Custodian UMB Bank, NA
928 Grand Blvd.
Kansas City, MO 64106 Distributor Ultimus Fund Distributors, LLC
225 Pictoria Drive, Suite 450
Cincinnati, OH 45246 | Independent Registered Public Accounting Firm Cohen & Company, Ltd.
1835 Market Street, Suite 310
Philadelphia, PA 19103 Legal Counsel Faegre Drinker Biddle & Reath LLP
One Logan Square Suite 2000
Philadelphia, PA 19103 Conestoga Funds’ Officers Robert M. Mitchell, Chairman and
Chief Executive Officer
Duane R. D’Orazio, Secretary and Chief Compliance Officer
Mark S. Clewett, Senior Vice President
Joseph F. Monahan, Senior Vice President and Treasurer
Angela A. Simmons, Assistant Treasurer
Daniel D. Bauer, Assistant Treasurer
Neil Walker, Assistant Treasurer
Stephen L. Preston, Assistant Vice President
and Anti-Money Laundering Officer |
This report is provided for the general information of the shareholders of the Conestoga Small Cap, SMid Cap, Mid Cap and Discovery Funds. This report is not intended for distribution to prospective investors in the Funds, unless preceded or accompanied by an effective prospectus.
(b) Included in (a)
| Item 8. | Changes in and Disagreements with Accountants for Open-End Management Investment Companies. |
Not applicable
| Item 9. | Proxy Disclosures for Open-End Management Investment Companies. |
Not applicable
| Item 10. | Remuneration Paid to Directors, Officers, and Others of Open-End Management Investment Companies. |
Not applicable [filed under item 7]
| Item 11. | Statement Regarding Basis for Approval of Investment Advisory Contract. |
Not applicable
| Item 12. | Disclosure of Proxy Voting Policies and Procedures for Closed-End Management Investment Companies. |
Not applicable
| Item 13. | Portfolio Managers of Closed-End Management Investment Companies. |
Not applicable
| Item 14. | Purchases of Equity Securities by Closed-End Management Investment Company and Affiliated Purchasers. |
Not applicable
| Item 15. | Submission of Matters to a Vote of Security Holders. |
The registrant has not adopted procedures by which shareholders may recommend nominees to the registrant’s board of trustees.
| Item 16. | Controls and Procedures. |
(a) Based on their evaluation of the registrant’s disclosure controls and procedures (as defined in Rule 30a-3(c) under the Investment Company Act of 1940) as of a date within 90 days of the filing date of this report, the registrant’s principal executive officer and principal financial officer have concluded that such disclosure controls and procedures are reasonably designed and are operating effectively to ensure that material information relating to the registrant, including its consolidated subsidiaries, is made known to them by others within those entities, particularly during the period in which this report is being prepared, and that the information required in filings on Form N-CSR is recorded, processed, summarized, and reported on a timely basis.
(b) There were no changes in the registrant’s internal control over financial reporting (as defined in Rule 30a-3(d) under the Investment Company Act of 1940) that occurred during the period covered by this report that have materially affected, or are reasonably likely to materially affect, the registrant’s internal control over financial reporting.
Item 17. Disclosure of Securities Lending Activities for Closed-End Management Investment Companies.
Not applicable
Item 18. Recovery of Erroneously Awarded Compensation.
Not applicable
Item 19. Exhibits.
File the exhibits listed below as part of this Form. Letter or number the exhibits in the sequence indicated.
(a)(1) Any code of ethics, or amendment thereto, that is the subject of the disclosure required by Item 2, to the extent that the registrant intends to satisfy the Item 2 requirements through filing of an exhibit: Attached hereto
(a)(2) A separate certification for each principal executive officer and principal financial officer of the registrant as required by Rule 30a-2(a) under the Act (17 CFR 270.30a-2(a)): Attached hereto
(1) Not applicable
(2) Change in the registrant’s independent public accountant: Not applicable
(b) Certifications required by Rule 30a-2(b) under the Act (17 CFR 270.30a-2(b)): Attached hereto
| Exhibit 99.CERT | Certifications required by Rule 30a-2(a) under the Act |
| | |
| Exhibit 99.906CERT | Certifications required by Rule 30a-2(b) under the Act |
| | |
| Exhibit 99.CODE ETH | Code of Ethics |
SIGNATURES
Pursuant to the requirements of the Securities Exchange Act of 1934 and the Investment Company Act of 1940, the registrant has duly caused this report to be signed on its behalf by the undersigned, thereunto duly authorized.
| (Registrant) | Conestoga Funds | | | |
| | | | | |
| By (Signature and Title)* | | /s/ Robert M. Mitchell. | |
| | | | Robert M. Mitchell, Chief Executive Officer | |
| | | | | |
| Date | December 4, 2024 | | | |
| | | | | |
| Pursuant to the requirements of the Securities Exchange Act of 1934 and the Investment Company Act of 1940, this report has been signed below by the following persons on behalf of the registrant and in the capacities and on the dates indicated. |
| | | | | |
| By (Signature and Title)* | | /s/ Robert M. Mitchell | |
| | | | Robert M. Mitchell, Chief Executive Officer | |
| | | | | |
| Date | December 4, 2024 | | | |
| | | | | |
| By (Signature and Title)* | | /s/ Joseph F. Monahan | |
| | | | Joseph F. Monahan, Treasurer and Principal Accounting Officer | |
| | | | | |
| Date | December 4, 2024 | | | |
| * | Print the name and title of each signing officer under his or her signature. |