UNITED STATES
SECURITIES AND EXCHANGE COMMISSION
Washington, D.C. 20549
FORM N-CSR
CERTIFIED SHAREHOLDER REPORT OF REGISTERED
MANAGEMENT INVESTMENT COMPANIES
Investment Company Act file number 811-21128
Legg Mason Partners Variable Equity Trust
(Exact name of registrant as specified in charter)
620 Eighth Avenue, 47th Floor, New York, NY 10018
(Address of principal executive offices) (Zip code)
Marc A. De Oliveira.
Franklin Templeton
100 First Stamford Place
Stamford, CT 06902
(Name and address of agent for service)
Registrant’s telephone number, including area code: 877-6LM-FUND/656-3863
Date of fiscal year end: December 31
Date of reporting period: June 30, 2023
| ITEM 1. | REPORT TO STOCKHOLDERS. |
The Semi-Annual Report to Stockholders is filed herewith.
June 30, 2023

Semi-Annual Report
Franklin Templeton
Model Portfolio Funds
Franklin Templeton Aggressive Model Portfolio
Franklin Templeton Moderately Aggressive Model Portfolio
Franklin Templeton Moderate Model Portfolio
Franklin Templeton Moderately Conservative Model Portfolio
Franklin Templeton Conservative Model Portfolio
The Securities and Exchange Commission has adopted new regulations that will result in changes to the design and delivery of annual and semi-annual shareholder reports beginning in July 2024.
If you have previously elected to receive shareholder reports electronically, you will continue to do so and need not take any action.
Otherwise, paper copies of the Fund’s shareholder reports will be mailed to you beginning in July 2024. If you would like to receive shareholder reports and other communications from the Fund electronically instead of by mail, you may make that request at any time by contacting your insurance company or your financial intermediary (such as a broker-dealer or bank).
|
| INVESTMENT PRODUCTS: NOT FDIC INSURED • NO BANK GUARANTEE • MAY LOSE VALUE |
Franklin Templeton Model Portfolio Funds
Franklin Templeton Model Portfolio Funds (“Model Portfolio Funds”) consists of separate investment Portfolios, each with its own investment objective and policies. Each Portfolio is a “fund of funds,” investing in other mutual funds, and is managed as an asset allocation program.
The Portfolios are separate investment series of Legg Mason Partners Variable Equity Trust, a Maryland statutory trust.
Letter from the president

Dear Shareholder,
We are pleased to provide the semi-annual report of Franklin Templeton Model Portfolio Funds for the six-month reporting period ended June 30, 2023. Please read on for each Portfolio’s performance information during the Portfolios’ reporting period.
As always, we remain committed to providing you with excellent service and a full spectrum of investment choices. We also remain committed to supplementing the support you receive from your financial advisor. One way we accomplish this is through our website, www.franklintempleton.com. Here you can gain immediate access to market and investment information, including:
| • | | Market insights and commentaries from our portfolio managers and |
| • | | A host of educational resources. |
We look forward to helping you meet your financial goals.
Sincerely,

Jane Trust, CFA
President and Chief Executive Officer
July 31, 2023
| | |
II | | Franklin Templeton Model Portfolio Funds |
Portfolios overview
Each of the five Franklin Templeton Model Portfolio Funds is managed as an asset allocation program and allocates its assets among insurance-dedicated mutual funds that have been selected by New York Life Insurance and Annuity Corporation (“NYLIAC”) as investment options for use with their variable annuity and variable universal life insurance policies, noninsurance-dedicated mutual funds and exchange traded funds (the “underlying funds”). The underlying funds include funds managed by investment advisers that are not affiliated with the Portfolios’ manager and funds managed by affiliated investment advisers. When selecting investments to fulfill a desired asset class exposure, the portfolio managers expect to allocate primarily to underlying funds managed by unaffiliated investment advisers, but may also allocate to affiliated underlying funds. The underlying funds may change from time to time without prior notice to shareholders.
Franklin Templeton Aggressive Model Portfolio1
Franklin Templeton Aggressive Model Portfolio seeks capital appreciation. The Portfolio organizes its investments in underlying funds into two main asset classes: the equity class (equity securities of all types) and the fixed income class (fixed income securities of all types). The portfolio managers may invest across all asset classes and strategies. Under ordinary circumstances, the portfolio managers expect to allocate between 80% to 100% of the Portfolio’s assets among underlying funds that invest in equity and equity-like strategies and between 0% to 20% of the Portfolio’s assets among underlying funds that invest in fixed income strategies. The Portfolio’s allocation to each class will be measured at the time of purchase and may vary thereafter as a result of market movement. The Portfolio compares its performance to a composite benchmark, consisting of 75% Russell 3000 Indexi, 15% MSCI World Ex U.S.A. Indexii, and 10% Bloomberg U.S. Aggregate Indexiii. The portfolio managers will seek to maintain a level of risk in the Portfolio similar to that of this composite benchmark.
Performance review
For the six months ended June 30, 2023, Class I shares of Franklin Templeton Aggressive Model Portfolio returned 10.94%. The Portfolio’s unmanaged benchmarks, the Bloomberg U.S. Aggregate Index, the Russell 3000 Index, and the Aggressive Model Portfolio Composite Benchmarkiv, returned 2.09%, 16.17% and 14.00%, respectively, over the same time frame.
| | | | |
Performance Snapshot as of June 30, 2023
(unaudited) | |
| | | 6 months | |
| Franklin Templeton Aggressive Model Portfolio: | | | | |
Class I | | | 10.94 | % |
Class II | | | 10.79 | % |
| Bloomberg U.S. Aggregate Index | | | 2.09 | % |
| Russell 3000 Index | | | 16.17 | % |
| Aggressive Model Portfolio Composite Benchmark | | | 14.00 | % |
The performance shown represents past performance. Past performance is no guarantee of future results and current performance may be higher or lower than the performance shown above. Principal value and investment returns will fluctuate and investors’ shares, when redeemed, may be worth more or less than their original cost.
All share class returns assume the reinvestment of all distributions, including returns of capital, if any, at net asset value and the deduction of all Portfolio expenses. Performance figures for periods shorter than one year represent cumulative figures and are not annualized.
The portfolio managers periodically adjust the allocation of the Portfolio’s assets among the underlying funds depending upon the portfolio managers’ outlook for the equity and bond markets in general, particular sectors of such markets and the performance outlook for the underlying funds. In assessing the equity and bond markets, the portfolio managers consider a broad range of market and economic trends and quantitative factors.
|
| Total Annual Operating Expenses† (unaudited) |
As of the Portfolio’s current prospectus dated May 1, 2023, the gross total annual fund operating expense ratios for Class I and Class II were 0.65% and 0.90%, respectively.
Actual expenses may be higher. For example, expenses may be higher than those shown if average net assets decrease. Net assets are more likely to decrease and Fund expense ratios are more likely to increase when markets are volatile.
| 1 | The Portfolio is an underlying investment option of various variable annuity and variable life insurance products. The Portfolio’s performance returns do not reflect the deduction of expenses imposed in connection with investing in variable annuity or variable life insurance contracts, such as administrative fees, account charges and surrender charges, which, if reflected, would reduce the performance of the Portfolio. Past performance is no guarantee of future results. |
| † | Includes expenses of the underlying funds in which the Portfolio invests. |
| | |
| Franklin Templeton Model Portfolio Funds 2023 Semi-Annual Report | | III |
Portfolios overview (cont’d)
Franklin Templeton Moderately Aggressive Model Portfolio1
Franklin Templeton Moderately Aggressive Model Portfolio seeks capital appreciation. The Portfolio organizes its investments in underlying funds into two main asset classes: the equity class (equity securities of all types) and the fixed income class (fixed income securities of all types). The portfolio managers may invest across all asset classes and strategies. Under ordinary circumstances, the portfolio managers expect to allocate between 60% to 70% of the Portfolio’s assets among underlying funds that invest in equity and equity-like strategies and between 30% to 40% of the Portfolio’s assets among underlying funds that invest in fixed income strategies. The Portfolio’s allocation to each class will be measured at the time of purchase and may vary thereafter as a result of market movement. The Portfolio compares its performance to a composite benchmark, consisting of 60% Russell 3000 Index, 10% MSCI World Ex U.S.A. Index, and 30% Bloomberg U.S. Aggregate Index. The portfolio managers will seek to maintain a level of risk in the Portfolio similar to that of this composite benchmark.
Performance review
For the six months ended June 30, 2023, Class I shares of Franklin Templeton Moderately Aggressive Model Portfolio returned 9.25%. The Portfolio’s unmanaged benchmarks, the Bloomberg U.S. Aggregate Index, the Russell 3000 Index, and the Moderately Aggressive Model Portfolio Composite Benchmarkv, returned 2.09%, 16.17% and 11.36%, respectively, over the same time frame.
| | | | |
Performance Snapshot as of June 30, 2023
(unaudited) | |
| | | 6 months | |
| Franklin Templeton Moderately Aggressive Model Portfolio: | | | | |
Class I | | | 9.25 | % |
Class II | | | 9.08 | % |
| Bloomberg U.S. Aggregate Index | | | 2.09 | % |
| Russell 3000 Index | | | 16.17 | % |
| Moderately Aggressive Model Portfolio Composite Benchmark | | | 11.36 | % |
The performance shown represents past performance. Past performance is no guarantee of future results and current performance may be higher or lower than the performance shown above. Principal value and investment returns will fluctuate and investors’ shares, when redeemed, may be worth more or less than their original cost.
All share class returns assume the reinvestment of all distributions, including returns of capital, if any, at net asset value and the deduction of all Portfolio expenses. Performance figures for periods shorter than one year represent cumulative figures and are not annualized.
The portfolio managers periodically adjust the allocation of the Portfolio’s assets among the underlying funds depending upon the portfolio managers’ outlook for the equity and bond markets in general, particular sectors of such markets and the performance outlook for the underlying funds. In assessing the equity and bond markets, the portfolio managers consider a broad range of market and economic trends and quantitative factors.
|
| Total Annual Operating Expenses† (unaudited) |
As of the Portfolio’s current prospectus dated May 1, 2023, the gross total annual fund operating expense ratios for Class I and Class II were 0.62% and 0.87%, respectively.
Actual expenses may be higher. For example, expenses may be higher than those shown if average net assets decrease. Net assets are more likely to decrease and Portfolio expense ratios are more likely to increase when markets are volatile.
| 1 | The Portfolio is an underlying investment option of various variable annuity and variable life insurance products. The Portfolio’s performance returns do not reflect the deduction of expenses imposed in connection with investing in variable annuity or variable life insurance contracts, such as administrative fees, account charges and surrender charges, which, if reflected, would reduce the performance of the Portfolio. Past performance is no guarantee of future results. |
| † | Includes expenses of the underlying funds in which the Portfolio invests. |
| | |
IV | | Franklin Templeton Model Portfolio Funds 2023 Semi-Annual Report |
Franklin Templeton Moderate Model Portfolio1
Franklin Templeton Moderate Model Portfolio seeks capital appreciation. The Portfolio organizes its investments in underlying funds into two main asset classes: the equity class (equity securities of all types) and the fixed income class (fixed income securities of all types). The portfolio managers may invest across all asset classes and strategies. Under ordinary circumstances, the portfolio managers expect to allocate between 45% to 65% of the Portfolio’s assets among underlying funds that invest in equity and equity-like strategies and between 35% to 55% of the Portfolio’s assets among underlying funds that invest in fixed income strategies. The Portfolio’s allocation to each class will be measured at the time of purchase and may vary thereafter as a result of market movement. The Portfolio compares its performance to a composite benchmark, consisting of 45% Russell 3000 Index, 10% MSCI World Ex U.S.A. Index, and 45% Bloomberg U.S. Aggregate Index. The portfolio managers will seek to maintain a level of risk in the Portfolio similar to that of this composite benchmark.
Performance review
For the six months ended June 30, 2023, Class I shares of Franklin Templeton Moderate Model Portfolio returned 7.46%. The Portfolio’s unmanaged benchmarks, the Bloomberg U.S. Aggregate Index, the Russell 3000 Index, and the Moderate Model Portfolio Composite Benchmarkvi, returned 2.09%, 16.17% and 9.23%, respectively, over the same time frame.
| | | | |
Performance Snapshot as of June 30, 2023
(unaudited) | |
| | | 6 months | |
| Franklin Templeton Moderate Model Portfolio: | | | | |
Class I | | | 7.46 | % |
Class II | | | 7.39 | % |
| Bloomberg U.S. Aggregate Index | | | 2.09 | % |
| Russell 3000 Index | | | 16.17 | % |
| Moderate Model Portfolio Composite Benchmark | | | 9.23 | % |
The performance shown represents past performance. Past performance is no guarantee of future results and current performance may be higher or lower than the performance shown above. Principal value and investment returns will fluctuate and investors’ shares, when redeemed, may be worth more or less than their original cost.
All share class returns assume the reinvestment of all distributions, including returns of capital, if any, at net asset value and the deduction of all Portfolio expenses. Performance figures for periods shorter than one year represent cumulative figures and are not annualized.
The portfolio managers periodically adjust the allocation of the Portfolio’s assets among underlying funds depending upon the portfolio managers’ outlook for the equity and bond markets in general, particular sectors of such markets and the performance outlook for the underlying funds. In assessing the equity and bond markets, the portfolio managers consider a broad range of market and economic trends and quantitative factors.
|
| Total Annual Operating Expenses† (unaudited) |
As of the Portfolio’s current prospectus dated May 1, 2023, the gross total annual fund operating expense ratios for Class I and Class II were 0.59% and 0.84%, respectively.
Actual expenses may be higher. For example, expenses may be higher than those shown if average net assets decrease. Net assets are more likely to decrease and Portfolio expense ratios are more likely to increase when markets are volatile.
| 1 | The Portfolio is an underlying investment option of various variable annuity and variable life insurance products. The Portfolio’s performance returns do not reflect the deduction of expenses imposed in connection with investing in variable annuity or variable life insurance contracts, such as administrative fees, account charges and surrender charges, which, if reflected, would reduce the performance of the Portfolio. Past performance is no guarantee of future results. |
| † | Includes expenses of the underlying funds in which the Portfolio invests. |
| | |
| Franklin Templeton Model Portfolio Funds 2023 Semi-Annual Report | | V |
Portfolios overview (cont’d)
Franklin Templeton Moderately Conservative Model Portfolio1
Franklin Templeton Moderately Conservative Model Portfolio seeks a balance of capital appreciation and income. The Portfolio organizes its investments in underlying funds into two main asset classes: the equity class (equity securities of all types) and the fixed income class (fixed income securities of all types). The portfolio managers may invest across all asset classes and strategies. Under ordinary circumstances, the portfolio managers expect to allocate between 30% to 50% of the Portfolio’s assets among underlying funds that invest in equity and equity-like strategies and between 50% to 70% of the Portfolio’s assets among underlying funds that invest in fixed income strategies. The Portfolio’s allocation to each class will be measured at the time of purchase and may vary thereafter as a result of market movement. The Portfolio compares its performance to a composite benchmark, consisting of 35% Russell 3000 Index, 5% MSCI World Ex U.S.A. Index, and 60% Bloomberg U.S. Aggregate Index. The portfolio managers will seek to maintain a level of risk in the Portfolio similar to that of this composite benchmark.
Performance review
For the six months ended June 30, 2023, Class I shares of Franklin Templeton Moderately Conservative Model Portfolio returned 5.37%. The Portfolio’s unmanaged benchmarks, the Bloomberg U.S. Aggregate Index, the Russell 3000 Index, and the Moderately Conservative Model Portfolio Composite Benchmarkvii, returned 2.09%, 16.17% and 7.36%, respectively, over the same time frame.
| | | | |
Performance Snapshot as of June 30, 2023
(unaudited) | |
| | | 6 months | |
| Franklin Templeton Moderately Conservative Model Portfolio: | | | | |
Class I | | | 5.37 | % |
Class II | | | 5.28 | % |
| Bloomberg U.S. Aggregate Index | | | 2.09 | % |
| Russell 3000 Index | | | 16.17 | % |
| Moderately Conservative Model Portfolio Composite Benchmark | | | 7.36 | % |
The performance shown represents past performance. Past performance is no guarantee of future results and current performance may be higher or lower than the performance shown above. Principal value and investment returns will fluctuate and investors’ shares, when redeemed, may be worth more or less than their original cost.
All share class returns assume the reinvestment of all distributions, including returns of capital, if any, at net asset value and the deduction of all Portfolio expenses. Performance figures for periods shorter than one year represent cumulative figures and are not annualized.
The portfolio managers periodically adjust the allocation of the Portfolio’s assets among underlying funds depending upon the portfolio managers’ outlook for the equity and bond markets in general, particular sectors of such markets and the performance outlook for the underlying funds. In assessing the equity and bond markets, the portfolio managers consider a broad range of market and economic trends and quantitative factors.
|
| Total Annual Operating Expenses† (unaudited) |
As of the Portfolio’s current prospectus dated May 1, 2023, the gross total annual fund operating expense ratios for Class I and Class II were 0.61% and 0.85%, respectively.
Actual expenses may be higher. For example, expenses may be higher than those shown if average net assets decrease. Net assets are more likely to decrease and Fund expense ratios are more likely to increase when markets are volatile.
| 1 | The Portfolio is an underlying investment option of various variable annuity and variable life insurance products. The Portfolio’s performance returns do not reflect the deduction of expenses imposed in connection with investing in variable annuity or variable life insurance contracts, such as administrative fees, account charges and surrender charges, which, if reflected, would reduce the performance of the Portfolio. Past performance is no guarantee of future results. |
| † | Includes expenses of the underlying funds in which the Portfolio invests. |
| | |
VI | | Franklin Templeton Model Portfolio Funds 2023 Semi-Annual Report |
Franklin Templeton Conservative Model Portfolio1
Franklin Templeton Conservative Model Portfolio seeks a balance of capital appreciation and income. The Portfolio organizes its investments in underlying funds into two main asset classes: the equity class (equity securities of all types) and the fixed income class (fixed income securities of all types). The portfolio managers may invest across all asset classes and strategies. Under ordinary circumstances, the portfolio managers expect to allocate between 10% to 30% of the Portfolio’s assets among underlying funds that invest in equity and equity-like strategies and between 70% to 90% of the Portfolio’s assets among underlying funds that invest in fixed income strategies. The Portfolio’s allocation to each class will be measured at the time of purchase and may vary thereafter as a result of market movement. The Portfolio compares its performance to a composite benchmark, consisting of 20% Russell 3000 Index and 80% Bloomberg U.S. Aggregate Index. The portfolio managers will seek to maintain a level of risk in the Portfolio similar to that of this composite benchmark.
Performance review
For the six months ended June 30, 2023, Class I shares of Franklin Templeton Conservative Model Portfolio returned 3.83%. The Portfolio’s unmanaged benchmarks, the Bloomberg U.S. Aggregate Index, the Russell 3000 Index, and the Conservative Model Portfolio Composite Benchmarkviii, returned 2.09%, 16.17% and 4.82%, respectively, over the same time frame.
| | | | |
Performance Snapshot as of June 30, 2023
(unaudited) | |
| | | 6 months | |
| Franklin Templeton Conservative Model Portfolio: | | | | |
Class I | | | 3.83 | % |
Class II | | | 3.72 | % |
| Bloomberg U.S. Aggregate Index | | | 2.09 | % |
| Russell 3000 Index | | | 16.17 | % |
| Conservative Model Portfolio Composite Benchmark | | | 4.82 | % |
The performance shown represents past performance. Past performance is no guarantee of future results and current performance may be higher or lower than the performance shown above. Principal value and investment returns will fluctuate and investors’ shares, when redeemed, may be worth more or less than their original cost.
All share class returns assume the reinvestment of all distributions, including returns of capital, if any, at net asset value and the deduction of all Portfolio expenses. Performance figures for periods shorter than one year represent cumulative figures and are not annualized.
The portfolio managers periodically adjust the allocation of the Portfolio’s assets among underlying funds depending upon the portfolio managers’ outlook for the equity and bond markets in general, particular sectors of such markets and the performance outlook for the underlying funds. In assessing the equity and bond markets, the portfolio managers consider a broad range of market and economic trends and quantitative factors.
|
| Total Annual Operating Expenses† (unaudited) |
As of the Portfolio’s current prospectus dated May 1, 2023, the gross total annual fund operating expense ratios for Class I and Class II were 0.64% and 0.89%, respectively.
Actual expenses may be higher. For example, expenses may be higher than those shown if average net assets decrease. Net assets are more likely to decrease and Fund expense ratios are more likely to increase when markets are volatile.
| 1 | The Portfolio is an underlying investment option of various variable annuity and variable life insurance products. The Portfolio’s performance returns do not reflect the deduction of expenses imposed in connection with investing in variable annuity or variable life insurance contracts, such as administrative fees, account charges and surrender charges, which, if reflected, would reduce the performance of the Portfolio. Past performance is no guarantee of future results. |
| † | Includes expenses of the underlying funds in which the Portfolio invests. |
| | |
| Franklin Templeton Model Portfolio Funds 2023 Semi-Annual Report | | VII |
Portfolios overview (cont’d)
As always, thank you for your confidence in our stewardship of your assets.
Sincerely,
Jane Trust, CFA
President and Chief Executive Officer
July 31, 2023
RISKS: Equity securities are subject to price fluctuation and possible loss of principal. Small- and mid-cap stocks involve greater risks and volatility than large-cap stocks. International investments are subject to special risks, including currency fluctuations and social, economic, and political uncertainties, which could increase volatility. These risks are magnified in emerging markets. Emerging market countries tend to have economic, political, and legal systems that are less developed and are less stable than those of more developed countries. Fixed income securities involve interest rate, credit, inflation, and reinvestment risks, and possible loss of principal. As interest rates rise, the value of fixed income securities falls. High yield bonds are subject to greater price volatility, illiquidity, and possibility of default.
Each Portfolio is a fund of funds and is subject to the risks of the underlying funds in which it invests. In addition to the Portfolios’ operating expenses, you will indirectly bear the operating expenses of the underlying funds. The investment strategies employed by the underlying funds and the securities in which they invest may change without the knowledge of the Portfolios’ portfolio managers. The portfolio managers may invest each Portfolio’s assets in underlying funds that have a limited performance history. Each underlying fund may engage in active and frequent trading, resulting in higher portfolio turnover and transaction costs. The underlying funds in which each Portfolio invests may be either diversified or non-diversified. Certain of the underlying funds may engage in short selling, which is a speculative strategy that involves special risks. Unlike the possible loss on a security that is purchased, there is no limit on the amount of loss on an appreciating security that is sold short.
The model used to manage each Portfolio’s assets provides no assurance that the recommended allocation will either maximize returns or minimize risks. There is no assurance that a recommended allocation will prove the ideal allocation in all circumstances. Derivatives, such as options and futures, can be illiquid, may disproportionately increase losses, and have a potentially large impact on each Portfolio’s performance. The market values of securities or other assets will fluctuate, sometimes sharply and unpredictably, due to changes in general market conditions, overall economic trends or events, governmental actions or intervention, actions taken by the U.S. Federal Reserve or foreign central banks, market disruptions caused by trade disputes or other factors, political developments, armed conflicts, economic sanctions and countermeasures in response to sanctions, major cybersecurity events, investor sentiment, the global and domestic effects of a pandemic, and other factors that may or may not be related to the issuer of the security or other asset. Please see the Portfolios’ prospectus for a more complete discussion of these and other risks and each Portfolio’s investment strategies.
All investments are subject to risk including the possible loss of principal. Past performance is no guarantee of future results. All index performance reflects no deduction for fees, expenses or taxes. Please note that an investor cannot invest directly in an index.
IMPORTANT INFORMATION: The Portfolios are available only to insurance company separate accounts established by New York Life Insurance and Annuity Corporation that fund certain variable annuity and variable life insurance contracts. These Portfolios may not be available in all states and may only be offered in certain variable products. Please refer to the prospectuses. Variable annuities are long-term, tax-deferred investment vehicles designed for retirement purposes. Gains from tax-deferred investments are taxable as ordinary income upon withdrawal. Withdrawals made prior to age 59 1/2 are subject to a 10% IRS penalty charge and/or surrender charges. Investments in a variable annuity are subject to market risks, including loss of principal. Guarantees are based on the claims-paying ability of the insurer.
| i | The Russell 3000 Index measures the performance of the 3,000 largest U.S. companies based on total market capitalization, which represents approximately 98% of the U.S. equity market. |
| ii | MSCI World Ex U.S.A. Index captures large-, mid- and small-cap representation across 22 of 23 Developed Markets (DM) countries — excluding the United States. The MSCI World Ex U.S.A. Index calculates performance utilizing local currencies taking out the effect of converting to the U.S. dollar. |
| iii | The Bloomberg U.S. Aggregate Index is a broad-based bond index comprised of government, corporate, mortgage- and asset-backed issues, rated investment grade or higher, and having at least one year to maturity. |
| iv | The Aggressive Model Portfolio Composite Benchmark is a hypothetical representation of the performance of the Portfolio’s major asset classes. It consists of consists of 75% Russell 3000 Index, 15% MSCI World Ex U.S.A. Index, and 10% Bloomberg U.S. Aggregate Index. |
| v | The Moderately Aggressive Model Portfolio Composite Benchmark is a hypothetical representation of the performance of the Portfolio’s major asset classes. It consists of consists of 60% Russell 3000 Index, 10% MSCI World Ex U.S.A. Index, and 30% Bloomberg U.S. Aggregate Index. |
| vi | The Moderate Model Portfolio Composite Benchmark is a hypothetical representation of the performance of the Portfolio’s major asset classes. It consists of 45% Russell 3000 Index, 10% MSCI World Ex U.S.A. Index, and 45% Bloomberg U.S. Aggregate Index. |
| vii | The Moderately Conservative Model Portfolio Composite Benchmark is a hypothetical representation of the performance of the Portfolio’s major asset classes. It consists of consists of 35% Russell 3000 Index, 5% MSCI World Ex U.S.A. Index, and 60% Bloomberg U.S. Aggregate Index. |
| viii | The Conservative Model Portfolio Composite Benchmark is a hypothetical representation of the performance of the Portfolio’s major asset classes. It consists of 20% Russell 3000 Index and 80% Bloomberg U.S. Aggregate Index. |
| | |
VIII | | Franklin Templeton Model Portfolio Funds 2023 Semi-Annual Report |
Portfolios at a glance (unaudited)
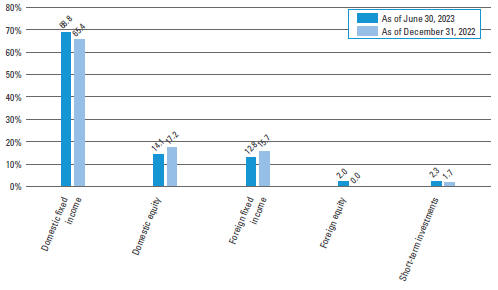
Franklin Templeton Aggressive Model Portfolio Investment Breakdown† (%) as a percent of total investments
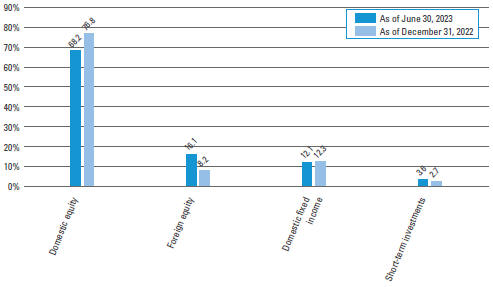
| † | The bar graph above represents the composition of the Portfolio’s investments as of June 30, 2023 and December 31, 2022. The Portfolio is actively managed. As a result, the composition of the Portfolio’s investments is subject to change at any time. |
| | |
| Franklin Templeton Model Portfolio Funds 2023 Semi-Annual Report | | 1 |
Portfolios at a glance (unaudited) (cont’d)
Franklin Templeton Moderately Aggressive Model Portfolio Investment Breakdown† (%) as a percent of total investments
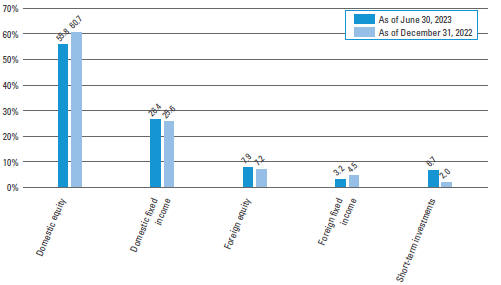
| † | The bar graph above represents the composition of the Portfolio’s investments as of June 30, 2023 and December 31, 2022. The Portfolio is actively managed. As a result, the composition of the Portfolio’s investments is subject to change at any time. |
| | |
2 | | Franklin Templeton Model Portfolio Funds 2023 Semi-Annual Report |
Franklin Templeton Moderate Model Portfolio Investment Breakdown† (%) as a percent of total investments
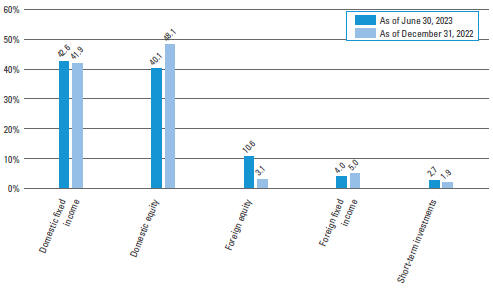
| † | The bar graph above represents the composition of the Portfolio’s investments as of June 30, 2023 and December 31, 2022. The Portfolio is actively managed. As a result, the composition of the Portfolio’s investments is subject to change at any time. |
| | |
| Franklin Templeton Model Portfolio Funds 2023 Semi-Annual Report | | 3 |
Portfolios at a glance (unaudited) (cont’d)
Franklin Templeton Moderately Conservative Model Portfolio Investment Breakdown† (%) as a percent of total investments
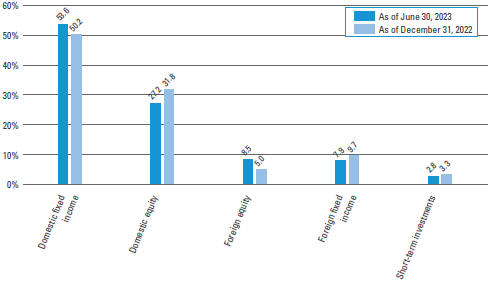
| † | The bar graph above represents the composition of the Portfolio’s investments as of June 30, 2023 and December 31, 2022. The Portfolio is actively managed. As a result, the composition of the Portfolio’s investments is subject to change at any time. |
| | |
4 | | Franklin Templeton Model Portfolio Funds 2023 Semi-Annual Report |
Franklin Templeton Conservative Model Portfolio Investment Breakdown† (%) as a percent of total investments
| † | The bar graph above represents the composition of the Portfolio’s investments as of June 30, 2023 and December 31, 2022. The Portfolio is actively managed. As a result, the composition of the Portfolio’s investments is subject to change at any time. |
| | |
| Franklin Templeton Model Portfolio Funds 2023 Semi-Annual Report | | 5 |
Portfolios expenses (unaudited)
Example
As a shareholder of the Portfolio, you may incur two types of costs: (1) transaction costs and (2)ongoing costs, including management fees; service and/or distribution (12b-1) fees; and other Portfolio expenses. This example is intended to help you understand your ongoing costs (in dollars) of investing in the Portfolio and to compare these costs with the ongoing costs of investing in other funds.
This example is based on an investment of $1,000 invested on January 1, 2023 and held for the six months ended June 30, 2023.
Actual expenses
The table below titled “Based on actual total return” provides information about actual account values and actual expenses. You may use the information provided in this table, together with the amount you invested, to estimate the expenses that you paid over the period. To estimate the expenses you paid on your account, divide your ending account value by $1,000 (for example, an $8,600 ending account value divided by $1,000 = 8.6), then multiply the result by the number under the heading entitled “Expenses Paid During the Period”.
Hypothetical example for comparison purposes
The table below titled “Based on hypothetical total return” provides information about hypothetical account values and hypothetical expenses based on the actual expense ratio and an assumed rate of return of 5.00% per year before expenses, which is not the Portfolio’s actual return. The hypothetical account values and expenses may not be used to estimate the actual ending account balance or expenses you paid for the period. You may use the information provided in this table to compare the ongoing costs of investing in the Portfolio and other portfolios. To do so, compare the 5.00% hypothetical example relating to the Portfolio with the 5.00% hypothetical examples that appear in the shareholder reports of the other funds.
Please note that the expenses shown in the table below are meant to highlight your ongoing costs only and do not reflect any transactional costs. Therefore, the table is useful in comparing ongoing costs only, and will not help you determine the relative total costs of owning different funds. In addition, if these transaction costs were included, your costs would have been higher.
| | | | | | | | | | | | | | | | | | | | | | | | | | | | | | | | | | | | | | | | | | | | | | |
| | |
| Based on actual total return1 | | | | | | Based on hypothetical total return1 | |
Franklin
Templeton
Aggressive
Model
Portfolio | | Actual
Total Return2 | | | Beginning
Account
Value | | | Ending
Account
Value | | | Annualized
Expense
Ratio3 | | | Expenses
Paid
During
the
Period4 | | | | | | Franklin
Templeton
Aggressive
Model
Portfolio | | Hypothetical
Annualized
Total Return | | | Beginning
Account
Value | | | Ending
Account
Value | | | Annualized
Expense
Ratio3 | | | Expenses
Paid
During
the
Period4 | |
| Class I | | | 10.94 | % | | $ | 1,000.00 | | | $ | 1,109.40 | | | | 0.13 | % | | $ | 0.68 | | | | | | | Class I | | | 5.00 | % | | $ | 1,000.00 | | | $ | 1,024.15 | | | | 0.13 | % | | $ | 0.65 | |
| Class II | | | 10.79 | | | | 1,000.00 | | | | 1,107.90 | | | | 0.38 | | | | 1.99 | | | | | | | Class II | | | 5.00 | | | | 1,000.00 | | | | 1,022.91 | | | | 0.38 | | | | 1.91 | |
| 1 | For the six months ended June 30, 2023. |
| 2 | Assumes the reinvestment of all distributions, including returns of capital, if any, at net asset value. Total return is not annualized, as it may not be representative of the total return for the year. Total returns do not reflect expenses associated with separate accounts such as administrative fees, account charges and surrender charges, which, if reflected, would reduce the total returns. Performance figures may reflect compensating balance arrangements, fee waivers and/or expense reimbursements. In the absence of compensating balance arrangements, fee waivers and/or expense reimbursements, the total return would have been lower. Past performance is no guarantee of future results. |
| 3 | Does not include fees and expenses of the Underlying Funds in which the Portfolio invests. |
| 4 | Expenses (net of compensating balance arrangements, fee waivers and/or expense reimbursements) are equal to each class’ respective annualized expense ratio multiplied by the average account value over the period, multiplied by the number of days in the most recent fiscal half-year (181), then divided by 365. |
| | |
6 | | Franklin Templeton Model Portfolio Funds 2023 Semi-Annual Report |
Example
As a shareholder of the Portfolio, you may incur two types of costs:(1) transaction costs and (2) ongoing costs, including management fees; service and/or distribution (12b-1) fees; and other Portfolio expenses. This example is intended to help you understand your ongoing costs (in dollars) of investing in the Portfolio and to compare these costs with the ongoing costs of investing in other funds.
This example is based on an investment of $1,000 invested on January 1, 2023 and held for the six months ended June 30, 2023.
Actual expenses
The table below titled “Based on actual total return” provides information about actual account values and actual expenses. You may use the information provided in this table, together with the amount you invested, to estimate the expenses that you paid over the period. To estimate the expenses you paid on your account, divide your ending account value by $1,000 (for example, an $8,600 ending account value divided by $1,000 = 8.6), then multiply the result by the number under the heading entitled “Expenses Paid During the Period”.
Hypothetical example for comparison purposes
The table below titled “Based on hypothetical total return” provides information about hypothetical account values and hypothetical expenses based on the actual expense ratio and an assumed rate of return of 5.00% per year before expenses, which is not the Portfolio’s actual return. The hypothetical account values and expenses may not be used to estimate the actual ending account balance or expenses you paid for the period. You may use the information provided in this table to compare the ongoing costs of investing in the Portfolio and other portfolios. To do so, compare the 5.00% hypothetical example relating to the Portfolio with the 5.00% hypothetical examples that appear in the shareholder reports of the other funds.
Please note that the expenses shown in the table below are meant to highlight your ongoing costs only and do not reflect any transactional costs. Therefore, the table is useful in comparing ongoing costs only, and will not help you determine the relative total costs of owning different funds. In addition, if these transaction costs were included, your costs would have been higher.
| | | | | | | | | | | | | | | | | | | | | | | | | | | | | | | | | | | | | | | | | | | | | | |
| | | |
| Based on actual total return1 | | | | | | | | | Based on hypothetical total return1 | |
Franklin
Templeton
Moderately
Aggressive
Model
Portfolio | | Actual
Total Return2 | | | Beginning
Account
Value | | | Ending
Account
Value | | | Annualized
Expense
Ratio3 | | | Expenses
Paid
During
the
Period4 | | | | | | Franklin
Templeton
Moderately
Aggressive
Model
Portfolio | | Hypothetical
Annualized
Total Return | | | Beginning
Account
Value | | | Ending
Account
Value | | | Annualized
Expense
Ratio3 | | | Expenses
Paid
During
the
Period4 | |
| Class I | | | 9.25 | % | | $ | 1,000.00 | | | $ | 1,092.50 | | | | 0.12 | % | | $ | 0.62 | | | | | | | Class I | | | 5.00 | % | | $ | 1,000.00 | | | $ | 1,024.20 | | | | 0.12 | % | | $ | 0.60 | |
| Class II | | | 9.08 | | | | 1,000.00 | | | | 1,090.80 | | | | 0.37 | | | | 1.92 | | | | | | | Class II | | | 5.00 | | | | 1,000.00 | | | | 1,022.96 | | | | 0.37 | | | | 1.86 | |
| 1 | For the six months ended June 30, 2023. |
| 2 | Assumes the reinvestment of all distributions, including returns of capital, if any, at net asset value. Total return is not annualized, as it may not be representative of the total return for the year. Total returns do not reflect expenses associated with separate accounts such as administrative fees, account charges and surrender charges, which, if reflected, would reduce the total returns. Performance figures may reflect compensating balance arrangements, fee waivers and/or expense reimbursements. In the absence of compensating balance arrangements, fee waivers and/or expense reimbursements, the total return would have been lower. Past performance is no guarantee of future results. |
| 3 | Does not include fees and expenses of the Underlying Funds in which the Portfolio invests. |
| 4 | Expenses (net of compensating balance arrangements, fee waivers and/or expense reimbursements) are equal to each class’ respective annualized expense ratio multiplied by the average account value over the period, multiplied by the number of days in the most recent fiscal half-year (181), then divided by 365. |
| | |
| Franklin Templeton Model Portfolio Funds 2023 Semi-Annual Report | | 7 |
Portfolios expenses (unaudited) (cont’d)
Example
As a shareholder of the Portfolio, you may incur two types of costs:(1) transaction costs and (2) ongoing costs, including management fees; service and/or distribution (12b-1) fees; and other Portfolio expenses. This example is intended to help you understand your ongoing costs (in dollars) of investing in the Portfolio and to compare these costs with the ongoing costs of investing in other funds.
This example is based on an investment of $1,000 invested on January 1, 2023 and held for the six months ended June 30, 2023.
Actual expenses
The table below titled “Based on actual total return” provides information about actual account values and actual expenses. You may use the information provided in this table, together with the amount you invested, to estimate the expenses that you paid over the period. To estimate the expenses you paid on your account, divide your ending account value by $1,000 (for example, an $8,600 ending account value divided by $1,000 = 8.6), then multiply the result by the number under the heading entitled “Expenses Paid During the Period”.
Hypothetical example for comparison purposes
The table below titled “Based on hypothetical total return” providesinformationabouthypotheticalaccountvaluesandhypothetical expenses based on the actual expense ratio and an assumed rate of return of 5.00% per year before expenses, which is not the Portfolio’s actual return. The hypothetical account values and expenses may not be used to estimate the actual ending account balance or expenses you paid for the period. You may use the information provided in this table to compare the ongoing costs of investing in the Portfolio and other portfolios. To do so, compare the 5.00% hypothetical example relating to the Portfolio with the 5.00% hypothetical examples that appear in the shareholder reports of the other funds.
Please note that the expenses shown in the table below are meant to highlight your ongoing costs only and do not reflect any transactional costs. Therefore, the table is useful in comparing ongoing costs only, and will not help you determine the relative total costs of owning different funds. In addition, if these transaction costs were included, your costs would have been higher.
| | | | | | | | | | | | | | | | | | | | | | | | | | | | | | | | | | | | | | | | | | | | | | |
| | |
| Based on actual total return1 | | | | | | Based on hypothetical total return1 | |
Franklin
Templeton
Moderate
Model
Portfolio | | Actual
Total Return2 | | | Beginning
Account
Value | | | Ending
Account
Value | | | Annualized
Expense
Ratio3 | | | Expenses
Paid
During
the
Period4 | | | | | | Franklin
Templeton
Moderate
Model
Portfolio | | Hypothetical
Annualized
Total Return | | | Beginning
Account
Value | | | Ending
Account
Value | | | Annualized
Expense
Ratio3 | | | Expenses
Paid
During
the
Period4 | |
| Class I | | | 7.46 | % | | $ | 1,000.00 | | | $ | 1,074.60 | | | | 0.12 | % | | $ | 0.62 | | | | | | | Class I | | | 5.00 | % | | $ | 1,000.00 | | | $ | 1,024.20 | | | | 0.12 | % | | $ | 0.60 | |
| Class II | | | 7.39 | | | | 1,000.00 | | | | 1,073.90 | | | | 0.37 | | | | 1.90 | | | | | | | Class II | | | 5.00 | | | | 1,000.00 | | | | 1,022.96 | | | | 0.37 | | | | 1.86 | |
| 1 | For the six months ended June 30, 2023. |
| 2 | Assumes the reinvestment of all distributions, including returns of capital, if any, at net asset value. Total return is not annualized, as it may not be representative of the total return for the year. Total returns do not reflect expenses associated with separate accounts such as administrative fees, account charges and surrender charges, which, if reflected, would reduce the total returns. Performance figures may reflect compensating balance arrangements, fee waivers and/or expense reimbursements. In the absence of compensating balance arrangements, fee waivers and/or expense reimbursements, the total return would have been lower. Past performance is no guarantee of future results. |
| 3 | Does not include fees and expenses of the Underlying Funds in which the Portfolio invests. |
| 4 | Expenses (net of compensating balance arrangements, fee waivers and/or expense reimbursements) are equal to each class’ respective annualized expense ratio multiplied by the average account value over the period, multiplied by the number of days in the most recent fiscal half-year (181), then divided by 365. |
| | |
8 | | Franklin Templeton Model Portfolio Funds 2023 Semi-Annual Report |
Example
As a shareholder of the Portfolio, you may incur two types of costs:(1) transaction costs and (2) ongoing costs, including management fees; service and/or distribution (12b-1) fees; and other Portfolio expenses. This example is intended to help you understand your ongoing costs (in dollars) of investing in the Portfolio and to compare these costs with the ongoing costs of investing in other funds.
This example is based on an investment of $1,000 invested on January 1, 2023 and held for the six months ended June 30, 2023.
Actual expenses
The table below titled “Based on actual total return” provides information about actual account values and actual expenses. You may use the information provided in this table, together with the amount you invested, to estimate the expenses that you paid over the period. To estimate the expenses you paid on your account, divide your ending account value by $1,000 (for example, an $8,600 ending account value divided by $1,000 = 8.6), then multiply the result by the number under the heading entitled “Expenses Paid During the Period”.
Hypothetical example for comparison purposes
The table below titled “Based on hypothetical total return” provides information about hypothetical account values and hypothetical expenses based on the actual expense ratio and an assumed rate of return of 5.00% per year before expenses, which is not the Portfolio’s actual return. The hypothetical account values and expenses may not be used to estimate the actual ending account balance or expenses you paid for the period. You may use the information provided in this table to compare the ongoing costs of investing in the Portfolio and other portfolios. To do so, compare the 5.00% hypothetical example relating to the Portfolio with the 5.00% hypothetical examples that appear in the shareholder reports of the other funds.
Please note that the expenses shown in the table below are meant to highlight your ongoing costs only and do not reflect any transactional costs. Therefore, the table is useful in comparing ongoing costs only, and will not help you determine the relative total costs of owning different funds. In addition, if these transaction costs were included, your costs would have been higher.
| | | | | | | | | | | | | | | | | | | | | | | | | | | | | | | | | | | | | | | | | | | | | | |
| | |
| Based on actual total return1 | | | | | | Based on hypothetical total return1 | |
Franklin
Templeton
Moderately
Conservative
Model
Portfolio | | Actual
Total Return2 | | | Beginning
Account
Value | | | Ending
Account
Value | | | Annualized
Expense
Ratio3 | | | Expenses
Paid
During
the
Period4 | | | | | | Franklin
Templeton
Moderately
Conservative
Model
Portfolio | | Hypothetical
Annualized
Total Return | | | Beginning
Account
Value | | | Ending
Account
Value | | | Annualized
Expense
Ratio3 | | | Expenses
Paid
During
the
Period4 | |
| Class I | | | 5.37 | % | | $ | 1,000.00 | | | $ | 1,053.70 | | | | 0.14 | % | | $ | 0.71 | | | | | | | Class I | | | 5.00 | % | | $ | 1,000.00 | | | $ | 1,024.10 | | | | 0.14 | % | | $ | 0.70 | |
| Class II | | | 5.28 | | | | 1,000.00 | | | | 1,052.80 | | | | 0.38 | | | | 1.93 | | | | | | | Class II | | | 5.00 | | | | 1,000.00 | | | | 1,022.91 | | | | 0.38 | | | | 1.91 | |
| 1 | For the six months ended June 30, 2023. |
| 2 | Assumes the reinvestment of all distributions, including returns of capital, if any, at net asset value. Total return is not annualized, as it may not be representative of the total return for the year. Total returns do not reflect expenses associated with separate accounts such as administrative fees, account charges and surrender charges, which, if reflected, would reduce the total returns. Performance figures may reflect compensating balance arrangements, fee waivers and/or expense reimbursements. In the absence of compensating balance arrangements, fee waivers and/or expense reimbursements, the total return would have been lower. Past performance is no guarantee of future results. |
| 3 | Does not include fees and expenses of the Underlying Funds in which the Portfolio invests. |
| 4 | Expenses (net of compensating balance arrangements, fee waivers and/or expense reimbursements) are equal to each class’ respective annualized expense ratio multiplied by the average account value over the period, multiplied by the number of days in the most recent fiscal half-year (181), then divided by 365. |
| | |
| Franklin Templeton Model Portfolio Funds 2023 Semi-Annual Report | | 9 |
Portfolios expenses (unaudited) (cont’d)
Example
As a shareholder of the Portfolio, you may incur two types of costs:(1) transaction costs and (2) ongoing costs, including management fees; service and/or distribution (12b-1) fees; and other Portfolio expenses. This example is intended to help you understand your ongoing costs (in dollars) of investing in the Portfolio and to compare these costs with the ongoing costs of investing in other funds.
This example is based on an investment of $1,000 invested on January 1, 2023 and held for the six months ended June 30, 2023.
Actual expenses
The table below titled “Based on actual total return” provides information about actual account values and actual expenses. You may use the information provided in this table, together with the amount you invested, to estimate the expenses that you paid over the period. To estimate the expenses you paid on your account, divide your ending account value by $1,000 (for example, an $8,600 ending account value divided by $1,000 = 8.6), then multiply the result by the number under the heading entitled “Expenses Paid During the Period”.
Hypothetical example for comparison purposes
The table below titled “Based on hypothetical total return” provides information about hypothetical account values and hypothetical expenses based on the actual expense ratio and an assumed rate of return of 5.00% per year before expenses, which is not the Portfolio’s actual return. The hypothetical account values and expenses may not be used to estimate the actual ending account balance or expenses you paid for the period. You may use the information provided in this table to compare the ongoing costs of investing in the Portfolio and other portfolios. To do so, compare the 5.00% hypothetical example relating to the Portfolio with the 5.00% hypothetical examples that appear in the shareholder reports of the other funds.
Please note that the expenses shown in the table below are meant to highlight your ongoing costs only and do not reflect any transactional costs. Therefore, the table is useful in comparing ongoing costs only, and will not help you determine the relative total costs of owning different funds. In addition, if these transaction costs were included, your costs would have been higher.
| | | | | | | | | | | | | | | | | | | | | | | | | | | | | | | | | | | | | | | | | | | | | | |
| | |
| Based on actual total return1 | | | | | | Based on hypothetical total return1 | |
Franklin
Templeton
Conservative
Model
Portfolio | | Actual
Total Return2 | | | Beginning
Account
Value | | | Ending
Account
Value | | | Annualized
Expense
Ratio3 | | | Expenses
Paid
During
the
Period4 | | | | | | Franklin
Templeton
Conservative
Model
Portfolio | | Hypothetical
Annualized
Total Return | | | Beginning
Account
Value | | | Ending
Account
Value | | | Annualized
Expense
Ratio3 | | | Expenses
Paid
During
the
Period4 | |
| Class I | | | 3.83 | % | | $ | 1,000.00 | | | $ | 1,038.30 | | | | 0.17 | % | | $ | 0.86 | | | | | | | Class I | | | 5.00 | % | | $ | 1,000.00 | | | $ | 1,023.95 | | | | 0.17 | % | | $ | 0.85 | |
| Class II | | | 3.72 | | | | 1,000.00 | | | | 1,037.20 | | | | 0.42 | | | | 2.12 | | | | | | | Class II | | | 5.00 | | | | 1,000.00 | | | | 1,022.71 | | | | 0.42 | | | | 2.11 | |
| 1 | For the six months ended June 30, 2023. |
| 2 | Assumes the reinvestment of all distributions, including returns of capital, if any, at net asset value. Total return is not annualized, as it may not be representative of the total return for the year. Total returns do not reflect expenses associated with separate accounts such as administrative fees, account charges and surrender charges, which, if reflected, would reduce the total returns. Performance figures may reflect compensating balance arrangements, fee waivers and/or expense reimbursements. In the absence of compensating balance arrangements, fee waivers and/or expense reimbursements, the total return would have been lower. Past performance is no guarantee of future results. |
| 3 | Does not include fees and expenses of the Underlying Funds in which the Portfolio invests. |
| 4 | Expenses (net of compensating balance arrangements, fee waivers and/or expense reimbursements) are equal to each class’ respective annualized expense ratio multiplied by the average account value over the period, multiplied by the number of days in the most recent fiscal half-year (181), then divided by 365. |
| | |
10 | | Franklin Templeton Model Portfolio Funds 2023 Semi-Annual Report |
Schedules of investments (unaudited)
June 30, 2023
Franklin Templeton Aggressive Model Portfolio
(Percentages shown based on Portfolio net assets)
| | | | | | | | | | | | | | | | |
| Description | | | | | | | | Shares | | | Value | |
| Investments in Underlying Funds — 98.2% | | | | | | | | | | | | | | | | |
| Domestic Equity — 69.5% | | | | | | | | | | | | | | | | |
American Funds Insurance Series — Growth Fund, Class 1A | | | | | | | | | | | 440,220 | | | $ | 39,166,422 | |
BNY Mellon Investment Portfolios — Technology Growth Portfolio, Initial Shares | | | | | | | | | | | 832,416 | | | | 20,294,301 | |
Delaware VIP Trust — Delaware VIP Small Cap Value Series, Standard Class | | | | | | | | | | | 536,025 | | | | 19,146,820 | |
Fidelity Concord Street Trust — Fidelity® 500 Index Fund, Institutional Premium Shares | | | | | | | | | | | 227,451 | | | | 35,257,123 | |
Legg Mason Partners Variable Equity Trust — ClearBridge Variable Appreciation Portfolio, Class I Shares | | | | | | | | | | | 517,304 | | | | 29,191,469 | (a) |
MainStay VP Funds Trust: | | | | | | | | | | | | | | | | |
MainStay VP Epoch U.S. Equity Yield Portfolio, Initial Class | | | | | | | | | | | 1,688,640 | | | | 29,111,647 | |
MainStay VP Fidelity Institutional AM® Utilities Portfolio, Initial Class | | | | | | | | | | | 1,142,514 | | | | 14,577,223 | (b) |
MainStay VP Small Cap Growth Portfolio, Initial Class | | | | | | | | | | | 1,394,168 | | | | 14,573,519 | |
MainStay VP Wellington U.S. Equity Portfolio, Initial Class | | | | | | | | | | | 1,587,031 | | | | 38,894,486 | |
MFS Variable Insurance Portfolios: | | | | | | | | | | | | | | | | |
MFS® Investors Trust Series, Initial Class | | | | | | | | | | | 671,616 | | | | 24,137,863 | |
MFS® Research Series, Initial Class | | | | | | | | | | | 615,757 | | | | 19,297,823 | |
Variable Insurance Products Fund — VIP Equity-Income Portfolio, Initial Class | | | | | | | | | | | 1,287,155 | | | | 31,509,545 | |
Variable Insurance Products Fund III — VIP Growth Opportunities Portfolio, Initial Class | | | | | | | | | | | 444,904 | | | | 23,757,898 | |
Total Domestic Equity | | | | | | | | | | | | | | | 338,916,139 | |
| Foreign Equity — 16.4% | | | | | | | | | | | | | | | | |
Fidelity Concord Street Trust — Fidelity® International Index Fund, Institutional Premium Shares | | | | | | | | | | | 368,464 | | | | 17,008,294 | |
Invesco Variable Insurance Funds — Invesco V.I. International Growth Fund, Class I Shares | | | | | | | | | | | 664,917 | | | | 21,802,617 | |
MainStay VP Funds Trust — MainStay VP MacKay International Equity Portfolio, Initial Class | | | | | | | | | | | 1,567,441 | | | | 17,039,025 | |
Variable Insurance Products Fund — VIP Emerging Markets Portfolio, Initial Class | | | | | | | | | | | 2,316,703 | | | | 24,140,048 | |
Total Foreign Equity | | | | | | | | | | | | | | | 79,989,984 | |
| Domestic Fixed Income — 12.3% | | | | | | | | | | | | | | | | |
Fidelity Salem Street Trust — Fidelity® U.S. Bond Index Fund, Institutional Premium Shares | | | | | | | | | | | 5,884,700 | | | | 60,377,021 | |
Total Investments in Underlying Funds before Short-Term Investments (Cost — $481,765,010) | | | | | | | | 479,283,144 | |
| | | | |
| | | Rate | | | | | | | | | | |
| Short-Term Investments — 3.7% | | | | | | | | | | | | | | | | |
Blackrock Liquidity Funds — Treasury Trust Fund, Institutional Shares
(Cost — $17,893,378) | | | 5.024 | % | | | | | | | 17,893,378 | | | | 17,893,378 | (c) |
Total Investments — 101.9% (Cost — $499,658,388) | | | | | | | | | | | | | | | 497,176,522 | |
Liabilities in Excess of Other Assets — (1.9)% | | | | | | | | | | | | | | | (9,438,305 | ) |
Total Net Assets — 100.0% | | | | | | | | | | | | | | $ | 487,738,217 | |
| (a) | Underlying Fund is affiliated with Franklin Resources, Inc. and more information about the Underlying Fund is available at www.franklintempleton.com (Note 8). |
| (b) | Fidelity Institutional AM is a registered service mark of FMR LLC. |
| (c) | Rate shown is one-day yield as of the end of the reporting period. |
See Notes to Financial Statements.
| | |
| Franklin Templeton Model Portfolio Funds 2023 Semi-Annual Report | | 11 |
Schedules of investments (unaudited) (cont’d)
June 30, 2023
Franklin Templeton Moderately Aggressive Model Portfolio
(Percentages shown based on Portfolio net assets)
| | | | | | | | | | | | | | | | |
| Description | | | | | | | | Shares | | | Value | |
| Investments in Underlying Funds — 99.5% | | | | | | | | | | | | | | | | |
| Domestic Equity — 56.3% | | | | | | | | | | | | | | | | |
American Funds Insurance Series — Growth Fund, Class 1A | | | | | | | | | | | 1,077,559 | | | $ | 95,870,372 | |
BNY Mellon Investment Portfolios — Technology Growth Portfolio, Initial Shares | | | | | | | | | | | 1,273,415 | | | | 31,045,847 | |
Delaware VIP Trust — Delaware VIP Small Cap Value Series, Standard Class | | | | | | | | | | | 940,854 | | | | 33,607,318 | |
Fidelity Concord Street Trust — Fidelity® 500 Index Fund, Institutional Premium Shares | | | | | | | | | | | 937,579 | | | | 145,334,173 | |
Legg Mason Partners Variable Equity Trust — ClearBridge Variable Appreciation Portfolio, Class I Shares | | | | | | | | | | | 1,483,425 | | | | 83,709,677 | (a) |
MainStay VP Funds Trust: | | | | | | | | | | | | | | | | |
MainStay VP Epoch U.S. Equity Yield Portfolio, Initial Class | | | | | | | | | | | 3,436,287 | | | | 59,240,562 | |
MainStay VP Fidelity Institutional AM® Utilities Portfolio, Initial Class | | | | | | | | | | | 3,410,698 | | | | 43,516,752 | (b) |
MainStay VP Small Cap Growth Portfolio, Initial Class | | | | | | | | | | | 2,821,568 | | | | 29,494,410 | |
MainStay VP Wellington U.S. Equity Portfolio, Initial Class | | | | | | | | | | | 3,000,805 | | | | 73,542,835 | |
MFS Variable Insurance Portfolios: | | | | | | | | | | | | | | | | |
MFS® Investors Trust Series, Initial Class | | | | | | | | | | | 1,618,920 | | | | 58,183,996 | |
MFS® Research Series, Initial Class | | | | | | | | | | | 1,649,277 | | | | 51,688,339 | |
Variable Insurance Products Fund — VIP Equity-Income Portfolio, Initial Class | | | | | | | | | | | 2,871,349 | | | | 70,290,623 | |
Variable Insurance Products Fund III — VIP Growth Opportunities Portfolio, Initial Class | | | | | | | | | | | 1,173,673 | | | | 62,674,140 | |
Total Domestic Equity | | | | | | | | | | | | | | | 838,199,044 | |
| Domestic Fixed Income — 26.6% | | | | | | | | | | | | | | | | |
American Funds Insurance Series — The Bond Fund of America, Class 1A | | | | | | | | | | | 4,633,448 | | | | 43,693,414 | |
BlackRock Variable Series Funds II, Inc. — BlackRock High Yield V.I. Fund, Class I Shares | | | | | | | | | | | 3,350,593 | | | | 22,113,913 | |
Fidelity Salem Street Trust — Fidelity® U.S. Bond Index Fund, Institutional Premium Shares | | | | | | | | | | | 14,424,014 | | | | 147,990,383 | |
Legg Mason Partners Variable Income Trust — Western Asset Core Plus VIT Portfolio, Class I Shares | | | | | | | | | | | 10,309,379 | | | | 51,237,614 | (a) |
MainStay VP Funds Trust: | | | | | | | | | | | | | | | | |
MainStay VP Bond Portfolio, Initial Class | | | | | | | | | | | 2,957,820 | | | | 36,474,065 | |
MainStay VP PIMCO Real Return Portfolio, Initial Class | | | | | | | | | | | 3,491,360 | | | | 29,140,288 | |
PIMCO Variable Insurance Trust — PIMCO Total Return Portfolio, Institutional Class | | | | | | | | | | | 7,298,493 | | | | 65,686,439 | |
Total Domestic Fixed Income | | | | | | | | | | | | | | | 396,336,116 | |
| Foreign Equity — 13.3% | | | | | | | | | | | | | | | | |
Fidelity Concord Street Trust — Fidelity® International Index Fund, Institutional Premium Shares | | | | | | | | | | | 1,607,661 | | | | 74,209,633 | |
Invesco Variable Insurance Funds — Invesco V.I. International Growth Fund, Class I Shares | | | | | | | | | | | 1,578,687 | | | | 51,765,131 | |
MainStay VP Funds Trust — MainStay VP MacKay International Equity Portfolio, Initial Class | | | | | | | | | | | 2,569,442 | | | | 27,931,375 | |
Variable Insurance Products Fund — VIP Emerging Markets Portfolio, Initial Class | | | | | | | | | | | 4,242,798 | | | | 44,209,959 | |
Total Foreign Equity | | | | | | | | | | | | | | | 198,116,098 | |
| Foreign Fixed Income — 3.3% | | | | | | | | | | | | | | | | |
Columbia Funds Variable Series Trust II — Columbia Variable Portfolio — Emerging Markets Bond Fund, Class 1 | | | | | | | | | | | 2,470,988 | | | | 18,680,671 | |
PIMCO Variable Insurance Trust — PIMCO International Bond Portfolio (U.S. Dollar- Hedged), Institutional Class | | | | | | | | | | | 3,124,596 | | | | 29,464,938 | |
Total Foreign Fixed Income | | | | | | | | | | | | | | | 48,145,609 | |
Total Investments in Underlying Funds before Short-Term Investments
(Cost — $1,515,120,847) | | | | | | | | 1,480,796,867 | |
See Notes to Financial Statements.
| | |
12 | | Franklin Templeton Model Portfolio Funds 2023 Semi-Annual Report |
Franklin Templeton Moderately Aggressive Model Portfolio
(Percentages shown based on Portfolio net assets)
| | | | | | | | | | | | | | | | |
| Description | | Rate | | | | | | Shares | | | Value | |
| Short-Term Investments — 1.5% | | | | | | | | | | | | | | | | |
Blackrock Liquidity Funds — Treasury Trust Fund, Institutional Shares
(Cost — $21,733,915) | | | 5.024 | % | | | | | | | 21,733,915 | | | $ | 21,733,915 | (c) |
Total Investments — 101.0% (Cost — $1,536,854,762) | | | | | | | | | | | | | | | 1,502,530,782 | |
Liabilities in Excess of Other Assets — (1.0)% | | | | | | | | | | | | | | | (14,495,719 | ) |
Total Net Assets — 100.0% | | | | | | | | | | | | | | $ | 1,488,035,063 | |
| (a) | Underlying Fund is affiliated with Franklin Resources, Inc. and more information about the Underlying Fund is available at www.franklintempleton.com (Note 8). |
| (b) | Fidelity Institutional AM is a registered service mark of FMR LLC. |
| (c) | Rate shown is one-day yield as of the end of the reporting period. |
See Notes to Financial Statements.
| | |
| Franklin Templeton Model Portfolio Funds 2023 Semi-Annual Report | | 13 |
Schedules of investments (unaudited) (cont’d)
June 30, 2023
Franklin Templeton Moderate Model Portfolio
(Percentages shown based on Portfolio net assets)
| | | | | | | | | | | | | | | | |
| Description | | | | | | | | Shares | | | Value | |
| Investments in Underlying Funds — 98.1% | | | | | | | | | | | | | | | | |
| Domestic Fixed Income — 43.0% | | | | | | | | | | | | | | | | |
American Funds Insurance Series — The Bond Fund of America, Class 1A | | | | | | | | | | | 12,265,967 | | | $ | 115,668,069 | |
BlackRock Variable Series Funds II, Inc. — BlackRock High Yield V.I. Fund, Class I Shares | | | | | | | | | | | 3,619,017 | | | | 23,885,515 | |
Fidelity Salem Street Trust — Fidelity® U.S. Bond Index Fund, Institutional Premium Shares | | | | | | | | | | | 14,604,776 | | | | 149,844,997 | |
Legg Mason Partners Variable Income Trust — Western Asset Core Plus VIT Portfolio, Class I Shares | | | | | | | | | | | 13,223,457 | | | | 65,720,584 | (a) |
MainStay VP Funds Trust: | | | | | | | | | | | | | | | | |
MainStay VP Bond Portfolio, Initial Class | | | | | | | | | | | 2,856,190 | | | | 35,220,819 | |
MainStay VP MacKay Convertible Portfolio, Initial Class | | | | | | | | | | | 1,648,801 | | | | 23,975,044 | |
MainStay VP PIMCO Real Return Portfolio, Initial Class | | | | | | | | | | | 3,514,150 | | | | 29,330,498 | |
PIMCO Variable Insurance Trust — PIMCO Total Return Portfolio, Institutional Class | | | | | | | | | | | 8,263,223 | | | | 74,369,010 | |
Total Domestic Fixed Income | | | | | | | | | | | | | | | 518,014,536 | |
| Domestic Equity — 40.4% | | | | | | | | | | | | | | | | |
American Funds Insurance Series — Growth Fund, Class 1A | | | | | | | | | | | 565,174 | | | | 50,283,500 | |
BNY Mellon Investment Portfolios — Technology Growth Portfolio, Initial Shares | | | | | | | | | | | 1,062,026 | | | | 25,892,183 | |
Delaware VIP Trust — Delaware VIP Small Cap Value Series, Standard Class | | | | | | | | | | | 518,114 | | | | 18,507,046 | |
Fidelity Concord Street Trust — Fidelity® 500 Index Fund, Institutional Premium Shares | | | | | | | | | | | 573,055 | | | | 88,829,274 | |
Legg Mason Partners Variable Equity Trust — ClearBridge Variable Appreciation Portfolio, Class I Shares | | | | | | | | | | | 967,964 | | | | 54,622,219 | (a) |
MainStay VP Funds Trust: | | | | | | | | | | | | | | | | |
MainStay VP Epoch U.S. Equity Yield Portfolio, Initial Class | | | | | | | | | | | 1,366,589 | | | | 23,559,592 | |
MainStay VP Fidelity Institutional AM® Utilities Portfolio, Initial Class | | | | | | | | | | | 2,702,996 | | | | 34,487,261 | (b) |
MainStay VP Small Cap Growth Portfolio, Initial Class | | | | | | | | | | | 1,748,528 | | | | 18,277,713 | |
MainStay VP Wellington U.S. Equity Portfolio, Initial Class | | | | | | | | | | | 1,982,431 | | | | 48,584,816 | |
MFS Variable Insurance Portfolios: | | | | | | | | | | | | | | | | |
MFS® Investors Trust Series, Initial Class | | | | | | | | | | | 1,002,479 | | | | 36,029,089 | |
MFS® Research Series, Initial Class | | | | | | | | | | | 972,482 | | | | 30,477,600 | |
Variable Insurance Products Fund — VIP Equity-Income Portfolio, Initial Class | | | | | | | | | | | 1,296,136 | | | | 31,729,398 | |
Variable Insurance Products Fund III — VIP Growth Opportunities Portfolio, Initial Class | | | | | | | | | | | 484,819 | | | | 25,889,363 | |
Total Domestic Equity | | | | | | | | | | | | | | | 487,169,054 | |
| Foreign Equity — 10.7% | | | | | | | | | | | | | | | | |
Fidelity Concord Street Trust — Fidelity® International Index Fund, Institutional Premium Shares | | | | | | | | | | | 892,021 | | | | 41,175,694 | |
Invesco Variable Insurance Funds — Invesco V.I. International Growth Fund, Class I Shares | | | | | | | | | | | 1,070,982 | | | | 35,117,495 | |
MainStay VP Funds Trust — MainStay VP MacKay International Equity Portfolio, Initial Class | | | | | | | | | | | 2,122,764 | | | | 23,075,722 | |
Variable Insurance Products Fund — VIP Emerging Markets Portfolio, Initial Class | | | | | | | | | | | 2,811,823 | | | | 29,299,192 | |
Total Foreign Equity | | | | | | | | 128,668,103 | |
| Foreign Fixed Income — 4.0% | | | | | | | | | | | | | | | | |
Columbia Funds Variable Series Trust II — Columbia Variable Portfolio — Emerging Markets Bond Fund, Class 1 | | | | | | | | | | | 2,402,514 | | | | 18,163,005 | |
PIMCO Variable Insurance Trust — PIMCO International Bond Portfolio (U.S. Dollar- Hedged), Institutional Class | | | | | | | | | | | 3,200,389 | | | | 30,179,671 | |
Total Foreign Fixed Income | | | | | | | | | | | | | | | 48,342,676 | |
Total Investments in Underlying Funds before Short-Term Investments
(Cost — $1,224,683,120) | | | | | | | | | | | | | | | 1,182,194,369 | |
See Notes to Financial Statements.
| | |
14 | | Franklin Templeton Model Portfolio Funds 2023 Semi-Annual Report |
Franklin Templeton Moderate Model Portfolio
(Percentages shown based on Portfolio net assets)
| | | | | | | | | | | | | | | | |
| Description | | Rate | | | | | | Shares | | | Value | |
| Short-Term Investments — 2.7% | | | | | | | | | | | | | | | | |
Blackrock Liquidity Funds — Treasury Trust Fund, Institutional Shares
(Cost — $32,647,480) | | | 5.024 | % | | | | | | | 32,647,480 | | | $ | 32,647,480 | (c) |
Total Investments — 100.8% (Cost — $1,257,330,600) | | | | | | | | | | | | | | | 1,214,841,849 | |
Liabilities in Excess of Other Assets — (0.8)% | | | | | | | | | | | | | | | (9,803,124 | ) |
Total Net Assets — 100.0% | | | | | | | | | | | | | | $ | 1,205,038,725 | |
| (a) | Underlying Fund is affiliated with Franklin Resources, Inc. and more information about the Underlying Fund is available at www.franklintempleton.com (Note 8). |
| (b) | Fidelity Institutional AM is a registered service mark of FMR LLC. |
| (c) | Rate shown is one-day yield as of the end of the reporting period. |
See Notes to Financial Statements.
| | |
| Franklin Templeton Model Portfolio Funds 2023 Semi-Annual Report | | 15 |
Schedules of investments (unaudited) (cont’d)
June 30, 2023
Franklin Templeton Moderately Conservative Model Portfolio
(Percentages shown based on Portfolio net assets)
| | | | | | | | | | | | | | | | |
| Description | | | | | | | | Shares | | | Value | |
| Investments in Underlying Funds — 98.0% | | | | | | | | | | | | | | | | |
| Domestic Fixed Income — 54.0% | | | | | | | | | | | | | | | | |
American Funds Insurance Series — The Bond Fund of America, Class 1A | | | | | | | | | | | 4,798,903 | | | $ | 45,253,658 | |
BlackRock Variable Series Funds II, Inc. — BlackRock High Yield V.I. Fund, Class I Shares | | | | | | | | | | | 1,855,241 | | | | 12,244,587 | |
Fidelity Salem Street Trust — Fidelity® U.S. Bond Index Fund, Institutional Premium Shares | | | | | | | | | | | 5,064,007 | | | | 51,956,717 | |
Legg Mason Partners Variable Income Trust — Western Asset Core Plus VIT Portfolio, Class I Shares | | | | | | | | | | | 5,835,234 | | | | 29,001,112 | (a) |
MainStay VP Funds Trust: | | | | | | | | | | | | | | | | |
MainStay VP Bond Portfolio, Initial Class | | | | | | | | | | | 2,354,502 | | | | 29,034,309 | |
MainStay VP MacKay Convertible Portfolio, Initial Class | | | | | | | | | | | 589,085 | | | | 8,565,825 | |
MainStay VP PIMCO Real Return Portfolio, Initial Class | | | | | | | | | | | 2,486,231 | | | | 20,751,075 | |
PIMCO Variable Insurance Trust — PIMCO Total Return Portfolio, Institutional Class | | | | | | | | | | | 3,209,219 | | | | 28,882,972 | |
Total Domestic Fixed Income | | | | | | | | | | | | | | | 225,690,255 | |
| Domestic Equity — 27.5% | | | | | | | | | | | | | | | | |
American Funds Insurance Series — Growth Fund, Class 1A | | | | | | | | | | | 94,141 | | | | 8,375,711 | |
Delaware VIP Trust — Delaware VIP Small Cap Value Series, Standard Class | | | | | | | | | | | 155,199 | | | | 5,543,700 | |
Fidelity Concord Street Trust — Fidelity® 500 Index Fund, Institutional Premium Shares | | | | | | | | | | | 162,112 | | | | 25,128,975 | |
Legg Mason Partners Variable Equity Trust — ClearBridge Variable Appreciation Portfolio, Class I Shares | | | | | | | | | | | 241,272 | | | | 13,614,970 | (a) |
MainStay VP Funds Trust: | | | | | | | | | | | | | | | | |
MainStay VP Epoch U.S. Equity Yield Portfolio, Initial Class | | | | | | | | | | | 485,796 | | | | 8,374,982 | |
MainStay VP Fidelity Institutional AM® Utilities Portfolio, Initial Class | | | | | | | | | | | 935,702 | | | | 11,938,530 | (b) |
MainStay VP Small Cap Growth Portfolio, Initial Class | | | | | | | | | | | 517,825 | | | | 5,412,929 | |
MainStay VP Wellington U.S. Equity Portfolio, Initial Class | | | | | | | | | | | 352,461 | | | | 8,638,010 | |
MFS Variable Insurance Portfolios: | | | | | | | | | | | | | | | | |
MFS® Investors Trust Series, Initial Class | | | | | | | | | | | 266,882 | | | | 9,591,745 | |
MFS® Research Series, Initial Class | | | | | | | | | | | 276,548 | | | | 8,667,020 | |
Variable Insurance Products Fund — VIP Equity-Income Portfolio, Initial Class | | | | | | | | | | | 380,286 | | | | 9,309,400 | |
Total Domestic Equity | | | | | | | | | | | | | | | 114,595,972 | |
| Foreign Equity — 8.6% | | | | | | | | | | | | | | | | |
Fidelity Concord Street Trust — Fidelity® International Index Fund, Institutional Premium Shares | | | | | | | | | | | 417,551 | | | | 19,274,168 | |
Invesco Variable Insurance Funds — Invesco V.I. International Growth Fund, Class I Shares | | | | | | | | | | | 253,909 | | | | 8,325,666 | |
Variable Insurance Products Fund — VIP Emerging Markets Portfolio, Initial Class | | | | | | | | | | | 800,000 | | | | 8,336,000 | |
Total Foreign Equity | | | | | | | | 35,935,834 | |
| Foreign Fixed Income — 7.9% | | | | | | | | | | | | | | | | |
Columbia Funds Variable Series Trust II — Columbia Variable Portfolio — Emerging Markets Bond Fund, Class 1 | | | | | | | | | | | 1,090,194 | | | | 8,241,864 | |
PIMCO Variable Insurance Trust — PIMCO International Bond Portfolio (U.S. Dollar-Hedged), Institutional Class | | | | | | | | | | | 2,633,035 | | | | 24,829,520 | |
Total Foreign Fixed Income | | | | | | | | 33,071,384 | |
Total Investments in Underlying Funds before Short-Term Investments
(Cost — $431,733,189) | | | | | | | | | | | | | | | 409,293,445 | |
See Notes to Financial Statements.
| | |
16 | | Franklin Templeton Model Portfolio Funds 2023 Semi-Annual Report |
Franklin Templeton Moderately Conservative Model Portfolio
(Percentages shown based on Portfolio net assets)
| | | | | | | | | | | | | | | | |
| Description | | Rate | | | | | | Shares | | | Value | |
| Short-Term Investments — 2.8% | | | | | | | | | | | | | | | | |
Blackrock Liquidity Funds — Treasury Trust Fund, Institutional Shares
(Cost — $11,849,328) | | | 5.024 | % | | | | | | | 11,849,328 | | | $ | 11,849,328 | (c) |
Total Investments — 100.8% (Cost — $443,582,517) | | | | | | | | | | | | | | | 421,142,773 | |
Liabilities in Excess of Other Assets — (0.8)% | | | | | | | | | | | | | | | (3,489,030 | ) |
Total Net Assets — 100.0% | | | | | | | | | | | | | | $ | 417,653,743 | |
| (a) | Underlying Fund is affiliated with Franklin Resources, Inc. and more information about the Underlying Fund is available at www.franklintempleton.com (Note 8). |
| (b) | Fidelity Institutional AM is a registered service mark of FMR LLC. |
| (c) | Rate shown is one-day yield as of the end of the reporting period. |
See Notes to Financial Statements.
| | |
| Franklin Templeton Model Portfolio Funds 2023 Semi-Annual Report | | 17 |
Schedules of investments (unaudited) (cont’d)
June 30, 2023
Franklin Templeton Conservative Model Portfolio
(Percentages shown based on Portfolio net assets)
| | | | | | | | | | | | | | | | |
| Description | | | | | | | | Shares | | | Value | |
| Investments in Underlying Funds — 98.0% | | | | | | | | | | | | | | | | |
| Domestic Fixed Income — 69.0% | | | | | | | | | | | | | | | | |
American Funds Insurance Series — The Bond Fund of America, Class 1A | | | | | | | | | | | 1,833,329 | | | $ | 17,288,294 | |
BlackRock Variable Series Funds II, Inc. — BlackRock High Yield V.I. Fund, Class I Shares | | | | | | | | | | | 1,004,954 | | | | 6,632,694 | |
Fidelity Salem Street Trust — Fidelity® U.S. Bond Index Fund, Institutional Premium Shares | | | | | | | | | | | 2,351,610 | | | | 24,127,523 | |
Legg Mason Partners Variable Income Trust — Western Asset Core Plus VIT Portfolio, Class I Shares | | | | | | | | | | | 2,317,051 | | | | 11,515,743 | (a) |
MainStay VP Funds Trust: | | | | | | | | | | | | | | | | |
MainStay VP Bond Portfolio, Initial Class | | | | | | | | | | | 1,817,472 | | | | 22,411,980 | |
MainStay VP MacKay Convertible Portfolio, Initial Class | | | | | | | | | | | 234,080 | | | | 3,403,736 | |
MainStay VP PIMCO Real Return Portfolio, Initial Class | | | | | | | | | | | 1,691,551 | | | | 14,118,361 | |
PIMCO Variable Insurance Trust — PIMCO Total Return Portfolio, Institutional Class | | | | | | | | | | | 1,743,377 | | | | 15,690,390 | |
Total Domestic Fixed Income | | | | | | | | | | | | | | | 115,188,721 | |
| Domestic Equity — 14.2% | | | | | | | | | | | | | | | | |
American Funds Insurance Series — Growth Fund, Class 1A | | | | | | | | | | | 37,682 | | | | 3,352,515 | |
Delaware VIP Trust — Delaware VIP Small Cap Value Series, Standard Class | | | | | | | | | | | 47,239 | | | | 1,687,385 | |
Fidelity Concord Street Trust — Fidelity® 500 Index Fund, Institutional Premium Shares | | | | | | | | | | | 64,926 | | | | 10,064,093 | |
MainStay VP Funds Trust: | | | | | | | | | | | | | | | | |
MainStay VP Epoch U.S. Equity Yield Portfolio, Initial Class | | | | | | | | | | | 197,429 | | | | 3,403,619 | |
MainStay VP Small Cap Growth Portfolio, Initial Class | | | | | | | | | | | 168,117 | | | | 1,757,363 | |
Variable Insurance Products Fund — VIP Equity-Income Portfolio, Initial Class | | | | | | | | | | | 138,414 | | | | 3,388,381 | |
Total Domestic Equity | | | | | | | | | | | | | | | 23,653,356 | |
| Foreign Fixed Income — 12.8% | | | | | | | | | | | | | | | | |
Columbia Funds Variable Series Trust II — Columbia Variable Portfolio — Emerging Markets Bond Fund, Class 1 | | | | | | | | | | | 442,166 | | | | 3,342,772 | |
PIMCO Variable Insurance Trust — PIMCO International Bond Portfolio (U.S. Dollar-Hedged), Institutional Class | | | | | | | | | | | 1,922,681 | | | | 18,130,883 | |
Total Foreign Fixed Income | | | | | | | | | | | | | | | 21,473,655 | |
| Foreign Equity — 2.0% | | | | | | | | | | | | | | | | |
Fidelity Concord Street Trust — Fidelity® International Index Fund, Institutional Premium Shares | | | | | | | | | | | 71,553 | | | | 3,302,871 | |
Total Investments in Underlying Funds before Short-Term Investments
(Cost — $178,143,432) | | | | | | | | | | | | 163,618,603 | |
| | | | |
| | | Rate | | | | | | | | | | |
| Short-Term Investments — 2.3% | | | | | | | | | | | | | | | | |
Blackrock Liquidity Funds — Treasury Trust Fund, Institutional Shares
(Cost — $3,792,109) | | | 5.024 | % | | | | | | | 3,792,109 | | | | 3,792,109 | (b) |
Total Investments — 100.3% (Cost — $181,935,541) | | | | | | | | | | | | | | | 167,410,712 | |
Liabilities in Excess of Other Assets — (0.3)% | | | | | | | | | | | | | | | (469,186 | ) |
Total Net Assets — 100.0% | | | | | | | | | | | | | | $ | 166,941,526 | |
| (a) | Underlying Fund is affiliated with Franklin Resources, Inc. and more information about the Underlying Fund is available at www.franklintempleton.com (Note 8). |
| (b) | Rate shown is one-day yield as of the end of the reporting period. |
See Notes to Financial Statements.
| | |
18 | | Franklin Templeton Model Portfolio Funds 2023 Semi-Annual Report |
Statements of assets and liabilities (unaudited)
June 30, 2023
| | | | | | | | | | | | |
| | | Franklin Templeton
Aggressive
Model Portfolio | | | Franklin Templeton
Moderately
Aggressive
Model Portfolio | | | Franklin Templeton
Moderate
Model Portfolio | |
| Assets: | | | | | | | | | | | | |
Investments in affiliated Underlying Funds, at cost | | $ | 28,891,150 | | | $ | 136,292,417 | | | $ | 122,227,853 | |
Investments in Underlying Funds, at cost | | | 470,767,238 | | | | 1,400,562,345 | | | | 1,135,102,747 | |
Investments in affiliated Underlying Funds, at value | | $ | 29,191,469 | | | $ | 134,947,291 | | | $ | 120,342,803 | |
Investments in Underlying Funds, at value | | | 467,985,053 | | | | 1,367,583,491 | | | | 1,094,499,046 | |
Receivable for Portfolio shares sold | | | 945,308 | | | | 2,767,604 | | | | 1,472,489 | |
Distributions receivable from Underlying Funds | | | 188,119 | | | | 1,055,062 | | | | 1,212,895 | |
Prepaid expenses | | | 422 | | | | 1,389 | | | | 3,039 | |
Total Assets | | | 498,310,371 | | | | 1,506,354,837 | | | | 1,217,530,272 | |
| | | |
| Liabilities: | | | | | | | | | | | | |
Payable for investments in unaffiliated Underlying Funds | | | 9,704,126 | | | | 17,869,347 | | | | 10,969,761 | |
Payable for investments in affiliated Underlying Funds | | | 710,000 | | | | — | | | | 1,145,000 | |
Service and/or distribution fees payable | | | 87,022 | | | | 289,297 | | | | 240,300 | |
Investment management fee payable | | | 38,036 | | | | 117,230 | | | | 95,584 | |
Trustees’ fees payable | | | 4,959 | | | | 16,964 | | | | 14,659 | |
Accrued expenses | | | 28,011 | | | | 26,936 | | | | 26,243 | |
Total Liabilities | | | 10,572,154 | | | | 18,319,774 | | | | 12,491,547 | |
| Total Net Assets | | $ | 487,738,217 | | | $ | 1,488,035,063 | | | $ | 1,205,038,725 | |
| | | |
| Net Assets: | | | | | | | | | | | | |
Par value (Note 7) | | $ | 387 | | | $ | 1,264 | | | $ | 1,090 | |
Paid-in capital in excess of par value | | | 499,874,769 | | | | 1,556,044,185 | | | | 1,272,455,394 | |
Total distributable earnings (loss) | | | (12,136,939) | | | | (68,010,386) | | | | (67,417,759) | |
| Total Net Assets | | $ | 487,738,217 | | | $ | 1,488,035,063 | | | $ | 1,205,038,725 | |
| | | |
| Net Assets: | | | | | | | | | | | | |
Class I | | | $48,649,190 | | | | $40,787,855 | | | | $10,576,154 | |
Class II | | | $439,089,027 | | | | $1,447,247,208 | | | | $1,194,462,571 | |
| | | |
| Shares Outstanding: | | | | | | | | | | | | |
Class I | | | 3,846,117 | | | | 3,453,315 | | | | 952,622 | |
Class II | | | 34,832,626 | | | | 122,989,328 | | | | 108,033,856 | |
| | | |
| Net Asset Value: | | | | | | | | | | | | |
Class I | | | $12.65 | | | | $11.81 | | | | $11.10 | |
Class II | | | $12.61 | | | | $11.77 | | | | $11.06 | |
See Notes to Financial Statements.
| | |
| Franklin Templeton Model Portfolio Funds 2023 Semi-Annual Report | | 19 |
Statements of assets and liabilities (unaudited) (cont’d)
June 30, 2023
| | | | | | | | |
| | | Franklin Templeton
Moderately
Conservative
Model Portfolio | | | Franklin Templeton
Conservative
Model Portfolio | |
| Assets: | | | | | | | | |
Investments in affiliated Underlying Funds, at cost | | $ | 43,412,278 | | | $ | 11,868,706 | |
Investments in Underlying Funds, at cost | | | 400,170,239 | | | | 170,066,835 | |
Investments in affiliated Underlying Funds, at value | | $ | 42,616,082 | | | $ | 11,515,743 | |
Investments in Underlying Funds, at value | | | 378,526,691 | | | | 155,894,969 | |
Receivable for investments in unaffiliated Underlying Funds | | | 1,880,000 | | | | 1,155,000 | |
Receivable for Portfolio shares sold | | | 926,293 | | | | 52,271 | |
Distributions receivable from Underlying Funds | | | 522,759 | | | | 261,818 | |
Receivable for investments in affiliated Underlying Funds | | | 385,000 | | | | — | |
Prepaid expenses | | | 443 | | | | 198 | |
Total Assets | | | 424,857,268 | | | | 168,879,999 | |
| | |
| Liabilities: | | | | | | | | |
Payable for investments in unaffiliated Underlying Funds | | | 6,405,341 | | | | 1,860,470 | |
Payable for investments in affiliated Underlying Funds | | | 645,000 | | | | — | |
Service and/or distribution fees payable | | | 83,903 | | | | 33,577 | |
Investment management fee payable | | | 33,389 | | | | 13,453 | |
Trustees’ fees payable | | | 5,767 | | | | 2,659 | |
Accrued expenses | | | 30,125 | | | | 28,314 | |
Total Liabilities | | | 7,203,525 | | | | 1,938,473 | |
| Total Net Assets | | $ | 417,653,743 | | | $ | 166,941,526 | |
| | |
| Net Assets: | | | | | | | | |
Par value (Note 7) | | $ | 398 | | | $ | 176 | |
Paid-in capital in excess of par value | | | 448,075,247 | | | | 187,045,713 | |
Total distributable earnings (loss) | | | (30,421,902) | | | | (20,104,363) | |
| Total Net Assets | | $ | 417,653,743 | | | $ | 166,941,526 | |
| | |
| Net Assets: | | | | | | | | |
Class I | | | $3,820,635 | | | | $2,711,990 | |
Class II | | | $413,833,108 | | | | $164,229,536 | |
| | |
| Shares Outstanding: | | | | | | | | |
Class I | | | 363,138 | | | | 284,646 | |
Class II | | | 39,421,910 | | | | 17,294,820 | |
| | |
| Net Asset Value: | | | | | | | | |
Class I | | | $10.52 | | | | $9.53 | |
Class II | | | $10.50 | | | | $9.50 | |
See Notes to Financial Statements.
| | |
20 | | Franklin Templeton Model Portfolio Funds 2023 Semi-Annual Report |
Statements of operations (unaudited)
For the Six Months Ended June 30, 2023
| | | | | | | | | | | | |
| | | Franklin Templeton
Aggressive
Model Portfolio | | | Franklin Templeton
Moderately
Aggressive
Model Portfolio | | | Franklin Templeton
Moderate
Model Portfolio | |
| Investment Income: | | | | | | | | | | | | |
Income distributions from unaffiliated Underlying Funds | | $ | 1,306,730 | | | $ | 5,903,419 | | | $ | 6,370,452 | |
Income distributions from affiliated Underlying Funds | | | 4,281 | | | | 12,583 | | | | 8,211 | |
Total Investment Income | | | 1,311,011 | | | | 5,916,002 | | | | 6,378,663 | |
| | | |
| Expenses: | | | | | | | | | | | | |
Service and/or distribution fees (Notes 2 and 5) | | | 481,869 | | | | 1,628,063 | | | | 1,370,876 | |
Investment management fee (Note 2) | | | 212,201 | | | | 668,737 | | | | 553,694 | |
Legal fees | | | 17,705 | | | | 32,569 | | | | 27,134 | |
Fund accounting fees | | | 16,650 | | | | 20,802 | | | | 19,911 | |
Trustees’ fees | | | 13,971 | | | | 44,785 | | | | 37,597 | |
Audit and tax fees | | | 12,398 | | | | 12,398 | | | | 12,398 | |
Shareholder reports | | | 1,699 | | | | 1,773 | | | | 1,844 | |
Commitment fees (Note 9) | | | 1,654 | | | | 5,419 | | | | 4,563 | |
Insurance | | | 919 | | | | 3,097 | | | | 2,631 | |
Custody fees | | | 808 | | | | 2,481 | | | | 2,115 | |
Transfer agent fees (Note 5) | | | 54 | | | | 60 | | | | 60 | |
Interest expense | | | 10 | | | | 37 | | | | 31 | |
Miscellaneous expenses | | | 2,131 | | | | 2,794 | | | | 2,685 | |
Total Expenses | | | 762,069 | | | | 2,423,015 | | | | 2,035,539 | |
| Net Investment Income | | | 548,942 | | | | 3,492,987 | | | | 4,343,124 | |
|
| Realized and Unrealized Gain (Loss) on Underlying Funds, Affiliated Underlying Funds, Capital Gain Distributions From Affiliated Underlying Funds and Capital Gain Distributions From Unaffiliated Underlying Funds (Notes 1 and 3): | |
Net Realized Gain (Loss) From: | | | | | | | | | | | | |
Sale of unaffiliated Underlying Funds | | | (7,923,594) | | | | (33,401,526) | | | | (26,823,761) | |
Capital gain distributions from affiliated Underlying Funds | | | 167,034 | | | | 490,928 | | | | 320,340 | |
Capital gain distributions from unaffiliated Underlying Funds | | | 2,962,109 | | | | 8,089,195 | | | | 4,775,573 | |
Net Realized Loss | | | (4,794,451) | | | | (24,821,403) | | | | (21,727,848) | |
Change in Net Unrealized Appreciation (Depreciation) From: | | | | | | | | | | | | |
Unaffiliated Underlying Funds | | | 45,435,041 | | | | 128,854,670 | | | | 89,017,462 | |
Affiliated Underlying Funds | | | 2,974,247 | | | | 10,035,928 | | | | 7,354,498 | |
Change in Net Unrealized Appreciation (Depreciation) | | | 48,409,288 | | | | 138,890,598 | | | | 96,371,960 | |
| Net Gain on Underlying Funds, Affiliated Underlying Funds, Capital Gain Distributions From Affiliated Underlying Funds and Capital Gain Distributions From Unaffiliated Underlying Funds | | | 43,614,837 | | | | 114,069,195 | | | | 74,644,112 | |
| Increase in Net Assets From Operations | | $ | 44,163,779 | | | $ | 117,562,182 | | | $ | 78,987,236 | |
See Notes to Financial Statements.
| | |
| Franklin Templeton Model Portfolio Funds 2023 Semi-Annual Report | | 21 |
Statements of operations (unaudited) (cont’d)
For the Six Months Ended June 30, 2023
| | | | | | | | |
| | | Franklin Templeton
Moderately
Conservative
Model Portfolio | | | Franklin Templeton
Conservative
Model Portfolio | |
| Investment Income: | | | | | | | | |
Income distributions from unaffiliated Underlying Funds | | $ | 2,554,865 | | | $ | 1,315,152 | |
Income distributions from affiliated Underlying Funds | | | 2,104 | | | | — | |
Total Investment Income | | | 2,556,969 | | | | 1,315,152 | |
| | |
| Expenses: | | | | | | | | |
Service and/or distribution fees (Notes 2 and 5) | | | 492,025 | | | | 201,621 | |
Investment management fee (Note 2) | | | 198,850 | | | | 81,931 | |
Legal fees | | | 18,350 | | | | 15,800 | |
Fund accounting fees | | | 16,763 | | | | 15,704 | |
Trustees’ fees | | | 13,994 | | | | 6,127 | |
Audit and tax fees | | | 12,398 | | | | 12,398 | |
Shareholder reports | | | 1,741 | | | | 1,692 | |
Commitment fees (Note 9) | | | 1,695 | | | | 734 | |
Insurance | | | 1,029 | | | | 478 | |
Custody fees | | | 779 | | | | 351 | |
Transfer agent fees (Note 5) | | | 61 | | | | 61 | |
Interest expense | | | 12 | | | | 35 | |
Miscellaneous expenses | | | 2,148 | | | | 2,022 | |
Total Expenses | | | 759,845 | | | | 338,954 | |
| Net Investment Income | | | 1,797,124 | | | | 976,198 | |
|
| Realized and Unrealized Gain (Loss) on Underlying Funds, Affiliated Underlying Funds, Capital Gain Distributions From Affiliated Underlying Funds and Capital Gain Distributions From Unaffiliated Underlying Funds (Notes 1 and 3): | |
Net Realized Gain (Loss) From: | | | | | | | | |
Sale of affiliated Underlying Funds | | | (30,795) | | | | (4,202) | |
Sale of unaffiliated Underlying Funds | | | (8,473,491) | | | | (4,290,777) | |
Capital gain distributions from affiliated Underlying Funds | | | 82,105 | | | | — | |
Capital gain distributions from unaffiliated Underlying Funds | | | 1,136,833 | | | | 683,475 | |
Net Realized Loss | | | (7,285,348) | | | | (3,611,504) | |
Change in Net Unrealized Appreciation (Depreciation) From: | | | | | | | | |
Unaffiliated Underlying Funds | | | 23,605,935 | | | | 8,239,114 | |
Affiliated Underlying Funds | | | 2,148,920 | | | | 301,930 | |
Change in Net Unrealized Appreciation (Depreciation) | | | 25,754,855 | | | | 8,541,044 | |
| Net Gain on Underlying Funds, Affiliated Underlying Funds, Capital Gain Distributions From Affiliated Underlying Funds and Capital Gain Distributions From Unaffiliated Underlying Funds | | | 18,469,507 | | | | 4,929,540 | |
| Increase in Net Assets From Operations | | $ | 20,266,631 | | | $ | 5,905,738 | |
See Notes to Financial Statements.
| | |
22 | | Franklin Templeton Model Portfolio Funds 2023 Semi-Annual Report |
Statements of changes in net assets
Franklin Templeton Aggressive Model Portfolio
| | | | | | | | |
For the Six Months Ended June 30, 2023 (unaudited)
and the Year Ended December 31, 2022 | | 2023 | | | 2022 | |
| | |
| Operations: | | | | | | | | |
Net investment income | | $ | 548,942 | | | $ | 3,143,888 | |
Net realized gain (loss) | | | (4,794,451) | | | | 12,089,954 | |
Change in net unrealized appreciation (depreciation) | | | 48,409,288 | | | | (67,279,937) | |
Increase (Decrease) in Net Assets From Operations | | | 44,163,779 | | | | (52,046,095) | |
| | |
| Distributions to Shareholders From (Notes 1 and 6): | | | | | | | | |
Total distributable earnings | | | (2,378,646) | | | | (20,956,766) | |
Decrease in Net Assets From Distributions to Shareholders | | | (2,378,646) | | | | (20,956,766) | |
| | |
| Portfolio Share Transactions (Note 7): | | | | | | | | |
Net proceeds from sale of shares | | | 68,978,282 | | | | 168,716,387 | |
Reinvestment of distributions | | | 2,378,328 | | | | 20,953,139 | |
Cost of shares repurchased | | | (3,941,060) | | | | (2,603,934) | |
Increase in Net Assets From Portfolio Share Transactions | | | 67,415,550 | | | | 187,065,592 | |
Increase in Net Assets | | | 109,200,683 | | | | 114,062,731 | |
| | |
| Net Assets: | | | | | | | | |
Beginning of period | | | 378,537,534 | | | | 264,474,803 | |
End of period | | $ | 487,738,217 | | | $ | 378,537,534 | |
See Notes to Financial Statements.
| | |
| Franklin Templeton Model Portfolio Funds 2023 Semi-Annual Report | | 23 |
Statements of changes in net assets (cont’d)
Franklin Templeton Moderately Aggressive Model Portfolio
| | | | | | | | |
For the Six Months Ended June 30, 2023 (unaudited)
and the Year Ended December 31, 2022 | | 2023 | | | 2022 | |
| | |
| Operations: | | | | | | | | |
Net investment income | | $ | 3,492,987 | | | $ | 15,216,165 | |
Net realized gain (loss) | | | (24,821,403) | | | | 21,679,331 | |
Change in net unrealized appreciation (depreciation) | | | 138,890,598 | | | | (215,546,666) | |
Increase (Decrease) in Net Assets From Operations | | | 117,562,182 | | | | (178,651,170) | |
| | |
| Distributions to Shareholders From (Notes 1 and 6): | | | | | | | | |
Total distributable earnings | | | (6,719,594) | | | | (49,672,328) | |
Decrease in Net Assets From Distributions to Shareholders | | | (6,719,594) | | | | (49,672,328) | |
| | |
| Portfolio Share Transactions (Note 7): | | | | | | | | |
Net proceeds from sale of shares | | | 146,561,756 | | | | 429,558,590 | |
Reinvestment of distributions | | | 6,719,321 | | | | 49,669,841 | |
Cost of shares repurchased | | | (4,379,041) | | | | (5,785,868) | |
Increase in Net Assets From Portfolio Share Transactions | | | 148,902,036 | | | | 473,442,563 | |
Increase in Net Assets | | | 259,744,624 | | | | 245,119,065 | |
| | |
| Net Assets: | | | | | | | | |
Beginning of period | | | 1,228,290,439 | | | | 983,171,374 | |
End of period | | $ | 1,488,035,063 | | | $ | 1,228,290,439 | |
See Notes to Financial Statements.
| | |
24 | | Franklin Templeton Model Portfolio Funds 2023 Semi-Annual Report |
Franklin Templeton Moderate Model Portfolio
| | | | | | | | |
For the Six Months Ended June 30, 2023 (unaudited)
and the Year Ended December 31, 2022 | | 2023 | | | 2022 | |
| | |
| Operations: | | | | | | | | |
Net investment income | | $ | 4,343,124 | | | $ | 16,227,633 | |
Net realized gain (loss) | | | (21,727,848) | | | | 12,829,331 | |
Change in net unrealized appreciation (depreciation) | | | 96,371,960 | | | | (173,083,366) | |
Increase (Decrease) in Net Assets From Operations | | | 78,987,236 | | | | (144,026,402) | |
| | |
| Distributions to Shareholders From (Notes 1 and 6): | | | | | | | | |
Total distributable earnings | | | (4,675,239) | | | | (35,672,854) | |
Decrease in Net Assets From Distributions to Shareholders | | | (4,675,239) | | | | (35,672,854) | |
| | |
| Portfolio Share Transactions (Note 7): | | | | | | | | |
Net proceeds from sale of shares | | | 105,496,155 | | | | 316,114,119 | |
Reinvestment of distributions | | | 4,675,020 | | | | 35,670,825 | |
Cost of shares repurchased | | | (7,509,649) | | | | (4,545,272) | |
Increase in Net Assets From Portfolio Share Transactions | | | 102,661,526 | | | | 347,239,672 | |
Increase in Net Assets | | | 176,973,523 | | | | 167,540,416 | |
| | |
| Net Assets: | | | | | | | | |
Beginning of period | | | 1,028,065,202 | | | | 860,524,786 | |
End of period | | $ | 1,205,038,725 | | | $ | 1,028,065,202 | |
See Notes to Financial Statements.
| | |
| Franklin Templeton Model Portfolio Funds 2023 Semi-Annual Report | | 25 |
Statements of changes in net assets (cont’d)
Franklin Templeton Moderately Conservative Model Portfolio
| | | | | | | | |
For the Six Months Ended June 30, 2023 (unaudited)
and the Year Ended December 31, 2022 | | 2023 | | | 2022 | |
| | |
| Operations: | | | | | | | | |
Net investment income | | $ | 1,797,124 | | | $ | 7,333,917 | |
Net realized gain (loss) | | | (7,285,348) | | | | 203,063 | |
Change in net unrealized appreciation (depreciation) | | | 25,754,855 | | | | (55,767,398) | |
Increase (Decrease) in Net Assets From Operations | | | 20,266,631 | | | | (48,230,418) | |
| | |
| Distributions to Shareholders From (Notes 1 and 6): | | | | | | | | |
Total distributable earnings | | | (675,011) | | | | (10,382,460) | |
Decrease in Net Assets From Distributions to Shareholders | | | (675,011) | | | | (10,382,460) | |
| | |
| Portfolio Share Transactions (Note 7): | | | | | | | | |
Net proceeds from sale of shares | | | 31,402,341 | | | | 108,113,191 | |
Reinvestment of distributions | | | 674,925 | | | | 10,380,912 | |
Cost of shares repurchased | | | (11,672,090) | | | | (11,445,467) | |
Increase in Net Assets From Portfolio Share Transactions | | | 20,405,176 | | | | 107,048,636 | |
Increase in Net Assets | | | 39,996,796 | | | | 48,435,758 | |
| | |
| Net Assets: | | | | | | | | |
Beginning of period | | | 377,656,947 | | | | 329,221,189 | |
End of period | | $ | 417,653,743 | | | $ | 377,656,947 | |
See Notes to Financial Statements.
| | |
26 | | Franklin Templeton Model Portfolio Funds 2023 Semi-Annual Report |
Franklin Templeton Conservative Model Portfolio
| | | | | | | | |
For the Six Months Ended June 30, 2023 (unaudited)
and the Year Ended December 31, 2022 | | 2023 | | | 2022 | |
| | |
| Operations: | | | | | | | | |
Net investment income | | $ | 976,198 | | | $ | 3,431,623 | |
Net realized loss | | | (3,611,504) | | | | (2,259,823) | |
Change in net unrealized appreciation (depreciation) | | | 8,541,044 | | | | (22,723,164) | |
Increase (Decrease) in Net Assets From Operations | | | 5,905,738 | | | | (21,551,364) | |
| | |
| Distributions to Shareholders From (Notes 1 and 6): | | | | | | | | |
Total distributable earnings | | | (200,006) | | | | (4,151,085) | |
Decrease in Net Assets From Distributions to Shareholders | | | (200,006) | | | | (4,151,085) | |
| | |
| Portfolio Share Transactions (Note 7): | | | | | | | | |
Net proceeds from sale of shares | | | 11,887,456 | | | | 60,240,400 | |
Reinvestment of distributions | | | 199,949 | | | | 4,149,762 | |
Cost of shares repurchased | | | (12,088,585) | | | | (25,382,322) | |
Increase (Decrease) in Net Assets From Portfolio Share Transactions | | | (1,180) | | | | 39,007,840 | |
Increase in Net Assets | | | 5,704,552 | | | | 13,305,391 | |
| | |
| Net Assets: | | | | | | | | |
Beginning of period | | | 161,236,974 | | | | 147,931,583 | |
End of period | | $ | 166,941,526 | | | $ | 161,236,974 | |
See Notes to Financial Statements.
| | |
| Franklin Templeton Model Portfolio Funds 2023 Semi-Annual Report | | 27 |
Financial highlights
Franklin Templeton Aggressive Model Portfolio
| | | | | | | | |
For a share of each class of beneficial interest outstanding throughout each year ended December 31,
unless otherwise noted: |
| | | | | | | | | | | | | | | | |
| Class I Shares1 | | 20232 | | | 2022 | | | 2021 | | | 20203 | |
| | | | |
| Net asset value, beginning of period | | | $11.46 | | | | $14.61 | | | | $12.94 | | | | $10.00 | |
| | | | |
| Income (loss) from operations: | | | | | | | | | | | | | | | | |
Net investment income | | | 0.03 | | | | 0.18 | | | | 0.27 | | | | 0.22 | |
Net realized and unrealized gain (loss) | | | 1.22 | | | | (2.61) | | | | 2.29 | | | | 2.97 | |
Total income (loss) from operations | | | 1.25 | | | | (2.43) | | | | 2.56 | | | | 3.19 | |
| | | | |
| Less distributions from: | | | | | | | | | | | | | | | | |
Net investment income | | | (0.00) | 4 | | | (0.31) | | | | (0.24) | | | | (0.12) | |
Net realized gains | | | (0.06) | | | | (0.41) | | | | (0.65) | | | | (0.13) | |
Total distributions | | | (0.06) | | | | (0.72) | | | | (0.89) | | | | (0.25) | |
| | | | |
| Net asset value, end of period | | | $12.65 | | | | $11.46 | | | | $14.61 | | | | $12.94 | |
Total return5 | | | 10.94 | % | | | (16.62) | % | | | 19.75 | % | | | 31.90 | % |
| | | | |
| Net assets, end of period (000s) | | | $48,649 | | | | $31,077 | | | | $13,851 | | | | $2,155 | |
| | | | |
| Ratios to average net assets: | | | | | | | | | | | | | | | | |
Gross expenses6 | | | 0.13 | %7 | | | 0.15 | % | | | 0.19 | % | | | 0.61 | %7 |
Net expenses6,8 | | | 0.13 | 7 | | | 0.15 | | | | 0.19 | | | | 0.23 | 7,9 |
Net investment income | | | 0.51 | 7 | | | 1.42 | | | | 1.82 | | | | 2.62 | 7 |
| | | | |
| Portfolio turnover rate | | | 17 | % | | | 41 | % | | | 70 | % | | | 31 | % |
| 1 | Per share amounts have been calculated using the average shares method. |
| 2 | For the six months ended June 30, 2023 (unaudited). |
| 3 | For the period April 15, 2020 (inception date) to December 31, 2020. |
| 4 | Amount represents less than $0.005 or greater than $(0.005) per share. |
| 5 | Performance figures may reflect compensating balance arrangements, fee waivers and/or expense reimbursements. In the absence of compensating balance arrangements, fee waivers and/or expense reimbursements, the total return would have been lower. Total returns do not reflect expenses associated with separate accounts such as administrative fees, account charges and surrender charges which, if reflected, would reduce the total return for all periods shown. Past performance is no guarantee of future results. Total returns for periods of less than one year are not annualized. |
| 6 | Does not include fees and expenses of the Underlying Funds in which the Portfolio invests. |
| 8 | As a result of an expense limitation arrangement, the ratio of total annual fund operating expenses, other than interest, brokerage, taxes, extraordinary expenses and acquired fund fees and expenses (fees and expenses of Underlying Funds), to average net assets of Class I shares did not exceed 0.23%. This expense limitation arrangement cannot be terminated prior to December 31, 2024 without the Board of Trustees’ consent. |
| 9 | Reflects fee waivers and/or expense reimbursements. |
See Notes to Financial Statements.
| | |
28 | | Franklin Templeton Model Portfolio Funds 2023 Semi-Annual Report |
Franklin Templeton Aggressive Model Portfolio
|
For a share of each class of beneficial interest outstanding throughout each year ended December 31,
unless otherwise noted: |
| | | | | | | | | | | | | | | | |
| Class II Shares1 | | 20232 | | | 2022 | | | 2021 | | | 20203 | |
| | | | |
| Net asset value, beginning of period | | | $11.44 | | | | $14.59 | | | | $12.93 | | | | $10.00 | |
| | | | |
| Income (loss) from operations: | | | | | | | | | | | | | | | | |
Net investment income | | | 0.01 | | | | 0.12 | | | | 0.21 | | | | 0.19 | |
Net realized and unrealized gain (loss) | | | 1.22 | | | | (2.57) | | | | 2.32 | | | | 2.98 | |
Total income (loss) from operations | | | 1.23 | | | | (2.45) | | | | 2.53 | | | | 3.17 | |
| | | | |
| Less distributions from: | | | | | | | | | | | | | | | | |
Net investment income | | | (0.00) | 4 | | | (0.29) | | | | (0.22) | | | | (0.11) | |
Net realized gains | | | (0.06) | | | | (0.41) | | | | (0.65) | | | | (0.13) | |
Total distributions | | | (0.06) | | | | (0.70) | | | | (0.87) | | | | (0.24) | |
| | | | |
| Net asset value, end of period | | | $12.61 | | | | $11.44 | | | | $14.59 | | | | $12.93 | |
Total return5 | | | 10.79 | % | | | (16.82) | % | | | 19.51 | % | | | 31.70 | % |
| | | | |
| Net assets, end of period (000s) | | | $439,089 | | | | $347,461 | | | | $250,624 | | | | $71,616 | |
| | | | |
| Ratios to average net assets: | | | | | | | | | | | | | | | | |
Gross expenses6 | | | 0.38 | %7 | | | 0.40 | % | | | 0.43 | % | | | 0.83 | %7 |
Net expenses6,8 | | | 0.38 | 7 | | | 0.40 | | | | 0.43 | | | | 0.48 | 7,9 |
Net investment income | | | 0.23 | 7 | | | 0.98 | | | | 1.46 | | | | 2.23 | 7 |
| | | | |
| Portfolio turnover rate | | | 17 | % | | | 41 | % | | | 70 | % | | | 31 | % |
| 1 | Per share amounts have been calculated using the average shares method. |
| 2 | For the six months ended June 30, 2023 (unaudited). |
| 3 | For the period April 15, 2020 (inception date) to December 31, 2020. |
| 4 | Amount represents less than $0.005 or greater than $(0.005) per share. |
| 5 | Performance figures may reflect compensating balance arrangements, fee waivers and/or expense reimbursements. In the absence of compensating balance arrangements, fee waivers and/or expense reimbursements, the total return would have been lower. Total returns do not reflect expenses associated with separate accounts such as administrative fees, account charges and surrender charges which, if reflected, would reduce the total return for all periods shown. Past performance is no guarantee of future results. Total returns for periods of less than one year are not annualized. |
| 6 | Does not include fees and expenses of the Underlying Funds in which the Portfolio invests. |
| 8 | As a result of an expense limitation arrangement, the ratio of total annual fund operating expenses, other than interest, brokerage, taxes, extraordinary expenses and acquired fund fees and expenses (fees and expenses of Underlying Funds), to average net assets of Class II shares did not exceed 0.48%. This expense limitation arrangement cannot be terminated prior to December 31, 2024 without the Board of Trustees’ consent. |
| 9 | Reflects fee waivers and/or expense reimbursements. |
See Notes to Financial Statements.
| | |
| Franklin Templeton Model Portfolio Funds 2023 Semi-Annual Report | | 29 |
Financial highlights (cont’d)
Franklin Templeton Moderately Aggressive Model Portfolio
|
For a share of each class of beneficial interest outstanding throughout each year ended December 31,
unless otherwise noted: |
| | | | | | | | | | | | | | | | |
| Class I Shares1 | | 20232 | | | 2022 | | | 2021 | | | 20203 | |
| | | | |
| Net asset value, beginning of period | | | $10.86 | | | | $13.50 | | | | $12.39 | | | | $10.00 | |
| | | | |
| Income (loss) from operations: | | | | | | | | | | | | | | | | |
Net investment income | | | 0.04 | | | | 0.21 | | | | 0.24 | | | | 0.24 | |
Net realized and unrealized gain (loss) | | | 0.97 | | | | (2.36) | | | | 1.60 | | | | 2.36 | |
Total income (loss) from operations | | | 1.01 | | | | (2.15) | | | | 1.84 | | | | 2.60 | |
| | | | |
| Less distributions from: | | | | | | | | | | | | | | | | |
Net investment income | | | (0.01) | | | | (0.29) | | | | (0.25) | | | | (0.12) | |
Net realized gains | | | (0.05) | | | | (0.20) | | | | (0.48) | | | | (0.09) | |
Total distributions | | | (0.06) | | | | (0.49) | | | | (0.73) | | | | (0.21) | |
| | | | |
| Net asset value, end of period | | | $11.81 | | | | $10.86 | | | | $13.50 | | | | $12.39 | |
Total return4 | | | 9.25 | % | | | (15.89) | % | | | 14.79 | % | | | 25.99 | % |
| | | | |
| Net assets, end of period (000s) | | | $40,788 | | | | $27,295 | | | | $13,346 | | | | $3,118 | |
| | | | |
| Ratios to average net assets: | | | | | | | | | | | | | | | | |
Gross expenses5 | | | 0.12 | %6 | | | 0.13 | % | | | 0.15 | % | | | 0.28 | %6 |
Net expenses5,7 | | | 0.12 | 6 | | | 0.13 | | | | 0.15 | | | | 0.21 | 6,8 |
Net investment income | | | 0.78 | 6 | | | 1.84 | | | | 1.81 | | | | 2.92 | 6 |
| | | | |
| Portfolio turnover rate | | | 13 | % | | | 33 | % | | | 66 | % | | | 28 | % |
| 1 | Per share amounts have been calculated using the average shares method. |
| 2 | For the six months ended June 30, 2023 (unaudited). |
| 3 | For the period April 15, 2020 (inception date) to December 31, 2020. |
| 4 | Performance figures may reflect compensating balance arrangements, fee waivers and/or expense reimbursements. In the absence of compensating balance arrangements, fee waivers and/or expense reimbursements, the total return would have been lower. Total returns do not reflect expenses associated with separate accounts such as administrative fees, account charges and surrender charges which, if reflected, would reduce the total return for all periods shown. Past performance is no guarantee of future results. Total returns for periods of less than one year are not annualized. |
| 5 | Does not include fees and expenses of the Underlying Funds in which the Portfolio invests. |
| 7 | As a result of an expense limitation arrangement, the ratio of total annual fund operating expenses, other than interest, brokerage, taxes, extraordinary expenses and acquired fund fees and expenses (fees and expenses of Underlying Funds), to average net assets of Class I shares did not exceed 0.21%. This expense limitation arrangement cannot be terminated prior to December 31, 2024 without the Board of Trustees’ consent. |
| 8 | Reflects fee waivers and/or expense reimbursements. |
See Notes to Financial Statements.
| | |
30 | | Franklin Templeton Model Portfolio Funds 2023 Semi-Annual Report |
Franklin Templeton Moderately Aggressive Model Portfolio
|
For a share of each class of beneficial interest outstanding throughout each year ended December 31,
unless otherwise noted: |
| | | | | | | | | | | | | | | | |
| Class II Shares1 | | 20232 | | | 2022 | | | 2021 | | | 20203 | |
| | | | |
| Net asset value, beginning of period | | $ | 10.84 | | | $ | 13.47 | | | $ | 12.37 | | | $ | 10.00 | |
| | | | |
| Income (loss) from operations: | | | | | | | | | | | | | | | | |
Net investment income | | | 0.03 | | | | 0.16 | | | | 0.20 | | | | 0.22 | |
Net realized and unrealized gain (loss) | | | 0.96 | | | | (2.32) | | | | 1.60 | | | | 2.35 | |
Total income (loss) from operations | | | 0.99 | | | | (2.16) | | | | 1.80 | | | | 2.57 | |
| | | | |
| Less distributions from: | | | | | | | | | | | | | | | | |
Net investment income | | | (0.01) | | | | (0.27) | | | | (0.22) | | | | (0.11) | |
Net realized gains | | | (0.05) | | | | (0.20) | | | | (0.48) | | | | (0.09) | |
Total distributions | | | (0.06) | | | | (0.47) | | | | (0.70) | | | | (0.20) | |
| | | | |
| Net asset value, end of period | | $ | 11.77 | | | $ | 10.84 | | | $ | 13.47 | | | $ | 12.37 | |
Total return4 | | | 9.08 | % | | | (16.03) | % | | | 14.56 | % | | | 25.69 | % |
| | | | |
| Net assets, end of period (millions) | | $ | 1,447 | | | $ | 1,201 | | | $ | 970 | | | $ | 266 | |
| | | | |
| Ratios to average net assets: | | | | | | | | | | | | | | | | |
Gross expenses5 | | | 0.37 | %6 | | | 0.38 | % | | | 0.39 | % | | | 0.51 | %6 |
Net expenses5,7 | | | 0.37 | 6 | | | 0.38 | | | | 0.39 | | | | 0.46 | 6,8 |
Net investment income | | | 0.52 | 6 | | | 1.40 | | | | 1.51 | | | | 2.71 | 6 |
| | | | |
| Portfolio turnover rate | | | 13 | % | | | 33 | % | | | 66 | % | | | 28 | % |
| 1 | Per share amounts have been calculated using the average shares method. |
| 2 | For the six months ended June 30, 2023 (unaudited). |
| 3 | For the period April 15, 2020 (inception date) to December 31, 2020. |
| 4 | Performance figures may reflect compensating balance arrangements, fee waivers and/or expense reimbursements. In the absence of compensating balance arrangements, fee waivers and/or expense reimbursements, the total return would have been lower. Total returns do not reflect expenses associated with separate accounts such as administrative fees, account charges and surrender charges which, if reflected, would reduce the total return for all periods shown. Past performance is no guarantee of future results. Total returns for periods of less than one year are not annualized. |
| 5 | Does not include fees and expenses of the Underlying Funds in which the Portfolio invests. |
| 7 | As a result of an expense limitation arrangement, the ratio of total annual fund operating expenses, other than interest, brokerage, taxes, extraordinary expenses and acquired fund fees and expenses (fees and expenses of Underlying Funds), to average net assets of Class II shares did not exceed 0.46%. This expense limitation arrangement cannot be terminated prior to December 31, 2024 without the Board of Trustees’ consent. |
| 8 | Reflects fee waivers and/or expense reimbursements. |
See Notes to Financial Statements.
| | |
| Franklin Templeton Model Portfolio Funds 2023 Semi-Annual Report | | 31 |
Financial highlights (cont’d)
Franklin Templeton Moderate Model Portfolio
|
For a share of each class of beneficial interest outstanding throughout each year ended December 31,
unless otherwise noted: |
| | | | | | | | | | | | | | | | |
| Class I Shares1 | | 20232 | | | 2022 | | | 2021 | | | 20203 | |
| | | | |
| Net asset value, beginning of period | | $ | 10.37 | | | $ | 12.64 | | | $ | 11.80 | | | $ | 10.00 | |
| | | | |
| Income (loss) from operations: | | | | | | | | | | | | | | | | |
Net investment income | | | 0.06 | | | | 0.22 | | | | 0.21 | | | | 0.28 | |
Net realized and unrealized gain (loss) | | | 0.72 | | | | (2.08) | | | | 1.27 | | | | 1.71 | |
Total income (loss) from operations | | | 0.78 | | | | (1.86) | | | | 1.48 | | | | 1.99 | |
| | | | |
| Less distributions from: | | | | | | | | | | | | | | | | |
Net investment income | | | (0.01) | | | | (0.31) | | | | (0.23) | | | | (0.12) | |
Net realized gains | | | (0.04) | | | | (0.10) | | | | (0.41) | | | | (0.07) | |
Total distributions | | | (0.05) | | | | (0.41) | | | | (0.64) | | | | (0.19) | |
| | | | |
| Net asset value, end of period | | $ | 11.10 | | | $ | 10.37 | | | $ | 12.64 | | | $ | 11.80 | |
Total return4 | | | 7.46 | % | | | (14.77) | % | | | 12.54 | % | | | 19.95 | % |
| | | | |
| Net assets, end of period (000s) | | $ | 10,576 | | | $ | 8,028 | | | $ | 5,724 | | | $ | 2,188 | |
| | | | |
| Ratios to average net assets: | | | | | | | | | | | | | | | | |
Gross expenses5 | | | 0.12 | %6 | | | 0.13 | % | | | 0.16 | % | | | 0.29 | %6 |
Net expenses5,7 | | | 0.12 | 6 | | | 0.13 | | | | 0.16 | | | | 0.21 | 6,8 |
Net investment income | | | 1.06 | 6 | | | 2.01 | | | | 1.68 | | | | 3.45 | 6 |
| | | | |
| Portfolio turnover rate | | | 14 | % | | | 39 | % | | | 68 | % | | | 27 | % |
| 1 | Per share amounts have been calculated using the average shares method. |
| 2 | For the six months ended June 30, 2023 (unaudited). |
| 3 | For the period April 15, 2020 (inception date) to December 31, 2020. |
| 4 | Performance figures may reflect compensating balance arrangements, fee waivers and/or expense reimbursements. In the absence of compensating balance arrangements, fee waivers and/or expense reimbursements, the total return would have been lower. Total returns do not reflect expenses associated with separate accounts such as administrative fees, account charges and surrender charges which, if reflected, would reduce the total return for all periods shown. Past performance is no guarantee of future results. Total returns for periods of less than one year are not annualized. |
| 5 | Does not include fees and expenses of the Underlying Funds in which the Portfolio invests. |
| 7 | As a result of an expense limitation arrangement, the ratio of total annual fund operating expenses, other than interest, brokerage, taxes, extraordinary expenses and acquired fund fees and expenses (fees and expenses of Underlying Funds), to average net assets of Class I shares did not exceed 0.21%. This expense limitation arrangement cannot be terminated prior to December 31, 2024 without the Board of Trustees’ consent. |
| 8 | Reflects fee waivers and/or expense reimbursements. |
See Notes to Financial Statements.
| | |
32 | | Franklin Templeton Model Portfolio Funds 2023 Semi-Annual Report |
Franklin Templeton Moderate Model Portfolio
|
For a share of each class of beneficial interest outstanding throughout each year ended December 31,
unless otherwise noted: |
| | | | | | | | | | | | | | | | |
| Class II Shares1 | | 20232 | | | 2022 | | | 2021 | | | 20203 | |
| | | | |
| Net asset value, beginning of period | | $ | 10.34 | | | $ | 12.61 | | | $ | 11.78 | | | $ | 10.00 | |
| | | | |
| Income (loss) from operations: | | | | | | | | | | | | | | | | |
Net investment income | | | 0.04 | | | | 0.19 | | | | 0.18 | | | | 0.23 | |
Net realized and unrealized gain (loss) | | | 0.73 | | | | (2.08) | | | | 1.27 | | | | 1.73 | |
Total income (loss) from operations | | | 0.77 | | | | (1.89) | | | | 1.45 | | | | 1.96 | |
| | | | |
| Less distributions from: | | | | | | | | | | | | | | | | |
Net investment income | | | (0.01) | | | | (0.28) | | | | (0.21) | | | | (0.11) | |
Net realized gains | | | (0.04) | | | | (0.10) | | | | (0.41) | | | | (0.07) | |
Total distributions | | | (0.05) | | | | (0.38) | | | | (0.62) | | | | (0.18) | |
| | | | |
| Net asset value, end of period | | $ | 11.06 | | | $ | 10.34 | | | $ | 12.61 | | | $ | 11.78 | |
Total return4 | | | 7.39 | % | | | (14.99) | % | | | 12.30 | % | | | 19.65 | % |
| | | | |
| Net assets, end of period (millions) | | $ | 1,194 | | | $ | 1,020 | | | $ | 855 | | | $ | 267 | |
| | | | |
| Ratios to average net assets: | | | | | | | | | | | | | | | | |
Gross expenses5 | | | 0.37 | %6 | | | 0.38 | % | | | 0.39 | % | | | 0.51 | %6 |
Net expenses5,7 | | | 0.37 | 6 | | | 0.38 | | | | 0.39 | | | | 0.46 | 6,8 |
Net investment income | | | 0.78 | 6 | | | 1.75 | | | | 1.45 | | | | 2.92 | 6 |
| | | | |
| Portfolio turnover rate | | | 14 | % | | | 39 | % | | | 68 | % | | | 27 | % |
| 1 | Per share amounts have been calculated using the average shares method. |
| 2 | For the six months ended June 30, 2023 (unaudited). |
| 3 | For the period April 15, 2020 (inception date) to December 31, 2020. |
| 4 | Performance figures may reflect compensating balance arrangements, fee waivers and/or expense reimbursements. In the absence of compensating balance arrangements, fee waivers and/or expense reimbursements, the total return would have been lower. Total returns do not reflect expenses associated with separate accounts such as administrative fees, account charges and surrender charges which, if reflected, would reduce the total return for all periods shown. Past performance is no guarantee of future results. Total returns for periods of less than one year are not annualized. |
| 5 | Does not include fees and expenses of the Underlying Funds in which the Portfolio invests. |
| 7 | As a result of an expense limitation arrangement, the ratio of total annual fund operating expenses, other than interest, brokerage, taxes, extraordinary expenses and acquired fund fees and expenses (fees and expenses of Underlying Funds), to average net assets of Class II shares did not exceed 0.46%. This expense limitation arrangement cannot be terminated prior to December 31, 2024 without the Board of Trustees’ consent. |
| 8 | Reflects fee waivers and/or expense reimbursements. |
See Notes to Financial Statements.
| | |
| Franklin Templeton Model Portfolio Funds 2023 Semi-Annual Report | | 33 |
Financial highlights (cont’d)
Franklin Templeton Moderately Conservative Model Portfolio
| | | | | | | | | | | | | | | | |
For a share of each class of beneficial interest outstanding throughout each year ended December 31,
unless otherwise noted: | |
| Class I Shares1 | | 20232 | | | 2022 | | | 2021 | | | 20203 | |
| | | | |
| Net asset value, beginning of period | | | $10.00 | | | | $11.86 | | | | $11.47 | | | | $10.00 | |
| | | | |
| Income (loss) from operations: | | | | | | | | | | | | | | | | |
Net investment income | | | 0.06 | | | | 0.24 | | | | 0.21 | | | | 0.25 | |
Net realized and unrealized gain (loss) | | | 0.48 | | | | (1.79) | | | | 0.85 | | | | 1.40 | |
Total income (loss) from operations | | | 0.54 | | | | (1.55) | | | | 1.06 | | | | 1.65 | |
| | | | |
| Less distributions from: | | | | | | | | | | | | | | | | |
Net investment income | | | (0.02) | | | | (0.28) | | | | (0.23) | | | | (0.13) | |
Net realized gains | | | — | | | | (0.03) | | | | (0.44) | | | | (0.05) | |
Total distributions | | | (0.02) | | | | (0.31) | | | | (0.67) | | | | (0.18) | |
| | | | |
| Net asset value, end of period | | | $10.52 | | | | $10.00 | | | | $11.86 | | | | $11.47 | |
Total return4 | | | 5.37 | % | | | (13.08) | % | | | 9.22 | % | | | 16.43 | % |
| | | | |
| Net assets, end of period (000s) | | | $3,821 | | | | $2,860 | | | | $2,882 | | | | $1,050 | |
| | | | |
| Ratios to average net assets: | | | | | | | | | | | | | | | | |
Gross expenses5 | | | 0.14 | %6 | | | 0.15 | % | | | 0.19 | % | | | 0.43 | %6 |
Net expenses5,7 | | | 0.14 | 6 | | | 0.15 | | | | 0.19 | | | | 0.23 | 6,8 |
Net investment income | | | 1.18 | 6 | | | 2.26 | | | | 1.74 | | | | 3.14 | 6 |
| | | | |
| Portfolio turnover rate | | | 12 | % | | | 35 | % | | | 61 | % | | | 27 | % |
| 1 | Per share amounts have been calculated using the average shares method. |
| 2 | For the six months ended June 30, 2023 (unaudited). |
| 3 | For the period April 15, 2020 (inception date) to December 31, 2020. |
| 4 | Performance figures may reflect compensating balance arrangements, fee waivers and/or expense reimbursements. In the absence of compensating balance arrangements, fee waivers and/or expense reimbursements, the total return would have been lower. Total returns do not reflect expenses associated with separate accounts such as administrative fees, account charges and surrender charges which, if reflected, would reduce the total return for all periods shown. Past performance is no guarantee of future results. Total returns for periods of less than one year are not annualized. |
| 5 | Does not include fees and expenses of the Underlying Funds in which the Portfolio invests. |
| 7 | As a result of an expense limitation arrangement, the ratio of total annual fund operating expenses, other than interest, brokerage, taxes, extraordinary expenses and acquired fund fees and expenses (fees and expenses of Underlying Funds), to average net assets of Class I shares did not exceed 0.23%. This expense limitation arrangement cannot be terminated prior to December 31, 2024 without the Board of Trustees’ consent. |
| 8 | Reflects fee waivers and/or expense reimbursements. |
See Notes to Financial Statements.
| | |
34 | | Franklin Templeton Model Portfolio Funds 2023 Semi-Annual Report |
Franklin Templeton Moderately Conservative Model Portfolio
| | | | | | | | | | | | | | | | |
For a share of each class of beneficial interest outstanding throughout each year ended December 31,
unless otherwise noted: | |
| Class II Shares1 | | 20232 | | | 2022 | | | 2021 | | | 20203 | |
| | | | |
| Net asset value, beginning of period | | | $9.99 | | | | $11.85 | | | | $11.47 | | | | $10.00 | |
| | | | |
| Income (loss) from operations: | | | | | | | | | | | | | | | | |
Net investment income | | | 0.05 | | | | 0.22 | | | | 0.16 | | | | 0.23 | |
Net realized and unrealized gain (loss) | | | 0.48 | | | | (1.80) | | | | 0.87 | | | | 1.40 | |
Total income (loss) from operations | | | 0.53 | | | | (1.58) | | | | 1.03 | | | | 1.63 | |
| | | | |
| Less distributions from: | | | | | | | | | | | | | | | | |
Net investment income | | | (0.02) | | | | (0.25) | | | | (0.21) | | | | (0.11) | |
Net realized gains | | | — | | | | (0.03) | | | | (0.44) | | | | (0.05) | |
Total distributions | | | (0.02) | | | | (0.28) | | | | (0.65) | | | | (0.16) | |
| | | | |
| Net asset value, end of period | | | $10.50 | | | | $9.99 | | | | $11.85 | | | | $11.47 | |
Total return4 | | | 5.28 | % | | | (13.29) | % | | | 8.96 | % | | | 16.32 | % |
| | | | |
| Net assets, end of period (millions) | | | $414 | | | | $375 | | | | $326 | | | | $129 | |
| | | | |
| Ratios to average net assets: | | | | | | | | | | | | | | | | |
Gross expenses5 | | | 0.38 | %6 | | | 0.39 | % | | | 0.41 | % | | | 0.63 | %6 |
Net expenses5,7 | | | 0.38 | 6 | | | 0.39 | | | | 0.41 | | | | 0.48 | 6,8 |
Net investment income | | | 0.90 | 6 | | | 2.08 | | | | 1.36 | | | | 2.99 | 6 |
| | | | |
| Portfolio turnover rate | | | 12 | % | | | 35 | % | | | 61 | % | | | 27 | % |
| 1 | Per share amounts have been calculated using the average shares method. |
| 2 | For the six months ended June 30, 2023 (unaudited). |
| 3 | For the period April 15, 2020 (inception date) to December 31, 2020. |
| 4 | Performance figures may reflect compensating balance arrangements, fee waivers and/or expense reimbursements. In the absence of compensating balance arrangements, fee waivers and/or expense reimbursements, the total return would have been lower. Total returns do not reflect expenses associated with separate accounts such as administrative fees, account charges and surrender charges which, if reflected, would reduce the total return for all periods shown. Past performance is no guarantee of future results. Total returns for periods of less than one year are not annualized. |
| 5 | Does not include fees and expenses of the Underlying Funds in which the Portfolio invests. |
| 7 | As a result of an expense limitation arrangement, the ratio of total annual fund operating expenses, other than interest, brokerage, taxes, extraordinary expenses and acquired fund fees and expenses (fees and expenses of Underlying Funds), to average net assets of Class II shares did not exceed 0.48%. This expense limitation arrangement cannot be terminated prior to December 31, 2024 without the Board of Trustees’ consent. |
| 8 | Reflects fee waivers and/or expense reimbursements. |
See Notes to Financial Statements.
| | |
| Franklin Templeton Model Portfolio Funds 2023 Semi-Annual Report | | 35 |
Financial highlights (cont’d)
Franklin Templeton Conservative Model Portfolio
| | | | | | | | | | | | | | | | |
For a share of each class of beneficial interest outstanding throughout each year ended December 31,
unless otherwise noted: | |
| Class I Shares1 | | 20232 | | | 2022 | | | 2021 | | | 20203 | |
| | | | |
| Net asset value, beginning of period | | | $9.19 | | | | $10.86 | | | | $10.91 | | | | $10.00 | |
| | | | |
| Income (loss) from operations: | | | | | | | | | | | | | | | | |
Net investment income | | | 0.07 | | | | 0.26 | | | | 0.17 | | | | 0.33 | |
Net realized and unrealized gain (loss) | | | 0.28 | | | | (1.66) | | | | 0.38 | | | | 0.77 | |
Total income (loss) from operations | | | 0.35 | | | | (1.40) | | | | 0.55 | | | | 1.10 | |
| | | | |
| Less distributions from: | | | | | | | | | | | | | | | | |
Net investment income | | | (0.01) | | | | (0.25) | | | | (0.23) | | | | (0.15) | |
Net realized gains | | | — | | | | (0.02) | | | | (0.37) | | | | (0.04) | |
Total distributions | | | (0.01) | | | | (0.27) | | | | (0.60) | | | | (0.19) | |
| | | | |
| Net asset value, end of period | | | $9.53 | | | | $9.19 | | | | $10.86 | | | | $10.91 | |
Total return4 | | | 3.83 | % | | | (12.96) | % | | | 4.98 | % | | | 10.99 | % |
| | | | |
| Net assets, end of period (000s) | | | $2,712 | | | | $2,036 | | | | $1,406 | | | | $1,053 | |
| | | | |
| Ratios to average net assets: | | | | | | | | | | | | | | | | |
Gross expenses5 | | | 0.17 | %6 | | | 0.18 | % | | | 0.25 | % | | | 0.57 | %6 |
Net expenses5,7 | | | 0.17 | 6 | | | 0.18 | | | | 0.23 | | | | 0.23 | 6,8 |
Net investment income | | | 1.47 | 6 | | | 2.64 | | | | 1.52 | | | | 4.33 | 6 |
| | | | |
| Portfolio turnover rate | | | 17 | % | | | 32 | % | | | 56 | % | | | 22 | % |
| 1 | Per share amounts have been calculated using the average shares method. |
| 2 | For the six months ended June 30, 2023 (unaudited). |
| 3 | For the period April 15, 2020 (inception date) to December 31, 2020. |
| 4 | Performance figures may reflect compensating balance arrangements, fee waivers and/or expense reimbursements. In the absence of compensating balance arrangements, fee waivers and/or expense reimbursements, the total return would have been lower. Total returns do not reflect expenses associated with separate accounts such as administrative fees, account charges and surrender charges which, if reflected, would reduce the total return for all periods shown. Past performance is no guarantee of future results. Total returns for periods of less than one year are not annualized. |
| 5 | Does not include fees and expenses of the Underlying Funds in which the Portfolio invests. |
| 7 | As a result of an expense limitation arrangement, the ratio of total annual fund operating expenses, other than interest, brokerage, taxes, extraordinary expenses and acquired fund fees and expenses (fees and expenses of Underlying Funds), to average net assets of Class I shares did not exceed 0.23%. This expense limitation arrangement cannot be terminated prior to December 31, 2024 without the Board of Trustees’ consent. |
| 8 | Reflects fee waivers and/or expense reimbursements. |
See Notes to Financial Statements.
| | |
36 | | Franklin Templeton Model Portfolio Funds 2023 Semi-Annual Report |
Franklin Templeton Conservative Model Portfolio
| | | | | | | | | | | | | | | | |
For a share of each class of beneficial interest outstanding throughout each year ended December 31,
unless otherwise noted: | |
| Class II Shares1 | | 20232 | | | 2022 | | | 2021 | | | 20203 | |
| | | | |
| Net asset value, beginning of period | | | $9.17 | | | | $10.84 | | | | $10.90 | | | | $10.00 | |
| | | | |
| Income (loss) from operations: | | | | | | | | | | | | | | | | |
Net investment income | | | 0.06 | | | | 0.21 | | | | 0.14 | | | | 0.28 | |
Net realized and unrealized gain (loss) | | | 0.28 | | | | (1.64) | | | | 0.38 | | | | 0.80 | |
Total income (loss) from operations | | | 0.34 | | | | (1.43) | | | | 0.52 | | | | 1.08 | |
| | | | |
| Less distributions from: | | | | | | | | | | | | | | | | |
Net investment income | | | (0.01) | | | | (0.22) | | | | (0.21) | | | | (0.14) | |
Net realized gains | | | — | | | | (0.02) | | | | (0.37) | | | | (0.04) | |
Total distributions | | | (0.01) | | | | (0.24) | | | | (0.58) | | | | (0.18) | |
| | | | |
| Net asset value, end of period | | | $9.50 | | | | $9.17 | | | | $10.84 | | | | $10.90 | |
Total return4 | | | 3.72 | % | | | (13.18) | % | | | 4.71 | % | | | 10.78 | % |
| | | | |
| Net assets, end of period (000s) | | | $164,230 | | | | $159,201 | | | | $146,525 | | | | $82,143 | |
| | | | |
| Ratios to average net assets: | | | | | | | | | | | | | | | | |
Gross expenses5 | | | 0.42 | %6 | | | 0.43 | % | | | 0.45 | % | | | 0.77 | %6 |
Net expenses5,7 | | | 0.42 | 6 | | | 0.43 | | | | 0.45 | | | | 0.48 | 6,8 |
Net investment income | | | 1.19 | 6 | | | 2.18 | | | | 1.27 | | | | 3.73 | 6 |
| | | | |
| Portfolio turnover rate | | | 17 | % | | | 32 | % | | | 56 | % | | | 22 | % |
| 1 | Per share amounts have been calculated using the average shares method. |
| 2 | For the six months ended June 30, 2023 (unaudited). |
| 3 | For the period April 15, 2020 (inception date) to December 31, 2020. |
| 4 | Performance figures may reflect compensating balance arrangements, fee waivers and/or expense reimbursements. In the absence of compensating balance arrangements, fee waivers and/or expense reimbursements, the total return would have been lower. Total returns do not reflect expenses associated with separate accounts such as administrative fees, account charges and surrender charges which, if reflected, would reduce the total return for all periods shown. Past performance is no guarantee of future results. Total returns for periods of less than one year are not annualized. |
| 5 | Does not include fees and expenses of the Underlying Funds in which the Portfolio invests. |
| 7 | As a result of an expense limitation arrangement, the ratio of total annual fund operating expenses, other than interest, brokerage, taxes, extraordinary expenses and acquired fund fees and expenses (fees and expenses of Underlying Funds), to average net assets of Class II shares did not exceed 0.48%. This expense limitation arrangement cannot be terminated prior to December 31, 2024 without the Board of Trustees’ consent. |
| 8 | Reflects fee waivers and/or expense reimbursements. |
See Notes to Financial Statements.
| | |
| Franklin Templeton Model Portfolio Funds 2023 Semi-Annual Report | | 37 |
Notes to financial statements (unaudited)
1. Organization and significant accounting policies
Franklin Templeton Aggressive Model Portfolio (“Aggressive Model Portfolio”), Franklin Templeton Moderately Aggressive Model Portfolio (“Moderately Aggressive Model Portfolio”), Franklin Templeton Moderate Model Portfolio (“Moderate Model Portfolio”), Franklin Templeton Moderately Conservative Model Portfolio (“Moderately Conservative Model Portfolio”) and Franklin Templeton Conservative Model Portfolio (“Conservative Model Portfolio”) (collectively, the “Portfolios”) are separate diversified investment series of Legg Mason Partners Variable Equity Trust (the “Trust”). The Trust, a Maryland statutory trust, is registered under the Investment Company Act of 1940, as amended (the “1940 Act”), as an open-end management investment company. The Portfolios invest in insurance-dedicated mutual funds that have been selected by New York Life Insurance and Annuity Corporation (“NYLIAC”) as investment options for use with their variable annuity and variable universal life insurance policies, noninsurance-dedicated mutual funds and exchange traded funds (“Underlying Funds”). The Underlying Funds include funds managed by investment advisers that are not affiliated with Franklin Resources, Inc. (“Franklin Resources”) and funds managed by Franklin Resources affiliated investment advisers. Shares of the Portfolios are offered to variable annuity and variable life insurance separate accounts established by NYLIAC.
Shares of the Portfolios may only be purchased or redeemed through variable annuity contracts and variable life insurance policies issued by NYLIAC through their separate accounts.
The Portfolios follow the accounting and reporting guidance in Financial Accounting Standards Board (“FASB”) Accounting Standards Codification Topic 946, Financial Services – Investment Companies (“ASC 946”). The following are significant accounting policies consistently followed by the Portfolios and are in conformity with U.S. generally accepted accounting principles (“GAAP”), including, but not limited to, ASC 946. Estimates and assumptions are required to be made regarding assets, liabilities and changes in net assets resulting from operations when financial statements are prepared. Changes in the economic environment, financial markets and any other parameters used in determining these estimates could cause actual results to differ. Subsequent events have been evaluated through the date the financial statements were issued.
(a) Investment valuation. Investments in the Underlying Funds are valued at the closing net asset value per share of each Underlying Fund on the day of valuation. Equity securities for which market quotations are available are valued at the last reported sales price or official closing price on the primary market or exchange on which they trade. The valuations for fixed income securities (which may include, but are not limited to, corporate, government, municipal, mortgage-backed, collateralized mortgage obligations and asset-backed securities) and certain derivative instruments are typically the prices supplied by independent third party pricing services, which may use market prices or broker/dealer quotations or a variety of valuation techniques and methodologies. The independent third party pricing services typically use inputs that are observable such as issuer details, interest rates, yield curves, prepayment speeds, credit risks/spreads, default rates and quoted prices for similar securities. Investments in open-end funds are valued at the closing net asset value per share of each fund on the day of valuation. When the Portfolios hold securities or other assets that are denominated in a foreign currency, the Portfolios will normally use the currency exchange rates as of 4:00 p.m. (Eastern Time). If independent third party pricing services are unable to supply prices for a portfolio investment, or if the prices supplied are deemed by the manager to be unreliable, the market price may be determined by the manager using quotations from one or more broker/dealers or at the transaction price if the security has recently been purchased and no value has yet been obtained from a pricing service or pricing broker. When reliable prices are not readily available, such as when the value of a security has been significantly affected by events after the close of the exchange or market on which the security is principally traded, but before each Portfolio calculates its net asset value, the Portfolios value these securities as determined in accordance with procedures approved by the Portfolios’ Board of Trustees.
Pursuant to policies adopted by the Board of Trustees, the Portfolios’ manager has been designated as the valuation designee and is responsible for the oversight of the daily valuation process. The Portfolios’ manager is assisted by the Global Fund Valuation Committee (the “Valuation Committee”). The Valuation Committee is responsible for making fair value determinations, evaluating the effectiveness of the Portfolios’ pricing policies, and reporting to the Portfolios’ manager and the Board of Trustees. When determining the reliability of third party pricing information for investments owned by the Portfolios, the Valuation Committee, among other things, conducts due diligence reviews of pricing vendors, monitors the daily change in prices and reviews transactions among market participants.
The Valuation Committee will consider pricing methodologies it deems relevant and appropriate when making fair value determinations. Examples of possible methodologies include, but are not limited to, multiple of earnings; discount from market of a similar freely traded security; discounted cash-flow analysis; book value or a multiple thereof; risk premium/yield analysis; yield to maturity; and/or fundamental investment analysis. The Valuation Committee will also consider factors it deems relevant and appropriate in light of the facts and circumstances. Examples of possible factors include, but are not limited to, the type of security; the issuer’s financial statements; the purchase price of the security; the discount from market value of unrestricted securities of the same class at the time of purchase; analysts’ research and observations from financial institutions; information regarding any transactions or offers with respect to the security; the existence of merger proposals or tender offers affecting the security; the price and extent of public trading in similar securities of the issuer or
| | |
38 | | Franklin Templeton Model Portfolio Funds 2023 Semi-Annual Report |
comparable companies; and the existence of a shelf registration for restricted securities. Additionally, if the closing net asset value per share for an Underlying Fund is not available on the day of valuation, the Valuation Committee may adjust the Underlying Fund’s last available net asset value per share to account for significant events that have occurred subsequent to the Underlying Fund’s last net asset value per share calculation but prior to the day of valuation.
For each portfolio security that has been fair valued pursuant to the policies adopted by the Board of Trustees, the fair value price is compared against the last available and next available market quotations. The Valuation Committee reviews the results of such back testing monthly and fair valuation occurrences are reported to the Board of Trustees quarterly.
The Portfolios use valuation techniques to measure fair value that are consistent with the market approach and/or income approach, depending on the type of security and the particular circumstance. The market approach uses prices and other relevant information generated by market transactions involving identical or comparable securities. The income approach uses valuation techniques to discount estimated future cash flows to present value.
GAAP establishes a disclosure hierarchy that categorizes the inputs to valuation techniques used to value assets and liabilities at measurement date. These inputs are summarized in the three broad levels listed below:
| • | | Level 1 — unadjusted quoted prices in active markets for identical investments |
| • | | Level 2 — other significant observable inputs (including quoted prices for similar investments, interest rates, prepayment speeds, credit risk, etc.) |
| • | | Level 3 — significant unobservable inputs (including the Portfolios’ own assumptions in determining the fair value of investments) |
The inputs or methodologies used to value securities are not necessarily an indication of the risk associated with investing in those securities.
The following is a summary of the inputs used in valuing the Portfolios’ assets carried at fair value:
Aggressive Model Portfolio
| | | | | | | | | | | | | | | | |
| ASSETS | |
| Description | | Quoted Prices
(Level 1) | | | Other Significant
Observable Inputs
(Level 2) | | | Significant
Unobservable
Inputs
(Level 3) | | | Total | |
| Long-Term Investments: | | | | | | | | | | | | | | | | |
Investments in Underlying Funds†: | | | | | | | | | | | | | | | | |
Domestic Equity | | $ | 183,446,022 | | | $ | 155,470,116 | | | | — | | | $ | 338,916,138 | |
Foreign Equity | | | 58,187,368 | | | | 21,802,617 | | | | — | | | | 79,989,985 | |
Domestic Fixed Income | | | 60,377,021 | | | | — | | | | — | | | | 60,377,021 | |
| Total Long-Term Investments | | | 302,010,411 | | | | 177,272,733 | | | | — | | | | 479,283,144 | |
| Short-Term Investments† | | | 17,893,378 | | | | — | | | | — | | | | 17,893,378 | |
| Total Investments | | $ | 319,903,789 | | | $ | 177,272,733 | | | | — | | | $ | 497,176,522 | |
| † | See Schedule of Investments for additional detailed categorizations. |
Moderately Aggressive Model Portfolio
| | | | | | | | | | | | | | | | |
| ASSETS | |
| Description | | Quoted Prices
(Level 1) | | | Other Significant
Observable Inputs
(Level 2) | | | Significant
Unobservable
Inputs
(Level 3) | | | Total | |
| Long-Term Investments: | | | | | | | | | | | | | | | | |
Investments in Underlying Funds†: | | | | | | | | | | | | | | | | |
Domestic Equity | | $ | 502,926,795 | | | $ | 335,272,250 | | | | — | | | $ | 838,199,045 | |
Domestic Fixed Income | | | 330,721,763 | | | | 65,614,353 | | | | — | | | | 396,336,116 | |
Foreign Fixed Income | | | 48,145,608 | | | | — | | | | — | | | | 48,145,608 | |
Foreign Equity | | | 146,350,967 | | | | 51,765,131 | | | | — | | | | 198,116,098 | |
| Total Long-Term Investments | | | 1,028,145,133 | | | | 452,651,734 | | | | — | | | | 1,480,796,867 | |
| Short-Term Investments† | | | 21,733,915 | | | | — | | | | — | | | | 21,733,915 | |
| Total Investments | | $ | 1,049,879,048 | | | $ | 452,651,734 | | | | — | | | $ | 1,502,530,782 | |
| † | See Schedule of Investments for additional detailed categorizations. |
| | |
| Franklin Templeton Model Portfolio Funds 2023 Semi-Annual Report | | 39 |
Notes to financial statements (unaudited) (cont’d)
Moderate Model Portfolio
| | | | | | | | | | | | | | | | |
| ASSETS | |
| Description | | Quoted Prices
(Level 1) | | | Other Significant
Observable Inputs
(Level 2) | | | Significant
Unobservable
Inputs
(Level 3) | | | Total | |
| Long-Term Investments: | | | | | | | | | | | | | | | | |
Investments in Underlying Funds†: | | | | | | | | | | | | | | | | |
Domestic Equity | | $ | 293,469,126 | | | $ | 193,699,929 | | | | — | | | $ | 487,169,055 | |
Domestic Fixed Income | | | 429,488,175 | | | | 88,526,361 | | | | — | | | | 518,014,536 | |
Foreign Fixed Income | | | 48,342,676 | | | | — | | | | — | | | | 48,342,676 | |
Foreign Equity | | | 93,550,607 | | | | 35,117,495 | | | | — | | | | 128,668,102 | |
| Total Long-Term Investments | | | 864,850,584 | | | | 317,343,785 | | | | — | | | | 1,182,194,369 | |
| Short-Term Investments† | | | 32,647,480 | | | | — | | | | — | | | | 32,647,480 | |
| Total Investments | | $ | 897,498,064 | | | $ | 317,343,785 | | | | — | | | $ | 1,214,841,849 | |
| † | See Schedule of Investments for additional detailed categorizations. |
Moderately Conservative Model Portfolio
| | | | | | | | | | | | | | | | |
| ASSETS | |
| Description | | Quoted Prices
(Level 1) | | | Other Significant
Observable Inputs
(Level 2) | | | Significant
Unobservable
Inputs
(Level 3) | | | Total | |
| Long-Term Investments: | | | | | | | | | | | | | | | | |
Investments in Underlying Funds†: | | | | | | | | | | | | | | | | |
Domestic Equity | | $ | 66,312,110 | | | $ | 48,283,861 | | | | — | | | $ | 114,595,971 | |
Domestic Fixed Income | | | 167,339,046 | | | | 58,351,210 | | | | — | | | | 225,690,256 | |
Foreign Fixed Income | | | 33,071,384 | | | | — | | | | — | | | | 33,071,384 | |
Foreign Equity | | | 27,610,168 | | | | 8,325,666 | | | | — | | | | 35,935,834 | |
| Total Long-Term Investments | | | 294,332,708 | | | | 114,960,737 | | | | — | | | | 409,293,445 | |
| Short-Term Investments† | | | 11,849,328 | | | | — | | | | — | | | | 11,849,328 | |
| Total Investments | | $ | 306,182,036 | | | $ | 114,960,737 | | | | — | | | $ | 421,142,773 | |
| † | See Schedule of Investments for additional detailed categorizations. |
Conservative Model Portfolio
| | | | | | | | | | | | | | | | |
| ASSETS | |
| Description | | Quoted Prices
(Level 1) | | | Other Significant
Observable Inputs
(Level 2) | | | Significant
Unobservable
Inputs
(Level 3) | | | Total | |
| Long-Term Investments: | | | | | | | | | | | | | | | | |
Investments in Underlying Funds†: | | | | | | | | | | | | | | | | |
Domestic Equity | | $ | 13,452,473 | | | $ | 10,200,882 | | | | — | | | $ | 23,653,355 | |
Domestic Fixed Income | | | 75,254,644 | | | | 39,934,077 | | | | — | | | | 115,188,721 | |
Other Investments in Underlying Funds | | | 24,776,527 | | | | — | | | | — | | | | 24,776,527 | |
| Total Long-Term Investments | | | 113,483,644 | | | | 50,134,959 | | | | — | | | | 163,618,603 | |
| Short-Term Investments† | | | 3,792,109 | | | | — | | | | — | | | | 3,792,109 | |
| Total Investments | | $ | 117,275,753 | | | $ | 50,134,959 | | | | — | | | $ | 167,410,712 | |
| † | See Schedule of Investments for additional detailed categorizations. |
(b) Fund of funds risk. The cost of investing in the Portfolios, as funds of funds, may be higher than the cost of investing in a mutual fund that only invests directly in individual securities. An Underlying Fund may change its investment objective or policies without the Portfolios’ approval, which could force the Portfolios to withdraw their investments from such Underlying Fund at a time that is unfavorable to the Portfolios. In addition, one Underlying Fund may buy the same securities that another Underlying Fund sells. Therefore, the Portfolios would indirectly bear the costs of these trades without accomplishing any investment purpose.
| | |
40 | | Franklin Templeton Model Portfolio Funds 2023 Semi-Annual Report |
(c) Security transactions and investment income. Security transactions are accounted for on a trade date basis. Net investment income distributions, if any, from the Underlying Funds are recorded on the ex-dividend date as investment income. Interest income is recorded on an accrual basis. Short-term and long-term capital gain distributions, if any, from the Underlying Funds are recorded on the ex-dividend date as realized gains. The character of certain distributions received from the Underlying Funds may represent a return of capital. The Portfolios determine the components of these distributions subsequent to the ex-dividend date, based on the actual tax character reported by the Underlying Funds. These distributions are recorded by adjusting the cost basis of the related Underlying Fund. The cost of investments sold is determined by use of the specific identification method.
(d) Distributions to shareholders. Distributions from net investment income and distributions of net realized gains, if any, are declared at least annually. Distributions to shareholders of the Portfolios are recorded on the ex-dividend date and are determined in accordance with income tax regulations, which may differ from GAAP.
(e) Share class accounting. Investment income, common expenses and realized/unrealized gains (losses) on investments are allocated to the various classes of the Portfolios on the basis of daily net assets of each class. Fees relating to a specific class are charged directly to that share class.
(f) Compensating balance arrangements. The Portfolios have an arrangement with their custodian bank whereby a portion of the custodian’s fees is paid indirectly by credits earned on the Portfolios’ cash on deposit with the bank.
(g) Federal and other taxes. It is the Portfolios’ policy to comply with the federal income and excise tax requirements of the Internal Revenue Code of 1986 (the “Code”), as amended, applicable to regulated investment companies. Accordingly, the Portfolios intend to distribute their taxable income and net realized gains, if any, to shareholders in accordance with timing requirements imposed by the Code. Therefore, no federal or state income tax provision is required in the Portfolios’ financial statements.
Management has analyzed the Portfolios’ tax positions taken on income tax returns for all open tax years and has concluded that as of December 31, 2022, no provision for income tax is required in the Portfolios’ financial statements. The Portfolios’ federal and state income and federal excise tax returns for tax years for which the applicable statutes of limitations have not expired are subject to examination by the Internal Revenue Service and state departments of revenue.
(h) Reclassification. GAAP requires that certain components of net assets be reclassified to reflect permanent differences between financial and tax reporting. These reclassifications have no effect on net assets or net asset value per share.
2. Investment management agreement and other transactions with affiliates
Legg Mason Partners Fund Advisor, LLC (“LMPFA”) is each Portfolio’s investment manager. Franklin Advisers, Inc. (“Franklin Advisers”) is each Portfolio’s subadviser. Western Asset Management Company, LLC (“Western Asset”) manages the portion of each Portfolio’s cash and short-term instruments allocated to it. LMPFA, Franklin Advisers and Western Asset are wholly-owned subsidiaries of Franklin Resources.
Under the investment management agreement, each Portfolio pays an investment management fee, calculated daily and paid monthly, at an annual rate that decreases as assets increase, as follows: 0.13% of assets up to and including $1 billion, 0.11% of assets over $1 billion and up to and including $1.5 billion, 0.09% of assets over $1.5 billion and up to and including $2 billion, 0.08% of assets over $2 billion and up to and including $3.5 billion, 0.07% of assets over $3.5 billion and up to and including $5 billion and 0.06% of assets over $5 billion. For purposes of determining the effective management fee rate, the net assets of each Portfolio will be aggregated.
LMPFA provides administrative and certain oversight services to the Portfolios. LMPFA delegates to the subadviser the day-to-day portfolio management of the Portfolios, except for the management of the portion of each Portfolio’s cash and short-term instruments allocated to Western Asset. For its services, LMPFA pays Franklin Advisers a fee monthly, at an annual rate equal to 70% of the net management fee it receives from each Portfolio. For Western Asset’s services to the Portfolios, LMPFA pays Western Asset monthly 0.02% of the portion of each Portfolio’s average daily net assets that are allocated to Western Asset by LMPFA.
The Portfolios indirectly bear their proportionate share of expenses from the Underlying Funds. Since the Underlying Funds have varied expense levels and the Portfolios may own different proportions of the Underlying Funds at different times, the amount of expenses incurred indirectly by the Portfolios will vary.
As a result of expense limitation arrangements between the Portfolios and LMPFA, the ratio of total annual fund operating expenses, other than interest, brokerage, taxes, extraordinary expenses and acquired fund fees and expenses (fees and expenses of Underlying Funds), to average net assets of Class I and Class II shares of Aggressive Model Portfolio, Moderately Conservative Model Portfolio and Conservative Model Portfolio did not exceed 0.23% and 0.48%, respectively. Additionally, the ratio of total annual fund operating expenses, other than interest, brokerage, taxes, extraordinary expenses and
| | |
| Franklin Templeton Model Portfolio Funds 2023 Semi-Annual Report | | 41 |
Notes to financial statements (unaudited) (cont’d)
acquired fund fees and expenses (fees and expenses of Underlying Funds), to average net assets of Class I and Class II shares of Moderately Aggressive Model Portfolio and Moderate Model Portfolio did not exceed 0.21% and 0.46%, respectively. These expense limitation arrangements cannot be terminated prior to December 31, 2024 without the Board of Trustees’ consent.
LMPFA is permitted to recapture amounts waived and/or expenses reimbursed to a class during the same fiscal year if the class’ total annual fund operating expenses have fallen to a level below the expense limitation (“expense cap”) in effect at the time the fees were earned or the expenses incurred. In no case will LMPFA recapture any amount that would result, on any particular business day of the Portfolios, in the class’ total annual fund operating expenses exceeding the expense cap or any other lower limit then in effect.
Franklin Templeton Investor Services, LLC (“Investor Services”) serves as the Portfolios’ shareholder servicing agent and acts as the Portfolios’ transfer agent and dividend-paying agent. Investor Services is an indirect, wholly-owned subsidiary of Franklin Resources. Franklin Distributors, LLC (“Franklin Distributors”) serves as the Portfolios’ sole and exclusive distributor. Franklin Distributors is an indirect, wholly-owned broker-dealer subsidiary of Franklin Resources.
All officers and one Trustee of the Trust are employees of Franklin Resources or its affiliates and do not receive compensation from the Trust.
3. Investments
During the six months ended June 30, 2023, the aggregate cost of purchases and proceeds from sales of investments (excluding short-term investments) were as follows:
| | | | | | | | |
| | | Purchases | | | Sales | |
| Aggressive Model Portfolio | | $ | 144,791,412 | | | $ | 73,207,670 | |
| Moderately Aggressive Model Portfolio | | | 353,945,859 | | | | 179,703,095 | |
| Moderate Model Portfolio | | | 263,148,616 | | | | 157,111,804 | |
| Moderately Conservative Model Portfolio | | | 74,335,091 | | | | 48,515,000 | |
| Conservative Model Portfolio | | | 27,678,580 | | | | 28,383,090 | |
At June 30, 2023, the aggregate cost of investments and the aggregate gross unrealized appreciation and depreciation of investments for federal income tax purposes were substantially as follows:
| | | | | | | | | | | | | | | | |
| | | Aggressive Model Portfolio | |
| | | Cost | | | Gross
Unrealized
Appreciation | | | Gross
Unrealized
Depreciation | | | Net
Unrealized
Depreciation | |
| Securities | | $ | 499,658,388 | | | $ | 10,531,221 | | | $ | (13,013,087) | | | $ | (2,481,866) | |
| |
| | | Moderately Aggressive Model Portfolio | |
| | | Cost | | | Gross
Unrealized
Appreciation | | | Gross
Unrealized
Depreciation | | | Net
Unrealized
Depreciation | |
| Securities | | $ | 1,536,854,762 | | | $ | 30,131,788 | | | $ | (64,455,768) | | | $ | (34,323,980) | |
| |
| | | Moderate Model Portfolio | |
| | | Cost | | | Gross
Unrealized
Appreciation | | | Gross
Unrealized
Depreciation | | | Net
Unrealized
Depreciation | |
| Securities | | $ | 1,257,330,600 | | | $ | 18,429,666 | | | $ | (60,918,417) | | | $ | (42,488,751) | |
| |
| | | Moderately Conservative Model Portfolio | |
| | | Cost | | | Gross
Unrealized
Appreciation | | | Gross
Unrealized
Depreciation | | | Net
Unrealized
Depreciation | |
| Securities | | $ | 443,582,517 | | | $ | 5,214,712 | | | $ | (27,654,456) | | | $ | (22,439,744) | |
| |
| | | Conservative Model Portfolio | |
| | | Cost | | | Gross
Unrealized
Appreciation | | | Gross
Unrealized
Depreciation | | | Net
Unrealized
Depreciation | |
| Securities | | $ | 181,935,541 | | | $ | 1,166,065 | | | $ | (15,690,894) | | | $ | (14,524,829) | |
| | |
42 | | Franklin Templeton Model Portfolio Funds 2023 Semi-Annual Report |
4. Derivative instruments and hedging activities
During the six months ended June 30, 2023, the Portfolios did not invest in derivative instruments.
5. Class specific expenses, waivers and/or expense reimbursements
The Portfolios have adopted a Rule 12b-1 shareholder services and distribution plan and under that plan Aggressive Model Portfolio, Moderately Aggressive Model Portfolio, Moderate Model Portfolio, Moderately Conservative Model Portfolio and Conservative Model Portfolio pay service and/or distribution fees with respect to their Class II shares calculated at the annual rate of 0.25% of the average daily net assets of the class. Service and/or distribution fees are accrued daily and paid monthly.
For the six months ended June 30, 2023, class specific expenses were as follows:
| | | | | | | | |
| | | Service and/or
Distribution Fees | | | Transfer Agent
Fees | |
| Aggressive Model Portfolio | | | | | | | | |
| Class I | | | — | | | $ | 26 | |
| Class II | | $ | 481,869 | | | | 28 | |
| Total | | $ | 481,869 | | | $ | 54 | |
| | |
| | | Service and/or
Distribution Fees | | | Transfer Agent
Fees | |
| Moderately Aggressive Model Portfolio | | | | | | | | |
| Class I | | | — | | | $ | 32 | |
| Class II | | $ | 1,628,063 | | | | 28 | |
| Total | | $ | 1,628,063 | | | $ | 60 | |
| | |
| | | Service and/or
Distribution Fees | | | Transfer Agent
Fees | |
| Moderate Model Portfolio | | | | | | | | |
| Class I | | | — | | | $ | 32 | |
| Class II | | $ | 1,370,876 | | | | 28 | |
| Total | | $ | 1,370,876 | | | $ | 60 | |
| | |
| | | Service and/or
Distribution Fees | | | Transfer Agent
Fees | |
| Moderately Conservative Model Portfolio | | | | | | | | |
| Class I | | | — | | | $ | 32 | |
| Class II | | $ | 492,025 | | | | 29 | |
| Total | | $ | 492,025 | | | $ | 61 | |
| | |
| | | Service and/or
Distribution Fees | | | Transfer Agent
Fees | |
| Conservative Model Portfolio | | | | | | | | |
| Class I | | | — | | | $ | 32 | |
| Class II | | $ | 201,621 | | | | 29 | |
| Total | | $ | 201,621 | | | $ | 61 | |
| | |
| Franklin Templeton Model Portfolio Funds 2023 Semi-Annual Report | | 43 |
Notes to financial statements (unaudited) (cont’d)
6. Distributions to shareholders by class
| | | | | | | | |
| | | Six Months Ended
June 30, 2023 | | | Year Ended
December 31, 2022 | |
| Aggressive Model Portfolio | | | | | | | | |
| Net Investment Income: | | | | | | | | |
| Class I | | $ | 4,386 | | | $ | 786,176 | |
| Class II | | | 40,645 | | | | 8,161,253 | |
| Total | | $ | 45,031 | | | $ | 8,947,429 | |
| | |
| Net Realized Gains: | | | | | | | | |
| Class I | | $ | 227,310 | | | $ | 934,678 | |
| Class II | | | 2,106,305 | | | | 11,074,659 | |
| Total | | $ | 2,333,615 | | | $ | 12,009,337 | |
| | |
| | | Six Months Ended
June 30, 2023 | | | Year Ended
December 31, 2022 | |
| Moderately Aggressive Model Portfolio | | | | | | | | |
| Net Investment Income: | | | | | | | | |
| Class I | | $ | 22,196 | | | $ | 691,783 | |
| Class II | | | 807,852 | | | | 28,372,862 | |
| Total | | $ | 830,048 | | | $ | 29,064,645 | |
| | |
| Net Realized Gains: | | | | | | | | |
| Class I | | $ | 157,493 | | | $ | 422,040 | |
| Class II | | | 5,732,053 | | | | 20,185,643 | |
| Total | | $ | 5,889,546 | | | $ | 20,607,683 | |
| | |
| | | Six Months Ended
June 30, 2023 | | | Year Ended
December 31, 2022 | |
| Moderate Model Portfolio | | | | | | | | |
| Net Investment Income: | | | | | | | | |
| Class I | | $ | 5,215 | | | $ | 224,644 | |
| Class II | | | 594,846 | | | | 26,790,506 | |
| Total | | $ | 600,061 | | | $ | 27,015,150 | |
| | |
| Net Realized Gains: | | | | | | | | |
| Class I | | $ | 35,415 | | | $ | 67,179 | |
| Class II | | | 4,039,763 | | | | 8,590,525 | |
| Total | | $ | 4,075,178 | | | $ | 8,657,704 | |
| | |
| | | Six Months Ended
June 30, 2023 | | | Year Ended
December 31, 2022 | |
| Moderately Conservative Model Portfolio | | | | | | | | |
| Net Investment Income: | | | | | | | | |
| Class I | | $ | 6,176 | | | $ | 76,768 | |
| Class II | | | 668,835 | | | | 9,273,252 | |
| Total | | $ | 675,011 | | | $ | 9,350,020 | |
| | |
44 | | Franklin Templeton Model Portfolio Funds 2023 Semi-Annual Report |
| | | | | | | | |
| | | Six Months Ended
June 30, 2023 | | | Year Ended
December 31, 2022 | |
| Moderately Conservative Model Portfolio (cont’d) | | | | | | | | |
| | |
| Net Realized Gains: | | | | | | | | |
| Class I | | | — | | | $ | 7,308 | |
| Class II | | | — | | | | 1,025,132 | |
| Total | | | — | | | $ | 1,032,440 | |
| | |
| | | Six Months Ended
June 30, 2023 | | | Year Ended
December 31, 2022 | |
| Conservative Model Portfolio | | | | | | | | |
| Net Investment Income: | | | | | | | | |
| Class I | | $ | 3,147 | | | $ | 52,344 | |
| Class II | | | 196,859 | | | | 3,797,684 | |
| Total | | $ | 200,006 | | | $ | 3,850,028 | |
| | |
| Net Realized Gains: | | | | | | | | |
| Class I | | | — | | | $ | 2,888 | |
| Class II | | | — | | | | 298,169 | |
| Total | | | — | | | $ | 301,057 | |
7. Shares of beneficial interest
At June 30, 2023, the Trust had an unlimited number of shares of beneficial interest authorized with a par value of $0.00001 per share. The Portfolios have the ability to issue multiple classes of shares. Each class of shares represents an identical interest and has the same rights, except that each class bears certain direct expenses, including those specifically related to the distribution of its shares.
Transactions in shares of each class were as follows:
| | | | | | | | | | | | | | | | |
| | | Six Months Ended
June 30, 2023 | | | Year Ended
December 31, 2022 | |
| | | | |
| | | Shares | | | Amount | | | Shares | | | Amount | |
| Aggressive Model Portfolio | | | | | | | | | | | | | | | | |
| Class I | | | | | | | | | | | | | | | | |
| Shares sold | | | 1,131,369 | | | $ | 13,637,288 | | | | 1,638,784 | | | $ | 20,484,701 | |
| Shares issued on reinvestment | | | 18,481 | | | | 231,378 | | | | 149,338 | | | | 1,717,227 | |
| Shares repurchased | | | (15,038) | | | | (176,448) | | | | (24,534) | | | | (306,730) | |
| Net increase | | | 1,134,812 | | | $ | 13,692,218 | | | | 1,763,588 | | | $ | 21,895,198 | |
| | | | |
| Class II | | | | | | | | | | | | | | | | |
| Shares sold | | | 4,598,559 | | | $ | 55,340,994 | | | | 11,728,502 | | | $ | 148,231,686 | |
| Shares issued on reinvestment | | | 172,031 | | | | 2,146,950 | | | | 1,676,016 | | | | 19,235,912 | |
| Shares repurchased | | | (318,220) | | | | (3,764,612) | | | | (200,897) | | | | (2,297,204) | |
| Net increase | | | 4,452,370 | | | $ | 53,723,332 | | | | 13,203,621 | | | $ | 165,170,394 | |
| | |
| | | Six Months Ended
June 30, 2023 | | | Year Ended
December 31, 2022 | |
| | | | |
| | | Shares | | | Amount | | | Shares | | | Amount | |
| Moderately Aggressive Model Portfolio | | | | | | | | | | | | | | | | |
| Class I | | | | | | | | | | | | | | | | |
| Shares sold | | | 943,101 | | | $ | 10,717,022 | | | | 1,467,097 | | | $ | 17,243,257 | |
| Shares issued on reinvestment | | | 15,335 | | | | 179,416 | | | | 101,982 | | | | 1,111,336 | |
| Shares repurchased | | | (17,764) | | | | (202,473) | | | | (45,306) | | | | (522,859) | |
| Net increase | | | 940,672 | | | $ | 10,693,965 | | | | 1,523,773 | | | $ | 17,831,734 | |
| | |
| Franklin Templeton Model Portfolio Funds 2023 Semi-Annual Report | | 45 |
Notes to financial statements (unaudited) (cont’d)
| | | | | | | | | | | | | | | | |
| | | Six Months Ended
June 30, 2023 | | | Year Ended
December 31, 2022 | |
| | | | |
| | | Shares | | | Amount | | | Shares | | | Amount | |
| Moderately Aggressive Model Portfolio (cont’d) | | | | | | | | | | | | | | | | |
| Class II | | | | | | | | | | | | | | | | |
| Shares sold | | | 11,965,261 | | | $ | 135,844,734 | | | | 34,817,849 | | | $ | 412,315,333 | |
| Shares issued on reinvestment | | | 560,884 | | | | 6,539,905 | | | | 4,469,247 | | | | 48,558,505 | |
| Shares repurchased | | | (371,929) | | | | (4,176,568) | | | | (469,635) | | | | (5,263,009) | |
| Net increase | | | 12,154,216 | | | $ | 138,208,071 | | | | 38,817,461 | | | $ | 455,610,829 | |
| | |
| | | Six Months Ended
June 30, 2023 | | | Year Ended
December 31, 2022 | |
| | | | |
| | | Shares | | | Amount | | | Shares | | | Amount | |
| Moderate Model Portfolio | | | | | | | | | | | | | | | | |
| Class I | | | | | | | | | | | | | | | | |
| Shares sold | | | 260,272 | | | $ | 2,817,632 | | | | 397,974 | | | $ | 4,485,507 | |
| Shares issued on reinvestment | | | 3,667 | | | | 40,411 | | | | 27,848 | | | | 289,794 | |
| Shares repurchased | | | (85,729) | | | | (922,697) | | | | (104,245) | | | | (1,148,103) | |
| Net increase | | | 178,210 | | | $ | 1,935,346 | | | | 321,577 | | | $ | 3,627,198 | |
| | | | |
| Class II | | | | | | | | | | | | | | | | |
| Shares sold | | | 9,542,650 | | | $ | 102,678,523 | | | | 27,787,043 | | | $ | 311,628,612 | |
| Shares issued on reinvestment | | | 422,480 | | | | 4,634,609 | | | | 3,410,146 | | | | 35,381,031 | |
| Shares repurchased | | | (610,190) | | | | (6,586,952) | | | | (296,837) | | | | (3,397,169) | |
| Net increase | | | 9,354,940 | | | $ | 100,726,180 | | | | 30,900,352 | | | $ | 343,612,474 | |
| | |
| | | Six Months Ended
June 30, 2023 | | | Year Ended
December 31, 2022 | |
| | | | |
| | | Shares | | | Amount | | | Shares | | | Amount | |
| Moderately Conservative Model Portfolio | | | | | | | | | | | | | | | | |
| Class I | | | | | | | | | | | | | | | | |
| Shares sold | | | 101,334 | | | $ | 1,044,334 | | | | 136,784 | | | $ | 1,456,645 | |
| Shares issued on reinvestment | | | 583 | | | | 6,090 | | | | 8,224 | | | | 82,528 | |
| Shares repurchased | | | (24,703) | | | | (254,622) | | | | (102,035) | | | | (1,106,794) | |
| Net increase | | | 77,214 | | | $ | 795,802 | | | | 42,973 | | | $ | 432,379 | |
| | | | |
| Class II | | | | | | | | | | | | | | | | |
| Shares sold | | | 2,950,872 | | | $ | 30,358,007 | | | | 9,936,053 | | | $ | 106,656,546 | |
| Shares issued on reinvestment | | | 64,126 | | | | 668,835 | | | | 1,027,237 | | | | 10,298,384 | |
| Shares repurchased | | | (1,100,287) | | | | (11,417,468) | | | | (990,063) | | | | (10,338,673) | |
| Net increase | | | 1,914,711 | | | $ | 19,609,374 | | | | 9,973,227 | | | $ | 106,616,257 | |
| | |
| | | Six Months Ended
June 30, 2023 | | | Year Ended
December 31, 2022 | |
| | | | |
| | | Shares | | | Amount | | | Shares | | | Amount | |
| Conservative Model Portfolio | | | | | | | | | | | | | | | | |
| Class I | | | | | | | | | | | | | | | | |
| Shares sold | | | 84,755 | | | $ | 800,790 | | | | 124,061 | | | $ | 1,195,310 | |
| Shares issued on reinvestment | | | 326 | | | | 3,090 | | | | 5,838 | | | | 53,909 | |
| Shares repurchased | | | (21,902) | | | | (206,072) | | | | (37,923) | | | | (376,765) | |
| Net increase | | | 63,179 | | | $ | 597,808 | | | | 91,976 | | | $ | 872,454 | |
| | | | |
| Class II | | | | | | | | | | | | | | | | |
| Shares sold | | | 1,177,647 | | | $ | 11,086,666 | | | | 5,983,042 | | | $ | 59,045,090 | |
| Shares issued on reinvestment | | | 20,832 | | | | 196,859 | | | | 444,219 | | | | 4,095,853 | |
| Shares repurchased | | | (1,258,618) | | | | (11,882,513) | | | | (2,592,190) | | | | (25,005,557) | |
| Net increase (decrease) | | | (60,139) | | | $ | (598,988) | | | | 3,835,071 | | | $ | 38,135,386 | |
8. Transactions with affiliated companies
As defined by the 1940 Act, an affiliated company is one in which the Portfolios own 5% or more of the outstanding voting securities, or a company which is under common ownership or control with the Portfolios. The following Underlying Funds were considered affiliated companies for all or some portion of the six months ended June 30, 2023. The following transactions were effected in such Underlying Funds for the six months ended June 30, 2023.
| | |
46 | | Franklin Templeton Model Portfolio Funds 2023 Semi-Annual Report |
| | | | | | | | | | | | | | | | | | | | | | | | | | | | | | | | | | | | | | | | |
Aggressive Model Portfolio | | Affiliate
Value at
December 31,
2022 | | | Purchased | | | Sold | | | Realized
Gain (Loss)
from Sale
of Affiliated
Underlying
Funds | | | Income
Distributions
from
Affiliated
Underlying
Funds | | | Capital Gain
Distributions
from
Affiliated
Underlying
Funds | | | Net Increase
(Decrease) in
Unrealized
Appreciation
(Depreciation) | | | Affiliate
Value at
June 30,
2023 | |
| | Cost | | | Shares | | | Proceeds | | | Shares | |
| ClearBridge Variable Appreciation Portfolio, Class I Shares | | $ | 22,065,907 | | | $ | 4,151,315 | | | | 78,531 | | | | — | | | | — | | | | — | | | $ | 4,281 | | | $ | 167,034 | | | $ | 2,974,247 | | | $ | 29,191,469 | |
| | | | | | | | |
Moderately Aggressive Model Portfolio | | Affiliate
Value at
December 31,
2022 | | | Purchased | | | Sold | | | Realized
Gain (Loss)
from Sale
of Affiliated
Underlying
Funds | | | Income
Distributions
from
Affiliated
Underlying
Funds | | | Capital Gain
Distributions
from
Affiliated
Underlying
Funds | | | Net Increase
(Decrease) in
Unrealized
Appreciation
(Depreciation) | | | Affiliate
Value at
June 30,
2023 | |
| | Cost | | | Shares | | | Proceeds | | | Shares | |
| ClearBridge Variable Appreciation Portfolio, Class I Shares | | $ | 69,165,103 | | | $ | 5,598,512 | | | | 108,100 | | | | — | | | | — | | | | — | | | $ | 12,583 | | | $ | 490,928 | | | $ | 8,946,062 | | | $ | 83,709,677 | |
| Western Asset Core Plus VIT Portfolio, Class I Shares | | | 36,252,748 | | | | 13,895,000 | | | | 2,788,062 | | | | — | | | | — | | | | — | | | | — | | | | — | | | | 1,089,866 | | | | 51,237,614 | |
| | | $ | 105,417,851 | | | $ | 19,493,512 | | | | | | | | — | | | | | | | | — | | | $ | 12,583 | | | $ | 490,928 | | | $ | 10,035,928 | | | $ | 134,947,291 | |
| | | | | | | | |
Moderate Model Portfolio | | Affiliate
Value at
December 31,
2022 | | | Purchased | | | Sold | | | Realized
Gain (Loss)
from Sale
of Affiliated
Underlying
Funds | | | Income
Distributions
from
Affiliated
Underlying
Funds | | | Capital Gain
Distributions
from
Affiliated
Underlying
Funds | | | Net Increase
(Decrease) in
Unrealized
Appreciation
(Depreciation) | | | Affiliate
Value at
June 30,
2023 | |
| | Cost | | | Shares | | | Proceeds | | | Shares | |
| ClearBridge Variable Appreciation Portfolio, Class I Shares | | $ | 45,447,191 | | | $ | 3,373,551 | | | | 64,262 | | | | — | | | | — | | | | — | | | $ | 8,211 | | | $ | 320,340 | | | $ | 5,801,477 | | | $ | 54,622,219 | |
| Western Asset Core Plus VIT Portfolio, Class I Shares | | | 49,757,563 | | | | 14,410,000 | | | | 2,900,311 | | | | — | | | | — | | | | — | | | | — | | | | — | | | | 1,553,021 | | | | 65,720,584 | |
| | | $ | 95,204,754 | | | $ | 17,783,551 | | | | | | | | — | | | | | | | | — | | | $ | 8,211 | | | $ | 320,340 | | | $ | 7,354,498 | | | $ | 120,342,803 | |
| | | | | | | | |
Moderately Conservative Model Portfolio | | Affiliate
Value at
December 31,
2022 | | | Purchased | | | Sold | | | Realized
Gain (Loss)
from Sale
of Affiliated
Underlying
Funds | | | Income
Distributions
from
Affiliated
Underlying
Funds | | | Capital Gain
Distributions
from
Affiliated
Underlying
Funds | | | Net Increase
(Decrease) in
Unrealized
Appreciation
(Depreciation) | | | Affiliate
Value at
June 30,
2023 | |
| | Cost | | | Shares | | | Proceeds | | | Shares | |
| ClearBridge Variable Appreciation Portfolio, Class I Shares | | $ | 11,200,877 | | | $ | 1,344,210 | | | | 25,369 | | | $ | 385,000 | | | | 6,823 | | | $ | (30,795) | | | $ | 2,104 | | | $ | 82,105 | | | $ | 1,485,678 | | | $ | 13,614,970 | |
| Western Asset Core Plus VIT Portfolio, Class I Shares | | | 21,777,870 | | | | 6,560,000 | | | | 1,317,004 | | | | — | | | | — | | | | — | | | | — | | | | — | | | | 663,242 | | | | 29,001,112 | |
| | | $ | 32,978,747 | | | $ | 7,904,210 | | | | | | | $ | 385,000 | | | | | | | $ | (30,795) | | | $ | 2,104 | | | $ | 82,105 | | | $ | 2,148,920 | | | $ | 42,616,082 | |
| | | | | | | | |
Conservative Model Portfolio | | Affiliate
Value at
December 31,
2022 | | | Purchased | | | Sold | | | Realized
Gain (Loss)
from Sale
of Affiliated
Underlying
Funds | | | Income
Distributions
from
Affiliated
Underlying
Funds | | | Capital Gain
Distributions
from
Affiliated
Underlying
Funds | | | Net Increase
(Decrease) in
Unrealized
Appreciation
(Depreciation) | | | Affiliate
Value at
June 30,
2023 | |
| | Cost | | | Shares | | | Proceeds | | | Shares | |
| Western Asset Core Plus VIT Portfolio, Class I Shares | | $ | 9,618,015 | | | $ | 1,755,000 | | | | 352,406 | | | $ | 155,000 | | | | 30,794 | | | $ | (4,202) | | | | — | | | | — | | | $ | 301,930 | | | $ | 11,515,743 | |
9. Redemption facility
The Portfolios, together with other U.S. registered and foreign investment funds (collectively, the “Borrowers”) managed by Franklin Resources or its affiliates, are borrowers in a joint syndicated senior unsecured credit facility totaling $2.675 billion (the “Global Credit Facility”). The Global Credit Facility provides a source of funds to the Borrowers for temporary and emergency purposes, including the ability to meet future unanticipated or unusually large redemption requests. Unless renewed, the Global Credit Facility will terminate on February 2, 2024.
| | |
| Franklin Templeton Model Portfolio Funds 2023 Semi-Annual Report | | 47 |
Notes to financial statements (unaudited) (cont’d)
Under the terms of the Global Credit Facility, the Portfolios shall, in addition to interest charged on any borrowings made by the Portfolios and other costs incurred by the Portfolios, pay its share of fees and expenses incurred in connection with the implementation and maintenance of the Global Credit Facility, based upon its relative share of the aggregate net assets of all the Borrowers, including an annual commitment fee of 0.15% based upon the unused portion of the Global Credit Facility. These fees are reflected in the Statement of Operations. The Portfolios did not utilize the Global Credit Facility during the six months ended June 30, 2023.
10. Deferred capital losses
As of December 31, 2022, Moderately Conservative Model Portfolio and Conservative Model Portfolio had deferred capital losses of $1,260,348 and $1,981,572 respectively, which have no expiration date, that will be available to offset future taxable capital gains.
| | |
48 | | Franklin Templeton Model Portfolio Funds 2023 Semi-Annual Report |
Board approval of management and subadvisory agreements (unaudited)
Legg Mason Partners Variable Equity Trust
— Franklin Templeton Aggressive Model Portfolio
At an in-person meeting of the Board of Trustees of Legg Mason Partners Variable Equity Trust (the “Trust”) held on May 3-4, 2023, the Board, including the Trustees who are not considered to be “interested persons” of the Trust (the “Independent Trustees”) under the Investment Company Act of 1940, as amended (the “1940 Act”), approved for an annual period the continuation of the management agreement (the “Management Agreement”) between the Trust and Legg Mason Partners Fund Advisor, LLC (the “Manager”) with respect to Franklin Templeton Aggressive Model Portfolio, a series of the Trust (the “Fund”), and the sub-advisory agreement pursuant to which Franklin Advisers, Inc. (“Franklin Advisers”) provides day-to-day management of the Fund’s portfolio, and the sub-advisory agreement pursuant to which Western Asset Management Company, LLC (“Western Asset” and, together with Franklin Advisers, the “Sub-Advisers”) provides day-to-day management of the Fund’s cash and short-term instruments allocated to it by the Manager. The management agreement and sub-advisory agreements are collectively referred to as the “Agreements.”
Background
The Board received extensive information in advance of the meeting to assist it in its consideration of the Agreements and asked questions and requested additional information from management. Throughout the year the Board (including its various committees) had met with representatives of the Manager and the Subadvisers, and had received information relevant to the renewal of the Agreements. Prior to the meeting the Independent Trustees met with their independent legal counsel to discuss and consider the information provided and submitted questions to management, and they considered the responses provided. The Board received and considered a variety of information about the Manager and the Subadvisers, as well as the management, advisory and sub-advisory arrangements for the Fund and other funds overseen by the Board, certain portions of which are discussed below. The information received and considered by the Board both in conjunction with the May 2023 meeting and throughout the year was both written and oral. The contractual arrangements discussed below are the product of multiple years of review and negotiation and information received and considered by the Board during those years.
The information provided and presentations made to the Board encompassed the Fund and all funds for which the Board has responsibility. The discussion below covers both the advisory and the administrative functions being rendered by the Manager, both of which functions are encompassed by the Management Agreement, as well as the advisory functions rendered by the Subadvisers pursuant to the Sub-Advisory Agreements.
Board approval of management agreement and sub-advisory agreements
The Independent Trustees were advised by separate independent legal counsel throughout the process. Prior to voting, the Independent Trustees received a memorandum from their independent legal counsel discussing the legal standards for their consideration of the proposed continuation of the Agreements. The Independent Trustees also reviewed the proposed continuation of the Management Agreement and the Sub-Advisory Agreements in private sessions with their independent legal counsel at which no representatives of the Manager and Subadvisers were present. The Independent Trustees considered the Management Agreement and each Sub-Advisory Agreement separately in the course of their review. In doing so, they noted the respective roles of the Manager and the Subadvisers in providing services to the Fund.
In approving the Agreements, the Board, including the Independent Trustees, considered a variety of factors, including those factors discussed below. No single factor reviewed by the Board was identified by the Board as the principal factor in determining whether to approve the Management Agreement and the Sub-Advisory Agreements. Each Trustee may have attributed different weight to the various factors in evaluating the Management Agreement and each Sub-Advisory Agreement.
After considering all relevant factors and information, the Board, exercising its business judgment, determined that the continuation of the Agreements was in the best interests of the Fund and its shareholders and approved the continuation of each such agreement for another year.
Nature, extent and quality of the services under the management agreement and sub-advisory agreements
The Board received and considered information regarding the nature, extent and quality of services provided to the Fund by the Manager and the Subadvisers under the Management Agreement and the Sub-Advisory Agreements, respectively,
| | |
| Franklin Templeton Model Portfolio Funds | | 49 |
Board approval of management and subadvisory agreements (unaudited) (cont’d)
during the past year. The Board noted information received at regular meetings throughout the year related to the services rendered by the Manager in its management of the Fund’s affairs and the Manager’s role in coordinating the activities of the Fund’s other service providers. The Board’s evaluation of the services provided by the Manager and the Subadvisers took into account the Board’s knowledge gained as Trustees of funds in the fund complex overseen by the Trustees, including knowledge gained regarding the scope and quality of the investment management and other capabilities of the Manager and the Subadvisers, and the quality of the Manager’s administrative and other services. The Board observed that the scope of services provided by the Manager and the Subadvisers, and of the undertakings required of the Manager and Subadvisers in connection with those services, including maintaining and monitoring their own and the Fund’s compliance programs, liquidity management programs, derivatives risk management programs, cybersecurity programs and valuation-related policies, had expanded over time as a result of regulatory, market and other developments. The Board also noted that on a regular basis it received and reviewed information from the Manager regarding the Fund’s compliance policies and procedures established pursuant to Rule 38a-1 under the 1940 Act. The Board also considered the risks associated with the Fund borne by the Manager and its affiliates (such as entrepreneurial, operational, reputational, litigation and regulatory risk), as well as the Manager’s and each Subadviser’s risk management processes.
The Board reviewed the qualifications, backgrounds and responsibilities of the Manager’s and each Subadviser’s senior personnel and the team of investment professionals primarily responsible for the day-to-day portfolio management of the Fund. The Board also considered, based on its knowledge of the Manager and the Manager’s affiliates, the financial resources of Franklin Resources, Inc., the parent organization of the Manager and the Subadvisers. The Board recognized the importance of having a fund manager with significant resources.
The Board considered the division of responsibilities among the Manager and the Subadvisers and the oversight provided by the Manager. The Board also considered the policies and practices of the Manager and the Subadvisers regarding the selection of brokers and dealers and the execution of portfolio transactions. The Board considered management’s periodic reports to the Board on, among other things, its business plans, any organizational changes and portfolio manager compensation.
The Board received and considered performance information for the Fund as well as for a group of funds (the “Performance Universe”) selected by Broadridge Financial Solutions, Inc. (“Broadridge”), an independent provider of investment company data, based on classifications provided by Thomson Reuters Lipper (“Lipper”). The Board was provided with a description of the methodology used to determine the similarity of the Fund with the funds included in the Performance Universe. It was noted that while the Board found the Broadridge data generally useful, they recognized its limitations, including that the data may vary depending on the end date selected and that the results of the performance comparisons may vary depending on the selection of the peer group and its composition over time. The Board also noted that it had received and discussed with management information throughout the year at periodic intervals comparing the Fund’s performance against its benchmark and against the Fund’s peers. The Board also considered the Fund’s performance in light of overall financial market conditions.
The information comparing the Fund’s performance to that of its Performance Universe, consisting of funds (including the Fund) classified as mixed-asset target allocation aggressive growth funds underlying variable insurance products by Lipper, showed, among other data, that the performance of the Fund’s Class I shares for the one-year period ended December 31, 2022 was above the median performance of the funds in the Performance Universe and the performance for the period since the Fund’s inception (April 15, 2020) through December 31, 2022 was at the median performance of the funds in the Performance Universe.
The Board concluded that, overall, the nature, extent and quality of services provided (and expected to be provided), including performance, under the Management Agreement and each Sub-Advisory Agreement were sufficient for renewal.
Management fees and expense ratios
The Board reviewed and considered the contractual management fee payable by the Fund to the Manager (the “Contractual Management Fee”) and the actual management fees paid by the Fund to the Manager after giving effect to breakpoints and waivers, if any (the “Actual Management Fee”), in light of the nature, extent and quality of the management and sub-advisory services provided by the Manager and the Subadvisers, respectively. The Board also noted that the compensation paid to the Subadvisers is the responsibility and expense of the Manager, not the Fund.
| | |
50 | | Franklin Templeton Model Portfolio Funds |
The Board received and considered information provided by Broadridge comparing the Contractual Management Fee and the Actual Management Fee and the Fund’s total actual expenses with those of funds in both the relevant expense group and a broader group of funds, each selected by Broadridge based on classifications provided by Lipper. It was noted that while the Board found the Broadridge data generally useful, they recognized its limitations, including that the data may vary depending on the selection of the peer group. The Board also reviewed information regarding fees charged by the Manager and/or the Subadvisers to other U.S. clients investing primarily in an asset class similar to that of the Fund, noting that there were none.
The Manager reviewed with the Board the differences in services provided to these different types of accounts, noting that the Fund is provided with certain administrative services, office facilities, and Fund officers (including the Fund’s chief executive, chief financial and chief compliance officers), and that the Manager coordinates and oversees the provision of services to the Fund by other Fund service providers. The Board considered the fee comparisons in light of the differences in management of these different types of accounts, and the differences in the degree of entrepreneurial and other risks borne by the Manager in managing the Fund and in managing other types of accounts.
The Board considered the overall management fee, the fees of each of the Subadvisers and the amount of the management fee retained by the Manager after payment of the subadvisory fees, in each case in light of the services rendered for those amounts. The Board also received an analysis of complex-wide management fees provided by the Manager, which, among other things, set out a framework of fees based on asset classes.
The Board also received and considered information comparing the Fund’s Contractual Management Fee and Actual Management Fee as well as its actual total expense ratio with those of a group of eight mixed-asset target allocation aggressive growth funds of funds underlying variable insurance products (including the Fund) selected by Broadridge to be comparable to the Fund (the “Expense Group”), and a broader group of funds selected by Broadridge consisting of mixed-asset target allocation aggressive growth funds of funds underlying variable insurance products (including the Fund) (the “Expense Universe”). This information showed that the Fund’s Contractual Management Fee was below the median of management fees payable by the funds in the Expense Group and that the Fund’s Actual Management Fee was approximately equivalent to the median of management fees paid by the funds in the Expense Group and approximately equivalent to the median of management fees paid by the funds in the Expense Universe. This information also showed that the Fund’s actual total expense ratio was approximately equivalent to the median of the total expense ratios of the funds in the Expense Group and below the median of the actual total expense ratios of the funds in the Expense Universe, and that the Fund’s underlying fund expenses were approximately equivalent to the median of the underlying fund expenses of the funds in the Expense Group and below the median of the underlying fund expenses of the funds in the Expense Universe.
Taking all of the above into consideration, as well as the factors identified below, the Board determined that the management fee and the subadvisory fees for the Fund were reasonable in light of the nature, extent and quality of the services provided to the Fund under the Management Agreement and the Sub-Advisory Agreements.
Manager profitability
The Board received and considered an analysis of the profitability of the Manager and its affiliates in providing services to the Fund. The Board also received profitability information with respect to the Legg Mason Funds complex as a whole. The Board received information with respect to the Manager’s allocation methodologies used in preparing this profitability data. It was noted that the allocation methodologies had previously been reviewed by an outside consultant. The profitability of the Manager and its affiliates was considered by the Board not excessive in light of the nature, extent and quality of the services provided to the Fund.
Economies of scale
The Board received and discussed information concerning whether the Manager realizes economies of scale with respect to the management of the Fund as the Fund’s assets grow. The Board noted that the Manager had previously agreed to institute breakpoints in the Fund’s Contractual Management Fee, reflecting the potential for reducing the blended rate of the Contractual Management Fee as the Fund grows. The Board considered whether the breakpoint fee structure was a reasonable means of sharing any economies of scale or other efficiencies that might accrue from increases in the Fund’s asset levels. The Board noted that the Fund’s assets had not reached the specified asset level at which a breakpoint to its Contractual Management Fee would be triggered. The Board also noted the size of the Fund.
| | |
| Franklin Templeton Model Portfolio Funds | | 51 |
Board approval of management and subadvisory agreements (unaudited) (cont’d)
The Board determined that the management fee structure for the Fund, including breakpoints, was reasonable.
Other benefits to the manager and the subadvisers
The Board considered other benefits received by the Manager, the Subadvisers and their affiliates as a result of their relationship with the Fund, including the opportunity to offer additional products and services to Fund shareholders, including the appointment of an affiliate of the Manager as the transfer agent of the Fund.
In light of the costs of providing investment management and other services to the Fund and the ongoing commitment of the Manager and the Subadvisers to the Fund, the Board considered that the ancillary benefits that the Manager, the Subadvisers and their affiliates received were reasonable.
| | |
52 | | Franklin Templeton Model Portfolio Funds |
Legg Mason Partners Variable Equity Trust
— Franklin Templeton Moderately Aggressive Model Portfolio
At an in-person meeting of the Board of Trustees of Legg Mason Partners Variable Equity Trust (the “Trust”) held on May 3-4, 2023, the Board, including the Trustees who are not considered to be “interested persons” of the Trust (the “Independent Trustees”) under the Investment Company Act of 1940, as amended (the “1940 Act”), approved for an annual period the continuation of the management agreement (the “Management Agreement”) between the Trust and Legg Mason Partners Fund Advisor, LLC (the “Manager”) with respect to Franklin Templeton Moderately Aggressive Model Portfolio, a series of the Trust (the “Fund”), and the sub-advisory agreement pursuant to which Franklin Advisers, Inc. (“Franklin Advisers”) provides day-to-day management of the Fund’s portfolio, and the sub-advisory agreement pursuant to which Western Asset Management Company, LLC (“Western Asset” and, together with Franklin Advisers, the “Sub-Advisers”) provides day-to-day management of the Fund’s cash and short-term instruments allocated to it by the Manager. The management agreement and sub-advisory agreements are collectively referred to as the “Agreements.”
Background
The Board received extensive information in advance of the meeting to assist it in its consideration of the Agreements and asked questions and requested additional information from management. Throughout the year the Board (including its various committees) had met with representatives of the Manager and the Subadvisers, and had received information relevant to the renewal of the Agreements. Prior to the meeting the Independent Trustees met with their independent legal counsel to discuss and consider the information provided and submitted questions to management, and they considered the responses provided. The Board received and considered a variety of information about the Manager and the Subadvisers, as well as the management, advisory and sub-advisory arrangements for the Fund and other funds overseen by the Board, certain portions of which are discussed below. The information received and considered by the Board both in conjunction with the May 2023 meeting and throughout the year was both written and oral. The contractual arrangements discussed below are the product of multiple years of review and negotiation and information received and considered by the Board during those years.
The information provided and presentations made to the Board encompassed the Fund and all funds for which the Board has responsibility. The discussion below covers both the advisory and the administrative functions being rendered by the Manager, both of which functions are encompassed by the Management Agreement, as well as the advisory functions rendered by the Subadvisers pursuant to the Sub-Advisory Agreements.
Board approval of management agreement and sub-advisory agreements
The Independent Trustees were advised by separate independent legal counsel throughout the process. Prior to voting, the Independent Trustees received a memorandum from their independent legal counsel discussing the legal standards for their consideration of the proposed continuation of the Agreements. The Independent Trustees also reviewed the proposed continuation of the Management Agreement and the Sub-Advisory Agreements in private sessions with their independent legal counsel at which no representatives of the Manager and Subadvisers were present. The Independent Trustees considered the Management Agreement and each Sub-Advisory Agreement separately in the course of their review. In doing so, they noted the respective roles of the Manager and the Subadvisers in providing services to the Fund.
In approving the Agreements, the Board, including the Independent Trustees, considered a variety of factors, including those factors discussed below. No single factor reviewed by the Board was identified by the Board as the principal factor in determining whether to approve the Management Agreement and the Sub-Advisory Agreements. Each Trustee may have attributed different weight to the various factors in evaluating the Management Agreement and each Sub-Advisory Agreement.
After considering all relevant factors and information, the Board, exercising its business judgment, determined that the continuation of the Agreements was in the best interests of the Fund and its shareholders and approved the continuation of each such agreement for another year.
Nature, extent and quality of the services under the management agreement and sub-advisory agreements
The Board received and considered information regarding the nature, extent and quality of services provided to the Fund by the Manager and the Subadvisers under the Management Agreement and the Sub-Advisory Agreements, respectively,
| | |
| Franklin Templeton Model Portfolio Funds | | 53 |
Board approval of management and subadvisory agreements (unaudited) (cont’d)
during the past year. The Board noted information received at regular meetings throughout the year related to the services rendered by the Manager in its management of the Fund’s affairs and the Manager’s role in coordinating the activities of the Fund’s other service providers. The Board’s evaluation of the services provided by the Manager and the Subadvisers took into account the Board’s knowledge gained as Trustees of funds in the fund complex overseen by the Trustees, including knowledge gained regarding the scope and quality of the investment management and other capabilities of the Manager and the Subadvisers, and the quality of the Manager’s administrative and other services. The Board observed that the scope of services provided by the Manager and the Subadvisers, and of the undertakings required of the Manager and Subadvisers in connection with those services, including maintaining and monitoring their own and the Fund’s compliance programs, liquidity management programs, derivatives risk management programs, cybersecurity programs and valuation-related policies, had expanded over time as a result of regulatory, market and other developments. The Board also noted that on a regular basis it received and reviewed information from the Manager regarding the Fund’s compliance policies and procedures established pursuant to Rule 38a-1 under the 1940 Act. The Board also considered the risks associated with the Fund borne by the Manager and its affiliates (such as entrepreneurial, operational, reputational, litigation and regulatory risk), as well as the Manager’s and each Subadviser’s risk management processes.
The Board reviewed the qualifications, backgrounds and responsibilities of the Manager’s and each Subadviser’s senior personnel and the team of investment professionals primarily responsible for the day-to-day portfolio management of the Fund. The Board also considered, based on its knowledge of the Manager and the Manager’s affiliates, the financial resources of Franklin Resources, Inc., the parent organization of the Manager and the Subadvisers. The Board recognized the importance of having a fund manager with significant resources.
The Board considered the division of responsibilities among the Manager and the Subadvisers and the oversight provided by the Manager. The Board also considered the policies and practices of the Manager and the Subadvisers regarding the selection of brokers and dealers and the execution of portfolio transactions. The Board considered management’s periodic reports to the Board on, among other things, its business plans, any organizational changes and portfolio manager compensation.
The Board received and considered performance information for the Fund as well as for a group of funds (the “Performance Universe”) selected by Broadridge Financial Solutions, Inc. (“Broadridge”), an independent provider of investment company data, based on classifications provided by Thomson Reuters Lipper (“Lipper”). The Board was provided with a description of the methodology used to determine the similarity of the Fund with the funds included in the Performance Universe. It was noted that while the Board found the Broadridge data generally useful, they recognized its limitations, including that the data may vary depending on the end date selected and that the results of the performance comparisons may vary depending on the selection of the peer group and its composition over time. The Board also noted that it had received and discussed with management information throughout the year at periodic intervals comparing the Fund’s performance against its benchmark and against the Fund’s peers. The Board also considered the Fund’s performance in light of overall financial market conditions.
The information comparing the Fund’s performance to that of its Performance Universe, consisting of funds (including the Fund) classified as mixed-asset target allocation growth funds underlying variable insurance products by Lipper, showed, among other data, that the performance of the Fund’s Class I shares for the one-year period ended December 31, 2022 was above the median performance of the funds in the Performance Universe and the performance for the period since the Fund’s inception (April 15, 2020) through December 31, 2022 was approximately equivalent to the median performance of the funds in the Performance Universe.
The Board concluded that, overall, the nature, extent and quality of services provided (and expected to be provided), including performance, under the Management Agreement and each Sub-Advisory Agreement were sufficient for renewal.
Management fees and expense ratios
The Board reviewed and considered the contractual management fee payable by the Fund to the Manager (the “Contractual Management Fee”) and the actual management fees paid by the Fund to the Manager after giving effect to breakpoints and waivers, if any (the “Actual Management Fee”), in light of the nature, extent and quality of the management and sub-advisory services provided by the Manager and the Subadvisers, respectively. The Board also noted that the compensation paid to the Subadvisers is the responsibility and expense of the Manager, not the Fund.
| | |
54 | | Franklin Templeton Model Portfolio Funds |
The Board received and considered information provided by Broadridge comparing the Contractual Management Fee and the Actual Management Fee and the Fund’s total actual expenses with those of funds in both the relevant expense group and a broader group of funds, each selected by Broadridge based on classifications provided by Lipper. It was noted that while the Board found the Broadridge data generally useful, they recognized its limitations, including that the data may vary depending on the selection of the peer group. The Board also reviewed information regarding fees charged by the Manager and/or the Subadvisers to other U.S. clients investing primarily in an asset class similar to that of the Fund, noting that there were none.
The Manager reviewed with the Board the differences in services provided to these different types of accounts, noting that the Fund is provided with certain administrative services, office facilities, and Fund officers (including the Fund’s chief executive, chief financial and chief compliance officers), and that the Manager coordinates and oversees the provision of services to the Fund by other Fund service providers. The Board considered the fee comparisons in light of the differences in management of these different types of accounts, and the differences in the degree of entrepreneurial and other risks borne by the Manager in managing the Fund and in managing other types of accounts.
The Board considered the overall management fee, the fees of each of the Subadvisers and the amount of the management fee retained by the Manager after payment of the subadvisory fees, in each case in light of the services rendered for those amounts. The Board also received an analysis of complex-wide management fees provided by the Manager, which, among other things, set out a framework of fees based on asset classes.
The Board also received and considered information comparing the Fund’s Contractual Management Fee and Actual
Management Fee as well as its actual total expense ratio with those of a group of seven mixed-asset target allocation growth funds of funds underlying variable insurance products (including the Fund) selected by Broadridge to be comparable to the Fund (the “Expense Group”), and a broader group of funds selected by Broadridge consisting of mixed-asset target allocation growth funds of funds underlying variable insurance products (including the Fund) (the “Expense Universe”). This information showed that the Fund’s Contractual Management Fee was below the median of management fees payable by the funds in the Expense Group and that the Fund’s Actual Management Fee was approximately equivalent to the median of management fees paid by the funds in the Expense Group and approximately equivalent to the median of management fees paid by the funds in the Expense Universe. This information also showed that the Fund’s actual total expense ratio was at the median of the total expense ratios of the funds in the Expense Group and below the median of the actual total expense ratios of the funds in the Expense Universe, and that the Fund’s underlying fund expenses were at the median of the underlying fund expenses of the funds in the Expense Group and below the median of the underlying fund expenses of the funds in the Expense Universe.
Taking all of the above into consideration, as well as the factors identified below, the Board determined that the management fee and the subadvisory fees for the Fund were reasonable in light of the nature, extent and quality of the services provided to the Fund under the Management Agreement and the Sub-Advisory Agreements.
Manager profitability
The Board received and considered an analysis of the profitability of the Manager and its affiliates in providing services to the Fund. The Board also received profitability information with respect to the Legg Mason Funds complex as a whole. The Board received information with respect to the Manager’s allocation methodologies used in preparing this profitability data. It was noted that the allocation methodologies had previously been reviewed by an outside consultant. The profitability of the Manager and its affiliates was considered by the Board not excessive in light of the nature, extent and quality of the services provided to the Fund.
Economies of scale
The Board received and discussed information concerning whether the Manager realizes economies of scale with respect to the management of the Fund as the Fund’s assets grow. The Board noted that the Manager had previously agreed to institute breakpoints in the Fund’s Contractual Management Fee, reflecting the potential for reducing the blended rate of the Contractual Management Fee as the Fund grows. The Board considered whether the breakpoint fee structure was a reasonable means of sharing any economies of scale or other efficiencies that might accrue from increases in the Fund’s asset levels. The Board noted that the Fund’s assets had reached the specified asset level at which a breakpoint to its Contractual Management Fee would be triggered.
| | |
| Franklin Templeton Model Portfolio Funds | | 55 |
Board approval of management and subadvisory agreements (unaudited) (cont’d)
The Board determined that the management fee structure for the Fund, including breakpoints, was reasonable.
Other benefits to the manager and the subadvisers
The Board considered other benefits received by the Manager, the Subadvisers and their affiliates as a result of their relationship with the Fund, including the opportunity to offer additional products and services to Fund shareholders, including the appointment of an affiliate of the Manager as the transfer agent of the Fund.
In light of the costs of providing investment management and other services to the Fund and the ongoing commitment of the Manager and the Subadvisers to the Fund, the Board considered that the ancillary benefits that the Manager, the Subadvisers and their affiliates received were reasonable.
| | |
56 | | Franklin Templeton Model Portfolio Funds |
Legg Mason Partners Variable Equity Trust
— Franklin Templeton Moderate Model Portfolio
At an in-person meeting of the Board of Trustees of Legg Mason Partners Variable Equity Trust (the “Trust”) held on May 3-4, 2023, the Board, including the Trustees who are not considered to be “interested persons” of the Trust (the “Independent Trustees”) under the Investment Company Act of 1940, as amended (the “1940 Act”), approved for an annual period the continuation of the management agreement (the “Management Agreement”) between the Trust and Legg Mason Partners Fund Advisor, LLC (the “Manager”) with respect to Franklin Templeton Moderate Model Portfolio, a series of the Trust (the “Fund”), and the sub-advisory agreement pursuant to which Franklin Advisers, Inc. (“Franklin Advisers”) provides day-to-day management of the Fund’s portfolio, and the sub-advisory agreement pursuant to which Western Asset Management Company, LLC (“Western Asset” and, together with Franklin Advisers, the “Sub-Advisers”) provides day-to-day management of the Fund’s cash and short-term instruments allocated to it by the Manager. The management agreement and sub-advisory agreements are collectively referred to as the “Agreements.”
Background
The Board received extensive information in advance of the meeting to assist it in its consideration of the Agreements and asked questions and requested additional information from management. Throughout the year the Board (including its various committees) had met with representatives of the Manager and the Subadvisers, and had received information relevant to the renewal of the Agreements. Prior to the meeting the Independent Trustees met with their independent legal counsel to discuss and consider the information provided and submitted questions to management, and they considered the responses provided. The Board received and considered a variety of information about the Manager and the Subadvisers, as well as the management, advisory and sub-advisory arrangements for the Fund and other funds overseen by the Board, certain portions of which are discussed below. The information received and considered by the Board both in conjunction with the May 2023 meeting and throughout the year was both written and oral. The contractual arrangements discussed below are the product of multiple years of review and negotiation and information received and considered by the Board during those years.
The information provided and presentations made to the Board encompassed the Fund and all funds for which the Board has responsibility. The discussion below covers both the advisory and the administrative functions being rendered by the Manager, both of which functions are encompassed by the Management Agreement, as well as the advisory functions rendered by the Subadvisers pursuant to the Sub-Advisory Agreements.
Board approval of management agreement and sub-advisory agreements
The Independent Trustees were advised by separate independent legal counsel throughout the process. Prior to voting, the Independent Trustees received a memorandum from their independent legal counsel discussing the legal standards for their consideration of the proposed continuation of the Agreements. The Independent Trustees also reviewed the proposed continuation of the Management Agreement and the Sub-Advisory Agreements in private sessions with their independent legal counsel at which no representatives of the Manager and Subadvisers were present. The Independent Trustees considered the Management Agreement and each Sub-Advisory Agreement separately in the course of their review. In doing so, they noted the respective roles of the Manager and the Subadvisers in providing services to the Fund.
In approving the Agreements, the Board, including the Independent Trustees, considered a variety of factors, including those factors discussed below. No single factor reviewed by the Board was identified by the Board as the principal factor in determining whether to approve the Management Agreement and the Sub-Advisory Agreements. Each Trustee may have attributed different weight to the various factors in evaluating the Management Agreement and each Sub-Advisory Agreement.
After considering all relevant factors and information, the Board, exercising its business judgment, determined that the continuation of the Agreements was in the best interests of the Fund and its shareholders and approved the continuation of each such agreement for another year.
Nature, extent and quality of the services under the management agreement and sub-advisory agreements
The Board received and considered information regarding the nature, extent and quality of services provided to the Fund by the Manager and the Subadvisers under the Management Agreement and the Sub-Advisory Agreements, respectively,
| | |
| Franklin Templeton Model Portfolio Funds | | 57 |
Board approval of management and subadvisory agreements (unaudited) (cont’d)
during the past year. The Board noted information received at regular meetings throughout the year related to the services rendered by the Manager in its management of the Fund’s affairs and the Manager’s role in coordinating the activities of the Fund’s other service providers. The Board’s evaluation of the services provided by the Manager and the Subadvisers took into account the Board’s knowledge gained as Trustees of funds in the fund complex overseen by the Trustees, including knowledge gained regarding the scope and quality of the investment management and other capabilities of the Manager and the Subadvisers, and the quality of the Manager’s administrative and other services. The Board observed that the scope of services provided by the Manager and the Subadvisers, and of the undertakings required of the Manager and Subadvisers in connection with those services, including maintaining and monitoring their own and the Fund’s compliance programs, liquidity management programs, derivatives risk management programs, cybersecurity programs and valuation-related policies, had expanded over time as a result of regulatory, market and other developments. The Board also noted that on a regular basis it received and reviewed information from the Manager regarding the Fund’s compliance policies and procedures established pursuant to Rule 38a-1 under the 1940 Act. The Board also considered the risks associated with the Fund borne by the Manager and its affiliates (such as entrepreneurial, operational, reputational, litigation and regulatory risk), as well as the Manager’s and each Subadviser’s risk management processes.
The Board reviewed the qualifications, backgrounds and responsibilities of the Manager’s and each Subadviser’s senior personnel and the team of investment professionals primarily responsible for the day-to-day portfolio management of the Fund. The Board also considered, based on its knowledge of the Manager and the Manager’s affiliates, the financial resources of Franklin Resources, Inc., the parent organization of the Manager and the Subadvisers. The Board recognized the importance of having a fund manager with significant resources.
The Board considered the division of responsibilities among the Manager and the Subadvisers and the oversight provided by the Manager. The Board also considered the policies and practices of the Manager and the Subadvisers regarding the selection of brokers and dealers and the execution of portfolio transactions. The Board considered management’s periodic reports to the Board on, among other things, its business plans, any organizational changes and portfolio manager compensation.
The Board received and considered performance information for the Fund as well as for a group of funds (the “Performance Universe”) selected by Broadridge Financial Solutions, Inc. (“Broadridge”), an independent provider of investment company data, based on classifications provided by Thomson Reuters Lipper (“Lipper”). The Board was provided with a description of the methodology used to determine the similarity of the Fund with the funds included in the Performance Universe. It was noted that while the Board found the Broadridge data generally useful, they recognized its limitations, including that the data may vary depending on the end date selected and that the results of the performance comparisons may vary depending on the selection of the peer group and its composition over time. The Board also noted that it had received and discussed with management information throughout the year at periodic intervals comparing the Fund’s performance against its benchmark and against the Fund’s peers. The Board also considered the Fund’s performance in light of overall financial market conditions.
The information comparing the Fund’s performance to that of its Performance Universe, consisting of funds (including the Fund) classified as mixed-asset target allocation moderate funds underlying variable insurance products by Lipper, showed, among other data, that the performance of the Fund’s Class I shares for the one-year period ended December 31, 2022 and the period since the Fund’s inception (April 15, 2020) through December 31, 2022 was above the median performance of the funds in the Performance Universe for each period.
The Board concluded that, overall, the nature, extent and quality of services provided (and expected to be provided), including performance, under the Management Agreement and each Sub-Advisory Agreement were sufficient for renewal.
Management fees and expense ratios
The Board reviewed and considered the contractual management fee payable by the Fund to the Manager (the “Contractual Management Fee”) and the actual management fees paid by the Fund to the Manager after giving effect to breakpoints and waivers, if any (the “Actual Management Fee”), in light of the nature, extent and quality of the management and sub-advisory services provided by the Manager and the Subadvisers, respectively. The Board also noted that the compensation paid to the Subadvisers is the responsibility and expense of the Manager, not the Fund.
| | |
58 | | Franklin Templeton Model Portfolio Funds |
The Board received and considered information provided by Broadridge comparing the Contractual Management Fee and the Actual Management Fee and the Fund’s total actual expenses with those of funds in both the relevant expense group and a broader group of funds, each selected by Broadridge based on classifications provided by Lipper. It was noted that while the Board found the Broadridge data generally useful, they recognized its limitations, including that the data may vary depending on the selection of the peer group. The Board also reviewed information regarding fees charged by the Manager and/or the Subadvisers to other U.S. clients investing primarily in an asset class similar to that of the Fund, noting that there were none.
The Manager reviewed with the Board the differences in services provided to these different types of accounts, noting that the Fund is provided with certain administrative services, office facilities, and Fund officers (including the Fund’s chief executive, chief financial and chief compliance officers), and that the Manager coordinates and oversees the provision of services to the Fund by other Fund service providers. The Board considered the fee comparisons in light of the differences in management of these different types of accounts, and the differences in the degree of entrepreneurial and other risks borne by the Manager in managing the Fund and in managing other types of accounts.
The Board considered the overall management fee, the fees of each of the Subadvisers and the amount of the management fee retained by the Manager after payment of the subadvisory fees, in each case in light of the services rendered for those amounts. The Board also received an analysis of complex-wide management fees provided by the Manager, which, among other things, set out a framework of fees based on asset classes.
The Board also received and considered information comparing the Fund’s Contractual Management Fee and Actual Management Fee as well as its actual total expense ratio with those of a group of seven mixed-asset target allocation moderate funds of funds underlying variable insurance products (including the Fund) selected by Broadridge to be comparable to the Fund (the “Expense Group”), and a broader group of funds selected by Broadridge consisting of mixed-asset target allocation moderate funds of funds underlying variable insurance products (including the Fund) (the “Expense Universe”). This information showed that the Fund’s Contractual Management Fee was below the median of management fees payable by the funds in the Expense Group and that the Fund’s Actual Management Fee was approximately equivalent to the median of management fees paid by the funds in the Expense Group and approximately equivalent to the median of management fees paid by the funds in the Expense Universe. This information also showed that the Fund’s actual total expense ratio was above the median of the total expense ratios of the funds in the Expense Group and approximately equivalent to the median of the actual total expense ratios of the funds in the Expense Universe, that the Fund’s underlying fund expenses were above the median of the underlying fund expenses of the funds in the Expense Group and approximately equivalent to the median of the underlying fund expenses of the funds in the Expense Universe. The Board took into account management’s discussion of the Fund’s expenses and noted the limited size of the Expense Group.
Taking all of the above into consideration, as well as the factors identified below, the Board determined that the management fee and the subadvisory fees for the Fund were reasonable in light of the nature, extent and quality of the services provided to the Fund under the Management Agreement and the Sub-Advisory Agreements.
Manager profitability
The Board received and considered an analysis of the profitability of the Manager and its affiliates in providing services to the Fund. The Board also received profitability information with respect to the Legg Mason Funds complex as a whole. The Board received information with respect to the Manager’s allocation methodologies used in preparing this profitability data. It was noted that the allocation methodologies had previously been reviewed by an outside consultant. The profitability of the Manager and its affiliates was considered by the Board not excessive in light of the nature, extent and quality of the services provided to the Fund.
Economies of scale
The Board received and discussed information concerning whether the Manager realizes economies of scale with respect to the management of the Fund as the Fund’s assets grow. The Board noted that the Manager had previously agreed to institute breakpoints in the Fund’s Contractual Management Fee, reflecting the potential for reducing the blended rate of the Contractual Management Fee as the Fund grows. The Board considered whether the breakpoint fee structure was a reasonable means of sharing any economies of scale or other efficiencies that might accrue from increases in the Fund’s asset levels. The Board noted that the Fund’s assets had reached the specified asset level at which a breakpoint to its Contractual Management Fee would be triggered.
| | |
| Franklin Templeton Model Portfolio Funds | | 59 |
Board approval of management and subadvisory agreements (unaudited) (cont’d)
The Board determined that the management fee structure for the Fund, including breakpoints, was reasonable.
Other benefits to the manager and the subadvisers
The Board considered other benefits received by the Manager, the Subadvisers and their affiliates as a result of their relationship with the Fund, including the opportunity to offer additional products and services to Fund shareholders, including the appointment of an affiliate of the Manager as the transfer agent of the Fund.
In light of the costs of providing investment management and other services to the Fund and the ongoing commitment of the Manager and the Subadvisers to the Fund, the Board considered that the ancillary benefits that the Manager, the Subadvisers and their affiliates received were reasonable.
| | |
60 | | Franklin Templeton Model Portfolio Funds |
Legg Mason Partners Variable Equity Trust
— Franklin Templeton Moderately Conservative Model Portfolio
At an in-person meeting of the Board of Trustees of Legg Mason Partners Variable Equity Trust (the “Trust”) held on May 3-4, 2023, the Board, including the Trustees who are not considered to be “interested persons” of the Trust (the “Independent Trustees”) under the Investment Company Act of 1940, as amended (the “1940 Act”), approved for an annual period the continuation of the management agreement (the “Management Agreement”) between the Trust and Legg Mason Partners Fund Advisor, LLC (the “Manager”) with respect to Franklin Templeton Moderately Conservative Model Portfolio, a series of the Trust (the “Fund”), and the sub-advisory agreement pursuant to which Franklin Advisers, Inc. (“Franklin Advisers”) provides day-to-day management of the Fund’s portfolio, and the sub-advisory agreement pursuant to which Western Asset Management Company, LLC (“Western Asset” and, together with Franklin Advisers, the “Sub-Advisers”) provides day-to-day management of the Fund’s cash and short-term instruments allocated to it by the Manager. The management agreement and sub-advisory agreements are collectively referred to as the “Agreements.”
Background
The Board received extensive information in advance of the meeting to assist it in its consideration of the Agreements and asked questions and requested additional information from management. Throughout the year the Board (including its various committees) had met with representatives of the Manager and the Subadvisers, and had received information relevant to the renewal of the Agreements. Prior to the meeting the Independent Trustees met with their independent legal counsel to discuss and consider the information provided and submitted questions to management, and they considered the responses provided. The Board received and considered a variety of information about the Manager and the Subadvisers, as well as the management, advisory and sub-advisory arrangements for the Fund and other funds overseen by the Board, certain portions of which are discussed below. The information received and considered by the Board both in conjunction with the May 2023 meeting and throughout the year was both written and oral. The contractual arrangements discussed below are the product of multiple years of review and negotiation and information received and considered by the Board during those years.
The information provided and presentations made to the Board encompassed the Fund and all funds for which the Board has responsibility. The discussion below covers both the advisory and the administrative functions being rendered by the Manager, both of which functions are encompassed by the Management Agreement, as well as the advisory functions rendered by the Subadvisers pursuant to the Sub-Advisory Agreements.
Board approval of management agreement and sub-advisory agreements
The Independent Trustees were advised by separate independent legal counsel throughout the process. Prior to voting, the Independent Trustees received a memorandum from their independent legal counsel discussing the legal standards for their consideration of the proposed continuation of the Agreements. The Independent Trustees also reviewed the proposed continuation of the Management Agreement and the Sub-Advisory Agreements in private sessions with their independent legal counsel at which no representatives of the Manager and Subadvisers were present. The Independent Trustees considered the Management Agreement and each Sub-Advisory Agreement separately in the course of their review. In doing so, they noted the respective roles of the Manager and the Subadvisers in providing services to the Fund.
In approving the Agreements, the Board, including the Independent Trustees, considered a variety of factors, including those factors discussed below. No single factor reviewed by the Board was identified by the Board as the principal factor in determining whether to approve the Management Agreement and the Sub-Advisory Agreements. Each Trustee may have attributed different weight to the various factors in evaluating the Management Agreement and each Sub-Advisory Agreement.
After considering all relevant factors and information, the Board, exercising its business judgment, determined that the continuation of the Agreements was in the best interests of the Fund and its shareholders and approved the continuation of each such agreement for another year.
Nature, extent and quality of the services under the management agreement and sub-advisory agreements
The Board received and considered information regarding the nature, extent and quality of services provided to the Fund by the Manager and the Subadvisers under the Management Agreement and the Sub-Advisory Agreements, respectively,
| | |
| Franklin Templeton Model Portfolio Funds | | 61 |
Board approval of management and subadvisory agreements (unaudited) (cont’d)
during the past year. The Board noted information received at regular meetings throughout the year related to the services rendered by the Manager in its management of the Fund’s affairs and the Manager’s role in coordinating the activities of the Fund’s other service providers. The Board’s evaluation of the services provided by the Manager and the Subadvisers took into account the Board’s knowledge gained as Trustees of funds in the fund complex overseen by the Trustees, including knowledge gained regarding the scope and quality of the investment management and other capabilities of the Manager and the Subadvisers, and the quality of the Manager’s administrative and other services. The Board observed that the scope of services provided by the Manager and the Subadvisers, and of the undertakings required of the Manager and Subadvisers in connection with those services, including maintaining and monitoring their own and the Fund’s compliance programs, liquidity management programs, derivatives risk management programs, cybersecurity programs and valuation-related policies, had expanded over time as a result of regulatory, market and other developments. The Board also noted that on a regular basis it received and reviewed information from the Manager regarding the Fund’s compliance policies and procedures established pursuant to Rule 38a-1 under the 1940 Act. The Board also considered the risks associated with the Fund borne by the Manager and its affiliates (such as entrepreneurial, operational, reputational, litigation and regulatory risk), as well as the Manager’s and each Subadviser’s risk management processes.
The Board reviewed the qualifications, backgrounds and responsibilities of the Manager’s and each Subadviser’s senior personnel and the team of investment professionals primarily responsible for the day-to-day portfolio management of the Fund. The Board also considered, based on its knowledge of the Manager and the Manager’s affiliates, the financial resources of Franklin Resources, Inc., the parent organization of the Manager and the Subadvisers. The Board recognized the importance of having a fund manager with significant resources.
The Board considered the division of responsibilities among the Manager and the Subadvisers and the oversight provided by the Manager. The Board also considered the policies and practices of the Manager and the Subadvisers regarding the selection of brokers and dealers and the execution of portfolio transactions. The Board considered management’s periodic reports to the Board on, among other things, its business plans, any organizational changes and portfolio manager compensation.
The Board received and considered performance information for the Fund as well as for a group of funds (the “Performance Universe”) selected by Broadridge Financial Solutions, Inc. (“Broadridge”), an independent provider of investment company data, based on classifications provided by Thomson Reuters Lipper (“Lipper”). The Board was provided with a description of the methodology used to determine the similarity of the Fund with the funds included in the Performance Universe. It was noted that while the Board found the Broadridge data generally useful, they recognized its limitations, including that the data may vary depending on the end date selected and that the results of the performance comparisons may vary depending on the selection of the peer group and its composition over time. The Board also noted that it had received and discussed with management information throughout the year at periodic intervals comparing the Fund’s performance against its benchmark and against the Fund’s peers. The Board also considered the Fund’s performance in light of overall financial market conditions.
The information comparing the Fund’s performance to that of its Performance Universe, consisting of funds (including the Fund) classified as mixed-asset target allocation conservative funds underlying variable insurance products by Lipper, showed, among other data, that the performance of the Fund’s Class I shares for the one-year period ended December 31, 2022 and the period since the Fund’s inception (April 15, 2020) through December 31, 2022 was above the median performance of the funds in the Performance Universe for each period and ranked in the first quintile of the funds in the Performance Universe for the period since the Fund’s inception (April 15, 2020) through December 31, 2022.
The Board concluded that, overall, the nature, extent and quality of services provided (and expected to be provided), including performance, under the Management Agreement and each Sub-Advisory Agreement were sufficient for renewal.
Management fees and expense ratios
The Board reviewed and considered the contractual management fee payable by the Fund to the Manager (the “Contractual Management Fee”) and the actual management fees paid by the Fund to the Manager after giving effect to breakpoints and waivers, if any (the “Actual Management Fee”), in light of the nature, extent and quality of the management and sub-advisory services provided by the Manager and the Subadvisers, respectively. The Board also noted that the compensation paid to the Subadvisers is the responsibility and expense of the Manager, not the Fund.
| | |
62 | | Franklin Templeton Model Portfolio Funds |
The Board received and considered information provided by Broadridge comparing the Contractual Management Fee and the Actual Management Fee and the Fund’s total actual expenses with those of funds in both the relevant expense group and a broader group of funds, each selected by Broadridge based on classifications provided by Lipper. It was noted that while the Board found the Broadridge data generally useful, they recognized its limitations, including that the data may vary depending on the selection of the peer group. The Board also reviewed information regarding fees charged by the Manager and/or the Subadvisers to other U.S. clients investing primarily in an asset class similar to that of the Fund, noting that there were none.
The Manager reviewed with the Board the differences in services provided to these different types of accounts, noting that the Fund is provided with certain administrative services, office facilities, and Fund officers (including the Fund’s chief executive, chief financial and chief compliance officers), and that the Manager coordinates and oversees the provision of services to the Fund by other Fund service providers. The Board considered the fee comparisons in light of the differences in management of these different types of accounts, and the differences in the degree of entrepreneurial and other risks borne by the Manager in managing the Fund and in managing other types of accounts.
The Board considered the overall management fee, the fees of each of the Subadvisers and the amount of the management fee retained by the Manager after payment of the subadvisory fees, in each case in light of the services rendered for those amounts. The Board also received an analysis of complex-wide management fees provided by the Manager, which, among other things, set out a framework of fees based on asset classes.
The Board also received and considered information comparing the Fund’s Contractual Management Fee and Actual Management Fee as well as its actual total expense ratio with those of a group of eight mixed-asset target allocation conservative funds of funds underlying variable insurance products (including the Fund) selected by Broadridge to be comparable to the Fund (the “Expense Group”), and a broader group of funds selected by Broadridge consisting of mixed-asset target allocation conservative funds of funds underlying variable insurance products (including the Fund) (the “Expense Universe”). This information showed that the Fund’s Contractual Management Fee was approximately equivalent to the median of management fees payable by the funds in the Expense Group and that the Fund’s Actual Management Fee was approximately equivalent to the median of management fees paid by the funds in the Expense Group and approximately equivalent to the median of management fees paid by the funds in the Expense Universe. This information also showed that the Fund’s actual total expense ratio was above the median of the total expense ratios of the funds in the Expense Group and above the median of the actual total expense ratios of the funds in the Expense Universe, and that the Fund’s underlying fund expenses were above the median of the underlying fund expenses of the funds in the Expense Group and approximately equivalent to the median of the underlying fund expenses of the funds in the Expense Universe. The Board took into account management’s discussion of the Fund’s expenses and noted the limited size of the Expense Group.
Taking all of the above into consideration, as well as the factors identified below, the Board determined that the management fee and the subadvisory fees for the Fund were reasonable in light of the nature, extent and quality of the services provided to the Fund under the Management Agreement and the Sub-Advisory Agreements.
Manager profitability
The Board received and considered an analysis of the profitability of the Manager and its affiliates in providing services to the Fund. The Board also received profitability information with respect to the Legg Mason Funds complex as a whole. The Board received information with respect to the Manager’s allocation methodologies used in preparing this profitability data. It was noted that the allocation methodologies had previously been reviewed by an outside consultant. The profitability of the Manager and its affiliates was considered by the Board not excessive in light of the nature, extent and quality of the services provided to the Fund.
Economies of scale
The Board received and discussed information concerning whether the Manager realizes economies of scale with respect to the management of the Fund as the Fund’s assets grow. The Board noted that the Manager had previously agreed to institute breakpoints in the Fund’s Contractual Management Fee, reflecting the potential for reducing the blended rate of the Contractual Management Fee as the Fund grows. The Board considered whether the breakpoint fee structure was a reasonable means of sharing any economies of scale or other efficiencies that might accrue from increases in the Fund’s asset levels. The Board noted that the Fund’s assets had not reached the specified asset level at which a breakpoint to its Contractual Management Fee would be triggered. The Board also noted the size of the Fund.
| | |
| Franklin Templeton Model Portfolio Funds | | 63 |
Board approval of management and subadvisory agreements (unaudited) (cont’d)
The Board determined that the management fee structure for the Fund, including breakpoints, was reasonable.
Other benefits to the manager and the subadvisers
The Board considered other benefits received by the Manager, the Subadvisers and their affiliates as a result of their relationship with the Fund, including the opportunity to offer additional products and services to Fund shareholders, including the appointment of an affiliate of the Manager as the transfer agent of the Fund.
In light of the costs of providing investment management and other services to the Fund and the ongoing commitment of the Manager and the Subadvisers to the Fund, the Board considered that the ancillary benefits that the Manager, the Subadvisers and their affiliates received were reasonable.
| | |
64 | | Franklin Templeton Model Portfolio Funds |
Legg Mason Partners Variable Equity Trust
— Franklin Templeton Conservative Model Portfolio
At an in-person meeting of the Board of Trustees of Legg Mason Partners Variable Equity Trust (the “Trust”) held on May 3-4, 2023, the Board, including the Trustees who are not considered to be “interested persons” of the Trust (the “Independent Trustees”) under the Investment Company Act of 1940, as amended (the “1940 Act”), approved for an annual period the continuation of the management agreement (the “Management Agreement”) between the Trust and Legg Mason Partners Fund Advisor, LLC (the “Manager”) with respect to Franklin Templeton Conservative Model Portfolio, a series of the Trust (the “Fund”), and the sub-advisory agreement pursuant to which Franklin Advisers, Inc. (“Franklin Advisers”) provides day-to-day management of the Fund’s portfolio, and the sub-advisory agreement pursuant to which Western Asset Management Company, LLC (“Western Asset” and, together with Franklin Advisers, the “Sub-Advisers”) provides day-to-day management of the Fund’s cash and short-term instruments allocated to it by the Manager. The management agreement and sub-advisory agreements are collectively referred to as the “Agreements.”
Background
The Board received extensive information in advance of the meeting to assist it in its consideration of the Agreements and asked questions and requested additional information from management. Throughout the year the Board (including its various committees) had met with representatives of the Manager and the Subadvisers, and had received information relevant to the renewal of the Agreements. Prior to the meeting the Independent Trustees met with their independent legal counsel to discuss and consider the information provided and submitted questions to management, and they considered the responses provided. The Board received and considered a variety of information about the Manager and the Subadvisers, as well as the management, advisory and sub-advisory arrangements for the Fund and other funds overseen by the Board, certain portions of which are discussed below. The information received and considered by the Board both in conjunction with the May 2023 meeting and throughout the year was both written and oral. The contractual arrangements discussed below are the product of multiple years of review and negotiation and information received and considered by the Board during those years.
The information provided and presentations made to the Board encompassed the Fund and all funds for which the Board has responsibility. The discussion below covers both the advisory and the administrative functions being rendered by the Manager, both of which functions are encompassed by the Management Agreement, as well as the advisory functions rendered by the Subadvisers pursuant to the Sub-Advisory Agreements.
Board approval of management agreement and sub-advisory agreements
The Independent Trustees were advised by separate independent legal counsel throughout the process. Prior to voting, the Independent Trustees received a memorandum from their independent legal counsel discussing the legal standards for their consideration of the proposed continuation of the Agreements. The Independent Trustees also reviewed the proposed continuation of the Management Agreement and the Sub-Advisory Agreements in private sessions with their independent legal counsel at which no representatives of the Manager and Subadvisers were present. The Independent Trustees considered the Management Agreement and each Sub-Advisory Agreement separately in the course of their review. In doing so, they noted the respective roles of the Manager and the Subadvisers in providing services to the Fund.
In approving the Agreements, the Board, including the Independent Trustees, considered a variety of factors, including those factors discussed below. No single factor reviewed by the Board was identified by the Board as the principal factor in determining whether to approve the Management Agreement and the Sub-Advisory Agreements. Each Trustee may have attributed different weight to the various factors in evaluating the Management Agreement and each Sub-Advisory Agreement.
After considering all relevant factors and information, the Board, exercising its business judgment, determined that the continuation of the Agreements was in the best interests of the Fund and its shareholders and approved the continuation of each such agreement for another year.
Nature, extent and quality of the services under the management agreement and sub-advisory agreements
The Board received and considered information regarding the nature, extent and quality of services provided to the Fund by the Manager and the Subadvisers under the Management Agreement and the Sub-Advisory Agreements, respectively,
| | |
| Franklin Templeton Model Portfolio Funds | | 65 |
Board approval of management and subadvisory agreements (unaudited) (cont’d)
during the past year. The Board noted information received at regular meetings throughout the year related to the services rendered by the Manager in its management of the Fund’s affairs and the Manager’s role in coordinating the activities of the Fund’s other service providers. The Board’s evaluation of the services provided by the Manager and the Subadvisers took into account the Board’s knowledge gained as Trustees of funds in the fund complex overseen by the Trustees, including knowledge gained regarding the scope and quality of the investment management and other capabilities of the Manager and the Subadvisers, and the quality of the Manager’s administrative and other services. The Board observed that the scope of services provided by the Manager and the Subadvisers, and of the undertakings required of the Manager and Subadvisers in connection with those services, including maintaining and monitoring their own and the Fund’s compliance programs, liquidity management programs, derivatives risk management programs, cybersecurity programs and valuation-related policies, had expanded over time as a result of regulatory, market and other developments. The Board also noted that on a regular basis it received and reviewed information from the Manager regarding the Fund’s compliance policies and procedures established pursuant to Rule 38a-1 under the 1940 Act. The Board also considered the risks associated with the Fund borne by the Manager and its affiliates (such as entrepreneurial, operational, reputational, litigation and regulatory risk), as well as the Manager’s and each Subadviser’s risk management processes.
The Board reviewed the qualifications, backgrounds and responsibilities of the Manager’s and each Subadviser’s senior personnel and the team of investment professionals primarily responsible for the day-to-day portfolio management of the Fund. The Board also considered, based on its knowledge of the Manager and the Manager’s affiliates, the financial resources of Franklin Resources, Inc., the parent organization of the Manager and the Subadvisers. The Board recognized the importance of having a fund manager with significant resources.
The Board considered the division of responsibilities among the Manager and the Subadvisers and the oversight provided by the Manager. The Board also considered the policies and practices of the Manager and the Subadvisers regarding the selection of brokers and dealers and the execution of portfolio transactions. The Board considered management’s periodic reports to the Board on, among other things, its business plans, any organizational changes and portfolio manager compensation.
The Board received and considered performance information for the Fund as well as for a group of funds (the “Performance Universe”) selected by Broadridge Financial Solutions, Inc. (��Broadridge”), an independent provider of investment company data, based on classifications provided by Thomson Reuters Lipper (“Lipper”). The Board was provided with a description of the methodology used to determine the similarity of the Fund with the funds included in the Performance Universe. It was noted that while the Board found the Broadridge data generally useful, they recognized its limitations, including that the data may vary depending on the end date selected and that the results of the performance comparisons may vary depending on the selection of the peer group and its composition over time. The Board also noted that it had received and discussed with management information throughout the year at periodic intervals comparing the Fund’s performance against its benchmark and against the Fund’s peers. The Board also considered the Fund’s performance in light of overall financial market conditions.
The information comparing the Fund’s performance to that of its Performance Universe, consisting of funds (including the Fund) classified as mixed-asset target allocation conservative funds underlying variable insurance products by Lipper, showed, among other data, that the performance of the Fund’s Class I shares for the one-year period ended December 31, 2022 was above the median performance of the funds in the Performance Universe and the performance for the period since the Fund’s inception (April 15, 2020) through December 31, 2022 was below the median performance of the funds in the Performance Universe. The Board noted the explanations from the Manager and Franklin Advisers concerning the reasons for the Fund’s relative performance versus the peer group for the various periods. The Board also noted that the Fund’s performance was ahead of its benchmark for the quarter ending March 31, 2023.
The Board concluded that, overall, the nature, extent and quality of services provided (and expected to be provided), including performance, under the Management Agreement and each Sub-Advisory Agreement were sufficient for renewal.
Management fees and expense ratios
The Board reviewed and considered the contractual management fee payable by the Fund to the Manager (the “Contractual Management Fee”) and the actual management fees paid by the Fund to the Manager after giving effect to breakpoints and waivers, if any (the “Actual Management Fee”), in light of the nature, extent and quality of the management and sub-advisory services provided by the Manager and the Subadvisers, respectively. The Board also noted that the compensation paid to the Subadvisers is the responsibility and expense of the Manager, not the Fund.
| | |
66 | | Franklin Templeton Model Portfolio Funds |
The Board received and considered information provided by Broadridge comparing the Contractual Management Fee and the Actual Management Fee and the Fund’s total actual expenses with those of funds in both the relevant expense group and a broader group of funds, each selected by Broadridge based on classifications provided by Lipper. It was noted that while the Board found the Broadridge data generally useful, they recognized its limitations, including that the data may vary depending on the selection of the peer group. The Board also reviewed information regarding fees charged by the Manager and/or the Subadvisers to other U.S. clients investing primarily in an asset class similar to that of the Fund, noting that there were none.
The Manager reviewed with the Board the differences in services provided to these different types of accounts, noting that the Fund is provided with certain administrative services, office facilities, and Fund officers (including the Fund’s chief executive, chief financial and chief compliance officers), and that the Manager coordinates and oversees the provision of services to the Fund by other Fund service providers. The Board considered the fee comparisons in light of the differences in management of these different types of accounts, and the differences in the degree of entrepreneurial and other risks borne by the Manager in managing the Fund and in managing other types of accounts.
The Board considered the overall management fee, the fees of each of the Subadvisers and the amount of the management fee retained by the Manager after payment of the subadvisory fees, in each case in light of the services rendered for those amounts. The Board also received an analysis of complex-wide management fees provided by the Manager, which, among other things, set out a framework of fees based on asset classes.
The Board also received and considered information comparing the Fund’s Contractual Management Fee and Actual Management Fee as well as its actual total expense ratio with those of a group of ten mixed-asset target allocation conservative funds of funds underlying variable insurance products (including the Fund) selected by Broadridge to be comparable to the Fund (the “Expense Group”), and a broader group of funds selected by Broadridge consisting of mixed-asset target allocation conservative funds of funds underlying variable insurance products (including the Fund) (the “Expense Universe”). This information showed that the Fund’s Contractual Management Fee was below the median of management fees payable by the funds in the Expense Group and that the Fund’s Actual Management Fee was above the median of management fees paid by the funds in the Expense Group and approximately equivalent to the median of management fees paid by the funds in the Expense Universe. This information also showed that the Fund’s actual total expense ratio was above the median of the total expense ratios of the funds in the Expense Group and above the median of the actual total expense ratios of the funds in the Expense Universe, and that the Fund’s underlying fund expenses were approximately equivalent to the median of the underlying fund expenses of the funds in the Expense Group and at the median of the underlying fund expenses of the funds in the Expense Universe. The Board took into account management’s discussion of the Fund’s expenses and noted the limited size of the Expense Group.
Taking all of the above into consideration, as well as the factors identified below, the Board determined that the management fee and the subadvisory fees for the Fund were reasonable in light of the nature, extent and quality of the services provided to the Fund under the Management Agreement and the Sub-Advisory Agreements.
Manager profitability
The Board received and considered an analysis of the profitability of the Manager and its affiliates in providing services to the Fund. The Board also received profitability information with respect to the Legg Mason Funds complex as a whole. The Board received information with respect to the Manager’s allocation methodologies used in preparing this profitability data. It was noted that the allocation methodologies had previously been reviewed by an outside consultant. The profitability of the Manager and its affiliates was considered by the Board not excessive in light of the nature, extent and quality of the services provided to the Fund.
Economies of scale
The Board received and discussed information concerning whether the Manager realizes economies of scale with respect to the management of the Fund as the Fund’s assets grow. The Board noted that the Manager had previously agreed to institute breakpoints in the Fund’s Contractual Management Fee, reflecting the potential for reducing the blended rate of the
| | |
| Franklin Templeton Model Portfolio Funds | | 67 |
Board approval of management and subadvisory agreements (unaudited) (cont’d)
Contractual Management Fee as the Fund grows. The Board considered whether the breakpoint fee structure was a reasonable means of sharing any economies of scale or other efficiencies that might accrue from increases in the Fund’s asset levels. The Board noted that the Fund’s assets had not reached the specified asset level at which a breakpoint to its Contractual Management Fee would be triggered. The Board also noted the size of the Fund.
The Board determined that the management fee structure for the Fund, including breakpoints, was reasonable.
Other benefits to the manager and the subadvisers
The Board considered other benefits received by the Manager, the Subadvisers and their affiliates as a result of their relationship with the Fund, including the opportunity to offer additional products and services to Fund shareholders, including the appointment of an affiliate of the Manager as the transfer agent of the Fund.
In light of the costs of providing investment management and other services to the Fund and the ongoing commitment of the Manager and the Subadvisers to the Fund, the Board considered that the ancillary benefits that the Manager, the Subadvisers and their affiliates received were reasonable.
| | |
68 | | Franklin Templeton Model Portfolio Funds |
Statement regarding liquidity risk management program (unaudited)
Each of the Franklin Templeton and Legg Mason Funds has adopted and implemented a written Liquidity Risk Management Program (the “LRMP”) as required by Rule 22e-4 under the Investment Company Act of 1940 (the “Liquidity Rule”). The LRMP is designed to assess and manage each Fund’s liquidity risk, which is defined as the risk that the Fund could not meet requests to redeem shares issued by the Fund without significant dilution of remaining investors’ interests in the Fund. In accordance with the Liquidity Rule, the LRMP includes policies and procedures that provide for: (1) assessment, management, and review (no less frequently than annually) of each Fund’s liquidity risk; (2) classification of each Fund’s portfolio holdings into one of four liquidity categories (Highly Liquid, Moderately Liquid, Less Liquid, and Illiquid); (3) for Funds that do not primarily hold assets that are Highly Liquid, establishing and maintaining a minimum percentage of the Fund’s net assets in Highly Liquid investments (called a “Highly Liquid Investment Minimum” or “HLIM”); and (4) prohibiting the Fund’s acquisition of Illiquid investments that would result in the Fund holding more than 15% of its net assets in Illiquid assets. The LRMP also requires reporting to the Securities and Exchange Commission (“SEC”) (on a non-public basis) and to the Board if the Fund’s holdings of Illiquid assets exceed 15% of the Fund’s net assets. Funds with HLIMs must have procedures for addressing HLIM shortfalls, including reporting to the Board and, with respect to HLIM shortfalls lasting more than seven consecutive calendar days, reporting to the SEC (on a non-public basis).
The Director of Liquidity Risk within the Investment Risk Management Group (the “IRMG”) is the appointed Administrator of the LRMP. The IRMG maintains the Investment Liquidity Committee (the “ILC”) to provide oversight and administration of policies and procedures governing liquidity risk management for Franklin Templeton and Legg Mason products and portfolios. The ILC includes representatives from Franklin Templeton’s Risk, Trading, Global Compliance, Legal, Investment Compliance, Investment Operations, Valuation Committee, Product Management and Global Product Strategy.
In assessing and managing each Fund’s liquidity risk, the ILC considers, as relevant, a variety of factors, including the Fund’s investment strategy and the liquidity of its portfolio investments during both normal and reasonably foreseeable stressed conditions; its short and long-term cash flow projections; and its cash holdings and access to other funding sources including the Funds’ interfund lending facility and line of credit. Classification of the Fund’s portfolio holdings in the four liquidity categories is based on the number of days it is reasonably expected to take to convert the investment to cash (for Highly Liquid and Moderately Liquid holdings) or sell or dispose of the investment (for Less Liquid and Illiquid investments), in current market conditions without significantly changing the investment’s market value.
Each Fund primarily holds liquid assets that are defined under the Liquidity Rule as “Highly Liquid Investments,” and therefore is not required to establish an HLIM. Highly Liquid Investments are defined as cash and any investment reasonably expected to be convertible to cash in current market conditions in three business days or less without the conversion to cash significantly changing the market value of the investment.
At meetings of the Funds’ Board of Trustees held in May 2023, the Program Administrator provided a written report to the Board addressing the adequacy and effectiveness of the program for the year ended December 31, 2022. The Program Administrator report concluded that (i.) the LRMP, as adopted and implemented, remains reasonably designed to assess and manage each Fund’s liquidity risk; (ii.) the LRMP, including the Highly Liquid Investment Minimum (“HLIM”) where applicable, was implemented and operated effectively to achieve the goal of assessing and managing each Fund’s liquidity risk; and (iii.) each Fund was able to meet requests for redemption without significant dilution of remaining investors’ interests in the Fund.
| | |
| Franklin Templeton Model Portfolio Funds | | 69 |
Franklin Templeton
Model Portfolio Funds
Trustees
Paul R. Ades
Andrew L. Breech
Althea L. Duersten
Chair
Stephen R. Gross
Susan M. Heilbron
Arnold L. Lehman
Robin J. W. Masters
Ken Miller
G. Peter O’Brien
Thomas F. Schlafly
Jane Trust
Investment manager
Legg Mason Partners Fund Advisor, LLC
Subadviser
Franklin Advisers, Inc.
Distributor
Franklin Distributors, LLC
Custodian
The Bank of New York Mellon
Transfer agent
Franklin Templeton Investor
Services, LLC
3344 Quality Drive
Rancho Cordova, CA 95670-7313
Independent registered public accounting firm
PricewaterhouseCoopers LLP
Baltimore, MD
Franklin Templeton Model Portfolio Funds
Franklin Templeton Aggressive Model Portfolio
Franklin Templeton Moderately Aggressive Model Portfolio
Franklin Templeton Moderate Model Portfolio
Franklin Templeton Moderately Conservative Model Portfolio
Franklin Templeton Conservative Model Portfolio
The Portfolios are separate investment series of Legg Mason Partners Variable Equity Trust, a Maryland statutory trust.
Franklin Templeton Model Portfolio Funds
Legg Mason Funds
620 Eighth Avenue, 47th Floor
New York, NY 10018
The Portfolios file their complete schedule of portfolio holdings with the Securities and Exchange Commission (“SEC”) for the first and third quarters of each fiscal year as an exhibit to their reports on Form N-PORT. The Portfolios’ Forms N-PORT are available on the SEC’s website at www.sec.gov. To obtain information on Form N-PORT, shareholders can call the Portfolios at 877-6LM-FUND/656-3863.
Information on how the Portfolios voted proxies relating to portfolio securities during the prior 12-month period ended June 30th of each year and a description of the policies and procedures that the Portfolios use to determine how to vote proxies related to portfolio transactions are available (1) without charge, upon request, by calling the Portfolios at 877-6LM-FUND/656-3863, (2) at www.franklintempleton.com and (3) on the SEC’s website at www.sec.gov.
This report is submitted for the general information of the shareholders of Franklin Templeton Aggressive Model Portfolio, Franklin Templeton Moderately Aggressive Model Portfolio, Franklin Templeton Moderate Model Portfolio, Franklin Templeton Moderately Conservative Model Portfolio and Franklin Templeton Conservative Model Portfolio. This report is not authorized for distribution to prospective investors in the Portfolios unless preceded or accompanied by a current prospectus.
Investors should consider each Portfolio’s investment objectives, risks, charges and expenses carefully before investing. Each prospectus contains this and other important information about the Portfolios. Please read the prospectuses carefully before investing.
www.franklintempleton.com
© 2023 Franklin Distributors, LLC, Member FINRA/SIPC. All rights reserved.
Legg Mason Funds Privacy and Security Notice
Your Privacy Is Our Priority
Franklin Templeton* is committed to safeguarding your personal information. This notice is designed to provide you with a summary of the non-public personal information Franklin Templeton may collect and maintain about current or former individual investors; our policy regarding the use of that information; and the measures we take to safeguard the information. We do not sell individual investors’ non-public personal information to anyone and only share it as described in this notice.
Information We Collect
When you invest with us, you provide us with your non-public personal information. We collect and use this information to service your accounts and respond to your requests. The non-public personal information we may collect falls into the following categories:
| • | | Information we receive from you or your financial intermediary on applications or other forms, whether we receive the form in writing or electronically. For example, this information may include your name, address, tax identification number, birth date, investment selection, beneficiary information, and your personal bank account information and/or email address if you have provided that information. |
| • | | Information about your transactions and account history with us, or with other companies that are part of Franklin Templeton, including transactions you request on our website or in our app. This category also includes your communications to us concerning your investments. |
| • | | Information we receive from third parties (for example, to update your address if you move, obtain or verify your email address or obtain additional information to verify your identity). |
| • | | Information collected from you online, such as your IP address or device ID and data gathered from your browsing activity and location. (For example, we may use cookies to collect device and browser information so our website recognizes your online preferences and device information.) Our website contains more information about cookies and similar technologies and ways you may limit them. |
| • | | Other general information that we may obtain about you such as demographic information. |
Disclosure Policy
To better service your accounts and process transactions or services you requested, we may share non-public personal information with other Franklin Templeton companies. From time to time we may also send you information about products/services offered by other Franklin Templeton companies although we will not share your non-public personal information with these companies without first offering you the opportunity to prevent that sharing.
We will only share non-public personal information with outside parties in the limited circumstances permitted by law. For example, this includes situations where we need to share information with companies who work on our behalf to service or maintain your account or process transactions you requested, when the disclosure is to companies assisting us with our own marketing efforts, when the disclosure is to a party representing you, or when required by law (for example, in response to legal process). Additionally, we will ensure that any outside companies working on our behalf, or with whom we have joint marketing agreements, are under contractual obligations to protect the confidentiality of your information, and to use it only to provide the services we asked them to perform.
Confidentiality and Security
Our employees are required to follow procedures with respect to maintaining the confidentiality of our investors’ non-public personal information. Additionally, we maintain physical, electronic and procedural safeguards to protect the information. This includes performing ongoing evaluations of our systems containing investor information and making changes when appropriate.
At all times, you may view our current privacy notice on our website at franklintempleton.com or contact us for a copy at (800) 632-2301.
*For purposes of this privacy notice Franklin Templeton shall refer to the following entities:
Fiduciary Trust International of the South (FTIOS), as custodian for individual retirement plans
Franklin Advisers, Inc.
|
| NOT PART OF THE SEMI-ANNUAL REPORT |
Legg Mason Funds Privacy and Security Notice (cont’d)
Franklin Distributors, LLC, including as program manager of the Franklin Templeton 529 College Savings Plan and the NJBEST 529 College Savings Plan
Franklin Mutual Advisers, LLC
Franklin, Templeton and Mutual Series Funds
Franklin Templeton Institutional, LLC
Franklin Templeton Investments Corp., Canada
Franklin Templeton Investments Management, Limited UK
Franklin Templeton Portfolio Advisors, Inc.
Legg Mason Funds serviced by Franklin Templeton Investor Services, LLC
Templeton Asset Management, Limited
Templeton Global Advisors, Limited
Templeton Investment Counsel, LLC
If you are a customer of other Franklin Templeton affiliates and you receive notices from them, you will need to read those
notices separately.
|
| NOT PART OF THE SEMI-ANNUAL REPORT |
www.franklintempleton.com
© 2023 Franklin Distributors, LLC, Member FINRA/SIPC. All rights reserved.
QSIN601966 08/23 SR23-4702
Not applicable.
| ITEM 3. | AUDIT COMMITTEE FINANCIAL EXPERT. |
Not applicable.
| ITEM 4. | PRINCIPAL ACCOUNTANT FEES AND SERVICES. |
Not applicable.
| ITEM 5. | AUDIT COMMITTEE OF LISTED REGISTRANTS. |
Not applicable.
| ITEM 6. | SCHEDULE OF INVESTMENTS. |
Included herein under Item 1.
| ITEM 7. | DISCLOSURE OF PROXY VOTING POLICIES AND PROCEDURES FOR CLOSED-END MANAGEMENT INVESTMENT COMPANIES. |
Not applicable.
| ITEM 8. | PORTFOLIO MANAGERS OF CLOSED-END MANAGEMENT INVESTMENT COMPANIES. |
Not applicable.
| ITEM 9. | PURCHASES OF EQUITY SECURITIES BY CLOSED-END MANAGEMENT INVESTMENT COMPANY AND AFFILIATED PURCHASERS. |
Not applicable.
| ITEM 10. | SUBMISSION OF MATTERS TO A VOTE OF SECURITY HOLDERS. |
Not applicable.
| ITEM 11. | CONTROLS AND PROCEDURES. |
| | (a) | The registrant’s principal executive officer and principal financial officer have concluded that the registrant’s disclosure controls and procedures (as defined in Rule 30a- 3(c) under the Investment Company Act of 1940, as amended (the “1940 Act”)) are effective as of a date within 90 days of the filing date of this report that includes the disclosure required by this paragraph, based on their evaluation of the disclosure controls and procedures required by Rule 30a-3(b) under the 1940 Act and 15d-15(b) under the Securities Exchange Act of 1934. |
| | (b) | There were no changes in the registrant’s internal control over financial reporting (as defined in Rule 30a-3(d) under the 1940 Act) that occurred during the period covered by this report that have materially affected, or are likely to materially affect the registrant’s internal control over financial reporting. |
| ITEM 12. | DISCLOSURE OF SECURITIES LENDING ACTIVITIES FOR CLOSED-END MANAGEMENT INVESTMENT COMPANIES. |
Not applicable
(a) (1) Not applicable.
Exhibit 99.CODE ETH
(a) (2) Certifications pursuant to section 302 of the Sarbanes-Oxley Act of 2002 attached hereto.
Exhibit 99.CERT
(b) Certifications pursuant to Section 906 of the Sarbanes-Oxley Act of 2002 attached hereto.
Exhibit 99.906CERT
SIGNATURES
Pursuant to the requirements of the Securities Exchange Act of 1934 and the Investment Company Act of 1940, the registrant has duly caused this Report to be signed on its behalf by the undersigned, there unto duly authorized.
Legg Mason Partners Variable Equity Trust
| | |
| By: | | /s/ Jane Trust |
| | Jane Trust |
| | Chief Executive Officer |
| |
| Date: | | August 18, 2023 |
Pursuant to the requirements of the Securities Exchange Act of 1934 and the Investment Company Act of 1940, this report has been signed below by the following persons on behalf of the registrant and in the capacities and on the dates indicated.
| | |
| By: | | /s/ Jane Trust |
| | Jane Trust |
| | Chief Executive Officer |
| |
| Date: | | August 18, 2023 |
| | |
| By: | | /s/ Christopher Berarducci |
| | Christopher Berarducci |
| | Principal Financial Officer |
| |
| Date: | | August 18, 2023 |