UNITED STATES
SECURITIES AND EXCHANGE COMMISSION
Washington, D.C. 20549
Form N-CSR/A
CERTIFIED SHAREHOLDER REPORT OF REGISTERED
MANAGEMENT INVESTMENT COMPANIES
Investment Company Act File Number: 811-21148
Eaton Vance New York Municipal Bond Fund
(Exact Name of Registrant as Specified in Charter)
Two International Place, Boston, Massachusetts 02110
(Address of Principal Executive Offices)
Deidre E. Walsh
Two International Place, Boston, Massachusetts 02110
(Name and Address of Agent for Services)
(617) 482-8260
(Registrant’s Telephone Number)
September 30
Date of Fiscal Year End
September 30, 2023
Date of Reporting Period
Explanatory Note:
This Form N-CSR/A amends Form N-CSR of the registrant for the annual reporting period ended September 30, 2023, originally filed with the Securities and Exchange Commission on November 27, 2023 (Accession No. 0001193125-23-283205). The purpose of the amendment is to include the annual report for Eaton Vance New York Municipal Bond Fund that was omitted in error and to remove the September 30, 2023 semiannual report for Eaton Vance National Municipal Opportunities Trust that should not have been included in this filing. Other than the aforementioned revision, this Form N-CSR/A does not reflect events occurring after the filing of the original Form N-CSR, nor modify or update the disclosures therein in any way.
Item 1. Reports to Stockholders
Eaton Vance
Municipal Bond Funds
Annual Report
September 30, 2023
Municipal (EIM) • California (EVM) • New York (ENX)
Commodity Futures Trading Commission Registration. The Commodity Futures Trading Commission (“CFTC”) has adopted regulations that subject registered investment companies and advisers to regulation by the CFTC if a fund invests more than a prescribed level of its assets in certain CFTC-regulated instruments (including futures, certain options and swap agreements) or markets itself as providing investment exposure to such instruments. The investment adviser has claimed an exclusion from the definition of “commodity pool operator” under the Commodity Exchange Act with respect to its management of each Fund. Accordingly, neither the Funds nor the adviser with respect to the operation of the Funds is subject to CFTC regulation. Because of its management of other strategies, the Funds' adviser is registered with the CFTC as a commodity pool operator. The adviser is also registered as a commodity trading advisor.
Fund shares are not insured by the FDIC and are not deposits or other obligations of, or guaranteed by, any depository institution. Shares are subject to investment risks, including possible loss of principal invested.
Annual Report September 30, 2023
Eaton Vance
Municipal Bond Funds
Eaton Vance
Municipal Bond Funds
September 30, 2023
Management’s Discussion of Fund Performance†
Economic and Market Conditions
For municipal bond investors, the 12-month period ended September 30, 2023, was a roller-coaster ride. In the opening month of the period, municipal bonds posted negative returns. Municipal mutual funds experienced net outflows as investors reacted to statements by U.S. Federal Reserve (Fed) officials that the central bank was not done with interest rate hikes and fighting inflation remained its top priority.
However, in the final months of 2022, municipal bond performance rebounded. Despite the Fed’s fourth 0.75% rate hike in November, the Bloomberg Municipal Bond Index (the Index) rose 4.68% -- its best monthly performance since 1986. Drivers of the rally included Fed signals that future rate hikes might be smaller, as well as growing investor demand amid lower supplies of new municipal bond issues.
Although the Fed did deliver a smaller 0.50% rate hike in December 2022, it raised expectations of how high rates might go in 2023. The Index -- helped by attractive yields and limited supply -- nonetheless eked out positive performance in December 2022.
In January 2023, municipal bonds delivered a third straight month of positive returns, driven by the ongoing supply-demand imbalance and the return of net inflows into open-end mutual funds. In February, however, the municipal rally stalled as robust economic reports -- including unexpectedly strong job creation in January -- led investors to fear the Fed might keep rates higher for longer than previously expected.
In March 2023, municipal returns turned positive again. The second- and third-largest bank failures in U.S. history triggered a “flight to quality” that drove municipal bonds to their strongest March performance since 2008, despite the Fed announcing its ninth consecutive rate hike that month.
But from April 2023 through period-end, the municipal bond market experienced another sell-off. Although positive technical factors -- most importantly, demand that exceeded municipal bond supply -- produced brief periods of positive performance, the Fed’s 10th and 11th rate hikes in a little over a year -- in May and July 2023 -- overwhelmed positive technical factors and caused municipal rates to rise and bond prices to fall.
In August and September, above-average supply -- reversing the previous favorable supply-demand imbalance -- plus a typical end-of-summer slowdown in coupon reinvestment, helped reduce demand for municipal bonds even more. And while the Fed left rates unchanged at its September 2023 meeting, investors interpreted the Fed’s message to be that rates would stay higher for longer than investors expected just weeks earlier -- adding further fuel to the municipal bond sell-off.
For the period as a whole, the Index returned 2.66% as coupon payments outpaced declining bond prices. While interest rates rose and bond prices fell across the municipal bond yield curve, the largest rate increases occurred at the long and short ends of the yield curve. U.S. Treasurys, meanwhile, underperformed municipal bonds throughout the yield curve during the period.
Fund Performance
For the 12-month period ended September 30, 2023, Eaton Vance Municipal Bond Fund (the Municipal Fund), Eaton Vance California Municipal Bond Fund (the California Fund), and Eaton Vance New York Municipal Bond Fund (the New York Fund) at net asset value of their common shares (NAV) underperformed the Funds’ benchmark, the Bloomberg Municipal Bond Index (the Index), which returned 2.66%.
The Funds’ managers may employ leverage through residual interest bond financing to enhance tax-exempt income potential. The use of leverage has the effect of achieving additional exposure to the municipal bond market, magnifying a Fund’s exposure to its underlying investments in both up and down markets.
During the period, leverage detracted from the Municipal Fund’s performance versus the Index, contributed to the California Fund’s performance versus the Index, and did not have a significant impact on the New York Fund’s performance versus the Index.
Fund-Specific Results
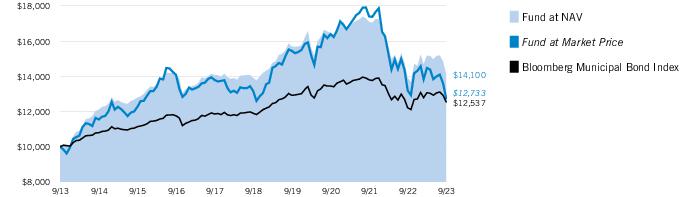
Eaton Vance Municipal Bond Fund returned 1.30% at NAV, underperforming the Index, which returned 2.66% during the period.
Detractors from performance versus the Index included the use of leverage, security selections in bonds with 22 years or more remaining to maturity, and security selections and an underweight position in the transportation sector.
Chief contributors to returns versus the Index included security selections and overweight positions in the special tax sector, in zero-coupon bonds, and in BBB-rated bonds, which generally outperformed higher-rated bonds during the period.
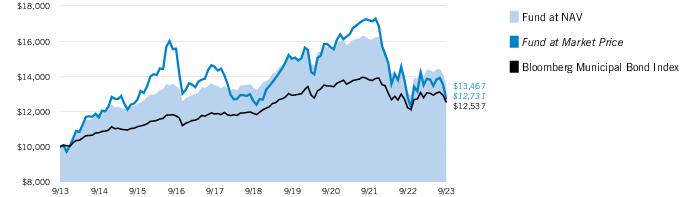
Eaton Vance California Municipal Bond Fund returned 2.50% at NAV, underperforming the Index, which returned 2.66% during the period.
Detractors from performance relative to the Index during the period included security selections and an underweight position in the transportation sector, security selections and an underweight position in A-rated bonds, and security selections in 4% coupon bonds.
In contrast, an overweight position in bonds with 22 years or more remaining to maturity, an overweight position in zero-coupon bonds, and the use of leverage all contributed to the California Fund’s returns relative to the Index during the period.
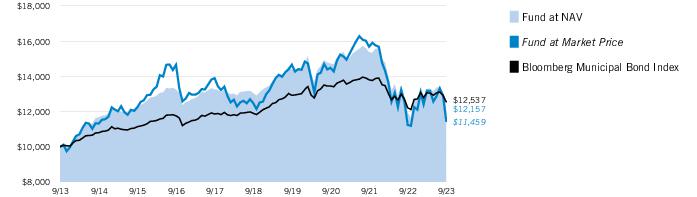
Eaton Vance New York Municipal Bond Fund returned 1.82% at NAV, underperforming the Index, which returned 2.66% during the period.
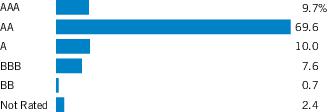
Detractors from performance relative to the Index included security selections and an overweight position in AA-rated bonds, security selections in the transportation sector, and security selections in bonds with 22 years or more remaining to maturity.
In contrast, contributors to the New York Fund’s performance versus the Index included security selections and an overweight position in BBB-rated bonds, an overweight position in 4% coupon bonds, and security selections and an overweight position in bonds with 17-22 years remaining to maturity.
See Endnotes and Additional Disclosures in this report.
Past performance is no guarantee of future results. Returns are historical and are calculated net of management fees and other expenses by determining the percentage change in net asset value (NAV) or market price (as applicable) with all distributions reinvested in accordance with the Fund’s Dividend Reinvestment Plan. Furthermore, returns do not reflect the deduction of taxes that shareholders may have to pay on Fund distributions or upon the sale of Fund shares. Performance at market price will differ from performance at NAV due to variations in the Fund’s market price versus NAV, which may reflect factors such as fluctuations in supply and demand for Fund shares, changes in Fund distributions, shifting market expectations for the Fund’s future returns and distribution rates, and other considerations affecting the trading prices of closed-end funds. Investment return and principal value will fluctuate so that shares, when sold, may be worth more or less than their original cost. Performance for periods less than or equal to one year is cumulative. Performance is for the stated time period only; due to market volatility, current Fund performance may be lower or higher than the quoted return. For performance as of the most recent month-end, please refer to eatonvance.com.
Eaton Vance
Municipal Bond Fund
September 30, 2023
Performance
Portfolio Manager(s) Cynthia J. Clemson and Julie P. Callahan, CFA
| % Average Annual Total Returns1,2 | Inception Date | One Year | Five Years | Ten Years |
| Fund at NAV | 08/30/2002 | 1.30% | 0.27% | 3.49% |
| Fund at Market Price | — | (3.47) | (0.67) | 2.44 |
|
| Bloomberg Municipal Bond Index | — | 2.66% | 1.05% | 2.29% |
| % Premium/Discount to NAV3 | |
| As of period end | (14.99)% |
| Distributions 4 | |
| Total Distributions per share for the period | $0.419 |
| Distribution Rate at NAV | 3.79% |
| Taxable-Equivalent Distribution Rate at NAV | 6.40 |
| Distribution Rate at Market Price | 4.46 |
| Taxable-Equivalent Distribution Rate at Market Price | 7.53 |
| % Total Leverage5 | |
| Residual Interest Bond (RIB) Financing | 32.23% |
Growth of $10,000
This graph shows the change in value of a hypothetical investment of $10,000 in the Fund for the period indicated. For comparison, the same investment is shown in the indicated index.
See Endnotes and Additional Disclosures in this report.
Past performance is no guarantee of future results. Returns are historical and are calculated net of management fees and other expenses by determining the percentage change in net asset value (NAV) or market price (as applicable) with all distributions reinvested in accordance with the Fund’s Dividend Reinvestment Plan. Furthermore, returns do not reflect the deduction of taxes that shareholders may have to pay on Fund distributions or upon the sale of Fund shares. Performance at market price will differ from performance at NAV due to variations in the Fund’s market price versus NAV, which may reflect factors such as fluctuations in supply and demand for Fund shares, changes in Fund distributions, shifting market expectations for the Fund’s future returns and distribution rates, and other considerations affecting the trading prices of closed-end funds. Investment return and principal value will fluctuate so that shares, when sold, may be worth more or less than their original cost. Performance for periods less than or equal to one year is cumulative. Performance is for the stated time period only; due to market volatility, current Fund performance may be lower or higher than the quoted return. For performance as of the most recent month-end, please refer to eatonvance.com.
Eaton Vance
Municipal Bond Fund
September 30, 2023
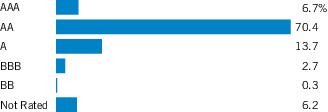
| Credit Quality (% of total investments)1,2 |
Footnotes:
| 1 | For purposes of the Fund’s rating restrictions, ratings are based on Moody’s Investors Service, Inc. (“Moody’s”), S&P Global Ratings (“S&P”) or Fitch Ratings (“Fitch”), as applicable. If securities are rated differently by the ratings agencies, the highest rating is applied. Ratings, which are subject to change, apply to the creditworthiness of the issuers of the underlying securities and not to the Fund or its shares. Credit ratings measure the quality of a bond based on the issuer’s creditworthiness, with ratings ranging from AAA, being the highest, to D, being the lowest based on S&P’s measures. Ratings of BBB or higher by S&P or Fitch (Baa or higher by Moody’s) are considered to be investment-grade quality. Credit ratings are based largely on the ratings agency’s analysis at the time of rating. The rating assigned to any particular security is not necessarily a reflection of the issuer’s current financial condition and does not necessarily reflect its assessment of the volatility of a security’s market value or of the liquidity of an investment in the security. Holdings designated as “Not Rated” (if any) are not rated by the national ratings agencies stated above. |
| 2 | The chart includes the municipal bonds held by a trust that issues residual interest bonds, consistent with the Portfolio of Investments. |
Eaton Vance
California Municipal Bond Fund
September 30, 2023
Performance
Portfolio Manager(s) Trevor G. Smith and Carl A. Thompson, CFA
| % Average Annual Total Returns1,2 | Inception Date | One Year | Five Years | Ten Years |
| Fund at NAV | 08/30/2002 | 2.50% | 0.13% | 3.02% |
| Fund at Market Price | — | (0.56) | 0.20 | 2.44 |
|
| Bloomberg Municipal Bond Index | — | 2.66% | 1.05% | 2.29% |
| % Premium/Discount to NAV3 | |
| As of period end | (15.15)% |
| Distributions 4 | |
| Total Distributions per share for the period | $0.363 |
| Distribution Rate at NAV | 3.66% |
| Taxable-Equivalent Distribution Rate at NAV | 7.98 |
| Distribution Rate at Market Price | 4.32 |
| Taxable-Equivalent Distribution Rate at Market Price | 9.40 |
| % Total Leverage5 | |
| RIB Financing | 30.63% |
Growth of $10,000
This graph shows the change in value of a hypothetical investment of $10,000 in the Fund for the period indicated. For comparison, the same investment is shown in the indicated index.
See Endnotes and Additional Disclosures in this report.
Past performance is no guarantee of future results. Returns are historical and are calculated net of management fees and other expenses by determining the percentage change in net asset value (NAV) or market price (as applicable) with all distributions reinvested in accordance with the Fund’s Dividend Reinvestment Plan. Furthermore, returns do not reflect the deduction of taxes that shareholders may have to pay on Fund distributions or upon the sale of Fund shares. Performance at market price will differ from performance at NAV due to variations in the Fund’s market price versus NAV, which may reflect factors such as fluctuations in supply and demand for Fund shares, changes in Fund distributions, shifting market expectations for the Fund’s future returns and distribution rates, and other considerations affecting the trading prices of closed-end funds. Investment return and principal value will fluctuate so that shares, when sold, may be worth more or less than their original cost. Performance for periods less than or equal to one year is cumulative. Performance is for the stated time period only; due to market volatility, current Fund performance may be lower or higher than the quoted return. For performance as of the most recent month-end, please refer to eatonvance.com.
Eaton Vance
California Municipal Bond Fund
September 30, 2023
| Credit Quality (% of total investments)1,2 |
Footnotes:
| 1 | For purposes of the Fund’s rating restrictions, ratings are based on Moody’s Investors Service, Inc. (“Moody’s”), S&P Global Ratings (“S&P”) or Fitch Ratings (“Fitch”), as applicable. If securities are rated differently by the ratings agencies, the highest rating is applied. Ratings, which are subject to change, apply to the creditworthiness of the issuers of the underlying securities and not to the Fund or its shares. Credit ratings measure the quality of a bond based on the issuer’s creditworthiness, with ratings ranging from AAA, being the highest, to D, being the lowest based on S&P’s measures. Ratings of BBB or higher by S&P or Fitch (Baa or higher by Moody’s) are considered to be investment-grade quality. Credit ratings are based largely on the ratings agency’s analysis at the time of rating. The rating assigned to any particular security is not necessarily a reflection of the issuer’s current financial condition and does not necessarily reflect its assessment of the volatility of a security’s market value or of the liquidity of an investment in the security. Holdings designated as “Not Rated” (if any) are not rated by the national ratings agencies stated above. |
| 2 | The chart includes the municipal bonds held by a trust that issues residual interest bonds, consistent with the Portfolio of Investments. |
Eaton Vance
New York Municipal Bond Fund
September 30, 2023
Performance
Portfolio Manager(s) Christopher J. Eustance, CFA and Paul Metheny, CFA
| % Average Annual Total Returns1,2 | Inception Date | One Year | Five Years | Ten Years |
| Fund at NAV | 08/30/2002 | 1.82% | (1.41)% | 1.97% |
| Fund at Market Price | — | 1.95 | (1.69) | 1.37 |
|
| Bloomberg Municipal Bond Index | — | 2.66% | 1.05% | 2.29% |
| % Premium/Discount to NAV3 | |
| As of period end | (14.62)% |
| Distributions 4 | |
| Total Distributions per share for the period | $0.356 |
| Distribution Rate at NAV | 3.67% |
| Taxable-Equivalent Distribution Rate at NAV | 7.60 |
| Distribution Rate at Market Price | 4.30 |
| Taxable-Equivalent Distribution Rate at Market Price | 8.90 |
| % Total Leverage5 | |
| RIB Financing | 33.09% |
Growth of $10,000
This graph shows the change in value of a hypothetical investment of $10,000 in the Fund for the period indicated. For comparison, the same investment is shown in the indicated index.
See Endnotes and Additional Disclosures in this report.
Past performance is no guarantee of future results. Returns are historical and are calculated net of management fees and other expenses by determining the percentage change in net asset value (NAV) or market price (as applicable) with all distributions reinvested in accordance with the Fund’s Dividend Reinvestment Plan. Furthermore, returns do not reflect the deduction of taxes that shareholders may have to pay on Fund distributions or upon the sale of Fund shares. Performance at market price will differ from performance at NAV due to variations in the Fund’s market price versus NAV, which may reflect factors such as fluctuations in supply and demand for Fund shares, changes in Fund distributions, shifting market expectations for the Fund’s future returns and distribution rates, and other considerations affecting the trading prices of closed-end funds. Investment return and principal value will fluctuate so that shares, when sold, may be worth more or less than their original cost. Performance for periods less than or equal to one year is cumulative. Performance is for the stated time period only; due to market volatility, current Fund performance may be lower or higher than the quoted return. For performance as of the most recent month-end, please refer to eatonvance.com.
Eaton Vance
New York Municipal Bond Fund
September 30, 2023
| Credit Quality (% of total investments)1,2 |
Footnotes:
| 1 | For purposes of the Fund’s rating restrictions, ratings are based on Moody’s Investors Service, Inc. (“Moody’s”), S&P Global Ratings (“S&P”) or Fitch Ratings (“Fitch”), as applicable. If securities are rated differently by the ratings agencies, the highest rating is applied. Ratings, which are subject to change, apply to the creditworthiness of the issuers of the underlying securities and not to the Fund or its shares. Credit ratings measure the quality of a bond based on the issuer’s creditworthiness, with ratings ranging from AAA, being the highest, to D, being the lowest based on S&P’s measures. Ratings of BBB or higher by S&P or Fitch (Baa or higher by Moody’s) are considered to be investment-grade quality. Credit ratings are based largely on the ratings agency’s analysis at the time of rating. The rating assigned to any particular security is not necessarily a reflection of the issuer’s current financial condition and does not necessarily reflect its assessment of the volatility of a security’s market value or of the liquidity of an investment in the security. Holdings designated as “Not Rated” (if any) are not rated by the national ratings agencies stated above. |
| 2 | The chart includes the municipal bonds held by a trust that issues residual interest bonds, consistent with the Portfolio of Investments. |
Eaton Vance
Municipal Bond Funds
September 30, 2023
The Fund's Investment Objectives, Principal Strategies and Principal Risks‡
Eaton Vance Municipal Bond Fund
Investment Objectives. The Fund’s investment objective is to provide current income exempt from federal income tax.
Principal Strategies. During normal market conditions, at least 80% of the Fund’s net assets will be invested in municipal obligations, the interest on which is exempt from federal income tax, including the alternative minimum tax (“AMT”), and that are rated A or better by Moody’s Investors Service, Inc. (“Moody’s”), S&P Global Ratings (“S&P”) or Fitch Ratings (“Fitch”). The foregoing 80% policy may not be changed without shareholder approval. Under normal market conditions, the Fund expects to be fully invested (at least 95% of its net assets) in accordance with its investment objective. The Fund may invest up to 20% of its net assets in municipal obligations rated BBB/Baa or below (or unrated obligations deemed by the Fund’s adviser, Eaton Vance Management (“Eaton Vance”), to be of equivalent quality), provided that not more than 15% of its net assets may be invested in municipal obligations rated below B (or unrated obligations deemed by Eaton Vance to be of equivalent quality) and may invest up to 20% of its net assets in bonds on which the interest is subject to the AMT. When a municipal obligation is split rated (meaning rated in different categories by Moody’s, S&P or Fitch) the Fund will deem the higher rating to apply.
The Fund may purchase derivative instruments, which derive their value from another instrument, security or index, including financial futures contracts and related options, interest rate swaps and forward rate contracts. The Fund also may invest in residual interests of a trust (the “trust”) that holds municipal securities (“RIBs”). These trusts will also issue floating-rate notes to third parties that may be senior to a Fund’s residual interest. The Fund may purchase and sell financial futures contracts and related options, including futures contracts and related options based on various debt securities and securities indices, as well as interest rate swaps and forward rate contracts, to seek to hedge against changes in interest rates or for other risk management purposes.
Except for certain fundamental investment restrictions set forth in the Fund’s registration statement and the 80% requirement pertaining to investment in municipal and insured municipal obligations set forth above, the investment objective and policies of the Fund may be changed by the Board without shareholder action.
The Fund employs leverage to seek opportunities for additional income. Leverage may amplify the effect on the Fund’s NAV of any increase or decrease in the value of investments held. The Fund generally will not use leverage if the investment adviser anticipates that it would result in a lower return to shareholders for any significant amount of time. There can be no assurance that the use of leverage will be successful.
Principal Risks
Market Discount Risk. As with any security, the market value of the common shares may increase or decrease from the amount initially paid for the common shares. The Fund’s common shares have traded both at a premium and at a discount relative to NAV. The shares of closed-end management investment companies frequently trade at a discount from their NAV. This is a risk separate and distinct from the risk that the Fund’s NAV may decrease.
Market Risk. The value of investments held by the Fund may increase or decrease in response to social, economic, political, financial, public health crises or other disruptive events (whether real, expected or perceived) in the U.S. and global markets and include events such as war, natural disasters, epidemics and pandemics, terrorism, conflicts and social unrest. These events may negatively impact broad segments of businesses and populations and may exacerbate pre-existing risks to the Fund. The frequency and magnitude of resulting changes in the value of the Fund’s investments cannot be predicted. Certain securities and other investments held by the Fund may experience increased volatility, illiquidity, or other potentially adverse effects in reaction to changing market conditions. Monetary and/or fiscal actions taken by U.S. or foreign governments to stimulate or stabilize the global economy may not be effective and could lead to high market volatility. No active trading market may exist for certain investments held by the Fund, which may impair the ability of the Fund to sell or to realize the current valuation of such investments in the event of the need to liquidate such assets.
Interest Rate Risk. In general, the value of debt instruments will fluctuate based on changes in interest rates. The value of these securities is likely to increase when interest rates fall and decline when interest rates rise. Duration measures the time-weighted expected cash flows of a fixed-income security, while maturity refers to the amount of time until a fixed-income security matures. Generally, securities with longer durations or maturities are more sensitive to changes in interest rates than securities with shorter durations or maturities, causing them to be more volatile. Conversely, fixed-income securities with shorter durations or maturities will be less volatile but may provide lower returns than fixed-income securities with longer durations or maturities. Because the Fund is managed toward an income objective, it may hold more longer duration or maturity obligations and thereby be more exposed to interest rate risk than municipal income funds that are managed with a greater emphasis on total return. The impact of interest rate changes is significantly less for floating-rate instruments that have relatively short periodic rate resets (e.g., ninety days or less). In a rising interest rate environment, the durations or maturities of income securities that have the ability to be prepaid or called by the issuer may be extended. In a declining interest rate environment, the proceeds from prepaid or maturing instruments may have to be reinvested at a lower interest rate. Certain instruments held by the Fund may pay an interest rate based on the London Interbank Offered Rate (“LIBOR”), which is the average offered rate for various maturities of short-term loans between certain major international banks. LIBOR is used throughout global banking and financial industries to determine interest rates for a variety of financial instruments (such as debt instruments and derivatives) and borrowing arrangements. Upon a determination by regulators to phase out the use of LIBOR, market participants have been transitioning to the use of alternative reference rates over the past few years. As of June 30, 2023, the administrator of LIBOR ceased publishing LIBOR settings. Although the transition process away from LIBOR has become increasingly well defined, the impact on certain debt securities, derivatives and other financial instruments that utilize LIBOR remains uncertain. The phase-out of LIBOR may result in, among other things, increased volatility or illiquidity in markets for instruments that were historically based on LIBOR and changes in the value of such instruments.
See Endnotes and Additional Disclosures in this report.
9
Eaton Vance
Municipal Bond Funds
September 30, 2023
The Fund's Investment Objectives, Principal Strategies and Principal Risks‡ — continued
Credit Risk. Investments in municipal obligations and other debt obligations (referred to below as “debt instruments”) are subject to the risk of non-payment of scheduled principal and interest. Changes in economic conditions or other circumstances may reduce the capacity of the party obligated to make principal and interest payments on such instruments and may lead to defaults. Such non-payments and defaults may reduce the value of Fund shares and income distributions. The value of debt instruments also may decline because of concerns about the issuer’s ability to make principal and interest payments. In addition, the credit ratings of debt instruments may be lowered if the financial condition of the party obligated to make payments with respect to such instruments deteriorates. In order to enforce its rights in the event of a default, bankruptcy or similar situation, the Fund may be required to retain legal or similar counsel, which may increase the Fund’s operating expenses and adversely affect net asset value. Municipal obligations may be insured as to principal and interest payments. If the claims-paying ability or other rating of the insurer is downgraded by a rating agency, the value of such obligations may be negatively affected.
Municipal Obligations Risk. The amount of public information available about municipal obligations is generally less than for corporate equities or bonds, meaning that the investment performance of municipal obligations may be more dependent on the analytical abilities of the investment adviser than stock or corporate bond investments. The secondary market for municipal obligations also tends to be less well-developed and less liquid than many other securities markets, which may limit the Fund’s ability to sell its municipal obligations at attractive prices. The differences between the price at which an obligation can be purchased and the price at which it can be sold may widen during periods of market distress. Less liquid obligations can become more difficult to value and be subject to erratic price movements. The increased presence of nontraditional participants (such as proprietary trading desks of investment banks and hedge funds) or the absence of traditional participants (such as individuals, insurance companies, banks and life insurance companies) in the municipal markets may lead to greater volatility in the markets because non-traditional participants may trade more frequently or in greater volume.
Lower Rated Investments Risk. Investments rated below investment grade and comparable unrated investments (sometimes referred to as “junk”) are speculative because of increased credit risk relative to other fixed income investments. Changes in economic conditions or other circumstances typically have a greater effect on the ability of issuers of lower rated investments to make principal and interest payments than they do on issuers of higher rated investments. An economic downturn generally leads to a higher non-payment rate, and a lower rated investment may lose significant value before a default occurs. Lower rated investments typically are subject to greater price volatility and illiquidity than higher rated investments.
Leverage Risk. Certain Fund transactions may give rise to leverage. Leverage can result from a non-cash exposure to an asset, index, rate or instrument. Leverage can also result from borrowings, issuance of preferred shares or participation in residual interest bond transactions. Leverage can increase both the risk and return potential of the Fund. The use of leverage may cause the Fund to maintain liquid assets or liquidate portfolio positions when it may not be advantageous to do so to satisfy its obligations or to meet segregation requirements. Leverage may cause the Fund’s NAV to be more volatile than if it had not been leveraged, as certain types of leverage may exaggerate the effect of any increase or decrease in the Fund’s portfolio securities. The loss on leveraged investments may substantially exceed the initial investment. The Fund intends to use leverage to provide the holders of common shares with a potentially higher return. To the extent the income derived from securities purchased with funds received from leverage exceeds the cost of leverage, the Fund’s return will be greater than if leverage had not been used. Conversely, if the income from the securities purchased with such funds is not sufficient to cover the cost of leverage, the return to the Fund will be less than if leverage had not been used, and therefore the amount available for distribution to common shareholders as dividends and other distributions will be reduced. In the latter case, the investment adviser in its best judgment may nevertheless determine to maintain the Fund’s leveraged position if it deems such action to be appropriate. The use of leverage through issuance of preferred shares by the Fund creates an opportunity for increased net income, but, at the same time, creates special risks. There can be no assurance that a leveraging strategy will be successful during any period in which it is employed.
Risk of Residual Interest Bonds. The Fund may enter into residual interest bond transactions, which expose the Fund to leverage and greater risk than an investment in a fixed-rate municipal bond. The interest payments that the Fund receives on the residual interest bonds acquired in such transactions vary inversely with short-term interest rates, normally decreasing when short-term rates increase. The value and market for residual interest bonds are volatile and such bonds may have limited liquidity. As required by applicable accounting standards, the Fund records interest expense on its liability with respect to floating-rate notes and also records offsetting interest income in an amount equal to this expense.
Restricted Securities Risk. Unless registered for sale to the public under applicable federal securities law, restricted securities can be sold only in private transactions to qualified purchasers pursuant to an exemption from registration. The sale price realized from a private transaction could be less than the Fund’s purchase price for the restricted security. It may be difficult to identify a qualified purchaser for a restricted security held by the Fund and such security could be deemed illiquid. It may also be more difficult to value such securities.
Derivatives Risk. The Fund’s exposure to derivatives involves risks different from, or possibly greater than, the risks associated with investing directly in securities and other investments. The use of derivatives can lead to losses because of adverse movements in the price or value of the security, instrument, index, currency, commodity, economic indicator or event underlying a derivative (“reference instrument”), due to failure of a counterparty or due to tax or regulatory constraints. Derivatives may create leverage in the Fund, which represents a non-cash exposure to the underlying reference instrument. Leverage can increase both the risk and return potential of the Fund. Derivatives risk may be more significant when derivatives are used to enhance return or as a substitute for a cash investment position, rather than solely to hedge the risk of a position held by the Fund. Use of derivatives involves the exercise of specialized skill and judgment, and a transaction may be unsuccessful in whole or in part because of market behavior or unexpected events. Changes in the value of a derivative (including one used for hedging) may not correlate perfectly with the underlying reference instrument. Derivative instruments traded in over-the-counter markets may be difficult to value, may be illiquid, and may be subject to wide swings in valuation caused by changes in the
See Endnotes and Additional Disclosures in this report.
10
Eaton Vance
Municipal Bond Funds
September 30, 2023
The Fund's Investment Objectives, Principal Strategies and Principal Risks‡ — continued
value of the underlying reference instrument. If a derivative’s counterparty is unable to honor its commitments, the value of Fund shares may decline and the Fund could experience delays in (or be unable to achieve) the return of collateral or other assets held by the counterparty. The loss on derivative transactions may substantially exceed the initial investment. A derivative investment also involves the risks relating to the reference instrument underlying the investment.
Liquidity Risk. The Fund is exposed to liquidity risk when trading volume, lack of a market maker or trading partner, large position size, market conditions, or legal restrictions impair its ability to sell particular investments or to sell them at advantageous market prices. Consequently, the Fund may have to accept a lower price to sell an investment or continue to hold it or keep the position open, sell other investments to raise cash or abandon an investment opportunity, any of which could have a negative effect on the Fund’s performance. These effects may be exacerbated during times of financial or political stress.
Sector and Geographic Risk. Because the Fund may invest a significant portion of its assets in obligations issued in a particular state and/or U.S. territories and in certain types of municipal or other obligations and/or in certain sectors, the value of Fund shares may be affected by events that adversely affect that state, U.S. territory, sector or type of obligation and may fluctuate more than that of a fund that invests more broadly. General obligation bonds issued by municipalities are adversely affected by economic downturns and any resulting decline in tax revenues.
Recent Market Conditions. The outbreak of COVID-19 and efforts to contain its spread have resulted in closing borders, enhanced health screenings, changes to healthcare service preparation and delivery, quarantines, cancellations, disruptions to supply chains and customer activity, as well as general concern and uncertainty. The impact of this coronavirus, and the effects of other infectious illness outbreaks, epidemics or pandemics, may be short term or may continue for an extended period of time. Health crises caused by outbreaks of disease, such as the coronavirus outbreak, may exacerbate other pre-existing political, social and economic risks and disrupt normal market conditions and operations. For example, a global pandemic or other widespread health crisis could cause substantial market volatility and exchange trading suspensions and closures. In addition, the increasing interconnectedness of markets around the world may result in many markets being affected by events or conditions in a single country or region or events affecting a single or small number of issuers. The coronavirus outbreak and public and private sector responses thereto have led to large portions of the populations of many countries working from home for indefinite periods of time, temporary or permanent layoffs, disruptions in supply chains, and lack of availability of certain goods. The impact of such responses could adversely affect the information technology and operational systems upon which the Fund and the Fund’s service providers rely, and could otherwise disrupt the ability of the employees of the Fund’s service providers to perform critical tasks relating to the Fund. Any such impact could adversely affect the Fund’s performance, or the performance of the securities in which the Fund invests and may lead to losses on your investment in the Fund.
Risks Associated with Active Management. The success of the Fund’s investment strategy depends on portfolio management’s successful application of analytical skills and investment judgment. Active management involves subjective decisions and there is no guarantee that such decisions will produce the desired results or expected returns.
Tax Risk. Income from tax-exempt municipal obligations could be declared taxable because of changes in tax laws, adverse interpretations by the relevant taxing authority or the non-compliant conduct of the issuer of an obligation.
Tax-Sensitive Investing Risk. The Fund may hold a security in order to achieve more favorable tax-treatment or to sell a security in order to create tax losses. The Fund’s utilization of various tax-management techniques may be curtailed or eliminated by tax legislation, regulation or interpretations. The Fund may not be able to minimize taxable distributions to shareholders and a portion of the Fund’s distributions may be taxable.
Cybersecurity Risk. With the increased use of technologies by Fund service providers to conduct business, such as the Internet, the Fund is susceptible to operational, information security and related risks. In general, cyber incidents can result from deliberate attacks or unintentional events. Cybersecurity failures by or breaches of the Fund’s investment adviser or administrator and other service providers (including, but not limited to, the custodian or transfer agent), and the issuers of securities in which the Fund invests, may disrupt and otherwise adversely affect their business operations. This may result in financial losses to the Fund, impede Fund trading, interfere with the Fund’s ability to calculate its net asset value, interfere with Fund shareholders’ ability to transact business or cause violations of applicable privacy and other laws, regulatory fines, penalties, reputational damage, reimbursement or other compensation costs, or additional compliance costs.
Inflation Risk. Inflation risk is the risk that the value of assets or income from investment will be worth less in the future as inflation decreases the value of money. As inflation increases, the real value of Fund shares and distributions thereon can decline.
Counterparty Risk. Changes in the credit quality of the companies that serve as the Fund’s counterparties with respect to derivatives or other transactions supported by another party’s credit, may affect the value of those instruments. Certain entities that have served as counterparties in the markets for these transactions have incurred significant losses and financial hardships including bankruptcy as a result of exposure to sub-prime mortgages and other lower quality credit investments that have experienced defaults or otherwise suffered extreme credit deterioration. As a result, such hardships have reduced these entities’ capital and called into question their continued ability to perform their obligations under such transactions. By using such derivatives or other transactions, the Fund assumes the risk that its counterparties could experience similar financial hardships. In the event of insolvency of a counterparty, the Fund may sustain losses or be unable to liquidate a derivatives position. The counterparty risk for cleared derivatives is generally lower than for uncleared
See Endnotes and Additional Disclosures in this report.
11
Eaton Vance
Municipal Bond Funds
September 30, 2023
The Fund's Investment Objectives, Principal Strategies and Principal Risks‡ — continued
OTC derivative transactions since generally a clearing organization becomes substituted for each counterparty to a cleared derivative contract and, in effect, guarantees the parties’ performance under the contract as each party to a trade looks only to the clearing house for performance of financial obligations. However, there can be no assurance that the clearing house, or its members, will satisfy its obligations to the Fund.
Anti-Takeover Provisions. The Fund's Declaration of Trust contains provisions that could have the effect of limiting the ability of other persons or entities to acquire control of the Fund or to change the composition of its Board.
General Fund Investing Risks. The Fund is not a complete investment program and there is no guarantee that the Fund will achieve its investment objective. It is possible to lose money by investing in the Fund. An investment in the Fund is not a deposit in a bank and is not insured or guaranteed by the Federal Deposit Insurance Corporation or any other government agency.
Eaton Vance California Municipal Bond Fund
Investment Objectives. The Fund’s investment objective is to provide current income exempt from federal income tax.
Principal Strategies. During normal market conditions, at least 80% of the Fund’s net assets will be invested in municipal obligations, the interest on which is exempt from federal income tax, including the alternative minimum tax (“AMT”) and California personal income taxes, and that are rated A or better by Moody’s Investors Service, Inc. (“Moody’s”), S&P Global Ratings (“S&P”) or Fitch Ratings (“Fitch”). The foregoing 80% policy may not be changed without shareholder approval. Under normal market conditions, the Fund expects to be fully invested (at least 95% of its net assets) in accordance with its investment objective. The Fund may invest up to 20% of its net assets in municipal obligations rated BBB/Baa or below (or unrated obligations deemed by the Fund’s adviser, Eaton Vance Management (“Eaton Vance”), to be of equivalent quality), provided that not more than 15% of its net assets may be invested in municipal obligations rated below B (or unrated obligations deemed by Eaton Vance to be of equivalent quality) and may invest up to 20% of its net assets in bonds on which the interest is subject to the AMT. When a municipal obligation is split rated (meaning rated in different categories by Moody’s, S&P or Fitch) the Fund will deem the higher rating to apply.
The Fund may purchase derivative instruments, which derive their value from another instrument, security or index, including financial futures contracts and related options, interest rate swaps and forward rate contracts. The Fund also may invest in residual interests of a trust (the “trust”) that holds municipal securities (“RIBs”). These trusts will also issue floating-rate notes to third parties that may be senior to a Fund’s residual interest. The Fund may purchase and sell financial futures contracts and related options, including futures contracts and related options based on various debt securities and securities indices, as well as interest rate swaps and forward rate contracts, to seek to hedge against changes in interest rates or for other risk management purposes.
Except for certain fundamental investment restrictions set forth in the Fund’s registration statement and the 80% requirement pertaining to investment in municipal and insured municipal obligations set forth above, the investment objective and policies of the Fund may be changed by the Board without shareholder action.
The Fund employs leverage to seek opportunities for additional income. Leverage may amplify the effect on the Fund’s NAV of any increase or decrease in the value of investments held. The Fund generally will not use leverage if the investment adviser anticipates that it would result in a lower return to shareholders for any significant amount of time. There can be no assurance that the use of leverage will be successful.
Principal Risks
Market Discount Risk. As with any security, the market value of the common shares may increase or decrease from the amount initially paid for the common shares. The Fund’s common shares have traded both at a premium and at a discount relative to NAV. The shares of closed-end management investment companies frequently trade at a discount from their NAV. This is a risk separate and distinct from the risk that the Fund’s NAV may decrease.
Market Risk. The value of investments held by the Fund may increase or decrease in response to social, economic, political, financial, public health crises or other disruptive events (whether real, expected or perceived) in the U.S. and global markets and include events such as war, natural disasters, epidemics and pandemics, terrorism, conflicts and social unrest. These events may negatively impact broad segments of businesses and populations and may exacerbate pre-existing risks to the Fund. The frequency and magnitude of resulting changes in the value of the Fund’s investments cannot be predicted. Certain securities and other investments held by the Fund may experience increased volatility, illiquidity, or other potentially adverse effects in reaction to changing market conditions. Monetary and/or fiscal actions taken by U.S. or foreign governments to stimulate or stabilize the global economy may not be effective and could lead to high market volatility. No active trading market may exist for certain investments held by the Fund, which may impair the ability of the Fund to sell or to realize the current valuation of such investments in the event of the need to liquidate such assets.
Interest Rate Risk. In general, the value of debt instruments will fluctuate based on changes in interest rates. The value of these securities is likely to increase when interest rates fall and decline when interest rates rise. Duration measures the time-weighted expected cash flows of a fixed-income security, while maturity refers to the amount of time until a fixed-income security matures. Generally, securities with longer durations or maturities are more sensitive to changes in interest rates than securities with shorter durations or maturities, causing them to be more volatile. Conversely, fixed-income securities with shorter durations or maturities will be less volatile but may provide lower returns than fixed-income securities with longer durations or maturities. Because the Fund is managed toward an income objective, it may hold more longer duration or maturity obligations and thereby be more exposed to interest rate risk than municipal income funds that are managed with a greater emphasis on total return. The impact of interest rate changes is significantly less for
See Endnotes and Additional Disclosures in this report.
12
Eaton Vance
Municipal Bond Funds
September 30, 2023
The Fund's Investment Objectives, Principal Strategies and Principal Risks‡ — continued
floating-rate instruments that have relatively short periodic rate resets (e.g., ninety days or less). In a rising interest rate environment, the durations or maturities of income securities that have the ability to be prepaid or called by the issuer may be extended. In a declining interest rate environment, the proceeds from prepaid or maturing instruments may have to be reinvested at a lower interest rate. Certain instruments held by the Fund may pay an interest rate based on the London Interbank Offered Rate (“LIBOR”), which is the average offered rate for various maturities of short-term loans between certain major international banks. LIBOR is used throughout global banking and financial industries to determine interest rates for a variety of financial instruments (such as debt instruments and derivatives) and borrowing arrangements. Upon a determination by regulators to phase out the use of LIBOR, market participants have been transitioning to the use of alternative reference rates over the past few years. As of June 30, 2023, the administrator of LIBOR ceased publishing LIBOR settings. Although the transition process away from LIBOR has become increasingly well defined, the impact on certain debt securities, derivatives and other financial instruments that utilize LIBOR remains uncertain. The phase-out of LIBOR may result in, among other things, increased volatility or illiquidity in markets for instruments that were historically based on LIBOR and changes in the value of such instruments.
Credit Risk. Investments in municipal obligations and other debt obligations (referred to below as “debt instruments”) are subject to the risk of non-payment of scheduled principal and interest. Changes in economic conditions or other circumstances may reduce the capacity of the party obligated to make principal and interest payments on such instruments and may lead to defaults. Such non-payments and defaults may reduce the value of Fund shares and income distributions. The value of debt instruments also may decline because of concerns about the issuer’s ability to make principal and interest payments. In addition, the credit ratings of debt instruments may be lowered if the financial condition of the party obligated to make payments with respect to such instruments deteriorates. In order to enforce its rights in the event of a default, bankruptcy or similar situation, the Fund may be required to retain legal or similar counsel, which may increase the Fund’s operating expenses and adversely affect net asset value. Municipal obligations may be insured as to principal and interest payments. If the claims-paying ability or other rating of the insurer is downgraded by a rating agency, the value of such obligations may be negatively affected.
Municipal Obligations Risk. The amount of public information available about municipal obligations is generally less than for corporate equities or bonds, meaning that the investment performance of municipal obligations may be more dependent on the analytical abilities of the investment adviser than stock or corporate bond investments. The secondary market for municipal obligations also tends to be less well-developed and less liquid than many other securities markets, which may limit the Fund’s ability to sell its municipal obligations at attractive prices. The differences between the price at which an obligation can be purchased and the price at which it can be sold may widen during periods of market distress. Less liquid obligations can become more difficult to value and be subject to erratic price movements. The increased presence of nontraditional participants (such as proprietary trading desks of investment banks and hedge funds) or the absence of traditional participants (such as individuals, insurance companies, banks and life insurance companies) in the municipal markets may lead to greater volatility in the markets because non-traditional participants may trade more frequently or in greater volume.
Lower Rated Investments Risk. Investments rated below investment grade and comparable unrated investments (sometimes referred to as “junk”) are speculative because of increased credit risk relative to other fixed income investments. Changes in economic conditions or other circumstances typically have a greater effect on the ability of issuers of lower rated investments to make principal and interest payments than they do on issuers of higher rated investments. An economic downturn generally leads to a higher non-payment rate, and a lower rated investment may lose significant value before a default occurs. Lower rated investments typically are subject to greater price volatility and illiquidity than higher rated investments.
Leverage Risk. Certain Fund transactions may give rise to leverage. Leverage can result from a non-cash exposure to an asset, index, rate or instrument. Leverage can also result from borrowings, issuance of preferred shares or participation in residual interest bond transactions. Leverage can increase both the risk and return potential of the Fund. The use of leverage may cause the Fund to maintain liquid assets or liquidate portfolio positions when it may not be advantageous to do so to satisfy its obligations or to meet segregation requirements. Leverage may cause the Fund’s NAV to be more volatile than if it had not been leveraged, as certain types of leverage may exaggerate the effect of any increase or decrease in the Fund’s portfolio securities. The loss on leveraged investments may substantially exceed the initial investment. The Fund intends to use leverage to provide the holders of common shares with a potentially higher return. To the extent the income derived from securities purchased with funds received from leverage exceeds the cost of leverage, the Fund’s return will be greater than if leverage had not been used. Conversely, if the income from the securities purchased with such funds is not sufficient to cover the cost of leverage, the return to the Fund will be less than if leverage had not been used, and therefore the amount available for distribution to common shareholders as dividends and other distributions will be reduced. In the latter case, the investment adviser in its best judgment may nevertheless determine to maintain the Fund’s leveraged position if it deems such action to be appropriate. The use of leverage through issuance of preferred shares by the Fund creates an opportunity for increased net income, but, at the same time, creates special risks. There can be no assurance that a leveraging strategy will be successful during any period in which it is employed.
Risk of Residual Interest Bonds. The Fund may enter into residual interest bond transactions, which expose the Fund to leverage and greater risk than an investment in a fixed-rate municipal bond. The interest payments that the Fund receives on the residual interest bonds acquired in such transactions vary inversely with short-term interest rates, normally decreasing when short-term rates increase. The value and market for residual interest bonds are volatile and such bonds may have limited liquidity. As required by applicable accounting standards, the Fund records interest expense on its liability with respect to floating-rate notes and also records offsetting interest income in an amount equal to this expense.
See Endnotes and Additional Disclosures in this report.
13
Eaton Vance
Municipal Bond Funds
September 30, 2023
The Fund's Investment Objectives, Principal Strategies and Principal Risks‡ — continued
Restricted Securities Risk. Unless registered for sale to the public under applicable federal securities law, restricted securities can be sold only in private transactions to qualified purchasers pursuant to an exemption from registration. The sale price realized from a private transaction could be less than the Fund’s purchase price for the restricted security. It may be difficult to identify a qualified purchaser for a restricted security held by the Fund and such security could be deemed illiquid. It may also be more difficult to value such securities.
Derivatives Risk. The Fund’s exposure to derivatives involves risks different from, or possibly greater than, the risks associated with investing directly in securities and other investments. The use of derivatives can lead to losses because of adverse movements in the price or value of the security, instrument, index, currency, commodity, economic indicator or event underlying a derivative (“reference instrument”), due to failure of a counterparty or due to tax or regulatory constraints. Derivatives may create leverage in the Fund, which represents a non-cash exposure to the underlying reference instrument. Leverage can increase both the risk and return potential of the Fund. Derivatives risk may be more significant when derivatives are used to enhance return or as a substitute for a cash investment position, rather than solely to hedge the risk of a position held by the Fund. Use of derivatives involves the exercise of specialized skill and judgment, and a transaction may be unsuccessful in whole or in part because of market behavior or unexpected events. Changes in the value of a derivative (including one used for hedging) may not correlate perfectly with the underlying reference instrument. Derivative instruments traded in over-the-counter markets may be difficult to value, may be illiquid, and may be subject to wide swings in valuation caused by changes in the value of the underlying reference instrument. If a derivative’s counterparty is unable to honor its commitments, the value of Fund shares may decline and the Fund could experience delays in (or be unable to achieve) the return of collateral or other assets held by the counterparty. The loss on derivative transactions may substantially exceed the initial investment. A derivative investment also involves the risks relating to the reference instrument underlying the investment.
Liquidity Risk. The Fund is exposed to liquidity risk when trading volume, lack of a market maker or trading partner, large position size, market conditions, or legal restrictions impair its ability to sell particular investments or to sell them at advantageous market prices. Consequently, the Fund may have to accept a lower price to sell an investment or continue to hold it or keep the position open, sell other investments to raise cash or abandon an investment opportunity, any of which could have a negative effect on the Fund’s performance. These effects may be exacerbated during times of financial or political stress.
Sector and Geographic Risk. Because the Fund may invest a significant portion of its assets in obligations issued in a particular state and/or U.S. territories and in certain types of municipal or other obligations and/or in certain sectors, the value of Fund shares may be affected by events that adversely affect that state, U.S. territory, sector or type of obligation and may fluctuate more than that of a fund that invests more broadly. General obligation bonds issued by municipalities are adversely affected by economic downturns and any resulting decline in tax revenues.
Recent Market Conditions. The outbreak of COVID-19 and efforts to contain its spread have resulted in closing borders, enhanced health screenings, changes to healthcare service preparation and delivery, quarantines, cancellations, disruptions to supply chains and customer activity, as well as general concern and uncertainty. The impact of this coronavirus, and the effects of other infectious illness outbreaks, epidemics or pandemics, may be short term or may continue for an extended period of time. Health crises caused by outbreaks of disease, such as the coronavirus outbreak, may exacerbate other pre-existing political, social and economic risks and disrupt normal market conditions and operations. For example, a global pandemic or other widespread health crisis could cause substantial market volatility and exchange trading suspensions and closures. In addition, the increasing interconnectedness of markets around the world may result in many markets being affected by events or conditions in a single country or region or events affecting a single or small number of issuers. The coronavirus outbreak and public and private sector responses thereto have led to large portions of the populations of many countries working from home for indefinite periods of time, temporary or permanent layoffs, disruptions in supply chains, and lack of availability of certain goods. The impact of such responses could adversely affect the information technology and operational systems upon which the Fund and the Fund’s service providers rely, and could otherwise disrupt the ability of the employees of the Fund’s service providers to perform critical tasks relating to the Fund. Any such impact could adversely affect the Fund’s performance, or the performance of the securities in which the Fund invests and may lead to losses on your investment in the Fund.
Risks Associated with Active Management. The success of the Fund’s investment strategy depends on portfolio management’s successful application of analytical skills and investment judgment. Active management involves subjective decisions and there is no guarantee that such decisions will produce the desired results or expected returns.
Tax Risk. Income from tax-exempt municipal obligations could be declared taxable because of changes in tax laws, adverse interpretations by the relevant taxing authority or the non-compliant conduct of the issuer of an obligation.
Tax-Sensitive Investing Risk. The Fund may hold a security in order to achieve more favorable tax-treatment or to sell a security in order to create tax losses. The Fund’s utilization of various tax-management techniques may be curtailed or eliminated by tax legislation, regulation or interpretations. The Fund may not be able to minimize taxable distributions to shareholders and a portion of the Fund’s distributions may be taxable.
Cybersecurity Risk. With the increased use of technologies by Fund service providers to conduct business, such as the Internet, the Fund is susceptible to operational, information security and related risks. In general, cyber incidents can result from deliberate attacks or unintentional events. Cybersecurity failures by or breaches of the Fund’s investment adviser or administrator and other service providers (including, but not limited to, the custodian or transfer agent), and the issuers of securities in which the Fund invests, may disrupt and otherwise adversely affect their business operations. This may result in
See Endnotes and Additional Disclosures in this report.
14
Eaton Vance
Municipal Bond Funds
September 30, 2023
The Fund's Investment Objectives, Principal Strategies and Principal Risks‡ — continued
financial losses to the Fund, impede Fund trading, interfere with the Fund’s ability to calculate its net asset value, interfere with Fund shareholders’’ ability to transact business or cause violations of applicable privacy and other laws, regulatory fines, penalties, reputational damage, reimbursement or other compensation costs, or additional compliance costs.
Inflation Risk. Inflation risk is the risk that the value of assets or income from investment will be worth less in the future as inflation decreases the value of money. As inflation increases, the real value of Fund shares and distributions thereon can decline.
Counterparty Risk. Changes in the credit quality of the companies that serve as the Fund’s counterparties with respect to derivatives or other transactions supported by another party’s credit, may affect the value of those instruments. Certain entities that have served as counterparties in the markets for these transactions have incurred significant losses and financial hardships including bankruptcy as a result of exposure to sub-prime mortgages and other lower quality credit investments that have experienced defaults or otherwise suffered extreme credit deterioration. As a result, such hardships have reduced these entities’ capital and called into question their continued ability to perform their obligations under such transactions. By using such derivatives or other transactions, the Fund assumes the risk that its counterparties could experience similar financial hardships. In the event of insolvency of a counterparty, the Fund may sustain losses or be unable to liquidate a derivatives position.
The counterparty risk for cleared derivatives is generally lower than for uncleared OTC derivative transactions since generally a clearing organization becomes substituted for each counterparty to a cleared derivative contract and, in effect, guarantees the parties’ performance under the contract as each party to a trade looks only to the clearing house for performance of financial obligations. However, there can be no assurance that the clearing house, or its members, will satisfy its obligations to the Fund.
Anti-Takeover Provisions. The Fund's Declaration of Trust contains provisions that could have the effect of limiting the ability of other persons or entities to acquire control of the Fund or to change the composition of its Board.
General Fund Investing Risks. The Fund is not a complete investment program and there is no guarantee that the Fund will achieve its investment objective. It is possible to lose money by investing in the Fund. An investment in the Fund is not a deposit in a bank and is not insured or guaranteed by the Federal Deposit Insurance Corporation or any other government agency.
Eaton Vance New York Municipal Bond Fund
Investment Objectives. The Fund’s investment objective is to provide current income exempt from federal income tax.
Principal Strategies. During normal market conditions, at least 80% of the Fund’s net assets will be invested in municipal obligations, the interest on which is exempt from federal income tax, including the alternative minimum tax (“AMT”), and New York State and New York City personal income taxes and that are rated A or better by Moody’s Investors Service, Inc. (“Moody’s”), S&P Global Ratings (“S&P”) or Fitch Ratings (“Fitch”). The foregoing 80% policy may not be changed without shareholder approval. Under normal market conditions, the Fund expects to be fully invested (at least 95% of its net assets) in accordance with its investment objective. The Fund may invest up to 20% of its net assets in municipal obligations rated BBB/Baa or below (or unrated obligations deemed by the Fund’s adviser, Eaton Vance Management (“Eaton Vance”), to be of equivalent quality), provided that not more than 15% of its net assets may be invested in municipal obligations rated below B (or unrated obligations deemed by Eaton Vance to be of equivalent quality) and may invest up to 20% of its net assets in bonds on which the interest is subject to the AMT. When a municipal obligation is split rated (meaning rated in different categories by Moody’s, S&P or Fitch) the Fund will deem the higher rating to apply.
The Fund may purchase derivative instruments, which derive their value from another instrument, security or index, including financial futures contracts and related options, interest rate swaps and forward rate contracts. The Fund also may invest in residual interests of a trust (the “trust”) that holds municipal securities (“RIBs”). These trusts will also issue floating-rate notes to third parties that may be senior to a Fund’s residual interest. The Fund may purchase and sell financial futures contracts and related options, including futures contracts and related options based on various debt securities and securities indices, as well as interest rate swaps and forward rate contracts, to seek to hedge against changes in interest rates or for other risk management purposes.
Except for certain fundamental investment restrictions set forth in the Fund’s registration statement and the 80% requirement pertaining to investment in municipal and insured municipal obligations set forth above, the investment objective and policies of the Fund may be changed by the Board without shareholder action.
The Fund employs leverage to seek opportunities for additional income. Leverage may amplify the effect on the Fund’s NAV of any increase or decrease in the value of investments held. The Fund generally will not use leverage if the investment adviser anticipates that it would result in a lower return to shareholders for any significant amount of time. There can be no assurance that the use of leverage will be successful.
Principal Risks
Market Discount Risk. As with any security, the market value of the common shares may increase or decrease from the amount initially paid for the common shares. The Fund’s common shares have traded both at a premium and at a discount relative to NAV. The shares of closed-end management investment companies frequently trade at a discount from their NAV. This is a risk separate and distinct from the risk that the Fund’s NAV may decrease.
See Endnotes and Additional Disclosures in this report.
15
Eaton Vance
Municipal Bond Funds
September 30, 2023
The Fund's Investment Objectives, Principal Strategies and Principal Risks‡ — continued
Market Risk. The value of investments held by the Fund may increase or decrease in response to social, economic, political, financial, public health crises or other disruptive events (whether real, expected or perceived) in the U.S. and global markets and include events such as war, natural disasters, epidemics and pandemics, terrorism, conflicts and social unrest. These events may negatively impact broad segments of businesses and populations and may exacerbate pre-existing risks to the Fund. The frequency and magnitude of resulting changes in the value of the Fund’s investments cannot be predicted. Certain securities and other investments held by the Fund may experience increased volatility, illiquidity, or other potentially adverse effects in reaction to changing market conditions. Monetary and/or fiscal actions taken by U.S. or foreign governments to stimulate or stabilize the global economy may not be effective and could lead to high market volatility. No active trading market may exist for certain investments held by the Fund, which may impair the ability of the Fund to sell or to realize the current valuation of such investments in the event of the need to liquidate such assets.
Interest Rate Risk. In general, the value of debt instruments will fluctuate based on changes in interest rates. The value of these securities is likely to increase when interest rates fall and decline when interest rates rise. Duration measures the time-weighted expected cash flows of a fixed-income security, while maturity refers to the amount of time until a fixed-income security matures. Generally, securities with longer durations or maturities are more sensitive to changes in interest rates than securities with shorter durations or maturities, causing them to be more volatile. Conversely, fixed-income securities with shorter durations or maturities will be less volatile but may provide lower returns than fixed-income securities with longer durations or maturities. Because the Fund is managed toward an income objective, it may hold more longer duration or maturity obligations and thereby be more exposed to interest rate risk than municipal income funds that are managed with a greater emphasis on total return. The impact of interest rate changes is significantly less for floating-rate instruments that have relatively short periodic rate resets (e.g., ninety days or less). In a rising interest rate environment, the durations or maturities of income securities that have the ability to be prepaid or called by the issuer may be extended. In a declining interest rate environment, the proceeds from prepaid or maturing instruments may have to be reinvested at a lower interest rate. Certain instruments held by the Fund may pay an interest rate based on the London Interbank Offered Rate (“LIBOR”), which is the average offered rate for various maturities of short-term loans between certain major international banks. LIBOR is used throughout global banking and financial industries to determine interest rates for a variety of financial instruments (such as debt instruments and derivatives) and borrowing arrangements. Upon a determination by regulators to phase out the use of LIBOR, market participants have been transitioning to the use of alternative reference rates over the past few years. As of June 30, 2023, the administrator of LIBOR ceased publishing LIBOR settings. Although the transition process away from LIBOR has become increasingly well defined, the impact on certain debt securities, derivatives and other financial instruments that utilize LIBOR remains uncertain. The phase-out of LIBOR may result in, among other things, increased volatility or illiquidity in markets for instruments that were historically based on LIBOR and changes in the value of such instruments.
Credit Risk. Investments in municipal obligations and other debt obligations (referred to below as “debt instruments”) are subject to the risk of non-payment of scheduled principal and interest. Changes in economic conditions or other circumstances may reduce the capacity of the party obligated to make principal and interest payments on such instruments and may lead to defaults. Such non-payments and defaults may reduce the value of Fund shares and income distributions. The value of debt instruments also may decline because of concerns about the issuer’s ability to make principal and interest payments. In addition, the credit ratings of debt instruments may be lowered if the financial condition of the party obligated to make payments with respect to such instruments deteriorates. In order to enforce its rights in the event of a default, bankruptcy or similar situation, the Fund may be required to retain legal or similar counsel, which may increase the Fund’s operating expenses and adversely affect net asset value. Municipal obligations may be insured as to principal and interest payments. If the claims-paying ability or other rating of the insurer is downgraded by a rating agency, the value of such obligations may be negatively affected.
Municipal Obligations Risk. The amount of public information available about municipal obligations is generally less than for corporate equities or bonds, meaning that the investment performance of municipal obligations may be more dependent on the analytical abilities of the investment adviser than stock or corporate bond investments. The secondary market for municipal obligations also tends to be less well-developed and less liquid than many other securities markets, which may limit the Fund’s ability to sell its municipal obligations at attractive prices. The differences between the price at which an obligation can be purchased and the price at which it can be sold may widen during periods of market distress. Less liquid obligations can become more difficult to value and be subject to erratic price movements. The increased presence of nontraditional participants (such as proprietary trading desks of investment banks and hedge funds) or the absence of traditional participants (such as individuals, insurance companies, banks and life insurance companies) in the municipal markets may lead to greater volatility in the markets because non-traditional participants may trade more frequently or in greater volume.
Lower Rated Investments Risk. Investments rated below investment grade and comparable unrated investments (sometimes referred to as “junk”) are speculative because of increased credit risk relative to other fixed income investments. Changes in economic conditions or other circumstances typically have a greater effect on the ability of issuers of lower rated investments to make principal and interest payments than they do on issuers of higher rated investments. An economic downturn generally leads to a higher non-payment rate, and a lower rated investment may lose significant value before a default occurs. Lower rated investments typically are subject to greater price volatility and illiquidity than higher rated investments.
Leverage Risk. Certain Fund transactions may give rise to leverage. Leverage can result from a non-cash exposure to an asset, index, rate or instrument. Leverage can also result from borrowings, issuance of preferred shares or participation in residual interest bond transactions. Leverage can increase both the risk and return potential of the Fund. The use of leverage may cause the Fund to maintain liquid assets or liquidate portfolio positions when it may not be advantageous to do so to satisfy its obligations or to meet segregation requirements. Leverage may cause the Fund’s NAV to be more volatile than if it had not been leveraged, as certain types of leverage may exaggerate the effect of any increase or decrease in the Fund’s portfolio securities. The loss on leveraged investments may substantially exceed the initial investment. The Fund intends to use leverage to provide the holders of common shares with a potentially higher return. To the extent the income derived from securities purchased with funds received from leverage exceeds the cost of leverage, the
See Endnotes and Additional Disclosures in this report.
16
Eaton Vance
Municipal Bond Funds
September 30, 2023
The Fund's Investment Objectives, Principal Strategies and Principal Risks‡ — continued
Fund’s return will be greater than if leverage had not been used. Conversely, if the income from the securities purchased with such funds is not sufficient to cover the cost of leverage, the return to the Fund will be less than if leverage had not been used, and therefore the amount available for distribution to common shareholders as dividends and other distributions will be reduced. In the latter case, the investment adviser in its best judgment may nevertheless determine to maintain the Fund’s leveraged position if it deems such action to be appropriate. The use of leverage through issuance of preferred shares by the Fund creates an opportunity for increased net income, but, at the same time, creates special risks. There can be no assurance that a leveraging strategy will be successful during any period in which it is employed.
Risk of Residual Interest Bonds. The Fund may enter into residual interest bond transactions, which expose the Fund to leverage and greater risk than an investment in a fixed-rate municipal bond. The interest payments that the Fund receives on the residual interest bonds acquired in such transactions vary inversely with short-term interest rates, normally decreasing when short-term rates increase. The value and market for residual interest bonds are volatile and such bonds may have limited liquidity. As required by applicable accounting standards, the Fund records interest expense on its liability with respect to floating-rate notes and also records offsetting interest income in an amount equal to this expense.
Restricted Securities Risk. Unless registered for sale to the public under applicable federal securities law, restricted securities can be sold only in private transactions to qualified purchasers pursuant to an exemption from registration. The sale price realized from a private transaction could be less than the Fund’s purchase price for the restricted security. It may be difficult to identify a qualified purchaser for a restricted security held by the Fund and such security could be deemed illiquid. It may also be more difficult to value such securities.
Derivatives Risk. The Fund’s exposure to derivatives involves risks different from, or possibly greater than, the risks associated with investing directly in securities and other investments. The use of derivatives can lead to losses because of adverse movements in the price or value of the security, instrument, index, currency, commodity, economic indicator or event underlying a derivative (“reference instrument”), due to failure of a counterparty or due to tax or regulatory constraints. Derivatives may create leverage in the Fund, which represents a non-cash exposure to the underlying reference instrument. Leverage can increase both the risk and return potential of the Fund. Derivatives risk may be more significant when derivatives are used to enhance return or as a substitute for a cash investment position, rather than solely to hedge the risk of a position held by the Fund. Use of derivatives involves the exercise of specialized skill and judgment, and a transaction may be unsuccessful in whole or in part because of market behavior or unexpected events. Changes in the value of a derivative (including one used for hedging) may not correlate perfectly with the underlying reference instrument. Derivative instruments traded in over-the-counter markets may be difficult to value, may be illiquid, and may be subject to wide swings in valuation caused by changes in the value of the underlying reference instrument. If a derivative’s counterparty is unable to honor its commitments, the value of Fund shares may decline and the Fund could experience delays in (or be unable to achieve) the return of collateral or other assets held by the counterparty. The loss on derivative transactions may substantially exceed the initial investment. A derivative investment also involves the risks relating to the reference instrument underlying the investment.
Liquidity Risk. The Fund is exposed to liquidity risk when trading volume, lack of a market maker or trading partner, large position size, market conditions, or legal restrictions impair its ability to sell particular investments or to sell them at advantageous market prices. Consequently, the Fund may have to accept a lower price to sell an investment or continue to hold it or keep the position open, sell other investments to raise cash or abandon an investment opportunity, any of which could have a negative effect on the Fund’s performance. These effects may be exacerbated during times of financial or political stress.
Sector and Geographic Risk. Because the Fund may invest a significant portion of its assets in obligations issued in a particular state and/or U.S. territories and in certain types of municipal or other obligations and/or in certain sectors, the value of Fund shares may be affected by events that adversely affect that state, U.S. territory, sector or type of obligation and may fluctuate more than that of a fund that invests more broadly. General obligation bonds issued by municipalities are adversely affected by economic downturns and any resulting decline in tax revenues.
Issuer Non-Diversification Risk. The Fund is “non-diversified,” which means it may invest a greater percentage of its assets in the securities of a single issuer than a fund that is “diversified.” Non-diversified funds may focus their investments in a small number of issuers, making them more susceptible to risks affecting such issuers than a more diversified fund might be, and the value of the Fund's shares may be more volatile than the values of shares of more diversified funds.
Recent Market Conditions. The outbreak of COVID-19 and efforts to contain its spread have resulted in closing borders, enhanced health screenings, changes to healthcare service preparation and delivery, quarantines, cancellations, disruptions to supply chains and customer activity, as well as general concern and uncertainty. The impact of this coronavirus, and the effects of other infectious illness outbreaks, epidemics or pandemics, may be short term or may continue for an extended period of time. Health crises caused by outbreaks of disease, such as the coronavirus outbreak, may exacerbate other pre-existing political, social and economic risks and disrupt normal market conditions and operations. For example, a global pandemic or other widespread health crisis could cause substantial market volatility and exchange trading suspensions and closures. In addition, the increasing interconnectedness of markets around the world may result in many markets being affected by events or conditions in a single country or region or events affecting a single or small number of issuers. The coronavirus outbreak and public and private sector responses thereto have led to large portions of the populations of many countries working from home for indefinite periods of time, temporary or permanent layoffs, disruptions in supply chains, and lack of availability of certain
See Endnotes and Additional Disclosures in this report.
17
Eaton Vance
Municipal Bond Funds
September 30, 2023
The Fund's Investment Objectives, Principal Strategies and Principal Risks‡ — continued
goods. The impact of such responses could adversely affect the information technology and operational systems upon which the Fund and the Fund’s service providers rely, and could otherwise disrupt the ability of the employees of the Fund’s service providers to perform critical tasks relating to the Fund. Any such impact could adversely affect the Fund’s performance, or the performance of the securities in which the Fund invests and may lead to losses on your investment in the Fund.
Risks Associated with Active Management. The success of the Fund’s investment strategy depends on portfolio management’s successful application of analytical skills and investment judgment. Active management involves subjective decisions and there is no guarantee that such decisions will produce the desired results or expected returns.
Tax Risk. Income from tax-exempt municipal obligations could be declared taxable because of changes in tax laws, adverse interpretations by the relevant taxing authority or the non-compliant conduct of the issuer of an obligation.
Tax-Sensitive Investing Risk. The Fund may hold a security in order to achieve more favorable tax-treatment or to sell a security in order to create tax losses. The Fund’s utilization of various tax-management techniques may be curtailed or eliminated by tax legislation, regulation or interpretations. The Fund may not be able to minimize taxable distributions to shareholders and a portion of the Fund’s distributions may be taxable.
Cybersecurity Risk. With the increased use of technologies by Fund service providers to conduct business, such as the Internet, the Fund is susceptible to operational, information security and related risks. In general, cyber incidents can result from deliberate attacks or unintentional events. Cybersecurity failures by or breaches of the Fund’s investment adviser or administrator and other service providers (including, but not limited to, the custodian or transfer agent), and the issuers of securities in which the Fund invests, may disrupt and otherwise adversely affect their business operation. This may result in financial losses to the Fund, impede Fund trading, interfere with the Fund’s ability to calculate its net asset value, interfere with Fund shareholders’ ability to transact business or cause violations of applicable privacy and other laws, regulatory fines, penalties, reputational damage, reimbursement or other compensation costs, or additional compliance costs.
Inflation Risk. Inflation risk is the risk that the value of assets or income from investment will be worth less in the future as inflation decreases the value of money. As inflation increases, the real value of Fund shares and distributions thereon can decline.
Counterparty Risk. Changes in the credit quality of the companies that serve as the Fund’s counterparties with respect to derivatives or other transactions supported by another party’s credit, may affect the value of those instruments. Certain entities that have served as counterparties in the markets for these transactions have incurred significant losses and financial hardships including bankruptcy as a result of exposure to sub-prime mortgages and other lower quality credit investments that have experienced defaults or otherwise suffered extreme credit deterioration. As a result, such hardships have reduced these entities’ capital and called into question their continued ability to perform their obligations under such transactions. By using such derivatives or other transactions, the Fund assumes the risk that its counterparties could experience similar financial hardships. In the event of insolvency of a counterparty, the Fund may sustain losses or be unable to liquidate a derivatives position. The counterparty risk for cleared derivatives is generally lower than for uncleared OTC derivative transactions since generally a clearing organization becomes substituted for each counterparty to a cleared derivative contract and, in effect, guarantees the parties’ performance under the contract as each party to a trade looks only to the clearing house for performance of financial obligations. However, there can be no assurance that the clearing house, or its members, will satisfy its obligations to the Fund.
Anti-Takeover Provisions. The Fund's Declaration of Trust contains provisions that could have the effect of limiting the ability of other persons or entities to acquire control of the Fund or to change the composition of its Board.
General Fund Investing Risks. The Fund is not a complete investment program and there is no guarantee that the Fund will achieve its investment objective. It is possible to lose money by investing in the Fund. An investment in the Fund is not a deposit in a bank and is not insured or guaranteed by the Federal Deposit Insurance Corporation or any other government agency.
See Endnotes and Additional Disclosures in this report.
18
Eaton Vance
Municipal Bond Funds
September 30, 2023
Endnotes and Additional Disclosures
| † | The views expressed in this report are those of the portfolio manager(s) and are current only through the date stated at the top of this page. These views are subject to change at any time based upon market or other conditions, and Eaton Vance and the Fund(s) disclaim any responsibility to update such views. These views may not be relied upon as investment advice and, because investment decisions are based on many factors, may not be relied upon as an indication of trading intent on behalf of any Eaton Vance fund. This commentary may contain statements that are not historical facts, referred to as “forward-looking statements.” The Fund’s actual future results may differ significantly from those stated in any forward-looking statement, depending on factors such as changes in securities or financial markets or general economic conditions, the volume of sales and purchases of Fund shares, the continuation of investment advisory, administrative and service contracts, and other risks discussed from time to time in the Fund’s filings with the Securities and Exchange Commission. |
| ‡ | The information contained herein is provided for informational purposes only and does not constitute a solicitation of an offer to buy or sell Fund shares. Common shares of the Fund are available for purchase and sale only at current market prices in secondary market trading. |
| | |
| 1 | Bloomberg Municipal Bond Index is an unmanaged index of municipal bonds traded in the U.S. Unless otherwise stated, index returns do not reflect the effect of any applicable sales charges, commissions, expenses, taxes or leverage, as applicable. It is not possible to invest directly in an index. |
| 2 | Performance results reflect the effects of leverage. |
| 3 | The shares of the Fund often trade at a discount or premium to their net asset value. The discount or premium may vary over time and may be higher or lower than what is quoted in this report. For up-to-date premium/discount information, please refer to https://funds.eatonvance.com/closed-end-fund-prices.php. |
| 4 | The Distribution Rate is based on the Fund’s last regular distribution per share in the period (annualized) divided by the Fund’s NAV or market price at the end of the period. The Fund’s distributions may be comprised of amounts characterized for federal income tax purposes as tax-exempt income, qualified and non-qualified ordinary dividends, capital gains and nondividend distributions, also known as return of capital. The Fund may distribute more than its net investment income and net realized capital gains and, therefore, a distribution may include a return of capital. The Fund will determine the federal income tax character of distributions paid to a shareholder after the end of the calendar year. This is reported on the IRS form 1099-DIV and provided to the shareholder shortly after each year-end. For information about the tax character of distributions made in prior calendar years, please refer to Performance-Tax Character of Distributions on the Fund’s webpage available at eatonvance.com. The Fund’s distributions are determined by the investment adviser based on its current assessment of the Fund’s long-term return potential. Fund distributions may be affected by numerous factors including changes in Fund performance, the cost of financing for Funds that employ leverage, portfolio holdings, realized and projected returns, and other factors. As portfolio and market conditions change, the rate of distributions paid by the Fund could change. Shareholders should not assume that the source of any distribution from the Fund is net income or profit, and the Fund’s distributions should not be used as a measure of performance or confused with “yield” or “income”. Taxable-equivalent performance is based on the highest combined federal and state income tax rates, where applicable. Lower tax rates would result in lower tax-equivalent performance. Actual tax rates will vary depending on your income, exemptions and deductions. Rates do not include local taxes. |
| 5 | Fund employs RIB financing. The leverage created by RIB investments provides an opportunity for increased income but, at the same time, creates special risks (including the likelihood of greater price volatility). The cost of leverage rises and falls with changes in short-term interest rates. See “Floating Rate Notes Issued in Conjunction with Securities Held” in the notes to the financial statements for more information about RIB financing. RIB leverage represents the amount of Floating Rate Notes outstanding at period end as a percentage of Fund net assets plus Floating Rate Notes. |
| | Fund profiles subject to change due to active management. |
| | Additional Information |
| | Yield curve is a graphical representation of the yields offered by bonds of various maturities. The yield curve flattens when long-term interest rates fall and/or short-term interest rates increase, and the yield curve steepens when long-term interest rates increase and/or short-term interest rates fall. |
| | Important Notice to Shareholders |
| | On January 26, 2023, the Board of Trustees of each Fund voted to exempt, on a going forward basis, all prior and, until further notice, new acquisitions of Fund shares that otherwise might be deemed “Control Share Acquisitions” under the Fund’s By-Laws from the Control Share Provisions of the Fund’s By-Laws. |
Eaton Vance
Municipal Bond Fund
September 30, 2023
| Security | Principal
Amount
(000's omitted) | Value |
| Hospital — 1.1% |
| Montefiore Obligated Group, 4.287%, 9/1/50 | $ | 13,890 | $ 8,110,829 |
Total Corporate Bonds
(identified cost $15,102,025) | | | $ 8,110,829 |
| Tax-Exempt Mortgage-Backed Securities — 0.4% |
| Security | Principal
Amount
(000's omitted) | Value |
| Housing — 0.4% |
| California Housing Finance Agency, Municipal Certificates, Series 2021-1, Class A, 3.50%, 11/20/35 | $ | 3,047 | $ 2,674,337 |
Total Tax-Exempt Mortgage-Backed Securities
(identified cost $2,894,964) | | | $ 2,674,337 |
| Tax-Exempt Municipal Obligations — 144.9% |
| Security | Principal
Amount
(000's omitted) | Value |
| Bond Bank — 2.6% |
| Delaware Valley Regional Finance Authority, PA, 5.75%, 7/1/32 | $ | 6,500 | $ 7,481,890 |
| New York State Environmental Facilities Corp., (State Revolving Fund), Green Bonds, 5.25%, 9/15/52 | | 7,000 | 7,384,720 |
| Rickenbacker Port Authority, OH, (OASBO Expanded Asset Pooled Financing Program), 5.375%, 1/1/32 | | 310 | 333,359 |
| Texas Water Development Board, 4.00%, 10/15/37(1) | | 4,875 | 4,687,117 |
| | | | $ 19,887,086 |
| Education — 4.8% |
| District of Columbia, (KIPP DC), 4.00%, 7/1/44 | $ | 280 | $ 235,950 |
| Massachusetts Development Finance Agency, (Northeastern University), 5.25%, 3/1/37 | | 1,650 | 1,655,511 |
| Massachusetts Health and Educational Facilities Authority, (Boston College): | | | |
| 5.50%, 6/1/27 | | 5,710 | 6,096,624 |
| 5.50%, 6/1/30 | | 8,225 | 9,032,613 |
| Security | Principal
Amount
(000's omitted) | Value |
| Education (continued) |
| New Jersey Educational Facilities Authority, (Princeton University), 4.00%, 7/1/47(1) | $ | 10,000 | $ 8,891,300 |
| Tennessee State School Bond Authority, 5.00%, 11/1/52(1) | | 10,000 | 10,280,400 |
| | | | $ 36,192,398 |
| Electric Utilities — 7.0% |
| Austin, TX, Electric Utility Revenue, 5.00%, 11/15/48(1) | $ | 10,000 | $ 10,244,600 |
| Douglas County Public Utility District No. 1, WA, 3.00%, 9/1/52 | | 7,165 | 4,820,899 |
| Orlando Utilities Commission, FL, Utility System Revenue, 5.00%, 10/1/48(1) | | 10,000 | 10,331,500 |
| San Antonio, TX, Electric & Gas Systems Revenue, 5.25%, 2/1/46(1) | | 10,000 | 10,357,500 |
| Seattle, WA, Municipal Light and Power Improvement Revenue: | | | |
| 4.00%, 7/1/47 | | 2,500 | 2,224,375 |
| 5.00%, 3/1/53(1) | | 9,000 | 9,226,080 |
| Utility Debt Securitization Authority, NY, 5.00%, 12/15/35 | | 5,000 | 5,003,700 |
| | | | $ 52,208,654 |
| Escrowed/Prerefunded — 0.1% |
| East Hempfield Township Industrial Development Authority, PA, (Student Services, Inc.), Prerefunded to 7/1/24, 5.00%, 7/1/39 | $ | 175 | $ 176,253 |
| Royal Oak Hospital Finance Authority, MI, (William Beaumont Hospital), Prerefunded to 3/1/24, 5.00%, 9/1/39 | | 1,000 | 1,003,480 |
| | | | $ 1,179,733 |
| General Obligations — 30.8% |
| Aledo Independent School District, TX, (PSF Guaranteed): | | | |
| 5.00%, 2/15/53 | $ | 255 | $ 260,924 |
| 5.00%, 2/15/53(1) | | 9,000 | 9,209,070 |
| Bastrop Independent School District, TX, (PSF Guaranteed), 5.00%, 2/15/53(1) | | 10,000 | 10,262,300 |
| Beaverton School District No. 48J, OR, 5.00%, 6/15/52(1) | | 10,000 | 10,223,200 |
| California, 5.25%, 9/1/53(1) | | 10,000 | 10,621,500 |
| Chicago Board of Education, IL, 5.00%, 12/1/30 | | 4,000 | 4,056,400 |
| Chicago, IL, 5.00%, 1/1/44 | | 19,880 | 19,289,166 |
| Clark County Water Reclamation District, NV, 5.00%, 7/1/49(1) | | 10,000 | 10,256,600 |
| Crowley Independent School District, TX, (PSF Guaranteed), 5.25%, 2/1/53 | | 2,000 | 2,103,740 |
20
See Notes to Financial Statements.
Eaton Vance
Municipal Bond Fund
September 30, 2023
Portfolio of Investments — continued
| Security | Principal
Amount
(000's omitted) | Value |
| General Obligations (continued) |
| Denton Independent School District, TX, (PSF Guaranteed), 5.00%, 8/15/53(1) | $ | 10,000 | $ 10,421,400 |
| District of Columbia, 4.00%, 2/1/46 | | 5,000 | 4,517,950 |
| Illinois: | | | |
| 4.00%, 11/1/38 | | 13,000 | 11,659,310 |
| 5.50%, 5/1/39 | | 810 | 845,519 |
| 5.50%, 3/1/47 | | 4,000 | 4,148,320 |
| 5.75%, 5/1/45 | | 830 | 865,765 |
| Jackson Public Schools, MI, 5.00%, 5/1/48(1) | | 2,150 | 2,121,727 |
| Katy Independent School District, TX, (PSF Guaranteed), 5.00%, 2/15/48(1) | | 10,000 | 10,295,800 |
| Klein Independent School District, TX, (PSF Guaranteed), 4.00%, 8/1/48 | | 5,110 | 4,493,734 |
| Lamar Consolidated Independent School District, TX, (PSF Guaranteed), 5.00%, 2/15/58(1) | | 10,000 | 10,234,900 |
| Leander Independent School District, TX, (PSF Guaranteed), 5.00%, 8/15/52(1) | | 10,000 | 10,217,500 |
| Massachusetts, 5.00%, 5/1/53(1) | | 10,000 | 10,325,000 |
| New Caney Independent School District, TX, (PSF Guaranteed), 5.00%, 2/15/53(1) | | 10,000 | 10,228,900 |
| New York, NY: | | | |
| 4.00%, 9/1/46 | | 5,000 | 4,408,350 |
| 5.25%, 5/1/41(1) | | 7,100 | 7,489,364 |
| 5.25%, 5/1/42(1) | | 3,125 | 3,282,531 |
| 5.25%, 10/1/47 | | 4,000 | 4,159,360 |
| (SPA: TD Bank, N.A.), 4.55%, 9/1/49(2) | | 5,500 | 5,500,000 |
| Peters Township School District, PA, 5.00%, 9/1/40(1) | | 3,225 | 3,364,836 |
| Renton School District No. 403, WA, 4.00%, 12/1/39 | | 2,500 | 2,339,175 |
| Royse City Independent School District, TX, (PSF Guaranteed), 5.00%, 2/15/53(1) | | 9,000 | 9,263,610 |
| Spring Independent School District, TX, 5.00%, 8/15/47(1) | | 11,575 | 11,927,459 |
| Trenton Public Schools, MI, 5.00%, 5/1/42(1) | | 2,150 | 2,221,917 |
| Ysleta Independent School District, TX, (PSF Guaranteed), 5.00%, 8/15/56(1) | | 10,000 | 10,139,300 |
| | | | $ 230,754,627 |
| Hospital — 11.2% |
| Allen County, OH, (Mercy Health), 4.00%, 8/1/47(1) | $ | 900 | $ 765,630 |
| Brevard County Health Facilities Authority, FL, (Health First Obligated Group): | | | |
| 5.00%, 4/1/47 | | 7,500 | 7,248,225 |
| 5.00%, 4/1/52 | | 7,510 | 7,189,999 |
| Chester County Health and Education Facilities Authority, PA, (Main Line Health System), 4.00%, 9/1/50 | | 11,625 | 9,688,275 |
| Security | Principal
Amount
(000's omitted) | Value |
| Hospital (continued) |
| Colorado Health Facilities Authority, (CommonSpirit Health), 5.25%, 11/1/52 | $ | 4,000 | $ 3,919,320 |
| Colorado Health Facilities Authority, (Intermountain Healthcare), 4.00%, 5/15/52 | | 5,000 | 4,295,500 |
| Hamilton County, OH, (Cincinnati Children's Hospital Medical Center), 5.00%, 5/15/34 | | 250 | 251,188 |
| Hamilton County, OH, (UC Health), 4.00%, 9/15/50 | | 3,175 | 2,287,841 |
| Indiana Finance Authority, (Indiana University Health), 5.00%, 10/1/53 | | 5,000 | 5,091,950 |
| Maryland Health and Higher Educational Facilities Authority, (MedStar Health), 5.00%, 8/15/42 | | 5,000 | 4,967,250 |
| Michigan Finance Authority, (Trinity Health Credit Group), 4.00%, 3/1/51 | | 7,000 | 5,890,080 |
| Missouri Health and Educational Facilities Authority, (Children's Mercy Hospital), 4.00%, 5/15/48 | | 5,000 | 4,201,800 |
| New Jersey Health Care Facilities Financing Authority, (Robert Wood Johnson University Hospital), 5.25%, 7/1/35 | | 5,000 | 5,003,000 |
| New York Dormitory Authority, (Northwell Health Obligated Group), 5.00%, 5/1/52 | | 5,900 | 5,888,908 |
| Pennsylvania Economic Development Financing Authority, (UPMC), 4.00%, 5/15/53 | | 4,115 | 3,371,214 |
| Pennsylvania Higher Educational Facilities Authority, (University of Pennsylvania Health System), 4.00%, 8/15/42 | | 1,600 | 1,456,144 |
| Tarrant County Cultural Education Facilities Finance Corp.,TX, (Baylor Scott & White Health), 5.00%, 11/15/51 | | 3,000 | 2,961,090 |
| West Virginia Hospital Finance Authority, (West Virginia University Health System Obligated Group), 4.375%, 6/1/53 | | 10,150 | 9,198,031 |
| | | | $ 83,675,445 |
| Housing — 3.9% |
| Maryland Economic Development Corp., (Morgan State University), Student Housing Revenue, 4.25%, 7/1/50 | $ | 1,350 | $ 1,151,888 |
| Nebraska Investment Finance Authority, Social Bonds, (FHLMC), (FNMA), (GNMA), 4.55%, 9/1/48 | | 8,835 | 8,102,137 |
| New York City Housing Development Corp., NY: | | | |
| 4.80%, 2/1/53 | | 5,000 | 4,729,000 |
| 4.95%, 11/1/58 | | 1,575 | 1,488,359 |
| North Carolina Housing Finance Agency, Social Bonds, (FHLMC), (FNMA), (GNMA), 4.40%, 7/1/46 | | 5,000 | 4,568,850 |
| Pennsylvania Housing Finance Agency, SFMR, Social Bonds, 5.00%, 10/1/50 | | 3,665 | 3,522,358 |
| Rhode Island Housing and Mortgage Finance Corp., Social Bonds, (FHLMC), (FNMA), (GNMA), 4.65%, 10/1/53 | | 3,880 | 3,609,564 |
21
See Notes to Financial Statements.
Eaton Vance
Municipal Bond Fund
September 30, 2023
Portfolio of Investments — continued
| Security | Principal
Amount
(000's omitted) | Value |
| Housing (continued) |
| Seattle Housing Authority, WA, 3.625%, 12/1/43 | $ | 1,000 | $ 798,660 |
| South Carolina Housing Finance and Development Authority, 4.95%, 7/1/53 | | 1,000 | 982,470 |
| | | | $ 28,953,286 |
| Industrial Development Revenue — 2.8% |
| Arkansas Development Finance Authority, (United States Steel Corp.), Green Bonds, (AMT), 5.45%, 9/1/52 | $ | 4,800 | $ 4,482,912 |
| Maricopa County Pollution Control Corp., AZ, (El Paso Electric Co.), 4.50%, 8/1/42 | | 4,840 | 4,248,842 |
| New York Transportation Development Corp., (Delta Air Lines, Inc. - LaGuardia Airport Terminals C&D Redevelopment), (AMT), 5.00%, 10/1/40 | | 12,610 | 12,121,237 |
| | | | $ 20,852,991 |
| Insured - Bond Bank — 0.1% |
| Puerto Rico Municipal Finance Agency, (AGM), 5.00%, 8/1/27 | $ | 470 | $ 472,872 |
| | | | $ 472,872 |
| Insured - Education — 2.7% |
| Massachusetts College Building Authority, (AGC), 5.50%, 5/1/39 | $ | 700 | $ 791,315 |
| Massachusetts Development Finance Agency, (Boston University), (AGC), 6.00%, 5/15/59 | | 1,105 | 1,235,545 |
| Massachusetts Development Finance Agency, (College of the Holy Cross): | | | |
| (AMBAC), 5.25%, 9/1/32 | | 15,900 | 17,806,251 |
| (AMBAC), 5.25%, 9/1/32(1) | | 750 | 839,917 |
| | | | $ 20,673,028 |
| Insured - Electric Utilities — 3.7% |
| Cleveland, OH, Public Power System Revenue: | | | |
| (NPFG), 0.00%, 11/15/27 | $ | 2,750 | $ 2,306,920 |
| (NPFG), 0.00%, 11/15/38 | | 1,000 | 458,680 |
| Lower Colorado River Authority, TX, (LCRA Transmission Services Corp.), (AGM), 5.25%, 5/15/53(1) | | 10,000 | 10,221,700 |
| Ohio Municipal Electric Generation Agency, (NPFG), 0.00%, 2/15/27 | | 5,000 | 4,330,300 |
| Omaha Public Power District, NE, (AGM), 4.00%, 2/1/51 | | 4,600 | 4,013,454 |
| Puerto Rico Electric Power Authority, (NPFG), 5.25%, 7/1/34 | | 375 | 370,725 |
| South Carolina Public Service Authority, (AGM), 5.75%, 12/1/52 | | 6,000 | 6,346,500 |
| | | | $ 28,048,279 |
| Security | Principal
Amount
(000's omitted) | Value |
| Insured - Escrowed/Prerefunded — 1.2% |
| Chicago Park District, IL, (BAM), Prerefunded to 1/1/24, 5.00%, 1/1/39(1) | $ | 7,390 | $ 7,405,297 |
| Massachusetts College Building Authority, (NPFG), Escrowed to Maturity, 0.00%, 5/1/26 | | 1,600 | 1,442,544 |
| | | | $ 8,847,841 |
| Insured - General Obligations — 5.2% |
| Chicago Park District, IL, (BAM), 5.00%, 1/1/39(1) | $ | 6,210 | $ 6,224,842 |
| Cincinnati City School District, OH, (AGM), (FGIC), 5.25%, 12/1/30 | | 4,500 | 4,941,765 |
| Erie School District, PA, (AMBAC), 0.00%, 9/1/30 | | 1,000 | 732,920 |
| Essex County Improvement Authority, NJ, (NPFG), 5.50%, 10/1/30 | | 2,000 | 2,258,560 |
| Irvington Township, NJ, (AGM), 0.00%, 7/15/26 | | 4,165 | 3,676,112 |
| Massachusetts, (AMBAC), 5.50%, 8/1/30 | | 1,900 | 2,106,834 |
| Nassau County, NY, (AGM), 5.00%, 4/1/43(1) | | 11,665 | 11,942,627 |
| Plain School District, OH, (NPFG), 0.00%, 12/1/27 | | 2,400 | 2,004,936 |
| Shaler Area School District, PA, (XLCA), 0.00%, 9/1/33 | | 2,550 | 1,606,959 |
| Waller Independent School District, TX, (BAM), 4.00%, 2/15/48 | | 4,165 | 3,486,438 |
| | | | $ 38,981,993 |
| Insured - Hospital — 0.2% |
| Allegheny County Hospital Development Authority, PA, (UPMC Health System), (NPFG), 6.00%, 7/1/24 | $ | 250 | $ 253,215 |
| California Statewide Communities Development Authority, (Enloe Medical Center), (AGM), 5.375%, 8/15/57 | | 1,500 | 1,570,800 |
| | | | $ 1,824,015 |
| Insured - Lease Revenue/Certificates of Participation — 0.2% |
| New Jersey Economic Development Authority, (Motor Vehicle Surcharges): | | | |
| (AGC), 0.00%, 7/1/26 | $ | 420 | $ 371,603 |
| (AGC), 0.00%, 7/1/27 | | 1,120 | 949,088 |
| New Jersey Economic Development Authority, (School Facilities Construction), (NPFG), 5.50%, 9/1/28 | | 500 | 537,960 |
| | | | $ 1,858,651 |
| Insured - Special Tax Revenue — 7.4% |
| Hamilton County, OH, Sales Tax Revenue: | | | |
| (AMBAC), 0.00%, 12/1/23 | $ | 1,245 | $ 1,236,410 |
| (AMBAC), 0.00%, 12/1/24 | | 3,665 | 3,489,703 |
| Harris County-Houston Sports Authority, TX, (AGM), (NPFG), 0.00%, 11/15/34 | | 19,335 | 10,702,696 |
22
See Notes to Financial Statements.
Eaton Vance
Municipal Bond Fund
September 30, 2023
Portfolio of Investments — continued
| Security | Principal
Amount
(000's omitted) | Value |
| Insured - Special Tax Revenue (continued) |
| Houston, TX, Hotel Occupancy Tax Revenue, (AMBAC), 0.00%, 9/1/24 | $ | 18,035 | $ 17,342,095 |
| Massachusetts, Dedicated Tax Revenue, (NPFG), 5.50%, 1/1/29 | | 750 | 815,010 |
| Miami-Dade County, FL, Professional Sports Franchise Facilities, (AGC), 7.00%, 10/1/39 | | 18,000 | 20,895,300 |
| Pennsylvania Turnpike Commission, (AGM), 5.25%, 7/15/30 | | 1,105 | 1,229,522 |
| | | | $ 55,710,736 |
| Insured - Transportation — 5.5% |
| E-470 Public Highway Authority, CO, (NPFG), 0.00%, 9/1/39 | $ | 25,000 | $ 11,099,000 |
| New Jersey Turnpike Authority, (AGM), (BHAC), 5.25%, 1/1/29 | | 1,000 | 1,080,300 |
| Port Palm Beach District, FL: | | | |
| (XLCA), 0.00%, 9/1/24 | | 1,605 | 1,533,738 |
| (XLCA), 0.00%, 9/1/25 | | 1,950 | 1,772,082 |
| (XLCA), 0.00%, 9/1/26 | | 1,000 | 866,510 |
| San Joaquin Hills Transportation Corridor Agency, CA, (NPFG), 0.00%, 1/15/25 | | 26,215 | 24,851,296 |
| | | | $ 41,202,926 |
| Insured - Water and Sewer — 4.8% |
| Chicago, IL, Wastewater Transmission Revenue, (AGM), 5.25%, 1/1/58 | $ | 7,000 | $ 7,178,430 |
| Chicago, IL, Water Revenue, (AGM), 5.25%, 11/1/53 | | 1,000 | 1,025,190 |
| DeKalb County, GA, Water and Sewerage Revenue, (AGM), 5.25%, 10/1/32(1) | | 10,000 | 10,369,200 |
| Erie Sewer Authority, PA, (AMBAC), 0.00%, 12/1/26 | | 1,920 | 1,672,013 |
| Massachusetts Water Resources Authority, (AGM), 5.25%, 8/1/35 | | 1,000 | 1,153,170 |
| Michigan Finance Authority, (Detroit Water and Sewerage Department): | | | |
| (AGM), 5.00%, 7/1/31 | | 1,500 | 1,509,090 |
| (AGM), 5.00%, 7/1/32 | | 2,845 | 2,861,814 |
| (AGM), 5.00%, 7/1/33 | | 2,435 | 2,449,391 |
| (AGM), 5.00%, 7/1/35 | | 2,970 | 2,984,315 |
| (AGM), 5.00%, 7/1/37 | | 2,435 | 2,441,769 |
| Middlesex County Improvement Authority, NJ, (Perth Amboy), (AMBAC), 0.00%, 9/1/24 | | 2,150 | 2,067,397 |
| | | | $ 35,711,779 |
| Lease Revenue/Certificates of Participation — 4.4% |
| Hampton Roads Transportation Accountability Commission, VA, 4.00%, 7/1/57 | $ | 5,000 | $ 4,379,500 |
| Security | Principal
Amount
(000's omitted) | Value |
| Lease Revenue/Certificates of Participation (continued) |
| Maryland Stadium Authority, Built to Learn Revenue, 4.00%, 6/1/52 | $ | 5,430 | $ 4,644,279 |
| New Jersey Economic Development Authority, (Portal North Bridge), 5.00%, 11/1/52 | | 7,000 | 7,007,140 |
| New Jersey Transportation Trust Fund Authority, (Transportation Program): | | | |
| 5.00%, 6/15/38 | | 130 | 130,069 |
| 5.00%, 6/15/44 | | 5,535 | 5,455,075 |
| New Jersey Transportation Trust Fund Authority, (Transportation System): | | | |
| 5.00%, 12/15/24 | | 10,000 | 10,098,800 |
| 5.25%, 12/15/23 | | 1,000 | 1,001,770 |
| | | | $ 32,716,633 |
| Other Revenue — 2.9% |
| Buckeye Tobacco Settlement Financing Authority, OH, 5.00%, 6/1/55 | $ | 6,415 | $ 5,534,028 |
| California Community Choice Financing Authority, Clean Energy Project Revenue, Green Bonds, 5.00% to 8/1/29 (Put Date), 12/1/53 | | 2,000 | 2,015,280 |
| Golden State Tobacco Securitization Corp., CA, 5.00%, 6/1/51 | | 3,185 | 3,235,992 |
| Main Street Natural Gas, Inc., GA, Gas Supply Revenue: | | | |
| 5.00% to 9/1/30 (Put Date), 9/1/53 | | 5,000 | 5,055,050 |
| 5.00% to 12/1/30 (Put Date), 12/1/54 | | 3,700 | 3,667,588 |
| Patriots Energy Group Financing Agency, SC, Gas Supply Revenue, 5.25% to 8/1/31 (Put Date), 10/1/54 | | 2,300 | 2,316,468 |
| | | | $ 21,824,406 |
| Senior Living/Life Care — 1.0% |
| California Public Finance Authority, (Enso Village): | | | |
| Green Bonds, 3.125%, 5/15/29(3) | $ | 410 | $ 382,280 |
| Green Bonds, 5.00%, 11/15/46(3) | | 565 | 483,499 |
| Clackamas County Hospital Facility Authority, OR, (Rose Villa), 5.25%, 11/15/50 | | 160 | 139,400 |
| Franklin County, OH, (Friendship Village of Dublin), 5.00%, 11/15/44 | | 525 | 493,662 |
| Massachusetts Development Finance Agency, (NewBridge on the Charles, Inc.), 5.00%, 10/1/57(3) | | 310 | 254,163 |
| New Hope Cultural Education Facilities Finance Corp., TX, (The Outlook at Windhaven), 6.75%, 10/1/52 | | 4,000 | 3,427,400 |
| North Carolina Medical Care Commission, (Pennybyrn at Maryfield), 5.00%, 10/1/50 | | 2,500 | 2,031,075 |
| | | | $ 7,211,479 |
23
See Notes to Financial Statements.
Eaton Vance
Municipal Bond Fund
September 30, 2023
Portfolio of Investments — continued
| Security | Principal
Amount
(000's omitted) | Value |
| Special Tax Revenue — 18.3% |
| Dallas Area Rapid Transit, TX, Sales Tax Revenue, 4.00%, 12/1/51 | $ | 5,000 | $ 4,287,850 |
| Massachusetts Bay Transportation Authority, Sales Tax Revenue: | | | |
| 4.00%, 7/1/51 | | 4,000 | 3,500,400 |
| 5.25%, 7/1/33 | | 750 | 837,548 |
| Michigan, Trunk Line Revenue, 5.25%, 11/15/49(1) | | 10,000 | 10,497,200 |
| New York City Transitional Finance Authority, NY, Future Tax Revenue: | | | |
| 4.00%, 8/1/37(1) | | 10,000 | 9,594,300 |
| 4.00%, 8/1/39(1) | | 5,000 | 4,681,550 |
| 4.00%, 2/1/43 | | 9,000 | 8,172,990 |
| 5.00%, 5/1/46 | | 5,000 | 5,111,550 |
| 5.00%, 11/1/46(1) | | 5,000 | 5,102,650 |
| New York Convention Center Development Corp., Hotel Occupancy Tax, 5.00%, 11/15/45(1) | | 13,000 | 12,902,110 |
| New York Dormitory Authority, Personal Income Tax Revenue: | | | |
| 4.00%, 2/15/47 | | 9,100 | 8,086,442 |
| 4.00%, 3/15/47 | | 3,500 | 3,106,600 |
| New York Dormitory Authority, Sales Tax Revenue: | | | |
| 4.00%, 3/15/46 | | 14,000 | 12,468,400 |
| 5.00%, 3/15/43(1) | | 6,000 | 6,097,740 |
| New York State Urban Development Corp., Personal Income Tax Revenue: | | | |
| 4.00%, 3/15/45(1) | | 2,800 | 2,485,140 |
| 4.00%, 3/15/45 | | 6,500 | 5,757,505 |
| New York Thruway Authority, Personal Income Tax Revenue: | | | |
| 4.00%, 3/15/44 | | 2,000 | 1,794,000 |
| Green Bonds, 5.00%, 3/15/55(1) | | 5,000 | 5,044,200 |
| Puerto Rico Sales Tax Financing Corp., 5.00%, 7/1/58 | | 6,000 | 5,442,480 |
| Triborough Bridge and Tunnel Authority, NY, Green Bonds, 5.25%, 5/15/47(1) | | 8,850 | 9,232,674 |
| Triborough Bridge and Tunnel Authority, NY, Sales Tax Revenue, 4.00%, 5/15/48 | | 3,000 | 2,665,350 |
| Washington Metropolitan Area Transit Authority, D.C., Sustainability Bonds, 5.25%, 7/15/53(1) | | 10,000 | 10,493,400 |
| | | | $ 137,362,079 |
| Transportation — 18.2% |
| Atlanta, GA, Department of Aviation, Green Bonds, 5.00%, 7/1/53(1) | $ | 10,000 | $ 10,297,500 |
| Charlotte, NC, (Charlotte Douglas International Airport), 5.00%, 7/1/53(1) | | 10,000 | 10,297,500 |
| Dallas and Fort Worth, TX, (Dallas/Fort Worth International Airport): | | | |
| 5.25%, 11/1/30 | | 3,845 | 3,848,307 |
| Security | Principal
Amount
(000's omitted) | Value |
| Transportation (continued) |
| Dallas and Fort Worth, TX, (Dallas/Fort Worth International Airport): (continued) | | | |
| 5.25%, 11/1/31 | $ | 5,940 | $ 5,945,108 |
| Denver City and County, CO, Airport System Revenue: | | | |
| 4.00%, 11/15/43 | | 5,665 | 5,200,697 |
| (AMT), 5.00%, 11/15/53 | | 3,920 | 3,885,700 |
| Florida Department of Transportation, Turnpike System Revenue, 5.00%, 7/1/52(1) | | 16,000 | 16,404,320 |
| Illinois Toll Highway Authority, 5.00%, 1/1/44(1) | | 10,000 | 10,315,500 |
| Los Angeles Department of Airports, CA, (Los Angeles International Airport), Green Bonds, (AMT), 5.00%, 5/15/47 | | 7,145 | 7,172,151 |
| Massachusetts, (Rail Enhancement Program), Sustainablility Bonds, 5.00%, 6/1/53(1)(4) | | 10,000 | 10,406,300 |
| Metropolitan Transportation Authority, NY, Green Bonds, 4.75%, 11/15/45 | | 730 | 680,725 |
| Metropolitan Washington Airports Authority, D.C.: | | | |
| (AMT), 4.00%, 10/1/51 | | 5,000 | 4,194,450 |
| (AMT), 5.25%, 10/1/53 | | 2,000 | 2,033,460 |
| New Jersey Turnpike Authority, 5.25%, 1/1/52 | | 2,500 | 2,600,375 |
| North Texas Tollway Authority: | | | |
| 4.125%, 1/1/39 | | 6,000 | 5,660,280 |
| 5.00%, 1/1/48 | | 7,500 | 7,385,850 |
| Pennsylvania Turnpike Commission: | | | |
| 5.00%, 12/1/53 | | 7,000 | 7,124,320 |
| 5.25%, 12/1/52 | | 2,600 | 2,691,858 |
| Port Authority of New York and New Jersey, 5.00%, 12/1/34(1) | | 16,400 | 16,430,504 |
| Texas Private Activity Bond Surface Transportation Corp., (North Tarrant Express Segment 3C), (AMT), 5.00%, 6/30/58 | | 2,500 | 2,392,725 |
| Texas Transportation Commission, (Central Texas Turnpike System), 5.00%, 8/15/42 | | 1,765 | 1,667,307 |
| | | | $ 136,634,937 |
| Water and Sewer — 5.9% |
| New York City Municipal Water Finance Authority, NY, (Water and Sewer System): | | | |
| 5.25%, 6/15/52(1) | $ | 3,000 | $ 3,131,700 |
| (SPA: Barclays Bank PLC), 4.80%, 6/15/53(2) | | 2,300 | 2,300,000 |
| (SPA: State Street Bank & Trust Co.), 4.55%, 6/15/41(2) | | 2,500 | 2,500,000 |
| Texas Water Development Board: | | | |
| 4.00%, 10/15/47(1) | | 2,900 | 2,577,781 |
| 5.00%, 10/15/47(1) | | 20,000 | 20,761,400 |
| 5.00%, 4/15/49(1) | | 10,700 | 10,932,939 |
24
See Notes to Financial Statements.
Eaton Vance
Municipal Bond Fund
September 30, 2023
Portfolio of Investments — continued
| Security | Principal
Amount
(000's omitted) | Value |
| Water and Sewer (continued) |
| Texas Water Development Board: (continued) | | | |
| 5.00%, 10/15/58(4) | $ | 2,000 | $ 2,057,680 |
| | | | $ 44,261,500 |
Total Tax-Exempt Municipal Obligations
(identified cost $1,120,027,897) | | | $1,087,047,374 |
| Security | Notional
Amount
(000's omitted) | Value |
| Transportation — 0.1% |
| HTA TRRB 2005L-745190R75 Assured Custodial Trust, 5.25%, 7/1/41 | $ | 875 | $ 858,515 |
Total Trust Units
(identified cost $881,419) | | | $ 858,515 |
Total Investments — 146.5%
(identified cost $1,138,906,305) | | | $1,098,691,055 |
| Other Assets, Less Liabilities — (46.5)% | | | $ (348,773,340) |
| Net Assets — 100.0% | | | $ 749,917,715 |
| The percentage shown for each investment category in the Portfolio of Investments is based on net assets. |
| (1) | Security represents the municipal bond held by a trust that issues residual interest bonds (see Note 1G). |
| (2) | Variable rate demand obligation that may be tendered at par on any day for payment the same or next business day. The stated interest rate, which generally resets daily, is determined by the remarketing agent and represents the rate in effect at September 30, 2023. |
| (3) | Security exempt from registration under Rule 144A of the Securities Act of 1933, as amended. These securities may be sold in certain transactions in reliance on an exemption from registration (normally to qualified institutional buyers). At September 30, 2023, the aggregate value of these securities is $1,119,942 or 0.1% of the Fund's net assets. |
| (4) | When-issued security. |
| At September 30, 2023, the concentration of the Fund’s investments in the various states and territories, determined as a percentage of total investments, is as follows: |
| Texas | 22.8% |
| New York | 18.3% |
| Others, representing less than 10% individually | 58.1% |
| The Fund invests primarily in debt securities issued by municipalities. The ability of the issuers of the debt securities to meet their obligations may be affected by economic developments in a specific industry or municipality. At September 30, 2023, 21.2% of total investments are backed by bond insurance of various financial institutions and financial guaranty assurance agencies. The aggregate percentage insured by an individual financial institution or financial guaranty assurance agency ranged from 0.1% to 8.0% of total investments. |
| Abbreviations: |
| AGC | – Assured Guaranty Corp. |
| AGM | – Assured Guaranty Municipal Corp. |
| AMBAC | – AMBAC Financial Group, Inc. |
| AMT | – Interest earned from these securities may be considered a tax preference item for purposes of the Federal Alternative Minimum Tax. |
| BAM | – Build America Mutual Assurance Co. |
| BHAC | – Berkshire Hathaway Assurance Corp. |
| FGIC | – Financial Guaranty Insurance Company |
| FHLMC | – Federal Home Loan Mortgage Corp. |
| FNMA | – Federal National Mortgage Association |
| GNMA | – Government National Mortgage Association |
| NPFG | – National Public Finance Guarantee Corp. |
| PSF | – Permanent School Fund |
| SFMR | – Single Family Mortgage Revenue |
| SPA | – Standby Bond Purchase Agreement |
| XLCA | – XL Capital Assurance, Inc. |
25
See Notes to Financial Statements.
Eaton Vance
California Municipal Bond Fund
September 30, 2023
| Tax-Exempt Municipal Obligations — 139.2% |
| Security | Principal
Amount
(000's omitted) | Value |
| Education — 11.5% |
| California Educational Facilities Authority, (Loyola Marymount University): | | | |
| Green Bonds, 5.00%, 10/1/43 | $ | 2,105 | $ 2,136,533 |
| Green Bonds, 5.00%, 10/1/48 | | 3,000 | 3,012,750 |
| California State University, 5.00%, 11/1/41(1) | | 9,550 | 9,753,224 |
| University of California, 5.00%, 5/15/46(1) | | 12,050 | 12,212,313 |
| | | | $ 27,114,820 |
| Electric Utilities — 4.4% |
| Los Angeles Department of Water and Power, CA, Power System Revenue, 5.00%, 7/1/42(1) | $ | 2,000 | $ 2,067,480 |
| Sacramento Municipal Utility District, CA: | | | |
| Green Bonds, 5.00%, 8/15/50(1) | | 7,000 | 7,275,590 |
| Green Bonds, 5.00%, 8/15/53 | | 1,000 | 1,052,750 |
| | | | $ 10,395,820 |
| General Obligations — 56.6% |
| ABC Unified School District, CA, (Election of 2018), 4.00%, 8/1/47 | $ | 5,000 | $ 4,618,450 |
| Alisal Union School District, CA, (Election of 2016), 4.25%, 8/1/54 | | 10,180 | 9,458,543 |
| Alum Rock Union Elementary School District, CA, (Election of 2016), 5.25%, 8/1/47 | | 1,100 | 1,153,933 |
| Brentwood Union School District, CA, (Election 2016), 5.25%, 8/1/52 | | 4,250 | 4,437,297 |
| Brisbane School District, CA, (Election of 2020), 3.00%, 8/1/49 | | 1,760 | 1,216,706 |
| California: | | | |
| 4.75%, 12/1/42 | | 3,000 | 3,014,310 |
| 5.00%, 9/1/52(1) | | 10,000 | 10,395,400 |
| 5.25%, 9/1/53(1) | | 10,000 | 10,621,500 |
| Chaffey Joint Union High School District, CA, (Election of 2012), 4.00%, 8/1/49(1) | | 11,900 | 10,853,514 |
| El Camino Community College District, CA, (Election of 2012), 5.00%, 8/1/48(1) | | 10,000 | 10,301,900 |
| Fort Bragg Unified School District, CA, (Election of 2020): | | | |
| 4.00%, 8/1/42 | | 1,350 | 1,224,707 |
| 4.125%, 8/1/47 | �� | 1,000 | 893,060 |
| La Canada Unified School District, CA, (Election of 2017), 5.75%, 8/1/50 | | 1,465 | 1,639,716 |
| Manteca Unified School District, CA, (Election of 2020), 5.25%, 8/1/53 | | 7,430 | 7,986,433 |
| Modesto High School District, CA, (Election of 2022), 4.00%, 8/1/52 | | 7,500 | 6,812,775 |
| Security | Principal
Amount
(000's omitted) | Value |
| General Obligations (continued) |
| Pasadena Area Community College District, CA, (Election of 2022), 4.00%, 8/1/52 | $ | 3,750 | $ 3,375,637 |
| Robla School District, CA, (Election of 2014), 3.00%, 8/1/53 | | 500 | 334,505 |
| San Diego Unified School District, CA, (Election of 2022), Sustainablility Bonds, 5.00%, 7/1/48(1)(2) | | 10,000 | 10,500,600 |
| San Jose City, CA, 5.00%, 9/1/49(1) | | 10,000 | 10,335,800 |
| San Luis Obispo County Community College District, CA, (Election of 2014), 4.00%, 8/1/43 | | 9,750 | 9,080,565 |
| San Rafael City High School District, CA, (Election of 2022), 4.25%, 8/1/47 | | 4,000 | 3,855,680 |
| Sierra Joint Community College District, CA, (Election of 2018), 4.00%, 8/1/48 | | 1,000 | 921,510 |
| South Bay Union School District, CA, (Election of 2018), 4.00%, 8/1/47 | | 3,000 | 2,621,100 |
| Sweetwater Union High School District, CA, (Election of 2018), 5.00%, 8/1/52 | | 5,000 | 5,116,100 |
| Westminster School District, CA, (Election of 2016), 4.00%, 8/1/51 | | 3,220 | 2,949,906 |
| | | | $ 133,719,647 |
| Hospital — 11.7% |
| California Health Facilities Financing Authority, (Cedars-Sinai Health System), 4.00%, 8/15/48 | $ | 10,025 | $ 9,001,347 |
| California Health Facilities Financing Authority, (City of Hope): | | | |
| 5.00%, 11/15/32 | | 2,130 | 2,088,508 |
| 5.00%, 11/15/35 | | 3,040 | 2,877,998 |
| California Health Facilities Financing Authority, (Kaiser Permanente), 4.00%, 11/1/44 | | 4,900 | 4,564,301 |
| California Health Facilities Financing Authority, (Lucile Salter Packard Children's Hospital at Stanford), 4.00%, 5/15/51 | | 5,250 | 4,552,800 |
| California Health Facilities Financing Authority, (Sutter Health), 5.00%, 11/15/46 | | 4,485 | 4,515,364 |
| | | | $ 27,600,318 |
| Housing — 6.2% |
| California Municipal Finance Authority, (Caritas): | | | |
| 4.00%, 8/15/51 | $ | 435 | $ 345,351 |
| Social Bonds, 5.25%, 8/15/53 | | 900 | 914,049 |
| California Statewide Communities Development Authority, (University of California, Irvine East Campus Apartments, Phase IV-A-CHF-Irvine, LLC), 5.00%, 5/15/47 | | 5,000 | 4,864,600 |
| CSCDA Community Improvement Authority, CA, (Pasadena Portfolio), Essential Housing Revenue, Social Bonds, 3.00%, 12/1/56(3) | | 2,680 | 1,663,208 |
26
See Notes to Financial Statements.
Eaton Vance
California Municipal Bond Fund
September 30, 2023
Portfolio of Investments — continued
| Security | Principal
Amount
(000's omitted) | Value |
| Housing (continued) |
| Independent Cities Finance Authority, CA, (Augusta Communities Mobile Home Park Pool), 5.25%, 5/15/56 | $ | 4,510 | $ 4,538,728 |
| Independent Cities Finance Authority, CA, (Castle Mobile Estates), 3.00%, 5/15/56 | | 710 | 458,880 |
| Independent Cities Finance Authority, CA, (Vista de Santa Barbara Mobilehome Park): | | | |
| 3.00%, 9/15/46 | | 925 | 644,531 |
| 3.00%, 9/15/56 | | 1,905 | 1,207,408 |
| | | | $ 14,636,755 |
| Insured - Electric Utilities — 2.0% |
| Puerto Rico Electric Power Authority, (NPFG), 5.25%, 7/1/34 | $ | 3,740 | $ 3,697,364 |
| Sacramento Municipal Utility District, CA, (AMBAC), (BHAC), 5.25%, 7/1/24 | | 1,075 | 1,088,437 |
| | | | $ 4,785,801 |
| Insured - General Obligations — 14.9% |
| Antioch Unified School District, CA, (BAM), 4.00%, 8/1/47(2) | $ | 3,375 | $ 3,053,497 |
| Bakersfield City School District, CA, (Election of 2016), (BAM), 3.00%, 11/1/51 | | 1,500 | 1,016,490 |
| Bellevue Union School District, CA, (Election of 2020), (AGM), 3.125%, 8/1/44 | | 400 | 290,060 |
| Center Joint Unified School District, CA, (Election of 2008), (BAM), 3.00%, 8/1/46 | | 1,000 | 686,340 |
| Coalinga-Huron Joint Unified School District, CA, (Election of 2022): | | | |
| (BAM), 5.00%, 8/1/48 | | 1,000 | 1,019,950 |
| (BAM), 5.25%, 8/1/53 | | 2,750 | 2,844,435 |
| Coalinga-Huron Recreation and Park District, CA, (Election of 2016), (BAM), 3.00%, 8/1/50 | | 750 | 492,308 |
| Duarte Unified School District, CA, (Election of 2020), (AGM), 4.25%, 8/1/48 | | 3,500 | 3,349,885 |
| El Monte City School District, CA, (Election of 2014), (BAM), 4.00%, 8/1/47 | | 1,000 | 895,430 |
| Fair Oaks Recreation and Park District, CA, (Election of 2018), (BAM), 5.75%, 8/1/51 | | 1,700 | 1,825,970 |
| McFarland Unified School District, CA, (Election of 2020): | | | |
| (BAM), 3.00%, 11/1/49 | | 750 | 493,095 |
| (BAM), 4.50%, 11/1/52 | | 4,500 | 4,324,995 |
| Moreno Valley Unified School District, CA, (Election of 2014), (AGM), 4.125%, 8/1/50 | | 3,750 | 3,471,637 |
| Oxnard School District, CA, (Election of 2022), (BAM), 4.125%, 8/1/50 | | 2,000 | 1,834,240 |
| Security | Principal
Amount
(000's omitted) | Value |
| Insured - General Obligations (continued) |
| Pittsburg Unified School District, CA, (Election of 2018), (AGM), 4.25%, 8/1/49 | $ | 750 | $ 703,433 |
| San Mateo County Community College District, CA, (NPFG), 0.00%, 9/1/25 | | 3,955 | 3,676,845 |
| Ukiah Unified School District, CA, (Election of 2020), (AGM), 5.50%, 8/1/53 | | 5,000 | 5,232,600 |
| | | | $ 35,211,210 |
| Insured - Hospital — 1.8% |
| California Health Facilities Financing Authority, (Adventist Health System), (AGM), 4.00%, 3/1/39 | $ | 4,275 | $ 4,033,548 |
| California Statewide Communities Development Authority, (Enloe Medical Center), (AGM), 5.25%, 8/15/52 | | 160 | 166,701 |
| | | | $ 4,200,249 |
| Insured - Special Tax Revenue — 1.8% |
| San Francisco City and County Redevelopment Agency, CA, (Transbay Infrastructure Project): | | | |
| (AGM), 5.00%, 8/1/43 | $ | 2,145 | $ 2,243,885 |
| (AGM), 5.25%, 8/1/53 | | 1,815 | 1,908,055 |
| | | | $ 4,151,940 |
| Insured - Transportation — 1.3% |
| San Joaquin Hills Transportation Corridor Agency, CA, (NPFG), 0.00%, 1/15/27 | $ | 3,520 | $ 3,042,653 |
| | | | $ 3,042,653 |
| Insured - Water and Sewer — 2.2% |
| Mountain House Public Financing Authority, CA, Green Bonds, (BAM), 4.25%, 12/1/52 | $ | 1,750 | $ 1,612,922 |
| Pittsburg Public Financing Authority, CA, Water Revenue, (AGM), 5.00%, 8/1/52 | | 3,630 | 3,701,112 |
| | | | $ 5,314,034 |
| Lease Revenue/Certificates of Participation — 1.3% |
| California Public Works Board, 5.00%, 11/1/38 | $ | 3,045 | $ 3,046,492 |
| | | | $ 3,046,492 |
| Other Revenue — 0.8% |
| California Community Choice Financing Authority, Clean Energy Project Revenue, Green Bonds, 5.00% to 8/1/29 (Put Date), 12/1/53 | $ | 1,000 | $ 1,007,640 |
| Golden State Tobacco Securitization Corp., CA, 5.00%, 6/1/51 | | 855 | 868,689 |
| | | | $ 1,876,329 |
27
See Notes to Financial Statements.
Eaton Vance
California Municipal Bond Fund
September 30, 2023
Portfolio of Investments — continued
| Security | Principal
Amount
(000's omitted) | Value |
| Senior Living/Life Care — 0.9% |
| California Municipal Finance Authority, (HumanGood - California Obligated Group), 4.00%, 10/1/49 | $ | 2,050 | $ 1,694,284 |
| California Public Finance Authority, (Enso Village): | | | |
| Green Bonds, 2.375%, 11/15/28(3) | | 105 | 99,792 |
| Green Bonds, 5.00%, 11/15/46(3) | | 450 | 385,088 |
| | | | $ 2,179,164 |
| Special Tax Revenue — 6.3% |
| Jurupa Public Financing Authority, CA: | | | |
| 5.00%, 9/1/30 | $ | 625 | $ 631,475 |
| 5.00%, 9/1/32 | | 625 | 630,800 |
| Puerto Rico Sales Tax Financing Corp., 5.00%, 7/1/58 | | 3,645 | 3,306,307 |
| San Bernardino County Transportation Authority, CA, Sales Tax Revenue, 5.25%, 3/1/40(1) | | 10,375 | 10,416,811 |
| | | | $ 14,985,393 |
| Transportation — 11.8% |
| Bay Area Toll Authority, CA, (San Francisco Bay Area), 4.125%, 4/1/54 | $ | 3,000 | $ 2,769,210 |
| Los Angeles Department of Airports, CA, (Los Angeles International Airport), (AMT), 5.00%, 5/15/43(1) | | 10,000 | 10,018,700 |
| San Francisco City and County Airport Commission, CA, (San Francisco International Airport), (AMT), 5.00%, 5/1/45 | | 5,000 | 4,982,450 |
| San Francisco Municipal Transportation Agency, CA, Green Bonds, 5.00%, 3/1/51(1) | | 10,000 | 10,087,300 |
| | | | $ 27,857,660 |
| Water and Sewer — 3.7% |
| Los Angeles, CA, Wastewater System Revenue, 5.00%, 6/1/43(1) | $ | 7,500 | $ 7,500,225 |
| Santa Clara Valley Water District, CA, Green Bonds, 5.00%, 8/1/49 | | 1,100 | 1,159,653 |
| | | | $ 8,659,878 |
Total Tax-Exempt Municipal Obligations
(identified cost $344,353,081) | | | $ 328,778,163 |
| Taxable Municipal Obligations — 6.2% |
| Security | Principal
Amount
(000's omitted) | Value |
| Education — 0.5% |
| California Municipal Finance Authority, (Albert Einstein Academies), 3.75%, 8/1/31(3) | $ | 1,415 | $ 1,171,224 |
| | | | $ 1,171,224 |
| General Obligations — 1.9% |
| Monterey Peninsula Community College District, CA, (Election of 2020): | | | |
| 2.861%, 8/1/46 | $ | 1,000 | $ 627,140 |
| 2.951%, 8/1/51 | | 1,400 | 839,244 |
| Ohlone Community College District, CA, 2.443%, 8/1/35 | | 535 | 393,878 |
| Robla School District, CA, 2.602%, 8/1/40 | | 615 | 403,132 |
| Santa Maria-Bonita School District, CA, 3.071%, 8/1/39 | | 2,000 | 1,459,220 |
| Tustin Unified School District, CA, 2.649%, 8/1/42 | | 1,125 | 736,774 |
| | | | $ 4,459,388 |
| Housing — 0.3% |
| Independent Cities Finance Authority, CA, (Vista de Santa Barbara Mobilehome Park), 4.50%, 9/15/56 | $ | 985 | $ 735,824 |
| | | | $ 735,824 |
| Insured - General Obligations — 1.7% |
| Palmdale School District, CA, (AGM), 2.948%, 8/1/47 | $ | 5,000 | $ 3,120,500 |
| Sanger Unified School District, CA, (BAM), 2.834%, 8/1/44 | | 1,250 | 782,737 |
| | | | $ 3,903,237 |
| Other Revenue — 1.2% |
| Central Marin Police Authority, CA, 3.101%, 2/1/41 | $ | 1,000 | $ 686,050 |
| Corte Madera, CA, Pension Obligation Bonds, 3.257%, 6/1/45 | | 940 | 635,008 |
| National City, CA, Pension Obligation Bonds, 3.423%, 11/1/42 | | 2,000 | 1,414,000 |
| | | | $ 2,735,058 |
| Water and Sewer — 0.6% |
| Metropolitan Water District of Southern California, (SPA: TD Bank, N.A.), 5.33%, 7/1/37(4) | $ | 1,500 | $ 1,500,000 |
| | | | $ 1,500,000 |
Total Taxable Municipal Obligations
(identified cost $21,056,743) | | | $ 14,504,731 |
28
See Notes to Financial Statements.
Eaton Vance
California Municipal Bond Fund
September 30, 2023
Portfolio of Investments — continued
| Security | Notional
Amount
(000's omitted) | Value |
| Transportation — 0.4% |
| HTA TRRB 2005L-745190UR7 Assured Custodial Trust, 5.25%, 7/1/41 | $ | 1,000 | $ 981,170 |
Total Trust Units
(identified cost $994,570) | | | $ 981,170 |
Total Investments — 145.8%
(identified cost $366,404,394) | | | $ 344,264,064 |
| Other Assets, Less Liabilities — (45.8)% | | | $ (108,096,071) |
| Net Assets — 100.0% | | | $ 236,167,993 |
| The percentage shown for each investment category in the Portfolio of Investments is based on net assets. |
| (1) | Security represents the municipal bond held by a trust that issues residual interest bonds (see Note 1G). |
| (2) | When-issued security. |
| (3) | Security exempt from registration under Rule 144A of the Securities Act of 1933, as amended. These securities may be sold in certain transactions in reliance on an exemption from registration (normally to qualified institutional buyers). At September 30, 2023, the aggregate value of these securities is $3,319,312 or 1.4% of the Fund's net assets. |
| (4) | Variable rate demand obligation that may be tendered at par on any day for payment the lesser of 5 business days or 7 calendar days. The stated interest rate, which generally resets weekly, represents the rate in effect at September 30, 2023. |
| The Fund invests primarily in debt securities issued by California municipalities. The ability of the issuers of the debt securities to meet their obligations may be affected by economic developments in a specific industry or municipality. At September 30, 2023, 17.6% of total investments are backed by bond insurance of various financial institutions and financial guaranty assurance agencies. The aggregate percentage insured by an individual financial institution or financial guaranty assurance agency ranged from 0.3% to 8.2% of total investments. |
| Abbreviations: |
| AGM | – Assured Guaranty Municipal Corp. |
| AMBAC | – AMBAC Financial Group, Inc. |
| AMT | – Interest earned from these securities may be considered a tax preference item for purposes of the Federal Alternative Minimum Tax. |
| BAM | – Build America Mutual Assurance Co. |
| BHAC | – Berkshire Hathaway Assurance Corp. |
| NPFG | – National Public Finance Guarantee Corp. |
| SPA | – Standby Bond Purchase Agreement |
29
See Notes to Financial Statements.
Eaton Vance
New York Municipal Bond Fund
September 30, 2023
| Security | Principal
Amount
(000's omitted) | Value |
| Hospital — 0.4% |
| Montefiore Obligated Group, 4.287%, 9/1/50 | $ | 1,350 | $ 788,309 |
Total Corporate Bonds
(identified cost $1,579,452) | | | $ 788,309 |
| Tax-Exempt Municipal Obligations — 147.3% |
| Security | Principal
Amount
(000's omitted) | Value |
| Bond Bank — 1.7% |
| New York State Environmental Facilities Corp., (State Revolving Fund): | | | |
| Green Bonds, 5.00%, 9/15/47 | $ | 135 | $ 140,210 |
| Green Bonds, 5.00%, 9/15/47(1) | | 2,700 | 2,804,193 |
| | | | $ 2,944,403 |
| Education — 7.9% |
| Build NYC Resource Corp., NY, (Academic Leadership Charter School), 4.00%, 6/15/36 | $ | 200 | $ 174,510 |
| Build NYC Resource Corp., NY, (East Harlem Scholars Academy Charter School), Social Bonds, 5.00%, 6/1/32(2) | | 375 | 374,711 |
| Build NYC Resource Corp., NY, (Grand Concourse Academy Charter School), 5.00%, 7/1/52 | | 700 | 634,088 |
| Monroe County Industrial Development Corp., NY, (True North Rochester Preparatory Charter School), 5.00%, 6/1/50(2) | | 1,885 | 1,683,399 |
| Monroe County Industrial Development Corp., NY, (University of Rochester), 4.00%, 7/1/50 | | 7,000 | 6,162,450 |
| New York Dormitory Authority, (New York University): | | | |
| 4.00%, 7/1/39 | | 1,250 | 1,173,862 |
| 5.00%, 7/1/39 | | 2,000 | 2,068,120 |
| New York Dormitory Authority, (The New School), 5.00%, 7/1/42 | | 650 | 645,560 |
| Schenectady County Capital Resource Corp., NY, (Union College), 5.25%, 7/1/52 | | 375 | 389,509 |
| Yonkers Economic Development Corp., NY, (Lamartine/Warburton, LLC - Charter School of Educational Excellence): | | | |
| 5.00%, 10/15/39 | | 395 | 358,455 |
| 5.00%, 10/15/49 | | 80 | 68,038 |
| 5.00%, 10/15/54 | | 120 | 99,977 |
| | | | $ 13,832,679 |
| Security | Principal
Amount
(000's omitted) | Value |
| Electric Utilities — 13.1% |
| Long Island Power Authority, NY, Electric System Revenue, Green Bonds, 5.00%, 9/1/48 | $ | 7,500 | $ 7,705,500 |
| New York Power Authority, Green Bonds, 4.00%, 11/15/50(1) | | 11,500 | 10,202,455 |
| Utility Debt Securitization Authority, NY: | | | |
| 5.00%, 12/15/33 | | 2,895 | 2,898,300 |
| Green Bonds, 5.00%, 12/15/49 | | 2,000 | 2,088,580 |
| | | | $ 22,894,835 |
| Escrowed/Prerefunded — 2.2% |
| Onondaga County Cultural Resources Trust, NY, (Syracuse University), Prerefunded to 12/1/23, 5.00%, 12/1/38 | $ | 3,820 | $ 3,826,379 |
| | | | $ 3,826,379 |
| General Obligations — 18.2% |
| East Meadow Union Free School District, NY, 2.00%, 6/15/35 | $ | 985 | $ 748,639 |
| New York, 5.00%, 3/15/41(3) | | 4,065 | 4,302,098 |
| New York, NY: | | | |
| 4.00%, 12/1/41 | | 530 | 484,606 |
| 4.00%, 4/1/50 | | 2,000 | 1,733,520 |
| 5.00%, 8/1/38 | | 1,035 | 1,088,903 |
| 5.00%, 8/1/47(1) | | 10,000 | 10,160,100 |
| 5.00%, 8/1/51(1) | | 10,000 | 10,166,000 |
| Puerto Rico, 4.00%, 7/1/46 | | 1,000 | 774,120 |
| Washingtonville Central School District, NY: | | | |
| 0.05%, 6/15/35 | | 950 | 549,052 |
| 0.05%, 6/15/36 | | 950 | 513,865 |
| 0.05%, 6/15/37 | | 950 | 478,572 |
| 0.05%, 6/15/38 | | 950 | 445,816 |
| 0.05%, 6/15/39 | | 695 | 308,990 |
| | | | $ 31,754,281 |
| Hospital — 6.5% |
| Brookhaven Local Development Corp., NY, (Long Island Community Hospital): | | | |
| 3.375%, 10/1/40 | $ | 1,500 | $ 1,121,640 |
| 4.00%, 10/1/45 | | 500 | 415,340 |
| Genesee County Funding Corp., NY, (Rochester Regional Health Obligation), 5.25%, 12/1/52 | | 1,000 | 964,240 |
| Jefferson County Civic Facility Development Corp., NY, (Samaritan Medical Center), 4.00%, 11/1/47 | | 2,200 | 1,405,976 |
| New York Dormitory Authority, (Maimonides Medical Center), 3.00%, 2/1/50 | | 1,975 | 1,302,019 |
30
See Notes to Financial Statements.
Eaton Vance
New York Municipal Bond Fund
September 30, 2023
Portfolio of Investments — continued
| Security | Principal
Amount
(000's omitted) | Value |
| Hospital (continued) |
| New York Dormitory Authority, (Memorial Sloan Kettering Cancer Center), 5.00%, 7/1/42 | $ | 1,500 | $ 1,533,840 |
| New York Dormitory Authority, (Northwell Health Obligated Group), 5.00%, 5/1/52 | | 3,400 | 3,393,608 |
| New York Dormitory Authority, (NYU Langone Hospitals Obligated Group), 4.00%, 7/1/50 | | 1,500 | 1,276,350 |
| | | | $ 11,413,013 |
| Housing — 6.1% |
| New York City Housing Development Corp., NY: | | | |
| 2.75%, 5/1/51 | $ | 3,000 | $ 1,895,940 |
| 3.40%, 11/1/39 | | 1,000 | 825,040 |
| 3.55%, 11/1/44 | | 1,115 | 871,718 |
| 3.80%, 11/1/43 | | 1,675 | 1,375,008 |
| 4.05%, 11/1/41 | | 2,030 | 1,861,591 |
| 4.95%, 11/1/58 | | 1,000 | 944,990 |
| Sustainability Bonds, 3.70%, 11/1/38 | | 850 | 719,568 |
| New York Housing Finance Agency: | | | |
| (FHLMC), (FNMA), (GNMA), 3.20%, 11/1/46 | | 1,075 | 757,176 |
| (FHLMC), (FNMA), (GNMA), 4.00%, 11/1/42 | | 500 | 451,180 |
| Green Bonds, (FNMA), 3.95%, 11/1/37 | | 1,000 | 900,880 |
| | | | $ 10,603,091 |
| Industrial Development Revenue — 3.7% |
| Build NYC Resource Corp., NY, (Pratt Paper (NY), Inc.), (AMT), 4.50%, 1/1/25(2) | $ | 390 | $ 390,597 |
| New York Liberty Development Corp., (Goldman Sachs Group, Inc.): | | | |
| 5.25%, 10/1/35 | | 895 | 974,055 |
| 5.50%, 10/1/37 | | 1,440 | 1,559,218 |
| New York Transportation Development Corp., (Delta Air Lines, Inc. - LaGuardia Airport Terminals C&D Redevelopment): | | | |
| (AMT), 5.00%, 1/1/36 | | 1,000 | 995,620 |
| (AMT), 5.00%, 10/1/40 | | 2,665 | 2,561,704 |
| | | | $ 6,481,194 |
| Insured - Education — 0.9% |
| New York Dormitory Authority, (City University), (AMBAC), 5.25%, 7/1/30 | $ | 75 | $ 75,094 |
| New York Dormitory Authority, (CUNY Student Housing), (AMBAC), (BAM), 5.50%, 7/1/35 | | 1,345 | 1,523,629 |
| | | | $ 1,598,723 |
| Security | Principal
Amount
(000's omitted) | Value |
| Insured - Electric Utilities — 1.9% |
| New York Power Authority, Green Transmission Revenue, (AGM), 4.00%, 11/15/47 | $ | 3,750 | $ 3,282,863 |
| | | | $ 3,282,863 |
| Insured - General Obligations — 6.0% |
| East Northport Fire District, NY, (AGC), 4.50%, 11/1/23 | $ | 200 | $ 200,082 |
| Nassau County, NY: | | | |
| (AGM), 4.00%, 4/1/47 | | 2,600 | 2,314,078 |
| (AGM), 5.00%, 7/1/40(1) | | 7,110 | 7,329,557 |
| Yonkers, NY, (AGM), 2.00%, 2/15/41 | | 1,000 | 612,710 |
| | | | $ 10,456,427 |
| Insured - Lease Revenue/Certificates of Participation — 2.0% |
| Ulster County Resource Recovery Agency, NY, Solid Waste System, (AMBAC), 0.00%, 3/1/25 | $ | 3,635 | $ 3,424,752 |
| | | | $ 3,424,752 |
| Insured - Other Revenue — 1.9% |
| New York City Industrial Development Agency, NY, (Queens Baseball Stadium), (AGM), 3.00%, 1/1/46 | $ | 4,785 | $ 3,301,028 |
| | | | $ 3,301,028 |
| Insured - Transportation — 4.5% |
| Metropolitan Transportation Authority, NY, Green Bonds, (AGM), 4.00%, 11/15/48 | $ | 7,120 | $ 6,227,721 |
| New York Thruway Authority, (AGM), 3.00%, 1/1/46 | | 2,340 | 1,631,495 |
| | | | $ 7,859,216 |
| Other Revenue — 1.9% |
| Hudson Yards Infrastructure Corp., NY: | | | |
| Green Bonds, 4.00%, 2/15/37 | $ | 2,000 | $ 1,968,280 |
| Green Bonds, 4.00%, 2/15/40 | | 1,345 | 1,265,524 |
| | | | $ 3,233,804 |
| Senior Living/Life Care — 1.9% |
| Brookhaven Local Development Corp., NY, (Jefferson's Ferry): | | | |
| 4.00%, 11/1/45 | $ | 600 | $ 476,610 |
| 5.25%, 11/1/25 | | 300 | 301,566 |
| 5.25%, 11/1/26 | | 200 | 201,570 |
| 5.25%, 11/1/29 | | 180 | 181,566 |
| 5.25%, 11/1/36 | | 970 | 969,952 |
31
See Notes to Financial Statements.
Eaton Vance
New York Municipal Bond Fund
September 30, 2023
Portfolio of Investments — continued
| Security | Principal
Amount
(000's omitted) | Value |
| Senior Living/Life Care (continued) |
| Southold Local Development Corp., NY, (Peconic Landing at Southold, Inc.), 4.00%, 12/1/45 | $ | 25 | $ 18,863 |
| Westchester County Local Development Corp., NY, (Miriam Osborn Memorial Home Association), 5.00%, 7/1/42 | | 1,200 | 1,195,056 |
| | | | $ 3,345,183 |
| Special Tax Revenue — 37.3% |
| Metropolitan Transportation Authority, NY, (Payroll Mobility Tax Revenue), 5.00%, 5/15/52 | $ | 1,500 | $ 1,561,410 |
| New York City Transitional Finance Authority, NY, Future Tax Revenue: | | | |
| 3.00%, 11/1/47 | | 1,000 | 699,990 |
| 5.00%, 5/1/46 | | 5,000 | 5,111,550 |
| 5.00%, 5/1/53(1) | | 10,000 | 10,131,400 |
| New York Dormitory Authority, Personal Income Tax Revenue, 5.00%, 3/15/46(1) | | 10,000 | 10,235,900 |
| New York Dormitory Authority, Sales Tax Revenue: | | | |
| 4.00%, 3/15/43 | | 2,000 | 1,802,300 |
| 4.00%, 3/15/49 | | 1,000 | 865,520 |
| 5.00%, 3/15/43 | | 2,000 | 2,032,580 |
| New York State Urban Development Corp., Personal Income Tax Revenue, 5.00%, 3/15/44(1) | | 10,000 | 10,215,200 |
| New York State Urban Development Corp., Sales Tax Revenue: | | | |
| 4.00%, 3/15/39 | | 2,500 | 2,356,850 |
| 4.00%, 3/15/45 | | 4,000 | 3,577,440 |
| New York Thruway Authority, Personal Income Tax Revenue, 3.00%, 3/15/49 | | 1,500 | 1,057,725 |
| Puerto Rico Sales Tax Financing Corp., 5.00%, 7/1/58 | | 3,500 | 3,174,780 |
| Triborough Bridge and Tunnel Authority, NY: | | | |
| 5.00%, 5/15/51 | | 3,000 | 3,048,780 |
| Green Bonds, 5.25%, 5/15/47(1) | | 7,500 | 7,824,300 |
| Triborough Bridge and Tunnel Authority, NY, Sales Tax Revenue, 4.00%, 5/15/48 | | 1,500 | 1,332,675 |
| | | | $ 65,028,400 |
| Transportation — 18.6% |
| Metropolitan Transportation Authority, NY: | | | |
| 5.25%, 11/15/55 | $ | 1,650 | $ 1,633,071 |
| Green Bonds, 4.75%, 11/15/45 | | 1,205 | 1,123,663 |
| New York Thruway Authority: | | | |
| 4.00%, 1/1/36 | | 2,500 | 2,444,800 |
| 4.00%, 1/1/45 | | 2,625 | 2,289,289 |
| New York Transportation Development Corp., (LaGuardia Airport Terminal B Redevelopment): | | | |
| (AMT), 4.00%, 7/1/33 | | 835 | 775,247 |
| Security | Principal
Amount
(000's omitted) | Value |
| Transportation (continued) |
| New York Transportation Development Corp., (LaGuardia Airport Terminal B Redevelopment): (continued) | | | |
| (AMT), 5.00%, 7/1/41 | $ | 2,150 | $ 2,094,917 |
| (AMT), 5.00%, 7/1/46 | | 1,000 | 951,820 |
| (AMT), 5.25%, 1/1/50 | | 1,240 | 1,217,060 |
| New York Transportation Development Corp., (Terminal 4 John F. Kennedy International Airport): | | | |
| 4.00%, 12/1/42 | | 3,200 | 2,778,400 |
| (AMT), 4.00%, 12/1/40 | | 100 | 87,593 |
| (AMT), 4.00%, 12/1/42 | | 750 | 641,310 |
| Port Authority of New York and New Jersey, (AMT), 5.00%, 7/15/38 | | 1,250 | 1,293,687 |
| Triborough Bridge and Tunnel Authority, NY, 5.00%, 11/15/51(1) | | 15,000 | 15,183,600 |
| | | | $ 32,514,457 |
| Water and Sewer — 11.0% |
| New York City Municipal Water Finance Authority, NY, (Water and Sewer System): | | | |
| 4.00%, 6/15/51 | $ | 3,125 | $ 2,717,437 |
| 5.00%, 6/15/47(1) | | 4,000 | 4,100,040 |
| 5.00%, 6/15/51(1) | | 10,000 | 10,181,300 |
| 5.25%, 6/15/48(3) | | 2,000 | 2,102,560 |
| | | | $ 19,101,337 |
Total Tax-Exempt Municipal Obligations
(identified cost $276,919,178) | | | $ 256,896,065 |
| Taxable Municipal Obligations — 0.9% |
| Security | Principal
Amount
(000's omitted) | Value |
| Education — 0.9% |
| Build NYC Resource Corp., NY, (New World Preparatory Charter School), 4.375%, 6/15/25 | $ | 240 | $ 231,653 |
| New York Dormitory Authority, (Iona College), 4.127%, 7/1/49 | | 2,000 | 1,268,000 |
Total Taxable Municipal Obligations
(identified cost $2,240,000) | | | $ 1,499,653 |
32
See Notes to Financial Statements.
Eaton Vance
New York Municipal Bond Fund
September 30, 2023
Portfolio of Investments — continued
| Security | Notional
Amount
(000's omitted) | Value |
| Transportation — 0.6% |
| HTA TRRB 2005L-745190UR7 Assured Custodial Trust, 5.25%, 7/1/41 | $ | 1,000 | $ 981,170 |
Total Trust Units
(identified cost $994,570) | | | $ 981,170 |
Total Investments — 149.2%
(identified cost $281,733,200) | | | $ 260,165,197 |
| Other Assets, Less Liabilities — (49.2)% | | | $ (85,756,503) |
| Net Assets — 100.0% | | | $ 174,408,694 |
| The percentage shown for each investment category in the Portfolio of Investments is based on net assets. |
| (1) | Security represents the municipal bond held by a trust that issues residual interest bonds (see Note 1G). |
| (2) | Security exempt from registration under Rule 144A of the Securities Act of 1933, as amended. These securities may be sold in certain transactions in reliance on an exemption from registration (normally to qualified institutional buyers). At September 30, 2023, the aggregate value of these securities is $2,448,707 or 1.4% of the Fund's net assets. |
| (3) | When-issued security. |
| The Fund invests primarily in debt securities issued by New York municipalities. The ability of the issuers of the debt securities to meet their obligations may be affected by economic developments in a specific industry or municipality. At September 30, 2023, 11.5% of total investments are backed by bond insurance of various financial institutions and financial guaranty assurance agencies. The aggregate percentage insured by an individual financial institution or financial guaranty assurance agency ranged from 0.1% to 9.5% of total investments. |
| Abbreviations: |
| AGC | – Assured Guaranty Corp. |
| AGM | – Assured Guaranty Municipal Corp. |
| AMBAC | – AMBAC Financial Group, Inc. |
| AMT | – Interest earned from these securities may be considered a tax preference item for purposes of the Federal Alternative Minimum Tax. |
| BAM | – Build America Mutual Assurance Co. |
| FHLMC | – Federal Home Loan Mortgage Corp. |
| FNMA | – Federal National Mortgage Association |
| GNMA | – Government National Mortgage Association |
33
See Notes to Financial Statements.
Eaton Vance
Municipal Bond Funds
September 30, 2023
Statements of Assets and Liabilities
| | September 30, 2023 |
| | Municipal Fund | California Fund | New York Fund |
| Assets | | | |
| Investments: | | | |
| Identified cost | $ 1,138,906,305 | $ 366,404,394 | $ 281,733,200 |
| Unrealized depreciation | (40,215,250) | (22,140,330) | (21,568,003) |
| Investments, at value | $1,098,691,055 | $344,264,064 | $260,165,197 |
| Restricted cash | $ 2,250,000 | $ 650,000 | $ — |
| Interest receivable | 12,451,187 | 3,415,715 | 2,985,865 |
| Receivable for investments sold | 23,911,823 | — | 16,244,685 |
| Trustees' deferred compensation plan | 289,130 | 95,965 | 70,901 |
| Due from broker for floating rate notes issued | 8,000,000 | 8,000,000 | — |
| Total assets | $1,145,593,195 | $356,425,744 | $279,466,648 |
| Liabilities | | | |
| Payable for floating rate notes issued | $ 356,644,991 | $ 104,299,522 | $ 86,244,658 |
| Due to broker for floating rate notes redeemed | 17,940,000 | — | 8,000,000 |
| Payable for investments purchased | 1,705,966 | — | 3,100,883 |
| Payable for when-issued securities | 12,544,000 | 13,865,126 | 6,417,204 |
| Due to custodian | 2,230,284 | 873,702 | 170,119 |
| Payable to affiliates: | | | |
| Investment adviser fee | 598,012 | 177,774 | 143,138 |
| Trustees' deferred compensation plan | 289,130 | 95,965 | 70,901 |
| Interest expense and fees payable | 3,444,025 | 786,484 | 772,272 |
| Accrued expenses | 279,072 | 159,178 | 138,779 |
| Total liabilities | $ 395,675,480 | $120,257,751 | $105,057,954 |
| Net Assets | $ 749,917,715 | $236,167,993 | $174,408,694 |
| Sources of Net Assets | | | |
| Common shares, $0.01 par value, unlimited number of shares authorized | $ 711,532 | $ 246,729 | $ 179,613 |
| Additional paid-in capital | 881,899,948 | 307,340,617 | 227,918,886 |
| Accumulated loss | (132,693,765) | (71,419,353) | (53,689,805) |
| Net Assets | $ 749,917,715 | $236,167,993 | $174,408,694 |
| Common Shares Issued and Outstanding | 71,153,184 | 24,672,939 | 17,961,289 |
| Net Asset Value Per Common Share | | | |
| Net assets ÷ common shares issued and outstanding | $ 10.54 | $ 9.57 | $ 9.71 |
34
See Notes to Financial Statements.
Eaton Vance
Municipal Bond Funds
September 30, 2023
| | Year Ended September 30, 2023 |
| | Municipal Fund | California Fund | New York Fund |
| Investment Income | | | |
| Interest income | $ 53,582,549 | $ 15,777,561 | $ 12,749,927 |
| Total investment income | $ 53,582,549 | $15,777,561 | $12,749,927 |
| Expenses | | | |
| Investment adviser fee | $ 7,816,647 | $ 2,373,503 | $ 1,848,611 |
| Trustees’ fees and expenses | 84,063 | 25,931 | 20,443 |
| Custodian fee | 188,758 | 62,430 | 49,675 |
| Transfer and dividend disbursing agent fees | 19,195 | 18,535 | 18,135 |
| Legal and accounting services | 162,042 | 96,065 | 93,755 |
| Printing and postage | 197,132 | 60,676 | 24,197 |
| Interest expense and fees | 17,142,804 | 4,961,691 | 4,415,256 |
| Miscellaneous | 96,882 | 66,275 | 46,082 |
| Total expenses | $ 25,707,523 | $ 7,665,106 | $ 6,516,154 |
| Net investment income | $ 27,875,026 | $ 8,112,455 | $ 6,233,773 |
| Realized and Unrealized Gain (Loss) | | | |
| Net realized gain (loss): | | | |
| Investment transactions | $ (23,640,552) | $ (5,141,517) | $ (6,371,605) |
| Net realized loss | $(23,640,552) | $ (5,141,517) | $ (6,371,605) |
| Change in unrealized appreciation (depreciation): | | | |
| Investments | $ 3,261,365 | $ 2,102,260 | $ 2,901,954 |
| Net change in unrealized appreciation (depreciation) | $ 3,261,365 | $ 2,102,260 | $ 2,901,954 |
| Net realized and unrealized loss | $(20,379,187) | $ (3,039,257) | $ (3,469,651) |
| Net increase in net assets from operations | $ 7,495,839 | $ 5,073,198 | $ 2,764,122 |
35
See Notes to Financial Statements.
Eaton Vance
Municipal Bond Funds
September 30, 2023
Statements of Changes in Net Assets
| | Year Ended September 30, 2023 |
| | Municipal Fund | California Fund | New York Fund |
| Increase (Decrease) in Net Assets | | | |
| From operations: | | | |
| Net investment income | $ 27,875,026 | $ 8,112,455 | $ 6,233,773 |
| Net realized loss | (23,640,552) | (5,141,517) | (6,371,605) |
| Net change in unrealized appreciation (depreciation) | 3,261,365 | 2,102,260 | 2,901,954 |
| Net increase in net assets from operations | $ 7,495,839 | $ 5,073,198 | $ 2,764,122 |
| Distributions to common shareholders | $ (27,527,620) | $ (7,743,226) | $ (6,401,404) |
| Tax return of capital to common shareholders | $ (2,411,030) | $ (1,213,051) | $ — |
| Capital share transactions: | | | |
| Cost of shares repurchased (see Note 5) | $ (8,115,776) | $ — | $ — |
| Net decrease in net assets from capital share transactions | $ (8,115,776) | $ — | $ — |
| Net decrease in net assets | $ (30,558,587) | $ (3,883,079) | $ (3,637,282) |
| Net Assets | | | |
| At beginning of year | $ 780,476,302 | $ 240,051,072 | $ 178,045,976 |
| At end of year | $749,917,715 | $236,167,993 | $174,408,694 |
36
See Notes to Financial Statements.
Eaton Vance
Municipal Bond Funds
September 30, 2023
Statements of Changes in Net Assets — continued
| | Year Ended September 30, 2022 |
| | Municipal Fund | California Fund | New York Fund |
| Increase (Decrease) in Net Assets | | | |
| From operations: | | | |
| Net investment income | $ 37,556,152 | $ 10,820,634 | $ 7,678,849 |
| Net realized loss | (31,659,488) | (7,865,315) | (13,594,140) |
| Net change in unrealized appreciation (depreciation) | (189,740,034) | (60,092,184) | (47,426,480) |
| Net decrease in net assets from operations | $ (183,843,370) | $ (57,136,865) | $ (53,341,771) |
| Distributions to common shareholders | $ (39,502,298) | $ (11,203,143) | $ (7,564,013) |
| Tax return of capital to common shareholders | $ — | $ (262,187) | $ — |
| Capital share transactions: | | | |
| Cost of shares repurchased (see Note 5) | $ — | $ (2,981,867) | $ (1,495,853) |
| Net decrease in net assets from capital share transactions | $ — | $ (2,981,867) | $ (1,495,853) |
| Net decrease in net assets | $ (223,345,668) | $ (71,584,062) | $ (62,401,637) |
| Net Assets | | | |
| At beginning of year | $1,003,821,970 | $ 311,635,134 | $ 240,447,613 |
| At end of year | $ 780,476,302 | $240,051,072 | $178,045,976 |
37
See Notes to Financial Statements.
Eaton Vance
Municipal Bond Funds
September 30, 2023
| | Year Ended September 30, 2023 |
| | Municipal Fund | California Fund | New York Fund |
| Cash Flows From Operating Activities | | | |
| Net increase in net assets from operations | $ 7,495,839 | $ 5,073,198 | $ 2,764,122 |
| Adjustments to reconcile net increase in net assets from operations to net cash provided by operating activities: | | | |
| Investments purchased | (648,859,093) | (144,900,392) | (155,262,774) |
| Investments sold | 891,588,435 | 258,297,581 | 195,395,394 |
| Net amortization/accretion of premium (discount) | 1,885,242 | 1,502,579 | 1,088,156 |
| Decrease in interest receivable | 4,513,079 | 1,006,050 | 802,031 |
| Increase in Trustees’ deferred compensation plan | (289,130) | (95,965) | (70,901) |
| Decrease in payable to affiliate for investment adviser fee | (106,937) | (51,892) | (14,898) |
| Increase (decrease) in interest expense and fees payable | 210,299 | (67,301) | 170,859 |
| Increase in payable to affiliate for Trustees' deferred compensation plan | 289,130 | 95,965 | 70,901 |
| Increase (decrease) in accrued expenses | (7,542) | 12,100 | 962 |
| Net change in unrealized (appreciation) depreciation from investments | (3,261,365) | (2,102,260) | (2,901,954) |
| Net realized loss from investments | 23,640,552 | 5,141,517 | 6,371,605 |
| Net cash provided by operating activities | $ 277,098,509 | $ 123,911,180 | $ 48,413,503 |
| Cash Flows From Financing Activities | | | |
| Cash distributions paid to common shareholders | $ (29,938,650) | $ (8,956,277) | $ (6,401,404) |
| Repurchases of common shares | (8,115,776) | — | — |
| Proceeds from secured borrowings | 255,450,000 | 16,000,000 | 55,445,000 |
| Repayment of secured borrowings | (493,925,000) | (129,465,000) | (97,350,000) |
| Increase (decrease) in due to custodian | 1,680,917 | (1,679,903) | (657,099) |
| Net cash used in financing activities | $(274,848,509) | $(124,101,180) | $ (48,963,503) |
| Net increase (decrease) in cash and restricted cash | $ 2,250,000 | $ (190,000) | $ (550,000) |
| Cash and restricted cash at beginning of year | $ — | $ 840,000 | $ 550,000 |
| Cash and restricted cash at end of year | $ 2,250,000 | $ 650,000 | $ — |
| Supplemental disclosure of cash flow information: | | | |
| Cash paid for interest and fees | $ 16,932,505 | $ 5,028,992 | $ 4,244,397 |
38
See Notes to Financial Statements.
Eaton Vance
Municipal Bond Funds
September 30, 2023
| | Municipal Fund |
| | Year Ended September 30, |
| | 2023 | 2022 | 2021 | 2020 | 2019 |
| Net asset value — Beginning of year | $ 10.850 | $ 13.950 | $ 14.050 | $ 13.980 | $ 12.940 |
| Income (Loss) From Operations | | | | | |
| Net investment income(1) | $ 0.390 | $ 0.522 | $ 0.593 | $ 0.571 | $ 0.522 |
| Net realized and unrealized gain (loss) | (0.296) | (3.073) | (0.098) | 0.033 | 0.982 |
| Total income (loss) from operations | $ 0.094 | $ (2.551) | $ 0.495 | $ 0.604 | $ 1.504 |
| Less Distributions | | | | | |
| From net investment income | $ (0.385) | $ (0.549) | $ (0.595) | $ (0.563) | $ (0.517) |
| Tax return of capital | (0.034) | — | — | — | — |
| Total distributions | $ (0.419) | $ (0.549) | $ (0.595) | $ (0.563) | $ (0.517) |
| Anti-dilutive effect of share repurchase program (see Note 5)(1) | $ 0.015 | $ — | $ — | $ — | $ 0.022 |
| Discount on tender offer(1) | $ — | $ — | $ — | $ 0.029 | $ 0.031 |
| Net asset value — End of year | $ 10.540 | $ 10.850 | $ 13.950 | $ 14.050 | $ 13.980 |
| Market value — End of year | $ 8.960 | $ 9.680 | $ 13.380 | $ 13.170 | $ 12.960 |
| Total Investment Return on Net Asset Value(2) | 1.30% | (18.50)% | 3.75% | 4.99% | 12.72% |
| Total Investment Return on Market Value(2) | (3.47)% | (24.19)% | 6.16% | 6.15% | 17.28% |
| Ratios/Supplemental Data | | | | | |
| Net assets, end of year (000’s omitted) | $749,918 | $780,476 | $1,003,822 | $1,011,234 | $1,114,236 |
| Ratios (as a percentage of average daily net assets): | | | | | |
| Expenses excluding interest and fees | 1.05% | 1.09% | 1.09% | 1.13% | 1.11% |
| Interest and fee expense(3) | 2.12% | 0.78% | 0.41% | 1.05% | 1.51% |
| Total expenses | 3.17% | 1.87% | 1.50% | 2.18% | 2.62% |
| Net investment income | 3.44% | 4.12% | 4.18% | 4.09% | 3.89% |
| Portfolio Turnover | 52% | 35% | 10% | 7% | 18% |
| (1) | Computed using average shares outstanding. |
| (2) | Returns are historical and are calculated by determining the percentage change in net asset value or market value with all distributions reinvested. Distributions are assumed to be reinvested at prices obtained under the Fund's dividend reinvestment plan. |
| (3) | Interest and fee expense relates to the liability for floating rate notes issued in conjunction with residual interest bond transactions (see Note 1G). |
39
See Notes to Financial Statements.
Eaton Vance
Municipal Bond Funds
September 30, 2023
Financial Highlights — continued
| | California Fund |
| | Year Ended September 30, |
| | 2023 | 2022 | 2021 | 2020 | 2019 |
| Net asset value — Beginning of year | $ 9.730 | $ 12.470 | $ 12.660 | $ 12.570 | $ 11.780 |
| Income (Loss) From Operations | | | | | |
| Net investment income(1) | $ 0.329 | $ 0.434 | $ 0.503 | $ 0.473 | $ 0.438 |
| Net realized and unrealized gain (loss) | (0.126) | (2.730) | (0.190) | 0.080 | 0.802 |
| Total income (loss) from operations | $ 0.203 | $ (2.296) | $ 0.313 | $ 0.553 | $ 1.240 |
| Less Distributions | | | | | |
| From net investment income | $ (0.314) | $ (0.448) | $ (0.503) | $ (0.463) | $ (0.454) |
| Tax return of capital | (0.049) | (0.011) | — | — | (0.020) |
| Total distributions | $ (0.363) | $ (0.459) | $ (0.503) | $ (0.463) | $ (0.474) |
| Anti-dilutive effect of share repurchase program (see Note 5)(1) | $ — | $ 0.015 | $ — | $ — | $ 0.024 |
| Net asset value — End of year | $ 9.570 | $ 9.730 | $ 12.470 | $ 12.660 | $ 12.570 |
| Market value — End of year | $ 8.120 | $ 8.510 | $ 11.940 | $ 11.360 | $ 11.330 |
| Total Investment Return on Net Asset Value(2) | 2.50% | (18.37)% | 2.78% | 4.93% | 11.54% |
| Total Investment Return on Market Value(2) | (0.56)% | (25.43)% | 9.67% | 4.46% | 18.91% |
| Ratios/Supplemental Data | | | | | |
| Net assets, end of year (000’s omitted) | $236,168 | $240,051 | $311,635 | $316,361 | $314,277 |
| Ratios (as a percentage of average daily net assets): | | | | | |
| Expenses excluding interest and fees | 1.07% | 1.14% | 1.11% | 1.12% | 1.15% |
| Interest and fee expense(3) | 1.97% | 0.85% | 0.40% | 1.00% | 1.59% |
| Total expenses | 3.04% | 1.99% | 1.51% | 2.12% | 2.74% |
| Net investment income | 3.22% | 3.81% | 3.96% | 3.76% | 3.61% |
| Portfolio Turnover | 37% | 43% | 19% | 20% | 17% |
| (1) | Computed using average shares outstanding. |
| (2) | Returns are historical and are calculated by determining the percentage change in net asset value or market value with all distributions reinvested. Distributions are assumed to be reinvested at prices obtained under the Fund's dividend reinvestment plan. |
| (3) | Interest and fee expense relates to the liability for floating rate notes issued in conjunction with residual interest bond transactions (see Note 1G). |
40
See Notes to Financial Statements.
Eaton Vance
Municipal Bond Funds
September 30, 2023
Financial Highlights — continued
| | New York Fund |
| | Year Ended September 30, |
| | 2023 | 2022 | 2021 | 2020 | 2019 |
| Net asset value — Beginning of year | $ 9.910 | $ 13.270 | $ 13.250 | $ 13.480 | $ 12.770 |
| Income (Loss) From Operations | | | | | |
| Net investment income(1) | $ 0.347 | $ 0.424 | $ 0.492 | $ 0.490 | $ 0.476 |
| Net realized and unrealized gain (loss) | (0.191) | (3.377) | 0.037 | (0.236) | 0.745 |
| Total income (loss) from operations | $ 0.156 | $ (2.953) | $ 0.529 | $ 0.254 | $ 1.221 |
| Less Distributions | | | | | |
| From net investment income | $ (0.356) | $ (0.418) | $ (0.498) | $ (0.484) | $ (0.497) |
| Tax return of capital | — | — | (0.011) | — | (0.014) |
| Total distributions | $ (0.356) | $ (0.418) | $ (0.509) | $ (0.484) | $ (0.511) |
| Anti-dilutive effect of share repurchase program (see Note 5)(1) | $ — | $ 0.011 | $ — | $ — | $ — |
| Net asset value — End of year | $ 9.710 | $ 9.910 | $ 13.270 | $ 13.250 | $ 13.480 |
| Market value — End of year | $ 8.290 | $ 8.450 | $ 12.270 | $ 11.800 | $ 12.440 |
| Total Investment Return on Net Asset Value(2) | 1.82% | (22.30)% | 4.34% | 2.37% | 10.25% |
| Total Investment Return on Market Value(2) | 1.95% | (28.32)% | 8.30% | (1.21)% | 17.47% |
| Ratios/Supplemental Data | | | | | |
| Net assets, end of year (000’s omitted) | $174,409 | $178,046 | $240,448 | $240,042 | $244,319 |
| Ratios (as a percentage of average daily net assets): | | | | | |
| Expenses excluding interest and fees | 1.11% | 1.07% | 1.06% | 1.09% | 1.10% |
| Interest and fee expense(3) | 2.33% | 0.66% | 0.35% | 0.93% | 1.38% |
| Total expenses | 3.44% | 1.73% | 1.41% | 2.02% | 2.48% |
| Net investment income | 3.29% | 3.55% | 3.65% | 3.68% | 3.63% |
| Portfolio Turnover | 54% | 61% | 15% | 31% | 25% |
| (1) | Computed using average shares outstanding. |
| (2) | Returns are historical and are calculated by determining the percentage change in net asset value or market value with all distributions reinvested. Distributions are assumed to be reinvested at prices obtained under the Fund's dividend reinvestment plan. |
| (3) | Interest and fee expense relates to the liability for floating rate notes issued in conjunction with residual interest bond transactions (see Note 1G). |
41
See Notes to Financial Statements.
Eaton Vance
Municipal Bond Funds
September 30, 2023
Notes to Financial Statements
1 Significant Accounting Policies
Eaton Vance Municipal Bond Fund (Municipal Fund), Eaton Vance California Municipal Bond Fund (California Fund) and Eaton Vance New York Municipal Bond Fund (New York Fund), (each individually referred to as the Fund, and collectively, the Funds), are Massachusetts business trusts registered under the Investment Company Act of 1940, as amended (the 1940 Act). New York Fund is a as non-diversified, closed-end management investment company. Municipal Fund and California Fund are diversified closed-end management investment companies. The Funds' investment objective is to provide current income exempt from regular federal income tax and, in state specific funds, taxes in their specified state and city (if any).
The following is a summary of significant accounting policies of the Funds. The policies are in conformity with accounting principles generally accepted in the United States of America (U.S. GAAP). Each Fund is an investment company and follows accounting and reporting guidance in the Financial Accounting Standards Board (FASB) Accounting Standards Codification Topic 946.
A Investment Valuation—The following methodologies are used to determine the market value or fair value of investments.
Debt Obligations. Debt obligations are generally valued on the basis of valuations provided by third party pricing services, as derived from such services’ pricing models. Inputs to the models may include, but are not limited to, reported trades, executable bid and ask prices, broker/dealer quotations, prices or yields of securities with similar characteristics, interest rates, anticipated prepayments, benchmark curves or information pertaining to the issuer, as well as industry and economic events. The pricing services may use a matrix approach, which considers information regarding securities with similar characteristics to determine the valuation for a security. Short-term debt obligations purchased with a remaining maturity of sixty days or less for which a valuation from a third party pricing service is not readily available may be valued at amortized cost, which approximates fair value.
Fair Valuation. In connection with Rule 2a-5 of the 1940 Act, the Trustees have designated a Fund’s investment adviser as its valuation designee. Investments for which valuations or market quotations are not readily available or are deemed unreliable are valued by the investment adviser, as valuation designee, at fair value using methods that most fairly reflect the security’s “fair value”, which is the amount that a Fund might reasonably expect to receive for the security upon its current sale in the ordinary course. Each such determination is based on a consideration of relevant factors, which are likely to vary from one pricing context to another. These factors may include, but are not limited to, the type of security, the existence of any contractual restrictions on the security’s disposition, the price and extent of public trading in similar securities of the issuer or of comparable companies or entities, quotations or relevant information obtained from broker/dealers or other market participants, information obtained from the issuer, analysts, and/or the appropriate stock exchange (for exchange-traded securities), an analysis of the company’s or entity’s financial statements, and an evaluation of the forces that influence the issuer and the market(s) in which the security is purchased and sold.
B Investment Transactions and Related Income—Investment transactions for financial statement purposes are accounted for on a trade date basis. Realized gains and losses on investments sold are determined on the basis of identified cost. Interest income is recorded on the basis of interest accrued, adjusted for amortization of premium or accretion of discount.
C Federal Taxes—Each Fund’s policy is to comply with the provisions of the Internal Revenue Code applicable to regulated investment companies and to distribute to shareholders each year substantially all of its taxable, if any, and tax-exempt net investment income, and all or substantially all of its net realized capital gains. Accordingly, no provision for federal income or excise tax is necessary. Each Fund intends to satisfy conditions which will enable it to designate distributions from the interest income generated by its investments in non-taxable municipal securities, which are exempt from regular federal income tax when received by each Fund, as exempt-interest dividends. The portion of such interest, if any, earned on private activity bonds issued after August 7, 1986, may be considered a tax preference item to shareholders.
As of September 30, 2023, the Funds had no uncertain tax positions that would require financial statement recognition, de-recognition, or disclosure. Each Fund files a U.S. federal income tax return annually after its fiscal year-end, which is subject to examination by the Internal Revenue Service for a period of three years from the date of filing.
D Legal Fees—Legal fees and other related expenses incurred as part of negotiations of the terms and requirement of capital infusions, or that are expected to result in the restructuring of, or a plan of reorganization for, an investment are recorded as realized losses. Ongoing expenditures to protect or enhance an investment are treated as operating expenses.
E Use of Estimates—The preparation of the financial statements in conformity with U.S. GAAP requires management to make estimates and assumptions that affect the reported amounts of assets and liabilities at the date of the financial statements and the reported amounts of income and expense during the reporting period. Actual results could differ from those estimates.
F Indemnifications—Under each Fund’s organizational documents, its officers and Trustees may be indemnified against certain liabilities and expenses arising out of the performance of their duties to each Fund. Under Massachusetts law, if certain conditions prevail, shareholders of a Massachusetts business trust (such as a Fund) could be deemed to have personal liability for the obligations of the Fund. However, each Fund’s Declaration of Trust contains an express disclaimer of liability on the part of Fund shareholders and the By-laws provide that the Fund shall assume, upon request by the shareholder, the defense on behalf of any Fund shareholders. Moreover, the By-laws also provide for indemnification out of Fund property of any shareholder held personally liable solely by reason of being or having been a shareholder for all loss or expense arising from such liability. Additionally, in
Eaton Vance
Municipal Bond Funds
September 30, 2023
Notes to Financial Statements — continued
the normal course of business, each Fund enters into agreements with service providers that may contain indemnification clauses. Each Fund’s maximum exposure under these arrangements is unknown as this would involve future claims that may be made against each Fund that have not yet occurred.
G Floating Rate Notes Issued in Conjunction with Securities Held—The Funds may invest in residual interest bonds, also referred to as inverse floating rate securities, whereby a Fund may sell a variable or fixed rate bond for cash to a Special-Purpose Vehicle (the SPV), (which is generally organized as a trust), while at the same time, buying a residual interest in the assets and cash flows of the SPV. The bond is deposited into the SPV with the same CUSIP number as the bond sold to the SPV by the Fund, and which may have been, but is not required to be, the bond purchased from the Fund (the Bond). The SPV also issues floating rate notes (Floating Rate Notes) which are sold to third-parties. The residual interest bond held by a Fund gives the Fund the right (1) to cause the holders of the Floating Rate Notes to generally tender their notes at par, and (2) to have the Bond held by the SPV transferred to the Fund, thereby terminating the SPV. Should the Fund exercise such right, it would generally pay the SPV the par amount due on the Floating Rate Notes and exchange the residual interest bond for the underlying Bond. Pursuant to generally accepted accounting principles for transfers and servicing of financial assets and extinguishment of liabilities, the Funds account for the transaction described above as a secured borrowing by including the Bond in their Portfolio of Investments and the Floating Rate Notes as a liability under the caption “Payable for floating rate notes issued” in their Statement of Assets and Liabilities. The Floating Rate Notes have interest rates that generally reset weekly and their holders have the option to tender their notes to the SPV for redemption at par at each reset date. Accordingly, the fair value of the payable for floating rate notes issued approximates its carrying value. If measured at fair value, the payable for floating rate notes would have been considered as Level 2 in the fair value hierarchy (see Note 6) at September 30, 2023. Interest expense related to a Fund’s liability with respect to Floating Rate Notes is recorded as incurred. The SPV may be terminated by the Fund, as noted above, or by the occurrence of certain termination events as defined in the trust agreement, such as a downgrade in the credit quality of the underlying Bond, bankruptcy of or payment failure by the issuer of the underlying Bond, the inability to remarket Floating Rate Notes that have been tendered due to insufficient buyers in the market, or the failure by the SPV to obtain renewal of the liquidity agreement under which liquidity support is provided for the Floating Rate Notes up to one year. At September 30, 2023, the amounts of the Funds’ Floating Rate Notes and related interest rates and collateral were as follows:
| | Municipal
Fund | California
Fund | New York
Fund |
| Floating Rate Notes Outstanding | $356,644,991 | $104,299,522 | $ 86,244,658 |
| Interest Rate or Range of Interest Rates (%) | 3.98 - 4.28 | 3.87 - 4.06 | 4.01 - 4.18 |
| Collateral for Floating Rate Notes Outstanding | $461,581,032 | $132,340,357 | $108,534,045 |
In addition, at September 30, 2023, Municipal Fund and California Fund pledged cash collateral of $2,250,000 and $650,000, respectively, for the benefit of a liquidity provider for certain Floating Rate Notes. Such collateral is reflected as restricted cash on the Statement of Assets and Liabilities.
For the year ended September 30, 2023, the Funds’ average settled Floating Rate Notes outstanding and the average interest rate including fees were as follows:
| | Municipal
Fund | California
Fund | New York
Fund |
| Average Floating Rate Notes Outstanding | $481,541,014 | $140,115,000 | $118,455,753 |
| Average Interest Rate | 3.56% | 3.54% | 3.73% |
In certain circumstances, the Funds may enter into shortfall and forbearance agreements with brokers by which a Fund agrees to reimburse the broker for the difference between the liquidation value of the Bond held by the SPV and the liquidation value of the Floating Rate Notes, as well as any shortfalls in interest cash flows. The Funds had no shortfalls as of September 30, 2023.
The Funds may also purchase residual interest bonds in a secondary market transaction without first owning the underlying bond. Such transactions are not required to be treated as secured borrowings. Shortfall agreements, if any, related to residual interest bonds purchased in a secondary market transaction are disclosed in the Portfolio of Investments.
The Funds' investment policies and restrictions expressly permit investments in residual interest bonds. Such bonds typically offer the potential for yields exceeding the yields available on fixed rate bonds with comparable credit quality and maturity. These securities tend to underperform the market for fixed rate bonds in a rising long-term interest rate environment, but tend to outperform the market for fixed rate bonds when long-term interest rates decline. The value and income of residual interest bonds are generally more volatile than that of a fixed rate bond. The Funds' investment policies do not allow the Funds to borrow money except as permitted by the 1940 Act. Effective August 19, 2022, the Funds began operating under Rule 18f-4 under the 1940 Act, which, among other things, governs the use of derivative investments and certain financing transactions by registered investment companies. Consistent with Rule 18f-4, the Funds may treat their investments in residual interest bonds and similar financing transactions as subject to the asset
Eaton Vance
Municipal Bond Funds
September 30, 2023
Notes to Financial Statements — continued
coverage requirements of Section 18 of the 1940 Act, or as derivatives transactions subject to the Funds' value-at-risk (VaR)-based limits on leverage risk. Effective October 11, 2023, the Funds have opted to treat such investments as derivatives transactions. The Funds may change this approach at any time. Residual interest bonds held by the Funds are securities exempt from registration under Rule 144A of the Securities Act of 1933.
H When-Issued Securities and Delayed Delivery Transactions—The Funds may purchase securities on a delayed delivery or when-issued basis. Payment and delivery may take place after the customary settlement period for that security. At the time the transaction is negotiated, the price of the security that will be delivered is fixed. The Funds maintain cash and/or security positions for these commitments such that sufficient liquid assets will be available to make payments upon settlement. Securities purchased on a delayed delivery or when-issued basis are marked-to-market daily and begin earning interest on settlement date. Such security purchases are subject to the risk that when delivered they will be worth less than the agreed upon payment price. Losses may also arise if the counterparty does not perform under the contract.
2 Distributions to Shareholders and Income Tax Information
Each Fund intends to make monthly distributions of net investment income to common shareholders. In addition, at least annually, each Fund intends to distribute all or substantially all of its net realized capital gains. Distributions are recorded on the ex-dividend date. Distributions to shareholders are determined in accordance with income tax regulations, which may differ from U.S. GAAP. As required by U.S. GAAP, only distributions in excess of tax basis earnings and profits are reported in the financial statements as a return of capital. Permanent differences between book and tax accounting relating to distributions are reclassified to paid-in capital. For tax purposes, distributions from short-term capital gains are considered to be from ordinary income.
The tax character of distributions declared for the years ended September 30, 2023 and September 30, 2022 was as follows:
| | Year Ended September 30, 2023 |
| | Municipal
Fund | California
Fund | New York
Fund |
| Tax-exempt income | $27,017,470 | $7,245,788 | $6,146,878 |
| Ordinary income | $ 510,150 | $ 497,438 | $ 254,526 |
| Tax return of capital | $ 2,411,030 | $1,213,051 | $ — |
| | Year Ended September 30, 2022 |
| | Municipal
Fund | California
Fund | New York
Fund |
| Tax-exempt income | $38,891,231 | $10,619,255 | $7,447,497 |
| Ordinary income | $ 611,067 | $ 583,888 | $ 116,516 |
| Tax return of capital | $ — | $ 262,187 | $ — |
During the year ended September 30, 2023, accumulated loss was decreased by $27,020 and paid-in capital was decreased by $27,020 for New York Fund due to the tax treatment of distributions in excess of net tax-exempt income. These reclassifications had no effect on the net assets or net asset value per share of New York Fund.
As of September 30, 2023, the components of distributable earnings (accumulated loss) on a tax basis were as follows:
| | Municipal
Fund | California
Fund | New York
Fund |
| Deferred capital losses | $ (97,027,104) | $ (49,211,492) | $ (33,297,778) |
| Net unrealized depreciation | (35,666,661) | (22,207,861) | (20,392,027) |
| Accumulated loss | $(132,693,765) | $(71,419,353) | $(53,689,805) |
At September 30, 2023, the following Funds, for federal income tax purposes, had deferred capital losses which would reduce the respective Fund’s taxable income arising from future net realized gains on investment transactions, if any, to the extent permitted by the Internal Revenue Code, and thus
Eaton Vance
Municipal Bond Funds
September 30, 2023
Notes to Financial Statements — continued
would reduce the amount of distributions to shareholders, which would otherwise be necessary to relieve the Funds of any liability for federal income or excise tax. The deferred capital losses are treated as arising on the first day of a Fund’s next taxable year and retain the same short-term or long-term character as when originally deferred. The amounts of the deferred capital losses are as follows:
| | Municipal
Fund | California
Fund | New York
Fund |
| Deferred capital losses: | | | |
| Short-term | $66,373,889 | $21,602,827 | $15,695,787 |
| Long-term | $30,653,215 | $27,608,665 | $17,601,991 |
The cost and unrealized appreciation (depreciation) of investments of each Fund at September 30, 2023, as determined on a federal income tax basis, were as follows:
| | Municipal
Fund | California
Fund | New York
Fund |
| Aggregate cost | $ 777,712,725 | $ 262,172,403 | $ 194,312,566 |
| Gross unrealized appreciation | $ 13,641,238 | $ 1,369,960 | $ 664,186 |
| Gross unrealized depreciation | (49,307,899) | (23,577,821) | (21,056,213) |
| Net unrealized depreciation | $ (35,666,661) | $ (22,207,861) | $ (20,392,027) |
3 Investment Adviser Fee and Other Transactions with Affiliates
The investment adviser fee is earned by Eaton Vance Management (EVM), an indirect, wholly-owned subsidiary of Morgan Stanley, as compensation for investment advisory services rendered to each Fund. The investment adviser fee is computed at an annual rate of 0.60% of each Fund’s average weekly gross assets and is payable monthly. Gross assets of a Fund are calculated by deducting accrued liabilities of the Fund except (i) the principal amount of any indebtedness for money borrowed, including debt securities issued by the Fund and the amount of floating-rate notes included as a liability in the Fund’s Statement of Assets and Liabilities of up to $801,875,000 for Municipal Fund, $228,750,000 for California Fund and $165,000,000 for New York Fund, and (ii) the amount of any outstanding preferred shares issued by the Fund. EVM also serves as the administrator of each Fund, but receives no compensation. For the year ended September 30, 2023, the investment adviser fees were as follows:
| | Municipal
Fund | California
Fund | New York
Fund |
| Investment Adviser Fee | $7,816,647 | $2,373,503 | $1,848,611 |
Trustees and officers of the Funds who are members of EVM’s organization receive remuneration for their services to the Funds out of the investment adviser fee. Trustees of the Funds who are not affiliated with EVM may elect to defer receipt of all or a percentage of their annual fees in accordance with the terms of the Trustees Deferred Compensation Plan. Certain officers and Trustees of the Funds are officers of EVM.
4 Purchases and Sales of Investments
Purchases and sales of investments, other than short-term obligations, for the year ended September 30, 2023 were as follows:
| | Municipal
Fund | California
Fund | New York
Fund |
| Purchases | $656,815,067 | $144,024,378 | $159,001,452 |
| Sales | $906,253,186 | $235,860,571 | $198,179,161 |
Eaton Vance
Municipal Bond Funds
September 30, 2023
Notes to Financial Statements — continued
5 Common Shares of Beneficial Interest
The Funds may issue common shares pursuant to their dividend reinvestment plans. There were no common shares issued by the Funds for the years ended September 30, 2023 and September 30, 2022 pursuant to such plans.
In November 2013, the Board of Trustees initially approved a share repurchase program for the Funds. Pursuant to the reauthorization of the share repurchase program by the Board of Trustees in March 2019, each Fund is authorized to repurchase up to 10% of its common shares outstanding as of the last day of the prior calendar year at market prices when shares are trading at a discount to net asset value (NAV). The share repurchase program does not obligate a Fund to purchase a specific amount of shares. During the years ended September 30, 2023 and September 30, 2022, the number, cost (including brokerage commissions), average price per share and weighted average discount per share to NAV of common shares repurchased, were as follows:
| | Year Ended September 30, 2023 |
| | Municipal
Fund |
| Common shares repurchased | 800,000 |
| Cost, including brokerage commissions, of common shares repurchased | $8,115,776 |
| Average price per share | $ 10.14 |
| Weighted average discount per share to NAV | 11.58% |
| | Year Ended September 30, 2022 |
| | California
Fund | New York
Fund |
| Common shares repurchased | 321,400 | 157,005 |
| Cost, including brokerage commissions, of common shares repurchased | $2,981,867 | $1,495,853 |
| Average price per share | $ 9.28 | $ 9.53 |
| Weighted average discount per share to NAV | 11.42% | 11.83% |
There were no repurchases of common shares by California Fund and New York Fund for the year ended September 30, 2023. There were no repurchases of common shares by Municipal Fund for the year ended September 30, 2022.
At September 30, 2023, according to the filings made on Schedule 13D and 13G pursuant to Sections 13(d) and 13(g) of the Securities Exchange Act of 1934, as amended, three affiliated entities together owned 10.0% of California Fund's common shares and 13.5% of New York Fund's common shares.
6 Fair Value Measurements
Under generally accepted accounting principles for fair value measurements, a three-tier hierarchy to prioritize the assumptions, referred to as inputs, is used in valuation techniques to measure fair value. The three-tier hierarchy of inputs is summarized in the three broad levels listed below.
| • | Level 1 – quoted prices in active markets for identical investments |
| • | Level 2 – other significant observable inputs (including quoted prices for similar investments, interest rates, prepayment speeds, credit risk, etc.) |
| • | Level 3 – significant unobservable inputs (including a fund's own assumptions in determining the fair value of investments) |
In cases where the inputs used to measure fair value fall in different levels of the fair value hierarchy, the level disclosed is determined based on the lowest level input that is significant to the fair value measurement in its entirety. The inputs or methodology used for valuing securities are not necessarily an indication of the risk associated with investing in those securities.
Eaton Vance
Municipal Bond Funds
September 30, 2023
Notes to Financial Statements — continued
At September 30, 2023, the hierarchy of inputs used in valuing the Funds' investments, which are carried at value, were as follows:
| Municipal Fund | | | | |
| Asset Description | Level 1 | Level 2 | Level 3 | Total |
| Corporate Bonds | $ — | $ 8,110,829 | $ — | $ 8,110,829 |
| Tax-Exempt Mortgage-Backed Securities | — | 2,674,337 | — | 2,674,337 |
| Tax-Exempt Municipal Obligations | — | 1,087,047,374 | — | 1,087,047,374 |
| Trust Units | — | 858,515 | — | 858,515 |
| Total Investments | $ — | $1,098,691,055 | $ — | $1,098,691,055 |
| California Fund | | | | |
| Asset Description | Level 1 | Level 2 | Level 3 | Total |
| Tax-Exempt Municipal Obligations | $ — | $ 328,778,163 | $ — | $ 328,778,163 |
| Taxable Municipal Obligations | — | 14,504,731 | — | 14,504,731 |
| Trust Units | — | 981,170 | — | 981,170 |
| Total Investments | $ — | $ 344,264,064 | $ — | $ 344,264,064 |
| New York Fund | | | | |
| Asset Description | Level 1 | Level 2 | Level 3 | Total |
| Corporate Bonds | $ — | $ 788,309 | $ — | $ 788,309 |
| Tax-Exempt Municipal Obligations | — | 256,896,065 | — | 256,896,065 |
| Taxable Municipal Obligations | — | 1,499,653 | — | 1,499,653 |
| Trust Units | — | 981,170 | — | 981,170 |
| Total Investments | $ — | $ 260,165,197 | $ — | $ 260,165,197 |
Eaton Vance
Municipal Bond Funds
September 30, 2023
Report of Independent Registered Public Accounting Firm
To the Trustees and Shareholders of Eaton Vance Municipal Bond Fund, Eaton Vance California Municipal Bond Fund and Eaton Vance New York Municipal Bond Fund:
Opinion on the Financial Statements and Financial Highlights
We have audited the accompanying statements of assets and liabilities of Eaton Vance Municipal Bond Fund, Eaton Vance California Municipal Bond Fund and Eaton Vance New York Municipal Bond Fund (collectively, the “Funds”), including the portfolios of investments, as of September 30, 2023, the related statements of operations and cash flows for the year then ended, the statements of changes in net assets for each of the two years in the period then ended, the financial highlights for each of the five years in the period then ended, and the related notes. In our opinion, the financial statements and financial highlights present fairly, in all material respects, the financial position of each of the Funds as of September 30, 2023, and the results of their operations and their cash flows for the year then ended, the changes in their net assets for each of the two years in the period then ended, and the financial highlights for each of the five years in the period then ended, in conformity with accounting principles generally accepted in the United States of America.
Basis for Opinion
These financial statements and financial highlights are the responsibility of the Funds’ management. Our responsibility is to express an opinion on the Funds’ financial statements and financial highlights based on our audits. We are a public accounting firm registered with the Public Company Accounting Oversight Board (United States) (PCAOB) and are required to be independent with respect to the Funds in accordance with the U.S. federal securities laws and the applicable rules and regulations of the Securities and Exchange Commission and the PCAOB.
We conducted our audits in accordance with the standards of the PCAOB. Those standards require that we plan and perform the audit to obtain reasonable assurance about whether the financial statements and financial highlights are free of material misstatement, whether due to error or fraud. The Funds are not required to have, nor were we engaged to perform, an audit of their internal control over financial reporting. As part of our audits, we are required to obtain an understanding of internal control over financial reporting but not for the purpose of expressing an opinion on the effectiveness of the Funds’ internal control over financial reporting. Accordingly, we express no such opinion.
Our audits included performing procedures to assess the risks of material misstatement of the financial statements and financial highlights, whether due to error or fraud, and performing procedures that respond to those risks. Such procedures included examining, on a test basis, evidence regarding the amounts and disclosures in the financial statements and financial highlights. Our audits also included evaluating the accounting principles used and significant estimates made by management, as well as evaluating the overall presentation of the financial statements and financial highlights. Our procedures included confirmation of securities owned as of September 30, 2023, by correspondence with the custodian and brokers; when replies were not received from brokers, we performed other auditing procedures. We believe that our audits provide a reasonable basis for our opinion.
/s/ Deloitte & Touche LLP
Boston, Massachusetts
November 20, 2023
We have served as the auditor of one or more Eaton Vance investment companies since 1959.
Eaton Vance
Municipal Bond Funds
September 30, 2023
Federal Tax Information (Unaudited)
The Form 1099-DIV you receive in February 2024 will show the tax status of all distributions paid to your account in calendar year 2023. Shareholders are advised to consult their own tax adviser with respect to the tax consequences of their investment in the Funds. As required by the Internal Revenue Code and/or regulations, shareholders must be notified regarding the status of exempt-interest dividends.
Exempt-Interest Dividends. For the fiscal year ended September 30, 2023, the Funds designate the following percentages of distributions from net investment income as exempt-interest dividends:
| Municipal Bond Fund | 98.30% |
| California Municipal Bond Fund | 94.45% |
| New York Municipal Bond Fund | 96.02% |
Eaton Vance
Municipal Bond Funds
September 30, 2023
Annual Meeting of Shareholders (Unaudited)
Municipal Bond Fund held its Annual Meeting of Shareholders on July 12, 2023 and California Municipal Bond Fund and New York Municipal Bond Fund held their Annual Meeting of Shareholders on August 11, 2023. The following action was taken by the shareholders:
Proposal 1(b). The election of Alan C. Bowser, George J. Gorman, Marcus L. Smith and Susan J. Sutherland as Class III Trustees of the Fund, each for a three-year term ending in 2026.
| | Nominee for Trustee:
Alan C. Bowser | Nominee for Trustee:
George J. Gorman | Nominee for Trustee:
Marcus L. Smith | Nominee for Trustee:
Susan J. Sutherland |
| Municipal Fund | | | | |
| For | 47,336,134 | 45,627,213 | 47,436,728 | 47,410,561 |
| Withheld | 11,185,938 | 12,894,859 | 11,085,344 | 11,111,511 |
Proposal 1(a). The election of Alan C. Bowser, George J. Gorman, Marcus L. Smith and Susan J. Sutherland as Class III Trustees of each Fund, each for a three-year term ending in 2026.
| | Nominee for Trustee:
Alan C. Bowser | Nominee for Trustee:
George J. Gorman | Nominee for Trustee:
Marcus L. Smith | Nominee for Trustee:
Susan J. Sutherland |
| California Fund | | | | |
| For | 16,676,495 | 16,700,166 | 16,700,449 | 16,697,157 |
| Withheld | 3,642,374 | 3,618,703 | 3,618,420 | 3,621,712 |
| New York Fund | | | | |
| For | 10,378,097 | 10,354,239 | 10,384,754 | 10,370,276 |
| Withheld | 3,797,343 | 3,821,201 | 3,790,686 | 3,805,164 |
Eaton Vance
Municipal Bond Funds
September 30, 2023
Dividend Reinvestment Plan
Each Fund offers a dividend reinvestment plan (Plan) pursuant to which shareholders may elect to have distributions automatically reinvested in common shares (Shares) of the Fund. You may elect to participate in the Plan by completing the Dividend Reinvestment Plan Application Form. If you do not participate, you will receive all distributions in cash paid by check mailed directly to you by Equiniti Trust Company, LLC (EQ) as dividend paying agent. On the distribution payment date, if the NAV per Share is equal to or less than the market price per Share plus estimated brokerage commissions, then new Shares will be issued. The number of Shares shall be determined by the greater of the NAV per Share or 95% of the market price. Otherwise, Shares generally will be purchased on the open market by EQ, the Plan agent (Agent). Distributions subject to income tax (if any) are taxable whether or not Shares are reinvested.
If your Shares are in the name of a brokerage firm, bank, or other nominee, you can ask the firm or nominee to participate in the Plan on your behalf. If the nominee does not offer the Plan, you will need to request that the Fund’s transfer agent re-register your Shares in your name or you will not be able to participate.
The Agent’s service fee for handling distributions will be paid by the Fund. Plan participants will be charged their pro rata share of brokerage commissions on all open-market purchases.
Plan participants may withdraw from the Plan at any time by writing to the Agent at the address noted on the following page. If you withdraw, you will receive Shares in your name for all Shares credited to your account under the Plan. If a participant elects by written notice to the Agent to sell part or all of his or her Shares and remit the proceeds, the Agent is authorized to deduct a $5.00 fee plus brokerage commissions from the proceeds.
If you wish to participate in the Plan and your Shares are held in your own name, you may complete the form on the following page and deliver it to the Agent. Any inquiries regarding the Plan can be directed to the Agent at 1-866-439-6787.
Eaton Vance
Municipal Bond Funds
September 30, 2023
Application for Participation in Dividend Reinvestment Plan
This form is for shareholders who hold their common shares in their own names. If your common shares are held in the name of a brokerage firm, bank, or other nominee, you should contact your nominee to see if it will participate in the Plan on your behalf. If you wish to participate in the Plan, but your brokerage firm, bank, or nominee is unable to participate on your behalf, you should request that your common shares be re-registered in your own name which will enable your participation in the Plan.
The following authorization and appointment is given with the understanding that I may terminate it at any time by terminating my participation in the Plan as provided in the terms and conditions of the Plan.
|
| Please print exact name on account | |
| |
| Shareholder signature | Date |
| |
| Shareholder signature | Date |
| Please sign exactly as your common shares are registered. All persons whose names appear on the share certificate must sign. |
YOU SHOULD NOT RETURN THIS FORM IF YOU WISH TO RECEIVE YOUR DISTRIBUTIONS IN CASH. THIS IS NOT A PROXY.
This authorization form, when signed, should be mailed to the following address:
Eaton Vance Municipal Bond Funds
c/o Equiniti Trust Company, LLC
P.O. Box 922
Wall Street Station
New York, NY 10269-0560
Eaton Vance
Municipal Bond Funds
September 30, 2023
Board of Trustees’ Contract Approval
Overview of the Contract Review Process
The Investment Company Act of 1940, as amended (the “1940 Act”), provides, in substance, that the investment advisory agreement between a fund and its investment adviser will continue in effect from year-to-year only if its continuation is approved on an annual basis by a vote of the fund’s board of trustees, including a majority of the trustees who are not “interested persons” of the fund (“independent trustees”), cast in person at a meeting called for the purpose of considering such approval.
At a meeting held on June 8, 2023, the Boards of Trustees/Directors (collectively, the “Board”) that oversee the registered investment companies advised by Eaton Vance Management or its affiliate, Boston Management and Research (the “Eaton Vance Funds”), including a majority of the independent trustees (the “Independent Trustees”), voted to approve the continuation of existing investment advisory agreements and sub-advisory agreements1 for each of the Eaton Vance Funds for an additional one-year period. The Board relied upon the affirmative recommendation of its Contract Review Committee, which is a committee exclusively comprised of Independent Trustees. Prior to making its recommendation, the Contract Review Committee reviewed information furnished by the adviser and sub-adviser to each of the Eaton Vance Funds (including information specifically requested by the Board) for a series of formal meetings held between April and June 2023, as well as certain additional information provided in response to specific requests from the Independent Trustees as members of the Contract Review Committee. Members of the Contract Review Committee also considered information received at prior meetings of the Board and its committees, to the extent such information was relevant to the Contract Review Committee’s annual evaluation of the investment advisory agreements and sub-advisory agreements.
In connection with its evaluation of the investment advisory agreements and sub-advisory agreements, the Board considered various information relating to the Eaton Vance Funds. This included information applicable to all or groups of Eaton Vance Funds, which is referenced immediately below, and information applicable to the particular Eaton Vance Fund covered by this report (each “Eaton Vance Fund” is referred to below as a “fund”). (For funds that invest through one or more underlying portfolios, references to “each fund” in this section may include information that was considered at the portfolio-level.)
Information about Fees, Performance and Expenses
• A report from an independent data provider comparing advisory and other fees paid by each fund to such fees paid by comparable funds, as identified by the independent data provider (“comparable funds”);
• A report from an independent data provider comparing each fund’s total expense ratio (and its components) to those of comparable funds;
• A report from an independent data provider comparing the investment performance of each fund (including, as relevant, total return data, income data, Sharpe ratios and information ratios) to the investment performance of comparable funds and, as applicable, benchmark indices, over various time periods;
• In certain instances, data regarding investment performance relative to customized groups of peer funds and blended indices identified by the adviser in consultation with the Portfolio Management Committee of the Board (a committee exclusively comprised of Independent Trustees);
• Comparative information concerning the fees charged and services provided by the adviser and sub-adviser to each fund in managing other accounts (which may include other mutual funds, collective investment funds and institutional accounts) using investment strategies and techniques similar to those used in managing such fund(s), if any;
• Profitability analyses with respect to the adviser and sub-adviser to each of the funds;
Information about Portfolio Management and Trading
• Descriptions of the investment management services provided to each fund, as well as each of the funds’ investment strategies and policies;
• The procedures and processes used to determine the value of fund assets, including, when necessary, the determination of “fair value” and actions taken to monitor and test the effectiveness of such procedures and processes;
• Information about the policies and practices of each fund’s adviser and sub-adviser with respect to trading, including their processes for seeking best execution of portfolio transactions;
• Information about the allocation of brokerage transactions and the benefits, if any, received by the adviser and sub-adviser to each fund as a result of brokerage allocation, including, as applicable, information concerning the acquisition of research through client commission arrangements and policies with respect to “soft dollars”;
• Data relating to the portfolio turnover rate of each fund and related information regarding active management in the context of particular strategies;
Information about each Adviser and Sub-adviser
• Reports detailing the financial results and condition of the adviser and sub-adviser to each fund;
• Information regarding the individual investment professionals whose responsibilities include portfolio management and investment research for the funds, and, for portfolio managers and certain other investment professionals, information relating to their responsibilities with respect to managing other mutual funds and investment accounts, as applicable;
1 Not all Eaton Vance Funds have entered into a sub-advisory agreement with a sub-adviser. Accordingly, references to “sub-adviser” or “sub-advisory agreement” in this “Overview” section may not be applicable to the particular Eaton Vance Fund covered by this report.
Eaton Vance
Municipal Bond Funds
September 30, 2023
Board of Trustees’ Contract Approval — continued
• Information regarding the adviser’s and its parent company’s (Morgan Stanley’s) efforts to retain and attract talented investment professionals, including in the context of a competitive marketplace for talent, as well as the ongoing unique environment presented by hybrid, remote and other alternative work arrangements;
• Information regarding the adviser’s compensation methodology for its investment professionals and the incentives and accountability it creates, along with investment professionals’ investments in the fund(s) they manage;
• The Code of Ethics of the adviser and its affiliates and the sub-adviser of each fund, together with information relating to compliance with, and the administration of, such codes;
• Policies and procedures relating to proxy voting, including regular reporting with respect to fund proxy voting activities;
• Information regarding the handling of corporate actions and class actions, as well as information regarding litigation and other regulatory matters;
• Information concerning the resources devoted to compliance efforts undertaken by the adviser and its affiliates and the sub-adviser of each fund, if any, including descriptions of their various compliance programs and their record of compliance;
• Information concerning the business continuity and disaster recovery plans of the adviser and its affiliates and the sub-adviser of each fund, if any;
• A description of Eaton Vance Management’s and Boston Management and Research’s oversight of sub-advisers, including with respect to regulatory and compliance issues, investment management and other matters;
Other Relevant Information
• Information regarding ongoing initiatives to further integrate and harmonize, where applicable, the investment management and other departments of the adviser and its affiliates with the overall investment management infrastructure of Morgan Stanley, in light of Morgan Stanley’s acquisition of Eaton Vance Corp. on March 1, 2021;
• Information concerning the nature, cost and character of the administrative and other non-investment advisory services provided by Eaton Vance Management and its affiliates;
• Information concerning oversight of the relationship with the custodian, subcustodians, fund accountants, and other third-party service providers by the adviser and/or administrator to each of the funds;
• Information concerning efforts to implement policies and procedures with respect to various recently adopted regulations applicable to the funds, including Rule 12d1-4 (the Fund-of-Funds Rule), Rule 18f-4 (the Derivatives Rule) and Rule 2a-5 (the Fair Valuation Rule);
• For an Eaton Vance Fund structured as an exchange-listed closed-end fund, information concerning the benefits of the closed-end fund structure, as well as, where relevant, the closed-end fund’s market prices (including as compared to the closed-end fund’s net asset value (NAV)), trading volume data, continued use of auction preferred shares (where applicable), distribution rates and other relevant matters;
• The risks which the adviser and/or its affiliates incur in connection with the management and operation of the funds, including, among others, litigation, regulatory, entrepreneurial, and other business risks (and the associated costs of such risks); and
• The terms of each investment advisory agreement and sub-advisory agreement.
During the various meetings of the Board and its committees over the course of the year leading up to the June 8, 2023 meeting, the Board received information from portfolio managers and other investment professionals of the advisers and sub-advisers of the funds regarding investment and performance matters, and considered various investment and trading strategies used in pursuing the funds’ investment objectives. The Board also received information regarding risk management techniques employed in connection with the management of the funds. The Board and its committees evaluated issues pertaining to industry and regulatory developments, compliance procedures, fund governance and other issues with respect to the funds, and received and participated in reports and presentations provided by Eaton Vance Management, Boston Management and Research and fund sub-advisers, with respect to such matters. In addition to the formal meetings of the Board and its committees, the Independent Trustees held regular teleconferences to discuss, among other topics, matters relating to the continuation of investment advisory agreements and sub-advisory agreements.
The Contract Review Committee was advised throughout the contract review process by Goodwin Procter LLP, independent legal counsel for the Independent Trustees. The members of the Contract Review Committee, with the advice of such counsel, exercised their own business judgment in determining the material factors to be considered in evaluating each investment advisory agreement and sub-advisory agreement and the weight to be given to each such factor. The conclusions reached with respect to each investment advisory agreement and sub-advisory agreement were based on a comprehensive evaluation of all the information provided and not any single factor. Moreover, each member of the Contract Review Committee may have placed varying emphasis on particular factors in reaching conclusions with respect to each investment advisory agreement and sub-advisory agreement. In evaluating each investment advisory agreement and sub-advisory agreement, including the fee structures and other terms contained in such agreements, the members of the Contract Review Committee were also informed by multiple years of analysis and discussion with the adviser and sub-adviser to each of the Eaton Vance Funds.
Results of the Contract Review Process
Based on its consideration of the foregoing, and such other information it deemed relevant, including the factors and conclusions described below, the Contract Review Committee concluded that the continuation of the investment advisory agreements between each of the following funds:
• Eaton Vance Municipal Bond Fund
• Eaton Vance California Municipal Bond Fund
Eaton Vance
Municipal Bond Funds
September 30, 2023
Board of Trustees’ Contract Approval — continued
• Eaton Vance New York Municipal Bond Fund
(the “Funds”) and Eaton Vance Management (the “Adviser”), including their respective fee structures, are in the interests of shareholders and, therefore, recommended to the Board approval of each agreement. Based on the recommendation of the Contract Review Committee, the Board, including a majority of the Independent Trustees, voted to approve continuation of the investment advisory agreement for each Fund.
Nature, Extent and Quality of Services
In considering whether to approve the investment advisory agreements for the Funds, the Board evaluated the nature, extent and quality of services provided to the Funds by the Adviser.
The Board considered the Adviser’s management capabilities and investment processes in light of the types of investments held by each Fund, including the education, experience and number of investment professionals and other personnel who provide portfolio management, investment research, and similar services to the Funds. In particular, the Board considered the abilities and experience of the Adviser’s investment professionals in analyzing factors such as credit risk, tax efficiency, and special considerations relevant to investing in municipal bonds. The Board considered the Adviser’s municipal bond team, which includes investment professionals and credit specialists who provide services to the Funds. The Board also took into account the resources dedicated to portfolio management and other services, the compensation methods of the Adviser and other factors, including the reputation and resources of the Adviser to recruit and retain highly qualified research, advisory and supervisory investment professionals. In addition, the Board considered the time and attention devoted to the Eaton Vance Funds, including each Fund, by senior management, as well as the infrastructure, operational capabilities and support staff in place to assist in the portfolio management and operations of the Funds, including the provision of administrative services. The Board also considered the business-related and other risks to which the Adviser or its affiliates may be subject in managing the Funds. The Board considered the deep experience of the Adviser and its affiliates with managing and operating funds organized as exchange-listed closed-end funds, such as the Funds. In this regard, the Board considered, among other things, the Adviser’s and its affiliates’ experience with implementing leverage arrangements, monitoring and assessing trading price discounts and premiums and adhering to the requirements of securities exchanges.
The Board considered the compliance programs of the Adviser and relevant affiliates thereof. The Board considered compliance and reporting matters regarding, among other things, personal trading by investment professionals, disclosure of portfolio holdings, late trading, frequent trading, portfolio valuation, business continuity and the allocation of investment opportunities. The Board also considered the responses of the Adviser and its affiliates to requests in recent years from regulatory authorities, such as the Securities and Exchange Commission and the Financial Industry Regulatory Authority.
The Board considered other administrative services provided or overseen by Eaton Vance Management and its affiliates, including transfer agency and accounting services. The Board evaluated the benefits to shareholders of investing in a fund that is a part of a large fund complex offering exposure to a variety of asset classes and investment disciplines.
After consideration of the foregoing factors, among others, the Board concluded that the nature, extent and quality of services provided by the Adviser, taken as a whole, are appropriate and consistent with the terms of the investment advisory agreements.
Fund Performance
The Board compared each Fund’s investment performance to that of comparable funds identified by an independent data provider (the peer group), as well as appropriate benchmark indices, and assessed each Fund’s performance on the basis of total return and current income return. The Board’s review included comparative performance data with respect to each Fund for the one-, three-, five- and ten-year periods ended December 31, 2022.
In this regard, the Board noted each Fund’s performance relative to its peer group and benchmark index for the three-year period, as follows:
| | Performance Relative to: |
| Fund | Median of Peers | Benchmark Index |
| Eaton Vance Municipal Bond Fund | Higher | Lower |
| Eaton Vance California Municipal Bond Fund | Higher | Lower |
| Eaton Vance New York Municipal Bond Fund | Lower | Lower |
The Board considered, among other things, the Adviser’s efforts to generate competitive levels of tax-exempt current income over time through investments that, relative to comparable funds, focus on higher quality municipal bonds with longer maturities. With respect to Eaton Vance New York Municipal Bond Fund, the Board noted certain actions taken by the Adviser to address the performance of the Fund and determined to continue to monitor and evaluate their effectiveness over time. With respect to the other two Funds, the Board concluded that the performance of each Fund was satisfactory.
Eaton Vance
Municipal Bond Funds
September 30, 2023
Board of Trustees’ Contract Approval — continued
Management Fees and Expenses
The Board considered contractual fee rates payable by each Fund for advisory and administrative services (referred to collectively as “management fees”). As part of its review, the Board considered each Fund’s management fees and total expense ratio for the one-year period ended December 31, 2022, as compared to those of comparable funds, before and after giving effect to any undertaking to waive fees or reimburse expenses. The Board also considered certain factors identified by management in response to inquiries from the Contract Review Committee regarding each Fund’s total expense ratio relative to comparable funds.
After considering the foregoing information, and in light of the nature, extent and quality of the services provided by the Adviser, the Board concluded that the management fees charged for advisory and related services are reasonable.
Profitability and “Fall-Out” Benefits
The Board considered the level of profits realized by the Adviser and relevant affiliates thereof in providing investment advisory and administrative services to each Fund and to all Eaton Vance Funds as a group. The Board considered the level of profits realized without regard to marketing support or other payments by the Adviser and its affiliates to third parties in respect of distribution or other services.
The Board concluded that, in light of the foregoing factors and the nature, extent and quality of the services rendered, the profits realized by the Adviser and its affiliates are deemed not to be excessive.
The Board also considered direct or indirect fall-out benefits received by the Adviser and its affiliates in connection with their respective relationships with the Funds, including the benefits of research services that may be available to the Adviser as a result of securities transactions effected for the Funds and other investment advisory clients.
Economies of Scale
In reviewing management fees and profitability, the Board also considered the extent to which the Adviser and its affiliates, on the one hand, and each Fund, on the other hand, can expect to realize benefits from economies of scale as the assets of each Fund increase. The Board acknowledged the difficulty in accurately measuring the benefits resulting from economies of scale, if any, with respect to the management of any specific fund or group of funds. The Board reviewed data summarizing the increases and decreases in the assets of each Fund and of all Eaton Vance Funds as a group over various time periods, and evaluated the extent to which the total expense ratio of each Fund and the profitability of the Adviser and its affiliates may have been affected by such increases or decreases. Based upon the foregoing, the Board concluded that each Fund currently shares in the benefits from economies of scale, if any, when they are realized by the Adviser. The Board also considered the fact that the Funds are not continuously offered and that the Funds’ assets are not expected to increase materially in the foreseeable future. The Board did not find that, in light of the level of the Adviser’s profits with respect to each Fund, the implementation of breakpoints in the advisory fee schedules is warranted at this time.
Eaton Vance
Municipal Bond Funds
September 30, 2023
Management and Organization
Fund Management. The Board of Trustees of each Fund (the “Board”) is responsible for the overall management and supervision of the affairs of each Fund. The Board members and officers of each Fund are listed below. Except as indicated, each individual has held the office shown or other offices in the same company for the last five years. Each Trustee holds office until the annual meeting for the year in which his or her term expires and until his or her successor is elected and qualified, subject to a prior death, resignation, retirement, disqualification or removal. Under the terms of the Fund’s current Trustee retirement policy, an Independent Trustee must retire and resign as a Trustee on the earlier of: (i) the first day of July following his or her 74th birthday; or (ii), with limited exception, December 31st of the 20th year in which he or she has served as a Trustee. However, if such retirement and resignation would cause the Fund to be out of compliance with Section 16 of the 1940 Act or any other regulations or guidance of the Securities and Exchange Commission, then such retirement and resignation will not become effective until such time as action has been taken for the Fund to be in compliance therewith. The “noninterested Trustees” consist of those Trustees who are not “interested persons” of each Fund, as that term is defined under the 1940 Act. The business address of each Board member and officer is Two International Place, Boston, Massachusetts 02110. As used below, “BMR” refers to Boston Management and Research, “EV” refers to EV LLC, “EVM” refers to Eaton Vance Management, “MSIM" refers to Morgan Stanley Investment Management Inc. and “EVD” refers to Eaton Vance Distributors, Inc. EV is the trustee of each of EVM and BMR. Each of EVM, BMR, EVD and EV are indirect, wholly owned subsidiaries of Morgan Stanley. Each officer affiliated with EVM may hold a position with other EVM affiliates that is comparable to his or her position with EVM listed below. Each Trustee oversees 127 funds in the Eaton Vance fund complex (including both funds and portfolios in a hub and spoke structure).
| Name and Year of Birth | Fund
Position(s) | Length of Service | Principal Occupation(s) and Other Directorships
During Past Five Years and Other Relevant Experience |
| Interested Trustee |
Anchal Pachnanda(1)
1980 | Class I
Trustee | Until 2024.
3 years.
Since 2023. | Co-Head of Strategy of MSIM (since 2019). Formerly, Head of Strategy of MSIM (2017-2019). Ms. Pachnanda is an interested person because of her position with MSIM, which is an affiliate of the Fund.
Other Directorships. None. |
| Noninterested Trustees |
Alan C. Bowser(2)
1962 | Class III
Trustee | Until 2026.
3 years.
Since 2023. | Private investor. Formerly, Chief Diversity Officer, Partner and a member of the Operating Committee, and formerly served as Senior Advisor on Diversity and Inclusion for the firm’s chief executive officer, Co-Head of the Americas Region, and Senior Client Advisor of Bridgewater Associates, an asset management firm (2011- 2023).
Other Directorships. Independent Director of Stout Risius Ross (a middle market professional services advisory firm) (since 2021). |
Mark R. Fetting
1954 | Class I
Trustee | Until 2024.
3 years.
Since 2016. | Private investor. Formerly held various positions at Legg Mason, Inc. (investment management firm) (2000-2012), including President, Chief Executive Officer, Director and Chairman (2008-2012), Senior Executive Vice President (2004-2008) and Executive Vice President (2001-2004). Formerly, President of Legg Mason family of funds (2001-2008). Formerly, Division President and Senior Officer of Prudential Financial Group, Inc. and related companies (investment management firm) (1991-2000).
Other Directorships. None. |
Cynthia E. Frost
1961 | Class II
Trustee | Until 2025.
3 years.
Since 2014. | Private investor. Formerly, Chief Investment Officer of Brown University (university endowment) (2000-2012). Formerly, Portfolio Strategist for Duke Management Company (university endowment manager) (1995-2000). Formerly, Managing Director, Cambridge Associates (investment consulting company) (1989-1995). Formerly, Consultant, Bain and Company (management consulting firm) (1987-1989). Formerly, Senior Equity Analyst, BA Investment Management Company (1983-1985).
Other Directorships. None. |
George J. Gorman
1952 | Chairperson
of the Board
and Class III
Trustee | Until 2026.
3 years. Chairperson of the Board since 2021 and Trustee since 2014. | Principal at George J. Gorman LLC (consulting firm). Formerly, Senior Partner at Ernst & Young LLP (a registered public accounting firm) (1974-2009).
Other Directorships. None. |
Eaton Vance
Municipal Bond Funds
September 30, 2023
Management and Organization — continued
| Name and Year of Birth | Fund
Position(s) | Length of Service | Principal Occupation(s) and Other Directorships
During Past Five Years and Other Relevant Experience |
| Noninterested Trustees (continued) |
Valerie A. Mosley
1960 | Class I
Trustee | Until 2024.
3 years.
Since 2014. | Chairwoman and Chief Executive Officer of Valmo Ventures (a consulting and investment firm). Founder of Upward Wealth, Inc., dba BrightUp, a fintech platform. Formerly, Partner and Senior Vice President, Portfolio Manager and Investment Strategist at Wellington Management Company, LLP (investment management firm) (1992-2012). Formerly, Chief Investment Officer, PG Corbin Asset Management (1990-1992). Formerly worked in institutional corporate bond sales at Kidder Peabody (1986-1990).
Other Directorships. Director of DraftKings, Inc. (digital sports entertainment and gaming company) (since September 2020). Director of Envestnet, Inc. (provider of intelligent systems for wealth management and financial wellness) (since 2018). Formerly, Director of Dynex Capital, Inc. (mortgage REIT) (2013-2020) and Director of Groupon, Inc. (e-commerce provider) (2020-2022). |
Keith Quinton
1958 | Class I
Trustee | Until 2024.
3 years.
Since 2018. | Private investor, researcher and lecturer. Formerly, Independent Investment Committee Member at New Hampshire Retirement System (2017-2021). Formerly, Portfolio Manager and Senior Quantitative Analyst at Fidelity Investments (investment management firm) (2001-2014).
Other Directorships. Formerly, Director (2016-2021) and Chairman (2019-2021) of New Hampshire Municipal Bond Bank. |
Marcus L. Smith
1966 | Class III
Trustee | Until 2026.
3 years.
Since 2018. | Private investor and independent corporate director. Formerly, Chief Investment Officer, Canada (2012-2017), Chief Investment Officer, Asia (2010-2012), Director of Asian Research (2004-2010) and portfolio manager (2001-2017) at MFS Investment Management (investment management firm).
Other Directorships. Director of First Industrial Realty Trust, Inc. (an industrial REIT) (since 2021). Director of MSCI Inc. (global provider of investment decision support tools) (since 2017). Formerly, Director of DCT Industrial Trust Inc. (logistics real estate company) (2017-2018). |
Susan J. Sutherland
1957 | Class III
Trustee | Until 2026.
3 years.
Since 2015. | Private investor. Director of Ascot Group Limited and certain of its subsidiaries (insurance and reinsurance) (since 2017). Formerly, Director of Hagerty Holding Corp. (insurance) (2015-2018) and Montpelier Re Holdings Ltd. (insurance and reinsurance) (2013-2015). Formerly, Associate, Counsel and Partner at Skadden, Arps, Slate, Meagher & Flom LLP (law firm) (1982-2013).
Other Directorships. Formerly, Director of Kairos Acquisition Corp. (insurance/InsurTech acquisition company) (2021-2023). |
Scott E. Wennerholm
1959 | Class II
Trustee | Until 2025.
3 years.
Since 2016. | Private investor. Formerly, Trustee at Wheelock College (postsecondary institution) (2012-2018). Formerly, Consultant at GF Parish Group (executive recruiting firm) (2016-2017). Formerly, Chief Operating Officer and Executive Vice President at BNY Mellon Asset Management (investment management firm) (2005-2011). Formerly, Chief Operating Officer and Chief Financial Officer at Natixis Global Asset Management (investment management firm) (1997-2004). Formerly, Vice President at Fidelity Investments Institutional Services (investment management firm) (1994-1997).
Other Directorships. None. |
Nancy A. Wiser
1967 | Class II
Trustee | Until 2025.
3 years.
Since 2022. | Formerly, Executive Vice President and the Global Head of Operations at Wells Fargo Asset Management (2011-2021).
Other Directorships. None. |
| Name and Year of Birth | Fund
Position(s) | Length of Service | Principal Occupation(s)
During Past Five Years |
| Principal Officers who are not Trustees |
Kenneth A. Topping
1966 | President | Since 2023 | Vice President and Chief Administrative Officer of EVM and BMR and Chief Operating Officer for Public Markets at MSIM. Also Vice President of Calvert Research and Management (“CRM”) since 2021. Formerly, Chief Operating Officer for Goldman Sachs Asset Management `Classic' (2009-2020). |
Deidre E. Walsh
1971 | Vice President and
Chief Legal Officer | Since 2009 | Vice President of EVM and BMR. Also Vice President of CRM. |
James F. Kirchner
1967 | Treasurer | Since 2007 | Vice President of EVM and BMR. Also Vice President of CRM. |
Eaton Vance
Municipal Bond Funds
September 30, 2023
Management and Organization — continued
| Name and Year of Birth | Fund
Position(s) | Length of Service | Principal Occupation(s)
During Past Five Years |
| Principal Officers who are not Trustees (continued) |
Nicholas S. Di Lorenzo
1987 | Secretary | Since 2022 | Formerly, associate (2012-2021) and counsel (2022) at Dechert LLP. |
Richard F. Froio
1968 | Chief Compliance
Officer | Since 2017 | Vice President of EVM and BMR since 2017. Formerly, Deputy Chief Compliance Officer (Adviser/Funds) and Chief Compliance Officer (Distribution) at PIMCO (2012-2017) and Managing Director at BlackRock/Barclays Global Investors (2009-2012). |
(1) Ms. Pachnanda began serving as Trustee effective April 1, 2023.
(2) Mr. Bowser began serving as Trustee effective January 4, 2023.
| FACTS | WHAT DOES EATON VANCE DO WITH YOUR
PERSONAL INFORMATION? |
| Why? | Financial companies choose how they share your personal information. Federal law gives consumers the right to limit some but not all sharing. Federal law also requires us to tell you how we collect, share, and protect your personal information. Please read this notice carefully to understand what we do. |
| |
| What? | The types of personal information we collect and share depend on the product or service you have with us. This information can include:■ Social Security number and income
■ investment experience and risk tolerance
■ checking account number and wire transfer instructions |
| |
| How? | All financial companies need to share customers’ personal information to run their everyday business. In the section below, we list the reasons financial companies can share their customers’ personal information; the reasons Eaton Vance chooses to share; and whether you can limit this sharing. |
Reasons we can share your
personal information | Does Eaton Vance
share? | Can you limit
this sharing? |
| For our everyday business purposes — such as to process your transactions, maintain your account(s), respond to court orders and legal investigations, or report to credit bureaus | Yes | No |
| For our marketing purposes — to offer our products and services to you | Yes | No |
| For joint marketing with other financial companies | No | We don’t share |
| For our investment management affiliates’ everyday business purposes — information about your transactions, experiences, and creditworthiness | Yes | Yes |
| For our affiliates’ everyday business purposes — information about your transactions and experiences | Yes | No |
| For our affiliates’ everyday business purposes — information about your creditworthiness | No | We don’t share |
| For our investment management affiliates to market to you | Yes | Yes |
| For our affiliates to market to you | No | We don’t share |
| For nonaffiliates to market to you | No | We don’t share |
To limit our
sharing | Call toll-free 1-800-262-1122 or email: EVPrivacy@eatonvance.comPlease note:If you are a new customer, we can begin sharing your information 30 days from the date we sent this notice. When you are no longer our customer, we continue to share your information as described in this notice. However, you can contact us at any time to limit our sharing. |
| Questions? | Call toll-free 1-800-262-1122 or email: EVPrivacy@eatonvance.com |
| Privacy Notice — continued | April 2021 |
| Who we are |
| Who is providing this notice? | Eaton Vance Management, Eaton Vance Distributors, Inc., Eaton Vance Trust Company, Eaton Vance Management (International) Limited, Eaton Vance Advisers International Ltd., Eaton Vance Global Advisors Limited, Eaton Vance Management’s Real Estate Investment Group, Boston Management and Research, Calvert Research and Management, Eaton Vance and Calvert Fund Families and our investment advisory affiliates (“Eaton Vance”) (see Investment Management Affiliates definition below) |
| What we do |
How does Eaton Vance
protect my personal
information? | To protect your personal information from unauthorized access and use, we use security measures that comply with federal law. These measures include computer safeguards and secured files and buildings. We have policies governing the proper handling of customer information by personnel and requiring third parties that provide support to adhere to appropriate security standards with respect to such information. |
How does Eaton Vance
collect my personal
information? | We collect your personal information, for example, when you■ open an account or make deposits or withdrawals from your account
■ buy securities from us or make a wire transfer
■ give us your contact informationWe also collect your personal information from others, such as credit bureaus, affiliates, or other companies. |
| Why can’t I limit all sharing? | Federal law gives you the right to limit only■ sharing for affiliates’ everyday business purposes — information about your creditworthiness
■ affiliates from using your information to market to you
■ sharing for nonaffiliates to market to youState laws and individual companies may give you additional rights to limit sharing. See below for more on your rights under state law. |
| Definitions |
Investment Management
Affiliates | Eaton Vance Investment Management Affiliates include registered investment advisers, registered broker- dealers, and registered and unregistered funds. Investment Management Affiliates does not include entities associated with Morgan Stanley Wealth Management, such as Morgan Stanley Smith Barney LLC and Morgan Stanley & Co. |
| Affiliates | Companies related by common ownership or control. They can be financial and nonfinancial companies.■ Our affiliates include companies with a Morgan Stanley name and financial companies such as Morgan Stanley Smith Barney LLC and Morgan Stanley & Co. |
| Nonaffiliates | Companies not related by common ownership or control. They can be financial and nonfinancial companies.■ Eaton Vance does not share with nonaffiliates so they can market to you. |
| Joint marketing | A formal agreement between nonaffiliated financial companies that together market financial products or services to you.■ Eaton Vance doesn’t jointly market. |
| Other important information |
| Vermont: Except as permitted by law, we will not share personal information we collect about Vermont residents with Nonaffiliates unless you provide us with your written consent to share such information.California: Except as permitted by law, we will not share personal information we collect about California residents with Nonaffiliates and we will limit sharing such personal information with our Affiliates to comply with California privacy laws that apply to us. |
Eaton Vance
Municipal Bond Funds
September 30, 2023
Potential Conflicts of Interest
As a diversified global financial services firm, Morgan Stanley engages in a broad spectrum of activities, including financial advisory services, investment management activities, lending, commercial banking, sponsoring and managing private investment funds, engaging in broker-dealer transactions and principal securities, commodities and foreign exchange transactions, research publication and other activities. In the ordinary course of its business, Morgan Stanley is a full-service investment banking and financial services firm and therefore engages in activities where Morgan Stanley’s interests or the interests of its clients may conflict with the interests of a Fund or Portfolio, if applicable, (collectively for the purposes of this section, “Fund” or “Funds”). Morgan Stanley advises clients and sponsors, manages or advises other investment funds and investment programs, accounts and businesses (collectively, together with the Morgan Stanley funds, any new or successor funds, programs, accounts or businesses (other than funds, programs, accounts or businesses sponsored, managed, or advised by former direct or indirect subsidiaries of Eaton Vance Corp. (“Eaton Vance Investment Accounts”)), the ‘‘MS Investment Accounts, and, together with the Eaton Vance Investment Accounts, the “Affiliated Investment Accounts’’) with a wide variety of investment objectives that in some instances may overlap or conflict with a Fund’s investment objectives and present conflicts of interest. In addition, Morgan Stanley or the investment adviser may also from time to time create new or successor Affiliated Investment Accounts that may compete with a Fund and present similar conflicts of interest. The discussion below enumerates certain actual, apparent and potential conflicts of interest. There is no assurance that conflicts of interest will be resolved in favor of Fund shareholders and, in fact, they may not be. Conflicts of interest not described below may also exist.
The discussions below with respect to actual, apparent and potential conflicts of interest also may be applicable to or arise from the MS Investment Accounts whether or not specifically identified.
Material Non-public and Other Information. It is expected that confidential or material non-public information regarding an investment or potential investment opportunity may become available to the investment adviser. If such information becomes available, the investment adviser may be precluded (including by applicable law or internal policies or procedures) from pursuing an investment or disposition opportunity with respect to such investment or investment opportunity. The investment adviser may also from time to time be subject to contractual ‘‘stand-still’’ obligations and/or confidentiality obligations that may restrict its ability to trade in certain investments on a Fund’s behalf. In addition, the investment adviser may be precluded from disclosing such information to an investment team, even in circumstances in which the information would be beneficial if disclosed. Therefore, the investment team may not be provided access to material non-public information in the possession of Morgan Stanley that might be relevant to an investment decision to be made on behalf of a Fund, and the investment team may initiate a transaction or sell an investment that, if such information had been known to it, may not have been undertaken. In addition, certain members of the investment team may be recused from certain investment-related discussions so that such members do not receive information that would limit their ability to perform functions of their employment with the investment adviser or its affiliates unrelated to that of a Fund. Furthermore, access to certain parts of Morgan Stanley may be subject to third party confidentiality obligations and to information barriers established by Morgan Stanley in order to manage potential conflicts of interest and regulatory restrictions, including without limitation joint transaction restrictions pursuant to the 1940 Act. Accordingly, the investment adviser’s ability to source investments from other business units within Morgan Stanley may be limited and there can be no assurance that the investment adviser will be able to source any investments from any one or more parts of the Morgan Stanley network.
The investment adviser may restrict its investment decisions and activities on behalf of the Funds in various circumstances, including because of applicable regulatory requirements or information held by the investment adviser or Morgan Stanley. The investment adviser might not engage in transactions or other activities for, or enforce certain rights in favor of, a Fund due to Morgan Stanley’s activities outside the Funds. In instances where trading of an investment is restricted, the investment adviser may not be able to purchase or sell such investment on behalf of a Fund, resulting in the Fund’s inability to participate in certain desirable transactions. This inability to buy or sell an investment could have an adverse effect on a Fund’s portfolio due to, among other things, changes in an investment’s value during the period its trading is restricted. Also, in situations where the investment adviser is required to aggregate its positions with those of other Morgan Stanley business units for position limit calculations, the investment adviser may have to refrain from making investments due to the positions held by other Morgan Stanley business units or their clients. There may be other situations where the investment adviser refrains from making an investment due to additional disclosure obligations, regulatory requirements, policies, and reputational risk, or the investment adviser may limit purchases or sales of securities in respect of which Morgan Stanley is engaged in an underwriting or other distribution capacity.
Morgan Stanley has established certain information barriers and other policies to address the sharing of information between different businesses within Morgan Stanley. As a result of information barriers, the investment adviser generally will not have access, or will have limited access, to certain information and personnel in other areas of Morgan Stanley relating to business transactions for clients (including transactions in investing, banking, prime brokerage and certain other areas), and generally will not manage the Funds with the benefit of the information held by such other areas. Morgan Stanley, due to its access to and knowledge of funds, markets and securities based on its prime brokerage and other businesses, may make decisions based on information or take (or refrain from taking) actions with respect to interests in investments of the kind held (directly or indirectly) by the Funds in a manner that may be adverse to the Funds, and will not have any obligation or other duty to share information with the investment adviser.
In limited circumstances, however, including for purposes of managing business and reputational risk, and subject to policies and procedures and any applicable regulations, Morgan Stanley personnel, including personnel of the investment adviser, on one side of an information barrier may have access to information and personnel on the other side of the information barrier through “wall crossings.” The investment adviser faces conflicts of interest in determining whether to engage in such wall crossings. Information obtained in connection with such wall crossings may limit or restrict the ability of the investment adviser to engage in or otherwise effect transactions on behalf of the Funds (including purchasing or selling securities that the investment adviser may otherwise have purchased or sold for a Fund in the absence of a wall crossing). In managing conflicts of interest that arise because of the foregoing, the investment adviser generally will be subject to fiduciary requirements. The investment adviser may also implement internal information barriers or ethical walls, and the conflicts described herein with respect to information barriers and otherwise with respect to Morgan Stanley and the
Eaton Vance
Municipal Bond Funds
September 30, 2023
Potential Conflicts of Interest — continued
investment adviser will also apply internally within the investment adviser. As a result, a Fund may not be permitted to transact in (e.g., dispose of a security in whole or in part) during periods when it otherwise would have been able to do so, which could adversely affect a Fund. Other investors in the security that are not subject to such restrictions may be able to transact in the security during such periods. There may also be circumstances in which, as a result of information held by certain portfolio management teams in the investment adviser, the investment adviser limits an activity or transaction for a Fund, including if the Fund is managed by a portfolio management team other than the team holding such information.
Investments by Morgan Stanley and its Affiliated Investment Accounts. In serving in multiple capacities to Affiliated Investment Accounts, Morgan Stanley, including the investment adviser and its investment teams, may have obligations to other clients or investors in Affiliated Investment Accounts, the fulfillment of which may not be in the best interests of a Fund or its shareholders. A Fund’s investment objectives may overlap with the investment objectives of certain Affiliated Investment Accounts. As a result, the members of an investment team may face conflicts in the allocation of investment opportunities among a Fund and other investment funds, programs, accounts and businesses advised by or affiliated with the investment adviser. Certain Affiliated Investment Accounts may provide for higher management or incentive fees or greater expense reimbursements or overhead allocations, all of which may contribute to this conflict of interest and create an incentive for the investment adviser to favor such other accounts.
Morgan Stanley currently invests and plans to continue to invest on its own behalf and on behalf of its Affiliated Investment Accounts in a wide variety of investment opportunities globally. Morgan Stanley and its Affiliated Investment Accounts, to the extent consistent with applicable law and policies and procedures, will be permitted to invest in investment opportunities without making such opportunities available to a Fund beforehand. Subject to the foregoing, Morgan Stanley may offer investments that fall into the investment objectives of an Affiliated Investment Account to such account or make such investment on its own behalf, even though such investment also falls within a Fund’s investment objectives. A Fund may invest in opportunities that Morgan Stanley and/or one or more Affiliated Investment Accounts has declined, and vice versa. All of the foregoing may reduce the number of investment opportunities available to a Fund and may create conflicts of interest in allocating investment opportunities. Investors should note that the conflicts inherent in making such allocation decisions may not always be resolved to a Fund’s advantage. There can be no assurance that a Fund will have an opportunity to participate in certain opportunities that fall within their investment objectives.
To seek to reduce potential conflicts of interest and to attempt to allocate such investment opportunities in a fair and equitable manner, the investment adviser has implemented allocation policies and procedures. These policies and procedures are intended to give all clients of the investment adviser, including the Funds, fair access to investment opportunities consistent with the requirements of organizational documents, investment strategies, applicable laws and regulations, and the fiduciary duties of the investment adviser. Each client of the investment adviser that is subject to the allocation policies and procedures, including each Fund, is assigned an investment team and portfolio manager(s) by the investment adviser. The investment team and portfolio managers review investment opportunities and will decide with respect to the allocation of each opportunity considering various factors and in accordance with the allocation policies and procedures. The allocation policies and procedures are subject to change. Investors should note that the conflicts inherent in making such allocation decisions may not always be resolved to the advantage of a Fund.
It is possible that Morgan Stanley or an Affiliated Investment Account, including another Eaton Vance fund, will invest in or advise a company that is or becomes a competitor of a company of which a Fund holds an investment. Such investment could create a conflict between the Fund, on the one hand, and Morgan Stanley or the Affiliated Investment Account, on the other hand. In such a situation, Morgan Stanley may also have a conflict in the allocation of its own resources to the portfolio investment. Furthermore, certain Affiliated Investment Accounts will be focused primarily on investing in other funds which may have strategies that overlap and/or directly conflict and compete with a Fund.
In addition, certain investment professionals who are involved in a Fund’s activities remain responsible for the investment activities of other Affiliated Investment Accounts managed by the investment adviser and its affiliates, and they will devote time to the management of such investments and other newly created Affiliated Investment Accounts (whether in the form of funds, separate accounts or other vehicles), as well as their own investments. In addition, in connection with the management of investments for other Affiliated Investment Accounts, members of Morgan Stanley and its affiliates may serve on the boards of directors of or advise companies which may compete with a Fund’s portfolio investments. Moreover, these Affiliated Investment Accounts managed by Morgan Stanley and its affiliates may pursue investment opportunities that may also be suitable for a Fund.
It should be noted that Morgan Stanley may, directly or indirectly, make large investments in certain of its Affiliated Investment Accounts, and accordingly Morgan Stanley’s investment in a Fund may not be a determining factor in the outcome of any of the foregoing conflicts. Nothing herein restricts or in any way limits the activities of Morgan Stanley, including its ability to buy or sell interests in, or provide financing to, equity and/or debt instruments, funds or portfolio companies, for its own accounts or for the accounts of Affiliated Investment Accounts or other investment funds or clients in accordance with applicable law.
Different clients of the investment adviser, including a Fund, may invest in different classes of securities of the same issuer, depending on the respective clients’ investment objectives and policies. As a result, the investment adviser and its affiliates, at times, will seek to satisfy fiduciary obligations to certain clients owning one class of securities of a particular issuer by pursuing or enforcing rights on behalf of those clients with respect to such class of securities, and those activities may have an adverse effect on another client which owns a different class of securities of such issuer. For example, if one client holds debt securities of an issuer and another client holds equity securities of the same issuer, if the issuer experiences financial or operational challenges, the investment adviser and its affiliates may seek a liquidation of the issuer on behalf of the client that holds the debt securities, whereas the client holding the
Eaton Vance
Municipal Bond Funds
September 30, 2023
Potential Conflicts of Interest — continued
equity securities may benefit from a reorganization of the issuer. Thus, in such situations, the actions taken by the investment adviser or its affiliates on behalf of one client can negatively impact securities held by another client. These conflicts also exist as between the investment adviser’s clients, including the Funds, and the Affiliated Investment Accounts managed by Morgan Stanley.
The investment adviser and its affiliates may give advice and recommend securities to other clients which may differ from advice given to, or securities recommended or bought for, a Fund even though such other clients’ investment objectives may be similar to those of the Fund.
The investment adviser and its affiliates manage long and short portfolios. The simultaneous management of long and short portfolios creates conflicts of interest in portfolio management and trading in that opposite directional positions may be taken in client accounts, including client accounts managed by the same investment team, and creates risks such as: (i) the risk that short sale activity could adversely affect the market value of long positions in one or more portfolios (and vice versa) and (ii) the risks associated with the trading desk receiving opposing orders in the same security simultaneously. The investment adviser and its affiliates have adopted policies and procedures that are reasonably designed to mitigate these conflicts. In certain circumstances, the investment adviser invests on behalf of itself in securities and other instruments that would be appropriate for, held by, or may fall within the investment guidelines of its clients, including a Fund. At times, the investment adviser may give advice or take action for its own accounts that differs from, conflicts with, or is adverse to advice given or action taken for any client.
From time to time, conflicts also arise due to the fact that certain securities or instruments may be held in some client accounts, including a Fund, but not in others, or that client accounts may have different levels of holdings in certain securities or instruments. In addition, due to differences in the investment strategies or restrictions among client accounts, the investment adviser may take action with respect to one account that differs from the action taken with respect to another account. In some cases, a client account may compensate the investment adviser based on the performance of the securities held by that account. The existence of such a performance based fee may create additional conflicts of interest for the investment adviser in the allocation of management time, resources and investment opportunities. The investment adviser has adopted several policies and procedures designed to address these potential conflicts including a code of ethics and policies that govern the investment adviser’s trading practices, including, among other things, the aggregation and allocation of trades among clients, brokerage allocations, cross trades and best execution.
In addition, at times an investment adviser investment team will give advice or take action with respect to the investments of one or more clients that is not given or taken with respect to other clients with similar investment programs, objectives, and strategies. Accordingly, clients with similar strategies will not always hold the same securities or instruments or achieve the same performance. The investment adviser’s investment teams also advise clients with conflicting programs, objectives or strategies. These conflicts also exist as between the investment adviser’s clients, including the Funds, and the Affiliated Investment Accounts managed by Morgan Stanley.
The investment adviser maintains separate trading desks by investment team and generally based on asset class, including two trading desks trading equity securities. These trading desks operate independently of one another. The two equity trading desks do not share information. The separate equity trading desks may result in one desk competing against the other desk when implementing buy and sell transactions, possibly causing certain accounts to pay more or receive less for a security than other accounts. In addition, Morgan Stanley and its affiliates maintain separate trading desks that operate independently of each other and do not share trading information with the investment adviser. These trading desks may compete against the investment adviser trading desks when implementing buy and sell transactions, possibly causing certain Affiliated Investment Accounts to pay more or receive less for a security than other Affiliated Investment Accounts.
Investments by Separate Investment Departments. The entities and individuals that provide investment-related services for the Fund and certain other Eaton Vance Investment Accounts (the “Eaton Vance Investment Department”) may be different from the entities and individuals that provide investment-related services to MS Investment Accounts (the “MS Investment Department and, together with the Eaton Vance Investment Department, the “Investment Departments”). Although Morgan Stanley has implemented information barriers between the Investment Departments in accordance with internal policies and procedures, each Investment Department may engage in discussions and share information and resources with the other Investment Department on certain investment-related matters. The sharing of information and resources between the Investment Departments is designed to further increase the knowledge and effectiveness of each Investment Department. Because each Investment Department generally makes investment decisions and executes trades independently of the other, the quality and price of execution, and the performance of investments and accounts, can be expected to vary. In addition, each Investment Department may use different trading systems and technology and may employ differing investment and trading strategies. As a result, a MS Investment Account could trade in advance of the Fund (and vice versa), might complete trades more quickly and efficiently than the Fund, and/or achieve different execution than the Fund on the same or similar investments made contemporaneously, even when the Investment Departments shared research and viewpoints that led to that investment decision. Any sharing of information or resources between the Investment Department servicing the Fund and the MS Investment Department may result, from time to time, in the Fund simultaneously or contemporaneously seeking to engage in the same or similar transactions as an account serviced by the other Investment Department and for which there are limited buyers or sellers on specific securities, which could result in less favorable execution for the Fund than such account. The Eaton Vance Investment Department will not knowingly or intentionally cause the Fund to engage in a cross trade with an account serviced by the MS Investment Department, however, subject to applicable law and internal policies and procedures, the Fund may conduct cross trades with other accounts serviced by the Eaton Vance Investment Department. Although the Eaton Vance Investment Department may aggregate the Fund’s trades with trades of other accounts serviced by the Eaton Vance Investment Department, subject to applicable law and internal policies and procedures, there will be no aggregation or coordination of trades with accounts serviced by the MS Investment Department, even when both Investment Departments are seeking to acquire or dispose of the same investments contemporaneously.
Eaton Vance
Municipal Bond Funds
September 30, 2023
Potential Conflicts of Interest — continued
Payments to Broker-Dealers and Other Financial Intermediaries. The investment adviser and/or EVD may pay compensation, out of their own funds and not as an expense of the Funds, to certain financial intermediaries (which may include affiliates of the investment adviser and EVD), including recordkeepers and administrators of various deferred compensation plans, in connection with the sale, distribution, marketing and retention of shares of the Funds and/or shareholder servicing. For example, the investment adviser or EVD may pay additional compensation to a financial intermediary for, among other things, promoting the sale and distribution of Fund shares, providing access to various programs, mutual fund platforms or preferred or recommended mutual fund lists that may be offered by a financial intermediary, granting EVD access to a financial intermediary’s financial advisors and consultants, providing assistance in the ongoing education and training of a financial intermediary’s financial personnel, furnishing marketing support, maintaining share balances and/or for sub-accounting, recordkeeping, administrative, shareholder or transaction processing services. Such payments are in addition to any distribution fees, shareholder servicing fees and/or transfer agency fees that may be payable by the Funds. The additional payments may be based on various factors, including level of sales (based on gross or net sales or some specified minimum sales or some other similar criteria related to sales of the Funds and/or some or all other Eaton Vance funds), amount of assets invested by the financial intermediary’s customers (which could include current or aged assets of the Funds and/or some or all other Eaton Vance funds), a Fund’s advisory fee, some other agreed upon amount or other measures as determined from time to time by the investment adviser and/or EVD. The amount of these payments may be different for different financial intermediaries.
The prospect of receiving, or the receipt of, additional compensation, as described above, by financial intermediaries may provide such financial intermediaries and their financial advisors and other salespersons with an incentive to favor sales of shares of the Funds over other investment options with respect to which these financial intermediaries do not receive additional compensation (or receive lower levels of additional compensation). These payment arrangements, however, will not change the price that an investor pays for shares of the Funds or the amount that the Funds receive to invest on behalf of an investor. Investors may wish to take such payment arrangements into account when considering and evaluating any recommendations relating to Fund shares and should review carefully any disclosures provided by financial intermediaries as to their compensation. In addition, in certain circumstances, the investment adviser may restrict, limit or reduce the amount of a Fund’s investment, or restrict the type of governance or voting rights it acquires or exercises, where the Fund (potentially together with Morgan Stanley) exceeds a certain ownership interest, or possesses certain degrees of voting or control or has other interests.
Morgan Stanley Trading and Principal Investing Activities. Notwithstanding anything to the contrary herein, Morgan Stanley will generally conduct its sales and trading businesses, publish research and analysis, and render investment advice without regard for a Fund’s holdings, although these activities could have an adverse impact on the value of one or more of the Fund’s investments, or could cause Morgan Stanley to have an interest in one or more portfolio investments that is different from, and potentially adverse to that of a Fund. Furthermore, from time to time, the investment adviser or its affiliates may invest “seed” capital in a Fund, typically to enable the Fund to commence investment operations and/or achieve sufficient scale. The investment adviser and its affiliates may hedge such seed capital exposure by investing in derivatives or other instruments expected to produce offsetting exposure. Such hedging transactions, if any, would occur outside of a Fund.
Morgan Stanley’s sales and trading, financing and principal investing businesses (whether or not specifically identified as such, and including Morgan Stanley’s trading and principal investing businesses) will not be required to offer any investment opportunities to a Fund. These businesses may encompass, among other things, principal trading activities as well as principal investing.
Morgan Stanley’s sales and trading, financing and principal investing businesses have acquired or invested in, and in the future may acquire or invest in, minority and/or majority control positions in equity or debt instruments of diverse public and/or private companies. Such activities may put Morgan Stanley in a position to exercise contractual, voting or creditor rights, or management or other control with respect to securities or loans of portfolio investments or other issuers, and in these instances Morgan Stanley may, in its discretion and subject to applicable law, act to protect its own interests or interests of clients, and not a Fund’s interests.
Subject to the limitations of applicable law, a Fund may purchase from or sell assets to, or make investments in, companies in which Morgan Stanley has or may acquire an interest, including as an owner, creditor or counterparty.
Morgan Stanley’s Investment Banking and Other Commercial Activities. Morgan Stanley advises clients on a variety of mergers, acquisitions, restructuring, bankruptcy and financing transactions. Morgan Stanley may act as an advisor to clients, including other investment funds that may compete with a Fund and with respect to investments that a Fund may hold. Morgan Stanley may give advice and take action with respect to any of its clients or proprietary accounts that may differ from the advice given, or may involve an action of a different timing or nature than the action taken, by a Fund. Morgan Stanley may give advice and provide recommendations to persons competing with a Fund and/or any of a Fund’s investments that are contrary to the Fund’s best interests and/or the best interests of any of its investments.
Morgan Stanley could be engaged in financial advising, whether on the buy-side or sell-side, or in financing or lending assignments that could result in Morgan Stanley’s determining in its discretion or being required to act exclusively on behalf of one or more third parties, which could limit a Fund’s ability to transact with respect to one or more existing or potential investments. Morgan Stanley may have relationships with third-party funds, companies or investors who may have invested in or may look to invest in portfolio companies, and there could be conflicts between a Fund’s best interests, on the one hand, and the interests of a Morgan Stanley client or counterparty, on the other hand.
Eaton Vance
Municipal Bond Funds
September 30, 2023
Potential Conflicts of Interest — continued
To the extent that Morgan Stanley advises creditor or debtor companies in the financial restructuring of companies either prior to or after filing for protection under Chapter 11 of the U.S. Bankruptcy Code or similar laws in other jurisdictions, the investment adviser’s flexibility in making investments in such restructurings on a Fund’s behalf may be limited.
Morgan Stanley could provide investment banking services to competitors of portfolio companies, as well as to private equity and/or private credit funds; such activities may present Morgan Stanley with a conflict of interest vis-a-vis a Fund’s investment and may also result in a conflict in respect of the allocation of investment banking resources to portfolio companies.
To the extent permitted by applicable law, Morgan Stanley may provide a broad range of financial services to companies in which a Fund invests, including strategic and financial advisory services, interim acquisition financing and other lending and underwriting or placement of securities, and Morgan Stanley generally will be paid fees (that may include warrants or other securities) for such services. Morgan Stanley will not share any of the foregoing interest, fees and other compensation received by it (including, for the avoidance of doubt, amounts received by the investment adviser) with a Fund, and any advisory fees payable will not be reduced thereby.
Morgan Stanley may be engaged to act as a financial advisor to a company in connection with the sale of such company, or subsidiaries or divisions thereof, may represent potential buyers of businesses through its mergers and acquisition activities and may provide lending and other related financing services in connection with such transactions. Morgan Stanley’s compensation for such activities is usually based upon realized consideration and is usually contingent, in substantial part, upon the closing of the transaction. Under these circumstances, a Fund may be precluded from participating in a transaction with or relating to the company being sold or participating in any financing activity related to merger or acquisition.
The involvement or presence of Morgan Stanley in the investment banking and other commercial activities described above (or the financial markets more broadly) may restrict or otherwise limit investment opportunities that may otherwise be available to the Funds. For example, issuers may hire and compensate Morgan Stanley to provide underwriting, financial advisory, placement agency, brokerage services or other services and, because of limitations imposed by applicable law and regulation, a Fund may be prohibited from buying or selling securities issued by those issuers or participating in related transactions or otherwise limited in its ability to engage in such investments.
The investment adviser believes that the nature and range of clients to whom Morgan Stanley and its subsidiaries render investment banking and other services is such that it would be inadvisable to exclude these companies from the Fund’s portfolio.
Morgan Stanley’s Marketing Activities. Morgan Stanley is engaged in the business of underwriting, syndicating, brokering, administering, servicing, arranging and advising on the distribution of a wide variety of securities and other investments in which a Fund may invest. Subject to the restrictions of the 1940 Act, including Sections 10(f) and 17(e) thereof, a Fund may invest in transactions in which Morgan Stanley acts as underwriter, placement agent, syndicator, broker, administrative agent, servicer, advisor, arranger or structuring agent and receives fees or other compensation from the sponsors of such products or securities. Any fees earned by Morgan Stanley in such capacity will not be shared with the investment adviser or the Funds. Certain conflicts of interest, in addition to the receipt of fees or other compensation, would be inherent in these transactions. Moreover, the interests of one of Morgan Stanley’s clients with respect to an issuer of securities in which a Fund has an investment may be adverse to the investment adviser’s or a Fund’s best interests. In conducting the foregoing activities, Morgan Stanley will be acting for its other clients and will have no obligation to act in the investment adviser’s or a Fund’s best interests.
Client Relationships. Morgan Stanley has existing and potential relationships with a significant number of corporations, institutions and individuals. In providing services to its clients, Morgan Stanley may face conflicts of interest with respect to activities recommended to or performed for such clients, on the one hand, and a Fund, its shareholders or the entities in which the Fund invests, on the other hand. In addition, these client relationships may present conflicts of interest in determining whether to offer certain investment opportunities to a Fund.
In acting as principal or in providing advisory and other services to its other clients, Morgan Stanley may engage in or recommend activities with respect to a particular matter that conflict with or are different from activities engaged in or recommended by the investment adviser on a Fund’s behalf.
Principal Investments. To the extent permitted by applicable law, there may be situations in which a Fund’s interests may conflict with the interests of one or more general accounts of Morgan Stanley and its affiliates or accounts managed by Morgan Stanley or its affiliates. This may occur because these accounts hold public and private debt and equity securities of many issuers which may be or become portfolio companies, or from whom portfolio companies may be acquired.
Transactions with Portfolio Companies of Affiliated Investment Accounts. The companies in which a Fund may invest may be counterparties to or participants in agreements, transactions or other arrangements with portfolio companies or other entities of portfolio investments of Affiliated Investment Accounts (for example, a company in which a Fund invests may retain a company in which an Affiliated Investment Account invests to provide services or may acquire an asset from such company or vice versa). Certain of these agreements, transactions and arrangements involve fees, servicing payments, rebates and/or other benefits to Morgan Stanley or its affiliates. For example, portfolio entities may, including at the encouragement of Morgan Stanley, enter into agreements regarding group procurement and/or vendor discounts. Morgan Stanley and its affiliates may also participate in these agreements and may realize better pricing or discounts as a result of the participation of portfolio entities. To the extent permitted by applicable law, certain of these agreements may provide for commissions or similar payments and/or discounts or rebates to be paid to a portfolio entity of an Affiliated Investment Account, and such payments or discounts or rebates may also be made directly to Morgan Stanley or its affiliates. Under these arrangements, a particular
Eaton Vance
Municipal Bond Funds
September 30, 2023
Potential Conflicts of Interest — continued
portfolio company or other entity may benefit to a greater degree than the other participants, and the funds, investment vehicles and accounts (which may or may not include a Fund) that own an interest in such entity will receive a greater relative benefit from the arrangements than the Eaton Vance funds, investment vehicles or accounts that do not own an interest therein. Fees and compensation received by portfolio companies of Affiliated Investment Accounts in relation to the foregoing will not be shared with a Fund or offset advisory fees payable.
Investments in Portfolio Investments of Other Funds. To the extent permitted by applicable law, when a Fund invests in certain companies or other entities, other funds affiliated with the investment adviser may have made or may be making an investment in such companies or other entities. Other funds that have been or may be managed by the investment adviser may invest in the companies or other entities in which a Fund has made an investment. Under such circumstances, a Fund and such other funds may have conflicts of interest (e.g., over the terms, exit strategies and related matters, including the exercise of remedies of their respective investments). If the interests held by a Fund are different from (or take priority over) those held by such other funds, the investment adviser may be required to make a selection at the time of conflicts between the interests held by such other funds and the interests held by a Fund.
Allocation of Expenses. Expenses may be incurred that are attributable to a Fund and one or more other Affiliated Investment Accounts (including in connection with issuers in which a Fund and such other Affiliated Investment Accounts have overlapping investments). The allocation of such expenses among such entities raises potential conflicts of interest. The investment adviser and its affiliates intend to allocate such common expenses among a Fund and any such other Affiliated Investment Accounts on a pro rata basis or in such other manner as the investment adviser deems to be fair and equitable or in such other manner as may be required by applicable law.
Temporary Investments. To more efficiently invest short-term cash balances held by a Fund, the investment adviser may invest such balances on an overnight “sweep” basis in shares of one or more money market funds or other short-term vehicles. It is anticipated that the investment adviser to these money market funds or other short-term vehicles may be the investment adviser (or an affiliate) to the extent permitted by applicable law, including Rule 12d1-1 under the 1940 Act.
Transactions with Affiliates. The investment adviser and any investment sub-adviser might purchase securities from underwriters or placement agents in which a Morgan Stanley affiliate is a member of a syndicate or selling group, as a result of which an affiliate might benefit from the purchase through receipt of a fee or otherwise. Neither the investment adviser nor any investment sub-adviser will purchase securities on behalf of a Fund from an affiliate that is acting as a manager of a syndicate or selling group. Purchases by the investment adviser on behalf of a Fund from an affiliate acting as a placement agent must meet the requirements of applicable law. Furthermore, Morgan Stanley may face conflicts of interest when the Funds use service providers affiliated with Morgan Stanley because Morgan Stanley receives greater overall fees when they are used.
General Process for Potential Conflicts. All of the transactions described above involve the potential for conflicts of interest between the investment adviser, related persons of the investment adviser and/or their clients. The Advisers Act, the 1940 Act and ERISA impose certain requirements designed to decrease the possibility of conflicts of interest between an investment adviser and its clients. In some cases, transactions may be permitted subject to fulfillment of certain conditions. Certain other transactions may be prohibited. In addition, the investment adviser has instituted policies and procedures designed to prevent conflicts of interest from arising and, when they do arise, to ensure that it effects transactions for clients in a manner that is consistent with its fiduciary duty to its clients and in accordance with applicable law. The investment adviser seeks to ensure that potential or actual conflicts of interest are appropriately resolved taking into consideration the overriding best interests of the client.
Delivery of Shareholder Documents. The Securities and Exchange Commission (SEC) permits funds to deliver only one copy of shareholder documents, including prospectuses, proxy statements and shareholder reports, to fund investors with multiple accounts at the same residential or post office box address. This practice is often called “householding” and it helps eliminate duplicate mailings to shareholders. Equiniti Trust Company, LLC ("EQ"), the closed-end funds transfer agent, or your financial intermediary, may household the mailing of your documents indefinitely unless you instruct EQ, or your financial intermediary, otherwise. If you would prefer that your Eaton Vance documents not be householded, please contact EQ or your financial intermediary. Your instructions that householding not apply to delivery of your Eaton Vance documents will typically be effective within 30 days of receipt by EQ or your financial intermediary.
Portfolio Holdings. Each Eaton Vance Fund and its underlying Portfolio(s) (if applicable) files a schedule of portfolio holdings on Part F to Form N-PORT with the SEC. Certain information filed on Form N-PORT may be viewed on the Eaton Vance website at www.eatonvance.com, by calling Eaton Vance at 1-800-262-1122 or in the EDGAR database on the SEC’s website at www.sec.gov.
Proxy Voting. From time to time, funds are required to vote proxies related to the securities held by the funds. The Eaton Vance Funds or their underlying Portfolios (if applicable) vote proxies according to a set of policies and procedures approved by the Funds’ and Portfolios’ Boards. You may obtain a description of these policies and procedures and information on how the Funds or Portfolios voted proxies relating to portfolio securities during the most recent 12-month period ended June 30, without charge, upon request, by calling 1-800-262-1122 and by accessing the SEC’s website at www.sec.gov.
Share Repurchase Program. The Funds' Boards of Trustees have approved a share repurchase program authorizing each Fund to repurchase up to 10% of its common shares outstanding as of the last day of the prior calendar year in open-market transactions at a discount to net asset value. The repurchase program does not obligate a Fund to purchase a specific amount of shares. The Funds' repurchase activity, including the number of shares purchased, average price and average discount to net asset value, is disclosed in the Funds' annual and semi-annual reports to shareholders.
Additional Notice to Shareholders. If applicable, a Fund may also redeem or purchase its outstanding preferred shares in order to maintain compliance with regulatory requirements, borrowing or rating agency requirements or for other purposes as it deems appropriate or necessary.
Closed-End Fund Information. Eaton Vance closed-end funds make fund performance data and certain information about portfolio characteristics available on the Eaton Vance website shortly after the end of each month. Other information about the funds is available on the website. The funds’ net asset value per share is readily accessible on the Eaton Vance website. Portfolio holdings for the most recent month-end are also posted to the website approximately 30 days following the end of the month. This information is available at www.eatonvance.com on the fund information pages under “Closed-End Funds & Term Trusts.”
Investment Adviser and Administrator
Eaton Vance Management
Two International Place
Boston, MA 02110
Custodian
State Street Bank and Trust Company
One Congress Street, Suite 1
Boston, MA 02114-2016
Transfer Agent
Equiniti Trust Company, LLC
6201 15th Avenue
Brooklyn, NY 11219
Independent Registered Public Accounting Firm
Deloitte & Touche LLP
200 Berkeley Street
Boston, MA 02116-5022
Fund Offices
Two International Place
Boston, MA 02110
Item 2. Code of Ethics
The registrant (sometimes referred to as the “Fund”) has adopted a code of ethics applicable to its Principal Executive Officer, Principal Financial Officer and Principal Accounting Officer. The registrant undertakes to provide a copy of such code of ethics to any person upon request, without charge, by calling 1-800-262-1122. The registrant has not amended the code of ethics as described in Form N-CSR during the period covered by this report. The registrant has not granted any waiver, including an implicit waiver, from a provision of the code of ethics as described in Form N-CSR during the period covered by this report.
Item 3. Audit Committee Financial Expert
The registrant’s Board of Trustees (the “Board”) has designated George J. Gorman and Scott E. Wennerholm, each an independent trustee, as audit committee financial experts. Mr. Gorman is a certified public accountant who is the Principal at George J. Gorman LLC (a consulting firm). Previously, Mr. Gorman served in various capacities at Ernst & Young LLP (a registered public accounting firm), including as Senior Partner. Mr. Gorman also has experience serving as an independent trustee and audit committee financial expert of other mutual fund complexes. Mr. Wennerholm is a private investor. Previously, Mr. Wennerholm served as a Trustee at Wheelock College (postsecondary institution), as a Consultant at GF Parish Group (executive recruiting firm), Chief Operating Officer and Executive Vice President at BNY Mellon Asset Management (investment management firm), Chief Operating Officer and Chief Financial Officer at Natixis Global Asset Management (investment management firm), and Vice President at Fidelity Investments Institutional Services (investment management firm).
Item 4. Principal Accountant Fees and Services
(a) –(d)
The following table presents the aggregate fees billed to the registrant for the registrant’s fiscal years ended September 30, 2022 and September 30, 2023 by the registrant’s principal accountant, Deloitte & Touche LLP (“D&T”), for professional services rendered for the audit of the registrant’s annual financial statements and fees billed for other services rendered by D&T during such periods.
| | | | | | | | |
Fiscal Years Ended | | 9/30/22 | | | 9/30/23 | |
Audit Fees | | $ | 80,900 | | | $ | 80,900 | |
Audit-Related Fees(1) | | $ | 0 | | | $ | 0 | |
Tax Fees(2) | | $ | 350 | | | $ | 0 | |
All Other Fees(3) | | $ | 0 | | | $ | 0 | |
| | | | | | | | |
Total | | $ | 81,250 | | | $ | 80,900 | |
| | | | | | | | |
| (1) | Audit-related fees consist of the aggregate fees billed for assurance and related services that are reasonably related to the performance of the audit of the registrant’s financial statements and are not reported under the category of audit fees. |
| (2) | Tax fees consist of the aggregate fees billed for professional services rendered by the principal accountant relating to tax compliance, tax advice, and tax planning and specifically include fees for tax return preparation and other related tax compliance/planning matters. |
| (3) | All other fees consist of the aggregate fees billed for products and services provided by the principal accountant other than audit, audit-related, and tax services. |
(e)(1) The registrant’s audit committee has adopted policies and procedures relating to the pre-approval of services provided by the registrant’s principal accountant (the “Pre-Approval Policies”). The Pre-Approval Policies establish a framework intended to assist the audit committee in the proper discharge of its pre-approval responsibilities. As a general matter, the Pre-Approval Policies (i) specify certain types of audit, audit-related, tax, and other services determined to be pre-approved by the audit committee; and (ii) delineate specific procedures governing the mechanics of the pre-approval process, including the approval and monitoring of audit and non-audit service fees. Unless a service is specifically pre-approved under the Pre-Approval Policies, it must be separately pre-approved by the audit committee.
The Pre-Approval Policies and the types of audit and non-audit services pre-approved therein must be reviewed and ratified by the registrant’s audit committee at least annually. The registrant’s audit committee maintains full responsibility for the appointment, compensation, and oversight of the work of the registrant’s principal accountant.
(e)(2) No services described in paragraphs (b)-(d) above were approved by the registrant’s audit committee pursuant to the “de minimis exception” set forth in Rule 2-01 (c)(7)(i)(C) of Regulation S-X.
(f) Not applicable.
(g) The following table presents (i) the aggregate non-audit fees (i.e., fees for audit-related, tax, and other services) billed to the registrant by D&T for the registrant’s fiscal years ended September 30, 2022 and September 30, 2023; and (ii) the aggregate non-audit fees (i.e., fees for audit-related, tax, and other services) billed to the Eaton Vance organization by D&T for the same time periods.
| | | | | | | | |
Fiscal Years Ended | | 9/30/22 | | | 9/30/23 | |
Registrant | | $ | 350 | | | $ | 0 | |
Eaton Vance(1) | | $ | 52,836 | | | $ | 52,836 | |
| (1) | The investment adviser to the registrant, as well as any of its affiliates that provide ongoing services to the registrant, are subsidiaries of Morgan Stanley. |
(h) The registrant’s audit committee has considered whether the provision by the registrant’s principal accountant of non-audit services to the registrant’s investment adviser and any entity controlling, controlled by, or under common control with the adviser that provides ongoing services to the registrant that were not pre-approved pursuant to Rule 2-01(c)(7)(ii) of Regulation S-X is compatible with maintaining the principal accountant’s independence.
(i) Not applicable.
(j) Not applicable.
Item 5. Audit Committee of Listed Registrants
The registrant has a separately-designated standing audit committee established in accordance with Section 3(a)(58)(A) of the Securities and Exchange Act of 1934, as amended. George J. Gorman, Keith Quinton, Scott E. Wennerholm (Chair), and Nancy A. Wiser are the members of the registrant’s audit committee.
Item 6. Schedule of Investments
Please see schedule of investments contained in the Report to Stockholders included under Item 1 of this Form N-CSR.
Item 7. Disclosure of Proxy Voting Policies and Procedures for Closed-End Management Investment Companies
The Board of the Fund has adopted a proxy voting policy and procedure (the “Fund Policy”), pursuant to which the trustees have delegated proxy voting responsibility to the Fund’s investment adviser and adopted the investment adviser’s proxy voting policies and procedures (the “Policies”) which are described below. The trustees will review the Policies annually. In the event that a conflict of interest arises between the Fund’s shareholders and the investment adviser, the administrator, or any of their affiliates or any affiliate of the Fund, the investment adviser will generally refrain from voting the proxies related to the companies giving rise to such conflict until it consults with the Board, or any committee, sub-committee or group of independent trustees identified by the Board, which will instruct the investment adviser on the appropriate course of action. If the Board Members are unable to meet and the failure to vote a proxy would have a material adverse impact on the Fund, the investment adviser may vote such proxy, provided that it discloses the existence of the material conflict to the Chairperson of the Fund’s Board as soon as practicable and to the Board at its next meeting.
The Policies are designed to promote accountability of a company’s management to its shareholders and to align the interests of management with those shareholders. An independent proxy voting service (“Agent”), currently Institutional Shareholder Services, Inc., has been retained to assist in the voting of proxies through the provision of vote analysis, implementation and recordkeeping and disclosure services. The investment adviser will generally vote proxies through the Agent. The Agent is required to vote all proxies in accordance with customized proxy voting guidelines (the “Guidelines”) and/or refer them back to the investment adviser pursuant to the Policies.
The Agent is required to establish and maintain adequate internal controls and policies in connection with the provision of proxy voting services, including methods to reasonably ensure that its analysis and recommendations are not influenced by a conflict of interest. The Guidelines include voting guidelines for matters relating to, among other things, the election of directors, approval of independent auditors, executive compensation, corporate structure and anti-takeover defenses. The investment adviser may cause the Fund to abstain from voting from time to time where it determines that the costs associated with voting a proxy outweigh the benefits derived from exercising the right to vote or it is unable to access or access timely ballots or other proxy information, among other stated reasons. The Agent will refer Fund proxies to the investment adviser for instructions under circumstances where, among others: (1) the application of the Guidelines is unclear; (2) a particular proxy question is not covered by the Guidelines; or (3) the Guidelines require input from the investment adviser. When a proxy voting issue has been referred to the investment adviser, the analyst (or portfolio manager if applicable) covering the company subject to the proxy proposal determines the final vote (or decision not to vote) and the investment adviser’s Proxy Administrator (described below) instructs the Agent to vote accordingly for securities held by the Fund. Where more than one analyst covers a particular company and the recommendations of such analysts voting a proposal conflict, the investment adviser’s Global Proxy Group (described below) will review such recommendations and any other available information related to the proposal and determine the manner in which it should be voted, which may result in different recommendations for the Fund that may differ from other clients of the investment adviser.
The investment adviser has appointed a Proxy Administrator to assist in the coordination of the voting of client proxies (including the Fund’s) in accordance with the Guidelines and the Policies. The investment adviser and its affiliates have also established a Global Proxy Group. The Global Proxy Group develops the investment adviser’s positions on all major corporate issues, creates the Guidelines and oversees the proxy voting process. The Proxy Administrator maintains a record of all proxy questions that have been referred by the Agent, all applicable recommendations, analysis and research received and any resolution of the matter. Before instructing the Agent to vote contrary to the Guidelines or the recommendation of the Agent, the Proxy Administrator will provide the Global Proxy Group with the Agent’s recommendation for the proposal along with any other relevant materials, including the basis for the analyst’s recommendation. The Proxy Administrator will then instruct the Agent to vote the proxy in the manner determined by the Global Proxy Group. A similar process will be followed if the Agent has a conflict of interest with respect to a proxy. The investment adviser will report to the Fund’s Board any votes cast contrary to the Guidelines or Agent recommendations, as applicable, no less than annually.
The investment adviser’s Global Proxy Group is responsible for monitoring and resolving possible material conflicts with respect to proxy voting. Because the Guidelines are predetermined and designed to be in the best interests of shareholders, application of the Guidelines to vote client proxies should, in most cases, adequately address any possible conflict of interest. The investment adviser will monitor situations that may result in a conflict of interest between any of its clients and the investment adviser or any of its affiliates by maintaining a list of significant existing and prospective corporate clients. The Proxy Administrator will compare such list with the names of companies of which he or she has been referred a proxy statement (the “Proxy Companies”). If a company on the list is also a Proxy Company, the Proxy Administrator will report that fact to the Global Proxy Group. If the Proxy Administrator intends to instruct the Agent to vote in a manner inconsistent with the Guidelines, the Global Proxy Group will first determine, in consultation with legal counsel if necessary, whether a material conflict exists. If it is determined that a material conflict exists, the investment adviser will seek instruction on how the proxy should be voted from the Fund’s Board, or any committee or subcommittee identified by the Board. If a matter is referred to the Global Proxy Group, the decision made and basis for the decision will be documented by the Proxy Administrator and/or Global Proxy Group.
Information on how the Fund voted proxies relating to portfolio securities during the most recent 12 month period ended June 30 is available (1) without charge, upon request, by calling 1-800-262-1122, and (2) on the Securities and Exchange Commission’s website at http://www.sec.gov.
Item 8. Portfolio Managers of Closed-End Management Investment Companies
Eaton Vance Management (“EVM” or “Eaton Vance”) is the investment adviser of each Fund. Cynthia J. Clemson and Julie P. Callahan, CFA are the portfolio managers of Eaton Vance Municipal Bond Fund. Christopher J. Eustance, CFA and Paul Metheny, CFA are the portfolio managers of Eaton Vance New York Municipal Bond Fund. Trevor G. Smith and Carl Thompson, CFA are the portfolio managers of Eaton Vance California Municipal Bond Fund. Each portfolio manager is a Vice President of EVM and also manages other Eaton Vance portfolios. Ms. Clemson and Messrs. Brandon, Eustance, Metheny, Smith and Thompson have been members of the Eaton Vance organization for more than five years. Ms. Callahan has been a Vice President of EVM since September 2021 and has been a Managing Director at Morgan Stanley Investment Management Inc. (“MSIM”), an affiliate of EVM, since 2020. Prior to joining MSIM, she was a senior member of the municipal bond portfolio management team at PIMCO from 2011 to 2020. This information is provided as of the date of filing this report.
The following table shows, as of each Fund’s most recent fiscal year end, the number of accounts each portfolio manager managed in each of the listed categories and the total assets (in millions of dollars) in the accounts managed within each category. The table also shows the number of accounts with respect to which the advisory fee is based on the performance of the account, if any, and the total assets (in millions of dollars) in those accounts.
| | | | | | | | | | | | | | | | |
| | | Number of
All
Accounts | | | Total Assets of
All Accounts | | | Number of Accounts
Paying a
Performance Fee | | | Total Assets of
Accounts Paying a
Performance Fee | |
Cynthia J. Clemson | | | | | | | | | | | | | | | | |
Registered Investment Companies | | | 8 | | | $ | 3,813.0 | | | | 0 | | | $ | 0 | |
Other Pooled Investment Vehicles | | | 0 | | | $ | 0 | | | | 0 | | | $ | 0 | |
Other Accounts | | | 8 | | | $ | 24.4 | | | | 0 | | | $ | 0 | |
Julie P. Callahan, CFA | | | | | | | | | | | | | | | | |
Registered Investment Companies | | | 9 | | | $ | 2,547.9 | | | | 0 | | | $ | 0 | |
Other Pooled Investment Vehicles | | | 0 | | | $ | 0 | | | | 0 | | | $ | 0 | |
Other Accounts | | | 0 | | | $ | 0 | | | | 0 | | | $ | 0 | |
Christopher J. Eustance, CFA | | | | | | | | | | | | | | | | |
Registered Investment Companies | | | 11 | | | $ | 6,053.3 | | | | 0 | | | $ | 0 | |
Other Pooled Investment Vehicles | | | 0 | | | $ | 0 | | | | 0 | | | $ | 0 | |
Other Accounts | | | 0 | | | $ | 0 | | | | 0 | | | $ | 0 | |
| | | | | | | | | | | | | | | | |
| | | Number
of All
Accounts | | | Total Assets of
All Accounts | | | Number of Accounts
Paying a
Performance Fee | | | Total Assets of
Accounts Paying a
Performance Fee | |
Paul Metheny, CFA | | | | | | | | | | | | | | | | |
Registered Investment Companies | | | 3 | | | $ | 1,028.3 | | | | 0 | | | $ | 0 | |
Other Pooled Investment Vehicles | | | 0 | | | $ | 0 | | | | 0 | | | $ | 0 | |
Other Accounts | | | 3 | | | $ | 521.7 | | | | 0 | | | $ | 0 | |
Trevor G. Smith | | | | | | | | | | | | | | | | |
Registered Investment Companies | | | 12 | | | $ | 3,415.0 | | | | 0 | | | $ | 0 | |
Other Pooled Investment Vehicles | | | 2 | | | $ | 156.5 | | | | 0 | | | $ | 0 | |
Other Accounts | | | 2 | | | $ | 24.4 | | | | 0 | | | $ | 0 | |
Carl Thompson, CFA | | | | | | | | | | | | | | | | |
Registered Investment Companies | | | 6 | | | $ | 649.9 | | | | 0 | | | $ | 0 | |
Other Pooled Investment Vehicles | | | 0 | | | $ | 0 | | | | 0 | | | $ | 0 | |
Other Accounts | | | 0 | | | $ | 0 | | | | 0 | | | $ | 0 | |
The following table shows the dollar range of Fund shares beneficially owned by each portfolio manager as of each Fund’s most recent fiscal year end.
| | |
Fund Name and Portfolio Managers | | Dollar Range of Equity Securities Beneficially Owned in the Fund |
California Municipal Bond Fund | | |
Trevor G. Smith | | None |
Carl Thompson, CFA | | None |
| |
Municipal Bond Fund | | |
Cynthia J. Clemson | | None |
Julie P. Callahan, CFA | | None |
| |
New York Municipal Bond Fund | | |
Christopher J. Eustance, CFA | | None |
Paul Metheny, CFA | | None |
Potential for Conflicts of Interest. It is possible that conflicts of interest may arise in connection with a portfolio manager’s management of the Fund’s investments on the one hand and the investments of other accounts for which a portfolio manager is responsible on the other. For example, a portfolio manager may have conflicts of interest in allocating management time, resources and investment opportunities among the Fund and other accounts he or she advises. In addition, due to differences in the investment strategies or restrictions between the Fund and the other accounts, the portfolio manager may take action with respect to another account that differs from the action taken with respect to the Fund. In some cases, another account managed by a portfolio manager may compensate the investment adviser based on the performance of the securities held by that account. The existence of such a performance based fee may create additional conflicts of interest for the portfolio manager in the allocation of management time, resources and investment opportunities. Whenever conflicts of interest arise, the portfolio manager will endeavor to exercise his or her discretion in a manner that he or she believes is equitable to all interested persons. EVM has adopted several policies and procedures designed to address these potential conflicts including a code of ethics and policies that govern the investment adviser’s trading practices, including among other things the aggregation and allocation of trades among clients, brokerage allocations, cross trades and best execution.
Compensation Structure for EVM
The compensation structure of Eaton Vance and its affiliates that are investment advisers (for purposes of this section “Eaton Vance”) is based on a total reward system of base salary and incentive compensation, which is paid either in the form of cash bonus, or for employees meeting the specified deferred compensation eligibility threshold, partially as a cash bonus and partially as mandatory deferred compensation. Deferred compensation granted to Eaton Vance employees is generally granted as a mix of deferred cash awards under the Investment Management Alignment Plan (IMAP) and equity-based awards in the form of stock units. The portion of incentive compensation granted in the form of a deferred compensation award and the terms of such awards are determined annually by the Compensation, Management Development and Succession Committee of Morgan Stanley.
Base salary compensation. Generally, portfolio managers receive base salary compensation based on the level of their position with the adviser.
Incentive compensation. In addition to base compensation, portfolio managers may receive discretionary year-end compensation. Incentive compensation may include:
| | • | | A mandatory program that defers a portion of incentive compensation into restricted stock units or other awards based on Morgan Stanley common stock or other plans that are subject to vesting and other conditions. |
| | • | | IMAP is a cash-based deferred compensation plan designed to increase the alignment of participants’ interests with the interests of clients. For eligible employees, a portion of their deferred compensation is mandatorily deferred into IMAP on an annual basis. Awards granted under IMAP are notionally invested in referenced funds available pursuant to the plan, which are funds advised by MSIM and its affiliates that are investment advisers. Portfolio managers are required to notionally invest a minimum of 40% of their account balance in the designated funds that they manage and are included in the IMAP notional investment fund menu. |
| | • | | Deferred compensation awards are typically subject to vesting over a multi-year period and are subject to cancellation through the payment date for competition, cause (i.e., any act or omission that constitutes a breach of obligation to the Funds, including failure to comply with internal compliance, ethics or risk management standards, and failure or refusal to perform duties satisfactorily, including supervisory and management duties), disclosure of proprietary information, and solicitation of employees or clients. Awards are also subject to clawback through the payment date if an employee’s act or omission (including with respect to direct supervisory responsibilities) causes a restatement of the firm’s consolidated financial results, constitutes a violation of the firm’s global risk management principles, policies and standards, or causes a loss of revenue associated with a position on which the employee was paid and the employee operated outside of internal control policies. |
Eaton Vance compensates employees based on principles of pay-for-performance, market competitiveness and risk management. Eligibility for, and the amount of any, discretionary compensation is subject to a multi-dimensional process. Specifically, consideration is given to one or more of the following factors, which can vary by portfolio management team and circumstances:
| | • | | Revenue and profitability of the business and/or each fund/account managed by the portfolio manager |
| | • | | Revenue and profitability of the Firm |
| | • | | Return on equity and risk factors of both the business units and Morgan Stanley |
| | • | | Assets managed by the portfolio manager |
| | • | | External market conditions |
| | • | | New business development and business sustainability |
| | • | | Contribution to client objectives |
| | • | | Team, product and/or MSIM and its affiliates that are investment advisers (including Eaton Vance) performance |
| | • | | The pre-tax investment performance of the funds/accounts managed by the portfolio manager (which may, in certain cases, be measured against the applicable benchmark(s) and/or peer group(s) over one, three and five-year periods) |
| | • | | Individual contribution and performance |
Further, the firm’s Global Incentive Compensation Discretion Policy requires compensation managers to consider Further the only legitimate, business related factors when exercising discretion in determining variable incentive compensation, including adherence to Morgan Stanley’s core values, conduct, disciplinary actions in the current performance year, risk management and risk outcomes.
Item 9. Purchases of Equity Securities by Closed-End Management Investment Company and Affiliated Purchasers
No such purchases this period.
Item 10. Submission of Matters to a Vote of Security Holders
No material changes.
Item 11. Controls and Procedures
(a) It is the conclusion of the registrant’s principal executive officer and principal financial officer that the effectiveness of the registrant’s current disclosure controls and procedures (such disclosure controls and procedures having been evaluated within 90 days of the date of this filing) provide reasonable assurance that the information required to be disclosed by the registrant has been recorded, processed, summarized and reported within the time period specified in the Commission’s rules and forms and that the information required to be disclosed by the registrant has been accumulated and communicated to the registrant’s principal executive officer and principal financial officer in order to allow timely decisions regarding required disclosure.
(b) There have been no changes in the registrant’s internal controls over financial reporting during the period covered by this report that has materially affected, or is reasonably likely to materially affect, the registrant’s internal control over financial reporting.
Item 12. Disclosure of Securities Lending Activities for Closed-End Management Investment Companies
No activity to report for the registrant’s most recent fiscal year end.
Item 13. Exhibits
Signatures
Pursuant to the requirements of the Securities Exchange Act of 1934 and the Investment Company Act of 1940, the registrant has duly caused this report to be signed on its behalf by the undersigned, thereunto duly authorized.
Eaton Vance New York Municipal Bond Fund
| | |
| By: | | /s/ Kenneth A. Topping |
| | Kenneth A. Topping |
| | President |
| |
| Date: | | December 8, 2023 |
Pursuant to the requirements of the Securities Exchange Act of 1934 and the Investment Company Act of 1940, this report has been signed below by the following persons on behalf of the registrant and in the capacities and on the dates indicated.
| | |
| By: | | /s/ James F. Kirchner |
| | James F. Kirchner |
| | Treasurer |
| |
| Date: | | December 8, 2023 |
| |
| By: | | /s/ Kenneth A. Topping |
| | Kenneth A. Topping |
| | President |
| |
| Date: | | December 8, 2023 |