UNITED STATES
SECURITIES AND EXCHANGE COMMISSION
Washington, D.C. 20549
Form N-CSR
CERTIFIED SHAREHOLDER REPORT OF REGISTERED
MANAGEMENT INVESTMENT COMPANIES
Investment Company Act File Number: 811-21148
Eaton Vance New York Municipal Bond Fund
(Exact Name of Registrant as Specified in Charter)
Two International Place, Boston, Massachusetts 02110
(Address of Principal Executive Offices)
Deidre E. Walsh
Two International Place, Boston, Massachusetts 02110
(Name and Address of Agent for Services)
(617) 482-8260
(Registrant’s Telephone Number)
September 30
Date of Fiscal Year End
September 30, 2021
Date of Reporting Period
Item 1. Reports to Stockholders

Eaton Vance
Municipal Bond Funds
Annual Report
September 30, 2021
Municipal (EIM) • California (EVM) • New York (ENX)

Commodity Futures Trading Commission Registration. The Commodity Futures Trading Commission (“CFTC”) has adopted regulations that subject registered investment companies and advisers to regulation by the CFTC if a fund invests more than a prescribed level of its assets in certain CFTC-regulated instruments (including futures, certain options and swap agreements) or markets itself as providing investment exposure to such instruments. The investment adviser has claimed an exclusion from the definition of “commodity pool operator” under the Commodity Exchange Act with respect to its management of each Fund. Accordingly, neither the Funds nor the adviser with respect to the operation of the Funds is subject to CFTC regulation. Because of its management of other strategies, the Funds’ adviser is registered with the CFTC as a commodity pool operator. The adviser is also registered as a commodity trading advisor.
Fund shares are not insured by the FDIC and are not deposits or other obligations of, or guaranteed by, any depository institution.
Shares are subject to investment risks, including possible loss of principal invested.
Annual Report September 30, 2021
Eaton Vance
Municipal Bond Funds
Eaton Vance
Municipal Bond Funds
September 30, 2021
Management’s Discussion of Fund Performance1
Economic and Market Conditions
In the opening month of the 12-month period starting October 1, 2020, municipal bond prices fell and yields rose, driven in part by investor uncertainty ahead of the U.S. presidential election and Congress’ failure to pass a second COVID-19 pandemic stimulus bill — $400-$500 billion of which had been projected for state and local government assistance.
In November 2020, however, the municipal market reversed course, beginning a rally that would last through mid-February 2021. Joe Biden’s presidential victory eased the political uncertainties that had dogged investment markets through much of the fall. The announcement that two coronavirus vaccine candidates had proven more than 90% effective in late-stage trials buoyed the markets as well. In December, the beginning of the COVID-19 vaccination process and Congress’ passage of a fiscal stimulus bill added more fuel to the bond rally.
From mid-February through June 2021, however, bonds reversed course again. Municipal and Treasury yields rose and bond prices declined in anticipation of rising economic growth, driven by a new, larger federal stimulus bill and accelerating progress on vaccinating the U.S. population. In late spring and early summer, higher than expected year-over-year inflation numbers also raised investor concerns and put further upward pressure on interest rates.
By July, however, the emergence of a more contagious Delta variant of COVID-19 and breakthrough cases in vaccinated people threatened the U.S. economic rebound and diminished inflation concerns. Investors again turned to U.S. Treasurys and municipal bonds as safe-haven assets, leading bond prices to rise and interest rates to fall in July.
In the final months of the period, bond prices declined once again. A combination of wage inflation and anticipation that the U.S. Federal Reserve (the Fed) would begin tapering its monthly bond purchases — which had bolstered the economy and helped hold rates down through most of the pandemic — conspired to push municipal rates modestly higher. The Fed’s acknowledgement after its September meeting that tapering could begin as early as November put further upward pressure on municipal and Treasury interest rates as the period came to a close.
Nonetheless, demand for municipal bonds remained strong amid concerns over rising taxes for high-income earners under new legislation proposed by the Biden administration.
For the period as a whole, interest rates rose across the municipal bond yield curve, but less at the long — 30-year — end of the curve. As a result, the curve flattened. Throughout the curve, however, rates remained near historic lows. The Bloomberg Municipal Bond Index (the Index), a broad measure of the municipal bond market, returned 2.63% for the period. Municipal bonds outperformed U.S. Treasurys, as Treasury interest rates in every part of the curve rose significantly more than municipal rates. Reflecting investors’ general optimism about an economic rebound and their search for yield in a low-yield environment, high-yield municipal bonds outperformed investment-grade municipal bonds during the period.
Fund Performance
For the 12-month period ended September 30, 2021, Eaton Vance Municipal Bond Fund, Eaton Vance California Municipal Bond Fund, and Eaton Vance New York Municipal Bond Fund (the Funds) at net asset value of their common shares (NAV) outperformed the 2.63% return of the Funds’ benchmark, the Index.
In managing the Funds, management employs leverage through residual interest bond financing to seek to enhance the Funds’ tax-exempt income. The use of leverage has the effect of achieving additional exposure to the municipal market, magnifying a Fund’s exposure to its underlying investments in both up and down market environments. Although municipal bond prices generally declined during the period due to rising interest rates, the use of leverage generated additional tax-exempt bond income for all three Funds, enhancing their performance relative to the Index, which does not employ leverage.
See Endnotes and Additional Disclosures in this report.
Past performance is no guarantee of future results. Returns are historical and are calculated net of management fees and other expenses by determining the percentage change in net asset value (NAV) or market price (as applicable) with all distributions reinvested in accordance with the Fund’s Dividend Reinvestment Plan. Performance at market price will differ from performance at NAV due to variations in the Fund’s market price versus NAV, which may reflect factors such as fluctuations in supply and demand for Fund shares, changes in Fund distributions, shifting market expectations for the Fund’s future returns and distribution rates, and other considerations affecting the trading prices of closed-end funds. Investment return and principal value will fluctuate so that shares, when sold, may be worth more or less than their original cost. Performance for periods less than or equal to one year is cumulative. Performance is for the stated time period only; due to market volatility, current Fund performance may be lower or higher than the quoted return. For performance as of the most recent month-end, please refer to eatonvance.com.
Eaton Vance
Municipal Bond Funds
September 30, 2021
Management’s Discussion of Fund Performance1 — continued
Fund Specific Results
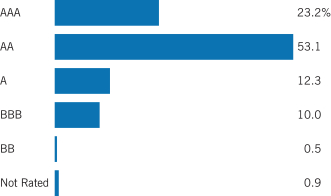
Eaton Vance Municipal Bond Fund returned 3.75% at NAV, outperforming the Index, which returned 2.63%. Contributors to performance versus the Index included leverage as well as security selections and an overweight position relative to the Index in BBB rated bonds during a period when BBB bonds outperformed AAA and AA bonds. An overweight position in Illinois bonds also contributed to performance relative to the Index as Illinois bonds recovered from weak performance in the previous fiscal year due to investor uncertainty about the economic effects of the pandemic. Chief detractors from returns versus the Index included an overweight position in the water and sewer sector; an overweight position in prerefunded, or escrowed, bonds; and security selections in zero-coupon bonds, which were the best-performing coupon structure within the Index during the period.
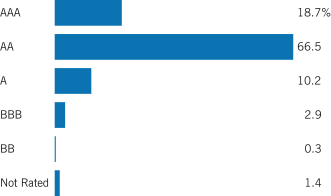
Eaton Vance California Municipal Bond Fund returned 2.78% at NAV, outperforming the Index, which returned 2.63%. Leverage; security selections in BBB rated bonds; and an allocation to taxable municipal bonds, which are not represented in the Index, all contributed to performance relative to the Index. In contrast, an overweight position in prerefunded bonds, security selections in zero-coupon bonds, and underweight positions in A rated and BBB rated bonds all detracted from performance versus the Index.
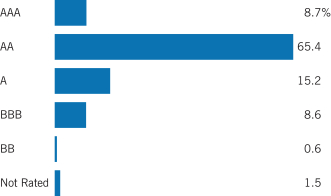
Eaton Vance New York Municipal Bond Fund returned 4.34% at NAV, outperforming the Index, which returned 2.63%. Primary contributors to performance relative to the Index included leverage; security selections in the transportation sector; and an overweight position in bonds rated BBB and below, including nonrated issues. Key detractors from performance versus the Index included an overweight position in prerefunded bonds, and security selections in the housing sector and A rated bonds.
See Endnotes and Additional Disclosures in this report.
Past performance is no guarantee of future results. Returns are historical and are calculated net of management fees and other expenses by determining the percentage change in net asset value (NAV) or market price (as applicable) with all distributions reinvested in accordance with the Fund’s Dividend Reinvestment Plan. Performance at market price will differ from performance at NAV due to variations in the Fund’s market price versus NAV, which may reflect factors such as fluctuations in supply and demand for Fund shares, changes in Fund distributions, shifting market expectations for the Fund’s future returns and distribution rates, and other considerations affecting the trading prices of closed-end funds. Investment return and principal value will fluctuate so that shares, when sold, may be worth more or less than their original cost. Performance for periods less than or equal to one year is cumulative. Performance is for the stated time period only; due to market volatility, current Fund performance may be lower or higher than the quoted return. For performance as of the most recent month-end, please refer to eatonvance.com.
Eaton Vance
Municipal Bond Fund
September 30, 2021
Performance2,3
Portfolio Manager Cynthia J. Clemson
| | | | | | | | | | | | | | | | |
| % Average Annual Total Returns | | Inception Date | | | One Year | | | Five Years | | | Ten Years | |
| | | | |
Fund at NAV | | | 08/30/2002 | | | | 3.75 | % | | | 3.92 | % | | | 6.53 | % |
Fund at Market Price | | | — | | | | 6.16 | | | | 4.32 | | | | 6.26 | |
|
| |
| | | | |
Bloomberg Municipal Bond Index | | | — | | | | 2.63 | % | | | 3.26 | % | | | 3.86 | % |
| | | | |
| % Premium/Discount to NAV4 | | | | | | | | | | | | |
| | | | |
| | | | | | | | | | | | | | | –4.09 | % |
| | | | |
| Distributions5 | | | | | | | | | | | | |
| | | | |
Total Distributions per share for the period | | | | | | | | | | | | | | $ | 0.595 | |
Distribution Rate at NAV | | | | | | | | | | | | | | | 4.27 | % |
Taxable-Equivalent Distribution Rate at NAV | | | | | | | | | | | | | | | 7.21 | |
Distribution Rate at Market Price | | | | | | | | | | | | | | | 4.45 | |
Taxable-Equivalent Distribution Rate at Market Price | | | | | | | | | | | | | | | 7.51 | |
| | | | |
| % Total Leverage6 | | | | | | | | | | | | |
| | | | |
Residual Interest Bond (RIB) Financing | | | | | | | | | | | | | | | 39.84 | % |
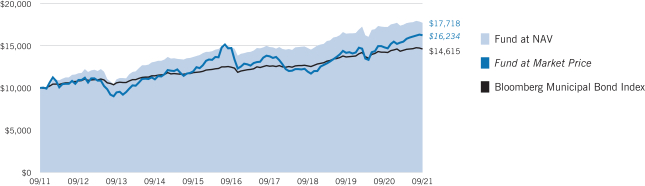
Growth of $10,000
This graph shows the change in value of a hypothetical investment of $10,000 in the Fund for the period indicated. For comparison, the same investment is shown in the indicated index.
See Endnotes and Additional Disclosures in this report.
Past performance is no guarantee of future results. Returns are historical and are calculated net of management fees and other expenses by determining the percentage change in net asset value (NAV) or market price (as applicable) with all distributions reinvested in accordance with the Fund’s Dividend Reinvestment Plan. Performance at market price will differ from performance at NAV due to variations in the Fund’s market price versus NAV, which may reflect factors such as fluctuations in supply and demand for Fund shares, changes in Fund distributions, shifting market expectations for the Fund’s future returns and distribution rates, and other considerations affecting the trading prices of closed-end funds. Investment return and principal value will fluctuate so that shares, when sold, may be worth more or less than their original cost. Performance for periods less than or equal to one year is cumulative. Performance is for the stated time period only; due to market volatility, current Fund performance may be lower or higher than the quoted return. For performance as of the most recent month-end, please refer to eatonvance.com.
Eaton Vance
Municipal Bond Fund
September 30, 2021
Fund Profile
Credit Quality (% of total investments)7,8
See Endnotes and Additional Disclosures in this report.
Past performance is no guarantee of future results. Returns are historical and are calculated net of management fees and other expenses by determining the percentage change in net asset value (NAV) or market price (as applicable) with all distributions reinvested in accordance with the Fund’s Dividend Reinvestment Plan. Performance at market price will differ from performance at NAV due to variations in the Fund’s market price versus NAV, which may reflect factors such as fluctuations in supply and demand for Fund shares, changes in Fund distributions, shifting market expectations for the Fund’s future returns and distribution rates, and other considerations affecting the trading prices of closed-end funds. Investment return and principal value will fluctuate so that shares, when sold, may be worth more or less than their original cost. Performance for periods less than or equal to one year is cumulative. Performance is for the stated time period only; due to market volatility, current Fund performance may be lower or higher than the quoted return. For performance as of the most recent month-end, please refer to eatonvance.com.
Eaton Vance
California Municipal Bond Fund
September 30, 2021
Performance2,3
Portfolio Managers Craig R. Brandon, CFA and Trevor G. Smith
| | | | | | | | | | | | | | | | |
| % Average Annual Total Returns | | Inception Date | | | One Year | | | Five Years | | | Ten Years | |
| | | | |
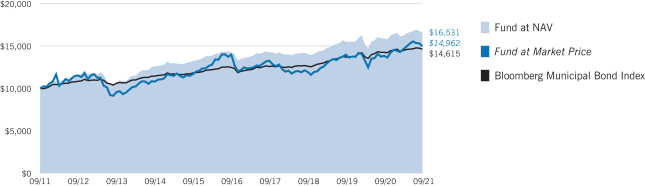
Fund at NAV | | | 08/30/2002 | | | | 2.78% | | | | 3.65 | % | | | 5.88 | % |
Fund at Market Price | | | — | | | | 9.67 | | | | 1.97 | | | | 4.96 | |
|
| |
| | | | |
Bloomberg Municipal Bond Index | | | — | | | | 2.63% | | | | 3.26 | % | | | 3.86 | % |
| | | | |
| % Premium/Discount to NAV4 | | | | | | | | | | | | |
| | | | |
| | | | | | | | | | | | | | | –4.25 | % |
| | | | |
| Distributions5 | | | | | | | | | | | | |
| | | | |
Total Distributions per share for the period | | | | | | | | | | | | | | $ | 0.503 | |
Distribution Rate at NAV | | | | | | | | | | | | | | | 4.03 | % |
Taxable-Equivalent Distribution Rate at NAV | | | | | | | | | | | | | | | 8.78 | |
Distribution Rate at Market Price | | | | | | | | | | | | | | | 4.21 | |
Taxable-Equivalent Distribution Rate at Market Price | | | | | | | | | | | | | | | 9.17 | |
| | | | |
| % Total Leverage6 | | | | | | | | | | | | |
| | | | |
RIB Financing | | | | | | | | | | | | | | | 40.06 | % |
Growth of $10,000
This graph shows the change in value of a hypothetical investment of $10,000 in the Fund for the period indicated. For comparison, the same investment is shown in the indicated index.
See Endnotes and Additional Disclosures in this report.
Past performance is no guarantee of future results. Returns are historical and are calculated net of management fees and other expenses by determining the percentage change in net asset value (NAV) or market price (as applicable) with all distributions reinvested in accordance with the Fund’s Dividend Reinvestment Plan. Performance at market price will differ from performance at NAV due to variations in the Fund’s market price versus NAV, which may reflect factors such as fluctuations in supply and demand for Fund shares, changes in Fund distributions, shifting market expectations for the Fund’s future returns and distribution rates, and other considerations affecting the trading prices of closed-end funds. Investment return and principal value will fluctuate so that shares, when sold, may be worth more or less than their original cost. Performance for periods less than or equal to one year is cumulative. Performance is for the stated time period only; due to market volatility, current Fund performance may be lower or higher than the quoted return. For performance as of the most recent month-end, please refer to eatonvance.com.
Eaton Vance
California Municipal Bond Fund
September 30, 2021
Fund Profile
Credit Quality (% of total investments)7,8
See Endnotes and Additional Disclosures in this report.
Past performance is no guarantee of future results. Returns are historical and are calculated net of management fees and other expenses by determining the percentage change in net asset value (NAV) or market price (as applicable) with all distributions reinvested in accordance with the Fund’s Dividend Reinvestment Plan. Performance at market price will differ from performance at NAV due to variations in the Fund’s market price versus NAV, which may reflect factors such as fluctuations in supply and demand for Fund shares, changes in Fund distributions, shifting market expectations for the Fund’s future returns and distribution rates, and other considerations affecting the trading prices of closed-end funds. Investment return and principal value will fluctuate so that shares, when sold, may be worth more or less than their original cost. Performance for periods less than or equal to one year is cumulative. Performance is for the stated time period only; due to market volatility, current Fund performance may be lower or higher than the quoted return. For performance as of the most recent month-end, please refer to eatonvance.com.
Eaton Vance
New York Municipal Bond Fund
September 30, 2021
Performance2,3
Portfolio Managers Craig R. Brandon, CFA and Christopher J. Eustance, CFA
| | | | | | | | | | | | | | | | |
| % Average Annual Total Returns | | Inception Date | | | One Year | | | Five Years | | | Ten Years | |
| | | | |
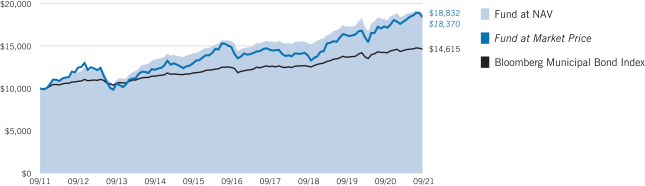
Fund at NAV | | | 08/30/2002 | | | | 4.34 | % | | | 3.01 | % | | | 5.15 | % |
Fund at Market Price | | | — | | | | 8.30 | | | | 1.36 | | | | 4.11 | |
|
| |
| | | | |
Bloomberg Municipal Bond Index | | | — | | | | 2.63 | % | | | 3.26 | % | | | 3.86 | % |
| | | | |
| % Premium/Discount to NAV4 | | | | | | | | | | | | |
| | | | |
| | | | | | | | | | | | | | | –7.57 | % |
| | | | |
| Distributions5 | | | | | | | | | | | | |
| | | | |
Total Distributions per share for the period | | | | | | | | | | | | | | $ | 0.509 | |
Distribution Rate at NAV | | | | | | | | | | | | | | | 3.42 | % |
Taxable-Equivalent Distribution Rate at NAV | | | | | | | | | | | | | | | 6.78 | |
Distribution Rate at Market Price | | | | | | | | | | | | | | | 3.70 | |
Taxable-Equivalent Distribution Rate at Market Price | | | | | | | | | | | | | | | 7.34 | |
| | | | |
| % Total Leverage6 | | | | | | | | | | | | |
| | | | |
RIB Financing | | | | | | | | | | | | | | | 34.30 | % |
Growth of $10,000
This graph shows the change in value of a hypothetical investment of $10,000 in the Fund for the period indicated. For comparison, the same investment is shown in the indicated index.
See Endnotes and Additional Disclosures in this report.
Past performance is no guarantee of future results. Returns are historical and are calculated net of management fees and other expenses by determining the percentage change in net asset value (NAV) or market price (as applicable) with all distributions reinvested in accordance with the Fund’s Dividend Reinvestment Plan. Performance at market price will differ from performance at NAV due to variations in the Fund’s market price versus NAV, which may reflect factors such as fluctuations in supply and demand for Fund shares, changes in Fund distributions, shifting market expectations for the Fund’s future returns and distribution rates, and other considerations affecting the trading prices of closed-end funds. Investment return and principal value will fluctuate so that shares, when sold, may be worth more or less than their original cost. Performance for periods less than or equal to one year is cumulative. Performance is for the stated time period only; due to market volatility, current Fund performance may be lower or higher than the quoted return. For performance as of the most recent month-end, please refer to eatonvance.com.
Eaton Vance
New York Municipal Bond Fund
September 30, 2021
Fund Profile
Credit Quality (% of total investments)7,8
See Endnotes and Additional Disclosures in this report.
Past performance is no guarantee of future results. Returns are historical and are calculated net of management fees and other expenses by determining the percentage change in net asset value (NAV) or market price (as applicable) with all distributions reinvested in accordance with the Fund’s Dividend Reinvestment Plan. Performance at market price will differ from performance at NAV due to variations in the Fund’s market price versus NAV, which may reflect factors such as fluctuations in supply and demand for Fund shares, changes in Fund distributions, shifting market expectations for the Fund’s future returns and distribution rates, and other considerations affecting the trading prices of closed-end funds. Investment return and principal value will fluctuate so that shares, when sold, may be worth more or less than their original cost. Performance for periods less than or equal to one year is cumulative. Performance is for the stated time period only; due to market volatility, current Fund performance may be lower or higher than the quoted return. For performance as of the most recent month-end, please refer to eatonvance.com.
Eaton Vance
Municipal Bond Funds
September 30, 2021
The Fund’s Investment Objectives, Principal Strategies and Principal Risks9
Eaton Vance Municipal Bond Fund
Investment Objective and Principal Strategies
The Fund’s investment objective is to provide current income exempt from federal income tax.
During normal market conditions, at least 80% of the Fund’s net assets will be invested in municipal obligations, the interest on which is exempt from federal income tax, including the alternative minimum tax (“AMT”) and that are rated A or better by Moody’s Investors Service, Inc. (“Moody’s”), S&P Global Ratings (“S&P”) or Fitch Ratings (“Fitch”). The foregoing 80% policy may not be changed without shareholder approval. Under normal market conditions, the Fund expects to be fully invested (at least 95% of its net assets) in accordance with its investment objective. The Fund may invest up to 20% of its net assets in municipal obligations rated BBB/Baa or below (or unrated obligations deemed by the Fund’s adviser, Eaton Vance Management (“Eaton Vance”), to be of equivalent quality), provided that not more than 15% of its net assets may be invested in municipal obligations rated below B (or unrated obligations deemed by Eaton Vance to be of equivalent quality) and may invest up to 20% of its net assets in bonds on which the interest is subject to the AMT. When a municipal obligation is split rated (meaning rated in different categories by Moody’s, S&P or Fitch) the Fund will deem the higher rating to apply.
The Fund may purchase derivative instruments, which derive their value from another instrument, security or index, including financial futures contracts and related options, interest rate swaps and forward rate contracts. The Fund also may invest in residual interests of a trust (the “trust”) that holds municipal securities (“RIBs”). The trust will also issue floating-rate notes to third parties that may be senior to a Fund’s residual interest. The Fund may purchase and sell financial futures contracts and related options, including futures contracts and related options based on various debt securities and securities indices, as well as interest rate swaps and forward rate contracts, to seek to hedge against changes in interest rates or for other risk management purposes.
Except for certain fundamental investment restrictions set forth in the Fund’s registration statement and the 80% requirement pertaining to investment in municipal and insured municipal obligations set forth above, the investment objective and policies of the Fund may be changed by the Board without shareholder action.
The Fund employs leverage to seek opportunities for additional income. Leverage may amplify the effect on the Fund’s NAV of any increase or decrease in the value of investments held. The Fund generally will not use leverage if the investment adviser anticipates that it would result in a lower return to shareholders for any significant amount of time. There can be no assurance that the use of leverage will be successful.
Principal Risks
Market Discount Risk. As with any security, the market value of the common shares may increase or decrease from the amount initially paid for the common shares. The Fund’s common shares have traded both at a premium and at a discount relative to NAV. The shares of closed-end management investment companies frequently trade at a discount from their NAV. This is a risk separate and distinct from the risk that the Fund’s NAV may decrease.
Market Risk. The value of investments held by the Fund may increase or decrease in response to economic, political, financial, public health crises
(such as epidemics or pandemics) or other disruptive events (whether real, expected or perceived) in the U.S. and global markets. These events may negatively impact broad segments of businesses and populations and may exacerbate pre-existing risks to the Fund. The frequency and magnitude of resulting changes in the value of the Fund’s investments cannot be predicted. Certain securities and other investments held by the Fund may experience increased volatility, illiquidity, or other potentially adverse effects in reaction to changing market conditions. Monetary and/or fiscal actions taken by U.S. or foreign governments to stimulate or stabilize the global economy may not be effective and could lead to high market volatility. No active trading market may exist for certain investments held by the Fund, which may impair the ability of the Fund to sell or to realize the current valuation of such investments in the event of the need to liquidate such assets.
Interest Rate Risk. In general, the value of debt instruments will fluctuate based on changes in interest rates. The value of these securities is likely to increase when interest rates fall and decline when interest rates rise. Duration measures the time-weighted expected cash flows of a fixed-income security, while maturity refers to the amount of time until a fixed-income security matures. Generally, securities with longer durations or maturities are more sensitive to changes in interest rates than securities with shorter durations or maturities, causing them to be more volatile. Conversely, fixed-income securities with shorter durations or maturities will be less volatile but may provide lower returns than fixed-income securities with longer durations or maturities. Because the Fund is managed toward an income objective, it may hold more longer duration or maturity obligations and thereby be more exposed to interest rate risk than municipal income funds that are managed with a greater emphasis on total return. The impact of interest rate changes is significantly less for floating-rate instruments that have relatively short periodic rate resets (e.g., ninety days or less). In a rising interest rate environment, the durations or maturities of income securities that have the ability to be prepaid or called by the issuer may be extended. In a declining interest rate environment, the proceeds from prepaid or maturing instruments may have to be reinvested at a lower interest rate. Certain instruments held by the Fund may pay an interest rate based on the London Interbank Offered Rate (“LIBOR”), which is the average offered rate for various maturities of short-term loans between certain major international banks. LIBOR is used throughout global banking and financial industries to determine interest rates for a variety of financial instruments (such as debt instruments and derivatives) and borrowing arrangements. The ICE Benchmark Administration Limited, the administrator of LIBOR, is expected to cease publishing certain LIBOR settings on December 31, 2021, and the remaining LIBOR settings on June 30, 2023. Although the transition process away from LIBOR is expected to be defined in advance of the anticipated discontinuation, there remains uncertainty regarding the future utilization of LIBOR and the nature of any replacement rate or rates. The phase-out of LIBOR may result in, among other things, increased volatility or illiquidity in markets for instruments based on LIBOR and changes in the value of such instruments.
Credit Risk. Investments in municipal obligations and other debt obligations (referred to below as “debt instruments”) are subject to the risk of non-payment of scheduled principal and interest. Changes in economic conditions or other circumstances may reduce the capacity of the party obligated to make principal and interest payments on such instruments and may lead to defaults. Such non-payments and defaults may reduce the value of Fund shares and income distributions. The value of debt instruments also may decline because of concerns about the issuer’s ability
See Endnotes and Additional Disclosures in this report.
Eaton Vance
Municipal Bond Funds
September 30, 2021
The Fund’s Investment Objectives, Principal Strategies and Principal Risks9 — continued
to make principal and interest payments. In addition, the credit ratings of debt instruments may be lowered if the financial condition of the party obligated to make payments with respect to such instruments deteriorates. In order to enforce its rights in the event of a default, bankruptcy or similar situation, the Fund may be required to retain legal or similar counsel, which may increase the Fund’s operating expenses and adversely affect net asset value. Municipal obligations may be insured as to principal and interest payments. If the claims-paying ability or other rating of the insurer is downgraded by a rating agency, the value of such obligations may be negatively affected.
Municipal Obligations Risk. The amount of public information available about municipal obligations is generally less than for corporate equities or bonds, meaning that the investment performance of municipal obligations may be more dependent on the analytical abilities of the investment adviser than stock or corporate bond investments. The secondary market for municipal obligations also tends to be less well-developed and less liquid than many other securities markets, which may limit the Fund’s ability to sell its municipal obligations at attractive prices. The differences between the price at which an obligation can be purchased and the price at which it can be sold may widen during periods of market distress. Less liquid obligations can become more difficult to value and be subject to erratic price movements. The increased presence of nontraditional participants (such as proprietary trading desks of investment banks and hedge funds) or the absence of traditional participants (such as individuals, insurance companies, banks and life insurance companies) in the municipal markets may lead to greater volatility in the markets because non-traditional participants may trade more frequently or in greater volume.
Lower Rated Investments Risk. Investments rated below investment grade and comparable unrated investments (sometimes referred to as “junk”) have speculative characteristics because of the credit risk associated with their issuers. Changes in economic conditions or other circumstances typically have a greater effect on the ability of issuers of lower rated investments to make principal and interest payments than they do on issuers of higher rated investments. An economic downturn generally leads to a higher non-payment rate, and a lower rated investment may lose significant value before a default occurs. Lower rated investments typically are subject to greater price volatility and illiquidity than higher rated investments.
Leverage Risk. Certain Fund transactions may give rise to leverage. Leverage can result from a non-cash exposure to an asset, index, rate or instrument. Leverage can also result from borrowings, issuance of preferred shares or participation in residual interest bond transactions. Leverage can increase both the risk and return potential of the Fund. The Fund is required to segregate liquid assets or otherwise cover the Fund’s obligation created by a transaction that may give rise to leverage. The use of leverage may cause the Fund to liquidate portfolio positions when it may not be advantageous to do so to satisfy its obligations or to meet segregation requirements. Leverage may cause the Fund’s NAV to be more volatile than if it had not been leveraged, as certain types of leverage may exaggerate the effect of any increase or decrease in the Fund’s portfolio securities. The loss on leveraged investments may substantially exceed the initial investment. The Fund intends to use leverage to provide the holders of common shares with a potentially higher return. To the extent the income derived from securities purchased with funds received from leverage exceeds the cost of leverage, the Fund’s return will be greater than if leverage had not been used. Conversely, if the income from the securities purchased with such funds is not sufficient to cover the cost of leverage, the return to the Fund
will be less than if leverage had not been used, and therefore the amount available for distribution to common shareholders as dividends and other distributions will be reduced. In the latter case, the investment adviser in its best judgment may nevertheless determine to maintain the Fund’s leveraged position if it deems such action to be appropriate. The use of leverage through issuance of preferred shares by the Fund creates an opportunity for increased net income, but, at the same time, creates special risks. There can be no assurance that a leveraging strategy will be successful during any period in which it is employed.
Risk of Residual Interest Bonds. The Fund may enter into residual interest bond transactions, which expose the Fund to leverage and greater risk than an investment in a fixed-rate municipal bond. The interest payments that the Fund receives on the residual interest bonds acquired in such transactions vary inversely with short-term interest rates, normally decreasing when short-term rates increase. The value and market for residual interest bonds are volatile and such bonds may have limited liquidity. As required by applicable accounting standards, the Fund records interest expense on its liability with respect to floating-rate notes and also records offsetting interest income in an amount equal to this expense.
Restricted Securities Risk. Unless registered for sale to the public under applicable federal securities law, restricted securities can be sold only in private transactions to qualified purchasers pursuant to an exemption from registration. The sale price realized from a private transaction could be less than the Fund’s purchase price for the restricted security. It may be difficult to identify a qualified purchaser for a restricted security held by the Fund and such security could be deemed illiquid. It may also be more difficult to value such securities.
Derivatives Risk. The Fund’s exposure to derivatives involves risks different from, or possibly greater than, the risks associated with investing directly in securities and other investments. The use of derivatives can lead to losses because of adverse movements in the price or value of the security, instrument, index, currency, commodity, economic indicator or event underlying a derivative (“reference instrument”), due to failure of a counterparty or due to tax or regulatory constraints. Derivatives may create leverage in the Fund, which represents a non-cash exposure to the underlying reference instrument. Leverage can increase both the risk and return potential of the Fund. Derivatives risk may be more significant when derivatives are used to enhance return or as a substitute for a cash investment position, rather than solely to hedge the risk of a position held by the Fund. Use of derivatives involves the exercise of specialized skill and judgment, and a transaction may be unsuccessful in whole or in part because of market behavior or unexpected events. Changes in the value of a derivative (including one used for hedging) may not correlate perfectly with the underlying reference instrument. Derivative instruments traded in over-the-counter markets may be difficult to value, may be illiquid, and may be subject to wide swings in valuation caused by changes in the value of the underlying reference instrument. If a derivative’s counterparty is unable to honor its commitments, the value of Fund shares may decline and the Fund could experience delays in the return of collateral or other assets held by the counterparty. The loss on derivative transactions may substantially exceed the initial investment, particularly when there is no stated limit on the Fund’s use of derivatives. A derivative investment also involves the risks relating to the reference instrument underlying the investment.
Liquidity Risk. The Fund is exposed to liquidity risk when trading volume, lack of a market maker or trading partner, large position size, market
See Endnotes and Additional Disclosures in this report.
Eaton Vance
Municipal Bond Funds
September 30, 2021
The Fund’s Investment Objectives, Principal Strategies and Principal Risks9 — continued
conditions, or legal restrictions impair its ability to sell particular investments or to sell them at advantageous market prices. Consequently, the Fund may have to accept a lower price to sell an investment or continue to hold it or keep the position open, sell other investments to raise cash or abandon an investment opportunity, any of which could have a negative effect on the Fund’s performance. These effects may be exacerbated during times of financial or political stress.
Sector and Geographic Risk. Because the Fund may invest a significant portion of its assets in obligations issued in a particular state and/or U.S. territories and in certain types of municipal or other obligations and/or in certain sectors, the value of Fund shares may be affected by events that adversely affect that state, U.S. territory, sector or type of obligation and may fluctuate more than that of a fund that invests more broadly. General obligation bonds issued by municipalities are adversely affected by economic downturns and any resulting decline in tax revenues. Please refer to the Fund’s Statement of Additional Information for state-specific economic information as well as information about Puerto Rico, the U.S. Virgin Islands, Guam and American Samoa.
Issuer Diversification Risk. The Fund is “non-diversified,” which means it may invest a greater percentage of its assets in the securities of a single issuer than a fund that is “diversified.” Non-diversified funds may focus their investments in a small number of issuers, making them more susceptible to risks affecting such issuers than a more diversified fund might be.
Recent Market Conditions. An outbreak of respiratory disease caused by a novel coronavirus was first detected in China in late 2019 and subsequently spread internationally. This coronavirus has resulted in closing borders, enhanced health screenings, changes to healthcare service preparation and delivery, quarantines, cancellations, disruptions to supply chains and customer activity, as well as general concern and uncertainty. The impact of this coronavirus has resulted in a substantial economic downturn. Health crises caused by outbreaks of disease, such as the coronavirus outbreak, may exacerbate other pre-existing political, social and economic risks and disrupt normal market conditions and operations. The impact of this outbreak has negatively affected the worldwide economy, as well as the economies of individual countries and industries, and could continue to affect the market in significant and unforeseen ways. Other epidemics and pandemics that may arise in the future may have similar effects. For example, a global pandemic or other widespread health crisis could cause substantial market volatility and exchange trading suspensions and closures. In addition, the increasing interconnectedness of markets around the world may result in many markets being affected by events or conditions in a single country or region or events affecting a single or small number of issuers. The coronavirus outbreak and public and private sector responses thereto have led to large portions of the populations of many countries working from home for indefinite periods of time, temporary or permanent layoffs, disruptions in supply chains, and lack of availability of certain goods. The impact of such responses could adversely affect the information technology and operational systems upon which the Fund and the Fund’s service providers rely, and could otherwise disrupt the ability of the employees of the Fund’s service providers to perform critical tasks relating to the Fund. Any such impact could adversely affect the Fund’s performance, or the performance of the securities in which the Fund invests and may lead to losses on your investment in the Fund.
Risks Associated with Active Management. The success of the Fund’s investment strategy depends on portfolio management’s successful
application of analytical skills and investment judgment. Active management involves subjective decisions.
Tax Risk. Income from tax-exempt municipal obligations could be declared taxable because of changes in tax laws, adverse interpretations by the relevant taxing authority or the non-compliant conduct of the issuer of an obligation.
Tax-Sensitive Investing Risk. The Fund may hold a security in order to achieve more favorable tax-treatment or to sell a security in order to create tax losses. The Fund’s utilization of various tax-management techniques may be curtailed or eliminated by tax legislation, regulation or interpretations. The Fund may not be able to minimize taxable distributions to shareholders and a portion of the Fund’s distributions may be taxable.
Cybersecurity Risk. With the increased use of technologies by Fund service providers to conduct business, such as the Internet, the Fund is susceptible to operational, information security and related risks. In general, cyber incidents can result from deliberate attacks or unintentional events. Cybersecurity failures by or breaches of the Fund’s investment adviser or administrator and other service providers (including, but not limited to, the custodian or transfer agent), and the issuers of securities in which the Fund invests, have the ability to cause disruptions and impact business operations potentially resulting in financial losses, interference with the Fund’s ability to calculate its net asset value, impediments to trading, the inability of Fund shareholders to transact business, violations of applicable privacy and other laws, regulatory fines, penalties, reputational damage, reimbursement or other compensation costs, or additional compliance costs.
General Fund Investing Risks. The Fund is not a complete investment program and there is no guarantee that the Fund will achieve its investment objective. It is possible to lose money by investing in the Fund. An investment in the Fund is not a deposit in a bank and is not insured or guaranteed by the Federal Deposit Insurance Corporation or any other government agency.
See Endnotes and Additional Disclosures in this report.
Eaton Vance
Municipal Bond Funds
September 30, 2021
The Fund’s Investment Objectives, Principal Strategies and Principal Risks9 — continued
Eaton Vance California Municipal Bond Fund
Investment Objective and Principal Strategies
The Fund’s investment objective is to provide current income exempt from federal income tax and California State personal income taxes.
During normal market conditions, at least 80% of the Fund’s net assets will be invested in municipal obligations, the interest on which is exempt from federal income tax, including the alternative minimum tax (“AMT”), and California State personal income taxes and that are rated A or better by Moody’s Investors Service, Inc. (“Moody’s”), S&P Global Ratings (“S&P”) or Fitch Ratings (“Fitch”). The foregoing 80% policy may not be changed without shareholder approval. Under normal market conditions, the Fund expects to be fully invested (at least 95% of its net assets) in accordance with its investment objective. The Fund may invest up to 20% of its net assets in municipal obligations rated BBB/Baa or below (or unrated obligations deemed by the Fund’s adviser, Eaton Vance Management (“Eaton Vance”), to be of equivalent quality), provided that not more than 15% of its net assets may be invested in municipal obligations rated below B (or unrated obligations deemed by Eaton Vance to be of equivalent quality) and may invest up to 20% of its net assets in bonds on which the interest is subject to the AMT. When a municipal obligation is split rated (meaning rated in different categories by Moody’s, S&P or Fitch) the Fund will deem the higher rating to apply.
The Fund may purchase derivative instruments, which derive their value from another instrument, security or index, including financial futures contracts and related options, interest rate swaps and forward rate contracts. The Fund also may invest in residual interests of a trust (the “trust”) that holds municipal securities (“RIBs”). The trust will also issue floating-rate notes to third parties that may be senior to a Fund’s residual interest. The Fund may purchase and sell financial futures contracts and related options, including futures contracts and related options based on various debt securities and securities indices, as well as interest rate swaps and forward rate contracts, to seek to hedge against changes in interest rates or for other risk management purposes.
Except for certain fundamental investment restrictions set forth in the Fund’s registration statement and the 80% requirement pertaining to investment in municipal and insured municipal obligations set forth above, the investment objective and policies of the Fund may be changed by the Board without shareholder action.
The Fund employs leverage to seek opportunities for additional income. Leverage may amplify the effect on the Fund’s NAV of any increase or decrease in the value of investments held. The Fund generally will not use leverage if the investment adviser anticipates that it would result in a lower return to shareholders for any significant amount of time. There can be no assurance that the use of leverage will be successful.
Principal Risks
Market Discount Risk. As with any security, the market value of the common shares may increase or decrease from the amount initially paid for the common shares. The Fund’s common shares have traded both at a premium and at a discount relative to NAV. The shares of closed-end management investment companies frequently trade at a discount from their NAV. This is a risk separate and distinct from the risk that the Fund’s NAV may decrease.
Market Risk. The value of investments held by the Fund may increase or decrease in response to economic, political, financial, public health crises (such as epidemics or pandemics) or other disruptive events (whether real, expected or perceived) in the U.S. and global markets. These events may negatively impact broad segments of businesses and populations and may exacerbate pre-existing risks to the Fund. The frequency and magnitude of resulting changes in the value of the Fund’s investments cannot be predicted. Certain securities and other investments held by the Fund may experience increased volatility, illiquidity, or other potentially adverse effects in reaction to changing market conditions. Monetary and/or fiscal actions taken by U.S. or foreign governments to stimulate or stabilize the global economy may not be effective and could lead to high market volatility. No active trading market may exist for certain investments held by the Fund, which may impair the ability of the Fund to sell or to realize the current valuation of such investments in the event of the need to liquidate such assets.
Interest Rate Risk. In general, the value of debt instruments will fluctuate based on changes in interest rates. The value of these securities is likely to increase when interest rates fall and decline when interest rates rise. Duration measures the time-weighted expected cash flows of a fixed-income security, while maturity refers to the amount of time until a fixed-income security matures. Generally, securities with longer durations or maturities are more sensitive to changes in interest rates than securities with shorter durations or maturities, causing them to be more volatile. Conversely, fixed-income securities with shorter durations or maturities will be less volatile but may provide lower returns than fixed-income securities with longer durations or maturities. Because the Fund is managed toward an income objective, it may hold more longer duration or maturity obligations and thereby be more exposed to interest rate risk than municipal income funds that are managed with a greater emphasis on total return. The impact of interest rate changes is significantly less for floating-rate instruments that have relatively short periodic rate resets (e.g., ninety days or less). In a rising interest rate environment, the durations or maturities of income securities that have the ability to be prepaid or called by the issuer may be extended. In a declining interest rate environment, the proceeds from prepaid or maturing instruments may have to be reinvested at a lower interest rate. Certain instruments held by the Fund may pay an interest rate based on the London Interbank Offered Rate (“LIBOR”), which is the average offered rate for various maturities of short-term loans between certain major international banks. LIBOR is used throughout global banking and financial industries to determine interest rates for a variety of financial instruments (such as debt instruments and derivatives) and borrowing arrangements. The ICE Benchmark Administration Limited, the administrator of LIBOR, is expected to cease publishing certain LIBOR settings on December 31, 2021, and the remaining LIBOR settings on June 30, 2023. Although the transition process away from LIBOR is expected to be defined in advance of the anticipated discontinuation, there remains uncertainty regarding the future utilization of LIBOR and the nature of any replacement rate or rates. The phase-out of LIBOR may result in, among other things, increased volatility or illiquidity in markets for instruments based on LIBOR and changes in the value of such instruments.
Credit Risk. Investments in municipal obligations and other debt obligations (referred to below as “debt instruments”) are subject to the risk of non-payment of scheduled principal and interest. Changes in economic conditions or other circumstances may reduce the capacity of the party obligated to make principal and interest payments on such instruments and may lead to defaults. Such non-payments and defaults may reduce the
See Endnotes and Additional Disclosures in this report.
Eaton Vance
Municipal Bond Funds
September 30, 2021
The Fund’s Investment Objectives, Principal Strategies and Principal Risks9 — continued
value of Fund shares and income distributions. The value of debt instruments also may decline because of concerns about the issuer’s ability to make principal and interest payments. In addition, the credit ratings of debt instruments may be lowered if the financial condition of the party obligated to make payments with respect to such instruments deteriorates. In order to enforce its rights in the event of a default, bankruptcy or similar situation, the Fund may be required to retain legal or similar counsel, which may increase the Fund’s operating expenses and adversely affect net asset value. Municipal obligations may be insured as to principal and interest payments. If the claims-paying ability or other rating of the insurer is downgraded by a rating agency, the value of such obligations may be negatively affected.
Municipal Obligations Risk. The amount of public information available about municipal obligations is generally less than for corporate equities or bonds, meaning that the investment performance of municipal obligations may be more dependent on the analytical abilities of the investment adviser than stock or corporate bond investments. The secondary market for municipal obligations also tends to be less well-developed and less liquid than many other securities markets, which may limit the Fund’s ability to sell its municipal obligations at attractive prices. The differences between the price at which an obligation can be purchased and the price at which it can be sold may widen during periods of market distress. Less liquid obligations can become more difficult to value and be subject to erratic price movements. The increased presence of nontraditional participants (such as proprietary trading desks of investment banks and hedge funds) or the absence of traditional participants (such as individuals, insurance companies, banks and life insurance companies) in the municipal markets may lead to greater volatility in the markets because non-traditional participants may trade more frequently or in greater volume.
Lower Rated Investments Risk. Investments rated below investment grade and comparable unrated investments (sometimes referred to as “junk”) have speculative characteristics because of the credit risk associated with their issuers. Changes in economic conditions or other circumstances typically have a greater effect on the ability of issuers of lower rated investments to make principal and interest payments than they do on issuers of higher rated investments. An economic downturn generally leads to a higher non-payment rate, and a lower rated investment may lose significant value before a default occurs. Lower rated investments typically are subject to greater price volatility and illiquidity than higher rated investments.
Leverage Risk. Certain Fund transactions may give rise to leverage. Leverage can result from a non-cash exposure to an asset, index, rate or instrument. Leverage can also result from borrowings, issuance of preferred shares or participation in residual interest bond transactions. Leverage can increase both the risk and return potential of the Fund. The Fund is required to segregate liquid assets or otherwise cover the Fund’s obligation created by a transaction that may give rise to leverage. The use of leverage may cause the Fund to liquidate portfolio positions when it may not be advantageous to do so to satisfy its obligations or to meet segregation requirements. Leverage may cause the Fund’s NAV to be more volatile than if it had not been leveraged, as certain types of leverage may exaggerate the effect of any increase or decrease in the Fund’s portfolio securities. The loss on leveraged investments may substantially exceed the initial investment. The Fund intends to use leverage to provide the holders of common shares with a potentially higher return. To the extent the income derived from securities purchased with funds received from leverage exceeds the cost of
leverage, the Fund’s return will be greater than if leverage had not been used. Conversely, if the income from the securities purchased with such funds is not sufficient to cover the cost of leverage, the return to the Fund will be less than if leverage had not been used, and therefore the amount available for distribution to common shareholders as dividends and other distributions will be reduced. In the latter case, the investment adviser in its best judgment may nevertheless determine to maintain the Fund’s leveraged position if it deems such action to be appropriate. The use of leverage through issuance of preferred shares by the Fund creates an opportunity for increased net income, but, at the same time, creates special risks. There can be no assurance that a leveraging strategy will be successful during any period in which it is employed.
Risk of Residual Interest Bonds. The Fund may enter into residual interest bond transactions, which expose the Fund to leverage and greater risk than an investment in a fixed-rate municipal bond. The interest payments that the Fund receives on the residual interest bonds acquired in such transactions vary inversely with short-term interest rates, normally decreasing when short-term rates increase. The value and market for residual interest bonds are volatile and such bonds may have limited liquidity. As required by applicable accounting standards, the Fund records interest expense on its liability with respect to floating-rate notes and also records offsetting interest income in an amount equal to this expense.
Restricted Securities Risk. Unless registered for sale to the public under applicable federal securities law, restricted securities can be sold only in private transactions to qualified purchasers pursuant to an exemption from registration. The sale price realized from a private transaction could be less than the Fund’s purchase price for the restricted security. It may be difficult to identify a qualified purchaser for a restricted security held by the Fund and such security could be deemed illiquid. It may also be more difficult to value such securities.
Derivatives Risk. The Fund’s exposure to derivatives involves risks different from, or possibly greater than, the risks associated with investing directly in securities and other investments. The use of derivatives can lead to losses because of adverse movements in the price or value of the security, instrument, index, currency, commodity, economic indicator or event underlying a derivative (“reference instrument”), due to failure of a counterparty or due to tax or regulatory constraints. Derivatives may create leverage in the Fund, which represents a non-cash exposure to the underlying reference instrument. Leverage can increase both the risk and return potential of the Fund. Derivatives risk may be more significant when derivatives are used to enhance return or as a substitute for a cash investment position, rather than solely to hedge the risk of a position held by the Fund. Use of derivatives involves the exercise of specialized skill and judgment, and a transaction may be unsuccessful in whole or in part because of market behavior or unexpected events. Changes in the value of a derivative (including one used for hedging) may not correlate perfectly with the underlying reference instrument. Derivative instruments traded in over-the-counter markets may be difficult to value, may be illiquid, and may be subject to wide swings in valuation caused by changes in the value of the underlying reference instrument. If a derivative’s counterparty is unable to honor its commitments, the value of Fund shares may decline and the Fund could experience delays in the return of collateral or other assets held by the counterparty. The loss on derivative transactions may substantially exceed the initial investment, particularly when there is no stated limit on the Fund’s use of derivatives. A derivative investment also involves the risks relating to the reference instrument underlying the investment.
See Endnotes and Additional Disclosures in this report.
Eaton Vance
Municipal Bond Funds
September 30, 2021
The Fund’s Investment Objectives, Principal Strategies and Principal Risks9 — continued
Liquidity Risk. The Fund is exposed to liquidity risk when trading volume, lack of a market maker or trading partner, large position size, market conditions, or legal restrictions impair its ability to sell particular investments or to sell them at advantageous market prices. Consequently, the Fund may have to accept a lower price to sell an investment or continue to hold it or keep the position open, sell other investments to raise cash or abandon an investment opportunity, any of which could have a negative effect on the Fund’s performance. These effects may be exacerbated during times of financial or political stress.
Sector and Geographic Risk. Because the Fund may invest a significant portion of its assets in obligations issued in a particular state and/or U.S. territories and in certain types of municipal or other obligations and/or in certain sectors, the value of Fund shares may be affected by events that adversely affect that state, U.S. territory, sector or type of obligation and may fluctuate more than that of a fund that invests more broadly. General obligation bonds issued by municipalities are adversely affected by economic downturns and any resulting decline in tax revenues. Please refer to the Fund’s Statement of Additional Information for state-specific economic information as well as information about Puerto Rico, the U.S. Virgin Islands, Guam and American Samoa.
Issuer Diversification Risk. The Fund is “non-diversified,” which means it may invest a greater percentage of its assets in the securities of a single issuer than a fund that is “diversified.” Non-diversified funds may focus their investments in a small number of issuers, making them more susceptible to risks affecting such issuers than a more diversified fund might be.
Recent Market Conditions. An outbreak of respiratory disease caused by a novel coronavirus was first detected in China in late 2019 and subsequently spread internationally. This coronavirus has resulted in closing borders, enhanced health screenings, changes to healthcare service preparation and delivery, quarantines, cancellations, disruptions to supply chains and customer activity, as well as general concern and uncertainty. The impact of this coronavirus has resulted in a substantial economic downturn. Health crises caused by outbreaks of disease, such as the coronavirus outbreak, may exacerbate other pre-existing political, social and economic risks and disrupt normal market conditions and operations. The impact of this outbreak has negatively affected the worldwide economy, as well as the economies of individual countries and industries, and could continue to affect the market in significant and unforeseen ways. Other epidemics and pandemics that may arise in the future may have similar effects. For example, a global pandemic or other widespread health crisis could cause substantial market volatility and exchange trading suspensions and closures. In addition, the increasing interconnectedness of markets around the world may result in many markets being affected by events or conditions in a single country or region or events affecting a single or small number of issuers. The coronavirus outbreak and public and private sector responses thereto have led to large portions of the populations of many countries working from home for indefinite periods of time, temporary or permanent layoffs, disruptions in supply chains, and lack of availability of certain goods. The impact of such responses could adversely affect the information technology and operational systems upon which the Fund and the Fund’s service providers rely, and could otherwise disrupt the ability of the employees of the Fund’s service providers to perform critical tasks relating to the Fund. Any such impact could adversely affect the Fund’s performance, or the performance of the securities in which the Fund invests and may lead to losses on your investment in the Fund.
Risks Associated with Active Management. The success of the Fund’s investment strategy depends on portfolio management’s successful application of analytical skills and investment judgment. Active management involves subjective decisions.
Tax Risk. Income from tax-exempt municipal obligations could be declared taxable because of changes in tax laws, adverse interpretations by the relevant taxing authority or the non-compliant conduct of the issuer of an obligation.
Tax-Sensitive Investing Risk. The Fund may hold a security in order to achieve more favorable tax-treatment or to sell a security in order to create tax losses. The Fund’s utilization of various tax-management techniques may be curtailed or eliminated by tax legislation, regulation or interpretations. The Fund may not be able to minimize taxable distributions to shareholders and a portion of the Fund’s distributions may be taxable.
Cybersecurity Risk. With the increased use of technologies by Fund service providers to conduct business, such as the Internet, the Fund is susceptible to operational, information security and related risks. In general, cyber incidents can result from deliberate attacks or unintentional events. Cybersecurity failures by or breaches of the Fund’s investment adviser or administrator and other service providers (including, but not limited to, the custodian or transfer agent), and the issuers of securities in which the Fund invests, have the ability to cause disruptions and impact business operations potentially resulting in financial losses, interference with the Fund’s ability to calculate its net asset value, impediments to trading, the inability of Fund shareholders to transact business, violations of applicable privacy and other laws, regulatory fines, penalties, reputational damage, reimbursement or other compensation costs, or additional compliance costs.
General Fund Investing Risks. The Fund is not a complete investment program and there is no guarantee that the Fund will achieve its investment objective. It is possible to lose money by investing in the Fund. An investment in the Fund is not a deposit in a bank and is not insured or guaranteed by the Federal Deposit Insurance Corporation or any other government agency.
See Endnotes and Additional Disclosures in this report.
Eaton Vance
Municipal Bond Funds
September 30, 2021
The Fund’s Investment Objectives, Principal Strategies and Principal Risks9 — continued
Eaton Vance New York Municipal Bond Fund
Investment Objective and Principal Strategies
The Fund’s investment objective is to provide current income exempt from federal income tax and New York State and New York City personal income taxes.
During normal market conditions, at least 80% of the Fund’s net assets will be invested in municipal obligations, the interest on which is exempt from federal income tax, including the alternative minimum tax (“AMT”), and New York State and New York City personal income taxes and that are rated A or better by Moody’s Investors Service, Inc. (“Moody’s”), S&P Global Ratings (“S&P”) or Fitch Ratings (“Fitch”). The foregoing 80% policy may not be changed without shareholder approval. Under normal market conditions, the Fund expects to be fully invested (at least 95% of its net assets) in accordance with its investment objective. The Fund may invest up to 20% of its net assets in municipal obligations rated BBB/Baa or below (or unrated obligations deemed by the Fund’s adviser, Eaton Vance Management (“Eaton Vance”), to be of equivalent quality), provided that not more than 15% of its net assets may be invested in municipal obligations rated below B (or unrated obligations deemed by Eaton Vance to be of equivalent quality) and may invest up to 20% of its net assets in bonds on which the interest is subject to the AMT. When a municipal obligation is split rated (meaning rated in different categories by Moody’s, S&P or Fitch) the Fund will deem the higher rating to apply.
The Fund may purchase derivative instruments, which derive their value from another instrument, security or index, including financial futures contracts and related options, interest rate swaps and forward rate contracts. The Fund also may invest in residual interests of a trust (the “trust”) that holds municipal securities (“RIBs”). The trust will also issue floating-rate notes to third parties that may be senior to a Fund’s residual interest. The Fund may purchase and sell financial futures contracts and related options, including futures contracts and related options based on various debt securities and securities indices, as well as interest rate swaps and forward rate contracts, to seek to hedge against changes in interest rates or for other risk management purposes.
Except for certain fundamental investment restrictions set forth in the Fund’s registration statement and the 80% requirement pertaining to investment in municipal and insured municipal obligations set forth above, the investment objective and policies of the Fund may be changed by the Board without shareholder action.
The Fund employs leverage to seek opportunities for additional income. Leverage may amplify the effect on the Fund’s NAV of any increase or decrease in the value of investments held. The Fund generally will not use leverage if the investment adviser anticipates that it would result in a lower return to shareholders for any significant amount of time. There can be no assurance that the use of leverage will be successful.
Principal Risks
Market Discount Risk. As with any security, the market value of the common shares may increase or decrease from the amount initially paid for the common shares. The Fund’s common shares have traded both at a premium and at a discount relative to NAV. The shares of closed-end management investment companies frequently trade at a discount from their NAV. This is a risk separate and distinct from the risk that the Fund’s NAV may decrease.
Market Risk. The value of investments held by the Fund may increase or decrease in response to economic, political, financial, public health crises (such as epidemics or pandemics) or other disruptive events (whether real, expected or perceived) in the U.S. and global markets. These events may negatively impact broad segments of businesses and populations and may exacerbate pre-existing risks to the Fund. The frequency and magnitude of resulting changes in the value of the Fund’s investments cannot be predicted. Certain securities and other investments held by the Fund may experience increased volatility, illiquidity, or other potentially adverse effects in reaction to changing market conditions. Monetary and/or fiscal actions taken by U.S. or foreign governments to stimulate or stabilize the global economy may not be effective and could lead to high market volatility. No active trading market may exist for certain investments held by the Fund, which may impair the ability of the Fund to sell or to realize the current valuation of such investments in the event of the need to liquidate such assets.
Interest Rate Risk. In general, the value of debt instruments will fluctuate based on changes in interest rates. The value of these securities is likely to increase when interest rates fall and decline when interest rates rise. Duration measures the time-weighted expected cash flows of a fixed-income security, while maturity refers to the amount of time until a fixed-income security matures. Generally, securities with longer durations or maturities are more sensitive to changes in interest rates than securities with shorter durations or maturities, causing them to be more volatile. Conversely, fixed-income securities with shorter durations or maturities will be less volatile but may provide lower returns than fixed-income securities with longer durations or maturities. Because the Fund is managed toward an income objective, it may hold more longer duration or maturity obligations and thereby be more exposed to interest rate risk than municipal income funds that are managed with a greater emphasis on total return. The impact of interest rate changes is significantly less for floating-rate instruments that have relatively short periodic rate resets (e.g., ninety days or less). In a rising interest rate environment, the durations or maturities of income securities that have the ability to be prepaid or called by the issuer may be extended. In a declining interest rate environment, the proceeds from prepaid or maturing instruments may have to be reinvested at a lower interest rate. Certain instruments held by the Fund may pay an interest rate based on the London Interbank Offered Rate (“LIBOR”), which is the average offered rate for various maturities of short-term loans between certain major international banks. LIBOR is used throughout global banking and financial industries to determine interest rates for a variety of financial instruments (such as debt instruments and derivatives) and borrowing arrangements. The ICE Benchmark Administration Limited, the administrator of LIBOR, is expected to cease publishing certain LIBOR settings on December 31, 2021, and the remaining LIBOR settings on June 30, 2023. Although the transition process away from LIBOR is expected to be defined in advance of the anticipated discontinuation, there remains uncertainty regarding the future utilization of LIBOR and the nature of any replacement rate or rates. The phase-out of LIBOR may result in, among other things, increased volatility or illiquidity in markets for instruments based on LIBOR and changes in the value of such instruments.
Credit Risk. Investments in municipal obligations and other debt obligations (referred to below as “debt instruments”) are subject to the risk of non-payment of scheduled principal and interest. Changes in economic conditions or other circumstances may reduce the capacity of the party obligated to make principal and interest payments on such instruments and may lead to defaults. Such non-payments and defaults may reduce the
See Endnotes and Additional Disclosures in this report.
Eaton Vance
Municipal Bond Funds
September 30, 2021
The Fund’s Investment Objectives, Principal Strategies and Principal Risks9 — continued
value of Fund shares and income distributions. The value of debt instruments also may decline because of concerns about the issuer’s ability to make principal and interest payments. In addition, the credit ratings of debt instruments may be lowered if the financial condition of the party obligated to make payments with respect to such instruments deteriorates. In order to enforce its rights in the event of a default, bankruptcy or similar situation, the Fund may be required to retain legal or similar counsel, which may increase the Fund’s operating expenses and adversely affect net asset value. Municipal obligations may be insured as to principal and interest payments. If the claims-paying ability or other rating of the insurer is downgraded by a rating agency, the value of such obligations may be negatively affected.
Municipal Obligations Risk. The amount of public information available about municipal obligations is generally less than for corporate equities or bonds, meaning that the investment performance of municipal obligations may be more dependent on the analytical abilities of the investment adviser than stock or corporate bond investments. The secondary market for municipal obligations also tends to be less well-developed and less liquid than many other securities markets, which may limit the Fund’s ability to sell its municipal obligations at attractive prices. The differences between the price at which an obligation can be purchased and the price at which it can be sold may widen during periods of market distress. Less liquid obligations can become more difficult to value and be subject to erratic price movements. The increased presence of nontraditional participants (such as proprietary trading desks of investment banks and hedge funds) or the absence of traditional participants (such as individuals, insurance companies, banks and life insurance companies) in the municipal markets may lead to greater volatility in the markets because non-traditional participants may trade more frequently or in greater volume.
Lower Rated Investments Risk. Investments rated below investment grade and comparable unrated investments (sometimes referred to as “junk”) have speculative characteristics because of the credit risk associated with their issuers. Changes in economic conditions or other circumstances typically have a greater effect on the ability of issuers of lower rated investments to make principal and interest payments than they do on issuers of higher rated investments. An economic downturn generally leads to a higher non-payment rate, and a lower rated investment may lose significant value before a default occurs. Lower rated investments typically are subject to greater price volatility and illiquidity than higher rated investments.
Leverage Risk. Certain Fund transactions may give rise to leverage. Leverage can result from a non-cash exposure to an asset, index, rate or instrument. Leverage can also result from borrowings, issuance of preferred shares or participation in residual interest bond transactions. Leverage can increase both the risk and return potential of the Fund. The Fund is required to segregate liquid assets or otherwise cover the Fund’s obligation created by a transaction that may give rise to leverage. The use of leverage may cause the Fund to liquidate portfolio positions when it may not be advantageous to do so to satisfy its obligations or to meet segregation requirements. Leverage may cause the Fund’s NAV to be more volatile than if it had not been leveraged, as certain types of leverage may exaggerate the effect of any increase or decrease in the Fund’s portfolio securities. The loss on leveraged investments may substantially exceed the initial investment. The Fund intends to use leverage to provide the holders of common shares with a potentially higher return. To the extent the income derived from securities purchased with funds received from leverage exceeds the cost of leverage, the Fund’s return will be greater than if leverage had not been
used. Conversely, if the income from the securities purchased with such funds is not sufficient to cover the cost of leverage, the return to the Fund will be less than if leverage had not been used, and therefore the amount available for distribution to common shareholders as dividends and other distributions will be reduced. In the latter case, the investment adviser in its best judgment may nevertheless determine to maintain the Fund’s leveraged position if it deems such action to be appropriate. The use of leverage through issuance of preferred shares by the Fund creates an opportunity for increased net income, but, at the same time, creates special risks. There can be no assurance that a leveraging strategy will be successful during any period in which it is employed.
Risk of Residual Interest Bonds. The Fund may enter into residual interest bond transactions, which expose the Fund to leverage and greater risk than an investment in a fixed-rate municipal bond. The interest payments that the Fund receives on the residual interest bonds acquired in such transactions vary inversely with short-term interest rates, normally decreasing when short-term rates increase. The value and market for residual interest bonds are volatile and such bonds may have limited liquidity. As required by applicable accounting standards, the Fund records interest expense on its liability with respect to floating-rate notes and also records offsetting interest income in an amount equal to this expense.
Restricted Securities Risk. Unless registered for sale to the public under applicable federal securities law, restricted securities can be sold only in private transactions to qualified purchasers pursuant to an exemption from registration. The sale price realized from a private transaction could be less than the Fund’s purchase price for the restricted security. It may be difficult to identify a qualified purchaser for a restricted security held by the Fund and such security could be deemed illiquid. It may also be more difficult to value such securities.
Derivatives Risk. The Fund’s exposure to derivatives involves risks different from, or possibly greater than, the risks associated with investing directly in securities and other investments. The use of derivatives can lead to losses because of adverse movements in the price or value of the security, instrument, index, currency, commodity, economic indicator or event underlying a derivative (“reference instrument”), due to failure of a counterparty or due to tax or regulatory constraints. Derivatives may create leverage in the Fund, which represents a non-cash exposure to the underlying reference instrument. Leverage can increase both the risk and return potential of the Fund. Derivatives risk may be more significant when derivatives are used to enhance return or as a substitute for a cash investment position, rather than solely to hedge the risk of a position held by the Fund. Use of derivatives involves the exercise of specialized skill and judgment, and a transaction may be unsuccessful in whole or in part because of market behavior or unexpected events. Changes in the value of a derivative (including one used for hedging) may not correlate perfectly with the underlying reference instrument. Derivative instruments traded in over-the-counter markets may be difficult to value, may be illiquid, and may be subject to wide swings in valuation caused by changes in the value of the underlying reference instrument. If a derivative’s counterparty is unable to honor its commitments, the value of Fund shares may decline and the Fund could experience delays in the return of collateral or other assets held by the counterparty. The loss on derivative transactions may substantially exceed the initial investment, particularly when there is no stated limit on the Fund’s use of derivatives. A derivative investment also involves the risks relating to the reference instrument underlying the investment.
See Endnotes and Additional Disclosures in this report.
Eaton Vance
Municipal Bond Funds
September 30, 2021
The Fund’s Investment Objectives, Principal Strategies and Principal Risks9 — continued
Liquidity Risk. The Fund is exposed to liquidity risk when trading volume, lack of a market maker or trading partner, large position size, market conditions, or legal restrictions impair its ability to sell particular investments or to sell them at advantageous market prices. Consequently, the Fund may have to accept a lower price to sell an investment or continue to hold it or keep the position open, sell other investments to raise cash or abandon an investment opportunity, any of which could have a negative effect on the Fund’s performance. These effects may be exacerbated during times of financial or political stress.
Sector and Geographic Risk. Because the Fund may invest a significant portion of its assets in obligations issued in a particular state and/or U.S. territories and in certain types of municipal or other obligations and/or in certain sectors, the value of Fund shares may be affected by events that adversely affect that state, U.S. territory, sector or type of obligation and may fluctuate more than that of a fund that invests more broadly. General obligation bonds issued by municipalities are adversely affected by economic downturns and any resulting decline in tax revenues. Please refer to the Fund’s Statement of Additional Information for state-specific economic information as well as information about Puerto Rico, the U.S. Virgin Islands, Guam and American Samoa.
Issuer Diversification Risk. The Fund is “non-diversified,” which means it may invest a greater percentage of its assets in the securities of a single issuer than a fund that is “diversified.” Non-diversified funds may focus their investments in a small number of issuers, making them more susceptible to risks affecting such issuers than a more diversified fund might be.
Recent Market Conditions. An outbreak of respiratory disease caused by a novel coronavirus was first detected in China in late 2019 and subsequently spread internationally. This coronavirus has resulted in closing borders, enhanced health screenings, changes to healthcare service preparation and delivery, quarantines, cancellations, disruptions to supply chains and customer activity, as well as general concern and uncertainty. The impact of this coronavirus has resulted in a substantial economic downturn. Health crises caused by outbreaks of disease, such as the coronavirus outbreak, may exacerbate other pre-existing political, social and economic risks and disrupt normal market conditions and operations. The impact of this outbreak has negatively affected the worldwide economy, as well as the economies of individual countries and industries, and could continue to affect the market in significant and unforeseen ways. Other epidemics and pandemics that may arise in the future may have similar effects. For example, a global pandemic or other widespread health crisis could cause substantial market volatility and exchange trading suspensions and closures. In addition, the increasing interconnectedness of markets around the world may result in many markets being affected by events or conditions in a single country or region or events affecting a single or small number of issuers. The coronavirus outbreak and public and private sector responses thereto have led to large portions of the populations of many countries working from home for indefinite periods of time, temporary or permanent layoffs, disruptions in supply chains, and lack of availability of certain goods. The impact of such responses could adversely affect the information technology and operational systems upon which the Fund and the Fund’s service providers rely, and could otherwise disrupt the ability of the employees of the Fund’s service providers to perform critical tasks relating to the Fund. Any such impact could adversely affect the Fund’s performance, or the performance of the securities in which the Fund invests and may lead to losses on your investment in the Fund.
Risks Associated with Active Management. The success of the Fund’s investment strategy depends on portfolio management’s successful application of analytical skills and investment judgment. Active management involves subjective decisions.
Tax Risk. Income from tax-exempt municipal obligations could be declared taxable because of changes in tax laws, adverse interpretations by the relevant taxing authority or the non-compliant conduct of the issuer of an obligation.
Tax-Sensitive Investing Risk. The Fund may hold a security in order to achieve more favorable tax-treatment or to sell a security in order to create tax losses. The Fund’s utilization of various tax-management techniques may be curtailed or eliminated by tax legislation, regulation or interpretations. The Fund may not be able to minimize taxable distributions to shareholders and a portion of the Fund’s distributions may be taxable.
Cybersecurity Risk. With the increased use of technologies by Fund service providers to conduct business, such as the Internet, the Fund is susceptible to operational, information security and related risks. In general, cyber incidents can result from deliberate attacks or unintentional events. Cybersecurity failures by or breaches of the Fund’s investment adviser or administrator and other service providers (including, but not limited to, the custodian or transfer agent), and the issuers of securities in which the Fund invests, have the ability to cause disruptions and impact business operations potentially resulting in financial losses, interference with the Fund’s ability to calculate its net asset value, impediments to trading, the inability of Fund shareholders to transact business, violations of applicable privacy and other laws, regulatory fines, penalties, reputational damage, reimbursement or other compensation costs, or additional compliance costs.
General Fund Investing Risks. The Fund is not a complete investment program and there is no guarantee that the Fund will achieve its investment objective. It is possible to lose money by investing in the Fund. An investment in the Fund is not a deposit in a bank and is not insured or guaranteed by the Federal Deposit Insurance Corporation or any other government agency.
See Endnotes and Additional Disclosures in this report.
Eaton Vance
Municipal Bond Funds
September 30, 2021
Endnotes and Additional Disclosures
| 1 | The views expressed in this report are those of the portfolio manager(s) and are current only through the date stated at the top of this page. These views are subject to change at any time based upon market or other conditions, and Eaton Vance and the Fund(s) disclaim any responsibility to update such views. These views may not be relied upon as investment advice and, because investment decisions are based on many factors, may not be relied upon as an indication of trading intent on behalf of any Eaton Vance fund. This commentary may contain statements that are not historical facts, referred to as “forward-looking statements.” The Fund’s actual future results may differ significantly from those stated in any forward-looking statement, depending on factors such as changes in securities or financial markets or general economic conditions, the volume of sales and purchases of Fund shares, the continuation of investment advisory, administrative and service contracts, and other risks discussed from time to time in the Fund’s filings with the Securities and Exchange Commission. |
| 2 | Bloomberg Municipal Bond Index is an unmanaged index of municipal bonds traded in the U.S. Unless otherwise stated, index returns do not reflect the effect of any applicable sales charges, commissions, expenses, taxes or leverage, as applicable. It is not possible to invest directly in an index. |
| 3 | Performance results reflect the effects of leverage. |
| 4 | The shares of the Fund often trade at a discount or premium to their net asset value. The discount or premium may vary over time and may be higher or lower than what is quoted in this report. For up-to-date premium/discount information, please refer to https://funds.eatonvance.com/closed-end-fund-prices.php. |
| 5 | The Distribution Rate is based on the Fund’s last regular distribution per share in the period (annualized) divided by the Fund’s NAV or market price at the end of the period. The Fund’s distributions may be comprised of amounts characterized for federal income tax purposes as tax-exempt income, qualified and non-qualified ordinary dividends, capital gains and nondividend distributions, also known as return of capital. The Fund will determine the federal income tax character of distributions paid to a shareholder after the end of the calendar year. This is reported on the IRS form 1099-DIV and provided to the shareholder shortly after each year-end. For information about the tax character of distributions made in prior calendar years, please refer to Performance-Tax Character of Distributions on the Fund’s webpage available at eatonvance.com. The Fund’s distributions are determined by the investment adviser based on its current assessment of the Fund’s long-term return potential. Fund distributions may be affected by numerous factors including changes in Fund performance, the cost of financing for Funds that employ leverage, portfolio holdings, realized and projected returns, and other factors. As portfolio and market conditions change, the rate of distributions paid by the Fund could change. Taxable-equivalent performance is based on the highest combined federal and state income tax rates, where applicable. Lower tax rates would result in lower tax-equivalent performance. Actual tax rates will vary depending on your income, exemptions and deductions. Rates do not include local taxes. |
| 6 | Fund employs RIB financing. The leverage created by RIB investments provides an opportunity for increased income but, at the same time, creates special risks (including the likelihood of greater price volatility). |
| | The cost of leverage rises and falls with changes in short-term interest rates. See “Floating Rate Notes Issued in Conjunction with Securities Held” in the notes to the financial statements for more information about RIB financing. RIB leverage represents the amount of Floating Rate Notes outstanding at period end as a percentage of Fund net assets plus Floating Rate Notes. |
| 7 | For purposes of the Fund’s rating restrictions, ratings are based on Moody’s Investors Service, Inc. (“Moody’s”), S&P Global Ratings (“S&P”) or Fitch Ratings (“Fitch”), as applicable. If securities are rated differently by the ratings agencies, the highest rating is applied. Ratings, which are subject to change, apply to the creditworthiness of the issuers of the underlying securities and not to the Fund or its shares. Credit ratings measure the quality of a bond based on the issuer’s creditworthiness, with ratings ranging from AAA, being the highest, to D, being the lowest based on S&P’s measures. Ratings of BBB or higher by S&P or Fitch (Baa or higher by Moody’s) are considered to be investment-grade quality. Credit ratings are based largely on the ratings agency’s analysis at the time of rating. The rating assigned to any particular security is not necessarily a reflection of the issuer’s current financial condition and does not necessarily reflect its assessment of the volatility of a security’s market value or of the liquidity of an investment in the security. Holdings designated as “Not Rated” (if any) are not rated by the national ratings agencies stated above. |
| 8 | The chart includes the municipal bonds held by a trust that issues residual interest bonds, consistent with the Portfolio of Investments. |
| 9 | The information contained herein is provided for informational purposes only and does not constitute a solicitation of an offer to buy or sell Fund shares. Common shares of the Fund are available for purchase and sale only at current market prices in secondary market trading. |
Fund profiles subject to change due to active management.
Additional Information
Yield curve is a graphical representation of the yields offered by bonds of various maturities. The yield curve flattens when long-term interest rates fall and/or short-term interest rates increase, and the yield curve steepens when long-term interest rates increase and/or short-term interest rates fall.
Important Notice to Shareholders
Effective October 1, 2021, Cynthia J. Clemson and Julie P. Callahan are the portfolio managers of the Municipal Bond Fund, Trevor G. Smith is the portfolio manager of the California Municipal Bond Fund, and Christopher J. Eustance is the portfolio manager of the New York Municipal Bond Fund.
Effective August 24, 2021, the Bloomberg Barclays fixed income indices were rebranded as Bloomberg indices.
Eaton Vance
Municipal Bond Fund
September 30, 2021
Portfolio of Investments
| | | | | | | | |
| Corporate Bonds — 1.4% | |
| Security | | Principal
Amount
(000’s omitted) | | | Value | |
|
| Hospital — 1.4% | |
| | |
Montefiore Obligated Group, 4.287%, 9/1/50 | | $ | 13,890 | | | $ | 14,469,239 | |
| |
Total Corporate Bonds — 1.4%
(identified cost $13,890,000) | | | $ | 14,469,239 | |
|
| Tax-Exempt Mortgage-Backed Securities — 0.4% | |
| Security | | Principal
Amount
(000’s omitted) | | | Value | |
|
| Housing — 0.4% | |
| | |
Washington Housing Finance Commission, Municipal Certificates, Series 2021-1, Class A, 3.50%, 12/20/35 | | $ | 3,255 | | | $ | 3,759,454 | |
| |
Total Tax-Exempt Mortgage-Backed Securities — 0.4%
(identified cost $3,683,205) | | | $ | 3,759,454 | |
|
| Tax-Exempt Municipal Obligations — 160.6% | |
| Security | | Principal
Amount
(000’s omitted) | | | Value | |
|
| Bond Bank — 2.2% | |
| | |
Delaware Valley Regional Finance Authority, PA, 5.75%, 7/1/32 | | $ | 6,500 | | | $ | 9,274,005 | |
| | |
Illinois Finance Authority, (Revolving Fund), Green Bonds, 4.00%, 7/1/38 | | | 5,000 | | | | 5,881,800 | |
| | |
Ohio Economic Development, (Ohio Enterprise Bond Fund), 6.00%, 12/1/34 | | | 700 | | | | 701,358 | |
| | |
Rickenbacker Port Authority, OH, (OASBO Expanded Asset Pooled Financing Program), 5.375%, 1/1/32 | | | 345 | | | | 445,875 | |
| | |
Texas Water Development Board, 4.00%, 10/15/37(1) | | | 4,875 | | | | 5,746,406 | |
| | |
| | | | | | | $ | 22,049,444 | |
|
| Education — 11.9% | |
| | |
Connecticut Health and Educational Facilities Authority, (Fairfield University), 5.00%, 7/1/46 | | $ | 4,750 | | | $ | 5,544,200 | |
| |
District of Columbia, (KIPP DC): | | | | | |
| | |
4.00%, 7/1/39 | | | 275 | | | | 310,976 | |
| | |
4.00%, 7/1/44 | | | 270 | | | | 301,425 | |
| | |
4.00%, 7/1/49 | | | 385 | | | | 426,742 | |
| | | | | | | | |
| Security | | Principal
Amount
(000’s omitted) | | | Value | |
|
| Education (continued) | |
| | |
Georgia Private Colleges and Universities Authority, (Mercer University), 4.00%, 10/1/50 | | $ | 2,700 | | | $ | 3,111,939 | |
| | |
Houston Higher Education Finance Corp., TX, (St. John’s School), Prerefunded to 9/1/22, 5.25%, 9/1/33 | | | 4,550 | | | | 4,755,387 | |
| | |
Massachusetts Development Finance Agency, (Boston College), 5.00%, 7/1/42(1) | | | 9,525 | | | | 11,405,425 | |
| | |
Massachusetts Development Finance Agency, (Northeastern University), 5.25%, 3/1/37 | | | 1,650 | | | | 1,834,025 | |
| | |
Massachusetts Development Finance Agency, (Williams College), 5.00%, 7/1/46(1) | | | 7,050 | | | | 8,357,845 | |
| | |
Massachusetts Health and Educational Facilities Authority, (Boston College): | | | | | | | | |
| | |
5.50%, 6/1/27 | | | 5,710 | | | | 7,208,076 | |
| | |
5.50%, 6/1/30 | | | 8,325 | | | | 11,029,543 | |
| | |
New Jersey Educational Facilities Authority, (Princeton University): | | | | | | | | |
| | |
4.00%, 7/1/47(1) | | | 10,000 | | | | 11,369,800 | |
| | |
5.00%, 7/1/29(1) | | | 1,675 | | | | 2,073,449 | |
| | |
5.00%, 7/1/31(1) | | | 1,125 | | | | 1,387,586 | |
| | |
New York Dormitory Authority, (Columbia University), 5.00%, 10/1/38(1) | | | 8,500 | | | | 10,546,545 | |
| | |
Ohio Higher Educational Facility Commission, (Oberlin College), 5.00%, 10/1/33 | | | 500 | | | | 542,515 | |
| | |
Pennsylvania State University, 5.00%, 9/1/42(1) | | | 3,750 | | | | 4,544,100 | |
| | |
Swarthmore Borough Authority, PA, (Swarthmore College), 5.00%, 9/15/46(1) | | | 3,000 | | | | 3,699,690 | |
| | |
University of Cincinnati, OH, 5.00%, 6/1/45(1) | | | 7,500 | | | | 9,067,875 | |
| | |
University of Michigan: | | | | | | | | |
| | |
5.00%, 4/1/40(1) | | | 15,000 | | | | 17,596,500 | |
| | |
5.00%, 4/1/48(1) | | | 3,500 | | | | 4,301,080 | |
| | |
| | | | | | | $ | 119,414,723 | |
|
| Electric Utilities — 5.7% | |
| | |
Energy Northwest, WA, 5.00%, 7/1/40 | | $ | 2,650 | | | $ | 2,947,489 | |
| | |
Los Angeles Department of Water and Power, CA, Power System Revenue, 4.00%, 7/1/46(1) | | | 3,000 | | | | 3,322,980 | |
| | |
Michigan Public Power Agency, 5.00%, 1/1/43 | | | 700 | | | | 706,594 | |
| | |
New York Power Authority, 4.00%, 11/15/50(1) | | | 12,500 | | | | 14,518,875 | |
| | |
Omaha Public Power District, NE: | | | | | | | | |
| | |
5.00%, 2/1/40(1) | | | 16,000 | | | | 17,880,320 | |
| | |
5.00%, 2/1/42(1) | | | 10,000 | | | | 12,150,900 | |
| | |
Utility Debt Securitization Authority, NY, 5.00%, 12/15/35 | | | 5,000 | | | | 5,512,900 | |
| | |
| | | | | | | $ | 57,040,058 | |
| | | | |
| | 20 | | See Notes to Financial Statements. |
Eaton Vance
Municipal Bond Fund
September 30, 2021
Portfolio of Investments — continued
| | | | | | | | |
| Security | | Principal
Amount
(000’s omitted) | | | Value | |
|
| Escrowed / Prerefunded — 6.6% | |
| | |
East Hempfield Township Industrial Development Authority, PA, (Student Services, Inc.), Prerefunded to 7/1/24, 5.00%, 7/1/39 | | $ | 175 | | | $ | 197,080 | |
| | |
Kent Hospital Finance Authority, MI, (Spectrum Health System), Prerefunded to 1/15/22, 5.00%, 1/15/31 | | | 750 | | | | 760,305 | |
| | |
New York Dormitory Authority, Sales Tax Revenue, Prerefunded to 3/15/23, 5.00%, 3/15/35 | | | 13,750 | | | | 14,707,412 | |
| | |
New York, NY, Prerefunded to 10/1/22,
5.00%, 10/1/32 | | | 10,000 | | | | 10,484,500 | |
| | |
North Carolina Capital Facilities Finance Agency, (Duke University), Prerefunded to 10/1/25, 5.00%, 10/1/41(1) | | | 10,000 | | | | 11,811,000 | |
| | |
Northeast Ohio Regional Sewer District, Prerefunded to 5/15/23, 4.00%, 11/15/33(1) | | | 1,000 | | | | 1,061,360 | |
| | |
University of Massachusetts Building Authority, Prerefunded to 11/1/22, 5.00%, 11/1/39(1) | | | 14,175 | | | | 14,916,211 | |
| | |
Walled Lake Consolidated School District, MI, Prerefunded to 11/1/23, 5.00%, 5/1/34 | | | 635 | | | | 697,243 | |
| | |
Wisconsin Health and Educational Facilities Authority, (Ascension Health Alliance Senior Credit Group), Prerefunded to 11/15/21,
5.00%, 11/15/41(1) | | | 11,500 | | | | 11,564,055 | |
| | |
| | | | | | | $ | 66,199,166 | |
|
| General Obligations — 29.0% | |
| | |
Allegheny County, PA, 5.00%, 11/1/43(1) | | $ | 3,800 | | | $ | 4,667,730 | |
| | |
Boston, MA, 5.00%, 5/1/38(1) | | | 2,000 | | | | 2,504,740 | |
| | |
California: | | | | | | | | |
| | |
5.00%, 10/1/33(1) | | | 18,800 | | | | 21,308,860 | |
| | |
5.00%, 8/1/46(1) | | | 15,000 | | | | 17,813,550 | |
| | |
Chicago, IL, 5.00%, 1/1/44 | | | 19,880 | | | | 23,676,285 | |
| | |
Cleveland, OH, 5.00%, 12/1/43(1) | | | 2,225 | | | | 2,685,909 | |
| | |
District of Columbia, 5.00%, 6/1/43(1) | | | 12,000 | | | | 14,714,520 | |
| | |
Forest Hills Local School District, OH, 5.00%, 12/1/46(1) | | | 2,225 | | | | 2,496,161 | |
| | |
Humble Independent School District, TX, (PSF Guaranteed), 5.00%, 2/15/43(1) | | | 20,000 | | | | 23,655,200 | |
| | |
Illinois: | | | | | | | | |
| | |
4.00%, 11/1/38 | | | 13,000 | | | | 14,701,830 | |
| | |
4.00%, 11/1/40 | | | 2,000 | | | | 2,249,220 | |
| | |
5.00%, 5/1/43 | | | 5,000 | | | | 5,855,250 | |
| | |
5.50%, 5/1/39 | | | 810 | | | | 1,024,853 | |
| | |
5.75%, 5/1/45 | | | 830 | | | | 1,051,203 | |
| | |
Jackson Public Schools, MI, 5.00%, 5/1/48(1) | | | 2,150 | | | | 2,564,413 | |
| | |
Massachusetts, 5.00%, 9/1/38(1) | | | 18,500 | | | | 23,075,790 | |
| | | | | | | | |
| Security | | Principal
Amount
(000’s omitted) | | | Value | |
|
| General Obligations (continued) | |
| | |
Morgan Hill Unified School District, CA, (Election of 2012), 4.00%, 8/1/47(1) | | $ | 10,000 | | | $ | 11,358,900 | |
| | |
Ohio, 5.00%, 2/1/37(1) | | | 2,225 | | | | 2,603,117 | |
| | |
Pennsylvania: | | | | | | | | |
| | |
4.00%, 4/1/29(1) | | | 3,000 | | | | 3,163,680 | |
| | |
5.00%, 3/1/32(1) | | | 2,750 | | | | 3,413,437 | |
| | |
Peters Township School District, PA, 5.00%, 9/1/40(1) | | | 3,225 | | | | 3,957,139 | |
| | |
Shoreline School District No. 412, WA, 4.00%, 6/1/38(1) | | | 2,800 | | | | 3,298,064 | |
| | |
State College Area School District, PA, 5.00%, 5/15/44(1) | | | 3,650 | | | | 4,431,793 | |
| | |
Tacoma School District No. 10, WA, Prerefunded to 12/1/25, 5.00%, 12/1/39(1) | | | 10,000 | | | | 11,854,100 | |
| | |
Trenton Public Schools, MI, 5.00%, 5/1/42(1) | | | 2,150 | | | | 2,600,253 | |
| | |
Upper Arlington City School District, OH, 5.00%, 12/1/48(1) | | | 2,225 | | | | 2,674,094 | |
| | |
Washington: | | | | | | | | |
| | |
4.00%, 7/1/28(1) | | | 10,000 | | | | 10,271,100 | |
| | |
5.00%, 2/1/35(1) | | | 23,500 | | | | 25,968,675 | |
| | |
5.00%, 2/1/38(1) | | | 10,000 | | | | 12,231,700 | |
| | |
5.00%, 6/1/38 | | | 1,540 | | | | 1,967,273 | |
| | |
5.00%, 6/1/40 | | | 2,500 | | | | 3,178,875 | |
| | |
Will County, IL, Prerefunded to 11/15/25, 5.00%, 11/15/45(1) | | | 19,725 | | | | 23,352,427 | |
| | |
Winchester, MA, 5.00%, 4/15/36 | | | 160 | | | | 160,573 | |
| | |
| | | | | | | $ | 290,530,714 | |
|
| Hospital — 12.5% | |
| | |
Allen County, OH, (Mercy Health), 4.00%, 8/1/47(1) | | $ | 900 | | | $ | 1,014,930 | |
| | |
Brookhaven Local Development Corp., NY, (Long Island Community Hospital), 5.00%, 10/1/50 | | | 1,795 | | | | 2,200,778 | |
| | |
California Health Facilities Financing Authority, (City of Hope), 4.00%, 11/15/45(1) | | | 5,200 | | | | 5,987,592 | |
| | |
Camden County Improvement Authority, NJ, (Cooper Health System), 5.75%, 2/15/42 | | | 250 | | | | 264,535 | |
| | |
Chester County Health and Education Facilities Authority, PA, (Main Line Health System), 4.00%, 9/1/50 | | | 11,625 | | | | 13,437,919 | |
| | |
Franklin County, OH, (Trinity Health Credit Group), 5.00%, 12/1/47(1) | | | 2,200 | | | | 2,681,558 | |
| | |
Hamilton County, OH, (Cincinnati Children’s Hospital Medical Center), 5.00%, 5/15/34 | | | 250 | | | | 279,195 | |
| | |
Hamilton County, OH, (UC Health), 4.00%, 9/15/50 | | | 3,335 | | | | 3,775,220 | |
| | |
Hawaii Department of Budget and Finance, (Hawaii Pacific Health), 5.50%, 7/1/38 | | | 3,150 | | | | 3,409,402 | |
| | | | |
| | 21 | | See Notes to Financial Statements. |
Eaton Vance
Municipal Bond Fund
September 30, 2021
Portfolio of Investments — continued
| | | | | | | | |
| Security | | Principal
Amount
(000’s omitted) | | | Value | |
|
| Hospital (continued) | |
| | |
Martin County Health Facilities Authority, FL, (Cleveland Clinic Health System), 4.00%, 1/1/46(1) | | $ | 10,000 | | | $ | 11,408,700 | |
| | |
Maryland Health and Higher Educational Facilities Authority, (Frederick Health System), 4.00%, 7/1/45 | | | 250 | | | | 287,087 | |
| | |
Massachusetts Development Finance Agency, (Partners HealthCare System): | | | | | | | | |
| | |
5.00%, 7/1/41(1) | | | 10,000 | | | | 11,875,600 | |
| | |
5.00%, 7/1/47(1) | | | 2,375 | | | | 2,809,554 | |
| | |
Michigan Finance Authority, (Trinity Health Credit Group), 5.00%, 12/1/42(1) | | | 7,300 | | | | 8,933,010 | |
| | |
Mobile Infirmary Health System Special Care Facilities Financing Authority, AL, (Infirmary Health System, Inc.), 3.00%, 2/1/46 | | | 3,000 | | | | 3,090,840 | |
| | |
Monroeville Finance Authority, PA, (UPMC Obligated Group), 5.00%, 2/15/42 | | | 500 | | | | 520,115 | |
| | |
New Jersey Health Care Facilities Financing Authority, (Palisades Medical Center), Prerefunded to 7/1/23, 5.25%, 7/1/31 | | | 135 | | | | 146,375 | |
| | |
New Jersey Health Care Facilities Financing Authority, (Princeton HealthCare System), 5.00%, 7/1/39(1) | | | 1,750 | | | | 2,080,015 | |
| | |
New Jersey Health Care Facilities Financing Authority, (Robert Wood Johnson University Hospital), 5.25%, 7/1/35 | | | 5,000 | | | | 5,410,200 | |
| | |
Ohio Higher Educational Facility Commission, (University Hospitals Health System, Inc.): | | | | | | | | |
| | |
5.00%, 1/15/27 | | | 565 | | | | 596,578 | |
| | |
5.00%, 1/15/29 | | | 165 | | | | 174,331 | |
| | |
Pennsylvania Higher Educational Facilities Authority, (University of Pennsylvania Health System), 4.00%, 8/15/42(1) | | | 1,600 | | | | 1,803,744 | |
| | |
Royal Oak Hospital Finance Authority, MI, (William Beaumont Hospital), 5.00%, 9/1/39 | | | 1,000 | | | | 1,104,290 | |
| | |
Tampa, FL, (BayCare Health System): | | | | | | | | |
| | |
4.00%, 11/15/46(1) | | | 3,000 | | | | 3,334,830 | |
| | |
5.00%, 11/15/46(1) | | | 12,000 | | | | 13,959,840 | |
| | |
Tarrant County Cultural Education Facilities Finance Corp., TX, (Baylor Scott & White Health), 5.00%, 11/15/45(1) | | | 12,900 | | | | 15,114,027 | |
| | |
Vermont Educational and Health Buildings Financing Agency, (University of Vermont Medical Center), 5.00%, 12/1/33 | | | 1,600 | | | | 1,891,056 | |
| | |
West Virginia Hospital Finance Authority, (West Virginia United Health System Obligated Group), Prerefunded to 6/1/23, 5.375%, 6/1/38 | | | 7,605 | | | | 8,250,893 | |
| | |
| | | | | | | $ | 125,842,214 | |
| | | | | | | | |
| Security | | Principal
Amount
(000’s omitted) | | | Value | |
|
| Housing — 0.6% | |
| | |
Maryland Economic Development Corp., (Morgan State University), Student Housing Revenue, 4.25%, 7/1/50 | | $ | 1,350 | | | $ | 1,542,402 | |
| | |
New York City Housing Development Corp., NY, 2.35%, 11/1/40 | | | 3,640 | | | | 3,598,540 | |
| | |
Seattle Housing Authority, WA, 3.625%, 12/1/43 | | | 1,000 | | | | 1,069,940 | |
| | |
| | | | | | | $ | 6,210,882 | |
|
| Industrial Development Revenue — 2.2% | |
| | |
George L. Smith II Georgia World Congress Center Authority, 4.00%, 1/1/54 | | $ | 2,000 | | | $ | 2,270,360 | |
| | |
Maricopa County Pollution Control Corp., AZ, (El Paso Electric Co.), 4.50%, 8/1/42 | | | 4,840 | | | | 4,946,093 | |
| | |
New York Transportation Development Corp., (Delta Air Lines, Inc. - LaGuardia Airport Terminals C&D Redevelopment), (AMT), 4.00%, 10/1/30 | | | 12,610 | | | | 14,755,213 | |
| | |
| | | | | | | $ | 21,971,666 | |
|
| Insured-Bond Bank — 0.1% | |
| | |
Puerto Rico Municipal Finance Agency, (AGM), 5.00%, 8/1/27 | | $ | 700 | | | $ | 704,886 | |
| | |
| | | | | | | $ | 704,886 | |
|
| Insured-Education — 2.6% | |
| | |
Massachusetts College Building Authority, (AGC), 5.50%, 5/1/39 | | $ | 700 | | | $ | 1,028,748 | |
| | |
Massachusetts Development Finance Agency, (Boston University), (AGC), 6.00%, 5/15/59 | | | 1,105 | | | | 1,487,452 | |
| | |
Massachusetts Development Finance Agency, (College of the Holy Cross): | | | | | | | | |
| | |
(AMBAC), 5.25%, 9/1/32(1) | | | 750 | | | | 1,039,957 | |
| | |
(AMBAC), 5.25%, 9/1/32 | | | 15,900 | | | | 22,047,099 | |
| | |
| | | | | | | $ | 25,603,256 | |
|
| Insured-Electric Utilities — 1.6% | |
| | |
Chelan County Public Utility District No. 1, WA, (Columbia River), (NPFG), 0.00%, 6/1/23 | | $ | 6,335 | | | $ | 6,299,587 | |
| | |
Cleveland, OH, Public Power System Revenue: | | | | | | | | |
| | |
(NPFG), 0.00%, 11/15/27 | | | 2,750 | | | | 2,531,760 | |
| | |
(NPFG), 0.00%, 11/15/38 | | | 1,000 | | | | 641,570 | |
| | |
Ohio Municipal Electric Generation Agency, (NPFG), 0.00%, 2/15/27 | | | 5,000 | | | | 4,660,850 | |
| | | | |
| | 22 | | See Notes to Financial Statements. |
Eaton Vance
Municipal Bond Fund
September 30, 2021
Portfolio of Investments — continued
| | | | | | | | |
| Security | | Principal
Amount
(000’s omitted) | | | Value | |
|
| Insured-Electric Utilities (continued) | |
| | |
Puerto Rico Electric Power Authority: | | | | | | | | |
| | |
(NPFG), 5.25%, 7/1/23 | | $ | 1,095 | | | $ | 1,138,888 | |
| | |
(NPFG), 5.25%, 7/1/34 | | | 375 | | | | 408,697 | |
| | |
| | | | | | | $ | 15,681,352 | |
|
| Insured-Escrowed / Prerefunded — 2.5% | |
| | |
Bay City Brownfield Redevelopment Authority, MI, (BAM), Prerefunded to 10/1/23, 5.375%, 10/1/38 | | $ | 500 | | | $ | 550,875 | |
| | |
Kane, Cook and DuPage Counties School District No. 46, IL, (AMBAC), Escrowed to Maturity, 0.00%, 1/1/22 | | | 13,145 | | | | 13,139,216 | |
| | |
Livonia Public Schools, MI, (AGM), Prerefunded to 5/1/23, 5.00%, 5/1/43 | | | 750 | | | | 806,700 | |
| | |
Louisiana Energy and Power Authority, (AGM), Prerefunded to 6/1/23, 5.25%, 6/1/38 | | | 5,640 | | | | 6,102,424 | |
| | |
Massachusetts College Building Authority, (NPFG), Escrowed to Maturity, 0.00%, 5/1/26 | | | 1,600 | | | | 1,536,992 | |
| | |
Michigan House of Representatives, (AMBAC), Escrowed to Maturity, 0.00%, 8/15/23 | | | 2,615 | | | | 2,595,570 | |
| | |
Westland Tax Increment Finance Authority, MI, (BAM), Prerefunded to 4/1/23, 5.25%, 4/1/34 | | | 500 | | | | 537,275 | |
| | |
| | | | | | | $ | 25,269,052 | |
|
| Insured-General Obligations — 7.7% | |
| | |
Chicago Park District, IL, (BAM), 5.00%, 1/1/39(1) | | $ | 13,600 | | | $ | 14,640,128 | |
| | |
Cincinnati City School District, OH, (AGM), (FGIC), 5.25%, 12/1/30 | | | 4,500 | | | | 6,070,185 | |
| | |
Clark County, NV, (AMBAC), 2.50%, 11/1/36 | | | 11,845 | | | | 11,857,319 | |
| | |
Erie School District, PA, (AMBAC), 0.00%, 9/1/30 | | | 1,000 | | | | 839,480 | |
| | |
Irvington Township, NJ, (AGM), 0.00%, 7/15/26 | | | 4,165 | | | | 3,918,349 | |
| | |
Kane, Cook and DuPage Counties School District No. 46, IL, (AMBAC), 0.00%, 1/1/22 | | | 16,605 | | | | 16,587,398 | |
| | |
Massachusetts, (AMBAC), 5.50%, 8/1/30 | | | 1,900 | | | | 2,590,726 | |
| | |
McKeesport School District, PA, (NPFG), 0.00%, 10/1/21 | | | 2,555 | | | | 2,555,000 | |
| | |
Nassau County, NY, (AGM), 5.00%, 4/1/49(1) | | | 11,600 | | | | 14,160,352 | |
| | |
Plain School District, OH, (NPFG), 0.00%, 12/1/27 | | | 2,400 | | | | 2,162,424 | |
| | |
Shaler Area School District, PA, (XLCA), 0.00%, 9/1/33 | | | 2,550 | | | | 1,986,450 | |
| | |
| | | | | | | $ | 77,367,811 | |
| | | | | | | | |
| Security | | Principal
Amount
(000’s omitted) | | | Value | |
|
| Insured-Hospital — 0.0%(2) | |
| | |
Allegheny County Hospital Development Authority, PA, (UPMC Health System), (NPFG), 6.00%, 7/1/24 | | $ | 250 | | | $ | 288,370 | |
| | |
| | | | | | | $ | 288,370 | |
|
| Insured-Housing — 0.1% | |
| | |
California Municipal Finance Authority, (CHF-Davis II, LLC - Orchard Park Student Housing), Green Bonds: | | | | | | | | |
| | |
(BAM), 3.00%, 5/15/51 | | $ | 265 | | | $ | 276,652 | |
| | |
(BAM), 4.00%, 5/15/46 | | | 265 | | | | 307,180 | |
| | |
| | | | | | | $ | 583,832 | |
|
| Insured-Lease Revenue / Certificates of Participation — 0.3% | |
| | |
Essex County Improvement Authority, NJ, (NPFG), 5.50%, 10/1/30 | | $ | 2,000 | | | $ | 2,757,080 | |
| | |
New Jersey Economic Development Authority, (School Facilities Construction), (NPFG), 5.50%, 9/1/28 | | | 500 | | | | 648,875 | |
| | |
| | | | | | | $ | 3,405,955 | |
|
| Insured-Other Revenue — 1.6% | |
| | |
Harris County-Houston Sports Authority, TX, (AGM), (NPFG), 0.00%, 11/15/34 | | $ | 19,335 | | | $ | 11,798,410 | |
| | |
New York City Industrial Development Agency, NY, (Yankee Stadium): | | | | | | | | |
| | |
(AGM), 3.00%, 3/1/36 | | | 1,110 | | | | 1,207,869 | |
| | |
(AGM), 3.00%, 3/1/49 | | | 2,420 | | | | 2,545,066 | |
| | |
| | | | | | | $ | 15,551,345 | |
|
| Insured-Special Tax Revenue — 6.0% | |
| | |
Garden State Preservation Trust, NJ, (AGM), 0.00%, 11/1/21 | | $ | 1,000 | | | $ | 999,640 | |
| | |
Hamilton County, OH, Sales Tax Revenue: | | | | | | | | |
| | |
(AMBAC), 0.00%, 12/1/23 | | | 1,245 | | | | 1,229,052 | |
| | |
(AMBAC), 0.00%, 12/1/24 | | | 3,665 | | | | 3,576,527 | |
| | |
Houston, TX, Hotel Occupancy Tax Revenue, (AMBAC), 0.00%, 9/1/24 | | | 18,035 | | | | 17,583,945 | |
| | |
Massachusetts, Dedicated Tax Revenue, (NPFG), 5.50%, 1/1/29 | | | 750 | | | | 969,292 | |
| | |
Miami-Dade County, FL, Professional Sports Franchise Facilities, (AGC), 7.00%, 10/1/39 | | | 18,000 | | | | 25,771,140 | |
| | | | |
| | 23 | | See Notes to Financial Statements. |
Eaton Vance
Municipal Bond Fund
September 30, 2021
Portfolio of Investments — continued
| | | | | | | | |
| Security | | Principal
Amount
(000’s omitted) | | | Value | |
|
| Insured-Special Tax Revenue (continued) | |
| | |
New Jersey Economic Development Authority, (Motor Vehicle Surcharges): | | | | | | | | |
| | |
(AGC), 0.00%, 7/1/26 | | $ | 420 | | | $ | 399,361 | |
| | |
(AGC), 0.00%, 7/1/27 | | | 1,120 | | | | 1,044,064 | |
| | |
Pennsylvania Turnpike Commission, (AGM), 5.25%, 7/15/30 | | | 1,105 | | | | 1,479,020 | |
| | |
Reno, NV, Capital Improvement Revenue, (AGM), 4.00%, 6/1/43 | | | 6,000 | | | | 6,674,100 | |
| | |
| | | | | | | $ | 59,726,141 | |
|
| Insured-Transportation — 6.9% | |
| | |
Chicago, IL, (O’Hare International Airport): | | | | | | | | |
| | |
(AGM), 5.00%, 1/1/28 | | $ | 2,500 | | | $ | 2,641,975 | |
| | |
(AGM), 5.00%, 1/1/29 | | | 1,260 | | | | 1,331,555 | |
| | |
(AGM), 5.125%, 1/1/30 | | | 2,200 | | | | 2,328,348 | |
| | |
(AGM), 5.125%, 1/1/31 | | | 1,750 | | | | 1,852,095 | |
| | |
(AGM), 5.25%, 1/1/32 | | | 1,115 | | | | 1,181,777 | |
| | |
(AGM), 5.25%, 1/1/33 | | | 1,150 | | | | 1,218,126 | |
| | |
E-470 Public Highway Authority, CO: | | | | | | | | |
| | |
(NPFG), 0.00%, 9/1/22 | | | 7,800 | | | | 7,779,252 | |
| | |
(NPFG), 0.00%, 9/1/39 | | | 25,000 | | | | 11,991,250 | |
| | |
Metropolitan Transportation Authority, NY, Green Bonds, (AGM), 4.00%, 11/15/46 | | | 5,770 | | | | 6,618,075 | |
| | |
New Jersey Turnpike Authority, (AGM), (BHAC), 5.25%, 1/1/29 | | | 1,000 | | | | 1,299,240 | |
| | |
Port Palm Beach District, FL: | | | | | | | | |
| | |
(XLCA), 0.00%, 9/1/24 | | | 1,605 | | | | 1,540,174 | |
| | |
(XLCA), 0.00%, 9/1/25 | | | 1,950 | | | | 1,829,529 | |
| | |
(XLCA), 0.00%, 9/1/26 | | | 1,000 | | | | 916,300 | |
| | |
Puerto Rico Highway and Transportation Authority: | | | | | | | | |
| | |
(AGC), 5.25%, 7/1/41 | | | 875 | | | | 966,210 | |
| | |
(AGM), 5.00%, 7/1/32 | | | 475 | | | | 478,316 | |
| | |
San Joaquin Hills Transportation Corridor Agency, CA, (NPFG), 0.00%, 1/15/25 | | | 26,215 | | | | 25,401,024 | |
| | |
| | | | | | | $ | 69,373,246 | |
|
| Insured-Water and Sewer — 4.6% | |
| | |
Chicago, IL, Wastewater Transmission Revenue, (NPFG), 0.00%, 1/1/23 | | $ | 13,670 | | | $ | 13,588,937 | |
| | |
DeKalb County, GA, Water and Sewerage Revenue, (AGM), 5.25%, 10/1/32(1) | | | 10,000 | | | | 12,180,600 | |
| | |
Erie Sewer Authority, PA, (AMBAC), 0.00%, 12/1/26 | | | 1,920 | | | | 1,756,397 | |
| | | | | | | | |
| Security | | Principal
Amount
(000’s omitted) | | | Value | |
|
| Insured-Water and Sewer (continued) | |
| | |
Massachusetts Water Resources Authority: | | | | | | | | |
| | |
(AGM), 5.25%, 8/1/35 | | $ | 1,000 | | | $ | 1,490,870 | |
| | |
(AGM), 5.25%, 8/1/38 | | | 1,070 | | | | 1,641,755 | |
| | |
Michigan Finance Authority, (Detroit Water and Sewerage Department): | | | | | | | | |
| | |
(AGM), 5.00%, 7/1/31 | | | 1,500 | | | | 1,682,760 | |
| | |
(AGM), 5.00%, 7/1/32 | | | 2,845 | | | | 3,189,956 | |
| | |
(AGM), 5.00%, 7/1/33 | | | 2,435 | | | | 2,728,831 | |
| | |
(AGM), 5.00%, 7/1/35 | | | 2,970 | | | | 3,322,331 | |
| | |
(AGM), 5.00%, 7/1/37 | | | 2,435 | | | | 2,718,921 | |
| | |
Middlesex County Improvement Authority, NJ, (Perth Amboy), (AMBAC), 0.00%, 9/1/24 | | | 2,150 | | | | 2,101,690 | |
| | |
| | | | | | | $ | 46,403,048 | |
|
| Lease Revenue / Certificates of Participation — 2.6% | |
| | |
Michigan State Building Authority, 5.00%, 10/15/51(1) | | $ | 2,200 | | | $ | 2,555,982 | |
| | |
North Carolina, Limited Obligation Bonds, 5.00%, 5/1/26(1) | | | 21,250 | | | | 23,795,963 | |
| | |
| | | | | | | $ | 26,351,945 | |
|
| Senior Living / Life Care — 2.3% | |
| | |
California Municipal Finance Authority, (HumanGood California Obligated Group), 3.00%, 10/1/46 | | $ | 4,500 | | | $ | 4,666,455 | |
| | |
California Public Finance Authority, (Enso Village), Green Bonds: | | | | | | | | |
| | |
3.125%, 5/15/29(3) | | | 410 | | | | 415,572 | |
| | |
5.00%, 11/15/46(3) | | | 400 | | | | 458,812 | |
| | |
Clackamas County Hospital Facility Authority, OR, (Rose Villa): | | | | | | | | |
| | |
5.125%, 11/15/40 | | | 240 | | | | 264,922 | |
| | |
5.25%, 11/15/50 | | | 160 | | | | 176,397 | |
| | |
Florida Development Finance Corp., (Mayflower Retirement Community): | | | | | | | | |
| | |
4.00%, 6/1/36(3) | | | 1,000 | | | | 1,130,130 | |
| | |
4.00%, 6/1/46(3) | | | 980 | | | | 1,086,193 | |
| | |
Franklin County, OH, (Friendship Village of Dublin), 5.00%, 11/15/44 | | | 525 | | | | 572,638 | |
| | |
Iowa Finance Authority, (Lifespace Communities, Inc.), 5.00%, 5/15/55 | | | 2,265 | | | | 2,621,239 | |
| | |
Massachusetts Development Finance Agency, (NewBridge on the Charles, Inc.), 5.00%, 10/1/57(3) | | | 310 | | | | 336,269 | |
| | |
Multnomah County Hospital Facilities Authority, OR, (Terwilliger Plaza), 4.00%, 12/1/51 | | | 4,355 | | | | 4,815,193 | |
| | | | |
| | 24 | | See Notes to Financial Statements. |
Eaton Vance
Municipal Bond Fund
September 30, 2021
Portfolio of Investments — continued
| | | | | | | | |
| Security | | Principal
Amount
(000’s omitted) | | | Value | |
|
| Senior Living / Life Care (continued) | |
| | |
New Hope Cultural Education Facilities Finance Corp., TX, (Westminster): | | | | | | | | |
| | |
4.00%, 11/1/49 | | $ | 535 | | | $ | 602,212 | |
| | |
4.00%, 11/1/55 | | | 750 | | | | 840,097 | |
| | |
New Jersey Economic Development Authority, (United Methodist Homes of New Jersey), 5.00%, 7/1/34 | | | 675 | | | | 704,383 | |
| | |
North Carolina Medical Care Commission, (Pennybyrn at Maryfield), 5.00%, 10/1/50 | | | 1,000 | | | | 1,119,300 | |
| | |
Palm Beach County Health Facilities Authority, FL, (Lifespace Communities, Inc.), 5.00%, 5/15/53 | | | 2,690 | | | | 3,123,063 | |
| | |
South Carolina Jobs-Economic Development Authority, (Kiawah Life Plan Village, Inc.), 8.75%, 7/1/25(3) | | | 330 | | | | 333,722 | |
| | |
Warren County, OH, (Otterbein Homes Obligated Group), 5.75%, 7/1/33 | | | 220 | | | | 236,441 | |
| | |
| | | | | | | $ | 23,503,038 | |
|
| Special Tax Revenue — 19.8% | |
| | |
Central Puget Sound Regional Transit Authority, WA, Sales and Use Tax Revenue, Green Bonds, Prerefunded to 11/1/25, 5.00%, 11/1/30(1) | | $ | 14,425 | | | $ | 16,949,231 | |
| | |
Central Puget Sound Regional Transit Authority, WA, Sales Tax and Motor Vehicle Excise Tax Revenue, Green Bonds, 5.00%, 11/1/41(1) | | | 10,000 | | | | 11,886,000 | |
| | |
Cleveland, OH, Income Tax Revenue: | | | | | | | | |
| | |
5.00%, 10/1/39(1) | | | 450 | | | | 551,264 | |
| | |
5.00%, 10/1/43(1) | | | 1,800 | | | | 2,188,764 | |
| | |
Connecticut, Special Tax Obligation, (Transportation Infrastructure), 5.00%, 1/1/31(1) | | | 20,000 | | | | 21,117,800 | |
| | |
Denver City and County, CO, Dedicated Tax Revenue, 5.00%, 8/1/41(1) | | | 10,000 | | | | 11,746,800 | |
| | |
Franklin County, OH, Sales Tax Revenue: | | | | | | | | |
| | |
5.00%, 6/1/38(1) | | | 1,100 | | | | 1,352,362 | |
| | |
5.00%, 6/1/43(1) | | | 1,100 | | | | 1,339,470 | |
| | |
Massachusetts Bay Transportation Authority, Sales Tax Revenue, 5.25%, 7/1/33 | | | 750 | | | | 1,023,682 | |
| | |
Massachusetts School Building Authority, Sales Tax Revenue: | | | | | | | | |
| | |
5.00%, 8/15/37(1) | | | 20,200 | | | | 23,473,006 | |
| | |
5.00%, 11/15/46(1) | | | 1,500 | | | | 1,797,735 | |
| | |
Massachusetts, (Rail Enhancement and Accelerated Bridge Programs), 5.00%, 6/1/47(1) | | | 2,000 | | | | 2,437,200 | |
| | |
New York City Transitional Finance Authority, NY,
Future Tax Revenue: | | | | | | |
| | |
4.00%, 8/1/37(1) | | | 10,000 | | | | 11,209,500 | |
| | |
4.00%, 2/1/38 | | | 5,000 | | | | 5,897,350 | |
| | | | | | | | |
| Security | | Principal
Amount
(000’s omitted) | | | Value | |
|
| Special Tax Revenue (continued) | |
| | |
New York City Transitional Finance Authority, NY,
Future Tax Revenue: (continued) | | | | | | |
| | |
4.00%, 8/1/39(1) | | $ | 5,000 | | | $ | 5,524,150 | |
| | |
4.00%, 5/1/42 | | | 3,120 | | | | 3,571,214 | |
| | |
5.00%, 2/1/37(1) | | | 20,000 | | | | 20,306,200 | |
| | |
New York Convention Center Development Corp., Hotel Occupancy Tax, 5.00%, 11/15/45(1) | | | 13,000 | | | | 15,017,600 | |
| | |
New York Dormitory Authority, Personal Income Tax Revenue, 5.00%, 6/15/31 | | | 10,000 | | | | 10,569,000 | |
| | |
New York Dormitory Authority, Sales Tax Revenue: | | | | | | | | |
| | |
4.00%, 3/15/46(1) | | | 14,000 | | | | 15,654,660 | |
| | |
5.00%, 3/15/43(1) | | | 6,000 | | | | 7,336,920 | |
| | |
New York State Urban Development Corp., Personal Income Tax Revenue, 4.00%, 3/15/45(1) | | | 2,800 | | | | 3,166,044 | |
| | |
Pennsylvania Turnpike Commission, Oil Franchise Tax Revenue, 5.25%, 12/1/44(1) | | | 3,750 | | | | 4,751,475 | |
| | |
| | | | | | | $ | 198,867,427 | |
|
| Transportation — 17.9% | |
| | |
Chicago, IL, (O’Hare International Airport): | | | | | | | | |
| | |
4.00%, 1/1/35 | | $ | 1,610 | | | $ | 1,897,272 | |
| | |
4.00%, 1/1/37 | | | 2,000 | | | | 2,339,160 | |
| | |
5.00%, 1/1/34 | | | 1,000 | | | | 1,139,380 | |
| | |
5.00%, 1/1/38 | | | 2,105 | | | | 2,453,651 | |
| | |
Dallas and Fort Worth, TX, (Dallas/Fort Worth International Airport): | | | | | | | | |
| | |
5.25%, 11/1/30 | | | 3,845 | | | | 4,231,576 | |
| | |
5.25%, 11/1/31 | | | 5,940 | | | | 6,534,594 | |
| | |
Delaware River and Bay Authority of Delaware and New Jersey, 4.00%, 1/1/44(1) | | | 8,850 | | | | 10,155,375 | |
| | |
Delaware River Joint Toll Bridge Commission of Pennsylvania and New Jersey: | | | | | | | | |
| | |
5.00%, 7/1/37(1) | | | 1,150 | | | | 1,384,761 | |
| | |
5.00%, 7/1/47(1) | | | 4,575 | | | | 5,416,480 | |
| | |
Illinois Toll Highway Authority: | | | | | | | | |
| | |
5.00%, 1/1/37(1) | | | 10,000 | | | | 11,677,100 | |
| | |
5.00%, 1/1/41(1) | | | 12,425 | | | | 14,641,496 | |
| | |
Kansas Department of Transportation, 5.00%, 9/1/35(1) | | | 10,000 | | | | 11,617,600 | |
| | |
Metropolitan Transportation Authority, NY, Green Bonds, 4.00%, 11/15/38 | | | 1,175 | | | | 1,326,246 | |
| | |
New Jersey Economic Development Authority, (Transit Transportation Project), 4.00%, 11/1/39 | | | 1,875 | | | | 2,151,956 | |
| | | | |
| | 25 | | See Notes to Financial Statements. |
Eaton Vance
Municipal Bond Fund
September 30, 2021
Portfolio of Investments — continued
| | | | | | | | |
| Security | | Principal
Amount
(000’s omitted) | | | Value | |
|
| Transportation (continued) | |
| | |
New Jersey Transportation Trust Fund Authority, (Transportation Program): | | | | | | | | |
| | |
5.00%, 6/15/38 | | $ | 130 | | | $ | 143,725 | |
| | |
5.00%, 6/15/44 | | | 2,740 | | | | 3,347,787 | |
| | |
New Jersey Transportation Trust Fund Authority, (Transportation System): | | | | | | | | |
| | |
5.00%, 12/15/24 | | | 10,000 | | | | 11,418,100 | |
| | |
5.25%, 12/15/23 | | | 1,000 | | | | 1,107,020 | |
| | |
New Jersey Turnpike Authority: | | | | | | | | |
| | |
4.00%, 1/1/51 | | | 2,495 | | | | 2,890,632 | |
| | |
5.00%, 1/1/48(1) | | | 10,000 | | | | 12,200,800 | |
| | |
New York Bridge Authority, 4.00%, 1/1/46 | | | 3,050 | | | | 3,585,458 | |
| | |
New York Liberty Development Corp., (4 World Trade Center), Prerefunded to 11/15/21, 5.00%, 11/15/31 | | | 1,070 | | | | 1,075,960 | |
| | |
Pennsylvania Turnpike Commission, 4.00%, 12/1/36 | | | 1,000 | | | | 1,193,310 | |
| | |
Port Authority of New York and New Jersey: | | | | | | | | |
| | |
4.00%, 9/1/43(1) | | | 14,000 | | | | 16,192,820 | |
| | |
5.00%, 12/1/34(1) | | | 16,400 | | | | 18,027,700 | |
| | |
5.00%, 10/15/35(1) | | | 2,675 | | | | 3,129,429 | |
| | |
5.00%, 10/15/42(1) | | | 3,750 | | | | 4,488,488 | |
| | |
Salt Lake City, UT, (Salt Lake City International Airport), (AMT), 5.00%, 7/1/46 | | | 10,000 | | | | 12,475,000 | |
| | |
Texas Private Activity Bond Surface Transportation Corp., (North Tarrant Express Segment 3C), (AMT), 5.00%, 6/30/58 | | | 8,165 | | | | 9,776,934 | |
| | |
Texas Transportation Commission, (Central Texas Turnpike System), 5.00%, 8/15/42 | | | 1,765 | | | | 1,974,541 | |
| | |
| | | | | | | $ | 179,994,351 | |
|
| Water and Sewer — 13.3% | |
| | |
Atlanta, GA, Water and Wastewater Revenue: | | | | | | | | |
| | |
5.00%, 11/1/43(1) | | $ | 3,750 | | | $ | 4,585,800 | |
| | |
5.00%, 11/1/47(1) | | | 5,900 | | | | 7,213,281 | |
| | |
Central Valley Water Reclamation Facility, CA, Green Bonds, 4.00%, 3/1/47 | | | 6,305 | | | | 7,392,802 | |
| | |
Charleston, SC, Waterworks and Sewer Revenue, Prerefunded to 1/1/25, 5.00%, 1/1/45(1) | | | 25,000 | | | | 28,734,750 | |
| | |
Dallas, TX, Waterworks and Sewer System Revenue, 5.00%, 10/1/41(1) | | | 15,000 | | | | 17,865,600 | |
| | |
East Baton Rouge Sewerage Commission, LA, 4.00%, 2/1/45(1) | | | 10,000 | | | | 11,502,800 | |
| | |
Grand Rapids, MI, Sanitary Sewer System Revenue, 5.00%, 1/1/43(1) | | | 2,500 | | | | 2,990,425 | |
| | | | | | | | |
| Security | | Principal
Amount
(000’s omitted) | | | Value | |
|
| Water and Sewer (continued) | |
| | |
Massachusetts Water Resources Authority, Green Bonds, 5.00%, 8/1/40(1) | | $ | 2,000 | | | $ | 2,382,660 | |
| | |
Metropolitan St. Louis Sewer District, MO: | | | | | | | | |
| | |
5.00%, 5/1/35(1) | | | 8,750 | | | | 10,049,025 | |
| | |
5.00%, 5/1/36(1) | | | 7,925 | | | | 9,096,156 | |
| | |
New York City Municipal Water Finance Authority, NY, 5.00%, 6/15/31 | | | 10,000 | | | | 10,336,000 | |
| | |
Port Huron, MI, Water Supply System, 5.25%, 10/1/31 | | | 250 | | | | 250,925 | |
| | |
Texas Water Development Board: | | | | | | | | |
| | |
4.00%, 10/15/47(1) | | | 2,900 | | | | 3,321,776 | |
| | |
5.00%, 10/15/40(1) | | | 15,500 | | | | 18,139,960 | |
| | |
| | | | | | | $ | 133,861,960 | |
| |
Total Tax-Exempt Municipal Obligations — 160.6%
(identified cost $1,466,107,144) | | | $ | 1,611,795,882 | |
| |
| Taxable Municipal Obligations — 1.9% | | | | | |
| Security | | Principal
Amount
(000’s omitted) | | | Value | |
|
| General Obligations — 0.6% | |
| | |
Campbell Union High School District, CA, 2.312%, 8/1/35 | | $ | 5,135 | | | $ | 5,104,652 | |
| | |
Cecil County, MD, 2.55%, 11/1/43 | | | 995 | | | | 980,642 | |
| | |
| | | | | | | $ | 6,085,294 | |
|
| Insured-General Obligations — 0.8% | |
| | |
Bureau County Township High School District No. 502, IL, (BAM), 2.829%, 12/1/38 | | $ | 2,665 | | | $ | 2,668,891 | |
| | |
Elmwood Park, IL, (AGM), 2.875%, 12/1/41 | | | 5,000 | | | | 4,920,850 | |
| | |
| | | | | | | $ | 7,589,741 | |
|
| Insured-Special Tax Revenue — 0.2% | |
| | |
Bexar County, TX, Venue Project Revenue, (AGM), 2.734%, 8/15/36 | | $ | 2,450 | | | $ | 2,415,455 | |
| | |
| | | | | | | $ | 2,415,455 | |
| | | | |
| | 26 | | See Notes to Financial Statements. |
Eaton Vance
Municipal Bond Fund
September 30, 2021
Portfolio of Investments — continued
| | | | | | | | |
| Security | | Principal
Amount
(000’s omitted) | | | Value | |
|
| Water and Sewer — 0.3% | |
| | |
Henrico County, VA, Water and Sewer System Revenue, 2.50%, 5/1/42 | | $ | 3,605 | | | $ | 3,543,643 | |
| | |
| | | | | | | $ | 3,543,643 | |
| |
Total Taxable Municipal Obligations — 1.9%
(identified cost $19,714,940) | | | $ | 19,634,133 | |
| |
Total Investments — 164.3%
(identified cost $1,503,395,289) | | | $ | 1,649,658,708 | |
| |
Other Assets, Less Liabilities — (64.3)% | | | $ | (645,836,738 | ) |
| | |
Net Assets — 100.0% | | | | | | $ | 1,003,821,970 | |
The percentage shown for each investment category in the Portfolio of Investments is based on net assets.
At September 30, 2021, the concentration of the Fund’s investments in the various states and territories, determined as a percentage of total investments, is as follows:
| | | | |
| |
| New York | | | 16.5% | |
| |
| Illinois | | | 11.4% | |
| |
| Others, representing less than 10% individually | | | 72.1% | |
The Fund invests primarily in debt securities issued by municipalities. The ability of the issuers of the debt securities to meet their obligations may be affected by economic developments in a specific industry or municipality. At September 30, 2021, 21.2% of total investments are backed by bond insurance of various financial institutions and financial guaranty assurance agencies. The aggregate percentage insured by an individual financial institution or financial guaranty assurance agency ranged from 0.1% to 6.8% of total investments.
| (1) | Security represents the municipal bond held by a trust that issues residual interest bonds (see Note 1G). |
| (2) | Amount is less than 0.05%. |
| (3) | Security exempt from registration under Rule 144A of the Securities Act of 1933, as amended. These securities may be sold in certain transactions in reliance on an exemption from registration (normally to qualified institutional buyers). At September 30, 2021, the aggregate value of these securities is $3,760,698 or 0.4% of the Fund’s net assets. |
Abbreviations:
| | | | |
| | |
| AGC | | – | | Assured Guaranty Corp. |
| | |
| AGM | | – | | Assured Guaranty Municipal Corp. |
| | |
| AMBAC | | – | | AMBAC Financial Group, Inc. |
| | |
| AMT | | – | | Interest earned from these securities may be considered a tax preference item for purposes of the Federal Alternative Minimum Tax. |
| | |
| BAM | | – | | Build America Mutual Assurance Co. |
| | |
| BHAC | | – | | Berkshire Hathaway Assurance Corp. |
| | |
| FGIC | | – | | Financial Guaranty Insurance Company |
| | |
| NPFG | | – | | National Public Finance Guarantee Corp. |
| | |
| PSF | | – | | Permanent School Fund |
| | |
| XLCA | | – | | XL Capital Assurance, Inc. |
| | | | |
| | 27 | | See Notes to Financial Statements. |
Eaton Vance
California Municipal Bond Fund
September 30, 2021
Portfolio of Investments
| | | | | | | | |
| Tax-Exempt Mortgage-Backed Securities — 0.6% | |
| Security | | Principal
Amount
(000’s omitted) | | | Value | |
|
| Housing — 0.6% | |
| | |
California Housing Finance Agency, Municipal Certificates, Series 2021-1, Class A, 3.50%, 11/20/35 | | $ | 1,564 | | | $ | 1,815,313 | |
| |
Total Tax-Exempt Mortgage-Backed Securities — 0.6%
(identified cost $1,758,679) | | | $ | 1,815,313 | |
|
| Tax-Exempt Municipal Obligations — 155.9% | |
| Security | | Principal
Amount
(000’s omitted) | | | Value | |
|
| Education — 13.2% | |
| | |
California Educational Facilities Authority, (Loyola Marymount University), Green Bonds: | | | | | | | | |
| | |
5.00%, 10/1/43 | | $ | 2,105 | | | $ | 2,541,619 | |
| | |
5.00%, 10/1/48 | | | 3,000 | | | | 3,599,550 | |
| | |
California Educational Facilities Authority, (Pepperdine University), 5.00%, 10/1/46(1) | | | 6,600 | | | | 7,696,458 | |
| | |
California Educational Facilities Authority, (University of the Pacific), 5.00%, 11/1/30 | | | 1,790 | | | | 1,796,534 | |
| | |
California State University, 5.00%, 11/1/41(1) | | | 9,550 | | | | 11,299,942 | |
| | |
University of California, 5.00%, 5/15/46(1) | | | 12,050 | | | | 14,231,170 | |
| | |
| | | | | | | $ | 41,165,273 | |
|
| Electric Utilities — 0.8% | |
| | |
Los Angeles Department of Water and Power, CA, Power System Revenue, 5.00%, 7/1/42(1) | | $ | 2,000 | | | $ | 2,444,240 | |
| | |
| | | | | | | $ | 2,444,240 | |
|
| Escrowed / Prerefunded — 28.8% | |
| | |
Beverly Hills Public Financing Authority, CA, Water Revenue, Prerefunded to 6/1/22, 5.00%, 6/1/37(1) | | $ | 5,725 | | | $ | 5,909,517 | |
| | |
Burbank Unified School District, CA, (Election of 2013), Prerefunded to 8/1/23, 4.00%, 8/1/31(1) | | | 6,900 | | | | 7,382,586 | |
| | |
California Educational Facilities Authority, (Harvey Mudd College): | | | | | | | | |
| | |
Prerefunded to 12/1/21, 5.25%, 12/1/31 | | | 645 | | | | 650,276 | |
| | |
Prerefunded to 12/1/21, 5.25%, 12/1/36 | | | 1,100 | | | | 1,108,998 | |
| | |
California Health Facilities Financing Authority, (Sutter Health): | | | | | | | | |
| | |
Prerefunded to 11/15/26, 5.00%, 11/15/46(1) | | | 1,225 | | | | 1,496,730 | |
| | |
Prerefunded to 11/15/26, 5.00%, 11/15/46 | | | 3,265 | | | | 3,989,242 | |
| | | | | | | | |
| Security | | Principal
Amount
(000’s omitted) | | | Value | |
|
| Escrowed / Prerefunded (continued) | |
| | |
Contra Costa Community College District, CA, (Election of 2006), Prerefunded to 8/1/23, 5.00%, 8/1/38(1) | | $ | 9,750 | | | $ | 10,609,560 | |
| | |
Palomar Community College District, CA, Prerefunded to 8/1/25, 5.00%, 8/1/44(1) | | | 10,000 | | | | 11,752,600 | |
| | |
Rancho California Water District Financing Authority, Prerefunded to 8/15/26, 5.00%, 8/1/46(1) | | | 2,500 | | | | 3,038,550 | |
| | |
San Bernardino Community College District, CA, Prerefunded to 8/1/23, 4.00%, 8/1/27(1) | | | 5,775 | | | | 6,178,903 | |
| | |
San Francisco Bay Area Rapid Transit District, CA, Sales Tax Revenue, Prerefunded to 7/1/22, 5.00%, 7/1/36(1) | | | 1,690 | | | | 1,750,722 | |
| | |
San Francisco City and County Public Utilities Commission, CA, Water Revenue, Green Bonds, Prerefunded to 11/1/24, 5.00%, 11/1/45(1) | | | 4,000 | | | | 4,573,640 | |
| | |
San Jose-Evergreen Community College District, CA, (Election of 2010), Prerefunded to 8/1/22, 5.00%, 8/1/37(1) | | | 4,975 | | | | 5,175,940 | |
| | |
Santa Monica Community College District, CA, (Election of 2008), Prerefunded to 8/1/24, 5.00%, 8/1/44(1) | | | 7,500 | | | | 8,504,475 | |
| | |
Torrance Unified School District, CA, (Election of 2008), Prerefunded to 8/1/23, 5.00%, 8/1/35 | | | 7,500 | | | | 8,161,200 | |
| | |
Ventura County Community College District, CA, Prerefunded to 8/1/25, 5.00%, 8/1/30(1) | | | 8,000 | | | | 9,402,080 | |
| | |
| | | | | | | $ | 89,685,019 | |
|
| General Obligations — 41.8% | |
| | |
Alameda City Unified School District, CA, (Election of 2014), 5.00%, 8/1/42(1) | | $ | 1,675 | | | $ | 2,039,597 | |
| | |
Albany Unified School District, CA, (Election of 2016), 4.00%, 8/1/46 | | | 3,950 | | | | 4,616,839 | |
| | |
Berryessa Union School District, CA, (Election of 2014), 5.00%, 8/1/40(1) | | | 7,450 | | | | 8,972,184 | |
| | |
Brisbane School District, CA, (Election of 2020), 3.00%, 8/1/49 | | | 1,760 | | | | 1,852,981 | |
| | |
Cabrillo Unified School District, CA, (Election of 2018), 5.00%, 8/1/48 | | | 5,000 | | | | 5,927,500 | |
| | |
California, 4.00%, 3/1/46(1) | | | 8,000 | | | | 9,328,400 | |
| | |
Campbell Union High School District, CA, (Election of 2016), Prerefunded to 8/1/26, 5.00%, 8/1/36(1) | | | 11,250 | | | | 13,654,350 | |
| | |
Chino Valley Unified School District, CA, (Election of 2016), 5.00%, 8/1/55(1) | | | 10,000 | | | | 12,616,100 | |
| | |
Desert Community College District, CA, 5.00%, 8/1/36(1) | | | 7,500 | | | | 8,875,950 | |
| | |
El Camino Community College District, CA, (Election of 2012), 5.00%, 8/1/48(1) | | | 10,000 | | | | 12,356,900 | |
| | | | |
| | 28 | | See Notes to Financial Statements. |
Eaton Vance
California Municipal Bond Fund
September 30, 2021
Portfolio of Investments — continued
| | | | | | | | |
| Security | | Principal
Amount
(000’s omitted) | | | Value | |
|
| General Obligations (continued) | |
| | |
Franklin-McKinley School District, CA, (Election of 2020), 4.00%, 8/1/49 | | $ | 1,000 | | | $ | 1,132,890 | |
| | |
Gilroy Unified School District, CA, (Election of 2016), 4.00%, 8/1/44 | | | 2,500 | | | | 2,908,100 | |
| | |
La Canada Unified School District, CA, (Election of 2017), 5.00%, 8/1/47(1) | | | 3,375 | | | | 4,170,386 | |
| | |
Long Beach Unified School District, CA, (Election of 2008), 5.00%, 8/1/41(1) | | | 1,500 | | | | 1,762,785 | |
| | |
Old Adobe Union School District, CA, (Election of 2018), 5.00%, 8/1/48 | | | 3,415 | | | | 4,013,274 | |
| | |
Oxnard Union High School District, CA, (Election of 2018), 5.00%, 8/1/42(1) | | | 3,000 | | | | 3,522,480 | |
| | |
Palo Alto, CA, (Election of 2008), 5.00%, 8/1/40 | | | 1,610 | | | | 1,615,699 | |
| | |
Perris Union High School District, CA, (Election of 2012), 3.00%, 9/1/45 | | | 1,750 | | | | 1,835,418 | |
| | |
Redding School District, CA, (Election of 2018), 5.00%, 8/1/48 | | | 2,645 | | | | 3,074,680 | |
| | |
Robla School District, CA, (Election of 2014), 3.00%, 8/1/53 | | | 500 | | | | 530,005 | |
| | |
San Bruno Park School District, CA, (Election of 2018), 5.00%, 8/1/48 | | | 2,500 | | | | 2,935,400 | |
| | |
San Diego Unified School District, CA, (Election of 2012), 5.00%, 7/1/47(1) | | | 4,000 | | | | 4,875,400 | |
| | |
San Jose Unified School District, CA, (Election of 2012), 4.00%, 8/1/42(1) | | | 12,000 | | | | 13,646,880 | |
| | |
Santa Rosa High School District, CA, (Election of 2014), 5.00%, 8/1/41 | | | 3,495 | | | | 4,118,054 | |
| | |
| | | | | | | $ | 130,382,252 | |
|
| Hospital — 14.0% | |
| | |
California Health Facilities Financing Authority, (Adventist Health System/West), 4.00%, 3/1/39 | | $ | 4,550 | | | $ | 5,017,922 | |
| | |
California Health Facilities Financing Authority, (City of Hope): | | | | | | | | |
| | |
4.00%, 11/15/45(1) | | | 5,000 | | | | 5,757,300 | |
| | |
5.00%, 11/15/32 | | | 2,130 | | | | 2,241,399 | |
| | |
5.00%, 11/15/35 | | | 3,040 | | | | 3,196,894 | |
| | |
California Health Facilities Financing Authority, (St. Joseph Health System): | | | | | | | | |
| | |
5.00%, 7/1/33 | | | 5,080 | | | | 5,495,138 | |
| | |
5.00%, 7/1/37 | | | 2,380 | | | | 2,572,756 | |
| | |
California Health Facilities Financing Authority, (Sutter Health): | | | | | | | | |
| | |
5.00%, 11/15/46(1) | | | 1,775 | | | | 2,113,617 | |
| | |
5.00%, 11/15/46 | | | 4,735 | | | | 5,638,296 | |
| | | | | | | | |
| Security | | Principal
Amount
(000’s omitted) | | | Value | |
|
| Hospital (continued) | |
| | |
California Public Finance Authority, (Sharp HealthCare): | | | | | | | | |
| | |
5.00%, 8/1/47(1) | | $ | 1,250 | | | $ | 1,504,600 | |
| | |
5.00%, 8/1/47 | | | 8,445 | | | | 10,165,078 | |
| | |
| | | | | | | $ | 43,703,000 | |
| | |
| Housing — 3.7% | | | | | | |
| | |
California Community Housing Agency, (Summit at Sausalito Apartments), 3.00%, 2/1/57(2) | | $ | 900 | | | $ | 852,903 | |
| | |
California Statewide Communities Development Authority, (University of California, Irvine East Campus Apartments, Phase IV-A-CHF-Irvine, LLC), 5.00%, 5/15/47 | | | 5,000 | | | | 5,903,300 | |
| | |
CSCDA Community Improvement Authority, CA, Essential Housing Revenue: | | | | | | | | |
| | |
2.80%, 3/1/47(2) | | | 300 | | | | 287,313 | |
| | |
3.00%, 12/1/56(2) | | | 295 | | | | 279,247 | |
| | |
Independent Cities Finance Authority, CA, (Castle Mobile Estates), 3.00%, 5/15/56 | | | 1,130 | | | | 1,156,578 | |
| | |
Independent Cities Finance Authority, CA, (Vista de Santa Barbara Mobilehome Park): | | | | | | | | |
| | |
3.00%, 9/15/46 | | | 925 | | | | 955,793 | |
| | |
3.00%, 9/15/56 | | | 1,980 | | | | 2,018,848 | |
| | |
| | | | | | | $ | 11,453,982 | |
|
| Insured-Electric Utilities — 2.4% | |
| | |
Puerto Rico Electric Power Authority, (NPFG), 5.25%, 7/1/34 | | $ | 3,740 | | | $ | 4,076,076 | |
| | |
Sacramento Municipal Utility District, CA, (AMBAC), (BHAC), 5.25%, 7/1/24 | | | 3,075 | | | | 3,347,630 | |
| | |
| | | | | | | $ | 7,423,706 | |
|
| Insured-General Obligations — 17.2% | |
| | |
Anderson Valley Unified School District, CA, (AGM), 3.00%, 8/1/35 | | $ | 500 | | | $ | 544,520 | |
| | |
Bellevue Union School District, CA, (Election of 2020), (AGM), 3.125%, 8/1/44 | | | 400 | | | | 424,452 | |
| | |
Central Unified School District, CA, (Election of 2020), (AGM), 3.00%, 8/1/44 | | | 3,750 | | | | 3,980,737 | |
| | |
Coalinga-Huron Recreation and Park District, CA, (Election of 2016): | | | | | | | | |
| | |
(BAM), 3.00%, 8/1/50 | | | 750 | | | | 779,430 | |
| | |
(BAM), 4.00%, 8/1/53 | | | 1,525 | | | | 1,724,577 | |
| | |
Cotati-Rohnert Park Unified School District, CA, (Election of 2016), (AGM), 5.00%, 8/1/44 | | | 3,500 | | | | 4,104,205 | |
| | | | |
| | 29 | | See Notes to Financial Statements. |
Eaton Vance
California Municipal Bond Fund
September 30, 2021
Portfolio of Investments — continued
| | | | | | | | |
| Security | | Principal
Amount
(000’s omitted) | | | Value | |
|
| Insured-General Obligations (continued) | |
| | |
Garvey School District, CA, (Election of 2016): | | | | | | | | |
| | |
(AGM), 5.00%, 8/1/45 | | $ | 2,440 | | | $ | 2,867,464 | |
| | |
(AGM), 5.00%, 8/1/48 | | | 1,610 | | | | 1,892,056 | |
| | |
Grass Valley School District, CA, (Election of 2018), (BAM), 5.00%, 8/1/45 | | | 3,000 | | | | 3,498,000 | |
| | |
McFarland Unified School District, CA, (Election of 2020), (BAM), 3.00%, 11/1/49 | | | 750 | | | | 775,972 | |
| | |
Mountain View School District, CA, (Election of 2016): | | | | | | | | |
| | |
(AGM), 4.00%, 8/1/49 | | | 1,000 | | | | 1,152,240 | |
| | |
(BAM), 5.00%, 8/1/42 | | | 1,145 | | | | 1,359,768 | |
| | |
(BAM), 5.00%, 8/1/45 | | | 1,520 | | | | 1,800,379 | |
| | |
Pomona Unified School District, CA, (Election of 2016), (BAM), 3.00%, 8/1/48 | | | 5,000 | | | | 5,328,600 | |
| | |
San Diego Unified School District, CA: | | | | | | | | |
| | |
(NPFG), 0.00%, 7/1/22 | | | 2,300 | | | | 2,297,148 | |
| | |
(NPFG), 0.00%, 7/1/23 | | | 5,000 | | | | 4,979,000 | |
| | |
San Mateo County Community College District, CA: | | | | | | | | |
| | |
(NPFG), 0.00%, 9/1/22 | | | 4,840 | | | | 4,831,046 | |
| | |
(NPFG), 0.00%, 9/1/23 | | | 4,365 | | | | 4,340,119 | |
| | |
(NPFG), 0.00%, 9/1/25 | | | 3,955 | | | | 3,862,216 | |
| | |
Union Elementary School District, CA, (Election of 1999), (NPFG), 0.00%, 9/1/22 | | | 3,200 | | | | 3,191,200 | |
| | |
| | | | | | | $ | 53,733,129 | |
|
| Insured-Transportation — 1.0% | |
| | |
San Joaquin Hills Transportation Corridor Agency, CA, (NPFG), 0.00%, 1/15/27 | | $ | 3,520 | | | $ | 3,264,624 | |
| | |
| | | | | | | $ | 3,264,624 | |
|
| Lease Revenue / Certificates of Participation — 1.1% | |
| | |
California Public Works Board, 5.00%, 11/1/38 | | $ | 3,045 | | | $ | 3,328,764 | |
| | |
| | | | | | | $ | 3,328,764 | |
|
| Senior Living / Life Care — 1.0% | |
| | |
California Municipal Finance Authority, (HumanGood California Obligated Group): | | | | | | | | |
| | |
3.00%, 10/1/46 | | $ | 1,000 | | | $ | 1,036,990 | |
| | |
4.00%, 10/1/46 | | | 1,500 | | | | 1,747,185 | |
| | |
California Public Finance Authority, (Enso Village), Green Bonds: | | | | | | | | |
| | |
2.375%, 11/15/28(2) | | | 105 | | | | 106,173 | |
| | |
5.00%, 11/15/46(2) | | | 150 | | | | 172,054 | |
| | |
| | | | | | | $ | 3,062,402 | |
| | | | | | | | |
| Security | | Principal
Amount
(000’s omitted) | | | Value | |
|
| Special Tax Revenue — 12.8% | |
| | |
Folsom Ranch Financing Authority, CA, (White Rock Springs Ranch): | | | | | | | | |
| | |
4.00%, 9/1/40 | | $ | 175 | | | $ | 193,814 | |
| | |
4.00%, 9/1/41 | | | 180 | | | | 198,974 | |
| | |
4.00%, 9/1/46 | | | 365 | | | | 402,690 | |
| | |
Jurupa Public Financing Authority, CA: | | | | | | | | |
| | |
5.00%, 9/1/30 | | | 625 | | | | 700,425 | |
| | |
5.00%, 9/1/32 | | | 625 | | | | 699,675 | |
| | |
Los Angeles County Metropolitan Transportation Authority, CA, Sales Tax Revenue, Green Bonds, 5.00%, 7/1/42(1) | | | 10,250 | | | | 12,450,162 | |
| | |
Ontario Community Facilities District No. 53, CA, (Tevelde Facilities), 4.00%, 9/1/51 | | | 1,325 | | | | 1,500,867 | |
| | |
Riverside County Transportation Commission, CA, Sales Tax Revenue, Prerefunded to 6/1/23, 5.25%, 6/1/39(1) | | | 6,285 | | | | 6,814,574 | |
| | |
San Bernardino County Transportation Authority, CA, Sales Tax Revenue, 5.25%, 3/1/40(1) | | | 10,375 | | | | 11,521,541 | |
| | |
San Francisco Bay Area Rapid Transit District, CA, Sales Tax Revenue, Prerefunded to 7/1/22, 5.00%, 7/1/36(1) | | | 4,560 | | | | 4,723,841 | |
| | |
San Luis Obispo Community Facilities District No. 2019-1, CA, (San Luis Ranch), 4.00%, 9/1/51 | | | 650 | | | | 732,687 | |
| | |
| | | | | | | $ | 39,939,250 | |
|
| Transportation — 4.7% | |
| | |
Long Beach, CA, Harbor Revenue, 5.00%, 5/15/42(1) | | $ | 7,500 | | | $ | 8,572,425 | |
| | |
San Francisco City and County Airport Commission, CA, (San Francisco International Airport), (AMT), 5.00%, 5/1/45 | | | 5,000 | | | | 6,084,450 | |
| | |
| | | | | | | $ | 14,656,875 | |
|
| Water and Sewer — 13.4% | |
| | |
Eastern Municipal Water District Financing Authority, CA, 5.25%, 7/1/42(1) | | $ | 9,000 | | | $ | 11,101,680 | |
| | |
Los Angeles Department of Water and Power, CA, Water System Revenue, 5.00%, 7/1/39(1) | | | 10,000 | | | | 11,215,500 | |
| | |
Los Angeles, CA, Wastewater System Revenue, 5.00%, 6/1/43(1) | | | 7,500 | | | | 8,065,950 | |
| | |
Orange County Sanitation District, CA, Wastewater Revenue, 5.00%, 2/1/35(1) | | | 10,000 | | | | 11,283,100 | |
| | |
| | | | | | | $ | 41,666,230 | |
| |
Total Tax-Exempt Municipal Obligations — 155.9%
(identified cost $449,921,966) | | | $ | 485,908,746 | |
| | | | |
| | 30 | | See Notes to Financial Statements. |
Eaton Vance
California Municipal Bond Fund
September 30, 2021
Portfolio of Investments — continued
| | | | | | | | |
| Taxable Municipal Obligations — 7.9% | |
| Security | | Principal
Amount
(000’s omitted) | | | Value | |
|
| Education — 1.7% | |
| | |
California Municipal Finance Authority, (Albert Einstein Academies), 3.75%, 8/1/31(2) | | $ | 1,345 | | | $ | 1,347,918 | |
| | |
California State University, 3.065%, 11/1/42 | | | 1,815 | | | | 1,844,294 | |
| | |
University of California, 3.071%, 5/15/51 | | | 2,000 | | | | 2,028,400 | |
| | |
| | | | | | | $ | 5,220,612 | |
|
| General Obligations — 2.1% | |
| | |
Marin Community College District, CA, 2.699%, 8/1/41 | | $ | 2,000 | | | $ | 1,982,340 | |
| | |
Monterey Peninsula Community College District, CA, (Election of 2020): | | | | | | | | |
| | |
2.861%, 8/1/46 | | | 1,000 | | | | 965,400 | |
| | |
2.951%, 8/1/51 | | | 1,400 | | | | 1,353,422 | |
| | |
Ohlone Community College District, CA, 2.443%, 8/1/35 | | | 535 | | | | 540,120 | |
| | |
Robla School District, CA, 2.602%, 8/1/40 | | | 615 | | | | 617,583 | |
| | |
Tustin Unified School District, CA, 2.649%, 8/1/42 | | | 1,125 | | | | 1,135,035 | |
| | |
| | | | | | | $ | 6,593,900 | |
|
| Housing — 0.3% | |
| | |
Independent Cities Finance Authority, CA, (Vista de Santa Barbara Mobilehome Park), 4.50%, 9/15/56 | | $ | 1,000 | | | $ | 973,000 | |
| | |
| | | | | | | $ | 973,000 | |
|
| Insured-General Obligations — 2.8% | |
| | |
Palmdale School District, CA, (AGM), 2.948%, 8/1/47 | | $ | 5,000 | | | $ | 4,971,450 | |
| | |
Sanger Unified School District, CA: | | | | | | | | |
| | |
(BAM), 2.734%, 8/1/42 | | | 2,500 | | | | 2,417,925 | |
| | |
(BAM), 2.834%, 8/1/44 | | | 1,250 | | | | 1,210,450 | |
| | |
| | | | | | | $ | 8,599,825 | |
|
| Other Revenue — 0.6% | |
| | |
Central Marin Police Authority, CA, 3.101%, 2/1/41 | | $ | 1,000 | | | $ | 1,012,070 | |
| | |
Corte Madera, CA, Pension Obligation Bonds, 3.257%, 6/1/45 | | | 940 | | | | 952,427 | |
| | |
| | | | | | | $ | 1,964,497 | |
| | | | | | | | |
| Security | | Principal
Amount
(000’s omitted) | | | Value | |
|
| Transportation — 0.4% | |
| | |
Los Angeles Department of Airports, CA, (Los Angeles International Airport), 1.963%, 5/15/33 | | $ | 675 | | | $ | 642,769 | |
| | |
San Jose, CA, Airport Revenue, 2.31%, 3/1/30 | | | 500 | | | | 505,065 | |
| | |
| | | | | | | $ | 1,147,834 | |
| |
Total Taxable Municipal Obligations — 7.9%
(identified cost $24,693,488) | | | $ | 24,499,668 | |
| |
Total Investments — 164.4%
(identified cost $476,374,133) | | | $ | 512,223,727 | |
| | |
Other Assets, Less Liabilities — (64.4)% | | | | | | $ | (200,588,593 | ) |
| | |
Net Assets — 100.0% | | | | | | $ | 311,635,134 | |
The percentage shown for each investment category in the Portfolio of Investments is based on net assets.
The Fund invests primarily in debt securities issued by California municipalities. The ability of the issuers of the debt securities to meet their obligations may be affected by economic developments in a specific industry or municipality. At September 30, 2021, 14.3% of total investments are backed by bond insurance of various financial institutions and financial guaranty assurance agencies. The aggregate percentage insured by an individual financial institution or financial guaranty assurance agency ranged from 0.7% to 6.0% of total investments.
| (1) | Security represents the municipal bond held by a trust that issues residual interest bonds (see Note 1G). |
| (2) | Security exempt from registration under Rule 144A of the Securities Act of 1933, as amended. These securities may be sold in certain transactions in reliance on an exemption from registration (normally to qualified institutional buyers). At September 30, 2021, the aggregate value of these securities is $3,045,608 or 1.0% of the Fund’s net assets. |
Abbreviations:
| | | | |
| | |
| AGM | | – | | Assured Guaranty Municipal Corp. |
| | |
| AMBAC | | – | | AMBAC Financial Group, Inc. |
| | |
| AMT | | – | | Interest earned from these securities may be considered a tax preference item for purposes of the Federal Alternative Minimum Tax. |
| | |
| BAM | | – | | Build America Mutual Assurance Co. |
| | |
| BHAC | | – | | Berkshire Hathaway Assurance Corp. |
| | |
| NPFG | | – | | National Public Finance Guarantee Corp. |
| | | | |
| | 31 | | See Notes to Financial Statements. |
Eaton Vance
New York Municipal Bond Fund
September 30, 2021
Portfolio of Investments
| | | | | | | | |
| Corporate Bonds — 0.6% | |
| Security | | Principal
Amount
(000’s omitted) | | | Value | |
|
| Hospital — 0.6% | |
| | |
Montefiore Obligated Group, 4.287%, 9/1/50 | | $ | 1,350 | | | $ | 1,406,298 | |
| |
Total Corporate Bonds — 0.6%
(identified cost $1,350,000) | | | $ | 1,406,298 | |
|
| Tax-Exempt Municipal Obligations — 150.5% | |
| Security | | Principal
Amount
(000’s omitted) | | | Value | |
|
| Education — 14.8% | |
| | |
Build NYC Resource Corp., NY, (Academic Leadership Charter School), 4.00%, 6/15/36 | | $ | 200 | | | $ | 225,774 | |
| | |
Hempstead Local Development Corp., NY, (Hofstra University), 3.00%, 7/1/51 | | | 3,000 | | | | 3,152,040 | |
| | |
Monroe County Industrial Development Corp., NY, (True North Rochester Preparatory Charter School): | | | | | | | | |
| | |
5.00%, 6/1/50(1) | | | 705 | | | | 817,927 | |
| | |
5.00%, 6/1/59(1) | | | 1,150 | | | | 1,326,605 | |
| | |
New York City Cultural Resources Trust, NY, (The Juilliard School), 5.00%, 1/1/38 | | | 600 | | | | 741,204 | |
| | |
New York Dormitory Authority, (Columbia University), 5.00%, 10/1/38(2) | | | 2,000 | | | | 2,481,540 | |
| | |
New York Dormitory Authority, (New York University): | | | | | | | | |
| | |
4.00%, 7/1/38 | | | 2,000 | | | | 2,413,060 | |
| | |
4.00%, 7/1/39 | | | 1,125 | | | | 1,353,499 | |
| | |
5.00%, 7/1/39(2) | | | 2,000 | | | | 2,484,040 | |
| | |
New York Dormitory Authority, (Rockefeller University): | | | | | | | | |
| | |
4.00%, 7/1/49(2) | | | 10,000 | | | | 11,690,500 | |
| | |
5.00%, 7/1/34 | | | 100 | | | | 103,481 | |
| | |
Onondaga County Cultural Resources Trust, NY, (Syracuse University), 4.00%, 12/1/47(2) | | | 7,000 | | | | 8,139,950 | |
| | |
Yonkers Economic Development Corp., NY,
(Lamartine/Warburton, LLC - Charter School of
Educational Excellence): | | | | | | |
| | |
5.00%, 10/15/39 | | | 395 | | | | 461,743 | |
| | |
5.00%, 10/15/49 | | | 80 | | | | 91,958 | |
| | |
5.00%, 10/15/54 | | | 120 | | | | 137,473 | |
| | |
| | | | | | | $ | 35,620,794 | |
| | | | | | | | |
| Security | | Principal
Amount
(000’s omitted) | | | Value | |
|
| Electric Utilities — 9.8% | |
| | |
Long Island Power Authority, NY, Electric System
Revenue: | | | | | | |
| | |
4.00%, 9/1/39 | | $ | 3,000 | | | $ | 3,579,720 | |
| | |
5.00%, 9/1/37 | | | 1,500 | | | | 1,879,215 | |
| | |
New York Power Authority: | | | | | | | | |
| | |
Green Bonds, 4.00%, 11/15/45 | | | 2,150 | | | | 2,512,619 | |
| | |
Green Bonds, 4.00%, 11/15/55(2) | | | 9,000 | | | | 10,407,780 | |
| | |
Utility Debt Securitization Authority, NY: | | | | | | | | |
| | |
5.00%, 12/15/33 | | | 2,895 | | | | 3,193,330 | |
| | |
5.00%, 12/15/36(2) | | | 1,675 | | | | 1,970,118 | |
| | |
| | | | | | | $ | 23,542,782 | |
|
| Escrowed / Prerefunded — 13.9% | |
| | |
Albany Municipal Water Finance Authority, NY: | | | | | | | | |
| | |
Prerefunded to 12/1/21, 5.00%, 12/1/26 | | $ | 755 | | | $ | 760,851 | |
| | |
Prerefunded to 12/1/21, 5.00%, 12/1/29 | | | 500 | | | | 503,875 | |
| | |
Geneva Development Corp., NY, (Hobart and William Smith Colleges): | | | | | | | | |
| | |
Prerefunded to 9/1/23, 5.00%, 9/1/30 | | | 200 | | | | 218,154 | |
| | |
Prerefunded to 9/1/23, 5.00%, 9/1/33 | | | 105 | | | | 114,531 | |
| | |
Prerefunded to 9/1/23, 5.00%, 9/1/34 | | | 200 | | | | 218,154 | |
| | |
Series 2012, Prerefunded to 9/1/22, 5.00%, 9/1/32 | | | 1,935 | | | | 2,019,966 | |
| | |
Series 2014, Prerefunded to 9/1/23, 5.00%, 9/1/32 | | | 200 | | | | 218,154 | |
| | |
Metropolitan Transportation Authority, NY, Prerefunded to 11/15/21, 5.25%, 11/15/38 | | | 3,430 | | | | 3,450,100 | |
| | |
New York Dormitory Authority, Sales Tax Revenue, Prerefunded to 3/15/23, 5.00%, 3/15/34 | | | 7,620 | | | | 8,150,581 | |
| | |
New York Thruway Authority, Prerefunded to 1/1/22, 5.00%, 1/1/37 | | | 3,240 | | | | 3,278,426 | |
| | |
Onondaga County Cultural Resources Trust, NY, (Syracuse University), Prerefunded to 12/1/23, 5.00%, 12/1/38 | | | 3,820 | | | | 4,213,804 | |
| | |
Sales Tax Asset Receivable Corp., NY, Prerefunded to 10/15/24, 5.00%, 10/15/30(2) | | | 8,900 | | | | 10,163,889 | |
| | |
| | | | | | | $ | 33,310,485 | |
|
| General Obligations — 9.5% | |
| | |
Buffalo, NY, 5.00%, 4/1/30 | | $ | 4,610 | | | $ | 6,037,855 | |
| | |
East Meadow Union Free School District, NY, 2.00%, 6/15/35 | | | 985 | | | | 971,722 | |
| | |
New York City, NY: | | | | | | | | |
| | |
4.00%, 8/1/34 | | | 1,170 | | | | 1,329,600 | |
| | |
4.00%, 12/1/41 | | | 530 | | | | 612,177 | |
| | |
5.00%, 8/1/34(2) | | | 10,000 | | | | 10,838,300 | |
| | | | |
| | 32 | | See Notes to Financial Statements. |
Eaton Vance
New York Municipal Bond Fund
September 30, 2021
Portfolio of Investments — continued
| | | | | | | | |
| Security | | Principal
Amount
(000’s omitted) | | | Value | |
|
| General Obligations (continued) | |
| | |
Washingtonville Central School District, NY: | | | | | | | | |
| | |
0.05%, 6/15/35 | | $ | 950 | | | $ | 699,722 | |
| | |
0.05%, 6/15/36 | | | 950 | | | | 676,010 | |
| | |
0.05%, 6/15/37 | | | 950 | | | | 656,545 | |
| | |
0.05%, 6/15/38 | | | 950 | | | | 637,906 | |
| | |
0.05%, 6/15/39 | | | 695 | | | | 453,029 | |
| | |
| | | | | | | $ | 22,912,866 | |
|
| Hospital — 11.7% | |
| | |
Brookhaven Local Development Corp., NY, (Long Island Community Hospital): | | | | | | | | |
| | |
3.375%, 10/1/40 | | $ | 1,500 | | | $ | 1,610,745 | |
| | |
4.00%, 10/1/45 | | | 500 | | | | 567,790 | |
| | |
Jefferson County Civic Facility Development Corp., NY, (Samaritan Medical Center), 4.00%, 11/1/47 | | | 2,200 | | | | 2,303,752 | |
| | |
New York Dormitory Authority, (Catholic Health System Obligated Group), 4.00%, 7/1/40 | | | 635 | | | | 717,144 | |
| | |
New York Dormitory Authority, (Maimonides Medical Center), 3.00%, 2/1/50 | | | 1,975 | | | | 2,055,007 | |
| | |
New York Dormitory Authority, (Memorial Sloan Kettering Cancer Center): | | | | | | | | |
| | |
5.00%, 7/1/42 | | | 1,500 | | | | 1,809,000 | |
| | |
Prerefunded to 1/1/22, 4.375%, 7/1/34(2) | | | 9,825 | | | | 9,926,689 | |
| | |
New York Dormitory Authority, (Montefiore Obligated Group): | | | | | | | | |
| | |
4.00%, 8/1/36 | | | 4,135 | | | | 4,680,241 | |
| | |
4.00%, 9/1/50 | | | 180 | | | | 202,048 | |
| | |
New York Dormitory Authority, (Orange Regional Medical Center), 5.00%, 12/1/45(1) | | | 3,800 | | | | 4,303,462 | |
| | |
| | | | | | | $ | 28,175,878 | |
|
| Housing — 5.5% | |
| | |
New York City Housing Development Corp., NY: | | | | | | | | |
| | |
3.40%, 11/1/39 | | $ | 1,000 | | | $ | 1,060,560 | |
| | |
3.55%, 11/1/44 | | | 1,270 | | | | 1,346,518 | |
| | |
3.70%, 11/1/38 | | | 885 | | | | 955,225 | |
| | |
3.80%, 11/1/43 | | | 1,675 | | | | 1,795,064 | |
| | |
4.05%, 11/1/41 | | | 2,030 | | | | 2,193,638 | |
| | |
New York Housing Finance Agency: | | | | | | | | |
| | |
(FHLMC), (FNMA), (GNMA), 3.20%, 11/1/46 | | | 1,075 | | | | 1,111,238 | |
| | |
(FHLMC), (FNMA), (GNMA), 4.00%, 11/1/42 | | | 500 | | | | 535,620 | |
| | |
(FNMA), 3.95%, 11/1/37 | | | 1,000 | | | | 1,077,180 | |
| | |
New York Mortgage Agency, 3.60%, 10/1/34 | | | 1,325 | | | | 1,374,436 | |
| | | | | | | | |
| Security | | Principal
Amount
(000’s omitted) | | | Value | |
|
| Housing (continued) | |
| | |
Westchester County Local Development Corp., NY, (Purchase Housing Corp. II), 5.00%, 6/1/47 | | $ | 1,500 | | | $ | 1,683,165 | |
| | |
| | | | | | | $ | 13,132,644 | |
|
| Industrial Development Revenue — 3.1% | |
| | |
Build NYC Resource Corp., NY, (Pratt Paper (NY), Inc.), (AMT), 4.50%, 1/1/25(1) | | $ | 875 | | | $ | 936,661 | |
| | |
New York Liberty Development Corp., (Goldman Sachs Group, Inc.): | | | | | | | | |
| | |
5.25%, 10/1/35 | | | 895 | | | | 1,260,438 | |
| | |
5.50%, 10/1/37 | | | 1,440 | | | | 2,119,795 | |
| | |
New York Transportation Development Corp., (Delta Air Lines, Inc. - LaGuardia Airport Terminals C&D Redevelopment), (AMT), 4.375%, 10/1/45 | | | 2,665 | | | | 3,092,972 | |
| | |
| | | | | | | $ | 7,409,866 | |
|
| Insured-Education — 0.8% | |
| | |
New York Dormitory Authority, (City University), (AMBAC), 5.25%, 7/1/30 | | $ | 75 | | | $ | 88,672 | |
| | |
New York Dormitory Authority, (CUNY Student Housing), (AMBAC), (BAM), 5.50%, 7/1/35 | | | 1,345 | | | | 1,881,924 | |
| | |
| | | | | | | $ | 1,970,596 | |
|
| Insured-Escrowed / Prerefunded — 0.8% | |
| | |
New York Dormitory Authority, (Educational Housing Services CUNY Student Housing), (AMBAC), 5.25%, 7/1/23 | | $ | 1,750 | | | $ | 1,900,990 | |
| | |
| | | | | | | $ | 1,900,990 | |
|
| Insured-General Obligations — 9.5% | |
| | |
East Northport Fire District, NY: | | | | | | | | |
| | |
(AGC), 4.50%, 11/1/21 | | $ | 200 | | | $ | 200,658 | |
| | |
(AGC), 4.50%, 11/1/22 | | | 200 | | | | 200,630 | |
| | |
(AGC), 4.50%, 11/1/23 | | | 200 | | | | 200,642 | |
| | |
Nassau County, NY: | | | | | | | | |
| | |
(AGM), 4.00%, 4/1/47 | | | 2,500 | | | | 2,901,975 | |
| | |
(AGM), 5.00%, 7/1/42 | | | 1,000 | | | | 1,217,280 | |
| | |
(AGM), 5.00%, 4/1/43(2) | | | 10,000 | | | | 12,291,300 | |
| | |
Oyster Bay, NY, (AGM), 4.00%, 8/1/28 | | | 4,585 | | | | 4,717,552 | |
| | |
Yonkers, NY, (AGM), 2.00%, 2/15/41 | | | 1,000 | | | | 956,240 | |
| | |
| | | | | | | $ | 22,686,277 | |
| | | | |
| | 33 | | See Notes to Financial Statements. |
Eaton Vance
New York Municipal Bond Fund
September 30, 2021
Portfolio of Investments — continued
| | | | | | | | |
| Security | | Principal
Amount
(000’s omitted) | | | Value | |
|
| Insured-Lease Revenue / Certificates of Participation — 1.9% | |
| | |
Ulster County Resource Recovery Agency, NY, Solid Waste System: | | | | | | | | |
| | |
(AMBAC), 0.00%, 3/1/23 | | $ | 1,090 | | | $ | 1,082,261 | |
| | |
(AMBAC), 0.00%, 3/1/25 | | | 3,635 | | | | 3,539,472 | |
| | |
| | | | | | | $ | 4,621,733 | |
|
| Insured-Other Revenue — 2.5% | |
| | |
New York City Industrial Development Agency, NY, (Yankee Stadium): | | | | | | | | |
| | |
(AGM), 3.00%, 3/1/40 | | $ | 785 | | | $ | 842,454 | |
| | |
(AGM), 3.00%, 3/1/49 | | | 4,785 | | | | 5,032,289 | |
| | |
| | | | | | | $ | 5,874,743 | |
|
| Insured-Special Tax Revenue — 0.6% | |
| | |
Puerto Rico Infrastructure Financing Authority, (AMBAC), 0.00%, 7/1/36 | | $ | 3,000 | | | $ | 1,526,730 | |
| | |
| | | | | | | $ | 1,526,730 | |
|
| Insured-Transportation — 5.1% | |
| | |
Metropolitan Transportation Authority, NY, Green Bonds: | | | | | | | | |
| | |
(AGM), 4.00%, 11/15/46 | | $ | 1,440 | | | $ | 1,651,651 | |
| | |
(AGM), 4.00%, 11/15/48(2) | | | 7,120 | | | | 8,221,037 | |
| | |
New York Thruway Authority, (AGM), 3.00%, 1/1/46 | | | 2,340 | | | | 2,462,710 | |
| | |
| | | | | | | $ | 12,335,398 | |
|
| Lease Revenue / Certificates of Participation — 3.9% | |
| | |
Hudson Yards Infrastructure Corp., NY, 5.00%, 2/15/42(2) | | $ | 8,000 | | | $ | 9,438,480 | |
| | |
| | | | | | | $ | 9,438,480 | |
|
| Other Revenue — 9.2% | |
| | |
Build NYC Resource Corp., NY, (Children’s Aid Society), 4.00%, 7/1/49 | | $ | 1,400 | | | $ | 1,589,826 | |
| | |
New York City Transitional Finance Authority, NY, (Building Aid): | | | | | | | | |
| | |
5.00%, 7/15/32(2) | | | 10,000 | | | | 11,663,000 | |
| | |
5.00%, 7/15/37(2) | | | 2,200 | | | | 2,733,324 | |
| | |
New York Liberty Development Corp., (7 World Trade Center), 5.00%, 9/15/32 | | | 5,975 | | | | 6,101,311 | |
| | |
| | | | | | | $ | 22,087,461 | |
| | | | | | | | |
| Security | | Principal
Amount
(000’s omitted) | | | Value | |
|
| Senior Living / Life Care — 2.5% | |
| | |
Brookhaven Local Development Corp., NY, (Jefferson’s Ferry): | | | | | | | | |
| | |
4.00%, 11/1/45 | | $ | 600 | | | $ | 671,730 | |
| | |
5.00%, 11/1/24 | | | 190 | | | | 214,624 | |
| | |
5.25%, 11/1/25 | | | 325 | | | | 382,723 | |
| | |
5.25%, 11/1/26 | | | 200 | | | | 242,066 | |
| | |
5.25%, 11/1/28 | | | 50 | | | | 60,237 | |
| | |
5.25%, 11/1/29 | | | 155 | | | | 186,312 | |
| | |
5.25%, 11/1/36 | | | 970 | | | | 1,155,600 | |
| | |
Southold Local Development Corp., NY, (Peconic Landing at Southold, Inc.), 4.00%, 12/1/45 | | | 25 | | | | 26,201 | |
| | |
Westchester County Local Development Corp., NY, (Kendal on Hudson): | | | | | | | | |
| | |
5.00%, 1/1/28 | | | 1,090 | | | | 1,143,083 | |
| | |
5.00%, 1/1/34 | | | 630 | | | | 657,884 | |
| | |
Westchester County Local Development Corp., NY, (Miriam Osborn Memorial Home Association), 5.00%, 7/1/42 | | | 1,200 | | | | 1,347,300 | |
| | |
| | | | | | | $ | 6,087,760 | |
|
| Special Tax Revenue — 22.1% | |
| | |
Metropolitan Transportation Authority, NY, Dedicated Tax Revenue, 5.00%, 11/15/31(2) | | $ | 10,000 | | | $ | 10,520,500 | |
| | |
New York City Transitional Finance Authority, NY, Future Tax Revenue: | | | | | | | | |
| | |
3.00%, 11/1/47 | | | 1,000 | | | | 1,049,740 | |
| | |
4.00%, 8/1/41 | | | 3,750 | | | | 4,318,950 | |
| | |
4.00%, 5/1/42 | | | 5,430 | | | | 6,215,287 | |
| | |
4.00%, 8/1/42 | | | 2,100 | | | | 2,386,944 | |
| | |
5.00%, 11/1/29 | | | 1,000 | | | | 1,304,580 | |
| | |
New York Dormitory Authority, Personal Income Tax Revenue: | | | | | | | | |
| | |
4.00%, 3/15/47(2) | | | 10,000 | | | | 11,585,900 | |
| | |
5.00%, 6/15/31(2) | | | 9,250 | | | | 9,776,325 | |
| | |
New York Dormitory Authority, Sales Tax Revenue, 5.00%, 3/15/43(2) | | | 2,000 | | | | 2,445,640 | |
| | |
New York State Urban Development Corp., Personal Income Tax Revenue, 3.00%, 3/15/48 | | | 3,400 | | | | 3,543,684 | |
| | |
| | | | | | | $ | 53,147,550 | |
|
| Transportation — 21.3% | |
| | |
Metropolitan Transportation Authority, NY, Green Bonds, 4.75%, 11/15/45 | | $ | 1,205 | | | $ | 1,415,031 | |
| | |
Nassau County Bridge Authority, NY: | | | | | | | | |
| | |
5.00%, 10/1/35 | | | 1,915 | | | | 1,922,028 | |
| | |
5.00%, 10/1/40 | | | 365 | | | | 366,325 | |
| | | | |
| | 34 | | See Notes to Financial Statements. |
Eaton Vance
New York Municipal Bond Funds
September 30, 2021
Portfolio of Investments — continued
| | | | | | | | |
| Security | | Principal
Amount
(000’s omitted) | | | Value | |
|
| Transportation (continued) | |
| | |
New York Bridge Authority: | | | | | | | | |
| | |
4.00%, 1/1/39 | | $ | 270 | | | $ | 322,750 | |
| | |
4.00%, 1/1/40 | | | 325 | | | | 387,602 | |
| | |
4.00%, 1/1/41 | | | 200 | | | | 237,850 | |
| | |
New York Thruway Authority: | | | | | | | | |
| | |
4.00%, 1/1/36 | | | 2,500 | | | | 2,872,875 | |
| | |
4.00%, 1/1/46(2) | | | 10,000 | | | | 11,489,800 | |
| | |
4.00%, 1/1/50 | | | 2,625 | | | | 2,987,040 | |
| | |
New York Transportation Development Corp., (LaGuardia Airport Terminal B Redevelopment): | | | | | | | | |
| | |
(AMT), 4.00%, 7/1/33 | | | 835 | | | | 899,487 | |
| | |
(AMT), 5.25%, 1/1/50 | | | 3,240 | | | | 3,612,956 | |
| | |
New York Transportation Development Corp., (Terminal 4 John F. Kennedy International Airport): | | | | | | | | |
| | |
4.00%, 12/1/42 | | | 3,740 | | | | 4,236,410 | |
| | |
5.00%, 12/1/36 | | | 480 | | | | 604,138 | |
| | |
(AMT), 4.00%, 12/1/40 | | | 100 | | | | 113,303 | |
| | |
Port Authority of New York and New Jersey: | | | | | | | | |
| | |
4.00%, 7/15/41 | | | 2,000 | | | | 2,367,180 | |
| | |
5.00%, 12/1/34(2) | | | 820 | | | | 901,385 | |
| | |
5.00%, 10/15/35(2) | | | 8,000 | | | | 9,359,040 | |
| | |
5.00%, 10/15/36(2) | | | 1,200 | | | | 1,449,828 | |
| | |
(AMT), 4.00%, 9/1/43(2) | | | 5,000 | | | | 5,717,700 | |
| | |
| | | | | | | $ | 51,262,728 | |
|
| Water and Sewer — 2.0% | |
| | |
New York City Municipal Water Finance Authority, NY, (Water and Sewer System), 5.00%, 6/15/46(2) | | $ | 2,000 | | | $ | 2,365,180 | |
| | |
Suffolk County Water Authority, NY, 5.00%, 6/1/36(2) | | | 2,000 | | | | 2,488,040 | |
| | |
| | | | | | | $ | 4,853,220 | |
| |
Total Tax-Exempt Municipal Obligations — 150.5%
(identified cost $338,998,408) | | | $ | 361,898,981 | |
| | | | | | | | |
| Taxable Municipal Obligations — 0.1% | |
| Security | | Principal
Amount
(000’s omitted) | | | Value | |
| | |
| Education — 0.1% | | | | | | |
| | |
Build NYC Resource Corp., NY, (New World Preparatory Charter School), 4.375%, 6/15/25(1) | | $ | 240 | | | $ | 239,652 | |
| |
Total Taxable Municipal Obligations — 0.1%
(identified cost $240,000) | | | $ | 239,652 | |
| |
Total Investments — 151.2%
(identified cost $340,588,408) | | | $ | 363,544,931 | |
| |
Other Assets, Less Liabilities — (51.2)% | | | $ | (123,097,318 | ) |
| |
Net Assets — 100.0% | | | $ | 240,447,613 | |
The percentage shown for each investment category in the Portfolio of Investments is based on net assets.
The Fund invests primarily in debt securities issued by New York municipalities. The ability of the issuers of the debt securities to meet their obligations may be affected by economic developments in a specific industry or municipality. At September 30, 2021, 14.0% of total investments are backed by bond insurance of various financial institutions and financial guaranty assurance agencies. The aggregate percentage insured by an individual financial institution or financial guaranty assurance agency ranged from 0.2% to 11.1% of total investments.
| (1) | Security exempt from registration under Rule 144A of the Securities Act of 1933, as amended. These securities may be sold in certain transactions in reliance on an exemption from registration (normally to qualified institutional buyers). At September 30, 2021, the aggregate value of these securities is $7,624,307 or 3.2% of the Fund’s net assets. |
| (2) | Security represents the municipal bond held by a trust that issues residual interest bonds (see Note 1G). |
Abbreviations:
| | | | |
| | |
| AGC | | – | | Assured Guaranty Corp. |
| | |
| AGM | | – | | Assured Guaranty Municipal Corp. |
| | |
| AMBAC | | – | | AMBAC Financial Group, Inc. |
| | |
| AMT | | – | | Interest earned from these securities may be considered a tax preference item for purposes of the Federal Alternative Minimum Tax. |
| | |
| BAM | | – | | Build America Mutual Assurance Co. |
| | |
| FHLMC | | – | | Federal Home Loan Mortgage Corp. |
| | |
| FNMA | | – | | Federal National Mortgage Association |
| | |
| GNMA | | – | | Government National Mortgage Association |
| | | | |
| | 35 | | See Notes to Financial Statements. |
Eaton Vance
Municipal Bond Funds
September 30, 2021
Statements of Assets and Liabilities
| | | | | | | | | | | | |
| | | September 30, 2021 | |
| Assets | | Municipal Fund | | | California Fund | | | New York Fund | |
|
Investments — | |
| | | |
Identified cost | | $ | 1,503,395,289 | | | $ | 476,374,133 | | | $ | 340,588,408 | |
| | | |
Unrealized appreciation | | | 146,263,419 | | | | 35,849,594 | | | | 22,956,523 | |
| | | |
Investments, at value | | $ | 1,649,658,708 | | | $ | 512,223,727 | | | $ | 363,544,931 | |
| | | |
Cash | | $ | 1,740,414 | | | $ | — | | | $ | — | |
| | | |
Interest receivable | | | 18,037,553 | | | | 4,845,442 | | | | 3,929,212 | |
| | | |
Receivable for investments sold | | | 23,800,000 | | | | 11,155,000 | | | | 1,065,000 | |
| | | |
Total assets | | $ | 1,693,236,675 | | | $ | 528,224,169 | | | $ | 368,539,143 | |
|
| Liabilities | |
| | | |
Payable for floating rate notes issued | | $ | 667,925,601 | | | $ | 209,125,012 | | | $ | 125,968,048 | |
| | | |
Due to broker for floating rate notes redeemed | | | 19,040,000 | | | | — | | | | — | |
| | | |
Due to custodian | | | — | | | | 6,745,192 | | | | 1,580,801 | |
| | | |
Payable to affiliate: | | | | | | | | | | | | |
| | | |
Investment adviser fee | | | 839,550 | | | | 258,313 | | | | 182,266 | |
| | | |
Interest expense and fees payable | | | 1,249,963 | | | | 299,741 | | | | 221,390 | |
| | | |
Accrued expenses | | | 359,591 | | | | 160,777 | | | | 139,025 | |
| | | |
Total liabilities | | $ | 689,414,705 | | | $ | 216,589,035 | | | $ | 128,091,530 | |
| | | |
Net Assets | | $ | 1,003,821,970 | | | $ | 311,635,134 | | | $ | 240,447,613 | |
|
| Sources of Net Assets | |
| | | |
Common shares, $0.01 par value, unlimited number of shares authorized | | $ | 719,532 | | | $ | 249,943 | | | $ | 181,183 | |
| | | |
Additional paid-in capital | | | 892,760,635 | | | | 311,794,508 | | | | 229,440,189 | |
| | | |
Distributable earnings (accumulated loss) | | | 110,341,803 | | | | (409,317 | ) | | | 10,826,241 | |
| | | |
Net Assets | | $ | 1,003,821,970 | | | $ | 311,635,134 | | | $ | 240,447,613 | |
| | | |
| Common Shares Outstanding | | | 71,953,184 | | | | 24,994,339 | | | | 18,118,294 | |
|
| Net Asset Value | |
| | | |
Net assets ÷ common shares issued and outstanding | | $ | 13.95 | | | $ | 12.47 | | | $ | 13.27 | |
| | | | |
| | 36 | | See Notes to Financial Statements. |
Eaton Vance
Municipal Bond Funds
September 30, 2021
Statements of Operations
| | | | | | | | | | | | |
| | | Year Ended September 30, 2021 | |
| Investment Income | | Municipal Fund | | | California Fund | | | New York Fund | |
| | | |
Interest | | $ | 58,016,928 | | | $ | 17,375,084 | | | $ | 12,338,834 | |
| | | |
Total investment income | | $ | 58,016,928 | | | $ | 17,375,084 | | | $ | 12,338,834 | |
|
| Expenses | |
| | | |
Investment adviser fee | | $ | 10,446,240 | | | $ | 3,215,368 | | | $ | 2,325,875 | |
| | | |
Trustees’ fees and expenses | | | 83,908 | | | | 26,332 | | | | 19,082 | |
| | | |
Custodian fee | | | 243,492 | | | | 76,991 | | | | 58,986 | |
| | | |
Transfer and dividend disbursing agent fees | | | 17,550 | | | | 21,505 | | | | 18,670 | |
| | | |
Legal and accounting services | | | 193,682 | | | | 103,670 | | | | 96,900 | |
| | | |
Printing and postage | | | 86,821 | | | | 26,626 | | | | 17,771 | |
| | | |
Interest expense and fees | | | 4,174,174 | | | | 1,275,474 | | | | 853,197 | |
| | | |
Miscellaneous | | | 72,029 | | | | 57,378 | | | | 41,912 | |
| | | |
Total expenses | | $ | 15,317,896 | | | $ | 4,803,344 | | | $ | 3,432,393 | |
| | | |
Net investment income | | $ | 42,699,032 | | | $ | 12,571,740 | | | $ | 8,906,441 | |
|
| Realized and Unrealized Gain (Loss) | |
|
Net realized gain (loss) — | |
| | | |
Investment transactions | | $ | 5,541,586 | | | $ | 667,567 | | | $ | 611,044 | |
| | | |
Net realized gain | | $ | 5,541,586 | | | $ | 667,567 | | | $ | 611,044 | |
| | | |
Change in unrealized appreciation (depreciation) — | | | | | | | | | | | | |
| | | |
Investments | | $ | (12,825,827 | ) | | $ | (5,398,300 | ) | | $ | 110,315 | |
| | | |
Net change in unrealized appreciation (depreciation) | | $ | (12,825,827 | ) | | $ | (5,398,300 | ) | | $ | 110,315 | |
| | | |
Net realized and unrealized gain (loss) | | $ | (7,284,241 | ) | | $ | (4,730,733 | ) | | $ | 721,359 | |
| | | |
Net increase in net assets from operations | | $ | 35,414,791 | | | $ | 7,841,007 | | | $ | 9,627,800 | |
| | | | |
| | 37 | | See Notes to Financial Statements. |
Eaton Vance
Municipal Bond Funds
September 30, 2021
Statements of Changes in Net Assets
| | | | | | | | | | | | |
| | | Year Ended September 30, 2021 | |
| Increase (Decrease) in Net Assets | | Municipal Fund | | | California Fund | | | New York Fund | |
| | | |
From operations — | | | | | | | | | | | | |
| | | |
Net investment income | | $ | 42,699,032 | | | $ | 12,571,740 | | | $ | 8,906,441 | |
| | | |
Net realized gain | | | 5,541,586 | | | | 667,567 | | | | 611,044 | |
| | | |
Net change in unrealized appreciation (depreciation) | | | (12,825,827 | ) | | | (5,398,300 | ) | | | 110,315 | |
| | | |
Net increase in net assets from operations | | $ | 35,414,791 | | | $ | 7,841,007 | | | $ | 9,627,800 | |
| | | |
Distributions to common shareholders | | $ | (42,826,531 | ) | | $ | (12,567,154 | ) | | $ | (9,015,482 | ) |
| | | |
Tax return of capital to common shareholders | | $ | — | | | $ | — | | | $ | (206,730 | ) |
| | | |
Net increase (decrease) in net assets | | $ | (7,411,740 | ) | | $ | (4,726,147 | ) | | $ | 405,588 | |
|
| Net Assets | |
| | | |
At beginning of year | | $ | 1,011,233,710 | | | $ | 316,361,281 | | | $ | 240,042,025 | |
| | | |
At end of year | | $ | 1,003,821,970 | | | $ | 311,635,134 | | | $ | 240,447,613 | |
| | | | |
| | 38 | | See Notes to Financial Statements. |
Eaton Vance
Municipal Bond Funds
September 30, 2021
Statements of Changes in Net Assets — continued
| | | | | | | | | | | | |
| | | Year Ended September 30, 2020 | |
| Increase (Decrease) in Net Assets | | Municipal Fund | | | California Fund | | | New York Fund | |
| | | |
From operations — | | | | | | | | | | | | |
| | | |
Net investment income | | $ | 43,303,259 | | | $ | 11,813,279 | | | $ | 8,875,413 | |
| | | |
Net realized gain (loss) | | | 1,126,362 | | | | (1,830,414 | ) | | | (4,259,268 | ) |
| | | |
Net change in unrealized appreciation (depreciation) | | | 2,442,549 | | | | 3,663,575 | | | | (121,807 | ) |
| | | |
Net increase in net assets from operations | | $ | 46,872,170 | | | $ | 13,646,440 | | | $ | 4,494,338 | |
| | | |
Distributions to common shareholders | | $ | (42,638,372 | ) | | $ | (11,562,381 | ) | | $ | (8,771,066 | ) |
| | | |
Capital share transactions - | | | | | | | | | | | | |
| | | |
Cost of shares repurchased in tender offer (see Note 5) | | $ | (107,235,821 | ) | | $ | — | | | $ | — | |
| | | |
Net decrease in net assets from capital share transactions | | $ | (107,235,821 | ) | | $ | — | | | $ | — | |
| | | |
Net increase (decrease) in net assets | | $ | (103,002,023 | ) | | $ | 2,084,059 | | | $ | (4,276,728 | ) |
|
| Net Assets | |
| | | |
At beginning of year | | $ | 1,114,235,733 | | | $ | 314,277,222 | | | $ | 244,318,753 | |
| | | |
At end of year | | $ | 1,011,233,710 | | | $ | 316,361,281 | | | $ | 240,042,025 | |
| | | | |
| | 39 | | See Notes to Financial Statements. |
Eaton Vance
Municipal Bond Funds
September 30, 2021
Statements of Cash Flows
| | | | | | | | | | | | | | | | | | | | |
| | | Year Ended September 30, 2021 | |
| Cash Flows From Operating Activities | | Municipal Fund | | | | | | California Fund | | | | | | New York Fund | |
| | | | | |
Net increase in net assets from operations | | $ | 35,414,791 | | | | | | | $ | 7,841,007 | | | | | | | $ | 9,627,800 | |
| | | | | |
Adjustments to reconcile net increase in net assets from operations to net cash provided by operating activities: | | | | | | | | | | | | | | | | | | | | |
| | | | | |
Investments purchased | | | (186,643,356 | ) | | | | | | | (106,489,056 | ) | | | | | | | (61,249,123 | ) |
| | | | | |
Investments sold | | | 250,021,224 | | | | | | | | 107,542,434 | | | | | | | | 80,661,882 | |
| | | | | |
Net amortization/accretion of premium (discount) | | | 5,236,494 | | | | | | | | 2,829,011 | | | | | | | | 2,465,452 | |
| | | | | |
Decrease in interest receivable | | | 1,729,378 | | | | | | | | 178,628 | | | | | | | | 574,597 | |
| | | | | |
Decrease in payable to affiliate for investment adviser fee | | | (31,427 | ) | | | | | | | (6,271 | ) | | | | | | | (9,965 | ) |
| | | | | |
Decrease in interest expense and fees payable | | | (566,614 | ) | | | | | | | (103,676 | ) | | | | | | | (149,577 | ) |
| | | | | |
Increase in accrued expenses | | | 65,705 | | | | | | | | 19,930 | | | | | | | | 5,786 | |
| | | | | |
Net change in unrealized (appreciation) depreciation from investments | | | 12,825,827 | | | | | | | | 5,398,300 | | | | | | | | (110,315 | ) |
| | | | | |
Net realized gain from investments | | | (5,541,586 | ) | | | | | | | (667,567 | ) | | | | | | | (611,044 | ) |
| | | | | |
Net cash provided by operating activities | | $ | 112,510,436 | | | | | | | $ | 16,542,740 | | | | | | | $ | 31,205,493 | |
| | |
| Cash Flows From Financing Activities | | | | | | | | | |
| | | | | |
Cash distributions paid to common shareholders | | $ | (42,826,531 | ) | | | | | | $ | (12,567,154 | ) | | | | | | $ | (9,222,212 | ) |
| | | | | |
Proceeds from secured borrowings | | | — | | | | | | | | — | | | | | | | | 8,000,000 | |
| | | | | |
Repayment of secured borrowings | | | (69,210,000 | ) | | | | | | | (12,000,000 | ) | | | | | | | (31,725,000 | ) |
| | | | | |
Increase in due to custodian | | | — | | | | | | | | 6,745,192 | | | | | | | | 1,580,801 | |
| | | | | |
Net cash used in financing activities | | $ | (112,036,531 | ) | | | | | | $ | (17,821,962 | ) | | | | | | $ | (31,366,411 | ) |
| | | | | |
Net increase (decrease) in cash | | $ | 473,905 | | | | | | | $ | (1,279,222 | ) | | | | | | $ | (160,918 | ) |
| | | | | |
Cash at beginning of year | | $ | 1,266,509 | | | | | | | $ | 1,279,222 | | | | | | | $ | 160,918 | |
| | | | | |
Cash at end of year | | $ | 1,740,414 | | | | | | | $ | — | | | | | | | $ | — | |
| | |
| Supplemental disclosure of cash flow information: | | | | | | | | | |
| | | | | |
Cash paid for interest and fees | | $ | 4,740,788 | | | | | | | $ | 1,379,150 | | | | | | | $ | 1,002,774 | |
| | | | |
| | 40 | | See Notes to Financial Statements. |
Eaton Vance
Municipal Bond Funds
September 30, 2021
Financial Highlights
| | | | | | | | | | | | | | | | | | | | |
| | | Municipal Fund | |
| | | Year Ended September 30, | |
| | | 2021 | | | 2020 | | | 2019 | | | 2018 | | | 2017 | |
| | | | | | |
Net asset value — Beginning of year | | $ | 14.050 | | | $ | 13.980 | | | $ | 12.940 | | | $ | 13.740 | | | $ | 14.480 | |
| | | | | |
| Income (Loss) From Operations | | | | | | | | | | | | | | | | | | | | |
| | | | | |
Net investment income(1) | | $ | 0.593 | | | $ | 0.571 | | | $ | 0.522 | | | $ | 0.573 | | | $ | 0.640 | |
| | | | | |
Net realized and unrealized gain (loss) | | | (0.098 | ) | | | 0.033 | | | | 0.982 | | | | (0.785 | ) | | | (0.739 | ) |
| | | | | |
Total income (loss) from operations | | $ | 0.495 | | | $ | 0.604 | | | $ | 1.504 | | | $ | (0.212 | ) | | $ | (0.099 | ) |
| | | | | |
| Less Distributions | | | | | | | | | | | | | | | | | | | | |
| | | | | |
From net investment income | | $ | (0.595 | ) | | $ | (0.563 | ) | | $ | (0.517 | ) | | $ | (0.572 | ) | | $ | (0.641 | ) |
| | | | | |
Tax return of capital | | | — | | | | — | | | | — | | | | (0.016 | ) | | | — | |
| | | | | |
Total distributions | | $ | (0.595 | ) | | $ | (0.563 | ) | | $ | (0.517 | ) | | $ | (0.588 | ) | | $ | (0.641 | ) |
| | | | | |
Anti-dilutive effect of share repurchase program (see Note 5)(1) | | $ | — | | | $ | — | | | $ | 0.022 | | | $ | — | | | $ | — | |
| | | | | |
Discount on tender offer (see Note 5)(1) | | $ | — | | | $ | 0.029 | | | $ | 0.031 | | | $ | — | | | $ | — | |
| | | | | |
Net asset value — End of year | | $ | 13.950 | | | $ | 14.050 | | | $ | 13.980 | | | $ | 12.940 | | | $ | 13.740 | |
| | | | | |
Market value — End of year | | $ | 13.380 | | | $ | 13.170 | | | $ | 12.960 | | | $ | 11.530 | | | $ | 12.680 | |
| | | | | |
Total Investment Return on Net Asset Value(2) | | | 3.75 | % | | | 4.99 | % | | | 12.72 | % | | | (1.09 | )% | | | (0.19 | )% |
| | | | | |
Total Investment Return on Market Value(2) | | | 6.16 | % | | | 6.15 | % | | | 17.28 | % | | | (4.50 | )% | | | (2.08 | )% |
| | | | | |
| Ratios/Supplemental Data | | | | | | | | | | | | | | | | | | | | |
| | | | | |
Net assets, end of year (000’s omitted) | | $ | 1,003,822 | | | $ | 1,011,234 | | | $ | 1,114,236 | | | $ | 881,990 | | | $ | 936,652 | |
| | | | | |
Ratios (as a percentage of average daily net assets): | | | | | | | | | | | | | | | | | | | | |
| | | | | |
Expenses excluding interest and fees | | | 1.09 | % | | | 1.13 | % | | | 1.11 | % | | | 1.07 | % | | | 1.07 | % |
| | | | | |
Interest and fee expense(3) | | | 0.41 | % | | | 1.05 | % | | | 1.51 | % | | | 1.25 | % | | | 0.93 | % |
| | | | | |
Total expenses | | | 1.50 | % | | | 2.18 | % | | | 2.62 | % | | | 2.32 | % | | | 2.00 | % |
| | | | | |
Net investment income | | | 4.18 | % | | | 4.09 | % | | | 3.89 | % | | | 4.29 | % | | | 4.67 | % |
| | | | | |
Portfolio Turnover | | | 10 | % | | | 7 | % | | | 18 | % | | | 17 | % | | | 6 | % |
| (1) | Computed using average shares outstanding. |
| (2) | Returns are historical and are calculated by determining the percentage change in net asset value or market value with all distributions reinvested. Distributions are assumed to be reinvested at prices obtained under the Fund’s dividend reinvestment plan. |
| (3) | Interest and fee expense relates to the liability for floating rate notes issued in conjunction with residual interest bond transactions (see Note 1G). |
| | | | |
| | 41 | | See Notes to Financial Statements. |
Eaton Vance
Municipal Bond Funds
September 30, 2021
Financial Highlights — continued
| | | | | | | | | | | | | | | | | | | | |
| | | California Fund | |
| |
| | | Year Ended September 30, | |
| | | 2021 | | | 2020 | | | 2019 | | | 2018 | | | 2017 | |
| | | | | | |
Net asset value — Beginning of year | | $ | 12.660 | | | $ | 12.570 | | | $ | 11.780 | | | $ | 12.450 | | | $ | 13.050 | |
| | | | | |
| Income (Loss) From Operations | | | | | | | | | | | | | | | | | | | | |
| | | | | |
Net investment income(1) | | $ | 0.503 | | | $ | 0.473 | | | $ | 0.438 | | | $ | 0.482 | | | $ | 0.566 | |
| | | | | |
Net realized and unrealized gain (loss) | | | (0.190 | ) | | | 0.080 | | | | 0.802 | | | | (0.641 | ) | | | (0.582 | ) |
| | | | | |
Total income (loss) from operations | | $ | 0.313 | | | $ | 0.553 | | | $ | 1.240 | | | $ | (0.159 | ) | | $ | (0.016 | ) |
| | | | | |
| Less Distributions | | | | | | | | | | | | | | | | | | | | |
| | | | | |
From net investment income | | $ | (0.503 | ) | | $ | (0.463 | ) | | $ | (0.454 | ) | | $ | (0.511 | ) | | $ | (0.584 | ) |
| | | | | |
Tax return of capital | | | — | | | | — | | | | (0.020 | ) | | | — | | | | — | |
| | | | | |
Total distributions | | $ | (0.503 | ) | | $ | (0.463 | ) | | $ | (0.474 | ) | | $ | (0.511 | ) | | $ | (0.584 | ) |
| | | | | |
Anti-dilutive effect of share repurchase program (see Note 5)(1) | | $ | — | | | $ | — | | | $ | 0.024 | | | $ | — | | | $ | — | |
| | | | | |
Net asset value — End of year | | $ | 12.470 | | | $ | 12.660 | | | $ | 12.570 | | | $ | 11.780 | | | $ | 12.450 | |
| | | | | |
Market value — End of year | | $ | 11.940 | | | $ | 11.360 | | | $ | 11.330 | | | $ | 9.960 | | | $ | 12.040 | |
| | | | | |
Total Investment Return on Net Asset Value(2) | | | 2.78 | % | | | 4.93 | % | | | 11.54 | % | | | (0.79 | )% | | | 0.27 | % |
| | | | | |
Total Investment Return on Market Value(2) | | | 9.67 | % | | | 4.46 | % | | | 18.91 | % | | | (13.26 | )% | | | (6.67 | )% |
| | | | | |
| Ratios/Supplemental Data | | | | | | | | | | | | | | | | | | | | |
| | | | | |
Net assets, end of year (000’s omitted) | | $ | 311,635 | | | $ | 316,361 | | | $ | 314,277 | | | $ | 251,940 | | | $ | 266,346 | |
| | | | | |
Ratios (as a percentage of average daily net assets): | | | | | | | | | | | | | | | | | | | | |
| | | | | |
Expenses excluding interest and fees | | | 1.11 | % | | | 1.12 | % | | | 1.15 | % | | | 1.16 | % | | | 1.15 | % |
| | | | | |
Interest and fee expense(3) | | | 0.40 | % | | | 1.00 | % | | | 1.59 | % | | | 1.41 | % | | | 1.01 | % |
| | | | | |
Total expenses | | | 1.51 | % | | | 2.12 | % | | | 2.74 | % | | | 2.57 | % | | | 2.16 | % |
| | | | | |
Net investment income | | | 3.96 | % | | | 3.76 | % | | | 3.61 | % | | | 3.99 | % | | | 4.55 | % |
| | | | | |
Portfolio Turnover | | | 19 | % | | | 20 | % | | | 17 | % | | | 24 | % | | | 19 | % |
| (1) | Computed using average shares outstanding. |
| (2) | Returns are historical and are calculated by determining the percentage change in net asset value or market value with all distributions reinvested. Distributions are assumed to be reinvested at prices obtained under the Fund’s dividend reinvestment plan. |
| (3) | Interest and fee expense relates to the liability for floating rate notes issued in conjunction with residual interest bond transactions (see Note 1G). |
| | | | |
| | 42 | | See Notes to Financial Statements. |
Eaton Vance
Municipal Bond Funds
September 30, 2021
Financial Highlights — continued
| | | | | | | | | | | | | | | | | | | | |
| | | New York Fund | |
| |
| | | Year Ended September 30, | |
| | | 2021 | | | 2020 | | | 2019 | | | 2018 | | | 2017 | |
| | | | | | |
Net asset value — Beginning of year | | $ | 13.250 | | | $ | 13.480 | | | $ | 12.770 | | | $ | 13.610 | | | $ | 14.290 | |
| | | | | |
| Income (Loss) From Operations | | | | | | | | | | | | | | | | | | | | |
| | | | | |
Net investment income(1) | | $ | 0.492 | | | $ | 0.490 | | | $ | 0.476 | | | $ | 0.539 | | | $ | 0.599 | |
| | | | | |
Net realized and unrealized gain (loss) | | | 0.037 | | | | (0.236 | ) | | | 0.745 | | | | (0.815 | ) | | | (0.661 | ) |
| | | | | |
Total income (loss) from operations | | $ | 0.529 | | | $ | 0.254 | | | $ | 1.221 | | | $ | (0.276 | ) | | $ | (0.062 | ) |
| | | | | |
| Less Distributions | | | | | | | | | | | | | | | | | | | | |
| | | | | |
From net investment income | | $ | (0.498 | ) | | $ | (0.484 | ) | | $ | (0.497 | ) | | $ | (0.564 | ) | | $ | (0.618 | ) |
| | | | | |
Tax return of capital | | | (0.011 | ) | | | — | | | | (0.014 | ) | | | — | | | | — | |
| | | | | |
Total distributions | | $ | (0.509 | ) | | $ | (0.484 | ) | | $ | (0.511 | ) | | $ | (0.564 | ) | | $ | (0.618 | ) |
| | | | | |
Net asset value — End of year | | $ | 13.270 | | | $ | 13.250 | | | $ | 13.480 | | | $ | 12.770 | | | $ | 13.610 | |
| | | | | |
Market value — End of year | | $ | 12.270 | | | $ | 11.800 | | | $ | 12.440 | | | $ | 11.060 | | | $ | 12.930 | |
| | | | | |
Total Investment Return on Net Asset Value(2) | | | 4.34 | % | | | 2.37 | % | | | 10.25 | % | | | (1.50 | )% | | | 0.02 | % |
| | | | | |
Total Investment Return on Market Value(2) | | | 8.30 | % | | | (1.21 | )% | | | 17.47 | % | | | (10.20 | )% | | | (5.18 | )% |
| | | | | |
| Ratios/Supplemental Data | | | | | | | | | | | | | | | | | | | | |
| | | | | |
Net assets, end of year (000’s omitted) | | $ | 240,448 | | | $ | 240,042 | | | $ | 244,319 | | | $ | 199,929 | | | $ | 213,185 | |
| | | | | |
Ratios (as a percentage of average daily net assets): | | | | | | | | | | | | | | | | | | | | |
| | | | | |
Expenses excluding interest and fees | | | 1.06 | % | | | 1.09 | % | | | 1.10 | % | | | 1.19 | % | | | 1.22 | % |
| | | | | |
Interest and fee expense(3) | | | 0.35 | % | | | 0.93 | % | | | 1.38 | % | | | 1.35 | % | | | 0.94 | % |
| | | | | |
Total expenses | | | 1.41 | % | | | 2.02 | % | | | 2.48 | % | | | 2.54 | % | | | 2.16 | % |
| | | | | |
Net investment income | | | 3.65 | % | | | 3.68 | % | | | 3.63 | % | | | 4.10 | % | | | 4.41 | % |
| | | | | |
Portfolio Turnover | | | 15 | % | | | 31 | % | | | 25 | % | | | 15 | % | | | 10 | % |
| (1) | Computed using average shares outstanding. |
| (2) | Returns are historical and are calculated by determining the percentage change in net asset value or market value with all distributions reinvested. Distributions are assumed to be reinvested at prices obtained under the Fund’s dividend reinvestment plan. |
| (3) | Interest and fee expense relates to the liability for floating rate notes issued in conjunction with residual interest bond transactions (see Note 1G). |
| | | | |
| | 43 | | See Notes to Financial Statements. |
Eaton Vance
Municipal Bond Funds
September 30, 2021
Notes to Financial Statements
1 Significant Accounting Policies
Eaton Vance Municipal Bond Fund (Municipal Fund), Eaton Vance California Municipal Bond Fund (California Fund) and Eaton Vance New York Municipal Bond Fund (New York Fund), (each individually referred to as the Fund, and collectively, the Funds), are Massachusetts business trusts registered under the Investment Company Act of 1940, as amended (the 1940 Act), as non-diversified, closed-end management investment companies. The Funds’ investment objective is to provide current income exempt from regular federal income tax and, in state specific funds, taxes in its specified state and city (if any).
The following is a summary of significant accounting policies of the Funds. The policies are in conformity with accounting principles generally accepted in the United States of America (U.S. GAAP). Each Fund is an investment company and follows accounting and reporting guidance in the Financial Accounting Standards Board (FASB) Accounting Standards Codification Topic 946.
A Investment Valuation — The following methodologies are used to determine the market value or fair value of investments.
Debt Obligations. Debt obligations are generally valued on the basis of valuations provided by third party pricing services, as derived from such services’ pricing models. Inputs to the models may include, but are not limited to, reported trades, executable bid and ask prices, broker/dealer quotations, prices or yields of securities with similar characteristics, interest rates, anticipated prepayments, benchmark curves or information pertaining to the issuer, as well as industry and economic events. The pricing services may use a matrix approach, which considers information regarding securities with similar characteristics to determine the valuation for a security. Short-term debt obligations purchased with a remaining maturity of sixty days or less for which a valuation from a third party pricing service is not readily available may be valued at amortized cost, which approximates fair value.
Fair Valuation. Investments for which valuations or market quotations are not readily available or are deemed unreliable are valued at fair value using methods determined in good faith by or at the direction of the Trustees of a Fund in a manner that most fairly reflects the security’s “fair value”, which is the amount that a Fund might reasonably expect to receive for the security upon its current sale in the ordinary course. Each such determination is based on a consideration of relevant factors, which are likely to vary from one pricing context to another. These factors may include, but are not limited to, the type of security, the existence of any contractual restrictions on the security’s disposition, the price and extent of public trading in similar securities of the issuer or of comparable companies or entities, quotations or relevant information obtained from broker/dealers or other market participants, information obtained from the issuer, analysts, and/or the appropriate stock exchange (for exchange-traded securities), an analysis of the company’s or entity’s financial statements, and an evaluation of the forces that influence the issuer and the market(s) in which the security is purchased and sold.
B Investment Transactions and Related Income — Investment transactions for financial statement purposes are accounted for on a trade date basis. Realized gains and losses on investments sold are determined on the basis of identified cost. Interest income is recorded on the basis of interest accrued, adjusted for amortization of premium or accretion of discount.
C Federal Taxes — Each Fund’s policy is to comply with the provisions of the Internal Revenue Code applicable to regulated investment companies and to distribute to shareholders each year substantially all of its taxable, if any, and tax-exempt net investment income, and all or substantially all of its net realized capital gains. Accordingly, no provision for federal income or excise tax is necessary. Each Fund intends to satisfy conditions which will enable it to designate distributions from the interest income generated by its investments in non-taxable municipal obligations, which are exempt from regular federal income tax when received by each Fund, as exempt-interest dividends. The portion of such interest, if any, earned on private activity bonds issued after August 7, 1986, may be considered a tax preference item to shareholders.
As of September 30, 2021, the Funds had no uncertain tax positions that would require financial statement recognition, de-recognition, or disclosure. Each Fund files a U.S. federal income tax return annually after its fiscal year-end, which is subject to examination by the Internal Revenue Service for a period of three years from the date of filing.
D Legal Fees — Legal fees and other related expenses incurred as part of negotiations of the terms and requirement of capital infusions, or that are expected to result in the restructuring of, or a plan of reorganization for, an investment are recorded as realized losses. Ongoing expenditures to protect or enhance an investment are treated as operating expenses.
E Use of Estimates — The preparation of the financial statements in conformity with U.S. GAAP requires management to make estimates and assumptions that affect the reported amounts of assets and liabilities at the date of the financial statements and the reported amounts of income and expense during the reporting period. Actual results could differ from those estimates.
F Indemnifications — Under each Fund’s organizational documents, its officers and Trustees may be indemnified against certain liabilities and expenses arising out of the performance of their duties to each Fund. Under Massachusetts law, if certain conditions prevail, shareholders of a Massachusetts business trust (such as a Fund) could be deemed to have personal liability for the obligations of the Fund. However, each Fund’s Declaration of Trust contains an express disclaimer of liability on the part of Fund shareholders and the By-laws provide that the Fund shall assume, upon request by the shareholder, the defense on behalf of any Fund shareholders. Moreover, the By-laws also provide for indemnification out of Fund property of any shareholder held personally liable solely by reason of being or having been a shareholder for all loss or expense arising from such liability. Additionally, in the normal course of business, each Fund enters into agreements with service providers that may contain indemnification clauses. Each Fund’s maximum exposure under these arrangements is unknown as this would involve future claims that may be made against each Fund that have not yet occurred.
Eaton Vance
Municipal Bond Funds
September 30, 2021
Notes to Financial Statements — continued
G Floating Rate Notes Issued in Conjunction with Securities Held — The Funds may invest in residual interest bonds, also referred to as inverse floating rate securities, whereby a Fund may sell a variable or fixed rate bond for cash to a Special-Purpose Vehicle (the SPV), (which is generally organized as a trust), while at the same time, buying a residual interest in the assets and cash flows of the SPV. The bond is deposited into the SPV with the same CUSIP number as the bond sold to the SPV by the Fund, and which may have been, but is not required to be, the bond purchased from the Fund (the Bond). The SPV also issues floating rate notes (Floating Rate Notes) which are sold to third-parties. The residual interest bond held by a Fund gives the Fund the right (1) to cause the holders of the Floating Rate Notes to generally tender their notes at par, and (2) to have the Bond held by the SPV transferred to the Fund, thereby terminating the SPV. Should the Fund exercise such right, it would generally pay the SPV the par amount due on the Floating Rate Notes and exchange the residual interest bond for the underlying Bond. Pursuant to generally accepted accounting principles for transfers and servicing of financial assets and extinguishment of liabilities, the Funds account for the transaction described above as a secured borrowing by including the Bond in their Portfolio of Investments and the Floating Rate Notes as a liability under the caption “Payable for floating rate notes issued” in their Statement of Assets and Liabilities. The Floating Rate Notes have interest rates that generally reset weekly and their holders have the option to tender their notes to the SPV for redemption at par at each reset date. Accordingly, the fair value of the payable for floating rate notes issued approximates its carrying value. If measured at fair value, the payable for floating rate notes would have been considered as Level 2 in the fair value hierarchy (see Note 7) at September 30, 2021. Interest expense related to a Fund’s liability with respect to Floating Rate Notes is recorded as incurred. The SPV may be terminated by the Fund, as noted above, or by the occurrence of certain termination events as defined in the trust agreement, such as a downgrade in the credit quality of the underlying Bond, bankruptcy of or payment failure by the issuer of the underlying Bond, the inability to remarket Floating Rate Notes that have been tendered due to insufficient buyers in the market, or the failure by the SPV to obtain renewal of the liquidity agreement under which liquidity support is provided for the Floating Rate Notes up to one year. At September 30, 2021, the amounts of the Funds’ Floating Rate Notes and related interest rates and collateral were as follows:
| | | | | | | | | | | | |
| | | Municipal
Fund | | | California
Fund | | | New York
Fund | |
| | | |
Floating Rate Notes Outstanding | | $ | 667,925,601 | | | $ | 209,125,012 | | | $ | 125,968,048 | |
| | | |
Interest Rate or Range of Interest Rates (%) | | | 0.05 - 0.35 | | | | 0.07 - 0.13 | | | | 0.07 - 0.10 | |
| | | |
Collateral for Floating Rate Notes Outstanding | | $ | 965,984,199 | | | $ | 302,392,815 | | | $ | 180,549,285 | |
For the year ended September 30, 2021, the Funds’ average settled Floating Rate Notes outstanding and the average interest rate including fees were as follows:
| | | | | | | | | | | | |
| | | Municipal
Fund | | | California
Fund | | | New York
Fund | |
| | | |
Average Floating Rate Notes Outstanding | | $ | 719,073,151 | | | $ | 218,432,945 | | | $ | 142,098,151 | |
| | | |
Average Interest Rate | | | 0.58 | % | | | 0.58 | % | | | 0.60 | % |
In certain circumstances, the Funds may enter into shortfall and forbearance agreements with brokers by which a Fund agrees to reimburse the broker for the difference between the liquidation value of the Bond held by the SPV and the liquidation value of the Floating Rate Notes, as well as any shortfalls in interest cash flows. The Funds had no shortfalls as of September 30, 2021.
The Funds may also purchase residual interest bonds in a secondary market transaction without first owning the underlying bond. Such transactions are not required to be treated as secured borrowings. Shortfall agreements, if any, related to residual interest bonds purchased in a secondary market transaction are disclosed in the Portfolio of Investments.
The Funds’ investment policies and restrictions expressly permit investments in residual interest bonds. Such bonds typically offer the potential for yields exceeding the yields available on fixed rate bonds with comparable credit quality and maturity. These securities tend to underperform the market for fixed rate bonds in a rising long-term interest rate environment, but tend to outperform the market for fixed rate bonds when long-term interest rates decline. The value and income of residual interest bonds are generally more volatile than that of a fixed rate bond. The Funds’ investment policies do not allow the Funds to borrow money except as permitted by the 1940 Act. Management believes that the Funds’ restrictions on borrowing money and issuing senior securities (other than as specifically permitted) do not apply to Floating Rate Notes issued by the SPV and included as a liability in the Funds’ Statement of Assets and Liabilities. As secured indebtedness issued by an SPV, Floating Rate Notes are distinct from the borrowings and senior securities to which the Funds’ restrictions apply. Residual interest bonds held by the Funds are securities exempt from registration under Rule 144A of the Securities Act of 1933.
H When-Issued Securities and Delayed Delivery Transactions — The Funds may purchase securities on a delayed delivery or when-issued basis. Payment and delivery may take place after the customary settlement period for that security. At the time the transaction is negotiated, the price of the security that will be delivered is fixed. The Funds maintain cash and/or security positions for these commitments such that sufficient liquid assets will be available to
Eaton Vance
Municipal Bond Funds
September 30, 2021
Notes to Financial Statements — continued
make payments upon settlement. Securities purchased on a delayed delivery or when-issued basis are marked-to-market daily and begin earning interest on settlement date. Such securities are subject to the risk that when delivered they will be worth less than the agreed upon payment price. Losses may also arise if the counterparty does not perform under the contract.
2 Distributions to Shareholders and Income Tax Information
Each Fund intends to make monthly distributions of net investment income to common shareholders. In addition, at least annually, each Fund intends to distribute all or substantially all of its net realized capital gains. Distributions are recorded on the ex-dividend date. Distributions to shareholders are determined in accordance with income tax regulations, which may differ from U.S. GAAP. As required by U.S. GAAP, only distributions in excess of tax basis earnings and profits are reported in the financial statements as a return of capital. Permanent differences between book and tax accounting relating to distributions are reclassified to paid-in capital. For tax purposes, distributions from short-term capital gains are considered to be from ordinary income.
The tax character of distributions declared for the years ended September 30, 2021 and September 30, 2020 was as follows:
| | | | | | | | | | | | |
| | | Year Ended September 30, 2021 | |
| | | Municipal Fund | | | California Fund | | | New York Fund | |
| | | |
Tax-exempt income | | $ | 42,160,852 | | | $ | 12,285,044 | | | $ | 8,960,196 | |
| | | |
Ordinary income | | $ | 665,679 | | | $ | 282,110 | | | $ | 55,286 | |
| | | |
Tax return of capital | | $ | — | | | $ | — | | | $ | 206,730 | |
| | | | | | | | | | | | |
| | | Year Ended September 30, 2020 | |
| | | Municipal Fund | | | California Fund | | | New York Fund | |
| | | |
Tax-exempt income | | $ | 42,300,988 | | | $ | 11,454,640 | | | $ | 8,666,523 | |
| | | |
Ordinary income | | $ | 337,384 | | | $ | 107,741 | | | $ | 104,543 | |
As of September 30, 2021, the components of distributable earnings (accumulated loss) on a tax basis were as follows:
| | | | | | | | | | | | |
| | | Municipal
Fund | | | California
Fund | | | New York
Fund | |
| | | |
Undistributed tax-exempt income | | $ | 1,400,833 | | | $ | 346,533 | | | $ | — | |
| | | |
Deferred capital losses | | | (37,760,465 | ) | | | (35,610,097 | ) | | | (11,792,238 | ) |
| | | |
Net unrealized appreciation | | | 146,701,435 | | | | 34,854,247 | | | | 22,618,479 | |
| | | |
Distributable earnings (accumulated loss) | | $ | 110,341,803 | | | $ | (409,317 | ) | | $ | 10,826,241 | |
At September 30, 2021, the following Funds, for federal income tax purposes, had deferred capital losses which would reduce the respective Fund’s taxable income arising from future net realized gains on investment transactions, if any, to the extent permitted by the Internal Revenue Code, and thus would reduce the amount of distributions to shareholders, which would otherwise be necessary to relieve the Funds of any liability for federal income or excise tax. The deferred capital losses are treated as arising on the first day of a Fund’s next taxable year and retain the same short-term or long-term character as when originally deferred. The amounts of the deferred capital losses are as follows:
| | | | | | | | | | | | |
| | | Municipal
Fund | | | California
Fund | | | New York
Fund | |
|
Deferred capital losses: | |
| | | |
Short-term | | $ | 37,196,077 | | | $ | 16,096,629 | | | $ | 8,722,573 | |
| | | |
Long-term | | $ | 564,388 | | | $ | 19,513,468 | | | $ | 3,069,665 | |
Eaton Vance
Municipal Bond Funds
September 30, 2021
Notes to Financial Statements — continued
Included in the amounts above are deferred capital losses as a result of reorganizations which occurred in a prior year. Utilization of these deferred capital losses may be limited in accordance with certain income tax regulations. The amounts of the deferred capital losses are as follows:
| | | | | | | | | | | | |
| | | Municipal
Fund | | | California
Fund | | | New York
Fund | |
|
Deferred capital losses from reorganizations: | |
| | | |
Short-term | | $ | — | | | $ | 2,349,785 | | | $ | 1,398,642 | |
| | | |
Long-term | | $ | — | | | $ | 1,908,450 | | | $ | — | |
The cost and unrealized appreciation (depreciation) of investments of each Fund at September 30, 2021, as determined on a federal income tax basis, were as follows:
| | | | | | | | | | | | |
| | | Municipal
Fund | | | California
Fund | | | New York
Fund | |
| | | |
Aggregate cost | | $ | 835,031,672 | | | $ | 268,244,468 | | | $ | 214,958,404 | |
| | | |
Gross unrealized appreciation | | $ | 147,921,778 | | | $ | 35,425,445 | | | $ | 23,157,000 | |
| | | |
Gross unrealized depreciation | | | (1,220,343 | ) | | | (571,198 | ) | | | (538,521 | ) |
| | | |
Net unrealized appreciation | | $ | 146,701,435 | | | $ | 34,854,247 | | | $ | 22,618,479 | |
3 Investment Adviser Fee and Other Transactions with Affiliates
The investment adviser fee is earned by Eaton Vance Management (EVM) as compensation for investment advisory services rendered to each Fund. On March 1, 2021, Morgan Stanley acquired Eaton Vance Corp. (the “Transaction”) and EVM became an indirect, wholly-owned subsidiary of Morgan Stanley. In connection with the Transaction, each Fund entered into a new investment advisory agreement (the “New Agreement”) with EVM, which took effect on March 1, 2021. Each Fund’s prior fee reduction agreement was incorporated into the New Agreement. Pursuant to each Fund’s New Agreement (and each Fund’s investment advisory agreement with EVM in effect prior to March 1, 2021), the investment adviser fee is computed at an annual rate of 0.60% of each Fund’s average weekly gross assets and is payable monthly. Gross assets of a Fund are calculated by deducting accrued liabilities of the Fund except (i) the principal amount of any indebtedness for money borrowed, including debt securities issued by the Fund and the amount of floating-rate notes included as a liability in the Fund’s Statement of Assets and Liabilities of up to $801,875,000 for Municipal Fund, $228,750,000 for California Fund and $165,000,000 for New York Fund, and (ii) the amount of any outstanding preferred shares issued by the Fund. EVM also serves as the administrator of each Fund, but receives no compensation. For the year ended September 30, 2021, the investment adviser fees were as follows:
| | | | | | | | | | | | |
| | | Municipal
Fund | | | California
Fund | | | New York
Fund | |
| | | |
Investment Adviser Fee | | $ | 10,446,240 | | | $ | 3,215,368 | | | $ | 2,325,875 | |
Trustees and officers of the Funds who are members of EVM’s organization receive remuneration for their services to the Funds out of the investment adviser fee. Trustees of the Funds who are not affiliated with EVM may elect to defer receipt of all or a percentage of their annual fees in accordance with the terms of the Trustees Deferred Compensation Plan. For the year ended September 30, 2021, no significant amounts have been deferred. Certain officers and Trustees of the Funds are officers of EVM.
4 Purchases and Sales of Investments
Purchases and sales of investments, other than short-term obligations, for the year ended September 30, 2021 were as follows:
| | | | | | | | | | | | |
| | | Municipal
Fund | | | California
Fund | | | New York
Fund | |
| | | |
Purchases | | $ | 167,361,970 | | | $ | 99,985,372 | | | $ | 58,329,408 | |
| | | |
Sales | | $ | 254,151,224 | | | $ | 117,552,306 | | | $ | 81,571,882 | |
Eaton Vance
Municipal Bond Funds
September 30, 2021
Notes to Financial Statements — continued
5 Common Shares of Beneficial Interest
The Funds may issue common shares pursuant to their dividend reinvestment plans. There were no common shares issued by the Funds for the years ended September 30, 2021 and September 30, 2020 pursuant to such plans.
In November 2013, the Board of Trustees initially approved a share repurchase program for the Funds. Pursuant to the reauthorization of the share repurchase program by the Board of Trustees in March 2019, each Fund is authorized to repurchase up to 10% of its common shares outstanding as of the last day of the prior calendar year at market prices when shares are trading at a discount to net asset value (NAV). The share repurchase program does not obligate a Fund to purchase a specific amount of shares. There were no repurchases of common shares by the Funds for the years ended September 30, 2021 and September 30, 2020.
On November 14, 2019, Municipal Fund commenced a cash tender offer for up to 5% or 3,986,326 of its outstanding common shares at a price equal to 98% of the Fund’s net asset value per share (the “tender price”) as of the close of regular trading on the New York Stock Exchange on the date the tender offer expired. The tender offer expired at 5:00 P.M. Eastern Time on December 13, 2019. In accordance with the terms and conditions of the tender offer, because the number of shares tendered exceeded the number of shares offered to purchase, Municipal Fund purchased shares from tendering shareholders on a pro-rata basis (disregarding fractional shares). The purchase price of the properly tendered shares was equal to $13.6639 per share for an aggregate purchase price of $54,468,760.
On June 25, 2020, Municipal Fund commenced a cash tender offer for up to 5% or 3,787,010 of its outstanding common shares at the tender price as of the close of regular trading on the New York Stock Exchange on the date the tender offer expired. The tender offer expired at 5:00 P.M. Eastern Time on July 24, 2020. In accordance with the terms and conditions of the tender offer, because the number of shares tendered exceeded the number of shares offered to purchase, Municipal Fund purchased shares from tendering shareholders on a pro-rata basis (disregarding fractional shares). The purchase price of the properly tendered shares was equal to $13.9337 per share for an aggregate purchase price of $52,767,061.
At September 30, 2021, according to the filings made on Schedule 13D and 13G pursuant to Sections 13(d) and 13(g) of the Securities Exchange Act of 1934, as amended, three affiliated entities together owned 10.8% of California Fund’s common shares.
6 Overdraft Advances
Pursuant to the custodian agreement, State Street Bank and Trust Company (SSBT) may, in its discretion, advance funds to the Funds to make properly authorized payments. When such payments result in an overdraft, the Funds are obligated to repay SSBT at the current rate of interest charged by SSBT for secured loans (currently, the Federal Funds rate plus 2%). This obligation is payable on demand to SSBT. SSBT has a lien on a Fund’s assets to the extent of any overdraft. At September 30, 2021, California Fund and New York Fund had a payment due to SSBT pursuant to the foregoing arrangement of $6,745,192 and $1,580,801, respectively. Based on the short-term nature of these payments and the variable interest rate, the carrying value of the overdraft advances approximated its fair value at September 30, 2021. If measured at fair value, overdraft advances would have been considered as Level 2 in the fair value hierarchy (see Note 7) at September 30, 2021. The Funds’ average overdraft advances during the year ended September 30, 2021 were not significant.
7 Fair Value Measurements
Under generally accepted accounting principles for fair value measurements, a three-tier hierarchy to prioritize the assumptions, referred to as inputs, is used in valuation techniques to measure fair value. The three-tier hierarchy of inputs is summarized in the three broad levels listed below.
| • | | Level 1 – quoted prices in active markets for identical investments |
| • | | Level 2 – other significant observable inputs (including quoted prices for similar investments, interest rates, prepayment speeds, credit risk, etc.) |
| • | | Level 3 – significant unobservable inputs (including a fund’s own assumptions in determining the fair value of investments) |
In cases where the inputs used to measure fair value fall in different levels of the fair value hierarchy, the level disclosed is determined based on the lowest level input that is significant to the fair value measurement in its entirety. The inputs or methodology used for valuing securities are not necessarily an indication of the risk associated with investing in those securities.
Eaton Vance
Municipal Bond Funds
September 30, 2021
Notes to Financial Statements — continued
At September 30, 2021, the hierarchy of inputs used in valuing the Funds’ investments, which are carried at value, were as follows:
| | | | | | | | | | | | | | | | |
Municipal Fund | | | | | | | | | | | | |
| Asset Description | | Level 1 | | | Level 2 | | | Level 3 | | | Total | |
| | | | |
Corporate Bonds | | $ | — | | | $ | 14,469,239 | | | $ | — | | | $ | 14,469,239 | |
| | | | |
Tax-Exempt Mortgage-Backed Securities | | | — | | | | 3,759,454 | | | | — | | | | 3,759,454 | |
| | | | |
Tax-Exempt Municipal Obligations | | | — | | | | 1,611,795,882 | | | | — | | | | 1,611,795,882 | |
| | | | |
Taxable Municipal Obligations | | | — | | | | 19,634,133 | | | | — | | | | 19,634,133 | |
| | | | |
Total Investments | | $ | — | | | $ | 1,649,658,708 | | | $ | — | | | $ | 1,649,658,708 | |
| | | | |
California Fund | | | | | | | | | | | | |
| Asset Description | | Level 1 | | | Level 2 | | | Level 3 | | | Total | |
| | | | |
Tax-Exempt Mortgage-Backed Securities | | $ | — | | | $ | 1,815,313 | | | $ | — | | | $ | 1,815,313 | |
| | | | |
Tax-Exempt Municipal Obligations | | | — | | | | 485,908,746 | | | | — | | | | 485,908,746 | |
| | | | |
Taxable Municipal Obligations | | | — | | | | 24,499,668 | | | | — | | | | 24,499,668 | |
| | | | |
Total Investments | | $ | — | | | $ | 512,223,727 | | | $ | — | | | $ | 512,223,727 | |
| | | | |
New York Fund | | | | | | | | | | | | |
| Asset Description | | Level 1 | | | Level 2 | | | Level 3 | | | Total | |
| | | | |
Corporate Bonds | | $ | — | | | $ | 1,406,298 | | | $ | — | | | $ | 1,406,298 | |
| | | | |
Tax-Exempt Municipal Obligations | | | — | | | | 361,898,981 | | | | — | | | | 361,898,981 | |
| | | | |
Taxable Municipal Obligations | | | — | | | | 239,652 | | | | — | | | | 239,652 | |
| | | | |
Total Investments | | $ | — | | | $ | 363,544,931 | | | $ | — | | | $ | 363,544,931 | |
8 Risks and Uncertainties
Pandemic Risk
An outbreak of respiratory disease caused by a novel coronavirus was first detected in China in late 2019 and subsequently spread internationally. This coronavirus has resulted in closing borders, enhanced health screenings, changes to healthcare service preparation and delivery, quarantines, cancellations, disruptions to supply chains and customer activity, as well as general concern and uncertainty. Health crises caused by outbreaks, such as the coronavirus outbreak, may exacerbate other pre-existing political, social and economic risks and disrupt normal market conditions and operations. The impact of this outbreak has negatively affected the worldwide economy, the economies of individual countries, individual companies, and the market in general, and may continue to do so in significant and unforeseen ways, as may other epidemics and pandemics that may arise in the future. Any such impact could adversely affect the Funds’ performance, or the performance of the securities in which the Funds invest.
Eaton Vance
Municipal Bond Funds
September 30, 2021
Report of Independent Registered Public Accounting Firm
To the Trustees and Shareholders of Eaton Vance Municipal Bond Fund, Eaton Vance California Municipal Bond Fund and Eaton Vance New York Municipal Bond Fund:
Opinion on the Financial Statements and Financial Highlights
We have audited the accompanying statements of assets and liabilities of Eaton Vance Municipal Bond Fund, Eaton Vance California Municipal Bond Fund and Eaton Vance New York Municipal Bond Fund (collectively, the “Funds”), including the portfolios of investments, as of September 30, 2021, the related statements of operations and cash flows for the year then ended, the statements of changes in net assets for each of the two years in the period then ended, the financial highlights for each of the five years in the period then ended, and the related notes. In our opinion, the financial statements and financial highlights present fairly, in all material respects, the financial position of each of the Funds as of September 30, 2021, and the results of their operations and their cash flows for the year then ended, the changes in their net assets for each of the two years in the period then ended, and the financial highlights for each of the five years in the period then ended, in conformity with accounting principles generally accepted in the United States of America.
Basis for Opinion
These financial statements and financial highlights are the responsibility of the Funds’ management. Our responsibility is to express an opinion on the Funds’ financial statements and financial highlights based on our audits. We are a public accounting firm registered with the Public Company Accounting Oversight Board (United States) (PCAOB) and are required to be independent with respect to the Funds in accordance with the U.S. federal securities laws and the applicable rules and regulations of the Securities and Exchange Commission and the PCAOB.
We conducted our audits in accordance with the standards of the PCAOB. Those standards require that we plan and perform the audit to obtain reasonable assurance about whether the financial statements and financial highlights are free of material misstatement, whether due to error or fraud. The Funds are not required to have, nor were we engaged to perform, an audit of their internal control over financial reporting. As part of our audits we are required to obtain an understanding of internal control over financial reporting but not for the purpose of expressing an opinion on the effectiveness of the Funds’ internal control over financial reporting. Accordingly, we express no such opinion.
Our audits included performing procedures to assess the risks of material misstatement of the financial statements and financial highlights, whether due to error or fraud, and performing procedures that respond to those risks. Such procedures included examining, on a test basis, evidence regarding the amounts and disclosures in the financial statements and financial highlights. Our audits also included evaluating the accounting principles used and significant estimates made by management, as well as evaluating the overall presentation of the financial statements and financial highlights. Our procedures included confirmation of securities owned as of September 30, 2021, by correspondence with the custodian and brokers; when replies were not received from brokers, we performed other auditing procedures. We believe that our audits provide a reasonable basis for our opinion.
/s/ Deloitte & Touche LLP
Boston, Massachusetts
November 19, 2021
We have served as the auditor of one or more Eaton Vance investment companies since 1959.
Eaton Vance
Municipal Bond Funds
September 30, 2021
Federal Tax Information (Unaudited)
The Form 1099-DIV you receive in February 2022 will show the tax status of all distributions paid to your account in calendar year 2021. Shareholders are advised to consult their own tax adviser with respect to the tax consequences of their investment in the Funds. As required by the Internal Revenue Code and/or regulations, shareholders must be notified regarding exempt-interest dividends.
Exempt-Interest Dividends. For the fiscal year ended September 30, 2021, the Funds designate the following percentages of distributions from net investment income as exempt-interest dividends:
| | | | |
| |
Municipal Bond Fund | | | 98.45 | % |
| |
California Municipal Bond Fund | | | 97.76 | % |
| |
New York Municipal Bond Fund | | | 99.40 | % |
Eaton Vance
Municipal Bond Funds
September 30, 2021
Annual Meeting of Shareholders (Unaudited)
Each Fund held its Annual Meeting of Shareholders on July 15, 2021. The following action was taken by the shareholders:
Proposal 1. The election of Mark R. Fetting, Valerie A. Mosley, William H. Park and Keith Quinton as Class I Trustees of each Fund, each for a three-year term ending in 2024.
| | | | | | | | | | | | | | | | |
| | | Nominee for Trustee: Mark R. Fetting | | | Nominee for Trustee: Valerie A. Mosley | | | Nominee for Trustee: William H. Park | | | Nominee for Trustee: Keith Quinton | |
| | | | |
California Fund | | | | | | | | | | | | | | | | |
| | | | |
For | | | 16,255,182 | | | | 16,240,738 | | | | 16,222,126 | | | | 16,254,578 | |
| | | | |
Withheld | | | 4,761,921 | | | | 4,776,365 | | | | 4,794,977 | | | | 4,762,525 | |
| | | | |
Municipal Fund | | | | | | | | | | | | | | | | |
| | | | |
For | | | 48,935,716 | | | | 48,894,115 | | | | 48,725,865 | | | | 48,908,819 | |
| | | | |
Withheld | | | 12,693,409 | | | | 12,735,010 | | | | 12,903,260 | | | | 12,720,306 | |
| | | | |
New York Fund | | | | | | | | | | | | | | | | |
| | | | |
For | | | 11,309,698 | | | | 11,279,879 | | | | 11,306,293 | | | | 11,287,086 | |
| | | | |
Withheld | | | 3,806,051 | | | | 3,835,870 | | | | 3,809,456 | | | | 3,828,663 | |
Eaton Vance
Municipal Bond Funds
September 30, 2021
Dividend Reinvestment Plan
Each Fund offers a dividend reinvestment plan (Plan) pursuant to which shareholders may elect to have distributions automatically reinvested in common shares (Shares) of the Fund. You may elect to participate in the Plan by completing the Dividend Reinvestment Plan Application Form. If you do not participate, you will receive all distributions in cash paid by check mailed directly to you by American Stock Transfer & Trust Company, LLC (AST) as dividend paying agent. On the distribution payment date, if the NAV per Share is equal to or less than the market price per Share plus estimated brokerage commissions, then new Shares will be issued. The number of Shares shall be determined by the greater of the NAV per Share or 95% of the market price. Otherwise, Shares generally will be purchased on the open market by AST, the Plan agent (Agent). Distributions subject to income tax (if any) are taxable whether or not Shares are reinvested.
If your Shares are in the name of a brokerage firm, bank, or other nominee, you can ask the firm or nominee to participate in the Plan on your behalf. If the nominee does not offer the Plan, you will need to request that the Fund’s transfer agent re-register your Shares in your name or you will not be able to participate.
The Agent’s service fee for handling distributions will be paid by the Fund. Plan participants will be charged their pro rata share of brokerage commissions on all open-market purchases.
Plan participants may withdraw from the Plan at any time by writing to the Agent at the address noted on the following page. If you withdraw, you will receive Shares in your name for all Shares credited to your account under the Plan. If a participant elects by written notice to the Agent to sell part or all of his or her Shares and remit the proceeds, the Agent is authorized to deduct a $5.00 fee plus brokerage commissions from the proceeds.
If you wish to participate in the Plan and your Shares are held in your own name, you may complete the form on the following page and deliver it to the Agent. Any inquiries regarding the Plan can be directed to the Agent at 1-866-439-6787.
Eaton Vance
Municipal Bond Funds
September 30, 2021
Application for Participation in Dividend Reinvestment Plan
This form is for shareholders who hold their common shares in their own names. If your common shares are held in the name of a brokerage firm, bank, or other nominee, you should contact your nominee to see if it will participate in the Plan on your behalf. If you wish to participate in the Plan, but your brokerage firm, bank, or nominee is unable to participate on your behalf, you should request that your common shares be re-registered in your own name which will enable your participation in the Plan.
The following authorization and appointment is given with the understanding that I may terminate it at any time by terminating my participation in the Plan as provided in the terms and conditions of the Plan.
Please print exact name on account
Shareholder signature Date
Shareholder signature Date
Please sign exactly as your common shares are registered. All persons whose names appear on the share certificate must sign.
YOU SHOULD NOT RETURN THIS FORM IF YOU WISH TO RECEIVE YOUR DISTRIBUTIONS IN CASH. THIS IS NOT A PROXY.
This authorization form, when signed, should be mailed to the following address:
Eaton Vance Municipal Bond Funds
c/o American Stock Transfer & Trust Company, LLC
P.O. Box 922
Wall Street Station
New York, NY 10269-0560
Eaton Vance
Municipal Bond Funds
September 30, 2021
Management and Organization
Fund Management. The Trustees of Eaton Vance Municipal Bond Fund, Eaton Vance California Municipal Bond Fund and Eaton Vance New York Municipal Bond Fund (the Funds) are responsible for the overall management and supervision of the Funds’ affairs. The Trustees and officers of the Funds are listed below. Except as indicated, each individual has held the office shown or other offices in the same company for the last five years. The “Noninterested Trustees” consist of those Trustees who are not “interested persons” of the Funds, as that term is defined under the 1940 Act. The business address of each Trustee and officer is Two International Place, Boston, Massachusetts 02110. As used below, “EVC” refers to Eaton Vance Corp., “EV” refers to EV LLC, “EVM” refers to Eaton Vance Management, “BMR” refers to Boston Management and Research and “EVD” refers to Eaton Vance Distributors, Inc. EV is the trustee of each of EVM and BMR. Effective March 1, 2021, each of EVM, BMR, EVD and EV are indirect, wholly owned subsidiaries of Morgan Stanley. Each officer affiliated with EVM may hold a position with other EVM affiliates that is comparable to his or her position with EVM listed below. Each Trustee oversees 138 portfolios (with the exception of Messrs. Faust and Wennerholm and Ms. Frost who oversee 137 portfolios) in the Eaton Vance Complex (including all master and feeder funds in a master feeder structure). Each officer serves as an officer of certain other Eaton Vance funds. Each Trustee serves for a three-year term. Each officer serves until his or her successor is elected.
| | | | | | |
| Name and Year of Birth | | Fund Position(s) | | Term
Expiring. Trustee
Since(1) | | Principal Occupation(s) and Other Directorships During Past Five Years and Other Relevant Experience |
| | | |
| Interested Trustee | | | | | | |
| | | |
Thomas E. Faust Jr. 1958 | | Class II Trustee | | Until 2022. Trustee since 2007. | | Chairman of Morgan Stanley Investment Management, Inc. (MSIM), member of the Board of Managers and President of EV, Chief Executive Officer of EVM and BMR, and Director of EVD. Formerly, Chairman, Chief Executive Officer and President of EVC. Trustee and/or officer of 137 registered investment companies. Mr. Faust is an interested person because of his positions with MSIM, BMR, EVM, EVD, and EV, which are affiliates of the Funds, and his former position with EVC, which was an affiliate of the Funds prior to March 1, 2021. Other Directorships in the Last Five Years. Formerly, Director of EVC (2007-2021) and Hexavest Inc. (investment management firm) (2012-2021). |
| | |
| Noninterested Trustees | | | | |
| | | |
Mark R. Fetting 1954 | | Class I Trustee | | Until 2024. Trustee since 2016. | | Private investor. Formerly held various positions at Legg Mason, Inc. (investment management firm) (2000-2012), including President, Chief Executive Officer, Director and Chairman (2008-2012), Senior Executive Vice President (2004-2008) and Executive Vice President (2001-2004). Formerly, President of Legg Mason family of funds (2001-2008). Formerly, Division President and Senior Officer of Prudential Financial Group, Inc. and related companies (investment management firm) (1991-2000). Other Directorships in the Last Five Years. None. |
| | | |
Cynthia E. Frost 1961 | | Class II Trustee | | Until 2022. Trustee since 2014. | | Private investor. Formerly, Chief Investment Officer of Brown University (university endowment) (2000-2012). Formerly, Portfolio Strategist for Duke Management Company (university endowment manager) (1995-2000). Formerly, Managing Director, Cambridge Associates (investment consulting company) (1989-1995). Formerly, Consultant, Bain and Company (management consulting firm) (1987-1989). Formerly, Senior Equity Analyst, BA Investment Management Company (1983-1985). Other Directorships in the Last Five Years. None. |
| | | |
George J. Gorman 1952 | | Chairperson of the Board and Class III Trustee | | Until 2023. Chairperson of the Board since 2021 and Trustee since 2014. | | Principal at George J. Gorman LLC (consulting firm). Formerly, Senior Partner at Ernst & Young LLP (a registered public accounting firm) (1974-2009). Other Directorships in the Last Five Years. None. |
Eaton Vance
Municipal Bond Funds
September 30, 2021
Management and Organization — continued
| | | | | | |
| Name and Year of Birth | | Fund Position(s) | | Term
Expiring. Trustee
Since(1) | | Principal Occupation(s) and Other Directorships During Past Five Years and Other Relevant Experience |
| | |
| Noninterested Trustees (continued) | | | | |
| | | |
Valerie A. Mosley 1960 | | Class I Trustee | | Until 2024. Trustee since 2014. | | Chairwoman and Chief Executive Officer of Valmo Ventures (a consulting and investment firm). Founder of Upward Wealth, Inc., dba BrightUP, a fintech platform. Formerly, Partner and Senior Vice President, Portfolio Manager and Investment Strategist at Wellington Management Company, LLP (investment management firm) (1992-2012). Formerly, Chief Investment Officer, PG Corbin Asset Management (1990-1992). Formerly worked in institutional corporate bond sales at Kidder Peabody (1986-1990). Other Directorships in the Last Five Years. Director of DraftKings, Inc. (digital sports entertainment and gaming company) (since September 2020). Director of Groupon, Inc. (e-commerce provider) (since April 2020). Director of Envestnet, Inc. (provider of intelligent systems for wealth management and financial wellness) (since 2018). Formerly, Director of Dynex Capital, Inc. (mortgage REIT) (2013-2020). |
| | | |
William H. Park 1947 | | Class I Trustee | | Until 2024. Trustee since 2003. | | Private investor. Formerly, Consultant (management and transactional) (2012-2014). Formerly, Chief Financial Officer, Aveon Group L.P. (investment management firm) (2010-2011). Formerly, Vice Chairman, Commercial Industrial Finance Corp. (specialty finance company) (2006-2010). Formerly, President and Chief Executive Officer, Prizm Capital Management, LLC (investment management firm) (2002-2005). Formerly, Executive Vice President and Chief Financial Officer, United Asset Management Corporation (investment management firm) (1982-2001). Formerly, Senior Manager, Price Waterhouse (now PricewaterhouseCoopers) (a registered public accounting firm) (1972-1981). Other Directorships in the Last Five Years. None. |
| | | |
Helen Frame Peters 1948 | | Class III Trustee | | Until 2023. Trustee since 2008. | | Professor of Finance, Carroll School of Management, Boston College. Formerly, Dean, Carroll School of Management, Boston College (2000-2002). Formerly, Chief Investment Officer, Fixed Income, Scudder Kemper Investments (investment management firm) (1998-1999). Formerly, Chief Investment Officer, Equity and Fixed Income, Colonial Management Associates (investment management firm) (1991-1998). Other Directorships in the Last Five Years. None. |
| | | |
Keith Quinton 1958 | | Class I Trustee | | Until 2024. Trustee since 2018. | | Private investor, researcher and lecturer. Formerly, Independent Investment Committee Member at New Hampshire Retirement System (2017-2021). Formerly, Portfolio Manager and Senior Quantitative Analyst at Fidelity Investments (investment management firm) (2001-2014). Other Directorships in the Last Five Years. Formerly, Director (2016-2021) and Chairman (2019-2021) of New Hampshire Municipal Bond Bank. |
| | | |
Marcus L. Smith 1966 | | Class III Trustee | | Until 2023. Trustee since 2018. | | Private investor. Formerly, Portfolio Manager at MFS Investment Management (investment management firm) (1994-2017). Other Directorships in the Last Five Years. Director of First Industrial Realty Trust, Inc. (an industrial REIT) (since 2021). Director of MSCI Inc. (global provider of investment decision support tools) (since 2017). Formerly, Director of DCT Industrial Trust Inc. (logistics real estate company) (2017-2018). |
| | | |
Susan J. Sutherland 1957 | | Class III Trustee | | Until 2023. Trustee since 2015. | | Private investor. Director of Ascot Group Limited and certain of its subsidiaries (insurance and reinsurance) (since 2017). Formerly, Director of Hagerty Holding Corp. (insurance) (2015-2018) and Montpelier Re Holdings Ltd. (insurance and reinsurance) (2013-2015). Formerly, Associate, Counsel and Partner at Skadden, Arps, Slate, Meagher & Flom LLP (law firm) (1982-2013). Other Directorships in the Last Five Years. Director of Kairos Acquisition Corp. (insurance/InsurTech acquisition company) (since 2021). |
| | | |
Scott E. Wennerholm 1959 | | Class II Trustee | | Until 2022. Trustee since 2016. | | Private investor. Formerly, Trustee at Wheelock College (postsecondary institution) (2012-2018). Formerly, Consultant at GF Parish Group (executive recruiting firm) (2016-2017). Formerly, Chief Operating Officer and Executive Vice President at BNY Mellon Asset Management (investment management firm) (2005-2011). Formerly, Chief Operating Officer and Chief Financial Officer at Natixis Global Asset Management (investment management firm) (1997-2004). Formerly, Vice President at Fidelity Investments Institutional Services (investment management firm) (1994-1997). Other Directorships in the Last Five Years. None. |
Eaton Vance
Municipal Bond Funds
September 30, 2021
Management and Organization — continued
| | | | | | |
| Name and Year of Birth | | Fund Position(s) | | Officer
Since(2) | | Principal Occupation(s) During Past Five Years |
| |
| Principal Officers who are not Trustees | | |
| | | |
Eric A. Stein 1980 | | President | | 2020 | | Vice President and Chief Investment Officer, Fixed Income of EVM and BMR. Prior to November 1, 2020, Mr. Stein was a co-Director of Eaton Vance’s Global Income Investments. Also Vice President of Calvert Research and Management (“CRM”). |
| | | |
Deidre E. Walsh 1971 | | Vice President and Chief Legal Officer | | 2009 | | Vice President of EVM and BMR. Also Vice President of CRM. |
| | | |
James F. Kirchner 1967 | | Treasurer | | 2007 | | Vice President of EVM and BMR. Also Vice President of CRM. |
| | | |
Kimberly M. Roessiger 1985 | | Secretary | | 2021 | | Vice President of EVM and BMR. |
| | | |
Richard F. Froio 1968 | | Chief Compliance Officer | | 2017 | | Vice President of EVM and BMR since 2017. Formerly, Deputy Chief Compliance Officer (Adviser/Funds) and Chief Compliance Officer (Distribution) at PIMCO (2012-2017) and Managing Director at BlackRock/Barclays Global Investors (2009-2012). |
| (1) | Year first appointed to serve as Trustee for a fund in the Eaton Vance family of funds. Each Trustee has served continuously since appointment unless indicated otherwise. |
| (2) | Year first elected to serve as officer of a fund in the Eaton Vance family of funds when the officer has served continuously. Otherwise, year of most recent election as an officer of a fund in the Eaton Vance family of funds. Titles may have changed since initial election. |
Eaton Vance Funds
| | |
| Privacy Notice | | April 2021 |
| | |
| |
| FACTS | | WHAT DOES EATON VANCE DO WITH YOUR
PERSONAL INFORMATION? |
| | | |
| |
| | |
| Why? | | Financial companies choose how they share your personal information. Federal law gives consumers the right to limit some but not all sharing. Federal law also requires us to tell you how we collect, share, and protect your personal information. Please read this notice carefully to understand what we do. |
| | |
| | | |
| What? | | The types of personal information we collect and share depend on the product or service you have with us. This information can include: ∎ Social Security number and income ∎ investment experience and risk tolerance ∎ checking account number and wire transfer instructions |
| | |
| | | |
| How? | | All financial companies need to share customers’ personal information to run their everyday business. In the section below, we list the reasons financial companies can share their customers’ personal information; the reasons Eaton Vance chooses to share; and whether you can limit this sharing. |
| | |
| | | |
| | | | |
Reasons we can share your
personal information | | Does Eaton Vance share? | | Can you limit this sharing? |
| For our everyday business purposes — such as to process your transactions, maintain your account(s), respond to court orders and legal investigations, or report to credit bureaus | | Yes | | No |
| For our marketing purposes — to offer our products and services to you | | Yes | | No |
| For joint marketing with other financial companies | | No | | We don’t share |
| For our investment management affiliates’ everyday business purposes — information about your transactions, experiences, and creditworthiness | | Yes | | Yes |
| For our affiliates’ everyday business purposes — information about your transactions and experiences | | Yes | | No |
| For our affiliates’ everyday business purposes — information about your creditworthiness | | No | | We don’t share |
| For our investment management affiliates to market to you | | Yes | | Yes |
| For our affiliates to market to you | | No | | We don’t share |
| For nonaffiliates to market to you | | No | | We don’t share |
| | |
| To limit our sharing | | Call toll-free 1-800-262-1122 or email: EVPrivacy@eatonvance.com Please note: If you are a new customer, we can begin sharing your information 30 days from the date we sent this notice. When you are no longer our customer, we continue to share your information as described in this notice. However, you can contact us at any time to limit our sharing. |
| | |
| | | |
| | |
| Questions? | | Call toll-free 1-800-262-1122 or email: EVPrivacy@eatonvance.com |
| | |
| | | |
Eaton Vance Funds
| | |
| Privacy Notice — continued | | April 2021 |
| | |
| Who we are |
| Who is providing this notice? | | Eaton Vance Management, Eaton Vance Distributors, Inc., Eaton Vance Trust Company, Eaton Vance Management (International) Limited, Eaton Vance Advisers International Ltd., Eaton Vance Global Advisors Limited, Eaton Vance Management’s Real Estate Investment Group, Boston Management and Research, Calvert Research and Management, Eaton Vance and Calvert Fund Families and our investment advisory affiliates (“Eaton Vance”) (see Investment Management Affiliates definition below) |
| What we do |
| How does Eaton Vance protect my personal information? | | To protect your personal information from unauthorized access and use, we use security measures that comply with federal law. These measures include computer safeguards and secured files and buildings. We have policies governing the proper handling of customer information by personnel and requiring third parties that provide support to adhere to appropriate security standards with respect to such information. |
| How does Eaton Vance collect my personal information? | | We collect your personal information, for example, when you ∎ open an account or make deposits or withdrawals from your account ∎ buy securities from us or make a wire transfer ∎ give us your contact information We also collect your personal information from others, such as credit bureaus, affiliates, or other companies. |
| Why can’t I limit all sharing? | | Federal law gives you the right to limit only ∎ sharing for affiliates’ everyday business purposes — information about your creditworthiness ∎ affiliates from using your information to market to you ∎ sharing for nonaffiliates to market to you State laws and individual companies may give you additional rights to limit sharing. See below for more on your rights under state law. |
| Definitions |
| Investment Management Affiliates | | Eaton Vance Investment Management Affiliates include registered investment advisers, registered broker-dealers, and registered and unregistered funds. Investment Management Affiliates does not include entities associated with Morgan Stanley Wealth Management, such as Morgan Stanley Smith Barney LLC and Morgan Stanley & Co. |
| Affiliates | | Companies related by common ownership or control. They can be financial and nonfinancial companies. ∎ Our affiliates include companies with a Morgan Stanley name and financial companies such as Morgan Stanley Smith Barney LLC and Morgan Stanley & Co. |
| Nonaffiliates | | Companies not related by common ownership or control. They can be financial and nonfinancial companies. ∎ Eaton Vance does not share with nonaffiliates so they can market to you. |
| Joint marketing | | A formal agreement between nonaffiliated financial companies that together market financial products or services to you. ∎ Eaton Vance doesn’t jointly market. |
| Other important information |
Vermont: Except as permitted by law, we will not share personal information we collect about Vermont residents with Nonaffiliates unless you provide us with your written consent to share such information. California: Except as permitted by law, we will not share personal information we collect about California residents with Nonaffiliates and we will limit sharing such personal information with our Affiliates to comply with California privacy laws that apply to us. |
Eaton Vance
Municipal Bond Funds
September 30, 2021
Potential Conflicts of Interest
As a diversified global financial services firm, Morgan Stanley engages in a broad spectrum of activities, including financial advisory services, investment management activities, lending, commercial banking, sponsoring and managing private investment funds, engaging in broker-dealer transactions and principal securities, commodities and foreign exchange transactions, research publication and other activities. In the ordinary course of its business, Morgan Stanley is a full-service investment banking and financial services firm and therefore engages in activities where Morgan Stanley’s interests or the interests of its clients may conflict with the interests of a Fund or Portfolio, if applicable, (collectively for the purposes of this section, “Fund” or “Funds”). Morgan Stanley advises clients and sponsors, manages or advises other investment funds and investment programs, accounts and businesses (collectively, together with the Morgan Stanley funds, any new or successor funds, programs, accounts or businesses (other than funds, programs, accounts or businesses sponsored, managed, or advised by former direct or indirect subsidiaries of Eaton Vance Corp. (“Eaton Vance Investment Accounts”)), the ‘‘MS Investment Accounts, and, together with the Eaton Vance Investment Accounts, the “Affiliated Investment Accounts’’) with a wide variety of investment objectives that in some instances may overlap or conflict with a Fund’s investment objectives and present conflicts of interest. In addition, Morgan Stanley or the investment adviser may also from time to time create new or successor Affiliated Investment Accounts that may compete with a Fund and present similar conflicts of interest. The discussion below enumerates certain actual, apparent and potential conflicts of interest. There is no assurance that conflicts of interest will be resolved in favor of Fund shareholders and, in fact, they may not be. Conflicts of interest not described below may also exist.
The discussions below with respect to actual, apparent and potential conflicts of interest also may be applicable to or arise from the MS Investment Accounts whether or not specifically identified.
Material Non-public and Other Information. It is expected that confidential or material non-public information regarding an investment or potential investment opportunity may become available to the investment adviser. If such information becomes available, the investment adviser may be precluded (including by applicable law or internal policies or procedures) from pursuing an investment or disposition opportunity with respect to such investment or investment opportunity. The investment adviser may also from time to time be subject to contractual ‘‘stand-still’’ obligations and/or confidentiality obligations that may restrict its ability to trade in certain investments on a Fund’s behalf. In addition, the investment adviser may be precluded from disclosing such information to an investment team, even in circumstances in which the information would be beneficial if disclosed. Therefore, the investment team may not be provided access to material non-public information in the possession of Morgan Stanley that might be relevant to an investment decision to be made on behalf of a Fund, and the investment team may initiate a transaction or sell an investment that, if such information had been known to it, may not have been undertaken. In addition, certain members of the investment team may be recused from certain investment-related discussions so that such members do not receive information that would limit their ability to perform functions of their employment with the investment adviser or its affiliates unrelated to that of a Fund. Furthermore, access to certain parts of Morgan Stanley may be subject to third party confidentiality obligations and to information barriers established by Morgan Stanley in order to manage potential conflicts of interest and regulatory restrictions, including without limitation joint transaction restrictions pursuant to the 1940 Act. Accordingly, the investment adviser’s ability to source investments from other business units within Morgan Stanley may be limited and there can be no assurance that the investment adviser will be able to source any investments from any one or more parts of the Morgan Stanley network.
The investment adviser may restrict its investment decisions and activities on behalf of the Funds in various circumstances, including because of applicable regulatory requirements or information held by the investment adviser or Morgan Stanley. The investment adviser might not engage in transactions or other activities for, or enforce certain rights in favor of, a Fund due to Morgan Stanley’s activities outside the Funds. In instances where trading of an investment is restricted, the investment adviser may not be able to purchase or sell such investment on behalf of a Fund, resulting in the Fund’s inability to participate in certain desirable transactions. This inability to buy or sell an investment could have an adverse effect on a Fund’s portfolio due to, among other things, changes in an investment’s value during the period its trading is restricted. Also, in situations where the investment adviser is required to aggregate its positions with those of other Morgan Stanley business units for position limit calculations, the investment adviser may have to refrain from making investments due to the positions held by other Morgan Stanley business units or their clients. There may be other situations where the investment adviser refrains from making an investment due to additional disclosure obligations, regulatory requirements, policies, and reputational risk, or the investment adviser may limit purchases or sales of securities in respect of which Morgan Stanley is engaged in an underwriting or other distribution capacity.
Morgan Stanley has established certain information barriers and other policies to address the sharing of information between different businesses within Morgan Stanley. As a result of information barriers, the investment adviser generally will not have access, or will have limited access, to certain information and personnel in other areas of Morgan Stanley and generally will not manage the Funds with the benefit of the information held by such other areas. Morgan Stanley, due to its access to and knowledge of funds, markets and securities based on its prime brokerage and other businesses, may make decisions based on information or take (or refrain from taking) actions with respect to interests in investments of the kind held (directly or indirectly) by the Funds in a manner that may be adverse to the Funds, and will not have any obligation or other duty to share information with the investment adviser.
In limited circumstances, however, including for purposes of managing business and reputational risk, and subject to policies and procedures and any applicable regulations, Morgan Stanley personnel, including personnel of the investment adviser, on one side of an information barrier may have access to information and personnel on the other side of the information barrier through “wall crossings.” The investment adviser faces conflicts of interest in determining whether to engage in such wall crossings. Information obtained in connection with such wall crossings may limit or restrict the ability of the investment adviser to engage in or otherwise effect transactions on behalf of the Funds (including purchasing or selling securities that the investment adviser may otherwise have purchased or sold for a Fund in the absence of a wall crossing). In managing conflicts of interest that arise because of the foregoing, the investment adviser generally will be subject to fiduciary requirements. The investment adviser may also implement internal information barriers or ethical walls, and the conflicts described herein with respect to information barriers and otherwise with respect to Morgan Stanley and the investment adviser will also apply internally within the investment adviser. As a result, a Fund may not be permitted to transact in (e.g., dispose of a
Eaton Vance
Municipal Bond Funds
September 30, 2021
Potential Conflicts of Interest — continued
security in whole or in part) during periods when it otherwise would have been able to do so, which could adversely affect a Fund. Other investors in the security that are not subject to such restrictions may be able to transact in the security during such periods. There may also be circumstances in which, as a result of information held by certain portfolio management teams in the investment adviser, the investment adviser limits an activity or transaction for a Fund, including if the Fund is managed by a portfolio management team other than the team holding such information.
Investments by Morgan Stanley and its Affiliated Investment Accounts. In serving in multiple capacities to Affiliated Investment Accounts, Morgan Stanley, including the investment adviser and its investment teams, may have obligations to other clients or investors in Affiliated Investment Accounts, the fulfillment of which may not be in the best interests of a Fund or its shareholders. A Fund’s investment objectives may overlap with the investment objectives of certain Affiliated Investment Accounts. As a result, the members of an investment team may face conflicts in the allocation of investment opportunities among a Fund and other investment funds, programs, accounts and businesses advised by or affiliated with the investment adviser. Certain Affiliated Investment Accounts may provide for higher management or incentive fees or greater expense reimbursements or overhead allocations, all of which may contribute to this conflict of interest and create an incentive for the investment adviser to favor such other accounts.
Morgan Stanley currently invests and plans to continue to invest on its own behalf and on behalf of its Affiliated Investment Accounts in a wide variety of investment opportunities globally. Morgan Stanley and its Affiliated Investment Accounts, to the extent consistent with applicable law and policies and procedures, will be permitted to invest in investment opportunities without making such opportunities available to a Fund beforehand. Subject to the foregoing, Morgan Stanley may offer investments that fall into the investment objectives of an Affiliated Investment Account to such account or make such investment on its own behalf, even though such investment also falls within a Fund’s investment objectives. A Fund may invest in opportunities that Morgan Stanley and/or one or more Affiliated Investment Accounts has declined, and vice versa. All of the foregoing may reduce the number of investment opportunities available to a Fund and may create conflicts of interest in allocating investment opportunities. Investors should note that the conflicts inherent in making such allocation decisions may not always be resolved to a Fund’s advantage. There can be no assurance that a Fund will have an opportunity to participate in certain opportunities that fall within their investment objectives.
To seek to reduce potential conflicts of interest and to attempt to allocate such investment opportunities in a fair and equitable manner, the investment adviser has implemented allocation policies and procedures. These policies and procedures are intended to give all clients of the investment adviser, including the Funds, fair access to investment opportunities consistent with the requirements of organizational documents, investment strategies, applicable laws and regulations, and the fiduciary duties of the investment adviser. Each client of the investment adviser that is subject to the allocation policies and procedures, including each Fund, is assigned an investment team and portfolio manager(s) by the investment adviser. The investment team and portfolio managers review investment opportunities and will decide with respect to the allocation of each opportunity considering various factors and in accordance with the allocation policies and procedures. The allocation policies and procedures are subject to change. Investors should note that the conflicts inherent in making such allocation decisions may not always be resolved to the advantage of a Fund.
It is possible that Morgan Stanley or an Affiliated Investment Account, including another Eaton Vance fund, will invest in or advise a company that is or becomes a competitor of a company of which a Fund holds an investment. Such investment could create a conflict between the Fund, on the one hand, and Morgan Stanley or the Affiliated Investment Account, on the other hand. In such a situation, Morgan Stanley may also have a conflict in the allocation of its own resources to the portfolio investment. Furthermore, certain Affiliated Investment Accounts will be focused primarily on investing in other funds which may have strategies that overlap and/or directly conflict and compete with a Fund.
In addition, certain investment professionals who are involved in a Fund’s activities remain responsible for the investment activities of other Affiliated Investment Accounts managed by the investment adviser and its affiliates, and they will devote time to the management of such investments and other newly created Affiliated Investment Accounts (whether in the form of funds, separate accounts or other vehicles), as well as their own investments. In addition, in connection with the management of investments for other Affiliated Investment Accounts, members of Morgan Stanley and its affiliates may serve on the boards of directors of or advise companies which may compete with a Fund’s portfolio investments. Moreover, these Affiliated Investment Accounts managed by Morgan Stanley and its affiliates may pursue investment opportunities that may also be suitable for a Fund.
It should be noted that Morgan Stanley may, directly or indirectly, make large investments in certain of its Affiliated Investment Accounts, and accordingly Morgan Stanley’s investment in a Fund may not be a determining factor in the outcome of any of the foregoing conflicts. Nothing herein restricts or in any way limits the activities of Morgan Stanley, including its ability to buy or sell interests in, or provide financing to, equity and/or debt instruments, funds or portfolio companies, for its own accounts or for the accounts of Affiliated Investment Accounts or other investment funds or clients in accordance with applicable law.
Different clients of the investment adviser, including a Fund, may invest in different classes of securities of the same issuer, depending on the respective clients’ investment objectives and policies. As a result, the investment adviser and its affiliates, at times, will seek to satisfy fiduciary obligations to certain clients owning one class of securities of a particular issuer by pursuing or enforcing rights on behalf of those clients with respect to such class of securities, and those activities may have an adverse effect on another client which owns a different class of securities of such issuer. For example, if one client holds debt securities of an issuer and another client holds equity securities of the same issuer, if the issuer experiences financial or operational challenges, the investment adviser and its affiliates may seek a liquidation of the issuer on behalf of the client that holds the debt securities, whereas the client holding the equity securities may benefit from a reorganization of the issuer. Thus, in such situations, the actions taken by the investment adviser or its affiliates on behalf of one client can negatively impact securities held by another client. These conflicts also exist as between the investment adviser’s clients, including the Funds, and the Affiliated Investment Accounts managed by Morgan Stanley.
Eaton Vance
Municipal Bond Funds
September 30, 2021
Potential Conflicts of Interest — continued
The investment adviser and its affiliates may give advice and recommend securities to other clients which may differ from advice given to, or securities recommended or bought for, a Fund even though such other clients’ investment objectives may be similar to those of the Fund.
The investment adviser and its affiliates manage long and short portfolios. The simultaneous management of long and short portfolios creates conflicts of interest in portfolio management and trading in that opposite directional positions may be taken in client accounts, including client accounts managed by the same investment team, and creates risks such as: (i) the risk that short sale activity could adversely affect the market value of long positions in one or more portfolios (and vice versa) and (ii) the risks associated with the trading desk receiving opposing orders in the same security simultaneously. The investment adviser and its affiliates have adopted policies and procedures that are reasonably designed to mitigate these conflicts. In certain circumstances, the investment adviser invests on behalf of itself in securities and other instruments that would be appropriate for, held by, or may fall within the investment guidelines of its clients, including a Fund. At times, the investment adviser may give advice or take action for its own accounts that differs from, conflicts with, or is adverse to advice given or action taken for any client.
From time to time, conflicts also arise due to the fact that certain securities or instruments may be held in some client accounts, including a Fund, but not in others, or that client accounts may have different levels of holdings in certain securities or instruments. .. In addition, due to differences in the investment strategies or restrictions among client accounts, the investment adviser may take action with respect to one account that differs from the action taken with respect to another account. In some cases, a client account may compensate the investment adviser based on the performance of the securities held by that account. The existence of such a performance based fee may create additional conflicts of interest for the investment adviser in the allocation of management time, resources and investment opportunities. The investment adviser has adopted several policies and procedures designed to address these potential conflicts including a code of ethics and policies that govern the investment adviser’s trading practices, including, among other things, the aggregation and allocation of trades among clients, brokerage allocations, cross trades and best execution.
In addition, at times an investment adviser investment team will give advice or take action with respect to the investments of one or more clients that is not given or taken with respect to other clients with similar investment programs, objectives, and strategies. Accordingly, clients with similar strategies will not always hold the same securities or instruments or achieve the same performance. The investment adviser’s investment teams also advise clients with conflicting programs, objectives or strategies. These conflicts also exist as between the investment adviser’s clients, including the Funds, and the Affiliated Investment Accounts managed by Morgan Stanley.
The investment adviser maintains separate trading desks by investment team and generally based on asset class, including two trading desks trading equity securities. These trading desks operate independently of one another. The two equity trading desks do not share information. The separate equity trading desks may result in one desk competing against the other desk when implementing buy and sell transactions, possibly causing certain accounts to pay more or receive less for a security than other accounts. In addition, Morgan Stanley and its affiliates maintain separate trading desks that operate independently of each other and do not share trading information with the investment adviser. These trading desks may compete against the investment adviser trading desks when implementing buy and sell transactions, possibly causing certain Affiliated Investment Accounts to pay more or receive less for a security than other Affiliated Investment Accounts.
Investments by Separate Investment Departments. The entities and individuals that provide investment-related services for the Fund and certain other Eaton Vance Investment Accounts (the “Eaton Vance Investment Department”) may be different from the entities and individuals that provide investment-related services to MS Investment Accounts (the “MS Investment Department and, together with the Eaton Vance Investment Department, the “Investment Departments”). Although Morgan Stanley has implemented information barriers between the Investment Departments in accordance with internal policies and procedures, each Investment Department may engage in discussions and share information and resources with the other Investment Department on certain investment-related matters. The sharing of information and resources between the Investment Departments is designed to further increase the knowledge and effectiveness of each Investment Department. Because each Investment Department generally makes investment decisions and executes trades independently of the other, the quality and price of execution, and the performance of investments and accounts, can be expected to vary. In addition, each Investment Department may use different trading systems and technology and may employ differing investment and trading strategies. As a result, a MS Investment Account could trade in advance of the Fund (and vice versa), might complete trades more quickly and efficiently than the Fund, and/or achieve different execution than the Fund on the same or similar investments made contemporaneously, even when the Investment Departments shared research and viewpoints that led to that investment decision. Any sharing of information or resources between the Investment Department servicing the Fund and the MS Investment Department may result, from time to time, in the Fund simultaneously or contemporaneously seeking to engage in the same or similar transactions as an account serviced by the other Investment Department and for which there are limited buyers or sellers on specific securities, which could result in less favorable execution for the Fund than such account. The Eaton Vance Investment Department will not knowingly or intentionally cause the Fund to engage in a cross trade with an account serviced by the MS Investment Department, however, subject to applicable law and internal policies and procedures, the Fund may conduct cross trades with other accounts serviced by the Eaton Vance Investment Department. Although the Eaton Vance Investment Department may aggregate the Fund’s trades with trades of other accounts serviced by the Eaton Vance Investment Department, subject to applicable law and internal policies and procedures, there will be no aggregation or coordination of trades with accounts serviced by the MS Investment Department, even when both Investment Departments are seeking to acquire or dispose of the same investments contemporaneously.
Payments to Broker-Dealers and Other Financial Intermediaries. The investment adviser and/or EVD may pay compensation, out of their own funds and not as an expense of the Funds, to certain financial intermediaries (which may include affiliates of the investment adviser and EVD), including recordkeepers and administrators of various deferred compensation plans, in connection with the sale, distribution, marketing and retention of shares of the Funds and/or shareholder servicing. For example, the investment adviser or EVD may pay additional compensation to a financial intermediary for, among
Eaton Vance
Municipal Bond Funds
September 30, 2021
Potential Conflicts of Interest — continued
other things, promoting the sale and distribution of Fund shares, providing access to various programs, mutual fund platforms or preferred or recommended mutual fund lists that may be offered by a financial intermediary, granting EVD access to a financial intermediary’s financial advisors and consultants, providing assistance in the ongoing education and training of a financial intermediary’s financial personnel, furnishing marketing support, maintaining share balances and/or for sub-accounting, recordkeeping, administrative, shareholder or transaction processing services. Such payments are in addition to any distribution fees, shareholder servicing fees and/or transfer agency fees that may be payable by the Funds. The additional payments may be based on various factors, including level of sales (based on gross or net sales or some specified minimum sales or some other similar criteria related to sales of the Funds and/or some or all other Eaton Vance funds), amount of assets invested by the financial intermediary’s customers (which could include current or aged assets of the Funds and/or some or all other Eaton Vance funds), a Fund’s advisory fee, some other agreed upon amount or other measures as determined from time to time by the investment adviser and/or EVD. The amount of these payments may be different for different financial intermediaries.
The prospect of receiving, or the receipt of, additional compensation, as described above, by financial intermediaries may provide such financial intermediaries and their financial advisors and other salespersons with an incentive to favor sales of shares of the Funds over other investment options with respect to which these financial intermediaries do not receive additional compensation (or receive lower levels of additional compensation). These payment arrangements, however, will not change the price that an investor pays for shares of the Funds or the amount that the Funds receive to invest on behalf of an investor. Investors may wish to take such payment arrangements into account when considering and evaluating any recommendations relating to Fund shares and should review carefully any disclosures provided by financial intermediaries as to their compensation. In addition, in certain circumstances, the investment adviser may restrict, limit or reduce the amount of a Fund’s investment, or restrict the type of governance or voting rights it acquires or exercises, where the Fund (potentially together with Morgan Stanley) exceeds a certain ownership interest, or possesses certain degrees of voting or control or has other interests.
Morgan Stanley Trading and Principal Investing Activities. Notwithstanding anything to the contrary herein, Morgan Stanley will generally conduct its sales and trading businesses, publish research and analysis, and render investment advice without regard for a Fund’s holdings, although these activities could have an adverse impact on the value of one or more of the Fund’s investments, or could cause Morgan Stanley to have an interest in one or more portfolio investments that is different from, and potentially adverse to that of a Fund. Furthermore, from time to time, the investment adviser or its affiliates may invest “seed” capital in a Fund, typically to enable the Fund to commence investment operations and/or achieve sufficient scale. The investment adviser and its affiliates may hedge such seed capital exposure by investing in derivatives or other instruments expected to produce offsetting exposure. Such hedging transactions, if any, would occur outside of a Fund.
Morgan Stanley’s sales and trading, financing and principal investing businesses (whether or not specifically identified as such, and including Morgan Stanley’s trading and principal investing businesses) will not be required to offer any investment opportunities to a Fund. These businesses may encompass, among other things, principal trading activities as well as principal investing.
Morgan Stanley’s sales and trading, financing and principal investing businesses have acquired or invested in, and in the future may acquire or invest in, minority and/or majority control positions in equity or debt instruments of diverse public and/or private companies. Such activities may put Morgan Stanley in a position to exercise contractual, voting or creditor rights, or management or other control with respect to securities or loans of portfolio investments or other issuers, and in these instances Morgan Stanley may, in its discretion and subject to applicable law, act to protect its own interests or interests of clients, and not a Fund’s interests.
Subject to the limitations of applicable law, a Fund may purchase from or sell assets to, or make investments in, companies in which Morgan Stanley has or may acquire an interest, including as an owner, creditor or counterparty.
Morgan Stanley’s Investment Banking and Other Commercial Activities. Morgan Stanley advises clients on a variety of mergers, acquisitions, restructuring, bankruptcy and financing transactions. Morgan Stanley may act as an advisor to clients, including other investment funds that may compete with a Fund and with respect to investments that a Fund may hold. Morgan Stanley may give advice and take action with respect to any of its clients or proprietary accounts that may differ from the advice given, or may involve an action of a different timing or nature than the action taken, by a Fund. Morgan Stanley may give advice and provide recommendations to persons competing with a Fund and/or any of a Fund’s investments that are contrary to the Fund’s best interests and/or the best interests of any of its investments.
Morgan Stanley could be engaged in financial advising, whether on the buy-side or sell-side, or in financing or lending assignments that could result in Morgan Stanley’s determining in its discretion or being required to act exclusively on behalf of one or more third parties, which could limit a Fund’s ability to transact with respect to one or more existing or potential investments. Morgan Stanley may have relationships with third-party funds, companies or investors who may have invested in or may look to invest in portfolio companies, and there could be conflicts between a Fund’s best interests, on the one hand, and the interests of a Morgan Stanley client or counterparty, on the other hand.
To the extent that Morgan Stanley advises creditor or debtor companies in the financial restructuring of companies either prior to or after filing for protection under Chapter 11 of the U.S. Bankruptcy Code or similar laws in other jurisdictions, the investment adviser’s flexibility in making investments in such restructurings on a Fund’s behalf may be limited.
Eaton Vance
Municipal Bond Funds
September 30, 2021
Potential Conflicts of Interest — continued
Morgan Stanley could provide investment banking services to competitors of portfolio companies, as well as to private equity and/or private credit funds; such activities may present Morgan Stanley with a conflict of interest vis-a-vis a Fund’s investment and may also result in a conflict in respect of the allocation of investment banking resources to portfolio companies.
To the extent permitted by applicable law, Morgan Stanley may provide a broad range of financial services to companies in which a Fund invests, including strategic and financial advisory services, interim acquisition financing and other lending and underwriting or placement of securities, and Morgan Stanley generally will be paid fees (that may include warrants or other securities) for such services. Morgan Stanley will not share any of the foregoing interest, fees and other compensation received by it (including, for the avoidance of doubt, amounts received by the investment adviser) with a Fund, and any advisory fees payable will not be reduced thereby.
Morgan Stanley may be engaged to act as a financial advisor to a company in connection with the sale of such company, or subsidiaries or divisions thereof, may represent potential buyers of businesses through its mergers and acquisition activities and may provide lending and other related financing services in connection with such transactions. Morgan Stanley’s compensation for such activities is usually based upon realized consideration and is usually contingent, in substantial part, upon the closing of the transaction. Under these circumstances, a Fund may be precluded from participating in a transaction with or relating to the company being sold or participating in any financing activity related to merger or acquisition.
The involvement or presence of Morgan Stanley in the investment banking and other commercial activities described above (or the financial markets more broadly) may restrict or otherwise limit investment opportunities that may otherwise be available to the Funds. For example, issuers may hire and compensate Morgan Stanley to provide underwriting, financial advisory, placement agency, brokerage services or other services and, because of limitations imposed by applicable law and regulation, a Fund may be prohibited from buying or selling securities issued by those issuers or participating in related transactions or otherwise limited in its ability to engage in such investments.
Morgan Stanley’s Marketing Activities. Morgan Stanley is engaged in the business of underwriting, syndicating, brokering, administering, servicing, arranging and advising on the distribution of a wide variety of securities and other investments in which a Fund may invest. Subject to the restrictions of the 1940 Act, including Sections 10(f) and 17(e) thereof, a Fund may invest in transactions in which Morgan Stanley acts as underwriter, placement agent, syndicator, broker, administrative agent, servicer, advisor, arranger or structuring agent and receives fees or other compensation from the sponsors of such products or securities. Any fees earned by Morgan Stanley in such capacity will not be shared with the investment adviser or the Funds. Certain conflicts of interest, in addition to the receipt of fees or other compensation, would be inherent in these transactions. Moreover, the interests of one of Morgan Stanley’s clients with respect to an issuer of securities in which a Fund has an investment may be adverse to the investment adviser’s or a Fund’s best interests. In conducting the foregoing activities, Morgan Stanley will be acting for its other clients and will have no obligation to act in the investment adviser’s or a Fund’s best interests.
Client Relationships. Morgan Stanley has existing and potential relationships with a significant number of corporations, institutions and individuals. In providing services to its clients, Morgan Stanley may face conflicts of interest with respect to activities recommended to or performed for such clients, on the one hand, and a Fund, its shareholders or the entities in which the Fund invests, on the other hand. In addition, these client relationships may present conflicts of interest in determining whether to offer certain investment opportunities to a Fund.
In acting as principal or in providing advisory and other services to its other clients, Morgan Stanley may engage in or recommend activities with respect to a particular matter that conflict with or are different from activities engaged in or recommended by the investment adviser on a Fund’s behalf.
Principal Investments. To the extent permitted by applicable law, there may be situations in which a Fund’s interests may conflict with the interests of one or more general accounts of Morgan Stanley and its affiliates or accounts managed by Morgan Stanley or its affiliates. This may occur because these accounts hold public and private debt and equity securities of many issuers which may be or become portfolio companies, or from whom portfolio companies may be acquired.
Transactions with Portfolio Companies of Affiliated Investment Accounts. The companies in which a Fund may invest may be counterparties to or participants in agreements, transactions or other arrangements with portfolio companies or other entities of portfolio investments of Affiliated Investment Accounts (for example, a company in which a Fund invests may retain a company in which an Affiliated Investment Account invests to provide services or may acquire an asset from such company or vice versa). Certain of these agreements, transactions and arrangements involve fees, servicing payments, rebates and/or other benefits to Morgan Stanley or its affiliates. For example, portfolio entities may, including at the encouragement of Morgan Stanley, enter into agreements regarding group procurement and/or vendor discounts. Morgan Stanley and its affiliates may also participate in these agreements and may realize better pricing or discounts as a result of the participation of portfolio entities. To the extent permitted by applicable law, certain of these agreements may provide for commissions or similar payments and/or discounts or rebates to be paid to a portfolio entity of an Affiliated Investment Account, and such payments or discounts or rebates may also be made directly to Morgan Stanley or its affiliates. Under these arrangements, a particular portfolio company or other entity may benefit to a greater degree than the other participants, and the funds, investment vehicles and accounts (which may or may not include a Fund) that own an interest in such entity will receive a greater relative benefit from the arrangements than the Eaton Vance funds, investment vehicles or accounts that do not own an interest therein. Fees and compensation received by portfolio companies of Affiliated Investment Accounts in relation to the foregoing will not be shared with a Fund or offset advisory fees payable.
Eaton Vance
Municipal Bond Funds
September 30, 2021
Potential Conflicts of Interest — continued
Investments in Portfolio Investments of Other Funds. To the extent permitted by applicable law, when a Fund invests in certain companies or other entities, other funds affiliated with the investment adviser may have made or may be making an investment in such companies or other entities. Other funds that have been or may be managed by the investment adviser may invest in the companies or other entities in which a Fund has made an investment. Under such circumstances, a Fund and such other funds may have conflicts of interest (e.g., over the terms, exit strategies and related matters, including the exercise of remedies of their respective investments). If the interests held by a Fund are different from (or take priority over) those held by such other funds, the investment adviser may be required to make a selection at the time of conflicts between the interests held by such other funds and the interests held by a Fund.
Allocation of Expenses. Expenses may be incurred that are attributable to a Fund and one or more other Affiliated Investment Accounts (including in connection with issuers in which a Fund and such other Affiliated Investment Accounts have overlapping investments). The allocation of such expenses among such entities raises potential conflicts of interest. The investment adviser and its affiliates intend to allocate such common expenses among a Fund and any such other Affiliated Investment Accounts on a pro rata basis or in such other manner as the investment adviser deems to be fair and equitable or in such other manner as may be required by applicable law.
Temporary Investments. To more efficiently invest short-term cash balances held by a Fund, the investment adviser may invest such balances on an overnight “sweep” basis in shares of one or more money market funds or other short-term vehicles. It is anticipated that the investment adviser to these money market funds or other short-term vehicles may be the investment adviser (or an affiliate) to the extent permitted by applicable law, including Rule 12d1-1 under the 1940 Act. The Fund may invest in Eaton Vance Cash Reserves Fund, LLC (Cash Reserves Fund), an affiliated investment company managed by Eaton Vance, for this purpose. Eaton Vance does not currently receive a fee for advisory services provided to Cash Reserves Fund.
Transactions with Affiliates. The investment adviser and any investment sub-adviser might purchase securities from underwriters or placement agents in which a Morgan Stanley affiliate is a member of a syndicate or selling group, as a result of which an affiliate might benefit from the purchase through receipt of a fee or otherwise. Neither the investment adviser nor any investment sub-adviser will purchase securities on behalf of a Fund from an affiliate that is acting as a manager of a syndicate or selling group. Purchases by the investment adviser on behalf of a Fund from an affiliate acting as a placement agent must meet the requirements of applicable law. Furthermore, Morgan Stanley may face conflicts of interest when the Funds use service providers affiliated with Morgan Stanley because Morgan Stanley receives greater overall fees when they are used.
General Process for Potential Conflicts. All of the transactions described above involve the potential for conflicts of interest between the investment adviser, related persons of the investment adviser and/or their clients. The Advisers Act, the 1940 Act and ERISA impose certain requirements designed to decrease the possibility of conflicts of interest between an investment adviser and its clients. In some cases, transactions may be permitted subject to fulfillment of certain conditions. Certain other transactions may be prohibited. In addition, the investment adviser has instituted policies and procedures designed to prevent conflicts of interest from arising and, when they do arise, to ensure that it effects transactions for clients in a manner that is consistent with its fiduciary duty to its clients and in accordance with applicable law. The investment adviser seeks to ensure that potential or actual conflicts of interest are appropriately resolved taking into consideration the overriding best interests of the client.
Eaton Vance Funds
IMPORTANT NOTICES
Delivery of Shareholder Documents. The Securities and Exchange Commission (SEC) permits funds to deliver only one copy of shareholder documents, including prospectuses, proxy statements and shareholder reports, to fund investors with multiple accounts at the same residential or post office box address. This practice is often called “householding” and it helps eliminate duplicate mailings to shareholders. American Stock Transfer & Trust Company, LLC (“AST”), the closed-end funds transfer agent, or your financial intermediary, may household the mailing of your documents indefinitely unless you instruct AST, or your financial intermediary, otherwise. If you would prefer that your Eaton Vance documents not be householded, please contact AST or your financial intermediary. Your instructions that householding not apply to delivery of your Eaton Vance documents will typically be effective within 30 days of receipt by AST or your financial intermediary.
Portfolio Holdings. Each Eaton Vance Fund and its underlying Portfolio(s) (if applicable) files a schedule of portfolio holdings on Part F to Form N-PORT with the SEC. Certain information filed on Form N-PORT may be viewed on the Eaton Vance website at www.eatonvance.com, by calling Eaton Vance at 1-800-262-1122 or in the EDGAR database on the SEC’s website at www.sec.gov.
Proxy Voting. From time to time, funds are required to vote proxies related to the securities held by the funds. The Eaton Vance Funds or their underlying Portfolios (if applicable) vote proxies according to a set of policies and procedures approved by the Funds’ and Portfolios’ Boards. You may obtain a description of these policies and procedures and information on how the Funds or Portfolios voted proxies relating to portfolio securities during the most recent 12-month period ended June 30, without charge, upon request, by calling 1-800-262-1122 and by accessing the SEC’s website at www.sec.gov.
Share Repurchase Program. The Funds’ Boards of Trustees have approved a share repurchase program authorizing each Fund to repurchase up to 10% of its common shares outstanding as of the last day of the prior calendar year in open-market transactions at a discount to net asset value. The repurchase program does not obligate a Fund to purchase a specific amount of shares. The Funds’ repurchase activity, including the number of shares purchased, average price and average discount to net asset value, is disclosed in the Funds’ annual and semi-annual reports to shareholders.
Additional Notice to Shareholders. If applicable, a Fund may also redeem or purchase its outstanding preferred shares in order to maintain compliance with regulatory requirements, borrowing or rating agency requirements or for other purposes as it deems appropriate or necessary.
Closed-End Fund Information. Eaton Vance closed-end funds make fund performance data and certain information about portfolio characteristics available on the Eaton Vance website shortly after the end of each month. Other information about the funds is available on the website. The funds’ net asset value per share is readily accessible on the Eaton Vance website. Portfolio holdings for the most recent month-end are also posted to the website approximately 30 days following the end of the month. This information is available at www.eatonvance.com on the fund information pages under “Individual Investors — Closed-End Funds”.
This Page Intentionally Left Blank
This Page Intentionally Left Blank
Investment Adviser and Administrator
Eaton Vance Management
Two International Place
Boston, MA 02110
Custodian
State Street Bank and Trust Company
State Street Financial Center, One Lincoln Street
Boston, MA 02111
Transfer Agent
American Stock Transfer & Trust Company, LLC
6201 15th Avenue
Brooklyn, NY 11219
Independent Registered Public Accounting Firm
Deloitte & Touche LLP
200 Berkeley Street
Boston, MA 02116-5022
Fund Offices
Two International Place
Boston, MA 02110

1453 9.30.21
Item 2. Code of Ethics
The registrant (sometimes referred to as the “Fund”) has adopted a code of ethics applicable to its Principal Executive Officer, Principal Financial Officer and Principal Accounting Officer. The registrant undertakes to provide a copy of such code of ethics to any person upon request, without charge, by calling 1-800-262-1122. The registrant has not amended the code of ethics as described in Form N-CSR during the period covered by this report. The registrant has not granted any waiver, including an implicit waiver, from a provision of the code of ethics as described in Form N-CSR during the period covered by this report.
Item 3. Audit Committee Financial Expert
The registrant’s Board of Trustees (the “Board”) has designated George J. Gorman, William H. Park and Scott E. Wennerholm, each an independent trustee, as audit committee financial experts. Mr. Gorman is a certified public accountant who is the Principal at George J. Gorman LLC (a consulting firm). Previously, Mr. Gorman served in various capacities at Ernst & Young LLP (a registered public accounting firm), including as Senior Partner. Mr. Gorman also has experience serving as an independent trustee and audit committee financial
expert of other mutual fund complexes. Mr. Park is a certified public accountant who is a private investor. Previously, he served as a consultant, as the Chief Financial Officer of Aveon Group, L.P. (an investment management firm), as the Vice Chairman of Commercial Industrial Finance Corp. (specialty finance company), as President and Chief Executive Officer of Prizm Capital Management, LLC (investment management firm), as Executive Vice President and Chief Financial Officer of United Asset Management Corporation (an institutional investment management firm) and as a Senior Manager at Price Waterhouse (now PricewaterhouseCoopers) (a registered public accounting firm). Mr. Wennerholm is a private investor. Previously, Mr. Wennerholm served as a Trustee at Wheelock College (postsecondary institution), as a Consultant at GF Parish Group (executive recruiting firm), Chief Operating Officer and Executive Vice President at BNY Mellon Asset Management (investment management firm) Chief Operating Officer and Chief Financial Officer at Natixis Global Asset Management (investment management firm), and Vice President at Fidelity Investments Institutional Services (investment management firm).
Item 4. Principal Accountant Fees and Services
(a) –(d)
The following table presents the aggregate fees billed to the registrant for the registrant’s fiscal years ended September 30, 2020 and September 30, 2021 by the registrant’s principal accountant, Deloitte & Touche LLP (“D&T”), for professional services rendered for the audit of the registrant’s annual financial statements and fees billed for other services rendered by D&T during such periods.
| | | | | | | | |
Fiscal Years Ended | | 9/30/20 | | | 9/30/21 | |
Audit Fees | | $ | 74,100 | | | $ | 74,100 | |
Audit-Related Fees(1) | | $ | 0 | | | $ | 0 | |
Tax Fees(2) | | $ | 11,659 | | | $ | 10,459 | |
All Other Fees(3) | | $ | 0 | | | $ | 0 | |
| | | | | | | | |
Total | | $ | 85,759 | | | $ | 84,559 | |
| | | | | | | | |
| (1) | Audit-related fees consist of the aggregate fees billed for assurance and related services that are reasonably related to the performance of the audit of the registrant’s financial statements and are not reported under the category of audit fees. |
| (2) | Tax fees consist of the aggregate fees billed for professional services rendered by the principal accountant relating to tax compliance, tax advice, and tax planning and specifically include fees for tax return preparation and other related tax compliance/planning matters. |
| (3) | All other fees consist of the aggregate fees billed for products and services provided by the principal accountant other than audit, audit-related, and tax services. |
(e)(1) The registrant’s audit committee has adopted policies and procedures relating to the pre-approval of services provided by the registrant’s principal accountant (the “Pre-Approval Policies”). The Pre-Approval Policies establish a framework intended to assist the audit committee in the proper discharge of its pre-approval responsibilities. As a general matter, the Pre-Approval Policies (i) specify certain types of audit, audit-related, tax, and other services determined to be pre-approved by the audit committee; and (ii) delineate specific procedures governing the mechanics of the pre-approval process, including the approval and monitoring of audit and non-audit service fees. Unless a service is specifically pre-approved under the Pre-Approval Policies, it must be separately pre-approved by the audit committee.
The Pre-Approval Policies and the types of audit and non-audit services pre-approved therein must be reviewed and ratified by the registrant’s audit committee at least annually. The registrant’s audit committee maintains full responsibility for the appointment, compensation, and oversight of the work of the registrant’s principal accountant.
(e)(2) No services described in paragraphs (b)-(d) above were approved by the registrant’s audit committee pursuant to the “de minimis exception” set forth in Rule 2-01 (c)(7)(i)(C) of Regulation S-X.
(f) Not applicable.
(g) The following table presents (i) the aggregate non-audit fees (i.e., fees for audit-related, tax, and other services) billed to the registrant by D&T for the registrant’s fiscal years ended September 30, 2020 and September 30, 2021; and (ii) the aggregate non-audit fees (i.e., fees for audit-related, tax, and other services) billed to the Eaton Vance organization by D&T for the same time periods.
| | | | | | | | |
Fiscal Years Ended | | 9/30/20 | | | 9/30/21 | |
Registrant | | $ | 11,659 | | | $ | 10,459 | |
Eaton Vance(1) | | $ | 51,800 | | | $ | 51,800 | |
| (1) | The investment adviser to the registrant, as well as any of its affiliates that provide ongoing services to the registrant, are subsidiaries of Morgan Stanley. |
(h) The registrant’s audit committee has considered whether the provision by the registrant’s principal accountant of non-audit services to the registrant’s investment adviser and any entity controlling, controlled by, or under common control with the adviser that provides ongoing services to the registrant that were not pre-approved pursuant to Rule 2-01(c)(7)(ii) of Regulation S-X is compatible with maintaining the principal accountant’s independence.
Item 5. Audit Committee of Listed Registrants
The registrant has a separately-designated standing audit committee established in accordance with Section 3(a)(58)(A) of the Securities and Exchange Act of 1934, as amended. George J. Gorman, William H. Park, Helen Frame Peters and Scott E. Wennerholm (Chair) are the members of the registrant’s audit committee.
Item 6. Schedule of Investments
Please see schedule of investments contained in the Report to Stockholders included under Item 1 of this Form N-CSR.
Item 7. Disclosure of Proxy Voting Policies and Procedures for Closed-End Management Investment Companies
The Board of the Fund has adopted a proxy voting policy and procedure (the “Fund Policy”), pursuant to which the trustees have delegated proxy voting responsibility to the Fund’s investment adviser and adopted the investment adviser’s proxy voting policies and procedures (the “Policies”) which are described below. The trustees will review the Policies annually. In the event that a conflict of interest arises between the Fund’s shareholders and the investment adviser, the administrator, or any of their affiliates or any affiliate of the Fund, the investment adviser will generally refrain from voting the proxies related to the companies giving rise to such conflict until it consults with the Board, or any committee, sub-committee or group of independent trustees
identified by the Board, which will instruct the investment adviser on the appropriate course of action. If the Board Members are unable to meet and the failure to vote a proxy would have a material adverse impact on the Fund, the investment adviser may vote such proxy, provided that it discloses the existence of the material conflict to the Chairperson of the Fund’s Board as soon as practicable and to the Board at its next meeting.
The Policies are designed to promote accountability of a company’s management to its shareholders and to align the interests of management with those shareholders. An independent proxy voting service (“Agent”), currently Institutional Shareholder Services, Inc., has been retained to assist in the voting of proxies through the provision of vote analysis, implementation and recordkeeping and disclosure services. The investment adviser will generally vote proxies through the Agent. The Agent is required to vote all proxies in accordance with customized proxy voting guidelines (the “Guidelines”) and/or refer them back to the investment adviser pursuant to the Policies.
The Agent is required to establish and maintain adequate internal controls and policies in connection with the provision of proxy voting services, including methods to reasonably ensure that its analysis and recommendations are not influenced by a conflict of interest. The Guidelines include voting guidelines for matters relating to, among other things, the election of directors, approval of independent auditors, executive compensation, corporate structure and anti-takeover defenses. The investment adviser may cause the Fund to abstain from voting from time to time where it determines that the costs associated with voting a proxy outweigh the benefits derived from exercising the right to vote or it is unable to access or access timely ballots or other proxy information, among other stated reasons. The Agent will refer Fund proxies to the investment adviser for instructions under circumstances where, among others: (1) the application of the Guidelines is unclear; (2) a particular proxy question is not covered by the Guidelines; or (3) the Guidelines require input from the investment adviser. When a proxy voting issue has been referred to the investment adviser, the analyst (or portfolio manager if applicable) covering the company subject to the proxy proposal determines the final vote (or decision not to vote) and the investment adviser’s Proxy Administrator (described below) instructs the Agent to vote accordingly for securities held by the Fund. Where more than one analyst covers a particular company and the recommendations of such analysts voting a proposal conflict, the investment adviser’s Global Proxy Group (described below) will review such recommendations and any other available information related to the proposal and determine the manner in which it should be voted, which may result in different recommendations for the Fund that may differ from other clients of the investment adviser.
The investment adviser has appointed a Proxy Administrator to assist in the coordination of the voting of client proxies (including the Fund’s) in accordance with the Guidelines and the Policies. The investment adviser and its affiliates have also established a Global Proxy Group. The Global Proxy Group develops the investment adviser’s positions on all major corporate issues, creates the Guidelines and oversees the proxy voting process. The Proxy Administrator maintains a record of all proxy questions that have been referred by the Agent, all applicable recommendations, analysis and research received and any resolution of the matter. Before instructing the Agent to vote contrary to the Guidelines or the recommendation of the Agent, the Proxy Administrator will provide the Global Proxy Group with the Agent’s recommendation for the proposal along with any other relevant materials, including the basis for the analyst’s recommendation. The Proxy Administrator will then instruct the Agent to vote the proxy in the manner determined by the Global Proxy Group. A similar process will be followed if the Agent has a conflict of interest with respect to a proxy. The investment adviser will report to the Fund’s Board any votes cast contrary to the Guidelines or Agent recommendations, as applicable, no less than annually.
The investment adviser’s Global Proxy Group is responsible for monitoring and resolving possible material conflicts with respect to proxy voting. Because the Guidelines are predetermined and designed to be in the best interests of shareholders, application of the Guidelines to vote client proxies should, in most cases, adequately address any possible conflict of interest. The investment adviser will monitor situations that may result in a conflict of interest between any of its clients and the investment adviser or any of its affiliates by maintaining a list of significant existing and prospective corporate clients. The Proxy Administrator will compare such list
with the names of companies of which he or she has been referred a proxy statement (the “Proxy Companies”). If a company on the list is also a Proxy Company, the Proxy Administrator will report that fact to the Global Proxy Group. If the Proxy Administrator intends to instruct the Agent to vote in a manner inconsistent with the Guidelines, the Global Proxy Group will first determine, in consultation with legal counsel if necessary, whether a material conflict exists. If it is determined that a material conflict exists, the investment adviser will seek instruction on how the proxy should be voted from the Fund’s Board, or any committee or subcommittee identified by the Board. If a matter is referred to the Global Proxy Group, the decision made and basis for the decision will be documented by the Proxy Administrator and/or Global Proxy Group.
Information on how the Fund voted proxies relating to portfolio securities during the most recent 12 month period ended June 30 is available (1) without charge, upon request, by calling 1-800-262-1122, and (2) on the Securities and Exchange Commission’s website at http://www.sec.gov.
Item 8. Portfolio Managers of Closed-End Management Investment Companies
Eaton Vance Management (“EVM” or “Eaton Vance”) is the investment adviser of each Fund. Cynthia J. Clemson and Julie P. Callahan, portfolio managers of Eaton Vance Municipal Bond Fund, Christopher J. Eustance, portfolio manager of Eaton Vance New York Municipal Bond Fund and Trevor G. Smith, portfolio manager of Eaton Vance California Municipal Bond Fund are responsible for the overall and day-to-day management of each Fund’s investments.
Ms. Clemson is a Vice President of EVM, is Co-Director of Municipal Investments and has been a portfolio manager of Eaton Vance Municipal Bond Fund since March 2014. She has managed other Eaton Vance portfolios for more than five years. Mr. Eustance is a Vice President of EVM and has been a portfolio manager of Eaton Vance New York Municipal Bond Fund since December 2019. Mr. Smith is a Vice President of EVM and has been a portfolio manager of Eaton Vance California Municipal Bond Fund since December 2019. Messrs. Eustance and Smith have been employed by EVM for more than five years. Ms. Callahan has been a Vice President of EVM since September 2021, has been a Managing Director at Morgan Stanley Investment Management Inc. (“MSIM”), an affiliate of EVM, since 2020, and has been a portfolio manager of Eaton Vance Municipal Bond Fund since October 2021. Prior to joining MSIM, she was a senior member of the municipal bond portfolio management team at PIMCO from 2011 to 2020. This information is provided as of the date of filing this report.
The following table shows, as of each Fund’s most recent fiscal year end, the number of accounts each portfolio manager managed in each of the listed categories and the total assets (in millions of dollars) in the accounts managed within each category. The table also shows the number of accounts with respect to which the advisory fee is based on the performance of the account, if any, and the total assets (in millions of dollars) in those accounts.
| | | | | | | | | | | | | | | | |
| | | Number of All
Accounts | | | Total Assets of
All Accounts | | | Number of Accounts
Paying a
Performance Fee | | | Total Assets of
Accounts Paying a
Performance Fee | |
Cynthia J. Clemson | | | | | | | | | | | | | | | | |
Registered Investment Companies | | | 11 | | | $ | 4,945.3 | | | | 0 | | | $ | 0 | |
Other Pooled Investment Vehicles | | | 0 | | | $ | 0 | | | | 0 | | | $ | 0 | |
Other Accounts | | | 4 | | | $ | 282.4 | | | | 0 | | | $ | 0 | |
Julie P. Callahan(1) | | | | | | | | | | | | | | | | |
Registered Investment Companies | | | 0 | | | $ | 0 | | | | 0 | | | $ | 0 | |
Other Pooled Investment Vehicles | | | 0 | | | $ | 0 | | | | 0 | | | $ | 0 | |
Other Accounts | | | 0 | | | $ | 0 | | | | 0 | | | $ | 0 | |
| | | | | | | | | | | | | | | | |
| | | Number of All
Accounts | | | Total Assets of
All Accounts | | | Number of Accounts
Paying a
Performance Fee | | | Total Assets of
Accounts Paying a
Performance Fee | |
Christopher J. Eustance | | | | | | | | | | | | | | | | |
Registered Investment Companies | | | 9 | | | $ | 2,163.2 | | | | 0 | | | $ | 0 | |
Other Pooled Investment Vehicles | | | 0 | | | $ | 0 | | | | 0 | | | $ | 0 | |
Other Accounts | | | 0 | | | $ | 0 | | | | 0 | | | $ | 0 | |
Trevor G. Smith | | | | | | | | | | | | | | | | |
Registered Investment Companies | | | 12 | | | $ | 4,978.1 | | | | 0 | | | $ | 0 | |
Other Pooled Investment Vehicles | | | 2 | | | $ | 29.8 | | | | 0 | | | $ | 0 | |
Other Accounts | | | 0 | | | $ | 0 | | | | 0 | | | $ | 0 | |
| (1) | As of September 30, 2021. Ms. Callahan became a portfolio manager effective October 1, 2021. |
The following table shows the dollar range of Fund shares beneficially owned by each portfolio manager as of each Fund’s most recent fiscal year end.
| | |
Fund Name and Portfolio Managers | | Dollar Range of Equity Securities
Beneficially Owned in the Fund |
California Municipal Bond Fund | | |
Trevor G. Smith | | None |
Municipal Bond Fund | | |
Cynthia J. Clemson | | None |
Julie P. Callahan(1) | | None |
New York Municipal Bond Fund | | |
Christopher J. Eustance | | None |
| (1) | As of September 30, 2021. |
Potential for Conflicts of Interest. It is possible that conflicts of interest may arise in connection with a portfolio manager’s management of the Fund’s investments on the one hand and the investments of other accounts for which a portfolio manager is responsible on the other. For example, a portfolio manager may have conflicts of interest in allocating management time, resources and investment opportunities among the Fund and other accounts he or she advises. In addition, due to differences in the investment strategies or restrictions between the Fund and the other accounts, the portfolio manager may take action with respect to another account that differs from the action taken with respect to the Fund. In some cases, another account managed by a portfolio manager may compensate the investment adviser based on the performance of the securities held by that account. The existence of such a performance based fee may create additional conflicts of interest for the portfolio manager in the allocation of management time, resources and investment opportunities. Whenever conflicts of interest arise, the portfolio manager will endeavor to exercise his or her discretion in a manner that he or she believes is equitable to all interested persons. EVM has adopted several policies and procedures designed to address these potential conflicts including a code of ethics and policies that govern the investment adviser’s trading practices, including among other things the aggregation and allocation of trades among clients, brokerage allocations, cross trades and best execution.
Compensation Structure for EVM
Compensation of EVM’s portfolio managers and other investment professionals has the following primary components: (1) a base salary, (2) an annual cash bonus, and (3) annual non-cash compensation consisting of restricted shares of Morgan Stanley stock that are subject to a fixed vesting and distribution schedule. EVM’s investment professionals also receive certain retirement, insurance and other benefits that are broadly available to EVM’s employees. Compensation of EVM’s investment professionals is reviewed primarily on an annual basis. Cash bonuses, stock-based compensation awards, and adjustments in base salary are typically paid or put into effect at or shortly after the December 31st fiscal year end of Morgan Stanley.
Method to Determine Compensation. EVM compensates its portfolio managers based primarily on the scale and complexity of their portfolio responsibilities and the total return performance of managed funds and accounts versus the benchmark(s) stated in the prospectus, as well as an appropriate peer group (as described below). In addition to rankings within peer groups of funds on the basis of absolute performance, consideration may also be given to relative risk-adjusted performance. Risk-adjusted performance measures include, but are not limited to the Sharpe ratio, which uses standard deviation and excess return to determine reward per unit of risk. Performance is normally based on periods ending on the September 30th preceding fiscal year end. Fund performance is normally evaluated primarily versus peer groups of funds as determined by Lipper Inc. and/or Morningstar, Inc. When a fund’s peer group as determined by Lipper or Morningstar is deemed by EVM’s management not to provide a fair comparison, performance may instead be evaluated primarily against a custom peer group or market index. In evaluating the performance of a fund and its manager, primary emphasis is normally placed on three-year performance, with secondary consideration of performance over longer and shorter periods. For funds that are tax-managed or otherwise have an objective of after-tax returns, performance is measured net of taxes. For other funds, performance is evaluated on a pre-tax basis. For funds with an investment objective other than total return (such as current income), consideration will also be given to the fund’s success in achieving its objective. For managers responsible for multiple funds and accounts, investment performance is evaluated on an aggregate basis, based on averages or weighted averages among managed funds and accounts. Funds and accounts that have performance-based advisory fees are not accorded disproportionate weightings in measuring aggregate portfolio manager performance.
The compensation of portfolio managers with other job responsibilities (such as heading an investment group or providing analytical support to other portfolios) will include consideration of the scope of such responsibilities and the managers’ performance in meeting them.
EVM seeks to compensate portfolio managers commensurate with their responsibilities and performance, and competitive with other firms within the investment management industry. EVM participates in investment-industry compensation surveys and utilizes survey data as a factor in determining salary, bonus and stock-based compensation levels for portfolio managers and other investment professionals. Salaries, bonuses and stock-based compensation are also influenced by the operating performance of EVM and its parent company. The overall annual cash bonus pool is generally based on a substantially fixed percentage of pre-bonus adjusted operating income. While the salaries of EVM’s portfolio managers are comparatively fixed, cash bonuses and stock-based compensation may fluctuate significantly from year to year, based on changes in manager performance and other factors as described herein. For a high performing portfolio manager, cash bonuses and stock-based compensation may represent a substantial portion of total compensation.
Item 9. Purchases of Equity Securities by Closed-End Management Investment Company and Affiliated Purchasers
No such purchases this period.
Item 10. Submission of Matters to a Vote of Security Holders
No material changes.
Item 11. Controls and Procedures
(a) It is the conclusion of the registrant’s principal executive officer and principal financial officer that the effectiveness of the registrant’s current disclosure controls and procedures (such disclosure controls and procedures having been evaluated within 90 days of the date of this filing) provide reasonable assurance that the information required to be disclosed by the registrant has been recorded, processed, summarized and reported within the time period specified in the Commission’s rules and forms and that the information required to be disclosed by the registrant has been accumulated and communicated to the registrant’s principal executive officer and principal financial officer in order to allow timely decisions regarding required disclosure.
(b) There have been no changes in the registrant’s internal controls over financial reporting during the period covered by this report that has materially affected, or is reasonably likely to materially affect, the registrant’s internal control over financial reporting.
Item 12. Disclosure of Securities Lending Activities for Closed-End Management Investment Companies
No activity to report for the registrant’s most recent fiscal year end.
Item 13. Exhibits
Signatures
Pursuant to the requirements of the Securities Exchange Act of 1934 and the Investment Company Act of 1940, the registrant has duly caused this report to be signed on its behalf by the undersigned, thereunto duly authorized.
| | |
| Eaton Vance New York Municipal Bond Fund |
| |
| By: | | /s/ Eric A. Stein |
| | Eric A. Stein |
| | President |
Date: November 22, 2021
Pursuant to the requirements of the Securities Exchange Act of 1934 and the Investment Company Act of 1940, this report has been signed below by the following persons on behalf of the registrant and in the capacities and on the dates indicated.
| | |
| By: | | /s/ James F. Kirchner |
| | James F. Kirchner |
| | Treasurer |
Date: November 22, 2021
| | |
| By: | | /s/ Eric A. Stein |
| | Eric A. Stein |
| | President |
Date: November 22, 2021