UNITED STATES
SECURITIES AND EXCHANGE COMMISSION
Washington, D.C. 20549
Form N-CSR
CERTIFIED SHAREHOLDER REPORT OF REGISTERED
MANAGEMENT INVESTMENT COMPANIES
Investment Company Act File Number: 811-21148
Eaton Vance New York Municipal Bond Fund
(Exact Name of Registrant as Specified in Charter)
Two International Place, Boston, Massachusetts 02110
(Address of Principal Executive Offices)
Deidre E. Walsh
Two International Place, Boston, Massachusetts 02110
(Name and Address of Agent for Services)
(617) 482-8260
(Registrant’s Telephone Number)
September 30
Date of Fiscal Year End
September 30, 2023
Date of Reporting Period
Item 1. Reports to Stockholders
Eaton Vance
National Municipal Opportunities Trust (EOT)
Semiannual Report
September 30, 2023
Commodity Futures Trading Commission Registration. The Commodity Futures Trading Commission (“CFTC”) has adopted regulations that subject registered investment companies and advisers to regulation by the CFTC if a fund invests more than a prescribed level of its assets in certain CFTC-regulated instruments (including futures, certain options and swap agreements) or markets itself as providing investment exposure to such instruments. The investment adviser has claimed an exclusion from the definition of “commodity pool operator” under the Commodity Exchange Act with respect to its management of the Fund. Accordingly, neither the Fund nor the adviser with respect to the operation of the Fund is subject to CFTC regulation. Because of its management of other strategies, the Fund’s adviser is registered with the CFTC as a commodity pool operator. The adviser is also registered as a commodity trading advisor.
Fund shares are not insured by the FDIC and are not deposits or other obligations of, or guaranteed by, any depository institution. Shares are subject to investment risks, including possible loss of principal invested.
Semiannual Report September 30, 2023
Eaton Vance
National Municipal Opportunities Trust
Eaton Vance
National Municipal Opportunities Trust
September 30, 2023
Performance
Portfolio Manager(s) Cynthia J. Clemson and William J. Delahunty, Jr., CFA
| % Average Annual Total Returns1,2 | Inception Date | Six Months | One Year | Five Years | Ten Years |
| Fund at NAV | 05/29/2009 | (4.86)% | 2.68% | 0.18% | 2.83% |
| Fund at Market Price | — | (6.16) | 3.03 | (1.36) | 3.32 |
|
| Bloomberg Municipal Bond Index | — | (4.05)% | 2.66% | 1.05% | 2.29% |
| % Premium/Discount to NAV3 | |
| As of period end | (4.87)% |
| Distributions 4 | |
| Total Distributions per share for the period | $0.375 |
| Distribution Rate at NAV | 4.40% |
| Taxable-Equivalent Distribution Rate at NAV | 7.43 |
| Distribution Rate at Market Price | 4.62 |
| Taxable-Equivalent Distribution Rate at Market Price | 7.81 |
| % Total Leverage5 | |
| Residual Interest Bond (RIB) Financing | 13.70% |
See Endnotes and Additional Disclosures in this report.
Past performance is no guarantee of future results. Returns are historical and are calculated net of management fees and other expenses by determining the percentage change in net asset value (NAV) or market price (as applicable) with all distributions reinvested in accordance with the Fund’s Dividend Reinvestment Plan. Furthermore, returns do not reflect the deduction of taxes that shareholders may have to pay on Fund distributions or upon the sale of Fund shares. Performance at market price will differ from performance at NAV due to variations in the Fund’s market price versus NAV, which may reflect factors such as fluctuations in supply and demand for Fund shares, changes in Fund distributions, shifting market expectations for the Fund’s future returns and distribution rates, and other considerations affecting the trading prices of closed-end funds. Investment return and principal value will fluctuate so that shares, when sold, may be worth more or less than their original cost. Performance for periods less than or equal to one year is cumulative. Performance is for the stated time period only; due to market volatility, current Fund performance may be lower or higher than the quoted return. For performance as of the most recent month-end, please refer to eatonvance.com.
Eaton Vance
National Municipal Opportunities Trust
September 30, 2023
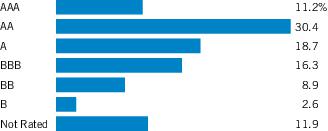
| Credit Quality (% of total investments)1,2 |
Footnotes:
| 1 | For purposes of the Fund’s rating restrictions, ratings are based on Moody’s Investors Service, Inc. (“Moody’s”), S&P Global Ratings (“S&P”) or Fitch Ratings (“Fitch”), as applicable. If securities are rated differently by the ratings agencies, the highest rating is applied. Ratings, which are subject to change, apply to the creditworthiness of the issuers of the underlying securities and not to the Fund or its shares. Credit ratings measure the quality of a bond based on the issuer’s creditworthiness, with ratings ranging from AAA, being the highest, to D, being the lowest based on S&P’s measures. Ratings of BBB or higher by S&P or Fitch (Baa or higher by Moody’s) are considered to be investment-grade quality. Credit ratings are based largely on the ratings agency’s analysis at the time of rating. The rating assigned to any particular security is not necessarily a reflection of the issuer’s current financial condition and does not necessarily reflect its assessment of the volatility of a security’s market value or of the liquidity of an investment in the security. Holdings designated as “Not Rated” (if any) are not rated by the national ratings agencies stated above. |
| 2 | The chart includes the municipal bonds held by a trust that issues residual interest bonds, consistent with the Portfolio of Investments. |
Eaton Vance
National Municipal Opportunities Trust
September 30, 2023
Endnotes and Additional Disclosures
| 1 | Bloomberg Municipal Bond Index is an unmanaged index of municipal bonds traded in the U.S. Unless otherwise stated, index returns do not reflect the effect of any applicable sales charges, commissions, expenses, taxes or leverage, as applicable. It is not possible to invest directly in an index. |
| 2 | Performance results reflect the effects of leverage. |
| 3 | The shares of the Fund often trade at a discount or premium to their net asset value. The discount or premium may vary over time and may be higher or lower than what is quoted in this report. For up-to-date premium/discount information, please refer to https://funds.eatonvance.com/closed-end-fund-prices.php. |
| 4 | The Distribution Rate is based on the Fund’s last regular distribution per share in the period (annualized) divided by the Fund’s NAV or market price at the end of the period. The Fund’s distributions may be comprised of amounts characterized for federal income tax purposes as tax-exempt income, qualified and non-qualified ordinary dividends, capital gains and nondividend distributions, also known as return of capital. The Fund may distribute more than its net investment income and net realized capital gains and, therefore, a distribution may include a return of capital. The Fund will determine the federal income tax character of distributions paid to a shareholder after the end of the calendar year. This is reported on the IRS form 1099-DIV and provided to the shareholder shortly after each year-end. For information about the tax character of distributions made in prior calendar years, please refer to Performance-Tax Character of Distributions on the Fund’s webpage available at eatonvance.com. The Fund’s distributions are determined by the investment adviser based on its current assessment of the Fund’s long-term return potential. Fund distributions may be affected by numerous factors including changes in Fund performance, the cost of financing for leverage, portfolio holdings, realized and projected returns, and other factors. As portfolio and market conditions change, the rate of distributions paid by the Fund could change. Shareholders should not assume that the source of any distribution from the Fund is net income or profit, and the Fund's distributions should not be used as a measure of performance or confused with “yield” or “income.” Taxable-equivalent performance is based on the highest combined federal and state income tax rates, where applicable. Lower tax rates would result in lower tax-equivalent performance. Actual tax rates will vary depending on your income, exemptions and deductions. Rates do not include local taxes. |
| 5 | Fund employs RIB financing. The leverage created by RIB investments provides an opportunity for increased income but, at the same time, creates special risks (including the likelihood of greater price volatility). The cost of leverage rises and falls with changes in short-term interest rates. See “Floating Rate Notes Issued in Conjunction with Securities Held” in the notes to the financial statements for more information about RIB financing. RIB leverage represents the amount of Floating Rate Notes outstanding at period end as a percentage of Fund net assets plus Floating Rate Notes. |
| | Fund profile subject to change due to active management. |
| | Important Notice to Shareholders |
| | On January 26, 2023, the Fund’s Board of Trustees voted to exempt, on a going forward basis, all prior and, until further notice, new acquisitions of Fund shares that otherwise might be deemed “Control Share Acquisitions” under the Fund’s By-Laws from the Control Share Provisions of the Fund’s By-Laws. |
Eaton Vance
National Municipal Opportunities Trust
September 30, 2023
Portfolio of Investments (Unaudited)
| Security | Principal
Amount
(000's omitted) | Value |
| Education — 0.7% |
| Grand Canyon University, 4.125%, 10/1/24 | $ | 2,000 | $ 1,914,000 |
| | | | $ 1,914,000 |
| Hospital — 0.7% |
| Montefiore Obligated Group, 4.287%, 9/1/50 | $ | 3,240 | $ 1,891,943 |
| | | | $ 1,891,943 |
| Other Revenue — 0.9% |
| Morongo Band of Mission Indians, 7.00%, 10/1/39(1) | $ | 2,430 | $ 2,423,366 |
| | | | $ 2,423,366 |
Total Corporate Bonds
(identified cost $8,198,858) | | | $ 6,229,309 |
| Tax-Exempt Municipal Obligations — 108.5% |
| Security | Principal
Amount
(000's omitted) | Value |
| Education — 2.0% |
| Arizona Industrial Development Authority, (Doral Academy of Nevada), 5.00%, 7/15/49(1) | $ | 560 | $ 479,237 |
| Arizona Industrial Development Authority, (Pinecrest Academy of Nevada), 4.00%, 7/15/50(1) | | 185 | 135,979 |
| Boyle County, KY, (Centre College), 4.50%, 6/1/53 | | 1,000 | 911,070 |
| Capital Trust Agency, FL, (Florida Charter Educational Foundation, Inc.): | | | |
| 5.375%, 6/15/38(1) | | 210 | 194,760 |
| 5.375%, 6/15/48(1) | | 395 | 342,410 |
| District of Columbia, (KIPP DC), 4.00%, 7/1/44 | | 410 | 345,499 |
| Illinois Finance Authority, (DePaul College Prep Foundation), 5.625%, 8/1/53(1) | | 750 | 717,075 |
| Jacksonville, FL, (Jacksonville University), 5.00%, 6/1/53(1) | | 1,000 | 824,040 |
| Public Finance Authority, WI, (North Carolina Leadership Academy), 5.00%, 6/15/54(1) | | 455 | 374,520 |
| Public Finance Authority, WI, (Roseman University of Health Sciences): | | | |
| 4.00%, 4/1/52(1) | | 245 | 175,361 |
| 5.00%, 4/1/40(1) | | 620 | 576,494 |
| 5.00%, 4/1/50(1) | | 165 | 143,438 |
| Security | Principal
Amount
(000's omitted) | Value |
| Education (continued) |
| Yonkers Economic Development Corp., NY, (Lamartine/Warburton, LLC - Charter School of Educational Excellence): | | | |
| 5.00%, 10/15/49 | $ | 70 | $ 59,533 |
| 5.00%, 10/15/54 | | 110 | 91,645 |
| | | | $ 5,371,061 |
| Electric Utilities — 6.5% |
| Austin, TX, Electric Utility Revenue, 5.25%, 11/15/53(2) | $ | 4,000 | $ 4,150,320 |
| Burke County Development Authority, GA, (Oglethorpe Power Corp.), 4.125%, 11/1/45 | | 5,750 | 4,647,322 |
| Hawaii Department of Budget and Finance, (Hawaiian Electric Co., Inc.), 3.20%, 7/1/39 | | 1,000 | 640,880 |
| Lower Colorado River Authority, TX, (LCRA Transmission Services Corp.), 5.50%, 5/15/47 | | 2,000 | 2,094,400 |
| New York Power Authority, Green Bonds, 4.00%, 11/15/55 | | 2,000 | 1,740,260 |
| Omaha Public Power District, NE, 5.00%, 2/1/47 | | 4,000 | 4,124,355 |
| | | | $ 17,397,537 |
| Escrowed/Prerefunded — 0.4% |
| New Jersey Economic Development Authority, (School Facilities Construction), Prerefunded to 12/15/28, 5.00%, 6/15/43 | $ | 275 | $ 295,716 |
| Public Finance Authority, WI, (Roseman University of Health Sciences): | | | |
| Prerefunded to 4/1/30, 5.00%, 4/1/40(1) | | 35 | 37,761 |
| Prerefunded to 4/1/30, 5.00%, 4/1/50(1) | | 10 | 10,789 |
| Prerefunded to 4/1/32, 4.00%, 4/1/52(1) | | 5 | 5,171 |
| Southwestern Illinois Development Authority, (Memorial Group, Inc.), Prerefunded to 11/1/23, 7.25%, 11/1/33 | | 770 | 771,648 |
| | | | $ 1,121,085 |
| General Obligations — 15.4% |
| Chicago Board of Education, IL, 5.00%, 12/1/42 | $ | 6,410 | $ 5,914,315 |
| Denton Independent School District, TX, (PSF Guaranteed), 5.00%, 8/15/53(1)(2) | | 4,000 | 4,168,560 |
| Illinois: | | | |
| 4.25%, 12/1/37 | | 6,000 | 5,609,940 |
| 5.00%, 5/1/36 | | 3,500 | 3,445,995 |
| Jackson County School District No. 6, OR, 0.00%, 6/15/41 | | 710 | 279,229 |
| Klein Independent School District, TX, (PSF Guaranteed), 4.00%, 8/1/48 | | 1,555 | 1,367,467 |
| Lamar Consolidated Independent School District, TX, (PSF Guaranteed), 5.00%, 2/15/58(1)(2) | | 2,500 | 2,558,725 |
5
See Notes to Financial Statements.
Eaton Vance
National Municipal Opportunities Trust
September 30, 2023
Portfolio of Investments (Unaudited) — continued
| Security | Principal
Amount
(000's omitted) | Value |
| General Obligations (continued) |
| Leander Independent School District, TX, (PSF Guaranteed), 5.00%, 8/15/47(2) | $ | 4,000 | $ 4,118,000 |
| Pasadena Independent School District, TX, (PSF Guaranteed), 4.25%, 2/15/53(3) | | 5,000 | 4,517,800 |
| Puerto Rico: | | | |
| 0.00%, 7/1/33 | | 2,000 | 1,182,080 |
| 4.00%, 7/1/35 | | 2,033 | 1,771,577 |
| San Diego Unified School District, CA, (Election of 2022), Sustainability Bonds, 5.00%, 7/1/48(3) | | 4,000 | 4,200,240 |
| Township of Freehold, NJ: | | | |
| 1.00%, 10/15/29 | | 575 | 464,226 |
| 1.00%, 10/15/30 | | 1,035 | 804,847 |
| 1.00%, 10/15/31 | | 975 | 729,865 |
| | | | $ 41,132,866 |
| Hospital — 6.1% |
| Chattanooga Health, Educational and Housing Facility Board, TN, (CommonSpirit Health), 4.00%, 8/1/44 | $ | 670 | $ 559,537 |
| Geisinger Authority, PA, (Geisinger Health System), 4.00%, 2/15/47 | | 1,105 | 949,891 |
| Illinois Finance Authority, (Presence Health Network): | | | |
| 3.75%, 2/15/34 | | 1,190 | 1,126,061 |
| 4.00%, 2/15/36 | | 2,500 | 2,383,200 |
| Montgomery County Higher Education and Health Authority, PA, (Thomas Jefferson University Obligated Group), 5.00%, 5/1/57 | | 3,000 | 2,847,450 |
| Muskingum County, OH, (Genesis HealthCare System Obligated Group), 5.00%, 2/15/44 | | 1,000 | 859,730 |
| New York Dormitory Authority, (Northwell Health Obligated Group), 5.00%, 5/1/52 | | 1,770 | 1,766,673 |
| Pennsylvania Economic Development Financing Authority, (UPMC), 4.00%, 5/15/48 | | 500 | 423,665 |
| Tarrant County Cultural Education Facilities Finance Corp., TX, (Cook Children's Medical Center), 5.25%, 12/1/39(2) | | 3,500 | 3,506,370 |
| West Virginia Hospital Finance Authority, (West Virginia University Health System Obligated Group), 4.375%, 6/1/53 | | 2,025 | 1,835,075 |
| | | | $ 16,257,652 |
| Housing — 3.7% |
| CSCDA Community Improvement Authority, CA, (City of Orange Portfolio), Essential Housing Revenue, Social Bonds, 3.00%, 3/1/57(1) | $ | 4,255 | $ 2,654,737 |
| Indiana Housing and Community Development Authority, SFMR, Social Bonds, (FHLMC), (FNMA), (GNMA), 4.70%, 7/1/53 | | 2,000 | 1,897,340 |
| Security | Principal
Amount
(000's omitted) | Value |
| Housing (continued) |
| New Mexico Mortgage Finance Authority, (FHLMC), (FNMA), (GNMA), 4.25%, 9/1/43 | $ | 990 | $ 914,869 |
| Rhode Island Housing and Mortgage Finance Corp., Social Bonds, (FHLMC), (FNMA), (GNMA), 4.65%, 10/1/53 | | 1,690 | 1,572,207 |
| Washington Housing Finance Commission, 3.375%, 4/20/37 | | 3,405 | 2,739,901 |
| | | | $ 9,779,054 |
| Industrial Development Revenue — 10.4% |
| Arkansas Development Finance Authority, (United States Steel Corp.), Green Bonds, (AMT), 5.70%, 5/1/53 | $ | 2,540 | $ 2,438,324 |
| Henderson, KY, (Pratt Paper, LLC), (AMT), 4.70%, 1/1/52(1) | | 2,000 | 1,827,820 |
| Houston, TX, (United Airlines, Inc.), (AMT), 4.00%, 7/15/41 | | 2,980 | 2,478,764 |
| Iowa Finance Authority, (Iowa Fertilizer Co.), 5.00%, 12/1/50 | | 1,500 | 1,435,485 |
| Maine Finance Authority, (Casella Waste Systems, Inc.), (AMT), 5.125% to 8/1/25 (Put Date), 8/1/35(1) | | 725 | 725,884 |
| National Finance Authority, NH, (Covanta): | | | |
| 4.625%, 11/1/42(1) | | 1,415 | 1,167,616 |
| (AMT), 4.875%, 11/1/42(1) | | 1,555 | 1,326,275 |
| New Hampshire Business Finance Authority, (Casella Waste Systems, Inc.), 2.95%, 4/1/29(1) | | 560 | 497,969 |
| New Jersey Economic Development Authority, (Continental Airlines), (AMT), 5.25%, 9/15/29 | | 1,900 | 1,895,136 |
| New York Liberty Development Corp., (Goldman Sachs Group, Inc.), 5.25%, 10/1/35 | | 2,560 | 2,786,125 |
| New York Transportation Development Corp., (Delta Air Lines, Inc. - LaGuardia Airport Terminals C&D Redevelopment): | | | |
| (AMT), 4.375%, 10/1/45 | | 1,500 | 1,308,705 |
| (AMT), 5.00%, 10/1/40 | | 4,405 | 4,234,262 |
| Niagara Area Development Corp., NY, (Covanta), (AMT), 4.75%, 11/1/42(1) | | 2,000 | 1,678,080 |
| Phenix City Industrial Development Board, AL, (MeadWestvaco Coated Board), (AMT), 4.125%, 5/15/35 | | 3,935 | 3,727,271 |
| Vermont Economic Development Authority, (Casella Waste Systems, Inc.), (AMT), 4.625% to 4/3/28 (Put Date), 4/1/36(1) | | 145 | 141,693 |
| | | | $ 27,669,409 |
| Insured - Electric Utilities — 1.9% |
| Georgia Municipal Electric Authority, (Plant Vogtle Units 3 & 4 Project J), (AGM), 5.00%, 7/1/64 | $ | 1,875 | $ 1,884,975 |
6
See Notes to Financial Statements.
Eaton Vance
National Municipal Opportunities Trust
September 30, 2023
Portfolio of Investments (Unaudited) — continued
| Security | Principal
Amount
(000's omitted) | Value |
| Insured - Electric Utilities (continued) |
| Lower Colorado River Authority, TX, (LCRA Transmission Services Corp.), (AGM), 5.25%, 5/15/53(2) | $ | 3,000 | $ 3,066,510 |
| | | | $ 4,951,485 |
| Insured - Other Revenue — 0.1% |
| New York City Industrial Development Agency, NY, (Queens Baseball Stadium), (AGM), 3.00%, 1/1/46 | $ | 280 | $ 193,164 |
| | | | $ 193,164 |
| Insured - Special Tax Revenue — 4.9% |
| Miami-Dade County, FL, Professional Sports Franchise Facilities: | | | |
| (AGC), 6.875%, 10/1/34 | $ | 4,000 | $ 4,687,600 |
| (AGC), 7.00%, 10/1/39 | | 6,000 | 6,965,100 |
| Tolomato Community Development District, FL: | | | |
| (AGM), 3.75%, 5/1/39 | | 720 | 629,294 |
| (AGM), 3.75%, 5/1/40 | | 855 | 735,933 |
| | | | $ 13,017,927 |
| Insured - Transportation — 8.2% |
| Metropolitan Transportation Authority, NY, Green Bonds, (AGM), 4.00%, 11/15/48 | $ | 6,225 | $ 5,444,883 |
| New York Thruway Authority, (AGM), 3.00%, 1/1/46 | | 4,895 | 3,412,892 |
| North Carolina Turnpike Authority, (Triangle Expressway System): | | | |
| (AGC), 0.00%, 1/1/35 | | 4,000 | 2,385,760 |
| (AGC), 0.00%, 1/1/36 | | 13,000 | 7,312,370 |
| Pennsylvania Economic Development Financing Authority, (PennDOT Major Bridges Package One), (AGM), (AMT), 5.00%, 12/31/57 | | 3,375 | 3,266,494 |
| | | | $ 21,822,399 |
| Lease Revenue/Certificates of Participation — 6.4% |
| Baltimore, MD, (Harbor Point), 4.875%, 6/1/42 | $ | 320 | $ 294,022 |
| New Jersey Economic Development Authority, (Portal North Bridge), 5.00%, 11/1/52 | | 2,000 | 2,002,040 |
| New Jersey Economic Development Authority, (School Facilities Construction): | | | |
| 5.00%, 6/15/43 | | 465 | 467,423 |
| 5.00%, 6/15/44 | | 4,260 | 4,313,292 |
| New Jersey Transportation Trust Fund Authority, (Transportation Program), 4.25%, 6/15/44 | | 800 | 736,376 |
| New Jersey Transportation Trust Fund Authority, (Transportation System), 0.00%, 12/15/38 | | 20,000 | 9,285,265 |
| | | | $ 17,098,418 |
| Security | Principal
Amount
(000's omitted) | Value |
| Other Revenue — 3.2% |
| Black Belt Energy Gas District, AL, 5.50% to 11/1/28 (Put Date), 6/1/49 | $ | 1,000 | $ 1,020,330 |
| Buckeye Tobacco Settlement Financing Authority, OH, 5.00%, 6/1/55 | | 3,205 | 2,764,857 |
| Golden State Tobacco Securitization Corp., CA, 5.00%, 6/1/51 | | 780 | 792,488 |
| Kalispel Tribe of Indians, WA, Series A, 5.25%, 1/1/38(1) | | 390 | 398,553 |
| Military Installation Development Authority, UT, 4.00%, 6/1/41 | | 500 | 374,530 |
| Morongo Band of Mission Indians, CA, 5.00%, 10/1/42(1) | | 605 | 587,661 |
| Patriots Energy Group Financing Agency, SC, Gas Supply Revenue, 5.25% to 8/1/31 (Put Date), 10/1/54 | | 1,000 | 1,007,160 |
| Salt Verde Financial Corp., AZ, Senior Gas Revenue, 5.00%, 12/1/37 | | 1,605 | 1,577,827 |
| | | | $ 8,523,406 |
| Senior Living/Life Care — 9.1% |
| Atlantic Beach, FL, (Fleet Landing), 5.00%, 11/15/37 | $ | 3,405 | $ 3,178,874 |
| Bexar County Health Facilities Development Corp., TX, (Army Retirement Residence Foundation): | | | |
| 5.00%, 7/15/37 | | 850 | 750,550 |
| 5.00%, 7/15/42 | | 700 | 584,311 |
| Clackamas County Hospital Facility Authority, OR, (Rose Villa), 5.25%, 11/15/50 | | 125 | 108,906 |
| Colorado Health Facilities Authority, (Aberdeen Ridge), 5.00%, 5/15/58 | | 1,110 | 709,634 |
| District of Columbia, (Ingleside at Rock Creek), 5.00%, 7/1/32 | | 185 | 174,821 |
| Harris County Cultural Education Facilities Finance Corp., TX, (Brazos Presbyterian Homes, Inc.): | | | |
| 5.75%, 1/1/28 | | 165 | 165,000 |
| 6.375%, 1/1/33 | | 30 | 30,010 |
| Iowa Finance Authority, (Lifespace Communities, Inc.), 4.125%, 5/15/38 | | 1,500 | 1,114,800 |
| Massachusetts Development Finance Agency, (Linden Ponds, Inc.): | | | |
| 5.00%, 11/15/33(1) | | 470 | 471,072 |
| 5.00%, 11/15/38(1) | | 310 | 296,586 |
| Massachusetts Development Finance Agency, (NewBridge on the Charles, Inc.), 5.00%, 10/1/57(1) | | 1,650 | 1,352,802 |
| Multnomah County Hospital Facilities Authority, OR, (Mirabella at South Waterfront), Escrowed to Maturity, 5.00%, 10/1/24 | | 185 | 185,836 |
| Multnomah County Hospital Facilities Authority, OR, (Terwilliger Plaza), 4.00%, 12/1/51 | | 1,480 | 944,640 |
| National Finance Authority, NH, (The Vista): | | | |
| 5.25%, 7/1/39(1) | | 265 | 230,266 |
| 5.625%, 7/1/46(1) | | 360 | 309,859 |
7
See Notes to Financial Statements.
Eaton Vance
National Municipal Opportunities Trust
September 30, 2023
Portfolio of Investments (Unaudited) — continued
| Security | Principal
Amount
(000's omitted) | Value |
| Senior Living/Life Care (continued) |
| National Finance Authority, NH, (The Vista): (continued) | | | |
| 5.75%, 7/1/54(1) | $ | 780 | $ 663,437 |
| New Hope Cultural Education Facilities Finance Corp., TX, (Longhorn Village): | | | |
| 5.00%, 1/1/31 | | 1,235 | 1,174,312 |
| 5.00%, 1/1/32 | | 1,295 | 1,218,841 |
| New Mexico Hospital Equipment Loan Council, (Haverland Carter Lifestyle Group): | | | |
| 5.00%, 7/1/32 | | 75 | 69,083 |
| 5.00%, 7/1/33 | | 50 | 45,553 |
| 5.00%, 7/1/34 | | 55 | 49,553 |
| Norfolk Redevelopment and Housing Authority, VA, (Fort Norfolk Retirement Community, Inc. - Harbor's Edge), 5.00%, 1/1/49 | | 3,000 | 2,253,510 |
| Palm Beach County Health Facilities Authority, FL, (Green Cay Life Plan Village), 11.50%, 7/1/27(1) | | 750 | 813,720 |
| Palm Beach County Health Facilities Authority, FL, (Toby & Leon Cooperman Sinai Residences of Boca Raton), 4.00%, 6/1/41 | | 1,030 | 776,919 |
| Public Finance Authority, WI, (Mary's Woods at Marylhurst), 5.25%, 5/15/37(1) | | 630 | 593,113 |
| South Carolina Jobs-Economic Development Authority, (Seafields Kiawah Island Project), 7.75%, 11/15/58 | | 2,000 | 1,918,620 |
| Tarrant County Cultural Education Facilities Finance Corp., TX, (MRC Stevenson Oaks), 6.625%, 11/15/41 | | 1,335 | 1,201,874 |
| Tempe Industrial Development Authority, AZ, (Mirabella at ASU), 6.00%, 10/1/37(1) | | 900 | 593,208 |
| Tulsa County Industrial Authority, OK, (Montereau, Inc.), 5.25%, 11/15/37 | | 1,000 | 972,740 |
| Washington Housing Finance Commission, (Bayview Manor Homes), 5.00%, 7/1/51(1) | | 1,335 | 966,847 |
| Washington Housing Finance Commission, (Transforming Age), 5.00%, 1/1/49(1) | | 305 | 224,596 |
| | | | $ 24,143,893 |
| Special Tax Revenue — 7.9% |
| Maryland Economic Development Corp., (Port Covington), 4.00%, 9/1/50 | $ | 140 | $ 106,652 |
| New York City Transitional Finance Authority, NY, 4.375%, 5/1/53 | | 1,000 | 916,000 |
| New York State Urban Development Corp., Personal Income Tax Revenue, 5.00%, 3/15/44(2) | | 6,900 | 7,048,488 |
| New York Thruway Authority, Personal Income Tax Revenue, 4.00%, 3/15/44 | | 1,000 | 897,000 |
| Puerto Rico Sales Tax Financing Corp.: | | | |
| 0.00%, 7/1/51 | | 1,250 | 233,138 |
| 5.00%, 7/1/58 | | 4,015 | 3,641,926 |
| Security | Principal
Amount
(000's omitted) | Value |
| Special Tax Revenue (continued) |
| Tolomato Community Development District, FL, 3.25%, 5/1/40 | $ | 1,200 | $ 882,072 |
| Triborough Bridge and Tunnel Authority, NY, Green Bonds, 5.25%, 5/15/47(2) | | 2,125 | 2,216,885 |
| Triborough Bridge and Tunnel Authority, NY, Sales Tax Revenue, 4.00%, 5/15/48 | | 1,000 | 888,450 |
| Washington Metropolitan Area Transit Authority, D.C., Sustainability Bonds, 5.25%, 7/15/53(1)(2) | | 4,000 | 4,197,360 |
| | | | $ 21,027,971 |
| Transportation — 19.0% |
| Charlotte, NC, (Charlotte Douglas International Airport), 5.00%, 7/1/48 | $ | 4,000 | $ 4,123,320 |
| Chicago, IL, (O'Hare International Airport), (AMT), 5.50%, 1/1/55(2) | | 1,500 | 1,533,105 |
| Dallas and Fort Worth, TX, (Dallas/Fort Worth International Airport): | | | |
| 5.25%, 11/1/30 | | 1,125 | 1,125,968 |
| 5.25%, 11/1/31 | | 1,735 | 1,736,492 |
| Houston, TX, (United Airlines, Inc.), (AMT), 5.00%, 7/1/29 | | 2,060 | 2,029,553 |
| Massachusetts, (Rail Enhancement Program), Sustainablility Bonds, 5.00%, 6/1/53(2)(3) | | 4,000 | 4,162,400 |
| Metropolitan Transportation Authority, NY, Green Bonds, 5.25%, 11/15/55 | | 1,520 | 1,531,005 |
| Metropolitan Washington Airports Authority, D.C., (AMT), 4.00%, 10/1/51 | | 2,200 | 1,845,558 |
| Minneapolis-St. Paul Metropolitan Airports Commission, MN, 4.25%, 1/1/52 | | 1,000 | 902,930 |
| New Jersey Economic Development Authority, (The Goethals Bridge Replacement), (AMT), 5.125%, 1/1/34 | | 1,250 | 1,252,900 |
| New York Transportation Development Corp., (LaGuardia Airport Terminal B Redevelopment): | | | |
| (AMT), 5.00%, 12/1/39 | | 450 | 448,038 |
| (AMT), 5.25%, 1/1/50 | | 2,115 | 2,075,872 |
| New York Transportation Development Corp., (Terminal 4 John F. Kennedy International Airport), (AMT), 5.00%, 12/1/38 | | 1,950 | 1,947,309 |
| San Francisco City and County Airport Commission, CA, (San Francisco International Airport), (AMT), 5.00%, 5/1/49 | | 6,000 | 5,958,420 |
| South Jersey Transportation Authority, NJ, 5.25%, 11/1/52 | | 1,000 | 995,970 |
| Texas Private Activity Bond Surface Transportation Corp., (North Tarrant Express Segment 3C), (AMT), 5.00%, 6/30/58 | | 4,000 | 3,828,360 |
| Texas Transportation Commission, (State Highway 249 System), 0.00%, 8/1/38 | | 850 | 374,629 |
8
See Notes to Financial Statements.
Eaton Vance
National Municipal Opportunities Trust
September 30, 2023
Portfolio of Investments (Unaudited) — continued
| Security | Principal
Amount
(000's omitted) | Value |
| Transportation (continued) |
| Triborough Bridge and Tunnel Authority, NY, 5.00%, 11/15/51(2) | $ | 8,800 | $ 8,907,712 |
| Virginia Small Business Financing Authority, (95 Express Lanes, LLC), (AMT), 4.00%, 1/1/39 | | 955 | 863,473 |
| Virginia Small Business Financing Authority, (Transform 66 P3): | | | |
| (AMT), 5.00%, 12/31/49 | | 4,365 | 4,180,142 |
| (AMT), 5.00%, 12/31/52 | | 1,000 | 951,290 |
| | | | $ 50,774,446 |
| Water and Sewer — 3.3% |
| Michigan Finance Authority, (Detroit Water and Sewerage Department), 5.00%, 7/1/34 | $ | 2,070 | $ 2,079,833 |
| Texas Water Development Board: | | | |
| 4.80%, 10/15/52 | | 1,500 | 1,502,430 |
| 5.00%, 10/15/47(2) | | 5,000 | 5,190,350 |
| | | | $ 8,772,613 |
Total Tax-Exempt Municipal Obligations
(identified cost $298,177,066) | | | $289,054,386 |
| Taxable Municipal Obligations — 4.4% |
| Security | Principal
Amount
(000's omitted) | Value |
| General Obligations — 1.2% |
| Chicago, IL: | | | |
| 7.375%, 1/1/33 | $ | 1,750 | $ 1,816,255 |
| 7.781%, 1/1/35 | | 1,400 | 1,486,716 |
| | | | $ 3,302,971 |
| Hospital — 1.5% |
| California Statewide Communities Development Authority, (Loma Linda University Medical Center), 6.00%, 12/1/24 | $ | 4,000 | $ 3,956,880 |
| | | | $ 3,956,880 |
| Insured - Education — 0.4% |
| Onondaga Civic Development Corp., NY, (Upstate Properties Development, Inc.), (BAM), 3.158%, 12/1/41 | $ | 1,610 | $ 1,094,075 |
| | | | $ 1,094,075 |
| Security | Principal
Amount
(000's omitted) | Value |
| Insured - Housing — 0.4% |
| Oregon Facilities Authority, (CHF-Ashland, LLC - Southern Oregon University), (AGM), 3.508%, 7/1/41 | $ | 1,500 | $ 1,058,850 |
| | | | $ 1,058,850 |
| Special Tax Revenue — 0.5% |
| American Samoa Economic Development Authority: | | | |
| 2.47%, 9/1/24(1) | $ | 250 | $ 240,718 |
| 3.72%, 9/1/27(1) | | 1,115 | 988,436 |
| | | | $ 1,229,154 |
| Transportation — 0.4% |
| Maryland Economic Development Corp., (Seagirt Marine Terminal), 4.75%, 6/1/42 | $ | 1,500 | $ 1,138,500 |
| | | | $ 1,138,500 |
Total Taxable Municipal Obligations
(identified cost $13,171,825) | | | $ 11,780,430 |
Total Investments — 115.2%
(identified cost $319,547,749) | | | $307,064,125 |
| Other Assets, Less Liabilities — (15.2)% | | | $ (40,541,460) |
| Net Assets — 100.0% | | | $266,522,665 |
| The percentage shown for each investment category in the Portfolio of Investments is based on net assets. |
| (1) | Security exempt from registration under Rule 144A of the Securities Act of 1933, as amended. These securities may be sold in certain transactions in reliance on an exemption from registration (normally to qualified institutional buyers). At September 30, 2023, the aggregate value of these securities is $36,115,994 or 13.6% of the Trust's net assets. |
| (2) | Security represents the municipal bond held by a trust that issues residual interest bonds (see Note 1G). |
| (3) | When-issued security. |
| At September 30, 2023, the concentration of the Trust’s investments in the various states and territories, determined as a percentage of total investments, is as follows: |
| Texas | 17.2% |
| New York | 16.5% |
| Others, representing less than 10% individually | 64.3% |
9
See Notes to Financial Statements.
Eaton Vance
National Municipal Opportunities Trust
September 30, 2023
Portfolio of Investments (Unaudited) — continued
| The Trust invests primarily in debt securities issued by municipalities. The ability of the issuers of the debt securities to meet their obligations may be affected by economic developments in a specific industry or municipality. At September 30, 2023, 12.0% of total investments are backed by bond insurance of various financial institutions and financial guaranty assurance agencies. The aggregate percentage insured by an individual financial institution or financial guaranty assurance agency ranged from 0.4% to 7.0% of total investments. |
| Abbreviations: |
| AGC | – Assured Guaranty Corp. |
| AGM | – Assured Guaranty Municipal Corp. |
| AMT | – Interest earned from these securities may be considered a tax preference item for purposes of the Federal Alternative Minimum Tax. |
| BAM | – Build America Mutual Assurance Co. |
| FHLMC | – Federal Home Loan Mortgage Corp. |
| FNMA | – Federal National Mortgage Association |
| GNMA | – Government National Mortgage Association |
| PSF | – Permanent School Fund |
| SFMR | – Single Family Mortgage Revenue |
10
See Notes to Financial Statements.
Eaton Vance
National Municipal Opportunities Trust
September 30, 2023
Statement of Assets and Liabilities (Unaudited)
| | September 30, 2023 |
| Assets | |
| Investments, at value (identified cost $319,547,749) | $ 307,064,125 |
| Interest receivable | 4,373,598 |
| Receivable for investments sold | 17,221,583 |
| Trustees' deferred compensation plan | 46,882 |
| Due from broker for floating rate notes issued | 3,200,000 |
| Total assets | $331,906,188 |
| Liabilities | |
| Payable for floating rate notes issued | $ 42,286,644 |
| Due to broker for floating rate notes redeemed | 7,660,000 |
| Payable for when-issued securities | 13,247,780 |
| Due to custodian | 1,291,889 |
| Payable to affiliates: | |
| Investment adviser and administrative fee | 160,742 |
| Trustees' deferred compensation plan | 46,882 |
| Interest expense and fees payable | 574,847 |
| Accrued expenses | 114,739 |
| Total liabilities | $ 65,383,523 |
| Net Assets | $266,522,665 |
| Sources of Net Assets | |
| Common shares, $0.01 par value, unlimited number of shares authorized | $ 156,249 |
| Additional paid-in capital | 298,400,478 |
| Accumulated loss | (32,034,062) |
| Net Assets | $266,522,665 |
| Common Shares Issued and Outstanding | 15,624,921 |
| Net Asset Value Per Common Share | |
| Net assets ÷ common shares issued and outstanding | $ 17.06 |
11
See Notes to Financial Statements.
Eaton Vance
National Municipal Opportunities Trust
September 30, 2023
Statement of Operations (Unaudited)
| | Six Months Ended |
| | September 30, 2023 |
| Investment Income | |
| Interest income | $ 7,774,842 |
| Total investment income | $ 7,774,842 |
| Expenses | |
| Investment adviser and administrative fee | $ 986,429 |
| Trustees’ fees and expenses | 10,732 |
| Custodian fee | 35,380 |
| Transfer and dividend disbursing agent fees | 9,767 |
| Legal and accounting services | 41,726 |
| Printing and postage | 27,394 |
| Interest expense and fees | 920,083 |
| Miscellaneous | 31,434 |
| Total expenses | $ 2,062,945 |
| Net investment income | $ 5,711,897 |
| Realized and Unrealized Gain (Loss) | |
| Net realized gain (loss): | |
| Investment transactions | $ (3,769,353) |
| Net realized loss | $ (3,769,353) |
| Change in unrealized appreciation (depreciation): | |
| Investments | $ (15,768,193) |
| Net change in unrealized appreciation (depreciation) | $(15,768,193) |
| Net realized and unrealized loss | $(19,537,546) |
| Net decrease in net assets from operations | $(13,825,649) |
12
See Notes to Financial Statements.
Eaton Vance
National Municipal Opportunities Trust
September 30, 2023
Statements of Changes in Net Assets
| | Six Months Ended
September 30, 2023
(Unaudited) | Year Ended
March 31, 2023 |
| Increase (Decrease) in Net Assets | | |
| From operations: | | |
| Net investment income | $ 5,711,897 | $ 11,288,228 |
| Net realized loss | (3,769,353) | (12,891,702) |
| Net change in unrealized appreciation (depreciation) | (15,768,193) | (14,102,309) |
| Net decrease in net assets from operations | $ (13,825,649) | $ (15,705,783) |
| Distributions to shareholders | $ (5,859,345) | $ (11,718,624) |
| Capital share transactions: | | |
| Reinvestment of distributions | $ — | $ 6,744 |
| Net increase in net assets from capital share transactions | $ — | $ 6,744 |
| Net decrease in net assets | $ (19,684,994) | $ (27,417,663) |
| Net Assets | | |
| At beginning of period | $ 286,207,659 | $ 313,625,322 |
| At end of period | $266,522,665 | $286,207,659 |
13
See Notes to Financial Statements.
Eaton Vance
National Municipal Opportunities Trust
September 30, 2023
Statement of Cash Flows (Unaudited)
| | Six Months Ended |
| | September 30, 2023 |
| Cash Flows From Operating Activities | |
| Net decrease in net assets from operations | $ (13,825,649) |
| Adjustments to reconcile net decrease in net assets from operations to net cash used in operating activities: | |
| Investments purchased | (77,722,630) |
| Investments sold | 70,222,238 |
| Net amortization/accretion of premium (discount) | (457,010) |
| Decrease in interest receivable | 190,423 |
| Increase in Trustees’ deferred compensation plan | (46,882) |
| Decrease in payable to affiliate for investment adviser and administrative fee | (3,470) |
| Increase in interest expense and fees payable | 271,087 |
| Increase in payable to affiliate for Trustees' deferred compensation plan | 46,882 |
| Decrease in accrued expenses | (46,814) |
| Net change in unrealized appreciation (depreciation) from investments | 15,768,193 |
| Net realized loss from investments | 3,769,353 |
| Net cash used in operating activities | $ (1,834,279) |
| Cash Flows From Financing Activities | |
| Cash distributions paid | $ (5,859,345) |
| Proceeds from secured borrowings | 21,800,000 |
| Repayment of secured borrowings | (14,500,000) |
| Increase in due to custodian | 393,624 |
| Net cash provided by financing activities | $ 1,834,279 |
| Net increase in cash | $ — |
| Cash at beginning of period | $ — |
| Cash at end of period | $ — |
| Supplemental disclosure of cash flow information: | |
| Cash paid for interest and fees on borrowings | $ 648,996 |
14
See Notes to Financial Statements.
Eaton Vance
National Municipal Opportunities Trust
September 30, 2023
| | Six Months Ended
September 30, 2023
(Unaudited) | Year Ended March 31, |
| | 2023 | 2022 | 2021 | 2020 | 2019 |
| Net asset value — Beginning of period | $ 18.320 | $ 20.070 | $ 21.730 | $ 20.530 | $ 21.090 | $ 21.320 |
| Income (Loss) From Operations | | | | | | |
| Net investment income(1) | $ 0.366 | $ 0.722 | $ 0.733 | $ 0.780 | $ 0.835 | $ 0.955 |
| Net realized and unrealized gain (loss) | (1.251) | (1.722) | (1.652) | 1.183 | (0.412) | (0.057) |
| Total income (loss) from operations | $ (0.885) | $ (1.000) | $ (0.919) | $ 1.963 | $ 0.423 | $ 0.898 |
| Less Distributions | | | | | | |
| From net investment income | $ (0.375) | $ (0.750) | $ (0.753) | $ (0.764) | $ (0.841) | $ (1.021) |
| From net realized gain | — | — | — | — | (0.078) | (0.107) |
| Tax return of capital | — | — | — | — | (0.065) | — |
| Total distributions | $ (0.375) | $ (0.750) | $ (0.753) | $ (0.764) | $ (0.984) | $ (1.128) |
| Premium from common shares sold through shelf offering (see Note 5)(1) | $ — | $ — | $ 0.012 | $ 0.001 | $ 0.001 | $ — |
| Net asset value — End of period | $ 17.060 | $ 18.320 | $ 20.070 | $ 21.730 | $ 20.530 | $ 21.090 |
| Market value — End of period | $ 16.220 | $ 17.670 | $ 19.050 | $ 22.500 | $ 19.500 | $ 21.120 |
| Total Investment Return on Net Asset Value(2) | (4.86)% (3) | (4.73)% | (4.36)% | 9.87% | 1.90% | 4.54% |
| Total Investment Return on Market Value(2) | (6.16)% (3) | (3.19)% | (12.33)% | 19.77% | (3.35)% | 7.98% |
| Ratios/Supplemental Data | | | | | | |
| Net assets, end of period (000’s omitted) | $266,523 | $286,208 | $313,625 | $333,178 | $314,321 | $321,241 |
| Ratios (as a percentage of average daily net assets): | | | | | | |
| Expenses excluding interest and fees | 0.81% (4) | 0.77% | 0.73% | 0.73% | 0.75% | 0.76% |
| Interest and fee expense(5) | 0.65% (4) | 0.32% | 0.06% | 0.05% | 0.17% | 0.22% |
| Total expenses | 1.46% (4) | 1.09% | 0.79% | 0.78% | 0.92% | 0.98% |
| Net investment income | 4.03% (4) | 3.92% | 3.35% | 3.67% | 3.88% | 4.55% |
| Portfolio Turnover | 27% (3) | 45% | 13% | 13% | 44% | 17% |
| (1) | Computed using average shares outstanding. |
| (2) | Returns are historical and are calculated by determining the percentage change in net asset value or market value with all distributions reinvested. Distributions are assumed to be reinvested at prices obtained under the Trust’s dividend reinvestment plan. |
| (3) | Not annualized. |
| (4) | Annualized. |
| (5) | Interest and fee expense relates to the liability for floating rate notes issued in conjunction with residual interest bond transactions (see Note 1G). |
15
See Notes to Financial Statements.
Eaton Vance
National Municipal Opportunities Trust
September 30, 2023
Notes to Financial Statements (Unaudited)
1 Significant Accounting Policies
Eaton Vance National Municipal Opportunities Trust (the Trust) is a Massachusetts business trust registered under the Investment Company Act of 1940, as amended (the 1940 Act), as a diversified, closed-end management investment company. The Trust’s primary investment objective is to provide current income exempt from regular federal income tax. The Trust will, as a secondary investment objective, seek to achieve capital appreciation.
The following is a summary of significant accounting policies of the Trust. The policies are in conformity with accounting principles generally accepted in the United States of America (U.S. GAAP). The Trust is an investment company and follows accounting and reporting guidance in the Financial Accounting Standards Board (FASB) Accounting Standards Codification Topic 946.
A Investment Valuation—The following methodologies are used to determine the market value or fair value of investments.
Debt Obligations. Debt obligations are generally valued on the basis of valuations provided by third party pricing services, as derived from such services’ pricing models. Inputs to the models may include, but are not limited to, reported trades, executable bid and ask prices, broker/dealer quotations, prices or yields of securities with similar characteristics, interest rates, anticipated prepayments, benchmark curves or information pertaining to the issuer, as well as industry and economic events. The pricing services may use a matrix approach, which considers information regarding securities with similar characteristics to determine the valuation for a security. Short-term debt obligations purchased with a remaining maturity of sixty days or less for which a valuation from a third party pricing service is not readily available may be valued at amortized cost, which approximates fair value.
Fair Valuation. In connection with Rule 2a-5 of the 1940 Act, the Trustees have designated the Trust’s investment adviser as its valuation designee. Investments for which valuations or market quotations are not readily available or are deemed unreliable are valued by the investment adviser, as valuation designee, at fair value using methods that most fairly reflect the security’s “fair value”, which is the amount that the Trust might reasonably expect to receive for the security upon its current sale in the ordinary course. Each such determination is based on a consideration of relevant factors, which are likely to vary from one pricing context to another. These factors may include, but are not limited to, the type of security, the existence of any contractual restrictions on the security’s disposition, the price and extent of public trading in similar securities of the issuer or of comparable companies or entities, quotations or relevant information obtained from broker/dealers or other market participants, information obtained from the issuer, analysts, and/or the appropriate stock exchange (for exchange-traded securities), an analysis of the company’s or entity’s financial statements, and an evaluation of the forces that influence the issuer and the market(s) in which the security is purchased and sold.
B Investment Transactions and Related Income—Investment transactions for financial statement purposes are accounted for on a trade date basis. Realized gains and losses on investments sold are determined on the basis of identified cost. Interest income is recorded on the basis of interest accrued, adjusted for amortization of premium or accretion of discount.
C Federal Taxes—The Trust’s policy is to comply with the provisions of the Internal Revenue Code applicable to regulated investment companies and to distribute to shareholders each year substantially all of its taxable, if any, and tax-exempt net investment income, and all or substantially all of its net realized capital gains. Accordingly, no provision for federal income or excise tax is necessary. The Trust intends to satisfy conditions which will enable it to designate distributions from the interest income generated by its investments in non-taxable municipal securities, which are exempt from regular federal income tax when received by the Trust, as exempt-interest dividends. The portion of such interest, if any, earned on private activity bonds issued after August 7, 1986, may be considered a tax preference item to shareholders.
As of September 30, 2023, the Trust had no uncertain tax positions that would require financial statement recognition, de-recognition, or disclosure. The Trust files a U.S. federal income tax return annually after its fiscal year-end, which is subject to examination by the Internal Revenue Service for a period of three years from the date of filing.
D Legal Fees—Legal fees and other related expenses incurred as part of negotiations of the terms and requirement of capital infusions, or that are expected to result in the restructuring of, or a plan of reorganization for, an investment are recorded as realized losses. Ongoing expenditures to protect or enhance an investment are treated as operating expenses.
E Use of Estimates—The preparation of the financial statements in conformity with U.S. GAAP requires management to make estimates and assumptions that affect the reported amounts of assets and liabilities at the date of the financial statements and the reported amounts of income and expense during the reporting period. Actual results could differ from those estimates.
F Indemnifications—Under the Trust's organizational documents, its officers and Trustees may be indemnified against certain liabilities and expenses arising out of the performance of their duties to the Trust. Under Massachusetts law, if certain conditions prevail, shareholders of a Massachusetts business trust (such as the Trust) could be deemed to have personal liability for the obligations of the Trust. However, the Trust’s Declaration of Trust contains an express disclaimer of liability on the part of Trust shareholders and the By-laws provide that the Trust shall assume, upon request by the shareholder, the defense on behalf of any Trust shareholders. Moreover, the By-laws also provide for indemnification out of Trust property of any shareholder held personally liable solely by reason of being or having been a shareholder for all loss or expense arising from such liability. Additionally, in the normal course of business, the Trust enters into agreements with service providers that may contain indemnification clauses. The Trust’s maximum exposure under these arrangements is unknown as this would involve future claims that may be made against the Trust that have not yet occurred.
Eaton Vance
National Municipal Opportunities Trust
September 30, 2023
Notes to Financial Statements (Unaudited) — continued
G Floating Rate Notes Issued in Conjunction with Securities Held—The Trust may invest in residual interest bonds, also referred to as inverse floating rate securities, whereby the Trust may sell a variable or fixed rate bond for cash to a Special-Purpose Vehicle (the SPV), (which is generally organized as a trust), while at the same time, buying a residual interest in the assets and cash flows of the SPV. The bond is deposited into the SPV with the same CUSIP number as the bond sold to the SPV by the Trust, and which may have been, but is not required to be, the bond purchased from the Trust (the Bond). The SPV also issues floating rate notes (Floating Rate Notes) which are sold to third-parties. The residual interest bond held by the Trust gives the Trust the right (1) to cause the holders of the Floating Rate Notes to generally tender their notes at par, and (2) to have the Bond held by the SPV transferred to the Trust, thereby terminating the SPV. Should the Trust exercise such right, it would generally pay the SPV the par amount due on the Floating Rate Notes and exchange the residual interest bond for the underlying Bond. Pursuant to generally accepted accounting principles for transfers and servicing of financial assets and extinguishment of liabilities, the Trust accounts for the transaction described above as a secured borrowing by including the Bond in its Portfolio of Investments and the Floating Rate Notes as a liability under the caption “Payable for floating rate notes issued” in its Statement of Assets and Liabilities. The Floating Rate Notes have interest rates that generally reset weekly and their holders have the option to tender their notes to the SPV for redemption at par at each reset date. Accordingly, the fair value of the payable for floating rate notes issued approximates its carrying value. If measured at fair value, the payable for floating rate notes would have been considered as Level 2 in the fair value hierarchy (see Note 6) at September 30, 2023. Interest expense related to the Trust's liability with respect to Floating Rate Notes is recorded as incurred. The SPV may be terminated by the Trust, as noted above, or by the occurrence of certain termination events as defined in the trust agreement, such as a downgrade in the credit quality of the underlying Bond, bankruptcy of or payment failure by the issuer of the underlying Bond, the inability to remarket Floating Rate Notes that have been tendered due to insufficient buyers in the market, or the failure by the SPV to obtain renewal of the liquidity agreement under which liquidity support is provided for the Floating Rate Notes up to one year. At September 30, 2023, the amount of the Trust's Floating Rate Notes outstanding and the related collateral were $42,286,644 and $54,776,265, respectively. The range of interest rates on the Floating Rate Notes outstanding at September 30, 2023 was 4.0% to 4.3%. For the six months ended September 30, 2023, the Trust's average settled Floating Rate Notes outstanding and the average interest rate (annualized) including fees were $52,366,858 and 3.51%, respectively.
In certain circumstances, the Trust may enter into shortfall and forbearance agreements with brokers by which the Trust agrees to reimburse the broker for the difference between the liquidation value of the Bond held by the SPV and the liquidation value of the Floating Rate Notes, as well as any shortfalls in interest cash flows. The Trust had no shortfalls as of September 30, 2023.
The Trust may also purchase residual interest bonds in a secondary market transaction without first owning the underlying bond. Such transactions are not required to be treated as secured borrowings. Shortfall agreements, if any, related to residual interest bonds purchased in a secondary market transaction are disclosed in the Portfolio of Investments.
The Trust's investment policies and restrictions expressly permit investments in residual interest bonds. Such bonds typically offer the potential for yields exceeding the yields available on fixed rate bonds with comparable credit quality and maturity. These securities tend to underperform the market for fixed rate bonds in a rising long-term interest rate environment, but tend to outperform the market for fixed rate bonds when long-term interest rates decline. The value and income of residual interest bonds are generally more volatile than that of a fixed rate bond. The Trust's investment policies do not allow the Trust to borrow money except as permitted by the 1940 Act. Effective August 19, 2022, the Trust began operating under Rule 18f-4 under the 1940 Act, which, among other things, governs the use of derivative investments and certain financing transactions by registered investment companies. Consistent with Rule 18f-4, the Trust may treat its investments in residual interest bonds and similar financing transactions as subject to the asset coverage requirements of Section 18 of the 1940 Act, or as derivatives transactions subject to the Trust's value-at-risk (VaR)-based limits on leverage risk. Effective October 11, 2023, the Trust has opted to treat such investments as derivatives transactions. The Trust may change this approach at any time. Residual interest bonds held by the Trust are securities exempt from registration under Rule 144A of the Securities Act of 1933.
H When-Issued Securities and Delayed Delivery Transactions—The Trust may purchase securities on a delayed delivery or when-issued basis. Payment and delivery may take place after the customary settlement period for that security. At the time the transaction is negotiated, the price of the security that will be delivered is fixed. The Trust maintains cash and/or security positions for these commitments such that sufficient liquid assets will be available to make payments upon settlement. Securities purchased on a delayed delivery or when-issued basis are marked-to-market daily and begin earning interest on settlement date. Such security purchases are subject to the risk that when delivered they will be worth less than the agreed upon payment price. Losses may also arise if the counterparty does not perform under the contract.
I Interim Financial Statements—The interim financial statements relating to September 30, 2023 and for the six months then ended have not been audited by an independent registered public accounting firm, but in the opinion of the Trust’s management, reflect all adjustments, consisting only of normal recurring adjustments, necessary for the fair presentation of the financial statements.
2 Distributions to Shareholders and Income Tax Information
The Trust intends to make monthly distributions of net investment income to common shareholders. In addition, at least annually, the Trust intends to distribute all or substantially all of its net realized capital gains. Distributions are recorded on the ex-dividend date. Distributions to shareholders are determined in accordance with income tax regulations, which may differ from U.S. GAAP. As required by U.S. GAAP, only distributions in excess of tax basis earnings and profits are reported in the financial statements as a return of capital. Permanent differences between book and tax accounting relating to distributions are reclassified to paid-in capital. For tax purposes, distributions from short-term capital gains are considered to be from ordinary income.
Eaton Vance
National Municipal Opportunities Trust
September 30, 2023
Notes to Financial Statements (Unaudited) — continued
At March 31, 2023, the Trust, for federal income tax purposes, had deferred capital losses of $17,103,043 which would reduce its taxable income arising from future net realized gains on investment transactions, if any, to the extent permitted by the Internal Revenue Code, and thus would reduce the amount of distributions to shareholders, which would otherwise be necessary to relieve the Trust of any liability for federal income or excise tax. The deferred capital losses are treated as arising on the first day of the Trust’s next taxable year and retain the same short-term or long-term character as when originally deferred. Of the deferred capital losses at March 31, 2023, $7,880,272 are short-term and $9,222,771 are long-term.
The cost and unrealized appreciation (depreciation) of investments of the Trust at September 30, 2023, as determined on a federal income tax basis, were as follows:
| Aggregate cost | $ 275,966,457 |
| Gross unrealized appreciation | $ 7,922,934 |
| Gross unrealized depreciation | (19,111,910) |
| Net unrealized depreciation | $ (11,188,976) |
3 Investment Adviser and Administrative Fee and Other Transactions with Affiliates
The investment adviser and administrative fee is earned by Eaton Vance Management (EVM), an indirect, wholly-owned subsidiary of Morgan Stanley, as compensation for investment advisory and administrative services rendered to the Trust. The fee is computed at an annual rate as a percentage of the Trust’s average daily gross assets as follows and is payable monthly:
| Average Daily Gross Assets | Annual Fee Rate |
| Up to and including $1.5 billion | 0.60% |
| Over $1.5 billion | 0.59% |
Gross assets, as defined in the Trust’s investment advisory and administrative agreement with EVM, means total assets of the Trust, including any form of investment leverage, minus all accrued expenses incurred in the normal course of operations, but not excluding any liabilities or obligations attributable to investment leverage obtained through (i) indebtedness of any type (including, without limitation, borrowing through a credit facility or the issuance of debt securities), (ii) the issuance of preferred stock or other similar preference securities, (iii) the reinvestment of collateral received for securities loaned in accordance with the Trust’s investment objectives and policies, and/or (iv) any other means. For purposes of this calculation, gross assets represent net assets plus the amount payable by the Trust to floating-rate note holders. For the six months ended September 30, 2023, the investment adviser and administrative fee incurred by the Trust and the effective annual rate, as a percentage of average daily gross assets, were $986,429 and 0.60%, respectively.
Trustees and officers of the Trust who are members of EVM’s organization receive remuneration for their services to the Trust out of the investment adviser and administrative fee. Trustees of the Trust who are not affiliated with the investment adviser may elect to defer receipt of all or a percentage of their annual fees in accordance with the terms of the Trustees Deferred Compensation Plan. Certain officers and Trustees of the Trust are officers of EVM.
4 Purchases and Sales of Investments
Purchases and sales of investments, other than short-term obligations, aggregated $90,970,410 and $87,123,187, respectively, for the six months ended September 30, 2023.
5 Common Shares of Beneficial Interest and Shelf Offering
The Trust may issue common shares pursuant to its dividend reinvestment plan. There were no common shares issued by the Trust for the six months ended September 30, 2023. Common shares issued by the Trust pursuant to its dividend reinvestment plan for the year ended March 31, 2023 were 357.
In November 2013, the Board of Trustees initially approved a share repurchase program for the Trust. Pursuant to the reauthorization of the share repurchase program by the Board of Trustees in March 2019, the Trust is authorized to repurchase up to 10% of its common shares outstanding as of the last day of the prior calendar year at market prices when shares are trading at a discount to net asset value. The share repurchase program does not obligate the Trust to purchase a specific amount of shares. There were no repurchases of common shares by the Trust for the six months ended September 30, 2023 and the year ended March 31, 2023.
Eaton Vance
National Municipal Opportunities Trust
September 30, 2023
Notes to Financial Statements (Unaudited) — continued
Pursuant to a registration statement filed with the SEC, the Trust is authorized to issue up to an additional 1,908,750 common shares through an equity shelf offering program (the "shelf offering"). Under the shelf offering, the Trust, subject to market conditions, may raise additional capital from time to time and in varying amounts and offering methods at a net price at or above the Trust’s net asset value per common share. During the six months ended September 30, 2023 and the year ended March 31, 2023, there were no shares sold by the Trust pursuant to its shelf offering.
6 Fair Value Measurements
Under generally accepted accounting principles for fair value measurements, a three-tier hierarchy to prioritize the assumptions, referred to as inputs, is used in valuation techniques to measure fair value. The three-tier hierarchy of inputs is summarized in the three broad levels listed below.
| • | Level 1 – quoted prices in active markets for identical investments |
| • | Level 2 – other significant observable inputs (including quoted prices for similar investments, interest rates, prepayment speeds, credit risk, etc.) |
| • | Level 3 – significant unobservable inputs (including a fund's own assumptions in determining the fair value of investments) |
In cases where the inputs used to measure fair value fall in different levels of the fair value hierarchy, the level disclosed is determined based on the lowest level input that is significant to the fair value measurement in its entirety. The inputs or methodology used for valuing securities are not necessarily an indication of the risk associated with investing in those securities.
At September 30, 2023, the hierarchy of inputs used in valuing the Trust's investments, which are carried at value, were as follows:
| Asset Description | Level 1 | Level 2 | Level 3 | Total |
| Corporate Bonds | $ — | $ 6,229,309 | $ — | $ 6,229,309 |
| Tax-Exempt Municipal Obligations | — | 289,054,386 | — | 289,054,386 |
| Taxable Municipal Obligations | — | 11,780,430 | — | 11,780,430 |
| Total Investments | $ — | $307,064,125 | $ — | $307,064,125 |
Eaton Vance
National Municipal Opportunities Trust
September 30, 2023
Board of Trustees’ Contract Approval
Overview of the Contract Review Process
The Investment Company Act of 1940, as amended (the “1940 Act”), provides, in substance, that the investment advisory agreement between a fund and its investment adviser will continue in effect from year-to-year only if its continuation is approved on an annual basis by a vote of the fund’s board of trustees, including a majority of the trustees who are not “interested persons” of the fund (“independent trustees”), cast in person at a meeting called for the purpose of considering such approval.
At a meeting held on June 8, 2023, the Boards of Trustees/Directors (collectively, the “Board”) that oversee the registered investment companies advised by Eaton Vance Management or its affiliate, Boston Management and Research (the “Eaton Vance Funds”), including a majority of the independent trustees (the “Independent Trustees”), voted to approve the continuation of existing investment advisory agreements and sub-advisory agreements1 for each of the Eaton Vance Funds for an additional one-year period. The Board relied upon the affirmative recommendation of its Contract Review Committee, which is a committee exclusively comprised of Independent Trustees. Prior to making its recommendation, the Contract Review Committee reviewed information furnished by the adviser and sub-adviser to each of the Eaton Vance Funds (including information specifically requested by the Board) for a series of formal meetings held between April and June 2023, as well as certain additional information provided in response to specific requests from the Independent Trustees as members of the Contract Review Committee. Members of the Contract Review Committee also considered information received at prior meetings of the Board and its committees, to the extent such information was relevant to the Contract Review Committee’s annual evaluation of the investment advisory agreements and sub-advisory agreements.
In connection with its evaluation of the investment advisory agreements and sub-advisory agreements, the Board considered various information relating to the Eaton Vance Funds. This included information applicable to all or groups of Eaton Vance Funds, which is referenced immediately below, and information applicable to the particular Eaton Vance Fund covered by this report (each “Eaton Vance Fund” is referred to below as a “fund”). (For funds that invest through one or more underlying portfolios, references to “each fund” in this section may include information that was considered at the portfolio-level.)
Information about Fees, Performance and Expenses
• A report from an independent data provider comparing advisory and other fees paid by each fund to such fees paid by comparable funds, as identified by the independent data provider (“comparable funds”);
• A report from an independent data provider comparing each fund’s total expense ratio (and its components) to those of comparable funds;
• A report from an independent data provider comparing the investment performance of each fund (including, as relevant, total return data, income data, Sharpe ratios and information ratios) to the investment performance of comparable funds and, as applicable, benchmark indices, over various time periods;
• In certain instances, data regarding investment performance relative to customized groups of peer funds and blended indices identified by the adviser in consultation with the Portfolio Management Committee of the Board (a committee exclusively comprised of Independent Trustees);
• Comparative information concerning the fees charged and services provided by the adviser and sub-adviser to each fund in managing other accounts (which may include other mutual funds, collective investment funds and institutional accounts) using investment strategies and techniques similar to those used in managing such fund(s), if any;
• Profitability analyses with respect to the adviser and sub-adviser to each of the funds;
Information about Portfolio Management and Trading
• Descriptions of the investment management services provided to each fund, as well as each of the funds’ investment strategies and policies;
• The procedures and processes used to determine the value of fund assets, including, when necessary, the determination of “fair value” and actions taken to monitor and test the effectiveness of such procedures and processes;
• Information about the policies and practices of each fund’s adviser and sub-adviser with respect to trading, including their processes for seeking best execution of portfolio transactions;
• Information about the allocation of brokerage transactions and the benefits, if any, received by the adviser and sub-adviser to each fund as a result of brokerage allocation, including, as applicable, information concerning the acquisition of research through client commission arrangements and policies with respect to “soft dollars”;
• Data relating to the portfolio turnover rate of each fund and related information regarding active management in the context of particular strategies;
Information about each Adviser and Sub-adviser
• Reports detailing the financial results and condition of the adviser and sub-adviser to each fund;
• Information regarding the individual investment professionals whose responsibilities include portfolio management and investment research for the funds, and, for portfolio managers and certain other investment professionals, information relating to their responsibilities with respect to managing other mutual funds and investment accounts, as applicable;
1 Not all Eaton Vance Funds have entered into a sub-advisory agreement with a sub-adviser. Accordingly, references to “sub-adviser” or “sub-advisory agreement” in this “Overview” section may not be applicable to the particular Eaton Vance Fund covered by this report.
Eaton Vance
National Municipal Opportunities Trust
September 30, 2023
Board of Trustees’ Contract Approval — continued
• Information regarding the adviser’s and its parent company’s (Morgan Stanley’s) efforts to retain and attract talented investment professionals, including in the context of a competitive marketplace for talent, as well as the ongoing unique environment presented by hybrid, remote and other alternative work arrangements;
• Information regarding the adviser’s compensation methodology for its investment professionals and the incentives and accountability it creates, along with investment professionals’ investments in the fund(s) they manage;
• The Code of Ethics of the adviser and its affiliates and the sub-adviser of each fund, together with information relating to compliance with, and the administration of, such codes;
• Policies and procedures relating to proxy voting, including regular reporting with respect to fund proxy voting activities;
• Information regarding the handling of corporate actions and class actions, as well as information regarding litigation and other regulatory matters;
• Information concerning the resources devoted to compliance efforts undertaken by the adviser and its affiliates and the sub-adviser of each fund, if any, including descriptions of their various compliance programs and their record of compliance;
• Information concerning the business continuity and disaster recovery plans of the adviser and its affiliates and the sub-adviser of each fund, if any;
• A description of Eaton Vance Management’s and Boston Management and Research’s oversight of sub-advisers, including with respect to regulatory and compliance issues, investment management and other matters;
Other Relevant Information
• Information regarding ongoing initiatives to further integrate and harmonize, where applicable, the investment management and other departments of the adviser and its affiliates with the overall investment management infrastructure of Morgan Stanley, in light of Morgan Stanley’s acquisition of Eaton Vance Corp. on March 1, 2021;
• Information concerning the nature, cost and character of the administrative and other non-investment advisory services provided by Eaton Vance Management and its affiliates;
• Information concerning oversight of the relationship with the custodian, subcustodians, fund accountants, and other third-party service providers by the adviser and/or administrator to each of the funds;
• Information concerning efforts to implement policies and procedures with respect to various recently adopted regulations applicable to the funds, including Rule 12d1-4 (the Fund-of-Funds Rule), Rule 18f-4 (the Derivatives Rule) and Rule 2a-5 (the Fair Valuation Rule);
• For an Eaton Vance Fund structured as an exchange-listed closed-end fund, information concerning the benefits of the closed-end fund structure, as well as, where relevant, the closed-end fund’s market prices (including as compared to the closed-end fund’s net asset value (NAV)), trading volume data, continued use of auction preferred shares (where applicable), distribution rates and other relevant matters;
• The risks which the adviser and/or its affiliates incur in connection with the management and operation of the funds, including, among others, litigation, regulatory, entrepreneurial, and other business risks (and the associated costs of such risks); and
• The terms of each investment advisory agreement and sub-advisory agreement.
During the various meetings of the Board and its committees over the course of the year leading up to the June 8, 2023 meeting, the Board received information from portfolio managers and other investment professionals of the advisers and sub-advisers of the funds regarding investment and performance matters, and considered various investment and trading strategies used in pursuing the funds’ investment objectives. The Board also received information regarding risk management techniques employed in connection with the management of the funds. The Board and its committees evaluated issues pertaining to industry and regulatory developments, compliance procedures, fund governance and other issues with respect to the funds, and received and participated in reports and presentations provided by Eaton Vance Management, Boston Management and Research and fund sub-advisers, with respect to such matters. In addition to the formal meetings of the Board and its committees, the Independent Trustees held regular teleconferences to discuss, among other topics, matters relating to the continuation of investment advisory agreements and sub-advisory agreements.
The Contract Review Committee was advised throughout the contract review process by Goodwin Procter LLP, independent legal counsel for the Independent Trustees. The members of the Contract Review Committee, with the advice of such counsel, exercised their own business judgment in determining the material factors to be considered in evaluating each investment advisory agreement and sub-advisory agreement and the weight to be given to each such factor. The conclusions reached with respect to each investment advisory agreement and sub-advisory agreement were based on a comprehensive evaluation of all the information provided and not any single factor. Moreover, each member of the Contract Review Committee may have placed varying emphasis on particular factors in reaching conclusions with respect to each investment advisory agreement and sub-advisory agreement. In evaluating each investment advisory agreement and sub-advisory agreement, including the fee structures and other terms contained in such agreements, the members of the Contract Review Committee were also informed by multiple years of analysis and discussion with the adviser and sub-adviser to each of the Eaton Vance Funds.
Results of the Contract Review Process
Based on its consideration of the foregoing, and such other information it deemed relevant, including the factors and conclusions described below, the Contract Review Committee concluded that the continuation of the investment advisory and administrative agreement between Eaton Vance National Municipal Opportunities Trust (the “Fund”) and Eaton Vance Management (the “Adviser”), including its fee structure, is in the interests of shareholders and, therefore, recommended to the Board approval of the agreement. Based on the recommendation of the Contract Review Committee, the Board, including a majority of the Independent Trustees, voted to approve continuation of the investment advisory and administrative agreement for the Fund.
Eaton Vance
National Municipal Opportunities Trust
September 30, 2023
Board of Trustees’ Contract Approval — continued
Nature, Extent and Quality of Services
In considering whether to approve the investment advisory and administrative agreement for the Fund, the Board evaluated the nature, extent and quality of services provided to the Fund by the Adviser.
The Board considered the Adviser’s management capabilities and investment processes in light of the types of investments held by the Fund, including the education, experience and number of investment professionals and other personnel who provide portfolio management, investment research, and similar services to the Fund. In particular, the Board considered, where relevant, the abilities and experience of the Adviser’s investment professionals in analyzing factors such as credit risk, tax efficiency and special considerations relevant to investing in municipal obligations, Treasury securities and other securities backed by the U.S. government or its agencies. The Board considered the Adviser’s municipal bond team, which includes investment professionals and credit specialists who provide services to the Fund. The Board also took into account the resources dedicated to portfolio management and other services, the compensation methods of the Adviser and other factors, including the reputation and resources of the Adviser to recruit and retain highly qualified research, advisory and supervisory investment professionals. In addition, the Board considered the time and attention devoted to the Eaton Vance Funds, including the Fund, by senior management, as well as the infrastructure, operational capabilities and support staff in place to assist in the portfolio management and operations of the Fund, including the provision of administrative services. The Board also considered the business-related and other risks to which the Adviser or its affiliates may be subject in managing the Fund. The Board considered the deep experience of the Adviser and its affiliates with managing and operating funds organized as exchange-listed closed-end funds, such as the Fund. In this regard, the Board considered, among other things, the Adviser’s and its affiliates’ experience with implementing leverage arrangements, monitoring and assessing trading price discounts and premiums and adhering to the requirements of securities exchanges.
The Board considered the compliance programs of the Adviser and relevant affiliates thereof. The Board considered compliance and reporting matters regarding, among other things, personal trading by investment professionals, disclosure of portfolio holdings, late trading, frequent trading, portfolio valuation, business continuity and the allocation of investment opportunities. The Board also considered the responses of the Adviser and its affiliates to requests in recent years from regulatory authorities, such as the Securities and Exchange Commission and the Financial Industry Regulatory Authority.
The Board considered other administrative services provided or overseen by Eaton Vance Management and its affiliates, including transfer agency and accounting services. The Board evaluated the benefits to shareholders of investing in a fund that is a part of a large fund complex offering exposure to a variety of asset classes and investment disciplines.
After consideration of the foregoing factors, among others, the Board concluded that the nature, extent and quality of services provided by the Adviser, taken as a whole, are appropriate and consistent with the terms of the investment advisory and administrative agreement.
Fund Performance
The Board compared the Fund’s investment performance to that of comparable funds identified by an independent data provider (the peer group), as well as an appropriate benchmark index, and assessed the Fund’s performance on the basis of total return and current income return. The Board’s review included comparative performance data with respect to the Fund for the one-, three-, five- and ten-year periods ended December 31, 2022. The Board considered, among other things, the Adviser’s efforts to generate competitive levels of tax-exempt current income over time. In this regard, the Board noted that the performance of the Fund was higher than the median performance of the Fund’s peer group for the three-year period. The Board also noted that the performance of the Fund was lower than its benchmark index for the three-year period. The Board considered, among other things, the Adviser’s efforts to generate competitive levels of tax-exempt current income over time through investments that, relative to comparable funds, focus on higher quality municipal bonds with longer maturities. The Board concluded that the performance of the Fund was satisfactory.
Management Fees and Expenses
The Board considered contractual fee rates payable by the Fund for advisory and administrative services (referred to collectively as “management fees”). As part of its review, the Board considered the Fund’s management fees and total expense ratio for the one-year period ended December 31, 2022, as compared to those of comparable funds, before and after giving effect to any undertaking to waive fees or reimburse expenses. The Board also considered certain factors identified by management in response to inquiries from the Contract Review Committee regarding each Fund’s total expense ratio relative to comparable funds.
After considering the foregoing information, and in light of the nature, extent and quality of the services provided by the Adviser, the Board concluded that the management fees charged for advisory and related services are reasonable.
Profitability and “Fall-Out” Benefits
The Board considered the level of profits realized by the Adviser and relevant affiliates thereof in providing investment advisory and administrative services to the Fund and to all Eaton Vance Funds as a group. The Board considered the level of profits realized without regard to marketing support or other payments by the Adviser and its affiliates to third parties in respect of distribution or other services.
The Board concluded that, in light of the foregoing factors and the nature, extent and quality of the services rendered, the profits realized by the Adviser and its affiliates are deemed not to be excessive.
Eaton Vance
National Municipal Opportunities Trust
September 30, 2023
Board of Trustees’ Contract Approval — continued
The Board also considered direct or indirect fall-out benefits received by the Adviser and its affiliates in connection with their respective relationships with the Fund, including the benefits of research services that may be available to the Adviser as a result of securities transactions effected for the Fund and other investment advisory clients.
Economies of Scale
In reviewing management fees and profitability, the Board also considered the extent to which the Adviser and its affiliates, on the one hand, and the Fund, on the other hand, can expect to realize benefits from economies of scale as the assets of the Fund increase. The Board acknowledged the difficulty in accurately measuring the benefits resulting from economies of scale, if any, with respect to the management of any specific fund or group of funds. The Board reviewed data summarizing the increases and decreases in the assets of the Fund and of all Eaton Vance Funds as a group over various time periods, and evaluated the extent to which the total expense ratio of the Fund and the profitability of the Adviser and its affiliates may have been affected by such increases or decreases. Based upon the foregoing, the Board concluded that the Fund currently shares in the benefits from economies of scale, if any, when they are realized by the Adviser. The Board also considered the fact that the Fund is not continuously offered in the same manner as an open-end fund and that the Fund is authorized to issue additional common shares through a shelf offering. The Board also concluded that the structure of the advisory fee, which includes breakpoints at certain asset levels, will allow the Fund to continue to benefit from any economies of scale in the future.
Eaton Vance
National Municipal Opportunities Trust
September 30, 2023
| Officers |
Kenneth A. Topping
President | Nicholas S. Di Lorenzo
Secretary |
Deidre E. Walsh
Vice President and Chief Legal Officer | Richard F. Froio
Chief Compliance Officer |
James F. Kirchner
Treasurer | |
George J. Gorman
Chairperson | |
| Alan C. Bowser(1) | |
| Mark R. Fetting | |
| Cynthia E. Frost | |
| Valerie A. Mosley | |
| Anchal Pachnanda*(2) | |
| Keith Quinton | |
| Marcus L. Smith | |
| Susan J. Sutherland | |
| Scott E. Wennerholm | |
| Nancy A. Wiser | |
| * | Interested Trustee |
| (1) | Mr. Bowser began serving as Trustee effective January 4, 2023. |
| (2) | Ms. Pachnanda began serving as Trustee effective April 1, 2023. |
| FACTS | WHAT DOES EATON VANCE DO WITH YOUR
PERSONAL INFORMATION? |
| Why? | Financial companies choose how they share your personal information. Federal law gives consumers the right to limit some but not all sharing. Federal law also requires us to tell you how we collect, share, and protect your personal information. Please read this notice carefully to understand what we do. |
| |
| What? | The types of personal information we collect and share depend on the product or service you have with us. This information can include:■ Social Security number and income
■ investment experience and risk tolerance
■ checking account number and wire transfer instructions |
| |
| How? | All financial companies need to share customers’ personal information to run their everyday business. In the section below, we list the reasons financial companies can share their customers’ personal information; the reasons Eaton Vance chooses to share; and whether you can limit this sharing. |
Reasons we can share your
personal information | Does Eaton Vance
share? | Can you limit
this sharing? |
| For our everyday business purposes — such as to process your transactions, maintain your account(s), respond to court orders and legal investigations, or report to credit bureaus | Yes | No |
| For our marketing purposes — to offer our products and services to you | Yes | No |
| For joint marketing with other financial companies | No | We don’t share |
| For our investment management affiliates’ everyday business purposes — information about your transactions, experiences, and creditworthiness | Yes | Yes |
| For our affiliates’ everyday business purposes — information about your transactions and experiences | Yes | No |
| For our affiliates’ everyday business purposes — information about your creditworthiness | No | We don’t share |
| For our investment management affiliates to market to you | Yes | Yes |
| For our affiliates to market to you | No | We don’t share |
| For nonaffiliates to market to you | No | We don’t share |
To limit our
sharing | Call toll-free 1-800-262-1122 or email: EVPrivacy@eatonvance.comPlease note:If you are a new customer, we can begin sharing your information 30 days from the date we sent this notice. When you are no longer our customer, we continue to share your information as described in this notice. However, you can contact us at any time to limit our sharing. |
| Questions? | Call toll-free 1-800-262-1122 or email: EVPrivacy@eatonvance.com |
| Privacy Notice — continued | April 2021 |
| Who we are |
| Who is providing this notice? | Eaton Vance Management, Eaton Vance Distributors, Inc., Eaton Vance Trust Company, Eaton Vance Management (International) Limited, Eaton Vance Advisers International Ltd., Eaton Vance Global Advisors Limited, Eaton Vance Management’s Real Estate Investment Group, Boston Management and Research, Calvert Research and Management, Eaton Vance and Calvert Fund Families and our investment advisory affiliates (“Eaton Vance”) (see Investment Management Affiliates definition below) |
| What we do |
How does Eaton Vance
protect my personal
information? | To protect your personal information from unauthorized access and use, we use security measures that comply with federal law. These measures include computer safeguards and secured files and buildings. We have policies governing the proper handling of customer information by personnel and requiring third parties that provide support to adhere to appropriate security standards with respect to such information. |
How does Eaton Vance
collect my personal
information? | We collect your personal information, for example, when you■ open an account or make deposits or withdrawals from your account
■ buy securities from us or make a wire transfer
■ give us your contact informationWe also collect your personal information from others, such as credit bureaus, affiliates, or other companies. |
| Why can’t I limit all sharing? | Federal law gives you the right to limit only■ sharing for affiliates’ everyday business purposes — information about your creditworthiness
■ affiliates from using your information to market to you
■ sharing for nonaffiliates to market to youState laws and individual companies may give you additional rights to limit sharing. See below for more on your rights under state law. |
| Definitions |
Investment Management
Affiliates | Eaton Vance Investment Management Affiliates include registered investment advisers, registered broker- dealers, and registered and unregistered funds. Investment Management Affiliates does not include entities associated with Morgan Stanley Wealth Management, such as Morgan Stanley Smith Barney LLC and Morgan Stanley & Co. |
| Affiliates | Companies related by common ownership or control. They can be financial and nonfinancial companies.■ Our affiliates include companies with a Morgan Stanley name and financial companies such as Morgan Stanley Smith Barney LLC and Morgan Stanley & Co. |
| Nonaffiliates | Companies not related by common ownership or control. They can be financial and nonfinancial companies.■ Eaton Vance does not share with nonaffiliates so they can market to you. |
| Joint marketing | A formal agreement between nonaffiliated financial companies that together market financial products or services to you.■ Eaton Vance doesn’t jointly market. |
| Other important information |
| Vermont: Except as permitted by law, we will not share personal information we collect about Vermont residents with Nonaffiliates unless you provide us with your written consent to share such information.California: Except as permitted by law, we will not share personal information we collect about California residents with Nonaffiliates and we will limit sharing such personal information with our Affiliates to comply with California privacy laws that apply to us. |
Delivery of Shareholder Documents. The Securities and Exchange Commission (SEC) permits funds to deliver only one copy of shareholder documents, including prospectuses, proxy statements and shareholder reports, to fund investors with multiple accounts at the same residential or post office box address. This practice is often called “householding” and it helps eliminate duplicate mailings to shareholders. Equiniti Trust Company, LLC (“EQ”), the closed-end funds transfer agent, or your financial intermediary, may household the mailing of your documents indefinitely unless you instruct EQ, or your financial intermediary, otherwise. If you would prefer that your Eaton Vance documents not be householded, please contact EQ or your financial intermediary. Your instructions that householding not apply to delivery of your Eaton Vance documents will typically be effective within 30 days of receipt by EQ or your financial intermediary.
Portfolio Holdings. Each Eaton Vance Fund and its underlying Portfolio(s) (if applicable) files a schedule of portfolio holdings on Part F to Form N-PORT with the SEC. Certain information filed on Form N-PORT may be viewed on the Eaton Vance website at www.eatonvance.com, by calling Eaton Vance at 1-800-262-1122 or in the EDGAR database on the SEC’s website at www.sec.gov.
Proxy Voting. From time to time, funds are required to vote proxies related to the securities held by the funds. The Eaton Vance Funds or their underlying Portfolios (if applicable) vote proxies according to a set of policies and procedures approved by the Funds’ and Portfolios’ Boards. You may obtain a description of these policies and procedures and information on how the Funds or Portfolios voted proxies relating to portfolio securities during the most recent 12-month period ended June 30, without charge, upon request, by calling 1-800-262-1122 and by accessing the SEC’s website at www.sec.gov.
Share Repurchase Program. The Fund’s Board of Trustees has approved a share repurchase program authorizing the Fund to repurchase up to 10% of its common shares outstanding as of the last day of the prior calendar year in open-market transactions at a discount to net asset value. The repurchase program does not obligate the Fund to purchase a specific amount of shares. The Fund’s repurchase activity, including the number of shares purchased, average price and average discount to net asset value, is disclosed in the Fund’s annual and semi-annual reports to shareholders.
Additional Notice to Shareholders. If applicable, a Fund may also redeem or purchase its outstanding preferred shares in order to maintain compliance with regulatory requirements, borrowing or rating agency requirements or for other purposes as it deems appropriate or necessary.
Closed-End Fund Information. Eaton Vance closed-end funds make fund performance data and certain information about portfolio characteristics available on the Eaton Vance website shortly after the end of each month. Other information about the funds is available on the website. The funds’ net asset value per share is readily accessible on the Eaton Vance website. Portfolio holdings for the most recent month-end are also posted to the website approximately 30 days following the end of the month. This information is available at www.eatonvance.com on the fund information pages under “Closed-End Funds & Term Trusts.”
This Page Intentionally Left Blank
Investment Adviser and Administrator
Eaton Vance Management
Two International Place
Boston, MA 02110
Custodian
State Street Bank and Trust Company
One Congress Street, Suite 1
Boston, MA 02114-2016
Transfer Agent
Equiniti Trust Company, LLC
6201 15th Avenue
Brooklyn, NY 11219
Fund Offices
Two International Place
Boston, MA 02110
Item 2. Code of Ethics
The registrant (sometimes referred to as the “Fund”) has adopted a code of ethics applicable to its Principal Executive Officer, Principal Financial Officer and Principal Accounting Officer. The registrant undertakes to provide a copy of such code of ethics to any person upon request, without charge, by calling 1-800-262-1122. The registrant has not amended the code of ethics as described in Form N-CSR during the period covered by this report. The registrant has not granted any waiver, including an implicit waiver, from a provision of the code of ethics as described in Form N-CSR during the period covered by this report.
Item 3. Audit Committee Financial Expert
The registrant’s Board of Trustees (the “Board”) has designated George J. Gorman and Scott E. Wennerholm, each an independent trustee, as audit committee financial experts. Mr. Gorman is a certified public accountant who is the Principal at George J. Gorman LLC (a consulting firm). Previously, Mr. Gorman served in various capacities at Ernst & Young LLP (a registered public accounting firm), including as Senior Partner. Mr. Gorman also has experience serving as an independent trustee and audit committee financial expert of other mutual fund complexes. Mr. Wennerholm is a private investor. Previously, Mr. Wennerholm served as a Trustee at Wheelock College (postsecondary institution), as a Consultant at GF Parish Group (executive recruiting firm), Chief Operating Officer and Executive Vice President at BNY Mellon Asset Management (investment management firm), Chief Operating Officer and Chief Financial Officer at Natixis Global Asset Management (investment management firm), and Vice President at Fidelity Investments Institutional Services (investment management firm).
Item 4. Principal Accountant Fees and Services
(a) –(d)
The following table presents the aggregate fees billed to the registrant for the registrant’s fiscal years ended September 30, 2022 and September 30, 2023 by the registrant’s principal accountant, Deloitte & Touche LLP (“D&T”), for professional services rendered for the audit of the registrant’s annual financial statements and fees billed for other services rendered by D&T during such periods.
| | | | | | | | |
Fiscal Years Ended | | 9/30/22 | | | 9/30/23 | |
Audit Fees | | $ | 80,900 | | | $ | 80,900 | |
Audit-Related Fees(1) | | $ | 0 | | | $ | 0 | |
Tax Fees(2) | | $ | 350 | | | $ | 0 | |
All Other Fees(3) | | $ | 0 | | | $ | 0 | |
| | | | | | | | |
Total | | $ | 81,250 | | | $ | 80,900 | |
| | | | | | | | |
| (1) | Audit-related fees consist of the aggregate fees billed for assurance and related services that are reasonably related to the performance of the audit of the registrant’s financial statements and are not reported under the category of audit fees. |
| (2) | Tax fees consist of the aggregate fees billed for professional services rendered by the principal accountant relating to tax compliance, tax advice, and tax planning and specifically include fees for tax return preparation and other related tax compliance/planning matters. |
| (3) | All other fees consist of the aggregate fees billed for products and services provided by the principal accountant other than audit, audit-related, and tax services. |
(e)(1) The registrant’s audit committee has adopted policies and procedures relating to the pre-approval of services provided by the registrant’s principal accountant (the “Pre-Approval Policies”). The Pre-Approval Policies establish a framework intended to assist the audit committee in the proper discharge of its pre-approval responsibilities. As a general matter, the Pre-Approval Policies (i) specify certain types of audit, audit-related, tax, and other services determined to be pre-approved by the audit committee; and (ii) delineate specific procedures governing the mechanics of the pre-approval process, including the approval and monitoring of audit and non-audit service fees. Unless a service is specifically pre-approved under the Pre-Approval Policies, it must be separately pre-approved by the audit committee.
The Pre-Approval Policies and the types of audit and non-audit services pre-approved therein must be reviewed and ratified by the registrant’s audit committee at least annually. The registrant’s audit committee maintains full responsibility for the appointment, compensation, and oversight of the work of the registrant’s principal accountant.
(e)(2) No services described in paragraphs (b)-(d) above were approved by the registrant’s audit committee pursuant to the “de minimis exception” set forth in Rule 2-01 (c)(7)(i)(C) of Regulation S-X.
(f) Not applicable.
(g) The following table presents (i) the aggregate non-audit fees (i.e., fees for audit-related, tax, and other services) billed to the registrant by D&T for the registrant’s fiscal years ended September 30, 2022 and September 30, 2023; and (ii) the aggregate non-audit fees (i.e., fees for audit-related, tax, and other services) billed to the Eaton Vance organization by D&T for the same time periods.
| | | | | | | | |
Fiscal Years Ended | | 9/30/22 | | | 9/30/23 | |
Registrant | | $ | 350 | | | $ | 0 | |
Eaton Vance(1) | | $ | 52,836 | | | $ | 52,836 | |
| (1) | The investment adviser to the registrant, as well as any of its affiliates that provide ongoing services to the registrant, are subsidiaries of Morgan Stanley. |
(h) The registrant’s audit committee has considered whether the provision by the registrant’s principal accountant of non-audit services to the registrant’s investment adviser and any entity controlling, controlled by, or under common control with the adviser that provides ongoing services to the registrant that were not pre-approved pursuant to Rule 2-01(c)(7)(ii) of Regulation S-X is compatible with maintaining the principal accountant’s independence.
(i) Not applicable.
(j) Not applicable.
Item 5. Audit Committee of Listed Registrants
The registrant has a separately-designated standing audit committee established in accordance with Section 3(a)(58)(A) of the Securities and Exchange Act of 1934, as amended. George J. Gorman, Keith Quinton, Scott E. Wennerholm (Chair), and Nancy A. Wiser are the members of the registrant’s audit committee.
Item 6. Schedule of Investments
Please see schedule of investments contained in the Report to Stockholders included under Item 1 of this Form N-CSR.
Item 7. Disclosure of Proxy Voting Policies and Procedures for Closed-End Management Investment Companies
The Board of the Fund has adopted a proxy voting policy and procedure (the “Fund Policy”), pursuant to which the trustees have delegated proxy voting responsibility to the Fund’s investment adviser and adopted the investment adviser’s proxy voting policies and procedures (the “Policies”) which are described below. The trustees will review the Policies annually. In the event that a conflict of interest arises between the Fund’s shareholders and the investment adviser, the administrator, or any of their affiliates or any affiliate of the Fund, the investment adviser will generally refrain from voting the proxies related to the companies giving rise to such conflict until it consults with the Board, or any committee, sub-committee or group of independent trustees identified by the Board, which will instruct the investment adviser on the appropriate course of action. If the Board Members are unable to meet and the failure to vote a proxy would have a material adverse impact on the Fund, the investment adviser may vote such proxy, provided that it discloses the existence of the material conflict to the Chairperson of the Fund’s Board as soon as practicable and to the Board at its next meeting.
The Policies are designed to promote accountability of a company’s management to its shareholders and to align the interests of management with those shareholders. An independent proxy voting service (“Agent”), currently Institutional Shareholder Services, Inc., has been retained to assist in the voting of proxies through the provision of vote analysis, implementation and recordkeeping and disclosure services. The investment adviser will generally vote proxies through the Agent. The Agent is required to vote all proxies in accordance with customized proxy voting guidelines (the “Guidelines”) and/or refer them back to the investment adviser pursuant to the Policies.
The Agent is required to establish and maintain adequate internal controls and policies in connection with the provision of proxy voting services, including methods to reasonably ensure that its analysis and recommendations are not influenced by a conflict of interest. The Guidelines include voting guidelines for matters relating to, among other things, the election of directors, approval of independent auditors, executive compensation, corporate structure and anti-takeover defenses. The investment adviser may cause the Fund to abstain from voting from time to time where it determines that the costs associated with voting a proxy outweigh the benefits derived from exercising the right to vote or it is unable to access or access timely ballots or other proxy information, among other stated reasons. The Agent will refer Fund proxies to the investment adviser for instructions under circumstances where, among others: (1) the application of the Guidelines is unclear; (2) a particular proxy question is not covered by the Guidelines; or (3) the Guidelines require input from the investment adviser. When a proxy voting issue has been referred to the investment adviser, the analyst (or portfolio manager if applicable) covering the company subject to the proxy proposal determines the final vote (or decision not to vote) and the investment adviser’s Proxy Administrator (described below) instructs the Agent to vote accordingly for securities held by the Fund. Where more than one analyst covers a particular company and the recommendations of such analysts voting a proposal conflict, the investment adviser’s Global Proxy Group (described below) will review such recommendations and any other available information related to the proposal and determine the manner in which it should be voted, which may result in different recommendations for the Fund that may differ from other clients of the investment adviser.
The investment adviser has appointed a Proxy Administrator to assist in the coordination of the voting of client proxies (including the Fund’s) in accordance with the Guidelines and the Policies. The investment adviser and its affiliates have also established a Global Proxy Group. The Global Proxy Group develops the investment adviser’s positions on all major corporate issues, creates the Guidelines and oversees the proxy voting process. The Proxy Administrator maintains a record of all proxy questions that have been referred by the Agent, all applicable recommendations, analysis and research received and any resolution of the matter. Before instructing the Agent to vote contrary to the Guidelines or the recommendation of the Agent, the Proxy Administrator will provide the Global Proxy Group with the Agent’s recommendation for the proposal along with any other relevant materials, including the basis for the analyst’s recommendation. The Proxy Administrator will then instruct the Agent to vote the proxy in the manner determined by the Global Proxy Group. A similar process will be followed if the Agent has a conflict of interest with respect to a proxy. The investment adviser will report to the Fund’s Board any votes cast contrary to the Guidelines or Agent recommendations, as applicable, no less than annually.
The investment adviser’s Global Proxy Group is responsible for monitoring and resolving possible material conflicts with respect to proxy voting. Because the Guidelines are predetermined and designed to be in the best interests of shareholders, application of the Guidelines to vote client proxies should, in most cases, adequately address any possible conflict of interest. The investment adviser will monitor situations that may result in a conflict of interest between any of its clients and the investment adviser or any of its affiliates by maintaining a list of significant existing and prospective corporate clients. The Proxy Administrator will compare such list with the names of companies of which he or she has been referred a proxy statement (the “Proxy Companies”). If a company on the list is also a Proxy Company, the Proxy Administrator will report that fact to the Global Proxy Group. If the Proxy Administrator intends to instruct the Agent to vote in a manner inconsistent with the Guidelines, the Global Proxy Group will first determine, in consultation with legal counsel if necessary, whether a material conflict exists. If it is determined that a material conflict exists, the investment adviser will seek instruction on how the proxy should be voted from the Fund’s Board, or any committee or subcommittee identified by the Board. If a matter is referred to the Global Proxy Group, the decision made and basis for the decision will be documented by the Proxy Administrator and/or Global Proxy Group.
Information on how the Fund voted proxies relating to portfolio securities during the most recent 12 month period ended June 30 is available (1) without charge, upon request, by calling 1-800-262-1122, and (2) on the Securities and Exchange Commission’s website at http://www.sec.gov.
Item 8. Portfolio Managers of Closed-End Management Investment Companies
Eaton Vance Management (“EVM” or “Eaton Vance”) is the investment adviser of each Fund. Cynthia J. Clemson and Julie P. Callahan, CFA are the portfolio managers of Eaton Vance Municipal Bond Fund. Christopher J. Eustance, CFA and Paul Metheny, CFA are the portfolio managers of Eaton Vance New York Municipal Bond Fund. Trevor G. Smith and Carl Thompson, CFA are the portfolio managers of Eaton Vance California Municipal Bond Fund. Each portfolio manager is a Vice President of EVM and also manages other Eaton Vance portfolios. Ms. Clemson and Messrs. Brandon, Eustance, Metheny, Smith and Thompson have been members of the Eaton Vance organization for more than five years. Ms. Callahan has been a Vice President of EVM since September 2021 and has been a Managing Director at Morgan Stanley Investment Management Inc. (“MSIM”), an affiliate of EVM, since 2020. Prior to joining MSIM, she was a senior member of the municipal bond portfolio management team at PIMCO from 2011 to 2020. This information is provided as of the date of filing this report.
The following table shows, as of each Fund’s most recent fiscal year end, the number of accounts each portfolio manager managed in each of the listed categories and the total assets (in millions of dollars) in the accounts managed within each category. The table also shows the number of accounts with respect to which the advisory fee is based on the performance of the account, if any, and the total assets (in millions of dollars) in those accounts.
| | | | | | | | | | | | | | | | |
| | | Number of
All
Accounts | | | Total Assets of
All Accounts | | | Number of Accounts
Paying a
Performance Fee | | | Total Assets of
Accounts Paying a
Performance Fee | |
Cynthia J. Clemson | | | | | | | | | | | | | | | | |
Registered Investment Companies | | | 8 | | | $ | 3,813.0 | | | | 0 | | | $ | 0 | |
Other Pooled Investment Vehicles | | | 0 | | | $ | 0 | | | | 0 | | | $ | 0 | |
Other Accounts | | | 8 | | | $ | 24.4 | | | | 0 | | | $ | 0 | |
Julie P. Callahan, CFA | | | | | | | | | | | | | | | | |
Registered Investment Companies | | | 9 | | | $ | 2,547.9 | | | | 0 | | | $ | 0 | |
Other Pooled Investment Vehicles | | | 0 | | | $ | 0 | | | | 0 | | | $ | 0 | |
Other Accounts | | | 0 | | | $ | 0 | | | | 0 | | | $ | 0 | |
Christopher J. Eustance, CFA | | | | | | | | | | | | | | | | |
Registered Investment Companies | | | 11 | | | $ | 6,053.3 | | | | 0 | | | $ | 0 | |
Other Pooled Investment Vehicles | | | 0 | | | $ | 0 | | | | 0 | | | $ | 0 | |
Other Accounts | | | 0 | | | $ | 0 | | | | 0 | | | $ | 0 | |
| | | | | | | | | | | | | | | | |
| | | Number of
All
Accounts | | | Total Assets of
All Accounts | | | Number of Accounts
Paying a
Performance Fee | | | Total Assets of
Accounts Paying a
Performance Fee | |
Paul Metheny, CFA | | | | | | | | | | | | | | | | |
Registered Investment Companies | | | 3 | | | $ | 1,028.3 | | | | 0 | | | $ | 0 | |
Other Pooled Investment Vehicles | | | 0 | | | $ | 0 | | | | 0 | | | $ | 0 | |
Other Accounts | | | 3 | | | $ | 521.7 | | | | 0 | | | $ | 0 | |
Trevor G. Smith | | | | | | | | | | | | | | | | |
Registered Investment Companies | | | 12 | | | $ | 3,415.0 | | | | 0 | | | $ | 0 | |
Other Pooled Investment Vehicles | | | 2 | | | $ | 156.5 | | | | 0 | | | $ | 0 | |
Other Accounts | | | 2 | | | $ | 24.4 | | | | 0 | | | $ | 0 | |
Carl Thompson, CFA | | | | | | | | | | | | | | | | |
Registered Investment Companies | | | 6 | | | $ | 649.9 | | | | 0 | | | $ | 0 | |
Other Pooled Investment Vehicles | | | 0 | | | $ | 0 | | | | 0 | | | $ | 0 | |
Other Accounts | | | 0 | | | $ | 0 | | | | 0 | | | $ | 0 | |
The following table shows the dollar range of Fund shares beneficially owned by each portfolio manager as of each Fund’s most recent fiscal year end.
| | |
Fund Name and Portfolio Managers | | Dollar Range of Equity Securities Beneficially Owned in the Fund |
| California Municipal Bond Fund | | |
Trevor G. Smith | | None |
Carl Thompson, CFA | | None |
| |
| Municipal Bond Fund | | |
Cynthia J. Clemson | | None |
Julie P. Callahan, CFA | | None |
| |
| New York Municipal Bond Fund | | |
Christopher J. Eustance, CFA | | None |
Paul Metheny, CFA | | None |
Potential for Conflicts of Interest. It is possible that conflicts of interest may arise in connection with a portfolio manager’s management of the Fund’s investments on the one hand and the investments of other accounts for which a portfolio manager is responsible on the other. For example, a portfolio manager may have conflicts of interest in allocating management time, resources and investment opportunities among the Fund and other accounts he or she advises. In addition, due to differences in the investment strategies or restrictions between the Fund and the other accounts, the portfolio manager may take action with respect to another account that differs from the action taken with respect to the Fund. In some cases, another account managed by a portfolio manager may compensate the investment adviser based on the performance of the securities held by that account. The existence of such a performance based fee may create additional conflicts of interest for the portfolio manager in the allocation of management time, resources and investment opportunities. Whenever conflicts of interest arise, the portfolio manager will endeavor to exercise his or her discretion in a manner that he or she believes is equitable to all interested persons. EVM has adopted several policies and procedures designed to address these potential conflicts including a code of ethics and policies that govern the investment adviser’s trading practices, including among other things the aggregation and allocation of trades among clients, brokerage allocations, cross trades and best execution.
Compensation Structure for EVM
The compensation structure of Eaton Vance and its affiliates that are investment advisers (for purposes of this section “Eaton Vance”) is based on a total reward system of base salary and incentive compensation, which is paid either in the form of cash bonus, or for employees meeting the specified deferred compensation eligibility threshold, partially as a cash bonus and partially as mandatory deferred compensation. Deferred compensation granted to Eaton Vance employees is generally granted as a mix of deferred cash awards under the Investment Management Alignment Plan (IMAP) and equity-based awards in the form of stock units. The portion of incentive compensation granted in the form of a deferred compensation award and the terms of such awards are determined annually by the Compensation, Management Development and Succession Committee of Morgan Stanley.
Base salary compensation. Generally, portfolio managers receive base salary compensation based on the level of their position with the adviser.
Incentive compensation. In addition to base compensation, portfolio managers may receive discretionary year-end compensation. Incentive compensation may include:
| | • | | A mandatory program that defers a portion of incentive compensation into restricted stock units or other awards based on Morgan Stanley common stock or other plans that are subject to vesting and other conditions. |
| | • | | IMAP is a cash-based deferred compensation plan designed to increase the alignment of participants’ interests with the interests of clients. For eligible employees, a portion of their deferred compensation is mandatorily deferred into IMAP on an annual basis. Awards granted under IMAP are notionally invested in referenced funds available pursuant to the plan, which are funds advised by MSIM and its affiliates that are investment advisers. Portfolio managers are required to notionally invest a minimum of 40% of their account balance in the designated funds that they manage and are included in the IMAP notional investment fund menu. |
| | • | | Deferred compensation awards are typically subject to vesting over a multi-year period and are subject to cancellation through the payment date for competition, cause (i.e., any act or omission that constitutes a breach of obligation to the Funds, including failure to comply with internal compliance, ethics or risk management standards, and failure or refusal to perform duties satisfactorily, including supervisory and management duties), disclosure of proprietary information, and solicitation of employees or clients. Awards are also subject to clawback through the payment date if an employee’s act or omission (including with respect to direct supervisory responsibilities) causes a restatement of the firm’s consolidated financial results, constitutes a violation of the firm’s global risk management principles, policies and standards, or causes a loss of revenue associated with a position on which the employee was paid and the employee operated outside of internal control policies. |
Eaton Vance compensates employees based on principles of pay-for-performance, market competitiveness and risk management. Eligibility for, and the amount of any, discretionary compensation is subject to a multi-dimensional process. Specifically, consideration is given to one or more of the following factors, which can vary by portfolio management team and circumstances:
| | • | | Revenue and profitability of the business and/or each fund/account managed by the portfolio manager |
| | • | | Revenue and profitability of the Firm |
| | • | | Return on equity and risk factors of both the business units and Morgan Stanley |
| | • | | Assets managed by the portfolio manager |
| | • | | External market conditions |
| | • | | New business development and business sustainability |
| | • | | Contribution to client objectives |
| | • | | Team, product and/or MSIM and its affiliates that are investment advisers (including Eaton Vance) performance |
| | • | | The pre-tax investment performance of the funds/accounts managed by the portfolio manager (which may, in certain cases, be measured against the applicable benchmark(s) and/or peer group(s) over one, three and five-year periods) |
| | • | | Individual contribution and performance |
Further, the firm’s Global Incentive Compensation Discretion Policy requires compensation managers to consider Further the only legitimate, business related factors when exercising discretion in determining variable incentive compensation, including adherence to Morgan Stanley’s core values, conduct, disciplinary actions in the current performance year, risk management and risk outcomes.
Item 9. Purchases of Equity Securities by Closed-End Management Investment Company and Affiliated Purchasers
No such purchases this period.
Item 10. Submission of Matters to a Vote of Security Holders
No material changes.
Item 11. Controls and Procedures
(a) It is the conclusion of the registrant’s principal executive officer and principal financial officer that the effectiveness of the registrant’s current disclosure controls and procedures (such disclosure controls and procedures having been evaluated within 90 days of the date of this filing) provide reasonable assurance that the information required to be disclosed by the registrant has been recorded, processed, summarized and reported within the time period specified in the Commission’s rules and forms and that the information required to be disclosed by the registrant has been accumulated and communicated to the registrant’s principal executive officer and principal financial officer in order to allow timely decisions regarding required disclosure.
(b) There have been no changes in the registrant’s internal controls over financial reporting during the period covered by this report that has materially affected, or is reasonably likely to materially affect, the registrant’s internal control over financial reporting.
Item 12. Disclosure of Securities Lending Activities for Closed-End Management Investment Companies
No activity to report for the registrant’s most recent fiscal year end.
Item 13. Exhibits
Signatures
Pursuant to the requirements of the Securities Exchange Act of 1934 and the Investment Company Act of 1940, the registrant has duly caused this report to be signed on its behalf by the undersigned, thereunto duly authorized.
Eaton Vance New York Municipal Bond Fund
| | |
| By: | | /s/ Kenneth A. Topping |
| | Kenneth A. Topping |
| | President |
Date: November 21, 2023
Pursuant to the requirements of the Securities Exchange Act of 1934 and the Investment Company Act of 1940, this report has been signed below by the following persons on behalf of the registrant and in the capacities and on the dates indicated.
| | |
| By: | | /s/ James F. Kirchner |
| | James F. Kirchner |
| | Treasurer |
Date: November 21, 2023
| | |
| By: | | /s/ Kenneth A. Topping |
| | Kenneth A. Topping |
| | President |
Date: November 21, 2023