UNITED STATES
SECURITIES AND EXCHANGE COMMISSION
Washington, D.C. 20549
FormN-CSR
CERTIFIED SHAREHOLDER REPORT OF REGISTERED
MANAGEMENT INVESTMENT COMPANIES
Investment Company Act File Number:811-21148
Eaton Vance New York Municipal Bond Fund
(Exact Name of Registrant as Specified in Charter)
Two International Place, Boston, Massachusetts 02110
(Address of Principal Executive Offices)
Maureen A. Gemma
Two International Place, Boston, Massachusetts 02110
(Name and Address of Agent for Services)
(617)482-8260
(Registrant’s Telephone Number)
September 30
Date of Fiscal Year End
September 30, 2019
Date of Reporting Period
Item 1. Reports to Stockholders

Eaton Vance
Municipal Bond Funds
Annual Report
September 30, 2019
Municipal (EIM) • California (EVM) • New York (ENX)
Important Note. Beginning on January 1, 2021, as permitted by regulations adopted by the Securities and Exchange Commission, paper copies of each Fund’s annual and semi-annual shareholder reports will no longer be sent by mail unless you specifically request paper copies of the reports. Instead, the reports will be made available on the Funds’ website (funds.eatonvance.com/closed-end-fund-and-term-trust-documents.php), and you will be notified by mail each time a report is posted and provided with a website address to access the report.
If you already elected to receive shareholder reports electronically, you will not be affected by this change and you need not take any action. If you hold shares at the Funds’ transfer agent, American Stock Transfer & Trust Company, LLC (“AST”), you may elect to receive shareholder reports and other communications from the Funds electronically by contacting AST. If you own your shares through a financial intermediary (such as a broker-dealer or bank), you must contact your financial intermediary to sign up.
You may elect to receive all future Fund shareholder reports in paper free of charge. If you hold shares at AST, you can inform AST that you wish to continue receiving paper copies of your shareholder reports by calling 1-866-439-6787. If you own these shares through a financial intermediary, you must contact your financial intermediary or follow instructions included with this disclosure, if applicable, to elect to continue to receive paper copies of your shareholder reports. Your election to receive reports in paper will apply to all funds held with AST or to all funds held through your financial intermediary, as applicable.

Commodity Futures Trading Commission Registration. Effective December 31, 2012, the Commodity Futures Trading Commission (“CFTC”) adopted certain regulatory changes that subject registered investment companies and advisers to regulation by the CFTC if a fund invests more than a prescribed level of its assets in certain CFTC-regulated instruments (including futures, certain options and swap agreements) or markets itself as providing investment exposure to such instruments. Each Fund has claimed an exclusion from the definition of the term “commodity pool operator” under the Commodity Exchange Act. Accordingly, neither the Funds nor the adviser with respect to the operation of the Funds is subject to CFTC regulation. Because of its management of other strategies, each Fund’s adviser is registered with the CFTC as a commodity pool operator and a commodity trading advisor.
Fund shares are not insured by the FDIC and are not deposits or other obligations of, or guaranteed by, any depository institution. Shares are subject to investment risks, including possible loss of principal invested.
Annual ReportSeptember 30, 2019
Eaton Vance
Municipal Bond Funds
Table of Contents
| | | | |
Management’s Discussion of Fund Performance | | | 2 | |
| |
Performance and Fund Profile | | | | |
| |
| | | | |
Municipal Bond Fund | | | 4 | |
California Municipal Bond Fund | | | 5 | |
New York Municipal Bond Fund | | | 6 | |
| |
| | | | |
| |
Endnotes and Additional Disclosures | | | 7 | |
| |
Financial Statements | | | 8 | |
| |
Report of Independent Registered Public Accounting Firm | | | 42 | |
| |
Federal Tax Information | | | 43 | |
| |
Annual Meeting of Shareholders | | | 44 | |
| |
Dividend Reinvestment Plan | | | 45 | |
| |
Board of Trustees’ Contract Approval | | | 47 | |
| |
Management and Organization | | | 51 | |
| |
Important Notices | | | 54 | |
Eaton Vance
Municipal Bond Funds
September 30, 2019
Management’s Discussion of Fund Performance1
Economic and Market Conditions
For the 12-month period ended September 30, 2019, investors witnessed a dramatic turnaround in fixed-income markets. The rising interest-rate environment at the beginning of the period gave way to a falling interest-rate climate against the backdrop of multiple domestic and international uncertainties.
As a whole, the period was marked by strong performance across the municipal bond market with the Bloomberg Barclays Municipal Bond Index (the Index),2 a broad measure of the asset class, returning 8.55%. The municipal bond yield curve9 experienced a so-called “bull market flattening,” where rates declined across the curve but more so toward the long end of the curve. With investors searching for yield in a low-rate environment, lower-rated7 bonds generally outperformed higher-rated bonds, while longer-duration10 issues outperformed shorter-duration issues.
With U.S. economic data largely positive in calendar year 2018, the U.S. Federal Reserve Board (the Fed) raised its benchmark federal funds rate four times — from a low range of 1.50%-1.75% to 2.25%-2.50% — with the last quarter-point increase on December 19, 2018.
As 2018 came to a close, investors became increasingly concerned about a growing U.S.-China trade war and looming U.S. government shutdown. In connection with its December 2018 rate hike, the Fed lowered its number of projected interest-rate increases in 2019 from three to two, which some investors viewed as indicating weakness in the U.S. economy. The result was a “flight to quality” by investors seeking the relative safety of fixed-income investments over stocks. This bond rally pushed longer-term bond prices up and yields down in the final month of 2018.
The first two months of 2019 were relatively quiet for bonds. Downward pressure on interest rates and upward pressure on prices resumed in March 2019 and continued through the end of the period propelled by lower-than-desired inflation, Brexit concerns, low European interest rates, and on-again/off-again trade-conflict rhetoric. This combination of factors fueled investor concerns about both U.S. and global growth potential during the period.
After holding interest rates steady through the first half of 2019, the Fed cut its benchmark interest rate to 2.00%- 2.25% on July 31 — its first reduction in over a decade — followed by a second interest-rate drop to 1.75%-2.00% on September 18. Lower rates are intended to help stimulate
economic activity by making borrowing costs relatively more affordable.
Within the municipal bond market, technical factors amplified the price rally during the period. The 2017 tax law changes resulted in a combination of lower supply of new municipals and increased demand from high-income investors in high-tax states who had seen their tax bills rise under the new code. For the period as a whole, high-quality municipals generally underperformed Treasurys in the two-six-year area of the yield curve; performed in line with Treasurys in the middle of the curve; and outperformed Treasurys in the 16-30-year area of the curve.
Fund Performance
For the 12-month period ended September 30, 2019, Eaton Vance Municipal Bond Fund, Eaton Vance California Municipal Bond Fund, and Eaton Vance New York Municipal Bond Fund shares at net asset value (NAV) outperformed the 8.55% return of the Funds’ benchmark, the Index.
The Funds’ overall strategy is to invest primarily in higher-quality bonds rated “A” or higher. In managing the Funds, management employs leverage through residual interest bond financing6 to seek to enhance the Funds’ tax-exempt income. The use of leverage has the effect of achieving additional exposure to the municipal market, magnifying a Fund’s exposure to its underlying investments in both up and down market environments. During this period of falling rates and rising bond prices, the leverage amplified the appreciation in the price of bonds held by the Funds and generated additional tax-exempt bond income, enhancing the total return of the Funds.
Management attempts to hedge to various degrees against the greater potential risk of volatility caused by the use of leverage and investing in bonds at the long end of the yield curve by using Treasury futures, interest-rate swaps, or both. As a risk management tactic within the Funds’ overall strategy, interest-rate hedging is intended to moderate performance on both the upside and the downside of the market. So in a period when municipal and Treasury bonds generally rose in price, the hedging strategy mitigated a portion of that appreciation and was a detractor from relative results — versus the unhedged Index — for Municipal Bond Fund. However, by period-end, Municipal Bond Fund no longer employed a hedging strategy. The California and New York Municipal Bond Funds did not employ a hedging strategy during the period.
See Endnotes and Additional Disclosures in this report.
Past performance is no guarantee of future results. Returns are historical and are calculated by determining the percentage change in net asset value (NAV) or market price (as applicable) with all distributions reinvested and include management fees and other expenses. Fund performance at market price will differ from its results at NAV due to factors such as changing perceptions about the Fund, market conditions, fluctuations in supply and demand for Fund shares, or changes in Fund distributions. Investment return and principal value will fluctuate so that shares, when sold, may be worth more or less than their original cost. Performance less than or equal to one year is cumulative. Performance is for the stated time period only; due to market volatility, current Fund performance may be lower or higher than the quoted return. For performance as of the most recent month-end, please refer to eatonvance.com.
Eaton Vance
Municipal Bond Funds
September 30, 2019
Management’s Discussion of Fund Performance — continued
Fund Specific Results
Eaton Vance Municipal Bond Fund returned 12.72% at NAV, outperforming the 8.55% return of the Index during the period. The main contributors to performance versus the Index included the Fund’s overweight, relative to the Index, in zero-coupon bonds, which were the best-performing coupon structure in the Index during the period; an overweight in bonds with 17 or more years remaining to maturity, during a period when longer-maturity bonds outperformed shorter-maturity issues; and leverage. The chief detractors from results versus the Index included an overweight in prerefunded or escrowed bonds; the Fund’s hedging strategy; and an underweight in BBB-rated bonds during a period when lower-rated bonds outperformed higher-rated issues.
Eaton Vance California Municipal Bond Fund returned 11.54% at NAV, outperforming the 8.55% return of the Index. An overweight in zero-coupon bonds contributed to performance, relative to the Index, as did leverage and an overweight in bonds with 17 or more years remaining to maturity. In contrast, an overweight in prerefunded bonds, an underweight in BBB-rated bonds, and security selection in the transportation sector all detracted from performance versus the Index during the period.
Eaton Vance New York Municipal Bond Fund returned 10.25% at NAV, outperforming the 8.55% return of the Index. Key contributors to performance versus the Index included an overweight in bonds with 17 or more years remaining to maturity, security selection and an overweight in 4% coupon bonds, and leverage. Primary detractors from performance relative to the Index included an overweight in prerefunded bonds, security selection in zero-coupon bonds, and an underweight in BBB-rated bonds.
See Endnotes and Additional Disclosures in this report.
Past performance is no guarantee of future results. Returns are historical and are calculated by determining the percentage change in net asset value (NAV) or market price (as applicable) with all distributions reinvested and include management fees and other expenses. Fund performance at market price will differ from its results at NAV due to factors such as changing perceptions about the Fund, market conditions, fluctuations in supply and demand for Fund shares, or changes in Fund distributions. Investment return and principal value will fluctuate so that shares, when sold, may be worth more or less than their original cost. Performance less than or equal to one year is cumulative. Performance is for the stated time period only; due to market volatility, current Fund performance may be lower or higher than the quoted return. For performance as of the most recent month-end, please refer to eatonvance.com.
Eaton Vance
Municipal Bond Fund
September 30, 2019
Performance2,3
Portfolio Manager Cynthia J. Clemson
| | | | | | | | | | | | | | | | |
| % Average Annual Total Returns | | Inception Date | | | One Year | | | Five Years | | | Ten Years | |
Fund at NAV | | | 08/30/2002 | | | | 12.72 | % | | | 5.32 | % | | | 6.72 | % |
Fund at Market Price | | | — | | | | 17.28 | | | | 5.99 | | | | 5.93 | |
Bloomberg Barclays Municipal Bond Index | | | — | | | | 8.55 | % | | | 3.66 | % | | | 4.16 | % |
| | | | |
| | | | | | | | | | | | | | | | |
| % Premium/Discount to NAV4 | | | | | | | | | | | | |
| | | | | | | | | | | | | | | –7.30 | % |
| | | | |
| | | | | | | | | | | | | | | | |
| Distributions5 | | | | | | | | | | | | |
Total Distributions per share for the period | | | | | | | | | | | | | | $ | 0.517 | |
Distribution Rate at NAV | | | | | | | | | | | | | | | 3.68 | % |
Taxable-Equivalent Distribution Rate at NAV | | | | | | | | | | | | | | | 6.22 | % |
Distribution Rate at Market Price | | | | | | | | | | | | | | | 3.97 | % |
Taxable-Equivalent Distribution Rate at Market Price | | | | | | | | | | | | | | | 6.71 | % |
| | | | |
| | | | | | | | | | | | | | | | |
| % Total Leverage6 | | | | | | | | | | | | |
Residual Interest Bond (RIB) Financing | | | | | | | | | | | | | | | 41.71 | % |
Fund Profile
Credit Quality (% of total investments)7,8
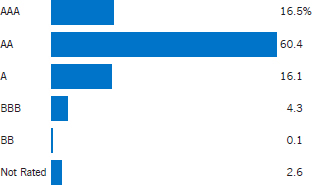
See Endnotes and Additional Disclosures in this report.
Past performance is no guarantee of future results. Returns are historical and are calculated by determining the percentage change in net asset value (NAV) or market price (as applicable) with all distributions reinvested and include management fees and other expenses. Fund performance at market price will differ from its results at NAV due to factors such as changing perceptions about the Fund, market conditions, fluctuations in supply and demand for Fund shares, or changes in Fund distributions. Investment return and principal value will fluctuate so that shares, when sold, may be worth more or less than their original cost. Performance less than or equal to one year is cumulative. Performance is for the stated time period only; due to market volatility, current Fund performance may be lower or higher than the quoted return. For performance as of the most recent month-end, please refer to eatonvance.com.
Eaton Vance
California Municipal Bond Fund
September 30, 2019
Performance2,3
Portfolio Manager Craig R. Brandon, CFA
| | | | | | | | | | | | | | | | |
| % Average Annual Total Returns | | Inception Date | | | One Year | | | Five Years | | | Ten Years | |
Fund at NAV | | | 08/30/2002 | | | | 11.54 | % | | | 4.63 | % | | | 5.60 | % |
Fund at Market Price | | | — | | | | 18.91 | | | | 5.14 | | | | 4.49 | |
Bloomberg Barclays Municipal Bond Index | | | — | | | | 8.55 | % | | | 3.66 | % | | | 4.16 | % |
| | | | |
| | | | | | | | | | | | | | | | |
| % Premium/Discount to NAV4 | | | | | | | | | | | | |
| | | | | | | | | | | | | | | –9.86 | % |
| | | | |
| | | | | | | | | | | | | | | | |
| Distributions5 | | | | | | | | | | | | |
Total Distributions per share for the period | | | | | | | | | | | | | | $ | 0.474 | |
Distribution Rate at NAV | | | | | | | | | | | | | | | 3.77 | % |
Taxable-Equivalent Distribution Rate at NAV | | | | | | | | | | | | | | | 8.21 | % |
Distribution Rate at Market Price | | | | | | | | | | | | | | | 4.18 | % |
Taxable-Equivalent Distribution Rate at Market Price | | | | | | | | | | | | | | | 9.11 | % |
| | | | |
| | | | | | | | | | | | | | | | |
| % Total Leverage6 | | | | | | | | | | | | |
RIB Financing | | | | | | | | | | | | | | | 42.21 | % |
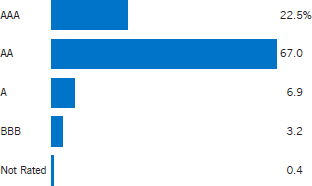
Fund Profile
Credit Quality (% of total investments)7,8
See Endnotes and Additional Disclosures in this report.
Past performance is no guarantee of future results. Returns are historical and are calculated by determining the percentage change in net asset value (NAV) or market price (as applicable) with all distributions reinvested and include management fees and other expenses. Fund performance at market price will differ from its results at NAV due to factors such as changing perceptions about the Fund, market conditions, fluctuations in supply and demand for Fund shares, or changes in Fund distributions. Investment return and principal value will fluctuate so that shares, when sold, may be worth more or less than their original cost. Performance less than or equal to one year is cumulative. Performance is for the stated time period only; due to market volatility, current Fund performance may be lower or higher than the quoted return. For performance as of the most recent month-end, please refer to eatonvance.com.
Eaton Vance
New York Municipal Bond Fund
September 30, 2019
Performance2,3
Portfolio Manager Craig R. Brandon, CFA
| | | | | | | | | | | | | | | | |
| % Average Annual Total Returns | | Inception Date | | | One Year | | | Five Years | | | Ten Years | |
Fund at NAV | | | 08/30/2002 | | | | 10.25 | % | | | 4.27 | % | | | 5.44 | % |
Fund at Market Price | | | — | | | | 17.47 | | | | 5.31 | | | | 4.23 | |
Bloomberg Barclays Municipal Bond Index | | | — | | | | 8.55 | % | | | 3.66 | % | | | 4.16 | % |
| | | | |
| | | | | | | | | | | | | | | | |
| % Premium/Discount to NAV4 | | | | | | | | | | | | |
| | | | | | | | | | | | | | | –7.72 | % |
| | | | |
| | | | | | | | | | | | | | | | |
| Distributions5 | | | | | | | | | | | | |
Total Distributions per share for the period | | | | | | | | | | | | | | $ | 0.511 | |
Distribution Rate at NAV | | | | | | | | | | | | | | | 3.69 | % |
Taxable-Equivalent Distribution Rate at NAV | | | | | | | | | | | | | | | 7.32 | % |
Distribution Rate at Market Price | | | | | | | | | | | | | | | 4.00 | % |
Taxable-Equivalent Distribution Rate at Market Price | | | | | | | | | | | | | | | 7.94 | % |
| | | | |
| | | | | | | | | | | | | | | | |
| % Total Leverage6 | | | | | | | | | | | | |
RIB Financing | | | | | | | | | | | | | | | 38.55 | % |
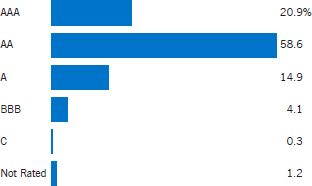
Fund Profile
Credit Quality (% of total investments)7,8
See Endnotes and Additional Disclosures in this report.
Past performance is no guarantee of future results. Returns are historical and are calculated by determining the percentage change in net asset value (NAV) or market price (as applicable) with all distributions reinvested and include management fees and other expenses. Fund performance at market price will differ from its results at NAV due to factors such as changing perceptions about the Fund, market conditions, fluctuations in supply and demand for Fund shares, or changes in Fund distributions. Investment return and principal value will fluctuate so that shares, when sold, may be worth more or less than their original cost. Performance less than or equal to one year is cumulative. Performance is for the stated time period only; due to market volatility, current Fund performance may be lower or higher than the quoted return. For performance as of the most recent month-end, please refer to eatonvance.com.
Eaton Vance
Municipal Bond Funds
September 30, 2019
Endnotes and Additional Disclosures
| 1 | The views expressed in this report are those of the portfolio manager(s) and are current only through the date stated at the top of this page. These views are subject to change at any time based upon market or other conditions, and Eaton Vance and the Fund(s) disclaim any responsibility to update such views. These views may not be relied upon as investment advice and, because investment decisions are based on many factors, may not be relied upon as an indication of trading intent on behalf of any Eaton Vance fund. This commentary may contain statements that are not historical facts, referred to as “forward looking statements.” The Fund’s actual future results may differ significantly from those stated in any forward looking statement, depending on factors such as changes in securities or financial markets or general economic conditions, the volume of sales and purchases of Fund shares, the continuation of investment advisory, administrative and service contracts, and other risks discussed from time to time in the Fund’s filings with the Securities and Exchange Commission. |
| 2 | Bloomberg Barclays Municipal Bond Index is an unmanaged index of municipal bonds traded in the U.S. Unless otherwise stated, index returns do not reflect the effect of any applicable sales charges, commissions, expenses, taxes or leverage, as applicable. It is not possible to invest directly in an index. |
| 3 | Performance results reflect the effects of leverage. Performance since inception for an index, if presented, is the performance since the Fund’s or oldest share class’ inception, as applicable. |
| 4 | The shares of the Fund often trade at a discount or premium from their net asset value. The discount or premium of the Fund may vary over time and may be higher or lower than what is quoted in this report. For up-to-date premium/discount information, please refer to http://eatonvance.com/closedend. |
| 5 | The Distribution Rate is based on the Fund’s last regular distribution per share in the period (annualized) divided by the Fund’s NAV or market price at the end of the period. The Fund’s distributions may be comprised of amounts characterized for federal income tax purposes as tax-exempt income, qualified and non-qualified ordinary dividends, capital gains and nondividend distributions, also known as return of capital. The Fund will determine the federal income tax character of distributions paid to a shareholder after the end of the calendar year. This is reported on the IRS form 1099-DIV and provided to the shareholder shortly after each year-end. For information about the tax character of distributions made in prior calendar years, please refer to Performance-Tax Character of Distributions on the Fund’s webpage available at eatonvance.com. The Fund’s distributions are determined by the investment adviser based on its current assessment of the Fund’s long-term return potential. Fund distributions may be affected by numerous factors including changes in Fund performance, the cost of financing for Funds that employ leverage, portfolio holdings, realized and projected returns, and other factors. As portfolio and market conditions change, the rate of distributions paid by the Fund could change. Taxable-equivalent performance is based on the highest combined federal and state income tax rates, where applicable. Lower tax rates would result in lower tax-equivalent performance. Actual tax rates will vary depending on your income, exemptions and deductions. Rates do not include local taxes. |
| 6 | Fund employs RIB financing. The leverage created by RIB investments provides an opportunity for increased income but, at the same time, creates special risks (including the likelihood of greater price volatility). The cost of leverage rises and falls with changes in short-term interest rates. See “Floating Rate Notes Issued in Conjunction with Securities Held” in the notes to the financial statements for more information about RIB financing. RIB leverage represents the amount of Floating Rate Notes outstanding at period end as a percentage of Fund net assets plus Floating Rate Notes. |
| 7 | Ratings are based on Moody’s Investors Service, Inc. (“Moody’s”), S&P Global Ratings (“S&P”) or Fitch Ratings (“Fitch”), as applicable. If securities are rated differently by the ratings agencies, the highest rating is applied. Ratings, which are subject to change, apply to the creditworthiness of the issuers of the underlying securities and not to the Fund or its shares. |
| | Credit ratings measure the quality of a bond based on the issuer’s creditworthiness, with ratings ranging from AAA, being the highest, to D, being the lowest based on S&P’s measures. Ratings of BBB or higher by S&P or Fitch (Baa or higher by Moody’s) are considered to be investment-grade quality. Credit ratings are based largely on the ratings agency’s analysis at the time of rating. The rating assigned to any particular security is not necessarily a reflection of the issuer’s current financial condition and does not necessarily reflect its assessment of the volatility of a security’s market value or of the liquidity of an investment in the security. Holdings designated as “Not Rated” (if any) are not rated by the national ratings agencies stated above. |
| 8 | The chart includes the municipal bonds held by a trust that issues residual interest bonds, consistent with the Portfolio of Investments. |
| 9 | Yield curve is a graphical representation of the yields offered by bonds of various maturities. The yield curve flattens when long-term interest rates fall and/or short-term interest rates increase, and the yield curve steepens when long-term interest rates increase and/or short-term interest rates fall. |
| 10 | Duration is a measure of the expected change in price of a bond — in percentage terms — given a one percent change in interest rates, all else being constant. Securities with lower durations tend to be less sensitive to interest rate changes. |
| | Fund profiles subject to change due to active management. |
Important Notice to Shareholders
| | Effective April 24, 2019, each of Municipal Bond Fund (“EIM”), California Municipal Bond Fund (“EVM”) and New York Municipal Bond Fund (“ENX”) amended its investment objective to eliminate references to the alternative minimum tax (“AMT”) as shown below: |
| | | | |
| Fund | | Prior Objective | | Revised Objective |
| | |
EIM | | To provide current income exempt from federal income tax, including AMT | | To provide current income exempt from federal income tax |
| | |
EVM | | To provide current income exempt from federal income tax, including AMT, and California personal income tax | | To provide current income exempt from federal income tax and California personal income tax |
| | |
ENX | | To provide current income exempt from federal income tax, including AMT and New York State and New York City personal income tax | | To provide current income exempt from federal income tax and New York State and New York City personal income tax |
| | Each Fund also amended its policy of investing up to 20% of its net assets in municipal obligations rated investment grade (i.e., rated Baa or higher by Moody’s or BBB or higher by S&P or Fitch) to state that each Fund may invest up to 20% of its net assets in municipal obligations rated BBB/Baa or below (or unrated obligations deemed by Eaton Vance to be of equivalent quality), provided that not more than 15% of its net assets may be invested in municipal obligations rated below B (or unrated obligations deemed by Eaton Vance to be of equivalent quality). Additionally, each Fund’s investment policy to seek at all times to avoid investments in municipal obligations on which the interest may be subject to the AMT (“AMT Bonds”) was rescinded and each Fund adopted a policy permitting investments up to 20% of its net assets in AMT Bonds. |
| | Each Fund’s policy to invest at least 80% of its net assets in municipal obligations, the interest on which is exempt from federal income tax, including AMT, and for EVM and ENX, the state and/or local taxes noted above, and that are rated A or better is unchanged. |
Eaton Vance
Municipal Bond Fund
September 30, 2019
Portfolio of Investments
| | | | | | | | |
| Tax-Exempt Municipal Securities — 170.4% | |
| Security | | Principal Amount (000’s omitted) | | | Value | |
|
| Bond Bank — 0.6% | |
| | |
Ohio Economic Development, (Ohio Enterprise Bond Fund), 6.00%, 12/1/34 | | $ | 700 | | | $ | 738,066 | |
| | |
Rickenbacker Port Authority, OH, (OASBO Expanded Asset Pooled Financing Program), 5.375%, 1/1/32 | | | 505 | | | | 638,022 | |
| | |
Texas Water Development Board, 4.00%, 10/15/37(1) | | | 4,875 | | | | 5,591,820 | |
| | |
| | | | | | | $ | 6,967,908 | |
|
| Education — 15.8% | |
| | |
Connecticut Health and Educational Facilities Authority, (Fairfield University), 4.00%, 7/1/47 | | $ | 10,225 | | | $ | 11,191,978 | |
| | |
Connecticut Health and Educational Facilities Authority, (Fairfield University), 5.00%, 7/1/46 | | | 4,750 | | | | 5,532,277 | |
| | |
Houston Higher Education Finance Corp., TX, (St. John’s School), 5.25%, 9/1/33 | | | 4,550 | | | | 5,033,847 | |
| | |
Massachusetts Development Finance Agency, (Boston College), 5.00%, 7/1/42(1) | | | 9,525 | | | | 11,524,488 | |
| | |
Massachusetts Development Finance Agency, (Milton Academy), 5.00%, 9/1/35 | | | 750 | | | | 774,075 | |
| | |
Massachusetts Development Finance Agency, (Northeastern University), 5.25%, 3/1/37 | | | 1,650 | | | | 1,904,496 | |
| | |
Massachusetts Development Finance Agency, (Williams College), 5.00%, 7/1/46(1) | | | 7,050 | | | | 8,449,354 | |
| | |
Massachusetts Health and Educational Facilities Authority, (Boston College), 5.50%, 6/1/27 | | | 5,710 | | | | 7,450,522 | |
| | |
Massachusetts Health and Educational Facilities Authority, (Boston College), 5.50%, 6/1/30 | | | 8,325 | | | | 11,347,558 | |
| | |
Massachusetts Health and Educational Facilities Authority, (Northeastern University), 5.00%, 10/1/35 | | | 870 | | | | 895,996 | |
| | |
New Jersey Educational Facilities Authority, (Princeton University), 4.00%, 7/1/47(1) | | | 10,000 | | | | 11,489,200 | |
| | |
New Jersey Educational Facilities Authority, (Princeton University), 5.00%, 7/1/29(1) | | | 1,675 | | | | 2,125,877 | |
| | |
New Jersey Educational Facilities Authority, (Princeton University), 5.00%, 7/1/31(1) | | | 1,125 | | | | 1,421,235 | |
| | |
New York Dormitory Authority, (Columbia University), 5.00%, 10/1/38(1) | | | 8,500 | | | | 10,743,745 | |
| | |
New York Dormitory Authority, (Rockefeller University), 5.00%, 7/1/40(1) | | | 16,800 | | | | 16,854,096 | |
| | |
North Carolina Capital Facilities Finance Agency, (Duke University),
5.00%, 10/1/41(1) | | | 10,000 | | | | 11,831,100 | |
| | |
Ohio Higher Educational Facility Commission, (Kenyon College), 5.00%, 7/1/44 | | | 200 | | | | 204,738 | |
| | |
Ohio Higher Educational Facility Commission, (Oberlin College), 5.00%, 10/1/33 | | | 500 | | | | 559,740 | |
| | |
Pennsylvania Higher Educational Facilities Authority, (Saint Joseph’s University), 5.00%, 11/1/40 | | | 440 | | | | 452,940 | |
| | | | | | | | |
| Security | | Principal Amount (000’s omitted) | | | Value | |
|
| Education (continued) | |
| | |
Pennsylvania State University, 5.00%, 9/1/42(1) | | $ | 3,750 | | | $ | 4,573,163 | |
| | |
State Public School Building Authority, PA, (Northampton County Area Community College), 5.50%, 3/1/31 | | | 750 | | | | 788,333 | |
| | |
Swarthmore Borough Authority, PA, (Swarthmore College), 5.00%, 9/15/46(1) | | | 3,000 | | | | 3,731,610 | |
| | |
University of Cincinnati, OH, 5.00%, 6/1/45(1) | | | 7,500 | | | | 9,021,975 | |
| | |
University of Massachusetts Building Authority, 5.00%, 11/1/39(1) | | | 14,175 | | | | 15,581,160 | |
| | |
University of Michigan, 5.00%, 4/1/40(1) | | | 15,000 | | | | 17,887,650 | |
| | |
University of Michigan, 5.00%, 4/1/48(1) | | | 3,500 | | | | 4,303,460 | |
| | |
| | | | | | | $ | 175,674,613 | |
|
| Electric Utilities — 6.0% | |
| | |
Energy Northwest, WA, (Columbia Generating Station), 5.00%, 7/1/40 | | $ | 2,650 | | | $ | 3,027,625 | |
| | |
Hawaii Department of Budget and Finance, (Hawaiian Electric Co.), 3.20%, 7/1/39 | | | 6,515 | | | | 6,685,302 | |
| | |
Los Angeles Department of Water and Power, CA, Power System Revenue,
4.00%, 7/1/46(1) | | | 3,000 | | | | 3,275,730 | |
| | |
Michigan Public Power Agency, 5.00%, 1/1/43 | | | 700 | | | | 738,367 | |
| | |
Ohio Air Quality Development Authority, (Buckeye Power, Inc.), 6.00%, 12/1/40 | | | 500 | | | | 525,635 | |
| | |
Omaha Public Power District, NE, 5.00%, 2/1/40(1) | | | 16,000 | | | | 18,384,320 | |
| | |
Omaha Public Power District, NE, 5.00%, 2/1/42(1) | | | 10,000 | | | | 12,126,800 | |
| | |
Pima County Industrial Development Authority, AZ, (Tucson Electric Power Co.), 5.25%, 10/1/40 | | | 11,300 | | | | 11,681,601 | |
| | |
Unified Government of Wyandotte County/Kansas City Board of Public Utilities, KS, 5.00%, 9/1/36 | | | 4,110 | | | | 4,388,370 | |
| | |
Utility Debt Securitization Authority, NY, 5.00%, 12/15/35 | | | 5,000 | | | | 5,711,050 | |
| | |
| | | | | | | $ | 66,544,800 | |
|
| Escrowed / Prerefunded — 15.1% | |
| | |
Allegheny County Higher Education Building Authority, PA, (Duquesne University), Prerefunded to 3/1/21, 5.50%, 3/1/31 | | $ | 1,050 | | | $ | 1,111,267 | |
| | |
Apollo Career Center Joint Vocational School District, OH, Prerefunded to 12/1/21, 5.25%, 12/1/33 | | | 270 | | | | 293,163 | |
| | |
California Department of Water Resources, Prerefunded to 12/1/20, 5.25%, 12/1/35(1) | | | 9,715 | | | | 10,181,029 | |
| | |
Connecticut Health and Educational Facilities Authority, (Wesleyan University), Prerefunded to 7/1/20, 5.00%, 7/1/39(1) | | | 16,900 | | | | 17,373,369 | |
| | |
Delaware River Port Authority of Pennsylvania and New Jersey, Prerefunded to 1/1/20, 5.00%, 1/1/35 | | | 4,455 | | | | 4,496,342 | |
| | |
Delaware River Port Authority of Pennsylvania and New Jersey, Prerefunded to 1/1/20, 5.00%, 1/1/40 | | | 940 | | | | 948,723 | |
| | | | |
| | 8 | | See Notes to Financial Statements. |
Eaton Vance
Municipal Bond Fund
September 30, 2019
Portfolio of Investments — continued
| | | | | | | | |
| Security | | Principal Amount (000’s omitted) | | | Value | |
|
| Escrowed / Prerefunded (continued) | |
| | |
Franklin County Industrial Development Authority, PA, (The Chambersburg Hospital), Prerefunded to 7/1/20, 5.375%, 7/1/42 | | $ | 1,000 | | | $ | 1,030,030 | |
| | |
Honolulu City and County, HI, Wastewater System, Prerefunded to 7/1/21, 5.25%, 7/1/36(1) | | | 9,750 | | | | 10,425,285 | |
| | |
Houston Higher Education Finance Corp., TX, (William Marsh Rice University), Prerefunded to 5/15/20, 5.00%, 5/15/35 | | | 1,000 | | | | 1,022,610 | |
| | |
Houston Higher Education Finance Corp., TX, (William Marsh Rice University), Prerefunded to 5/15/20, 5.00%, 5/15/35(1) | | | 15,000 | | | | 15,339,150 | |
| | |
Kalamazoo Hospital Finance Authority, MI, (Bronson Healthcare Group), Prerefunded to 5/15/21, 5.25%, 5/15/33 | | | 430 | | | | 456,626 | |
| | |
King County, WA, Sewer Revenue, Prerefunded to 1/1/21, 5.00%, 1/1/34(1) | | | 6,000 | | | | 6,272,100 | |
| | |
King County, WA, Sewer Revenue, Prerefunded to 1/1/21, 5.00%, 1/1/34(1) | | | 4,000 | | | | 4,186,520 | |
| | |
Marco Island, FL, Utility System, Prerefunded to 10/1/20, 5.00%, 10/1/34 | | | 1,445 | | | | 1,498,971 | |
| | |
Marco Island, FL, Utility System, Prerefunded to 10/1/20, 5.00%, 10/1/40 | | | 6,325 | | | | 6,561,239 | |
| | |
Maryland Health and Higher Educational Facilities Authority, (Charlestown Community, Inc.), Prerefunded to 1/1/21, 6.125%, 1/1/30 | | | 1,410 | | | | 1,492,414 | |
| | |
Metropolitan Transportation Authority, NY, Prerefunded to 11/15/20, 5.25%, 11/15/40 | | | 4,735 | | | | 4,953,520 | |
| | |
Metropolitan Transportation Authority, NY, Prerefunded to 11/15/21, 5.25%, 11/15/38 | | | 5,505 | | | | 5,985,862 | |
| | |
Mississippi, Prerefunded to 10/1/21, 5.00%, 10/1/30(1) | | | 10,000 | | | | 10,743,600 | |
| | |
Mississippi, Prerefunded to 10/1/21, 5.00%, 10/1/36(1) | | | 13,800 | | | | 14,826,168 | |
| | |
New Jersey Health Care Facilities Financing Authority, (Palisades Medical Center), Prerefunded to 7/1/23, 5.25%, 7/1/31 | | | 615 | | | | 702,828 | |
| | |
North Carolina, Limited Obligation Bonds, Prerefunded to 5/1/21, 5.00%, 5/1/30(1) | | | 10,000 | | | | 10,589,800 | |
| | |
Ohio Higher Educational Facility Commission, (Kenyon College), Prerefunded to 7/1/20, 5.00%, 7/1/44 | | | 105 | | | | 107,861 | |
| | |
Ohio Higher Educational Facility Commission, (Summa Health System), Prerefunded to 5/15/20, 5.75%, 11/15/40 | | | 290 | | | | 297,804 | |
| | |
Ohio Turnpike Commission, Prerefunded to 2/15/20, 5.00%, 2/15/31 | | | 1,000 | | | | 1,013,870 | |
| | |
Oregon, Prerefunded to 8/2/21, 5.00%, 8/1/36 | | | 1,710 | | | | 1,823,578 | |
| | |
Oregon Department of Administrative Services, Lottery Revenue, Prerefunded to 4/1/21, 5.25%, 4/1/30 | | | 7,545 | | | | 7,983,138 | |
| | |
Pennsylvania Higher Educational Facilities Authority, (Thomas Jefferson University), Prerefunded to 3/1/20, 5.00%, 3/1/40 | | | 925 | | | | 939,180 | |
| | | | | | | | |
| Security | | Principal Amount (000’s omitted) | | | Value | |
|
| Escrowed / Prerefunded (continued) | |
| | |
Pennsylvania Turnpike Commission, Prerefunded to 12/1/20, 5.35%, 12/1/30 | | $ | 135 | | | $ | 141,341 | |
| | |
Pennsylvania Turnpike Commission, Prerefunded to 12/1/20, 5.35%, 12/1/30 | | | 175 | | | | 183,220 | |
| | |
Pennsylvania Turnpike Commission, Prerefunded to 12/1/20, 6.00%, 12/1/34 | | | 3,520 | | | | 3,711,242 | |
| | |
Pennsylvania Turnpike Commission, Prerefunded to 12/1/20, 6.00%, 12/1/34 | | | 720 | | | | 759,118 | |
| | |
Pennsylvania Turnpike Commission, Prerefunded to 12/1/20, 6.00%, 12/1/34 | | | 760 | | | | 801,291 | |
| | |
Pennsylvania Turnpike Commission, Prerefunded to 12/1/21, 5.25%, 12/1/31 | | | 1,000 | | | | 1,085,790 | |
| | |
South Fork Municipal Authority, PA, (Conemaugh Health System), Prerefunded to 7/1/20, 5.50%, 7/1/29 | | | 250 | | | | 257,645 | |
| | |
Southcentral Pennsylvania General Authority, (York College of Pennsylvania), Prerefunded to 5/1/21, 5.50%, 11/1/31 | | | 1,500 | | | | 1,597,740 | |
| | |
Tarrant County Cultural Education Facilities Finance Corp., TX, (Scott & White Healthcare), Prerefunded to 8/15/20, 5.25%, 8/15/40 | | | 5,655 | | | | 5,846,422 | |
| | |
Tarrant County Cultural Education Facilities Finance Corp., TX, (Scott & White Healthcare), Prerefunded to 8/15/20, 5.25%, 8/15/40 | | | 450 | | | | 465,233 | |
| | |
University of Colorado, (University Enterprise Revenue), Prerefunded to 6/1/21, 5.25%, 6/1/36(1) | | | 10,000 | | | | 10,661,600 | |
| | |
Washington County Industrial Development Authority, PA, (Washington and Jefferson College), Prerefunded to 5/1/20, 5.25%, 11/1/30 | | | 575 | | | | 588,357 | |
| | |
| | | | | | | $ | 168,755,046 | |
|
| General Obligations — 28.4% | |
| | |
Allegheny County, PA, 5.00%, 11/1/43(1) | | $ | 3,800 | | | $ | 4,659,484 | |
| | |
Boston, MA, 5.00%, 5/1/38(1) | | | 2,000 | | | | 2,513,260 | |
| | |
California, 5.00%, 10/1/33(1) | | | 18,800 | | | | 21,983,216 | |
| | |
California, 5.00%, 8/1/46(1) | | | 15,000 | | | | 17,872,500 | |
| | |
Chicago, IL, 5.00%, 1/1/44 | | | 19,880 | | | | 22,473,744 | |
| | |
Chicago Board of Education, IL, 0.00%, 12/1/26 | | | 2,000 | | | | 1,619,980 | |
| | |
Chicago Park District, IL, (Harbor Facilities), 5.25%, 1/1/37(1) | | | 10,000 | | | | 10,317,200 | |
| | |
Cleveland, OH, 5.00%, 12/1/43(1) | | | 2,225 | | | | 2,697,301 | |
| | |
Delaware Valley Regional Finance Authority, PA, 5.75%, 7/1/32 | | | 6,500 | | | | 9,097,725 | |
| | |
District of Columbia, 5.00%, 6/1/43(1) | | | 12,000 | | | | 14,737,680 | |
| | |
Forest Hills Local School District, OH, 5.00%, 12/1/46(1) | | | 2,225 | | | | 2,567,072 | |
| | |
Humble Independent School District, TX, (PSF Guaranteed), 5.00%, 2/15/43(1) | | | 20,000 | | | | 24,002,800 | |
| | |
Jackson Public Schools, MI, 5.00%, 5/1/48(1) | | | 2,150 | | | | 2,578,430 | |
| | | | |
| | 9 | | See Notes to Financial Statements. |
Eaton Vance
Municipal Bond Fund
September 30, 2019
Portfolio of Investments — continued
| | | | | | | | |
| Security | | Principal Amount (000’s omitted) | | | Value | |
|
| General Obligations (continued) | |
| | |
Klein Independent School District, TX, (PSF Guaranteed), 5.00%, 2/1/36(1) | | $ | 2,000 | | | $ | 2,090,960 | |
| | |
Massachusetts, 5.00%, 9/1/38(1) | | | 18,500 | | | | 22,969,230 | |
| | |
Monmouth County Improvement Authority, NJ, 5.00%, 1/15/27 | | | 260 | | | | 272,111 | |
| | |
Morgan Hill Unified School District, CA, (Election of 2012), 4.00%, 8/1/47(1) | | | 10,000 | | | | 11,209,500 | |
| | |
New York, 5.00%, 2/15/34(1) | | | 2,750 | | | | 2,884,777 | |
| | |
New York, NY, 5.00%, 10/1/32 | | | 10,000 | | | | 11,050,000 | |
| | |
Ohio, 5.00%, 2/1/37(1) | | | 2,225 | | | | 2,647,572 | |
| | |
Oregon, 5.00%, 8/1/35(1) | | | 6,750 | | | | 7,173,427 | |
| | |
Oregon, 5.00%, 8/1/36 | | | 1,290 | | | | 1,369,954 | |
| | |
Pennsylvania, 4.00%, 4/1/29(1) | | | 3,000 | | | | 3,235,590 | |
| | |
Pennsylvania, 5.00%, 3/1/32(1) | | | 2,750 | | | | 3,430,790 | |
| | |
Peters Township School District, PA, 5.00%, 9/1/40(1) | | | 3,225 | | | | 3,997,839 | |
| | |
Port of Houston Authority of Harris County, TX, 5.00%, 10/1/35 | | | 7,500 | | | | 7,764,150 | |
| | |
Shoreline School District No. 412, WA, 4.00%, 6/1/38(1) | | | 2,800 | | | | 3,182,200 | |
| | |
State College Area School District, PA, 5.00%, 5/15/44(1) | | | 3,650 | | | | 4,470,337 | |
| | |
Tacoma School District No. 10, WA, 5.00%, 12/1/39(1) | | | 10,000 | | | | 11,806,100 | |
| | |
Trenton Public Schools, MI, 5.00%, 5/1/42(1) | | | 2,150 | | | | 2,595,738 | |
| | |
Upper Arlington City School District, OH, 5.00%, 12/1/48(1) | | | 2,225 | | | | 2,696,700 | |
| | |
Walled Lake Consolidated School District, MI, 5.00%, 5/1/34 | | | 635 | | | | 720,681 | |
| | |
Washington, 4.00%, 7/1/28(1) | | | 10,000 | | | | 10,699,500 | |
| | |
Washington, 5.00%, 2/1/35(1) | | | 23,500 | | | | 26,879,300 | |
| | |
Washington, 5.00%, 2/1/38(1) | | | 10,000 | | | | 12,355,200 | |
| | |
Wayland, MA, 5.00%, 2/1/33 | | | 340 | | | | 355,599 | |
| | |
Wayland, MA, 5.00%, 2/1/36 | | | 510 | | | | 532,777 | |
| | |
Will County, IL, 5.00%, 11/15/45(1) | | | 19,725 | | | | 22,465,000 | |
| | |
Winchester, MA, 5.00%, 4/15/36 | | | 160 | | | | 168,277 | |
| | |
| | | | | | | $ | 316,143,701 | |
|
| Hospital — 13.3% | |
| | |
Allen County, OH, (Mercy Health), 4.00%, 8/1/47(1) | | $ | 900 | | | $ | 975,348 | |
| | |
California Health Facilities Financing Authority, (Catholic Healthcare West), 5.25%, 3/1/27 | | | 1,000 | | | | 1,053,550 | |
| | |
California Health Facilities Financing Authority, (Catholic Healthcare West), 5.25%, 3/1/28 | | | 1,770 | | | | 1,864,270 | |
| | |
California Health Facilities Financing Authority, (City of Hope),
4.00%, 11/15/45(1) | | | 5,200 | | | | 5,876,260 | |
| | |
Camden County Improvement Authority, NJ, (Cooper Health System), 5.75%, 2/15/42 | | | 250 | | | | 279,383 | |
| | |
Colorado Health Facilities Authority, (Adventist Health System/Sunbelt Obligated Group), 4.00%, 11/15/41(1) | | | 7,950 | | | | 8,718,367 | |
| | | | | | | | |
| Security | | Principal Amount (000’s omitted) | | | Value | |
|
| Hospital (continued) | |
| | |
Colorado Health Facilities Authority, (CommonSpirit Health), 4.00%, 8/1/44 | | $ | 2,160 | | | $ | 2,339,885 | |
| | |
Franklin County, OH, (Trinity Health Credit Group), 5.00%, 12/1/47(1) | | | 2,200 | | | | 2,622,092 | |
| | |
Grand Traverse Hospital Finance Authority, MI, (Munson Healthcare Obligated Group), 5.375%, 7/1/35 | | | 750 | | | | 800,948 | |
| | |
Hamilton County, OH, (Cincinnati Children’s Hospital Medical Center), 5.00%, 5/15/34 | | | 250 | | | | 284,060 | |
| | |
Hawaii Department of Budget and Finance, (Hawaii Pacific Health), 5.50%, 7/1/38 | | | 3,150 | | | | 3,527,874 | |
| | |
Kent Hospital Finance Authority, MI, (Spectrum Health System), 5.00%, 1/15/31 | | | 750 | | | | 797,610 | |
| | |
Martin County Health Facilities Authority, FL, (Cleveland Clinic Health System), 4.00%, 1/1/46(1) | | | 10,000 | | | | 11,163,900 | |
| | |
Massachusetts Development Finance Agency, (Partners HealthCare System),
5.00%, 7/1/41(1) | | | 10,000 | | | | 11,794,000 | |
| | |
Massachusetts Development Finance Agency, (Partners HealthCare System),
5.00%, 7/1/47(1) | | | 2,375 | | | | 2,783,025 | |
| | |
Massachusetts Health and Educational Facilities Authority, (Southcoast Health System), 5.00%, 7/1/29 | | | 1,000 | | | | 1,003,370 | |
| | |
Michigan Finance Authority, (Trinity Health Credit Group), 5.00%, 12/1/42(1) | | | 7,300 | | | | 8,750,875 | |
| | |
Middleburg Heights, OH, (Southwest General Health Center), 5.25%, 8/1/36 | | | 500 | | | | 529,690 | |
| | |
Middleburg Heights, OH, (Southwest General Health Center), 5.25%, 8/1/41 | | | 755 | | | | 798,428 | |
| | |
Monroeville Finance Authority, PA, (UPMC Obligated Group), 5.00%, 2/15/42 | | | 500 | | | | 541,610 | |
| | |
New Jersey Health Care Facilities Financing Authority, (Palisades Medical Center), Prerefunded to 7/1/23, 5.25%, 7/1/31 | | | 135 | | | | 154,279 | |
| | |
New Jersey Health Care Facilities Financing Authority, (Princeton HealthCare System), 5.00%, 7/1/39(1) | | | 1,750 | | | | 2,076,182 | |
| | |
New Jersey Health Care Facilities Financing Authority, (Robert Wood Johnson University Hospital), 5.25%, 7/1/35 | | | 5,000 | | | | 5,601,050 | |
| | |
Northampton County General Purpose Authority, PA, (Saint Luke’s Hospital), 5.50%, 8/15/33 | | | 250 | | | | 257,630 | |
| | |
Ohio Higher Educational Facility Commission, (Cleveland Clinic Health System), Series 2011A, 5.00%, 1/1/32 | | | 500 | | | | 521,440 | |
| | |
Ohio Higher Educational Facility Commission, (Cleveland Clinic Health System), Series 2012A, 5.00%, 1/1/32 | | | 12,500 | | | | 13,449,000 | |
| | |
Ohio Higher Educational Facility Commission, (Summa Health System), 5.75%, 11/15/40 | | | 170 | | | | 174,294 | |
| | |
Ohio Higher Educational Facility Commission, (University Hospitals Health System, Inc.), 5.00%, 1/15/27 | | | 565 | | | | 624,444 | |
| | | | |
| | 10 | | See Notes to Financial Statements. |
Eaton Vance
Municipal Bond Fund
September 30, 2019
Portfolio of Investments — continued
| | | | | | | | |
| Security | | Principal Amount (000’s omitted) | | | Value | |
|
| Hospital (continued) | |
| | |
Ohio Higher Educational Facility Commission, (University Hospitals Health System, Inc.), 5.00%, 1/15/29 | | $ | 165 | | | $ | 181,635 | |
| | |
Pennsylvania Higher Educational Facilities Authority, (University of Pennsylvania Health System), 4.00%, 8/15/42(1) | | | 1,600 | | | | 1,763,552 | |
| | |
Pennsylvania Higher Educational Facilities Authority, (UPMC Health System), 5.00%, 5/15/31 | | | 675 | | | | 689,459 | |
| | |
Royal Oak Hospital Finance Authority, MI, (William Beaumont Hospital), 5.00%, 9/1/39 | | | 1,000 | | | | 1,125,010 | |
| | |
Tampa, FL, (BayCare Health System), 4.00%, 11/15/46(1) | | | 3,000 | | | | 3,236,310 | |
| | |
Tampa, FL, (BayCare Health System), 5.00%, 11/15/46(1) | | | 12,000 | | | | 14,105,520 | |
| | |
Tarrant County Cultural Education Facilities Finance Corp., TX, (Baylor Scott & White Health), 5.00%, 11/15/45(1) | | | 12,900 | | | | 14,937,168 | |
| | |
Vermont Educational and Health Buildings Financing Agency, (University of Vermont Medical Center), 5.00%, 12/1/33 | | | 1,600 | | | | 1,904,064 | |
| | |
West Virginia Hospital Finance Authority, (West Virginia United Health System Obligated Group), 5.375%, 6/1/38 | | | 7,605 | | | | 8,447,786 | |
| | |
Wisconsin Health and Educational Facilities Authority, (Ascension Health Alliance Senior Credit Group), 5.00%, 11/15/41(1) | | | 11,500 | | | | 12,296,950 | |
| | |
| | | | | | | $ | 148,050,318 | |
|
| Housing — 0.6% | |
| | |
East Hempfield Township Industrial Development Authority, PA, (Student Services, Inc.), 5.00%, 7/1/39 | | $ | 175 | | | $ | 189,889 | |
| | |
Michigan Housing Development Authority, 3.00%, 10/1/39 | | | 1,370 | | | | 1,399,633 | |
| | |
Michigan Housing Development Authority, 3.25%, 10/1/44 | | | 1,465 | | | | 1,505,727 | |
| | |
Michigan Housing Development Authority, 3.35%, 10/1/49 | | | 2,125 | | | | 2,182,184 | |
| | |
Seattle Housing Authority, WA, 3.625%, 12/1/43 | | | 1,000 | | | | 1,057,180 | |
| | |
| | | | | | | $ | 6,334,613 | |
|
| Industrial Development Revenue — 0.7% | |
| | |
Maricopa County Pollution Control Corp., AZ, (El Paso Electric Co.), 4.50%, 8/1/42 | | $ | 4,840 | | | $ | 5,058,671 | |
| | |
New York Liberty Development Corp., (Bank of America Tower at One Bryant Park), 2.625%, 9/15/69(2) | | | 1,805 | | | | 1,835,053 | |
| | |
New York Liberty Development Corp., (Bank of America Tower at One Bryant Park), 2.80%, 9/15/69(2) | | | 935 | | | | 951,615 | |
| | |
| | | | | | | $ | 7,845,339 | |
|
| Insured – Bond Bank — 0.1% | |
| | |
Puerto Rico Municipal Finance Agency, (AGM), 5.00%, 8/1/27 | | $ | 700 | | | $ | 719,208 | |
| | |
| | | | | | | $ | 719,208 | |
| | | | | | | | |
| Security | | Principal Amount (000’s omitted) | | | Value | |
|
| Insured – Education — 2.3% | |
| | |
Massachusetts College Building Authority, (XLCA), 5.50%, 5/1/39 | | $ | 700 | | | $ | 1,025,206 | |
| | |
Massachusetts Development Finance Agency, (Boston University), (XLCA), 6.00%, 5/15/59 | | | 1,105 | | | | 1,470,214 | |
| | |
Massachusetts Development Finance Agency, (College of the Holy Cross), (AMBAC), 5.25%, 9/1/32 | | | 15,900 | | | | 22,026,588 | |
| | |
Massachusetts Development Finance Agency, (College of the Holy Cross), (AMBAC), 5.25%, 9/1/32(1) | | | 750 | | | | 1,038,990 | |
| | |
| | | | | | | $ | 25,560,998 | |
|
| Insured – Electric Utilities — 2.1% | |
| | |
Chelan County Public Utility District No. 1, WA, (Columbia River), (NPFG), 0.00%, 6/1/23 | | $ | 6,335 | | | $ | 5,971,624 | |
| | |
Cleveland, OH, Public Power System Revenue, (NPFG), 0.00%, 11/15/27 | | | 2,750 | | | | 2,297,542 | |
| | |
Cleveland, OH, Public Power System Revenue, (NPFG), 0.00%, 11/15/38 | | | 1,000 | | | | 558,760 | |
| | |
Louisiana Energy and Power Authority, (AGM), 5.25%, 6/1/38 | | | 5,640 | | | | 6,340,375 | |
| | |
Ohio Municipal Electric Generation Agency, (NPFG), 0.00%, 2/15/27 | | | 5,000 | | | | 4,288,650 | |
| | |
Puerto Rico Electric Power Authority, (NPFG), 5.25%, 7/1/23 | | | 1,095 | | | | 1,162,080 | |
| | |
Puerto Rico Electric Power Authority, (NPFG), 5.25%, 7/1/26 | | | 1,530 | | | | 1,654,313 | |
| | |
Puerto Rico Electric Power Authority, (NPFG), 5.25%, 7/1/34 | | | 490 | | | | 531,591 | |
| | |
Puerto Rico Electric Power Authority, (NPFG), 5.25%, 7/1/35 | | | 1,085 | | | | 1,181,283 | |
| | |
| | | | | | | $ | 23,986,218 | |
|
| Insured – Escrowed / Prerefunded — 2.1% | |
| | |
Erie Sewer Authority, PA, (AMBAC), Escrowed to Maturity, 0.00%, 12/1/25 | | $ | 180 | | | $ | 162,661 | |
| | |
Kane, Cook and DuPage Counties School District No. 46, IL, (AMBAC), Escrowed to Maturity, 0.00%, 1/1/22 | | | 13,145 | | | | 12,708,060 | |
| | |
Massachusetts College Building Authority, (NPFG), Escrowed to Maturity, 0.00%, 5/1/26 | | | 1,600 | | | | 1,429,472 | |
| | |
Michigan Hospital Finance Authority, (St. John Health System), (AMBAC), Escrowed to Maturity, 5.00%, 5/15/28 | | | 665 | | | | 713,179 | |
| | |
Michigan House of Representatives, (AMBAC), Escrowed to Maturity, 0.00%, 8/15/23 | | | 2,615 | | | | 2,460,506 | |
| | |
Texas Transportation Commission, (Central Texas Turnpike System), (AMBAC), Escrowed to Maturity, 0.00%, 8/15/20 | | | 5,570 | | | | 5,499,985 | |
| | |
| | | | | | | $ | 22,973,863 | |
|
| Insured – General Obligations — 7.9% | |
| | |
Bay City Brownfield Redevelopment Authority, MI, (BAM), 5.375%, 10/1/38 | | $ | 500 | | | $ | 565,820 | |
| | | | |
| | 11 | | See Notes to Financial Statements. |
Eaton Vance
Municipal Bond Fund
September 30, 2019
Portfolio of Investments — continued
| | | | | | | | |
| Security | | Principal Amount (000’s omitted) | | | Value | |
|
| Insured – General Obligations (continued) | |
| | |
Chicago Park District, IL, (BAM),
5.00%, 1/1/39(1) | | $ | 13,600 | | | $ | 14,976,184 | |
| | |
Cincinnati City School District, OH, (AGM), (FGIC), 5.25%, 12/1/30 | | | 4,500 | | | | 6,141,420 | |
| | |
Clark County, NV, (AMBAC), 2.50%, 11/1/36 | | | 11,845 | | | | 11,845,592 | |
| | |
Erie School District, PA, (AMBAC), 0.00%, 9/1/30 | | | 1,000 | | | | 720,800 | |
| | |
Frisco Independent School District, TX, (PSF Guaranteed), (AGM), 2.75%, 8/15/39 | | | 9,530 | | | | 9,530,858 | |
| | |
Irvington Township, NJ, (AGM), 0.00%, 7/15/26 | | | 4,165 | | | | 3,626,382 | |
| | |
Kane, Cook and DuPage Counties School District No. 46, IL, (AMBAC), 0.00%, 1/1/22 | | | 16,605 | | | | 15,953,752 | |
| | |
Livonia Public Schools, MI, (AGM), 5.00%, 5/1/43 | | | 750 | | | | 839,408 | |
| | |
Massachusetts, (AMBAC), 5.50%, 8/1/30 | | | 1,900 | | | | 2,608,966 | |
| | |
McKeesport School District, PA, (NPFG), 0.00%, 10/1/21 | | | 2,555 | | | | 2,461,385 | |
| | |
Nassau County, NY, (AGM), 5.00%, 4/1/49(1) | | | 11,600 | | | | 14,237,492 | |
| | |
Plain School District, OH, (NPFG), 0.00%, 12/1/27 | | | 2,400 | | | | 2,022,696 | |
| | |
Shaler Area School District, PA, (XLCA), 0.00%, 9/1/33 | | | 2,550 | | | | 1,815,727 | |
| | |
Westland Tax Increment Finance Authority, MI, (BAM), 5.25%, 4/1/34 | | | 500 | | | | 556,250 | |
| | |
| | | | | | | $ | 87,902,732 | |
|
| Insured – Hospital — 0.0%(3) | |
| | |
Allegheny County Hospital Development Authority, PA, (UPMC Health System), (NPFG), 6.00%, 7/1/24 | | $ | 250 | | | $ | 301,097 | |
| | |
| | | | | | | $ | 301,097 | |
|
| Insured – Industrial Development Revenue — 0.1% | |
| | |
Pennsylvania Economic Development Financing Authority, (Aqua Pennsylvania, Inc.), (BHAC), 5.00%, 10/1/39 | | $ | 1,340 | | | $ | 1,343,926 | |
| | |
| | | | | | | $ | 1,343,926 | |
|
| Insured – Lease Revenue / Certificates of Participation — 0.3% | |
| | |
Essex County Improvement Authority, NJ, (NPFG), 5.50%, 10/1/30 | | $ | 2,000 | | | $ | 2,781,800 | |
| | |
New Jersey Economic Development Authority, (School Facilities Construction), (NPFG), 5.50%, 9/1/28 | | | 500 | | | | 628,735 | |
| | |
| | | | | | | $ | 3,410,535 | |
|
| Insured – Other Revenue — 1.8% | |
| | |
Harris County-Houston Sports Authority, TX, (AGM), (NPFG), 0.00%, 11/15/34 | | $ | 19,335 | | | $ | 11,871,497 | |
| | |
New York City Industrial Development Agency, NY, (Yankee Stadium), (AGC), 7.00%, 3/1/49 | | | 7,750 | | | | 7,790,765 | |
| | |
| | | | | | | $ | 19,662,262 | |
| | | | | | | | |
| Security | | Principal Amount (000’s omitted) | | | Value | |
|
| Insured – Special Tax Revenue — 6.8% | |
| | |
Alabama Public School and College Authority, (AGM), 2.50%, 12/1/27 | | $ | 15,975 | | | $ | 15,984,905 | |
| | |
Garden State Preservation Trust, NJ, (AGM), 0.00%, 11/1/21 | | | 1,000 | | | | 969,030 | |
| | |
Hamilton County, OH, Sales Tax Revenue, (AMBAC), 0.00%, 12/1/23 | | | 1,245 | | | | 1,165,332 | |
| | |
Hamilton County, OH, Sales Tax Revenue, (AMBAC), 0.00%, 12/1/24 | | | 3,665 | | | | 3,364,287 | |
| | |
Houston, TX, Hotel Occupancy Tax Revenue, (AMBAC), 0.00%, 9/1/24 | | | 18,035 | | | | 16,505,091 | |
| | |
Massachusetts, Dedicated Tax Revenue, (NPFG), 5.50%, 1/1/29 | | | 750 | | | | 995,505 | |
| | |
Miami-Dade County, FL, Professional Sports Franchise Facilities, (AGC), 7.00%, (0.00% until 10/1/19), 10/1/39 | | | 18,000 | | | | 25,823,160 | |
| | |
New Jersey Economic Development Authority, (Motor Vehicle Surcharges), (XLCA), 0.00%, 7/1/26 | | | 420 | | | | 355,643 | |
| | |
New Jersey Economic Development Authority, (Motor Vehicle Surcharges), (XLCA), 0.00%, 7/1/27 | | | 1,120 | | | | 919,610 | |
| | |
Pennsylvania Turnpike Commission, (AGM), 5.25%, 7/15/30 | | | 1,105 | | | | 1,507,739 | |
| | |
Pennsylvania Turnpike Commission, (AGM), Escrowed to Maturity, 5.25%, 7/15/30 | | | 1,435 | | | | 1,946,879 | |
| | |
Reno, NV, Capital Improvement Revenue, (AGM), 4.00%, 6/1/43 | | | 6,000 | | | | 6,525,600 | |
| | |
| | | | | | | $ | 76,062,781 | |
|
| Insured – Transportation — 9.1% | |
| | |
Chicago, IL, (O’Hare International Airport), (AGM), 5.00%, 1/1/28 | | $ | 2,500 | | | $ | 2,780,150 | |
| | |
Chicago, IL, (O’Hare International Airport), (AGM), 5.00%, 1/1/29 | | | 1,260 | | | | 1,399,079 | |
| | |
Chicago, IL, (O’Hare International Airport), (AGM), 5.125%, 1/1/30 | | | 2,200 | | | | 2,447,808 | |
| | |
Chicago, IL, (O’Hare International Airport), (AGM), 5.125%, 1/1/31 | | | 1,750 | | | | 1,944,180 | |
| | |
Chicago, IL, (O’Hare International Airport), (AGM), 5.25%, 1/1/32 | | | 1,115 | | | | 1,240,861 | |
| | |
Chicago, IL, (O’Hare International Airport), (AGM), 5.25%, 1/1/33 | | | 1,150 | | | | 1,277,880 | |
| | |
Clark County, NV, (Las Vegas-McCarran International Airport), (AGM), 5.25%, 7/1/39 | | | 9,665 | | | | 9,751,888 | |
| | |
E-470 Public Highway Authority, CO, (NPFG), 0.00%, 9/1/21 | | | 10,200 | | | | 9,910,626 | |
| | |
E-470 Public Highway Authority, CO, (NPFG), 0.00%, 9/1/22 | | | 7,800 | | | | 7,445,958 | |
| | |
E-470 Public Highway Authority, CO, (NPFG), 0.00%, 9/1/39 | | | 25,000 | | | | 11,001,500 | |
| | |
Metropolitan Transportation Authority, NY, Green Bonds, (AGM), 4.00%, 11/15/46 | | | 10,000 | | | | 11,145,000 | |
| | |
New Jersey Turnpike Authority, (AGM), (BHAC), 5.25%, 1/1/29 | | | 1,000 | | | | 1,325,130 | |
| | | | |
| | 12 | | See Notes to Financial Statements. |
Eaton Vance
Municipal Bond Fund
September 30, 2019
Portfolio of Investments — continued
| | | | | | | | |
| Security | | Principal Amount (000’s omitted) | | | Value | |
|
| Insured – Transportation (continued) | |
| | |
Port Palm Beach District, FL, (XLCA), 0.00%, 9/1/24 | | $ | 1,605 | | | $ | 1,377,684 | |
| | |
Port Palm Beach District, FL, (XLCA), 0.00%, 9/1/25 | | | 1,950 | | | | 1,619,631 | |
| | |
Port Palm Beach District, FL, (XLCA), 0.00%, 9/1/26 | | | 1,000 | | | | 802,720 | |
| | |
Puerto Rico Highway and Transportation Authority, (AGC), 5.25%, 7/1/41 | | | 2,100 | | | | 2,360,274 | |
| | |
Puerto Rico Highway and Transportation Authority, (AGM), 5.00%, 7/1/32 | | | 475 | | | | 486,600 | |
| | |
San Joaquin Hills Transportation Corridor Agency, CA, (NPFG), 0.00%, 1/15/25 | | | 26,215 | | | | 23,113,503 | |
| | |
South Jersey Transportation Authority, NJ, (AGC), 5.50%, 11/1/33 | | | 180 | | | | 180,569 | |
| | |
Texas Transportation Commission, (Central Texas Turnpike System), (AMBAC), 0.00%, 8/15/20 | | | 10,275 | | | | 10,142,350 | |
| | |
| | | | | | | $ | 101,753,391 | |
|
| Insured – Water and Sewer — 4.4% | |
| | |
Chicago, IL, Wastewater Transmission Revenue, (NPFG), 0.00%, 1/1/23 | | $ | 13,670 | | | $ | 12,784,184 | |
| | |
DeKalb County, GA, Water and Sewerage Revenue, (AGM), 5.25%, 10/1/32(1) | | | 10,000 | | | | 12,429,700 | |
| | |
Erie Sewer Authority, PA, (AMBAC), 0.00%, 12/1/26 | | | 1,920 | | | | 1,572,845 | |
| | |
Massachusetts Water Resources Authority, (AGM), 5.25%, 8/1/35 | | | 1,000 | | | | 1,452,330 | |
| | |
Massachusetts Water Resources Authority, (AGM), 5.25%, 8/1/38 | | | 1,070 | | | | 1,585,269 | |
| | |
Michigan Finance Authority, (Detroit Water and Sewerage Department), (AGM), 5.00%, 7/1/31 | | | 1,500 | | | | 1,729,155 | |
| | |
Michigan Finance Authority, (Detroit Water and Sewerage Department), (AGM), 5.00%, 7/1/32 | | | 2,845 | | | | 3,272,945 | |
| | |
Michigan Finance Authority, (Detroit Water and Sewerage Department), (AGM), 5.00%, 7/1/33 | | | 2,435 | | | | 2,791,411 | |
| | |
Michigan Finance Authority, (Detroit Water and Sewerage Department), (AGM), 5.00%, 7/1/35 | | | 2,970 | | | | 3,386,127 | |
| | |
Michigan Finance Authority, (Detroit Water and Sewerage Department), (AGM), 5.00%, 7/1/37 | | | 2,435 | | | | 2,763,895 | |
| | |
Middlesex County Improvement Authority, NJ, (Perth Amboy), (AMBAC), 0.00%, 9/1/24 | | | 2,150 | | | | 1,954,264 | |
| | |
Passaic Valley Sewerage Commissioners, NJ, (NPFG), 2.50%, 12/1/32 | | | 635 | | | | 635,006 | |
| | |
Pittsburgh Water and Sewer Authority, PA, (AGM), 5.00%, 9/1/33 | | | 1,250 | | | | 1,687,950 | |
| | |
Puerto Rico Aqueduct and Sewer Authority, (AGC), 5.00%, 7/1/28 | | | 890 | | | | 914,315 | |
| | |
| | | | | | | $ | 48,959,396 | |
|
| Lease Revenue / Certificates of Participation — 2.6% | |
| | |
Hudson Yards Infrastructure Corp., NY, 5.75%, 2/15/47 | | $ | 755 | | | $ | 797,982 | |
| | | | | | | | |
| Security | | Principal Amount (000’s omitted) | | | Value | |
|
| Lease Revenue / Certificates of Participation (continued) | |
| | |
Hudson Yards Infrastructure Corp., NY, Prerefunded to 2/15/21, 5.75%, 2/15/47 | | $ | 1,225 | | | $ | 1,300,117 | |
| | |
Michigan State Building Authority, 5.00%, 10/15/51(1) | | | 2,200 | | | | 2,578,092 | |
| | |
North Carolina, Limited Obligation Bonds, 5.00%, 5/1/26(1) | | | 21,250 | | | | 24,666,575 | |
| | |
| | | | | | | $ | 29,342,766 | |
|
| Other Revenue — 1.4% | |
| | |
New York City Transitional Finance Authority, NY, (Building Aid), 5.00%, 7/15/36(1) | | $ | 10,750 | | | $ | 11,404,030 | |
| | |
Oregon Department of Administrative Services, Lottery Revenue, 5.25%, 4/1/30 | | | 1,455 | | | | 1,538,415 | |
| | |
Texas Municipal Gas Acquisition and Supply Corp. III, Gas Supply Revenue, 5.00%, 12/15/30 | | | 1,960 | | | | 2,140,222 | |
| | |
| | | | | | | $ | 15,082,667 | |
|
| Senior Living / Life Care — 0.1% | |
| | |
Franklin County, OH, (Friendship Village of Dublin), 5.00%, 11/15/44 | | $ | 525 | | | $ | 579,747 | |
| | |
New Jersey Economic Development Authority, (United Methodist Homes of New Jersey), 5.00%, 7/1/34 | | | 675 | | | | 710,235 | |
| | |
Warren County, OH, (Otterbein Homes Obligated Group), 5.75%, 7/1/33 | | | 220 | | | | 251,337 | |
| | |
| | | | | | | $ | 1,541,319 | |
|
| Special Tax Revenue — 19.9% | |
| | |
Allegheny County Port Authority, PA, 5.75%, 3/1/29 | | $ | 1,500 | | | $ | 1,590,780 | |
| | |
Central Puget Sound Regional Transit Authority, WA, Sales and Use Tax Revenue, Green Bonds, 5.00%, 11/1/30(1) | | | 14,425 | | | | 17,364,671 | |
| | |
Central Puget Sound Regional Transit Authority, WA, Sales Tax and Motor Vehicle Excise Tax Revenue, Green Bonds, 5.00%, 11/1/41(1) | | | 10,000 | | | | 12,014,900 | |
| | |
Cleveland, OH, Income Tax Revenue, 5.00%, 10/1/39(1) | | | 450 | | | | 548,051 | |
| | |
Cleveland, OH, Income Tax Revenue, 5.00%, 10/1/43(1) | | | 1,800 | | | | 2,169,666 | |
| | |
Connecticut, Special Tax Obligation, (Transportation Infrastructure),
5.00%, 1/1/31(1) | | | 20,000 | | | | 22,114,600 | |
| | |
Denver City and County, CO, Dedicated Tax Revenue, 5.00%, 8/1/41(1) | | | 10,000 | | | | 11,932,000 | |
| | |
Franklin County, OH, Sales Tax Revenue, 5.00%, 6/1/38(1) | | | 1,100 | | | | 1,371,546 | |
| | |
Franklin County, OH, Sales Tax Revenue, 5.00%, 6/1/43(1) | | | 1,100 | | | | 1,356,828 | |
| | |
Massachusetts, (Rail Enhancement and Accelerated Bridge Programs),
5.00%, 6/1/47(1) | | | 2,000 | | | | 2,394,400 | |
| | |
Massachusetts Bay Transportation Authority, Sales Tax Revenue, 5.25%, 7/1/33 | | | 750 | | | | 1,031,647 | |
| | |
Massachusetts School Building Authority, Sales Tax Revenue, 5.00%, 8/15/37(1) | | | 20,200 | | | | 23,860,038 | |
| | |
Massachusetts School Building Authority, Sales Tax Revenue, 5.00%, 11/15/46(1) | | | 1,500 | | | | 1,794,735 | |
| | | | |
| | 13 | | See Notes to Financial Statements. |
Eaton Vance
Municipal Bond Fund
September 30, 2019
Portfolio of Investments — continued
| | | | | | | | |
| Security | | Principal Amount (000’s omitted) | | | Value | |
|
| Special Tax Revenue (continued) | |
| | |
New York City Transitional Finance Authority, NY, Future Tax Revenue, 4.00%, 8/1/37(1) | | $ | 10,000 | | | $ | 11,259,200 | |
| | |
New York City Transitional Finance Authority, NY, Future Tax Revenue, 4.00%, 8/1/39(1) | | | 5,000 | | | | 5,583,850 | |
| | |
New York City Transitional Finance Authority, NY, Future Tax Revenue, 4.00%, 5/1/42 | | | 3,120 | | | | 3,515,023 | |
| | |
New York City Transitional Finance Authority, NY, Future Tax Revenue, 5.00%, 2/1/37(1) | | | 20,000 | | | | 21,553,600 | |
| | |
New York City Transitional Finance Authority, NY, Future Tax Revenue,
5.50%, 11/1/35(1) | | | 2,145 | | | | 2,240,667 | |
| | |
New York City Transitional Finance Authority, NY, Future Tax Revenue, Prerefunded to 11/1/20, 5.50%, 11/1/35(1) | | | 1,655 | | | | 1,732,255 | |
| | |
New York Convention Center Development Corp., Hotel Occupancy Tax, 5.00%, 11/15/45(1) | | | 13,000 | | | | 15,223,520 | |
| | |
New York Dormitory Authority, Personal Income Tax Revenue, 5.00%, 6/15/31 | | | 10,000 | | | | 11,109,100 | |
| | |
New York Dormitory Authority, Sales Tax Revenue, 4.00%, 3/15/46(1) | | | 14,000 | | | | 15,479,240 | |
| | |
New York Dormitory Authority, Sales Tax Revenue, 5.00%, 3/15/34 | | | 3,750 | | | | 4,220,025 | |
| | |
New York Dormitory Authority, Sales Tax Revenue, 5.00%, 3/15/35 | | | 13,750 | | | | 15,463,250 | |
| | |
New York Dormitory Authority, Sales Tax Revenue, 5.00%, 3/15/43(1) | | | 6,000 | | | | 7,304,580 | |
| | |
New York State Urban Development Corp., Personal Income Tax Revenue, 4.00%, 3/15/45(1) | | | 2,800 | | | | 3,143,280 | |
| | |
Pennsylvania Turnpike Commission, Oil Franchise Tax Revenue, 5.25%, 12/1/44(1) | | | 3,750 | | | | 4,641,975 | |
| | |
| | | | | | | $ | 222,013,427 | |
|
| Transportation — 17.1% | |
| | |
Chicago, IL, (O’Hare International Airport), 5.00%, 1/1/34 | | $ | 1,000 | | | $ | 1,156,870 | |
| | |
Chicago, IL, (O’Hare International Airport), Series 2016C, 5.00%, 1/1/38 | | | 2,105 | | | | 2,465,523 | |
| | |
Chicago, IL, (O’Hare International Airport), Series 2018B, 5.00%, 1/1/38 | | | 1,500 | | | | 1,856,235 | |
| | |
Dallas and Fort Worth, TX, (Dallas/Fort Worth International Airport), 5.25%, 11/1/30 | | | 3,845 | | | | 4,409,715 | |
| | |
Dallas and Fort Worth, TX, (Dallas/Fort Worth International Airport), 5.25%, 11/1/31 | | | 5,940 | | | | 6,797,201 | |
| | |
Delaware River and Bay Authority of Delaware and New Jersey,
4.00%, 1/1/44(1) | | | 8,850 | | | | 9,958,197 | |
| | |
Delaware River Joint Toll Bridge Commission of Pennsylvania and New Jersey, 5.00%, 7/1/37(1) | | | 1,150 | | | | 1,405,427 | |
| | |
Delaware River Joint Toll Bridge Commission of Pennsylvania and New Jersey, 5.00%, 7/1/47(1) | | | 4,575 | | | | 5,503,817 | |
| | |
Illinois Toll Highway Authority,
5.00%, 1/1/37(1) | | | 10,000 | | | | 11,659,800 | |
| | |
Illinois Toll Highway Authority,
5.00%, 1/1/41(1) | | | 12,425 | | | | 14,522,464 | |
| | | | | | | | |
| Security | | Principal Amount (000’s omitted) | | | Value | |
|
| Transportation (continued) | |
| | |
Kansas Department of Transportation, 5.00%, 9/1/35(1) | | $ | 10,000 | | | $ | 11,889,200 | |
| | |
Los Angeles Department of Airports, CA, (Los Angeles International Airport), 5.25%, 5/15/28 | | | 3,750 | | | | 3,846,225 | |
| | |
Massachusetts Department of Transportation, (Metropolitan Highway System), 5.00%, 1/1/32 | | | 1,000 | | | | 1,009,230 | |
| | |
Massachusetts Department of Transportation, (Metropolitan Highway System), 5.00%, 1/1/37 | | | 500 | | | | 504,575 | |
| | |
Metropolitan Transportation Authority, NY, 5.25%, 11/15/32 | | | 5,000 | | | | 5,786,900 | |
| | |
Metropolitan Transportation Authority, NY, Green Bonds, 4.00%, 11/15/38 | | | 1,520 | | | | 1,700,698 | |
| | |
Miami-Dade County, FL, (Miami International Airport), 5.00%, 10/1/41 | | | 12,920 | | | | 13,325,559 | |
| | |
New Jersey Transportation Trust Fund Authority, (Transportation Program), 5.00%, 6/15/38 | | | 130 | | | | 143,191 | |
| | |
New Jersey Transportation Trust Fund Authority, (Transportation Program), 5.00%, 6/15/44(2) | | | 2,740 | | | | 3,139,026 | |
| | |
New Jersey Transportation Trust Fund Authority, (Transportation System), 5.00%, 12/15/24 | | | 10,000 | | | | 11,520,300 | |
| | |
New Jersey Transportation Trust Fund Authority, (Transportation System), 5.25%, 12/15/23 | | | 1,000 | | | | 1,139,670 | |
| | |
New Jersey Transportation Trust Fund Authority, (Transportation System), 5.50%, 6/15/31 | | | 1,150 | | | | 1,219,828 | |
| | |
New Jersey Turnpike Authority, 5.00%, 1/1/48(1) | | | 10,000 | | | | 12,191,300 | |
| | |
New York Liberty Development Corp., (4 World Trade Center), 5.00%, 11/15/31 | | | 1,070 | | | | 1,154,327 | |
| | |
Orlando-Orange County Expressway Authority, FL, Prerefunded to 7/1/20, 5.00%, 7/1/35 | | | 700 | | | | 719,341 | |
| | |
Orlando-Orange County Expressway Authority, FL, Prerefunded to 7/1/20, 5.00%, 7/1/35 | | | 2,635 | | | | 2,707,805 | |
| | |
Orlando-Orange County Expressway Authority, FL, Prerefunded to 7/1/20, 5.00%, 7/1/40 | | | 1,810 | | | | 1,860,010 | |
| | |
Orlando-Orange County Expressway Authority, FL, Prerefunded to 7/1/20, 5.00%, 7/1/40 | | | 1,155 | | | | 1,186,474 | |
| | |
Pennsylvania Turnpike Commission, Prerefunded to 12/1/20, 5.35%, 12/1/30 | | | 190 | | | | 198,924 | |
| | |
Port Authority of New York and New Jersey, 4.00%, 9/1/43(1) | | | 14,000 | | | | 15,931,160 | |
| | |
Port Authority of New York and New Jersey, 5.00%, 12/1/34(1) | | | 16,400 | | | | 18,796,204 | |
| | |
Port Authority of New York and New Jersey, 5.00%, 10/15/35(1) | | | 2,675 | | | | 3,189,536 | |
| | |
Port Authority of New York and New Jersey, 5.00%, 7/15/39 | | | 5,000 | | | | 5,140,500 | |
| | |
Port Authority of New York and New Jersey, 5.00%, 10/15/42(1) | | | 3,750 | | | | 4,530,150 | |
| | |
Texas Private Activity Bond Surface Transportation Corp., (North Tarrant Express Segment 3C), (AMT), 5.00%, 6/30/58 | | | 4,855 | | | | 5,674,427 | |
| | |
Texas Transportation Commission, (Central Texas Turnpike System), 5.00%, 8/15/37 | | | 1,500 | | | | 1,691,490 | |
| | | | |
| | 14 | | See Notes to Financial Statements. |
Eaton Vance
Municipal Bond Fund
September 30, 2019
Portfolio of Investments — continued
| | | | | | | | |
| Security | | Principal Amount (000’s omitted) | | | Value | |
|
| Transportation (continued) | |
| | |
Texas Transportation Commission, (Central Texas Turnpike System), 5.00%, 8/15/42 | | $ | 265 | | | $ | 296,901 | |
| | |
| | | | | | | $ | 190,228,200 | |
|
| Water and Sewer — 11.8% | |
| | |
Atlanta, GA, Water and Wastewater Revenue, 5.00%, 11/1/43(1) | | $ | 3,750 | | | $ | 4,549,987 | |
| | |
Atlanta, GA, Water and Wastewater Revenue, 5.00%, 11/1/47(1) | | | 5,900 | | | | 7,123,247 | |
| | |
Charleston, SC, Waterworks and Sewer Revenue, 5.00%, 1/1/45(1) | | | 25,000 | | | | 29,027,750 | |
| | |
Dallas, TX, Waterworks and Sewer System Revenue, 5.00%, 10/1/41(1) | | | 15,000 | | | | 17,861,550 | |
| | |
Detroit, MI, Sewage Disposal System, 5.00%, 7/1/32 | | | 2,625 | | | | 2,848,440 | |
| | |
Detroit, MI, Sewage Disposal System, 5.25%, 7/1/39 | | | 2,345 | | | | 2,553,611 | |
| | |
Detroit, MI, Water Supply System, 5.25%, 7/1/41 | | | 3,210 | | | | 3,403,499 | |
| | |
Grand Rapids, MI, Sanitary Sewer System Revenue, 5.00%, 1/1/43(1) | | | 2,500 | | | | 3,026,125 | |
| | |
Massachusetts Water Resources Authority, Green Bonds, 5.00%, 8/1/40(1) | | | 2,000 | | | | 2,399,240 | |
| | |
Metropolitan St. Louis Sewer District, MO, 5.00%, 5/1/35(1) | | | 8,750 | | | | 10,335,850 | |
| | |
Metropolitan St. Louis Sewer District, MO, 5.00%, 5/1/36(1) | | | 7,925 | | | | 9,349,281 | |
| | |
New York City Municipal Water Finance Authority, NY, 5.00%, 6/15/31 | | | 10,000 | | | | 10,962,600 | |
| | |
Northeast Ohio Regional Sewer District, 4.00%, 11/15/33(1) | | | 1,000 | | | | 1,071,160 | |
| | |
Port Huron, MI, Water Supply System, 5.25%, 10/1/31 | | | 250 | | | | 268,248 | |
| | |
Portland, OR, Water System, 5.00%, 5/1/36 | | | 5,385 | | | | 5,672,451 | |
| | |
Texas Water Development Board, 4.00%, 10/15/47(1) | | | 2,900 | | | | 3,233,703 | |
| | |
Texas Water Development Board, 5.00%, 10/15/40(1) | | | 15,500 | | | | 18,170,960 | |
| | |
| | | | | | | $ | 131,857,702 | |
| |
Total Tax-Exempt Municipal Securities — 170.4%
(identified cost $1,742,435,504) | | | $ | 1,899,018,826 | |
|
| Trust Units — 0.0%(3) | |
| Security | | Notional
Amount
(000’s omitted) | | | Value | |
|
| Insured – Special Tax Revenue — 0.0%(3) | |
| | |
COFINA Series 2007A Senior Bonds Due 2045 National Custodial Trust (taxable), 8/1/45(4) | | $ | 159 | | | $ | 21,891 | |
| | |
COFINA Series 2007A Senior Bonds Due 2045 National Custodial Trust (non-taxable), 8/1/45(4) | | | 483 | | | | 24,175 | |
| |
Total Trust Units — 0.0%(3)
(identified cost $40,400) | | | $ | 46,066 | |
| | | | | | | | |
| Corporate Bonds & Notes — 0.4% | |
| Security | | Principal
Amount
(000’s omitted) | | | Value | |
|
| Hospital — 0.4% | |
| | |
CommonSpirit Health, 3.347%, 10/1/29 | | $ | 4,320 | | | $ | 4,377,709 | |
| |
Total Corporate Bonds & Notes — 0.4%
(identified cost $4,320,000) | | | $ | 4,377,709 | |
| |
Total Investments — 170.8%
(identified cost $1,746,795,904) | | | $ | 1,903,442,601 | |
| |
Other Assets, Less Liabilities — (70.8)% | | | $ | (789,206,868 | ) |
| |
Net Assets — 100.0% | | | $ | 1,114,235,733 | |
The percentage shown for each investment category in the Portfolio of Investments is based on net assets.
At September 30, 2019, the concentration of the Fund’s investments in the various states and territories, determined as a percentage of total investments, is as follows:
| | | | |
| |
| New York | | | 15.5% | |
| |
| Texas | | | 10.3% | |
| |
| Others, representing less than 10% individually | | | 74.2% | |
The Fund invests primarily in debt securities issued by municipalities. The ability of the issuers of the debt securities to meet their obligations may be affected by economic developments in a specific industry or municipality. At September 30, 2019, 21.7% of total investments are backed by bond insurance of various financial institutions and financial guaranty assurance agencies. The aggregate percentage insured by an individual financial institution or financial guaranty assurance agency ranged from 0.1% to 7.6% of total investments.
| (1) | Security represents the municipal bond held by a trust that issues residual interest bonds (see Note 1G). |
| (2) | When-issued security. |
| (3) | Amount is less than 0.05%. |
| (4) | Security was received in connection with the restructuring of an insured zero-coupon bond issued by the Puerto Rico Sales Tax Financing Corporation (“COFINA”) (the “Original Bond”). The notional amount of the combined taxable and tax-exempt trust units reflects the accreted amount of the Original Bond from original issuance through the restructuring date. Each trust certificate represents an ownership interest in various coupon paying and zero-coupon COFINA bonds and potential insurance payments pursuant to an insurance policy with National Public Finance Guarantee Corporation. The trust units have no stated coupon interest rate but accrete income to maturity at the annual rate of approximately 5.04%, the same rate as the Original Bond. |
| | | | |
| | 15 | | See Notes to Financial Statements. |
Eaton Vance
Municipal Bond Fund
September 30, 2019
Portfolio of Investments — continued
Abbreviations:
| | | | |
| | |
| AGC | | – | | Assured Guaranty Corp. |
| | |
| AGM | | – | | Assured Guaranty Municipal Corp. |
| | |
| AMBAC | | – | | AMBAC Financial Group, Inc. |
| | |
| AMT | | – | | Interest earned from these securities may be considered a tax preference item for purposes of the Federal Alternative Minimum Tax. |
| | |
| BAM | | – | | Build America Mutual Assurance Co. |
| | |
| BHAC | | – | | Berkshire Hathaway Assurance Corp. |
| | |
| FGIC | | – | | Financial Guaranty Insurance Company |
| | |
| NPFG | | – | | National Public Finance Guarantee Corp. |
| | |
| PSF | | – | | Permanent School Fund |
| | |
| XLCA | | – | | XL Capital Assurance, Inc. |
| | | | |
| | 16 | | See Notes to Financial Statements. |
Eaton Vance
California Municipal Bond Fund
September 30, 2019
Portfolio of Investments
| | | | | | | | |
| Tax-Exempt Investments — 171.6% | |
| Security | | Principal Amount (000’s omitted) | | | Value | |
|
| Education — 17.6% | |
| | |
California Educational Facilities Authority, (Claremont McKenna College), 5.00%, 1/1/27 | | $ | 770 | | | $ | 772,426 | |
| | |
California Educational Facilities Authority, (Harvey Mudd College), 5.25%, 12/1/31 | | | 645 | | | | 699,928 | |
| | |
California Educational Facilities Authority, (Harvey Mudd College), 5.25%, 12/1/36 | | | 1,100 | | | | 1,192,444 | |
| | |
California Educational Facilities Authority, (Loyola Marymount University), Green Bonds, 5.00%, 10/1/43 | | | 2,105 | | | | 2,579,341 | |
| | |
California Educational Facilities Authority, (Loyola Marymount University), Green Bonds, 5.00%, 10/1/48 | | | 3,000 | | | | 3,665,490 | |
| | |
California Educational Facilities Authority, (Pepperdine University), 5.00%, 10/1/46(1) | | | 6,600 | | | | 7,791,696 | |
| | |
California Educational Facilities Authority, (University of the Pacific), 5.00%, 11/1/30 | | | 1,790 | | | | 1,924,035 | |
| | |
California Municipal Finance Authority, (University of San Diego), 5.00%, 10/1/31 | | | 1,385 | | | | 1,480,094 | |
| | |
California Municipal Finance Authority, (University of San Diego), 5.00%, 10/1/35 | | | 945 | | | | 1,013,550 | |
| | |
California Municipal Finance Authority, (University of San Diego), 5.25%, 10/1/26 | | | 2,270 | | | | 2,442,111 | |
| | |
California Municipal Finance Authority, (University of San Diego), 5.25%, 10/1/27 | | | 2,820 | | | | 3,031,500 | |
| | |
California Municipal Finance Authority, (University of San Diego), 5.25%, 10/1/28 | | | 2,970 | | | | 3,190,315 | |
| | |
California State University, 5.00%, 11/1/41(1) | | | 9,550 | | | | 11,379,303 | |
| | |
University of California, 5.00%, 5/15/46(1) | | | 12,050 | | | | 14,310,459 | |
| | |
| | | | | | | $ | 55,472,692 | |
|
| Electric Utilities — 1.6% | |
| | |
Los Angeles Department of Water and Power, Power System Revenue, 5.00%, 7/1/42(1) | | $ | 2,000 | | | $ | 2,439,040 | |
| | |
Southern California Public Power Authority, (Tieton Hydropower), 5.00%, 7/1/35 | | | 1,890 | | | | 1,940,652 | |
| | |
Vernon, Electric System Revenue, 5.125%, 8/1/21 | | | 745 | | | | 747,734 | |
| | |
| | | | | | | $ | 5,127,426 | |
|
| Escrowed / Prerefunded — 14.6% | |
| | |
California Educational Facilities Authority, (California Institute of Technology), Prerefunded to 11/1/19, 5.00%, 11/1/39(1) | | $ | 10,000 | | | $ | 10,031,500 | |
| | |
California Educational Facilities Authority, (Santa Clara University), Prerefunded to 2/1/20, 5.00%, 2/1/29 | | | 285 | | | | 288,711 | |
| | |
California Educational Facilities Authority, (University of San Francisco), Prerefunded to 10/1/21, 6.125%, 10/1/36 | | | 390 | | | | 428,934 | |
| | | | | | | | |
| Security | | Principal Amount (000’s omitted) | | | Value | |
|
| Escrowed / Prerefunded (continued) | |
| | |
California Educational Facilities Authority, (University of San Francisco), Prerefunded to 10/1/21, 6.125%, 10/1/36 | | $ | 375 | | | $ | 412,046 | |
| | |
Contra Costa Community College District, (Election of 2006), Prerefunded to 8/1/23, 5.00%, 8/1/38(1) | | | 9,750 | | | | 11,196,120 | |
| | |
Foothill-De Anza Community College District, Prerefunded to 8/1/21, 5.00%, 8/1/36(1) | | | 10,000 | | | | 10,723,600 | |
| | |
San Diego Community College District, (Election of 2002), Prerefunded to 8/1/21, 5.00%, 8/1/32 | | | 2,095 | | | | 2,246,594 | |
| | |
San Diego Community College District, (Election of 2006), Prerefunded to 8/1/21, 5.00%, 8/1/31 | | | 3,000 | | | | 3,217,080 | |
| | |
San Francisco Bay Area Rapid Transit District, Sales Tax Revenue, Prerefunded to 7/1/22, 5.00%, 7/1/36(1) | | | 1,690 | | | | 1,870,762 | |
| | |
San Jose-Evergreen Community College District, (Election of 2010), Prerefunded to 8/1/22, 5.00%, 8/1/37(1) | | | 4,975 | | | | 5,523,046 | |
| | |
| | | | | | | $ | 45,938,393 | |
|
| General Obligations — 53.3% | |
| | |
Alameda City Unified School District, (Election of 2014), 5.00%, 8/1/42(1) | | $ | 1,675 | | | $ | 2,042,043 | |
| | |
Berryessa Union School District, (Election of 2014), 5.00%, 8/1/40(1) | | | 7,450 | | | | 9,016,065 | |
| | |
Burbank Unified School District, (Election of 2013), 4.00%, 8/1/31(1) | | | 6,900 | | | | 7,481,739 | |
| | |
Cabrillo Unified School District, (Election of 2018), 5.00%, 8/1/48 | | | 5,000 | | | | 5,894,150 | |
| | |
California, 5.50%, 11/1/35 | | | 5,900 | | | | 6,156,591 | |
| | |
Campbell Union High School District, (Election of 2016), 5.00%, 8/1/36(1) | | | 11,250 | | | | 13,685,062 | |
| | |
Desert Community College District, 5.00%, 8/1/36(1) | | | 7,500 | | | | 9,010,575 | |
| | |
El Camino Community College District, (Election of 2012), 5.00%, 8/1/48(1) | | | 10,000 | | | | 12,390,900 | |
| | |
La Canada Unified School District, (Election of 2017), 5.00%, 8/1/47(1) | | | 3,375 | | | | 4,214,666 | |
| | |
Livermore Valley Joint Unified School District, (Election of 2016), 4.00%, 8/1/46 | | | 5,000 | | | | 5,525,150 | |
| | |
Long Beach Unified School District, (Election of 2008), 5.00%, 8/1/41(1) | | | 1,500 | | | | 1,802,535 | |
| | |
Old Adobe Union School District, (Election of 2018), 5.00%, 8/1/48 | | | 3,415 | | | | 4,025,704 | |
| | |
Oxnard Union High School District, (Election of 2018), 5.00%, 8/1/42(1) | | | 3,000 | | | | 3,583,170 | |
| | |
Palo Alto, (Election of 2008), 5.00%, 8/1/40 | | | 1,850 | | | | 1,906,333 | |
| | |
Palo Alto, (Election of 2008), 5.00%, 8/1/40(1) | | | 7,020 | | | | 7,233,759 | |
| | |
Palomar Community College District, 5.00%, 8/1/44(1) | | | 10,000 | | | | 11,736,600 | |
| | |
Redding School District, (Election of 2018), 5.00%, 8/1/48 | | | 2,645 | | | | 3,114,329 | |
| | |
San Bernardino Community College District, 4.00%, 8/1/27(1) | | | 5,775 | | | | 6,377,448 | |
| | | | |
| | 17 | | See Notes to Financial Statements. |
Eaton Vance
California Municipal Bond Fund
September 30, 2019
Portfolio of Investments — continued
| | | | | | | | |
| Security | | Principal Amount (000’s omitted) | | | Value | |
|
| General Obligations (continued) | |
| | |
San Bruno Park School District, (Election of 2018), 5.00%, 8/1/48 | | $ | 2,500 | | | $ | 2,940,125 | |
| | |
San Diego Unified School District, (Election of 2012), 5.00%, 7/1/47(1) | | | 4,000 | | | | 4,840,680 | |
| | |
San Jose Unified School District, (Election of 2012), 4.00%, 8/1/42(1) | | | 12,000 | | | | 13,548,840 | |
| | |
Santa Monica Community College District, (Election of 2008), 5.00%, 8/1/44(1) | | | 7,500 | | | | 8,656,350 | |
| | |
Santa Rosa High School District, (Election of 2014), 5.00%, 8/1/41 | | | 3,495 | | | | 4,192,462 | |
| | |
Torrance Unified School District, (Election of 2008), 5.00%, 8/1/35 | | | 7,500 | | | | 8,500,200 | |
| | |
Ventura County Community College District, 5.00%, 8/1/30(1) | | | 8,000 | | | | 9,580,880 | |
| | |
| | | | | | | $ | 167,456,356 | |
|
| Hospital — 18.7% | |
| | |
California Health Facilities Financing Authority, (Adventist Health System/West), 4.00%, 3/1/39 | | $ | 5,000 | | | $ | 5,395,800 | |
| | |
California Health Facilities Financing Authority, (Catholic Healthcare West), 5.25%, 3/1/27 | | | 1,750 | | | | 1,843,712 | |
| | |
California Health Facilities Financing Authority, (Catholic Healthcare West), 5.25%, 3/1/28 | | | 550 | | | | 579,293 | |
| | |
California Health Facilities Financing Authority, (City of Hope),
4.00%, 11/15/45(1) | | | 5,000 | | | | 5,650,250 | |
| | |
California Health Facilities Financing Authority, (City of Hope), 5.00%, 11/15/32 | | | 2,130 | | | | 2,345,215 | |
| | |
California Health Facilities Financing Authority, (City of Hope), 5.00%, 11/15/35 | | | 3,040 | | | | 3,341,325 | |
| | |
California Health Facilities Financing Authority, (St. Joseph Health System), 5.00%, 7/1/33 | | | 5,080 | | | | 5,723,484 | |
| | |
California Health Facilities Financing Authority, (St. Joseph Health System), 5.00%, 7/1/37 | | | 2,380 | | | | 2,670,360 | |
| | |
California Health Facilities Financing Authority, (Sutter Health),
5.00%, 11/15/46(1) | | | 3,000 | | | | 3,550,170 | |
| | |
California Health Facilities Financing Authority, (Sutter Health), 5.00%, 11/15/46 | | | 8,000 | | | | 9,467,120 | |
| | |
California Health Facilities Financing Authority, (Sutter Health),
5.25%, 8/15/31(1) | | | 5,000 | | | | 5,360,600 | |
| | |
California Public Finance Authority, (Sharp HealthCare), 5.00%, 8/1/47(1) | | | 1,250 | | | | 1,502,100 | |
| | |
California Public Finance Authority, (Sharp HealthCare), 5.00%, 8/1/47 | | | 8,445 | | | | 10,148,188 | |
| | |
California Statewide Communities Development Authority, (Cottage Health System), 5.25%, 11/1/30 | | | 1,000 | | | | 1,040,600 | |
| | |
| | | | | | | $ | 58,618,217 | |
| | | | | | | | |
| Security | | Principal Amount (000’s omitted) | | | Value | |
|
| Housing — 1.9% | |
| | |
California Statewide Communities Development Authority, (University of California, Irvine East Campus Apartments, Phase IV-A-CHF-Irvine, LLC), 5.00%, 5/15/47 | | $ | 5,000 | | | $ | 5,892,650 | |
| | |
| | | | | | | $ | 5,892,650 | |
|
| Insured – Electric Utilities — 3.1% | |
| | |
Puerto Rico Electric Power Authority, (NPFG), 5.25%, 7/1/34 | | $ | 4,875 | | | $ | 5,288,790 | |
| | |
Sacramento Municipal Utility District, (AMBAC), (BHAC), 5.25%, 7/1/24 | | | 4,000 | | | | 4,532,600 | |
| | |
| | | | | | | $ | 9,821,390 | |
|
| Insured – Escrowed / Prerefunded — 1.0% | |
| | |
Clovis Unified School District, (NPFG), Escrowed to Maturity, 0.00%, 8/1/20 | | $ | 3,130 | | | $ | 3,097,010 | |
| | |
| | | | | | | $ | 3,097,010 | |
|
| Insured – General Obligations — 19.2% | |
| | |
Burbank Unified School District, (Election of 1997), (NPFG), 0.00%, 8/1/21 | | $ | 4,135 | | | $ | 4,024,802 | |
| | |
Cotati-Rohnert Park Unified School District, (Election of 2016), (AGM), 5.00%, 8/1/44 | | | 3,500 | | | | 4,131,785 | |
| | |
Garvey School District, (Election of 2016), (AGM), 5.00%, 8/1/45 | | | 2,440 | | | | 2,886,349 | |
| | |
Garvey School District, (Election of 2016), (AGM), 5.00%, 8/1/48 | | | 1,610 | | | | 1,900,154 | |
| | |
Grass Valley School District, (Election of 2018), (BAM), 5.00%, 8/1/45 | | | 3,000 | | | | 3,536,250 | |
| | |
Mountain View School District, (Election of 2016), (BAM), 5.00%, 8/1/42 | | | 1,145 | | | | 1,366,764 | |
| | |
Mountain View School District, (Election of 2016), (BAM), 5.00%, 8/1/45 | | | 1,520 | | | | 1,808,694 | |
| | |
Perris Union High School District, (Election of 2018), (AGM), 4.00%, 9/1/43 | | | 6,635 | | | | 7,603,843 | |
| | |
San Diego Unified School District, (NPFG), 0.00%, 7/1/22 | | | 2,300 | | | | 2,217,154 | |
| | |
San Diego Unified School District, (NPFG), 0.00%, 7/1/23 | | | 5,000 | | | | 4,747,100 | |
| | |
San Juan Unified School District, (AGM), 0.00%, 8/1/21 | | | 5,630 | | | | 5,490,883 | |
| | |
San Mateo County Community College District, (NPFG), 0.00%, 9/1/22 | | | 4,840 | | | | 4,661,936 | |
| | |
San Mateo County Community College District, (NPFG), 0.00%, 9/1/23 | | | 4,365 | | | | 4,144,000 | |
| | |
San Mateo County Community College District, (NPFG), 0.00%, 9/1/25 | | | 3,955 | | | | 3,636,741 | |
| | |
San Mateo Union High School District, (NPFG), 0.00%, 9/1/21 | | | 5,240 | | | | 5,111,725 | |
| | |
Union Elementary School District, (Election of 1999), (NPFG), 0.00%, 9/1/22 | | | 3,200 | | | | 3,071,584 | |
| | |
| | | | | | | $ | 60,339,764 | |
| | | | |
| | 18 | | See Notes to Financial Statements. |
Eaton Vance
California Municipal Bond Fund
September 30, 2019
Portfolio of Investments — continued
| | | | | | | | |
| Security | | Principal Amount (000’s omitted) | | | Value | |
|
| Insured – Transportation — 0.9% | |
| | |
San Joaquin Hills Transportation Corridor Agency, (NPFG), 0.00%, 1/15/27 | | $ | 3,520 | | | $ | 2,918,361 | |
| | |
| | | | | | | $ | 2,918,361 | |
|
| Lease Revenue / Certificates of Participation — 1.1% | |
| | |
California Public Works Board, 5.00%, 11/1/38 | | $ | 3,045 | | | $ | 3,449,863 | |
| | |
| | | | | | | $ | 3,449,863 | |
|
| Special Tax Revenue — 12.6% | |
| | |
Jurupa Public Financing Authority, 5.00%, 9/1/30 | | $ | 625 | | | $ | 729,468 | |
| | |
Jurupa Public Financing Authority, 5.00%, 9/1/32 | | | 625 | | | | 722,719 | |
| | |
Los Angeles County Metropolitan Transportation Authority, Sales Tax Revenue, Green Bonds, 5.00%, 7/1/42(1) | | | 10,250 | | | | 12,549,690 | |
| | |
Riverside County Transportation Commission, Sales Tax Revenue, Prerefunded to 6/1/23, 5.25%, 6/1/39(1) | | | 6,285 | | | | 7,221,465 | |
| | |
San Bernardino County Transportation Authority, Sales Tax Revenue, 5.25%, 3/1/40(1) | | | 10,375 | | | | 12,074,010 | |
| | |
San Francisco Bay Area Rapid Transit District, Sales Tax Revenue, 5.00%, 7/1/36(1) | | | 4,560 | | | | 5,008,613 | |
| | |
San Francisco Bay Area Rapid Transit District, Sales Tax Revenue, Prerefunded to 7/1/20, 5.00%, 7/1/28 | | | 1,300 | | | | 1,337,700 | |
| | |
| | | | | | | $ | 39,643,665 | |
|
| Transportation — 7.9% | |
| | |
Long Beach, Harbor Revenue, 5.00%, 5/15/27 | | $ | 2,500 | | | $ | 2,557,950 | |
| | |
Long Beach, Harbor Revenue, 5.00%, 5/15/42(1) | | | 7,500 | | | | 8,776,200 | |
| | |
Los Angeles Department of Airports, (Los Angeles International Airport), 5.00%, 5/15/35(1) | | | 8,560 | | | | 8,754,141 | |
| | |
San Francisco City and County Airport Commission, (San Francisco International Airport), 5.00%, 5/1/35 | | | 2,825 | | | | 2,882,743 | |
| | |
San Jose, Airport Revenue, 5.00%, 3/1/31 | | | 1,750 | | | | 1,837,850 | |
| | |
| | | | | | | $ | 24,808,884 | |
|
| Water and Sewer — 18.1% | |
| | |
Beverly Hills Public Financing Authority, Water Revenue, 5.00%, 6/1/37(1) | | $ | 5,725 | | | $ | 6,251,013 | |
| | |
Eastern Municipal Water District Financing Authority, 5.25%, 7/1/42(1) | | | 9,000 | | | | 11,224,890 | |
| | |
Los Angeles Department of Water and Power, Water System Revenue, 5.00%, 7/1/39(1) | | | 10,000 | | | | 11,582,600 | |
| | |
Los Angeles, Wastewater System Revenue, 5.00%, 6/1/43(1) | | | 7,500 | | | | 8,433,600 | |
| | |
Orange County Sanitation District, Wastewater Revenue, 5.00%, 2/1/35(1) | | | 10,000 | | | | 11,654,600 | |
| | |
Rancho California Water District Financing Authority, 5.00%, 8/1/46(1) | | | 2,500 | | | | 2,999,950 | |
| | | | | | | | |
| Security | | Principal Amount (000’s omitted) | | | Value | |
|
| Water and Sewer (continued) | |
| | |
San Francisco City and County Public Utilities Commission, Water Revenue, Green Bonds, 5.00%, 11/1/45(1) | | $ | 4,000 | | | $ | 4,668,720 | |
| | |
| | | | | | | $ | 56,815,373 | |
| |
Total Tax-Exempt Investments — 171.6%
(identified cost $501,815,725) | | | $ | 539,400,044 | |
| |
Other Assets, Less Liabilities — (71.6)% | | | $ | (225,122,822 | ) |
| |
Net Assets — 100.0% | | | $ | 314,277,222 | |
The percentage shown for each investment category in the Portfolio of Investments is based on net assets.
The Fund invests primarily in debt securities issued by California municipalities. The ability of the issuers of the debt securities to meet their obligations may be affected by economic developments in a specific industry or municipality. At September 30, 2019, 14.1% of total investments are backed by bond insurance of various financial institutions and financial guaranty assurance agencies. The aggregate percentage insured by an individual financial institution or financial guaranty assurance agency ranged from 0.8% to 8.0% of total investments.
| (1) | Security represents the municipal bond held by a trust that issues residual interest bonds (see Note 1G). |
Abbreviations:
| | | | |
| | |
| AGM | | – | | Assured Guaranty Municipal Corp. |
| | |
| AMBAC | | – | | AMBAC Financial Group, Inc. |
| | |
| BAM | | – | | Build America Mutual Assurance Co. |
| | |
| BHAC | | – | | Berkshire Hathaway Assurance Corp. |
| | |
| NPFG | | – | | National Public Finance Guarantee Corp. |
| | | | |
| | 19 | | See Notes to Financial Statements. |
Eaton Vance
New York Municipal Bond Fund
September 30, 2019
Portfolio of Investments
| | | | | | | | |
| Tax-Exempt Investments — 161.7% | |
| Security | | Principal
Amount
(000’s omitted) | | | Value | |
|
| Bond Bank — 9.6% | |
| | |
New York State Environmental Facilities Corp., 5.00%, 10/15/39 | | $ | 4,110 | | | $ | 4,186,282 | |
| | |
New York State Environmental Facilities Corp., Clean Water and Drinking Water, 4.00%, 6/15/46(1) | | | 17,500 | | | | 19,366,025 | |
| | |
| | | | | | | $ | 23,552,307 | |
|
| Education — 20.7% | |
| | |
Geneva Development Corp., (Hobart and William Smith Colleges), 5.00%, 9/1/30 | | $ | 200 | | | $ | 227,716 | |
| | |
Geneva Development Corp., (Hobart and William Smith Colleges), 5.00%, 9/1/33 | | | 105 | | | | 119,580 | |
| | |
Geneva Development Corp., (Hobart and William Smith Colleges), 5.00%, 9/1/34 | | | 200 | | | | 227,188 | |
| | |
Geneva Development Corp., (Hobart and William Smith Colleges), Series 2012, 5.00%, 9/1/32 | | | 1,935 | | | | 2,127,010 | |
| | |
Geneva Development Corp., (Hobart and William Smith Colleges), Series 2014, 5.00%, 9/1/32 | | | 200 | | | | 227,522 | |
| | |
Hempstead Local Development Corp., (Adelphi University), 5.00%, 6/1/21 | | | 950 | | | | 1,006,363 | |
| | |
Hempstead Local Development Corp., (Adelphi University), 5.00%, 6/1/31 | | | 800 | | | | 846,832 | |
| | |
Hempstead Local Development Corp., (Adelphi University), 5.00%, 6/1/32 | | | 300 | | | | 317,364 | |
| | |
New York City Cultural Resources Trust, (The Juilliard School), 5.00%, 1/1/38 | | | 600 | | | | 759,750 | |
| | |
New York Dormitory Authority, (Columbia University), 5.00%, 10/1/38(1) | | | 2,000 | | | | 2,527,940 | |
| | |
New York Dormitory Authority, (Columbia University), 5.00%, 10/1/41 | | | 1,275 | | | | 1,343,187 | |
| | |
New York Dormitory Authority, (Columbia University), 5.00%, 10/1/41(1) | | | 10,000 | | | | 10,534,800 | |
| | |
New York Dormitory Authority, (Cornell University), 5.00%, 7/1/37(1) | | | 6,975 | | | | 7,159,768 | |
| | |
New York Dormitory Authority, (New York University), 5.00%, 7/1/39(1) | | | 2,000 | | | | 2,508,480 | |
| | |
New York Dormitory Authority, (Rochester Institute of Technology), 5.00%, 7/1/40 | | | 2,000 | | | | 2,056,480 | |
| | |
New York Dormitory Authority, (Rockefeller University), 5.00%, 7/1/34 | | | 100 | | | | 109,383 | |
| | |
New York Dormitory Authority, (Rockefeller University), 5.00%, 7/1/40 | | | 1,110 | | | | 1,113,574 | |
| | |
New York Dormitory Authority, (Rockefeller University), 5.00%, 7/1/40(1) | | | 2,700 | | | | 2,708,694 | |
| | |
New York Dormitory Authority, (Skidmore College), 5.00%, 7/1/26 | | | 1,175 | | | | 1,244,936 | |
| | |
New York Dormitory Authority, (Skidmore College), 5.00%, 7/1/28 | | | 325 | | | | 345,264 | |
| | | | | | | | |
| Security | | Principal
Amount
(000’s omitted) | | | Value | |
|
| Education (continued) | |
| | |
New York Dormitory Authority, (Skidmore College), 5.25%, 7/1/30 | | $ | 250 | | | $ | 266,043 | |
| | |
New York Dormitory Authority, (The New School), 5.00%, 7/1/46 | | | 1,660 | | | | 1,955,613 | |
| | |
New York Dormitory Authority, (The New School), Prerefunded to 7/1/20, 5.50%, 7/1/40 | | | 6,250 | | | | 6,447,312 | |
| | |
Onondaga County Cultural Resources Trust, (Syracuse University), 5.00%, 12/1/38 | | | 3,820 | | | | 4,365,649 | |
| | |
| | | | | | | $ | 50,546,448 | |
|
| Electric Utilities — 2.9% | |
| | |
Long Island Power Authority, Electric System Revenue, 5.00%, 9/1/37 | | $ | 1,500 | | | $ | 1,853,115 | |
| | |
Utility Debt Securitization Authority, 5.00%, 12/15/33 | | | 2,895 | | | | 3,315,441 | |
| | |
Utility Debt Securitization Authority, 5.00%, 12/15/36(1) | | | 1,675 | | | | 2,012,814 | |
| | |
| | | | | | | $ | 7,181,370 | |
|
| Escrowed / Prerefunded — 4.4% | |
| | |
Long Beach City School District, Prerefunded to 5/1/20, 4.50%, 5/1/26 | | $ | 3,715 | | | $ | 3,788,074 | |
| | |
Metropolitan Transportation Authority, Prerefunded to 11/15/20, 5.00%, 11/15/34 | | | 2,000 | | | | 2,086,740 | |
| | |
Metropolitan Transportation Authority, Prerefunded to 11/15/21, 5.25%, 11/15/38 | | | 3,430 | | | | 3,729,610 | |
| | |
New York Dormitory Authority, (North Shore-Long Island Jewish Obligated Group), Escrowed to Maturity, 5.00%, 5/1/20 | | | 1,065 | | | | 1,088,079 | |
| | |
| | | | | | | $ | 10,692,503 | |
|
| General Obligations — 10.8% | |
| | |
New York, 5.00%, 2/15/34(1) | | $ | 8,250 | | | $ | 8,654,332 | |
| | |
New York City, 4.00%, 8/1/34 | | | 1,170 | | | | 1,327,997 | |
| | |
New York City, 4.00%, 12/1/41 | | | 2,100 | | | | 2,381,883 | |
| | |
New York City, 5.00%, 8/1/34(1) | | | 10,000 | | | | 11,296,600 | |
| | |
Washingtonville Central School District, 0.05%, 6/15/35 | | | 950 | | | | 623,988 | |
| | |
Washingtonville Central School District, 0.05%, 6/15/36 | | | 950 | | | | 598,148 | |
| | |
Washingtonville Central School District, 0.05%, 6/15/37 | | | 950 | | | | 577,154 | |
| | |
Washingtonville Central School District, 0.05%, 6/15/38 | | | 950 | | | | 557,413 | |
| | |
Washingtonville Central School District, 0.05%, 6/15/39 | | | 695 | | | | 395,594 | |
| | |
| | | | | | | $ | 26,413,109 | |
|
| Hospital — 10.7% | |
| | |
New York Dormitory Authority, (Catholic Health System Obligated Group), 4.00%, 7/1/40 | | $ | 635 | | | $ | 705,307 | |
| | |
New York Dormitory Authority, (Highland Hospital of Rochester), 5.00%, 7/1/26 | | | 755 | | | | 772,999 | |
| | | | |
| | 20 | | See Notes to Financial Statements. |
Eaton Vance
New York Municipal Bond Fund
September 30, 2019
Portfolio of Investments — continued
| | | | | | | | |
| Security | | Principal
Amount
(000’s omitted) | | | Value | |
|
| Hospital (continued) | |
| | |
New York Dormitory Authority, (Highland Hospital of Rochester), 5.20%, 7/1/32 | | $ | 1,000 | | | $ | 1,023,810 | |
| | |
New York Dormitory Authority, (Memorial Sloan-Kettering Cancer Center), 5.00%, 7/1/42 | | | 1,500 | | | | 1,801,785 | |
| | |
New York Dormitory Authority, (Memorial Sloan-Kettering Cancer Center), Prerefunded to 1/1/22, 4.375%, 7/1/34(1) | | | 9,825 | | | | 10,428,747 | |
| | |
New York Dormitory Authority, (Montefiore Obligated Group), 4.00%, 8/1/36 | | | 4,135 | | | | 4,617,596 | |
| | |
Suffolk County Economic Development Corp., (Catholic Health Services of Long Island Obligated Group), 5.00%, 7/1/28 | | | 6,380 | | | | 6,781,238 | |
| | |
| | | | | | | $ | 26,131,482 | |
|
| Housing — 7.6% | |
| | |
New York City Housing Development Corp., 3.40%, 11/1/39 | | $ | 1,000 | | | $ | 1,046,740 | |
| | |
New York City Housing Development Corp., 3.55%, 11/1/44 | | | 1,270 | | | | 1,329,182 | |
| | |
New York City Housing Development Corp., 3.70%, 11/1/38 | | | 885 | | | | 940,799 | |
| | |
New York City Housing Development Corp., 3.80%, 11/1/43 | | | 1,675 | | | | 1,771,497 | |
| | |
New York City Housing Development Corp., 4.05%, 11/1/41 | | | 2,030 | | | | 2,177,946 | |
| | |
New York Housing Finance Agency, (FHLMC), (FNMA), (GNMA), 3.20%, 11/1/46 | | | 1,075 | | | | 1,092,738 | |
| | |
New York Housing Finance Agency, (FHLMC), (FNMA), (GNMA), 4.00%, 11/1/42 | | | 500 | | | | 533,900 | |
| | |
New York Housing Finance Agency, (FNMA), 3.95%, 11/1/37 | | | 1,000 | | | | 1,074,370 | |
| | |
New York Mortgage Agency, 3.60%, 10/1/34 | | | 2,000 | | | | 2,145,240 | |
| | |
New York Mortgage Agency, 4.10%, 10/1/38 | | | 4,300 | | | | 4,734,687 | |
| | |
Westchester County Local Development Corp., (Purchase Housing Corp. II), 5.00%, 6/1/47 | | | 1,500 | | | | 1,746,330 | |
| | |
| | | | | | | $ | 18,593,429 | |
|
| Industrial Development Revenue — 1.5% | |
| | |
New York Liberty Development Corp., (Bank of America Tower at One Bryant Park), 2.80%, 9/15/69(2) | | $ | 400 | | | $ | 407,108 | |
| | |
New York Liberty Development Corp., (Goldman Sachs Group, Inc.), 5.25%, 10/1/35 | | | 895 | | | | 1,229,533 | |
| | |
New York Liberty Development Corp., (Goldman Sachs Group, Inc.), 5.50%, 10/1/37 | | | 1,440 | | | | 2,066,775 | |
| | |
| | | | | | | $ | 3,703,416 | |
|
| Insured – Education — 1.7% | |
| | |
New York Dormitory Authority, (Barnard College), (NPFG), 5.00%, 7/1/24 | | $ | 290 | | | $ | 290,943 | |
| | |
New York Dormitory Authority, (City University), (AMBAC), 5.25%, 7/1/30 | | | 75 | | | | 92,615 | |
| | |
New York Dormitory Authority, (City University), (AMBAC), 5.50%, 7/1/35 | | | 1,345 | | | | 1,855,360 | |
| | |
New York Dormitory Authority, (Educational Housing Services CUNY Student Housing), (AMBAC), 5.25%, 7/1/23 | | | 1,750 | | | | 1,961,715 | |
| | |
| | | | | | | $ | 4,200,633 | |
| | | | | | | | |
| Security | | Principal
Amount
(000’s omitted) | | | Value | |
|
| Insured – Electric Utilities — 3.0% | |
| | |
New York Power Authority, (BHAC), 4.50%, 11/15/47(1) | | $ | 7,210 | | | $ | 7,226,655 | |
| | |
| | | | | | | $ | 7,226,655 | |
|
| Insured – Escrowed / Prerefunded — 1.9% | |
| | |
Brentwood Union Free School District, (AGC), Prerefunded to 11/15/19, 4.75%, 11/15/23 | | $ | 2,290 | | | $ | 2,299,824 | |
| | |
Brentwood Union Free School District, (AGC), Prerefunded to 11/15/19, 5.00%, 11/15/24 | | | 2,390 | | | | 2,400,970 | |
| | |
| | | | | | | $ | 4,700,794 | |
|
| Insured – General Obligations — 8.7% | |
| | |
East Northport Fire District, (AGC), 4.50%, 11/1/20 | | $ | 200 | | | $ | 200,570 | |
| | |
East Northport Fire District, (AGC), 4.50%, 11/1/21 | | | 200 | | | | 200,530 | |
| | |
East Northport Fire District, (AGC), 4.50%, 11/1/22 | | | 200 | | | | 200,530 | |
| | |
East Northport Fire District, (AGC), 4.50%, 11/1/23 | | | 200 | | | | 200,530 | |
| | |
Longwood Central School District, Suffolk County, (AGC), 4.15%, 6/1/23 | | | 1,005 | | | | 1,007,291 | |
| | |
Longwood Central School District, Suffolk County, (AGC), 4.25%, 6/1/24 | | | 1,050 | | | | 1,052,489 | |
| | |
Nassau County, (AGM), 5.00%, 7/1/42 | | | 1,000 | | | | 1,222,130 | |
| | |
Nassau County, (AGM), 5.00%, 4/1/43(1) | | | 10,000 | | | | 12,376,900 | |
| | |
Oyster Bay, (AGM), 4.00%, 8/1/28 | | | 4,585 | | | | 4,883,346 | |
| | |
| | | | | | | $ | 21,344,316 | |
|
| Insured – Hospital — 0.2% | |
| | |
New York City Health and Hospitals Corp., (AGM), 5.50%, 2/15/20 | | $ | 500 | | | $ | 501,705 | |
| | |
| | | | | | | $ | 501,705 | |
|
| Insured – Lease Revenue / Certificates of Participation — 2.4% | |
| | |
Ulster County Resource Recovery Agency, Solid Waste System, (AMBAC), 0.00%, 3/1/21 | | $ | 1,490 | | | $ | 1,458,427 | |
| | |
Ulster County Resource Recovery Agency, Solid Waste System, (AMBAC), 0.00%, 3/1/23 | | | 1,090 | | | | 1,030,333 | |
| | |
Ulster County Resource Recovery Agency, Solid Waste System, (AMBAC), 0.00%, 3/1/25 | | | 3,635 | | | | 3,302,870 | |
| | |
| | | | | | | $ | 5,791,630 | |
|
| Insured – Special Tax Revenue — 1.7% | |
| | |
New York Thruway Authority, Miscellaneous Tax Revenue, (AMBAC), 5.50%, 4/1/20 | | $ | 2,685 | | | $ | 2,740,982 | |
| | |
Puerto Rico Infrastructure Financing Authority, (AMBAC), 0.00%, 7/1/36 | | | 3,000 | | | | 1,288,380 | |
| | |
| | | | | | | $ | 4,029,362 | |
| | | | |
| | 21 | | See Notes to Financial Statements. |
Eaton Vance
New York Municipal Bond Fund
September 30, 2019
Portfolio of Investments — continued
| | | | | | | | |
| Security | | Principal
Amount
(000’s omitted) | | | Value | |
|
| Insured – Transportation — 4.4% | |
| | |
Metropolitan Transportation Authority, Green Bonds, (AGM), 4.00%, 11/15/46 | | $ | 1,500 | | | $ | 1,671,750 | |
| | |
Metropolitan Transportation Authority, Green Bonds, (AGM), 4.00%, 11/15/46(1) | | | 8,000 | | | | 9,004,080 | |
| | |
| | | | | | | $ | 10,675,830 | |
|
| Lease Revenue / Certificates of Participation — 4.1% | |
| | |
Hudson Yards Infrastructure Corp., 4.00%, 2/15/44 | | $ | 400 | | | $ | 445,616 | |
| | |
Hudson Yards Infrastructure Corp., 5.00%, 2/15/42(1) | | | 8,000 | | | | 9,620,480 | |
| | |
| | | | | | | $ | 10,066,096 | |
|
| Other Revenue — 14.1% | |
| | |
Battery Park City Authority, 5.00%, 11/1/34 | | $ | 4,625 | | | $ | 4,639,337 | |
| | |
Brooklyn Arena Local Development Corp., (Barclays Center), 0.00%, 7/15/31 | | | 6,000 | | | | 4,311,660 | |
| | |
Brooklyn Arena Local Development Corp., (Barclays Center), 5.00%, 7/15/42 | | | 1,500 | | | | 1,726,155 | |
| | |
Build NYC Resource Corp., (Children’s Aid Society), 4.00%, 7/1/49 | | | 2,400 | | | | 2,700,216 | |
| | |
New York City Transitional Finance Authority, (Building Aid), 5.00%, 7/15/32(1) | | | 10,000 | | | | 11,871,200 | |
| | |
New York City Transitional Finance Authority, (Building Aid), 5.00%, 7/15/37(1) | | | 2,200 | | | | 2,732,378 | |
| | |
New York Liberty Development Corp., (7 World Trade Center), 5.00%, 9/15/32 | | | 5,975 | | | | 6,493,451 | |
| | |
| | | | | | | $ | 34,474,397 | |
|
| Senior Living / Life Care — 1.4% | |
| | |
Brookhaven Local Development Corp., (Jefferson’s Ferry), 5.00%, 11/1/24 | | $ | 135 | | | $ | 152,561 | |
| | |
Brookhaven Local Development Corp., (Jefferson’s Ferry), 5.25%, 11/1/25 | | | 325 | | | | 377,182 | |
| | |
Brookhaven Local Development Corp., (Jefferson’s Ferry), 5.25%, 11/1/26 | | | 200 | | | | 236,916 | |
| | |
Brookhaven Local Development Corp., (Jefferson’s Ferry), 5.25%, 11/1/36 | | | 970 | | | | 1,136,083 | |
| | |
Westchester County Local Development Corp., (Miriam Osborn Memorial Home Association), 5.00%, 7/1/42 | | | 1,200 | | | | 1,391,232 | |
| | |
| | | | | | | $ | 3,293,974 | |
|
| Special Tax Revenue — 28.9% | |
| | |
Metropolitan Transportation Authority, Dedicated Tax Revenue, 5.00%, 11/15/31(1) | | $ | 10,000 | | | $ | 11,110,400 | |
| | |
New York City Transitional Finance Authority, Future Tax Revenue, 4.00%, 8/1/41 | | | 3,750 | | | | 4,242,825 | |
| | | | | | | | |
| Security | | Principal
Amount
(000’s omitted) | | | Value | |
|
| Special Tax Revenue (continued) | |
| | |
New York City Transitional Finance Authority, Future Tax Revenue, 4.00%, 5/1/42 | | $ | 5,430 | | | $ | 6,117,492 | |
| | |
New York City Transitional Finance Authority, Future Tax Revenue, 4.00%, 8/1/42 | | | 2,100 | | | | 2,347,002 | |
| | |
New York City Transitional Finance Authority, Future Tax Revenue, 5.00%, 2/1/35(1) | | | 10,000 | | | | 10,467,000 | |
| | |
New York City Transitional Finance Authority, Future Tax Revenue, 5.50%, 11/1/35(1) | | | 845 | | | | 882,687 | |
| | |
New York City Transitional Finance Authority, Future Tax Revenue, Prerefunded to 11/1/20, 5.50%, 11/1/35(1) | | | 655 | | | | 685,575 | |
| | |
New York Dormitory Authority, Personal Income Tax Revenue, 5.00%, 6/15/31(1) | | | 9,250 | | | | 10,275,917 | |
| | |
New York Dormitory Authority, Personal Income Tax Revenue, 5.00%, 3/15/33 | | | 650 | | | | 683,053 | |
| | |
New York Dormitory Authority, Sales Tax Revenue, 5.00%, 3/15/34 | | | 7,620 | | | | 8,575,091 | |
| | |
New York Dormitory Authority, Sales Tax Revenue, 5.00%, 3/15/43(1) | | | 2,000 | | | | 2,434,860 | |
| | |
New York Thruway Authority, Miscellaneous Tax Revenue, Prerefunded to 4/1/20, 5.00%, 4/1/26 | | | 2,370 | | | | 2,414,035 | |
| | |
Sales Tax Asset Receivable Corp., 5.00%, 10/15/30(1) | | | 8,900 | | | | 10,455,809 | |
| | |
| | | | | | | $ | 70,691,746 | |
|
| Transportation — 14.1% | |
| | |
Metropolitan Transportation Authority, Green Bonds, 4.00%, 11/15/38 | | $ | 2,855 | | | $ | 3,194,402 | |
| | |
Nassau County Bridge Authority, 5.00%, 10/1/35 | | | 1,915 | | | | 1,983,653 | |
| | |
Nassau County Bridge Authority, 5.00%, 10/1/40 | | | 365 | | | | 377,790 | |
| | |
New York Thruway Authority, 4.00%, 1/1/36 | | | 2,500 | | | | 2,852,400 | |
| | |
New York Thruway Authority, 5.00%, 1/1/37 | | | 7,240 | | | | 7,810,078 | |
| | |
New York Transportation Development Corp., (LaGuardia Airport Terminal B Redevelopment), (AMT), 5.00%, 7/1/46 | | | 500 | | | | 553,810 | |
| | |
Port Authority of New York and New Jersey, 5.00%, 12/1/34(1) | | | 820 | | | | 939,810 | |
| | |
Port Authority of New York and New Jersey, 5.00%, 10/15/35(1) | | | 8,000 | | | | 9,538,800 | |
| | |
Port Authority of New York and New Jersey, 5.00%, 10/15/36(1) | | | 1,200 | | | | 1,471,824 | |
| | |
Port Authority of New York and New Jersey, (AMT), 4.00%, 9/1/43(1) | | | 5,000 | | | | 5,668,550 | |
| | |
| | | | | | | $ | 34,391,117 | |
|
| Water and Sewer — 6.9% | |
| | |
Albany Municipal Water Finance Authority, 5.00%, 12/1/26 | | $ | 755 | | | $ | 813,762 | |
| | |
Albany Municipal Water Finance Authority, 5.00%, 12/1/29 | | | 500 | | | | 538,355 | |
| | |
New York City Municipal Water Finance Authority, (Water and Sewer System), 5.00%, 6/15/46(1) | | | 2,000 | | | | 2,368,320 | |
| | | | |
| | 22 | | See Notes to Financial Statements. |
Eaton Vance
New York Municipal Bond Fund
September 30, 2019
Portfolio of Investments — continued
| | | | | | | | |
| Security | | Principal
Amount
(000’s omitted) | | | Value | |
|
| Water and Sewer (continued) | |
| | |
New York City Municipal Water Finance Authority, (Water and Sewer System), Prerefunded to 6/15/21,
5.00%, 6/15/44(1) | | $ | 8,750 | | | $ | 9,320,850 | |
| | |
Suffolk County Water Authority, 4.00%, 6/1/41 | | | 1,150 | | | | 1,306,791 | |
| | |
Suffolk County Water Authority, 5.00%, 6/1/36(1) | | | 2,000 | | | | 2,538,500 | |
| | |
| | | | | | | $ | 16,886,578 | |
| |
Total Tax-Exempt Investments — 161.7%
(identified cost $372,120,882) | | | $ | 395,088,897 | |
| |
Other Assets, Less Liabilities — (61.7)% | | | $ | (150,770,144 | ) |
| |
Net Assets — 100.0% | | | $ | 244,318,753 | |
The percentage shown for each investment category in the Portfolio of Investments is based on net assets.
The Fund invests primarily in debt securities issued by New York municipalities. The ability of the issuers of the debt securities to meet their obligations may be affected by economic developments in a specific industry or municipality. At September 30, 2019, 14.8% of total investments are backed by bond insurance of various financial institutions and financial guaranty assurance agencies. The aggregate percentage insured by an individual financial institution or financial guaranty assurance agency ranged from 0.1% to 7.5% of total investments.
| (1) | Security represents the municipal bond held by a trust that issues residual interest bonds (see Note 1G). |
| (2) | When-issued security. |
Abbreviations:
| | | | |
| | |
| AGC | | – | | Assured Guaranty Corp. |
| | |
| AGM | | – | | Assured Guaranty Municipal Corp. |
| | |
| AMBAC | | – | | AMBAC Financial Group, Inc. |
| | |
| AMT | | – | | Interest earned from these securities may be considered a tax preference item for purposes of the Federal Alternative Minimum Tax. |
| | |
| BHAC | | – | | Berkshire Hathaway Assurance Corp. |
| | |
| FHLMC | | – | | Federal Home Loan Mortgage Corp. |
| | |
| FNMA | | – | | Federal National Mortgage Association |
| | |
| GNMA | | – | | Government National Mortgage Association |
| | |
| NPFG | | – | | National Public Finance Guarantee Corp. |
| | | | |
| | 23 | | See Notes to Financial Statements. |
Eaton Vance
Municipal Bond Funds
September 30, 2019
Statements of Assets and Liabilities
| | | | | | | | | | | | |
| | | September 30, 2019 | |
| Assets | | Municipal Fund | | | California Fund | | | New York Fund | |
| | | |
Investments — | | | | | | | | | | | | |
| | | |
Identified cost | | $ | 1,746,795,904 | | | $ | 501,815,725 | | | $ | 372,120,882 | |
| | | |
Unrealized appreciation | | | 156,646,697 | | | | 37,584,319 | | | | 22,968,015 | |
| | | |
Investments, at value | | $ | 1,903,442,601 | | | $ | 539,400,044 | | | $ | 395,088,897 | |
| | | |
Interest receivable | | $ | 21,303,985 | | | $ | 5,348,500 | | | $ | 4,747,530 | |
| | | |
Receivable for investments sold | | | 15,555,000 | | | | 1,755,000 | | | | — | |
| | | |
Total assets | | $ | 1,940,301,586 | | | $ | 546,503,544 | | | $ | 399,836,427 | |
|
| Liabilities | |
| | | |
Payable for floating rate notes issued (net of unamortized deferred debt issuance costs of $0, $0 and $16,954, respectively) | | $ | 799,382,725 | | | $ | 230,234,220 | | | $ | 153,577,524 | |
| | | |
Due to broker for floating rate notes redeemed | | | 9,900,000 | | | | — | | | | — | |
| | | |
Payable for when-issued securities | | | 5,879,629 | | | | — | | | | 400,000 | |
| | | |
Due to custodian | | | 4,687,828 | | | | 451,313 | | | | 293,933 | |
| | | |
Payable to affiliate: | | | | | | | | | | | | |
| | | |
Investment adviser fee | | | 946,690 | | | | 268,528 | | | | 196,029 | |
| | | |
Interest expense and fees payable | | | 4,855,537 | | | | 1,104,438 | | | | 900,802 | |
| | | |
Accrued expenses | | | 413,444 | | | | 167,823 | | | | 149,386 | |
| | | |
Total liabilities | | $ | 826,065,853 | | | $ | 232,226,322 | | | $ | 155,517,674 | |
| | | |
Net Assets | | $ | 1,114,235,733 | | | $ | 314,277,222 | | | $ | 244,318,753 | |
|
| Sources of Net Assets | |
| | | |
Common shares, $0.01 par value, unlimited number of shares authorized | | $ | 797,265 | | | $ | 249,943 | | | $ | 181,183 | |
| | | |
Additional paid-in capital | | | 999,918,723 | | | | 311,794,508 | | | | 229,646,918 | |
| | | |
Distributable earnings | | | 113,519,745 | | | | 2,232,771 | | | | 14,490,652 | |
| | | |
Net Assets | | $ | 1,114,235,733 | | | $ | 314,277,222 | | | $ | 244,318,753 | |
| | | |
| Common Shares Outstanding | | | 79,726,520 | | | | 24,994,339 | | | | 18,118,294 | |
|
| Net Asset Value | |
| | | |
Net assets ÷ common shares issued and outstanding | | $ | 13.98 | | | $ | 12.57 | | | $ | 13.48 | |
| | | | |
| | 24 | | See Notes to Financial Statements. |
Eaton Vance
Municipal Bond Funds
September 30, 2019
Statements of Operations
| | | | | | | | | | | | |
| | | Year Ended September 30, 2019 | |
| Investment Income | | Municipal Fund | | | California Fund | | | New York Fund | |
| | | |
Interest | | $ | 68,257,531 | | | $ | 18,834,967 | | | $ | 14,085,942 | |
| | | |
Total investment income | | $ | 68,257,531 | | | $ | 18,834,967 | | | $ | 14,085,942 | |
|
| Expenses | |
| | | |
Investment adviser fee | | $ | 10,651,957 | | | $ | 3,101,350 | | | $ | 2,253,839 | |
| | | |
Trustees’ fees and expenses | | | 91,408 | | | | 28,558 | | | | 20,826 | |
| | | |
Custodian fee | | | 276,069 | | | | 106,585 | | | | 77,925 | |
| | | |
Transfer and dividend disbursing agent fees | | | 48,183 | | | | 22,694 | | | | 24,391 | |
| | | |
Legal and accounting services | | | 290,081 | | | | 93,228 | | | | 108,712 | |
| | | |
Printing and postage | | | 205,284 | | | | 26,021 | | | | 19,662 | |
| | | |
Interest expense and fees | | | 15,779,878 | | | | 4,719,501 | | | | 3,176,592 | |
| | | |
Miscellaneous | | | 149,651 | | | | 31,765 | | | | 31,209 | |
| | | |
Total expenses | | $ | 27,492,511 | | | $ | 8,129,702 | | | $ | 5,713,156 | |
| | | |
Net investment income | | $ | 40,765,020 | | | $ | 10,705,265 | | | $ | 8,372,786 | |
|
| Realized and Unrealized Gain (Loss) | |
| | | |
Net realized gain (loss) — | | | | | | | | | | | | |
| | | |
Investment transactions | | $ | 2,611,780 | | | $ | (766,200 | ) | | $ | (116,429 | ) |
| | | |
Financial futures contracts | | | (684,205 | ) | | | — | | | | — | |
| | | |
Net realized gain (loss) | | $ | 1,927,575 | | | $ | (766,200 | ) | | $ | (116,429 | ) |
| | | |
Change in unrealized appreciation (depreciation) — | | | | | | | | | | | | |
| | | |
Investments | | $ | 78,265,931 | | | $ | 21,249,394 | | | $ | 13,819,201 | |
| | | |
Financial futures contracts | | | (768,109 | ) | | | — | | | | — | |
| | | |
Net change in unrealized appreciation (depreciation) | | $ | 77,497,822 | | | $ | 21,249,394 | | | $ | 13,819,201 | |
| | | |
Net realized and unrealized gain | | $ | 79,425,397 | | | $ | 20,483,194 | | | $ | 13,702,772 | |
| | | |
Net increase in net assets from operations | | $ | 120,190,417 | | | $ | 31,188,459 | | | $ | 22,075,558 | |
| | | | |
| | 25 | | See Notes to Financial Statements. |
Eaton Vance
Municipal Bond Funds
September 30, 2019
Statements of Changes in Net Assets
| | | | | | | | | | | | |
| | | Year Ended September 30, 2019 | |
| Increase (Decrease) in Net Assets | | Municipal Fund | | | California Fund | | | New York Fund | |
| | | |
From operations — | | | | | | | | | | | | |
| | | |
Net investment income | | $ | 40,765,020 | | | $ | 10,705,265 | | | $ | 8,372,786 | |
| | | |
Net realized gain (loss) | | | 1,927,575 | | | | (766,200 | ) | | | (116,429 | ) |
| | | |
Net change in unrealized appreciation (depreciation) | | | 77,497,822 | | | | 21,249,394 | | | | 13,819,201 | |
| | | |
Net increase in net assets from operations | | $ | 120,190,417 | | | $ | 31,188,459 | | | $ | 22,075,558 | |
| | | |
Distributions to common shareholders | | $ | (39,757,451 | ) | | $ | (10,995,495 | ) | | $ | (8,681,059 | ) |
| | | |
Tax return of capital to common shareholders | | $ | — | | | $ | (498,023 | ) | | $ | (251,185 | ) |
| | | |
Capital share transactions — | | | | | | | | | | | | |
| | | |
Issued in connection with tax-free reorganizations (see Note 9) | | $ | 287,993,697 | | | $ | 46,853,792 | | | $ | 31,246,579 | |
| | | |
Cost of shares repurchased (see Note 5) | | | (16,221,641 | ) | | | (4,211,453 | ) | | | — | |
| | | |
Cost of shares repurchased in tender offer (see Note 5) | | | (119,959,604 | ) | | | — | | | | — | |
| | | |
Net increase in net assets from capital share transactions | | $ | 151,812,452 | | | $ | 42,642,339 | | | $ | 31,246,579 | |
| | | |
Net increase in net assets | | $ | 232,245,418 | | | $ | 62,337,280 | | | $ | 44,389,893 | |
|
| Net Assets | |
| | | |
At beginning of year | | $ | 881,990,315 | | | $ | 251,939,942 | | | $ | 199,928,860 | |
| | | |
At end of year | | $ | 1,114,235,733 | | | $ | 314,277,222 | | | $ | 244,318,753 | |
| | | | |
| | 26 | | See Notes to Financial Statements. |
Eaton Vance
Municipal Bond Funds
September 30, 2019
Statements of Changes in Net Assets — continued
| | | | | | | | | | | | |
| | | Year Ended September 30, 2018 | |
| Increase (Decrease) in Net Assets | | Municipal Fund | | | California Fund | | | New York Fund | |
| | | |
From operations — | | | | | | | | | | | | |
| | | |
Net investment income | | $ | 39,030,164 | | | $ | 10,305,471 | | | $ | 8,440,030 | |
| | | |
Net realized loss | | | (1,179,634 | ) | | | (1,802,114 | ) | | | (522,072 | ) |
| | | |
Net change in unrealized appreciation (depreciation) | | | (52,408,908 | ) | | | (11,981,311 | ) | | | (12,334,355 | ) |
| | | |
Net decrease in net assets from operations | | $ | (14,558,378 | ) | | $ | (3,477,954 | ) | | $ | (4,416,397 | ) |
| | | |
Distributions to common shareholders | | $ | (39,030,958 | ) | | $ | (10,928,233 | ) | | $ | (8,839,509 | ) |
| | | |
Tax return of capital to common shareholders | | $ | (1,072,424 | ) | | $ | — | | | $ | — | |
| | | |
Net decrease in net assets | | $ | (54,661,760 | ) | | $ | (14,406,187 | ) | | $ | (13,255,906 | ) |
|
| Net Assets | |
| | | |
At beginning of year | | $ | 936,652,075 | | | $ | 266,346,129 | | | $ | 213,184,766 | |
| | | |
At end of year | | $ | 881,990,315 | | | $ | 251,939,942 | | | $ | 199,928,860 | |
| | | | |
| | 27 | | See Notes to Financial Statements. |
Eaton Vance
Municipal Bond Funds
September 30, 2019
Statements of Cash Flows
| | | | | | | | | | | | |
| | | Year Ended September 30, 2019 | |
| Cash Flows From Operating Activities | | Municipal Fund | | | California Fund | | | New York Fund | |
| | | |
Net increase in net assets from operations | | $ | 120,190,417 | | | $ | 31,188,459 | | | $ | 22,075,558 | |
| | | |
Adjustments to reconcile net increase in net assets from operations to net cash provided by operating activities: | | | | | | | | | | | | |
| | | |
Investments purchased | | | (302,419,298 | ) | | | (102,056,933 | ) | | | (91,689,485 | ) |
| | | |
Investments sold | | | 403,876,959 | | | | 107,934,752 | | | | 103,637,917 | |
| | | |
Net amortization/accretion of premium (discount) | | | 1,323,119 | | | | 2,188,103 | | | | 1,806,057 | |
| | | |
Amortization of deferred debt issuance costs | | | — | | | | — | | | | 909 | |
| | | |
Decrease in interest receivable | | | 1,061,327 | | | | 363,337 | | | | 615,286 | |
| | | |
Decrease in receivable for variation margin on open financial futures contracts | | | 35,780 | | | | — | | | | — | |
| | | |
Decrease in receivable from affiliate | | | 104,204 | | | | — | | | | — | |
| | | |
Increase in payable to affiliate for investment adviser fee | | | 60,964 | | | | 28,558 | | | | 13,493 | |
| | | |
Increase (decrease) in interest expense and fees payable | | | 596,551 | | | | 32,652 | | | | (149,089 | ) |
| | | |
Decrease in accrued expenses | | | (199,537 | ) | | | (6,972 | ) | | | (15,066 | ) |
| | | |
Net change in unrealized (appreciation) depreciation from investments | | | (78,265,931 | ) | | | (21,249,394 | ) | | | (13,819,201 | ) |
| | | |
Net realized (gain) loss from investments | | | (2,611,780 | ) | | | 766,200 | | | | 116,429 | |
| | | |
Net cash provided by operating activities | | $ | 143,752,775 | | | $ | 19,188,762 | | | $ | 22,592,808 | |
|
| Cash Flows From Financing Activities | |
| | | |
Repurchase of common shares | | $ | (16,221,641 | ) | | $ | (4,211,453 | ) | | $ | — | |
| | | |
Repurchase of common shares in tender offer | | | (119,959,604 | ) | | | — | | | | — | |
| | | |
Cash distributions paid to common shareholders | | | (40,846,543 | ) | | | (11,631,095 | ) | | | (9,033,737 | ) |
| | | |
Increase (decrease) in due to custodian | | | 4,687,828 | | | | (1,194,221 | ) | | | 41,944 | |
| | | |
Proceeds from secured borrowings | | | 105,740,000 | | | | 18,600,000 | | | | 18,400,000 | |
| | | |
Repayment of secured borrowings | | | (86,055,000 | ) | | | (21,035,000 | ) | | | (32,700,000 | ) |
| | | |
Cash acquired in connection with tax-free reorganizations (see Note 9) | | | 8,194,491 | | | | 283,007 | | | | 698,985 | |
| | | |
Net cash used in financing activities | | $ | (144,460,469 | ) | | $ | (19,188,762 | ) | | $ | (22,592,808 | ) |
| | | |
Net decrease in cash | | $ | (707,694 | ) | | $ | — | | | $ | — | |
| | | |
Cash and restricted cash at beginning of year | | $ | 707,694 | (1) | | $ | — | | | $ | — | |
| | | |
Cash at end of year | | $ | — | | | $ | — | | | $ | — | |
|
| Supplemental disclosure of cash flow information: | |
| | | |
Noncash operating activities not included herein consist of: | | | | | | | | | | | | |
| | | |
Acquisition of net assets in connection with tax-free reorganizations (see Note 9), less cash acquired | | $ | 279,799,206 | | | $ | 46,570,785 | | | $ | 30,547,594 | |
| | | |
Noncash financing activities not included herein consist of: | | | | | | | | | | | | |
| | | |
Issuance of Fund shares in connection with tax-free reorganizations (see Note 9) | | $ | 287,993,697 | | | $ | 46,853,792 | | | $ | 31,246,579 | |
| | | |
Cash paid for interest and fees | | $ | 15,183,327 | | | $ | 4,686,849 | | | $ | 3,324,772 | |
| (1) | Includes cash of $180,994 and deposits for derivatives collateral — financial futures contracts of $526,700. |
| | | | |
| | 28 | | See Notes to Financial Statements. |
Eaton Vance
Municipal Bond Funds
September 30, 2019
Financial Highlights
| | | | | | | | | | | | | | | | | | | | |
| | | Municipal Fund | |
| |
| | | Year Ended September 30, | |
| | | 2019 | | | 2018 | | | 2017 | | | 2016 | | | 2015 | |
| | | | | |
Net asset value — Beginning of year | | $ | 12.940 | | | $ | 13.740 | | | $ | 14.480 | | | $ | 13.870 | | | $ | 13.940 | |
| | | | | |
| Income (Loss) From Operations | | | | | | | | | | | | | | | | | | | | |
| | | | | |
Net investment income(1) | | $ | 0.522 | | | $ | 0.573 | | | $ | 0.640 | | | $ | 0.706 | | | $ | 0.760 | |
| | | | | |
Net realized and unrealized gain (loss) | | | 0.982 | | | | (0.785 | ) | | | (0.739 | ) | | | 0.631 | | | | (0.064 | ) |
| | | | | |
Total income (loss) from operations | | $ | 1.504 | | | $ | (0.212 | ) | | $ | (0.099 | ) | | $ | 1.337 | | | $ | 0.696 | |
| | | | | |
| Less Distributions | | | | | | | | | | | | | | | | | | | | |
| | | | | |
From net investment income | | $ | (0.517 | ) | | $ | (0.572 | ) | | $ | (0.641 | ) | | $ | (0.727 | ) | | $ | (0.766 | ) |
| | | | | |
Tax return of capital | | | — | | | | (0.016 | ) | | | — | | | | — | | | | — | |
| | | | | |
Total distributions | | $ | (0.517 | ) | | $ | (0.588 | ) | | $ | (0.641 | ) | | $ | (0.727 | ) | | $ | (0.766 | ) |
| | | | | |
Anti-dilutive effect of share repurchase program (see Note 5)(1) | | $ | 0.022 | | | $ | — | | | $ | — | | | $ | — | | | $ | — | |
| | | | | |
Discount on tender offer (see Note 5)(1) | | $ | 0.031 | | | $ | — | | | $ | — | | | $ | — | | | $ | — | |
| | | | | |
Net asset value — End of year | | $ | 13.980 | | | $ | 12.940 | | | $ | 13.740 | | | $ | 14.480 | | | $ | 13.870 | |
| | | | | |
Market value — End of year | | $ | 12.960 | | | $ | 11.530 | | | $ | 12.680 | | | $ | 13.620 | | | $ | 12.510 | |
| | | | | |
Total Investment Return on Net Asset Value(2) | | | 12.72 | % | | | (1.09 | )% | | | (0.19 | )% | | | 10.19 | % | | | 5.69 | % |
| | | | | |
Total Investment Return on Market Value(2) | | | 17.28 | % | | | (4.50 | )% | | | (2.08 | )% | | | 14.91 | % | | | 6.14 | % |
| | | | | |
| Ratios/Supplemental Data | | | | | | | | | | | | | | | | | | | | |
| | | | | |
Net assets, end of year (000’s omitted) | | $ | 1,114,236 | | | $ | 881,990 | | | $ | 936,652 | | | $ | 987,016 | | | $ | 945,479 | |
| | | | | |
Ratios (as a percentage of average daily net assets): | | | | | | | | | | | | | | | | | | | | |
| | | | | |
Expenses excluding interest and fees(3) | | | 1.11 | % | | | 1.07 | % | | | 1.07 | % | | | 1.05 | % | | | 1.05 | % |
| | | | | |
Interest and fee expense(4) | | | 1.51 | % | | | 1.25 | % | | | 0.93 | % | | | 0.53 | % | | | 0.38 | % |
| | | | | |
Total expenses(3) | | | 2.62 | % | | | 2.32 | % | | | 2.00 | % | | | 1.58 | % | | | 1.43 | % |
| | | | | |
Net investment income | | | 3.89 | % | | | 4.29 | % | | | 4.67 | % | | | 4.92 | % | | | 5.43 | % |
| | | | | |
Portfolio Turnover | | | 18 | % | | | 17 | % | | | 6 | % | | | 18 | % | | | 5 | % |
| (1) | Computed using average shares outstanding. |
| (2) | Returns are historical and are calculated by determining the percentage change in net asset value or market value with all distributions reinvested. Distributions are assumed to be reinvested at prices obtained under the Fund’s dividend reinvestment plan. |
| (3) | Excludes the effect of custody fee credits, if any, of less than 0.005%. Effective September 1, 2015, custody fee credits, which were earned on cash deposit balances, were discontinued by the custodian. |
| (4) | Interest and fee expense relates to the liability for floating rate notes issued in conjunction with residual interest bond transactions (see Note 1G). |
| | | | |
| | 29 | | See Notes to Financial Statements. |
Eaton Vance
Municipal Bond Funds
September 30, 2019
Financial Highlights — continued
| | | | | | | | | | | | | | | | | | | | |
| | | California Fund | |
| |
| | | Year Ended September 30, | |
| | | 2019 | | | 2018 | | | 2017 | | | 2016 | | | 2015 | |
| | | | | |
Net asset value — Beginning of year | | $ | 11.780 | | | $ | 12.450 | | | $ | 13.050 | | | $ | 12.720 | | | $ | 12.900 | |
| | | | | |
| Income (Loss) From Operations | | | | | | | | | | | | | | | | | | | | |
| | | | | |
Net investment income(1) | | $ | 0.438 | | | $ | 0.482 | | | $ | 0.566 | | | $ | 0.637 | | | $ | 0.688 | |
| | | | | |
Net realized and unrealized gain (loss) | | | 0.802 | | | | (0.641 | ) | | | (0.582 | ) | | | 0.377 | | | | (0.184 | ) |
| | | | | |
Total income (loss) from operations | | $ | 1.240 | | | $ | (0.159 | ) | | $ | (0.016 | ) | | $ | 1.014 | | | $ | 0.504 | |
| | | | | |
| Less Distributions | | | | | | | | | | | | | | | | | | | | |
| | | | | |
From net investment income | | $ | (0.454 | ) | | $ | (0.511 | ) | | $ | (0.584 | ) | | $ | (0.684 | ) | | $ | (0.684 | ) |
| | | | | |
Tax return of capital | | | (0.020 | ) | | | — | | | | — | | | | — | | | | — | |
| | | | | |
Total distributions | | $ | (0.474 | ) | | $ | (0.511 | ) | | $ | (0.584 | ) | | $ | (0.684 | ) | | $ | (0.684 | ) |
| | | | | |
Anti-dilutive effect of share repurchase program (see Note 5)(1) | | $ | 0.024 | | | $ | — | | | $ | — | | | $ | — | | | $ | 0.000 | (2) |
| | | | | |
Net asset value — End of year | | $ | 12.570 | | | $ | 11.780 | | | $ | 12.450 | | | $ | 13.050 | | | $ | 12.720 | |
| | | | | |
Market value — End of year | | $ | 11.330 | | | $ | 9.960 | | | $ | 12.040 | | | $ | 13.560 | | | $ | 11.630 | |
| | | | | |
Total Investment Return on Net Asset Value(3) | | | 11.54 | % | | | (0.79 | )% | | | 0.27 | % | | | 8.22 | % | | | 4.46 | % |
| | | | | |
Total Investment Return on Market Value(3) | | | 18.91 | % | | | (13.26 | )% | | | (6.67 | )% | | | 22.99 | % | | | 8.55 | % |
| | | | | |
| Ratios/Supplemental Data | | | | | | | | | | | | | | | | | | | | |
| | | | | |
Net assets, end of year (000’s omitted) | | $ | 314,277 | | | $ | 251,940 | | | $ | 266,346 | | | $ | 279,281 | | | $ | 272,045 | |
| | | | | |
Ratios (as a percentage of average daily net assets): | | | | | | | | | | | | | | | | | | | | |
| | | | | |
Expenses excluding interest and fees(4) | | | 1.15 | % | | | 1.16 | % | | | 1.15 | % | | | 1.13 | % | | | 1.11 | % |
| | | | | |
Interest and fee expense(5) | | | 1.59 | % | | | 1.41 | % | | | 1.01 | % | | | 0.58 | % | | | 0.40 | % |
| | | | | |
Total expenses(4) | | | 2.74 | % | | | 2.57 | % | | | 2.16 | % | | | 1.71 | % | | | 1.51 | % |
| | | | | |
Net investment income | | | 3.61 | % | | | 3.99 | % | | | 4.55 | % | | | 4.89 | % | | | 5.36 | % |
| | | | | |
Portfolio Turnover | | | 17 | % | | | 24 | % | | | 19 | % | | | 12 | % | | | 7 | % |
| (1) | Computed using average shares outstanding. |
| (2) | Amount is less than $0.0005. |
| (3) | Returns are historical and are calculated by determining the percentage change in net asset value or market value with all distributions reinvested. Distributions are assumed to be reinvested at prices obtained under the Fund’s dividend reinvestment plan. |
| (4) | Excludes the effect of custody fee credits, if any, of less than 0.005%. Effective September 1, 2015, custody fee credits, which were earned on cash deposit balances, were discontinued by the custodian. |
| (5) | Interest and fee expense relates to the liability for floating rate notes issued in conjunction with residual interest bond transactions (see Note 1G). |
| | | | |
| | 30 | | See Notes to Financial Statements. |
Eaton Vance
Municipal Bond Funds
September 30, 2019
Financial Highlights — continued
| | | | | | | | | | | | | | | | | | | | |
| | | New York Fund | |
| |
| | | Year Ended September 30, | |
| | | 2019 | | | 2018 | | | 2017 | | | 2016 | | | 2015 | |
| | | | | |
Net asset value — Beginning of year | | $ | 12.770 | | | $ | 13.610 | | | $ | 14.290 | | | $ | 13.940 | | | $ | 14.040 | |
| | | | | |
| Income (Loss) From Operations | | | | | | | | | | | | | | | | | | | | |
| | | | | |
Net investment income(1) | | $ | 0.476 | | | $ | 0.539 | | | $ | 0.599 | | | $ | 0.666 | | | $ | 0.716 | |
| | | | | |
Net realized and unrealized gain (loss) | | | 0.745 | | | | (0.815 | ) | | | (0.661 | ) | | | 0.402 | | | | (0.100 | ) |
| | | | | |
Total income (loss) from operations | | $ | 1.221 | | | $ | (0.276 | ) | | $ | (0.062 | ) | | $ | 1.068 | | | $ | 0.616 | |
| | | | | |
| Less Distributions | | | | | | | | | | | | | | | | | | | | |
| | | | | |
From net investment income | | $ | (0.497 | ) | | $ | (0.564 | ) | | $ | (0.618 | ) | | $ | (0.718 | ) | | $ | (0.718 | ) |
| | | | | |
Tax return of capital | | | (0.014 | ) | | | — | | | | — | | | | — | | | | — | |
| | | | | |
Total distributions | | $ | (0.511 | ) | | $ | (0.564 | ) | | $ | (0.618 | ) | | $ | (0.718 | ) | | $ | (0.718 | ) |
| | | | | |
Anti-dilutive effect of share repurchase program (see Note 5)(1) | | $ | — | | | $ | — | | | $ | — | | | $ | — | | | $ | 0.002 | |
| | | | | |
Net asset value — End of year | | $ | 13.480 | | | $ | 12.770 | | | $ | 13.610 | | | $ | 14.290 | | | $ | 13.940 | |
| | | | | |
Market value — End of year | | $ | 12.440 | | | $ | 11.060 | | | $ | 12.930 | | | $ | 14.320 | | | $ | 12.600 | |
| | | | | |
Total Investment Return on Net Asset Value(2) | | | 10.25 | % | | | (1.50 | )% | | | 0.02 | % | | | 8.01 | % | | | 5.07 | % |
| | | | | |
Total Investment Return on Market Value(2) | | | 17.47 | % | | | (10.20 | )% | | | (5.18 | )% | | | 19.75 | % | | | 8.14 | % |
| | | | | |
| Ratios/Supplemental Data | | | | | | | | | | | | | | | | | | | | |
| | | | | |
Net assets, end of year (000’s omitted) | | $ | 244,319 | | | $ | 199,929 | | | $ | 213,185 | | | $ | 223,810 | | | $ | 218,282 | |
| | | | | |
Ratios (as a percentage of average daily net assets): | | | | | | | | | | | | | | | | | | | | |
| | | | | |
Expenses excluding interest and fees(3) | | | 1.10 | % | | | 1.19 | % | | | 1.22 | % | | | 1.18 | % | | | 1.20 | % |
| | | | | |
Interest and fee expense(4) | | | 1.38 | % | | | 1.35 | % | | | 0.94 | % | | | 0.53 | % | | | 0.37 | % |
| | | | | |
Total expenses(3) | | | 2.48 | % | | | 2.54 | % | | | 2.16 | % | | | 1.71 | % | | | 1.57 | % |
| | | | | |
Net investment income | | | 3.63 | % | | | 4.10 | % | | | 4.41 | % | | | 4.66 | % | | | 5.11 | % |
| | | | | |
Portfolio Turnover | | | 25 | % | | | 15 | % | | | 10 | % | | | 11 | % | | | 5 | % |
| (1) | Computed using average shares outstanding. |
| (2) | Returns are historical and are calculated by determining the percentage change in net asset value or market value with all distributions reinvested. Distributions are assumed to be reinvested at prices obtained under the Fund’s dividend reinvestment plan. |
| (3) | Excludes the effect of custody fee credits, if any, of less than 0.005%. Effective September 1, 2015, custody fee credits, which were earned on cash deposit balances, were discontinued by the custodian. |
| (4) | Interest and fee expense relates to the liability for floating rate notes issued in conjunction with residual interest bond transactions (see Note 1G). |
| | | | |
| | 31 | | See Notes to Financial Statements. |
Eaton Vance
Municipal Bond Funds
September 30, 2019
Notes to Financial Statements
1 Significant Accounting Policies
Eaton Vance Municipal Bond Fund (Municipal Fund), Eaton Vance California Municipal Bond Fund (California Fund) and Eaton Vance New York Municipal Bond Fund (New York Fund), (each individually referred to as the Fund, and collectively, the Funds), are Massachusetts business trusts registered under the Investment Company Act of 1940, as amended (the 1940 Act), as non-diversified, closed-end management investment companies. Prior to April 24, 2019, the Funds’ investment objective was to provide current income exempt from regular federal income tax, including alternative minimum tax (AMT), and, in state specific funds, taxes in its specified state and city (if any). Effective April 24, 2019, each Fund’s investment objective was revised to eliminate references to the AMT; however, each Fund will continue to invest at least 80% of its net assets in municipal obligations which are exempt from the AMT.
The following is a summary of significant accounting policies of the Funds. The policies are in conformity with accounting principles generally accepted in the United States of America (U.S. GAAP). Each Fund is an investment company and follows accounting and reporting guidance in the Financial Accounting Standards Board (FASB) Accounting Standards Codification Topic 946.
A Investment Valuation — The following methodologies are used to determine the market value or fair value of investments.
Debt Obligations. Debt obligations are generally valued on the basis of valuations provided by third party pricing services, as derived from such services’ pricing models. Inputs to the models may include, but are not limited to, reported trades, executable bid and ask prices, broker/dealer quotations, prices or yields of securities with similar characteristics, interest rates, anticipated prepayments, benchmark curves or information pertaining to the issuer, as well as industry and economic events. The pricing services may use a matrix approach, which considers information regarding securities with similar characteristics to determine the valuation for a security. Short-term debt obligations purchased with a remaining maturity of sixty days or less for which a valuation from a third party pricing service is not readily available may be valued at amortized cost, which approximates fair value.
Derivatives. Financial futures contracts are valued at the closing settlement price established by the board of trade or exchange on which they are traded.
Fair Valuation. Investments for which valuations or market quotations are not readily available or are deemed unreliable are valued at fair value using methods determined in good faith by or at the direction of the Trustees of a Fund in a manner that most fairly reflects the security’s “fair value”, which is the amount that a Fund might reasonably expect to receive for the security upon its current sale in the ordinary course. Each such determination is based on a consideration of relevant factors, which are likely to vary from one pricing context to another. These factors may include, but are not limited to, the type of security, the existence of any contractual restrictions on the security’s disposition, the price and extent of public trading in similar securities of the issuer or of comparable companies or entities, quotations or relevant information obtained from broker/dealers or other market participants, information obtained from the issuer, analysts, and/or the appropriate stock exchange (for exchange-traded securities), an analysis of the company’s or entity’s financial statements, and an evaluation of the forces that influence the issuer and the market(s) in which the security is purchased and sold.
B Investment Transactions and Related Income — Investment transactions for financial statement purposes are accounted for on a trade date basis. Realized gains and losses on investments sold are determined on the basis of identified cost. Interest income is recorded on the basis of interest accrued, adjusted for amortization of premium or accretion of discount.
C Federal Taxes — Each Fund’s policy is to comply with the provisions of the Internal Revenue Code applicable to regulated investment companies and to distribute to shareholders each year substantially all of its taxable, if any, and tax-exempt net investment income, and all or substantially all of its net realized capital gains. Accordingly, no provision for federal income or excise tax is necessary. Each Fund intends to satisfy conditions which will enable it to designate distributions from the interest income generated by its investments in municipal obligations, which are exempt from regular federal income tax when received by each Fund, as exempt-interest dividends.
As of September 30, 2019, the Funds had no uncertain tax positions that would require financial statement recognition, de-recognition, or disclosure. Each Fund files a U.S. federal income tax return annually after its fiscal year-end, which is subject to examination by the Internal Revenue Service for a period of three years from the date of filing.
D Legal Fees — Legal fees and other related expenses incurred as part of negotiations of the terms and requirement of capital infusions, or that are expected to result in the restructuring of, or a plan of reorganization for, an investment are recorded as realized losses. Ongoing expenditures to protect or enhance an investment are treated as operating expenses.
E Use of Estimates — The preparation of the financial statements in conformity with U.S. GAAP requires management to make estimates and assumptions that affect the reported amounts of assets and liabilities at the date of the financial statements and the reported amounts of income and expense during the reporting period. Actual results could differ from those estimates.
F Indemnifications — Under each Fund’s organizational documents, its officers and Trustees may be indemnified against certain liabilities and expenses arising out of the performance of their duties to each Fund. Under Massachusetts law, if certain conditions prevail, shareholders of a Massachusetts business trust (such as a Fund) could be deemed to have personal liability for the obligations of the Fund. However, each Fund’s Declaration of Trust contains an express disclaimer of liability on the part of Fund shareholders and the By-laws provide that the Fund shall assume, upon request by the shareholder, the defense on behalf of any Fund shareholders. Moreover, the By-laws also provide for indemnification out of Fund property of any shareholder held personally liable solely by reason of being or having been a shareholder for all loss or expense arising from such liability. Additionally, in
Eaton Vance
Municipal Bond Funds
September 30, 2019
Notes to Financial Statements — continued
the normal course of business, each Fund enters into agreements with service providers that may contain indemnification clauses. Each Fund’s maximum exposure under these arrangements is unknown as this would involve future claims that may be made against each Fund that have not yet occurred.
G Floating Rate Notes Issued in Conjunction with Securities Held — The Funds may invest in residual interest bonds, also referred to as inverse floating rate securities, whereby a Fund may sell a variable or fixed rate bond for cash to a Special-Purpose Vehicle (the SPV), (which is generally organized as a trust), while at the same time, buying a residual interest in the assets and cash flows of the SPV. The bond is deposited into the SPV with the same CUSIP number as the bond sold to the SPV by the Fund, and which may have been, but is not required to be, the bond purchased from the Fund (the Bond). The SPV also issues floating rate notes (Floating Rate Notes) which are sold to third-parties. The residual interest bond held by a Fund gives the Fund the right (1) to cause the holders of the Floating Rate Notes to generally tender their notes at par, and (2) to have the Bond held by the SPV transferred to the Fund, thereby terminating the SPV. Should the Fund exercise such right, it would generally pay the SPV the par amount due on the Floating Rate Notes and exchange the residual interest bond for the underlying Bond. Pursuant to generally accepted accounting principles for transfers and servicing of financial assets and extinguishment of liabilities, the Funds account for the transaction described above as a secured borrowing by including the Bond in their Portfolio of Investments and the Floating Rate Notes (net of unamortized deferred debt issuance costs, if any) as a liability under the caption “Payable for floating rate notes issued” in their Statement of Assets and Liabilities. The Floating Rate Notes have interest rates that generally reset weekly and their holders have the option to tender their notes to the SPV for redemption at par at each reset date. Accordingly, the fair value of the payable for floating rate notes issued approximates its carrying value. If measured at fair value, the payable for floating rate notes would have been considered as Level 2 in the fair value hierarchy (see Note 8) at September 30, 2019. Interest expense related to a Fund’s liability with respect to Floating Rate Notes is recorded as incurred. The SPV may be terminated by the Fund, as noted above, or by the occurrence of certain termination events as defined in the trust agreement, such as a downgrade in the credit quality of the underlying Bond, bankruptcy of or payment failure by the issuer of the underlying Bond, the inability to remarket Floating Rate Notes that have been tendered due to insufficient buyers in the market, or the failure by the SPV to obtain renewal of the liquidity agreement under which liquidity support is provided for the Floating Rate Notes up to one year. Structuring fees paid to the liquidity provider upon the creation of an SPV are recorded as debt issuance costs and are being amortized as interest expense to the expected maturity of the related trust. Unamortized structuring fees related to a terminated SPV are recorded as a realized loss on extinguishment of debt. At September 30, 2019, the amounts of the Funds’ Floating Rate Notes and related interest rates and collateral were as follows:
| | | | | | | | | | | | |
| | | Municipal Fund | | | California Fund | | | New York
Fund | |
| | | |
Floating Rate Notes Outstanding | | $ | 799,382,725 | | | $ | 230,234,220 | | | $ | 153,594,478 | |
| | | |
Interest Rate or Range of Interest Rates (%) | | | 1.43 - 1.88 | | | | 1.52 - 1.70 | | | | 1.58 - 1.66 | |
| | | |
Collateral for Floating Rate Notes Outstanding | | $ | 1,123,474,429 | | | $ | 327,729,450 | | | $ | 208,188,796 | |
For the year ended September 30, 2019, the Funds’ average settled Floating Rate Notes outstanding and the average interest rate including fees and amortization of deferred debt issuance costs were as follows:
| | | | | | | | | | | | |
| | | Municipal Fund | | | California Fund | | | New York Fund | |
| | | |
Average Floating Rate Notes Outstanding | | $ | 726,327,192 | | | $ | 222,469,712 | | | $ | 145,793,781 | |
| | | |
Average Interest Rate | | | 2.17 | % | | | 2.12 | % | | | 2.18 | % |
In certain circumstances, the Funds may enter into shortfall and forbearance agreements with brokers by which a Fund agrees to reimburse the broker for the difference between the liquidation value of the Bond held by the SPV and the liquidation value of the Floating Rate Notes, as well as any shortfalls in interest cash flows. The Funds had no shortfalls as of September 30, 2019.
The Funds may also purchase residual interest bonds in a secondary market transaction without first owning the underlying bond. Such transactions are not required to be treated as secured borrowings. Shortfall agreements, if any, related to residual interest bonds purchased in a secondary market transaction are disclosed in the Portfolio of Investments.
The Funds’ investment policies and restrictions expressly permit investments in residual interest bonds. Such bonds typically offer the potential for yields exceeding the yields available on fixed rate bonds with comparable credit quality and maturity. These securities tend to underperform the market for fixed rate bonds in a rising long-term interest rate environment, but tend to outperform the market for fixed rate bonds when long-term interest rates decline. The value and income of residual interest bonds are generally more volatile than that of a fixed rate bond. The Funds’ investment policies do not allow the Funds to borrow money except as permitted by the 1940 Act. Management believes that the Funds’ restrictions on borrowing money and issuing senior securities (other than as specifically permitted) do not apply to Floating Rate Notes issued by the SPV and included as a liability in the Funds’ Statement of Assets and Liabilities. As secured indebtedness issued by an SPV, Floating Rate Notes are distinct from the borrowings and senior securities to which the Funds’ restrictions apply. Residual interest bonds held by the Funds are securities exempt from registration under Rule 144A of the Securities Act of 1933.
Eaton Vance
Municipal Bond Funds
September 30, 2019
Notes to Financial Statements — continued
H Financial Futures Contracts — Upon entering into a financial futures contract, a Fund is required to deposit with the broker, either in cash or securities, an amount equal to a certain percentage of the contract amount (initial margin). Subsequent payments, known as variation margin, are made or received by the Fund each business day, depending on the daily fluctuations in the value of the underlying security, and are recorded as unrealized gains or losses by the Fund. Gains (losses) are realized upon the expiration or closing of the financial futures contracts. Should market conditions change unexpectedly, the Fund may not achieve the anticipated benefits of the financial futures contracts and may realize a loss. Futures contracts have minimal counterparty risk as they are exchange traded and the clearinghouse for the exchange is substituted as the counterparty, guaranteeing counterparty performance.
I When-Issued Securities and Delayed Delivery Transactions — The Funds may purchase or sell securities on a delayed delivery or when-issued basis. Payment and delivery may take place after the customary settlement period for that security. At the time the transaction is negotiated, the price of the security that will be delivered is fixed. The Funds maintain cash and/or security positions for these commitments such that sufficient liquid assets will be available to make payments upon settlement. Securities purchased on a delayed delivery or when-issued basis are marked-to-market daily and begin earning interest on settlement date. Losses may arise due to changes in the market value of the underlying securities or if the counterparty does not perform under the contract.
J New Accounting Pronouncement — During the year ended September 30, 2019, the Funds adopted the FASB’s Accounting Standards Update No. 2016-18 “Statement of Cash Flows (Topic 230), Restricted Cash, a consensus of the FASB’s Emerging Issues Task Force” (ASU 2016-18), which became effective for fiscal years beginning after December 15, 2017 and interim periods within those fiscal years. Pursuant to the new standard, the Funds are required to include amounts described as restricted cash and restricted cash equivalents with cash and cash equivalents when reconciling the beginning-of-period and end-of-period total amounts shown on their Statement of Cash Flows. Prior to the change, such amounts were disclosed separately within their Statement of Cash Flows. This change in accounting had no impact on the Funds’ net assets.
2 Distributions to Shareholders and Income Tax Information
Each Fund intends to make monthly distributions of net investment income to common shareholders. In addition, at least annually, each Fund intends to distribute all or substantially all of its net realized capital gains. Distributions are recorded on the ex-dividend date. Distributions to shareholders are determined in accordance with income tax regulations, which may differ from U.S. GAAP. As required by U.S. GAAP, only distributions in excess of tax basis earnings and profits are reported in the financial statements as a return of capital. Permanent differences between book and tax accounting relating to distributions are reclassified to paid-in capital. For tax purposes, distributions from short-term capital gains are considered to be from ordinary income.
The tax character of distributions declared for the years ended September 30, 2019 and September 30, 2018 was as follows:
| | | | | | | | | | | | |
| | | Year Ended September 30, 2019 | |
| | | Municipal Fund | | | California Fund | | | New York Fund | |
| | | |
Tax-exempt income | | $ | 39,748,285 | | | $ | 10,995,495 | | | $ | 8,681,059 | |
| | | |
Ordinary income | | $ | 9,166 | | | $ | — | | | $ | — | |
| | | |
Tax return of capital | | $ | — | | | $ | 498,023 | | | $ | 251,185 | |
| |
| | | Year Ended September 30, 2018 | |
| | | Municipal Fund | | | California Fund | | | New York Fund | |
| | | |
Tax-exempt income | | $ | 39,030,958 | | | $ | 10,926,086 | | | $ | 8,839,509 | |
| | | |
Ordinary income | | $ | — | | | $ | 2,147 | | | $ | — | |
| | | |
Tax return of capital | | $ | 1,072,424 | | | $ | — | | | $ | — | |
During the year ended September 30, 2019, the following amounts were reclassified due to expired capital loss carryforwards.
| | | | | | | | | | | | |
| | | Municipal Fund | | | California Fund | | | New York Fund | |
| | | |
Change in: | | | | | | | | | | | | |
| | | |
Paid-in capital | | $ | (16,458,561 | ) | | $ | (7,665,266 | ) | | $ | (6,463,209 | ) |
| | | |
Distributable earnings | | $ | 16,458,561 | | | $ | 7,665,266 | | | $ | 6,463,209 | |
Eaton Vance
Municipal Bond Funds
September 30, 2019
Notes to Financial Statements — continued
These reclassifications had no effect on the net assets or net asset value per share of the Funds.
As of September 30, 2019, the components of distributable earnings (accumulated loss) on a tax basis were as follows:
| | | | | | | | | | | | |
| | | Municipal Fund | | | California Fund | | | New York Fund | |
| | | |
Undistributed tax-exempt income | | $ | 941,700 | | | $ | — | | | $ | — | |
| | | |
Deferred capital losses | | $ | (44,490,964 | ) | | $ | (34,632,979 | ) | | $ | (8,645,787 | ) |
| | | |
Net unrealized appreciation | | $ | 157,069,009 | | | $ | 36,865,750 | | | $ | 23,136,439 | |
At September 30, 2019, the following Funds, for federal income tax purposes, had deferred capital losses which would reduce the respective Fund’s taxable income arising from future net realized gains on investment transactions, if any, to the extent permitted by the Internal Revenue Code, and thus would reduce the amount of distributions to shareholders, which would otherwise be necessary to relieve the Funds of any liability for federal income or excise tax. The deferred capital losses are treated as arising on the first day of a Fund’s next taxable year, retaining the same short-term or long-term character as when originally deferred. The amounts of the deferred capital losses are as follows:
| | | | | | | | | | | | |
| | | Municipal Fund | | | California Fund | | | New York Fund | |
| | | |
Deferred capital losses: | | | | | | | | | | | | |
| | | |
Short-term | | $ | 39,814,966 | | | $ | 14,681,260 | | | $ | 6,243,465 | |
| | | |
Long-term | | $ | 4,675,998 | | | $ | 19,951,719 | | | $ | 2,402,322 | |
Included in the amounts above are deferred capital losses as a result of the reorganizations during the year ended September 30, 2019 (see Note 9). Utilization of these deferred capital losses may be limited in accordance with certain income tax regulations. The amounts of the deferred capital losses are as follows:
| | | | | | | | | | | | |
| | | Municipal
Fund | | | California Fund | | | New York Fund | |
| | | |
Deferred capital losses from reorganizations: | | | | | | | | | | | | |
| | | |
Short-term | | $ | 5,197,423 | | | $ | 2,708,254 | | | $ | 1,553,735 | |
| | | |
Long-term | | $ | 4,675,998 | | | $ | 2,346,701 | | | $ | 449,772 | |
The cost and unrealized appreciation (depreciation) of investments of each Fund at September 30, 2019, as determined on a federal income tax basis, were as follows:
| | | | | | | | | | | | |
| | | Municipal Fund | | | California Fund | | | New York Fund | |
| | | |
Aggregate cost | | $ | 946,990,867 | | | $ | 272,300,074 | | | $ | 218,357,980 | |
| | | |
Gross unrealized appreciation | | $ | 157,072,124 | | | $ | 36,865,750 | | | $ | 23,319,573 | |
| | | |
Gross unrealized depreciation | | | (3,115 | ) | | | — | | | | (183,134 | ) |
| | | |
Net unrealized appreciation | | $ | 157,069,009 | | | $ | 36,865,750 | | | $ | 23,136,439 | |
3 Investment Adviser Fee and Other Transactions with Affiliates
The investment adviser fee is earned by Eaton Vance Management (EVM) as compensation for investment advisory services rendered to each Fund. Pursuant to the investment advisory agreement and a subsequent fee reduction agreement between each Fund and EVM, the fee is calculated at an annual rate of 0.60% of each Fund’s average weekly gross assets. The fee reductions cannot be terminated without the consent of a majority of Trustees and a majority of shareholders. Average weekly gross assets include the principal amount of any indebtedness for money borrowed, including debt securities issued by a Fund. Pursuant to a fee reduction agreement between each Fund and EVM, average weekly gross assets are calculated by adding to net assets the amount payable by the Fund to floating rate note holders, such adjustment being limited to the value of the Auction Preferred Shares (APS) outstanding
Eaton Vance
Municipal Bond Funds
September 30, 2019
Notes to Financial Statements — continued
prior to any APS redemptions by the Fund. The investment adviser fee is payable monthly. EVM also serves as the administrator of each Fund, but receives no compensation. For the year ended September 30, 2019, the investment adviser fees were as follows:
| | | | | | | | | | | | |
| | | Municipal Fund | | | California Fund | | | New York Fund | |
| | | |
Investment Adviser Fee | | $ | 10,651,957 | | | $ | 3,101,350 | | | $ | 2,253,839 | |
Trustees and officers of the Funds who are members of EVM’s organization receive remuneration for their services to the Funds out of the investment adviser fee. Trustees of the Funds who are not affiliated with EVM may elect to defer receipt of all or a percentage of their annual fees in accordance with the terms of the Trustees Deferred Compensation Plan. For the year ended September 30, 2019, no significant amounts have been deferred. Certain officers and Trustees of the Funds are officers of EVM.
4 Purchases and Sales of Investments
Purchases and sales of investments, other than short-term obligations, for the year ended September 30, 2019 were as follows:
| | | | | | | | | | | | |
| | | Municipal Fund | | | California Fund | | | New York Fund | |
| | | |
Purchases | | $ | 308,298,927 | | | $ | 88,859,084 | | | $ | 91,536,405 | |
| | | |
Sales | | $ | 392,782,891 | | | $ | 103,489,752 | | | $ | 103,637,917 | |
5 Common Shares of Beneficial Interest
The Funds may issue common shares pursuant to their dividend reinvestment plans. There were no common shares issued by the Funds for the years ended September 30, 2019 and September 30, 2018 pursuant to such plans.
In November 2013, the Board of Trustees initially approved a share repurchase program for the Funds. Pursuant to the reauthorization of the share repurchase program by the Board of Trustees in March 2019, each Fund is authorized to repurchase up to 10% of its common shares outstanding as of the last day of the prior calendar year at market prices when shares are trading at a discount to net asset value (NAV). The share repurchase program does not obligate a Fund to purchase a specific amount of shares. During the year ended September 30, 2019, the number, cost (including brokerage commissions), average price per share and weighted average discount per share to NAV of common shares repurchased, were as follows:
| | | | | | | | |
| | | Year ended September 30, 2019 | |
| | | Municipal Fund | | | California Fund | |
| | |
Common shares repurchased | | | 1,326,880 | | | | 387,540 | |
| | |
Cost, including brokerage commissions, of common shares repurchased | | $ | 16,221,641 | | | $ | 4,211,453 | |
| | |
Average price per share | | $ | 12.23 | | | $ | 10.87 | |
| | |
Weighted average discount per share to NAV | | | 9.45 | % | | | 12.17 | % |
There were no repurchases of common shares by the Funds for the year ended September 30, 2018.
On March 27, 2019, Municipal Fund announced that its Board of Trustees approved a cash tender offer for up to 10% of its outstanding common shares at a price equal to 98% of the Fund’s net asset value per share as of the close of regular trading on the New York Stock Exchange on the date the tender offer expires. On April 18, 2019, Municipal Fund commenced a cash tender offer for 8,969,613 of its outstanding shares. The tender offer expired at 5:00 P.M. on May 17, 2019.
In accordance with the terms and conditions of the tender offer, because the number of shares tendered exceeded the number of shares offered to purchase, Municipal Fund purchased shares from tendering shareholders on a pro-rata basis (disregarding fractional shares). The purchase price of the properly tendered shares was equal to $13.374 per share for an aggregate purchase price of $119,959,604.
The Board of Trustees also authorized the Fund to conduct two conditional cash tender offers, for up to 5% of the Fund’s outstanding common shares at a price equal to 98% of the Fund’s net asset value per share as of the close of regular trading on the New York Stock Exchange on the date the tender offer
Eaton Vance
Municipal Bond Funds
September 30, 2019
Notes to Financial Statements — continued
expires, to follow the initial tender offer, which expired May 17, 2019, provided certain conditions are met. As of October 1, 2019, the terms of the first conditional tender offer were met. On November 14, 2019, Municipal Fund commenced a cash tender offer for up to 5% or 3,986,326 of its outstanding common shares at a price per share equal to 98% of Municipal Fund’s net asset value per share as of the close of regular trading on the New York Stock Exchange on the date the tender offer expires. The tender offer expires at 5:00 P.M. Eastern Time on December 13, 2019, unless the offer is extended.
In addition, Municipal Fund, California Fund and New York Fund issued 21,854,763 shares, 3,987,531 shares and 2,456,514 shares, respectively, in connection with the reorganizations described below in Note 9 during the year ended September 30, 2019.
At September 30, 2019, one shareholder owned 12.4% of the outstanding shares of Municipal Fund.
6 Overdraft Advances
Pursuant to the custodian agreement, State Street Bank and Trust Company (SSBT) may, in its discretion, advance funds to the Funds to make properly authorized payments. When such payments result in an overdraft, the Funds are obligated to repay SSBT at the current rate of interest charged by SSBT for secured loans (currently, the Federal Funds rate plus 2%). This obligation is payable on demand to SSBT. SSBT has a lien on a Fund’s assets to the extent of any overdraft. At September 30, 2019, the Municipal Fund, California Fund and New York Fund had a payment due to SSBT pursuant to the foregoing arrangement of $4,687,828, $451,313 and $293,933, respectively. Based on the short-term nature of these payments and the variable interest rate, the carrying value of the overdraft advances approximated its fair value at September 30, 2019. If measured at fair value, overdraft advances would have been considered as Level 2 in the fair value hierarchy (see Note 8) at September 30, 2019. The Funds’ average overdraft advances during the year ended September 30, 2019 were not significant.
7 Financial Instruments
The Funds may trade in financial instruments with off-balance sheet risk in the normal course of their investing activities. These financial instruments may include financial futures contracts and may involve, to a varying degree, elements of risk in excess of the amounts recognized for financial statement purposes. The notional or contractual amounts of these instruments represent the investment a Fund has in particular classes of financial instruments and do not necessarily represent the amounts potentially subject to risk. The measurement of the risks associated with these instruments is meaningful only when all related and offsetting transactions are considered. At September 30, 2019, there were no obligations outstanding under these financial instruments.
Each Fund is subject to interest rate risk in the normal course of pursuing its investment objective. Because the Funds hold fixed-rate bonds, the value of these bonds may decrease if interest rates rise. During the year ended September 30, 2019, Municipal Fund entered into U.S. Treasury futures contracts to hedge against changes in interest rates.
The effect of derivative instruments (not considered to be hedging instruments for accounting disclosure purposes) on the Statement of Operations and whose primary underlying risk exposure is interest rate risk for the year ended September 30, 2019 was as follows:
| | | | |
| | | Municipal
Fund | |
| |
Realized Gain (Loss) on Derivatives Recognized in Income | | $ | (684,205 | )(1) |
| |
Change in Unrealized Appreciation (Depreciation) on Derivatives Recognized in Income | | $ | (768,109 | )(2) |
| (1) | Statement of Operations location: Net realized gain (loss) – Financial futures contracts. |
| (2) | Statement of Operations location: Change in unrealized appreciation (depreciation) – Financial futures contracts. |
The average notional cost of futures contracts (short) outstanding during the year ended September 30, 2019, which is indicative of the volume of this derivative type, was approximately $9,970,000 for Municipal Fund.
8 Fair Value Measurements
Under generally accepted accounting principles for fair value measurements, a three-tier hierarchy to prioritize the assumptions, referred to as inputs, is used in valuation techniques to measure fair value. The three-tier hierarchy of inputs is summarized in the three broad levels listed below.
| • | | Level 1 – quoted prices in active markets for identical investments |
| • | | Level 2 – other significant observable inputs (including quoted prices for similar investments, interest rates, prepayment speeds, credit risk, etc.) |
| • | | Level 3 – significant unobservable inputs (including a fund’s own assumptions in determining the fair value of investments) |
Eaton Vance
Municipal Bond Funds
September 30, 2019
Notes to Financial Statements — continued
In cases where the inputs used to measure fair value fall in different levels of the fair value hierarchy, the level disclosed is determined based on the lowest level input that is significant to the fair value measurement in its entirety. The inputs or methodology used for valuing securities are not necessarily an indication of the risk associated with investing in those securities.
At September 30, 2019, the hierarchy of inputs used in valuing the Funds’ investments, which are carried at value, were as follows:
| | | | | | | | | | | | | | | | |
Municipal Fund | |
| Asset Description | | Level 1 | | | Level 2 | | | Level 3 | | | Total | |
| | | | |
Tax-Exempt Municipal Securities | | $ | — | | | $ | 1,899,018,826 | | | $ | — | | | $ | 1,899,018,826 | |
| | | | |
Trust Units | | | — | | | | 46,066 | | | | — | | | | 46,066 | |
| | | | |
Corporate Bonds & Notes | | | — | | | | 4,377,709 | | | | — | | | | 4,377,709 | |
| | | | |
Total Investments | | $ | — | | | $ | 1,903,442,601 | | | $ | — | | | $ | 1,903,442,601 | |
|
California Fund | |
| Asset Description | | Level 1 | | | Level 2 | | | Level 3 | | | Total | |
| | | | |
Tax-Exempt Investments | | $ | — | | | $ | 539,400,044 | | | $ | — | | | $ | 539,400,044 | |
| | | | |
Total Investments | | $ | — | | | $ | 539,400,044 | | | $ | — | | | $ | 539,400,044 | |
|
New York Fund | |
| Asset Description | | Level 1 | | | Level 2 | | | Level 3 | | | Total | |
| | | | |
Tax-Exempt Investments | | $ | — | | | $ | 395,088,897 | | | $ | — | | | $ | 395,088,897 | |
| | | | |
Total Investments | | $ | — | | | $ | 395,088,897 | | | $ | — | | | $ | 395,088,897 | |
9 Reorganizations
Municipal Fund
During the year ended September 30, 2019, Municipal Fund acquired the net assets of Eaton Vance Massachusetts Municipal Bond Fund (Massachusetts Fund), Eaton Vance Michigan Municipal Bond Fund (Michigan Fund), Eaton Vance New Jersey Municipal Bond Fund (New Jersey Fund), Eaton Vance Ohio Municipal Bond Fund (Ohio Fund), Eaton Vance Pennsylvania Municipal Bond Fund (Pennsylvania Fund) and Eaton Vance Municipal Bond Fund II (Municipal Fund II), (collectively, the “Acquired Funds”), pursuant to Agreements and Plans of Reorganization (each, a “Plan”) approved by the respective shareholders of the Acquired Funds. Under the terms of each Plan, the common shares of each Acquired Fund were, in effect, exchanged for new common shares of Municipal Fund with an equal aggregate net asset value. The purpose of each reorganization was to combine two funds managed by EVM with similar investment objectives and policies. Each reorganization was structured as a tax-free reorganization under the Internal Revenue Code.
The net assets and shares outstanding of each Acquired Fund as of the close of business on the closing date of each reorganization and the number of shares issued in each reorganization by Municipal Fund were as follows:
| | | | | | | | | | | | | | |
| Closing Date | | Acquired Fund | | Acquired Fund
Shares Outstanding | | | Acquired Fund
Net Assets | | | Municipal Fund
Shares Issued | |
| | | | |
December 14, 2018 | | Massachusetts Fund | | | 1,768,514 | | | $ | 25,238,430 | | | | 1,951,416 | |
| | | | |
December 14, 2018 | | Michigan Fund | | | 1,500,065 | | | $ | 21,836,875 | | | | 1,688,410 | |
| | | | |
January 18, 2019 | | New Jersey Fund | | | 2,579,166 | | | $ | 35,868,539 | | | | 2,745,404 | |
| | | | |
January 18, 2019 | | Ohio Fund | | | 2,537,940 | | | $ | 33,611,079 | | | | 2,572,612 | |
| | | | |
January 18, 2019 | | Pennsylvania Fund | | | 2,960,040 | | | $ | 40,019,819 | | | | 3,063,142 | |
| | | | |
March 22, 2019 | | Municipal Fund II | | | 10,013,381 | | | $ | 131,418,955 | | | | 9,833,779 | |
Eaton Vance
Municipal Bond Funds
September 30, 2019
Notes to Financial Statements — continued
The investment portfolios of the Acquired Funds were the principal assets acquired by Municipal Fund. For financial reporting purposes, assets received and shares issued by Municipal Fund were recorded at fair value; however, the identified cost of the investments received from the Acquired Funds were carried forward to align ongoing reporting of Municipal Fund’s realized and unrealized gains and losses with amounts distributable to shareholders for tax purposes.
Investments and net assets immediately before each reorganization and combined net assets were as follows:
| | | | | | | | | | | | | | | | | | | | |
| | | Acquired Fund | | | Municipal Fund | | | | |
| | | Investments,
at value | | | Investments,
at cost | | | Net Assets | | | Net Assets | | | Combined
Net Assets | |
| | | | | |
Massachusetts Fund | | $ | 38,996,775 | | | $ | 37,519,639 | | | $ | 25,238,430 | | | | | | | | | |
| | | | | |
Michigan Fund | | $ | 34,639,956 | | | $ | 33,730,348 | | | $ | 21,836,875 | | | | | | | | | |
| | | | | |
| | $ | 73,636,731 | | | $ | 71,249,987 | | | $ | 47,075,305 | | | $ | 877,422,524 | | | $ | 924,497,829 | |
| | | | | |
New Jersey Fund | | $ | 53,601,739 | | | $ | 51,263,517 | | | $ | 35,868,539 | | | | | | | | | |
| | | | | |
Ohio Fund | | $ | 52,616,041 | | | $ | 49,737,600 | | | $ | 33,611,079 | | | | | | | | | |
| | | | | |
Pennsylvania Fund | | $ | 62,673,308 | | | $ | 60,814,048 | | | $ | 40,019,819 | | | | | | | | | |
| | | | | |
| | $ | 168,891,088 | | | $ | 161,815,165 | | | $ | 109,499,437 | | | $ | 933,895,461 | | | $ | 1,043,394,898 | |
| | | | | |
Municipal Fund II | | $ | 205,943,186 | | | $ | 193,716,216 | | | $ | 131,418,955 | | | $ | 1,067,281,699 | | | $ | 1,198,700,654 | |
Included in net assets of the Acquired Funds immediately before each reorganization were accumulated net realized gain (loss) and unrealized appreciation (depreciation) as follows:
| | | | | | | | |
| | | Accumulated
Net Realized
Gain (Loss) | | | Unrealized
Appreciation
(Depreciation) | |
| | |
Massachusetts Fund | | $ | (193,263 | ) | | $ | 1,477,136 | |
| | |
Michigan Fund | | $ | 38,536 | | | $ | 909,608 | |
| | |
New Jersey Fund | | $ | (1,550 | ) | | $ | 2,338,222 | |
| | |
Ohio Fund | | $ | 107,900 | | | $ | 2,878,441 | |
| | |
Pennsylvania Fund | | $ | (1,646,291 | ) | | $ | 1,859,260 | |
| | |
Municipal Fund II | | $ | (8,689,724 | ) | | $ | 12,226,970 | |
Assuming each reorganization had been completed on October 1, 2018, the beginning of Municipal Fund’s annual reporting period, Municipal Fund’s pro forma results of operations for the year ended September 30, 2019 are as follows:
| | | | |
| | |
Net investment income | | $ | 44,715,266 | |
| |
Net realized and unrealized gain | | $ | 85,302,373 | |
| |
Net increase in net assets from operations | | $ | 130,017,639 | |
Because the combined investment portfolios have been managed as a single integrated portfolio since the closings of the reorganizations, it is not practicable to separate the amounts of revenue and earnings of each Acquired Fund that have been included in Municipal Fund’s Statement of Operations since the time of each closing.
California Fund
At the close of business on December 14, 2018, California Fund acquired the net assets of Eaton Vance California Municipal Bond Fund II (California Fund II) pursuant to an Agreement and Plan of Reorganization (the “Plan”) approved by shareholders of California Fund II. Under the terms of the Plan, the common shares of California Fund II were, in effect, exchanged for new common shares of California Fund with an equal aggregate net asset value. The purpose of the reorganization was to combine two funds managed by EVM with substantially similar investment objectives and policies. The reorganization was structured as a tax-free reorganization under the Internal Revenue Code.
Eaton Vance
Municipal Bond Funds
September 30, 2019
Notes to Financial Statements — continued
The net assets and shares outstanding of California Fund II as of the close of business on December 14, 2018 and the number of shares issued in the reorganization by California Fund were as follows:
| | | | | | | | | | |
| | | California Fund II | | | California Fund | |
| | | Shares Outstanding | | Net Assets | | | Shares Issued | |
| | | |
| | | 3,886,356 | | $ | 46,853,792 | | | | 3,987,531 | |
The investment portfolio of California Fund II, with a fair value of $79,072,648 and identified cost of $76,841,447 was the principal asset acquired by California Fund. For financial reporting purposes, assets received and shares issued by California Fund were recorded at fair value; however, the identified cost of the investments received from California Fund II was carried forward to align ongoing reporting of California Fund’s realized and unrealized gains and losses with amounts distributable to shareholders for tax purposes. The aggregate net assets of California Fund immediately before the reorganization were $251,386,702. The net assets of California Fund II at that date of $46,853,792, including $5,045,990 of accumulated net realized losses and $2,231,201 of unrealized appreciation, were combined with those of California Fund, resulting in combined net assets of $298,240,494.
Assuming the reorganization had been completed on October 1, 2018, the beginning of California Fund’s annual reporting period, California Fund’s pro forma results of operations for the year ended September 30, 2019 are as follows:
| | | | |
| | |
Net investment income | | $ | 11,021,853 | |
| |
Net realized and unrealized gain | | $ | 20,231,175 | |
| |
Net increase in net assets from operations | | $ | 31,253,028 | |
Because the combined investment portfolios have been managed as a single integrated portfolio since the reorganization was completed, it is not practicable to separate the amounts of revenue and earnings of California Fund II that have been included in California Fund’s Statement of Operations since December 14, 2018.
New York Fund
At the close of business on December 14, 2018, New York Fund acquired the net assets of Eaton Vance New York Municipal Bond Fund II (New York Fund II) pursuant to an Agreement and Plan of Reorganization (the “Plan”) approved by shareholders of New York Fund II. Under the terms of the Plan, the common shares of New York Fund II were, in effect, exchanged for new common shares of New York Fund with an equal aggregate net asset value. The purpose of the reorganization was to combine two funds managed by EVM with substantially similar investment objectives and policies. The reorganization was structured as a tax-free reorganization under the Internal Revenue Code.
The net assets and shares outstanding of New York Fund II as of the close of business on December 14, 2018 and the number of shares issued in the reorganization by New York Fund were as follows:
| | | | | | | | | | |
| | | New York Fund II | | | New York Fund | |
| | | Shares Outstanding | | Net Assets | | | Shares Issued | |
| | | |
| | | 2,556,510 | | $ | 31,246,579 | | | | 2,456,514 | |
The investment portfolio of New York Fund II, with a fair value of $53,007,450 and identified cost of $51,991,914 was the principal asset acquired by New York Fund. For financial reporting purposes, assets received and shares issued by New York Fund were recorded at fair value; however, the identified cost of the investments received from New York Fund II was carried forward to align ongoing reporting of New York Fund’s realized and unrealized gains and losses with amounts distributable to shareholders for tax purposes. The aggregate net assets of New York Fund immediately before the reorganization were $199,216,655. The net assets of New York Fund II at that date of $31,246,579, including $1,942,265 of accumulated net realized losses and $1,015,536 of unrealized appreciation, were combined with those of New York Fund, resulting in combined net assets of $230,463,234.
Eaton Vance
Municipal Bond Funds
September 30, 2019
Notes to Financial Statements — continued
Assuming the reorganization had been completed on October 1, 2018, the beginning of New York Fund’s annual reporting period, New York Fund’s pro forma results of operations for the year ended September 30, 2019 are as follows:
| | | | |
| | |
Net investment income | | $ | 8,566,062 | |
| |
Net realized and unrealized gain | | $ | 13,775,428 | |
| |
Net increase in net assets from operations | | $ | 22,341,490 | |
Because the combined investment portfolios have been managed as a single integrated portfolio since the reorganization was completed, it is not practicable to separate the amounts of revenue and earnings of New York Fund II that have been included in New York Fund’s Statement of Operations since December 14, 2018.
Eaton Vance
Municipal Bond Funds
September 30, 2019
Report of Independent Registered Public Accounting Firm
To the Trustees and Shareholders of Eaton Vance Municipal Bond Fund, Eaton Vance California Municipal Bond Fund and Eaton Vance New York Municipal Bond Fund:
Opinion on the Financial Statements and Financial Highlights
We have audited the accompanying statements of assets and liabilities of Eaton Vance Municipal Bond Fund, Eaton Vance California Municipal Bond Fund and Eaton Vance New York Municipal Bond Fund (collectively, the “Funds”), including the portfolios of investments, as of September 30, 2019, the related statements of operations and cash flows for the year then ended, the statements of changes in net assets for each of the two years in the period then ended, the financial highlights for each of the five years in the period then ended, and the related notes. In our opinion, the financial statements and financial highlights present fairly, in all material respects, the financial positions of the Funds as of September 30, 2019, and the results of their operations and their cash flows for the year then ended, the changes in their net assets for each of the two years in the period then ended, and the financial highlights for each of the five years in the period then ended, in conformity with accounting principles generally accepted in the United States of America.
Basis for Opinion
These financial statements and financial highlights are the responsibility of the Funds’ management. Our responsibility is to express an opinion on the Funds’ financial statements and financial highlights based on our audits. We are a public accounting firm registered with the Public Company Accounting Oversight Board (United States) (PCAOB) and are required to be independent with respect to the Funds in accordance with the U.S. federal securities laws and the applicable rules and regulations of the Securities and Exchange Commission and the PCAOB.
We conducted our audits in accordance with the standards of the PCAOB. Those standards require that we plan and perform the audit to obtain reasonable assurance about whether the financial statements and financial highlights are free of material misstatement, whether due to error or fraud. The Funds are not required to have, nor were we engaged to perform, an audit of their internal control over financial reporting. As part of our audits we are required to obtain an understanding of internal control over financial reporting but not for the purpose of expressing an opinion on the effectiveness of the Funds’ internal control over financial reporting. Accordingly, we express no such opinion.
Our audits included performing procedures to assess the risks of material misstatement of the financial statements and financial highlights, whether due to error or fraud, and performing procedures that respond to those risks. Such procedures included examining, on a test basis, evidence regarding the amounts and disclosures in the financial statements and financial highlights. Our audits also included evaluating the accounting principles used and significant estimates made by management, as well as evaluating the overall presentation of the financial statements and financial highlights. Our procedures included confirmation of securities owned as of September 30, 2019, by correspondence with the custodian and brokers; when replies were not received from brokers, we performed other auditing procedures. We believe that our audits provide a reasonable basis for our opinion.
/s/ Deloitte & Touche LLP
Boston, Massachusetts
November 18, 2019
We have served as the auditor of one or more Eaton Vance investment companies since 1959.
Eaton Vance
Municipal Bond Funds
September 30, 2019
Federal Tax Information (Unaudited)
The Form 1099-DIV you receive in February 2020 will show the tax status of all distributions paid to your account in calendar year 2019. Shareholders are advised to consult their own tax adviser with respect to the tax consequences of their investment in the Funds. As required by the Internal Revenue Code and/or regulations, shareholders must be notified regarding exempt-interest dividends.
Exempt-Interest Dividends. For the fiscal year ended September 30, 2019, the Funds designate the following percentages of distributions from net investment income as exempt-interest dividends:
| | | | |
| |
Municipal Bond Fund | | | 99.98 | % |
| |
California Municipal Bond Fund | | | 95.67 | % |
| |
New York Municipal Bond Fund | | | 97.19 | % |
Eaton Vance
Municipal Bond Funds
September 30, 2019
Annual Meeting of Shareholders (Unaudited)
Each Fund held its Annual Meeting of Shareholders on July 18, 2019. The following action was taken by the shareholders:
Item 1. The election of Thomas E. Faust Jr., Cynthia E. Frost and Scott E. Wennerholm as Class II Trustees of each Fund for a three-year term expiring in 2022.
| | | | | | | | | | | | |
| | | Nominee for Class II Trustee Elected by All Shareholders: Thomas E. Faust Jr. | | | Nominee for Class II Trustee Elected by All Shareholders: Cynthia E. Frost | | | Nominee for Class II Trustee Elected by All Shareholders: Scott E. Wennerholm | |
| | | |
California Fund | | | | | | | | | | | | |
| | | |
For | | | 21,143,749 | | | | 21,183,814 | | | | 21,235,288 | |
| | | |
Withheld | | | 2,743,591 | | | | 2,703,526 | | | | 2,652,052 | |
| | | |
Municipal Fund | | | | | | | | | | | | |
| | | |
For | | | 80,236,169 | | | | 80,340,311 | | | | 76,910,782 | |
| | | |
Withheld | | | 1,541,917 | | | | 1,437,775 | | | | 4,867,304 | |
| | | |
New York Fund | | | | | | | | | | | | |
| | | |
For | | | 16,120,366 | | | | 16,236,330 | | | | 16,079,735 | |
| | | |
Withheld | | | 1,017,619 | | | | 901,655 | | | | 1,058,250 | |
Eaton Vance
Municipal Bond Funds
September 30, 2019
Dividend Reinvestment Plan
Each Fund offers a dividend reinvestment plan (Plan) pursuant to which shareholders may elect to have distributions automatically reinvested in common shares (Shares) of the Fund. You may elect to participate in the Plan by completing the Dividend Reinvestment Plan Application Form. If you do not participate, you will receive all distributions in cash paid by check mailed directly to you by American Stock Transfer & Trust Company, LLC (AST) as dividend paying agent. On the distribution payment date, if the NAV per Share is equal to or less than the market price per Share plus estimated brokerage commissions, then new Shares will be issued. The number of Shares shall be determined by the greater of the NAV per Share or 95% of the market price. Otherwise, Shares generally will be purchased on the open market by AST, the Plan agent (Agent). Distributions subject to income tax (if any) are taxable whether or not Shares are reinvested.
If your Shares are in the name of a brokerage firm, bank, or other nominee, you can ask the firm or nominee to participate in the Plan on your behalf. If the nominee does not offer the Plan, you will need to request that the Fund’s transfer agent re-register your Shares in your name or you will not be able to participate.
The Agent’s service fee for handling distributions will be paid by the Fund. Plan participants will be charged their pro rata share of brokerage commissions on all open-market purchases.
Plan participants may withdraw from the Plan at any time by writing to the Agent at the address noted on the following page. If you withdraw, you will receive Shares in your name for all Shares credited to your account under the Plan. If a participant elects by written notice to the Agent to sell part or all of his or her Shares and remit the proceeds, the Agent is authorized to deduct a $5.00 fee plus brokerage commissions from the proceeds.
If you wish to participate in the Plan and your Shares are held in your own name, you may complete the form on the following page and deliver it to the Agent. Any inquiries regarding the Plan can be directed to the Agent at 1-866-439-6787.
Eaton Vance
Municipal Bond Funds
September 30, 2019
Application for Participation in Dividend Reinvestment Plan
This form is for shareholders who hold their common shares in their own names. If your common shares are held in the name of a brokerage firm, bank, or other nominee, you should contact your nominee to see if it will participate in the Plan on your behalf. If you wish to participate in the Plan, but your brokerage firm, bank, or nominee is unable to participate on your behalf, you should request that your common shares be re-registered in your own name which will enable your participation in the Plan.
The following authorization and appointment is given with the understanding that I may terminate it at any time by terminating my participation in the Plan as provided in the terms and conditions of the Plan.
Please print exact name on account
Shareholder signature Date
Shareholder signature Date
Please sign exactly as your common shares are registered. All persons whose names appear on the share certificate must sign.
YOU SHOULD NOT RETURN THIS FORM IF YOU WISH TO RECEIVE YOUR DISTRIBUTIONS IN CASH. THIS IS NOT A PROXY.
This authorization form, when signed, should be mailed to the following address:
Eaton Vance Municipal Bond Funds
c/o American Stock Transfer & Trust Company, LLC
P.O. Box 922
Wall Street Station
New York, NY 10269-0560
Eaton Vance
Municipal Bond Funds
September 30, 2019
Board of Trustees’ Contract Approval
Overview of the Contract Review Process
The Investment Company Act of 1940, as amended (the “1940 Act”), provides, in substance, that the investment advisory agreement between a fund and its investment adviser will continue in effect from year-to-year only if its continuation is approved on an annual basis by a vote of the fund’s board of trustees, including a majority of the trustees who are not “interested persons” of the fund (“independent trustees”), cast in person at a meeting called for the purpose of considering such approval.
At a meeting held on April 24, 2019, the Boards of Trustees/Directors (collectively, the “Board”) of the registered investment companies advised by Eaton Vance Management or its affiliate, Boston Management and Research (the “Eaton Vance Funds”), including a majority of the independent trustees (the “Independent Trustees”), voted to approve the continuation of existing investment advisory and sub-advisory agreements for each of the Eaton Vance Funds for an additional one-year period. In voting its approval, the Board relied upon the affirmative recommendation of its Contract Review Committee, which is a committee exclusively comprised of Independent Trustees. Prior to making its recommendation, the Contract Review Committee reviewed information furnished by the adviser and sub-adviser (where applicable) to each of the Eaton Vance Funds (including information specifically requested by the Board) for a series of meetings held between February and April 2019. Members of the Contract Review Committee also considered information received at prior meetings of the Board and its committees, to the extent such information was relevant to the Contract Review Committee’s annual evaluation of the investment advisory and sub-advisory agreements.
Among other things, the information the Board considered included the following (for funds that invest through one or more underlying portfolios, references to “each fund” in this section may include information that was considered at the portfolio-level):
Information about Fees, Performance and Expenses
| | • | | A report from an independent data provider comparing advisory and related fees paid by each fund to such fees paid by comparable funds, as identified by the independent data provider (“comparable funds”); |
| | • | | A report from an independent data provider comparing each fund’s total expense ratio (and its components) to those of comparable funds; |
| | • | | A report from an independent data provider comparing the investment performance of each fund (including, where relevant, yield data, Sharpe ratios and information ratios) to the investment performance of comparable funds over various time periods; |
| | • | | Data regarding investment performance relative to benchmark indices and, in certain instances, to customized groups of peer funds and blended indices identified by the adviser in consultation with the Portfolio Management Committee of the Board; |
| | • | | Comparative information concerning the fees charged and services provided by the adviser and sub-adviser (where applicable) to each fund in managing other accounts (including mutual funds, other collective investment funds and institutional accounts) using investment strategies and techniques similar to those used in managing such fund(s), if any; |
| | • | | Profitability analyses with respect to the adviser and sub-adviser (where applicable) to each of the funds; |
Information about Portfolio Management and Trading
| | • | | Descriptions of the investment management services provided to each fund, as well as each of the funds’ investment strategies and policies; |
| | • | | The procedures and processes used to determine the fair value of fund assets, when necessary, and actions taken to monitor and test the effectiveness of such procedures and processes; |
| | • | | Information about the policies and practices of each fund’s adviser and sub-adviser (where applicable and in the context of a sub-adviser with trading responsibilities) with respect to trading, including their processes for seeking best execution of portfolio transactions; |
| | • | | Information about the allocation of brokerage transactions and the benefits, if any, received by the adviser and sub-adviser (where applicable and in the context of a sub-adviser with trading responsibilities) to each fund as a result of brokerage allocation, including information concerning the acquisition of research through client commission arrangements and policies with respect to “soft dollars”; |
| | • | | Data relating to the portfolio turnover rate of each fund; |
Information about each Adviser and Sub-adviser
| | • | | Reports detailing the financial results and condition of the adviser and sub-adviser (where applicable) to each fund; |
| | • | | Information regarding the individual investment professionals whose responsibilities include portfolio management and investment research for the funds, and, for portfolio managers and certain other investment professionals, information relating to their responsibilities with respect to managing other mutual funds and investment accounts, if applicable; |
| | • | | The Code of Ethics of the adviser and its affiliates and the sub-adviser (where applicable) of each fund, together with information relating to compliance with, and the administration of, such codes; |
| | • | | Policies and procedures relating to proxy voting and the handling of corporate actions and class actions; |
| | • | | Information concerning the resources devoted to compliance efforts undertaken by the adviser and its affiliates and the sub-adviser (where applicable) of each fund, if any, including descriptions of their various compliance programs and their record of compliance; |
| | • | | Information concerning the business continuity and disaster recovery plans of the adviser and its affiliates and the sub-adviser (where applicable) of each fund, if any; |
Eaton Vance
Municipal Bond Funds
September 30, 2019
Board of Trustees’ Contract Approval — continued
| | • | | A description of Eaton Vance Management’s and Boston Management and Research’s oversight of sub-advisers, including with respect to regulatory and compliance issues, investment management and other matters; |
Other Relevant Information
| | • | | Information concerning the nature, cost and character of the administrative and other non-investment advisory services provided by Eaton Vance Management and its affiliates; |
| | • | | Information concerning management of the relationship with the custodian, subcustodians and fund accountants by the adviser or administrator to each of the funds; and |
| | • | | The terms of each investment advisory agreement. |
During the various meetings of the Board and its committees throughout the twelve months ended April 2019, the Trustees received information from portfolio managers and other investment professionals of the advisers and sub-advisers (where applicable) of the funds regarding investment and performance matters, and considered various investment and trading strategies used in pursuing the funds’ investment objectives. The Trustees also received information regarding risk management techniques employed in connection with the management of the funds. The Board and its Committees evaluated issues pertaining to industry and regulatory developments, compliance procedures, fund governance and other issues with respect to the funds, and received and participated in reports and presentations provided by Eaton Vance Management, Boston Management and Research and fundsub-advisers (as applicable), with respect to such matters. In addition to the formal meetings of the Board and its committees, the Independent Trustees held regular teleconferences to discuss, among other topics, matters relating to the continuation of investment advisory and sub-advisory agreements.
The Contract Review Committee was advised throughout the contract review process by Goodwin Procter LLP, independent legal counsel for the Independent Trustees. The members of the Contract Review Committee, with the advice of such counsel, exercised their own business judgment in determining the material factors to be considered in evaluating each investment advisory and sub-advisory agreement and the weight to be given to each such factor. The conclusions reached with respect to each investment advisory and sub-advisory agreement were based on a comprehensive evaluation of all the information provided and not any single factor. Moreover, each member of the Contract Review Committee may have placed varying emphasis on particular factors in reaching conclusions with respect to each investment advisory and sub-advisory agreement. In evaluating each investment advisory and sub-advisory agreement, including the fee structures and other terms contained in such agreements, the members of the Contract Review Committee were also informed by multiple years of analysis and discussion with the adviser and sub-adviser (where applicable) to each of the Eaton Vance Funds.
Results of the Process
Based on its consideration of the foregoing, and such other information as it deemed relevant, including the factors and conclusions described below, the Contract Review Committee concluded that the continuation of the investment advisory agreements between each of the following funds:
| | • | | Eaton Vance Municipal Bond Fund |
| | • | | Eaton Vance California Municipal Bond Fund |
| | • | | Eaton Vance New York Municipal Bond Fund |
(the “Funds”) and Eaton Vance Management (the “Adviser”), including their respective fee structures, are in the interests of shareholders and, therefore, recommended to the Board approval of each agreement. Based on the recommendation of the Contract Review Committee, the Board, including a majority of the Independent Trustees, voted to approve continuation of the investment advisory agreement for each Fund.
Nature, Extent and Quality of Services
In considering whether to approve the investment advisory agreements for the Funds, the Board evaluated the nature, extent and quality of services provided to the Funds by the Adviser.
The Board considered the Adviser’s management capabilities and investment processes in light of the types of investments held by each Fund, including the education, experience and number of investment professionals and other personnel who provide portfolio management, investment research, and similar services to the Funds. In particular, the Board considered the abilities and experience of the Adviser’s investment professionals in analyzing factors such as credit risk, tax efficiency, and special considerations relevant to investing in municipal bonds. The Board considered the Adviser’s municipal bond team, which includes investment professionals and credit specialists who provide services to the Funds. The Board also took into account the resources dedicated to portfolio management and other services, the compensation methods of the Adviser and other factors, including the reputation and resources of the Adviser to recruit and retain highly qualified research, advisory and supervisory investment professionals. In addition, the Board considered the time and attention devoted to the Eaton Vance Funds, including each Fund, by senior management, as well as the infrastructure, operational capabilities and support staff in place to assist in the portfolio management and operations of the Funds, including the provision of administrative services. The Board also considered the business-related and other risks to which the Adviser or its affiliates may be subject in managing the Funds.
Eaton Vance
Municipal Bond Funds
September 30, 2019
Board of Trustees’ Contract Approval — continued
The Board considered the compliance programs of the Adviser and relevant affiliates thereof. The Board considered compliance and reporting matters regarding, among other things, personal trading by investment professionals, disclosure of portfolio holdings, late trading, frequent trading, portfolio valuation, business continuity and the allocation of investment opportunities. The Board also considered the responses of the Adviser and its affiliates to requests in recent years from regulatory authorities, such as the Securities and Exchange Commission and the Financial Industry Regulatory Authority.
The Board considered shareholder and other administrative services provided or managed by Eaton Vance Management and its affiliates, including transfer agency and accounting services. The Board evaluated the benefits to shareholders of investing in a fund that is a part of a large fund complex offering exposure to a variety of asset classes and investment disciplines.
After consideration of the foregoing factors, among others, the Board concluded that the nature, extent and quality of services provided by the Adviser, taken as a whole, are appropriate and consistent with the terms of the investment advisory agreements.
Fund Performance
The Board compared each Fund’s investment performance to that of comparable funds and appropriate benchmark indices and assessed each Fund’s performance on the basis of total return and current income return. The Board’s review included comparative performance data with respect to each Fund for the one-, three-, five- and ten-year periods ended September 30, 2018.
In this regard, the Board noted each Fund’s performance relative to its peer group and benchmark index for the three-year period, as follows:
| | | | | | | | |
| Fund | | Performance Relative to: | |
| | Median of Peers | | | Index | |
| | |
Eaton Vance Municipal Bond Fund | | | Lower | | | | Higher | |
| | |
Eaton Vance California Municipal Bond Fund | | | Lower | | | | Lower | |
| | |
Eaton Vance New York Municipal Bond Fund | | | Lower | | | | Lower | |
The Board considered, among other things, the Adviser’s efforts to generate competitive levels of tax-exempt current income over time through investments that, relative to comparable funds, focus on higher quality municipal bonds with longer maturities. With respect to Eaton Vance Municipal Bond Fund, based on its review of performance over multiple periods and other relevant information provided by the Adviser, the Board concluded that the performance of such Fund was satisfactory. With respect to Eaton Vance California Municipal Bond Fund and Eaton Vance New York Municipal Bond Fund, the Board considered information from the Adviser regarding the reasons for each Fund’s performance relative to their respective comparable funds and benchmark indices. The Board noted that each Fund’s investment strategy requires the Fund to invest, during normal market conditions, at least 80% of the Fund’s assets in high grade (rated A or better) municipal obligations. The Board noted that this higher quality bias, as well as security selection, detracted from each Fund’s relative performance. The Board also noted information from the Adviser regarding recent improvements in Eaton Vance California Municipal Bond Fund’s relative performance.
Management Fees and Expenses
The Board considered contractual fee rates payable by each Fund for advisory and administrative services (referred to collectively as “management fees”). As part of its review, the Board considered each Fund’s management fees and total expense ratio for the one-year period ended September 30, 2018, as compared to those of comparable funds, before and after giving effect to any undertaking to waive fees or reimburse expenses. The Board also considered factors that had an impact on each Fund’s total expense ratio relative to comparable funds, and, with respect to Eaton Vance California Municipal Bond Fund and Eaton Vance New York Municipal Bond Fund, certain factors identified by management in response to inquiries from the Contract Review Committee regarding each Fund’s total expense ratio relative to comparable funds.
After considering the foregoing information, and in light of the nature, extent and quality of the services provided by the Adviser, the Board concluded that the management fees charged for advisory and related services are reasonable.
Profitability and “Fall-Out” Benefits
The Board considered the level of profits realized by the Adviser and relevant affiliates thereof in providing investment advisory and administrative services to each Fund and to all Eaton Vance Funds as a group. The Board considered the level of profits realized without regard to marketing support or other payments by the Adviser and its affiliates to third parties in respect of distribution services.
The Board concluded that, in light of the foregoing factors and the nature, extent and quality of the services rendered, the profits realized by the Adviser and its affiliates are deemed not to be excessive.
Eaton Vance
Municipal Bond Funds
September 30, 2019
Board of Trustees’ Contract Approval — continued
The Board also considered direct or indirect fall-out benefits received by the Adviser and its affiliates in connection with their respective relationships with the Funds, including the benefits of research services that may be available to the Adviser as a result of securities transactions effected for the Funds and other investment advisory clients.
Economies of Scale
In reviewing management fees and profitability, the Board also considered the extent to which the Adviser and its affiliates, on the one hand, and each Fund, on the other hand, can expect to realize benefits from economies of scale as the assets of each Fund increase. The Board acknowledged the difficulty in accurately measuring the benefits resulting from economies of scale, if any, with respect to the management of any specific fund or group of funds. The Board reviewed data summarizing the increases and decreases in the assets of each Fund and of all Eaton Vance Funds as a group over various time periods, and evaluated the extent to which the total expense ratio of each Fund and the profitability of the Adviser and its affiliates may have been affected by such increases or decreases. Based upon the foregoing, the Board concluded that each Fund currently shares in the benefits from economies of scale, if any, when they are realized by the Adviser. The Board also considered the fact that the Funds are not continuously offered and that the Funds’ assets are not expected to increase materially in the foreseeable future. The Board concluded that, in light of the level of the Adviser’s profits with respect to each Fund, the implementation of breakpoints in the advisory fee schedules is not warranted at this time.
Eaton Vance
Municipal Bond Funds
September 30, 2019
Management and Organization
Fund Management. The Trustees of Eaton Vance Municipal Bond Fund, Eaton Vance California Municipal Bond Fund and Eaton Vance New York Municipal Bond Fund (the Funds) are responsible for the overall management and supervision of the Funds’ affairs. The Trustees and officers of the Funds are listed below. Except as indicated, each individual has held the office shown or other offices in the same company for the last five years. The “Noninterested Trustees” consist of those Trustees who are not “interested persons” of the Funds, as that term is defined under the 1940 Act. The business address of each Trustee and officer is Two International Place, Boston, Massachusetts 02110. As used below, “EVC” refers to Eaton Vance Corp., “EV” refers to Eaton Vance, Inc., “EVM” refers to Eaton Vance Management, “BMR” refers to Boston Management and Research and “EVD” refers to Eaton Vance Distributors, Inc. EVC and EV are the corporate parent and trustee, respectively, of EVM and BMR. EVD is a wholly-owned subsidiary of EVC. Each officer affiliated with Eaton Vance may hold a position with other Eaton Vance affiliates that is comparable to his or her position with EVM listed below. Each Trustee oversees 162 portfolios in the Eaton Vance Complex (including all master and feeder funds in a master feeder structure). Each officer serves as an officer of certain other Eaton Vance funds. Each Trustee serves for a three-year term. Each officer serve until his or her successor is elected.
| | | | | | |
| Name and Year of Birth | | Position(s) with the Funds | | Term
Expiring. Trustee
Since(1) | | Principal Occupation(s) and Other Directorships During Past Five Years and Other Relevant Experience |
|
| Interested Trustee |
| | | |
Thomas E. Faust Jr. 1958 | | Class II Trustee | | Until 2022. Trustee since 2007. | | Chairman, Chief Executive Officer and President of EVC, Director and President of EV, Chief Executive Officer and President of EVM and BMR, and Director of EVD. Trustee and/or officer of 162 registered investment companies. Mr. Faust is an interested person because of his positions with EVM, BMR, EVD, EVC and EV, which are affiliates of the Funds. Other Directorships in the Last Five Years. Director of EVC and Hexavest Inc. (investment management firm). |
|
| Noninterested Trustees |
| | | |
Mark R. Fetting 1954 | | Class I Trustee | | Until 2021. Trustee since 2016. | | Private investor. Formerly held various positions at Legg Mason, Inc. (investment management firm) (2000-2012), including President, Chief Executive Officer, Director and Chairman (2008-2012), Senior Executive Vice President (2004-2008) and Executive Vice President (2001-2004). Formerly, President of Legg Mason family of funds (2001-2008). Formerly, Division President and Senior Officer of Prudential Financial Group, Inc. and related companies (investment management firm)(1991-2000). Other Directorships in the Last Five Years. None. |
| | | |
Cynthia E. Frost 1961 | | Class II Trustee | | Until 2022. Trustee since 2014. | | Private investor. Formerly, Chief Investment Officer of Brown University (university endowment) (2000-2012). Formerly, Portfolio Strategist for Duke Management Company (university endowment manager) (1995-2000). Formerly, Managing Director, Cambridge Associates (investment consulting company) (1989-1995). Formerly, Consultant, Bain and Company (management consulting firm)(1987-1989). Formerly, Senior Equity Analyst, BA Investment Management Company (1983-1985). Other Directorships in the Last Five Years. None. |
| | | |
George J. Gorman 1952 | | Class III Trustee | | Until 2020. Trustee since 2014. | | Principal at George J. Gorman LLC (consulting firm). Formerly, Senior Partner at Ernst & Young LLP (a registered public accounting firm) (1974-2009). Other Directorships in the Last Five Years. Formerly, Trustee of the BofA Funds Series Trust (11 funds) (2011-2014) and of the Ashmore Funds (9 funds)(2010-2014). |
| | | |
Valerie A. Mosley 1960 | | Class I Trustee | | Until 2021. Trustee since 2014. | | Chairwoman and Chief Executive Officer of Valmo Ventures (a consulting and investment firm). Former Partner and Senior Vice President, Portfolio Manager and Investment Strategist at Wellington Management Company, LLP (investment management firm) (1992-2012). Former Chief Investment Officer, PG Corbin Asset Management (1990-1992). Formerly worked in institutional corporate bond sales at Kidder Peabody (1986-1990). Other Directorships in the Last Five Years. Director of Envestnet, Inc. (provider of intelligent systems for wealth management and financial wellness) (since 2018). Director of Dynex Capital, Inc. (mortgage REIT) (since 2013). |
Eaton Vance
Municipal Bond Funds
September 30, 2019
Management and Organization — continued
| | | | | | |
| Name and Year of Birth | | Position(s) with the Funds | | Term
Expiring. Trustee
Since(1) | | Principal Occupation(s) and Other Directorships During Past Five Years and Other Relevant Experience |
|
| Noninterested Trustees (continued) |
| | | |
William H. Park 1947 | | Chairperson of the Board and Class I Trustee | | Until 2021. Chairperson of the Board since 2016 and Trustee since 2003. | | Private investor. Formerly, Consultant (management and transactional) (2012-2014). Formerly, Chief Financial Officer, Aveon Group L.P. (investment management firm) (2010-2011). Formerly, Vice Chairman, Commercial Industrial Finance Corp. (specialty finance company) (2006-2010). Formerly, President and Chief Executive Officer, Prizm Capital Management, LLC (investment management firm)(2002-2005). Formerly, Executive Vice President and Chief Financial Officer, United Asset Management Corporation (investment management firm) (1982-2001). Formerly, Senior Manager, Price Waterhouse (now PricewaterhouseCoopers) (a registered public accounting firm) (1972-1981). Other Directorships in the Last Five Years. None. |
| | | |
Helen Frame Peters 1948 | | Class III Trustee | | Until 2020. Trustee since 2008. | | Professor of Finance, Carroll School of Management, Boston College. Formerly, Dean, Carroll School of Management, Boston College (2000-2002). Formerly, Chief Investment Officer, Fixed Income, Scudder Kemper Investments (investment management firm) (1998-1999). Formerly, Chief Investment Officer, Equity and Fixed Income, Colonial Management Associates (investment management firm) (1991-1998). Other Directorships in the Last Five Years. None. |
| | | |
Keith Quinton 1958 | | Class I Trustee | | Until 2021. Trustee since 2018. | | Independent Investment Committee Member at New Hampshire Retirement System (since 2017). Advisory Committee member at Northfield Information Services, Inc. (risk management analytics provider) (since 2016). Formerly, Portfolio Manager and Senior Quantitative Analyst at Fidelity Investments (investment management firm) (2001-2014). Other Directorships in the Last Five Years. Director of New Hampshire Municipal Bond Bank (since 2016). |
| | | |
Marcus L. Smith 1966 | | Class III Trustee | | Until 2020. Trustee since 2018. | | Member of Posse Boston Advisory Board (foundation) (since 2015). Trustee at University of Mount Union (since 2008). Formerly, Portfolio Manager at MFS Investment Management (investment management firm) (1994-2017). Other Directorships in the Last Five Years. Director of MSCI Inc. (global provider of investment decision support tools) (since 2017). Formerly, Director of DCT Industrial Trust Inc. (logistics real estate company) (2017-2018). |
| | | |
Susan J. Sutherland 1957 | | Class III Trustee | | Until 2020. Trustee since 2015. | | Private investor. Formerly, Associate, Counsel and Partner at Skadden, Arps, Slate, Meagher & Flom LLP (law firm) (1982-2013). Other Directorships in the Last Five Years. Formerly, Director of Montpelier Re Holdings Ltd. (global provider of customized insurance and reinsurance products) (2013-2015). |
| | | |
Scott E. Wennerholm 1959 | | Class II Trustee | | Until 2022. Trustee since 2016. | | Formerly, Trustee at Wheelock College (postsecondary institution) (2012-2018). Formerly, Consultant at GF Parish Group (executive recruiting firm) (2016-2017). Formerly, Chief Operating Officer and Executive Vice President at BNY Mellon Asset Management (investment management firm) (2005-2011). Formerly, Chief Operating Officer and Chief Financial Officer at Natixis Global Asset Management (investment management firm) (1997-2004). Formerly, Vice President at Fidelity Investments Institutional Services (investment management firm) (1994-1997). Other Directorships in the Last Five Years. None. |
Eaton Vance
Municipal Bond Funds
September 30, 2019
Management and Organization — continued
| | | | | | |
| Name and Year of Birth | | Position(s) with the Funds | | Officer
Since(2) | | Principal Occupation(s) During Past Five Years |
|
| Principal Officers who are not Trustees |
| | | |
Payson F. Swaffield 1956 | | President | | 2003 | | Vice President and Chief Income Investment Officer of EVM and BMR. Also Vice President of Calvert Research and Management (“CRM”) since 2016. |
| | | |
Maureen A. Gemma 1960 | | Vice President, Secretary and Chief Legal Officer | | 2005 | | Vice President of EVM and BMR. Also Vice President of CRM since 2016. |
| | | |
James F. Kirchner 1967 | | Treasurer | | 2007 | | Vice President of EVM and BMR. Also Vice President of CRM since 2016. |
| | | |
Richard F. Froio 1968 | | Chief Compliance Officer | | 2017 | | Vice President of EVM and BMR since 2017. Formerly Deputy Chief Compliance Officer (Adviser/Funds) and Chief Compliance Officer (Distribution) at PIMCO (2012-2017) and Managing Director at BlackRock/Barclays Global Investors (2009-2012). |
| (1) | Year first appointed to serve as Trustee for a fund in the Eaton Vance family of funds. Each Trustee has served continuously since appointment unless indicated otherwise. Each Trustee holds office until the annual meeting for the year in which his or her term expires and until his or her successor is elected and qualified, subject to a prior death, resignation, retirement, disqualification or removal. |
| (2) | Year first elected to serve as officer of a fund in the Eaton Vance family of funds when the officer has served continuously. Otherwise, year of most recent election as an officer of a fund in the Eaton Vance family of funds. Titles may have changed since initial election. |
Eaton Vance Funds
IMPORTANT NOTICES
Privacy. The Eaton Vance organization is committed to ensuring your financial privacy. Each of the financial institutions identified below has in effect the following policy (“Privacy Policy”) with respect to nonpublic personal information about its customers:
| • | | Only such information received from you, through application forms or otherwise, and information about your Eaton Vance fund transactions will be collected. This may include information such as name, address, social security number, tax status, account balances and transactions. |
| • | | None of such information about you (or former customers) will be disclosed to anyone, except as permitted by law (which includes disclosure to employees necessary to service your account). In the normal course of servicing a customer’s account, Eaton Vance may share information with unaffiliated third parties that perform various required services such as transfer agents, custodians and broker-dealers. |
| • | | Policies and procedures (including physical, electronic and procedural safeguards) are in place that are designed to protect the confidentiality of such information. |
| • | | We reserve the right to change our Privacy Policy at any time upon proper notification to you. Customers may want to review our Privacy Policy periodically for changes by accessing the link on our homepage: www.eatonvance.com. |
Our pledge of privacy applies to the following entities within the Eaton Vance organization: the Eaton Vance Family of Funds, Eaton Vance Management, Eaton Vance Investment Counsel, Eaton Vance Distributors, Inc., Eaton Vance Trust Company, Eaton Vance Management (International) Limited, Eaton Vance Advisers International Ltd., Eaton Vance Management’s Real Estate Investment Group and Boston Management and Research. In addition, our Privacy Policy applies only to those Eaton Vance customers who are individuals and who have a direct relationship with us. If a customer’s account (i.e., fund shares) is held in the name of a third-party financial advisor/broker-dealer, it is likely that only such advisor’s privacy policies apply to the customer. This notice supersedes all previously issued privacy disclosures. For more information about Eaton Vance’s Privacy Policy, please call 1-800-262-1122.
Delivery of Shareholder Documents. The Securities and Exchange Commission (SEC) permits funds to deliver only one copy of shareholder documents, including prospectuses, proxy statements and shareholder reports, to fund investors with multiple accounts at the same residential or post office box address. This practice is often called “householding” and it helps eliminate duplicate mailings to shareholders. American Stock Transfer & Trust Company, LLC (“AST”), the closed-end funds transfer agent, or your financial intermediary, may household the mailing of your documents indefinitely unless you instruct AST, or your financial intermediary, otherwise. If you would prefer that your Eaton Vance documents not be householded, please contact AST or your financial intermediary. Your instructions that householding not apply to delivery of your Eaton Vance documents will typically be effective within 30 days of receipt by AST or your financial intermediary.
Portfolio Holdings. Each Eaton Vance Fund and its underlying Portfolio(s) (if applicable) files a schedule of portfolio holdings on Part F toForm N-PORT with the SEC for the first and third quarters of each fiscal year. The Form N-PORT will be available on the Eaton Vance website at www.eatonvance.com, by calling Eaton Vance at 1-800-262-1122 or in the EDGAR database on the SEC’s website at www.sec.gov.
Proxy Voting. From time to time, funds are required to vote proxies related to the securities held by the funds. The Eaton Vance Funds or their underlying Portfolios (if applicable) vote proxies according to a set of policies and procedures approved by the Funds’ and Portfolios’ Boards. You may obtain a description of these policies and procedures and information on how the Funds or Portfolios voted proxies relating to portfolio securities during the most recent 12-month period ended June 30, without charge, upon request, by calling 1-800-262-1122 and by accessing the SEC’s website at www.sec.gov.
Share Repurchase Program. The Funds’ Boards of Trustees have approved a share repurchase program authorizing each Fund to repurchase up to 10% of its common shares outstanding as of the last day of the prior calendar year in open-market transactions at a discount to net asset value. The repurchase program does not obligate a Fund to purchase a specific amount of shares. The Funds’ repurchase activity, including the number of shares purchased, average price and average discount to net asset value, is disclosed in the Funds’ annual and semi-annual reports to shareholders.
Additional Notice to Shareholders. If applicable, a Fund may also redeem or purchase its outstanding preferred shares in order to maintain compliance with regulatory requirements, borrowing or rating agency requirements or for other purposes as it deems appropriate or necessary.
Closed-End Fund Information. Eaton Vance closed-end funds make fund performance data and certain information about portfolio characteristics available on the Eaton Vance website shortly after the end of each month. Other information about the funds is available on the website. The funds’ net asset value per share is readily accessible on the Eaton Vance website. Portfolio holdings for the most recent month-end are also posted to the website approximately 30 days following the end of the month. This information is available at www.eatonvance.com on the fund information pages under “Individual Investors — Closed-End Funds”.
This Page Intentionally Left Blank
This Page Intentionally Left Blank
Investment Adviser and Administrator
Eaton Vance Management
Two International Place
Boston, MA 02110
Custodian
State Street Bank and Trust Company
State Street Financial Center, One Lincoln Street
Boston, MA 02111
Transfer Agent
American Stock Transfer & Trust Company, LLC
6201 15th Avenue
Brooklyn, NY 11219
Independent Registered Public Accounting Firm
Deloitte & Touche LLP
200 Berkeley Street
Boston, MA 02116-5022
Fund Offices
Two International Place
Boston, MA 02110

1453 9.30.19
Item 2. Code of Ethics
The registrant has adopted a code of ethics applicable to its Principal Executive Officer, Principal Financial Officer and Principal Accounting Officer. The registrant undertakes to provide a copy of such code of ethics to any person upon request, without charge, by calling1-800-262-1122. The registrant has not amended the code of ethics as described in FormN-CSR during the period covered by this report. The registrant has not granted any waiver, including an implicit waiver, from a provision of the code of ethics as described in FormN-CSR during the period covered by this report.
Item 3. Audit Committee Financial Expert
The registrant’s Board has designated George J. Gorman and William H. Park, each an independent trustee, as audit committee financial experts. Mr. Gorman is a certified public accountant who is the Principal at George J. Gorman LLC (a consulting firm). Previously, Mr. Gorman served in various capacities at Ernst & Young LLP (a registered public accounting firm), including as Senior Partner. Mr. Gorman also has experience serving as an independent trustee and audit committee financial expert of other mutual fund complexes. Mr. Park is a certified public accountant who is a private investor. Previously, he served as a consultant, as the Chief Financial Officer of Aveon Group, L.P. (an investment management firm), as the Vice Chairman of Commercial Industrial Finance Corp. (specialty finance company), as President and Chief Executive Officer of Prizm Capital Management, LLC (investment management firm), as Executive Vice President and Chief Financial Officer of United Asset Management Corporation (an institutional investment management firm) and as a Senior Manager at Price Waterhouse (now PricewaterhouseCoopers) (a registered public accounting firm).
Item 4. Principal Accountant Fees and Services
(a) –(d)
The following table presents the aggregate fees billed to the registrant for the registrant’s fiscal years ended September 30, 2018 and September 30, 2019 by the registrant’s principal accountant, Deloitte & Touche LLP (“D&T”), for professional services rendered for the audit of the registrant’s annual financial statements and fees billed for other services rendered by D&T during such periods.
| | | | | | | | |
Fiscal Years Ended | | 9/30/18 | | | 9/30/19 | |
Audit Fees | | $ | 74,675 | | | $ | 76,000 | |
Audit-Related Fees(1) | | $ | 0 | | | $ | 0 | |
Tax Fees(2) | | $ | 13,368 | | | $ | 12,969 | |
All Other Fees(3) | | $ | 0 | | | $ | 0 | |
| | | | | | | | |
Total | | $ | 88,043 | | | $ | 88,969 | |
| | | | | | | | |
| (1) | Audit-related fees consist of the aggregate fees billed for assurance and related services that are reasonably related to the performance of the audit of the registrant’s financial statements and are not reported under the category of audit fees. |
| (2) | Tax fees consist of the aggregate fees billed for professional services rendered by the principal accountant relating to tax compliance, tax advice, and tax planning and specifically include fees for tax return preparation and other related tax compliance/planning matters. |
| (3) | All other fees consist of the aggregate fees billed for products and services provided by the principal accountant other than audit, audit-related, and tax services. |
(e)(1) The registrant’s audit committee has adopted policies and procedures relating to thepre-approval of services provided by the registrant’s principal accountant (the“Pre-Approval Policies”). ThePre-Approval Policies establish a framework intended to assist the audit committee in the proper discharge of itspre-approval responsibilities. As a general matter, thePre-Approval Policies (i) specify certain types of audit, audit-related, tax, and other services determined to bepre-approved by the audit committee; and (ii) delineate specific procedures governing the mechanics of thepre-approval process, including the approval and monitoring of audit andnon-audit service fees. Unless a service is specificallypre-approved under thePre-Approval Policies, it must be separatelypre-approved by the audit committee.
ThePre-Approval Policies and the types of audit andnon-audit servicespre-approved therein must be reviewed and ratified by the registrant’s audit committee at least annually. The registrant’s audit committee maintains full responsibility for the appointment, compensation, and oversight of the work of the registrant’s principal accountant.
(e)(2) No services described in paragraphs (b)-(d) above were approved by the registrant’s audit committee pursuant to the “de minimis exception” set forth in Rule2-01 (c)(7)(i)(C) of RegulationS-X.
(f) Not applicable.
(g) The following table presents (i) the aggregatenon-audit fees (i.e., fees for audit-related, tax, and other services) billed to the registrant by D&T for the registrant’s fiscal years ended September 30, 2018 and September 30, 2019; and (ii) the aggregatenon-audit fees (i.e., fees for audit-related, tax, and other services) billed to the Eaton Vance organization by D&T for the same time periods.
| | | | | | | | |
Fiscal Years Ended | | 9/30/18 | | | 9/30/19 | |
Registrant | | $ | 13,368 | | | $ | 12,969 | |
Eaton Vance(1) | | $ | 126,485 | | | $ | 59,903 | |
| (1) | The investment adviser to the registrant, as well as any of its affiliates that provide ongoing services to the registrant, are subsidiaries of Eaton Vance Corp. |
(h) The registrant’s audit committee has considered whether the provision by the registrant’s principal accountant ofnon-audit services to the registrant’s investment adviser and any entity controlling, controlled by, or under common control with the adviser that provides ongoing services to the registrant that were notpre-approved pursuant to Rule2-01(c)(7)(ii) of RegulationS-X is compatible with maintaining the principal accountant’s independence.
Item 5. Audit Committee of Listed Registrants
The registrant has a separately-designated standing audit committee established in accordance with Section 3(a)(58)(A) of the Securities and Exchange Act of 1934, as amended. George J. Gorman (Chair), William H. Park, Helen Frame Peters and Scott E. Wennerholm are the members of the registrant’s audit committee.
Item 6. Schedule of Investments
Please see schedule of investments contained in the Report to Stockholders included under Item 1 of this FormN-CSR.
Item 7. Disclosure of Proxy Voting Policies and Procedures forClosed-End Management Investment Companies
The Board of Trustees of the Trust has adopted a proxy voting policy and procedure (the “Fund Policy”), pursuant to which the Trustees have delegated proxy voting responsibility to the Fund’s investment adviser and adopted the investment adviser’s proxy voting policies and procedures (the “Policies”) which are described below. The Trustees will review the Fund’s proxy voting records from time to time and will annually consider approving the Policies for the upcoming year. In the event that a conflict of interest arises between the Fund’s shareholders and the investment adviser, the administrator, or any of their affiliates or any affiliate of the Fund, the investment adviser will generally refrain from voting the proxies related to the companies giving rise to such conflict until it consults with the Board’s Special Committee except as contemplated under the Fund Policy. The Board’s Special Committee will instruct the investment adviser on the appropriate course of action.
The Policies are designed to promote accountability of a company’s management to its shareholders and to align the interests of management with those shareholders. An independent proxy voting service (“Agent”), currently Institutional Shareholder Services, Inc., has been retained to assist in the voting of proxies through the provision of vote analysis, implementation and recordkeeping and disclosure services. The investment adviser will generally vote proxies through the Agent. The Agent is required to vote all proxies and/or refer them back to the investment adviser pursuant to the Policies. It is generally the policy of the investment adviser to vote in accordance with the recommendation of the Agent. The Agent shall refer to the investment adviser proxies relating to mergers and restructurings, and the disposition of assets, termination, liquidation and mergers contained in mutual fund proxies. The investment adviser will normally vote against anti-takeover measures and other proposals designed to limit the ability of shareholders to act on possible transactions, except in the case ofclosed-end management investment companies. The investment adviser generally supports management on social and environmental proposals. The investment adviser may abstain from voting from time to time where it determines that the costs associated with voting a proxy outweighs the benefits derived from exercising the right to vote or the economic effect on shareholders interests or the value of the portfolio holding is indeterminable or insignificant.
In addition, the investment adviser will monitor situations that may result in a conflict of interest between the Fund’s shareholders and the investment adviser, the administrator, or any of their affiliates or any affiliate of the Fund by maintaining a list of significant existing and prospective corporate clients. The investment adviser’s personnel responsible for reviewing and voting proxies on behalf of the Fund will report any proxy received or expected to be received from a company included on that list to the personnel of the investment adviser identified in the Policies. If such personnel expects to instruct the Agent to vote such proxies in a manner inconsistent with the guidelines of the Policies or the recommendation of the Agent, the personnel will consult with members of senior management of the investment adviser to determine if a material conflict of interests exists. If it is determined that a material conflict does exist, the investment adviser will seek instruction on how to vote from the Special Committee.
Information on how the Fund voted proxies relating to portfolio securities during the most recent 12 month period ended June 30 is available (1) without charge, upon request, by calling1-800-262-1122, and (2) on the Securities and Exchange Commission’s website athttp://www.sec.gov.
Item 8. Portfolio Managers ofClosed-End Management Investment Companies
Eaton Vance Management (“EVM” or “Eaton Vance”) is the investment adviser of each Fund. Craig R. Brandon, portfolio manager of Eaton Vance California Municipal Bond Fund and Eaton Vance New York Municipal Bond Fund and Cynthia J. Clemson, portfolio manager of Eaton Vance Municipal Bond Fund are responsible for the overall andday-to-day management of each Fund’s investments.
Mr. Brandon is a Vice President of EVM, has been a portfolio manager of Eaton Vance California Municipal Bond Fund since January 2014 and of Eaton Vance New York Municipal Bond Fund since November 2005, has been an EVM analyst since 1998 and isCo-Director of the Municipal Investments Group. Ms. Clemson is a Vice President of EVM, has been a portfolio manager of Eaton Vance Municipal Bond Fund since March 2014 and isCo-Director of the Municipal Investments Group. Mr. Brandon and Ms. Clemson have managed other Eaton Vance portfolios for more than five years. This information is provided as of the date of filing this report.
The following table shows, as of each Fund’s most recent fiscal year end, the number of accounts each portfolio manager managed in each of the listed categories and the total assets (in millions of dollars) in the accounts managed within each category. The table also shows the number of accounts with respect to which the advisory fee is based on the performance of the account, if any, and the total assets (in millions of dollars) in those accounts.
| | | | | | | | | | | | | | | | |
| | | Number
of All
Accounts | | | Total
Assets of
All
Accounts | | | Number of
Accounts
Paying a
Performance
Fee | | | Total Assets
of
Accounts
Paying a
Performance
Fee | |
Craig R. Brandon | | | | | | | | | | | | | | | | |
Registered Investment Companies | | | 15 | | | $ | 6,348.3 | | | | 0 | | | $ | 0 | |
Other Pooled Investment Vehicles | | | 1 | | | $ | 19.7 | | | | 0 | | | $ | 0 | |
Other Accounts | | | 2 | | | $ | 120.7 | | | | 0 | | | $ | 0 | |
| | | | |
Cynthia J. Clemson | | | | | | | | | | | | | | | | |
Registered Investment Companies | | | 9 | | | $ | 4,187.5 | | | | 0 | | | $ | 0 | |
Other Pooled Investment Vehicles | | | 1 | | | $ | 19.7 | | | | 0 | | | $ | 0 | |
Other Accounts | | | 2 | | | $ | 120.7 | | | | 0 | | | $ | 0 | |
The following table shows the dollar range of Fund shares beneficially owned by each portfolio manager as of each Fund’s most recent fiscal year end.
| | | | |
Fund Name and Portfolio Managers | | Dollar Range of Equity
Securities
Beneficially Owned in the Fund | |
California Municipal Bond Fund | | | | |
Craig R. Brandon | | | None | |
| |
Municipal Bond Fund | | | | |
Cynthia J. Clemson | | | None | |
| |
New York Municipal Bond Fund | | | | |
Craig R. Brandon | | | None | |
Potential for Conflicts of Interest. It is possible that conflicts of interest may arise in connection with a portfolio manager’s management of the Fund’s investments on the one hand and the investments of other accounts for which a portfolio manager is responsible on the other. For example, a portfolio manager may have conflicts of interest in allocating management time, resources and investment opportunities among the Fund and other accounts he or she advises. In addition, due to differences in the investment strategies or restrictions between the Fund and the other accounts, the portfolio manager may take action with respect to another account that differs from the action taken with respect to the Fund. In some cases, another account managed by a portfolio manager may compensate the investment adviser based on the performance of the securities held by that account. The existence of such a performance based fee may create additional conflicts of interest for the portfolio manager in the allocation of management time, resources and investment opportunities. Whenever conflicts of interest arise, the portfolio manager will endeavor to exercise his or her discretion in a manner that he or she believes is equitable to all interested persons. EVM has adopted several policies and procedures designed to address these potential conflicts including a code of ethics and policies that govern the investment adviser’s trading practices, including among other things the aggregation and allocation of trades among clients, brokerage allocations, cross trades and best execution.
Compensation Structure for EVM
Compensation of EVM’s portfolio managers and other investment professionals has the following primary components: (1) a base salary, (2) an annual cash bonus, (3) annualnon-cash compensation consisting of options to purchase shares of EVC nonvoting common stock and/or restricted shares of EVC nonvoting common stock that generally are subject to a vesting schedule and (4) (for equity portfolio managers) a Deferred Alpha Incentive Plan, which pays a deferred cash award tied to future excess returns in certain equity strategy portfolios. EVM’s investment professionals also receive certain retirement, insurance and other benefits that are broadly available to EVM’s employees. Compensation of EVM’s investment professionals is reviewed primarily on an annual basis. Cash bonuses, stock-based compensation awards, and adjustments in base salary are typically paid or put into effect at or shortly after the October 31st fiscal year end of EVC.
Method to Determine Compensation. EVM compensates its portfolio managers based primarily on the scale and complexity of their portfolio responsibilities and the total return performance of managed funds and accounts versus the benchmark(s) stated in the prospectus, as well as an appropriate peer group (as described below). In addition to rankings within peer groups of funds on the basis of absolute performance, consideration may also be given to relative risk-adjusted performance. Risk-adjusted performance measures include, but are not limited to, the Sharpe ratio (Sharpe ratio uses standard deviation and excess return to determine reward per unit of risk). Performance is normally based on periods ending on the September 30th preceding fiscal year end. Fund performance is normally evaluated primarily versus peer groups of funds as determined by Lipper Inc. and/or Morningstar, Inc. When a fund’s peer group as determined by Lipper or Morningstar is deemed by EVM’s management not to provide a fair comparison, performance may instead be evaluated primarily against a custom peer group or market index. In evaluating the performance of a fund and its manager, primary emphasis is normally placed on three-year performance, with secondary consideration of performance over longer and shorter periods. For funds that aretax-managed or otherwise have an objective ofafter-tax returns, performance is measured net of taxes. For other funds, performance is evaluated on apre-tax basis. For funds with an investment objective other than total return (such as current income), consideration will also be given to the fund’s success in achieving its objective. For managers responsible for multiple funds and accounts, investment performance is evaluated on an aggregate basis, based on averages or weighted averages among managed funds and accounts. Funds and accounts that have performance-based advisory fees are not accorded disproportionate weightings in measuring aggregate portfolio manager performance. A portion of the compensation payable to equity portfolio managers and investment professionals will be determined based on the ability of one or more accounts managed by such manager to achieve a specified target average annual gross return over a three year period in excess of the account benchmark. The cash award to be payable at the end of the three year term will be established at the inception of the term and will be adjusted positively or negatively to the extent that the average annual gross return varies from the specified target return.
The compensation of portfolio managers with other job responsibilities (such as heading an investment group or providing analytical support to other portfolios) will include consideration of the scope of such responsibilities and the managers’ performance in meeting them.
EVM seeks to compensate portfolio managers commensurate with their responsibilities and performance, and competitive with other firms within the investment management industry. EVM participates in investment-industry compensation surveys and utilizes survey data as a factor in determining salary, bonus and stock-based compensation levels for portfolio managers and other investment professionals. Salaries, bonuses and stock-based compensation are also influenced by the operating performance of EVM and its parent company. The overall annual cash bonus pool is generally based on a substantially fixed percentage ofpre-bonus adjusted operating income. While the salaries of EVM’s portfolio managers are comparatively fixed, cash bonuses and stock-based compensation may fluctuate significantly from year to year, based on changes in manager performance and other factors as described herein. For a high performing portfolio manager, cash bonuses and stock-based compensation may represent a substantial portion of total compensation.
Item 9. Purchases of Equity Securities byClosed-End Management Investment Company and Affiliated Purchasers
No such purchases this period.
Item 10. Submission of Matters to a Vote of Security Holders
No material changes.
Item 11. Controls and Procedures
(a) It is the conclusion of the registrant’s principal executive officer and principal financial officer that the effectiveness of the registrant’s current disclosure controls and procedures (such disclosure controls and procedures having been evaluated within 90 days of the date of this filing) provide reasonable assurance that the information required to be disclosed by the registrant has been recorded, processed, summarized and reported within the time period specified in the Commission’s rules and forms and that the information required to be disclosed by the registrant has been accumulated and communicated to the registrant’s principal executive officer and principal financial officer in order to allow timely decisions regarding required disclosure.
(b) There have been no changes in the registrant’s internal controls over financial reporting during the period covered by this report that has materially affected, or is reasonably likely to materially affect, the registrant’s internal control over financial reporting.
Item 12. Disclosure of Securities Lending Activities forClosed-End Management Investment Companies
No activity to report for the registrant’s most recent fiscal year end.
Item 13. Exhibits
| | |
| |
| (a)(1) | | Registrant’s Code of Ethics – Not applicable (please see Item 2). |
| |
| (a)(2)(i) | | Treasurer’s Section 302 certification. |
| |
| (a)(2)(ii) | | President’s Section 302 certification. |
| |
| (b) | | Combined Section 906 certification. |
Signatures
Pursuant to the requirements of the Securities Exchange Act of 1934 and the Investment Company Act of 1940, the registrant has duly caused this report to be signed on its behalf by the undersigned, thereunto duly authorized.
Eaton Vance New York Municipal Bond Fund
| | |
| By: | | /s/ Payson F. Swaffield |
| | Payson F. Swaffield |
| | President |
| |
| Date: | | November 21, 2019 |
Pursuant to the requirements of the Securities Exchange Act of 1934 and the Investment Company Act of 1940, this report has been signed below by the following persons on behalf of the registrant and in the capacities and on the dates indicated.
| | |
| By: | | /s/ James F. Kirchner |
| | James F. Kirchner |
| | Treasurer |
| |
| Date: | | November 21, 2019 |
| | |
| By: | | /s/ Payson F. Swaffield |
| | Payson F. Swaffield |
| | President |
| |
| Date: | | November 21, 2019 |