UNITED STATES
SECURITIES AND EXCHANGE COMMISSION
Washington, D.C. 20549
FORM 10-Q
☒ Quarterly Report Pursuant to Section 13 or 15(d) of the Securities Exchange Act of 1934
For the quarterly period ended June 30, 2024
☐ Transition Report pursuant to Section 13 or 15(d) of the Securities Exchange Act of 1934
For the transition period from ________ to ________
Commission File Number: 000-50058
PRA Group, Inc.
(Exact name of registrant as specified in its charter)
| | | | | | | | | | | | | | |
| Delaware | | | | 75-3078675 |
| (State or other jurisdiction of incorporation or organization) | | | | (I.R.S. Employer Identification No.) |
120 Corporate Boulevard
Norfolk, Virginia 23502
(Address of principal executive offices)
(888) 772-7326
(Registrant's Telephone No., including area code)
Not Applicable
(Former name, former address and former fiscal year, if changed since last report)
Securities registered pursuant to Section 12(b) of the Act:
| | | | | | | | |
| Title of each class | Trading Symbol(s) | Name of each exchange on which registered |
| Common Stock, $0.01 par value per share | PRAA | NASDAQ Global Select Market |
Indicate by check mark whether the registrant (1) has filed all reports required to be filed by Section 13 or 15(d) of the Securities Exchange Act of 1934 during the preceding 12 months (or for such shorter period that the registrant was required to file such reports), and (2) has been subject to such filing requirements for the past 90 days. Yes þ No ¨
Indicate by check mark whether the registrant has submitted electronically every Interactive Data File required to be submitted pursuant to Rule 405 of Regulation S-T during the preceding 12 months (or for such shorter period that the registrant was required to submit such files). Yes þ No ¨
Indicate by check mark whether the registrant is a large accelerated filer, an accelerated filer, a non-accelerated filer, a smaller reporting company, or an emerging growth company. See the definitions of "large accelerated filer," "accelerated filer," "smaller reporting company," and "emerging growth company" in Rule 12b-2 of the Exchange Act.
Large accelerated filer þ Accelerated filer ¨ Non-accelerated filer ¨ Smaller reporting company ☐ Emerging growth company ☐
If an emerging growth company, indicate by check mark if the registrant has elected not to use the extended transition period for complying with any new or revised financial accounting standards provided pursuant to Section 13(a) of the Exchange Act. ¨
Indicate by check mark whether the registrant is a shell company (as defined in Rule 12b-2 of the Exchange Act). Yes ☐ No þ
The number of shares of the registrant's common stock outstanding as of August 1, 2024 was 39,417,253.
Table of Contents
| | | | | | | | |
| |
| | |
| Item 1. | | |
| | |
| | |
| | |
| | |
| | |
| | |
| | |
| | |
| | |
| | |
| | |
| | |
| | |
| | |
| | |
| | |
| | |
| | |
| | |
| | |
| | |
| Item 2. | | |
| Item 3. | | |
| Item 4. | | |
| | |
| |
| | |
| Item 1. | | |
| Item 1A. | | |
| Item 2. | | |
| Item 3. | | |
| Item 4. | | |
| Item 5. | | |
| Item 6. | | |
| | |
| Signatures | | |
Part I. Financial Information
Item 1. Financial Statements (Unaudited)
PRA Group, Inc.
Consolidated Balance Sheets
June 30, 2024 and December 31, 2023
(Amounts in thousands)
| | | | | | | | | | | |
| (unaudited) | | |
| June 30,
2024 | | December 31,
2023 |
| Assets | | | |
| Cash and cash equivalents | $ | 118,865 | | | $ | 112,528 | |
| | | |
| Investments | 59,619 | | | 72,404 | |
| Finance receivables, net | 3,820,186 | | | 3,656,598 | |
| | | |
| Income taxes receivable | 34,813 | | | 27,713 | |
| Deferred tax assets, net | 76,486 | | | 74,694 | |
| Right-of-use assets | 42,374 | | | 45,877 | |
| Property and equipment, net | 32,827 | | | 36,450 | |
| Goodwill | 415,646 | | | 431,564 | |
| Other assets | 61,124 | | | 67,526 | |
| Total assets | $ | 4,661,940 | | | $ | 4,525,354 | |
| Liabilities and Equity | | | |
| Liabilities: | | | |
| Accounts payable | $ | 10,198 | | | $ | 6,325 | |
| | | |
| Accrued expenses | 114,260 | | | 131,893 | |
| Income taxes payable | 23,583 | | | 17,912 | |
| Deferred tax liabilities, net | 18,423 | | | 17,051 | |
| Lease liabilities | 46,746 | | | 50,300 | |
| Interest-bearing deposits | 114,991 | | | 115,589 | |
| Borrowings | 3,113,777 | | | 2,914,270 | |
| Other liabilities | 16,684 | | | 32,638 | |
| Total liabilities | 3,458,662 | | | 3,285,978 | |
| | | |
| Equity: | | | |
| Preferred stock, $0.01 par value, 2,000 shares authorized, no shares issued and outstanding | — | | | — | |
| Common stock, $0.01 par value; 100,000 shares authorized, 39,417 shares issued and outstanding as of June 30, 2024; 100,000 shares authorized, 39,247 shares issued and outstanding as of December 31, 2023 | 394 | | | 392 | |
| Additional paid-in capital | 12,339 | | | 7,071 | |
| Retained earnings | 1,514,539 | | | 1,489,548 | |
| Accumulated other comprehensive loss | (381,809) | | | (329,899) | |
| Total stockholders' equity - PRA Group, Inc. | 1,145,463 | | | 1,167,112 | |
| Noncontrolling interests | 57,815 | | | 72,264 | |
| Total equity | 1,203,278 | | | 1,239,376 | |
| Total liabilities and equity | $ | 4,661,940 | | | $ | 4,525,354 | |
The accompanying notes are an integral part of these Consolidated Financial Statements.
PRA Group, Inc.
Consolidated Income Statements
For the Three and Six Months Ended June 30, 2024 and 2023
(Amounts in thousands, except per share amounts)
(unaudited)
| | | | | | | | | | | | | | | | | | | | | | | | | | |
| | Three Months Ended June 30, | | Six Months Ended June 30, |
| | 2024 | | 2023 | | 2024 | | 2023 |
| Revenues: | | | | | | | | |
| Portfolio income | | $ | 209,290 | | | $ | 184,290 | | | $ | 411,346 | | | $ | 372,532 | |
| Changes in expected recoveries | | 73,320 | | | 21,136 | | | 124,994 | | | (15,776) | |
| Total portfolio revenue | | 282,610 | | | 205,426 | | | 536,340 | | | 356,756 | |
| Other revenue | | 1,619 | | | 3,810 | | | 3,475 | | | 7,950 | |
| Total revenues | | 284,229 | | | 209,236 | | | 539,815 | | | 364,706 | |
| | | | | | | | |
| Operating expenses: | | | | | | | | |
| Compensation and employee services | | 74,241 | | | 65,788 | | | 147,838 | | | 148,191 | |
| Legal collection fees | | 13,762 | | | 9,551 | | | 25,874 | | | 18,389 | |
| Legal collection costs | | 35,274 | | | 21,522 | | | 61,965 | | | 45,467 | |
| Agency fees | | 21,008 | | | 17,677 | | | 40,731 | | | 35,055 | |
| Outside fees and services | | 18,124 | | | 18,262 | | | 43,174 | | | 43,206 | |
| Communication | | 11,577 | | | 10,117 | | | 24,155 | | | 20,644 | |
| Rent and occupancy | | 4,136 | | | 4,319 | | | 8,280 | | | 8,767 | |
| Depreciation and amortization | | 2,637 | | | 3,482 | | | 5,357 | | | 7,071 | |
| | | | | | | | |
| Other operating expenses | | 14,248 | | | 12,957 | | | 26,823 | | | 25,999 | |
| | | | | | | | |
| Total operating expenses | | 195,007 | | | 163,675 | | | 384,197 | | | 352,789 | |
| Income from operations | | 89,222 | | | 45,561 | | | 155,618 | | | 11,917 | |
| Other income and (expense): | | | | | | | | |
| | | | | | | | |
| Interest expense, net | | (55,353) | | | (43,022) | | | (107,631) | | | (81,305) | |
| | | | | | | | |
| Foreign exchange gain/(loss), net | | (99) | | | 429 | | | 128 | | | 420 | |
| Other | | 46 | | | (230) | | | (160) | | | (880) | |
| Income/(loss) before income taxes | | 33,816 | | | 2,738 | | | 47,955 | | | (69,848) | |
| | | | | | | | |
| Income tax expense/(benefit) | | 8,702 | | | 1,578 | | | 11,088 | | | (17,105) | |
| Net income/(loss) | | 25,114 | | | 1,160 | | | 36,867 | | | (52,743) | |
| Adjustment for net income attributable to noncontrolling interests | | 3,598 | | | 4,964 | | | 11,876 | | | 9,690 | |
| Net income/(loss) attributable to PRA Group, Inc. | | $ | 21,516 | | | $ | (3,804) | | | $ | 24,991 | | | $ | (62,433) | |
| | | | | | | | |
| Net income/(loss) per common share attributable to PRA Group, Inc.: | | | | | | | | |
| Basic | | $ | 0.55 | | | $ | (0.10) | | | $ | 0.64 | | | $ | (1.60) | |
| Diluted | | $ | 0.54 | | | $ | (0.10) | | | $ | 0.63 | | | $ | (1.60) | |
| Weighted average number of shares outstanding: | | | | | | | | |
| Basic | | 39,364 | | | 39,190 | | | 39,319 | | | 39,111 | |
| Diluted | | 39,546 | | | 39,190 | | | 39,497 | | | 39,111 | |
The accompanying notes are an integral part of these Consolidated Financial Statements.
PRA Group, Inc.
Consolidated Statements of Comprehensive Income
For the Three and Six Months Ended June 30, 2024 and 2023
(Amounts in thousands)
(unaudited)
| | | | | | | | | | | | | | | | | | | | | | | |
| Three Months Ended June 30, | | Six Months Ended June 30, |
| 2024 | | 2023 | | 2024 | | 2023 |
| Net income/(loss) | $ | 25,114 | | | $ | 1,160 | | | $ | 36,867 | | | $ | (52,743) | |
| Other comprehensive income/(loss), net of tax | | | | | | | |
| Foreign currency translation adjustments | (14,258) | | | 7,083 | | | (62,449) | | | 5,533 | |
| Cash flow hedges | (1,293) | | | 5,719 | | | 1,515 | | | 888 | |
| Debt securities available-for-sale | 65 | | | (80) | | | 111 | | | 48 | |
| Other comprehensive income/(loss) | (15,486) | | | 12,722 | | | (60,823) | | | 6,469 | |
| Total comprehensive income/(loss) | 9,628 | | | 13,882 | | | (23,956) | | | (46,274) | |
| Less comprehensive income/(loss) attributable to noncontrolling interests | (3,097) | | | 8,956 | | | 2,962 | | | 16,232 | |
| Comprehensive income/(loss) attributable to PRA Group, Inc. | $ | 12,725 | | | $ | 4,926 | | | $ | (26,918) | | | $ | (62,506) | |
The accompanying notes are an integral part of these Consolidated Financial Statements.
PRA Group, Inc.
Consolidated Statements of Changes in Equity
For the Six Months Ended June 30, 2024
(Amounts in thousands)
(unaudited)
| | | | | | | | | | | | | | | | | | | | | | | | | | | | | | | | | | | | | | | | | | | |
| Common Stock | | Additional Paid-In | | Retained | | Accumulated Other Comprehensive | | Noncontrolling | | Total | | |
| Shares | | Amount | | Capital | | Earnings | | Income/(Loss) | | Interests | | Equity | | |
| Balance as of December 31, 2023 | 39,247 | | | $ | 392 | | | $ | 7,071 | | | $ | 1,489,548 | | | $ | (329,899) | | | $ | 72,264 | | | $ | 1,239,376 | | | |
| Components of comprehensive income, net of tax: | | | | | | | | | | | | | | | |
| Net income | — | | | — | | | — | | | 3,475 | | | — | | | 8,278 | | | 11,753 | | | |
| Foreign currency translation adjustments | — | | | — | | | — | | | — | | | (45,973) | | | (2,218) | | | (48,191) | | | |
| Cash flow hedges | — | | | — | | | — | | | — | | | 2,808 | | | — | | | 2,808 | | | |
| Debt securities available-for-sale | — | | | — | | | — | | | — | | | 46 | | | — | | | 46 | | | |
| Distributions to noncontrolling interests | — | | | — | | | — | | | — | | | — | | | (11,332) | | | (11,332) | | | |
| Vesting of restricted stock | 98 | | | 1 | | | (1) | | | — | | | — | | | — | | | — | | | |
| | | | | | | | | | | | | | | |
| Share-based compensation expense | — | | | — | | | 3,327 | | | — | | | — | | | — | | | 3,327 | | | |
| Employee stock relinquished for payment of taxes | — | | | — | | | (1,469) | | | — | | | — | | | — | | | (1,469) | | | |
| Balance as of March 31, 2024 | 39,345 | | | $ | 393 | | | $ | 8,928 | | | $ | 1,493,023 | | | $ | (373,018) | | | $ | 66,992 | | | $ | 1,196,318 | | | |
| Components of comprehensive income, net of tax: | | | | | | | | | | | | | | | |
| Net income | — | | | — | | | — | | | 21,516 | | | — | | | 3,598 | | | 25,114 | | | |
| Foreign currency translation adjustments | — | | | — | | | — | | | — | | | (7,563) | | | (6,695) | | | (14,258) | | | |
| Cash flow hedges | — | | | — | | | — | | | — | | | (1,293) | | | — | | | (1,293) | | | |
| Debt securities available-for-sale | — | | | — | | | — | | | — | | | 65 | | | — | | | 65 | | | |
| Distributions to noncontrolling interests | — | | | — | | | — | | | — | | | — | | | (6,080) | | | (6,080) | | | |
| | | | | | | | | | | | | | | |
| Vesting of restricted stock | 72 | | | 1 | | | (1) | | | — | | | — | | | — | | | — | | | |
| | | | | | | | | | | | | | | |
| Share-based compensation expense | — | | | — | | | 3,555 | | | — | | | — | | | — | | | 3,555 | | | |
| Employee stock relinquished for payment of taxes | — | | | — | | | (143) | | | — | | | — | | | — | | | (143) | | | |
| Balance as of June 30, 2024 | 39,417 | | | $ | 394 | | | $ | 12,339 | | | $ | 1,514,539 | | | $ | (381,809) | | | $ | 57,815 | | | $ | 1,203,278 | | | |
| | | | | | | | | | | | | | | |
| | | | | | | | | | | | | | | |
| | | | | | | | | | | | | | | |
| | | | | | | | | | | | | | | |
| | | | | | | | | | | | | | | |
| | | | | | | | | | | | | | | |
| | | | | | | | | | | | | | | |
| | | | | | | | | | | | | | | |
| | | | | | | | | | | | | | | |
| | | | | | | | | | | | | | | |
| | | | | | | | | | | | | | | |
The accompanying notes are an integral part of these Consolidated Financial Statements.
PRA Group, Inc.
Consolidated Statements of Changes in Equity
For the Six Months Ended June 30, 2023
(Amounts in thousands)
(unaudited)
| | | | | | | | | | | | | | | | | | | | | | | | | | | | | | | | | | | | | | | | | | | |
| Common Stock | | Additional Paid-In | | Retained | | Accumulated Other Comprehensive | | Noncontrolling | | Total | | |
| Shares | | Amount | | Capital | | Earnings | | Income/(Loss) | | Interests | | Equity | | |
| Balance as of December 31, 2022 | 38,980 | | | $ | 390 | | | $ | 2,172 | | | $ | 1,573,025 | | | $ | (347,926) | | | $ | 59,089 | | | $ | 1,286,750 | | | |
| Components of comprehensive income, net of tax: | | | | | | | | | | | | | | | |
| Net income/(loss) | — | | | — | | | — | | | (58,629) | | | — | | | 4,726 | | | (53,903) | | | |
| Foreign currency translation adjustments | — | | | — | | | — | | | — | | | (4,101) | | | 2,551 | | | (1,550) | | | |
| Cash flow hedges | — | | | — | | | — | | | — | | | (4,831) | | | — | | | (4,831) | | | |
| Debt securities available-for-sale | — | | | — | | | — | | | — | | | 128 | | | — | | | 128 | | | |
| Vesting of restricted stock | 190 | | | 2 | | | (2) | | | — | | | — | | | — | | | — | | | |
| Share-based compensation expense | — | | | — | | | 3,799 | | | — | | | — | | | — | | | 3,799 | | | |
| Employee stock relinquished for payment of taxes | — | | | — | | | (5,684) | | | — | | | — | | | — | | | (5,684) | | | |
| Balance as of March 31, 2023 | 39,170 | | | $ | 392 | | | $ | 285 | | | $ | 1,514,396 | | | $ | (356,730) | | | $ | 66,366 | | | $ | 1,224,709 | | | |
| Components of comprehensive income, net of tax: | | | | | | | | | | | | | | | |
| Net income/(loss) | — | | | — | | | — | | | (3,804) | | | — | | | 4,964 | | | 1,160 | | | |
| Foreign currency translation adjustments | — | | | — | | | — | | | — | | | 3,091 | | | 3,992 | | | 7,083 | | | |
| Cash flow hedges | — | | | — | | | — | | | — | | | 5,719 | | | — | | | 5,719 | | | |
| Debt securities available-for-sale | — | | | — | | | — | | | — | | | (80) | | | — | | | (80) | | | |
| Distributions to noncontrolling interests | — | | | — | | | — | | | — | | | — | | | (1,173) | | | (1,173) | | | |
| Vesting of restricted stock | 72 | | | — | | | — | | | — | | | — | | | — | | | — | | | |
| Share-based compensation expense | — | | | — | | | 2,715 | | | — | | | — | | | — | | | 2,715 | | | |
| Employee stock relinquished for payment of taxes | — | | | — | | | (459) | | | — | | | — | | | — | | | (459) | | | |
| Balance as of June 30, 2023 | 39,242 | | | $ | 392 | | | $ | 2,541 | | | $ | 1,510,592 | | | $ | (348,000) | | | $ | 74,149 | | | $ | 1,239,674 | | | |
| | | | | | | | | | | | | | | |
| | | | | | | | | | | | | | | |
| | | | | | | | | | | | | | | |
| | | | | | | | | | | | | | | |
| | | | | | | | | | | | | | | |
| | | | | | | | | | | | | | | |
| | | | | | | | | | | | | | | |
| | | | | | | | | | | | | | | |
| | | | | | | | | | | | | | | |
| | | | | | | | | | | | | | | |
| | | | | | | | | | | | | | | |
The accompanying notes are an integral part of these Consolidated Financial Statements.
PRA Group, Inc.
Consolidated Statements of Cash Flows
For the Six Months Ended June 30, 2024
(Amounts in thousands)
(unaudited)
| | | | | | | | | | | |
| Six Months Ended June 30, |
| 2024 | | 2023 |
| Cash flows from operating activities: | | | |
| Net income/(loss) | $ | 36,867 | | | $ | (52,743) | |
| Adjustments to reconcile net income/(loss) to net cash used in operating activities: | | | |
| Share-based compensation expense | 6,882 | | | 6,514 | |
| Depreciation and amortization | 5,357 | | | 7,071 | |
| | | |
| | | |
| | | |
| Amortization of debt discount and issuance costs | 4,531 | | | 4,825 | |
| Changes in expected recoveries | (124,994) | | | 15,776 | |
| | | |
| Deferred income taxes | (2,073) | | | (24,439) | |
| Net unrealized foreign currency transaction gain | (11,215) | | | (27,907) | |
| | | |
| Other | (1,027) | | | (1,051) | |
| | | |
| Changes in operating assets and liabilities: | | | |
| Other assets | (1,046) | | | (1,306) | |
| | | |
| Accrued expenses, accounts payable and other liabilities | (13,404) | | | 6,050 | |
| Income taxes payable, net | (2,366) | | | (13,629) | |
| | | |
| | | |
| | | |
| | | |
| Net cash used in operating activities | (102,488) | | | (80,839) | |
| Cash flows from investing activities: | | | |
| Purchases of property and equipment, net | (1,832) | | | (1,091) | |
| | | |
| Purchases of nonperforming loan portfolios | (625,186) | | | (559,547) | |
| Recoveries applied to negative allowance | 520,940 | | | 463,966 | |
| Purchases of investments | (48,247) | | | (60,057) | |
| Proceeds from sales and maturities of investments | 58,130 | | | 62,762 | |
| | | |
| | | |
| | | |
| Net cash used in investing activities | (96,195) | | | (93,967) | |
| Cash flows from financing activities: | | | |
| Proceeds from lines of credit | 435,341 | | | 459,432 | |
| Principal payments on lines of credit | (604,938) | | | (274,772) | |
| Retirement of Convertible Senior Notes due 2023 | — | | | (345,000) | |
| Proceeds from issuance of Senior Notes due 2030 | 400,000 | | | — | |
| Proceeds from issuance of Senior Notes due 2028 | — | | | 400,000 | |
| Principal payments on long-term debt | (7,500) | | | (5,000) | |
| Repurchases of senior notes | — | | | (3,657) | |
| | | |
| Payments of origination costs and fees | (5,111) | | | (5,324) | |
| Tax withholdings related to share-based payments | (1,612) | | | (6,142) | |
| Distributions to noncontrolling interests | (17,412) | | | (1,172) | |
| | | |
| | | |
| Net increase/(decrease) in interest-bearing deposits | 5,058 | | | (9,869) | |
| | | |
| | | |
| Net cash provided by financing activities | 203,826 | | | 208,496 | |
| Effect of exchange rates on cash | 1,082 | | | 6,216 | |
| Net increase in cash, cash equivalents and restricted cash | 6,225 | | | 39,906 | |
| Cash, cash equivalents and restricted cash, beginning of period | 113,692 | | | 84,759 | |
| Cash, cash equivalents and restricted cash, end of period | $ | 119,917 | | | $ | 124,665 | |
| | | |
| Supplemental disclosure of cash flow information: | | | |
| Cash paid for interest | $ | 116,575 | | | $ | 51,652 | |
| Cash paid for income taxes | 15,326 | | | 20,859 | |
| Reconciliation to Balance Sheet accounts: | | | |
| Cash and cash equivalents | $ | 118,865 | | | $ | 111,375 | |
| Restricted cash included in Other assets | 1,052 | | | 13,290 | |
| Cash, cash equivalents and restricted cash | $ | 119,917 | | | $ | 124,665 | |
The accompanying notes are an integral part of these Consolidated Financial Statements.
PRA Group, Inc.
Notes to Consolidated Financial Statements
1. Organization and Business:
Nature of operations: As used herein, the terms "PRA Group," the "Company," or similar terms refer to PRA Group, Inc. and its subsidiaries.
PRA Group, Inc., a Delaware corporation, is a global financial and business services company with operations in the Americas, Europe and Australia. The Company's primary business is the purchase, collection and management of portfolios of nonperforming loans. The Company also provides fee-based services on class action claims recoveries in the United States ("U.S.").
Basis of presentation: The Consolidated Financial Statements of the Company are prepared in accordance with U.S. generally accepted accounting principles ("GAAP"). The accompanying interim financial statements have been prepared in accordance with the instructions for Quarterly Reports on Form 10-Q, and therefore, do not include all information and Notes to the Consolidated Financial Statements necessary for a complete presentation of financial position, results of operations, comprehensive income/(loss) and cash flows in conformity with GAAP. In the opinion of management, all adjustments, consisting of normal and recurring items, necessary for the fair presentation of the Company's Consolidated Balance Sheets as of June 30, 2024, its Consolidated Income Statements and Statements of Comprehensive Income for the three and six months ended June 30, 2024 and 2023, and its Consolidated Statements of Changes in Equity and Statements of Cash Flows for the six months ended June 30, 2024 and 2023, have been included. The Consolidated Financial Statements include the accounts of PRA Group and other entities in which the Company has a controlling interest. All significant intercompany accounts and transactions have been eliminated.
These unaudited Consolidated Financial Statements should be read in conjunction with the audited Consolidated Financial Statements and notes thereto included in the Company's Annual Report on Form 10-K for the year ended December 31, 2023 (the "2023 Form 10-K"). For further discussion of the Company's significant accounting policies, refer to Note 1 to the Consolidated Financial Statements in the 2023 Form 10-K. There were no material changes to these policies during the three months ended June 30, 2024.
The preparation of the Consolidated Financial Statements in conformity with GAAP requires management to make estimates and assumptions that affect reported amounts and disclosures. Realized results could differ from those estimates and assumptions, and the Company's Consolidated Income Statements for the three and six months ended June 30, 2024 may not be indicative of future results.
Reclassification of prior year presentation: In the Consolidated Statements of Cash Flows, certain prior period amounts have been reclassified for consistency with the current period presentation.
2. Finance Receivables, net:
Finance receivables, net consisted of the following as of June 30, 2024 and December 31, 2023 (amounts in thousands):
| | | | | | | | | | | |
| June 30, 2024 | | December 31, 2023 |
| Amortized cost | $ | — | | | $ | — | |
| Negative allowance for expected recoveries | 3,820,186 | | | 3,656,598 | |
| Balance at end of period | $ | 3,820,186 | | | $ | 3,656,598 | |
PRA Group, Inc.
Notes to Consolidated Financial Statements
Changes in the negative allowance for expected recoveries by portfolio segment for the three and six months ended June 30, 2024 and 2023 were as follows (amounts in thousands):
| | | | | | | | | | | | | | | | | | | | | | | | | | | | | | | | | | | | | | |
| Three Months Ended June 30, |
| 2024 | | | 2023 |
| Core | | Insolvency | | Total | | | Core | | Insolvency | | Total |
| Balance at beginning of period | $ | 3,298,092 | | | $ | 352,103 | | | $ | 3,650,195 | | | | $ | 2,935,850 | | | $ | 350,647 | | | $ | 3,286,497 | |
Initial negative allowance for expected recoveries - portfolio acquisitions (1) | 326,752 | | | 52,617 | | | 379,369 | | | | 308,274 | | | 19,485 | | | 327,759 | |
| Foreign currency translation adjustment | (13,623) | | | 205 | | | (13,418) | | | | 23,380 | | | 4,034 | | | 27,414 | |
Recoveries applied to negative allowance (2) | (226,247) | | | (43,033) | | | (269,280) | | | | (198,897) | | | (39,361) | | | (238,258) | |
Changes in expected recoveries (3) | 65,747 | | | 7,573 | | | 73,320 | | | | 17,798 | | | 3,338 | | | 21,136 | |
| Balance at end of period | $ | 3,450,721 | | | $ | 369,465 | | | $ | 3,820,186 | | | | $ | 3,086,405 | | | $ | 338,143 | | | $ | 3,424,548 | |
| | | | | | | | | | | | | | | | | | | | | | | | | | | | | | | | | | | | | | |
| Six Months Ended June 30, |
| 2024 | | | 2023 |
| Core | | Insolvency | | Total | | | Core | | Insolvency | | Total |
| Balance at beginning of period | $ | 3,295,214 | | | $ | 361,384 | | | $ | 3,656,598 | | | | $ | 2,936,207 | | | $ | 358,801 | | | $ | 3,295,008 | |
Initial negative allowance for expected recoveries - portfolio acquisitions (1) | 545,409 | | | 79,777 | | | 625,186 | | | | 515,595 | | | 42,389 | | | 557,984 | |
| Foreign currency translation adjustment | (63,750) | | | (1,902) | | | (65,652) | | | | 43,216 | | | 8,082 | | | 51,298 | |
Recoveries applied to negative allowance (2) | (441,463) | | | (79,477) | | | (520,940) | | | | (385,283) | | | (78,683) | | | (463,966) | |
Changes in expected recoveries (3) | 115,311 | | | 9,683 | | | 124,994 | | | | (23,330) | | | 7,554 | | | (15,776) | |
| Balance at end of period | $ | 3,450,721 | | | $ | 369,465 | | | $ | 3,820,186 | | | | $ | 3,086,405 | | | $ | 338,143 | | | $ | 3,424,548 | |
(1) Initial negative allowance for expected recoveries - portfolio acquisitions
Portfolio acquisitions for the three and six months ended June 30, 2024 and 2023 were as follows (amounts in thousands):
| | | | | | | | | | | | | | | | | | | | | | | | | | | | | | | | | | | | | | |
| Three Months Ended June 30, |
| 2024 | | | 2023 |
| Core | | Insolvency | | Total | | | Core | | Insolvency | | Total |
| Face value | $ | 2,402,148 | | | $ | 279,417 | | | $ | 2,681,565 | | | | $ | 2,217,262 | | | $ | 91,940 | | | $ | 2,309,202 | |
| Noncredit discount | (316,934) | | | (23,186) | | | (340,120) | | | | (240,532) | | | (6,742) | | | (247,274) | |
| Allowance for credit losses at acquisition | (1,758,462) | | | (203,614) | | | (1,962,076) | | | | (1,668,456) | | | (65,713) | | | (1,734,169) | |
| Purchase price | $ | 326,752 | | | $ | 52,617 | | | $ | 379,369 | | | | $ | 308,274 | | | $ | 19,485 | | | $ | 327,759 | |
| | | | | | | | | | | | | | | | | | | | | | | | | | | | | | | | | | | | | | |
| Six Months Ended June 30, |
| 2024 | | | 2023 |
| Core | | Insolvency | | Total | | | Core | | Insolvency | | Total |
| Face value | $ | 4,110,779 | | | $ | 393,633 | | | $ | 4,504,412 | | | | $ | 3,725,226 | | | $ | 196,750 | | | $ | 3,921,976 | |
| Noncredit discount | (548,319) | | | (36,628) | | | (584,947) | | | | (391,043) | | | (14,784) | | | (405,827) | |
| Allowance for credit losses at acquisition | (3,017,051) | | | (277,228) | | | (3,294,279) | | | | (2,818,588) | | | (139,577) | | | (2,958,165) | |
| Purchase price | $ | 545,409 | | | $ | 79,777 | | | $ | 625,186 | | | | $ | 515,595 | | | $ | 42,389 | | | $ | 557,984 | |
PRA Group, Inc.
Notes to Consolidated Financial Statements
The initial negative allowance recorded on portfolio acquisitions for the three and six months ended June 30, 2024 and 2023 was as follows (amounts in thousands):
| | | | | | | | | | | | | | | | | | | | | | | | | | | | | | | | | | | | | | |
| Three Months Ended June 30, |
| 2024 | | | 2023 |
| Core | | Insolvency | | Total | | | Core | | Insolvency | | Total |
| Allowance for credit losses at acquisition | $ | (1,758,462) | | | $ | (203,614) | | | $ | (1,962,076) | | | | $ | (1,668,456) | | | $ | (65,713) | | | $ | (1,734,169) | |
| Writeoffs, net | 1,758,462 | | | 203,614 | | | 1,962,076 | | | | 1,668,456 | | | 65,713 | | | 1,734,169 | |
| Expected recoveries | 326,752 | | | 52,617 | | | 379,369 | | | | 308,274 | | | 19,485 | | | 327,759 | |
| Initial negative allowance for expected recoveries | $ | 326,752 | | | $ | 52,617 | | | $ | 379,369 | | | | $ | 308,274 | | | $ | 19,485 | | | $ | 327,759 | |
| | | | | | | | | | | | | | | | | | | | | | | | | | | | | | | | | | | | | | |
| Six Months Ended June 30, |
| 2024 | | | 2023 |
| Core | | Insolvency | | Total | | | Core | | Insolvency | | Total |
| Allowance for credit losses at acquisition | $ | (3,017,051) | | | $ | (277,228) | | | $ | (3,294,279) | | | | $ | (2,818,588) | | | $ | (139,577) | | | $ | (2,958,165) | |
| Writeoffs, net | 3,017,051 | | | 277,228 | | | 3,294,279 | | | | 2,818,588 | | | 139,577 | | | 2,958,165 | |
| Expected recoveries | 545,409 | | | 79,777 | | | 625,186 | | | | 515,595 | | | 42,389 | | | 557,984 | |
| Initial negative allowance for expected recoveries | $ | 545,409 | | | $ | 79,777 | | | $ | 625,186 | | | | $ | 515,595 | | | $ | 42,389 | | | $ | 557,984 | |
(2) Recoveries applied to negative allowance
Recoveries applied to the negative allowance for the three and six months ended June 30, 2024 and 2023 were as follows (amounts in thousands):
| | | | | | | | | | | | | | | | | | | | | | | | | | | | | | | | | | | | | | |
| Three Months Ended June 30, |
| 2024 | | | 2023 |
| Core | | Insolvency | | Total | | | Core | | Insolvency | | Total |
Recoveries (a) | $ | 423,659 | | | $ | 54,911 | | | $ | 478,570 | | | | $ | 373,178 | | | $ | 49,370 | | | $ | 422,548 | |
| Less - amounts reclassified to portfolio income | 197,412 | | | 11,878 | | | 209,290 | | | | 174,281 | | | 10,009 | | | 184,290 | |
| Recoveries applied to negative allowance | $ | 226,247 | | | $ | 43,033 | | | $ | 269,280 | | | | $ | 198,897 | | | $ | 39,361 | | | $ | 238,258 | |
| | | | | | | | | | | | | | | | | | | | | | | | | | | | | | | | | | | | | | |
| Six Months Ended June 30, |
| 2024 | | | 2023 |
| Core | | Insolvency | | Total | | | Core | | Insolvency | | Total |
Recoveries (a) | $ | 829,972 | | | $ | 102,314 | | | $ | 932,286 | | | | $ | 737,414 | | | $ | 99,084 | | | $ | 836,498 | |
| Less - amounts reclassified to portfolio income | 388,509 | | | 22,837 | | | 411,346 | | | | 352,131 | | | 20,401 | | | 372,532 | |
| Recoveries applied to negative allowance | $ | 441,463 | | | $ | 79,477 | | | $ | 520,940 | | | | $ | 385,283 | | | $ | 78,683 | | | $ | 463,966 | |
(a) Recoveries include cash collections, buybacks and other cash-based adjustments.
(3) Changes in expected recoveries
The Company develops its estimates of expected recoveries by applying discounted cash flow methodologies to its estimated remaining collections and recognizes income over the estimated life of the pool at the constant effective interest rate of the pool. For additional information about these methodologies, refer to Note 1 to the Consolidated Financial Statements in the 2023 Form 10-K.
PRA Group, Inc.
Notes to Consolidated Financial Statements
Changes in expected recoveries for the three months ended June 30, 2024 and 2023 were as follows (amounts in thousands):
| | | | | | | | | | | | | | | | | | | | | | | | | | | | | | | | | | | | | | |
| Three Months Ended June 30, |
| 2024 | | | 2023 |
| Core | | Insolvency | | Total | | | Core | | Insolvency | | Total |
| Recoveries received in excess of forecast | $ | 46,830 | | | $ | 7,430 | | | $ | 54,260 | | | | $ | 21,536 | | | $ | 3,812 | | | $ | 25,348 | |
| Changes in expected future recoveries | 18,917 | | | 143 | | | 19,060 | | | | (3,738) | | | (474) | | | (4,212) | |
| Changes in expected recoveries | $ | 65,747 | | | $ | 7,573 | | | $ | 73,320 | | | | $ | 17,798 | | | $ | 3,338 | | | $ | 21,136 | |
Changes in expected recoveries for the three months ended June 30, 2024 were $73.3 million, which included $54.3 million in recoveries received in excess of forecast (cash collections overperformance), due mainly to collections performance in the U.S., driven in large part by the Company's cash-generating initiatives, coupled with collections performance in Europe. Changes in expected future recoveries of $19.1 million mainly reflect the Company's assessment of certain pools in the U.S. and Europe, resulting in an increase to the expected cash flows based primarily on overperformance in recent periods. The increase in expected cash flows was driven in large part by forecast increases to the 2013 to 2019 U.S. Core pools, as well as increases to a number of pools in Europe.
Changes in expected recoveries for the three months ended June 30, 2023 were a net positive $21.1 million. This included $25.3 million in recoveries received in excess of forecast (cash collections overperformance) and a $4.2 million negative adjustment to changes in expected future recoveries. The $25.3 million in recoveries received in excess of forecast was largely due to overperformance generated from larger than expected one-time payments in Europe and performance on new vintages in South America.
Changes in expected recoveries for the six months ended June 30, 2024 and 2023 were as follows (amounts in thousands):
| | | | | | | | | | | | | | | | | | | | | | | | | | | | | | | | | | | | | | |
| Six Months Ended June 30, |
| 2024 | | | 2023 |
| Core | | Insolvency | | Total | | | Core | | Insolvency | | Total |
| Recoveries received in excess of forecast | $ | 80,748 | | | $ | 9,350 | | | $ | 90,098 | | | | $ | 21,823 | | | $ | 7,363 | | | $ | 29,186 | |
| Changes in expected future recoveries | 34,563 | | | 333 | | | 34,896 | | | | (45,153) | | | 191 | | | (44,962) | |
| Changes in expected recoveries | $ | 115,311 | | | $ | 9,683 | | | $ | 124,994 | | | | $ | (23,330) | | | $ | 7,554 | | | $ | (15,776) | |
Changes in expected recoveries for the six months ended June 30, 2024 were $125.0 million, which included $90.1 million in recoveries received in excess of forecast, due mainly to collections performance in the U.S., driven in large part by the Company's cash-generating initiatives, coupled with collections performance in Brazil and Europe. Changes in expected future recoveries of $34.9 million mainly reflect the Company's assessment of certain pools in the U.S. and Europe, resulting in an increase to the expected cash flows based primarily on overperformance in recent periods. The increase in expected cash flows was driven in large part by forecast increases to the 2013 to 2019 U.S. Core pools, as well as increases to a number of pools in Europe.
Changes in expected recoveries for the six months ended June 30, 2023 were a net negative $15.8 million. This included $29.2 million in recoveries received in excess of forecast (cash collections overperformance), primarily due to strong performance in Europe and South America, and a $45.0 million negative adjustment to changes in expected future recoveries. The changes in expected future recoveries reflect the Company's assessment of certain pools, which resulted in a reduction of expected cash flows due to collections performance in U.S. call centers resulting from weaker economic conditions.
PRA Group, Inc.
Notes to Consolidated Financial Statements
3. Investments:
Investments consisted of the following as of June 30, 2024 and December 31, 2023 (amounts in thousands):
| | | | | | | | | | | |
| June 30, 2024 | | December 31, 2023 |
| | | |
| | | |
| Debt securities | | | |
| | | |
| | | |
| | | |
| Available-for-sale | $ | 47,918 | | | $ | 59,470 | |
| | | |
| | | |
| Equity securities | | | |
| Private equity funds | 2,281 | | | 2,451 | |
| Equity method investment | 9,420 | | | 10,483 | |
| | | |
| Total investments | $ | 59,619 | | | $ | 72,404 | |
Debt Securities
Government securities: As of June 30, 2024, the Company's available-for-sale debt securities consisted of Swedish treasury securities maturing within one year. As of June 30, 2024 and December 31, 2023, the amortized cost and fair value of these investments were as follows (amounts in thousands):
| | | | | | | | | | | | | | | | | | | | | | | |
| June 30, 2024 |
| Amortized Cost | | Gross Unrealized Gains | | Gross Unrealized Losses | | Aggregate Fair Value |
| Available-for-sale | | | | | | | |
| | | | | | | |
| | | | | | | |
| Government securities | $ | 47,741 | | | $ | 177 | | | $ | — | | | $ | 47,918 | |
| | | | | | | |
| | | | | | | |
| | | | | | | |
| December 31, 2023 |
| Amortized Cost | | Gross Unrealized Gains | | Gross Unrealized Losses | | Aggregate Fair Value |
| Available-for-sale | | | | | | | |
| | | | | | | |
| Government securities | $ | 59,404 | | | $ | 66 | | | $ | — | | | $ | 59,470 | |
| | | | | | | |
| | | | | | | |
Equity Method Investment
The Company has an 11.7% interest in RCB Investimentos S.A. ("RCB"), a servicing platform for nonperforming loans in Brazil, accounted for under the equity method.
4. Goodwill:
The Company performs an annual review of goodwill as of October 1 of each year, or more frequently if indicators of impairment exist, with the most recent annual review performed as of October 1, 2023. The Company performed a quarterly assessment by evaluating whether any triggering events had occurred as of June 30, 2024, which included considering current market conditions, and determined that goodwill was not more-likely-than-not impaired. Changes in goodwill for the three and six months ended June 30, 2024 and 2023, were as follows (amounts in thousands):
| | | | | | | | | | | | | | | | | | | | | | | | | | |
| Three Months Ended June 30, | | | Six Months Ended June 30, |
| 2024 | | 2023 | | | 2024 | | 2023 |
| Balance as of beginning of period | $ | 411,846 | | | $ | 420,647 | | | | $ | 431,564 | | | $ | 435,921 | |
| | | | | | | | |
| | | | | | | | |
| | | | | | | | |
| | | | | | | | |
| | | | | | | | |
| | | | | | | | |
| Foreign currency translation | 3,800 | | | (5,742) | | | | (15,918) | | | (21,016) | |
| Balance as of end of period | $ | 415,646 | | | $ | 414,905 | | | | $ | 415,646 | | | $ | 414,905 | |
PRA Group, Inc.
Notes to Consolidated Financial Statements
5. Borrowings:
Borrowings consisted of the following as of June 30, 2024 and December 31, 2023 (amounts in thousands):
| | | | | | | | | | | |
| June 30, 2024 | | December 31, 2023 |
North American revolving credit facility (1) | $ | 219,305 | | | $ | 396,303 | |
United Kingdom revolving credit facility (2) | 495,665 | | | 502,847 | |
European revolving credit facility (3) | 533,653 | | | 538,565 | |
North American term loan (4) | 435,000 | | | 442,500 | |
| Credit facility borrowings | 1,683,623 | | | 1,880,215 | |
| Senior Notes due 2025 (the "2025 Notes") | 298,000 | | | 298,000 | |
| Senior Notes due 2028 (the "2028 Notes") | 398,000 | | | 398,000 | |
| Senior Notes due 2029 (the "2029 Notes") | 350,000 | | | 350,000 | |
| Senior Notes due 2030 (the "2030 Notes") | 400,000 | | | — | |
| Senior notes | 1,446,000 | | | 1,046,000 | |
| Credit facility borrowings and senior notes | 3,129,623 | | | 2,926,215 | |
| Debt discount and issuance costs | (15,846) | | | (11,945) | |
| Borrowings | $ | 3,113,777 | | | $ | 2,914,270 | |
(1)Revolving credit facility under the Company's North American Revolving Credit and Term Loan (the "North American Credit Agreement"), which includes an aggregate principal amount of $1.5 billion (subject to compliance with a borrowing base and applicable debt covenants), consisting of (i) a fully-funded $435.0 million term loan (the "Term Loan"), (ii) a $1.0 billion domestic revolving credit facility, and (iii) a $75.0 million Canadian revolving credit facility, maturing on July 30, 2026.
(2)Revolving credit facility under the Company's United Kingdom ("UK") Credit Agreement (the "UK Credit Agreement"), consisting of an $800.0 million revolving credit facility (subject to a borrowing base) and an accordion feature for up to $200.0 million in additional commitments, subject to certain conditions, maturing on July 30, 2026.
(3)Revolving credit facility under the Company's European Credit Agreement (the "European Credit Agreement"), providing revolving borrowings for an aggregate amount of approximately €730.0 million (subject to the borrowing base and applicable debt covenants) and an accordion feature for up to €500.0 million, subject to certain conditions, maturing on November 23, 2027. As of June 30, 2024, after an increase in the limit during the prior quarter, interest bearing deposits in AK Nordic AB cannot exceed SEK2.2 billion.
(4)Term Loan under the North American Credit Agreement.
During the three months ended June 30, 2024, the Company repaid $395.9 million aggregate principal amount of outstanding borrowings under the North American revolving credit facility with the net proceeds from the issuance of the 2030 Notes. For additional details about the North American Credit Agreement, the UK Credit Agreement, the European Credit Agreement and the Company's senior notes, refer to Note 7 to the Consolidated Financial Statements in the 2023 Form 10-K and description of the 2030 Notes below.
The Company determined that it was in compliance with the covenants contained in its financing arrangements as of June 30, 2024.
2030 Notes
On May 20, 2024, the Company completed the private offering of $400.0 million in aggregate principal amount of its 8.875% Senior Notes due January 31, 2030. The 2030 Notes were issued pursuant to an Indenture dated May 20, 2024 (the "2024 Indenture"), between the Company and Regions Bank, as trustee. The 2024 Indenture contains customary terms and covenants, including certain events of default after which the 2030 Notes may be due and payable immediately. The 2030 Notes are senior unsecured obligations of the Company and are guaranteed on a senior unsecured basis by all of the Company's existing and future domestic restricted subsidiaries that guarantee the North American Credit Agreement, subject to certain exceptions. Interest on the 2030 Notes is payable semi-annually, in arrears, on January 31 and July 31 of each year.
Before June 1, 2026, the Company may redeem the 2030 Notes, in whole or in part, at a price equal to 100% of the aggregate principal amount of the 2030 Notes being redeemed, plus the applicable "make whole" premium. On or before June 1, 2026, the Company may redeem up to 40% of the aggregate principal amount of the 2030 Notes at a redemption price of 108.875% plus accrued and unpaid interest with the net cash proceeds of a public offering of common stock of the Company provided, that at least 60% in aggregate principal amount of the 2030 Notes remains outstanding immediately after the occurrence of such redemption and that such redemption will occur within 90 days of the date of the closing of such public offering.
PRA Group, Inc.
Notes to Consolidated Financial Statements
In addition, on or after June 1, 2026, the Company may redeem the 2030 Notes, in whole or in part, at a price equal to 104.438% of the aggregate principal amount of the 2030 Notes being redeemed. The applicable redemption price changes if redeemed during the 12 months beginning June 1 of each year to 102.219% for 2027 and then 100% for 2028 and thereafter.
In the event of a change of control, each holder will have the right to require the Company to repurchase all or any part of such holder's 2030 Notes at an offer price equal to 101% of the aggregate principal amount plus accrued and unpaid interest. If the Company sells assets under certain circumstances and does not use the proceeds for specified purposes, the Company will be required to make an offer to repurchase the 2030 Notes at 100% of their principal amount plus accrued and unpaid interest.
6. Derivatives:
The Company periodically enters into derivative financial instruments; typically interest rate swaps and foreign currency contracts, to reduce its exposure to fluctuations in interest rates on variable-rate debt and foreign currency exchange rates. Derivative financial instruments are recognized at fair value in the Company's Consolidated Balance Sheets. For further discussion of the Company's use of, and accounting policies for, derivative instruments, refer to Notes 1 and 8 to the Consolidated Financial Statements in the 2023 Form 10-K. The following table summarizes the fair value of derivative financial instruments as of June 30, 2024 and December 31, 2023 (amounts in thousands):
| | | | | | | | | | | | | | | | | | | | | | | | | | |
| | June 30, 2024 | | December 31, 2023 |
| | Balance Sheet Account | | Fair Value | | Balance Sheet Account | | Fair Value |
| Derivatives designated as hedging instruments: | | | | | | | | |
| Interest rate contracts | | Other assets | | $ | 17,570 | | | Other assets | | $ | 21,770 | |
| Interest rate contracts | | Other liabilities | | 5,379 | | | Other liabilities | | 11,627 | |
| Derivatives not designated as hedging instruments: | | | | | | | | |
| Foreign currency contracts | | Other assets | | 890 | | | Other assets | | 1,007 | |
| Foreign currency contracts | | Other liabilities | | 506 | | | Other liabilities | | 8,776 | |
| | | | | | | | |
| | | | | | | | |
Derivatives Designated as Hedging Instruments:
Changes in the fair value of derivative contracts designated as cash flow hedging instruments are recognized in other comprehensive income ("OCI"). As of June 30, 2024 and December 31, 2023, the notional amount of interest rate contracts designated as cash flow hedging instruments was $813.6 million and $872.3 million, respectively. Derivatives designated as cash flow hedging instruments remained highly effective as of June 30, 2024, and have remaining terms from six months to four years. As of June 30, 2024, the Company estimates that $11.5 million of net derivative gains included in OCI will be reclassified into earnings within the next 12 months.
The following tables summarize the effects of derivatives designated as cash flow hedging instruments for the three and six months ended June 30, 2024 and 2023 (amounts in thousands):
| | | | | | | | | | | | | | | | | | | | | | | | | | | | | |
| | Gain recognized in OCI, net of tax |
| | Three Months Ended June 30, | | | Six Months Ended June 30, |
| Hedging instrument | | 2024 | | 2023 | | | 2024 | | 2023 |
| Interest rate contracts | | $ | 2,860 | | | $ | 10,771 | | | | $ | 9,930 | | | $ | 10,142 | |
| | | | | | | | | |
| | Gain reclassified from OCI into income |
| | Three Months Ended June 30, | | | Six Months Ended June 30, |
| Income statement account | | 2024 | | 2023 | | | 2024 | | 2023 |
| Interest expense, net | | $ | 5,532 | | | $ | 6,670 | | | | $ | 11,206 | | | $ | 12,168 | |
During the three months ended June 30, 2024, the Company elected certain of the optional expedients in accordance with ASU 2021-01, "Reference Rate Reform (Topic 848): Overall" ("ASU 2021-01"), and ASU 2022-06, "Reference Rate Reform (Topic 848): Deferral of the Sunset Date of Topic 848" (“ASU 2022-06”), to maintain cash flow hedge accounting for interest contracts with a combined notional amount of CAD 33.2 million.
PRA Group, Inc.
Notes to Consolidated Financial Statements
Derivatives Not Designated as Hedging Instruments:
The Company enters into foreign currency contracts to economically hedge foreign currency remeasurement exposure related to certain balances denominated in currencies other than the functional currency of the Company or its international subsidiaries. Changes in fair value of derivative contracts not designated as hedging instruments are recognized in earnings. As of June 30, 2024 and December 31, 2023, the notional amount of foreign currency contracts was $290.3 million and $368.5 million, respectively.
The following table summarizes the effects of derivatives not designated as hedging instruments for the three and six months ended June 30, 2024 and 2023 (amounts in thousands):
| | | | | | | | | | | | | | | | | | | | | | | | | | | | | | | | | | | |
| | | | Gain/(loss) recognized in income |
| Derivatives not designated as hedging instruments | | | | Three Months Ended June 30, | | | Six Months Ended June 30, |
| Income statement account | | 2024 | | 2023 | | | 2024 | | 2023 |
| Foreign currency contracts | | Foreign exchange gain/(loss), net | | $ | 726 | | | $ | (7,589) | | | | $ | 826 | | | $ | (15,287) | |
| Foreign currency contracts | | Interest expense, net | | 117 | | | 631 | | | | 309 | | | 1,153 | |
| | | | | | | | | | | |
| | | | | | | | | | | |
| | | | | | | | | |
| | | | | | | | | |
| | | | | | | | | | | |
| | | | | | | | | | | |
| | | | | | | | | | | |
| | | | | | | | | | | |
7. Fair Value:
As defined by ASC Topic 820, "Fair Value Measurement and Disclosures" ("ASC 820"), fair value is the price that would be received to sell an asset or paid to transfer a liability in an orderly transaction between market participants at the measurement date. ASC 820 requires the consideration of different input levels in the determination of fair value, as follows:
•Level 1: Quoted prices in active markets for identical assets and liabilities.
•Level 2: Observable inputs other than Level 1 quoted prices, such as quoted prices for similar instruments in active markets, quoted prices for identical or similar instruments in markets that are not active, and model-based valuation techniques for which all significant assumptions are observable in the market.
•Level 3: Unobservable inputs that are supported by little or no market activity. Level 3 assets and liabilities include financial instruments whose value is determined using pricing models, discounted cash flow methodologies, or similar techniques, as well as instruments for which the determination of fair value requires significant management judgment or estimation.
The level in the fair value hierarchy within which a fair value measurement in its entirety falls is based on the lowest level input that is significant to the fair value measurement in its entirety.
Financial Instruments Not Carried at Fair Value
As of June 30, 2024 and December 31, 2023, the carrying amounts and estimated fair values of financial instruments not carried at fair value were as follows (amounts in thousands):
| | | | | | | | | | | | | | | | | | | | | | | |
| June 30, 2024 | | December 31, 2023 |
| Carrying
Amount | | Estimated
Fair Value | | Carrying
Amount | | Estimated
Fair Value |
| Financial assets: | | | | | | | |
| Cash and cash equivalents | $ | 118,865 | | | $ | 118,865 | | | $ | 112,528 | | | $ | 112,528 | |
| | | | | | | |
| | | | | | | |
| Finance receivables, net | 3,820,186 | | | 3,250,769 | | | 3,656,598 | | | 3,167,798 | |
| Financial liabilities: | | | | | | | |
| Interest-bearing deposits | 114,991 | | | 114,991 | | | 115,589 | | | 115,589 | |
| Revolving lines of credit | 1,248,623 | | | 1,248,623 | | | 1,437,715 | | | 1,437,715 | |
Term Loan (1) | 435,000 | | | 435,000 | | | 442,500 | | | 442,500 | |
Senior notes (1) | 1,446,000 | | | 1,397,557 | | | 1,046,000 | | | 964,907 | |
| | | | | | | |
(1)Carrying amounts and estimated fair values do not include debt issuance costs.
The Company uses the following methods and assumptions to estimate the fair value of the above financial instruments:
Cash equivalents: Carrying amount approximates fair value due to the short-term nature of the instruments and the observable quoted prices for identical assets in active markets. Accordingly, the Company uses Level 1 inputs.
PRA Group, Inc.
Notes to Consolidated Financial Statements
Finance receivables, net: The Company estimates the fair value of these receivables using proprietary pricing models that the Company utilizes to make portfolio acquisition decisions. Accordingly, the Company's fair value estimates use Level 3 inputs as there is little observable market data available and management is required to use significant judgment in its estimates.
Interest-bearing deposits: Carrying amount approximates fair value due to the short-term nature of the deposits and the observable quoted prices for similar instruments in active markets. Accordingly, the Company uses Level 2 inputs for its fair value estimates.
Revolving lines of credit: Carrying amount approximates fair value due to the short-term nature of the interest rate periods and the observable quoted prices for similar instruments in active markets. Accordingly, the Company uses Level 2 inputs for its fair value estimate.
Term loan: Carrying amount approximates fair value due to the short-term nature of the interest rate periods and the observable quoted prices for similar instruments in active markets. Accordingly, the Company uses Level 2 inputs for its fair value estimate.
Senior Notes: Fair value estimates for the Senior Notes incorporate quoted market prices obtained from secondary market broker quotes, which were derived from a variety of inputs, including client orders, information from their pricing vendors, modeling software and actual trading prices when they occur. Accordingly, the Company uses Level 2 inputs for its fair value estimates.
Financial Instruments Carried at Fair Value
As of June 30, 2024 and December 31, 2023, financial instruments measured at fair value on a recurring basis were as follows (amounts in thousands):
| | | | | | | | | | | | | | | | | | | | | | | |
| Fair Value Measurements as of June 30, 2024 |
| Level 1 | | Level 2 | | Level 3 | | Total |
| Assets: | | | | | | | |
| | | | | | | |
| Government securities | $ | 47,918 | | | $ | — | | | $ | — | | | $ | 47,918 | |
| | | | | | | |
| | | | | | | |
| Derivative contracts (recorded in Other assets) | — | | | 18,460 | | | — | | | 18,460 | |
| Liabilities: | | | | | | | |
| Derivative contracts (recorded in Other liabilities) | — | | | 5,885 | | | — | | | 5,885 | |
| | | | | | | |
| Fair Value Measurements as of December 31, 2023 |
| Level 1 | | Level 2 | | Level 3 | | Total |
| Assets: | | | | | | | |
| | | | | | | |
| Government securities | $ | 59,470 | | | $ | — | | | $ | — | | | $ | 59,470 | |
| | | | | | | |
| | | | | | | |
| Derivative contracts (recorded in Other assets) | — | | | 22,777 | | | — | | | 22,777 | |
| Liabilities: | | | | | | | |
| Derivative contracts (recorded in Other liabilities) | — | | | 20,403 | | | — | | | 20,403 | |
The Company uses the following methods and assumptions to estimate the fair value of the above financial instruments:
Government securities: Fair value of the Company's investments in government securities is estimated using quoted market prices. Accordingly, the Company uses Level 1 inputs.
Derivative contracts: Fair value of derivative contracts is estimated using industry standard valuation models. These models project future cash flows and discount the future amounts to present value using market-based observable inputs, including interest rate curves and other factors. Accordingly, the Company uses Level 2 inputs for its fair value estimates.
PRA Group, Inc.
Notes to Consolidated Financial Statements
8. Accumulated Other Comprehensive Loss:
Reclassifications out of Accumulated other comprehensive loss for the three and six months ended June 30, 2024 and 2023, were as follows (amounts in thousands):
| | | | | | | | | | | | | | | | | | | | | | | | | | | | | | | | | | | | | | | |
| | | | Three Months Ended June 30, | | | | | Six Months Ended June 30, |
| Gain/(loss) on cash flow hedges | | Income Statement account | | 2024 | | 2023 | | | | | | | 2024 | | 2023 |
| Interest rate swaps | | Interest expense, net | | $ | 5,532 | | | $ | (6,670) | | | | | | | | $ | 11,206 | | | $ | (12,168) | |
Income tax effect of item above (1) | | Income tax expense/(benefit) | | (1,378) | | | 1,618 | | | | | | | | (2,790) | | | 2,914 | |
| Total gain/(loss) on cash flow hedges | | | | $ | 4,154 | | | $ | (5,052) | | | | | | | | $ | 8,416 | | | $ | (9,254) | |
(1)Income tax effects are released from Accumulated other comprehensive loss contemporaneously with the related gross pretax amount.
Changes in Accumulated other comprehensive loss by component, after tax, for the three and six months ended June 30, 2024 and 2023, were as follows (amounts in thousands):
| | | | | | | | | | | | | | | | | | | | | | | | | | | | | | | | | | | | | | | | | | | | | | | | | | | | | |
| | Three Months Ended June 30, |
| | 2024 | | | 2023 |
| | Debt Securities | | Cash | | Currency | | Accumulated | | | Debt Securities | | Cash | | Currency | | Accumulated |
| | Available-for-sale | | Flow Hedges | | Translation Adjustments | | Other Comp. Loss (1) | | | Available-for-sale | | Flow Hedges | | Translation Adjustments | | Other Comp. Loss (1) |
| Balance as of beginning of period | | $ | 111 | | | $ | 9,405 | | | $ | (382,534) | | | $ | (373,018) | | | | $ | (109) | | | $ | 22,973 | | | $ | (379,594) | | | $ | (356,730) | |
| Other comprehensive gain/(loss) before reclassifications | | 65 | | | 2,861 | | | (7,563) | | | (4,637) | | | | (80) | | | 10,771 | | | 3,091 | | | 13,782 | |
| Reclassifications, net | | — | | | (4,154) | | | — | | | (4,154) | | | | — | | | (5,052) | | | — | | | (5,052) | |
| Net current period other comprehensive gain/(loss) | | 65 | | | (1,293) | | | (7,563) | | | (8,791) | | | | (80) | | | 5,719 | | | 3,091 | | | 8,730 | |
| Balance as of end of period | | $ | 176 | | | $ | 8,112 | | | $ | (390,097) | | | $ | (381,809) | | | | $ | (189) | | | $ | 28,692 | | | $ | (376,503) | | | $ | (348,000) | |
| | | | | | | | | | | | | | | | | |
| | | | | | | | | | | |
| | | | | | | | | | | | | | | | | |
| | | | | | | | | | | | | | | | | |
| | | | | | | | | | | | | | | | | |
| | | | | | | | | | | | | | | | | |
| | | | | | | | | | | | | | | | | |
| | | | | | | | | | | | | | | | | |
| | | | | | | | | | | | | | | | | |
(1)Net of deferred taxes for unrealized (gains)/losses from cash flow hedges of $0.4 million and $(1.9) million for the three months ended June 30, 2024 and 2023, respectively.
| | | | | | | | | | | | | | | | | | | | | | | | | | | | | | | | | | | | | | | | | | | | | | | | | | | | | |
| | Six Months Ended June 30, |
| | 2024 | | | 2023 |
| | Debt Securities | | Cash | | Currency | | Accumulated | | | Debt Securities | | Cash | | Currency | | Accumulated |
| | Available-for-sale | | Flow Hedges | | Translation Adjustments | | Other Comp. Loss (1) | | | Available-for-sale | | Flow Hedges | | Translation Adjustments | | Other Comp. Loss (1) |
| Balance at beginning of period | | $ | 65 | | | $ | 6,597 | | | $ | (336,561) | | | $ | (329,899) | | | | $ | (237) | | | $ | 27,804 | | | $ | (375,493) | | | $ | (347,926) | |
| Other comprehensive gain/(loss) before reclassifications | | 111 | | | 9,931 | | | (53,536) | | | (43,494) | | | | 48 | | | 10,142 | | | (1,010) | | | 9,180 | |
| Reclassifications, net | | — | | | (8,416) | | | — | | | (8,416) | | | | — | | | (9,254) | | | — | | | (9,254) | |
| Net current period other comprehensive gain/(loss) | | 111 | | | 1,515 | | | (53,536) | | | (51,910) | | | | 48 | | | 888 | | | (1,010) | | | (74) | |
| Balance at end of period | | $ | 176 | | | $ | 8,112 | | | $ | (390,097) | | | $ | (381,809) | | | | $ | (189) | | | $ | 28,692 | | | $ | (376,503) | | | $ | (348,000) | |
| | | | | | | | | | | | | | | | | |
| | | | | | | | | | | |
| | | | | | | | | | | | | | | | | |
| | | | | | | | | | | | | | | | | |
| | | | | | | | | | | | | | | | | |
| | | | | | | | | | | | | | | | | |
| | | | | | | | | | | | | | | | | |
| | | | | | | | | | | | | | | | | |
| | | | | | | | | | | | | | | | | |
(1)Net of deferred taxes for unrealized gains from cash flow hedges $(2.7) million and $(9.5) million for the six months ended June 30, 2024 and 2023, respectively.
PRA Group, Inc.
Notes to Consolidated Financial Statements
9. Earnings per Share:
Basic earnings per share ("EPS") are computed by dividing net income available to common stockholders of PRA Group, Inc. by weighted average common shares outstanding. Diluted EPS are computed using the same components as basic EPS, with the denominator adjusted for nonvested share awards, if dilutive. Share-based awards that are contingent upon the attainment of performance goals are included in the computation of diluted EPS if the effect is dilutive. The dilutive effect of nonvested shares is computed using the treasury stock method, which assumes any proceeds that could be obtained upon the vesting of nonvested shares would be used to purchase common shares at the average market price for the period.
The following tables provide a reconciliation between the computation of basic and diluted EPS for the three and six months ended June 30, 2024 and 2023 (amounts in thousands, except per share amounts):
| | | | | | | | | | | | | | | | | | | | | | | | | | | | | | | | | | | | | | |
| Three Months Ended June 30, |
| 2024 | | | 2023 |
| Net Income Attributable to PRA Group, Inc. | | Weighted
Average
Common Shares | | EPS | | | Net Loss Attributable to PRA Group, Inc. | | Weighted
Average
Common Shares | | EPS |
| Basic EPS | $ | 21,516 | | | 39,364 | | | $ | 0.55 | | | | $ | (3,804) | | | 39,190 | | | $ | (0.10) | |
| Dilutive effect of nonvested share awards | | | 182 | | | (0.01) | | | | | | — | | | — | |
| | | | | | | | | | | | |
| Diluted EPS | $ | 21,516 | | | 39,546 | | | $ | 0.54 | | | | $ | (3,804) | | | 39,190 | | | $ | (0.10) | |
| | | | | | | | | | | | |
| Six Months Ended June 30, |
| 2024 | | | 2023 |
| Net Loss Attributable to PRA Group, Inc. | | Weighted
Average
Common Shares | | EPS | | | Net Income Attributable to PRA Group, Inc. | | Weighted
Average
Common Shares | | EPS |
| Basic EPS | $ | 24,991 | | | 39,319 | | | $ | 0.64 | | | | $ | (62,433) | | | 39,111 | | | $ | (1.60) | |
| Dilutive effect of nonvested share awards | | | 178 | | | (0.01) | | | | | | — | | | — | |
| Diluted EPS | $ | 24,991 | | | 39,497 | | | $ | 0.63 | | | | $ | (62,433) | | | 39,111 | | | $ | (1.60) | |
10. Commitments and Contingencies:
Forward Flow Agreements:
The Company enters into forward flow agreements for the purchase of nonperforming loans. These agreements typically have terms ranging from six to 12 months, or they can be open-ended, and establish purchase prices and specific criteria for the accounts to be purchased. Some of the agreements establish a volume reference for the contract term in the form of a target or maximum, however, very few agreements establish a minimum contractual obligation, and many of the contracts contain early termination provisions allowing either party to cancel the agreements in accordance with a specified notice period. The amounts purchased are also dependent on actual delivery by the sellers, and while purchases under these agreements comprise a significant portion of the Company's overall purchases, as of June 30, 2024, the minimum purchase obligation under these forward flow agreements was not significant.
Litigation and Regulatory Matters:
The Company and its subsidiaries are from time-to-time subject to a variety of legal and regulatory claims, inquiries and proceedings and regulatory matters, most of which are incidental to the ordinary course of its business. The Company initiates lawsuits against customers and is occasionally countersued by them in such actions. Also, customers, either individually, as members of a class action, or through a governmental entity on behalf of customers, may initiate litigation against the Company in which they allege that the Company has violated a law in the process of collecting on an account. From time-to-time, other types of lawsuits are brought against the Company. Additionally, the Company receives subpoenas and other requests or demands for information from regulators or governmental authorities who are investigating the Company's debt collection activities.
The Company accrues for potential liability arising from legal proceedings and regulatory matters when it is probable that such liability has been incurred and the amount of the loss can be reasonably estimated. This determination is based upon currently available information for those proceedings in which the Company is involved, taking into account the Company's best estimate of such losses for those cases for which such estimates can be made. The Company's estimate involves significant judgment, given the varying stages of the proceedings (including the fact that many of them are currently in preliminary stages),
PRA Group, Inc.
Notes to Consolidated Financial Statements
the number of unresolved issues in many of the proceedings (including issues regarding class certification and the scope of many of the claims), and the related uncertainty of the potential outcomes of these proceedings. In making determinations of the likely outcome of pending litigation, the Company considers many factors, including, but not limited to, the nature of the claim, the Company's experience with similar types of claims, the jurisdiction in which the matter is filed, input from outside legal counsel, the likelihood of resolving the matter through alternative mechanisms, the matter's current status and the damages sought or demands made. Accordingly, the Company's estimate will change from time to time, and actual losses could exceed the current estimate.
In certain legal proceedings, the Company may have recourse to insurance or third-party contractual indemnities to cover all or portions of its litigation expenses, judgments, or settlements. Loss estimates and accruals for potential liability related to legal proceedings are typically exclusive of potential recoveries, if any, under the Company's insurance policies or third-party indemnities.
The Company believes that the estimate of the aggregate range of reasonably possible losses in excess of the amount accrued for its legal proceedings outstanding as of June 30, 2024, where the range of loss can be estimated, was not material. As of June 30, 2024, there were no material developments in the legal proceedings included in Note 14 to the Consolidated Financial Statements in the 2023 Form 10-K, and there were no new material legal proceedings during the three months ended June 30, 2024.
11. Recently Issued Accounting Standards:
Recently issued accounting standards not yet adopted:
In November 2023, the Financial Accounting Standards Board ("FASB") issued ASU 2023-07, "Segment Reporting (Topic 280): Improvements to Reportable Segment Disclosures" ("ASU 2023-07"), which, among other updates, requires enhanced disclosures about significant segment expenses regularly provided to the chief operating decision maker, as well as the aggregate amount of other segment items included in the reported measure of segment profit or loss. ASU 2023-07 is effective for fiscal years beginning after December 15, 2023, and for interim periods within fiscal years beginning after December 15, 2024, and requires retrospective adoption. Early adoption is permitted.
In December 2023, the FASB issued ASU 2023-09, "Income Taxes (Topic 740): Improvements to Income Tax Disclosures" ("ASU 2023-09"), which requires enhanced annual disclosures with respect to the rate reconciliation and income taxes paid information. ASU 2023-09 is effective for fiscal years beginning after December 15, 2024, and may be adopted on a prospective or retrospective basis. Early adoption is permitted.
The Company is currently evaluating both ASU 2023-07 and ASU 2023-09 to determine the impacts on its disclosures.
Item 2. Management's Discussion and Analysis of Financial Condition and Results of Operations
All references in this Quarterly Report on Form 10-Q ("Quarterly Report") to "PRA Group," "we," "our," "us," "the Company" or similar terms are to PRA Group, Inc. and its subsidiaries.
Forward-Looking Statements:
This Quarterly Report contains forward-looking statements as defined by the Private Securities Litigation Reform Act of 1995. Statements other than statements of historical fact are forward-looking statements, including statements regarding cash collection trends, operating cost trends, liquidity and capital needs and other statements of expectations, beliefs, future plans, strategies and anticipated events or trends. Our results could differ materially from those expressed or implied by such forward-looking statements, or our forward-looking statements could be wrong, as a result of risks, uncertainties and assumptions, including the following:
•a deterioration in the economic or inflationary environment in the markets in which we operate;
•our ability to replace our portfolios of nonperforming loans with additional portfolios sufficient to operate efficiently and profitably and/or purchase nonperforming loans at appropriate prices;
•our ability to collect sufficient amounts on our nonperforming loans to fund our operations, including as a result of restrictions imposed by local, state, federal and international laws and regulations;
•a disruption or failure by any of our outsourcing or offshoring third party service providers to meet their obligations and our service level expectations;
•our ability to successfully implement our strategic and operational initiatives in our U.S. business;
•changes in accounting standards and their interpretations;
•the impact of a disease outbreak on the markets in which we operate and our ability to successfully manage the challenges associated with a disease outbreak, including epidemics, pandemics or similar widespread public health concerns;
•the occurrence of goodwill impairment charges;
•loss contingency accruals that are inadequate to cover actual losses;
•our ability to manage risks associated with our international operations;
•changes in local, state, federal or international laws or the interpretation of these laws, including tax, bankruptcy and collection laws;
•our ability to comply with existing and new regulations of the collection industry;
•changes in tax provisions or exposure to additional tax liabilities;
•investigations, reviews, or enforcement actions by governmental authorities, including the Consumer Financial Protection Bureau ("CFPB");
•our ability to comply with data privacy regulations such as the General Data Protection Regulation ("GDPR");
•adverse outcomes in pending litigation or administrative proceedings;
•our ability to retain, expand, renegotiate or replace our credit facilities and our ability to comply with the covenants under our financing arrangements;
•our ability to manage our capital and liquidity needs effectively, including as a result of changes in credit or capital markets or adverse changes in our credit ratings, whether due to concerns about our industry in general, the financial condition of our competitors, or other factors;
•changes in interest or exchange rates;
•default by, or failure of, one or more of our counterparty financial institutions;
•disruptions of business operations caused by cybersecurity incidents or the underperformance or failure of information technology infrastructure, networks or communication systems; and
•the "Risk Factors" in Item 1A of our Annual Report on Form 10-K for the year ended December 31, 2023 ("2023 Form 10-K") and in other filings with the Securities and Exchange Commission.
You should assume that the information appearing in this Quarterly Report is accurate only as of the date it was issued. Our business, financial condition, results of operations and prospects may have changed since that date. The future events, developments or results described in, or implied by, this Quarterly Report could turn out to be materially different. Except as required by law, we assume no obligation to publicly update or revise our forward-looking statements after the date of this Quarterly Report and you should not expect us to do so.
Frequently Used Terms
We may use the following terminology throughout this Quarterly Report:
•"Buybacks" refers to purchase price refunded by the seller due to the return of ineligible nonperforming loan accounts.
•"Cash collections" refers to collections on our nonperforming loan portfolios.
•"Cash receipts" refers to cash collections on our nonperforming loan portfolios, fees and revenue recognized from our class action claims recovery services.
•"Changes in expected recoveries" refers to the differences of actual recoveries received when compared to expected recoveries and the net present value of changes in estimated remaining collections.
•"Core" accounts or portfolios refer to accounts or portfolios that are nonperforming loans and are not in an insolvent status upon acquisition. These accounts are aggregated separately from insolvency accounts.
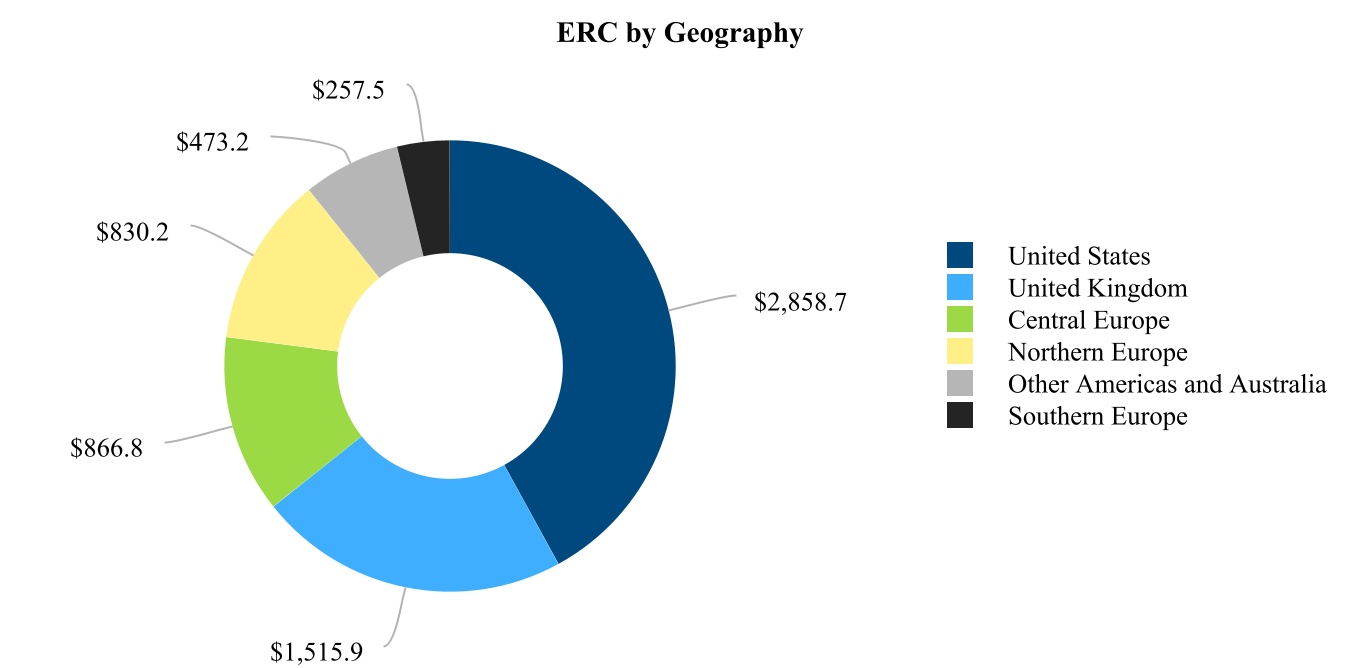
•"Estimated remaining collections" or "ERC" refers to the sum of all future projected cash collections on our nonperforming loan portfolios.
•"Finance receivables" or "receivables" refers to the negative allowance for expected recoveries recorded on our balance sheet as an asset.
•"Insolvency" accounts or portfolios refer to accounts or portfolios of nonperforming loans that are in an insolvent status when we purchase them and, as such, are purchased as a pool of insolvent accounts. These accounts include Individual Voluntary Arrangements ("IVAs"), Trust Deeds in the UK, Consumer Proposals in Canada and bankruptcy accounts in the U.S., Canada, Germany and the UK.
•"Negative allowance" refers to the present value of cash flows expected to be collected on our finance receivables.
•"Portfolio acquisitions" refers to all nonperforming loan portfolios acquired as a result of a purchase or added as a result of a business acquisition.
•"Portfolio purchases" refers to all nonperforming loan portfolios purchased in the normal course of business and excludes those added as a result of business acquisitions.
•"Portfolio income" reflects revenue recorded due to the passage of time using the effective interest rate calculated based on the purchase price of nonperforming loan portfolios and estimated remaining collections.
•"Purchase price" refers to the cash paid to a seller to acquire nonperforming loans.
•"Purchase price multiple" refers to the total estimated collections on our nonperforming loan portfolios divided by purchase price.
•"Recoveries" refers to cash collections plus buybacks and other adjustments.
•"Total estimated collections" or "TEC" refers to actual cash collections plus estimated remaining collections on our nonperforming loan portfolios.
Executive Overview
We are a global financial and business services company with operations in the Americas, Europe and Australia. Our primary business is the purchase, collection and management of portfolios of nonperforming loans. We are headquartered in Norfolk, Virginia, and our shares of common stock are traded on the Nasdaq Global Select Market under the symbol "PRAA".
| | | | | | | | |
| For the second quarter of 2024, we generated: | | Year-to-date June 30, 2024, we generated: |
•Total portfolio purchases of $379.4 million. | | •Total portfolio purchases of $625.2 million. |
•Total cash collections of $473.9 million. | | •Total cash collections of $923.4 million. |
•Cash efficiency ratio of 58.9%. | | •Cash efficiency ratio of 58.4%. |
•Diluted earnings per share of $0.54. | | •Diluted earnings per share of $0.63. |
•ERC of $6.8 billion as of June 30, 2024. | | |
With continued focus on our strategic roadmap - optimizing investments, driving operational execution and managing expenses - we took another important step in demonstrating the turnaround of our U.S. business in the second quarter of 2024, delivering against our financial and operational targets for the year and positioning the Company for future growth.
Total portfolio purchases of $379.4 million during the quarter represented our third-highest quarterly level of purchases over the past five years. Cash collections increased 13.0% compared to the second quarter of 2023, reflecting higher recent purchasing levels and the positive impact of cash-generating initiatives in the U.S., as well as continued collections growth in our European business.
Looking ahead, we expect portfolio purchases to remain strong through the remainder of the year and cash collections to sustain the growth rate observed during the first half of 2024. We also expect that cash efficiency for the year will be approximately 60%, as our strategies driving operational improvements and effectiveness are partially offset by the investments in our legal collections channel.
Americas
In the U.S., we continued to capitalize on strong levels of portfolio supply, driven by higher industry credit card balances and rising delinquency and charge-off rates, with U.S. portfolio purchases reaching $206.8 million for the quarter. Although certain customer segments appear to be experiencing stress from high interest rates and inflation, we have seen significant growth in the number of committed payment plans from our customer base. In our U.S. call centers, we made significant enhancements to our operating processes during the quarter, and in the legal collections channel, we have leveraged our internal resources and expanded the use of external resources to generate incremental cash collections. To support increased buying in the U.S., we have expanded our call center staffing, focusing on offshoring initiatives to counter the expense impact, and more than 25% of collectors supporting our U.S. business are now based offshore. In Brazil, we have continued to leverage our partnerships in the market to invest in a significant amount of portfolios, realizing solid rates of return on our investments.
Europe
In Europe, strong supply in the spot market led to a record amount of second quarter purchases, spanning all of our major markets, and since Europe is primarily a spot-driven market, volumes are dependent on seller strategies and timing. Although the consumer environment in Europe reflects some of the same economic factors as the U.S., we are also experiencing some positive trends, with the proportion of paying customers remaining stable and larger payments in certain markets starting to show signs of improvement. We also just marked the 10-year anniversary of our acquisition of Aktiv Capital A.S. in 2014, which elevated the Company from a primarily U.S.-based organization to a global enterprise with a diverse European footprint.
Summary of Selected Financial Data | | | | | | | | | | | | | | | | | | | | | | | | | | | | | | | | | | | | | | |
| As of or for the period ended (in thousands, except per share, ratio, headcount data or where otherwise noted) | | Second Quarter | | Year-to-Date |
| 2024 | | 2023 | | % Change | | 2024 | | 2023 | | % Change |
| Income statement | | | | | | | | | | | | |
| Portfolio income | | $ | 209,290 | | | $ | 184,290 | | | 13.6 | % | | $ | 411,346 | | | $ | 372,532 | | | 10.4 | % |
| | | | | | | | | | | | |
| Changes in expected recoveries | | 73,320 | | | 21,136 | | | 246.9 | | | 124,994 | | | (15,776) | | | 892.3 | |
| | | | | | | | | | | | |
| Total operating expenses | | 195,007 | | | 163,675 | | | 19.1 | | | 384,197 | | | 352,789 | | | 8.9 | |
| | | | | | | | | | | | |
| Interest expense, net | | 55,353 | | | 43,022 | | | 28.7 | | | 107,631 | | | 81,305 | | | 32.4 | |
| | | | | | | | | | | | |
| Income tax expense/(benefit) | | 8,702 | | | 1,578 | | | 451.5 | | | 11,088 | | | (17,105) | | | 164.8 | |
| | | | | | | | | | | | |
| Net income/(loss) attributable to PRA Group | | 21,516 | | | (3,804) | | | 665.6 | | | 24,991 | | | (62,433) | | | 140.0 | |
| | | | | | | | | | | | |
| Common share data | | | | | | | | | | | | |
| Diluted earnings per share | | $ | 0.54 | | | $ | (0.10) | | | 640.0 | % | | $ | 0.63 | | | $ | (1.60) | | | 139.4 | % |
| Diluted average common shares outstanding | | 39,546 | | | 39,190 | | | 0.9 | | | 39,497 | | | 39,111 | | | 1.0 | |
| Common shares outstanding (period-end) | | 39,417 | | | 39,242 | | | 0.4 | | | | | | | |
| Portfolio volumes | | | | | | | | | | | | |
| Total portfolio purchases | | $ | 379,369 | | | $ | 327,759 | | | 15.7 | % | | $ | 625,186 | | | $ | 557,984 | | | 12.0 | % |
| Total cash collections | | 473,882 | | | 419,319 | | | 13.0 | | | 923,400 | | | 830,603 | | | 11.2 | |
| Estimated remaining collections (period-end) | | 6,802,246 | | | 5,903,770 | | | 15.2 | | | | | | | |
| Balance sheet (period-end) | | | | | | | | | | | | |
| Finance receivables, net | | $ | 3,820,186 | | | $ | 3,424,548 | | | 11.6 | % | | | | | | |
| Borrowings | | 3,113,777 | | | 2,739,667 | | | 13.7 | | | | | | | |
| Total stockholders' equity - PRA Group, Inc. | | 1,145,463 | | | 1,165,525 | | | (1.7) | | | | | | | |
| Performance data and ratios | | | | | | | | | | | | |
Cash efficiency ratio (1) | | 58.9 | % | | 61.2 | % | | (3.8) | % | | 58.4 | % | | 57.8 | % | | 1.0 | % |
| Net income/(loss) attributable to PRA Group (last 12 months) | | $ | 3,945 | | | $ | (21,740) | | | 118.1 | | | | | | | |
Adjusted EBITDA (last 12 months) (2) | | 1,065,186 | | | 993,317 | | | 7.2 | | | | | | | |
| | | | | | | | | | | | |
| | | | | | | | | | | | |
Return on average Total stockholders' equity - PRA Group (3) | | 7.6 | % | | (1.3) | % | | 684.6 | | | 4.4 | % | | (10.5) | % | | 141.9 | |
Return on average tangible equity (4) | | 11.9 | % | | (2.0) | % | | 695.0 | | | 6.9 | % | | (16.5) | % | | 141.8 | |
| Credit facility availability (period-end) | | | | | | | | | | | | |
| Availability based on current ERC | | $ | 741,927 | | | $ | 332,491 | | | 123.1 | % | | | | | | |
| Additional availability | | 706,614 | | | 1,116,113 | | | (36.7) | | | | | | | |
| Total availability | | 1,448,541 | | | 1,448,604 | | | — | | | | | | | |
| Headcount (period-end) | | | | | | | | | | | | |
| Full-time equivalents | | 3,158 | | | 3,145 | | | 0.4 | % | | | | | | |
(1)Calculated by dividing cash receipts less operating expenses by cash receipts.
(2)Adjusted earnings before interest, taxes, depreciation and amortization ("Adjusted EBITDA") is a non-GAAP financial measure. Refer to section "Non-GAAP Financial Measures" for a reconciliation of Net Income/(loss) attributable to PRA Group, the most directly comparable financial measure calculated and reported in accordance with GAAP, to Adjusted EBITDA. (3)Calculated by dividing annualized net income income/(loss) attributable to PRA Group by average Total stockholders' equity - PRA Group for the period.
(4)Return on average tangible equity ("ROATE") is a non-GAAP financial measure. Average tangible equity ("ATE") is also a non-GAAP financial measure. Refer to section "Non-GAAP Financial Measures" for a reconciliation of Total stockholders' equity - PRA Group, the most directly comparable financial measure calculated and reported in accordance with GAAP, to ATE.
Results of Operations
Three and six months ended June 30, 2024 ("Q2 2024" and "2024 year-to-date") compared to three and six months ended June 30, 2023 ("Q2 2023" and "2023 year-to-date").
Cash Collections
Cash collections were as follows for the periods indicated (amounts in thousands):
| | | | | | | | | | | | | | | | | | | | | | | | | | | | | | | | | | | | | | | | | | | | | | | | | | |
| Second Quarter | | | Year-to-Date |
| 2024 | | 2023 | | $ Change | | % Change | | | 2024 | | 2023 | | $ Change | | % Change |
| Americas and Australia Core | $ | 263,828 | | | $ | 220,886 | | | $ | 42,942 | | | 19.4 | % | | | $ | 520,689 | | | $ | 448,846 | | | $ | 71,843 | | | 16.0 | % |
| Americas Insolvency | 26,971 | | | 26,384 | | | 587 | | | 2.2 | | | | 52,179 | | | 52,135 | | | 44 | | | 0.1 | |
| Europe Core | 156,739 | | | 149,324 | | | 7,415 | | | 5.0 | | | | 302,672 | | | 283,329 | | | 19,343 | | | 6.8 | |
| Europe Insolvency | 26,344 | | | 22,725 | | | 3,619 | | | 15.9 | | | | 47,860 | | | 46,293 | | | 1,567 | | | 3.4 | |
| Cash collections | $ | 473,882 | | | $ | 419,319 | | | $ | 54,563 | | | 13.0 | % | | | $ | 923,400 | | | $ | 830,603 | | | $ | 92,797 | | | 11.2 | % |
Cash collections adjusted (1) | $ | 473,882 | | | $ | 418,272 | | | $ | 55,610 | | | 13.3 | % | | | $ | 923,400 | | | $ | 837,316 | | | $ | 86,084 | | | 10.3 | % |
(1)Cash collections adjusted refers to prior year period foreign currency cash collections remeasured at average U.S. dollar exchange rates for the current year period.
Cash collections were $473.9 million in Q2 2024, an increase of $54.6 million, or 13.0%, compared to $419.3 million in Q2 2023. The increase was primarily due to an increase in U.S. Core cash collections of $42.4 million, mainly due to the impact of higher recent purchasing levels and our cash-generating initiatives, particularly in the legal collections channel. Also contributing to the increase were increased cash collections in Europe of $11.0 million, primarily due to higher recent purchasing levels.
Year-to-date cash collections increased by $92.8 million, or 11.2%, reflecting an increase of $63.6 million in U.S. Core cash collections and higher cash collections in Europe and Brazil of $20.9 million and $6.6 million, respectively. The increase in cash collections was primarily due to the same factors impacting the second quarter comparison as described above.
Portfolio Revenue
Total portfolio revenue was as follows for the periods indicated (amounts in thousands):
| | | | | | | | | | | | | | | | | | | | | | | | | | | | | | | | | | | | | | | | | | | | | | | | | | |
| Second Quarter | | | Year-to-Date |
| 2024 | | 2023 | | $ Change | | % Change | | | 2024 | | 2023 | | $ Change | | % Change |
| Portfolio income | $ | 209,290 | | | $ | 184,290 | | | $ | 25,000 | | | 13.6 | % | | | $ | 411,346 | | | $ | 372,532 | | | $ | 38,814 | | | 10.4 | % |
| Changes in expected recoveries | 73,320 | | | 21,136 | | | 52,184 | | | 246.9 | | | | 124,994 | | | (15,776) | | | 140,770 | | | 892.3 | |
| Total portfolio revenue | $ | 282,610 | | | $ | 205,426 | | | $ | 77,184 | | | 37.6 | % | | | $ | 536,340 | | | $ | 356,756 | | | $ | 179,584 | | | 50.3 | % |
| | | | | | | | | | | | | | | | |
| | | | | | | | | | | | | | | | |
Total portfolio revenue was $282.6 million in Q2 2024, an increase of $77.2 million, or 37.6%, compared to $205.4 million in Q2 2023. The increase was primarily due to an increase of $52.2 million in changes in expected recoveries, driven mainly by cash collections overperformance in the U.S., driven in large part by our cash-generating initiatives, including higher legal collections, as well as cash collections overperformance in Europe. Furthermore, in the U.S. and Europe, based primarily on overperformance in recent periods, there was a net increase to the ERC of certain pools in Q2 2024 compared to a net decrease in Q2 2023. The increase of $25.0 million in portfolio income was primarily due to the impact of higher purchasing and improved pricing in the U.S. and Europe beginning in 2023.
Year-to-date portfolio revenue increased by $179.6 million, or 50.3%, primarily due to an increase of $140.8 million in changes in expected recoveries, driven mainly by a net increase to the ERC of certain pools in the U.S., Europe and Brazil compared to a net decrease in the prior year period, as well as cash collections overperformance in the U.S. and Europe. The $38.8 million increase in portfolio income was primarily due to the impact of higher purchasing and improved pricing in the U.S. and Europe beginning in 2023.
Operating Expenses
Total operating expenses were as follows for the periods indicated (amounts in thousands):
| | | | | | | | | | | | | | | | | | | | | | | | | | | | | | | | | | | | | | | | | | | | | | | | | | |
| Second Quarter | | | Year-to-Date |
| 2024 | | 2023 | | $ Change | | % Change | | | 2024 | | 2023 | | $ Change | | % Change |
| Compensation and employee services | $ | 74,241 | | | $ | 65,788 | | | $ | 8,453 | | | 12.8 | % | | | $ | 147,838 | | | $ | 148,191 | | | $ | (353) | | | (0.2) | % |
| Legal collection fees | 13,762 | | | 9,551 | | | 4,211 | | | 44.1 | | | | 25,874 | | | 18,389 | | | 7,485 | | | 40.7 | |
| Legal collection costs | 35,274 | | | 21,522 | | | 13,752 | | | 63.9 | | | | 61,965 | | | 45,467 | | | 16,498 | | | 36.3 | |
| Agency fees | 21,008 | | | 17,677 | | | 3,331 | | | 18.8 | | | | 40,731 | | | 35,055 | | | 5,676 | | | 16.2 | |
| Outside fees and services | 18,124 | | | 18,262 | | | (138) | | | (0.8) | | | | 43,174 | | | 43,206 | | | (32) | | | (0.1) | |
| Communication | 11,577 | | | 10,117 | | | 1,460 | | | 14.4 | | | | 24,155 | | | 20,644 | | | 3,511 | | | 17.0 | |
| Rent and occupancy | 4,136 | | | 4,319 | | | (183) | | | (4.2) | | | | 8,280 | | | 8,767 | | | (487) | | | (5.6) | |
| Depreciation and amortization | 2,637 | | | 3,482 | | | (845) | | | (24.3) | | | | 5,357 | | | 7,071 | | | (1,714) | | | (24.2) | |
| | | | | | | | | | | | | | | | |
| Other operating expenses | 14,248 | | | 12,957 | | | 1,291 | | | 10.0 | | | | 26,823 | | | 25,999 | | | 824 | | | 3.2 | |
| Total operating expenses | $ | 195,007 | | | $ | 163,675 | | | $ | 31,332 | | | 19.1 | % | | | $ | 384,197 | | | $ | 352,789 | | | $ | 31,408 | | | 8.9 | % |
| | | | | | | | | | | | | | | | |
Compensation and employee services
Q2 2024 compensation and employee services expense increased $8.4 million, or 12.8%, mainly reflecting lower compensation accruals in Q2 2023. The Q2 2024 expense is comparable to the two most recent quarters and reflects our leveraging of third parties and offshore call centers to help offset the costs associated with a significant increase in account volumes and customer contacts. The 2024 year-to-date expense was largely consistent with the prior year period, decreasing by $0.4 million.
Legal collection fees
Legal collection fees represent contingent fees incurred for cash collections generated by our third-party attorney network. Q2 2024 fees increased $4.2 million, or 44.1%, mainly reflecting higher external legal collections within our U.S. Core portfolio. Increased external legal collections in the U.S. were also the primary driver of the $7.5 million, or 40.7%, increase for the year-to-date period.
Legal collection costs
Legal collection costs consist primarily of costs paid to courts where a lawsuit is filed for the purpose of attempting to collect on an account. Q2 2024 costs increased $13.8 million, or 63.9%, primarily due to increased activity in our U.S. legal collections channel, as well as the expansion of legal collection activities in Europe. The growth in legal collections activity also drove the $16.5 million, or 36.3%, increase for the year-to-date period.
Agency fees
Agency fees primarily represent third-party collection fees. Q2 2024 fees increased $3.3 million, or 18.8%, mainly reflecting higher fees paid on collections in Brazil. Collection fees in Brazil were also the primary driver of the $5.7 million, or 16.2%, increase for the year-to-date period.
Communication
Communication expense relates mainly to correspondence, network and calling costs associated with our cash-generating initiatives. An expansion in account volumes drove both the Q2 2024 increase of $1.5 million, or 14.4%, and the $3.5 million, or 17.0%, increase for the year-to-date period.
Interest Expense, Net
Interest expense, net was as follows for the periods indicated (amounts in thousands): | | | | | | | | | | | | | | | | | | | | | | | | | | | | | | | | | | | | | | | | | | | | | | | | | | |
| Second Quarter | | | Year-to-Date |
| 2024 | | 2023 | | $ Change | | % Change | | | 2024 | | 2023 | | $ Change | | % Change |
| Interest on debt obligations and unused line fees | $ | 33,180 | | | $ | 25,154 | | | $ | 8,026 | | | 31.9 | % | | | $ | 67,135 | | | $ | 46,978 | | | $ | 20,157 | | | 42.9 | % |
| Interest on senior notes | 22,246 | | | 18,165 | | | 4,081 | | | 22.5 | | | | 40,448 | | | 33,238 | | | 7,210 | | | 21.7 | |
| Coupon interest on convertible notes | — | | | 2,013 | | | (2,013) | | | (100.0) | | | | — | | | 5,032 | | | (5,032) | | | (100.0) | |
| Amortization of loan fees and other loan costs | 2,331 | | | 2,384 | | | (53) | | | (2.2) | | | | 4,531 | | | 4,825 | | | (294) | | | (6.1) | |
| Interest income | (2,404) | | | (4,694) | | | 2,290 | | | (48.8) | | | | (4,483) | | | (8,768) | | | 4,285 | | | (48.9) | |
| Interest expense, net | $ | 55,353 | | | $ | 43,022 | | | $ | 12,331 | | | 28.7 | % | | | $ | 107,631 | | | $ | 81,305 | | | $ | 26,326 | | | 32.4 | % |
Interest expense, net was $55.4 million in Q2 2024, an increase of $12.4 million, or 28.8%, compared to $43.0 million in Q2 2023. Interest expense, net increased by $26.3 million, or 32.3%, for the year-to-date period. The main drivers of the increases in both the second quarter and year-to-date periods were higher average debt balances and increased interest rates.
Income Tax Expense/(Benefit)
Income tax expense was $8.7 million in Q2 2024 compared to $1.6 million in Q2 2023. In Q2 2024, our effective tax rate was 25.7% compared to 57.6% in Q2 2023. Year-to-date income tax expense was $11.1 million in 2024 compared to a tax benefit of $17.1 million in the prior year period. The 2024 year-to-date effective tax rate was 23.1% compared to an effective tax benefit rate of 24.5% in the prior year period. Higher income before taxes drove increased income tax expense in both the second quarter and year-to-date periods, and the effective tax rate comparison was impacted by higher income before taxes in the current year periods, as well as changes in the mix of income from different taxing jurisdictions and the timing and amount of discrete items.
Balance Sheet
Finance receivables, net
Finance receivables, net were $3.8 billion as of June 30, 2024, an increase of $163.6 million, or 4.5%, compared to $3.7 billion as of December 31, 2023. Portfolio acquisitions of $625.2 million and changes in expected recoveries of $125.0 million were partially offset by recoveries applied to the negative allowance of $520.9 million.
Compared to June 30, 2023, finance receivables, net increased by $395.6 million, resulting from portfolio acquisitions of $1.2 billion and changes in expected recoveries of $169.9 million, partially offset by recoveries applied to the negative allowance of $974.0 million.
Borrowings
Borrowings were $3.1 billion as of June 30, 2024, an increase of $199.5 million, or 6.8%, compared to $2.9 billion as of December 31, 2023. Net proceeds of $395.9 million from the issuance of our Senior Notes due 2030 ("2030 Notes") were partially offset by a net reduction of $189.1 million in the amount drawn under our revolving credit facilities.
Compared to June 30, 2023, borrowings increased by $374.1 million. This was primarily due to net proceeds of $395.9 million from the issuance of our 2030 Notes, partially offset by a net reduction of $13.7 million in the amount drawn under our revolving credit facilities.
Supplemental Performance Data
Finance Receivables Portfolio Performance
We purchase portfolios of nonperforming loans from a variety of credit originators, or acquire portfolios through strategic acquisitions, and segregate them into two main portfolio segments: Core or Insolvency, based on the status of the account upon acquisition. In addition, the accounts are segregated into geographical regions based upon where the account was acquired. Ultimately, accounts are aggregated into annual pools based on portfolio segment, geography and year of acquisition. Portfolios of accounts that were in an insolvency status at the time of acquisition are represented in the Insolvency tables below. All other acquisitions of portfolios of accounts are included in our Core portfolio tables as represented below. Once an account is initially segregated, it is not later transferred from an Insolvency pool to a Core pool, or vice versa, and the account continues to be accounted for as originally segregated regardless of any future changes in operational status. Specifically, if a Core account files for bankruptcy or insolvency protection after acquisition, we adjust our collection practices to comply with any respective bankruptcy or insolvency rules or policies; however, for accounting purposes, the account remains in the Core pool. In the event an Insolvency account is dismissed from its bankruptcy or insolvency status whether voluntarily or involuntarily, we are typically free to pursue alternative collection activities; however, the account remains in the Insolvency pool.
The purchase price multiple represents our estimate of total cash collections over the original purchase price of the portfolio. Purchase price multiples can vary over time due to a variety of factors, including pricing competition, supply levels, paper type, age of the accounts acquired, mix of portfolios purchased, costs to collect, expected returns and changes in operational efficiency. For example, increased pricing due to elevated levels of competition or supply constraints negatively impacts purchase price multiples as we pay more to buy similar portfolios of nonperforming loans.
Further, there is an inverse relationship between the price we pay for a portfolio, the purchase price multiple and the effective interest rate of the pool. When we pay more for a portfolio, the purchase price multiple and effective interest rates are generally lower. The opposite tends to occur when we pay less for a portfolio. Certain types of accounts have lower collection costs, and we generally pay more for these types of accounts, resulting in a lower purchase price multiple but similar net income margins when compared with other portfolio purchases. Within a given portfolio type, when lower purchase price multiples are the result of more competitive pricing, this generally leads to lower profitability. As portfolio pricing becomes more favorable, our profitability will tend to increase. Profitability within given Core portfolio types may also be impacted by the age and quality of the accounts, which impact the cost to collect those accounts. Fresher accounts, for example, typically carry lower associated collection costs, while older accounts and lower balance accounts typically carry higher costs and, as a result, require higher purchase price multiples to achieve the same net profitability as fresher paper.
Revenue recognition is driven by estimates of the amount and timing of future cash collections. We record new portfolio acquisitions at the purchase price, which reflects the amount we expect to collect discounted at an effective interest rate. During the year of acquisition, portfolios are aggregated into annual pools, and the blended effective interest rate will change to reflect new buying and new cash flow estimates until the end of the year. At that time, the purchase price amount is fixed at the aggregated amounts paid to acquire the portfolio, the effective interest rate is fixed at the amount we expect to collect, discounted at the rate to equate purchase price to the recovery estimate, and the currency rates are fixed for purposes of comparability in future periods. Depending on the level of performance and expected future impacts from our operations, we may update ERC and TEC levels based on the results of our cash forecasting with a correlating adjustment to the purchase price multiple. We follow an established process to evaluate ERC, and we typically do not adjust our ERC and TEC until we gain sufficient collection experience with a pool of accounts. Over time, our TEC has often increased as pools have aged resulting in the ratio of TEC to purchase price for any given year of buying to gradually increase.
The numbers presented in the following tables represent gross cash collections and do not reflect any costs to collect; therefore, they may not represent relative profitability. Due to all of the factors described above, readers should be cautious when making comparisons of purchase price multiples among periods and between types of categories of portfolio segments and related geographies.
| | | | | | | | | | | | | | | | | | | |
Purchase Price Multiples as of June 30, 2024 Amounts in thousands |
| Purchase Period | Purchase Price (1)(2) | | | Total Estimated Collections (3) | Estimated Remaining Collections (4) | Current Purchase Price Multiple | Original Purchase Price Multiple (5) |
| Americas and Australia Core | | | | | | |
| 1996-2013 | $ | 1,932,722 | | | | $ | 5,745,296 | | $ | 54,130 | | 297% | 233% |
| 2014 | 404,117 | | | | 893,611 | | 28,903 | | 221% | 204% |
| 2015 | 443,114 | | | | 912,525 | | 39,549 | | 206% | 205% |
| 2016 | 455,767 | | | | 1,088,320 | | 60,856 | | 239% | 201% |
| 2017 | 532,851 | | | | 1,209,023 | | 92,474 | | 227% | 193% |
| 2018 | 653,975 | | | | 1,508,340 | | 134,993 | | 231% | 202% |
| 2019 | 581,476 | | | | 1,302,954 | | 143,944 | | 224% | 206% |
| 2020 | 435,668 | | | | 952,248 | | 165,787 | | 219% | 213% |
| 2021 | 435,846 | | | | 740,020 | | 286,888 | | 170% | 191% |
| 2022 | 406,082 | | | | 707,943 | | 364,784 | | 174% | 179% |
| 2023 | 622,583 | | | | 1,224,773 | | 948,003 | | 197% | 197% |
| 2024 | 373,421 | | | | 787,310 | | 759,217 | | 211% | 211% |
| Subtotal | 7,277,622 | | | | 17,072,363 | | 3,079,528 | | | |
| Americas Insolvency | | | | | | |
| 1996-2013 | 1,266,056 | | | | 2,503,066 | | 26 | | 198% | 159% |
| 2014 | 148,420 | | | | 218,933 | | 46 | | 148% | 124% |
| 2015 | 63,170 | | | | 88,083 | | 35 | | 139% | 125% |
| 2016 | 91,442 | | | | 118,282 | | 232 | | 129% | 123% |
| 2017 | 275,257 | | | | 358,452 | | 1,185 | | 130% | 125% |
| 2018 | 97,879 | | | | 136,147 | | 942 | | 139% | 127% |
| 2019 | 123,077 | | | | 168,485 | | 7,765 | | 137% | 128% |
| 2020 | 62,130 | | | | 91,590 | | 20,018 | | 147% | 136% |
| 2021 | 55,187 | | | | 74,273 | | 26,054 | | 135% | 136% |
| 2022 | 33,442 | | | | 47,143 | | 29,305 | | 141% | 139% |
| 2023 | 91,282 | | | | 120,038 | | 97,797 | | 132% | 135% |
| 2024 | 48,783 | | | | 71,770 | | 68,932 | | 147% | 147% |
| Subtotal | 2,356,125 | | | | 3,996,262 | | 252,337 | | | |
| Total Americas and Australia | 9,633,747 | | | | 21,068,625 | | 3,331,865 | | | |
| Europe Core | | | | | | | |
| 2012-2013 | 40,742 | | | | 72,662 | | 1 | | 178% | 153% |
| 2014 | 773,811 | | | | 2,564,807 | | 415,481 | | 331% | 208% |
| 2015 | 411,340 | | | | 755,061 | | 134,415 | | 184% | 160% |
| 2016 | 333,090 | | | | 579,777 | | 156,278 | | 174% | 167% |
| 2017 | 252,174 | | | | 369,070 | | 101,373 | | 146% | 144% |
| 2018 | 341,775 | | | | 557,913 | | 185,378 | | 163% | 148% |
| 2019 | 518,610 | | | | 848,086 | | 321,430 | | 164% | 152% |
| 2020 | 324,119 | | | | 568,114 | | 237,561 | | 175% | 172% |
| 2021 | 412,411 | | | | 701,265 | | 387,655 | | 170% | 170% |
| 2022 | 359,447 | | | | 584,036 | | 440,058 | | 162% | 162% |
| 2023 | 410,593 | | | | 692,794 | | 574,106 | | 169% | 169% |
| 2024 | 170,988 | | | | 312,073 | | 304,681 | | 183% | 183% |
| Subtotal | 4,349,100 | | | | 8,605,658 | | 3,258,417 | | | |
| Europe Insolvency | | | | | | |
| 2014 | 10,876 | | | | 18,979 | | — | | 175% | 129% |
| 2015 | 18,973 | | | | 29,381 | | — | | 155% | 139% |
| 2016 | 39,338 | | | | 57,841 | | 617 | | 147% | 130% |
| 2017 | 39,235 | | | | 51,992 | | 1,116 | | 133% | 128% |
| 2018 | 44,908 | | | | 52,649 | | 2,887 | | 117% | 123% |
| 2019 | 77,218 | | | | 113,418 | | 14,448 | | 147% | 130% |
| 2020 | 105,440 | | | | 157,743 | | 29,880 | | 150% | 129% |
| 2021 | 53,230 | | | | 73,783 | | 26,655 | | 139% | 134% |
| 2022 | 44,604 | | | | 61,840 | | 39,949 | | 139% | 137% |
| 2023 | 46,558 | | | | 64,255 | | 53,764 | | 138% | 138% |
| 2024 | 30,994 | | | | 45,761 | | 42,648 | | 147% | 147% |
| Subtotal | 511,374 | | | | 727,642 | | 211,964 | | | |
| Total Europe | 4,860,474 | | | | 9,333,300 | | 3,470,381 | | | |
| Total PRA Group | $ | 14,494,221 | | | | $ | 30,401,925 | | $ | 6,802,246 | | | |
(1)Includes the acquisition date finance receivables portfolios that were acquired through our business acquisitions.
(2)Non-U.S. amounts are presented at the exchange rate at the end of the year in which the portfolio was purchased. In addition, any purchase price adjustments that occur throughout the life of the portfolio are presented at the year-end exchange rate for the respective year of purchase.
(3)Non-U.S. amounts are presented at the year-end exchange rate for the respective year of purchase.
(4)Non-U.S. amounts are presented at the June 30, 2024 exchange rate.
(5)The original purchase price multiple represents the purchase price multiple at the end of the year of acquisition.
| | | | | | | | | | | | | | | | | | | | |
Portfolio Financial Information (1) |
| Amounts in thousands |
| June 30, 2024 (year-to-date) | | As of June 30, 2024 |
| Purchase Period | Cash
Collections (2) | Portfolio Income (2) | Changes in Expected Recoveries (2) | Total Portfolio Revenue (2) | | Net Finance Receivables (3) |
| Americas and Australia Core | | | | | | |
| 1996-2013 | $ | 18,065 | | $ | 7,042 | | $ | 11,887 | | $ | 18,929 | | | $ | 16,523 | |
| 2014 | 7,024 | | 2,805 | | 4,887 | | 7,692 | | | 11,018 | |
| 2015 | 8,806 | | 3,405 | | 7,303 | | 10,708 | | | 16,993 | |
| 2016 | 12,623 | | 6,530 | | 5,537 | | 12,067 | | | 21,359 | |
| 2017 | 20,755 | | 9,295 | | 6,625 | | 15,920 | | | 38,305 | |
| 2018 | 41,881 | | 14,656 | | 17,007 | | 31,663 | | | 73,826 | |
| 2019 | 43,863 | | 17,389 | | 7,800 | | 25,189 | | | 80,381 | |
| 2020 | 50,041 | | 19,482 | | 2,557 | | 22,039 | | | 92,936 | |
| 2021 | 56,615 | | 27,707 | | (5,049) | | 22,658 | | | 152,803 | |
| 2022 | 82,963 | | 34,964 | | (3,612) | | 31,352 | | | 221,981 | |
| 2023 | 149,967 | | 87,582 | | 13,175 | | 100,757 | | | 531,229 | |
| 2024 | 28,086 | | 22,132 | | 6,431 | | 28,563 | | | 373,386 | |
| Subtotal | 520,689 | | 252,989 | | 74,548 | | 327,537 | | | 1,630,740 | |
| Americas Insolvency | | | | | | |
| 1996-2013 | 518 | | 65 | | 454 | | 519 | | | — | |
| 2014 | 170 | | 52 | | 122 | | 174 | | | — | |
| 2015 | 112 | | 19 | | 74 | | 93 | | | 20 | |
| 2016 | 317 | | 22 | | 269 | | 291 | | | 201 | |
| 2017 | 1,548 | | 104 | | 1,493 | | 1,597 | | | 1,060 | |
| 2018 | 1,613 | | 73 | | 570 | | 643 | | | 886 | |
| 2019 | 10,306 | | 663 | | (212) | | 451 | | | 7,445 | |
| 2020 | 9,106 | | 1,419 | | 889 | | 2,308 | | | 18,223 | |
| 2021 | 8,214 | | 1,670 | | 501 | | 2,171 | | | 22,789 | |
| 2022 | 5,489 | | 1,637 | | 336 | | 1,973 | | | 24,327 | |
| 2023 | 11,945 | | 5,781 | | (790) | | 4,991 | | | 76,235 | |
| 2024 | 2,841 | | 1,912 | | 294 | | 2,206 | | | 47,843 | |
| Subtotal | 52,179 | | 13,417 | | 4,000 | | 17,417 | | | 199,029 | |
| Total Americas and Australia | 572,868 | | 266,406 | | 78,548 | | 344,954 | | | 1,829,769 | |
| Europe Core | | | | | | |
| 2012-2013 | 525 | | — | | 525 | | 525 | | | — | |
| 2014 | 50,594 | | 35,965 | | 13,941 | | 49,906 | | | 97,962 | |
| 2015 | 15,663 | | 6,867 | | 4,052 | | 10,919 | | | 66,674 | |
| 2016 | 13,878 | | 6,576 | | 2,459 | | 9,035 | | | 88,195 | |
| 2017 | 9,368 | | 3,410 | | 1,057 | | 4,467 | | | 67,454 | |
| 2018 | 19,334 | | 6,884 | | 3,837 | | 10,721 | | | 118,792 | |
| 2019 | 34,697 | | 11,337 | | 5,331 | | 16,668 | | | 216,535 | |
| 2020 | 25,522 | | 9,654 | | 2,912 | | 12,566 | | | 146,420 | |
| 2021 | 34,155 | | 14,494 | | 3,181 | | 17,675 | | | 235,125 | |
| 2022 | 39,130 | | 15,455 | | 755 | | 16,210 | | | 276,388 | |
| 2023 | 52,395 | | 22,109 | | 910 | | 23,019 | | | 338,599 | |
| 2024 | 7,411 | | 2,770 | | 1,803 | | 4,573 | | | 167,839 | |
| Subtotal | 302,672 | | 135,521 | | 40,763 | | 176,284 | | | 1,819,983 | |
| Europe Insolvency | | | | | | |
| 2014 | 86 | | — | | 86 | | 86 | | | — | |
| 2015 | 99 | | 2 | | 70 | | 72 | | | — | |
| 2016 | 468 | | 64 | | 166 | | 230 | | | 184 | |
| 2017 | 874 | | 73 | | (5) | | 68 | | | 928 | |
| 2018 | 1,919 | | 155 | | (14) | | 141 | | | 2,599 | |
| 2019 | 7,495 | | 782 | | 1,100 | | 1,882 | | | 12,648 | |
| 2020 | 13,446 | | 1,559 | | 1,011 | | 2,570 | | | 27,211 | |
| 2021 | 7,542 | | 1,420 | | 910 | | 2,330 | | | 23,263 | |
| 2022 | 7,167 | | 1,984 | | 915 | | 2,899 | | | 32,264 | |
| 2023 | 5,656 | | 2,578 | | 50 | | 2,628 | | | 41,559 | |
| 2024 | 3,108 | | 802 | | 1,394 | | 2,196 | | | 29,778 | |
| Subtotal | 47,860 | | 9,419 | | 5,683 | | 15,102 | | | 170,434 | |
| Total Europe | 350,532 | | 144,940 | | 46,446 | | 191,386 | | | 1,990,417 | |
| Total PRA Group | $ | 923,400 | | $ | 411,346 | | $ | 124,994 | | $ | 536,340 | | | $ | 3,820,186 | |
(1) Includes the nonperforming loan portfolios that were acquired through our business acquisitions.
(2)Non-U.S. amounts are presented using the average exchange rates during the current reporting period.
(3)Non-U.S. amounts are presented at the June 30, 2024 exchange rate.
| | | | | | | | | | | | | | | | | | | | | | | | | | | | | | | | | | | | | | | | | | | | | |
Cash Collections by Year, By Year of Purchase (1) as of June 30, 2024 Amounts in millions |
| | Cash Collections | |
| Purchase Period | Purchase Price (2)(3) | 1996-2013 | 2014 | 2015 | 2016 | 2017 | 2018 | 2019 | 2020 | 2021 | 2022 | 2023 | 2024 | Total | |
| Americas and Australia Core | | | | | | | | | | | | | |
| 1996-2013 | $ | 1,932.7 | | $ | 3,618.9 | | $ | 660.3 | | $ | 474.4 | | $ | 299.7 | | $ | 197.0 | | $ | 140.3 | | $ | 99.7 | | $ | 64.7 | | $ | 46.5 | | $ | 36.0 | | $ | 28.4 | | $ | 18.1 | | $ | 5,684.0 | | |
| 2014 | 404.1 | | — | | 92.7 | | 253.4 | | 170.3 | | 114.2 | | 82.2 | | 55.3 | | 31.9 | | 22.3 | | 15.0 | | 11.8 | | 7.0 | | 856.1 | | |
| 2015 | 443.1 | | — | | — | | 117.0 | | 228.4 | | 185.9 | | 126.6 | | 83.6 | | 57.2 | | 34.9 | | 19.5 | | 14.1 | | 8.8 | | 876.0 | | |
| 2016 | 455.8 | | — | | — | | — | | 138.7 | | 256.5 | | 194.6 | | 140.6 | | 105.9 | | 74.2 | | 38.4 | | 24.9 | | 12.6 | | 986.4 | | |
| 2017 | 532.9 | | — | | — | | — | | — | | 107.3 | | 278.7 | | 256.5 | | 192.5 | | 130.0 | | 76.3 | | 43.8 | | 20.8 | | 1,105.9 | | |
| 2018 | 654.0 | | — | | — | | — | | — | | — | | 122.7 | | 361.9 | | 337.7 | | 239.9 | | 146.1 | | 92.9 | | 41.9 | | 1,343.1 | | |
| 2019 | 581.5 | | — | | — | | — | | — | | — | | — | | 143.8 | | 349.0 | | 289.8 | | 177.7 | | 110.3 | | 43.9 | | 1,114.5 | | |
| 2020 | 435.7 | | — | | — | | — | | — | | — | | — | | — | | 132.9 | | 284.3 | | 192.0 | | 125.8 | | 50.0 | | 785.0 | | |
| 2021 | 435.8 | | — | | — | | — | | — | | — | | — | | — | | — | | 85.0 | | 177.3 | | 136.8 | | 56.6 | | 455.7 | | |
| 2022 | 406.1 | | — | | — | | — | | — | | — | | — | | — | | — | | — | | 67.7 | | 195.4 | | 83.0 | | 346.1 | | |
| 2023 | 622.5 | | — | | — | | — | | — | | — | | — | | — | | — | | — | | — | | 108.5 | | 150.0 | | 258.5 | | |
| 2024 | 373.4 | | — | | — | | — | | — | | — | | — | | — | | — | | — | | — | | — | | 28.0 | | 28.0 | | |
| Subtotal | 7,277.6 | | 3,618.9 | | 753.0 | | 844.8 | | 837.1 | | 860.9 | | 945.1 | | 1,141.4 | | 1,271.8 | | 1,206.9 | | 946.0 | | 892.7 | | 520.7 | | 13,839.3 | | |
| Americas Insolvency | | | | | | | | | | | | | |
| 1996-2013 | 1,266.1 | | 1,491.4 | | 421.4 | | 289.9 | | 168.7 | | 85.5 | | 30.3 | | 6.8 | | 3.6 | | 2.2 | | 1.6 | | 1.1 | | 0.5 | | 2,503.0 | | |
| 2014 | 148.4 | | — | | 37.0 | | 50.9 | | 44.3 | | 37.4 | | 28.8 | | 15.8 | | 2.2 | | 1.1 | | 0.7 | | 0.4 | | 0.2 | | 218.8 | | |
| 2015 | 63.2 | | — | | — | | 3.4 | | 17.9 | | 20.1 | | 19.8 | | 16.7 | | 7.9 | | 1.3 | | 0.6 | | 0.3 | | 0.1 | | 88.1 | | |
| 2016 | 91.4 | | — | | — | | — | | 18.9 | | 30.4 | | 25.0 | | 19.9 | | 14.4 | | 7.4 | | 1.8 | | 0.9 | | 0.3 | | 119.0 | | |
| 2017 | 275.3 | | — | | — | | — | | — | | 49.1 | | 97.3 | | 80.9 | | 58.8 | | 44.0 | | 20.8 | | 4.9 | | 1.5 | | 357.3 | | |
| 2018 | 97.9 | | — | | — | | — | | — | | — | | 6.7 | | 27.4 | | 30.5 | | 31.6 | | 24.6 | | 12.7 | | 1.6 | | 135.1 | | |
| 2019 | 123.1 | | — | | — | | — | | — | | — | | — | | 13.4 | | 31.4 | | 39.1 | | 37.8 | | 28.7 | | 10.3 | | 160.7 | | |
| 2020 | 62.1 | | — | | — | | — | | — | | — | | — | | — | | 6.5 | | 16.1 | | 20.4 | | 19.5 | | 9.1 | | 71.6 | | |
| 2021 | 55.2 | | — | | — | | — | | — | | — | | — | | — | | — | | 4.6 | | 17.9 | | 17.5 | | 8.2 | | 48.2 | | |
| 2022 | 33.4 | | — | | — | | — | | — | | — | | — | | — | | — | | — | | 3.2 | | 9.2 | | 5.5 | | 17.9 | | |
| 2023 | 91.2 | | — | | — | | — | | — | | — | | — | | — | | — | | — | | — | | 9.0 | | 11.9 | | 20.9 | | |
| 2024 | 48.8 | | — | | — | | — | | — | | — | | — | | — | | — | | — | | — | | — | | 2.9 | | 2.9 | | |
| Subtotal | 2,356.1 | | 1,491.4 | | 458.4 | | 344.2 | | 249.8 | | 222.5 | | 207.9 | | 180.9 | | 155.3 | | 147.4 | | 129.4 | | 104.2 | | 52.1 | | 3,743.5 | | |
| Total Americas and Australia | 9,633.7 | | 5,110.3 | | 1,211.4 | | 1,189.0 | | 1,086.9 | | 1,083.4 | | 1,153.0 | | 1,322.3 | | 1,427.1 | | 1,354.3 | | 1,075.4 | | 996.9 | | 572.8 | | 17,582.8 | | |
| Europe Core | | | | | | | | | | | | | | |
| 2012-2013 | 40.7 | | 27.7 | | 14.2 | | 5.5 | | 3.5 | | 3.3 | | 3.3 | | 2.4 | | 1.9 | | 1.8 | | 1.4 | | 1.0 | | 0.5 | | 66.5 | | |
| 2014 | 773.8 | | — | | 153.2 | | 292.0 | | 246.4 | | 220.8 | | 206.3 | | 172.9 | | 149.8 | | 149.2 | | 122.2 | | 107.6 | | 50.6 | | 1,871.0 | | |
| 2015 | 411.3 | | — | | — | | 45.8 | | 100.3 | | 86.2 | | 80.9 | | 66.1 | | 54.3 | | 51.4 | | 40.7 | | 33.8 | | 15.7 | | 575.2 | | |
| 2016 | 333.1 | | — | | — | | — | | 40.4 | | 78.9 | | 72.6 | | 58.0 | | 48.3 | | 46.7 | | 36.9 | | 29.7 | | 13.9 | | 425.4 | | |
| 2017 | 252.2 | | — | | — | | — | | — | | 17.9 | | 56.0 | | 44.1 | | 36.1 | | 34.8 | | 25.2 | | 20.2 | | 9.4 | | 243.7 | | |
| 2018 | 341.8 | | — | | — | | — | | — | | — | | 24.3 | | 88.7 | | 71.3 | | 69.1 | | 50.7 | | 41.6 | | 19.3 | | 365.0 | | |
| 2019 | 518.6 | | — | | — | | — | | — | | — | | — | | 48.0 | | 125.7 | | 121.4 | | 89.8 | | 75.1 | | 34.7 | | 494.7 | | |
| 2020 | 324.1 | | — | | — | | — | | — | | — | | — | | — | | 32.3 | | 91.7 | | 69.0 | | 56.1 | | 25.5 | | 274.6 | | |
| 2021 | 412.4 | | — | | — | | — | | — | | — | | — | | — | | — | | 48.5 | | 89.9 | | 73.0 | | 34.2 | | 245.6 | | |
| 2022 | 359.4 | | — | | — | | — | | — | | — | | — | | — | | — | | — | | 33.9 | | 83.8 | | 39.1 | | 156.8 | | |
| 2023 | 410.6 | | — | | — | | — | | — | | — | | — | | — | | — | | — | | — | | 50.2 | | 52.4 | | 102.6 | | |
| 2024 | 171.1 | | — | | — | | — | | — | | — | | — | | — | | — | | — | | — | | — | | 7.4 | | 7.4 | | |
| Subtotal | 4,349.1 | | 27.7 | | 167.4 | | 343.3 | | 390.6 | | 407.1 | | 443.4 | | 480.2 | | 519.7 | | 614.6 | | 559.7 | | 572.1 | | 302.7 | | 4,828.5 | | |
| Europe Insolvency | | | | | | | | | | | | | |
| 2014 | 10.9 | | — | | — | | 4.3 | | 3.9 | | 3.2 | | 2.6 | | 1.5 | | 0.8 | | 0.3 | | 0.2 | | 0.2 | | 0.1 | | 17.1 | | |
| 2015 | 19.0 | | — | | — | | 3.0 | | 4.4 | | 5.0 | | 4.8 | | 3.9 | | 2.9 | | 1.6 | | 0.6 | | 0.4 | | 0.1 | | 26.7 | | |
| 2016 | 39.3 | | — | | — | | — | | 6.2 | | 12.7 | | 12.9 | | 10.7 | | 7.9 | | 6.0 | | 2.7 | | 1.3 | | 0.5 | | 60.9 | | |
| 2017 | 39.2 | | — | | — | | — | | — | | 1.2 | | 7.9 | | 9.2 | | 9.8 | | 9.4 | | 6.5 | | 3.8 | | 0.9 | | 48.7 | | |
| 2018 | 44.9 | | — | | — | | — | | — | | — | | 0.6 | | 8.4 | | 10.3 | | 11.7 | | 9.8 | | 7.2 | | 1.9 | | 49.9 | | |
| 2019 | 77.2 | | — | | — | | — | | — | | — | | — | | 5.0 | | 21.1 | | 23.9 | | 21.0 | | 17.5 | | 7.5 | | 96.0 | | |
| 2020 | 105.4 | | — | | — | | — | | — | | — | | — | | — | | 6.0 | | 34.6 | | 34.1 | | 29.7 | | 13.4 | | 117.8 | | |
| 2021 | 53.2 | | — | | — | | — | | — | | — | | — | | — | | — | | 5.5 | | 14.4 | | 14.7 | | 7.5 | | 42.1 | | |
| 2022 | 44.6 | | — | | — | | — | | — | | — | | — | | — | | — | | — | | 4.5 | | 12.4 | | 7.2 | | 24.1 | | |
| 2023 | 46.7 | | — | | — | | — | | — | | — | | — | | — | | — | | — | | — | | 4.2 | | 5.7 | | 9.9 | | |
| 2024 | 31.0 | | — | | — | | — | | — | | — | | — | | — | | — | | — | | — | | — | | 3.1 | | 3.1 | | |
| Subtotal | 511.4 | | — | | — | | 7.3 | | 14.5 | | 22.1 | | 28.8 | | 38.7 | | 58.8 | | 93.0 | | 93.8 | | 91.4 | | 47.9 | | 496.3 | | |
| Total Europe | 4,860.5 | | 27.7 | | 167.4 | | 350.6 | | 405.1 | | 429.2 | | 472.2 | | 518.9 | | 578.5 | | 707.6 | | 653.5 | | 663.5 | | 350.6 | | 5,324.8 | | |
| Total PRA Group | $ | 14,494.2 | | $ | 5,138.0 | | $ | 1,378.8 | | $ | 1,539.6 | | $ | 1,492.0 | | $ | 1,512.6 | | $ | 1,625.2 | | $ | 1,841.2 | | $ | 2,005.6 | | $ | 2,061.9 | | $ | 1,728.9 | | $ | 1,660.4 | | $ | 923.4 | | $ | 22,907.6 | | |
(1)Non-U.S. amounts are presented using the average exchange rates during the cash collections period.
(2)Includes the acquisition date finance receivables portfolios acquired through our business acquisitions.
(3)Non-U.S. amounts are presented at the exchange rate at the end of the year in which the portfolio was purchased. In addition, any purchase price adjustments that occur throughout the life of the pool are presented at the year-end exchange rate for the respective year of purchase.
Estimated Remaining Collections
The following chart shows our ERC of $6.8 billion as of June 30, 2024 by geography (amounts in millions).
The following table displays our ERC by geography, year and account type for the 12 months ending June 30, for each year presented (amounts in thousands):
| | | | | | | | | | | | | | | | | | | | | | | | | | | | | |
| ERC By Geography, Year and Account Type |
| Americas and Australia Core | | Americas Insolvency | | Europe Core | | Europe Insolvency | | Total |
| 2025 | $ | 928,042 | | | $ | 94,770 | | | $ | 524,121 | | | $ | 76,175 | | | $ | 1,623,108 | |
| 2026 | 700,432 | | | 69,026 | | | 439,694 | | | 56,203 | | | 1,265,355 | |
| 2027 | 455,416 | | | 47,272 | | | 367,523 | | | 37,434 | | | 907,645 | |
| 2028 | 313,073 | | | 28,358 | | | 313,135 | | | 22,784 | | | 677,350 | |
| 2029 | 215,407 | | | 11,485 | | | 268,778 | | | 11,617 | | | 507,287 | |
| 2030 | 149,570 | | | 1,399 | | | 231,553 | | | 4,186 | | | 386,708 | |
| 2031 | 103,206 | | | 27 | | | 200,387 | | | 1,360 | | | 304,980 | |
| 2032 | 70,414 | | | — | | | 174,159 | | | 738 | | | 245,311 | |
| 2033 | 47,987 | | | — | | | 151,829 | | | 526 | | | 200,342 | |
| 2034 | 32,674 | | | — | | | 132,778 | | | 354 | | | 165,806 | |
| Thereafter | 63,307 | | | — | | | 454,460 | | | 587 | | | 518,354 | |
| Total ERC | $ | 3,079,528 | | | $ | 252,337 | | | $ | 3,258,417 | | | $ | 211,964 | | | $ | 6,802,246 | |
Cash Collections
The following table displays our cash collections by geography and account type for the periods indicated (amounts in thousands):
| | | | | | | | | | | | | | | | | | | | | | | | | | | | | | | | | | | | | | | | | | |
| Cash Collections by Geography and Account Type |
| Second Quarter | | | Year-to-Date |
| 2024 | | 2023 | | | | | 2024 | | 2023 | | |
| Americas and Australia Core | $ | 263,828 | | 55.6% | | $ | 220,886 | | 52.7% | | | | | $ | 520,689 | | 56.3% | | $ | 448,846 | | 54.0% | | |
| Americas Insolvency | 26,971 | | 5.7 | | 26,384 | | 6.3 | | | | | 52,179 | | 5.7 | | 52,135 | | 6.3 | | |
| Europe Core | 156,739 | | 33.1 | | 149,324 | | 35.6 | | | | | 302,672 | | 32.8 | | 283,329 | | 34.1 | | |
| Europe Insolvency | 26,344 | | 5.6 | | 22,725 | | 5.4 | | | | | 47,860 | | 5.2 | | 46,293 | | 5.6 | | |
| Total cash collections | $ | 473,882 | | 100% | | $ | 419,319 | | 100% | | | | | $ | 923,400 | | 100% | | $ | 830,603 | | 100% | | |
The following table displays our Core cash collections by geography and source for the periods indicated (amounts in thousands):
| | | | | | | | | | | | | | | | | | | | | | | | | | | | | | | | | | | | | | | | | | |
| Core Cash Collections by Geography and Source |
| Second Quarter | | | Year-to-Date |
| 2024 | | 2023 | | | | | 2024 | | 2023 | | |
| Americas and Australia | | | | | | | | | | | | | | | | |
| Call center and other | $ | 149,693 | | 56.7 | % | | $ | 138,507 | | 62.7% | | | | | $ | 304,147 | | 58.4% | | $ | 283,105 | | 63.1% | | |
| Legal | 114,135 | | 43.3 | | | 82,379 | | 37.3 | | | | | 216,542 | | 41.6 | | 165,741 | | 36.9 | | |
| Core cash collections | $ | 263,828 | | 100% | | $ | 220,886 | | 100% | | | | | $ | 520,689 | | 100% | | $ | 448,846 | | 100% | | |
| | | | | | | | | | | | | | | | |
| Europe | | | | | | | | | | | | | | | | |
| Call center and other | $ | 94,784 | | 60.5 | % | | $ | 92,676 | | 62.1% | | | | | $ | 188,007 | | 62.1% | | $ | 184,493 | | 65.1% | | |
| Legal | 61,955 | | 39.5 | | | 56,648 | | 37.9 | | | | | 114,665 | | 37.9 | | 98,836 | | 34.9 | | |
| Core cash collections | $ | 156,739 | | 100% | | $ | 149,324 | | 100% | | | | | $ | 302,672 | | 100% | | $ | 283,329 | | 100% | | |
| | | | | | | | | | | | | | | | |
| Total Company | | | | | | | | | | | | | | | | |
| Call center and other | $ | 244,477 | | 58.1 | % | | $ | 231,183 | | 62.4% | | | | | $ | 492,154 | | 59.8% | | $ | 467,598 | | 63.9% | | |
| Legal | 176,090 | | 41.9 | | | 139,027 | | 37.6 | | | | | 331,207 | | 40.2 | | 264,577 | | 36.1 | | |
| Total Core cash collections | $ | 420,567 | | 100% | | $ | 370,210 | | 100% | | | | | $ | 823,361 | | 100% | | $ | 732,175 | | 100% | | |
Seasonality
Customer payment patterns in all of the countries in which we operate can be affected by seasonal employment trends, income tax refunds, and holiday spending habits.
Portfolio Acquisitions
The following table displays our portfolio acquisitions by geography and account type for the periods indicated (amounts in thousands):
| | | | | | | | | | | | | | | | | | | | | | | | | | | | | | | | | | | | | | | | | | |
| Portfolio Acquisitions by Geography and Account Type |
| Second Quarter | | | Year-to-Date |
| 2024 | | 2023 | | | | | 2024 | | 2023 | | |
| Americas and Australia Core | $ | 198,761 | | 52.4% | | $ | 171,440 | | 52.4% | | | | | $ | 373,421 | | 59.7% | | $ | 288,307 | | 51.7% | | |
| Americas Insolvency | 26,627 | | 7.0 | | 12,189 | | 3.7 | | | | | 48,783 | | 7.8 | | 27,890 | | 5.0 | | |
| Europe Core | 127,991 | | 33.7 | | 136,834 | | 41.7 | | | | | 171,988 | | 27.5 | | 227,288 | | 40.7 | | |
| Europe Insolvency | 25,990 | | 6.9 | | 7,296 | | 2.2 | | | | | 30,994 | | 5.0 | | 14,499 | | 2.6 | | |
| Total portfolio acquisitions | $ | 379,369 | | 100% | | $ | 327,759 | | 100% | | | | | $ | 625,186 | | 100% | | $ | 557,984 | | 100% | | |
| | | | | | | | | | | | | | | | |
Portfolio Acquisitions by Major Asset Type and Delinquency Category (U.S. Only)
The following tables categorize our U.S. portfolio acquisitions by major asset type and delinquency category for the periods indicated (amounts in thousands):
| | | | | | | | | | | | | | | | | | | | | | | | | | | | | | | | | | | | | | | | | | |
| U.S. Portfolio Acquisitions by Major Asset Type |
| Second Quarter | | | Year-to-Date |
| 2024 | | 2023 | | | | | 2024 | | 2023 | | |
| Major Credit Cards | $ | 67,505 | | 32.6% | | $ | 41,605 | | 28.5% | | | | | $ | 126,563 | | 32.1% | | $ | 54,839 | | 21.5% | | |
| Private Label Credit Cards | 117,612 | | 56.9 | | 76,306 | | 52.4 | | | | | 227,499 | | 57.7 | | 142,958 | | 56.0 | | |
| Consumer Finance | 4,292 | | 2.1 | | 26,809 | | 18.4 | | | | | 10,539 | | 2.7 | | 54,860 | | 21.5 | | |
| Auto Related | 17,381 | | 8.4 | | 1,012 | | 0.7 | | | | | 29,450 | | 7.5 | | 2,493 | | 1.0 | | |
| Total | $ | 206,790 | | 100% | | $ | 145,732 | | 100% | | | | | $ | 394,051 | | 100% | | $ | 255,150 | | 100% | | |
| | | | | | | | | | | | | | | | | | | | | | | | | | | | | | | | | | | | | | | | | | |
| U.S. Portfolio Acquisitions by Delinquency Category |
| Second Quarter | | | Year-to-Date |
| 2024 | | 2023 | | | | | 2024 | | 2023 | | |
Fresh (1) | $ | 111,786 | | 62.0% | | $ | 89,767 | | 67.2% | | | | | $ | 216,290 | | 62.6% | | $ | 159,820 | | 70.3% | | |
Primary (2) | 2,684 | | 1.5 | | 5,378 | | 4.0 | | | | | 5,185 | | 1.5 | | 9,241 | | 4.1 | | |
Secondary (3) | 63,016 | | 35.0 | | 25,800 | | 19.3 | | | | | 115,871 | | 33.6 | | 43,589 | | 19.2 | | |
Other (4) | 2,677 | | 1.5 | | 12,598 | | 9.5 | | | | | 7,922 | | 2.3 | | 14,610 | | 6.4 | | |
| Total Core | 180,163 | | 100% | | 133,543 | | 100% | | | | | 345,268 | | 100% | | 227,260 | | 100% | | |
| Insolvency | 26,627 | | | | 12,189 | | | | | | | 48,783 | | | | 27,890 | | | | |
| Total | $ | 206,790 | | | | $ | 145,732 | | | | | | | $ | 394,051 | | | | $ | 255,150 | | | | |
| | | | | | | | | | | | | | | | |
(1)Fresh accounts are typically past due 120 to 270 days, charged-off by the credit originator and sold prior to any post-charge-off collection activity.
(2)Primary accounts are typically 240 to 450 days past due, charged-off and have been previously placed with one contingent fee servicer.
(3)Secondary accounts are typically 360 to 630 days past due, charged-off and have been previously placed with two contingent fee servicers.
(4)Other accounts are 480 days or more past due, charged-off and have previously been worked by three or more contingent fee servicers.
Non-GAAP Financial Measures
We report our financial results in accordance with U.S. generally accepted accounting principles ("GAAP"). However, our management also uses certain non-GAAP financial measures, including:
•adjusted earnings before interest, taxes, depreciation and amortization ("Adjusted EBITDA"), to evaluate the Company's performance and to set performance goals; and
•return on average tangible equity ("ROATE"), as a measure to monitor and evaluate operating performance relative to the Company's equity.
Adjusted EBITDA
We present Adjusted EBITDA because we consider it an important supplemental measure of operations and financial performance. Our management believes Adjusted EBITDA helps provide enhanced period-to-period comparability of operations and financial performance, as it excludes certain items whose fluctuations from period-to-period do not necessarily correspond to changes in the operations of our business, and is useful to investors as other companies in the industry report similar financial measures. Adjusted EBITDA should not be considered as an alternative to net income determined in accordance with GAAP. In addition, our calculation of Adjusted EBITDA may not be comparable to the calculation of similarly titled measures presented by other companies. Adjusted EBITDA is calculated starting with our GAAP financial measure, Net income/(loss) attributable to PRA Group, Inc. and is adjusted for:
•income tax expense (or less income tax benefit);
•foreign exchange loss (or less foreign exchange gain);
•interest expense, net (or less interest income, net);
•other expense (or less other income);
•depreciation and amortization;
•impairment of real estate;
•net income attributable to noncontrolling interests; and
•recoveries applied to negative allowance less changes in expected recoveries.
The following table provides a reconciliation of Net income/(loss) attributable to PRA Group, Inc. as reported in accordance with GAAP to Adjusted EBITDA for the periods indicated (amounts in thousands):
| | | | | | | | | | | |
|
| Last Twelve Months Ended | | Year Ended |
| June 30, 2024 | | December 31, 2023 |
| Net income/(loss) attributable to PRA Group, Inc. | $ | 3,945 | | | $ | (83,477) | |
| Adjustments: | | | |
| Income tax expense/(benefit) | 12,060 | | | (16,133) | |
| Foreign exchange loss/(gain) | 3 | | | (289) | |
| Interest expense, net | 208,050 | | | 181,724 | |
Other expense (1) | 1,224 | | | 1,944 | |
| Depreciation and amortization | 11,662 | | | 13,376 | |
| Impairment of real estate | 5,239 | | | 5,239 | |
| Net income attributable to noncontrolling interests | 18,909 | | | 16,723 | |
| | | |
| Recoveries applied to negative allowance less changes in expected recoveries | 804,094 | | | 887,891 | |
| Adjusted EBITDA | $ | 1,065,186 | | | $ | 1,006,998 | |
(1)Other expense reflects non-operating activities.
Return on Average Tangible Equity
We use ROATE, which is a supplemental measure of performance that is not required by, or presented in accordance with, GAAP, to monitor and evaluate operating performance relative to the Company's equity. Management believes ROATE is a useful financial measure for investors in evaluating the effective use of equity, and is an important component of our long-term shareholder return. Average tangible equity ("ATE") is defined as average Total stockholders' equity - PRA Group, Inc. less average goodwill and average other intangible assets. ROATE is calculated by dividing annualized Net income/(loss) attributable to PRA Group, Inc. by ATE.
The following table displays our ROATE and provides a reconciliation of Total stockholders' equity - PRA Group, Inc. as reported in accordance with GAAP to ATE for the periods indicated (amounts in thousands, except for ratio data):
| | | | | | | | | | | | | | | | | | | | | | | | | | | | | | | | | | | | | | | | | |
|
| | | | | | Average Balance |
| | Balance at Period End | | Second Quarter | | | Year-to-Date |
| | June 30, 2024 | | June 30, 2023 | | 2024 | | 2023 | | | 2024 | | 2023 |
| Total stockholders' equity - PRA Group, Inc. | | $ | 1,145,463 | | | $ | 1,165,525 | | | $ | 1,137,395 | | | $ | 1,161,934 | | | | $ | 1,147,300 | | | $ | 1,183,843 | |
| Less: Goodwill | | 415,646 | | | 414,905 | | | 413,746 | | | 417,776 | | | | 419,685 | | | 423,824 | |
| Less: Other intangible assets | | 1,597 | | | 1,836 | | | 1,632 | | | 1,835 | | | | 1,668 | | | 1,839 | |
| Average tangible equity | | | | | | $ | 722,017 | | | $ | 742,323 | | | | $ | 725,947 | | | $ | 758,180 | |
| Net income/(loss) attributable to PRA Group, Inc. | | | | | | $ | 21,516 | | | $ | (3,804) | | | | $ | 24,991 | | | $ | (62,433) | |
Return on average tangible equity (1) | | | | | | 11.9 | % | | (2.0) | % | | | 6.9 | % | | (16.5) | % |
(1)Based on annualized Net income/(loss) attributable to PRA Group, Inc.
Liquidity and Capital Resources
We actively manage our liquidity to meet our business needs and financial obligations.
Sources of Liquidity
Cash and cash equivalents. As of June 30, 2024, cash and cash equivalents totaled $118.9 million, of which $103.1 million consisted of cash on hand related to international operations with indefinitely reinvested earnings. For additional information about the unremitted earnings of our international subsidiaries, refer to Note 13 to our Consolidated Financial Statements in the 2023 Form 10-K.
Borrowings. As of June 30, 2024, we had the following committed amounts, borrowings and availability under our credit facilities (amounts in thousands):
| | | | | | | | | | | | | | | | | | | | | | | | | | | | | | | | |
| | | | | | Availability |
| | Committed Amounts | | Borrowings | | Availability Based on Current ERC (1) | | Additional Availability (2) | | Total Availability |
| North American revolving credit | | $ | 1,075,000 | | | $ | 219,305 | | | $ | 446,076 | | | $ | 409,619 | | | $ | 855,695 | |
| UK revolving credit | | 800,000 | | | 495,665 | | | 69,182 | | | 235,153 | | | 304,335 | |
| European revolving credit | | 822,164 | | | 533,653 | | | 226,669 | | | 61,842 | | | 288,511 | |
| Term loan | | 435,000 | | | 435,000 | | | — | | | — | | | — | |
| Senior notes | | 1,446,000 | | | 1,446,000 | | | — | | | — | | | — | |
| | | | | | | | | | |
| Less: Debt discounts and issuance costs | | — | | | (15,846) | | | — | | | — | | | — | |
| Total | | $ | 4,578,164 | | | $ | 3,113,777 | | | $ | 741,927 | | | $ | 706,614 | | | $ | 1,448,541 | |
| | | | | | | | | | |
| | | | | | | | | | |
| | | | | | | | | | |
| | | | | | | | | | |
(1)Available borrowings after calculation of borrowing base, which may be used for general corporate purposes, including portfolio purchases.
(2)Subject to borrowing base and debt covenants, including advance rates ranging from 35-55% of applicable ERC.
For additional details about our credit facilities, term loan and senior notes, see Note 5 to our Consolidated Financial Statements included in Part I, Item 1 of this Quarterly Report. Interest-bearing deposits. As of June 30, 2024, interest-bearing deposits totaled $115.0 million. Under our European revolving credit facility, our interest-bearing deposit funding is limited to SEK 2.2 billion (the equivalent of $207.5 million in U.S. dollars as of June 30, 2024).
Furthermore, we have the ability to slow the purchase of nonperforming loans and to use the net cash flow generated from cash collections on our portfolio of existing nonperforming loans to temporarily service our debt and fund existing operations.
Uses of Liquidity and Material Cash Requirements
Forward Flows. We enter into forward flow agreements for the purchase of nonperforming loans. These agreements typically have terms ranging from six to 12 months, or they can be open-ended, and establish purchase prices and specific criteria for the accounts to be purchased. Some of the agreements establish a volume reference for the contract term in the form of a target or maximum, however, very few agreements establish a minimum contractual obligation, and many of the contracts contain early termination provisions allowing either party to cancel the agreements in accordance with a specified notice period.
As of June 30, 2024, we have forward flow agreements in place with an estimated purchase price of approximately $385.6 million over the next 12 months. This total can vary significantly based on the remaining terms and renewal dates of the agreements and is comprised of $272.1 million for the Americas and Australia and $113.5 million for Europe. These amounts represent our estimated forward flow purchases over the next 12 months under the agreements in place, based on projections and other factors, including sellers' estimates of future flow sales, and are dependent on actual delivery by the sellers. Accordingly, amounts purchased under these agreements may vary significantly. In addition to these agreements, we may also enter into new or renewed forward flow commitments and/or close on spot purchase transactions.
Borrowings. As of June 30, 2024, we had $3.1 billion in outstanding borrowings. The estimated interest, unused fees and principal payments for the next 12 months are $223.8 million, of which $10.0 million relates to principal on our term loan. After 12 months, principal payments on our debt are due from between one and six years. Many of our financing arrangements include covenants with which we must comply, and as of June 30, 2024, we determined that we were in compliance with these covenants.
We intend to borrow $298.0 million under our North American revolving credit agreement on or about September 1, 2024 to redeem our Senior Notes due 2025, which, all other effects being equal, would cause a corresponding decrease to the availability under our credit facilities.
Share Repurchases. On February 25, 2022, our Board of Directors approved a share repurchase program under which we are authorized to repurchase up to $150.0 million of our outstanding common stock. The share repurchase program has no stated expiration date and does not obligate us to repurchase any specified amount of shares, remains subject to the discretion of our Board of Directors and, subject to compliance with applicable laws, may be modified, suspended or discontinued at any time.
Repurchases may be made from time-to-time in open market transactions, through privately negotiated transactions, in block transactions, through purchases made in accordance with trading plans adopted under Rule 10b5-1 of the Securities Exchange Act of 1934, as amended (the "Exchange Act"), or other methods, subject to market and/or other conditions and applicable regulatory requirements. Repurchases are also subject to restrictive covenants contained in our credit facilities and the indentures that govern our senior notes. There were no repurchases during the second quarter of 2024, and as of June 30, 2024, we had $67.7 million remaining for share repurchases under the program.
Leases. Our leases have remaining terms from one to 12 years. As of June 30, 2024, we had $46.7 million in lease liabilities, of which $9.2 million is due within the next 12 months. For additional information about our leases, refer to Note 5 to our Consolidated Financial Statements in the 2023 Form 10-K. Derivatives. We enter into derivative financial instruments to reduce our exposure to fluctuations in interest rates on variable rate debt and foreign currency exchange rates. As of June 30, 2024, we had $5.9 million of derivative liabilities, of which $0.5 million matures within one year. The remaining $5.4 million matures in 2028. For additional information, see Note 6 to our Consolidated Financial Statements included in Part I, Item 1 of this Quarterly Report. Investments. As of June 30, 2024, we held $47.9 million in Swedish treasury securities to meet the liquidity requirements of the Swedish Financial Services Authority for our banking subsidiary, AK Nordic AB.
We believe that funds generated from operations and cash collections on nonperforming loan portfolios, together with existing cash, available borrowings under our revolving credit facilities and access to the capital markets, will be sufficient to finance our operations, planned capital expenditures, forward flow purchase commitments, debt maturities and additional portfolio purchases during the next 12 months and beyond. Market conditions permitting, we may seek to access the debt or equity capital markets as we deem appropriate. Business acquisitions or higher than expected levels of portfolio purchasing could require additional financing from other sources. We may also, from time-to-time, repurchase senior notes in the open market or otherwise.
Cash Flow Analysis
The following table summarizes our cash flow activity for 2024 year-to-date compared to the prior year period (amounts in thousands):
| | | | | | | | | | | | | | | | | | | |
| Year-to-Date | | |
| 2024 | | 2023 | | $ Change | | |
| Net cash provided by/(used in): | | | | | | | |
| Operating activities | $ | (102,488) | | | $ | (80,839) | | | $ | (21,649) | | | |
| Investing activities | (96,195) | | | (93,967) | | | (2,228) | | | |
| Financing activities | 203,826 | | | 208,496 | | | (4,670) | | | |
| Effect of exchange rate on cash | 1,082 | | | 6,216 | | | (5,134) | | | |
| Net increase/(decrease) in cash, cash equivalents and restricted cash | $ | 6,225 | | | $ | 39,906 | | | $ | (33,681) | | | |
Operating Activities
Net cash used in operating activities mainly reflects cash collections recognized as revenue and cash paid for operating expenses, interest and income taxes. To calculate net cash used in operating activities, net income/(loss) was adjusted for (i) non-cash items included in net income such as unrealized foreign currency transaction gains/(losses), changes in expected recoveries, depreciation and amortization, deferred taxes, fair value changes in equity securities, and stock-based compensation, as well as (ii) changes in the balances of operating assets and liabilities, which can vary significantly in the normal course of business due to the amount and timing of payments.
Cash used in operating activities was $102.5 million 2024 year-to-date compared to $80.8 million in the prior year period. Higher cash paid for interest and operating expenses was partially offset by higher cash collections recognized as income and a lower impact from foreign currency transactions.
Investing Activities
Net cash used in investing activities increased $2.2 million compared to the prior year period. An increase of $65.6 million in purchases of nonperforming loan portfolios was partially offset by an increase of $57.0 million in recoveries applied to the negative allowance and a $7.2 million increase in net cash flow from purchases and disposals of investments.
Financing Activities
Net cash provided by financing activities decreased $4.7 million compared to the prior year period. A net decrease of $8.1 million in proceeds from lines of credit and senior notes and a $16.2 million increase in distributions to noncontrolling interests were partially offset by a $14.9 million increase in interest-bearing deposits.
In Q2 2024, we repaid $395.9 million aggregate principal amount of outstanding borrowings under our North American revolving credit agreement with the net proceeds from the issuance of our 2030 Notes. For additional details about these transactions, refer to Note 5 to our Consolidated Financial Statements included in Part I, Item 1 of this Quarterly Report. Recent Accounting Pronouncements
For discussion of recent accounting pronouncements and the anticipated effects on our Consolidated Financial Statements, see Note 11 to our Consolidated Financial Statements included in Part I, Item 1 of this Quarterly Report. Critical Accounting Estimates
Our Consolidated Financial Statements have been prepared in accordance with GAAP. Some of our significant accounting policies require that we use estimates, assumptions and judgments that affect the reported amounts of revenues, expenses, assets and liabilities. For a discussion of our significant accounting policies and critical accounting estimates, refer to Note 1 to our Consolidated Financial Statements in the 2023 Form 10-K.
We consider accounting estimates to be critical if they (1) involve a significant level of estimation uncertainty and (2) have had or are reasonably likely to have a material impact on our financial condition or results of operations. We base our estimates on historical experience, current trends and various other assumptions that we believe are reasonable under the circumstances, the results of which form the basis for making judgments about the carrying values of assets and liabilities that are not readily apparent from other sources. If these estimates differ significantly from actual results, the impact on our Consolidated Financial Statements may be material. We have determined that the following accounting policies involve critical estimates:
Revenue Recognition - Finance Receivables
Revenue recognition for finance receivables involves the use of estimates and the exercise of judgment on the part of management. These estimates include projections of the amount and timing of cash collections we expect to receive from our pools of accounts. We review individual pools for trends, actual performance versus projections and curve shape (a graphical depiction of the amount and timing of cash collections). We then project ERC and apply a discounted cash flow methodology to our ERC. Adjustments to ERC may include adjustments reflecting recent collection trends, our view of current and future economic conditions, changes in collection assumptions or other timing related adjustments.
Significant changes in our cash flow estimates could result in increased or decreased revenue as we immediately recognize the discounted value of such changes using the constant effective interest rate of the pool. Generally, adjustments to cash forecasts result in an adjustment to revenue at an amount less than the impact of the performance in the period due to the
effects of discounting. Additionally, cash collection forecast increases will result in more revenue being recognized and cash collection forecast decreases in less revenue being recognized over the life of the pool.
Goodwill
In accordance with Financial Accounting Standards Board ("FASB") ASC Topic 350, "Intangibles-Goodwill and Other" ("ASC 350"), we evaluate goodwill for impairment annually as of October 1, and more frequently if circumstances indicate that it is more-likely-than-not that the fair value of a reporting unit is below its carrying value.
We determine the fair value of a reporting unit by applying approaches prescribed under ASC Topic 820 "Fair Value Measurements and Disclosures": the income approach and the market approach. Under the income approach, we estimate the fair value of a reporting unit based on the present value of estimated future cash flows and a residual terminal value. Cash flow projections are based on management's estimates of a variety of factors, including growth rates and operating margins, which take into consideration industry and market conditions. Under the market approach, we estimate fair value based on market trading multiples and other relevant market transactions involving comparable publicly traded companies with operating and investment characteristics similar to the reporting unit. Depending on the availability of public data and suitable comparable transaction data, we may give more weight to the income approach than the market approach. We also assess the reasonableness of the aggregate estimated fair value of our reporting units by comparison to our market capitalization over a reasonable period, considering historic control premiums in the financial services industry and the current market environment.
As of June 30, 2024, we had goodwill of $415.6 million, consisting primarily of $388.8 million in our Debt Buying and Collection ("DBC") reporting unit. We performed our most recent annual review of the DBC reporting unit as of October 1, 2023, and concluded that goodwill was not impaired.
As of June 30, 2024, our quarterly impairment assessment did not identify the occurrence of any triggering events, and we determined our goodwill was not more-likely-than-not impaired. However, consistent with our most recent annual review, the DBC reporting unit may be at-risk for future impairment if our cash flow projections are not met or if market factors utilized in the impairment test deteriorate, including adverse changes in the debt sales market that impact our estimated purchasing volumes and purchase price multiples, and/or an increase in the discount rate. For additional information, refer to Item 7 "Management's Discussion and Analysis of Financial Condition and Results of Operations - Critical Accounting Estimates" of the 2023 Form 10-K.
Income Taxes
We are subject to income taxes in the U.S. and in numerous international jurisdictions. The tax laws are complex and subject to different interpretations by the taxpayer and the relevant government taxing authorities. When determining our domestic and non-U.S. income tax expense, we make judgments about the application of these inherently complex laws.
We record a tax provision for the anticipated tax consequences of the reported results of operations. The provision for income taxes is estimated using the asset and liability method, under which deferred tax assets and liabilities are recognized for the expected future tax consequences of temporary differences between the financial reporting and tax basis of assets and liabilities, and for operating losses and tax credit carryforwards. Deferred tax assets and liabilities are measured using the currently enacted tax rates that apply to taxable income in effect for the years in which those tax assets are expected to be realized or settled.
We exercise significant judgment in estimating the potential exposure to unresolved tax matters and apply a more likely than not standard for recording tax benefits related to uncertain tax positions in the application of complex tax laws. While actual results could vary, we believe we have adequate tax accruals with respect to the ultimate outcome of such unresolved tax matters. We record interest and penalties related to unresolved tax matters as a component of income tax expense when the more likely than not standards are not met.
If all or part of the deferred tax assets are determined not to be realizable in the future, we would establish a valuation allowance and charge the impact to earnings in the period such a determination is made. If we subsequently realize deferred tax assets that were previously determined to be unrealizable, the respective valuation allowance would be reversed, resulting in a positive adjustment to earnings. The establishment or release of a valuation allowance does not have an impact on cash, nor does such an allowance preclude the use of loss carryforwards or other deferred tax assets in future periods. The calculation of tax liabilities involves significant judgment in estimating the impact of uncertainties in the application of complex tax laws. Resolution of these uncertainties in a manner inconsistent with our expectations could have a material impact on our results of operations and financial position. For further information regarding our uncertain tax positions, refer to Note 13 to our Consolidated Financial Statements in the 2023 Form 10-K.
Item 3. Quantitative and Qualitative Disclosures About Market Risk
Our business is subject to various financial risks, including market, currency, interest rate, credit, liquidity and cash flow risk. We use various strategies, including derivative financial instruments, to manage these risks; however, they can still impact our Consolidated Financial Statements.
We do not utilize derivative financial instruments with a level of complexity or with a risk greater than the exposure to be managed, nor do we enter into or hold derivatives for trading or speculative purposes. Derivative instruments involve, to varying degrees, elements of non-performance, or credit risk. We do not believe that we currently face a significant risk of loss in the event of non-performance by the counterparties to these instruments, as these transactions were executed with a diversified group of major financial institutions with investment-grade credit ratings. Our intention is to spread our counterparty credit risk across a number of counterparties so that exposure to a single counterparty is mitigated.
Interest Rate Risk
We are subject to interest rate risk from borrowings on our variable rate credit facilities, as well as our interest-bearing deposits. As such, our consolidated financial results are subject to fluctuations due to changes in market interest rates. To reduce our exposure to changes in the market rate of interest, we have entered into interest rate derivative contracts to hedge a portion of our borrowings under floating rate financing arrangements. Under the terms of the interest rate derivatives, we receive a variable interest rate and pay a fixed interest rate. Of our $3.1 billion in total borrowings as of June 30, 2024, $1.4 billion was fixed rate debt. Considering these fixed rate borrowings and the interest rate hedges on our variable rate debt, with maturities ranging from six months to four years, as of June 30, 2024, 70% of our total debt was either fixed rate or converted to a fixed rate.
We assess interest rate risk by estimating the increase or decrease in interest expense that would occur due to a change in short-term interest rates. Borrowings on our variable rate credit facilities were $1.7 billion as of June 30, 2024, and based on our debt structure, assuming a 50 basis point decrease/increase in interest rates, interest expense over the following 12 months would decrease/increase by an estimated $4.9 million.
Currency Exchange Risk
We operate internationally and enter into transactions denominated in various foreign currencies. Our subsidiaries use multiple functional currencies, and weakness in one particular currency might be offset by strength in other currencies over time. During Q2 2024, our revenues from operations outside the U.S. were $131.4 million.
Fluctuations in foreign currencies could cause us to incur foreign currency gains and losses, and could affect our comprehensive income and stockholders' equity. Additionally, our reported financial results could change from period-to-period due solely to fluctuations between currencies. Foreign currency gains and losses are primarily the result of the remeasurement of transactions in other currencies into an entity's functional currency. Foreign currency gains and losses are included as a component of Other income and (expense) in our Consolidated Income Statements. From time-to-time, we may elect to enter into foreign exchange derivative contracts to reduce these variations in our Consolidated Income Statements.
When an entity's functional currency is different than the reporting currency of its parent, foreign currency translation adjustments may occur. Foreign currency translation adjustments are included as a component of Other comprehensive income/(loss) in our Consolidated Statements of Comprehensive Income and as a component of Equity in our Consolidated Balance Sheets.
We have taken measures to mitigate the impact of foreign currency fluctuations. We have organized our European operations so that portfolio ownership and collections generally occur within the same entity. Additionally, our European and UK credit facilities are multi-currency facilities, allowing us to better match funding and portfolio acquisitions by currency. We actively monitor the value of our finance receivables by currency. In the event adjustments are required to our liability composition by currency, we may, from time-to-time, execute re-balancing foreign exchange contracts to more closely align funding and portfolio acquisitions by currency.
Item 4. Controls and Procedures
Evaluation of Disclosure Controls and Procedures. We maintain disclosure controls and procedures (as defined in Exchange Act Rules 13a-15(e) and 15d-15(e)) that are designed to ensure that information required to be disclosed in our Exchange Act reports is recorded, processed, summarized and reported within the time periods specified in the SEC's rules and forms, and that such information is accumulated and communicated to our management, including our Chief Executive Officer and Chief Financial Officer, as appropriate, to allow timely decisions regarding required disclosure. In designing and evaluating the disclosure controls and procedures, management recognized that any controls and procedures, no matter how well designed and operated, can provide only reasonable assurance of achieving the desired control objectives, and management necessarily was required to apply its judgment in evaluating the cost-benefit relationship of possible controls and procedures. Also, projections of any evaluation of effectiveness to future periods are subject to the risk that controls may become inadequate because of changes in conditions or that the degree of compliance with the policies or procedures may deteriorate. We conducted an evaluation, under the supervision and with the participation of our principal executive officer and principal financial officer, of the effectiveness of our disclosure controls and procedures as of the end of the period covered by this Quarterly Report. Based on this evaluation, the principal executive officer and principal financial officer have concluded that, as of June 30, 2024, our disclosure controls and procedures were effective.
Changes in Internal Control over Financial Reporting. There was no change in our internal control over financial reporting that occurred during the quarter ended June 30, 2024, that has materially affected, or is reasonably likely to materially affect, our internal control over financial reporting.
Part II. Other Information
Item 1. Legal Proceedings
For information regarding legal proceedings as of June 30, 2024, refer to Note 10 to our Consolidated Financial Statements included in Part I, Item 1 of this Quarterly Report. Item 1A. Risk Factors
There have been no material changes in our risk factors from those disclosed in Part I, Item 1A of the 2023 Form 10-K.
Item 2. Unregistered Sales of Equity Securities and Use of Proceeds
Share Repurchase Programs
We do not currently pay regular dividends on our common stock and did not pay dividends during the second quarter of 2024; however, our Board of Directors may determine in the future to declare or pay dividends on our common stock. Our credit facilities and the indentures governing our senior notes contain financial and other restrictive covenants, including restrictions on certain types of transactions and our ability to pay dividends to our stockholders and repurchase our common stock.
Item 3. Defaults Upon Senior Securities
None.
Item 4. Mine Safety Disclosures
Not applicable.
Item 5. Other Information
On May 31, 2024, Martin Sjölund, President of PRA Group Europe, adopted a written arrangement that is intended to satisfy the affirmative defense conditions of Exchange Act Rule 10b5-1(c) (the "Trading Plan"). The Trading Plan provides for the sale of 14,433 shares of our common stock and will terminate on May 30, 2025, unless terminated earlier in accordance with the Trading Plan's terms.
Item 6. Exhibits
| | | | | |
| |
| Ninth Amendment to the Credit Agreement dated June 21, 2024 by and among PRA Group, Inc and PRA Group Canada Inc., the Guarantors, the Lenders party thereto, Bank of America, N.A., as Administrative Agent and Bank of America, N.A., acting through its Canada Branch, as Canadian Administrative Agent (filed herewith). |
| |
| |
| |
| 101.INS | XBRL Instance Document - the instance document does not appear in the Interactive Data File because its XBRL tags are embedded within the Inline XBRL document |
| 101.SCH | XBRL Taxonomy Extension Schema Document |
| 101.CAL | XBRL Taxonomy Extension Calculation Linkable Document |
| 101.LAB | XBRL Taxonomy Extension Label Linkable Document |
| 101.PRE | XBRL Taxonomy Extension Presentation Linkable Document |
| 101.DEF | XBRL Taxonomy Extension Definition Linkbase Document |
| 104 | Cover Page Interactive Data File (formatted as Inline XBRL and contained in Exhibit 101) |
| |
| |
SIGNATURES
Pursuant to the requirements of the Securities Exchange Act of 1934, the registrant has duly caused this report to be signed on its behalf by the undersigned, thereunto duly authorized.
| | | | | | | | | | | |
| | | |
| PRA Group, Inc. |
| (Registrant) |
| | | |
| August 7, 2024 | By: | | /s/ Vikram A. Atal |
| | | Vikram A. Atal |
| | | President and Chief Executive Officer |
| | | (Principal Executive Officer) |
| | | | | | | | | | | |
| | | |
| | | |
| August 7, 2024 | By: | | /s/ Rakesh Sehgal |
| | | Rakesh Sehgal |
| | | Executive Vice President and Chief Financial Officer |
| | | (Principal Financial and Accounting Officer) |