 Transaction overview On February 25, 2007, an Investor Group led by Kohlberg Kravis Roberts & Co. (“KKR”) and TPG Capital, L.P. (“TPG”) signed a definitive agreement to acquire TXU Corp., now Energy Future Holdings Corp. (“EFH”), in a transaction valued at approximately $49 billion EFH shareholders are entitled to receive $69.25 in cash for each share of common stock of EFH In addition to KKR and TPG, GS Capital Partners, Lehman Brothers, Citigroup and Morgan Stanley were equity investors at closing, with additional passive equity owners anticipated (together, the “Investor Group”) The Investor Group funded the transaction with $8.3 billion of new and roll-over equity and new, funded debt at EFH and Texas Competitive Electric Holdings Company LLC (“TECH” and formerly TXU Energy Company LLC) The Investor Group reviewed applicable rating agency guidelines and other publications regarding ring-fencing and developed a ring-fencing plan for Oncor that includes specific enhancements that meet or exceed key guidelines In doing so, Oncor Electric Delivery (“Oncor” and formerly TXU Electric Delivery) made firm commitments to regulators to maintain the structural separation of Oncor Specific contractual and structural enhancements to support Oncor’s credit ratings No new debt at Oncor to finance the transaction No change to the current management team or the way management intends to operate the business Appropriate and adequate liquidity facilities to be in place to support Oncor’s capital investment plan The Public Utility Commission of Texas (“PUCT”) will issue a legally binding order that embodies key commitments resulting in their enforceability by the Commission The transaction closed on October 10, 2007 3 Exhibit 99.1 |
 Sources of funds ($ millions) Uses of funds ($ millions) Sources / uses of funds and pro forma capitalization New revolving credit facility $1,316 Daily cash flow 14 Total sources $1,330 Repay floating rate senior notes $803 Repay existing A/R facility 113 Repay existing credit facility 386 Repay intercompany loans 23 Cash on balance sheet 5 Total uses $1,330 Pro forma capitalization ($ millions) Note: Existing capitalization as of June 30, 2007; excludes transition bonds 1 Shareholders’ equity does not reflect potential purchase accounting adjustments 5 At 6/30/07 Pro forma Amount % of Cap. Amount % of Cap. Intercompany loans $33 0.5% $ - 0.0% Short term borrowings 155 2.2% 1,316 18.5% Long-term debt due currently 200 2.9% - 0.0% Long-term debt 3,650 52.3% 2,850 40.1% Total debt $4,038 57.8% $4,166 58.6% Shareholder's equity at 6/30/07 2,947 42.2% 2,947 1 41.4% Total capitalization $6,985 100.0% $7,113 100.0% |
 The Investor Group’s commitment to maintaining the credit quality of Oncor The Investor Group has made a number of binding commitments to the PUCT as part of the regulatory process Business Continued emphasis on employee and customer safety No assets transferred from Oncor as a result of the transaction No change in Oncor’s business plan; imperative to leave rate payers unaffected Commitment to the execution of Oncor’s capital plan and recognition that it is essential to maintaining reliability and serving the growing needs of the ERCOT market The Investor Group plans to ensure continuity of best operating practices by retaining the current Oncor management team Contractual and structural Committed to a variety of contractual, structural and other enhancements, which we will discuss further over the course of today’s presentation The PUCT has authority to enforce a number of the separateness commitments made in connection with the transaction Financial No new debt issued at Oncor to finance the transaction Credit metrics of Oncor will be unaffected on a stand-alone basis as a result of the transaction Commitment to maintain a regulatory capital structure that is consistent with, or more conservative than, that which is used by the PUCT for recovery in Oncor’s rates (currently 60% debt / 40% equity) Oncor will limit the dividends paid by Oncor through December 31, 2012, to an amount not to exceed Oncor’s net income (determined in accordance with GAAP), subject to certain defined adjustments Appropriate and adequate liquidity facilities to be in place to support Oncor’s capital investment plan 6 |
 Summary of key investment considerations Pure infrastructure business with stable cash flows Benefits from a rate regulated monopoly, which enhances the stability of financial performance Regulatory separation of retail supply from transmission and distribution services eliminates commodity volatility No end-use customer credit risk Capital tracking mechanisms reduce the need for regular rate cases and provide current revenue to support investments Constructive regulatory environment Track record of constructive relationship with primary regulator, the PUCT Reasonable regulatory rate construct, which provides adequate and timely recovery of operating costs and return of and on capital invested Strong underlying business fundamentals Substantial historical and projected underlying economic growth with business sector diversity in primary market, reducing the underlying volatility of such growth Industry leading operating performance and reliability Over the past five years, operated at or near top decile metrics, in terms of O&M expense per customer and O&M expense per MWh delivered Operated at or near the top quartile for a variety of reliability metrics Track record and projected continuation of strong financial performance Conservative capitalization and consistent historical financial performance result in strong, investment grade profile Projected credit metrics (not impacted by transaction) support strong investment grade ratings and are well within investment grade guidelines for public utilities with comparable business risk profiles 7 |
 Summary of key investment considerations (cont’d) Ample liquidity to meet ongoing capital investment needs Retained earnings combined with new $2.0bn revolver provide adequate liquidity to support Oncor’s capital investment plan Significant enhancements provided by ring-fencing mechanisms Insertion of new bankruptcy-remote entity, Oncor Electric Delivery Holdings Company (“Oncor Holdings”), whose sole purpose is to hold the equity interest in Oncor and other ring-fenced entities and create a “clean” legal and operational separation of Oncor Holdings and its subsidiaries from EFH and its other subsidiaries (the “EFH Group”) Unanimous, affirmative vote of all directors present and voting (including, in any event, all independent directors) required for certain corporate actions, including causing Oncor or Oncor Holdings to voluntarily file for bankruptcy No pledge or guarantee of assets at Oncor or Oncor Holdings to support any of the obligations of the EFH Group Restrictions to regulatory debt / capitalization ratio are part of Oncor’s organizational documents Variety of other separation provisions in Oncor and Oncor Holdings organizational documents, including requirement that a majority of directors be independent Non-consolidation opinion to validate separateness Requested PUCT ability to enforce certain separateness commitments PUCT will issue a legally binding order that embodies key commitments resulting in their enforceability by the commission Strong, experienced management team Excellent track record of having executed successfully on large capital plans in prior periods Exceptional operational track record 8 |
 Oncor: an independently operated business Former brand TXU Electric Delivery New brand Business description Sixth largest T&D company in US High growth region (ERCOT) Efficient capital recovery Top quartile costs and reliability No commodity exposure No end-user risk CEO Robert Shapard Board of directors At least majority independent in all material respects pursuant to New York Stock Exchange criteria, including at least two directors that are independent pursuant to S&P criteria Headquarters location Dallas LTM EBITDA¹ $1,129 million Summary overview ¹ EBITDA is adjusted for transition bonds. As of 06/30/07 10 |
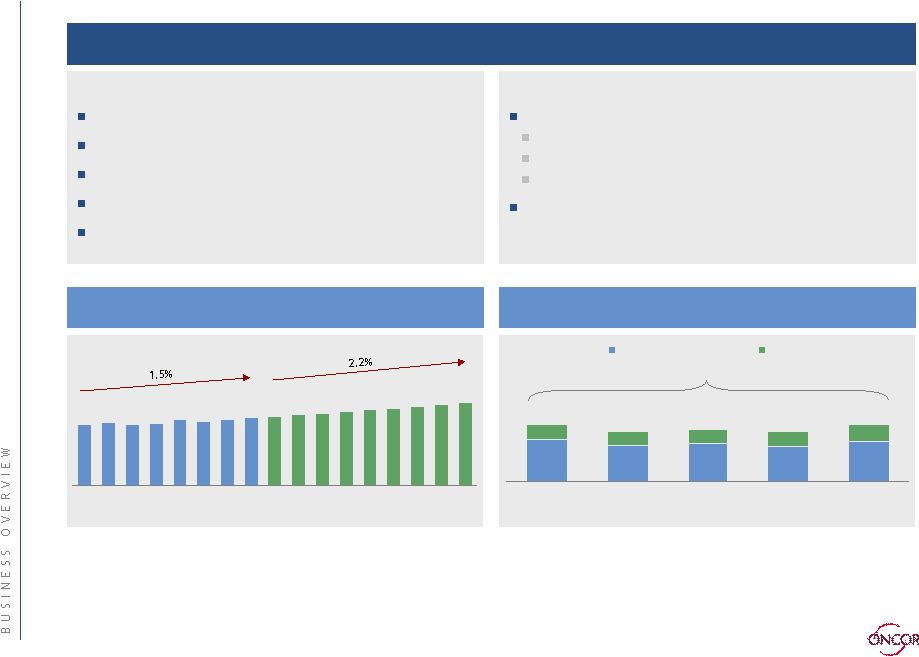 Oncor has very attractive business characteristics Constructive regulatory conditions Efficient capital recovery Transmission trackers AMR trackers Serve new distribution 60%/40% debt to equity Attractive business dynamics 6th largest US transmission and distribution company ERCOT is high growth region Top quartile costs and reliability No commodity exposure No retail customers Commitment to improving top quartile reliability and cost performance and investing prudent capital to maintain, upgrade and expand the ERCOT transmission grid Significant long-term demand growth 1999—2015E; Average peak demand (GW) 56 58 55 56 60 59 60 62 63 64 66 68 69 70 72 74 75 1999 2001 2003 2005 2007E 2009E 2011E 2013E 2015E 571 488 514 476 535 195 187 184 204 244 $766 $675 $698 $680 $779 2007E 2008E 2009E 2010E 2011E Tracker and New Serve All Other Large capital program with mechanism for efficient recovery 2007E—2011E ($ millions) >70% recovered via tracker, new serve Source: SNL Financial 11 |
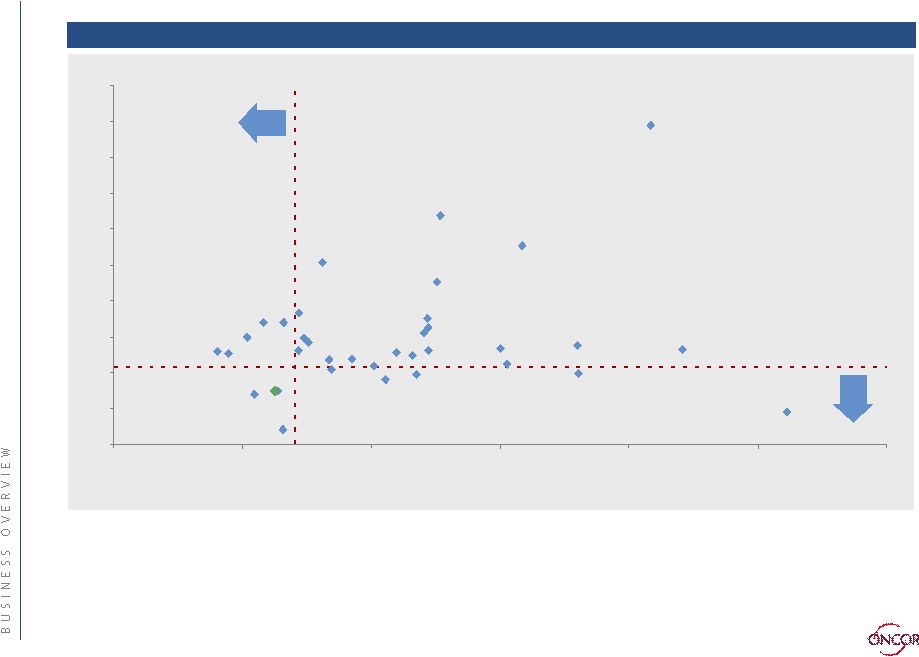
 Oncor’s advantaged structural position 197 194 107 106 104 101 85 82 81 57 SO EXC Oncor FPL PGN ETR DUK PCG D ED Oncor has a unique business model that looks more like a FERC pipeline than a traditional utility Large infrastructure base 2005 (annual TWh delivered) Highly favorable business risk profile FERC TransCo Oncor Pipeline MLP’s Water Utility Gas LDCs Traditio nal T&D Regulation FERC State FERC State State State Capital Tracker Yes Yes No Some No No Commodity Risk No No No No Yes Yes Retail Customers No No No Yes Yes Yes 2.6 3.6 3.7 3.8 4.1 4.1 5.9 6.4 6.9 7.6 7.9 8.2 2.6 2.1 2.3 2.0 2.0 15.9 15.4 15.0 14.5 14.2 13.7 13.2 11.4 11.6 11.1 10.4 10.4 10.3 8.7 8.4 8.3 9.2 1994 1995 1996 1997 1998 1999 2000 2001 2002 2003 2004 2005 2006 2007E 2008E 2009E 2010E Transmission CAPEX Distribution CAPEX Exposure to growing national need for transmission grid investment—historical and estimated T&D capex 1994—2010E (nominal $bn) Oncor is a scale player in a high-growth region, with a highly favorable business, regulatory, and structural profile Source: 10-Ks Constructive regulatory environment Outstanding Above average Average Below average Source: Wall Street Research Increased capital spend growth from reliability upgrades, new generation connection, congestion relief, organic growth and technology advances 12 |
 0 50 100 150 200 250 300 350 400 450 500 50 100 150 200 250 300 350 Oncor’s history of cost efficient and reliable performance Oncor Top quartile SAIDI Top quartile cost ¹ Excluding major events and planned outages; System Average Interruption Duration Index is defined as the number of minutes per year that the average customer is out of electric service Distribution O&M plus maintenance capital per customer US Electric Delivery Company Performance 2006 (SAIDI¹) 13 |
 Recent regulatory events On October 5, 2007, Oncor announced that along with TEF it had agreed in principle with major interested parties to resolve all outstanding issues in the PUCT review related to the merger The agreement also included provisions under which the PUCT would dismiss Oncor’s pending rate case The agreement is subject to approval by the PUCT The stipulated agreement includes the following provisions, among others: Oncor will agree to a one-time credit of $72 million, which is intended for all retail customers in its service territory Oncor will file a system-wide rate case no later than July 1, 2008 based on a test-year ended December 31, 2007 Oncor will incur a one-time $35 million write-off in 2007 or 2008 to its storm reserve and a one-time write- off in 2007 or 2008 to the 2002 restructuring expenses held as regulatory assets (approximately $21 million) Oncor will make annual reports to the PUCT regarding compliance with its commitments Oncor will limit the dividends paid by Oncor through December 31, 2012, to an amount not to exceed Oncor’s net income (determined in accordance with GAAP), subject to certain defined adjustments Oncor will commit to minimum capital spending of $3.6 billion over the five-year period ending December 31, 2012, subject to certain defined conditions Oncor will agree to certain system reliability, street light maintenance and customer service standards 14 |
 Oncor’s capital structure No new debt at Oncor to finance the merger Total revolver capacity $2,000 Credit facility draw at close 1 $1,316 Net revolver capacity available at close $684 Pro forma capitalization ($ millions) Oncor Electric Delivery Holdings Ring-fenced ¹ Credit facility draw includes refinancings of long term debt maturities at or before closing 1 After giving effect to the merger and related financing activities, excluding transition bonds Liquidity ($ millions) 16 Oncor Electric Delivery Company Total debt (6/30/07) 1 $4,166 LTM 6/30/07 Oncor adjusted EBITDA $1,129 Oncor total debt / LTM EBITDA 3.7x |
 Treatment of Oncor’s existing indebtedness Issuer / Tranche Size ($ millions) Treatment Oncor Electric Delivery Bank debt $155 Refinanced at closing Floating rate notes due 2008 800 Refinanced at closing Intercompany borrowing 33 Refinanced at closing Long term debt due currently 200 Matured in September 2007 Other senior debt 2,850 Remains outstanding Oncor Electric Delivery Transition Bond Company Transition bonds 1,053 Remain outstanding Debt balances as of June 30, 2007 17 |
 Summary of proposed ring-fencing provisions A new bankruptcy-remote entity, Oncor Holdings, was formed to hold EFH’s equity interest in Oncor and other ring-fenced entities Creates a “clean” legal and structural separation between Oncor and its subsidiaries and EFH and its subsidiaries other than the ring-fenced entities (collectively, the “Non-Ring-Fenced Entities”) Additional elements of the ring-fencing include: Separateness covenants included in the organizational documents of Oncor and Oncor Holdings At least a majority of the directors of Oncor and Oncor Holdings will be independent Independent directors will have certain approval rights over material actions, including instituting or consenting to the institution of bankruptcy proceedings Potential minority investor in Oncor with up to approximately 20% ownership stake and potential board representation Dividends limited so that Oncor's regulatory debt to equity ratio will remain at or below the approved ratio established by the PUCT for ratemaking purposes (currently at 60 / 40 debt to equity), and, through December 31, 2012, dividends will also be limited to an amount not to exceed Oncor's net income (determined under GAAP), subject to certain defined adjustments Oncor, Oncor Holdings and its other subsidiaries will not guarantee or support any of the new obligations of any Non-Ring-Fenced Entity EFH and Oncor have implemented certain mechanisms to ring-fence Oncor from EFH and its competitive businesses in order to preserve the credit quality of Oncor 19 |
 Corporate governance Oncor Holdings Will have at least majority of independent directors to monitor compliance with Oncor Holdings’ organizational documents and whose approval is affirmatively required before Oncor Holdings may take certain material actions The function of the directors of Oncor Holdings is principally to appoint directors to Oncor’s Board, and to make determinations regarding matters related to its ownership of equity in Oncor Oncor Will have nine directors (potentially more if Oncor has minority investors) At least a majority of the directors will be independent in all material respects from the EFH Group and the Investor Group, according to the NYSE definition of “independent” At least two independent directors will satisfy S&P’s requirements for independence Board composition Number of directors Number of NYSE independent directors Number of S&P independent directors Independent directors 6 6 2 EFH nominees 2 — — Oncor management 1 — — Potential minority investors 2+ 2+ 0—2+ Total 9—11+ 6—8+ 2—4+ Unanimous approval of all directors present and voting (including, in any event, all independent directors) is required to cause Oncor to file for bankruptcy, enter into certain transactions to merge, consolidate, or sell all or substantially all of Oncor’s assets, or liquidate or dissolve without adequate provisions for the payment of all creditors of Oncor The Oncor board or the independent directors, each acting by majority vote, has the authority to prevent Oncor from paying dividends if it or they determine that it is in the best interest of Oncor to retain such amounts to meet expected future requirements, including compliance with the debt to equity ratio established by the PUCT for rate making purposes Note: As of October 10, 2007, the boards had three independent directors, two of which satisfied S&P requirements, one member of Oncor management, and one EFH nominee 20 |
 Summary financials ($ millions) Oncor historical financials Year ended December 31, 6 months ended June 30, 2004 2005 2006 2006 2007 LTM June 30, 2007 Total operating revenues $2,226 $2,394 $2,449 $1,166 $1,195 $2,478 Total operating expenses $1,697 $1,805 $1,838 $893 $909 $1,854 Operating income $529 $589 $611 $273 $286 $624 EBITDA $1,057 $1,241 $1,276 $597 $602 $1,281 Less: Securitization revenue (106) (153) (154) (74) (72) (152) Adjusted EBITDA $951 $1,088 $1,122 $523 $530 $1,129 Capital expenditures 600 733 840 452 382 770 Balance sheet Cash and cash equivalents $ - $15 $1 $1 $1 $1 Total assets 9,493 9,911 10,709 10,296 10,949 10,949 Property, plant and equipment—net 6,609 7,067 7,608 7,377 7,847 7,847 Capitalization Long-term debt, less current amounts $4,199 $4,107 $3,811 $4,059 $4,562 $4,562 Excluding transition bonds 3,032 3,033 2,833 3,033 3,634 3,634 Transition bonds, less current amounts 1,167 1,074 978 1,026 928 928 Shareholders' equity 2,687 2,935 2,975 2,949 2,947 2,947 Total $6,886 $7,042 $6,786 $7,008 $7,509 $7,509 Capitalization ratios Long-term debt, less current amounts 61.0% 58.3% 56.2% 57.9% 60.8%¹ 60.8%¹ Shareholders' equity 39.0% 41.7% 43.8% 42.1% 39.2% 39.2% Total 100.0% 100.0% 100.0% 100.0% 100.0% 100.0% Note: Oncor’s financial statements include its wholly-owned, bankruptcy remote financing subsidiary, Oncor Electric Delivery Transition Bond Company LLC. Oncor Electric Delivery Transition Bond Company LLC was organized for the limited purpose of issuing securitization bonds to recover generation-related regulatory asset stranded costs and other qualified costs 1 The debt to equity ratio for regulatory purposes as of June 30, 2007 was 56.5% debt / 43.5% equity 22 |
 Oncor Adjusted EBITDA Reconciliation Year ended December 31, 6-month ended June 30, 2004 2005 2006 2006 2007 LTM June 30, 2007 Net income $273 $351 $344 $151 $139 $332 Provision for income taxes 116 174 170 75 76 171 Interest expense 279 269 286 140 154 300 Depreciation and Amortization 389 447 476 231 233 478 EBITDA $1,057 $1,241 $1,276 $597 $602 $1,281 Adjustments to EBITDA Less: Securitization revenue (106) (153) (154) (74) (72) (152) Adjusted EBITDA $951 $1,088 $1,122 $523 $530 $1,129 Reconciliation of net income to EBITDA ($ millions) 28 |