Exhibit 99.2
| 1. | Transaction overview |
On February 25, 2007, TXU Corp. (now named Energy Future Holdings Corp.) (“EFH”) entered into an Agreement and Plan of Merger (the “Merger Agreement”) with Texas Energy Future Merger Sub Corp and Texas Energy Future Holdings Limited Partnership (“Texas Holdings”), a limited partnership established by investment funds associated with Kohlberg Kravis Roberts & Co. (“KKR”) and TPG Capital, L.P. (“TPG”). The Merger Agreement was approved by existing shareholders on September 7, 2007. Under the terms of the Merger Agreement, EFH shareholders received $69.25 per share in cash for each share of EFH common stock they held. The “Transaction” was completed on October 10, 2007 and investment funds associated with or designated by KKR, TPG, and Goldman, Sachs & Co. (collectively, the “Sponsors”), and certain other co-investors (collectively with the Sponsors, the “Investor Group”) became the owners of EFH.
In connection with the Transaction, the Sponsors engaged J.P. Morgan Securities Inc., Citigroup Global Markets Inc., Credit Suisse Securities (USA) LLC, Goldman Sachs Credit Partners L.P., Lehman Brothers Inc. and Morgan Stanley Senior Funding, Inc. (collectively the “Arrangers”) to provide a new $2,000 million Senior Secured Revolving Credit Facility for Oncor Electric Delivery Company LLC (formerly known as Oncor Electric Delivery Company and TXU Electric Delivery Company, “Oncor”), an indirect wholly-owned subsidiary of EFH.
Upon consummation of the Transaction, Oncor implemented certain structural and operational measures intended to further separate Oncor from EFH and its other subsidiaries in order to protect Oncor’s financial integrity and credit from financial risks related to EFH and its other subsidiaries and to strengthen the legal separation of Oncor from its unregulated affiliates. In addition, these actions reduce the risk that the assets and liabilities of Oncor would be substantively consolidated with the assets and liabilities of EFH or any of its other subsidiaries in the event of a bankruptcy of one or more of those entities. Additionally, no new debt has been raised at Oncor to finance the Transaction. Proceeds from new funded debt at Oncor were used to repay existing indebtedness and for working capital and general corporate purposes.
Sources and uses at transaction close ($ millions)
Sources | Uses | |||||||
| New revolving credit facility | $ | 1,316 | Repay floating rate senior notes | $ | 803 | |||
| Daily cash flow | 14 | Repay existing A/R facility | 113 | |||||
| Repay existing credit facility | 386 | |||||||
| Repay intercompany loans | 23 | |||||||
| Cash on balance sheet | 5 | |||||||
Total sources | $ | 1,330 | Total uses | $ | 1,330 | |||
Pro forma capitalization ($ millions)
| At 6/30/07 | Pro forma | ||||||||||||
| Amount | % of Cap. | Amount | % of Cap. | ||||||||||
Intercompany loans | $ | 33 | 0.5 | % | $ | — | 0.0 | % | |||||
Short term borrowings | 155 | 2.2 | % | 1,316 | 18.5 | % | |||||||
Long-term debt due currently | 200 | 2.9 | % | — | 0.0 | % | |||||||
Long-term debt | 3,650 | 52.3 | % | 2,850 | 40.1 | % | |||||||
Total debt | $ | 4,038 | 57.8 | % | $ | 4,166 | 58.6 | % | |||||
Shareholder’s equity | 2,947 | 42.2 | % | 2,947 | 1 | 41.4 | % | ||||||
Total capitalization | $ | 6,985 | 100.0 | % | $ | 7,113 | 100.0 | % | |||||
Note: Existing capitalization as of June 30, 2007; excludes transition bonds
1 | Shareholder’s equity does not reflect potential purchase accounting adjustments |
Oncor credit ratings
On October 8, 2007, Fitch and on October 9, 2007, both Moody’s and Standard & Poor’s released revised corporate and facility ratings for Oncor as a result of the Transaction. Oncor’s ratings profile is detailed in the table below.
Oncor ratings profile
| Moody’s | S&P | Fitch | ||||
Issuer credit rating | Ba1 | BBB- | BBB- | |||
Senior secured rating | Ba1 | BBB- | BBB- | |||
Outlook | Stable | Watch Developing | Stable |
Summary corporate structure
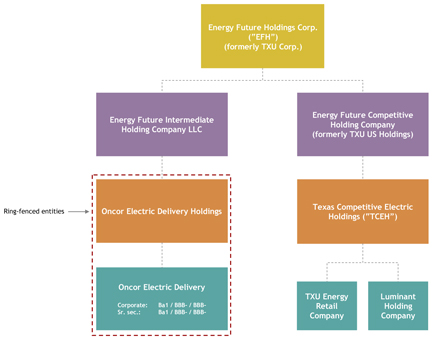
Note: None of the ring-fenced entities will secure or guarantee any of the debt incurred to fund the Transaction
1
| 2. | Company overview |
Oncor, an indirect wholly-owned subsidiary of EFH, is a regulated electricity transmission and distribution company principally engaged in providing delivery services to the home for retail electric providers (“REPs”) that sell power in the North-central, Eastern and Western parts of Texas. Oncor also provides transmission services to other electricity distribution companies, cooperatives and municipalities; transmission grid connections to merchant power plants; and interconnections to other transmission grids in Texas. Oncor provides the essential service of delivering electricity safely, reliably and economically to end-use consumers through its transmission and distribution systems. For the twelve months ended June 30, 2007, Oncor generated total operating revenues of $2,478 million and Adjusted EBITDA of $1,129 million.
As an electric transmission and distribution public utility in Texas, Oncor is regulated by the Public Utility Commission of Texas (“PUCT”).
Oncor is the sixth largest transmission and distribution company in the U.S. and operates the largest distribution and transmission system in Texas, providing power to more than 3 million electricity delivery points, over more than 100,000 miles of distribution lines and 14,300 miles of transmission lines. At December 31, 2006, Oncor had approximately 3,400 full-time employees.
Oncor operates within the Electric Reliability Council of Texas (“ERCOT”) region. ERCOT is the regional reliability coordinating organization for member electricity systems in Texas and the Independent System Operator of the interconnected transmission system of those systems. ERCOT is responsible for ensuring reliability, adequacy and security of the electric systems as well as nondiscriminatory access to transmission service by all wholesale market participants in the ERCOT region. ERCOT consists of approximately 150 members, including electric cooperatives, municipal power agencies, investor-owned independent generators, independent power marketers, electric transmission and distribution utilities and independent REPs.
Oncor service territory and comparable infrastructure base
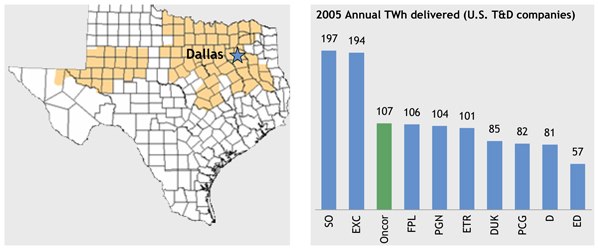
Source: Energy Velocity, Company filings
Electricity transmission
Oncor’s electric transmission business is responsible for the safe and reliable operations of its transmission network and substations. These responsibilities consist of the construction and maintenance of transmission facilities and substations and the monitoring, controlling and dispatching of high-voltage electricity over Oncor’s transmission facilities in coordination with ERCOT.
2
Oncor’s transmission business actively supports the operations of ERCOT and market participants. The transmission business participates with ERCOT and other member utilities to plan, design, construct and operate new transmission lines, with regulatory approval, necessary to maintain reliability, interconnect to merchant power plants, increase bulk power transfer capability and minimize limitations and constraints on the ERCOT transmission grid.
Transmission revenues are provided under tariffs approved by either the PUCT or, to a small degree, the FERC. Network transmission revenues compensate Oncor for delivery of power over transmission facilities operating at 60 kilovolts (kV) and above. Transformation service revenues compensate Oncor for substation facilities that transform power from high-voltage transmission to distribution voltages below 60 kV. Other services offered by the transmission business include, but are not limited to: system impact studies, facilities studies and maintenance of transformer equipment, substations and transmission lines owned by other nonretail parties.
Provisions of the restructuring legislation enacted in Texas in 1999 allow Oncor to annually update its transmission rates to reflect changes in invested capital. These provisions encourage investment in the transmission system to help ensure reliability and efficiency by allowing for timely recovery of and return on new transmission investments.
At December 31, 2006, Oncor’s transmission facilities included 4,680 circuit miles of 345-kV transmission lines and 9,684 circuit miles of 138- and 69-kV transmission lines. In 2006, 198 circuit miles of new 345-kV transmission lines were constructed. Forty-five generating plants totaling 32,699 MW are directly connected to Oncor’s transmission system, and 710 distribution substations are served from Oncor’s transmission system.
Oncor grid connections
| Number of interconnected lines | ||||||
Grid connections | 345 kV | 138 kV | 69 kV | |||
Centerpoint Energy Inc. | 8 | — | — | |||
American Electric Power Company, Inc. | 4 | 7 | 12 | |||
Lower Colorado River Authority | 6 | 20 | 3 | |||
Texas Municipal Power Agency | 8 | 9 | — | |||
Texas New Mexico Power | 2 | 9 | 11 | |||
Brazos Electric Power Cooperative | 4 | 94 | 21 | |||
Rayburn Country Electric Cooperative | — | 27 | 7 | |||
City of Georgetown | — | 2 | — | |||
Other small systems operating wholly within Texas | — | 10 | 3 | |||
Electricity Distribution
Oncor’s electricity distribution business is responsible for the overall safe and efficient operation of distribution facilities, including power delivery, power quality and system reliability. The Oncor distribution system includes over 3 million points of delivery. The electricity distribution business consists of the ownership, management, construction, maintenance and operation of the distribution system within Oncor’s certificated service area. For the five years ended December 31, 2006, the number of Oncor’s distribution system points of delivery served grew an average of 2% per year, with approximately 43,000 points of delivery added in 2006.
Oncor’s distribution system receives electricity from the transmission system through substations and distributes electricity to end-users and wholesale customers through approximately 3,000 distribution feeders.
3
The Oncor distribution system consists of 56,102 miles of overhead primary conductors, 21,879 miles of overhead secondary and street light conductors, 14,578 miles of underground primary conductors and 9,114 miles of underground secondary and street light conductors. The majority of the distribution system operates at 25-kV and 12.5-kV.
Customers
Oncor’s transmission customers consist of municipalities, electric cooperatives and other distribution companies. Oncor’s distribution customers consist of approximately 60 REPs in Oncor’s certificated service area. For the year ended December 31, 2006, distribution revenues from TXU Energy Retail represented 52% of Oncor’s distribution revenues and 46% of Oncor’s total revenues. The retail customers who purchase and consume electricity delivered by Oncor are free to choose their electricity supplier from REPs who compete for their business.
4
| 3. | Strategy |
Oncor’s goal is to improve its reliability, service levels and cost performance through efficient capital and technology deployment. In its core service territory, Oncor is redesigning the model that it uses for network and technology investments, driving standardization and significantly enhancing efficiency. Oncor expects to increase its investments in the transmission and distribution network and in new technologies such as advanced meter reading and remote system monitoring. At December 31, 2006, Oncor’s management projected that capital investment over the next five years would average more than $700 million per year, an increase of approximately 30% relative to the previous 10-year annual average. This expanded program is expected to reduce congestion costs, enhance network integrity and improve reliability and customer service standards in North Texas by the end of the decade.
Oncor also intends to seek opportunities to scale its operating advantage and technology program regionally, looking to achieve operating efficiencies, leverage its asset management capabilities over a larger grid and execute a coordinated technology and infrastructure investment program to improve reliability. Oncor believes that the infrastructure and technology investment needs in the electricity transmission and delivery sector are going to increase significantly over the coming years both regionally and nationally. Oncor believes it is well-positioned to participate in this build-out on a broader basis as an operator capable of coordinating and managing large-scale investment programs.
Technology initiatives
In 2006, Oncor finalized an agreement with CURRENT Communications Group, LLC (“CURRENT”), to utilize Oncor’s power distribution network as a broadband-enabled “Smart Grid.” CURRENT plans to design, build and operate the “broadband over power line” (BPL) network covering the majority of the Oncor certificated service area. Build-out of the BPL network began in 2006 with the installation of fiber optic cable and additional investment in advanced data management systems. This modernized grid is expected to enhance Oncor’s ability to deliver reliable electric service and provide the potential for additional products and services from REPs that will enable businesses and consumers to manage their electricity usage and costs. Under the terms of the agreement with CURRENT, Oncor expects to incur service fees totaling approximately $150 million over a 10 year period commencing in 2007 to utilize the Smart Grid capabilities of CURRENT’s BPL network.
Overlaid on the existing electric distribution network, the CURRENT BPL network will incorporate advanced digital communication and computing capabilities that provide real-time monitoring through the electric distribution network, which is expected to enable Oncor to:
| • | Increase network reliability and power quality; |
| • | Prevent, detect and restore customer outages more effectively; and |
| • | Implement advanced meter monitoring more efficiently |
Additionally, CURRENT will leverage the same BPL network to provide homes and businesses with high-performance broadband and wireless services, including voice, video and high-speed Internet access provided over existing electrical lines by having customers simply plug into any electrical outlet.
To take full advantage of the BPL network, Oncor has initiated replacement of existing meters with advanced digital metering technology. Installation of these advanced meters is expected to speed connects / disconnects where applicable and ultimately facilitate the creation of new products and service offerings by REPs, including time-of-use options and various new billing methods. Oncor had installed 285,000 advanced meters as of December 31, 2006 and plans to install up to 500,000 additional advanced meters in 2007. Oncor expects to replace all
5
of its 3 million meters with advanced meters under this technology initiative by 2012 for a total investment of approximately $450 million. Texas legislation provides for a special surcharge that includes the recovery of and return on a utility’s investment related to advanced metering technology to incent electricity delivery utilities to invest in this new technology.
6
| 4. | Key investment considerations |
Infrastructure business with stable cash flows
Oncor benefits from its status as a rate regulated monopoly for transmission and distribution service in its territory, which provides stability of cash flows and consistent financial performance. The regulatory separation of retail supply from transmission and distribution services eliminates commodity volatility in Oncor’s operations and earnings and Oncor bears no direct end-use customer credit risk. Additionally, capital tracking mechanisms reduce the need for regular rate cases and provide current revenue to support capital investment. For the three years ended December 31, 2006, Oncor generated an average total operating revenues and Adjusted EBITDA in excess of $2,356 million and $1,053 million, respectively.
Constructive regulatory environment
Oncor has a strong track record of maintaining a constructive relationship with its primary regulator, the PUCT. Oncor is subject to a reasonable regulatory rate construct, which has historically provided adequate and timely recovery of operating costs and return of and on capital invested.
Constructive Regulatory Environment
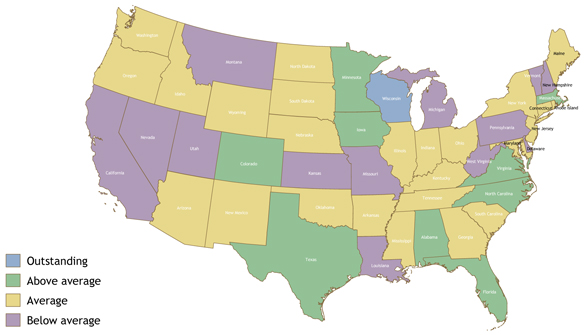
Source: Wall Street Research
Strong underlying business fundamentals
Oncor benefits from meaningful historical and projected underlying economic growth with business sector diversity in its primary market, reducing the underlying volatility of such growth. In addition, approximately 46% of Oncor’s revenues for the twelve months ended June 30, 2007 were derived from service to residential load, thus limiting exposure to commercial and industrial load.
7
Significant long-term demand growth
1999 – 2015E; Average peak demand (GW)
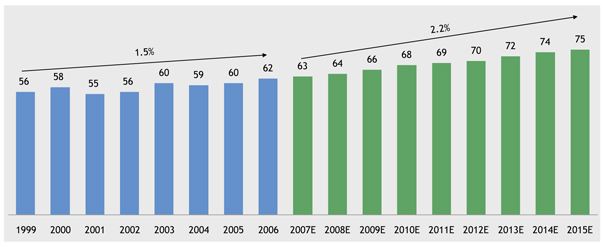
Source: SNL Financial
Industry leading operating performance and reliability
Over the past five years, Oncor has operated at or near top quartile metrics, in terms of O&M expense per customer and O&M expense per MWh delivered. Oncor has also operated at or near the top quartile for its reliability metrics, including System Average Interruption Duration Index (SAIDI) and Customer Average Interruption Duration Index (CAIDI).
US electric delivery company performance 2006 (SAIDI1)
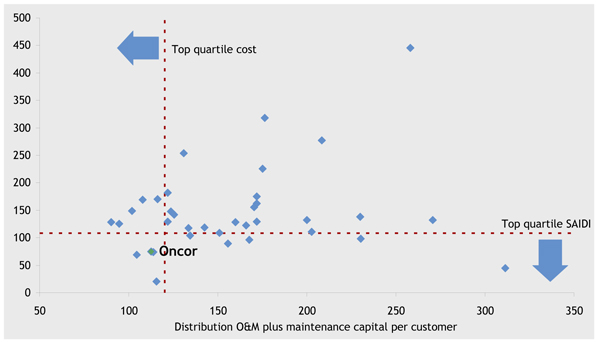
| ¹ | Excluding major events and planned outages; System Average Interruption Duration Index is defined as the number of minutes per year that the average customer is out of electric service |
Track record and projected continuation of strong financial performance
Oncor’s conservative capitalization and consistent historical financial performance result in a strong, investment grade profile. The projected credit metrics at Oncor, which will not be impacted by the Transaction, support strong investment grade ratings and are well within investment grade guidelines for public utilities with comparable business risk profiles.
8
Restrictions on Dividends
Dividend restrictions are included in Oncor’s organizational documents. Oncor’s regulatory debt to equity ratio is limited to the approved ratio established by the PUCT for rate making purposes (currently at 60 / 40 debt to equity). In addition, Oncor will limit its dividends through December 31, 2012 to an amount not to exceed Oncor’s net income (determined in accordance with GAAP), subject to certain defined adjustments.
The Oncor Board and the independent directors, acting by majority vote, each have the authority to prevent Oncor from paying dividends if it or they determine that it is in the best interest of Oncor to retain such amounts to meet expected future requirements, including compliance with the debt to equity ratio established by the PUCT for rate making purposes.
Any amendment of the dividend policy can only be adopted with the affirmative consent of a majority of the directors which approval must include a majority of the independent directors and all of the non-independent directors of Oncor nominated by affiliates of EFH.
Significant enhancements provided by ring-fencing mechanisms
In connection with the merger, a wholly-owned subsidiary of EFH formed a new, bankruptcy-remote entity, Oncor Electric Delivery Holdings Company LLC (“Oncor Holdings”), whose sole purpose is to hold the equity interest in Oncor and other ring-fenced entities and create a legal and operational separation of Oncor and its subsidiaries from EFH and its other subsidiaries (the “EFH Group”). In addition, Oncor’s organizational documents provide, among other things, that (i) the business and affairs of Oncor shall be managed by or under the direction of its Board of Directors and not by or under the direction of any EFH Group member or any officer or employee thereof and (ii) absent the unanimous vote of all directors present (which must include all independent directors), Oncor is prohibited from (x) consolidating or merging in any transaction in which it is not the surviving entity or with an EFH Group member, (y) dissolving or liquidating or disposing of all or substantially all its assets without adequate provision for the payment of all Oncor creditors, or (z) instituting or consenting to the institution of bankruptcy proceedings.
Ample liquidity to support operations
The new $2,000 million revolving credit facility combined with retained earnings will provide Oncor with ample liquidity to support future operations. At the Transaction close, Oncor had approximately $684 million of availability liquidity.
Oncor standalone liquidity ($ millions)
| Amount | |||
Total Revolver Capacity | $ | 2,000 | |
Revolver Drawings at Close1 | 1,316 | ||
Available Liquidity Close | $ | 684 | |
1 | Includes recent $200 million long term debt maturity and the repayment of $800 million of long term debt prior to maturity |
Strong, experienced management team
Oncor’s management has demonstrated an excellent track record of having executed successfully on large capital plans in prior periods and has also displayed an exceptional operational track record.
9
| 5. | Summary of separation provisions |
Oncor’s organizational documents include a number of restrictions designed to enhance the financial and structural independence of Oncor Holdings, Oncor, and their subsidiaries.
| • | Dividends will be limited as described in Section 5 of this document |
| • | No amendment of the dividend policy in Oncor’s organizational documents will be permitted unless approved by the Oncor Board, which must include approval by both (i) a majority of the independent directors and (ii) all of the non-independent directors of Oncor nominated by affiliates of EFH |
| • | Separate audited financial statements will be prepared for Oncor Holdings and Oncor |
| • | Notation will be made in EFH’s (and other EFH affiliates’) consolidated financial statements regarding the separateness of the assets, liabilities, cash flows and results of operation of the ring-fenced entities |
| • | No material credit support will be provided by any member of the EFH Group in favor of the ring-fenced entities or vice versa |
| • | Dealings between the EFH Group and its affiliates and the ring-fenced entities, including transfers of any material assets or facilities, will be at arm’s length, and subject to Oncor’s organizational documents and the regulations and guidelines of the PUCT |
| • | No commingling of assets, accounts or cash management systems between the ring-fenced entities and the EFH Group, other than: |
| • | Assets or funds deposited in connection with benefit plans |
| • | Nuclear decommissioning charges collected by Oncor |
| • | Transition charges owned by Oncor Electric Delivery Transition Bond Company |
Texas regulation of electric utilities includes a number of provisions that require utilities to operate independently of their unregulated affiliates.
| • | As of January 1, 2002, Texas’ unbundling statute required EFH to separate its electric generation (Luminant), retail electric (TXU Energy Retail), and transmission and distribution (Oncor) operations into distinct business units operating at arm’s length |
| • | Existing PUCT rules in place since 2002 establish affiliate standards that restrict sharing of information, cost shifting or cross-subsidies between Oncor and any EFH affiliated member and require proper allocation of costs for shared services, property, products, equipment and systems |
10
| 6. | Recent developments |
Agreement in PUCT merger proceeding
On October 5, 2007, Oncor announced that along with TEF it had agreed in principle with major interested parties to resolve all outstanding issues in the PUCT review related to the proposed merger of TXU Corp. with Texas Holdings. The agreement also included provisions under which the PUCT would dismiss Oncor’s pending rate case. The agreement is subject to approval by the PUCT.
In addition to commitments Oncor made in its filings in the PUCT review, the stipulated agreement includes the following provisions, among others.
| • | Oncor will agree to a one-time credit of $72 million, which is intended for all retail customers in its service territory, subject to PUCT dismissal of Oncor’s currently pending rate case, which will be requested by the parties to the settlement agreement. It is the intent of the parties to the agreement that the benefits of the credit flow directly to consumers, rather than to retail electric providers. Consistent with its existing agreement with the cities it serves, Oncor will file a system-wide rate case no later than July 1, 2008 based on a test-year ended December 31, 2007 |
| • | Oncor will incur a one-time $35 million write-off in 2007 or 2008 to its storm reserve and a one-time write-off in 2007 or 2008 to the 2002 restructuring expenses held as regulatory assets (approximately $21 million) |
| • | Oncor will make annual reports to the PUCT regarding compliance with its commitments |
| • | Oncor will limit the dividends paid by Oncor through December 31, 2012, to an amount not to exceed Oncor’s net income (determined in accordance with GAAP), subject to certain defined adjustments |
| • | Oncor will commit to minimum capital spending of $3.6 billion over the five-year period ending December 31, 2012, subject to certain defined conditions |
| • | Oncor will agree to certain system reliability, street light maintenance and customer service standards |
11
| 7. | Selected financial and operational information |
Selected financial data ($ millions)
| Year ended December 31, | 6 months ended June 30, | LTM June 30, 2007 | ||||||||||||||||||||||
| 2004 | 2005 | 2006 | 2006 | 2007 | ||||||||||||||||||||
Total operating revenues | $ | 2,226 | $ | 2,394 | $ | 2,449 | $ | 1,166 | $ | 1,195 | $ | 2,478 | ||||||||||||
| Operating expenses | ||||||||||||||||||||||||
Operation and maintenance | $ | 815 | $ | 813 | $ | 804 | $ | 404 | $ | 413 | $ | 813 | ||||||||||||
Depreciation and amortization | 389 | 447 | 476 | 231 | 233 | 478 | ||||||||||||||||||
Income taxes | 113 | 158 | 156 | 67 | 72 | 161 | ||||||||||||||||||
Taxes other than income | 380 | 387 | 402 | 191 | 191 | 402 | ||||||||||||||||||
Total operating expenses | $ | 1,697 | $ | 1,805 | $ | 1,838 | $ | 893 | $ | 909 | $ | 1,854 | ||||||||||||
Operating income | $ | 529 | $ | 589 | $ | 611 | $ | 273 | $ | 286 | $ | 624 | ||||||||||||
EBITDA | $ | 1,057 | $ | 1,241 | $ | 1,276 | $ | 597 | $ | 602 | $ | 1,281 | ||||||||||||
Less: Securitization revenue | (106 | ) | (153 | ) | (154 | ) | (74 | ) | (72 | ) | (152 | ) | ||||||||||||
Adjusted EBITDA | $ | 951 | $ | 1,088 | $ | 1,122 | $ | 523 | $ | 530 | $ | 1,129 | ||||||||||||
Interest income | $ | 56 | $ | 58 | $ | 58 | $ | 29 | $ | 29 | $ | 58 | ||||||||||||
Interest expense and related charges | 279 | 269 | 286 | 140 | 154 | 300 | ||||||||||||||||||
Capital expenditures | 600 | 733 | 840 | 452 | 382 | 770 | ||||||||||||||||||
Cash and cash equivalents | $ | — | $ | 15 | $ | 1 | $ | 1 | $ | 1 | $ | 1 | ||||||||||||
Total assets | 9,493 | 9,911 | 10,709 | 10,296 | 10,949 | 10,949 | ||||||||||||||||||
Property, plant and equipment—net | 6,609 | 7,067 | 7,608 | 7,377 | 7,847 | 7,847 | ||||||||||||||||||
| Capitalization | ||||||||||||||||||||||||
Long-term debt, less current amounts | $ | 4,199 | $ | 4,107 | $ | 3,811 | $ | 4,059 | $ | 4,562 | $ | 4,562 | ||||||||||||
Excluding transition bonds | 3,032 | 3,033 | 2,833 | 3,033 | 3,634 | 3,634 | ||||||||||||||||||
Transition bonds, less current amounts | 1,167 | 1,074 | 978 | 1,026 | 928 | 928 | ||||||||||||||||||
Shareholders’ equity | 2,687 | 2,935 | 2,975 | 2,949 | 2,947 | 2,947 | ||||||||||||||||||
Total | $ | 6,886 | $ | 7,042 | $ | 6,786 | $ | 7,008 | $ | 7,509 | $ | 7,509 | ||||||||||||
| Capitalization ratios | ||||||||||||||||||||||||
Long-term debt, less current amounts | 61.0 | % | 58.3 | % | 56.2 | % | 57.9 | % | 60.8 | %1 | 60.8 | %1 | ||||||||||||
Shareholders’ equity | 39.0 | % | 41.7 | % | 43.8 | % | 42.1 | % | 39.2 | % | 39.2 | % | ||||||||||||
Total | 100.0 | % | 100.0 | % | 100.0 | % | 100.0 | % | 100.0 | % | 100.0 | % | ||||||||||||
| Note: | Oncor’s financial statements include its wholly-owned, bankruptcy remote financing subsidiary, Oncor Electric Delivery Transition Bond Company LLC. Oncor Electric Delivery Transition Bond Company LLC was organized for the limited purpose of issuing securitization bonds to recover generation-related regulatory asset stranded costs and other qualified costs |
1 | The debt to equity ratio for regulatory purposes as of June 30, 2007 was 56.5% debt / 43.5% equity |
12
Selected operational data ($ million, unless otherwise noted)
| Year ended December 31, | 6 months ended June 30, | |||||||||||||||||
| 2004 | 2005 | 2006 | 2006 | 2007 | ||||||||||||||
| Operating statistics volumes | ||||||||||||||||||
Electric energy delivered (GWh) | 101,928 | 106,780 | 107,098 | 50,376 | 49,966 | |||||||||||||
% change | — | 4.8 | % | 0.3 | % | — | (0.8 | )% | ||||||||||
| Reliability statistics¹ | ||||||||||||||||||
System Average Interruption Duration Index (SAIDI) (nonstorm) | 76 | 77 | 79 | 74 | 78 | |||||||||||||
System Average Interruption Frequency Index (SAIFI) (nonstorm) | 1.10 | 1.17 | 1.17 | 1.11 | 1.15 | |||||||||||||
Customer Average Interruption Duration Index (CAIDI) (nonstorm) | 69 | 66 | 68 | 66 | 68 | |||||||||||||
Electricity points of delivery (end of period and in thousands) | ||||||||||||||||||
Electricity distribution points of delivery (based on number of meters)² | 2,971 | 3,013 | 3,056 | 3,038 | 3,077 | |||||||||||||
| Operating Revenues | ||||||||||||||||||
Electricity distribution revenues³ | ||||||||||||||||||
Affiliated (TXU Energy Company) | $ | 1,418 | $ | 1,276 | $ | 1,137 | $ | 550 | $ | 494 | ||||||||
Nonaffiliated | 590 | 879 | 1,046 | 485 | 558 | |||||||||||||
Total distribution revenues | $ | 2,008 | $ | 2,155 | $ | 2,183 | $ | 1,035 | $ | 1,052 | ||||||||
Third-party transmission revenues | 192 | 213 | 236 | 116 | 126 | |||||||||||||
Other miscellaneous revenues | 26 | 26 | 30 | 15 | 17 | |||||||||||||
Total operating revenues | $ | 2,226 | $ | 2,394 | $ | 2,449 | $ | 1,166 | $ | 1,195 | ||||||||
| ¹ | SAIDI is the average number of minutes electric service interrupted per consumer in a year. SAIFI is the average number of electric service interruptions per consumer in a year. CAIDI is the average duration in minutes per electric service interruption in a year. The statistics presented are based on the preceding twelve months’ data |
| ² | Includes lighting sites, primarily guard lights, for which TXU Energy Retail is the REP but are not included in TXU Energy Retail’s customer count. Such sites totaled 79,856 and 84,362 at June 30, 2007 and 2006, respectively |
| ³ | Includes transition charge revenue associated with the issuance of securitization bonds totaling $33 million and $37 million for the three months ended June 30, 2007 and 2006, respectively, and $70 million and $73 million for the six months ended June 30, 2007 and 2006, respectively. Also includes disconnect / reconnect fees and other discretionary revenues for services requested by REPs |
13