
Exhibit 99.1 U.S. Utilities | Oncor Allen Nye, CEO Oncor March 27, 2019Exhibit 99.1 U.S. Utilities | Oncor Allen Nye, CEO Oncor March 27, 2019
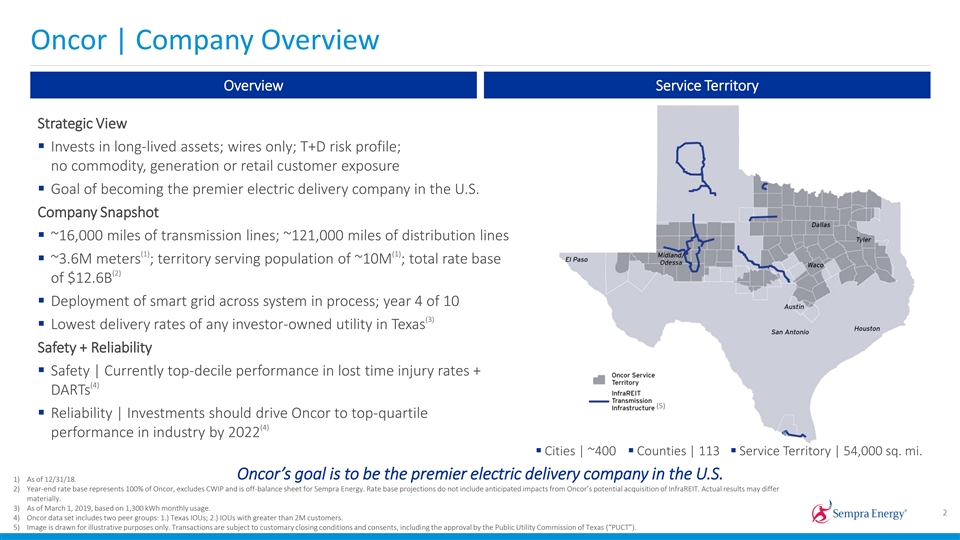
Oncor | Company Overview Overview Service Territory Strategic View § Invests in long-lived assets; wires only; T+D risk profile; no commodity, generation or retail customer exposure § Goal of becoming the premier electric delivery company in the U.S. Company Snapshot § ~16,000 miles of transmission lines; ~121,000 miles of distribution lines (1) (1) § ~3.6M meters ; territory serving population of ~10M ; total rate base (2) of $12.6B § Deployment of smart grid across system in process; year 4 of 10 (3) § Lowest delivery rates of any investor-owned utility in Texas Safety + Reliability § Safety | Currently top-decile performance in lost time injury rates + (4) DARTs (5) § Reliability | Investments should drive Oncor to top-quartile (4) performance in industry by 2022 § Cities | ~400§ Counties | 113§ Service Territory | 54,000 sq. mi. Oncor’s goal is to be the premier electric delivery company in the U.S. 1) As of 12/31/18. 2) Year-end rate base represents 100% of Oncor, excludes CWIP and is off-balance sheet for Sempra Energy. Rate base projections do not include anticipated impacts from Oncor’s potential acquisition of InfraREIT. Actual results may differ materially. 3) As of March 1, 2019, based on 1,300 kWh monthly usage. 2 4) Oncor data set includes two peer groups: 1.) Texas IOUs; 2.) IOUs with greater than 2M customers. 5) Image is drawn for illustrative purposes only. Transactions are subject to customary closing conditions and consents, including the approval by the Public Utility Commission of Texas (“PUCT”).Oncor | Company Overview Overview Service Territory Strategic View § Invests in long-lived assets; wires only; T+D risk profile; no commodity, generation or retail customer exposure § Goal of becoming the premier electric delivery company in the U.S. Company Snapshot § ~16,000 miles of transmission lines; ~121,000 miles of distribution lines (1) (1) § ~3.6M meters ; territory serving population of ~10M ; total rate base (2) of $12.6B § Deployment of smart grid across system in process; year 4 of 10 (3) § Lowest delivery rates of any investor-owned utility in Texas Safety + Reliability § Safety | Currently top-decile performance in lost time injury rates + (4) DARTs (5) § Reliability | Investments should drive Oncor to top-quartile (4) performance in industry by 2022 § Cities | ~400§ Counties | 113§ Service Territory | 54,000 sq. mi. Oncor’s goal is to be the premier electric delivery company in the U.S. 1) As of 12/31/18. 2) Year-end rate base represents 100% of Oncor, excludes CWIP and is off-balance sheet for Sempra Energy. Rate base projections do not include anticipated impacts from Oncor’s potential acquisition of InfraREIT. Actual results may differ materially. 3) As of March 1, 2019, based on 1,300 kWh monthly usage. 2 4) Oncor data set includes two peer groups: 1.) Texas IOUs; 2.) IOUs with greater than 2M customers. 5) Image is drawn for illustrative purposes only. Transactions are subject to customary closing conditions and consents, including the approval by the Public Utility Commission of Texas (“PUCT”).

Oncor | Macro Drivers – Texas Market Service Territory Overview (1) § 10th largest economy in the world | 2nd largest economy in the U.S. § 1,000+ substations, 137,000+ miles of combined T&D lines Leading premise growth, diverse service territory and demand for new generation result in potential investment opportunities 3 1) Bureau of Economic Analysis (BEA) “Bearfacts” (March 2018) and International Monetary Fund (IMF) Data Mapper, utilizing World Economic Outlook Data (April 2018).Oncor | Macro Drivers – Texas Market Service Territory Overview (1) § 10th largest economy in the world | 2nd largest economy in the U.S. § 1,000+ substations, 137,000+ miles of combined T&D lines Leading premise growth, diverse service territory and demand for new generation result in potential investment opportunities 3 1) Bureau of Economic Analysis (BEA) “Bearfacts” (March 2018) and International Monetary Fund (IMF) Data Mapper, utilizing World Economic Outlook Data (April 2018).
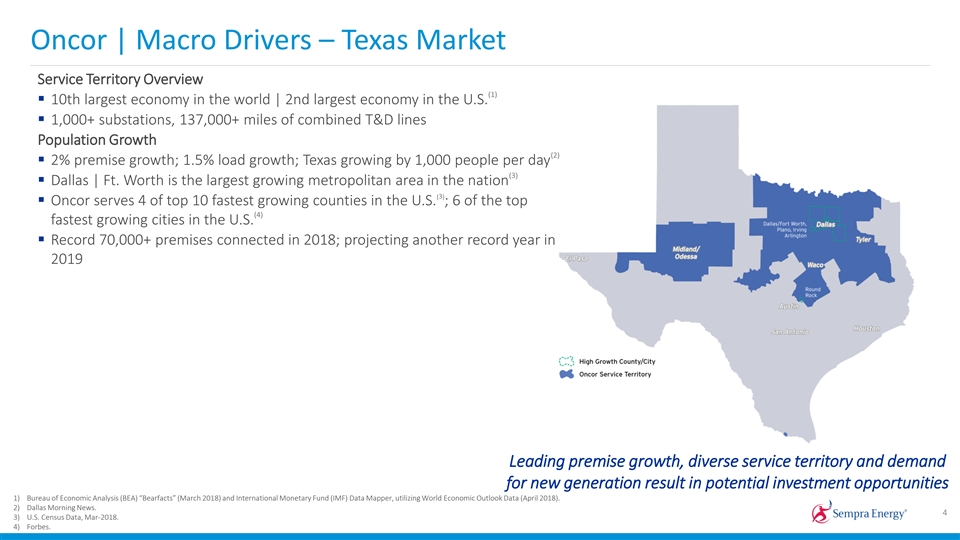
Oncor | Macro Drivers – Texas Market Service Territory Overview (1) § 10th largest economy in the world | 2nd largest economy in the U.S. § 1,000+ substations, 137,000+ miles of combined T&D lines Population Growth (2) § 2% premise growth; 1.5% load growth; Texas growing by 1,000 people per day (3) § Dallas | Ft. Worth is the largest growing metropolitan area in the nation (3) § Oncor serves 4 of top 10 fastest growing counties in the U.S. ; 6 of the top (4) fastest growing cities in the U.S. § Record 70,000+ premises connected in 2018; projecting another record year in 2019 Leading premise growth, diverse service territory and demand for new generation result in potential investment opportunities 1) Bureau of Economic Analysis (BEA) “Bearfacts” (March 2018) and International Monetary Fund (IMF) Data Mapper, utilizing World Economic Outlook Data (April 2018). 2) Dallas Morning News. 4 3) U.S. Census Data, Mar-2018. 4) Forbes.Oncor | Macro Drivers – Texas Market Service Territory Overview (1) § 10th largest economy in the world | 2nd largest economy in the U.S. § 1,000+ substations, 137,000+ miles of combined T&D lines Population Growth (2) § 2% premise growth; 1.5% load growth; Texas growing by 1,000 people per day (3) § Dallas | Ft. Worth is the largest growing metropolitan area in the nation (3) § Oncor serves 4 of top 10 fastest growing counties in the U.S. ; 6 of the top (4) fastest growing cities in the U.S. § Record 70,000+ premises connected in 2018; projecting another record year in 2019 Leading premise growth, diverse service territory and demand for new generation result in potential investment opportunities 1) Bureau of Economic Analysis (BEA) “Bearfacts” (March 2018) and International Monetary Fund (IMF) Data Mapper, utilizing World Economic Outlook Data (April 2018). 2) Dallas Morning News. 4 3) U.S. Census Data, Mar-2018. 4) Forbes.
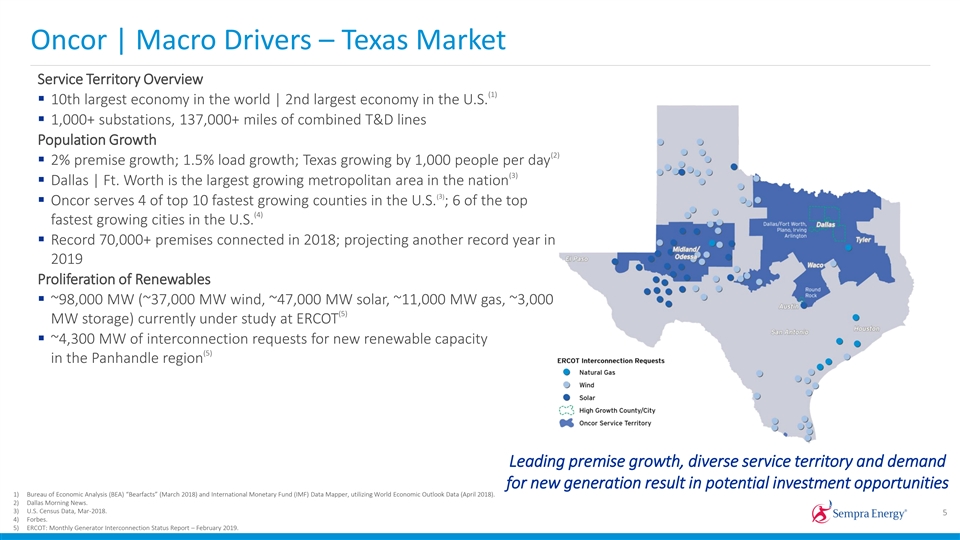
Oncor | Macro Drivers – Texas Market Service Territory Overview (1) § 10th largest economy in the world | 2nd largest economy in the U.S. § 1,000+ substations, 137,000+ miles of combined T&D lines Population Growth (2) § 2% premise growth; 1.5% load growth; Texas growing by 1,000 people per day (3) § Dallas | Ft. Worth is the largest growing metropolitan area in the nation (3) § Oncor serves 4 of top 10 fastest growing counties in the U.S. ; 6 of the top (4) fastest growing cities in the U.S. § Record 70,000+ premises connected in 2018; projecting another record year in 2019 Proliferation of Renewables § ~98,000 MW (~37,000 MW wind, ~47,000 MW solar, ~11,000 MW gas, ~3,000 (5) MW storage) currently under study at ERCOT § ~4,300 MW of interconnection requests for new renewable capacity (5) in the Panhandle region Leading premise growth, diverse service territory and demand for new generation result in potential investment opportunities 1) Bureau of Economic Analysis (BEA) “Bearfacts” (March 2018) and International Monetary Fund (IMF) Data Mapper, utilizing World Economic Outlook Data (April 2018). 2) Dallas Morning News. 3) U.S. Census Data, Mar-2018. 5 4) Forbes. 5) ERCOT: Monthly Generator Interconnection Status Report – February 2019.Oncor | Macro Drivers – Texas Market Service Territory Overview (1) § 10th largest economy in the world | 2nd largest economy in the U.S. § 1,000+ substations, 137,000+ miles of combined T&D lines Population Growth (2) § 2% premise growth; 1.5% load growth; Texas growing by 1,000 people per day (3) § Dallas | Ft. Worth is the largest growing metropolitan area in the nation (3) § Oncor serves 4 of top 10 fastest growing counties in the U.S. ; 6 of the top (4) fastest growing cities in the U.S. § Record 70,000+ premises connected in 2018; projecting another record year in 2019 Proliferation of Renewables § ~98,000 MW (~37,000 MW wind, ~47,000 MW solar, ~11,000 MW gas, ~3,000 (5) MW storage) currently under study at ERCOT § ~4,300 MW of interconnection requests for new renewable capacity (5) in the Panhandle region Leading premise growth, diverse service territory and demand for new generation result in potential investment opportunities 1) Bureau of Economic Analysis (BEA) “Bearfacts” (March 2018) and International Monetary Fund (IMF) Data Mapper, utilizing World Economic Outlook Data (April 2018). 2) Dallas Morning News. 3) U.S. Census Data, Mar-2018. 5 4) Forbes. 5) ERCOT: Monthly Generator Interconnection Status Report – February 2019.

Oncor | Macro Drivers – Texas Market Service Territory Overview (1) § 10th largest economy in the world | 2nd largest economy in the U.S. § 1,000+ substations, 137,000+ miles of combined T&D lines Population Growth (2) § 2% premise growth; 1.5% load growth; Texas growing by 1,000 people per day (3) § Dallas | Ft. Worth is the largest growing metropolitan area in the nation (3) § Oncor serves 4 of top 10 fastest growing counties in the U.S. ; 6 of the top (4) fastest growing cities in the U.S. § Record 70,000+ premises connected in 2018; projecting another record year in 2019 Proliferation of Renewables § ~98,000 MW (~37,000 MW wind, ~47,000 MW solar, ~11,000 MW gas, ~3,000 (5) MW storage) currently under study at ERCOT § ~4,300 MW of interconnection requests for new renewable capacity (5) in the Panhandle region Permian Basin (6) § Breakeven prices have fallen to $22-$26 per barrel in many areas of the Basin (7) § 40% West Texas load growth expected by 2022 (8) § Midland County unemployment is 2.1% Leading premise growth, diverse service territory and demand 1) Bureau of Economic Analysis (BEA) “Bearfacts” (March 2018) and International Monetary Fund (IMF) Data Mapper, utilizing World Economic Outlook Data (April 2018). 2) Dallas Morning News. 3) U.S. Census Data, Mar-2018. for new generation result in potential investment opportunities 4) Forbes. 5) ERCOT: Monthly Generator Interconnection Status Report – February, 2019. 6) Axios Generate. 6 7) ERCOT January 2019 Load Forecast. 8) Federal Reserve Bank of St. Louis.Oncor | Macro Drivers – Texas Market Service Territory Overview (1) § 10th largest economy in the world | 2nd largest economy in the U.S. § 1,000+ substations, 137,000+ miles of combined T&D lines Population Growth (2) § 2% premise growth; 1.5% load growth; Texas growing by 1,000 people per day (3) § Dallas | Ft. Worth is the largest growing metropolitan area in the nation (3) § Oncor serves 4 of top 10 fastest growing counties in the U.S. ; 6 of the top (4) fastest growing cities in the U.S. § Record 70,000+ premises connected in 2018; projecting another record year in 2019 Proliferation of Renewables § ~98,000 MW (~37,000 MW wind, ~47,000 MW solar, ~11,000 MW gas, ~3,000 (5) MW storage) currently under study at ERCOT § ~4,300 MW of interconnection requests for new renewable capacity (5) in the Panhandle region Permian Basin (6) § Breakeven prices have fallen to $22-$26 per barrel in many areas of the Basin (7) § 40% West Texas load growth expected by 2022 (8) § Midland County unemployment is 2.1% Leading premise growth, diverse service territory and demand 1) Bureau of Economic Analysis (BEA) “Bearfacts” (March 2018) and International Monetary Fund (IMF) Data Mapper, utilizing World Economic Outlook Data (April 2018). 2) Dallas Morning News. 3) U.S. Census Data, Mar-2018. for new generation result in potential investment opportunities 4) Forbes. 5) ERCOT: Monthly Generator Interconnection Status Report – February, 2019. 6) Axios Generate. 6 7) ERCOT January 2019 Load Forecast. 8) Federal Reserve Bank of St. Louis.
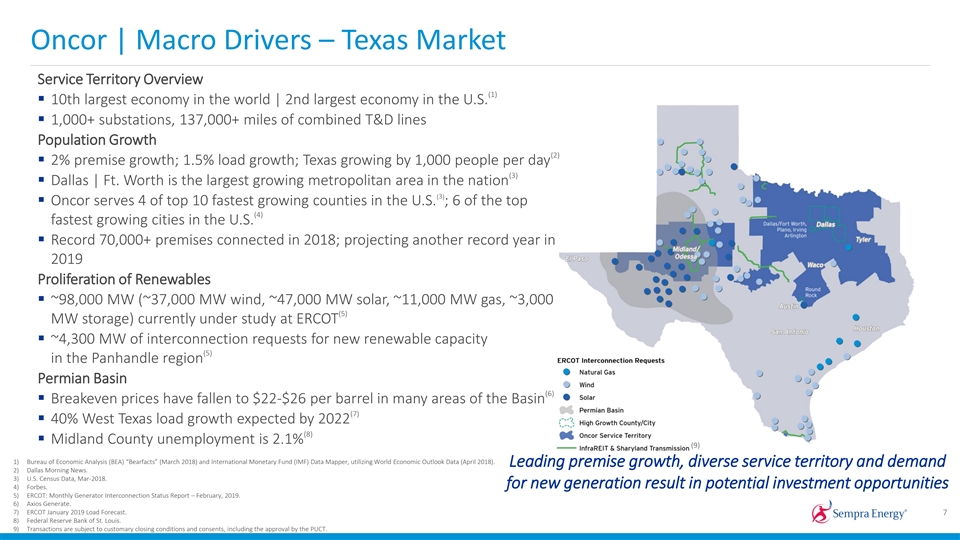
Oncor | Macro Drivers – Texas Market Service Territory Overview (1) § 10th largest economy in the world | 2nd largest economy in the U.S. § 1,000+ substations, 137,000+ miles of combined T&D lines Population Growth (2) § 2% premise growth; 1.5% load growth; Texas growing by 1,000 people per day (3) § Dallas | Ft. Worth is the largest growing metropolitan area in the nation (3) § Oncor serves 4 of top 10 fastest growing counties in the U.S. ; 6 of the top (4) fastest growing cities in the U.S. § Record 70,000+ premises connected in 2018; projecting another record year in 2019 Proliferation of Renewables § ~98,000 MW (~37,000 MW wind, ~47,000 MW solar, ~11,000 MW gas, ~3,000 (5) MW storage) currently under study at ERCOT § ~4,300 MW of interconnection requests for new renewable capacity (5) in the Panhandle region Permian Basin (6) § Breakeven prices have fallen to $22-$26 per barrel in many areas of the Basin (7) § 40% West Texas load growth expected by 2022 (8) § Midland County unemployment is 2.1% (9) 1) Bureau of Economic Analysis (BEA) “Bearfacts” (March 2018) and International Monetary Fund (IMF) Data Mapper, utilizing World Economic Outlook Data (April 2018). Leading premise growth, diverse service territory and demand 2) Dallas Morning News. 3) U.S. Census Data, Mar-2018. for new generation result in potential investment opportunities 4) Forbes. 5) ERCOT: Monthly Generator Interconnection Status Report – February, 2019. 6) Axios Generate. 7) ERCOT January 2019 Load Forecast. 7 8) Federal Reserve Bank of St. Louis. 9) Transactions are subject to customary closing conditions and consents, including the approval by the PUCT.Oncor | Macro Drivers – Texas Market Service Territory Overview (1) § 10th largest economy in the world | 2nd largest economy in the U.S. § 1,000+ substations, 137,000+ miles of combined T&D lines Population Growth (2) § 2% premise growth; 1.5% load growth; Texas growing by 1,000 people per day (3) § Dallas | Ft. Worth is the largest growing metropolitan area in the nation (3) § Oncor serves 4 of top 10 fastest growing counties in the U.S. ; 6 of the top (4) fastest growing cities in the U.S. § Record 70,000+ premises connected in 2018; projecting another record year in 2019 Proliferation of Renewables § ~98,000 MW (~37,000 MW wind, ~47,000 MW solar, ~11,000 MW gas, ~3,000 (5) MW storage) currently under study at ERCOT § ~4,300 MW of interconnection requests for new renewable capacity (5) in the Panhandle region Permian Basin (6) § Breakeven prices have fallen to $22-$26 per barrel in many areas of the Basin (7) § 40% West Texas load growth expected by 2022 (8) § Midland County unemployment is 2.1% (9) 1) Bureau of Economic Analysis (BEA) “Bearfacts” (March 2018) and International Monetary Fund (IMF) Data Mapper, utilizing World Economic Outlook Data (April 2018). Leading premise growth, diverse service territory and demand 2) Dallas Morning News. 3) U.S. Census Data, Mar-2018. for new generation result in potential investment opportunities 4) Forbes. 5) ERCOT: Monthly Generator Interconnection Status Report – February, 2019. 6) Axios Generate. 7) ERCOT January 2019 Load Forecast. 7 8) Federal Reserve Bank of St. Louis. 9) Transactions are subject to customary closing conditions and consents, including the approval by the PUCT.
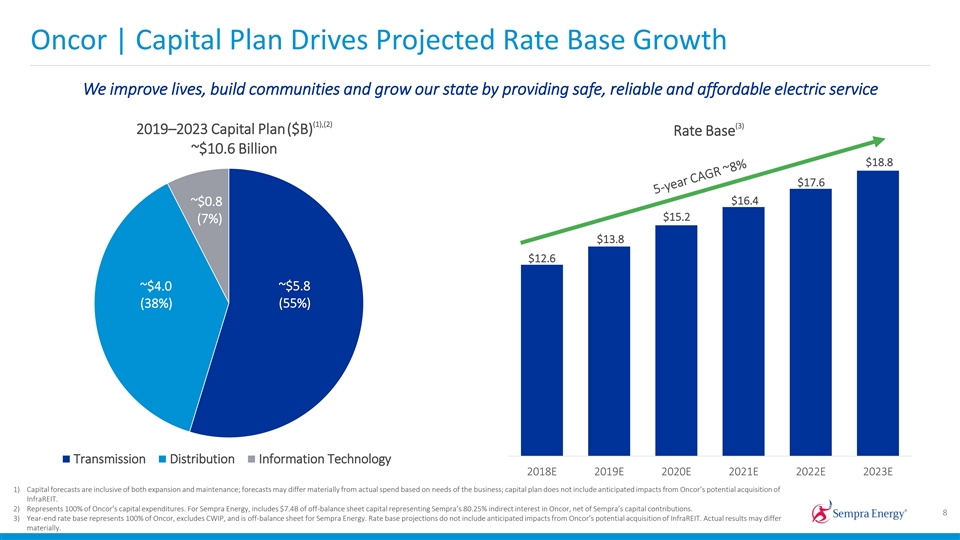
Oncor | Capital Plan Drives Projected Rate Base Growth We improve lives, build communities and grow our state by providing safe, reliable and affordable electric service (1),(2) (3) 2019–2023 Capital Plan($B) Rate Base ~$10.6 Billion $18.8 $17.6 $16.4 ~$0.8 $15.2 (7%) $13.8 $12.6 ~$5.8 ~$4.0 (38%) (55%) Transmission Distribution Information Technology 2018E 2019E 2020E 2021E 2022E 2023E 1) Capital forecasts are inclusive of both expansion and maintenance; forecasts may differ materially from actual spend based on needs of the business; capital plan does not include anticipated impacts from Oncor’s potential acquisition of InfraREIT. 2) Represents 100% of Oncor’s capital expenditures. For Sempra Energy, includes $7.4B of off-balance sheet capital representing Sempra’s 80.25% indirect interest in Oncor, net of Sempra’s capital contributions. 8 3) Year-end rate base represents 100% of Oncor, excludes CWIP, and is off-balance sheet for Sempra Energy. Rate base projections do not include anticipated impacts from Oncor’s potential acquisition of InfraREIT. Actual results may differ materially.Oncor | Capital Plan Drives Projected Rate Base Growth We improve lives, build communities and grow our state by providing safe, reliable and affordable electric service (1),(2) (3) 2019–2023 Capital Plan($B) Rate Base ~$10.6 Billion $18.8 $17.6 $16.4 ~$0.8 $15.2 (7%) $13.8 $12.6 ~$5.8 ~$4.0 (38%) (55%) Transmission Distribution Information Technology 2018E 2019E 2020E 2021E 2022E 2023E 1) Capital forecasts are inclusive of both expansion and maintenance; forecasts may differ materially from actual spend based on needs of the business; capital plan does not include anticipated impacts from Oncor’s potential acquisition of InfraREIT. 2) Represents 100% of Oncor’s capital expenditures. For Sempra Energy, includes $7.4B of off-balance sheet capital representing Sempra’s 80.25% indirect interest in Oncor, net of Sempra’s capital contributions. 8 3) Year-end rate base represents 100% of Oncor, excludes CWIP, and is off-balance sheet for Sempra Energy. Rate base projections do not include anticipated impacts from Oncor’s potential acquisition of InfraREIT. Actual results may differ materially.
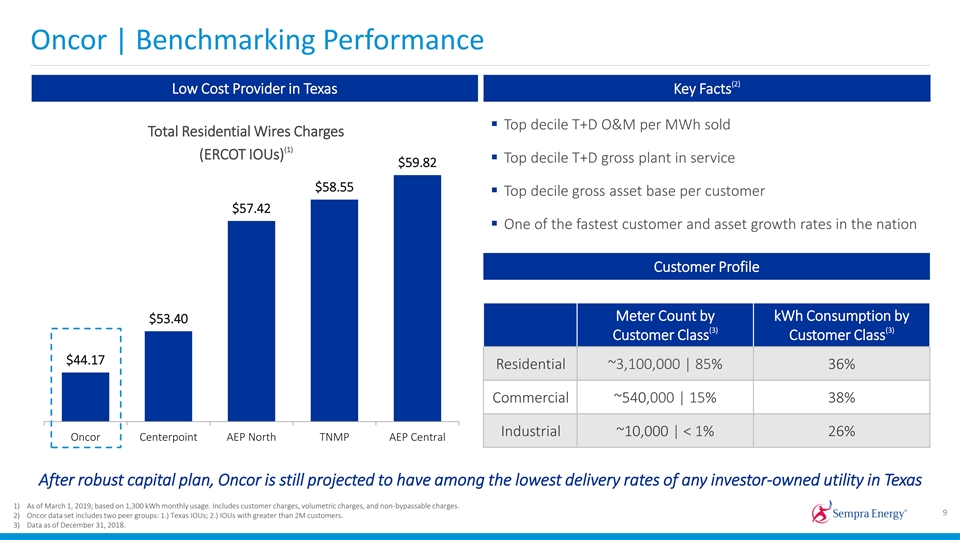
Oncor | Benchmarking Performance (2) Low Cost Provider in Texas Key Facts 11% 11% § Top decile T+D O&M per MWh sold Total Residential Wires Charges (1) (ERCOT IOUs) § Top decile T+D gross plant in service $59.82 $58.55 § Top decile gross asset base per customer 89% $57.42 § One of the fastest customer and asset growth rates in the nation Customer Profile Meter Count by kWh Consumption by $53.40 (3) (3) Customer Class Customer Class $44.17 Residential ~3,100,000 | 85% 36% Commercial ~540,000 | 15% 38% Industrial ~10,000 | < 1% 26% Oncor Centerpoint AEP North TNMP AEP Central After robust capital plan, Oncor is still projected to have among the lowest delivery rates of any investor-owned utility in Texas 1) As of March 1, 2019; based on 1,300 kWh monthly usage. Includes customer charges, volumetric charges, and non-bypassable charges. 9 2) Oncor data set includes two peer groups: 1.) Texas IOUs; 2.) IOUs with greater than 2M customers. 3) Data as of December 31, 2018.Oncor | Benchmarking Performance (2) Low Cost Provider in Texas Key Facts 11% 11% § Top decile T+D O&M per MWh sold Total Residential Wires Charges (1) (ERCOT IOUs) § Top decile T+D gross plant in service $59.82 $58.55 § Top decile gross asset base per customer 89% $57.42 § One of the fastest customer and asset growth rates in the nation Customer Profile Meter Count by kWh Consumption by $53.40 (3) (3) Customer Class Customer Class $44.17 Residential ~3,100,000 | 85% 36% Commercial ~540,000 | 15% 38% Industrial ~10,000 | < 1% 26% Oncor Centerpoint AEP North TNMP AEP Central After robust capital plan, Oncor is still projected to have among the lowest delivery rates of any investor-owned utility in Texas 1) As of March 1, 2019; based on 1,300 kWh monthly usage. Includes customer charges, volumetric charges, and non-bypassable charges. 9 2) Oncor data set includes two peer groups: 1.) Texas IOUs; 2.) IOUs with greater than 2M customers. 3) Data as of December 31, 2018.

Oncor | Project Spotlight – Far West Texas Transmission Infrastructure to Support West Texas Oil and Gas Production and Renewable Generation Growth § The Far West Texas region (including Winkler, Ward, Reeves, Loving and Culberson Counties) is Oncor’s fastest growing area in the Permian Basin § From 2019 to 2021 projected to have over $700M of Oncor projects to serve this area, including over 300 miles of new transmission lines, dynamic reactive devices (1) and associated station work § Supports load growth for the rapid economic expansion due to oil and natural gas production, processing and transportation § Pathway for further renewable (wind and solar) generation growth and penetration in region Project Length Estimated In Service Date Riverton – Horsehead Draw – Sand Lake 138 kV Line 40 Miles Dec. 2019 Odessa EHV – Riverton 345 kV Line 116 Miles Dec. 2020 (1) Riverton – Sand Lake 345 kV Line 40 Miles Dec. 2020 (1) Sand Lake – Solstice 345 kV Line 44 Miles Dec. 2020 (1) Horseshoe Springs – Owl Hills – Tunstill 138 kV Line 49 Miles May 2020 (1) Quarry Field – Kyle Ranch – Riverton 138 kV Line 25 Miles May 2021 10 1) Estimated mileage due to pending CCN approval.Oncor | Project Spotlight – Far West Texas Transmission Infrastructure to Support West Texas Oil and Gas Production and Renewable Generation Growth § The Far West Texas region (including Winkler, Ward, Reeves, Loving and Culberson Counties) is Oncor’s fastest growing area in the Permian Basin § From 2019 to 2021 projected to have over $700M of Oncor projects to serve this area, including over 300 miles of new transmission lines, dynamic reactive devices (1) and associated station work § Supports load growth for the rapid economic expansion due to oil and natural gas production, processing and transportation § Pathway for further renewable (wind and solar) generation growth and penetration in region Project Length Estimated In Service Date Riverton – Horsehead Draw – Sand Lake 138 kV Line 40 Miles Dec. 2019 Odessa EHV – Riverton 345 kV Line 116 Miles Dec. 2020 (1) Riverton – Sand Lake 345 kV Line 40 Miles Dec. 2020 (1) Sand Lake – Solstice 345 kV Line 44 Miles Dec. 2020 (1) Horseshoe Springs – Owl Hills – Tunstill 138 kV Line 49 Miles May 2020 (1) Quarry Field – Kyle Ranch – Riverton 138 kV Line 25 Miles May 2021 10 1) Estimated mileage due to pending CCN approval.
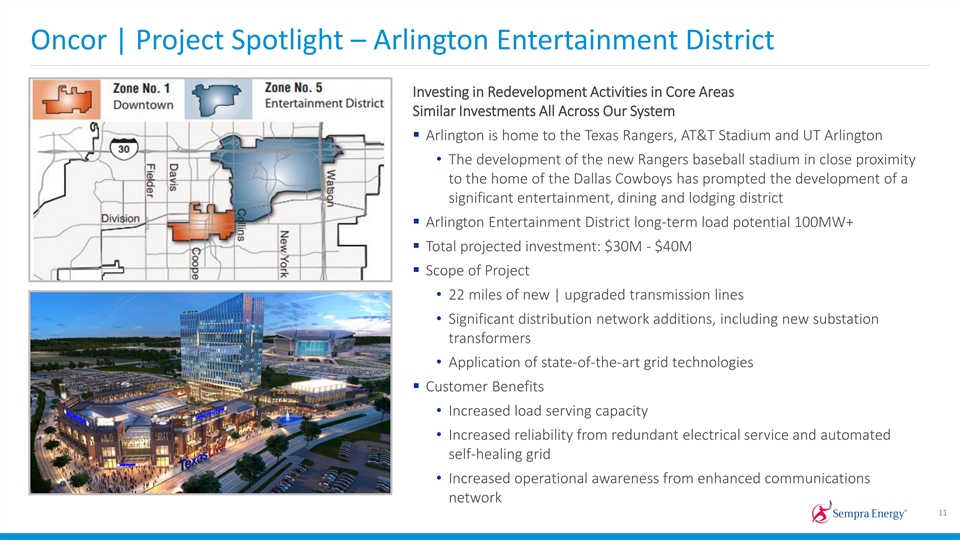
Oncor | Project Spotlight – Arlington Entertainment District Investing in Redevelopment Activities in Core Areas Similar Investments All Across Our System § Arlington is home to the Texas Rangers, AT&T Stadium and UT Arlington • The development of the new Rangers baseball stadium in close proximity to the home of the Dallas Cowboys has prompted the development of a significant entertainment, dining and lodging district § Arlington Entertainment District long-term load potential 100MW+ § Total projected investment: $30M - $40M § Scope of Project • 22 miles of new | upgraded transmission lines • Significant distribution network additions, including new substation transformers • Application of state-of-the-art grid technologies § Customer Benefits • Increased load serving capacity • Increased reliability from redundant electrical service and automated self-healing grid • Increased operational awareness from enhanced communications network 11Oncor | Project Spotlight – Arlington Entertainment District Investing in Redevelopment Activities in Core Areas Similar Investments All Across Our System § Arlington is home to the Texas Rangers, AT&T Stadium and UT Arlington • The development of the new Rangers baseball stadium in close proximity to the home of the Dallas Cowboys has prompted the development of a significant entertainment, dining and lodging district § Arlington Entertainment District long-term load potential 100MW+ § Total projected investment: $30M - $40M § Scope of Project • 22 miles of new | upgraded transmission lines • Significant distribution network additions, including new substation transformers • Application of state-of-the-art grid technologies § Customer Benefits • Increased load serving capacity • Increased reliability from redundant electrical service and automated self-healing grid • Increased operational awareness from enhanced communications network 11

Oncor | Project Spotlight – System Automation + Predictive Modeling Investing in a Self-Healing Grid to Improve Reliability for Customers Predictive Modeling: Driving Value for Customers § ~$600M project expected to be completed by 2026 § Uses meter data + other sources to identify potential facility loading | voltage issues, probable underground cable | transformer imminent failures, § Distribution Automation (DA) is Smart Grid technology that allows unauthorized distributed generation + other challenges before they impact individual devices to automatically sense local operating conditions to the customer make adjustments that optimize performance § Predictive weather modeling used to strategically stage personnel, § Provides the ability to automatically identify faulted areas of the network equipment + resources to increase response + restoration times after a storm and reroute power to quickly restore service § Launched Weather Current, weather monitoring service for customers which § DA technologies lead to increased reliability, greater situational includes helpful tips to educate importance of energy efficiency and safety awareness and advanced analytics on the distribution network around power lines and equipment, along with information to guard against potential storm and electricity hazards 2026 Goals (1) § 100% of the Oncor grid projected to be equipped with some form of DA Deployment Plan thru 2026 advanced distribution technology Current Future Total Communicating FCIs 1,000 39,000 40,000 § 80,000+ automated devices projected to be installed on Oncor’s Distribution Grid Reclosing Fuses 100 24,000 24,100 Intelligent Switches 500 2,500 3,000 § Vast communication network of radio, fiber + cell modem technologies Capacitors 4,000 12,000 16,000 projected to be leveraged | installed to support this initiative Reclosers 700 1,300 2,000 12 1) All numbers rounded.Oncor | Project Spotlight – System Automation + Predictive Modeling Investing in a Self-Healing Grid to Improve Reliability for Customers Predictive Modeling: Driving Value for Customers § ~$600M project expected to be completed by 2026 § Uses meter data + other sources to identify potential facility loading | voltage issues, probable underground cable | transformer imminent failures, § Distribution Automation (DA) is Smart Grid technology that allows unauthorized distributed generation + other challenges before they impact individual devices to automatically sense local operating conditions to the customer make adjustments that optimize performance § Predictive weather modeling used to strategically stage personnel, § Provides the ability to automatically identify faulted areas of the network equipment + resources to increase response + restoration times after a storm and reroute power to quickly restore service § Launched Weather Current, weather monitoring service for customers which § DA technologies lead to increased reliability, greater situational includes helpful tips to educate importance of energy efficiency and safety awareness and advanced analytics on the distribution network around power lines and equipment, along with information to guard against potential storm and electricity hazards 2026 Goals (1) § 100% of the Oncor grid projected to be equipped with some form of DA Deployment Plan thru 2026 advanced distribution technology Current Future Total Communicating FCIs 1,000 39,000 40,000 § 80,000+ automated devices projected to be installed on Oncor’s Distribution Grid Reclosing Fuses 100 24,000 24,100 Intelligent Switches 500 2,500 3,000 § Vast communication network of radio, fiber + cell modem technologies Capacitors 4,000 12,000 16,000 projected to be leveraged | installed to support this initiative Reclosers 700 1,300 2,000 12 1) All numbers rounded.

Oncor | Path to Premier (1),(2) Projected Earnings Path to Premier $470M - $510M • Largest T+D in Texas 1 $435M - $475M • Serving high growth areas including DFW 2 Metroplex and Permian Basin 3 (2),(3) • ~$10.6B 2019-2023 capital plan 4 • Lowest rates of any IOU in ERCOT 5 • 2% premise growth with 1.5% load growth 2019 2020 Represents Sempra’s share of Oncor earnings 1) Actual amounts may differ materially. 13 2) Does not include anticipated impacts from Oncor’s potential acquisition of InfraREIT. 3) Represents 100% of Oncor’s capital expenditures. For Sempra Energy, includes $7.4B of off-balance sheet capital representing Sempra’s 80.25% indirect interest in Oncor, net of Sempra’s capital contributions.Oncor | Path to Premier (1),(2) Projected Earnings Path to Premier $470M - $510M • Largest T+D in Texas 1 $435M - $475M • Serving high growth areas including DFW 2 Metroplex and Permian Basin 3 (2),(3) • ~$10.6B 2019-2023 capital plan 4 • Lowest rates of any IOU in ERCOT 5 • 2% premise growth with 1.5% load growth 2019 2020 Represents Sempra’s share of Oncor earnings 1) Actual amounts may differ materially. 13 2) Does not include anticipated impacts from Oncor’s potential acquisition of InfraREIT. 3) Represents 100% of Oncor’s capital expenditures. For Sempra Energy, includes $7.4B of off-balance sheet capital representing Sempra’s 80.25% indirect interest in Oncor, net of Sempra’s capital contributions.

Appendix 14Appendix 14
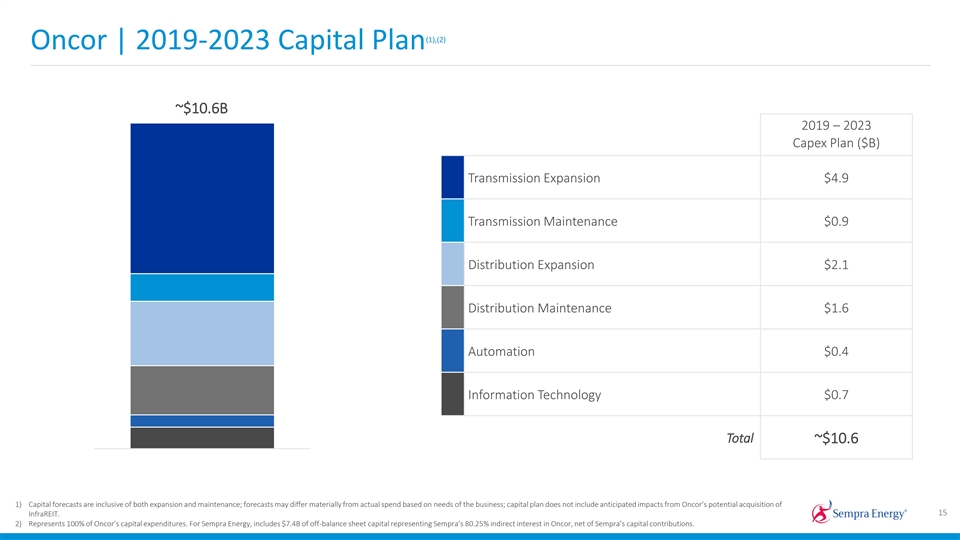
(1),(2) Oncor | 2019-2023 Capital Plan ~$ ~$ 110 0..6 6B 2019 – 2023 Capex Plan ($B) Transmission Expansion $4.9 Transmission Maintenance $0.9 Distribution Expansion $2.1 Distribution Maintenance $1.6 Automation $0.4 Information Technology $0.7 Total ~$10.6 1) Capital forecasts are inclusive of both expansion and maintenance; forecasts may differ materially from actual spend based on needs of the business; capital plan does not include anticipated impacts from Oncor’s potential acquisition of 15 InfraREIT. 2) Represents 100% of Oncor’s capital expenditures. For Sempra Energy, includes $7.4B of off-balance sheet capital representing Sempra’s 80.25% indirect interest in Oncor, net of Sempra’s capital contributions.(1),(2) Oncor | 2019-2023 Capital Plan ~$ ~$ 110 0..6 6B 2019 – 2023 Capex Plan ($B) Transmission Expansion $4.9 Transmission Maintenance $0.9 Distribution Expansion $2.1 Distribution Maintenance $1.6 Automation $0.4 Information Technology $0.7 Total ~$10.6 1) Capital forecasts are inclusive of both expansion and maintenance; forecasts may differ materially from actual spend based on needs of the business; capital plan does not include anticipated impacts from Oncor���s potential acquisition of 15 InfraREIT. 2) Represents 100% of Oncor’s capital expenditures. For Sempra Energy, includes $7.4B of off-balance sheet capital representing Sempra’s 80.25% indirect interest in Oncor, net of Sempra’s capital contributions.
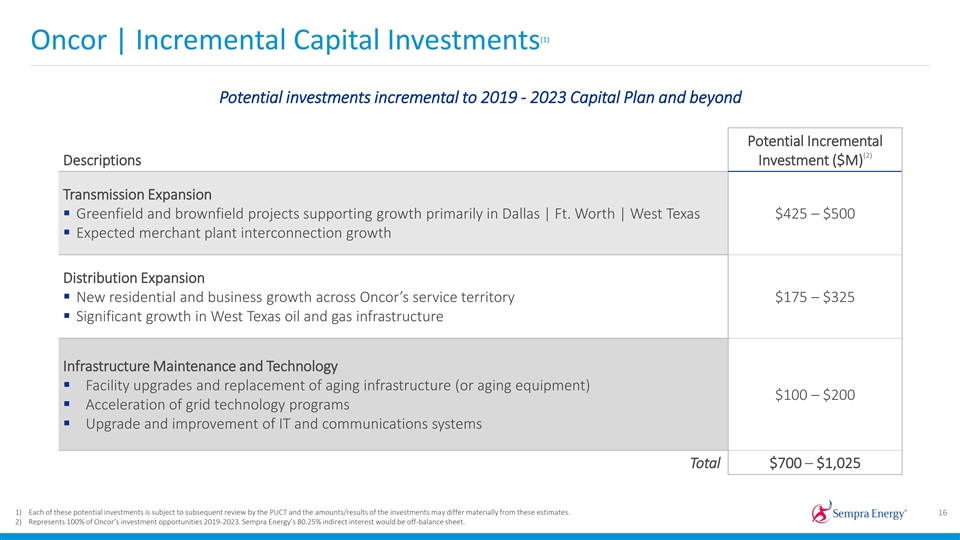
(1) Oncor | Incremental Capital Investments Potential investments incremental to 2019 - 2023 Capital Plan and beyond Potential Incremental (2) Descriptions Investment ($M) Transmission Expansion § Greenfield and brownfield projects supporting growth primarily in Dallas | Ft. Worth | West Texas $425 – $500 § Expected merchant plant interconnection growth Distribution Expansion § New residential and business growth across Oncor’s service territory $175 – $325 § Significant growth in West Texas oil and gas infrastructure Infrastructure Maintenance and Technology § Facility upgrades and replacement of aging infrastructure (or aging equipment) $100 – $200 § Acceleration of grid technology programs § Upgrade and improvement of IT and communications systems Total $700 – $1,025 1) Each of these potential investments is subject to subsequent review by the PUCT and the amounts/results of the investments may differ materially from these estimates. 16 2) Represents 100% of Oncor’s investment opportunities 2019-2023. Sempra Energy’s 80.25% indirect interest would be off-balance sheet.(1) Oncor | Incremental Capital Investments Potential investments incremental to 2019 - 2023 Capital Plan and beyond Potential Incremental (2) Descriptions Investment ($M) Transmission Expansion § Greenfield and brownfield projects supporting growth primarily in Dallas | Ft. Worth | West Texas $425 – $500 § Expected merchant plant interconnection growth Distribution Expansion § New residential and business growth across Oncor’s service territory $175 – $325 § Significant growth in West Texas oil and gas infrastructure Infrastructure Maintenance and Technology § Facility upgrades and replacement of aging infrastructure (or aging equipment) $100 – $200 § Acceleration of grid technology programs § Upgrade and improvement of IT and communications systems Total $700 – $1,025 1) Each of these potential investments is subject to subsequent review by the PUCT and the amounts/results of the investments may differ materially from these estimates. 16 2) Represents 100% of Oncor’s investment opportunities 2019-2023. Sempra Energy’s 80.25% indirect interest would be off-balance sheet.
Oncor | Constructive Regulatory Environment + Timely Recovery of Investments Transmission Cost of Service (TCOS) § Interim TCOS Update - twice per year § Reflects net new transmission investment and related depreciation, FIT and other taxes § Prudence review of capital expenditures deferred until next base-rate case § Typically approved within 45-60 days Distribution Cost Recovery Factor (DCRF) § Can file once per year; only between April 1-8 § Adjustments based on changes in the utility’s distribution-related investments § Prudence review of capital expenditures deferred until next base-rate case § Change in rates effective September 1 17Oncor | Constructive Regulatory Environment + Timely Recovery of Investments Transmission Cost of Service (TCOS) § Interim TCOS Update - twice per year § Reflects net new transmission investment and related depreciation, FIT and other taxes § Prudence review of capital expenditures deferred until next base-rate case § Typically approved within 45-60 days Distribution Cost Recovery Factor (DCRF) § Can file once per year; only between April 1-8 § Adjustments based on changes in the utility’s distribution-related investments § Prudence review of capital expenditures deferred until next base-rate case § Change in rates effective September 1 17

(1) InfraREIT Acquisition | PUCT Timeline Date Event November 30, 2018§ Oncor, Sempra, and Sharyland filed Sale, Transfer and Merger (STM) Application January 4, 2019§ Intervention Deadline March 5, 2019§ Intervenor Direct Testimony March 22, 2019§ Commission Staff Direct Testimony April 10-12, 2019§ Hearing on the Merits (Austin, TX) May 29, 2019§ 180th day after filing 18 1) Transactions are subject to customary closing conditions and consents, including the approval by the PUCT.(1) InfraREIT Acquisition | PUCT Timeline Date Event November 30, 2018§ Oncor, Sempra, and Sharyland filed Sale, Transfer and Merger (STM) Application January 4, 2019§ Intervention Deadline March 5, 2019§ Intervenor Direct Testimony March 22, 2019§ Commission Staff Direct Testimony April 10-12, 2019§ Hearing on the Merits (Austin, TX) May 29, 2019§ 180th day after filing 18 1) Transactions are subject to customary closing conditions and consents, including the approval by the PUCT.