united states
securities and exchange commission
washington, d.c. 20549
form n-csr
certified shareholder report of registered management
investment companies
Investment Company Act file number 811-21237
Unified Series Trust
(Exact name of registrant as specified in charter)
Ultimus Fund Solutions, LLC 225 Pictoria Drive, Suite 450 Cincinnati, OH 45246
(Address of principal executive offices) (Zip code)
Zachary P. Richmond
Ultimus Fund Solutions, LLC
225 Pictoria Drive, Suite 450
Cincinnati, OH 45246
(Name and address of agent for service)
Registrant's telephone number, including area code: 513-587-3400
Date of fiscal year end: 12/31
Date of reporting period: 12/31/22
Form N-CSR is to be used by management investment companies to file reports with the Commission not later than 10 days after the transmission to stockholders of any report that is required to be transmitted to stockholders under Rule 30e-1 under the Investment Company Act of 1940 (17 CFR 270.30e-1). The Commission may use the information provided on Form N-CSR in its regulatory, disclosure review, inspection and policymaking roles.
A registrant is required to disclose the information specified by Form N-CSR, and the Commission will make this information public. A registrant is not required to respond to the collection of information contained in Form N-CSR unless the Form displays a currently valid Office of Management and Budget ("OMB") control number. Please direct comments concerning the accuracy of the information collection burden estimate and any suggestions for reducing the burden to Secretary, Securities and Exchange Commission, 450 Fifth Street, NW, Washington, DC 20549-0609. The OMB has reviewed this collection of information under the clearance requirements of 44 U.S.C. § 3507.
Item 1. Reports to Stockholders.
 | Annual Report
December 31, 2022 |
| CDGIX | Crawford Large Cap Dividend Fund Class I |
| | |
| CDGCX | Crawford Large Cap Dividend Fund Class C |
| | |
| CDOFX | Crawford Small Cap Dividend Fund Class I |
| | |
| CMALX | Crawford Multi-Asset Income Fund |
| For a prospectus and more information, including charges and expenses call (800) 431-1716. The prospectus should be read carefully before investing. Past performance does not guarantee future results. Shares when redeemed may be worth more or less than their original cost. | Fund Investment Adviser:
Crawford Investment Counsel, Inc.
600 Galleria Parkway SE, Suite 1650
Atlanta, GA 30339
www.CrawfordInvestmentFunds.com |
| | |
| Distributed by | |
Ultimus Fund Distributors, LLC
225 Pictoria Drive, Suite 450
Cincinnati, OH 45246 | |
Management Discussion of Fund Performance – (Unaudited)
In 2022, investors were forced to face challenging conditions in both the capital markets and the underlying economy. As we move forward into 2023, Watching and Waiting seems an apt description of the posture of investors and where we find ourselves today. That is, we are watching developments in the underlying economy, monitoring corporate earnings reports and commentary, and keeping a close eye on company fundamentals. This is all occurring while we await a decline in inflation and determine the ultimate outcome of the Federal Reserve’s more restrictive interest rate policy. During the lag time, it is very difficult to measure the extent by which policy is actually affecting various economic factors. The risk is that the Federal Reserve might go too far with interest rate increases, thus causing a recession, or not go far enough and thus lengthen the process and eventually require more stringent measures. Given this period of uncertainty, we focus our investment approach on more consistent and stable, dividend-paying companies with the belief that quality characteristics enhance visibility and predictability of the portfolio, which improves the likelihood of success.
Dividends are an important part of our investment philosophy and process. Dividends represent a key component of total return over time, and a consistent and growing dividend often demonstrates a company’s ability to generate a sustainable and growing cash flow stream. We believe quality and dividends are inexorably linked and look to a company’s dividend history as an initial indicator of quality.
In our view, the success or failure of any investment is primarily determined by two attributes:
| 1. | Fundamental growth in the intrinsic value of a business: Our focus on high-quality companies increases the likelihood that fundamental progress of the company will be achieved year after year, continually enhancing intrinsic value in the process. |
| 2. | Valuation at time of investment: Our value orientation and price sensitivity reflect the belief that valuation is an important component of both the return and risk of any investment. |
Investment Process Goals:
| ● | Identify high-quality companies with a positively skewed risk/reward trade-off. |
| ● | Invest when short-term business or market considerations impair valuation. |
| ● | Allow the company’s fundamental progress, valuation improvement, and dividend stream to contribute to the total investment return over a longer-term time horizon. |
As we move into 2023, we are committed to these goals and portfolio attributes and expect they will be increasingly critical in delivering investment results for our shareholders. Last year in particular reinforced a lesson that we learned a long time ago, that in uncertain
Management Discussion of Fund Performance – (Unaudited) (continued)
times the best place to be invested is in high-quality securities. In 2022, investors were forced to face challenging conditions in both the capital markets and underlying economy, but we believe the investment results for our funds were very acceptable on a relative basis, considering all of the circumstances.
Crawford Large Cap Dividend Fund:
For the year ended December 31, 2022, the Crawford Large Cap Dividend Fund Class I Shares and Class C Shares produced total returns of (7.43)% and (8.33)%, respectively. This compares to total returns for the same time period of (7.54)% for the Fund’s primary benchmark, the Russell 1000® Value Index, and (18.11)% for the Fund’s secondary benchmark, the S&P 500® Index.
The Fund’s outperformance relative to its benchmarks is in line with expectations in a period of market decline. We seek to narrow the range of outcomes, thereby heightening the chance of success in uncertain periods. This relates to the higher-quality and lower-beta orientation of the portfolio.
On a relative basis, compared to the Fund’s primary benchmark, stock selection within Communication Services and Health Care contributed to the Fund’s outperformance. The Fund’s underweight to Energy represented a headwind to overall performance. Energy represented the highest performing sector within the Russell 1000® Value Index and the only sector with a positive return for the year. Despite the Fund’s lack of representation, the relative returns were favorable. We continue to hold our belief that given the volatility inherent to the sector, most Energy companies do not meet our quality screening parameters. The Fund continues to maintain a high-quality orientation, and we believe the portfolio is well-positioned to obtain attractive, long-term, risk-adjusted returns.
Crawford Small Cap Dividend Fund:
For the year ended December 31, 2022, the Crawford Small Cap Dividend Fund produced a total return of (14.12)%. This compares to a total return of (20.44)% for the Fund’s primary benchmark, the Russell 2000® Index. In 2022, the Fund’s quality bias contributed to its relative outperformance. Both dividend payers and companies with higher return on equity outperformed other companies within the Russell 2000® Index. This supports our longstanding belief that quality is a durable and persistent factor in small cap investing that influences both risk and return.
Within the portfolio, Financials and Industrials were the greatest contributors to the Fund’s relative outperformance, followed by Technology and Consumer Staples. The Fund’s underweight to the Energy Sector represented a detractor from relative performance, as
Management Discussion of Fund Performance – (Unaudited) (continued)
Energy was the highest performing sector within the Russell 2000® Index. Most Energy companies do not meet our quality screening parameters for the Fund.
We believe the Fund’s quality-focused, bottom-up investment process aligns well with the objectives of the Fund and expect that the Fund is positioned to continue to benefit from an information advantage in smaller-company stocks and a behavioral bias among investors against more consistent, predictable, dividend-paying companies with smaller market capitalizations.
Crawford Multi-Asset Income Fund:
For the year ended December 31, 2022, the Crawford Multi-Asset Income Fund produced a total return of (1.00)%. This compares to a total return of (3.71)% for the Fund’s benchmark, the NASDAQ US Multi-Asset Diversified Income IndexSM. We attribute the outperformance relative to the primary benchmark to dividend-paying stock selection and the Fund’s higher-quality orientation, lower overall sensitivity to the economy, and risk management. We believe the Fund held up well this year and benefitted from both strong performance in its Energy Infrastructure holdings and market outperformance by higher-yielding equities.
The Crawford Multi-Asset Income Fund’s portfolio management process is oriented toward generating a high level of current income. In order to achieve the desired yield, the Fund accepts and manages four sources of risk. These four risks are 1) Stock market risk, 2) Interest rate risk, 3) Energy price risk, and 4) Credit risk. Allocations to various asset categories such as high-dividend equities, preferred stocks, corporate bonds, real estate investment trusts, and energy infrastructure companies will vary over time as changes occur in individual security pricing and based on the overall income opportunity set. We believe that the income-producing ability of the portfolio is intact and will continue to serve shareholders well going forward.
Conclusion:
As always, the future remains uncertain, but we proceed in the belief that we are girded with the elements of eventual success because of how we invest. We seek to narrow the range of outcomes, thereby heightening the chance of success in our investments. We may have a recession, but if we do, we believe we will be reasonably protected from it; we believe that inflation will be trending downward in 2023; and we believe our emphasis on quality will be a sustaining force as we move through the year. We will continue to identify high-quality companies with a balanced risk/reward trade-off and will attempt to invest in these companies when valuations are attractive.
Thank you for your investment in the Crawford Funds.
Investment Results (Unaudited)
Average Annual Total Returns(a) as of December 31, 2022
| | One Year | Five Year | Ten Year |
| Crawford Large Cap Dividend Fund | | | |
| Class I | (7.43)% | 8.39% | 9.73% |
| Class C(b) | (8.33)% | 7.31% | 8.64% |
| Russell 1000® Value Index(c) | (7.54)% | 6.67% | 10.29% |
| | | | |
| | Expense Ratios(d) | |
| | Class I | Class C | |
| Gross | 0.89% | 1.89% | |
| With Applicable Waivers(e) | 0.89% | 1.89% | |
The performance quoted represents past performance, which does not guarantee future results. The investment return and principal value of an investment will fluctuate so that an investor’s shares, when redeemed, may be worth more or less than their original cost. The returns shown do not reflect the deduction of taxes that a shareholder would pay on Crawford Large Cap Dividend Fund (the “Fund”) distributions or the redemption of Fund shares. Current performance of the Fund may be lower or higher than the performance quoted. The Fund’s investment objectives, risks, charges and expenses should be considered carefully before investing. Performance data current to the most recent month end may be obtained by calling (800) 431-1716.
| (a) | The average annual total returns set forth above include all waivers of fees for various periods. Without such fee waivers, the total returns would have been lower. Total returns shown assume reinvestment of all capital gains and dividend distributions and reflect any changes in price per share. |
| (b) | Class C shares are sold with no initial sales charge, but are subject to a Contingent Deferred Sales Charge (“CDSC”) of 1.00% if redeemed within one year of purchase and an annual 12b-1 fee of 1.00%. |
| (c) | The Russell 1000® Value Index is a widely recognized unmanaged index of equity prices and is representative of a broader market and range of securities than are found in the Fund’s portfolio. Index returns do not reflect the deduction of expenses, which have been deducted from Fund’s returns. Index returns assume reinvestment of all distributions and do not reflect the deduction of taxes and fees. Individuals cannot invest directly in an index; however, an individual may invest in exchange-traded funds or other investment vehicles that attempt to track the performance of a benchmark index. |
| (d) | The expense ratios reflect information from the Fund’s prospectus dated April 30, 2022. Crawford Investment Counsel, Inc. (the “Adviser”) has contractually agreed to waive its management fee and/or reimburse expenses so that total annual operating expenses, excluding portfolio transaction and other investment-related costs (including brokerage fees and commissions); taxes; borrowing costs (such as interest and dividend expenses on securities sold short); acquired fund fees and expenses; fees and expenses associated with investments in other collective investment vehicles or derivative instruments (including for example option and swap fees and expenses); any amounts payable pursuant to a distribution or service plan adopted in accordance with Rule 12b-1 under the Investment Company Act of 1940; any administrative and/or shareholder servicing fees payable pursuant to a plan adopted by the Board of Trustees; expenses incurred in connection with any merger or reorganization; extraordinary expenses (such as litigation expenses, indemnification of |
Investment Results (Unaudited) (continued)
Trust officers and Trustees and contractual indemnification of the Fund service providers); and other expenses that the Trustees agree have not been incurred in the ordinary course of the Fund’s business, do not exceed 0.98% through April 30, 2023. This expense cap may not be terminated prior to this date except by the Board of Trustees. Each waiver/expense payment by the Adviser is subject to recoupment by the Adviser from the Fund in the three years following the date the particular waiver/ expense payment occurred, but only if such recoupment can be achieved without exceeding the annual expense limitation in effect at the time of the waiver/expense payment and any expense limitation in effect at the time of the recoupment. Additional information pertaining to the Fund’s expense ratios as of December 31, 2022 can be found in the financial highlights.
| (e) | The expense ratios, reflect information from the Fund’s prospectus dated April 30, 2022, exclude recoupment by the Adviser of previously waived management fees in the amount of 0.04% because there are no remaining prior waivers to recoup. |
The Fund’s investment objectives, strategies, risks, charges and expenses should be considered carefully before investing. The Fund’s prospectus contains this and other important information about the Fund and may be obtained by calling (800) 431-1716. Please read it carefully before investing.
The Fund is distributed by Ultimus Fund Distributors, LLC, Member FINRA/SIPC.
Investment Results (Unaudited) (continued)
Comparison of the Growth of a $10,000 Investment in the Crawford Large Cap Dividend Fund – Class I and the Russell 1000® Value Index, (Unaudited)
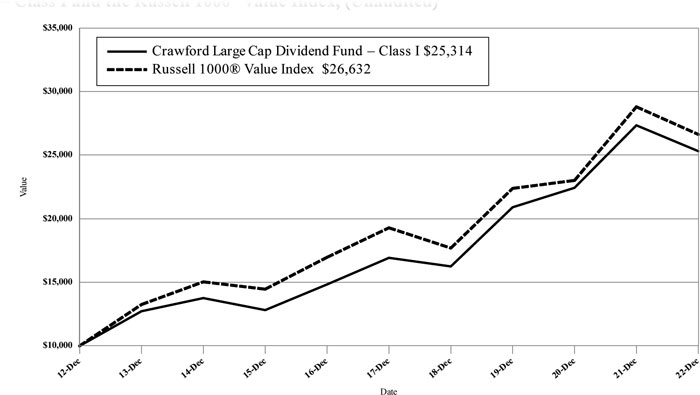
The chart above assumes an initial investment of $10,000 made on December 31, 2012 and through December 31, 2022. THE FUND’S RETURNS REPRESENT PAST PERFORMANCE AND DO NOT GUARANTEE FUTURE RESULTS. The Russell 1000® Value Index is a widely recognized unmanaged index of equity prices and is representative of a broader market and range of securities than are found in the Fund’s portfolio. The returns shown do not reflect deduction of taxes that a shareholder would pay on the Fund distributions or the redemption of Fund shares. Investment returns and principal values will fluctuate so that your shares, when redeemed, may be worth more or less than their original purchase price.
Current performance may be lower or higher than the performance data quoted. For more information on the Fund, and to obtain performance data current to the most recent month-end, or to request a prospectus, please call (800) 431-1716. The Fund’s prospectus and summary prospectus contains important information about the Fund’s investment objectives, potential risks, management fees, charges and expenses, and other information. Please read the prospectus or summary prospectus carefully before investing.
The Fund is distributed by Ultimus Fund Distributors, LLC, Member FINRA/SIPC.
Investment Results (Unaudited) (continued)
Average Annual Total Returns(a) as of December 31, 2022
| | One Year | Five Year | Ten Year |
| Crawford Small Cap Dividend Fund | | | |
| Class I | (14.12)% | 3.99% | 9.62% |
| Russell 2000® Index(b) | (20.44)% | 4.13% | 9.01% |
| | | | |
| | Expense Ratios(c) |
| | | Class I | |
| Gross | | 1.12% | |
| With Applicable Waivers | | 0.99% | |
The performance quoted represents past performance, which does not guarantee future results. The investment return and principal value of an investment will fluctuate so that an investor’s shares, when redeemed, may be worth more or less than their original cost. The returns shown do not reflect the deduction of taxes that a shareholder would pay on Crawford Small Cap Dividend Fund (the “Fund”) distributions or the redemption of Fund shares. Current performance of the Fund may be lower or higher than the performance quoted. The Fund’s investment objectives, risks, charges and expenses should be considered carefully before investing. Performance data current to the most recent month end may be obtained by calling (800) 431-1716.
| (a) | The average annual total returns set forth above include all waivers of fees for various periods since inception. Without such fee waivers, the total returns would have been lower. Total returns shown assume reinvestment of all capital gains and dividend distributions and reflect any changes in price per share. |
| (b) | The Russell 2000® Index is a widely recognized unmanaged index of equity prices and is representative of a broader market and range of securities than are found in the Fund’s portfolio. Index returns do not reflect the deduction of expenses, which have been deducted from the Fund’s returns. Index returns assume reinvestment of all distributions and do not reflect the deduction of taxes and fees. Individuals cannot invest directly in an index; however, an individual may invest in exchange-traded funds or other investment vehicles that attempt to track the performance of a benchmark index. |
| (c) | The expense ratios reflect information from the Fund’s prospectus dated April 30, 2022. Crawford Investment Counsel, Inc. (the “Adviser”) has contractually agreed to waive its management fee and/or reimburse expenses so that total annual operating expenses, excluding portfolio transaction and other investment-related costs (including brokerage fees and commissions); taxes; borrowing costs (such as interest and dividend expenses on securities sold short); acquired fund fees and expenses; fees and expenses associated with investments in other collective investment vehicles or derivative instruments (including for example option and swap fees and expenses); any amounts payable pursuant to a distribution or service plan adopted in accordance with Rule 12b-1 under the Investment Company Act of 1940; any administrative and/or shareholder servicing fees payable pursuant to a plan adopted by the Board of Trustees; expenses incurred in connection with any merger or reorganization; extraordinary expenses (such as litigation expenses, indemnification of Trust officers and Trustees and contractual indemnification of Fund service providers); and other expenses that the Trustees agree have not been incurred in the ordinary course of the Fund’s business, do not exceed 0.99% through April 30, 2023. This expense cap may not be terminated prior to this date except by the Board of Trustees. Each waiver/expense payment by the Adviser is subject to |
Investment Results (Unaudited) (continued)
recoupment by the Adviser from the Fund in the three years following the date the particular waiver/ expense payment occurred, but only if such recoupment can be achieved without exceeding the annual expense limitation in effect at the time of the waiver/expense payment and any expense limitation in effect at the time of the recoupment. Additional information pertaining to the Fund’s expense ratios as of December 31, 2022 can be found in the financial highlights.
The Fund’s investment objectives, strategies, risks, charges and expenses should be considered carefully before investing. The prospectus contains this and other important information about the Fund and may be obtained by calling (800) 431-1716. Please read it carefully before investing.
The Fund is distributed by Ultimus Fund Distributors, LLC, Member FINRA/SIPC.
Investment Results (Unaudited) (continued)
Comparison of the Growth of a $10,000 Investment in the Small Cap Dividend Fund – Class I and the Russell 2000® Index (Unaudited)
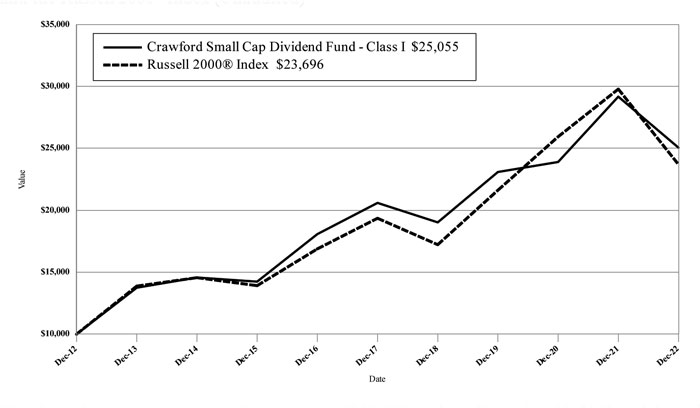
The chart above assumes an initial investment of $10,000 made on December 31, 2012 and through December 31, 2022. THE FUND’S RETURNS REPRESENT PAST PERFORMANCE AND DO NOT GUARANTEE FUTURE RESULTS. The Russell 2000® Index is a widely recognized unmanaged index of equity prices and is representative of a broader market and range of securities than are found in the Fund’s portfolio. The returns shown do not reflect deduction of taxes that a shareholder would pay on Fund distributions or the redemption of Fund shares. Investment returns and principal values will fluctuate so that your shares, when redeemed, may be worth more or less than their original purchase price.
Current performance may be lower or higher than the performance data quoted. For more information on the Fund, and to obtain performance data current to the most recent month-end, or to request a prospectus, please call (800) 431-1716. The Fund’s prospectus and summary prospectus contains important information about the Fund’s investment objectives, potential risks, management fees, charges and expenses, and other information. Please read the prospectus or summary prospectus carefully before investing.
The Fund is distributed by Ultimus Fund Distributors, LLC, Member FINRA/SIPC.
Investment Results (Unaudited) (continued)
Average Annual Total Returns(a) as of December 31, 2022
| | | | Since |
| | | | Inception |
| | One Year | Five Year | (9/12/17) |
| Crawford Multi-Asset Income Fund | (1.00)% | 4.07% | 3.86% |
| NASDAQ US Multi-Asset Diversified Income IndexSM (b) | (3.71)% | 1.79% | 1.98% |
| | | | |
| | Expense Ratios(c) |
| Gross | | 1.21% | |
| With Applicable Waivers | | 1.01% | |
The performance quoted represents past performance, which does not guarantee future results. The investment return and principal value of an investment will fluctuate so that an investor’s shares, when redeemed, may be worth more or less than their original cost. The returns shown do not reflect the deduction of taxes that a shareholder would pay on Crawford Multi-Asset Income Fund (the “Fund”) distributions or the redemption of Fund shares. Current performance of the Fund may be lower or higher than the performance quoted. Fund’s investment objectives, risks, charges and expenses should be considered carefully before investing. Performance data current to the most recent month end may be obtained by calling (800) 431-1716.
| (a) | The average annual total returns set forth above include all waivers of fees for various periods since inception. Without such fee waivers, the total returns would have been lower. Total returns shown assume reinvestment of all capital gains and dividend distributions and reflect any changes in price per share. |
| (b) | The NASDAQ US Multi-Asset Diversified Income IndexSM is designed to provide exposure to multiple asset segments, each selected to result in a consistent and high yield. The index is comprised of securities classified as U.S. equities, U.S. Real Estate Investment Trusts, U.S. preferred securities, U.S. Master Limited Partnerships, and a high-yield corporate debt Exchange Traded Fund and is representative of a broader market and range of securities than are found in the Fund’s portfolio. Index returns do not reflect the deduction of expenses, which have been deducted from the Fund’s returns. Index returns assume reinvestment of all distributions and do not reflect the deduction of taxes and fees. Individuals cannot invest directly in an index; however, an individual may invest in exchange-traded funds or other investment vehicles that attempt to track the performance of a benchmark index. |
| (c) | The expense ratios, which include acquired fund fees and expenses of 0.01%, reflect information from the Fund’s prospectus dated April 30, 2022. Crawford Investment Counsel, Inc. (the “Adviser”) has contractually agreed to waive its management fee and/or reimburse expenses so that total annual operating expenses, excluding portfolio transaction and other investment-related costs (including brokerage fees and commissions); taxes; borrowing costs (such as interest and dividend expenses on securities sold short); acquired fund fees and expenses; fees and expenses associated with investments in other collective investment vehicles or derivative instruments (including for example option and swap fees and expenses); any amounts payable pursuant to a distribution or service plan adopted in accordance with Rule 12b-1 under the Investment Company Act of 1940; any administrative and/ or shareholder servicing fees payable pursuant to a plan adopted by the Board of Trustees; expenses incurred in connection with any merger or reorganization; extraordinary expenses (such as litigation |
Investment Results (Unaudited) (continued)
expenses, indemnification of Trust officers and Trustees and contractual indemnification of Fund service providers); and other expenses that the Trustees agree have not been incurred in the ordinary course of the Fund’s business, do not exceed 1.00% through April 30, 2023. This expense cap may not be terminated prior to this date except by the Board of Trustees. Each waiver/expense payment by the Adviser is subject to recoupment by the Adviser from the Fund in the three years following the date the particular waiver/expense payment occurred, but only if such recoupment can be achieved without exceeding the annual expense limitation in effect at the time of the waiver/expense payment and any expense limitation in effect at the time of the recoupment. Additional information pertaining to the Fund’s expense ratios (not including acquired fund fees and expenses) as of December 31, 2022 can be found in the financial highlights.
The Fund’s investment objectives, strategies, risks, charges and expenses should be considered carefully before investing. The prospectus contains this and other important information about the Fund and may be obtained by calling (800) 431-1716. Please read it carefully before investing.
The Fund is distributed by Ultimus Fund Distributors, LLC, Member FINRA/SIPC.
Investment Results (Unaudited) (continued)
Comparison of the Growth of a $10,000 Investment in the Crawford Multi-Asset Income Fund and the NASDAQ US Multi-Asset Diversified Income IndexSM (Unaudited)
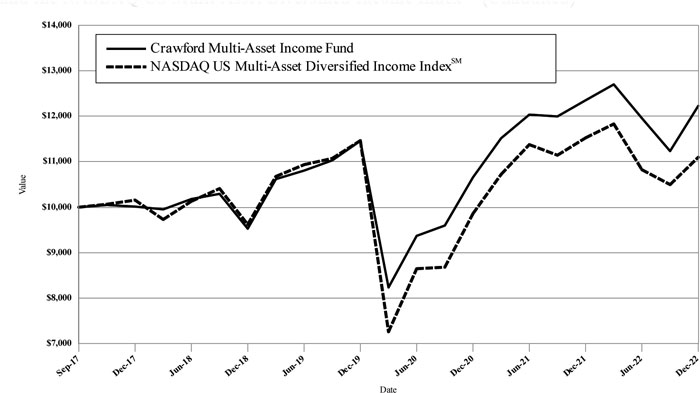
The chart above assumes an initial investment of $10,000 made on September 12, 2017 (commencement of operations) and through December 31, 2022. THE RETURNS REPRESENT PAST PERFORMANCE AND DO NOT GUARANTEE FUTURE RESULTS. The NASDAQ US Multi-Asset Diversified Income IndexSM is designed to provide exposure to multiple asset segments, each selected to result in a consistent and high yield. The returns shown do not reflect deduction of taxes that a shareholder would pay on Fund distributions or the redemption of Fund shares. Investment returns and principal values will fluctuate so that your shares, when redeemed, may be worth more or less than their original purchase price.
Current performance may be lower or higher than the performance data quoted. For more information on the Fund, and to obtain performance data current to the most recent month-end, or to request a prospectus, please call (800) 431-1716. The Fund’s prospectus and summary prospectus contains important information about the Fund’s investment objectives, potential risks, management fees, charges and expenses, and other information. Please read the prospectus or summary prospectus carefully before investing.
The Fund is distributed by Ultimus Fund Distributors, LLC, Member FINRA/SIPC.
Fund Holdings (Unaudited)
Crawford Large Cap Dividend Fund Holdings as of December 31, 2022.*
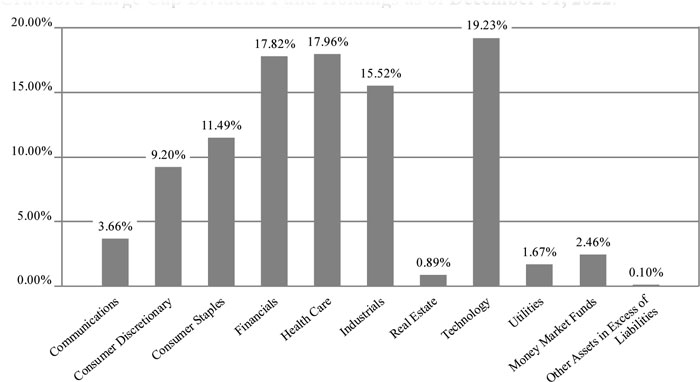
The investment objective of the Crawford Large Cap Dividend Fund is total return. Total return is comprised of both capital appreciation and income.
Crawford Small Cap Dividend Fund Holdings as of December 31, 2022.*
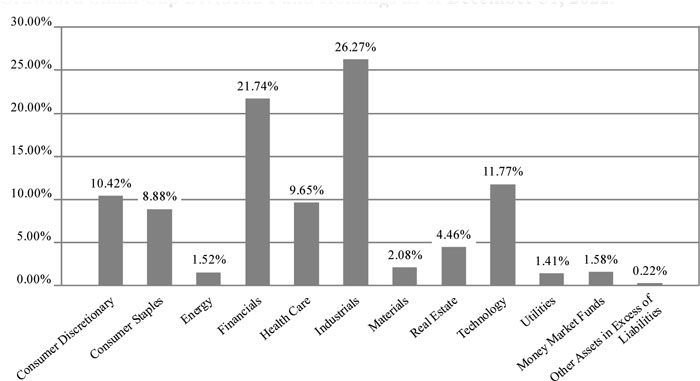
The investment objective of the Crawford Small Cap Dividend Fund is to provide attractive long-term total return with below market risk as measured by standard deviation in comparison with the Russell 2000® Index. Total return is comprised of both capital appreciation and income.
| * | As a percentage of net assets. |
Fund Holdings (Unaudited)
Crawford Multi-Asset Income Fund Holdings as of December 31, 2022.*
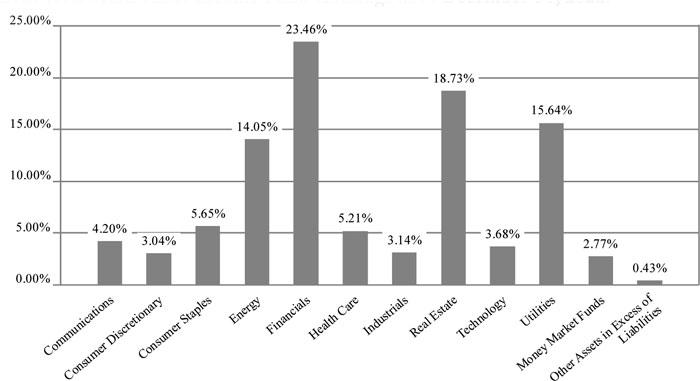
| * | As a percentage of net assets. |
The investment objective of the Crawford Multi-Asset Income Fund is to provide current income.
Availability of Portfolio Schedule – (Unaudited)
The Funds file a complete schedule of portfolio holdings with the Securities and Exchange Commission (the “SEC”) for the first and third quarters of each fiscal year as an exhibit to their reports on Form N-PORT. The Funds’ Form N-PORT reports are available on the SEC’s website at www.sec.gov or on the Funds’ website at www.crawfordinvestmentfunds.com.
| Crawford Large Cap Dividend Fund |
| Schedule of Investments |
| December 31, 2022 |
| | | Shares | | | Fair Value | |
| COMMON STOCKS — 97.44% | | | | | | | | |
| Communications — 3.66% | | | | | | | | |
| Comcast Corp., Class A | | | 25,000 | | | $ | 874,250 | |
| Omnicom Group, Inc. | | | 14,850 | | | | 1,211,315 | |
| | | | | | | | 2,085,565 | |
| Consumer Discretionary — 7.68% | | | | | | | | |
| Genuine Parts Co. | | | 12,940 | | | | 2,245,219 | |
| Hasbro, Inc. | | | 16,000 | | | | 976,160 | |
| Marsh & McLennan Cos., Inc. | | | 7,000 | | | | 1,158,360 | |
| | | | | | | | 4,379,739 | |
| Consumer Staples — 6.37% | | | | | | | | |
| Coca-Cola Co. (The) | | | 28,000 | | | | 1,781,080 | |
| Philip Morris International, Inc. | | | 18,250 | | | | 1,847,083 | |
| | | | | | | | 3,628,163 | |
| Financials — 24.82% | | | | | | | | |
| American Express Co. | | | 10,900 | | | | 1,610,475 | |
| BlackRock, Inc. | | | 2,100 | | | | 1,488,123 | |
| Chubb Ltd. | | | 5,920 | | | | 1,305,952 | |
| Home Depot, Inc. (The) | | | 6,410 | | | | 2,024,663 | |
| JPMorgan Chase & Co. | | | 6,700 | | | | 898,470 | |
| Medtronic PLC | | | 16,000 | | | | 1,243,520 | |
| Northern Trust Corp. | | | 13,120 | | | | 1,160,989 | |
| Procter & Gamble Co. (The) | | | 7,900 | | | | 1,197,324 | |
| Raytheon Technologies Corp. | | | 12,500 | | | | 1,261,500 | |
| Willis Towers Watson PLC | | | 7,978 | | | | 1,951,258 | |
| | | | | | | | 14,142,274 | |
| Health Care — 11.70% | | | | | | | | |
| AbbVie, Inc. | | | 12,500 | | | | 2,020,125 | |
| AstraZeneca PLC - ADR | | | 27,500 | | | | 1,864,500 | |
| Cardinal Health, Inc. | | | 3,000 | | | | 230,610 | |
| Merck & Co., Inc. | | | 20,170 | | | | 2,237,862 | |
| Stryker Corp. | | | 1,300 | | | | 317,837 | |
| | | | | | | | 6,670,934 | |
| Industrials — 16.33% | | | | | | | | |
| Honeywell International, Inc. | | | 7,200 | | | | 1,542,960 | |
| Hubbell, Inc. | | | 3,640 | | | | 854,235 | |
| Johnson Controls International PLC | | | 31,600 | | | | 2,022,400 | |
| Mondelez International, Inc., Class A | | | 25,850 | | | | 1,722,903 | |
| TE Connectivity Ltd. | | | 8,000 | | | | 918,400 | |
| United Parcel Service, Inc., Class B | | | 12,930 | | | | 2,247,751 | |
| | | | | | | | 9,308,649 | |
| Information Technology — 1.02% | | | | | | | | |
| M&T Bank Corp. | | | 4,000 | | | | 580,240 | |
| | | | | | | | | |
| Materials — 4.07% | | | | | | | | |
| Johnson & Johnson | | | 13,140 | | | | 2,321,181 | |
See accompanying notes which are an integral part of these financial statements.
| Crawford Large Cap Dividend Fund |
| Schedule of Investments (continued) |
| December 31, 2022 |
| | | Shares | | | Fair Value | |
| COMMON STOCKS — 97.44% - (continued) | | | | | | | | |
| Real Estate — 0.89% | | | | | | | | |
| Alexandria Real Estate Equities, Inc. | | | 3,500 | | | $ | 509,845 | |
| | | | | | | | | |
| Technology — 19.23% | | | | | | | | |
| Accenture PLC, A | | | 5,840 | | | | 1,558,345 | |
| Fidelity National Information Services, Inc. | | | 5,000 | | | | 339,250 | |
| Global Payments, Inc. | | | 9,700 | | | | 963,404 | |
| International Business Machines Corp. | | | 8,000 | | | | 1,127,120 | |
| Microsoft Corp. | | | 10,370 | | | | 2,486,933 | |
| S&P Global, Inc. | | | 3,600 | | | | 1,205,784 | |
| SAP SE - ADR | | | 4,000 | | | | 412,760 | |
| Texas Instruments, Inc. | | | 13,350 | | | | 2,205,687 | |
| Visa, Inc., Class A | | | 3,200 | | | | 664,832 | |
| | | | | | | | 10,964,115 | |
| Utilities — 1.67% | | | | | | | | |
| American Electric Power Co., Inc. | | | 10,000 | | | | 949,500 | |
| Total Common Stocks (Cost $30,701,584) | | | | | | | 55,540,205 | |
| | | | | | | | | |
| MONEY MARKET FUNDS - 2.46% | | | | | | | | |
| Federated Hermes Treasury Obligations Fund, Institutional Shares, 4.14%(a) | | | 1,400,179 | | | | 1,400,179 | |
| | | | | | | | | |
| Total Money Market Funds (Cost $1,400,179) | | | | | | | 1,400,179 | |
| | | | | | | | | |
| Total Investments — 99.90% (Cost $32,101,763) | | | | | | | 56,940,384 | |
| Other Assets in Excess of Liabilities — 0.10% | | | | | | | 54,836 | |
| NET ASSETS — 100.00% | | | | | | $ | 56,995,220 | |
| (a) | Rate disclosed is the seven day effective yield as of December 31, 2022. |
ADR - American Depositary Receipt.
See accompanying notes which are an integral part of these financial statements.
| Crawford Small Cap Dividend Fund |
| Schedule of Investments |
| December 31, 2022 |
| | | Shares | | | Fair Value | |
| COMMON STOCKS — 98.20% | | | | | | | | |
| Consumer Discretionary — 10.42% | | | | | | | | |
| Academy Sports & Outdoors, Inc. | | | 87,110 | | | $ | 4,576,759 | |
| Carter’s, Inc. | | | 46,374 | | | | 3,459,964 | |
| Columbia Sportswear Co. | | | 46,800 | | | | 4,098,743 | |
| HNI Corp. | | | 99,544 | | | | 2,830,036 | |
| JOANN, Inc. | | | 131,774 | | | | 375,556 | |
| Johnson Outdoors, Inc., Class A | | | 61,113 | | | | 4,040,792 | |
| Leggett & Platt, Inc. | | | 89,570 | | | | 2,886,841 | |
| Monro, Inc. | | | 63,248 | | | | 2,858,810 | |
| Rocky Brands, Inc. | | | 98,453 | | | | 2,325,460 | |
| Wolverine World Wide, Inc. | | | 178,943 | | | | 1,955,847 | |
| | | | | | | | 29,408,808 | |
| Consumer Staples — 8.88% | | | | | | | | |
| Casey’s General Stores, Inc. | | | 19,887 | | | | 4,461,648 | |
| Flowers Foods, Inc. | | | 104,461 | | | | 3,002,209 | |
| Inter Parfums, Inc. | | | 42,745 | | | | 4,125,747 | |
| J&J Snack Foods Corp. | | | 25,578 | | | | 3,829,283 | |
| MGP Ingredients, Inc. | | | 44,161 | | | | 4,697,847 | |
| PriceSmart, Inc. | | | 47,084 | | | | 2,861,766 | |
| Turning Point Brands, Inc. | | | 96,428 | | | | 2,085,738 | |
| | | | | | | | 25,064,238 | |
| Energy — 1.52% | | | | | | | | |
| DT Midstream, Inc. | | | 77,506 | | | | 4,282,982 | |
| | | | | | | | | |
| Financials — 21.74% | | | | | | | | |
| Artisan Partners Asset Management, Inc., Class A | | | 77,308 | | | | 2,296,048 | |
| BancFirst Corp. | | | 44,231 | | | | 3,900,290 | |
| First Hawaiian, Inc. | | | 119,537 | | | | 3,112,743 | |
| Glacier Bancorp, Inc. | | | 57,462 | | | | 2,839,772 | |
| Hanover Insurance Group, Inc. | | | 37,159 | | | | 5,021,295 | |
| Houlihan Lokey, Inc. | | | 54,826 | | | | 4,778,634 | |
| Lazard Ltd., Class A | | | 74,739 | | | | 2,591,201 | |
| Old Republic International Corp. | | | 161,397 | | | | 3,897,738 | |
| SouthState Corp. | | | 69,468 | | | | 5,304,576 | |
| Stock Yards Bancorp, Inc. | | | 54,584 | | | | 3,546,868 | |
| Trico Bancshares | | | 115,598 | | | | 5,894,343 | |
| Valley National Bancorp | | | 465,456 | | | | 5,264,307 | |
| Walker & Dunlop, Inc. | | | 54,797 | | | | 4,300,469 | |
| Webster Financial Corp. | | | 94,050 | | | | 4,452,327 | |
| WSFS Financial Corp. | | | 91,649 | | | | 4,155,366 | |
| | | | | | | | 61,355,977 | |
| Health Care — 9.65% | | | | | | | | |
| Atrion Corp. | | | 10,656 | | | | 5,961,499 | |
| CONMED Corp. | | | 75,266 | | | | 6,671,578 | |
| LeMaitre Vascular, Inc. | | | 81,133 | | | | 3,733,741 | |
| Perrigo Co. PLC | | | 113,301 | | | | 3,862,431 | |
| Psychemedics Corp. | | | 206,281 | | | | 1,019,028 | |
See accompanying notes which are an integral part of these financial statements.
| Crawford Small Cap Dividend Fund |
| Schedule of Investments (continued) |
| December 31, 2022 |
| | | Shares | | | Fair Value | |
| COMMON STOCKS — 98.20% - (continued) | | | | | | | | |
| Health Care — 9.65% - (continued) | | | | | | | | |
| U.S. Physical Therapy, Inc. | | | 73,813 | | | $ | 5,981,068 | |
| | | | | | | | 27,229,345 | |
| Industrials — 26.27% | | | | | | | | |
| AZZ, Inc. | | | 114,707 | | | | 4,611,221 | |
| ESCO Technologies, Inc. | | | 69,740 | | | | 6,105,039 | |
| Franklin Electric Co., Inc. | | | 73,818 | | | | 5,886,985 | |
| Hackett Group, Inc. (The) | | | 285,456 | | | | 5,814,739 | |
| Healthcare Services Group, Inc. | | | 158,245 | | | | 1,898,940 | |
| Landstar System, Inc. | | | 11,218 | | | | 1,827,412 | |
| Littelfuse, Inc. | | | 25,102 | | | | 5,527,460 | |
| Moog, Inc., Class A | | | 60,975 | | | | 5,351,166 | |
| MSC Industrial Direct Co., Inc., Class A | | | 63,857 | | | | 5,217,117 | |
| Mueller Water Products, Inc. | | | 414,022 | | | | 4,454,877 | |
| National Instruments Corp. | | | 154,151 | | | | 5,688,172 | |
| nVent Electric PLC | | | 158,259 | | | | 6,088,224 | |
| Standex International, Inc. | | | 49,412 | | | | 5,060,283 | |
| Tennant Co. | | | 50,391 | | | | 3,102,574 | |
| Valmont Industries, Inc. | | | 13,546 | | | | 4,479,256 | |
| Woodward, Inc. | | | 31,690 | | | | 3,061,571 | |
| | | | | | | | 74,175,036 | |
| Materials — 2.08% | | | | | | | | |
| HB Fuller Co. | | | 81,806 | | | | 5,858,946 | |
| | | | | | | | | |
| Real Estate — 4.46% | | | | | | | | |
| Armada Hoffler Properties, Inc. | | | 232,006 | | | | 2,668,069 | |
| Four Corners Property Trust, Inc. | | | 91,401 | | | | 2,370,028 | |
| Independence Realty Trust, Inc. | | | 268,343 | | | | 4,524,263 | |
| STAG Industrial, Inc. | | | 93,278 | | | | 3,013,812 | |
| | | | | | | | 12,576,172 | |
| Technology — 11.77% | | | | | | | | |
| Absolute Software Corp. | | | 417,946 | | | | 4,363,356 | |
| American Software, Inc., Class A | | | 390,281 | | | | 5,729,324 | |
| AudioCodes, Ltd. | | | 188,586 | | | | 3,373,804 | |
| Cass Information Systems, Inc. | | | 62,562 | | | | 2,866,591 | |
| Power Integrations, Inc. | | | 77,241 | | | | 5,539,725 | |
| Sapiens International Corp. NV | | | 184,486 | | | | 3,409,301 | |
| Simulations Plus, Inc. | | | 133,505 | | | | 4,882,278 | |
| TTEC Holdings, Inc. | | | 69,052 | | | | 3,047,265 | |
| | | | | | | | 33,211,644 | |
| Utilities — 1.41% | | | | | | | | |
| Black Hills Corp. | | | 56,552 | | | | 3,977,868 | |
| | | | | | | | | |
| Total Common Stocks (Cost $251,782,558) | | | | | | | 277,141,016 | |
| | | | | | | | | |
| MONEY MARKET FUNDS - 1.58% | | | | | | | | |
| Federated Hermes Treasury Obligations Fund, Institutional Shares, 4.14%(a) | | | 4,460,117 | | | | 4,460,117 | |
See accompanying notes which are an integral part of these financial statements.
| Crawford Small Cap Dividend Fund |
| Schedule of Investments (continued) |
| December 31, 2022 |
| | | Shares | | | Fair Value | |
| MONEY MARKET FUNDS - 1.58% - continued | | | | | | | | |
| Total Money Market Funds (Cost $4,460,117) | | | | | | $ | 4,460,117 | |
| | | | | | | | | |
| Total Investments — 99.78% (Cost $256,242,675) | | | | | | | 281,601,133 | |
| Other Assets in Excess of Liabilities — 0.22% | | | | | | | 608,066 | |
| NET ASSETS — 100.00% | | | | | | $ | 282,209,199 | |
| (a) | Rate disclosed is the seven day effective yield as of December 31, 2022. |
See accompanying notes which are an integral part of these financial statements.
| Crawford Multi-Asset Income Fund |
| Schedule of Investments |
| December 31, 2022 |
| | | Shares | | | Fair Value | |
| COMMON STOCKS — 53.60% | | | | | | | | |
| Communications — 4.20% | | | | | | | | |
| AT&T, Inc. | | | 55,800 | | | $ | 1,027,278 | |
| BCE, Inc. | | | 52,200 | | | | 2,294,190 | |
| Verizon Communications, Inc. | | | 53,360 | | | | 2,102,384 | |
| | | | | | | | 5,423,852 | |
| Consumer Staples — 5.65% | | | | | | | | |
| Kraft Heinz Co. (The) | | | 74,160 | | | | 3,019,054 | |
| Philip Morris International, Inc. | | | 42,360 | | | | 4,287,255 | |
| | | | | | | | 7,306,309 | |
| Energy — 11.47% | | | | | | | | |
| DT Midstream, Inc. | | | 40,430 | | | | 2,234,162 | |
| Kinder Morgan, Inc. | | | 218,930 | | | | 3,958,254 | |
| ONEOK, Inc. | | | 57,290 | | | | 3,763,953 | |
| Williams Cos., Inc. (The) | | | 147,970 | | | | 4,868,213 | |
| | | | | | | | 14,824,582 | |
| Financials — 5.19% | | | | | | | | |
| Huntington Bancshares, Inc. | | | 219,420 | | | | 3,093,822 | |
| New Residential Investment Corp. | | | 213,890 | | | | 1,747,481 | |
| New York Community Bancorp, Inc. | | | 217,820 | | | | 1,873,252 | |
| | | | | | | | 6,714,555 | |
| Health Care — 5.21% | | | | | | | | |
| AbbVie, Inc. | | | 19,750 | | | | 3,191,798 | |
| Gilead Sciences, Inc. | | | 41,315 | | | | 3,546,892 | |
| | | | | | | | 6,738,690 | |
| Industrials — 1.13% | | | | | | | | |
| BAE Systems PLC - ADR | | | 34,650 | | | | 1,460,324 | |
| | | | | | | | | |
| Real Estate — 12.45% | | | | | | | | |
| Alexander’s, Inc. | | | 10,810 | | | | 2,378,849 | |
| Brandywine Realty Trust | | | 193,970 | | | | 1,192,916 | |
| Crown Castle International Corp. | | | 9,300 | | | | 1,261,452 | |
| Four Corners Property Trust, Inc. | | | 81,830 | | | | 2,121,852 | |
| Physicians Realty Trust | | | 197,860 | | | | 2,863,033 | |
| STAG Industrial, Inc. | | | 81,070 | | | | 2,619,372 | |
| WP Carey, Inc. | | | 46,950 | | | | 3,669,143 | |
| | | | | | | | 16,106,617 | |
| Technology — 3.68% | | | | | | | | |
| International Business Machines Corp. | | | 33,740 | | | | 4,753,629 | |
| | | | | | | | | |
| Utilities — 4.62% | | | | | | | | |
| Duke Energy Corp. | | | 21,390 | | | | 2,202,956 | |
| NorthWestern Corp. | | | 63,470 | | | | 3,766,310 | |
| | | | | | | | 5,969,266 | |
| Total Common Stocks (Cost $62,055,881) | | | | | | | 69,297,824 | |
See accompanying notes which are an integral part of these financial statements.
| Crawford Multi-Asset Income Fund |
| Schedule of Investments (continued) |
| December 31, 2022 |
| | | Shares | | | Fair Value | |
| PREFERRED STOCKS — 34.98% | | | | | | | | |
| Energy — 0.51% | | | | | | | | |
| Energy Transfer LP, Series D, 7.63% | | | 29,730 | | | $ | 654,060 | |
| | | | | | | | | |
| Financials— 18.27% | | | | | | | | |
| AGNC Investment Corp., Series C, 7.00% | | | 56,340 | | | | 1,423,712 | |
| Allstate Corp., Series G, 5.63% | | | 36,750 | | | | 798,578 | |
| Ally Financial, Inc., Series B, 4.70% | | | 3,989,000 | | | | 2,680,109 | |
| American Express Co., Series D, 3.55% | | | 4,100,000 | | | | 3,378,400 | |
| Annaly Capital Management, Inc., Series F, 6.95% | | | 139,530 | | | | 3,401,741 | |
| Bank of America Corp., Series KK, 5.38% | | | 11,830 | | | | 247,720 | |
| Charles Schwab Corp. (The), Series I, 4.00% | | | 4,517,000 | | | | 3,924,144 | |
| Invesco Mortgage Capital, Inc., Series C, 7.50% | | | 122,310 | | | | 2,509,801 | |
| Two Harbors Investment Corp., Series B, 7.63% | | | 161,400 | | | | 3,055,302 | |
| Wells Fargo & Co., Series L, 7.50% | | | 1,850 | | | | 2,192,250 | |
| | | | | | | | 23,611,757 | |
| Industrials — 2.01% | | | | | | | | |
| General Electric Co., Series D, 8.09% | | | 2,640,000 | | | | 2,603,548 | |
| | | | | | | | | |
| Real Estate — 6.28% | | | | | | | | |
| Armada Hoffler Properties Inc., Series A, 6.75% | | | 109,817 | | | | 2,305,058 | |
| Digital Realty Trust, Inc., Series L, 5.20% | | | 102,150 | | | | 2,064,452 | |
| Hersha Hospitality Trust, Series D, 6.50% | | | 66,910 | | | | 1,251,552 | |
| UMH Properties, Inc., Series D, 6.38% | | | 37,100 | | | | 825,475 | |
| Vornado Realty Trust, Series M, 5.25% | | | 104,150 | | | | 1,672,649 | |
| | | | | | | | 8,119,186 | |
| Utilities — 7.91% | | | | | | | | |
| Centerpoint Energy, Inc., Series A, 6.13% | | | 4,150,000 | | | | 3,903,593 | |
| Nisource, Inc., Series B, 6.50% | | | 124,700 | | | | 3,028,963 | |
| Sempra Energy, 5.75% | | | 10,690 | | | | 231,225 | |
| Spire, Inc., Series A, 5.90% | | | 135,630 | | | | 3,062,526 | |
| | | | | | | | 10,226,307 | |
| Total Preferred Stocks (Cost $52,051,376) | | | | | | | 45,214,858 | |
| | | | | | | | | |
| | | Principal | | | | | |
| | | Amount | | | | | |
| CORPORATE BONDS — 8.22% | | | | | | | | |
| Consumer Discretionary — 3.04% | | | | | | | | |
| Newell Brands, Inc., 4.45%, 4/1/2026 | | $ | 4,172,000 | | | | 3,934,176 | |
| | | | | | | | | |
| Energy — 2.07% | | | | | | | | |
| Transcanada Trust, 5.63%, 5/20/2075 | | | 2,830,000 | | | | 2,681,425 | |
| | | | | | | | | |
| Utilities — 3.11% | | | | | | | | |
| Southern Co. (The), Series B, 8.40%, 3/15/2057(a) | | | 4,009,000 | | | | 4,009,000 | |
| Total Corporate Bonds (Cost $10,730,834) | | | | | | | 10,624,601 | |
| | | | | | | | | |
| | | Shares | | | | | |
| MONEY MARKET FUNDS - 2.77% | | | | | | | | |
| Federated Hermes Treasury Obligations Fund, Institutional Shares, 4.14%(b) | | | 3,576,932 | | | | 3,576,932 | |
See accompanying notes which are an integral part of these financial statements.
| Crawford Multi-Asset Income Fund |
| Schedule of Investments (continued) |
| December 31, 2022 |
| | | Shares | | | Fair Value | |
| MONEY MARKET FUNDS - 2.77% - continued | | | | | | | | |
| Total Money Market Funds (Cost $3,576,932) | | | | | | $ | 3,576,932 | |
| | | | | | | | | |
| Total Investments — 99.57% (Cost $128,415,023) | | | | | | | 128,714,215 | |
| Other Assets in Excess of Liabilities — 0.43% | | | | | | | 558,868 | |
| NET ASSETS — 100.00% | | | | | | $ | 129,273,083 | |
| (a) | Variable rate security. The rate shown is the effective interest rate as December 31, 2022. The benchmark on which the rate is calculated is shown parenthetically. |
| (b) | Rate disclosed is the seven day effective yield as of December 31, 2022. |
ADR - American Depositary Receipt.
See accompanying notes which are an integral part of these financial statements.
| Crawford Funds |
| Statements of Assets and Liabilities |
| December 31, 2022 |
| | | Crawford | | | Crawford | | | | |
| | | Large Cap | | | Small Cap | | | Crawford | |
| | | Dividend | | | Dividend | | | Multi-Asset | |
| | | Fund | | | Fund | | | Income Fund | |
| Assets | | | | | | | | | | | | |
| Investments in securities at value (cost $32,101,763, $256,242,675 and $128,415,023) | | $ | 56,940,384 | | | $ | 281,601,133 | | | $ | 128,714,215 | |
| Receivable for fund shares sold | | | 40,271 | | | | 842,560 | | | | — | |
| Receivable for investments sold | | | — | | | | 53,055 | | | | — | |
| Dividends and interest receivable | | | 126,240 | | | | 399,853 | | | | 677,224 | |
| Prepaid expenses | | | 17,815 | | | | 20,937 | | | | 7,364 | |
| Total Assets | | | 57,124,710 | | | | 282,917,538 | | | | 129,398,803 | |
| Liabilities | | | | | | | | | | | | |
| Payable for fund shares redeemed | | | 63,850 | | | | 450,253 | | | | — | |
| Payable to Adviser | | | 24,709 | | | | 199,974 | | | | 87,669 | |
| 12b-1 fees accrued - Class C | | | 6,268 | | | | — | | | | — | |
| Payable to affiliates | | | 13,139 | | | | 30,938 | | | | 15,857 | |
| Other accrued expenses | | | 21,524 | | | | 27,174 | | | | 22,194 | |
| Total Liabilities | | | 129,490 | | | | 708,339 | | | | 125,720 | |
| Net Assets | | $ | 56,995,220 | | | $ | 282,209,199 | | | $ | 129,273,083 | |
| Net Assets consist of: | | | | | | | | | | | | |
| Paid-in capital | | $ | 32,163,675 | | | $ | 258,413,301 | | | $ | 129,007,437 | |
| Accumulated earnings | | | 24,831,545 | | | | 23,795,898 | | | | 265,646 | |
| Net Assets | | $ | 56,995,220 | | | $ | 282,209,199 | | | $ | 129,273,083 | |
| Class I | | | | | | | | | | | | |
| Net Assets | | $ | 54,436,805 | | | $ | 282,209,199 | | | | | |
| Shares outstanding (unlimited number of shares authorized, no par value) | | | 4,154,949 | | | | 7,081,134 | | | | | |
| Net asset value and offering price per share | | $ | 13.10 | | | $ | 39.85 | | | | | |
| Class C | | | | | | | | | | | | |
| Net Assets | | $ | 2,558,415 | | | | | | | | | |
| Shares outstanding (unlimited number of shares authorized, no par value) | | | 196,994 | | | | | | | | | |
| Net asset value and offering price per share | | $ | 12.99 | | | | | | | | | |
| | | | | | | | | | | | | |
| Net Assets | | | | | | | | | | $ | 129,273,083 | |
| Shares outstanding (unlimited number of shares authorized, no par value) | | | | | | | | | | | 5,312,008 | |
| Net asset value and offering price per share | | | | | | | | | | $ | 24.34 | |
See accompanying notes which are an integral part of these financial statements.
| Crawford Funds |
| Statements of Operations |
| For the Year Ended December 31, 2022 |
| | | Crawford Large | | | Crawford Small | | | Crawford Multi- | |
| | | Cap Dividend | | | Cap Dividend | | | Asset Income | |
| | | Fund | | | Fund | | | Fund | |
| Investment Income | | | | | | | | | | | | |
| Dividend income | | $ | 1,407,584 | | | $ | 6,561,221 | | | $ | 4,594,971 | |
| Interest income | | | — | | | | — | | | | 1,328,998 | |
| Foreign dividend taxes withheld | | | (7,716 | ) | | | (55,996 | ) | | | (26,186 | ) |
| Total investment income | | | 1,399,868 | | | | 6,505,225 | | | | 5,897,783 | |
| | | | | | | | | | | | | |
| Expenses | | | | | | | | | | | | |
| Adviser | | | 285,385 | | | | 3,014,633 | | | | 1,349,378 | |
| Fund accounting | | | 43,311 | | | | 62,127 | | | | 45,018 | |
| Administration | | | 30,996 | | | | 162,318 | | | | 71,656 | |
| Transfer agent | | | 27,936 | | | | 34,864 | | | | 18,704 | |
| 12b-1 fees - Class C | | | 27,334 | | | | — | | | | — | |
| Registration | | | 27,110 | | | | 28,598 | | | | 16,535 | |
| Legal | | | 20,778 | | | | 20,778 | | | | 20,778 | |
| Audit and tax preparation | | | 18,861 | | | | 18,861 | | | | 19,910 | |
| Trustee | | | 18,093 | | | | 17,957 | | | | 17,956 | |
| Compliance services | | | 12,000 | | | | 12,000 | | | | 12,000 | |
| Custodian | | | 7,622 | | | | 33,344 | | | | 15,709 | |
| Report printing | | | 4,671 | | | | 21,558 | | | | 4,477 | |
| Insurance | | | 3,165 | | | | 6,849 | | | | 4,175 | |
| Pricing | | | 815 | | | | 1,469 | | | | 2,526 | |
| Miscellaneous | | | 21,519 | | | | 28,909 | | | | 20,501 | |
| Total expenses | | | 549,596 | | | | 3,464,265 | | | | 1,619,323 | |
| Fees contractually waived by Adviser | | | — | | | | (451,157 | ) | | | (270,163 | ) |
| Net operating expenses | | | 549,596 | | | | 3,013,108 | | | | 1,349,160 | |
| Net investment income | | | 850,272 | | | | 3,492,117 | | | | 4,548,623 | |
| Net Realized and Change in Unrealized Gain (Loss) on Investments | | | | | | | | | | | | |
| Net realized gain on investment securities transactions | | | 952,745 | | | | 4,732,614 | | | | 7,524,670 | |
| Net change in unrealized depreciation of investment securities and translation of assets and liabilities in foreign currency | | | (6,479,375 | ) | | | (56,595,290 | ) | | | (13,614,666 | ) |
| Net realized and change in unrealized loss on investments and foreign currency | | | (5,526,630 | ) | | | (51,862,676 | ) | | | (6,089,996 | ) |
| Net decrease in net assets resulting from operations | | $ | (4,676,358 | ) | | $ | (48,370,559 | ) | | $ | (1,541,373 | ) |
See accompanying notes which are an integral part of these financial statements.
| Crawford Funds |
| Statements of Changes in Net Assets |
| | | Crawford Large Cap Dividend Fund | |
| | | For the | | | For the | |
| | | Year Ended | | | Year Ended | |
| | | December 31, | | | December 31, | |
| | | 2022 | | | 2021 | |
| Increase (Decrease) in Net Assets due to: | | | | | | | | |
| Operations | | | | | | | | |
| Net investment income | | $ | 850,272 | | | $ | 720,827 | |
| Net realized gain on investment securities transactions | | | 952,745 | | | | 1,369,894 | |
| Net change in unrealized appreciation (depreciation) of investment securities and translation of assets and liabilities in foreign currency | | | (6,479,375 | ) | | | 9,366,365 | |
| Net increase (decrease) in net assets resulting from operations | | | (4,676,358 | ) | | | 11,457,086 | |
| | | | | | | | | |
| Distributions to Shareholders from Earnings | | | | | | | | |
| Class I | | | (1,739,331 | ) | | | (2,110,276 | ) |
| Class C | | | (57,028 | ) | | | (83,969 | ) |
| Total distributions | | | (1,796,359 | ) | | | (2,194,245 | ) |
| | | | | | | | | |
| Capital Transactions - Class I | | | | | | | | |
| Proceeds from shares sold | | | 5,236,993 | | | | 3,181,478 | |
| Reinvestment of distributions | | | 1,378,698 | | | | 1,761,515 | |
| Amount paid for shares redeemed | | | (5,133,220 | ) | | | (5,373,646 | ) |
| Total Class I | | | 1,482,471 | | | | (430,653 | ) |
| Capital Transactions - Class C | | | | | | | | |
| Proceeds from shares sold | | | 2,400 | | | | 110,219 | |
| Reinvestment of distributions | | | 56,606 | | | | 83,359 | |
| Amount paid for shares redeemed | | | (338,884 | ) | | | (561,579 | ) |
| Total Class C | | | (279,878 | ) | | | (368,001 | ) |
| Net increase (decrease) in net assets resulting from capital transactions | | | 1,202,593 | | | | (798,654 | ) |
| Total Increase (Decrease) in Net Assets | | | (5,270,124 | ) | | | 8,464,187 | |
| | | | | | | | | |
| Net Assets | | | | | | | | |
| Beginning of year | | | 62,265,344 | | | | 53,801,157 | |
| End of year | | $ | 56,995,220 | | | $ | 62,265,344 | |
| | | | | | | | | |
| Share Transactions - Class I | | | | | | | | |
| Shares sold | | | 394,575 | | | | 235,160 | |
| Shares issued in reinvestment of distributions | | | 105,822 | | | | 122,006 | |
| Shares redeemed | | | (387,016 | ) | | | (396,551 | ) |
| Total Class I | | | 113,381 | | | | (39,385 | ) |
| | | | | | | | | |
| Share Transactions - Class C | | | | | | | | |
| Shares sold | | | 185 | | | | 7,756 | |
| Shares issued in reinvestment of distributions | | | 4,365 | | | | 5,784 | |
| Shares redeemed | | | (26,365 | ) | | | (42,096 | ) |
| Total Class C | | | (21,815 | ) | | | (28,556 | ) |
| | | | | | | | | |
| Net increase (decrease) in shares outstanding | | | 91,566 | | | | (67,941 | ) |
See accompanying notes which are an integral part of these financial statements.
| Crawford Funds |
| Statements of Changes in Net Assets (continued) |
| | | Crawford Small Cap Dividend Fund | |
| | | For the | | | For the | |
| | | Year Ended | | | Year Ended | |
| | | December 31, | | | December 31, | |
| | | 2022 | | | 2021 | |
| Increase (Decrease) in Net Assets due to: | | | | | | | | |
| Operations | | | | | | | | |
| Net investment income | | $ | 3,492,117 | | | $ | 3,419,285 | |
| Net realized gain on investment securities transactions | | | 4,732,614 | | | | 25,953,829 | |
| Net change in unrealized appreciation (depreciation) of investment securities and translation of assets and liabilities in foreign currency | | | (56,595,290 | ) | | | 31,340,425 | |
| Net increase (decrease) in net assets resulting from operations | | | (48,370,559 | ) | | | 60,713,539 | |
| | | | | | | | | |
| Distributions to Shareholders from Earnings | | | | | | | | |
| Class I | | | (11,477,887 | ) | | | (23,570,079 | ) |
| Total distributions | | | (11,477,887 | ) | | | (23,570,079 | ) |
| | | | | | | | | |
| Capital Transactions - Class I | | | | | | | | |
| Proceeds from shares sold | | | 26,506,766 | | | | 47,465,130 | |
| Reinvestment of distributions | | | 10,280,084 | | | | 20,663,782 | |
| Amount paid for shares redeemed | | | (40,191,913 | ) | | | (29,036,264 | ) |
| Total Class I | | | (3,405,063 | ) | | | 39,092,648 | |
| Net increase (decrease) in net assets resulting from capital transactions | | | (3,405,063 | ) | | | 39,092,648 | |
| Total Increase (Decrease) in Net Assets | | | (63,253,509 | ) | | | 76,236,108 | |
| | | | | | | | | |
| Net Assets | | | | | | | | |
| Beginning of year | | | 345,462,708 | | | | 269,226,600 | |
| End of year | | $ | 282,209,199 | | | $ | 345,462,708 | |
| | | | | | | | | |
| Share Transactions - Class I | | | | | | | | |
| Shares sold | | | 602,608 | | | | 966,530 | |
| Shares issued in reinvestment of distributions | | | 255,116 | | | | 427,335 | |
| Shares redeemed | | | (924,127 | ) | | | (584,423 | ) |
| Total Class I | | | (66,403 | ) | | | 809,442 | |
| | | | | | | | | |
| Net increase (decrease) in shares outstanding | | | (66,403 | ) | | | 809,442 | |
See accompanying notes which are an integral part of these financial statements.
| Crawford Funds |
| Statements of Changes in Net Assets (continued) |
| | | Crawford Multi-Asset Income Fund | |
| | | For the | | | For the | |
| | | Year Ended | | | Year Ended | |
| | | December 31, | | | December 31, | |
| | | 2022 | | | 2021 | |
| Increase (Decrease) in Net Assets due to: | | | | | | | | |
| Operations | | | | | | | | |
| Net investment income | | $ | 4,548,623 | | | $ | 3,649,282 | |
| Net realized gain on investment securities transactions | | | 7,524,670 | | | | 1,890,821 | |
| Net change in unrealized appreciation (depreciation) of investment securities and translation of assets and liabilities in foreign currency | | | (13,614,666 | ) | | | 11,697,864 | |
| Net increase (decrease) in net assets resulting from operations | | | (1,541,373 | ) | | | 17,237,967 | |
| | | | | | | | | |
| Distributions to Shareholders from | | | | | | | | |
| Earnings | | | (6,216,571 | ) | | | (4,126,741 | ) |
| Return of capital | | | (153,270 | ) | | | — | |
| Total distributions | | | (6,369,841 | ) | | | (4,126,741 | ) |
| | | | | | | | | |
| Capital Transactions | | | | | | | | |
| Proceeds from shares sold | | | 6,087,577 | | | | 21,576,559 | |
| Reinvestment of distributions | | | 5,358,836 | | | | 3,311,063 | |
| Amount paid for shares redeemed | | | (12,953,783 | ) | | | (5,363,476 | ) |
| Net increase (decrease) in net assets resulting from capital transactions | | | (1,507,370 | ) | | | 19,524,146 | |
| Total Increase (Decrease) in Net Assets | | | (9,418,584 | ) | | | 32,635,372 | |
| | | | | | | | | |
| Net Assets | | | | | | | | |
| Beginning of year | | | 138,691,667 | | | | 106,056,295 | |
| End of year | | $ | 129,273,083 | | | $ | 138,691,667 | |
| | | | | | | | | |
| Share Transactions | | | | | | | | |
| Shares sold | | | 237,905 | | | | 850,422 | |
| Shares issued in reinvestment of distributions | | | 216,398 | | | | 132,281 | |
| Shares redeemed | | | (518,871 | ) | | | (215,394 | ) |
| | | | | | | | | |
| Net increase (decrease) in shares outstanding | | | (64,568 | ) | | | 767,309 | |
See accompanying notes which are an integral part of these financial statements.
| Crawford Large Cap Dividend Fund – Class I |
| Financial Highlights |
(For a share outstanding during each year)
| | | For the Years Ended December 31, | |
| | | 2022 | | | 2021 | | | 2020 | | | 2019 | | | 2018 | |
| | | | | | | | | | | | | | | | |
| Selected Per Share Data: | | | | | | | | | | | | | | | | | | | | |
| Net asset value, beginning of year | | $ | 14.62 | | | $ | 12.44 | | | $ | 12.44 | | | $ | 9.83 | | | $ | 10.63 | |
| Investment operations: | | | | | | | | | | | | | | | | | | | | |
| Net investment income | | | 0.20 | | | | 0.18 | | | | 0.21 | | | | 0.19 | | | | 0.18 | |
| Net realized and unrealized gain (loss) | | | (1.30 | ) | | | 2.53 | | | | 0.65 | | | | 2.61 | | | | (0.59 | ) |
| Total from investment operations | | | (1.10 | ) | | | 2.71 | | | | 0.86 | | | | 2.80 | | | | (0.41 | ) |
| Less distributions to shareholders from: | | | | | | | | | | | | | | | | | | | | |
| Net investment income | | | (0.20 | ) | | | (0.18 | ) | | | (0.21 | ) | | | (0.19 | ) | | | (0.18 | ) |
| Net realized gains | | | (0.22 | ) | | | (0.35 | ) | | | (0.65 | ) | | | — | | | | (0.21 | ) |
| Total distributions | | | (0.42 | ) | | | (0.53 | ) | | | (0.86 | ) | | | (0.19 | ) | | | (0.39 | ) |
| Net asset value, end of year | | $ | 13.10 | | | $ | 14.62 | | | $ | 12.44 | | | $ | 12.44 | | | $ | 9.83 | |
| Total Return(a) | | | (7.43 | )% | | | 21.91 | % | | | 7.32 | % | | | 28.61 | % | | | (3.97 | )% |
| Ratios and Supplemental Data: | | | | | | | | | | | | | | | | | | | | |
| Net assets, end of year (000 omitted) | | $ | 54,437 | | | $ | 59,095 | | | $ | 50,751 | | | $ | 47,713 | | | $ | 37,585 | |
| Ratio of net expenses to average net assets | | | 0.92 | % | | | 0.93 | % | | | 0.98 | % | | | 0.98 | % | | | 0.98 | % |
| Ratio of expenses to average net assets before waiver or recoupment | | | 0.92 | % | | | 0.89 | % | | | 0.95 | % | | | 0.98 | % | | | 1.03 | % |
| Ratio of net investment income to average net assets | | | 1.54 | % | | | 1.28 | % | | | 1.84 | % | | | 1.64 | % | | | 1.70 | % |
| Portfolio turnover rate | | | 11 | % | | | 7 | % | | | 43 | % | | | 7 | % | | | 14 | % |
| (a) | Total return represents the rate that the investor would have earned or lost on an investment in the Fund, assuming reinvestment of distributions. |
See accompanying notes which are an integral part of these financial statements.
| Crawford Large Cap Dividend Fund – Class C |
| Financial Highlights |
(For a share outstanding during each year)
| | | For the Years Ended December 31, | |
| | | 2022 | | | 2021 | | | 2020 | | | 2019 | | | 2018 | |
| | | | | | | | | | | | | | | | |
| Selected Per Share Data: | | | | | | | | | | | | | | | | | | | | |
| Net asset value, beginning of year | | $ | 14.49 | | | $ | 12.33 | | | $ | 12.33 | | | $ | 9.76 | | | $ | 10.54 | |
| Investment operations: | | | | | | | | | | | | | | | | | | | | |
| Net investment income | | | 0.07 | | | | 0.04 | | | | 0.10 | | | | 0.07 | | | | 0.08 | |
| Net realized and unrealized gain (loss) | | | (1.28 | ) | | | 2.51 | | | | 0.64 | | | | 2.57 | | | | (0.59 | ) |
| Total from investment operations | | | (1.21 | ) | | | 2.55 | | | | 0.74 | | | | 2.64 | | | | (0.51 | ) |
| Less distributions to shareholders from: | | | | | | | | | | | | | | | | | | | | |
| Net investment income | | | (0.07 | ) | | | (0.04 | ) | | | (0.09 | ) | | | (0.07 | ) | | | (0.06 | ) |
| Net realized gains | | | (0.22 | ) | | | (0.35 | ) | | | (0.65 | ) | | | — | | | | (0.21 | ) |
| Total distributions | | | (0.29 | ) | | | (0.39 | ) | | | (0.74 | ) | | | (0.07 | ) | | | (0.27 | ) |
| Net asset value, end of year | | $ | 12.99 | | | $ | 14.49 | | | $ | 12.33 | | | $ | 12.33 | | | $ | 9.76 | |
| Total Return(a) | | | (8.33 | )% | | | 20.73 | % | | | 6.26 | % | | | 27.16 | % | | | (4.84 | )% |
| Ratios and Supplemental Data: | | | | | | | | | | | | | | | | | | | | |
| Net assets, end of year (000 omitted) | | $ | 2,558 | | | $ | 3,171 | | | $ | 3,050 | | | $ | 4,168 | | | $ | 4,069 | |
| Ratio of net expenses to average net assets | | | 1.92 | % | | | 1.96 | % | | | 1.98 | % | | | 1.98 | % | | | 1.98 | % |
| Ratio of expenses to average net assets before waiver or recoupment | | | 1.92 | % | | | 1.89 | % | | | 1.95 | % | | | 1.98 | % | | | 2.03 | % |
| Ratio of net investment income to average net assets | | | 0.53 | % | | | 0.26 | % | | | 0.84 | % | | | 0.64 | % | | | 0.68 | % |
| Portfolio turnover rate | | | 11 | % | | | 7 | % | | | 43 | % | | | 7 | % | | | 14 | % |
| (a) | Total return represents the rate that the investor would have earned or lost on an investment in the Fund, assuming reinvestment of distributions. |
See accompanying notes which are an integral part of these financial statements.
| Crawford Small Cap Dividend Fund – Class I |
| Financial Highlights |
(For a share outstanding during each year)
| | | For the Years Ended December 31, | |
| | | 2022 | | | 2021 | | | 2020 | | | 2019 | | | 2018 | |
| | | | | | | | | | | | | | | | |
| Selected Per Share Data: | | | | | | | | | | | | | | | | | | | | |
| Net asset value, beginning of year | | $ | 48.33 | | | $ | 42.48 | | | $ | 41.98 | | | $ | 36.39 | | | $ | 42.42 | |
| Investment operations: | | | | | | | | | | | | | | | | | | | | |
| Net investment income | | | 0.50 | | | | 0.52 | | | | 0.52 | | | | 0.55 | | | | 0.47 | |
| Net realized and unrealized gain (loss) | | | (7.31 | ) | | | 8.83 | | | | 0.83 | | | | 7.20 | | | | (3.70 | ) |
| Total from investment operations | | | (6.81 | ) | | | 9.35 | | | | 1.35 | | | | 7.75 | | | | (3.23 | ) |
| Less distributions to shareholders from: | | | | | | | | | | | | | | | | | | | | |
| Net investment income | | | (0.51 | ) | | | (0.53 | ) | | | (0.48 | ) | | | (0.58 | ) | | | (0.45 | ) |
| Net realized gains | | | (1.16 | ) | | | (2.97 | ) | | | (0.37 | ) | | | (1.58 | ) | | | (2.35 | ) |
| Total distributions | | | (1.67 | ) | | | (3.50 | ) | | | (0.85 | ) | | | (2.16 | ) | | | (2.80 | ) |
| Net asset value, end of year | | $ | 39.85 | | | $ | 48.33 | | | $ | 42.48 | | | $ | 41.98 | | | $ | 36.39 | |
| Total Return(a) | | | (14.12 | )% | | | 22.06 | % | | | 3.50 | % | | | 21.38 | % | | | (7.64 | )% |
| Ratios and Supplemental Data: | | | | | | | | | | | | | | | | | | | | |
| Net assets, end of year (000 omitted) | | $ | 282,209 | | | $ | 345,463 | | | $ | 269,227 | | | $ | 249,865 | | | $ | 178,416 | |
| Ratio of net expenses to average net assets | | | 0.99 | % | | | 0.99 | % | | | 0.99 | % | | | 1.03 | % | | | 1.05 | % |
| Ratio of expenses to average net assets before waiver or recoupment | | | 1.14 | % | | | 1.12 | % | | | 1.17 | % | | | 1.18 | % | | | 1.20 | % |
| Ratio of net investment income to average net assets | | | 1.15 | % | | | 1.07 | % | | | 1.44 | % | | | 1.36 | % | | | 1.11 | % |
| Portfolio turnover rate | | | 20 | % | | | 27 | % | | | 32 | % | | | 28 | % | | | 33 | % |
| (a) | Total return represents the rate that the investor would have earned or lost on an investment in the Fund, assuming reinvestment of distributions. |
See accompanying notes which are an integral part of these financial statements.
| Crawford Multi-Asset Income Fund |
| Financial Highlights |
(For a share outstanding during each year)
| | | For the Years Ended December 31, | |
| | | 2022 | | | 2021 | | | 2020 | | | 2019 | | | 2018 | |
| | | | | | | | | | | | | | | | |
| Selected Per Share Data: | | | | | | | | | | | | | | | | | | | | |
| Net asset value, beginning of year | | $ | 25.80 | | | $ | 23.01 | | | $ | 25.74 | | | $ | 22.54 | | | $ | 24.79 | |
| Investment operations: | | | | | | | | | | | | | | | | | | | | |
| Net investment income | | | 0.83 | | | | 0.74 | | | | 0.79 | | | | 0.94 | | | | 1.05 | |
| Net realized and unrealized gain (loss) | | | (1.09 | ) | | | 2.88 | | | | (2.68 | ) | | | 3.56 | | | | (2.20 | ) |
| Total from investment operations | | | (0.26 | ) | | | 3.62 | | | | (1.89 | ) | | | 4.50 | | | | (1.15 | ) |
| Less distributions to shareholders from: | | | | | | | | | | | | | | | | | | | | |
| Net investment income | | | (0.87 | ) | | | (0.83 | ) | | | (0.82 | ) | | | (1.00 | ) | | | (1.04 | ) |
| Net realized gains | | | (0.30 | ) | | | — | | | | — | | | | (0.29 | ) | | | (0.06 | ) |
| Return of capital | | | (0.03 | ) | | | — | | | | (0.02 | ) | | | (0.01 | ) | | | — | |
| Total distributions | | | (1.20 | ) | | | (0.83 | ) | | | (0.84 | ) | | | (1.30 | ) | | | (1.10 | ) |
| Net asset value, end of year | | $ | 24.34 | | | $ | 25.80 | | | $ | 23.01 | | | $ | 25.74 | | | $ | 22.54 | |
| Total Return(a) | | | (1.00 | )% | | | 15.90 | % | | | (7.00 | )% | | | 20.25 | % | | | (4.86 | )% |
| Ratios and Supplemental Data: | | | | | | | | | | | | | | | | | | | | |
| Net assets, end of year (000 omitted) | | $ | 129,273 | | | $ | 138,692 | | | $ | 106,056 | | | $ | 93,326 | | | $ | 50,923 | |
| Ratio of net expenses to average net assets | | | 1.00 | % | | | 1.00 | % | | | 1.00 | % | | | 1.00 | % | | | 1.00 | % |
| Ratio of expenses to average net assets before waiver or recoupment | | | 1.20 | % | | | 1.20 | % | | | 1.26 | % | | | 1.32 | % | | | 1.39 | % |
| Ratio of net investment income to average net assets | | | 3.37 | % | | | 2.94 | % | | | 3.67 | % | | | 3.89 | % | | | 4.51 | % |
| Portfolio turnover rate | | | 36 | % | | | 12 | % | | | 33 | % | | | 20 | % | | | 28 | % |
| (a) | Total return represents the rate that the investor would have earned or lost on an investment in the Fund, assuming reinvestment of distributions. |
See accompanying notes which are an integral part of these financial statements.
| Crawford Funds |
| Notes to the Financial Statements |
| December 31, 2022 |
NOTE 1. ORGANIZATION
Crawford Large Cap Dividend Fund (the “Large Cap Dividend Fund”), Crawford Small Cap Dividend Fund (the “Small Cap Dividend Fund”) and Crawford Multi-Asset Income Fund (the “Multi-Asset Income Fund”) (each a “Fund” and collectively, the “Funds”) are each registered under the Investment Company Act of 1940, as amended (the “1940 Act”), as a diversified series of Unified Series Trust (the “Trust”). The Large Cap Dividend Fund, Small Cap Dividend Fund, and Multi-Asset Income Fund were organized on December 7, 2003, June 21, 2012, and August 7, 2017, respectively. The Trust is an open-end investment company established under the laws of Ohio by an Agreement and Declaration of Trust dated October 14, 2002, as amended (the “Trust Agreement”). The Trust Agreement permits the Board of Trustees (the “Board”) to issue an unlimited number of shares of beneficial interest of separate series without par value. Each Fund is one of a series of funds currently authorized by the Board. The investment adviser to the Funds is Crawford Investment Counsel, Inc. (the “Adviser”). The investment objective of the Large Cap Dividend Fund is to provide total return. The investment objective of the Small Cap Dividend Fund is to provide attractive long-term total return with below market risk as measured by standard deviation in comparison with the Russell 2000® Index. The investment objective of the Multi-Asset Income Fund is to provide current income.
The Large Cap Dividend Fund currently offers two classes of shares: Class I and Class C. Large Cap Dividend Fund Class I shares were first offered to the public on January 5, 2004, and Large Cap Dividend Fund Class C shares were first offered to the public on January 27, 2004. Small Cap Dividend Fund Class I shares were first offered to the public on September 26, 2012, and Small Cap Dividend Fund Class C shares were offered to the public on April 29, 2015 but closed for sale on December 3, 2019 and ceased operation on February 26, 2020. Shares of the Multi-Asset Income Fund were first offered to the public on September 12, 2017. Each class votes separately on matters affecting only that class, or on matters expressly required to be voted on separately by state or federal law. Shares of each class of a series have the same voting and other rights and preferences as the other classes and series of the Trust for matters that affect the Trust as a whole. Each share represents an equal proportionate interest in the assets and liabilities belonging to the applicable Fund and is entitled to such dividends and distributions out of income belonging to the Funds as are declared by the Board.
NOTE 2. SIGNIFICANT ACCOUNTING POLICIES
The Funds are investment companies and follow accounting and reporting guidance under Financial Accounting Standards Board Accounting Standards Codification (“ASC”) Topic 946, “Financial Services-Investment Companies”. The following is a summary of significant accounting policies followed by the Funds in the preparation of their financial
| Crawford Funds |
| Notes to the Financial Statements (continued) |
| December 31, 2022 |
statements. These policies are in conformity with generally accepted accounting principles in the United States of America (“GAAP”).
Estimates – The preparation of financial statements in conformity with GAAP requires management to make estimates and assumptions that affect the reported amounts of assets and liabilities and disclosure of contingent assets and liabilities at the date of the financial statements and the reported amounts of increases and decreases in net assets from operations during the reporting period. Actual results could differ from those estimates.
Foreign Currency Translation – The accounting records of the Funds are maintained in U.S. dollars. Foreign currency amounts are translated into U.S. dollars at the current rate of exchange each business day to determine the value of investments, and other assets and liabilities. Purchases and sales of foreign securities, and income and expenses, are translated at the prevailing rate of exchange on the respective date of these transactions. The Funds do not isolate that portion of the results of operations resulting from changes in foreign exchange rates on investments from fluctuations arising from changes in market prices of securities held. These fluctuations are included with the realized and unrealized gain or loss from investments. Net realized gain (loss) on foreign currency translations on the Statements of Operations represents currency gains (losses) realized between the trade and settlement dates on securities transactions, and the difference between the amount of investment income and foreign withholding taxes recorded on the Funds’ books and the U.S. dollar equivalent amounts actually received or paid. The change in unrealized currency gains (losses) on foreign currency translations for the period is reflected in the Statements of Operations.
Federal Income Taxes – The Funds make no provision for federal income or excise tax. Each Fund has qualified and intends to qualify each year as a regulated investment company (“RIC”) under subchapter M of the Internal Revenue Code of 1986, as amended, by complying with the requirements applicable to RICs and by distributing substantially all of its taxable income. Each Fund also intends to distribute sufficient net investment income and net capital gains, if any, so that it will not be subject to excise tax on undistributed income and gains. If the required amount of net investment income or gains is not distributed, the Funds could incur a tax expense.
As of and during the fiscal year ended December 31, 2022, the Funds did not have any liabilities for any unrecognized tax benefits. The Funds recognize interest and penalties, if any, related to unrecognized tax benefits as income tax expense in the Statements of Operations when incurred. During the year, the Funds did not incur any interest or penalties. Management of the Funds has reviewed tax positions taken in tax years that remain subject to examination by all major tax jurisdictions, including federal (i.e., the previous three tax year ends and the interim tax period since then, as applicable) and has
| Crawford Funds |
| Notes to the Financial Statements (continued) |
| December 31, 2022 |
concluded that no provision for unrecognized tax benefits or expenses is required in these financial statements and does not expect this to change over the next twelve months.
Expenses – Expenses incurred by the Trust that do not relate to a specific fund of the Trust are allocated to the individual funds based on each fund’s relative net assets or another appropriate basis (as determined by the Board). Expenses specifically attributable to any class are borne by that class. Income, realized gains and losses, unrealized appreciation and depreciation, and fund-wide expenses not allocated to a particular class shall be allocated to each class based on the net assets of that class in relation to the net assets of the entire fund.
Security Transactions and Related Income – The Funds follow industry practice and record security transactions on the trade date for financial reporting purposes. The specific identification method is used for determining gains or losses for financial statements and income tax purposes. Dividend income is recorded on the ex-dividend date and interest income is recorded on an accrual basis. Distributions received from investments in real estate investment trusts (“REITs”) that represent a return of capital or capital gain are recorded as a reduction of the cost of investment or as a realized gain, respectively. The calendar year-end amounts of ordinary income, capital gains, and return of capital included in distributions received from the Funds’ investments in REITs are reported to the Funds after the end of the calendar year; accordingly, the Funds estimate these amounts for accounting purposes until the characterization of REIT distributions is reported. Estimates are based on the most recent REIT distributions information available. Withholding taxes on foreign dividends and related reclaims have been provided for in accordance with the Funds’ understanding of the applicable country’s tax rules and rates.
Dividends and Distributions – The Large Cap Dividend Fund and the Small Cap Dividend Fund each typically distribute substantially all of their net investment income quarterly and net realized capital gains, if any, at least annually. The Multi-Asset Income Fund typically distributes net investment income monthly and any realized net capital gains, if any, annually. Distributions to shareholders, which are determined in accordance with income tax regulations, are recorded on the ex-dividend date. The treatment for financial reporting purposes of distributions made to shareholders during the year from net investment income or net realized capital gains may differ from their ultimate treatment for federal income tax purposes. Where such differences are permanent in nature; they are reclassified in the components of net assets based on their ultimate characterization for federal income tax purposes. Any such reclassifications will have no effect on net assets, results of operations, or net asset values (“NAV”) per share of the Funds.
| Crawford Funds |
| Notes to the Financial Statements (continued) |
| December 31, 2022 |
For the fiscal year ended of December 31, 2022, the Funds made the following reclassifications to increase (decrease) the components of net assets:
| | | | | | Accumulated | |
| | | Paid-In | | | Earnings | |
| | | Capital | | | (Deficit) | |
| Large Cap Dividend Fund | | $ | — | | | $ | — | |
| Small Cap Dividend Fund | | | — | | | | — | |
| Multi-Asset Income Fund | | | (216,729 | ) | | | 216,729 | |
Contingent Deferred Sales Charges – With respect to the Class C shares of the Large Cap Dividend Fund there is no initial sales charge on purchases. However, a contingent deferred sales charge (“CDSC”) of 1.00%, based on the lower of the shares’ cost or current NAV, will be imposed on such purchases if the shares are redeemed within 12 months of purchase. Any shares acquired by reinvestment of distributions will be redeemed without a CDSC. In determining whether a CDSC is payable, the Large Cap Dividend Fund will first redeem Class C shares not subject to any charge.
NOTE 3. SECURITIES VALUATION AND FAIR VALUE MEASUREMENTS
Each Fund values its portfolio securities at fair value as of the close of regular trading on the New York Stock Exchange (“NYSE”) (normally 4:00 p.m. Eastern time) on each business day the NYSE is open for business. Fair value is defined as the price that a Fund would receive upon selling an investment in a timely transaction to an independent buyer in the principal or most advantageous market of the investment. GAAP establishes a three-tier hierarchy to maximize the use of observable market data and minimize the use of unobservable inputs and to establish classification of fair value measurements for disclosure purposes.
Inputs refer broadly to the assumptions that market participants would use in pricing the asset or liability, including assumptions about risk (the risk inherent in a particular valuation technique used to measure fair value including a pricing model and/or the risk inherent in the inputs to the valuation technique). Inputs may be observable or unobservable. Observable inputs are inputs that reflect the assumptions market participants would use in pricing the asset or liability developed based on market data obtained and available from sources independent of the reporting entity. Unobservable inputs are inputs that reflect the reporting entity’s own assumptions about the assumptions market participants would use in pricing the asset or liability developed based on the best information available in the circumstances.
Various inputs are used in determining the value of each Fund’s investments. These inputs are summarized in the three broad levels listed below.
| ● | Level 1 – unadjusted quoted prices in active markets for identical investments and/or registered investment companies where the value per share is determined and published |
| Crawford Funds |
| Notes to the Financial Statements (continued) |
| December 31, 2022 |
and is the basis for current transactions for identical assets or liabilities at the valuation date
| ● | Level 2 – other significant observable inputs (including, but not limited to, quoted prices for an identical security in an inactive market, quoted prices for similar securities, interest rates, prepayment speeds, credit risk, etc.) |
| ● | Level 3 – significant unobservable inputs (including the Funds’ own assumptions in determining fair value of investments based on the best information available) |
The inputs used to measure fair value may fall into different levels of the fair value hierarchy. In such cases, for disclosure purposes, the level in the fair value hierarchy which is reported is determined based on the lowest level input that is significant to the fair value measurement in its entirety.
Equity securities that are traded on any stock exchange are generally valued at the last quoted sale price on the security’s primary exchange. Lacking a last sale price, an exchange-traded security is generally valued at its last bid price. Securities traded in the NASDAQ over-the-counter market are generally valued at the NASDAQ Official Closing Price. When using market quotations and when the market is considered active, the security is classified as a Level 1 security. In the event that market quotations are not readily available or are considered unreliable due to market or other events, a Fund values its securities and other assets at fair value in accordance with policies established by and under the general supervision of the Board. Under these policies, the securities will be classified as Level 2 or 3 within the fair value hierarchy, depending on the inputs used.
Debt securities are valued by using the mean between the closing bid and ask prices provided by a pricing service. If the closing bid and ask prices are not readily available, the pricing service may provide a price determined by a matrix pricing method. Matrix pricing is a mathematical technique used to value fixed income securities without relying exclusively on quoted prices. Matrix pricing takes into consideration recent transactions, yield, liquidity, risk, credit quality, coupon, maturity, type of issue and any other factors or market data the pricing service deems relevant for the actual security being priced and for other securities with similar characteristics. These securities will generally be categorized as Level 2 securities. If the Board or the Adviser decides that a price provided by the pricing service does not accurately reflect the fair value of the securities or when prices are not readily available from a pricing service, securities are valued at fair value as determined by the Valuation Designee, in conformity with guidelines adopted by and subject to review of the Board. These securities will generally be categorized as Level 3 securities.
| Crawford Funds |
| Notes to the Financial Statements (continued) |
| December 31, 2022 |
Investments in mutual funds, including money market mutual funds, are generally priced at the ending NAV provided by the service agent of the mutual funds. These securities are categorized as Level 1 securities.
In accordance with the Trust’s valuation policies and fair value determinations pursuant to Rule 2a-5, the Adviser as Valuation Designee is required to consider all appropriate factors relevant to the value of securities for which it has determined other pricing sources are not available or reliable as described above. No single method exists for determining fair value, because fair value depends upon the circumstances of each individual case. As a general principle, the current fair value of a security being valued by the Valuation Designee would be the amount that the Funds might reasonably expect to receive upon the current sale. Methods that are in accordance with this principle may, for example, be based on (i) a multiple of earnings; (ii) a discount from market prices of a similar freely traded security (including a derivative security or a basket of securities traded on other markets, exchanges or among dealers); or (iii) yield to maturity with respect to debt issues, or a combination of these and other methods. Fair-value pricing is permitted if, in the Valuation Designee’s opinion, the validity of market quotations appears to be questionable based on factors such as evidence of a thin market in the security based on a small number of quotations, a significant event occurs after the close of a market but before a Fund’s NAV calculation that may affect a security’s value, or the Valuation Designee is aware of any other data that calls into question the reliability of market quotations.
The following is a summary of the inputs used to value the Funds’ investments as of December 31, 2022:
| | | Valuation Inputs | | | | |
| Assets | | Level 1 | | | Level 2 | | | Level 3 | | | Total | |
| Large Cap Dividend Fund | | | | | | | | | | | | | | | | |
| Common Stocks(a) | | $ | 55,540,205 | | | $ | — | | | $ | — | | | $ | 55,540,205 | |
| Money Market Funds | | | 1,400,179 | | | | — | | | | — | | | | 1,400,179 | |
| Total | | $ | 56,940,384 | | | $ | — | | | $ | — | | | $ | 56,940,384 | |
| | | | | | | | | | | | | | | | | |
| Small Cap Dividend Fund | | | | | | | | | | | | | | | | |
| Common Stocks(a) | | | 277,141,016 | | | | — | | | | — | | | | 277,141,016 | |
| Money Market Funds | | | 4,460,117 | | | | — | | | | — | | | | 4,460,117 | |
| Total | | $ | 281,601,133 | | | $ | — | | | $ | — | | | $ | 281,601,133 | |
| | | | | | | | | | | | | | | | | |
| Multi-Asset Income Fund | | | | | | | | | | | | | | | | |
| Common Stocks(a) | | | 69,297,824 | | | | — | | | | — | | | | 69,297,824 | |
| Preferred Stocks(a) | | | 28,725,064 | | | | 16,489,794 | | | | — | | | | 45,214,858 | |
| Corporate Bonds(a) | | | — | | | | 10,624,601 | | | | — | | | | 10,624,601 | |
| Money Market Funds | | | 3,576,932 | | | | — | | | | — | | | | 3,576,932 | |
| Total | | $ | 101,599,820 | | | $ | 27,114,395 | | | $ | — | | | $ | 128,714,215 | |
| (a) | Refer to Schedule of Investments for sector classifications. |
| Crawford Funds |
| Notes to the Financial Statements (continued) |
| December 31, 2022 |
The Funds did not hold any investments at the end of the reporting period for which significant unobservable inputs (Level 3) were used in determining fair value; therefore, no reconciliation of Level 3 securities is included for this reporting period.
NOTE 4. FEES AND OTHER TRANSACTIONS WITH AFFILIATES AND OTHER SERVICE PROVIDERS
The Adviser, under the terms of the management agreement with the Trust with respect to each Fund (each an “Agreement”), manages the Funds’ investments. As compensation for its management services, each Fund pays the Adviser a management fee based on each Fund’s average daily net assets as follows:
| | | Large Cap Dividend | | Small Cap Dividend | | Multi-Asset Income |
| | | Fund | | Fund | | Fund |
| Management fee rate | | 0.50% | | 0.99% | | 1.00% |
| Management fees earned | | $285,385 | | $3,014,633 | | $1,349,378 |
| Fees recouped (waived) | | $– | | $(451,157) | | $(270,163) |
The Adviser has contractually agreed to waive its management fee and/or reimburse expenses so that total annual operating expenses, excluding portfolio transaction and other investment-related costs (including brokerage fees and commissions); taxes; borrowing costs (such as interest and dividend expenses on securities sold short); acquired fund fees and expenses; fees and expenses associated with investments in other collective investment vehicles or derivative instruments (including for example option and swap fees and expenses); any amounts payable pursuant to a distribution or service plan adopted in accordance with Rule 12b-1 under the 1940 Act; any administrative and/or shareholder servicing fees payable pursuant to a plan adopted by the Board; expenses incurred in connection with any merger or reorganization; extraordinary expenses (such as litigation expenses, indemnification of Trust officers and Trustees and contractual indemnification of Fund service providers); and other expenses that the Trustees agree have not been incurred in the ordinary course of the Funds’ business, do not exceed 0.98% of the Large Cap Dividend Fund’s average daily net assets, 0.99% of the Small Cap Dividend Fund’s average daily net assets and 1.00% of the Multi-Asset Income Fund’s average daily net assets. The contractual arrangements for the Funds are in place through April 30, 2023.
| Crawford Funds |
| Notes to the Financial Statements (continued) |
| December 31, 2022 |
Each waiver/expense payment by the Adviser is subject to recoupment by the Adviser from the applicable Fund in the three years following the date the particular waiver/expense payment occurred, but only if such recoupment can be achieved without exceeding the annual expense limitation in effect at the time of the waiver/expense payment and any expense limitation in effect at the time of the recoupment. The amounts subject to repayment by the Funds, pursuant to the aforementioned conditions are as follows:
| | | Large Cap | | | Small Cap | | | | |
| | | Dividend | | | Dividend | | | Multi-Asset | |
| Recoverable Through | | Fund | | | Fund | | | Income Fund | |
| December 31, 2023 | | $ | — | | | $ | 386,201 | | | $ | 238,010 | |
| December 31, 2024 | | | — | | | | 431,087 | | | | 250,932 | |
| December 31, 2025 | | | — | | | | 451,157 | | | | 270,163 | |
Ultimus Fund Solutions, LLC (“Ultimus”) provides administration, fund accounting and transfer agent services to the Funds. The Funds pay Ultimus fees in accordance with the agreements for such services.
Northern Lights Compliance Services, LLC (“NLCS”), an affiliate of Ultimus, provides a Chief Compliance Officer to the Trust, as well as related compliance services, pursuant to a consulting agreement between NLCS and the Trust. Under the terms of such agreement, NLCS receives fees from the Funds, which are approved annually by the Board.
Under the terms of a Distribution Agreement with the Trust, Ultimus Fund Distributors, LLC (the “Distributor”) serves as principal underwriter to the Funds. The Distributor is a wholly-owned subsidiary of Ultimus. The Distributor is compensated by the Adviser (not the Funds) for acting as principal underwriter.
Certain officers and a Trustee of the Trust are also employees of Ultimus and such persons are not paid by the Funds for serving in such capacities.
The Board supervises the business activities of the Trust. Each Trustee serves as a trustee until termination of the Trust unless the Trustee dies, resigns, retires, or is removed. The Chairman of the Board and more than 75% of the Trustees are “Independent Trustees,” which means that they are not “interested persons” as defined in the 1940 Act. The Independent Trustees review and establish compensation at least annually. Each Independent Trustee of the Trust receives annual compensation, which is an established amount paid quarterly per fund in the Trust at the time of the regular quarterly Board meetings. The Chairman of the Board receives the highest compensation, commensurate with his additional duties and each Chair of a committee receives additional compensation as well. Independent Trustees also receive $1,000 for attending any special meeting that requires an in-person approval of a contract and $250 for the first hour and $200 for each additional hour for attending other special meetings. In addition, the Trust reimburses Independent Trustees for out-of-pocket expenses incurred in conjunction with attendance at meetings.
The Trust, with respect to the Large Cap Dividend Fund’s Class C shares has adopted a Distribution Plan (the “Plan”) pursuant to Rule 12b-1 under the 1940 Act. Under the Plan, the Large Cap Dividend Fund pays a fee to the Distributor, the Adviser or other financial institutions of 1.00% of the Class C’s average daily net assets (0.75% to help defray the cost of distributing Class C shares and 0.25% for servicing the Class C shareholders)
| Crawford Funds |
| Notes to the Financial Statements (continued) |
| December 31, 2022 |
attributable to the Large Cap Dividend Fund in connection with the promotion and distribution of the Large Cap Dividend Fund’s Class C shares or the provision of personal services to Class C shareholders. These services include, but are not necessarily limited to, advertising, compensation to underwriters, dealers and selling personnel, the printing and mailing of prospectuses to other than current Large Cap Dividend Fund shareholders, the printing and mailing of sales literature and servicing shareholder accounts (“12b-1 Expenses”). The Plan is a compensation plan, which means that compensation is provided regardless of 12b-1 Expenses actually incurred. Pursuant to the Plan, the Board reviews, at least quarterly, a written report of the distribution expenses incurred on behalf of the Funds under the Plan. For the fiscal year ended December 31, 2022, the Large Cap Dividend Fund Class C shares incurred 12b-1 Expenses of $27,334. At December 31, 2022, $6,268 was owed for 12b-1 Expenses.
NOTE 5. PURCHASES AND SALES OF SECURITIES
For the fiscal year ended December 31, 2022, purchases and sales of investment securities, other than short-term investments, were as follows:
| | | Purchases | | | Sales | |
| Large Cap Dividend Fund | | $ | 6,275,499 | | | $ | 7,273,609 | |
| Small Cap Dividend Fund | | | 60,211,589 | | | | 72,511,883 | |
| Multi-Asset Income Fund | | | 47,353,289 | | | | 48,821,359 | |
There were no purchases or sales of long-term U.S. government obligations during the fiscal year ended December 31, 2022.
NOTE 6. FEDERAL TAX INFORMATION
At December 31, 2022, the net unrealized appreciation (depreciation) and tax cost of investments for tax purposes were as follows:
| | | Large Cap | | | Small Cap | | | Multi-Asset | |
| | | Dividend Fund | | | Dividend Fund | | | Income Fund | |
| Gross unrealized appreciation | | $ | 26,085,206 | | | $ | 47,810,157 | | | $ | 12,130,851 | |
| Gross unrealized depreciation | | | (1,270,309 | ) | | | (23,396,626 | ) | | | (11,831,661 | ) |
| Net unrealized appreciation (depreciation) on investments | | $ | 24,814,897 | | | $ | 24,413,531 | | | $ | 299,190 | |
| Tax cost of investments | | $ | 32,125,487 | | | $ | 257,187,602 | | | $ | 128,415,025 | |
| Crawford Funds |
| Notes to the Financial Statements (continued) |
| December 31, 2022 |
The tax character of distributions paid for the fiscal years ended December 31, 2022 and December 31, 2021 were as follows:
| | | Large Cap Dividend Fund | | | Small Cap Dividend Fund | | | Multi-Asset Income Fund | |
| | | 2022 | | | 2021 | | | 2022 | | | 2021 | | | 2022 | | | 2021 | |
| Distributions paid from: | | | | | | | | | | | | | | | | | | | | | | | | |
| Ordinary income(a) | | $ | 846,706 | | | $ | 723,327 | | | $ | 3,668,472 | | | $ | 3,489,559 | | | $ | 4,612,106 | | | $ | 4,126,741 | |
| Long-term capital gains | | | 949,653 | | | | 1,470,918 | | | | 7,809,415 | | | | 20,080,520 | | | | 1,604,465 | | | | — | |
| Tax return of capital | | | — | | | | — | | | | — | | | | — | | | | 153,270 | | | | — | |
| Total distributions paid | | $ | 1,796,359 | | | $ | 2,194,245 | | | $ | 11,477,887 | | | $ | 23,570,079 | | | $ | 6,369,841 | | | $ | 4,126,741 | |
| (a) | Short-term capital gain distributions are treated as ordinary income for tax purposes. |
At December 31, 2022, the components of accumulated earnings (deficit) on a tax basis were as follows:
| | | Large Cap | | | Small Cap | | | Multi-Asset | |
| | | Dividend Fund | | | Dividend Fund | | | Income Fund | |
| Undistributed ordinary income | | $ | 13,556 | | | $ | 11,718 | | | $ | — | |
| Undistributed long-term capital gains | | | 3,092 | | | | — | | | | — | |
| Accumulated capital and other losses | | | — | | | | (629,351 | ) | | | (33,579 | ) |
| Unrealized appreciation on investments | | | 24,814,897 | | | | 24,413,531 | | | | 299,225 | |
| Total accumulated earnings | | $ | 24,831,545 | | | $ | 23,795,898 | | | $ | 265,646 | |
The differences between book-basis and tax-basis unrealized appreciation (depreciation) are attributable primarily to: tax deferral of losses on wash sales, differences related to partnership investments and the return of capital adjustments from underlying investments.
During the fiscal year ended December 31, 2022, the Multi-Asset Income Fund utilized capital loss carryforwards of $5,949,811.
Capital losses and specified gains realized after October 31, and net investment losses realized after December 31 of the Funds fiscal year may be deferred and treated as occurring on the first business day of the following fiscal year for tax purposes. For the fiscal year ended December 31, 2022 the Small Cap Dividend Fund and the Multi-Asset Income Fund deferred post October losses in the amount of $629,351 and $33,579, respectively.
| Crawford Funds |
| Notes to the Financial Statements (continued) |
| December 31, 2022 |
NOTE 7. SECTOR RISK
If a Fund has significant investments in the securities of issuers within a particular sector, any development affecting that sector will have a greater impact on the value of the net assets of the Fund than would be the case if the Fund did not have significant investments in that sector. In addition, this may increase the risk of loss in the Fund and increase the volatility of the Fund’s NAV per share. For instance, economic or market factors, regulatory changes or other developments may negatively impact all companies in a particular sector, and therefore the value of the Fund’s portfolio will be adversely affected. As of December 31, 2022, the Small Cap Dividend Fund had 26.27% of the value of its net assets invested in stocks within the Industrials sector.
NOTE 8. COMMITMENTS AND CONTINGENCIES
The Trust indemnifies its officers and Trustees for certain liabilities that may arise from their performance of their duties to the Trust or the Funds. Additionally, in the normal course of business, the Trust enters into contracts that contain a variety of representations and warranties which provide general indemnifications. The Trust’s maximum exposure under these arrangements is unknown, as this would involve future claims that may be made against the Trust that have not yet occurred.
NOTE 9. SUBSEQUENT EVENTS
Management of the Funds has evaluated the need for disclosures and/or adjustments resulting from subsequent events through the date at which these financial statements were issued. Based upon this evaluation, management has determined there were no items requiring adjustment of the financial statements or additional disclosure, other than below.
On February 1, 2023, the Multi-Asset Income Fund paid an income distribution of $0.0564 per share to shareholders of record on January 30, 2023.
Report of Independent Registered Public Accounting Firm
To the Shareholders of Crawford Funds and
Board of Trustees of Unified Series Trust
Opinion on the Financial Statements
We have audited the accompanying statements of assets and liabilities, including the schedules of investments, of Crawford Large Cap Dividend Fund, Crawford Small Cap Dividend Fund, and Crawford Multi-Asset Income Fund (the “Funds”), each a series of Unified Series Trust, as of December 31, 2022, the related statements of operations for the year then ended, the statements of changes in net assets for each of the two years in the period then ended, the related notes, and the financial highlights for each of the five years in the period then ended (collectively referred to as the “financial statements”). In our opinion, the financial statements present fairly, in all material respects, the financial position of the each of the Funds as of December 31, 2022, the results of their operations for the year then ended, the changes in net assets for each of the two years in the period then ended, and the financial highlights for each of the five years in the period then ended, in conformity with accounting principles generally accepted in the United States of America.
Basis for Opinion
These financial statements are the responsibility of the Funds’ management. Our responsibility is to express an opinion on the Funds’ financial statements based on our audits. We are a public accounting firm registered with the Public Company Accounting Oversight Board (United States) (“PCAOB”) and are required to be independent with respect to the Funds in accordance with the U.S. federal securities laws and the applicable rules and regulations of the Securities and Exchange Commission and the PCAOB.
We conducted our audits in accordance with the standards of the PCAOB. Those standards require that we plan and perform the audit to obtain reasonable assurance about whether the financial statements are free of material misstatement whether due to error or fraud.
Our audits included performing procedures to assess the risks of material misstatement of the financial statements, whether due to error or fraud, and performing procedures that respond to those risks. Such procedures included examining, on a test basis, evidence regarding the amounts and disclosures in the financial statements. Our procedures included confirmation of securities owned as of December 31, 2022, by correspondence with the custodian and brokers. Our audits also included evaluating the accounting principles used and significant estimates made by management, as well as evaluating the overall presentation of the financial statements. We believe that our audits provide a reasonable basis for our opinion.
We have served as the Funds’ auditor since 2017.
COHEN & COMPANY, LTD.
Chicago, Illinois
February 24, 2023
| Liquidity Risk Management Program (Unaudited) |
The Funds have adopted and implemented a written liquidity risk management program (the “Program”) as required by Rule 22e-4 (the “Liquidity Rule”) under the 1940 Act. The Program is reasonably designed to assess and manage the Funds’ liquidity risk, taking into consideration, among other factors, each Fund’s investment strategy and the liquidity of its portfolio investments during normal and reasonably foreseeable stressed conditions; its short and long-term cash flow projections; and its cash holdings and access to other funding sources. The Board approved the appointment of the Liquidity Administrator Committee, comprising certain Trust officers and employees of the Adviser. The Liquidity Administrator Committee maintains Program oversight and reports to the Board on at least an annual basis regarding the Program’s operational effectiveness through a written report (the “Report”). The Program’s most recent Report, which was presented to the Board for consideration at its meeting held on August 16, 2022, outlined the operation of the Program and the adequacy and effectiveness of the Program’s implementation. During the review period, the Funds did not experience unusual stress or disruption to their operations related to purchase and redemption activity. Also, during the review period the Funds held adequate levels of cash and highly liquid investments to meet shareholder redemption activities in accordance with applicable requirements. The Report concluded that the Program is reasonably designed to prevent violation of the Liquidity Rule and has been effectively implemented.
| Summary of Fund Expenses (Unaudited) |
As a shareholder of a Fund, you incur two types of costs: (1) transaction costs and (2) ongoing costs, including management fees, distribution (12b-1) fees and other Fund expenses. These examples are intended to help you understand your ongoing costs (in dollars) of investing in each Fund and to compare these costs with the ongoing costs of investing in other funds. Each Fund’s example is based on an investment of $1,000 invested at the beginning of the period and held for the entire period from July 1, 2022 through December 31, 2022.
Actual Expenses
The first line of the table for each class provides information about actual account values and actual expenses. You may use the information in these lines, together with the amount you invested, to estimate the expenses that you paid over the period. Simply divide your account value by $1,000 (for example, an $8,600 account value divided by $1,000 = 8.60), then multiply the result by the number in the first line under the heading “Expenses Paid During Period” to estimate the expenses you paid on your account during this period.
Hypothetical Example for Comparison Purposes
The second line of the table for each class provides information about hypothetical account values and hypothetical expenses based on each Fund’s actual expense ratios and an assumed rate of return of 5% per year before expenses, which is not the Fund’s actual return. The hypothetical account values and expenses may not be used to estimate the actual ending account balances or expenses you paid for the period. You may use this information to compare the ongoing costs of investing in the Funds and other funds. To do so, compare this 5% hypothetical example with the 5% hypothetical examples that appear in the shareholder reports of other funds.
Expenses shown in the table are meant to highlight your ongoing costs only and do not reflect any transactional costs. Therefore, the second line of the table for each class is useful in comparing ongoing costs only and will not help you determine the relative total costs of owning different funds. In addition, if transaction costs were included, your costs would have been higher.
| Summary of Fund Expenses (Unaudited) (continued) |
| | | | | | | Ending | | | | | | |
| | | | Beginning | | | Account | | | Expenses | | | |
| | | | Account | | | Value | | | Paid | | | Annualized |
| | | | Value | | | December | | | During | | | Expense |
| | | | July 1, 2022 | | | 31, 2022 | | | Period(a) | | | Ratio |
| Crawford Large Cap Dividend Fund | | | | | | | | | | | | | | |
| Class I | Actual | | $ | 1,000.00 | | | $ | 1,062.20 | | | $ | 4.83 | | | 0.93% |
| | Hypothetical(b) | | $ | 1,000.00 | | | $ | 1,020.52 | | | $ | 4.74 | | | 0.93% |
| Class C | Actual | | $ | 1,000.00 | | | $ | 1,057.00 | | | $ | 10.01 | | | 1.93% |
| | Hypothetical(b) | | $ | 1,000.00 | | | $ | 1,015.48 | | | $ | 9.80 | | | 1.93% |
| Crawford Small Cap Dividend Fund | | | | | | | | | | | | | | |
| Class I | Actual | | $ | 1,000.00 | | | $ | 1,004.80 | | | $ | 5.00 | | | 0.99% |
| | Hypothetical(b) | | $ | 1,000.00 | | | $ | 1,020.21 | | | $ | 5.04 | | | 0.99% |
| Crawford Multi-Asset Income Fund | | | | | | | | | | | | | | |
| | Actual | | $ | 1,000.00 | | | $ | 1,022.70 | | | $ | 5.10 | | | 1.00% |
| | Hypothetical(b) | | $ | 1,000.00 | | | $ | 1,020.16 | | | $ | 5.09 | | | 1.00% |
| (a) | Expenses are equal to the Fund’s annualized expense ratios, multiplied by the average account value over the period, multiplied by 184/365 (to reflect the one-half year period). |
| (b) | Hypothetical assumes 5% annual return before expenses. |
| Shareholder Voting Results (Unaudited) |
At a Special Shareholder Meeting at which a quorum was present, as reconvened on September 13, 2022, Fund shareholders of record as of the close of business on July 5, 2022 voted to approve the following proposal:
Proposal 1: To elect the following individuals to serve on the Board of Trustees of the Trust:
Freddie Jacobs Jr.
Catharine Barrow McGauley
Kenneth G.Y. Grant
Daniel J. Condon
Gary A. Hippenstiel
Stephen A. Little
Ronald C. Tritschler
David R. Carson
| | | Shares Voted in | | Shares Voted | | Shares Needed to |
| Fund | | Favor* | | Against or Abstain* | | Approve* |
| Crawford Large Cap Dividend Fund | | 3,984,430 | | 69,779 | | Plurality |
| | | (98.28%) | | (1.72%) | | (greater than 50%) |
| | | | | | | |
| Crawfrod Small Cap Dividend Fund | | 6,450,991 | | 4,931 | | Plurality |
| | | (99.92%) | | (0.08%) | | (greater than 50%) |
| | | | | | | |
| Crawfrod Multi-Asset Fund | | 5,122,409 | | 0 | | Plurality |
| | | (100%) | | (0.00%) | | (greater than 50%) |
| * | as a percentage of the total voting securities of the Fund voted at the meeting at which a quorum was present. |
| Additional Federal Income Tax Information (Unaudited) |
The Form 1099-DIV you receive in January 2023 will show the tax status of all distributions paid to your account in calendar year 2022. Shareholders are advised to consult their own tax adviser with respect to the tax consequences of their investment in the Funds. As required by the Internal Revenue Code and/or regulations, shareholders must be notified regarding the status of qualified dividend income for individuals and the dividends received deduction for corporations.
Qualified Dividend Income. The Funds designate the following percentage or up to the maximum amount of such dividends allowable pursuant to the Internal Revenue Code, as qualified dividend income eligible for the reduced tax rate.
| | | Large Cap | | Small Cap | | Multi-Asset |
| | | Dividend Fund | | Dividend Fund | | Income Fund |
| Qualified Dividend Income | | 100% | | 100% | | 100% |
Qualified Business Income. The Funds designate the following percentage of ordinary income dividends, or up to the maximum amount of such dividends allowable pursuant to the Internal Revenue Code, as qualified business income.
| | | Large Cap | | Small Cap | | Multi-Asset |
| | | Dividend Fund | | Dividend Fund | | Income Fund |
| Qualified Business Income | | 0% | | 0% | | 0% |
Dividends Received Deduction. Corporate shareholders are generally entitled to take the dividends received deduction on the portion of the Funds’ dividend distribution that qualifies under tax law. For the Funds’ calendar year 2022 ordinary income dividends, the following percentage qualifies for the corporate dividends received deduction.
| | | Large Cap | | Small Cap | | Multi-Asset |
| | | Dividend Fund | | Dividend Fund | | Income Fund |
| Dividends Received Deduction | | 100% | | 100% | | 100% |
The Funds designate the following amounts as long-term capital gains distributions. The amounts designated may not agree with long-term capital gains in the tax character of distribution table due to utilization of earnings and profits distributed to shareholders on redemption of shares.
| | | Large Cap | | | Small Cap | | | Multi-Asset | |
| | | Dividend Fund | | | Dividend Fund | | | Income Fund | |
| Long-Term Capital Gains Distributions | | $ | 949,653 | | | $ | 7,809,415 | | | $ | 1,604,465 | |
| Trustees and Officers (Unaudited) |
GENERAL QUALIFICATIONS. The Board supervises the business activities of the Trust. Each Trustee serves as a trustee until termination of the Trust unless the Trustee dies, resigns, retires, or is removed. The Chairman of the Board and more than 75% of the Trustees are “Independent Trustees”, which means that they are not “interested persons” (as defined in the 1940 Act) of the Trust or any adviser, sub-adviser or distributor of the Trust.
The following table provides information regarding the Independent Trustees.
Name, Address*, (Year of Birth),
Position with Trust**,
Term of Position with Trust | | Principal Occupation During Past 5 Years and Other
Directorships |
Daniel J. Condon(1950)
Chairman, May 2022 to present; Chairman of the Audit Committee; Chairman of the Governance & Nominating Committee, May 2020 to May 2022; Independent Trustee, December 2002 to present | | Current: Retired (2017 – present); Trustee, Peak Income Plus Fund (2022 – February 2023). |
Kenneth G.Y. Grant(1949)
Chairman of the Governance & Nominating Committee, May 2022 to present; Chairman, January 2017 to May 2022; Independent Trustee, May 2008 to present | | Current: Director, Standpoint Multi-Asset (Cayman) Fund, Ltd. (2019 – present); Director, Advisors Charitable Gift Fund (2020 – present), a Donor Advised Fund; Trustee, Peak Income Plus Fund (2022 – present). Previous: EVP, Benefit Plans Administrative Services, Inc., provider of retirement benefit plans administration (2019 – 2020); Director, Northeast Retirement Services (NRS) LLC, a transfer agent and fund administrator; and Director, Global Trust Company (GTC), a non-depository trust company sponsoring private investment products (2003 – 2019); EVP, NRS (2003 – 2019); GTC, EVP (2008 – 2019); EVP, Savings Banks Retirement Association (2003 – 2019), provider of qualified retirement benefit plans. |
Ronald C. Tritschler(1952)
Chairman of the Audit Committee, May 2022 to present; Independent Trustee, January 2007 to present; Interested Trustee, December 2002 to December 2006 | | Current: Chief Executive Officer, Director and Legal Counsel of The Webb Companies, a national real estate company, (2001– present); Director, Standpoint Multi-Asset (Cayman) Fund, Ltd. (2020 – present); Director of First State Bank of the Southeast (2000 – present);Trustee, Peak Income Plus Fund (2022 – February 2023). |
Catharine B. McGauley(1977)
Independent Trustee, September 2022 to present | | Current: Lead Portfolio Manager of Atlantic Charter Insurance, a workers’ compensation insurer, (2010 – present); Investment Advisor for a Family Office (2015 – present); Senior Analyst/Advisor for a Boston real estate company and related family (2010 – present); Trustee, Peak Income Plus Fund (2022 – February 2023). |
Freddie Jacobs, Jr.(1970)
Independent Trustee, September 2022 to present | | Current: Chief Operating Officer and Chief Risk Officer Northeast Retirement Services LLC (NRS), and its subsidiary, Global Trust Company (GTC). NRS is a transfer agent and fund administrator, GTC is a non-depository trust company sponsoring private investment products (2021 – present); Trustee of Buckingham Browne & Nichols (BBN) (2018 – present); Member of the Finance Committee, BBN (2017 – present); Chairman Board of Directors of CrispusAttucks Fund (2020 – present); Board Member of Camp Harbor View (2020 – present); Trustee, Peak Income Plus Fund (2022 – February 2023). Previous: SVP, Senior Risk Officer NRS (2013 – 2021). |
| * | The address for each Trustee is 225 Pictoria Drive, Suite 450, Cincinnati, Ohio 45246. |
| ** | As of the date of this report, the Trust consists of 31 series. |
| Trustees and Officers (Unaudited) (continued) |
The following table provides information regarding the Interested Trustees and Officers of the Trust.
Name, Address*, (Year of Birth),
Position with Trust,
Term of Position with Trust | | Principal Occupation During Past 5 Yearsand Other
Directorships |
David R. Carson(1958)
Interested Trustee, August 2020 to present; President, January 2016 to August 2021 | | Current: Senior Vice President Client Strategies of UltimusFund Solutions, LLC, since 2013; Interested Trustee of UltimusManagers Trust, since 2020; Interested Trustee, Peak Income Plus Fund (2022 – present); Interested Trustee, Mammoth Institutional Credit Access Fund (2022 – present); Interested Trustee, Mammoth Institutional Equity Access Fund (2022 – present). |
Martin R. Dean(1963)
President, August 2021 to present; Vice President, November 2020 to August 2021; Chief Compliance Officer, April 2021 to August 2021; Assistant Chief Compliance Officer, January 2016 to April 2021 | | Current: President, Northern Lights Compliance Services (2023 – present); Senior Vice President, Head of Fund Compliance of UltimusFund Solutions, LLC (January 2016 – January 2023). |
Zachary P. Richmond(1980)
Treasurer and Chief Financial Officer, November 2014 to present | | Current: Vice President, Director of Financial Administration for UltimusFund Solutions, LLC, since 2015. |
GwenethK. Gosselink(1955)
Chief Compliance Officer, August 2021 to present | | Current: Assistant Vice President, Senior Compliance Officer of UltimusFund Solutions, LLC, since 2019. Previous: Chief Operating Officer & CCO at Miles Capital, Inc. (2013 – 2019). |
Elisabeth Dahl(1962)
Secretary, May 2017 to present; Assistant Secretary, March 2016 to May 2017 | | Current:Attorney, UltimusFund Solutions, LLC since March 2016. |
Stephen Preston(1966)
AML Compliance Officer, May 2017 to present | | Current: Vice President and Chief Compliance Officer, UltimusFund Solutions, LLC and UltimusFund Distributors, LLC, since 2011. |
Lynn E. Wood(1946)
Assistant Chief Compliance Officer, April 2021 to present; Chief Compliance Officer, October 2004 to April 2021 | | Current: Managing Member, Buttonwood Compliance Partners, LLC, since 2013. |
| * | The address for each Officer is 225 Pictoria Drive, Suite 450, Cincinnati, Ohio 45246. |
Other Information (Unaudited) |
The Funds’ Statement of Additional Information (“SAI”) includes additional information about the trustees and is available without charge, upon request. You may call toll-free at (800) 431-1716 to request a copy of the SAI or to make shareholder inquiries.
| Investment Advisory Agreement Approval (Unaudited) |
The Crawford Large Cap Dividend Fund (“Large Cap Fund”), the Crawford Small Cap Dividend Fund (“Small Cap Fund”), and the Crawford Multi-Asset Income Fund (“Multi-Asset Fund”) (together, the “Funds” and each, a “Fund”) are series of Unified Series Trust (the “Trust”). The Trust’s Board of Trustees (the “Board” or “Trustees”) oversees the management of the Funds and, as required by law, has considered the approval of continuance of the Funds’ management agreements with their investment adviser, Crawford Investment Counsel, Inc. (“Crawford”).
The Board requested and evaluated all information that the Trustees deemed reasonably necessary under the circumstances in connection with the approval of the continuance of the management agreements.
The Trustees held a teleconference to review and discuss materials compiled by Ultimus Fund Solutions, LLC, the Trust’s administrator, with regard to the management agreements between the Trust and Crawford. At the Trustees’ quarterly meeting held in August 2022, the Board interviewed certain executives of Crawford, including Crawford’s Chief Compliance Officer, and its Managing Director of Equity Investments, and its Chief Operating Officer. After discussion, the Trustees, including the Trustees who are not “interested persons” (as that term is defined in the Investment Company Act of 1940) of the Trust or Crawford (the “Independent Trustees”), approved the continuance of the management agreements between the Trust and Crawford for an additional year. The Trustees’ approved continuance of the Funds’ management agreements based on a consideration of all the information provided to the Trustees, and not as the result of any single factor. Some of the factors that figured particularly in the Trustees’ deliberations are described below, although individual Trustees may have evaluated this information differently, ascribing different weights to various factors.
(i) The Nature, Extent, and Quality of Services. The Trustees reviewed and considered information regarding the nature, extent, and quality of services that Crawford provides to the Funds, which include, but are not limited to, providing a continuous investment program for the Funds, adhering to the Funds’ investment restrictions, complying with the Trust’s policies and procedures, and voting proxies on behalf of the Funds. The Trustees considered the qualifications and experience of Crawford’s portfolio managers who are responsible for the day-to-day management of the Funds’ portfolios, as well as the qualifications and experience of the other individuals at Crawford who provide services to the Funds. The Trustees concluded that they were satisfied with the nature, extent, and quality of investment management services provided by Crawford to the Funds.
(ii) Fund Performance. The Trustees next reviewed and discussed the Funds’ performance for periods ended June 30, 2022. The Trustees discussed each Fund’s performance with management and concluded it was satisfied with the Funds’ performance and Crawford’s discussion and considerations related to any underperformance.
The Trustees observed that the Large Cap Fund Institutional Class had underperformed its benchmark, the Russell 1000 Value Index, for the one-year and since inception periods but outperformed for the three- and five-year periods. They noted that the Fund had underperformed the average return of its Morningstar Large Blend Category for the three-year, and five-year and since inception periods but had outperformed the average return of the category for the one-year period. The Trustees noted that the Large Cap Fund slightly outperformed a composite of other accounts managed by Crawford using a substantially similar strategy for the three-, five- and ten-year periods but that it slightly
| Investment Advisory Agreement Approval (Unaudited) (continued) |
underperformed the composite for the one-year period. The Board noted that the Large Cap Fund underperformed its peer group across all periods. The Board recalled that Crawford attributed recent underperformance to a lack of exposure to the energy sector, which significantly outperformed the broader markets.
The Trustees noted that the Small Cap Fund had outperformed its benchmark, the Russell 2000 Index, for the one-, three- and five-year and since inception periods. The Trustees noted that the Small Cap Fund had underperformed the average return of its Morningstar Small Blend Category for the three-year period but had outperformed for the one- and five-year and since inception periods. The Trustees acknowledged that the Small Cap Fund outperformed its peer group for the one-year and since inception periods but underperformed over the three- and five-year periods. The Trustees observed that the Small Cap Fund slightly underperformed a composite of other accounts managed by Crawford using a substantially similar strategy for the one-, three- and five-year and since inception periods. The Board recalled that Crawford attributed the Small Cap Fund’s performance to investment selection and the performance of certain sectors.
The Trustees observed that the Multi-Asset Fund had outperformed its index, the NASDAQ U.S. Multi-Asset Diversified Income Index, for the one- and three-year and since inception periods. The Trustees noted that the Multi-Asset Fund had outperformed the average return of its Morningstar Allocation 50%-70% Equity Category and peer group for the one-year period but underperformed for the three-year and since inception periods. The Board acknowledged Crawford’s explanation that the peer group and Morningstar category provided lower levels of income and allocations to alternative sources of income than the Multi-Asset Fund and as a result its benchmark was a more apt comparison for relative performance. The Trustees observed that the Multi-Asset Fund slightly underperformed a composite of other accounts managed by Crawford using a substantially similar strategy for the one- and three-year and since inception periods.
The Trustees noted Crawford’s discussion of how its Funds’ portfolios differ from the typical portfolios in the Funds’ comparison groups and considered the impact of the Morningstar categories on relative performance, given attributes of the other funds in the respective categories. It was the consensus of the Trustees that it was reasonable to conclude that Crawford has the ability to manage the Funds successfully from a performance standpoint.
(iii) Fee Rate and Profitability. With respect to each Fund, the Trustees reviewed a fee and expense comparison for funds with a similar strategy. The Trustees observed that the management fee for the Large Cap Fund was lower than the averages and the medians of the funds in its peer group and the Morningstar Large Blend Category and that net expenses were higher than the averages and medians. The Trustees observed that the Large Cap Fund’s management fee was below the fee charged for by Crawford for similarly managed accounts. The Trustees observed that the management fee and net expenses for the Small Cap Fund were higher than the average and the median of funds in the Morningstar Small Blend Category. The Trustees acknowledged that the Small Cap Fund’s management fee was higher than its peer group median and average, and that its net expense ratio was equal to its peer group median while higher than its peer group average. The Trustees observed that both the management fee and the net expenses for the Multi-Asset Fund were higher than the average and median of funds in the Morningstar Allocation 50%-70% Equity Category. The Trustees further observed that the Multi-Asset Fund’s net expense ratio was equal to its peer group median and lower than its peer group average. The Trustees commented that the
| Investment Advisory Agreement Approval (Unaudited) (continued) |
Multi-Asset Fund’s management fee and expenses were on par with the fee and expenses charged by Crawford for its similarly managed accounts. The Board considered Crawford’s remarks that its fees and expenses were attributable to the nuances and uniqueness of the Crawford Funds strategies and resources involved in executing these strategies.
The Trustees also considered a profitability analysis prepared by Crawford for its management of the Funds, which indicated that Crawford is not earning a profit as a result of managing the Large Cap Fund or the Multi-Asset Fund and is earning a small profit as a result of managing the Small Cap Fund.
The Trustees also recalled their review of the Large Cap Fund’s 12b-1 Plan at this meeting and considered other potential benefits that Crawford may receive in connection with its management of the Fund, including third-party research obtained by soft dollars, which may be used to benefit the Fund along with Crawford’s other advisory clients. After considering the above information, the Trustees concluded that the current management fee for each Fund represents reasonable compensation in light of the nature and quality of Crawford’s services to the Fund, the fees paid by competitive mutual funds, and the profitability of Crawford’s services to such Fund.
(iv) Economies of Scale. In determining the reasonableness of the management fees, the Trustees also considered the extent to which Crawford will realize economies of scale as a Fund grows larger. The Trustees determined that, in light of the size of the Funds and the fact that Crawford is not yet profitable in managing the Large Cap Fund or the Multi-Asset Fund and is only slightly profitable in managing the Small Cap Fund, Crawford is not realizing benefits from economies of scale in managing any Fund and therefore it is premature to reduce the management fee or introduce breakpoints at this time.
Rev: January 2020
| FACTS | WHAT DO THE CRAWFORD FUNDS (the “FUNDS”) DO WITH YOUR PERSONAL INFORMATION? |
| Why? | Financial companies choose how they share your personal information. Federal law gives consumers the right to limit some but not all sharing. Federal law also requires us to tell you how we collect, share, and protect your personal information. Please read this notice carefully to understand what we do. |
| What? | The types of personal information we collect and share depend on the product or service you have with us. This information can include: ■ Social Security number ■ account balances and account transactions ■ transaction or loss history and purchase history ■ checking account information and wire transfer instructions When you are no longer our customer, we continue to share your information as described in this notice. |
| How? | All financial companies need to share customers’ personal information to run their everyday business. In the section below, we list the reasons financial companies can share their customers’ personal information; the reasons the Funds choose to share; and whether you can limit this sharing. |
| Reasons we can share your personal information | Do the Funds share? |
For our everyday business purposes— such as to process your transactions, maintain your account(s), respond to court orders and legal investigations, or report to credit bureaus | Yes |
For our marketing purposes— to offer our products and services to you | No |
For joint marketing with other financial companies | No |
For our affiliates’ everyday business purposes— information about your transactions and experiences | No |
For our affiliates’ everyday business purposes— information about your creditworthiness | No |
For nonaffiliates to market to you | No |
| Questions? | Call (800) 431-1716 |
| Who we are |
Who is providing this notice? | Crawford Funds |
| | Ultimus Fund Distributors, LLC (Distributor) |
| | Ultimus Fund Solutions, LLC (Administrator) |
| What we do |
How do the Funds protect my personal information? | To protect your personal information from unauthorized access and use, we use security measures that comply with federal law. These measures include computer safeguards and secured files and buildings. Our service providers are held accountable for adhering to strict policies and procedures to prevent any misuse of your nonpublic personal information. |
How do the Funds collect my personal information? | We collect your personal information, for example, when you ■ open an account or deposit money ■ buy securities from us or sell securities to us ■ make deposits or withdrawals from your account ■ give us your account information ■ make a wire transfer ■ tell us who receives the money ■ tell us where to send the money ■ show your government-issued ID ■ show your driver’s license |
Why can’t I limit all sharing? | Federal law gives you the right to limit only ■ sharing for affiliates’ everyday business purposes — information about your creditworthiness ■ affiliates from using your information to market to you ■ sharing for nonaffiliates to market to you State laws and individual companies may give you additional rights to limit sharing. |
| Definitions |
| Affiliates | Companies related by common ownership or control. They can be financial and nonfinancial companies. ■ Crawford Investment Counsel, Inc., the investment adviser to the Funds, could be deemed to be an affiliate. |
| Nonaffiliates | Companies not related by common ownership or control. They can be financial and nonfinancial companies. ■ The Crawford Funds do not share your personal information with nonaffiliates so they can market to you |
| Joint marketing | A formal agreement between nonaffiliated financial companies that together market financial products or services to you. ■ The Crawford Funds do not jointly market. |
PROXY VOTING
A description of the policies and procedures that each Fund uses to determine how to vote proxies relating to portfolio securities and information regarding how each Fund voted those proxies during the most recent twelve month period ended June 30, are available (1) without charge upon request by calling the Funds at (800) 431-1716 and (2) in Fund documents filed with the SEC on the SEC’s website at www.sec.gov.
TRUSTEES
Daniel J. Condon, Chairman
David R. Carson
Kenneth G.Y. Grant
Freddie Jacobs, Jr.
Catharine B. McGauley
Ronald C. Tritschler | INDEPENDENT REGISTERED
PUBLIC ACCOUNTING FIRM
Cohen & Company, Ltd.
151 North Franklin Street, Suite 575
Chicago, IL 60606 |
| | |
| | |
OFFICERS
Martin R. Dean, President
Gweneth K. Gosselink, Chief Compliance Officer
Zachary P. Richmond, Treasurer and Chief Financial Officer
Lynn E. Wood, Assistant Chief
Compliance Officer | LEGAL COUNSEL
Thompson Hine LLP
312 Walnut Street, 20th Floor
Cincinnati, OH 45202 |
| | |
| | |
INVESTMENT ADVISER
Crawford Investment Counsel, Inc.
600 Galleria Parkway SE
Suite 1650
Atlanta, GA 30339 | CUSTODIAN
Huntington National Bank
41 South High Street
Columbus, OH 43215 |
| | |
| | |
DISTRIBUTOR
Ultimus Fund Distributors, LLC
225 Pictoria Drive, Suite 450
Cincinnati, OH 45246 | ADMINISTRATOR, TRANSFER AGENT
AND FUND ACCOUNTANT
Ultimus Fund Solutions, LLC
225 Pictoria Drive, Suite 450
Cincinnati, OH 45246 |
| | |
This report is intended only for the information of shareholders or those who have received the Funds’ prospectus which contains information about the Funds’ management fee and expenses. Please read the prospectus carefully before investing.
Distributed by Ultimus Fund Distributors, LLC
Member FINRA/SIPC
CRAWFORD-AR-22
Item 2. Code of Ethics.
As of the end of the period covered by this report, the registrant has adopted a code of ethics that applies to the registrant’s principal executive officer, principal financial officer, principal accounting officer or controller, or persons performing similar functions, regardless of whether these individuals are employed by the registrant or a third party. Pursuant to Item 12(a)(1), a copy of registrant’s code of ethics is filed as an exhibit to this Form N-CSR. During the period covered by this report, the code of ethics has not been amended, and the registrant has not granted any waivers, including implicit waivers, from the provisions of the code of ethics.
Item 3. Audit Committee Financial Expert.
(a)(1) The registrant’s Board of Trustees has determined that the registrant has at least one audit committee financial expert serving on its audit committee.
(a)(2) The audit committee financial expert is Freddie Jacobs, Jr., who is “independent” for purposes of this Item 3 of Form N-CSR.
Item 4. Principal Accountant Fees and Services.
Crawford Funds: FY 2022 $46,500
FY 2021 $43,900
Registrant
Crawford Funds: FY 2022 $0
FY 2021 $0
Registrant
Crawford Funds: FY 2022 $9,900
FY 2021 $9,900
Nature of the fees: Preparation of the 1120 RIC and Excise review
Registrant
Crawford Funds: FY 2022 $0
FY 2021 $0
| (e) | (1) Audit Committee’s Pre-Approval Policies |
The Audit Committee Charter requires the Audit Committee to be responsible for the selection, retention or termination of auditors and, in connection therewith, to (i) evaluate the proposed fees and other compensation, if any, to be paid to the auditors, (ii) evaluate the independence of the auditors, (iii) pre-approve all audit services and, when
appropriate, any non-audit services provided by the independent auditors to the Trust, (iv) pre-approve, when appropriate, any non-audit services provided by the independent auditors to the Trust's investment adviser, or any entity controlling, controlled by, or under common control with the investment adviser and that provides ongoing services to the Trust if the engagement relates directly to the operations and financial reporting of the Trust, and (v) receive the auditors’ specific representations as to their independence;
| (2) | None of the services described in paragraph (b) through (d) of this Item were approved by the audit committee pursuant to paragraph (c)(7)(i)(C) of Rule 2-01 of Regulation S-X. |
(f) During audit of registrant's financial statements for the most recent fiscal year, less than 50 percent of the hours expended on the principal accountant's engagement were attributed to work performed by persons other than the principal accountant's full-time, permanent employees.
(g) The aggregate non-audit fees billed by the registrant's accountant for services rendered to the registrant, and rendered to the registrant's investment adviser (not including any sub-adviser whose role is primarily portfolio management and is subcontracted with or overseen by another investment adviser), and any entity controlling, controlled by, or under common control with the adviser that provides ongoing services to the registrant:
Registrant Adviser
FY 2022 $ 0 $ 0
FY 2021 $ 0 $ 0
(h) The registrant’s audit committee has considered that the provision of non-audit services that were rendered to the registrant’s investment adviser and any entity controlling, controlled by, or under common control with the investment adviser that provides ongoing services to the registrant that were not pre-approved pursuant to paragraph (c)(7)(ii) of Rule 2-01 of Regulation S-X is compatible with maintaining the principal accountant’s independence.
Item 5. Audit Committee of Listed Companies. NOT APPLICABLE – applies to listed companies only
Item 6. Schedule of Investments. Schedule filed with Item 1.
Item 7. Disclosure of Proxy Voting Policies and Procedures for Closed-End Management Investment Companies. NOT APPLICABLE – applies to closed-end funds only
Item 8. Portfolio Managers of Closed-End Investment Companies. NOT APPLICABLE – applies to closed-end funds only
Item 9. Purchases of Equity Securities by Closed-End Management Investment Company and Affiliated Purchasers. NOT APPLICABLE – applies to closed-end funds only
Item 10. Submission of Matters to a Vote of Security Holders.
The registrant has not adopted procedures by which shareholders may recommend nominees to the registrant’s board of trustees.
Item 11. Controls and Procedures.
(a) Based on their evaluation of the registrant’s disclosure controls and procedures (as defined in Rule 30a-3(c) under the Investment Company Act of 1940, as amended (the “Act”)) as of a date within 90 days of the filing date of this report, the registrant’s principal executive officer and principal financial officer have concluded that such disclosure controls and procedures are reasonably designed and are operating effectively to ensure that material information relating to the registrant is made known to them by others within those entities, particularly during the period in which this report is being prepared, and
that the information required in filings on Form N-CSR is recorded, processed, summarized, and reported on a timely basis.
(b) There were no significant changes in the registrant’s internal control over financial reporting that occurred during the period covered by this report that have materially affected, or are reasonably likely to materially affect, the registrant’s internal control over financial reporting.
Item 12. Disclosure of Securities Lending Activities for Closed-End Investment Companies.
Not Applicable.
Item 13. Exhibits.
(a)(1) Not Applicable – filed with annual report
(a)(2) Certifications pursuant to Rule 30a-2(a) are attached hereto.
| (2) | Change in the registrant’s independent public accountants: Not applicable |
(b) Certifications pursuant to Rule 30a-2(b) are furnished herewith.
SIGNATURES
Pursuant to the requirements of the Securities Exchange Act of 1934 and the Investment Company Act of 1940, the registrant has duly caused this report to be signed on its behalf by the undersigned, thereunto duly authorized.
(Registrant) Unified Series Trust
By
| /s/ Martin R. Dean |
| Martin R. Dean, President |
| |
Pursuant to the requirements of the Securities Exchange Act of 1934 and the Investment Company Act of 1940, this report has been signed below by the following persons on behalf of the registrant and in the capacities and on the dates indicated.
By
| /s/ Martin R. Dean |
| Martin R. Dean, President |
| |
By
/s/ Zachary P. Richmond
| Zachary P. Richmond, Treasurer |
| |