united states
securities and exchange commission
washington, d.c. 20549
form n-csr
certified shareholder report of registered management
investment companies
Investment Company Act file number 811-21237
Unified Series Trust
(Exact name of registrant as specified in charter)
225 Pictoria Drive, Suite 450
Cincinnati, OH 45246
(Address of principal executive offices) (Zip code)
Zachary P. Richmond
Ultimus Fund Solutions, LLC
225 Pictoria Drive. Suite 450
Cincinnati, OH 45246
(Name and address of agent for service)
Registrant's telephone number, including area code: 513-587-3400
Date of fiscal year end: 03/31
Date of reporting period: 03/31/23
Form N-CSR is to be used by management investment companies to file reports with the Commission not later than 10 days after the transmission to stockholders of any report that is required to be transmitted to stockholders under Rule 30e-1 under the Investment Company Act of 1940 (17 CFR 270.30e-1). The Commission may use the information provided on Form N-CSR in its regulatory, disclosure review, inspection and policymaking roles.
A registrant is required to disclose the information specified by Form N-CSR, and the Commission will make this information public. A registrant is not required to respond to the collection of information contained in Form N-CSR unless the Form displays a currently valid Office of Management and Budget ("OMB") control number. Please direct comments concerning the accuracy of the information collection burden estimate and any suggestions for reducing the burden to Secretary, Securities and Exchange Commission, 450 Fifth Street, NW, Washington, DC 20549-0609. The OMB has reviewed this collection of information under the clearance requirements of 44 U.S.C. § 3507.
Item 1. Reports to Stockholders.

Dean Small Cap Value Fund
Dean Mid Cap Value Fund
Dean Equity Income Fund
Annual Report
March 31, 2023
| Dean Small Cap Value Fund |
| Management Discussion of Fund Performance (Unaudited) |
| March 31, 2023 |
Management’s Discussion & Analysis
The Dean Small Cap Value Fund (the “Fund”) returned +4.89% net of fees for the twelve months ended March 31, 2023, compared with a -12.96% return for the benchmark Russell 2000 Value Index and a -11.61% return for the broader Russell 2000 Index.
Macro Factors Impacting Performance
Macro factors were a strong tailwind for the portfolio in the past fiscal year. The portfolio benefited from holding stocks that are less volatile than the benchmark (a proxy for quality) and from holding stocks that have lower valuations than the benchmark (value stocks). The rising cost of capital is beginning to have an impact on the market environment leading to more emphasis being placed on valuation and quality. This is causing a shift in investor appetite towards higher-quality, value-oriented stocks which represent the two most important tenets to Dean Capital Management, LLC’s investment philosophy: “Value Driven, Quality Focused.”
Sector Performance (Best/Worst Relative to Benchmark)
The best performing sector relative to the benchmark for the twelve-month period was Industrials. The outperformance resulted from better than benchmark stock selection, especially in the Transportation industry. The portfolio held two conservatively financed and conservatively managed trucking companies that capitalized on late economic cycle dynamics where pricing and volumes continued to be strong. This overweight relative to the benchmark in trucking companies benefited the portfolio this past year.
The second best performing sector relative to the benchmark was Consumer Staples. Given the defensive nature of Consumer Staples companies, the sector outperformed the Russell 2000 Value Index during the period where the benchmark had a -13% total return. Thus, the portfolio benefited from having a larger weight than the benchmark throughout the past year. The portfolio also had better than benchmark stock selection, led by food companies that produced foods such as nuts, eggs, sauces, breads, bananas, pineapples, and sweet treats. As the economy slows and faces a possible recession, the recession resistant end markets of the food producers supported their stock prices.
The worst performing sector relative to the benchmark for the last twelve months was Energy. The underperformance was due to the underweight positioning versus the benchmark in a sector that outperformed in the period. The portfolio’s stock selection was better than the benchmark, but good stock selection could not make up for the underweight stance in the sector. The portfolio is down to one Energy holding, and it is less tied to
| Dean Small Cap Value Fund |
| Management Discussion of Fund Performance (Unaudited) (continued) |
| March 31, 2023 |
the price of oil compared to the benchmark’s holdings, which makes it less volatile compared to the benchmark’s holdings as well. We estimate that most energy companies are currently earning well above their full cycle normalized earning power, which causes them to appear to have low valuations based on historical earnings, but this exposes them to severe earnings revision risk if a hard economic downturn materializes, which would cause demand for oil to fall.
The second worst performing sector relative to the benchmark was Materials. The portfolio actually outperformed the benchmark in the Materials sector this past year; however, the outperformance was less than that of the other sectors, thus landing it as the second worst performing sector slot. Both sector allocation and stock selection were better than the benchmark.
Individual Securities Performance (Best/Worst Absolute Contributors)
The largest contributing company in the fiscal year was Murphy USA (MUSA). MUSA is a gas station operator with many locations located adjacent to Wal-Mart stores. MUSA has benefitted from the recent volatility in gasoline prices as fuel margins have expanded. MUSA is using its robust free cash flow to aggressively buy back its own shares. We sold the position out of the portfolio on the strong stock performance as the stock became expensive relative to our normalized earnings power estimate.
The second largest contributing stock was Tri Pointe Homes Inc. (TPH). TPH is a single-family homebuilder that operates in California, Arizona, Nevada, Colorado, Texas, Oregon, and Virginia. The homebuilding stocks were up late in the period as mortgage rates declined from recent high levels. This, combined with falling input costs from commodities, led to the rally. With a low-cost foothold in California and expansion plans in the Southeast, we believe that TPH is well positioned to continue growing and expanding margins. We took advantage of the rise in the stock price to trim the position; however, the portfolio continues to hold a position in TPH.
The largest detracting stock in the period was Stewart Information Services (STC). STC is a title insurer for the residential and commercial markets. With mortgage rates rising sharply early in the period, industries related to housing sold off on fears over demand destruction as affordability worsened. Given the difficult environment for home affordability, coupled with most homeowners holding mortgages that have rates materially below current levels, housing activity might be constrained for a while. STC’s earnings depend on housing activity remaining high and with it currently earning above our estimate of normalized
| Dean Small Cap Value Fund |
| Management Discussion of Fund Performance (Unaudited) (continued) |
| March 31, 2023 |
earnings, we believe there is a risk of earnings coming down to below normalized levels over the next few quarters. Thus, we sold the STC holding out of the portfolio.
The second largest detracting stock was Washington Trust Bancorp (WASH). WASH offers banking and financial services primarily in Rhode Island, but also in Connecticut and Massachusetts. Steeped in history, the bank was founded in 1800 and was named after George Washington. Given the turmoil from the recent banking crisis, where multiple large banks failed in a short period of time, most small cap bank stock prices were under pressure. WASH scores satisfactorily on a composite of the hot button issues of the day: securities to assets ratio, commercial real estate and construction loans as a percentage of total loans, and the tangible common equity ratio. The portfolio continues to hold a position in WASH.
Current Positioning and Opportunities
The portfolio’s largest overweight sectors relative to the benchmark are currently in the Industrials and Consumer Staples sectors. The largest underweight sectors relative to the benchmark are currently in the Financials and Energy sectors. Throughout the fiscal year, the Industrials and Health Care sectors increased the most in weight, while the Financials and Consumer Staples sectors decreased the most in weight. As always, these relative weights are a residual of our bottom-up opportunities and not based on a top-down macro call on the market or economy.
We remain focused on the fundamentals of the companies we own, and the price we are paying for those fundamentals. We are confident that a steadfast application of our proven and disciplined process should produce favorable results over time.
Thank you for your continued confidence in Dean.
| Investment Results (Unaudited) |
Average Annual Total Returns(a) as of March 31, 2023
| | | One Year | | Five Year | | Ten Year |
| Dean Small Cap Value Fund | | 4.89% | | 7.43% | | 8.68% |
| Russell 2000 Value Index(b) | | (12.96)% | | 4.55% | | 7.22% |
| Russell 2000 Index(b) | | (11.61)% | | 4.71% | | 8.04% |
Total annual operating expenses, which include acquired fund fees and expenses of less than 0.005%, as disclosed in the Dean Small Cap Value Fund (the “Fund”) prospectus dated July 29, 2022, were 1.13% of the Fund’s average daily net assets. The Dean Investment Associates, LLC (the “Adviser”) has contractually agreed to waive its management fee and/or to reimburse certain Fund operating expenses through July 31, 2023, but only to the extent necessary so that total annual operating expenses (excluding portfolio transaction and other investment-related costs (including brokerage fees and commissions); taxes; borrowing costs (such as interest and dividend expenses on securities sold short); acquired fund fees and expenses; fees and expenses associated with investments in other collective investment vehicles or derivative instruments (including for example option and swap fees and expenses); any amounts payable pursuant to a distribution or service plan adopted in accordance with Rule 12b-1 under the Investment Company Act of 1940; expenses incurred in connection with any merger or reorganization; extraordinary expenses (such as litigation expenses, indemnification of Trust officers and Trustees and contractual indemnification of Fund service providers)) do not exceed 1.25% of the Fund’s average daily net assets. Each waiver/expense payment by the Adviser is subject to recoupment by the Adviser from the Fund in the three years following the date the particular waiver/expense payment occurred, but only if such recoupment can be achieved without exceeding the annual expense limitation in effect at the time of the waiver/ expense payment and any expense limitation in effect at the time of recoupment. This expense limitation agreement may not be terminated prior to July 31, 2023, except by the Board of Trustees upon sixty (60) days’ written notice to the Adviser. Additional information pertaining to the expense ratios as of March 31, 2023 can be found in the financial highlights.
The performance quoted represents past performance, which does not guarantee future results. The investment return and principal value of an investment will fluctuate so that an investor’s shares, when redeemed, may be worth more or less than their original cost. The returns shown do not reflect deduction of taxes that a shareholder would pay on Fund distributions or the redemption of Fund shares. Current performance may be lower or higher than the performance quoted. The Fund’s investment objective, risks, charges and expenses should be considered carefully before investing. Performance data current to the most recent month end may be obtained by calling (888) 899-8343.
(a) Return figures reflect any change in price per share and assume the reinvestment of all distributions.
(b) The Russell 2000 Index is an equity index that measures the performance of the 2,000 smallest companies in the Russell 3000 Index, which is made up of 3,000 of the biggest U.S. stocks. The Russell 2000 Value Index is an unmanaged index of common stock prices that measures the performance of those Russell 2000 companies with lower price-to-book ratios forecasted growth values. The indices are representative of a broader market and range of securities than are found in the Fund’s portfolio. An individual cannot invest directly in an index or the indices. However, an individual may be able to invest in exchange traded funds or other investment vehicles that attempt to track the performance of an index.
You should consider the Fund’s investment objective, risks, charges and expenses carefully before you invest. The Fund’s prospectus contains important information about the Fund’s investment objective, potential risks, management fees, charges and expenses, and other information and should be read carefully before investing. You may obtain a current copy of the Fund’s prospectus or performance data current to the most recent month end by calling (888) 899-8343.
| Investment Results (Unaudited) (continued) |
Comparison of the Change in Value of a $10,000 Investment in the Dean Small Cap Value Fund, the Russell 2000 Value Index and the Russell 2000 Index (Unaudited)
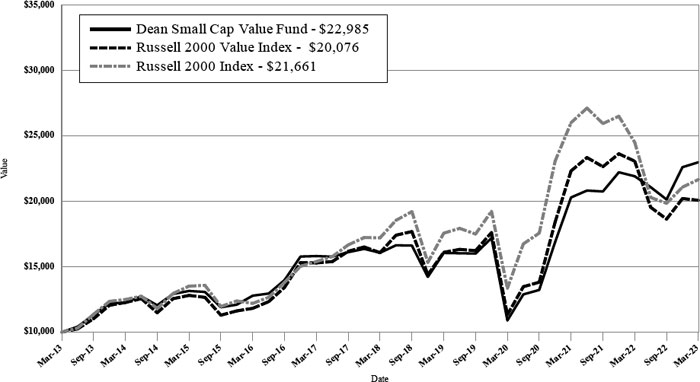
The graph shows the value of a hypothetical initial investment of $10,000 in the Fund, the Russell 2000 Value Index and the Russell 2000 Index on March 31, 2013 and held through March 31, 2023.
| (a) | Return figures reflect any change in price per share and assume the reinvestment of all distributions. |
The Russell 2000 Index is an equity index that measures the performance of the 2,000 smallest companies in the Russell 3000 Index, which is made up of 3,000 of the biggest U.S. stocks. The Russell 2000 Value Index is an unmanaged index of common stock prices that measures the performance of those Russell 2000 companies with lower price-to-book ratios forecasted growth values. The indices are representative of a broader market and range of securities than is found in the Fund’s portfolio. Individuals cannot invest directly in an index; however, an individual may invest in exchange traded funds or other investment vehicles that attempt to track the performance of a benchmark index. THE FUND’S RETURN REPRESENTS PAST PERFORMANCE AND DOES NOT GUARANTEE OR PREDICT FUTURE RESULTS. The returns shown do not reflect deduction of taxes that a shareholder would pay on Fund distributions or the redemption of Fund shares. Investment returns and principal values will fluctuate so that an investor’s shares, when redeemed, may be worth more or less than their original cost.
Current performance may be lower or higher than the performance data quoted. For more information on the Fund, and to obtain performance data current to the most recent month-end, or to request a prospectus, please call (888) 899-8343. You should carefully consider the investment objective, risks, charges and expenses of the Fund before investing. The Fund’s prospectus contains this and other information about the Fund and should be read carefully before investing.
The Fund is distributed by Ultimus Fund Distributors, LLC, Member FINRA/SIPC.
| Dean Mid Cap Value Fund |
| Management Discussion of Fund Performance (Unaudited) |
| March 31, 2023 |
Management’s Discussion & Analysis
The Dean Mid Cap Value Fund (the “Fund”) returned -.50% net of fees for the twelve months ended March 31, 2023, compared with a -9.22% return for the benchmark Russell Midcap Value Index and an -8.78% return for the broader Russell Midcap Index.
Macro Factors Impacting Performance
Macro style factors were a significant benefit to the Fund in the fiscal year. In a period of uncertainty as monetary policy shifted to a hawkish stance to slow the economy, quality characteristics tended to outperform. The portfolio benefitted from holding stocks with less volatility and lower financial leverage and also benefitted from being overweight stocks with higher profitability than the benchmark. Quality stocks tend to be less volatile, have lower financial leverage and generate higher returns on capital than stocks considered low quality. In addition, the portfolio benefited from stocks with lower valuations outperforming in the period. The rising cost of capital is beginning to have an impact on the market environment leading to more emphasis being placed on valuation and quality. This is causing a shift in investor appetite towards higher-quality, value-oriented stocks which represent the two most important tenets to Dean Capital Management, LLC’s investment philosophy: “Value Driven, Quality Focused.”
Sector Performance (Best/Worst Relative to Benchmark)
The best performing sector relative to the benchmark for the twelve-month period was Consumer Discretionary. Sector allocation was positive as the Fund was overweight an outperforming sector. Stock selection was the primary driver of outperformance with each of the seven names owned throughout the year positively adding to performance. Retail holdings added to performance through auto parts retailers AutoZone (AZO) and Genuine Parts (GPC) benefitting from strong sales as miles driven and age of cars increase and beauty and personal care retailer Ulta Beauty (ULTA), which benefitted from strong category sales and continued market share gains. Homebuilder PulteGroup (PHM) added to performance benefitting from a moderation in mortgage rates later in the year allowing home closings and margins to be better than initially feared. Tier 1 auto supplier BorgWarner (BWA) had a strong year as auto production improved after seeing significant supply chain issues and showed significant progress in their electric vehicle strategy. And finally, shoe maker Skechers (SKX) continued to have strong sell through with product focused on comfort and casual offerings.
The second best performing sector relative to the benchmark was Industrials. The Fund benefitted from being overweight the Industrials sector, which was the top performing sector in the Russell Midcap Value Index. The sector benefitted from broad late cycle industrial
| Dean Mid Cap Value Fund |
| Management Discussion of Fund Performance (Unaudited) (continued) |
| March 31, 2023 |
activity and channel filling to replenish supply chains impacted during COVID-19. For the Fund, the primary driver of outperformance relative to the benchmark was stock selection. While the stocks that outperformed had varying end markets, the key theme was strong demand in niche product lines. Hubbell (HUBB) outperformed as demand from utilities and telecommunications companies was strong, nVent (NVT) benefitted from strength in electrification and automation markets, FTI Consulting (FCN) benefitted from increased demand for advice related to complex capital structures and Curtis-Wright (CW) saw increased demand in its defense products as conflicts worldwide escalated.
The worst performing sector relative to the benchmark for the last twelve months was Energy. Sector allocation was a headwind as the Fund was underweight the Energy sector, which outperformed the Russell Midcap Value Index. Permian Basin exploration and production company Pioneer Natural Resources (PXD) was down -8.8% in the year as declining oil well productivity cast doubt over the company’s growth and capital plans. Oilfield services provider Baker Hughes (BKR) was down -18.8% for the year. Baker Hughes faced headwinds with poor execution within its supply chain, leading to curtailed sales and profitability. The company was also negatively impacted by currency headwinds and significant costs to exit its Russian operations. The company embarked on a reorganization plan late in the year that should reduce costs and better align the sales channels with end markets.
The second worst performing sector relative to the benchmark was Utilities. The Fund benefited by being overweight an outperforming sector. However, stock selection was subpar relative to the benchmark with Michigan based utility CMS Energy (CMS) down -9.6% and Missouri based Ameren (AEE) down -5.4%. Due to capital needs to fund future growth capital spending, the rapid rise of interest rates in the year was a headwind to the Fund’s utility holdings. While regulated utilities, in theory, are allowed to recover invested capital through increased rates, there is a disconnect in timing between capital needs and the period in which rate cases are approved. This often creates short-term pressure on earnings and is magnified in a rising rate environment.
Individual Securities Performance (Best/Worst Absolute Contributors)
Steel Dynamics (STLD), up 37.9% for the year, was the largest contributing stock. The company is the second largest electric arc furnace (EAF) steel producer in the U.S. Key end markets include construction, manufacturing, industrial equipment, and automotive, focusing on specialty value-added production. While steel commodity prices declined throughout the year, the company benefitted from strong end market demand and an advantaged cost position relative to peers. In addition, the company has invested and grown the steel fabrication business, which has seen strong demand in value added finished product, which carries higher gross margins. Construction demand continues to be strong
| Dean Mid Cap Value Fund |
| Management Discussion of Fund Performance (Unaudited) (continued) |
| March 31, 2023 |
supporting a significant backlog for 2023. The Fund has reduced the size of its holding in Steel Dynamics as the stock has outperformed, but the Fund continues to hold a position in the stock.
The second largest contributing stock this quarter was Hubbell (HUBB), up 35.0%. Hubbell is an electric equipment manufacturer with a 50/50 split between utility and electrical end markets. The company has exposure to power distribution and transmission, non-residential construction, and general industrial end markets. The company has less than 10% exposure to residential housing, which has been beneficial as new housing slows due to higher interest rates. North America accounts for 92% of sales. The company had several quarters of exceeding expectations and raising guidance on the back of strong demand from industrial and utility customers. Utilities continue to invest heavily in transmission and distribution while telecom invests heavily in 5G and fiber rollouts. End market demand remains strong on the back of secular investments in infrastructure, and the company should see cost pressures decline as metal prices moderate. The Fund continues to hold Hubbell.
The worst contributing stock for the year was Essex Property Trust (ESS), down -37.1% for the period held. Essex is an apartment focused REIT with property concentrated on the West coast. Forty-two percent of properties are in Southern CA near Los Angeles and San Diego, 42% of properties are in Northern CA near Santa Clara, Oakland, and San Francisco, and 16% are in Seattle. Residential apartment REITs have seen concerns rising as it relates to rent growth as the economy softens and new capacity is added to the market. With Essex’s portfolio focused near West coast technology centers, the stock has been hit harder than most as many tech companies have laid off employees or implemented hiring freezes. The concern is that a deep decline in tech employment may negatively impact rents to the tune of a 20% plus decline, similar to what was seen in the dot.com bust in 2000. While we do not expect a decline in rents of that magnitude, Essex has experienced moderate deceleration in rents. The stock was exited near the end of the Fund’s fiscal year on concerns of deteriorating fundamentals.
Crown Holdings (CCK) was the second largest detracting stock for the year, down -43.2% for the period held. Crown manufactures beverage cans, which account for 60% of revenue, of which metal cans account for 5%, transit packaging 20%, and other metal packaging accounting for the remaining revenue. The company missed its fiscal third quarter earnings expectations and guided fourth quarter earnings 40% lower than estimates. The company saw strong demand for beverage cans, but results were weaker than expected due to inflation, energy prices, rising interest rates, and currency headwinds. While many of the reasons for lower earnings appear to be macro, the company has consistently missed expectations and guided earnings lower over several quarters, all in a period of supposed strong demand.
| Dean Mid Cap Value Fund |
| Management Discussion of Fund Performance (Unaudited) (continued) |
| March 31, 2023 |
We exited the position in October due to the company’s poor operational execution as well as new industry capacity that is slated to come into production in 2023/24, both of which lowered our assumption of normalized earnings and thus, the stock’s fair value.
Current Positioning and Opportunities
At the end of the Fund’s fiscal year, the Fund’s largest overweight sectors relative to the benchmark were the Consumer Staples and Industrial sectors. The largest underweight sectors relative to the benchmark were the Information Technology and Financials sectors. Throughout the fiscal year, the Industrials and Communication Services sectors increased the most in weight, while the Financials and Energy sectors decreased the most in weight.
We remain focused on the fundamentals of the companies we own, and the price we are paying for those fundamentals. We are confident that a steadfast application of our proven and disciplined process should produce favorable results over time.
Thank you for your continued confidence in Dean.
| Investment Results (Unaudited) |
Average Annual Total Returns(a) as of March 31, 2023
| | | One Year | | Five Year | | Ten Year |
| Dean Mid Cap Value Fund | | (0.50)% | | 7.28% | | 9.08% |
| Russell Midcap Value Index(b) | | (9.22)% | | 6.54% | | 8.80% |
| Russell Midcap Index(b) | | (8.78)% | | 8.05% | | 10.05% |
The Total annual operating expenses, which included acquired fund fees and expenses of less than 0.005%, as disclosed in the Fund prospectus dated July 29, 2022, were 1.06% of the Fund’s average daily net assets (0.85% after fee waivers/expense reimbursements by Dean Investment Associates, LLC (the “Adviser”)). The Adviser has contractually agreed to waive its management fee and/or reimburse expenses so that total annual Fund operating expenses (excluding portfolio transaction and other investment-related costs (including brokerage fees and commissions); taxes; borrowing costs (such as interest and dividend expenses on securities sold short); acquired fund fees and expenses; fees and expenses associated with investments in other collective investment vehicles or derivative instruments (including for example option and swap fees and expenses); any amounts payable pursuant to a distribution or service plan adopted in accordance with Rule 12b-1 under the Investment Company Act of 1940; expenses incurred in connection with any merger or reorganization; extraordinary expenses (such as litigation expenses, indemnification of Trust officers and Trustees and contractual indemnification of Fund service providers)) do not exceed 0.85% of the Fund’s average daily net assets through July 31, 2023. Each waiver/expense payment by the Adviser is subject to recoupment by the Adviser from the Fund in the three years following the date the particular waiver/expense payment occurred, but only if such recoupment can be achieved without exceeding the annual expense limitation in effect at the time of the waiver/expense payment and any expense limitation in effect at the time of recoupment. This expense limitation agreement may not be terminated prior to July 31, 2023, except by the Board of Trustees upon sixty (60) days’ written notice to the Adviser. Additional information pertaining to the expense ratios as of March 31, 2023 can be found in the financial highlights.
The performance quoted represents past performance, which does not guarantee future results. The investment return and principal value of an investment will fluctuate so that an investor’s shares, when redeemed, may be worth more or less than their original cost. The returns shown do not reflect deduction of taxes that a shareholder would pay on Fund distributions or the redemption of Fund shares. Current performance may be lower or higher than the performance quoted. The Fund’s investment objective, risks, charges and expenses should be considered carefully before investing. Performance data current to the most recent month-end may be obtained by calling (888) 899-8343.
| (a) | Return figures reflect any change in price per share and assume the reinvestment of all distributions. The Fund’s returns reflect any fee reductions during the applicable periods. If such fee reductions had not occurred, the quoted performance would have been lower. |
| (b) | The Russell Midcap Index is a market capitalization weighted index representing the smallest 800 companies in the Russell 1000 Index. The Russell Midcap Value Index is an unmanaged index of common stock prices that measures the performance of those Russell Midcap companies with lower price-to-book ratios and lower forecasted growth values. The indices are representative of a broader market and range of securities than are found in the Fund’s portfolio. An individual cannot invest directly in an index. However, an individual may be able to invest in exchange traded funds or other investment vehicles that attempt to track the performance of an index. |
You should consider the Fund’s investment objective, risks, charges and expenses carefully before you invest. The Fund’s prospectus contains important information about the Fund’s investment objective, potential risks, management fees, charges and expenses, and other information and should be read carefully before investing. You may obtain a current copy of the Fund’s prospectus or performance data current to the most recent month end by calling (888) 899-8343.
| Investment Results (Unaudited) (continued) |
Comparison of the Change in the Value of a $10,000 Investment in the Dean Mid Cap Value Fund, the Russell Midcap Value Index, and the Russell Midcap Index (Unaudited)
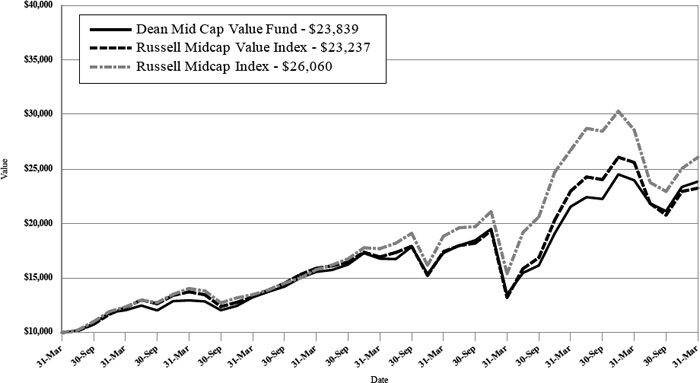
The graph shows the value of a hypothetical initial investment of $10,000 in the Fund, the Russell Midcap Value Index and the Russell Midcap Index on March 31, 2013 and held through March 31, 2023.
The Russell Midcap Index is a market capitalization weighted index representing the smallest 800 companies in the Russell 1000 Index. The Russell Midcap Value Index is an unmanaged index of common stock prices that measures the performance of those Russell Midcap companies with lower price-to-book ratios and lower forecasted growth values. The indices are representative of a broader market and range of securities than is found in the Fund’s portfolio. Individuals cannot invest directly in an index; however, an individual may invest in exchange traded funds or other investment vehicles that attempt to track the performance of a benchmark index. THE FUND’S RETURN REPRESENTS PAST PERFORMANCE AND DOES NOT GUARANTEE OR PREDICT FUTURE RESULTS. The returns shown do not reflect deduction of taxes that a shareholder would pay on Fund distributions or the redemption of Fund shares. Investment returns and principal values will fluctuate so that an investor’s shares, when redeemed, may be worth more or less than their original cost.
Current performance may be lower or higher than the performance data quoted. For more information on the Fund, and to obtain performance data current to the most recent month-end, or to request a prospectus, please call (888) 899-8343. You should carefully consider the investment objective, risks, charges and expenses of the Fund before investing. The Fund’s prospectus contains this and other information about the Fund and should be read carefully before investing.
The Fund is distributed by Ultimus Fund Distributors, LLC, Member FINRA/SIPC.
| Dean Equity Income Fund |
| Management Discussion of Fund Performance (Unaudited) |
| March 31, 2023 |
Management’s Discussion & Analysis
The Dean Equity Income Fund (the “Fund”) returned -2.66% (net of fees) for the period ended March 31, 2023 since the fund inception, compared with the Russell 1000 Value Index, down -1.62%.
Macro Factors Impacting Performance
Broad market factors acted largely as headwinds for the Fund since inception. Most importantly for the Fund’s relative performance, higher dividend yielding stocks underperformed the market. Additionally, stocks exhibiting the most earnings variability and growth performed well in the period while the Fund was under-exposed to these factors. On the other hand, the portfolio’s lower beta, volatility, and valuation were positive factors in the period.
Sector Performance (Best/Worst Relative to Benchmark)
The best performing sector relative to the benchmark since inception was Utilities. The strength was driven by allocation with the Utility sector the largest overweight sector and Utilities outperforming the benchmark Russell 1000 Value in the period. Additionally, new Utility sector investments were strong contributors outperforming since purchase. These included Alliant Energy (LNT) up 7.0% and Eversource Energy (ES) up 5.8% since purchase in the first quarter of 2023. Both utilities held up well in the volatile market.
The second best performing sector relative to the benchmark was Consumer Staples. Similar to the Utility sector, Consumer Staples performed well since inception principally due to being overweight in an outperforming sector. Household and Personal Product leader Kimberly-Clark (KMB) also added to the sector strength, up 3.7% in the period. Also, tobacco manufacturers Philip Morris International (PM) and Altria Group (MO) were relatively strong up 3.6% and 2.9%, respectively.
The worst performing sector relative to the benchmark since inception was Financials. Security selection drove the Financial sector weakness. Regional banks PNC Financial Group (PNC, -26.1% since inception) and US Bancorp (USB, -17.0%) underperformed in the period principally due to fear of contagion and fallout from the banking failures at Silicon Valley Bank and Signature Bank. While risks remain, we feel that both PNC and USB remain on solid footing and added modestly to the PNC position and continue to hold USB. For similar reasons, insurance holdings Prudential Financial (PRU, -21.2%) and Principal Financial Group (PFG, -18.7%) lagged the benchmark and the overall Financial sector in the period. And, again, similar to the portfolio bank positions, we remain confident in the insurers’ liquidity and long-term fundamentals and continue to hold the positions. See further discussion of PNC and PRU below.
| Dean Equity Income Fund |
| Management Discussion of Fund Performance (Unaudited) (continued) |
| March 31, 2023 |
The second worst performing sector relative to the benchmark was Communication Services. Stock selection drove the weakness. This is despite a strong performance from advertising leader Omnicom (OMC), up 21.0% in the period. See further discussion of OMC below. The biggest contributors to the benchmark strength came from wide range of outcome stocks that do not pay a dividend and are thus not an investment option for the Equity Income portfolio.
Individual Securities Performance (Best/Worst Absolute Contributors)
Omnicom Group (OMC) was the highest contributing stock during the since inception period. Omnicom is the second largest advertising company in terms of worldwide billings. OMC returned 21.0% since inception. The portfolio holds OMC due to its strong market share and highly variable cost structure, which allows the company to flex its P&L in times of financial hardship, while OMC’s top line mix shift to less cyclical, more digitally led advertising end markets has resulted in a steadier growth profile through the cycle. This was demonstrated by management’s provision of strong forward guidance, above Wall Street analyst estimates, even in the face of a wider range of outcomes economic environment. With supply chains easing and health care innovation continuing, the global market for ad spend continues to grow, with OMC a primary beneficiary. While the OMC position was trimmed in the first quarter on the outperformance, the portfolio maintains a position.
The second highest contributing holding was Broadcom Inc. (AVGO). Broadcom is a global designer and developer of semiconductor and infrastructure software solutions. AVGO returned 19.3% since inception as market sentiment seemed to have bottomed out late in 2022 on forecasted weaker handset shipments and high radio frequency component inventory until the second half of 2023 when headwinds should ease. On top of that, management posted a healthy first quarter earnings report and guided to a soft landing in the second half that should see the company post year-over-year growth in the back half due to high quality revenue mix and aggressive backlog scrubbing. AVGO has been rewarded by the market for its defensive characteristics and its consistency in results. The company’s strong revenue and free cash flow allow for continued research and development spending through the cycle. A staple of the equity income process, the portfolio continues to hold a position in AVGO.
The most detracting security was PNC Financial Services Group (PNC). PNC is a diversified financial services organization deriving >90% of its revenues from banking with the remainder coming from asset management. The Company was down -25.5% since the fund inception. It was a bumpy quarter for PNC as well, with disappointing net interest income and higher costs, but as the report was digested, the stock leveled off on management’s guidance for better-than-expected cost control. However, PNC was not
| Dean Equity Income Fund |
| Management Discussion of Fund Performance (Unaudited) (continued) |
| March 31, 2023 |
immune to the banking crisis and took a heavy fall with the rest of the banking industry. Management has put forth clear guardrails for managing its duration risk and was one of the first to access FHLB borrowings to have access to liquidity should it be needed, which was initially regarded as a red flag but was a defensive maneuver to take advantage of favorable spreads. With full faith in management’s ability to weather this storm due to its foresight and prudence in managing its balance sheet, the portfolio added a small weight to the existing position in the period.
The second largest detracting security was Prudential Financial (PRU). Prudential was down -22.3% since inception. Prudential is a diversified insurance and financial services company offering annuities, life insurance, retirement plan services, and asset management products. Prudential is the second largest life insurance company in the U.S. The company, like other life insurers, is operationally leveraged to the capital markets, however its asset management unit reported weaker than expected earnings and net flow as clients repositioned their exposures to fixed income strategies as interest rates rose. Nevertheless, its continued pivot towards capital-light businesses should better position PRU to compete domestically and generate above-peer return on equities while providing capital allocation flexibility to pursue mergers and acquisitions or share repurchases. With a yield above 6%, the portfolio continues to hold PRU.
Current Positioning and Opportunities
The portfolio’s largest overweight sectors relative to the benchmark are currently in the Industrials and Consumer Staples sectors. The largest underweight sectors relative to the benchmark are currently in the Financials and Energy sectors. Throughout the fiscal year, the Industrials and Health Care sectors increased the most in weight, while the Financials and Consumer Staples sectors decreased the most in weight. As always, these relative weights are a residual of our bottom-up opportunities and not based on a top-down macro call on the market or economy.
We remain focused on the fundamentals of the companies we own, and the price we are paying for those fundamentals. We are confident that a steadfast application of our proven and disciplined process should produce favorable results over time.
Thank you for your continued confidence in Dean.
| Investment Results (Unaudited) |
Average Annual Total Returns(a) as of March 31, 2023
| | | Since |
| | | Inception |
| | | (11/22/2022) |
| Dean Equity Income Fund(b) | | (2.66)% |
| Russell 1000 Value Index(b) | | (1.62)% |
The Total annual operating expenses, which included acquired fund fees and expenses of 0%, as disclosed in the Fund’s prospectus dated November 21, 2022, were 1.01% of the Fund’s average daily net assets (0.70% after fee waivers/expense reimbursements by Dean Investment Associates, LLC (the “Adviser”)). The Adviser has contractually agreed to waive its management fee and/or reimburse expenses so that total annual Fund operating expenses (excluding portfolio transaction and other investment-related costs (including brokerage fees and commissions); taxes; borrowing costs (such as interest and dividend expenses on securities sold short); acquired fund fees and expenses; fees and expenses associated with investments in other collective investment vehicles or derivative instruments (including for example option and swap fees and expenses); any amounts payable pursuant to a distribution or service plan adopted in accordance with Rule 12b-1 under the Investment Company Act of 1940; expenses incurred in connection with any merger or reorganization; extraordinary expenses (such as litigation expenses, indemnification of Trust officers and Trustees and contractual indemnification of Fund service providers)) do not exceed 0.70% of the Fund’s average daily net assets through July 31, 2024. Each waiver/expense payment by the Adviser is subject to recoupment by the Adviser from the Fund in the three years following the date the particular waiver/expense payment occurred, but only if such recoupment can be achieved without exceeding the annual expense limitation in effect at the time of the waiver/expense payment and any expense limitation in effect at the time of recoupment. This expense limitation agreement may not be terminated prior to July 31, 2024, except by the Board of Trustees upon sixty (60) days’ written notice to the Adviser. Additional information pertaining to the expense ratios as of March 31, 2023 can be found in the financial highlights.
The performance quoted represents past performance, which does not guarantee future results. The investment return and principal value of an investment will fluctuate so that an investor’s shares, when redeemed, may be worth more or less than their original cost. The returns shown do not reflect deduction of taxes that a shareholder would pay on Fund distributions or the redemption of Fund shares. Current performance may be lower or higher than the performance quoted. The Fund’s investment objective, risks, charges and expenses should be considered carefully before investing. Performance data current to the most recent month end may be obtained by calling (888) 899-8343.
| (a) | Return figures reflect any change in price per share and assume the reinvestment of all distributions. Total returns for less than one year are not annualized. |
| (b) | The Russell 1000 Value Index (the “Index”) is an unmanaged market capitalization weighted index of the 1,000 largest U.S. companies with lower price-to-book ratios and lower forecasted growth values. The Index is a widely recognized unmanaged index of equity prices and are representative of a broader market and range of securities than are found in the Fund’s portfolio. An individual cannot invest directly in an index. However, an individual may be able to invest in exchange traded funds or other investment vehicles that attempt to track the performance of an index. |
| Investment Results (Unaudited) (continued) |
You should consider the Fund’s investment objective, risks, charges and expenses carefully before you invest. The Fund’s prospectus contains important information about the Fund’s investment objective, potential risks, management fees, charges and expenses, and other information and should be read carefully before investing. You may obtain a current copy of the Fund’s prospectus or performance data current to the most recent month end by calling (888) 899-8343.
Comparison of the Change in the Value of a $10,000 Investment in the Dean Equity Income Fund and the Russel 1000 Value Index (Unaudited)
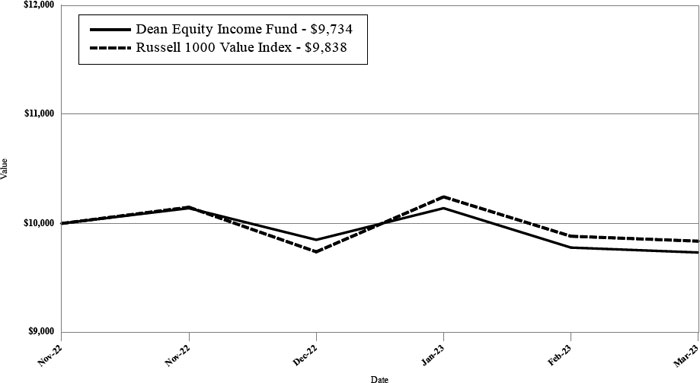
The graph shows the value of a hypothetical initial investment of $10,000 in the Fund, the Russell 1000 Value Index on November 22, 2022 and held through March 31, 2023.
The Russell 1000 Value Index is a widely recognized unmanaged index of common stock prices and is representative of a broader market and range of securities than is found in the Fund’s portfolio. Individuals cannot invest directly in an index; however, an individual may invest in exchange traded funds or other investment vehicles that attempt to track the performance of a benchmark index. THE FUND’S RETURN REPRESENTS PAST PERFORMANCE AND DOES NOT GUARANTEE OR PREDICT FUTURE RESULTS. The returns shown do not reflect deduction of taxes that a shareholder would pay on Fund distributions or the redemption of Fund shares. Investment returns and principal values will fluctuate so that an investor’s shares, when redeemed, may be worth more or less than their original cost.
Current performance may be lower or higher than the performance data quoted. For more information on the Fund, and to obtain performance data current to the most recent month-end, or to request a prospectus, please call (888) 899-8343. You should carefully consider the investment objective, risks, charges and expenses of the Fund before investing. The Fund’s prospectus contains this and other information about the Fund and should be read carefully before investing.
The Fund is distributed by Ultimus Fund Distributors, LLC, Member FINRA/SIPC.
| Fund Holdings (Unaudited) |
Dean Small Cap Value Fund Holdings as of March 31, 2023*
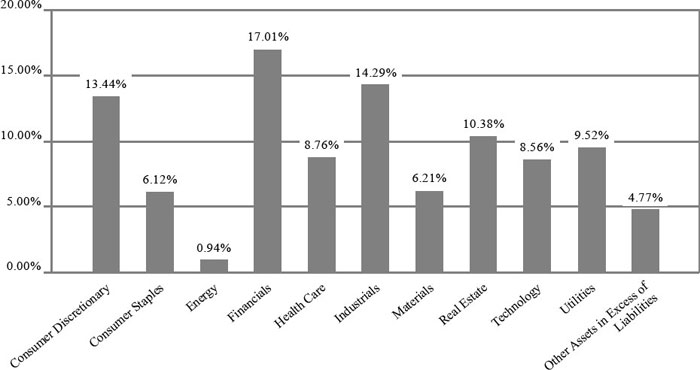
| * | As a percentage of net assets |
The investment objective of the Dean Small Cap Value Fund is long-term capital appreciation and, secondarily, dividend income. Portfolio holdings are subject to change.
| Fund Holdings (Unaudited) |
Dean Mid Cap Value Fund Holdings as of March 31, 2023*
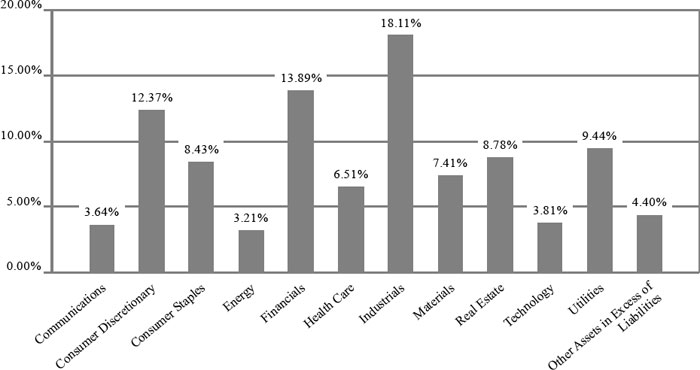
| * | As a percentage of net assets. |
The investment objective of the Dean Mid Cap Value Fund is long-term capital appreciation and, secondarily, dividend income. Portfolio holdings are subject to change.
| Fund Holdings (Unaudited) |
Dean Equity Income Fund Holdings as of March 31, 2023*
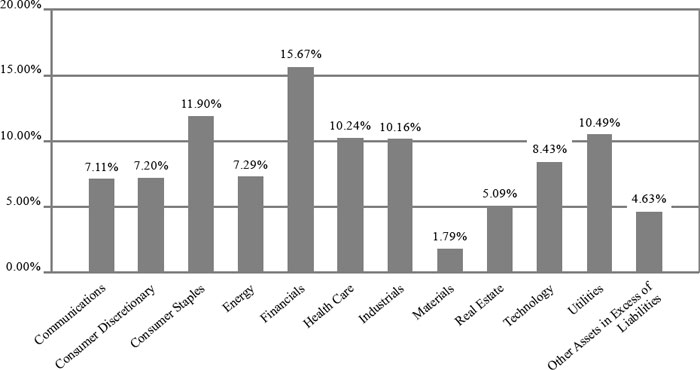
| * | As a percentage of net assets. |
The investment objective of the Dean Equity Income Fund is long-term capital appreciation with an income focus. Portfolio holdings are subject to change.
| Availability of Portfolio Schedule (Unaudited) |
Each Fund files a complete schedule of portfolio holdings with the Securities and Exchange Commission (the “SEC”) for the first and third quarters of each fiscal year as an exhibit to its reports on Form N-PORT. The Funds’ Form N-PORT reports are available on the SEC’s website at www. sec.gov and on the Funds’ website at www.deanmutualfunds.com.
| Dean Small Cap Value Fund |
| Schedule of Investments |
| March 31, 2023 |
| COMMON STOCKS — 95.23% | | Shares | | | Fair Value | |
| Consumer Discretionary — 13.44% | | | | | | | | |
| American Woodmark Corp.(a) | | | 43,190 | | | $ | 2,248,903 | |
| Carter’s, Inc. | | | 35,395 | | | | 2,545,608 | |
| Fox Factory Holding Corp.(a) | | | 11,117 | | | | 1,349,270 | |
| Johnson Outdoors, Inc., Class A | | | 38,590 | | | | 2,431,556 | |
| Medifast, Inc. | | | 28,751 | | | | 2,980,616 | |
| Methode Electronics, Inc. | | | 50,090 | | | | 2,197,949 | |
| Miller Industries, Inc. | | | 105,930 | | | | 3,744,626 | |
| Standard Motor Products, Inc. | | | 154,487 | | | | 5,702,116 | |
| TRI Pointe Group, Inc.(a) | | | 138,897 | | | | 3,516,872 | |
| Wendy’s Co. (The) | | | 98,391 | | | | 2,142,956 | |
| | | | | | | | 28,860,472 | |
| Consumer Staples — 6.12% | | | | | | | | |
| Cal-Maine Foods, Inc. | | | 63,379 | | | | 3,859,147 | |
| Fresh Del Monte Produce, Inc. | | | 55,457 | | | | 1,669,810 | |
| John B. Sanfilippo & Son, Inc. | | | 52,646 | | | | 5,102,451 | |
| Lancaster Colony Corp. | | | 12,395 | | | | 2,514,698 | |
| | | | | | | | 13,146,106 | |
| Energy — 0.94% | | | | | | | | |
| World Fuel Services Corp. | | | 79,096 | | | | 2,020,903 | |
| | | | | | | | | |
| Financials — 17.01% | | | | | | | | |
| Camden National Corp. | | | 99,285 | | | | 3,593,124 | |
| Capitol Federal Financial, Inc. | | | 528,117 | | | | 3,554,227 | |
| Cathay General Bancorp | | | 38,590 | | | | 1,332,127 | |
| Diamond Hill Investment Group, Inc. | | | 15,717 | | | | 2,586,704 | |
| Employers Holdings, Inc. | | | 81,396 | | | | 3,393,399 | |
| Federated Hermes, Inc., Class B | | | 31,051 | | | | 1,246,387 | |
| Great Southern Bancorp, Inc. | | | 23,639 | | | | 1,198,025 | |
| Nelnet, Inc., Class A | | | 37,823 | | | | 3,475,555 | |
| QCR Holdings, Inc. | | | 60,568 | | | | 2,659,541 | |
| Safety Insurance Group, Inc. | | | 51,368 | | | | 3,827,944 | |
| Washington Federal, Inc. | | | 88,041 | | | | 2,651,795 | |
| Washington Trust Bancorp, Inc. | | | 92,258 | | | | 3,197,662 | |
| Waterstone Financial, Inc. | | | 193,076 | | | | 2,921,240 | |
| White Mountains Insurance Group Ltd. | | | 639 | | | | 880,216 | |
| | | | | | | | 36,517,946 | |
| Health Care — 8.76% | | | | | | | | |
| Haemonetics Corp.(a) | | | 7,539 | | | | 623,852 | |
| National Healthcare Corp. | | | 79,735 | | | | 4,630,211 | |
| Perrigo Co. PLC | | | 44,979 | | | | 1,613,397 | |
| Phibro Animal Health Corp., A | | | 171,737 | | | | 2,631,011 | |
| Premier, Inc., Class A | | | 178,765 | | | | 5,786,623 | |
| Prestige Consumer Healthcare, Inc.(a) | | | 56,479 | | | | 3,537,280 | |
| | | | | | | | 18,822,374 | |
| Industrials — 14.29% | | | | | | | | |
| Advanced Energy Industries, Inc. | | | 16,484 | | | | 1,615,432 | |
| Argan, Inc. | | | 144,136 | | | | 5,833,184 | |
| | | | | | | | | |
See accompanying notes which are an integral part of these financial statements.
| Dean Small Cap Value Fund |
| Schedule of Investments (continued) |
| March 31, 2023 |
| COMMON STOCKS — 95.23% - continued | | Shares | | | Fair Value | |
| Industrials — 14.29% - continued | | | | | | | | |
| AZZ, Inc. | | | 101,458 | | | $ | 4,184,128 | |
| Brady Corp., Class A | | | 101,330 | | | | 5,444,461 | |
| Heartland Express, Inc. | | | 222,466 | | | | 3,541,659 | |
| John Bean Technologies Corp. | | | 17,378 | | | | 1,899,242 | |
| Kennametal, Inc. | | | 59,674 | | | | 1,645,809 | |
| Mueller Water Products, Inc. | | | 164,454 | | | | 2,292,488 | |
| Werner Enterprises, Inc. | | | 93,152 | | | | 4,237,484 | |
| | | | | | | | 30,693,887 | |
| Materials — 6.21% | | | | | | | | |
| Alamos Gold, Inc., Class A | | | 178,637 | | | | 2,184,731 | |
| NewMarket Corp. | | | 2,811 | | | | 1,025,959 | |
| Sensient Technologies Corp. | | | 68,618 | | | | 5,253,394 | |
| SSR Mining, Inc. | | | 92,769 | | | | 1,402,667 | |
| Stepan Co. | | | 33,734 | | | | 3,475,614 | |
| | | | | | | | 13,342,365 | |
| Real Estate — 10.38% | | | | | | | | |
| Alexander’s, Inc. | | | 9,711 | | | | 1,881,506 | |
| CareTrust REIT, Inc. | | | 40,890 | | | | 800,626 | |
| Cousins Properties, Inc. | | | 195,376 | | | | 4,177,139 | |
| Equity Commonwealth | | | 216,716 | | | | 4,488,188 | |
| Getty Realty Corp. | | | 59,929 | | | | 2,159,242 | |
| Physicians Realty Trust | | | 399,953 | | | | 5,971,298 | |
| Universal Health Realty Income Trust | | | 58,651 | | | | 2,821,700 | |
| | | | | | | | 22,299,699 | |
| Technology — 8.56% | | | | | | | | |
| Benchmark Electronics, Inc. | | | 92,385 | | | | 2,188,601 | |
| CSG Systems International, Inc. | | | 61,079 | | | | 3,279,942 | |
| MAXIMUS, Inc. | | | 60,568 | | | | 4,766,701 | |
| NextGen Healthcare, Inc.(a) | | | 49,707 | | | | 865,399 | |
| Viavi Solutions, Inc.(a) | | | 338,363 | | | | 3,664,471 | |
| Vishay Intertechnology, Inc. | | | 160,109 | | | | 3,621,666 | |
| | | | | | | | 18,386,780 | |
| Utilities — 9.52% | | | | | | | | |
| American States Water Co. | | | 43,318 | | | | 3,850,537 | |
| Avista Corp. | | | 87,913 | | | | 3,731,907 | |
| Northwest Natural Holding Co. | | | 15,845 | | | | 753,588 | |
| NorthWestern Corp. | | | 57,118 | | | | 3,304,847 | |
| Portland General Electric Co. | | | 106,441 | | | | 5,203,901 | |
| Spire, Inc. | | | 51,368 | | | | 3,602,952 | |
| | | | | | | | 20,447,732 | |
| | | | | | | | | |
| Total Common Stocks/Investments — 95.23% (Cost $200,062,430) | | | | | | | 204,538,264 | |
| Other Assets in Excess of Liabilities — 4.77% | | | | | | | 10,245,426 | |
| NET ASSETS — 100.00% | | | | | | $ | 214,783,690 | |
| | | | | | | | | |
| (a) | Non-income producing security. |
See accompanying notes which are an integral part of these financial statements.
| Dean Mid Cap Value Fund |
| Schedule of Investments |
| March 31, 2023 |
| COMMON STOCKS — 95.60% | | Shares | | | Fair Value | |
| Communications — 3.64% | | | | | | | | |
| Omnicom Group, Inc. | | | 16,635 | | | $ | 1,569,346 | |
| Take-Two Interactive Software, Inc.(a) | | | 9,546 | | | | 1,138,838 | |
| | | | | | | | 2,708,184 | |
| Consumer Discretionary — 12.37% | | | | | | | | |
| AutoZone, Inc.(a) | | | 613 | | | | 1,506,846 | |
| BorgWarner, Inc. | | | 27,079 | | | | 1,329,850 | |
| Genuine Parts Co. | | | 7,987 | | | | 1,336,305 | |
| Masco Corp. | | | 22,531 | | | | 1,120,241 | |
| PulteGroup, Inc. | | | 21,503 | | | | 1,253,195 | |
| Skechers U.S.A., Inc., Class A(a) | | | 26,796 | | | | 1,273,346 | |
| Ulta Beauty, Inc.(a) | | | 2,552 | | | | 1,392,550 | |
| | | | | | | | 9,212,333 | |
| Consumer Staples — 8.43% | | | | | | | | |
| BJ’s Wholesale Club Holdings, Inc.(a) | | | 15,737 | | | | 1,197,113 | |
| Casey’s General Stores, Inc. | | | 5,482 | | | | 1,186,634 | |
| Conagra Brands, Inc. | | | 39,488 | | | | 1,483,169 | |
| Flowers Foods, Inc. | | | 53,894 | | | | 1,477,236 | |
| US Foods Holding Corp.(a) | | | 25,223 | | | | 931,738 | |
| | | | | | | | 6,275,890 | |
| Energy — 3.21% | | | | | | | | |
| Baker Hughes Co. | | | 40,264 | | | | 1,162,019 | |
| Pioneer Natural Resources Co. | | | 6,002 | | | | 1,225,849 | |
| | | | | | | | 2,387,868 | |
| Financials — 13.89% | | | | | | | | |
| Ameriprise Financial, Inc. | | | 4,865 | | | | 1,491,122 | |
| Assurant, Inc. | | | 9,258 | | | | 1,111,608 | |
| Fifth Third Bancorp | | | 34,073 | | | | 907,705 | |
| Globe Life, Inc. | | | 12,760 | | | | 1,403,855 | |
| Raymond James Financial, Inc. | | | 15,737 | | | | 1,467,790 | |
| Regions Financial Corp. | | | 63,704 | | | | 1,182,346 | |
| Reinsurance Group of America, Inc. | | | 9,777 | | | | 1,297,995 | |
| W.R. Berkley Corp. | | | 23,759 | | | | 1,479,235 | |
| | | | | | | | 10,341,656 | |
| Health Care — 6.51% | | | | | | | | |
| Chemed Corp. | | | 2,263 | | | | 1,216,928 | |
| Encompass Health Corp. | | | 24,184 | | | | 1,308,354 | |
| Quest Diagnostics, Inc. | | | 7,987 | | | | 1,130,001 | |
| Zimmer Biomet Holdings, Inc. | | | 9,215 | | | | 1,190,578 | |
| | | | | | | | 4,845,861 | |
| Industrials — 18.11% | | | | | | | | |
| Curtiss-Wright Corp. | | | 8,365 | | | | 1,474,415 | |
| Dover Corp. | | | 8,648 | | | | 1,313,977 | |
| FTI Consulting, Inc.(a) | | | 7,514 | | | | 1,482,888 | |
| Hubbell, Inc. | | | 5,671 | | | | 1,379,811 | |
| ITT, Inc. | | | 14,981 | | | | 1,292,860 | |
| Littelfuse, Inc. | | | 4,820 | | | | 1,292,194 | |
| | | | | | | | | |
See accompanying notes which are an integral part of these financial statements
| Dean Mid Cap Value Fund |
| Schedule of Investments (continued) |
| March 31, 2023 |
| COMMON STOCKS — 95.60% - continued | | Shares | | | Fair Value | |
| Industrials — 18.11% - continued | | | | | | | | |
| MSC Industrial Direct Co., Inc., Class A | | | 14,556 | | | $ | 1,222,704 | |
| nVent Electric PLC | | | 38,374 | | | | 1,647,779 | |
| Regal Rexnord Corp. | | | 4,395 | | | | 618,508 | |
| Republic Services, Inc. | | | 10,255 | | | | 1,386,681 | |
| Stanley Black & Decker, Inc. | | | 4,679 | | | | 377,034 | |
| | | | | | | | 13,488,851 | |
| Materials — 7.41% | | | | | | | | |
| Avery Dennison Corp. | | | 6,333 | | | | 1,133,164 | |
| Eagle Materials, Inc. | | | 7,231 | | | | 1,061,149 | |
| Eastman Chemical Co. | | | 13,226 | | | | 1,115,481 | |
| FMC Corp. | | | 11,153 | | | | 1,362,116 | |
| Steel Dynamics, Inc. | | | 7,467 | | | | 844,219 | |
| | | | | | | | 5,516,129 | |
| Real Estate — 8.78% | | | | | | | | |
| Alexandria Real Estate Equities, Inc. | | | 5,999 | | | | 753,414 | |
| AvalonBay Communities, Inc. | | | 7,132 | | | | 1,198,604 | |
| CBRE Group, Inc., Class A(a) | | | 14,839 | | | | 1,080,428 | |
| Regency Centers Corp. | | | 18,573 | | | | 1,136,296 | |
| STAG Industrial, Inc. | | | 36,247 | | | | 1,225,874 | |
| Welltower, Inc. | | | 15,973 | | | | 1,145,104 | |
| | | | | | | | 6,539,720 | |
| Technology — 3.81% | | | | | | | | |
| Arrow Electronics, Inc.(a) | | | 12,045 | | | | 1,504,059 | |
| Broadridge Financial Solutions, Inc. | | | 9,121 | | | | 1,336,865 | |
| | | | | | | | 2,840,924 | |
| Utilities — 9.44% | | | | | | | | |
| Ameren Corp. | | | 15,832 | | | | 1,367,726 | |
| Atmos Energy Corp. | | | 13,091 | | | | 1,470,905 | |
| CenterPoint Energy, Inc. | | | 45,841 | | | | 1,350,476 | |
| CMS Energy Corp. | | | 22,117 | | | | 1,357,541 | |
| Xcel Energy, Inc. | | | 22,022 | | | | 1,485,164 | |
| | | | | | | | 7,031,812 | |
| | | | | | | | | |
| Total Common Stocks/Investments — 95.60% (Cost $56,252,652) | | | | | | | 71,189,228 | |
| Other Assets in Excess of Liabilities — 4.40% | | | | | | | 3,278,029 | |
| NET ASSETS — 100.00% | | | | | | $ | 74,467,257 | |
| | | | | | | | | |
| (a) | Non-income producing security. |
See accompanying notes which are an integral part of these financial statements.
| Dean Equity Income Fund |
| Schedule of Investments |
| March 31, 2023 |
| COMMON STOCKS — 95.37% | | Shares | | | Fair Value | |
| Communications — 7.11% | | | | | | | | |
| BCE, Inc. | | | 45,558 | | | $ | 2,040,543 | |
| Omnicom Group, Inc. | | | 12,120 | | | | 1,143,401 | |
| Verizon Communications, Inc. | | | 52,706 | | | | 2,049,736 | |
| | | | | | | | 5,233,680 | |
| Consumer Discretionary — 7.20% | | | | | | | | |
| Advance Auto Parts, Inc. | | | 9,137 | | | | 1,111,151 | |
| Home Depot, Inc. (The) | | | 4,351 | | | | 1,284,067 | |
| Packaging Corp. of America | | | 12,244 | | | | 1,699,834 | |
| Whirlpool Corp. | | | 9,137 | | | | 1,206,267 | |
| | | | | | | | 5,301,319 | |
| Consumer Staples — 11.90% | | | | | | | | |
| Altria Group, Inc. | | | 51,525 | | | | 2,299,045 | |
| Flowers Foods, Inc. | | | 52,457 | | | | 1,437,846 | |
| Kimberly-Clark Corp. | | | 16,222 | | | | 2,177,317 | |
| PepsiCo, Inc. | | | 6,899 | | | | 1,257,688 | |
| Philip Morris International, Inc. | | | 16,346 | | | | 1,589,649 | |
| | | | | | | | 8,761,545 | |
| Energy — 7.29% | | | | | | | | |
| Chevron Corp. | | | 14,606 | | | | 2,383,115 | |
| EOG Resources, Inc. | | | 10,753 | | | | 1,232,616 | |
| Kinder Morgan, Inc., Class P | | | 100,253 | | | | 1,755,430 | |
| | | | | | | | 5,371,161 | |
| Financials — 15.67% | | | | | | | | |
| BlackRock, Inc. | | | 1,740 | | | | 1,164,269 | |
| Canadian Imperial Bank of Commerce | | | 29,958 | | | | 1,270,818 | |
| JPMorgan Chase & Co. | | | 10,877 | | | | 1,417,382 | |
| PNC Financial Services Group, Inc. (The) | | | 10,504 | | | | 1,335,058 | |
| Principal Financial Group, Inc. | | | 19,205 | | | | 1,427,315 | |
| Prudential Financial, Inc. | | | 16,471 | | | | 1,362,811 | |
| T. Rowe Price Group, Inc. | | | 18,832 | | | | 2,126,132 | |
| U.S. Bancorp | | | 39,902 | | | | 1,438,467 | |
| | | | | | | | 11,542,252 | |
| Health Care — 10.24% | | | | | | | | |
| Amgen, Inc. | | | 7,458 | | | | 1,802,971 | |
| Bristol-Myers Squibb Co. | | | 13,922 | | | | 964,934 | |
| Johnson & Johnson | | | 14,295 | | | | 2,215,725 | |
| Merck & Co., Inc. | | | 13,612 | | | | 1,448,181 | |
| Pfizer, Inc. | | | 27,161 | | | | 1,108,169 | |
| | | | | | | | 7,539,980 | |
| Industrials — 10.16% | | | | | | | | |
| Fastenal Co. | | | 32,444 | | | | 1,750,029 | |
| Lockheed Martin Corp. | | | 2,300 | | | | 1,087,279 | |
| Paychex, Inc. | | | 9,572 | | | | 1,096,855 | |
| Union Pacific Corp. | | | 7,023 | | | | 1,413,449 | |
| United Parcel Service, Inc., Class B | | | 11,001 | | | | 2,134,085 | |
| | | | | | | | 7,481,697 | |
| | | | | | | | | |
See accompanying notes which are an integral part of these financial statements.
| Dean Equity Income Fund |
| Schedule of Investments (continued) |
| March 31, 2023 |
| COMMON STOCKS — 95.37% - continued | | Shares | | | Fair Value | |
| Materials — 1.79% | | | | | | | | |
| Air Products & Chemicals, Inc. | | | 4,599 | | | $ | 1,320,879 | |
| | | | | | | | | |
| Real Estate — 5.09% | | | | | | | | |
| Digital Realty Trust, Inc. | | | 15,103 | | | | 1,484,776 | |
| Essex Property Trust, Inc. | | | 5,283 | | | | 1,104,887 | |
| Lamar Advertising Co., Class A | | | 11,623 | | | | 1,161,021 | |
| | | | | | | | 3,750,684 | |
| Technology — 8.43% | | | | | | | | |
| Broadcom, Inc. | | | 3,294 | | | | 2,113,234 | |
| Cisco Systems, Inc. | | | 39,405 | | | | 2,059,896 | |
| Texas Instruments, Inc. | | | 10,939 | | | | 2,034,763 | |
| | | | | | | | 6,207,893 | |
| Utilities — 10.49% | | | | | | | | |
| Alliant Energy Corp. | | | 21,319 | | | | 1,138,435 | |
| American Electric Power Co., Inc. | | | 16,657 | | | | 1,515,620 | |
| Duke Energy Corp. | | | 19,640 | | | | 1,894,671 | |
| Eversource Energy | | | 15,973 | | | | 1,250,047 | |
| WEC Energy Group, Inc. | | | 20,324 | | | | 1,926,512 | |
| | | | | | | | 7,725,285 | |
| | | | | | | | | |
| Total Common Stocks/Investments — 95.37% (Cost $71,849,374) | | | | | | | 70,236,375 | |
| Other Assets in Excess of Liabilities — 4.63% | | | | | | | 3,410,456 | |
| NET ASSETS — 100.00% | | | | | | $ | 73,646,831 | |
| | | | | | | | | |
See accompanying notes which are an integral part of these financial statements.
| Dean Funds |
| Statements of Assets and Liabilities |
| March 31, 2023 |
| | | Dean Small Cap | | | Dean Mid Cap | | | Dean Equity | |
| | | Value Fund | | | Value Fund | | | Income Fund | |
| Assets | | | | | | | | | | | | |
| Investments in securities at value (cost $200,062,430, $56,252,652 and $71,849,374) | | $ | 204,538,264 | | | $ | 71,189,228 | | | $ | 70,236,375 | |
| Cash and cash equivalents | | | 9,387,268 | | | | 3,436,362 | | | | 4,029,891 | |
| Receivable for fund shares sold | | | 4,946,358 | | | | 1,445 | | | | 60,419 | |
| Receivable for investments sold | | | 1,068,213 | | | | 3,870,429 | | | | — | |
| Dividends receivable | | | 330,617 | | | | 156,583 | | | | 197,135 | |
| Prepaid expenses | | | 26,685 | | | | 15,973 | | | | 8,312 | |
| Total Assets | | | 220,297,405 | | | | 78,670,020 | | | | 74,532,132 | |
| Liabilities | | | | | | | | | | | | |
| Payable for investments purchased | | | 5,289,143 | | | | 4,128,292 | | | | 841,380 | |
| Payable for fund shares redeemed | | | 2,984 | | | | 6,169 | | | | — | |
| Payable to Adviser | | | 158,396 | | | | 34,693 | | | | 11,583 | |
| Payable to affiliates | | | 22,906 | | | | 9,818 | | | | 9,030 | |
| Other accrued expenses | | | 40,286 | | | | 23,791 | | | | 23,308 | |
| Total Liabilities | | | 5,513,715 | | | | 4,202,763 | | | | 885,301 | |
| Net Assets | | $ | 214,783,690 | | | $ | 74,467,257 | | | $ | 73,646,831 | |
| Net Assets consist of: | | | | | | | | | | | | |
| Paid-in capital | | $ | 210,721,528 | | | $ | 55,932,685 | | | $ | 74,740,432 | |
| Accumulated earnings (deficit) | | | 4,062,162 | | | | 18,534,572 | | | | (1,093,601 | ) |
| Net Assets | | $ | 214,783,690 | | | $ | 74,467,257 | | | $ | 73,646,831 | |
| Shares outstanding (unlimited number of shares authorized, no par value) | | | 11,437,019 | | | | 3,311,218 | | | | 3,794,754 | |
| Net asset value, offering and redemption price per share | | $ | 18.78 | | | $ | 22.49 | | | $ | 19.41 | |
| | | | | | | | | | | | | |
See accompanying notes which are an integral part of these financial statements.
| Dean Funds |
| Statements of Operations |
| For the Year or Period Ended March 31, 2023 |
| | | Dean Small Cap | | | Dean Mid Cap | | | Dean Equity | |
| | | Value Fund | | | Value Fund | | | Income Fund(a) | |
| Investment Income | | | | | | | | | | | | |
| Dividend income (net of foreign taxes withheld of $5,128, $– and $8,819) | | $ | 5,518,101 | | | $ | 1,503,240 | | | $ | 576,686 | |
| Interest income | | | 232,797 | | | | 87,213 | | | | 48,648 | |
| Total investment income | | | 5,750,898 | | | | 1,590,453 | | | | 625,334 | |
| | | | | | | | | | | | | |
| Expenses | | | | | | | | | | | | |
| Adviser | | | 1,697,866 | | | | 567,956 | | | | 72,377 | |
| Administration | | | 153,292 | | | | 68,565 | | | | 12,449 | |
| Custodian | | | 51,778 | | | | 13,594 | | | | 13,976 | |
| Transfer agent | | | 36,213 | | | | 10,079 | | | | 3,208 | |
| Fund accounting | | | 31,469 | | | | 20,117 | | | | 5,076 | |
| Registration | | | 30,015 | | | | 23,308 | | | | 589 | |
| Report printing | | | 26,055 | | | | 7,515 | | | | 2,439 | |
| Legal | | | 23,419 | | | | 23,419 | | | | 5,682 | |
| Audit and tax preparation | | | 17,810 | | | | 17,810 | | | | 17,400 | |
| Trustee | | | 17,477 | | | | 17,477 | | | | 4,169 | |
| Compliance services | | | 11,028 | | | | 11,028 | | | | 3,222 | |
| Insurance | | | 4,522 | | | | 3,304 | | | | — | |
| Pricing | | | 1,466 | | | | 1,140 | | | | 282 | |
| Miscellaneous | | | 55,721 | | | | 30,769 | | | | 9,236 | |
| Total expenses | | | 2,158,131 | | | | 816,081 | | | | 150,105 | |
| Fees waived by Adviser | | | — | | | | (172,518 | ) | | | (48,814 | ) |
| Net operating expenses | | | 2,158,131 | | | | 643,563 | | | | 101,291 | |
| Net investment income | | | 3,592,767 | | | | 946,890 | | | | 524,043 | |
| | | | | | | | | | | | | |
| Net Realized and Change in Unrealized Gain (Loss) on Investments | | | | | | | | | | | | |
| Net realized gain on investment securities transactions | | | 17,593,024 | | | | 3,226,530 | | | | 45,737 | |
| Net realized gain on foreign currency translations | | | — | | | | — | | | | 146 | |
| Net change in unrealized appreciation (depreciation) of investment securities | | | (11,956,951 | ) | | | (4,524,099 | ) | | | (1,612,999 | ) |
| Foreign currency | | | — | | | | — | | | | 432 | |
| Net realized and change in unrealized gain (loss) on investments | | | 5,636,073 | | | | (1,297,569 | ) | | | (1,566,684 | ) |
| Net increase (decrease) in net assets resulting from operations | | $ | 9,228,840 | | | $ | (350,679 | ) | | $ | (1,042,641 | ) |
| | | | | | | | | | | | | |
| (a) | For the period November 22, 2022 (commencement of operations) to March 31, 2023. |
See accompanying notes which are an integral part of these financial statements.
| Dean Funds |
| Statements of Changes in Net Assets |
| March 31, 2023 |
| | | Dean Small Cap Value Fund | | | Dean Mid Cap Value Fund | |
| | | For the Year | | | For the Year | | | For the Year | | | For the Year | |
| | | Ended | | | Ended | | | Ended | | | Ended | |
| | | March 31, 2023 | | | March 31, 2022 | | | March 31, 2023 | | | March 31, 2022 | |
| Increase (Decrease) in Net Assets due to: | | | | | | | | | | | | | | | | |
| Operations | | | | | | | | | | | | | | | | |
| Net investment income | | $ | 3,592,767 | | | $ | 2,025,719 | | | $ | 946,890 | | | $ | 614,373 | |
| Net realized gain on investment securities transactions | | | 17,593,024 | | | | 25,615,419 | | | | 3,226,530 | | | | 6,557,053 | |
| Net change in unrealized appreciation (depreciation) of investment securities | | | (11,956,951 | ) | | | (14,232,164 | ) | | | (4,524,099 | ) | | | 1,509,860 | |
| Net increase (decrease) in net assets resulting from operations | | | 9,228,840 | | | | 13,408,974 | | | | (350,679 | ) | | | 8,681,286 | |
| Distributions to Shareholders From: | | | | | | | | | | | | | | | | |
| Earnings | | | (2,517,470 | ) | | | (1,786,178 | ) | | | (3,867,873 | ) | | | (4,319,680 | ) |
| Total distributions | | | (2,517,470 | ) | | | (1,786,178 | ) | | | (3,867,873 | ) | | | (4,319,680 | ) |
| Capital Transactions | | | | | | | | | | | | | | | | |
| Proceeds from shares sold | | | 64,099,879 | | | | 33,284,225 | | | | 7,559,031 | | | | 6,797,142 | |
| Reinvestment of distributions | | | 2,018,672 | | | | 1,447,112 | | | | 3,748,284 | | | | 4,205,623 | |
| Amount paid for shares redeemed | | | (38,311,897 | ) | | | (35,136,353 | ) | | | (13,001,231 | ) | | | (14,560,546 | ) |
| Net increase (decrease) in net assets resulting from capital transactions | | | 27,806,654 | | | | (405,016 | ) | | | (1,693,916 | ) | | | (3,557,781 | ) |
| Total Increase (Decrease) in Net Assets | | | 34,518,024 | | | | 11,217,780 | | | | (5,912,468 | ) | | | 803,825 | |
| Net Assets | | | | | | | | | | | | | | | | |
| Beginning of year | | | 180,265,666 | | | | 169,047,886 | | | | 80,379,725 | | | | 79,575,900 | |
| End of year | | $ | 214,783,690 | | | $ | 180,265,666 | | | $ | 74,467,257 | | | $ | 80,379,725 | |
| | | | | | | | | | | | | | | | | |
| Share Transactions | | | | | | | | | | | | | | | | |
| Shares sold | | | 3,487,527 | | | | 1,880,020 | | | | 333,562 | | | | 286,213 | |
| Shares issued in reinvestment of distributions | | | 107,376 | | | | 80,934 | | | | 166,368 | | | | 177,378 | |
| Shares redeemed | | | (2,101,158 | ) | | | (1,984,393 | ) | | | (567,825 | ) | | | (608,393 | ) |
| Net increase (decrease) in shares outstanding | | | 1,493,745 | | | | (23,439 | ) | | | (67,895 | ) | | | (144,802 | ) |
| | | | | | | | | | | | | | | | | |
See accompanying notes which are an integral part of these financial statements.
| Dean Funds |
| Statements of Changes in Net Assets (continued) |
| March 31, 2023 |
| | | Dean Equity | |
| | | Income Fund | |
| | | For the Period | |
| | | Ended March | |
| | | 31, 2023(a) | |
| Increase (Decrease) in Net Assets due to: | | | | |
| Operations | | | | |
| Net investment income | | $ | 524,043 | |
| Net realized gain on investment securities transactions | | | 45,883 | |
| Net change in unrealized depreciation of investment securities | | | (1,612,567 | ) |
| Net decrease in net assets resulting from operations | | | (1,042,641 | ) |
| Distributions to Shareholders From: | | | | |
| Earnings | | | (50,960 | ) |
| Total distributions | | | (50,960 | ) |
| Capital Transactions | | | | |
| Proceeds from shares sold | | | 75,338,469 | |
| Reinvestment of distributions | | | 50,891 | |
| Amount paid for shares redeemed | | | (648,928 | ) |
| Net increase in net assets resulting from capital transactions | | | 74,740,432 | |
| Total Increase in Net Assets | | | 73,646,831 | |
| | | | | |
| Net Assets | | | | |
| Beginning of year | | | — | |
| End of year | | $ | 73,646,831 | |
| | | | | |
| Share Transactions | | | | |
| Shares sold | | | 3,825,371 | |
| Shares issued in reinvestment of distributions | | | 2,533 | |
| Shares redeemed | | | (33,150 | ) |
| Net increase in shares outstanding | | | 3,794,754 | |
| | | | | |
| (a) | For the period November 22, 2022 (commencement of operations) to March 31, 2023. |
See accompanying notes which are an integral part of these financial statements.
| Dean Small Cap Value Fund |
| Financial Highlights |
| |
| (For a share outstanding during each period) |
| | | For the Years Ended March 31, | |
| | | 2023 | | | 2022 | | | 2021 | | | 2020 | | | 2019 | |
| Selected Per Share Data: | | | | | | | | | | | | | | | |
| Net asset value, beginning of year | | $ | 18.13 | | | $ | 16.96 | | | $ | 9.25 | | | $ | 14.19 | | | $ | 14.63 | |
| | | | | | | | | | | | | | | | | | | | | |
| Investment operations: | | | | | | | | | | | | | | | | | | | | |
| Net investment income | | | 0.32 | | | | 0.20 | | | | 0.27 | | | | 0.16 | | | | 0.15 | |
| Net realized and unrealized gain (loss) | | | 0.57 | | | | 1.15 | | | | 7.67 | | | | (4.51 | ) | | | (0.18 | ) |
| Total from investment operations | | | 0.89 | | | | 1.35 | | | | 7.94 | | | | (4.35 | ) | | | (0.03 | ) |
| | | | | | | | | | | | | | | | | | | | | |
| Less distributions to shareholders from: | | | | | | | | | | | | | | | | | | | | |
| Net investment income | | | (0.24 | ) | | | (0.18 | ) | | | (0.23 | ) | | | (0.19 | ) | | | (0.20 | ) |
| Net realized gains | | | — | | | | — | | | | — | | | | (0.40 | ) | | | (0.21 | ) |
| Total distributions | | | (0.24 | ) | | | (0.18 | ) | | | (0.23 | ) | | | (0.59 | ) | | | (0.41 | ) |
| | | | | | | | | | | | | | | | | | | | | |
| Net asset value, end of year | | $ | 18.78 | | | $ | 18.13 | | | $ | 16.96 | | | $ | 9.25 | | | $ | 14.19 | |
| | | | | | | | | | | | | | | | | | | | | |
| Total Return(a) | | | 4.89 | % | | | 7.98 | % | | | 86.33 | % | | | (32.14 | )% | | | (0.08 | )% |
| | | | | | | | | | | | | | | | | | | | | |
| Ratios and Supplemental Data: | | | | | | | | | | | | | | | | | | | | |
| Net assets, end of year (000 omitted) | | $ | 214,784 | | | $ | 180,266 | | | $ | 169,048 | | | $ | 226,564 | | | $ | 321,178 | |
| Ratio of net expenses to average net assets | | | 1.14 | % | | | 1.13 | % | | | 1.19 | % | | | 1.15 | % | | | 1.12 | % |
| Ratio of gross expenses to average net assets before waiver or recoupment | | | 1.14 | % | | | 1.13 | % | | | 1.19 | % | | | 1.15 | % | | | 1.12 | % |
| Ratio of net investment income to average net assets | | | 1.90 | % | | | 1.15 | % | | | 1.16 | % | | | 1.14 | % | | | 1.04 | % |
| Portfolio turnover rate | | | 77 | % | | | 57 | % | | | 181 | % | | | 157 | % | | | 120 | % |
| | | | | | | | | | | | | | | | | | | | | |
| (a) | Total return represents the rate that the investor would have earned or lost on an investment in the Fund, assuming reinvestment of distributions. |
See accompanying notes which are an integral part of these financial statements.
| Dean Mid Cap Value Fund |
| Financial Highlights |
| |
| (For a share outstanding during each period) |
| | | For the Years Ended March 31, | |
| | | 2023 | | | 2022 | | | 2021 | | | 2020 | | | 2019 | |
| Selected Per Share Data: | | | | | | | | | | | | | | | | | | | | |
| Net asset value, beginning of year | | $ | 23.79 | | | $ | 22.58 | | | $ | 14.26 | | | $ | 19.83 | | | $ | 19.87 | |
| | | | | | | | | | | | | | | | | | | | | |
| Investment operations: | | | | | | | | | | | | | | | | | | | | |
| Net investment income | | | 0.29 | | | | 0.19 | | | | 0.16 | | | | 0.22 | | | | 0.22 | |
| Net realized and unrealized gain (loss) | | | (0.41 | ) | | | 2.34 | | | | 8.34 | | | | (4.08 | ) | | | 0.36 | |
| Total from investment operations | | | (0.12 | ) | | | 2.53 | | | | 8.50 | | | | (3.86 | ) | | | 0.58 | |
| | | | | | | | | | | | | | | | | | | | | |
| Less distributions to shareholders from: | | | | | | | | | | | | | | | | | | | | |
| Net investment income | | | (0.21 | ) | | | (0.20 | ) | | | (0.18 | ) | | | (0.22 | ) | | | (0.16 | ) |
| Net realized gains | | | (0.97 | ) | | | (1.12 | ) | | | — | | | | (1.49 | ) | | | (0.46 | ) |
| Total distributions | | | (1.18 | ) | | | (1.32 | ) | | | (0.18 | ) | | | (1.71 | ) | | | (0.62 | ) |
| | | | | | | | | | | | | | | | | | | | | |
| Net asset value, end of year | | $ | 22.49 | | | $ | 23.79 | | | $ | 22.58 | | | $ | 14.26 | | | $ | 19.83 | |
| | | | | | | | | | | | | | | | | | | | | |
| Total Return(a) | | | (0.50 | )% | | | 11.22 | % | | | 59.75 | % | | | (22.04 | )% | | | 3.10 | % |
| | | | | | | | | | | | | | | | | | | | | |
| Ratios and Supplemental Data: | | | | | | | | | | | | | | | | | | | | |
| Net assets, end of year (000 omitted) | | $ | 74,467 | | | $ | 80,380 | | | $ | 79,576 | | | $ | 32,673 | | | $ | 41,889 | |
| Ratio of net expenses to average net assets | | | 0.85 | % | | | 0.85 | % | | | 0.85 | % | | | 1.02 | % | | | 1.10 | % |
| Ratio of gross expenses to average net assets before waiver or recoupment | | | 1.08 | % | | | 1.06 | % | | | 1.15 | % | | | 1.30 | % | | | 1.40 | % |
| Ratio of net investment income to average net assets | | | 1.25 | % | | | 0.75 | % | | | 1.20 | % | | | 1.14 | % | | | 1.20 | % |
| Portfolio turnover rate | | | 22 | % | | | 27 | % | | | 65 | % | | | 76 | % | | | 46 | % |
| | | | | | | | | | | | | | | | | | | | | |
| (a) | Total return represents the rate that the investor would have earned or lost on an investment in the Fund, assuming reinvestment of distributions. |
See accompanying notes which are an integral part of these financial statements.
| Dean Equity Income Fund |
| Financial Highlights |
| |
| (For a share outstanding during each period) |
| | | For the | |
| | | Period | |
| | | Ended | |
| | | March 31, | |
| | | 2023(a) | |
| Selected Per Share Data: | | | | |
| Net asset value, beginning of year | | $ | 20.00 | |
| | | | | |
| Investment operations: | | | | |
| Net investment income | | | 0.18 | |
| Net realized and unrealized loss | | | (0.71 | ) |
| Total from investment operations | | | (0.53 | ) |
| | | | | |
| Less distributions to shareholders from: | | | | |
| Net investment income | | | (0.06 | ) |
| Total distributions | | | (0.06 | ) |
| | | | | |
| Net asset value, end of year | | $ | 19.41 | |
| | | | | |
| Total Return(b) | | | (2.66 | )% (c) |
| | | | | |
| Ratios and Supplemental Data: | | | | |
| Net assets, end of year (000 omitted) | | $ | 73,647 | |
| Ratio of net expenses to average net assets | | | 0.70 | % (d) |
| Ratio of gross expenses to average net assets before waiver or recoupment | | | 1.04 | % (d) |
| Ratio of net investment income to average net assets | | | 3.62 | % (d) |
| Portfolio turnover rate | | | 16 | % (c) |
| | | | | |
| (a) | For the period November 22, 2022(commencement of operations) to March 31, 2023. |
| (b) | Total return represents the rate that the investor would have earned or lost on an investment in the Fund, assuming reinvestment of distributions. |
See accompanying notes which are an integral part of these financial statements.
| Dean Funds |
| Notes to the Financial Statements |
| March 31, 2023 |
NOTE 1. ORGANIZATION
Dean Small Cap Value Fund (the “Small Cap Fund”), Dean Mid Cap Value Fund (the “Mid Cap Fund”) and Dean Equity Income Fund (the “Equity Income Fund”) (each a “Fund” and, collectively the “Funds”), are each organized as diversified series of Unified Series Trust (the “Trust”). The Small Cap Fund and the Mid Cap Fund were organized on November 13, 2006 and the Equity Income Fund was organized on November 22, 2022. The Funds are registered under the Investment Company Act of 1940, as amended (“1940 Act”). The Trust is an open-end investment company established under the laws of Ohio by an Agreement and Declaration of Trust dated October 14, 2002, as amended from time to time (the “Trust Agreement”). The Trust Agreement permits the Board of Trustees (the “Board”) to issue an unlimited number of shares of beneficial interest of separate series. The Funds are each a series of the Trust currently authorized by the Board. The investment adviser to each Fund is Dean Investment Associates, LLC (“Dean Investment Associates” or “Adviser”). In addition, the Adviser has retained Dean Capital Management, LLC (“DCM” or “Sub-Adviser”) to serve as sub-adviser to the Funds. DCM is an affiliate of the Adviser. The investment objective of the Small Cap Fund and the Mid Cap Fund is long-term capital appreciation and, secondarily, dividend income. The investment objective of the Equity Income Fund is long-term capital appreciation an, secondarily, income focus.
NOTE 2. SIGNIFICANT ACCOUNTING POLICIES
The Funds are investment companies and follow accounting and reporting guidance under Financial Accounting Standards Board Accounting Standards Codification (“ASC”) Topic 946, “Financial Services-Investment Companies” including Accounting Standards Update 2013-08. The following is a summary of significant accounting policies followed by the Funds in the preparation of their financial statements. These policies are in conformity with generally accepted accounting principles in the United States of America (“GAAP”).
Estimates – The preparation of financial statements in conformity with GAAP requires management to make estimates and assumptions that affect the reported amounts of assets and liabilities and disclosure of contingent assets and liabilities at the date of the financial statements and the reported amounts of increases and decreases in net assets from operations during the reporting period. Actual results could differ from those estimates.
Federal Income Taxes – The Funds make no provision for federal income or excise tax. Each Fund has qualified and intends to qualify each year as a regulated investment company (“RIC”) under subchapter M of the Internal Revenue Code of 1986, as amended, by complying with the requirements applicable to RICs and by distributing substantially all of its taxable income. Each Fund also intends to distribute sufficient net investment income and net capital gains, if any, so that it will not be subject to excise tax on
| Dean Funds |
| Notes to the Financial Statements (continued) |
| March 31, 2023 |
undistributed income and gains. If the required amount of net investment income or gains is not distributed, the Funds could incur a tax expense.
As of and during the fiscal year ended March 31, 2023, the Funds did not have any liabilities for any unrecognized tax benefits. The Funds recognize interest and penalties, if any, related to unrecognized tax benefits as income tax expense in the Statements of Operations when incurred. During the year, the Funds did not incur any interest or penalties. Management of the Funds has reviewed tax positions taken in tax years that remain subject to examination by all major tax jurisdictions, including federal (i.e., the previous three tax year ends and the interim tax period since then, as applicable) and has concluded that no provision for unrecognized tax benefits or expenses is required in these financial statements and does not expect this to change over the next twelve months.
Expenses – Expenses incurred by the Trust that do not relate to a specific Fund are allocated to the individual funds of the Trust based on each Fund’s relative net assets or another appropriate basis (as determined by the Board).
Security Transactions and Related Income – The Funds follow industry practice and record security transactions on the trade date for financial reporting purposes. The specific identification method is used for determining gains or losses for financial statements and income tax purposes. Dividend income is recorded on the ex-dividend date and interest income is recorded on an accrual basis. Distributions received from investments in real estate investment trusts (“REITs”) that represent a return of capital or capital gain are recorded as a reduction of the cost of investment or as a realized gain, respectively. The calendar year-end amounts of ordinary income, capital gains, and return of capital included in distributions received from the Funds’ investments in REITs are reported to the Funds after the end of the calendar year; accordingly, the Funds estimate these amounts for accounting purposes until the characterization of REIT distributions is reported. Estimates are based on the most recent REIT distributions information available. Withholding taxes on foreign dividends and related reclaims have been provided for in accordance with the Funds’ understanding of the applicable country’s tax rules and rates.
Dividends and Distributions – Each Fund intends to distribute its net investment income and net realized long-term and short-term capital gains, if any, at least annually. Dividends and distributions to shareholders, which are determined in accordance with income tax regulations, are recorded on the ex-dividend date. The treatment for financial reporting purposes of distributions made to shareholders during the period from net investment income or net realized capital gains may differ from their ultimate treatment for federal income tax purposes. These differences are caused primarily by differences in the timing of the recognition of certain components of income, expense or realized capital gain for federal income tax purposes. Where such differences are permanent in nature, they are
| Dean Funds |
| Notes to the Financial Statements (continued) |
| March 31, 2023 |
reclassified among the components of the net assets based on their ultimate characterization for federal income tax purposes. Any such reclassifications will have no effect on net assets, results of operations or net asset value (“NAV”) per share of the Funds.
Cash and Cash Equivalents — Idle cash may be swept into various interest bearing overnight demand deposits and is classified as a cash equivalent on the Statements of Assets and Liabilities. The Funds maintain cash in the bank deposit accounts which, at times, may exceed the Federal Deposit Insurance Corporation (FDIC) limit of $250,000. Amounts swept overnight are available on the next business day.
NOTE 3. SECURITIES VALUATION AND FAIR VALUE MEASUREMENTS
Each Fund values its portfolio securities at fair value as of the close of regular trading on the New York Stock Exchange (“NYSE”) (normally 4:00 p.m. Eastern time) on each business day the NYSE is open for business. Fair value is defined as the price that a Fund would receive upon selling an investment in a timely transaction to an independent buyer in the principal or most advantageous market of the investment. GAAP establishes a three-tier hierarchy to maximize the use of observable market data and minimize the use of unobservable inputs and to establish classification of fair value measurements for disclosure purposes.
Inputs refer broadly to the assumptions that market participants would use in pricing the asset or liability, including assumptions about risk (the risk inherent in a particular valuation technique used to measure fair value including a pricing model and/or the risk inherent in the inputs to the valuation technique). Inputs may be observable or unobservable. Observable inputs are inputs that reflect the assumptions market participants would use in pricing the asset or liability developed based on market data obtained and available from sources independent of the reporting entity. Unobservable inputs are inputs that reflect the reporting entity’s own assumptions about the assumptions market participants would use in pricing the asset or liability developed based on the best information available in the circumstances.
Various inputs are used in determining the value of each Fund’s investments. These inputs are summarized in the three broad levels listed below.
| ● | Level 1 – unadjusted quoted prices in active markets for identical investments and/or registered investment companies where the value per share is determined and published and is the basis for current transactions for identical assets or liabilities at the valuation date |
| Dean Funds |
| Notes to the Financial Statements (continued) |
| March 31, 2023 |
| ● | Level 2 – other significant observable inputs (including, but not limited to, quoted prices for an identical security in an inactive market, quoted prices for similar securities, interest rates, prepayment speeds, credit risk, etc.) |
| ● | Level 3 – significant unobservable inputs (including the Funds’ own assumptions in determining fair value of investments based on the best information available) |
The inputs used to measure fair value may fall into different levels of the fair value hierarchy. In such cases, for disclosure purposes, the level in the fair value hierarchy which is reported is determined based on the lowest level input that is significant to the fair value measurement in its entirety.
Equity securities that are traded on any stock exchange are generally valued at the last quoted sale price on the security’s primary exchange. Lacking a last sale price, an exchange-traded security is generally valued at its last bid price. Securities traded in the Nasdaq over-the-counter market are generally valued at the Nasdaq Official Closing Price. When using market quotations and when the market is considered active, the security is classified as a Level 1 security. In the event that market quotations are not readily available or are considered unreliable due to market or other events, securities are valued in good faith by the Adviser, as Valuation Designee, under the oversight of the Board’s Pricing & Liquidity Committee. The Adviser has adopted written policies and procedures for valuing securities and other assets in circumstances where market quotes are not readily available in conformity with guidelines adopted by the Board. In the event that market quotes are not readily available, and the security or asset cannot be valued pursuant to one of the valuation methods, the value of the security or asset will be determined in good faith by the Valuation Designee pursuant to its policies and procedures. To assist the Valuation Designee in carrying out the responsibility to determine the fair value of any securities or other assets for which market quotations are not readily available, the Trust has created a fair valuation pricing committee (the “Fair Value Committee”). The Fair Value Committee consists of the following standing members: (a) the Trust’s Treasurer or designee, (b) a representative of Ultimus and (c) on an ad hoc basis at a particular valuation time for which a fair valuation method is being determined for a Fund, a representative of the Adviser, which is the Valuation Designee. The Fair Value Committee will review any fair value provided by the Valuation Designee, subject to the ultimate review of the pricing methodology by the Pricing & Liquidity Committee of the Board on a quarterly basis. Under these policies, the securities will be classified as Level 2 or 3 within the fair value hierarchy, depending on the inputs used.
Investments in mutual funds, including money market mutual funds, are generally priced at the ending NAV provided by the service agent of the mutual funds. These securities are categorized as Level 1 securities.
| Dean Funds |
| Notes to the Financial Statements (continued) |
| March 31, 2023 |
In accordance with the Trust’s valuation policies and fair value determinations pursuant to Rule 2a-5 under the 1940 Act, the Valuation Designee is required to consider all appropriate factors relevant to the value of securities for which it has determined other pricing sources are not available or reliable as described above. No single method exists for determining fair value because fair value depends upon the circumstances of each individual case. As a general principle, the current fair value of a security being valued by the Valuation Designee would be the amount that a Fund might reasonably expect to receive upon the current sale. Methods that are in accordance with this principle may, for example, be based on (i) a multiple of earnings; (ii) a discount from market prices of a similar freely traded security (including a derivative security or a basket of securities traded on other markets, exchanges or among dealers); or (iii) yield to maturity with respect to debt issues, or a combination of these and other methods. Fair-value pricing is permitted if, in the Valuation Designee’s opinion, the validity of market quotations appears to be questionable based on factors such as evidence of a thin market in the security based on a small number of quotations, a significant event occurs after the close of a market but before a Fund’s NAV calculation that may affect a security’s value, or the Valuation Designee is aware of any other data that calls into question the reliability of market quotations.
The following is a summary of the inputs used to value the Funds’ investments as of March 31, 2023:
| Small Cap Fund | | | | | Valuation Inputs | | | | | | | |
| Assets | | Level 1 | | | Level 2 | | | Level 3 | | | Total | |
| Common Stocks(a) | | $ | 204,538,264 | | | $ | — | | | $ | — | | | $ | 204,538,264 | |
| Total | | $ | 204,538,264 | | | $ | — | | | $ | — | | | $ | 204,538,264 | |
| | | | | | | | | | | | | | | | | |
| Mid Cap Fund | | | | | Valuation Inputs | | | | | | | |
| Assets | | Level 1 | | | Level 2 | | | Level 3 | | | Total | |
| Common Stocks(a) | | $ | 71,189,228 | | | $ | — | | | $ | — | | | $ | 71,189,228 | |
| Total | | $ | 71,189,228 | | | $ | — | | | $ | — | | | $ | 71,189,228 | |
| | | | | | | | | | | | | | | | | |
| Equity Income Fund | | | | | Valuation Inputs | | | | | | | |
| Assets | | Level 1 | | | Level 2 | | | Level 3 | | | Total | |
| Common Stocks(a) | | $ | 70,236,375 | | | $ | — | | | $ | — | | | $ | 70,236,375 | |
| Total | | $ | 70,236,375 | | | $ | — | | | $ | — | | | $ | 70,236,375 | |
| (a) | Refer to Schedule of Investments for sector classifications. |
The Funds did not hold any investments at the end of the reporting period in which significant unobservable inputs (Level 3) were used in determining fair value; therefore, no reconciliation of Level 3 securities is included for this reporting period.
| Dean Funds |
| Notes to the Financial Statements (continued) |
| March 31, 2023 |
NOTE 4. FEES AND OTHER TRANSACTIONS WITH AFFILIATES AND OTHER SERVICE PROVIDERS
Each Fund’s investments are managed by the Adviser pursuant to the terms of a management agreement with the Trust. The Adviser has hired the Sub-Adviser to manage the Funds’ assets on a day-to-day basis. The Sub-Adviser is paid by the Adviser. In accordance with the management agreement for each Fund, the Adviser is entitled to a management fee, computed and accrued daily and paid monthly, at an annual rate of 0.90%, 0.75% and 0.50% of the average daily net assets of the Small Cap Fund, the Mid Cap Fund and the Equity Income Fund, respectively. For the fiscal year ended March 31, 2023, the Adviser earned management fees, before the waiver described below, of $1,697,866, $567,956 and $72,377 from the Small Cap Fund, the Mid Cap Fund and the Equity Income Fund, respectively. At March 31, 2023, the Adviser was owed $158,396 from the Small Cap Fund, $34,693 from the Mid Cap Fund and $11,583 from the Equity Income Fund.
The Adviser has contractually agreed to waive its management fee and/or to reimburse certain Fund operating expenses through July 31, 2023 for the Small Cap Fund and the Mid Cap Fund, and through July 31, 2024 for the Equity Income Fund, but only to the extent necessary so that total annual operating expenses, excluding portfolio transaction and other investment-related costs (including brokerage fees and commissions); taxes; borrowing costs (such as interest and dividend expenses on securities sold short); acquired fund fees and expenses; fees and expenses associated with investments in other collective investment vehicles or derivative instruments (including for example option and swap fees and expenses); any amounts payable pursuant to a distribution or service plan adopted in accordance with Rule 12b-1 under the 1940 Act; expenses incurred in connection with any merger or reorganization; extraordinary expenses (such as litigation expenses, indemnification of Trust officers and Trustees and contractual indemnification of Fund service providers, and other expenses that the Trustees agree have not been incurred in the ordinary course of the Funds’ business), do not exceed 1.25% of the Small Cap Fund’s average daily net assets, 0.85% of the Mid Cap Fund’s average daily net assets and 0.70% of the Equity Income Fund’s average daily net assets. For the fiscal year ended March 31, 2023, the Adviser waived fees of $172,518 and $48,813 for the Mid Cap Fund and the Equity Income Fund, respectively.
Each waiver/expense payment by the Adviser is subject to recoupment by the Adviser from the Fund in the three years following the date the particular waiver/expense payment occurred, but only if such recoupment can be achieved without exceeding the annual expense limitation in effect at the time of the waiver/expense payment and any expense limitation in effect at the time of recoupment. As of March 31, 2023, the Adviser may seek repayment of management fees waived and expense reimbursements pursuant to the
| Dean Funds |
| Notes to the Financial Statements (continued) |
| March 31, 2023 |
aforementioned conditions, from the Mid Cap Fund and the Equity Income Fund no later than the dates stated below:
| | | | | | Equity Income | |
| Recoverable Through | | Mid Cap Fund | | | Fund | |
| March 31, 2024 | | $ | 163,089 | | | | | |
| March 31, 2025 | | | 170,376 | | | | | |
| March 31, 2026 | | | 172,518 | | | $ | 48,813 | |
Ultimus Fund Solutions, LLC (“Ultimus”) provides administration, fund accounting and transfer agent services to the Funds. The Funds pay Ultimus fees in accordance with the agreements for such services.
Northern Lights Compliance Services, LLC (“NLCS”), an affiliate of Ultimus, provides a Chief Compliance Officer to the Trust, as well as related compliance services, pursuant to a consulting agreement between NLCS and the Trust. Under the terms of such agreement, NLCS receives fees from the Funds, which are approved annually by the Board.
Under the terms of a Distribution Agreement with the Trust, Ultimus Fund Distributors, LLC (the “Distributor”) serves as principal underwriter to the Funds. The Distributor is a wholly-owned subsidiary of Ultimus. The Distributor is compensated by the Adviser (not the Funds) for acting as principal underwriter.
Certain officers and a Trustee of the Trust are also employees of Ultimus and such persons are not paid by the Funds for serving in such capacities.
The Board supervises the business activities of the Trust. Each Trustee serves as a trustee until termination of the Trust unless the Trustee dies, resigns, retires, or is removed. The Chair of the Board and more than 75% of the Trustees are “Independent Trustees,” which means that they are not “interested persons” as defined in the 1940 Act. The Independent Trustees review and establish compensation at least annually. Each Independent Trustee of the Trust receives annual compensation, which is an established amount paid quarterly per fund in the Trust at the time of the regular quarterly Board meetings. The Chair of the Board receives the highest compensation, commensurate with his additional duties and each Chair of a committee receives additional compensation as well. Independent Trustees also receive $1,000 for attending any special meeting that requires an in-person approval of a contract and $250 for the first hour and $200 for each additional hour for attending other special meetings. In addition, the Trust reimburses Independent Trustees for out-of-pocket expenses incurred in conjunction with attendance at meetings.
| Dean Funds |
| Notes to the Financial Statements (continued) |
| March 31, 2023 |
NOTE 5. PURCHASES AND SALES OF SECURITIES
For the fiscal year ended March 31, 2023, purchases and sales of investment securities, other than short-term investments, were as follows:
| | | Purchases | | | Sales | |
| Small Cap Fund | | $ | 166,631,124 | | | $ | 140,076,839 | |
| Mid Cap Fund | | | 15,680,054 | | | | 19,533,061 | |
| Equity Income Fund | | | 78,423,644 | | | | 6,608,387 | |
There were no purchases or sales of long-term U.S. government obligations during the fiscal year ended March 31, 2023.
NOTE 6. FEDERAL TAX INFORMATION
At March 31, 2023, the net unrealized appreciation (depreciation) and tax cost of investments for tax purposes was as follows:
| | | Small Cap | | | Mid Cap | | | Equity Income | |
| | | Fund | | | Fund | | | Fund | |
| Gross unrealized appreciation | | $ | 11,025,984 | | | $ | 14,966,840 | | | $ | 1,033,443 | |
| Gross unrealized depreciation | | | (9,272,616 | ) | | | (60,595 | ) | | | (2,656,185 | ) |
| Net unrealized appreciation (depreciation) | | $ | 1,753,368 | | | $ | 14,906,245 | | | $ | (1,622,742 | ) |
| Tax cost of investments | | $ | 202,784,896 | | | $ | 56,282,982 | | | $ | 71,859,116 | |
The tax character of distributions paid for the fiscal years ended March 31, 2023 and March 31, 2022 were as follows:
| | | | | | | | | | | | | | | Equity Income | |
| | | Small Cap Fund | | | Mid Cap Fund | | | Fund | |
| | | 2023 | | | 2022 | | | 2023 | | | 2022 | | | 2023 | |
| Distributions paid from: | | | | | | | | | | | | | | | | | | | | |
| Ordinary income(a) | | $ | 2,517,470 | | | $ | 1,786,178 | | | $ | 692,115 | | | $ | 1,278,861 | | | $ | 50,960 | |
| Long-term capital gains | | | — | | | | — | | | | 3,175,758 | | | | 3,040,819 | | | | — | |
| Total | | $ | 2,517,470 | | | $ | 1,786,178 | | | $ | 3,867,873 | | | $ | 4,319,680 | | | $ | 50,960 | |
| (a) | Short-term capital gain distributions are treated as ordinary income for tax purposes. |
| Dean Funds |
| Notes to the Financial Statements (continued) |
| March 31, 2023 |
At March 31, 2023, the components of accumulated earnings (deficit) on a tax basis were as follows:
| | | | | | | | | Equity Income | |
| | | Small Cap Fund | | | Mid Cap Fund | | | Fund | |
| Undistributed ordinary income | | $ | 2,372,654 | | | $ | 394,987 | | | $ | 522,874 | |
| Undistributed long-term capital gains | | | — | | | | 3,233,339 | | | | 5,834 | |
| Accumulated capital and other losses | | | (63,860 | ) | | | — | | | | — | |
| Unrealized appreciation (depreciation) on investments | | | 1,753,368 | | | | 14,906,246 | | | | (1,622,742 | ) |
| Total accumulated earnings (deficit) | | $ | 4,062,162 | | | $ | 18,534,572 | | | $ | (1,094,034 | ) |
The difference between book basis and tax basis of unrealized appreciation (depreciation) is primarily attributable to the tax deferral of losses on wash sales.
As of March 31, 2023, the Small Cap Fund had short-term capital loss carryforwards of $63,860. These capital loss carryforwards, which do not expire, may be utilized in future years to offset net realized capital gains, if any, prior to distributing such gains to shareholders.
During the fiscal year ended March 31, 2023 Small Cap Fund utilized capital loss carryforwards of $18,246,863.
NOTE 7. SECTOR RISK
If a Fund has significant investments in the securities of issuers within a particular sector, any development affecting that sector will have a greater impact on the value of the net assets of the Fund than would be the case if the Fund did not have significant investments in that sector. In addition, this may increase the risk of loss in the Fund and increase the volatility of the Fund’s NAV per share. For instance, economic or market factors, regulatory changes or other developments may negatively impact all companies in a particular sector, and therefore the value of the Fund’s portfolio will be adversely affected.
NOTE 8. COMMITMENTS AND CONTINGENCIES
Under the Trust’s organizational documents, its Officers and Trustees are indemnified against certain liabilities arising out of the performance of their duties to the Funds. In addition, in the normal course of business, the Funds entered into contracts with its service providers, on behalf of the Funds, and others that provide for general indemnifications. The Funds’ maximum exposure under these arrangements is unknown, as this would involve future claims that may be made against the Funds. The Funds expect the risk of loss to be remote, however, there can be no assurance that such obligations will not result in material liabilities that adversely affect the Funds.
| Dean Funds |
| Notes to the Financial Statements (continued) |
| March 31, 2023 |
NOTE 9. SUBSEQUENT EVENTS
Management of the Funds has evaluated the need for disclosures and/or adjustments resulting from subsequent events through the date at which these financial statements were issued. Based upon this evaluation, management has determined there were no items requiring adjustment of the financial statements or additional disclosure.
| Report of Independent Registered Public Accounting Firm |
To the Shareholders of Dean Funds and
Board of Trustees of Unified Series Trust
Opinion on the Financial Statements
We have audited the accompanying statements of assets and liabilities, including the schedules of investments, of Dean Funds, comprising the funds listed below (the “Funds”), each a series of Unified Series Trust, as of March 31, 2023, the related statements of operations, the statements of changes in net assets, the related notes, and the financial highlights for each of the periods indicated below (collectively referred to as the “financial statements”). In our opinion, the financial statements present fairly, in all material respects, the financial position of each of the Funds as of March 31, 2023, the results of their operations, the changes in net assets, and the financial highlights for each of the periods indicated below in conformity with accounting principles generally accepted in the United States of America.
| | | Statements of | |
| | Statements of | Changes in Net | Financial |
| Fund Name | Operations | Assets | Highlights |
| Dean Mid Cap Value Fund | For the year | For the years | For the years |
| Dean Small Cap Value Fund | ended March 31, 2023 | ended March 31, 2023 and 2022 | ended March 31, 2023, 2022, 2021, 2020, and 2019 |
| Dean Equity Income Fund | For the period from November 22, 2022 (commencement of operations) through March 31, 2023 |
Basis for Opinion
These financial statements are the responsibility of the Funds’ management. Our responsibility is to express an opinion on the Funds’ financial statements based on our audits. We are a public accounting firm registered with the Public Company Accounting Oversight Board (United States) (“PCAOB”) and are required to be independent with respect to the Funds in accordance with the U.S. federal securities laws and the applicable rules and regulations of the Securities and Exchange Commission and the PCAOB.
We conducted our audits in accordance with the standards of the PCAOB. Those standards require that we plan and perform the audit to obtain reasonable assurance about whether the financial statements are free of material misstatement whether due to error or fraud.
Our audits included performing procedures to assess the risks of material misstatement of the financial statements, whether due to error or fraud, and performing procedures that respond to those risks. Such procedures included examining, on a test basis, evidence regarding the amounts and disclosures in the financial statements. Our procedures included confirmation of securities owned as of March 31, 2023, by correspondence with the custodian and brokers; when replies were not received from brokers, we performed other auditing procedures. Our audits also included evaluating the accounting principles used and significant estimates made by management, as well as evaluating
| Report of Independent Registered Public Accounting Firm (continued) |
the overall presentation of the financial statements. We believe that our audits provide a reasonable basis for our opinion.
We have served as the Funds’ auditor since 2007.

COHEN & COMPANY, LTD.
Chicago, Illinois
May 22, 2023
| Liquidity Risk Management Program (Unaudited) |
The Funds have adopted and implemented a written liquidity risk management program (the “Program”) as required by Rule 22e-4 (the “Liquidity Rule”) under the 1940 Act. The Program is reasonably designed to assess and manage each Fund’s liquidity risk, taking into consideration, among other factors, the Fund’s investment strategy and the liquidity of its portfolio investments during normal and reasonably foreseeable stressed conditions; its short and long-term cash flow projections; and its cash holdings and access to other funding sources. The Board approved the appointment of the Liquidity Administrator Committee, comprising certain Trust officers and employees of the Adviser. The Liquidity Administrator Committee maintains Program oversight and reports to the Board on at least an annual basis regarding the Program’s operational effectiveness through a written report (the “Report”). The most recent Report, which was presented to the Board for consideration at its meeting held on August 16, 2022, outlined the operation of the Program and the adequacy and effectiveness of the Program’s implementation. During the review period, the Funds did not experience unusual stress or disruption to their operations related to purchase and redemption activity. Also, during the review period the Funds held adequate levels of cash and highly liquid investments to meet shareholder redemption activities in accordance with applicable requirements. The Report concluded that the Program is reasonably designed to prevent violation of the Liquidity Rule and has been effectively implemented.
| Investment Advisory Agreement Approval (Unaudited) |
The Dean Mid Cap Value Fund (the “Mid Cap Fund”) and the Dean Small Cap Value Fund (the “Small Cap Fund”) (together the “Funds” and each, a “Fund”) are series of Unified Series Trust (the “Trust”). The Trust’s Board of Trustees (the “Board” or the “Trustees”) oversees the management of the Funds and, as required by law, has considered the approval of the continuance of the Funds’ management agreements with their investment adviser, Dean Investment Associates, LLC (“DIA”) and the sub-advisory agreement between DIA and Dean Capital Management, LLC (“DCM”).
The Board requested and evaluated all information that the Trustees deemed reasonably necessary under the circumstances in connection with the approval of the continuance of the management agreements and the sub-advisory agreement.
The Trustees held a teleconference on November 9, 2022 to review and discuss materials compiled by Ultimus Fund Solutions, LLC, the Trust’s administrator, with regard to the management agreements between the Trust and DIA, and the sub-advisory agreement between DIA and DCM. At the Trustees’ quarterly meeting held in November 2022, the Board interviewed certain executives of DIA and DCM, including DIA’s Chief Compliance Officer and its President, and DCM’s Chief Compliance Officer and portfolio managers. The Trustees, including the Trustees who are not “interested persons” (as that term is defined in the Investment Company Act of 1940) of the Trust, DIA or DCM (the “Independent Trustees”), approved the continuance of the management agreements between the Trust and DIA, and the sub-advisory agreement between DIA and DCM, for an additional year. The Trustees’ approval of the continuance of the Funds’ management agreements and sub-advisory agreement were based on a consideration of all the information provided to the Trustees, and were not the result of any single factor. Some of the factors that figured particularly in the Trustees’ deliberations are described below, although individual Trustees may have evaluated this information differently, ascribing different weights to various factors.
(i) The Nature, Extent, and Quality of Services. The Trustees reviewed and considered information regarding the nature, extent, and quality of services that DIA and DCM provide to the Funds, which include, but are not limited to, providing a continuous investment program for the Funds, adhering to the Funds’ investment restrictions, complying with the Trust’s policies and procedures, and voting proxies on behalf of the Funds. The
Trustees considered the qualifications and experience of DCM’s portfolio managers who are responsible for the day-to-day management of the Funds’ portfolios, as well as the qualifications and experience of the other individuals at DIA and DCM who provide services to the Funds. The Trustees also considered the favorable compliance report from the Trust CCO. The Trustees then reviewed the services provided by DIA in its oversight of DCM, noting that the two investment advisers are affiliated. The Trustees agreed that the work of DIA is not duplicative of DCM and that each is responsible for a significant amount of work on behalf of the Funds. The Trustees concluded that they continue to be impressed with the nature, extent, and quality of investment management services provided by each of DIA and DCM to the Funds and their commitment to value investing.
(ii) Fund Performance. The Trustees next reviewed and discussed the Funds’ performance for periods ended September 30, 2022. The Trustees observed that the Small Cap Fund had
| Investment Advisory Agreement Approval (Unaudited) (continued) |
outperformed its primary benchmark, the Russell 2000 Value Index, Morningstar category, and peer group over the one-year, three-year, and five-year periods but had underperformed each over the since inception period. The Trustees observed that the Mid Cap Fund had outperformed its primary benchmark, the Russell Midcap Value Index, and peer group over the one-year, three-year, and five-year periods. The Trustees acknowledged that the Fund underperformed the Russell MidCap Value Index and Morningstar category over the since inception period and performed in line with its peer group over the same period. The Trustees noted that the Mid Cap Fund outperformed its Morningstar category over each period except the since inception period. The Trustees considered that the Mid Cap Fund changed its investment strategy from large cap value to mid-cap value in 2011 and more than ten years has passed since that change. The Trustees also noted that the Funds performed comparably to DIA’s separately managed accounts that have similar investment strategies, considering differences in fees and methods of calculating performance. The Trustees considered the Funds’ performance to be satisfactory.
(iii) Fee Rate and Profitability. The Trustees reviewed fee and expense comparisons for the Funds’ respective Morningstar categories. The comparisons indicated that the Small Cap Fund’s management fee and net expense ratio are slightly higher than the median and average of its Morningstar category. The comparisons indicated that the Mid Cap Fund’s management fee is higher than the median and average of its Morningstar category but that its net expense ratio is equal to the median but slightly higher than the average. The Trustees also noted that the management fee and net expense ratio for each Fund is comparable to the median of each Fund’s custom peer group. The Trustees noted that DIA is continuing the expense limitation agreements for the Funds. The Trustees discussed and considered both the management fee and the sub-advisory fee and noted that that the management fee for both Funds is lower than the highest management fee in a sliding fee scale for DIA’s separately managed accounts.
The Trustees also considered profitability analyses prepared by DIA and DCM for their management of each Fund, which indicated that DIA is earning a profit as a result of managing the Small Cap Fund but is not earning a profit as a result of managing the Mid Cap Fund. The Trustees therefore considered that DCM is earning a profit both before and after deduction of marketing expenses as a result of managing the Small Cap Fund and that DCM is effectively breaking even as a result of managing the Mid Cap Fund. The Trustees determined that the profits for DIA and DCM were not excessive, based in part on their review of expense comparisons in the Broadridge 15(c) report prepared for the Board.
The Trustees also considered other potential benefits that DIA or DCM may receive in connection with its management of the Funds and noted that DIA utilizes soft dollars in accordance with its compliance policies and procedures. After considering the above information, the Trustees concluded that the current management fee and sub-advisory fee for each Fund represent reasonable compensation in light of the nature and quality of DIA’s and DCM’s respective services to the Fund,
| Investment Advisory Agreement Approval (Unaudited) (continued) |
the fees paid by competitive mutual funds, and the profitability of DIA’s and DCM’s services to the Fund.
(iv) Economies of Scale. In determining the reasonableness of the management fee and sub-advisory fee for each Fund, the Trustees also considered the extent to which DIA and DCM will realize economies of scale as each Fund grows larger. The Trustees determined that, in light of the size of the Funds and DIA’s and DCM’s levels of profitability in managing the Funds, it does not appear that DIA or DCM is realizing benefits from economies of scale in managing the Funds to such an extent that breakpoints should be implemented at this time.
| Investment Advisory Agreement Approval (Unaudited) (continued) |
The Dean Equity Income Fund (the “Fund”) is a series of Unified Series Trust (the “Trust”). The Trust’s Board of Trustees (the “Board” or the “Trustees”) oversees the management of the Fund and, as required by law, has considered the approval of the Fund’s management agreement with its investment adviser, Dean Investment Associates, LLC (“DIA”) and the sub-advisory agreement between DIA and Dean Capital Management, LLC (“DCM”).
The Board requested and evaluated all information that the Trustees deemed reasonably necessary under the circumstances in connection with the approval of the management agreement and the sub-advisory agreement.
The Trustees held a teleconference on November 9, 2022 to review and discuss materials compiled by Ultimus Fund Solutions, LLC, the Trust’s administrator, with regard to the management agreement between the Trust and DIA, and the sub-advisory agreement between DIA and DCM. At the Trustees’ quarterly meeting held in November 2022, the Board interviewed certain executives of DIA and DCM, including DIA’s Chief Compliance Officer and its President, and DCM’s Chief Compliance Officer and portfolio managers. The Trustees, including the Trustees who are not “interested persons” (as that term is defined in the Investment Company Act of 1940) of the Trust, DIA or DCM (the “Independent Trustees”), approved the management agreement between the Trust and DIA, and the sub-advisory agreement between DIA and DCM, for an initial period of two years. The Trustees’ approval of the Fund’s management agreement and sub-advisory agreement were based on a consideration of all the information provided to the Trustees, and were not the result of any single factor. Some of the factors that figured particularly in the Trustees’ deliberations are described below, although individual Trustees may have evaluated this information differently, ascribing different weights to various factors.
(i) The Nature, Extent, and Quality of Services. The Trustees reviewed and considered information regarding the nature, extent, and quality of services that DIA and DCM would provide to the Fund, which include, but are not limited to, providing a continuous investment program for the Fund, adhering to the Fund’s investment restrictions, complying with the Trust’s policies and procedures, and voting proxies on behalf of the Fund. The Trustees considered the qualifications and experience of DCM’s portfolio manager who would be responsible for the day-to-day management of the Fund’s portfolio, as well as the qualifications and experience of the other individuals at DIA and DCM who would provide services to the Fund. The Trustees noted their history with DIA and DCM and their confidence in DIA and DCM’s ability to manage a fund. After a thorough discussion and consideration, the Trustees concluded that DIA and DCM have adequate resources to provide satisfactory investment management services to the Fund.
(ii) Fund Performance. The Trustees next reviewed and discussed the performance of DIA and DCM’s separately managed account that has an investment strategy similar to that of the Fund, noting that the account outperformed its benchmark, the Russell 1000 Value Index, over the one-year, five-year, ten-year and since inception periods. It was the consensus of the Trustees that it was reasonable to conclude that DIA and DCM have the ability to manage the Fund successfully from a performance standpoint.
| Investment Advisory Agreement Approval (Unaudited) (continued) |
(iii) Fee Rate and Profitability. The Trustees reviewed a fee and expense comparison for the Morningstar Large Value category, which indicated that the Fund’s proposed management fee was below the median and average of its category, and the Fund’s estimated net expense ratio is equal to the median for the category and lower than the category average. The Trustees also reviewed a fee and expense comparison for a custom peer group, noting that the proposed management fee and estimated net expenses are lower than the median and average of the peer group. The Trustees noted that the proposed management fee and sub-advisory fee are comparable to the management fee and sub-advisory fee charged on DIA and DCM’s separately managed accounts.
The Trustees also considered profitability analyses prepared by DIA and DCM for its management of the Fund, which indicated that neither DIA nor DCM expect to earn a profit as a result of managing the Fund in its first two years of operations. The Trustees considered other potential benefits that DIA or DCM may receive in connection with its management of the Fund, including third-party research obtained by soft dollars, and noted that DIA does intend to enter into soft dollar arrangements on behalf of the Fund. After considering the above information, the Trustees concluded that the proposed management fee and sub-advisory fee represent reasonable compensation in light of the nature and quality of the services that DIA and DCM propose to provide to the Fund, the fees paid by competitive mutual funds, and the anticipated lack of profitability of DIA and DCM in providing services to the Fund in the first two years of operations.
(iv) Economies of Scale. In determining the reasonableness of the management fee, the Trustees also considered the extent to which DIA and DCM will realize economies of scale as the Fund grows larger. The Trustees determined that, in light of the anticipated size of the Fund in its first two years of operations, and DIA and DCM’s anticipated lack of profitability in managing the Fund in the first two years of operations, it does not appear that DIA or DCM will realize benefits from economies of scale in managing the Fund to such an extent that breakpoints in the management fee should be considered at this time.
| Summary of Fund Expenses (Unaudited) |
As a shareholder of a Fund, you incur two types of costs: (1) transaction costs and (2) ongoing costs, including management fees, distribution (12b-1) fees and other Fund expenses. These examples are intended to help you understand your ongoing costs (in dollars) of investing in each Fund and to compare these costs with the ongoing costs of investing in other funds. Each Fund’s example is based on an investment of $1,000 invested at the beginning of the period and held for the entire period from October 1, 2022 through March 31, 2023.
Actual Expenses
The first line of the table below provides information about actual account values and actual expenses. You may use the information in this line, together with the amount you invested, to estimate the expenses that you paid over the period. Simply divide your account value by $1,000 (for example, an $8,600 account value divided by $1,000 = 8.6), then multiply the result by the number in the first line under the heading “Expenses Paid During Period” to estimate the expenses you paid on your account during this period.
Hypothetical Example for Comparison Purposes
The second line of the table below provides information about hypothetical account values and hypothetical expenses based on each Fund’s actual expense ratio and an assumed rate of return of 5% per year before expenses, which is not the Fund’s actual return. The hypothetical account values and expenses may not be used to estimate the actual ending account balance or expenses you paid for the period. You may use this information to compare the ongoing costs of investing in the Funds and other funds. To do so, compare this 5% hypothetical example with the 5% hypothetical examples that appear in the shareholder reports of other funds.
Expenses shown in the table are meant to highlight your ongoing costs only and do not reflect any transactional costs. Therefore, the second line of the table below is useful in comparing ongoing costs only and will not help you determine the relative total costs of owning different funds. In addition, if transaction costs were included, your costs would have been higher.
| | | Beginning | | | Ending | | | | | | |
| | | Account | | | Account | | | Expenses | | | |
| | | Value | | | Value | | | Paid | | | Annualized |
| | | October 1, | | | March 31, | | | During | | | Expense |
| | | 2022 | | | 2023 | | | Period(a) | | | Ratio |
| Small Cap Fund | | | | | | | | | | | |
| | Actual | | $ | 1,000.00 | | | $ | 1,141.40 | | | $ | 6.09 | | | 1.14% |
| | Hypothetical(b) | | $ | 1,000.00 | | | $ | 1,019.24 | | | $ | 5.75 | | | 1.14% |
| Mid Cap Fund | | | | | | | | | | | | | | |
| | Actual | | $ | 1,000.00 | | | $ | 1,128.30 | | | $ | 4.51 | | | 0.85% |
| | Hypothetical(b) | | $ | 1,000.00 | | | $ | 1,020.69 | | | $ | 4.28 | | | 0.85% |
| Equity Income Fund | | | | | | | | | | | | | | |
| | Actual | | $ | 1,000.00 | | | $ | 973.40 | | | $ | 2.44 | (c) | | 0.70% |
| | Hypothetical(b) | | $ | 1,000.00 | | | $ | 1,015.20 | | | $ | 2.49 | (c) | | 0.70% |
| (a) | Expenses are equal to the Fund’s annualized expense ratios, multiplied by the average account value over the period, multiplied by 182/365 (to reflect the one-half year period). |
| (b) | Hypothetical assumes 5% annual return before expenses. |
| (c) | Expenses are equal to the Fund’s annualized expense ratios, multiplied by the average account value over the period, multiplied by 129/365 (to reflect the period since commencement of operations on November 22, 2022). |
| Additional Federal Income Tax Information (Unaudited) |
The Form 1099-DIV you receive in January 2024 will show the tax status of all distributions paid to your account in calendar year 2023. Shareholders are advised to consult their own tax adviser with respect to the tax consequences of their investment in the Fund. As required by the Internal Revenue Code and/or regulations, shareholders must be notified regarding the status of qualified dividend income for individuals and the dividends received deduction for corporations.
Qualified Dividend Income. The Funds designate the following percentage or up to the maximum amount of such dividends allowable pursuant to the Internal Revenue Code, as qualified dividend income eligible for the reduced tax rate.
| Small Cap Fund | | Mid Cap Fund | | Equity Income Fund |
| 100% | | 100% | | 74% |
Qualified Business Income. The Funds designate the following percentage of ordinary income dividends, or up to the maximum amount of such dividends allowable pursuant to the Internal Revenue Code, as qualified business income.
| Small Cap Fund | | Mid Cap Fund | | Equity Income Fund |
| — | | — | | — |
Dividends Received Deduction. Corporate shareholders are generally entitled to take the dividends received deduction on the portion of the Funds’ dividend distribution that qualifies under tax law. For the Funds’ calendar year 2022 ordinary income dividends, the following percentage qualifies for the corporate dividends received deduction.
| Small Cap Fund | | Mid Cap Fund | | Equity Income Fund |
| 100% | | 100% | | 76% |
The Funds designate the following amounts as long-term capital gains distributions. The amounts designated may not agree with long-term capital gains in the tax character of distribution table due to utilization of earnings and profits distributed to shareholders on redemption of shares.
| Small Cap Fund | | | Mid Cap Fund | | | Equity Income Fund | |
| $ | — | | | $ | 3,175,758 | | | $ | — | |
| Trustees and Officers (Unaudited) |
GENERAL QUALIFICATIONS. The Board supervises the business activities of the Trust. Each Trustee serves as a trustee until termination of the Trust unless the Trustee dies, resigns, retires, or is removed. The Chair of the Board and more than 75% of the Trustees are “Independent Trustees”, which means that they are not “interested persons” (as defined in the 1940 Act) of the Trust or any adviser, sub-adviser or distributor of the Trust.
The following table provides information regarding the Independent Trustees.
Name, Address*, (Year of Birth),
Position with Trust**,
Term of Position with Trust | | Principal Occupation During Past 5 Years and Other
Directorships |
Daniel J. Condon (1950) Chair, May 2022 to present; Chair of the Audit Committee; Chair of the Governance & Nominating Committee, May 2020 to May 2022; Independent Trustee, December 2002 to present | | Current: Retired (2017 – present). Previous: Peak Income Plus Fund (May 2022 – February 2023). |
Kenneth G.Y. Grant (1949) Chair of the Governance & Nominating Committee, May 2022 to present; Chair, January 2017 to May 2022; Independent Trustee, May 2008 to present | | Current: Director, Standpoint Multi-Asset (Cayman) Fund, Ltd. (2019 – present); Director, Advisors Charitable Gift Fund (2020 – present), a Donor Advised Fund; Trustee, Peak Income Plus Fund (May 2022 – present). Previous: EVP, Benefit Plans Administrative Services, Inc., provider of retirement benefit plans administration (2019 – 2020); Director, Northeast Retirement Services (NRS) LLC, a transfer agent and fund administrator; and Director, Global Trust Company (GTC), a non-depository trust company sponsoring private investment products (2003 – 2019); EVP, NRS (2003 – 2019); GTC, EVP (2008 – 2019); EVP, Savings Banks Retirement Association (2003 – 2019), provider of qualified retirement benefit plans. |
Ronald C. Tritschler (1952) Chair of the Audit Committee, May 2022 to present; Independent Trustee, January 2007 to present; Interested Trustee, December 2002 to December 2006 | | Current: Chief Executive Officer, Director and Legal Counsel of The Webb Companies, a national real estate company, (2001– present); Director, Standpoint Multi-Asset (Cayman) Fund, Ltd. (2020 – present); Director of First State Bank of the Southeast (2000 – present). Previous: Trustee, Peak Income Plus Fund (May 2022 – February 2023). |
| Trustees and Officers (Unaudited) (continued) |
Catharine B. McGauley (1977) Chair of the Pricing & Liquidity Committee, November 2022 to present; Independent Trustee, September 2022 to present | | Current: Lead Portfolio Manager of Atlantic Charter Insurance, a workers’ compensation insurer, (2010 – present); Investment Advisor for a Family Office (2015 – present); Senior Analyst/Advisor for a Boston real estate company and related family (2010 – present). Previous: Trustee, Peak Income Plus Fund (May 2022 – February 2023). |
Freddie Jacobs, Jr. (1970) Independent Trustee, September 2022 to present | | Current: Chief Operating Officer and Chief Risk Officer Northeast Retirement Services LLC (NRS), and its subsidiary, Global Trust Company (GTC). NRS is a transfer agent and fund administrator, GTC is a non-depository trust company sponsoring private investment products (2021 – present); Trustee of Buckingham Browne & Nichols (BBN) (2018 – present); Member of the Finance Committee, BBN (2017 – present); Chair Board of Directors of Crispus Attucks Fund (2020 – present); Board Member of Camp Harbor View (2020 – present); Trustee, Peak Income Plus Fund (May 2022 – February 2023). Previous: SVP, Senior Risk Officer NRS (2013 – 2021); Trustee, Peak Income Plus Fund (2022 – February 2023). |
| * | The address for each Trustee is 225 Pictoria Drive, Suite 450, Cincinnati, Ohio 45246. |
| ** | As of the date of this report, the Trust consists of 31 series. |
The following table provides information regarding the Interested Trustees and Officers of the Trust.
Name, Address*, (Year of Birth),
Position with Trust,
Term of Position with Trust | | Principal Occupation During Past 5 Years and Other
Directorships |
David R. Carson (1958) Interested Trustee, August 2020 to present; President, January 2016 to August 2021 | | Current: Senior Vice President Client Strategies of Ultimus Fund Solutions, LLC, (2013 – present); Interested Trustee, Peak Income Plus Fund (May 2022 – present). Previous: Interested Trustee of Ultimus Managers Trust, (January 2021 – April 2023); Interested Trustee, Mammoth Institutional Credit Access Fund and Mammoth Institutional Equity Access Fund (November 2022 – May 2023). |
| Trustees and Officers (Unaudited) (continued) |
Martin R. Dean (1963) President, August 2021 to present; Vice President, November 2020 to August 2021; Chief Compliance Officer, April 2021 to August 2021; Assistant Chief Compliance Officer, January 2016 to April 2021 | | Current: President, Northern Lights Compliance Services (2023 – present); Senior Vice President, Head of Fund Compliance of Ultimus Fund Solutions, LLC (January 2016 – January 2023). |
Zachary P. Richmond (1980) Treasurer and Chief Financial Officer, November 2014 to present | | Current: Vice President, Director of Financial Administration for Ultimus Fund Solutions, LLC, (2015 – present). |
Gweneth K. Gosselink (1955) Chief Compliance Officer, August 2021 to present | | Current: Assistant Vice President, Senior Compliance Officer of Ultimus Fund Solutions, LLC, since 2019. Previous: Chief Operating Officer & CCO at Miles Capital, Inc. (2013 – 2019). |
Elisabeth Dahl (1962) Secretary, May 2017 to present; Assistant Secretary, March 2016 to May 2017 | | Current: Attorney, Ultimus Fund Solutions, LLC since March 2016. |
Stephen Preston (1966) AML Compliance Officer, May 2017 to present | | Current: Vice President and Chief Compliance Officer, Ultimus Fund Solutions, LLC and Ultimus Fund Distributors, LLC, since 2011. |
Lynn E. Wood (1946) Assistant Chief Compliance Officer, April 2021 to present; Chief Compliance Officer, October 2004 to April 2021 | | Current: Managing Member, Buttonwood Compliance Partners, LLC, since 2013. |
| * | The address for each Officer is 225 Pictoria Drive, Suite 450, Cincinnati, Ohio 45246. |
| Other Information (Unaudited) |
The Funds’ Statement of Additional Information (“SAI”) includes additional information about the Trustees and is available without charge, upon request. You may call toll-free at (888) 899-8343 and (888) 899-8343 to request a copy of the SAI or to make shareholder inquiries.
Privacy Notice
Rev: March 2021
| FACTS | WHAT DO THE DEAN FUNDS (the “FUNDS”) DO WITH YOUR PERSONAL INFORMATION? |
| | |
| Why? | Financial companies choose how they share your personal information. Federal law gives consumers the right to limit some but not all sharing. Federal law also requires us to tell you how we collect, share, and protect your personal information. Please read this notice carefully to understand what we do. |
| | |
| What? | The types of personal information we collect and share depend on the product or service you have with us. This information can include: ■ Social Security number ■ account balances and account transactions ■ transaction or loss history and purchase history ■ checking account information and wire transfer instructions When you are no longer our customer, we continue to share your information as described in this notice. |
| | |
| How? | All financial companies need to share customers’ personal information to run their everyday business. In the section below, we list the reasons financial companies can share their customers’ personal information; the reasons the Funds choose to share; and whether you can limit this sharing. |
| Reasons we can share your personal information | Do the Funds share? |
For our everyday business purposes— such as to process your transactions, maintain your account(s), respond to court orders and legal investigations, or report to credit bureaus | Yes |
For our marketing purposes— to offer our products and services to you | No |
| For joint marketing with other financial companies | No |
For our affiliates’ everyday business purposes— information about your transactions and experiences | No |
For our affiliates’ everyday business purposes— information about your creditworthiness | No |
| For nonaffiliates to market to you | No |
| Questions? | Call (888) 899-8343 |
| Who we are |
| Who is providing this notice? | Dean Funds Ultimus Fund Distributors, LLC (Distributor) Ultimus Fund Solutions, LLC (Administrator) |
| What we do |
| How do the Funds protect my personal information? | To protect your personal information from unauthorized access and use, we use security measures that comply with federal law. These measures include computer safeguards and secured files and buildings. Our service providers are held accountable for adhering to strict policies and procedures to prevent any misuse of your nonpublic personal information. |
| How do the Funds collect my personal information? | We collect your personal information, for example, when you ■ open an account or deposit money ■ buy securities from us or sell securities to us ■ make deposits or withdrawals from your account ■ give us your account information ■ make a wire transfer ■ tell us who receives the money ■ tell us where to send the money ■ show your government-issued ID ■ show your driver’s license |
| Why can’t I limit all sharing? | Federal law gives you the right to limit only ■ sharing for affiliates’ everyday business purposes — information about your creditworthiness ■ affiliates from using your information to market to you ■ sharing for nonaffiliates to market to you State laws and individual companies may give you additional rights to limit sharing. |
| Definitions |
| Affiliates | Companies related by common ownership or control. They can be financial and nonfinancial companies. ■ Dean Investment Associates, LLC, the investment adviser to the Funds, could be deemed to be an affiliate. |
| Nonaffiliates | Companies not related by common ownership or control. They can be financial and nonfinancial companies. ■ The Dean Funds do not share your personal information with nonaffiliates so they can market to you |
| Joint marketing | A formal agreement between nonaffiliated financial companies that together market financial products or services to you. ■ The Dean Funds do not jointly market. |
PROXY VOTING
A description of the policies and procedures that each Fund uses to determine how to vote proxies relating to portfolio securities and information regarding how each Fund voted those proxies during the most recent twelve month period ended June 30, are available (1) without charge upon request by calling the Funds at (888) 899-8343 and (2) in Fund documents filed with the SEC on the SEC’s website at www.sec.gov.
TRUSTEES
Daniel J. Condon, Chair
David R. Carson
Kenneth G.Y. Grant
Freddie Jacobs, Jr.
Catharine B. McGauley
Ronald C. Tritschler | INDEPENDENT REGISTERED
PUBLIC ACCOUNTING FIRM
Cohen & Company, Ltd.
151 North Franklin Street, Suite 575
Chicago, IL 60606 |
| | |
| | |
OFFICERS
Martin R. Dean, President
Gweneth K. Gosselink,
Chief Compliance Officer
Zachary P. Richmond,
Treasurer and Chief Financial Officer
Lynn E. Wood,
Assistant Chief Compliance Officer | LEGAL COUNSEL
Thompson Hine LLP
312 Walnut Street, 20th Floor
Cincinnati, OH 45202 |
| | |
| | |
INVESTMENT ADVISER
Dean Investment Associates LLC
3500 Pentagon Blvd., Suite 200
Beavercreek, Ohio. 45431 | CUSTODIAN
Huntington National Bank
41 South High Street
Columbus, OH 43215 |
| | |
| | |
DISTRIBUTOR
Ultimus Fund Distributors, LLC
225 Pictoria Drive, Suite 450
Cincinnati, OH 45246 | ADMINISTRATOR, TRANSFER
AGENT AND FUND ACCOUNTANT
Ultimus Fund Solutions, LLC
225 Pictoria Drive, Suite 450
Cincinnati, OH 45246 |
| | |
This report is intended only for the information of shareholders or those who have received the Funds’ prospectus which contains information about the Funds’ management fees and expenses. Please read the prospectus carefully before investing.
Distributed by Ultimus Fund Distributors, LLC
Member FINRA/SIPC
Dean-AR-23

Absolute Select Value ETF (ABEQ)
(formerly known as Absolute Core Strategy ETF)
NYSE Arca, Inc.
Annual Report
March 31, 2023
Fund Adviser:
Absolute Investment Advisers, LLC
4 North Street, Suite 2
Hingham, MA 02043
1-833-267-3383
| Management Discussion of Fund Performance – (Unaudited) |
For the fiscal year ended March 31, 2023, the Absolute Select Value ETF (ABEQ or the “Fund”) returned -5.22%. By comparison, the S&P 500® Index returned -7.73%.
Alleghany Corp, Corteva, and Merck were among gainers for the period. Barrick Gold, Jones Lang Lasalle, and Verizon were detractors.
ABEQ utilizes a bottom-up fundamentally driven strategy focused on a concentrated group of individual equities. Over the past year, the Fund’s discerning approach to security selection helped it out-perform the S&P 500® Index.
The Fund continues to look skeptically at broader equity market valuations while at the same time finding numerous attractively priced companies. Simplicity and patience can work wonders when investing. Companies navigate economic cycles in fits and starts while stock prices amplify the tailwinds and headwinds companies cyclically encounter. Business is not linear, and markets are not predictable. Still, one wonders if today’s market participants have grown too comfortable with rich stock market valuations, and remain complacent about potential risks to their investment capital. Investor complacency often peaks before markets cycle lower.
Fifteen years removed from the 2008 crisis, Wall Street still operates today with a sense of amnesia. Investors must always prepare for the unexpected, including sudden, sharp swings in markets and the economy. Events that never happened before will undoubtedly occur. Whatever adverse scenario one contemplates, reality can be worse. The consideration of risk, the permanent destruction of one’s investment capital, should always be of paramount concern. Fortunately, the compounding effect of buying and holding the shares of good companies possessing sustainable competitive advantages remains as powerful as ever. To benefit from these investment virtues, one needs patience and time and a firm understanding of what one owns to tolerate the inherent uncertainty in markets.
| Investment Results (Unaudited) |
Average Annual Total Returns* as of March 31, 2023
| | | | | Since |
| | | | | Inception |
| | | | | January 21, |
| | | One Year | | 2020 |
| Absolute Select Value ETF - NAV | | (5.22)% | | 4.39% |
| Absolute Select Value ETF - Market Price | | (5.49)% | | 4.34% |
| S&P 500® Index(a) | | (7.73)% | | 8.67% |
Total annual operating expenses, as disclosed in the Absolute Select Value ETF’s (the “Fund”) prospectus dated July 29, 2022, were 0.85% of average daily net assets (1.24% before fee waivers/ expense reimbursements by Absolute Investment Advisers, LLC (the “Adviser”). The Adviser contractually has agreed to waive its management fee and/or reimburse expenses so that total annual Fund operating expenses, excluding portfolio transaction and other investment-related costs (including brokerage fees and commissions); taxes; borrowing costs (such as interest and dividend expenses on securities sold short); acquired fund fees and expenses; fees and expenses associated with investments in other collective investment vehicles or derivative instruments (including for example option and swap fees and expenses); any amounts payable pursuant to a distribution or service plan adopted in accordance with Rule 12b-1 under the Investment Company Act of 1940; any administrative and/or shareholder servicing fees payable pursuant to a plan adopted by the Board of Trustees; expenses incurred in connection with any merger or reorganization; extraordinary expenses (such as litigation expenses, indemnification of Trust officers and Trustees and contractual indemnification of Fund service providers); and other expenses that the Trustees agree have not been incurred in the ordinary course of the Fund’s business, do not exceed 0.85% of the Fund’s average daily net assets through July 31, 2024. This expense cap may not be terminated prior to this date except by the Board of Trustees upon 60 days’ written notice to the Adviser. Each waiver/expense payment by the Adviser is subject to recoupment by the Adviser from the Fund in the three years following the date the particular waiver/expense payment occurred, but only if such recoupment can be achieved without exceeding the annual expense limitation in effect at the time of the waiver/ expense payment and any expense limitation in effect at the time of the recoupment. Additional information pertaining to the Fund’s expense ratios (not including acquired fund fees and expenses) as of March 31, 2023 can be found in the financial highlights.
The performance quoted represents past performance, which does not guarantee future results. The investment return and principal value of an investment will fluctuate so that an investor’s shares, when redeemed, may be worth more or less than their original cost. The returns shown do not reflect deduction of taxes that a shareholder would pay on Fund distributions or the redemption of Fund shares. Current performance of the Fund may be lower or higher than the performance quoted. The Fund’s investment objective, risks, charges and expenses must be considered carefully before investing. Performance data current to the most recent month end may be obtained by calling (833) 267-3383. The Fund’s per share net asset value (“NAV”) is the value of one share of the Fund as calculated in accordance with the standard formula for valuing shares. The NAV return is based on the NAV of the Fund and the market return is based on the market price per share of the Fund. The price used to calculate market return (“Market Price”) is determined by using the midpoint between the highest bid and the lowest offer on the primary stock exchange on which the shares of the Fund are listed for trading, as of the time that the Fund’s NAV is calculated. Market Price and NAV returns assume that dividends and capital gain distributions have been reinvested in the Fund at Market Price and NAV, respectively. Since exchange-traded funds are bought and sold at prices set by the market, which can result in a premium or discount to NAV, the returns calculated using Market Price can differ from those calculated using NAV.
| Investment Results (Unaudited) (continued) |
| * | Return figures reflect any change in price per share and assume the reinvestment of all distributions. The Fund’s returns reflect any fee reductions during the applicable periods. If such fee reductions had not occurred, the quoted performance would have been lower. |
| (a) | The S&P 500® Index (the “Index”), or Standard & Poor’s 500 Index, is a market-capitalization-weighted index of 500 leading publicly traded companies in the U.S. and is representative of a broader domestic equity market and range of securities than is found in the Fund’s portfolio. Individuals cannot invest directly in the Index; however, an individual can invest in exchange-traded funds or other investment vehicles that attempt to track the performance of a benchmark index. |
The Fund’s investment objective, risks, charges and expenses must be considered carefully before investing. The prospectus contains this and other important information about the Fund and may be obtained by calling (833) 267-3383. Please read it carefully before investing.
The Fund is distributed by Northern Lights Distributors, LLC, member FINRA/SIPC
| Investment Results (Unaudited) (continued) |
Comparison of the Growth of a $10,000 Investment in the Absolute Select Value ETF and the S&P 500® Index (Unaudited)
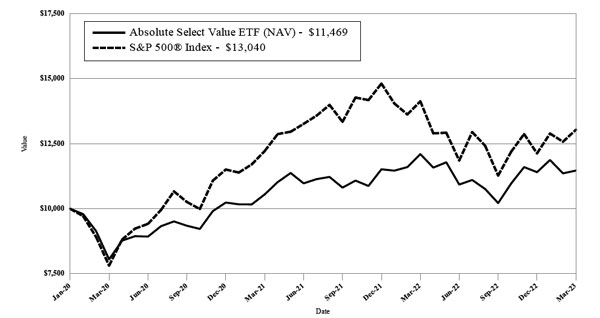
The graph shows the value of a hypothetical initial investment of $10,000 made on January 21, 2020 (commencement of operations) and held through March 31, 2023.
The S&P 500® Index (the “Index”), or Standard & Poor’s 500 Index, is a market-capitalization-weighted index of 500 leading publicly traded companies in the U.S. and is representative of a broader market and range of securities than is found in the Fund’s portfolio. Individuals cannot invest directly in an index; however, an individual may invest in exchange-traded funds or other investment vehicles that attempt to track the performance of a benchmark index. THE FUND’S RETURNS REPRESENT PAST PERFORMANCE AND DO NOT GUARANTEE FUTURE RESULTS. The returns shown do not reflect deduction of taxes that a shareholder would pay on Fund distributions or the redemption of Fund shares. Investment returns and principal values will fluctuate so that your shares, when redeemed, may be worth more or less than their original purchase price.
Current performance may be lower or higher than the performance data quoted. For more information on the Fund, and to obtain performance data current to the most recent month-end, or to request a prospectus, please call (833) 267-3383. You should carefully consider the investment objective, potential risks, management fees, and charges and expenses of the Fund before investing. The Fund’s prospectus contains this and other information about the Fund and should be read carefully before investing.
The Fund is distributed by Northern Lights Distributors, LLC, Member FINRA/SIPC.
| Fund Holdings (Unaudited) |
Absolute Select Value ETF Holdings as of March 31, 2023.*
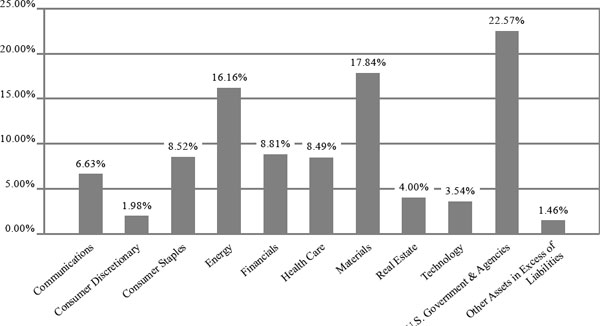
| * | As a percentage of net assets. |
As its investment objective, the Fund seeks positive absolute returns.
Portfolio holdings are subject to change.
Availability of Portfolio Schedule (Unaudited)
The Fund files a complete schedule of portfolio holdings with the Securities and Exchange Commission (the “SEC”) for the first and third quarters of each fiscal year as an exhibit to its reports on Form N-PORT. The Fund’s Form N-PORT reports are available on the SEC’s website at www. sec.gov or on the Fund’s website at www.absoluteadvisers.com.
| Absolute Select Value ETF |
| Schedule of Investments |
| March 31, 2023 |
| | | Shares | | | Fair Value | |
| Common Stocks — 75.97% | | | | | | | | |
| Canada — 12.84% | | | | | | | | |
| Energy — 4.25% | | | | | | | | |
| Enbridge, Inc. | | | 101,331 | | | $ | 3,865,777 | |
| | | | | | | | | |
| Materials — 8.59% | | | | | | | | |
| Agnico Eagle Mines Ltd. | | | 114,747 | | | | 5,848,655 | |
| Barrick Gold Corp. | | | 105,895 | | | | 1,966,470 | |
| | | | | | | | 7,815,125 | |
| Total Canada | | | | | | | 11,680,902 | |
| Ireland — 3.60% | | | | | | | | |
| Health Care — 3.60% | | | | | | | | |
| Medtronic PLC | | | 40,657 | | | | 3,277,767 | |
| | | | | | | | | |
| Total Ireland | | | | | | | 3,277,767 | |
| | | | | | | | | |
| United Kingdom — 4.92% | | | | | | | | |
| Consumer Staples — 4.92% | | | | | | | | |
| Unilever PLC - ADR | | | 86,106 | | | | 4,471,485 | |
| | | | | | | | | |
| Total United Kingdom | | | | | | | 4,471,485 | |
| | | | | | | | | |
| United States — 54.61% | | | | | | | | |
| Communications — 6.63% | | | | | | | | |
| Comcast Corp., Class A | | | 85,238 | | | | 3,231,373 | |
| Verizon Communications, Inc. | | | 71,823 | | | | 2,793,196 | |
| | | | | | | | 6,024,569 | |
| Consumer Discretionary — 1.98% | | | | | | | | |
| Starbucks Corp. | | | 8,717 | | | | 907,701 | |
| TJX Companies, Inc. (The) | | | 11,372 | | | | 891,110 | |
| | | | | | | | 1,798,811 | |
| Consumer Staples — 3.60% | | | | | | | | |
| Ingredion, Inc. | | | 32,165 | | | | 3,272,145 | |
| | | | | | | | | |
| Energy — 11.91% | | | | | | | | |
| Berkshire Hathaway, Inc., Class B(a) | | | 26,511 | | | | 8,185,802 | |
| EOG Resources, Inc. | | | 23,063 | | | | 2,643,712 | |
| | | | | | | | 10,829,514 | |
| Financials — 8.81% | | | | | | | | |
| Loews Corp. | | | 84,946 | | | | 4,928,566 | |
| Travelers Companies, Inc. (The) | | | 17,972 | | | | 3,080,581 | |
| | | | | | | | 8,009,147 | |
| Health Care — 4.89% | | | | | | | | |
| Merck & Co., Inc. | | | 41,790 | | | | 4,446,038 | |
| | | | | | | | | |
| Materials — 9.25% | | | | | | | | |
| Corteva, Inc. | | | 57,333 | | | | 3,457,753 | |
| DuPont de Nemours, Inc. | | | 68,986 | | | | 4,951,126 | |
| | | | | | | | 8,408,879 | |
| Real Estate — 4.00% | | | | | | | | |
| Equity Commonwealth | | | 175,672 | | | | 3,638,167 | |
See accompanying notes which are an integral part of these financial statements.
| Absolute Select Value ETF |
| Schedule of Investments (continued) |
| March 31, 2023 |
| | | Shares | | | Fair Value | |
| Common Stocks — 75.97% (continued) | | | | | | | | |
| United States — 54.61% (continued) | | | | | | | | |
| Technology — 3.54% | | | | | | | | |
| Cisco Systems, Inc. | | | 61,625 | | | $ | 3,221,447 | |
| Total United States | | | | | | | 49,648,717 | |
| Total Common Stocks | | | | | | | | |
| (Cost $65,041,017) | | | | | | | 69,078,871 | |
| | | | | | | | | |
| | | Principal | | | | | |
| | | Amount | | | Fair Value | |
| U.S. Government & Agencies — 22.57% | | | | | | | | |
| United States Treasury Bill 4.41%, 4/13/2023(b) | | $ | 3,000,000 | | | | 2,996,264 | |
| United States Treasury Bill 4.49%, 4/27/2023(b) | | | 3,000,000 | | | | 2,990,850 | |
| United States Treasury Bill 4.34%, 6/15/2023(b) | | | 3,000,000 | | | | 2,971,855 | |
| United States Treasury Bill 4.87%, 12/28/2023(b) | | | 3,000,000 | | | | 2,903,861 | |
| United States Treasury Note 0.25%, 9/30/2023 | | | 2,000,000 | | | | 1,957,235 | |
| United States Treasury Note 0.13%, 12/15/2023 | | | 2,000,000 | | | | 1,937,254 | |
| United States Treasury Note 0.25%, 3/15/2024 | | | 3,000,000 | | | | 2,878,024 | |
| United States Treasury Note 0.38%, 9/15/2024 | | | 2,000,000 | | | | 1,889,492 | |
| TOTAL U.S. GOVERNMENT & AGENCIES | | | | | | | | |
| (Cost $20,510,116) | | | | | | | 20,524,835 | |
| | | | | | | | | |
| Total Investments — 98.54% | | | | | | | | |
| (Cost $85,551,133) | | | | | | | 89,603,706 | |
| Other Assets in Excess of Liabilities — 1.46% | | | | | | | 1,331,746 | |
| Net Assets — 100.00% | | | | | | $ | 90,935,452 | |
| (a) | Non-income producing security. |
| (b) | The rate shown represents effective yield at time of purchase. |
ADR - American Depositary Receipt.
See accompanying notes which are an integral part of these financial statements.
| Absolute Select Value ETF |
| Statement of Assets and Liabilities |
| March 31, 2023 |
| Assets | | | | |
| Investments in securities, at fair value (cost $85,551,133) | | $ | 89,603,706 | |
| Cash | | | 1,246,804 | |
| Dividends and interest receivable | | | 78,406 | |
| Tax reclaims receivable | | | 78,005 | |
| Prepaid expenses | | | 824 | |
| Total Assets | | | 91,007,745 | |
| | | | | |
| Liabilities | | | | |
| Payable to Adviser, net of waiver | | | 41,613 | |
| Payable to affiliates | | | 6,259 | |
| Other accrued expenses | | | 24,421 | |
| Total Liabilities | | | 72,293 | |
| Net Assets | | $ | 90,935,452 | |
| | | | | |
| Net Assets consist of: | | | | |
| Paid-in capital | | $ | 88,081,500 | |
| Accumulated earnings | | | 2,853,952 | |
| Net Assets | | $ | 90,935,452 | |
| Shares outstanding (unlimited number of shares authorized, no par value) | | | 3,250,000 | |
| Net asset value per share | | $ | 27.98 | |
See accompanying notes which are an integral part of these financial statements.
| Absolute Select Value ETF |
| Statement of Operations |
| For the year ended March 31, 2023 |
| Investment Income | | | | |
| Dividend income (net of foreign taxes withheld of $89,204) | | $ | 2,197,134 | |
| Interest income | | | 249,670 | |
| Total investment income | | | 2,446,804 | |
| | | | | |
| Expenses | | | | |
| Adviser | | | 659,058 | |
| Administration | | | 53,004 | |
| Compliance services | | | 27,500 | |
| Legal | | | 25,481 | |
| Custodian | | | 25,169 | |
| Audit and tax | | | 18,642 | |
| Trustee | | | 17,476 | |
| Report printing | | | 17,412 | |
| Transfer agent | | | 10,464 | |
| Insurance | | | 3,222 | |
| Pricing | | | 614 | |
| Miscellaneous | | | 38,960 | |
| Total expenses | | | 897,002 | |
| Fees waived by Adviser | | | (237,336 | ) |
| Net operating expenses | | | 659,666 | |
| Net investment income | | | 1,787,138 | |
| | | | | |
| Net Realized and Change in Unrealized Gain (Loss) on Investments | | | | |
| Net realized gain (loss) on: | | | | |
| Investment securities | | | 81,220 | |
| Foreign currency translations | | | (2,075 | ) |
| Change in unrealized depreciation on: | | | | |
| Investment securities | | | (4,944,175 | ) |
| Foreign currency translations | | | (2,577 | ) |
| Net realized and unrealized gain (loss) on investment securities and foreign currency translations | | | (4,867,607 | ) |
| Net decrease in net assets resulting from operations | | $ | (3,080,469 | ) |
See accompanying notes which are an integral part of these financial statements.
| Absolute Select Value ETF |
| Statements of Changes in Net Assets |
| March 31, 2023 |
| | | For the Year | | | For the Year | |
| | | Ended March 31, | | | Ended March 31, | |
| | | 2023 | | | 2022 | |
| Increase (Decrease) in Net Assets due to: | | | | | | | | |
| Operations | | | | | | | | |
| Net investment income | | $ | 1,787,138 | | | $ | 448,487 | |
| Net realized gain on investment securities and foreign currency translations | | | 79,145 | | | | 2,773,996 | |
| Change in unrealized appreciation (depreciation) on investment securities | | | (4,946,752 | ) | | | 4,112,493 | |
| Net increase (decrease) in net assets resulting from operations | | | (3,080,469 | ) | | | 7,334,976 | |
| | | | | | | | | |
| Distributions to Shareholders From: | | | | | | | | |
| Earnings | | | (982,915 | ) | | | (329,315 | ) |
| Total distributions | | | (982,915 | ) | | | (329,315 | ) |
| Capital Transactions | | | | | | | | |
| Proceeds from shares sold | | | 39,387,641 | | | | 20,651,378 | |
| Amount paid for shares redeemed | | | (8,632,199 | ) | | | (9,300,348 | ) |
| Net increase in net assets resulting from capital transactions | | | 30,755,442 | | | | 11,351,030 | |
| Total Increase in Net Assets | | | 26,692,058 | | | | 18,356,691 | |
| | | | | | | | | |
| Net Assets | | | | | | | | |
| Beginning of year | | $ | 64,243,394 | | | $ | 45,886,703 | |
| End of year | | $ | 90,935,452 | | | $ | 64,243,394 | |
| | | | | | | | | |
| Share Transactions | | | | | | | | |
| Shares sold | | | 1,425,000 | | | | 725,000 | |
| Shares redeemed | | | (325,000 | ) | | | (325,000 | ) |
| Net increase in shares outstanding | | | 1,100,000 | | | | 400,000 | |
See accompanying notes which are an integral part of these financial statements.
| Absolute Select Value ETF |
| Financial Highlights |
| (For a share outstanding during each period) |
| | | For the | | | For the | | | For the | | | For the | |
| | | Year | | | Year | | | Year | | | Period | |
| | | Ended | | | Ended | | | Ended | | | Ended | |
| | | March 31, | | | March 31, | | | March 31, | | | March 31, | |
| | | 2023 | | | 2022 | | | 2021 | | | 2020(a) | |
| | | | | | | | | | | | | | | | | |
| Selected Per Share Data: | | | | | | | | | | | | | | | | |
| Net asset value, beginning of period | | $ | 29.88 | | | $ | 26.22 | | | $ | 20.14 | | | $ | 25.00 | |
| Investment operations: | | | | | | | | | | | | | | | | |
| Net investment income | | | 0.56 | | | | 0.22 | | | | 0.13 | | | | 0.03 | |
| Net realized and unrealized gain (loss) on investments | | | (2.13 | ) | | | 3.61 | | | | 6.10 | | | | (4.89 | ) |
| Total from investment operations | | | (1.57 | ) | | | 3.83 | | | | 6.23 | | | | (4.86 | ) |
| Less distributions to shareholders from: | | | | | | | | | | | | | | | | |
| Net investment income | | | (0.33 | ) | | | (0.17 | ) | | | (0.15 | ) | | | — | |
| Total distributions | | | (0.33 | ) | | | (0.17 | ) | | | (0.15 | ) | | | — | |
| Net asset value, end of period | | $ | 27.98 | | | $ | 29.88 | | | $ | 26.22 | | | $ | 20.14 | |
| Market price, end of period | | $ | 27.94 | | | $ | 29.92 | | | $ | 26.23 | | | $ | 20.21 | |
| Total Return(b) | | | (5.22 | )% | | | 14.66 | % | | | 31.02 | % | | | (19.44 | )%(c) |
| Ratios and Supplemental Data: | | | | | | | | | | | | | | | | |
| Net assets, end of period (000 omitted) | | $ | 90,935 | | | $ | 64,243 | | | $ | 45,887 | | | $ | 22,151 | |
| Ratio of net expenses to average net assets | | | 0.85 | % | | | 0.85 | % | | | 0.85 | % | | | 0.85 | %(d) |
| Ratio of expenses to average net assets before waiver and reimbursement | | | 1.16 | % | | | 1.24 | % | | | 1.51 | % | | | 3.88 | %(d) |
| Ratio of net investment income to average net assets | | | 2.30 | % | | | 0.85 | % | | | 0.58 | % | | | 1.40 | %(d) |
| Portfolio turnover rate(e) | | | 24 | % | | | 23 | % | | | 36 | % | | | 30 | %(c) |
| (a) | For the period January 21, 2020 (commencement of operations) to March 31, 2020. |
| (b) | Total return is calculated assuming a purchase of shares at net asset value on the first day and a sale at net asset value on the last day of the period. Distributions are assumed, for the purpose of this calculation, to be reinvested at the ex-dividend date net asset value per share on their respective payment dates. |
| (e) | Portfolio turnover rate excludes securities received or delivered from in-kind processing of creations or redemptions. |
See accompanying notes which are an integral part of these financial statements.
| Absolute Select Value ETF |
| Notes to the Financial Statements |
| March 31, 2023 |
NOTE 1. ORGANIZATION
Absolute Select Value ETF (the “Fund”, formerly known as Absolute Core Strategy ETF) was organized as a non-diversified series of Unified Series Trust (the “Trust”) on August 20, 2019, and is registered under the Investment Company Act of 1940, as amended (“1940 Act”). The Trust is an open-end investment company established under the laws of Ohio by an Agreement and Declaration of Trust dated October 14, 2002, as amended (the “Trust Agreement”). The Trust Agreement permits the Board of Trustees of the Trust (the “Board”) to issue an unlimited number of shares of beneficial interest of separate series without par value. The Fund is one of a series of funds currently authorized by the Board. The Fund’s investment adviser is Absolute Investment Advisers LLC (the “Adviser”). The Adviser has retained St. James Investment Company, LLC (the “Sub-Adviser”) to serve as Sub-Adviser to the Fund. As its investment objective, the Fund seeks positive absolute returns.
Non-Diversification Risk – The Fund is non-diversified, which means it may invest a greater percentage of its assets in a fewer number of securities as compared to other exchange traded funds that are more broadly diversified. As a result, the Fund’s share price may be more volatile than the share price of some other funds, and the poor performance of an individual security in the Fund’s portfolio may have a significant negative impact on the Fund’s performance.
NOTE 2. SIGNIFICANT ACCOUNTING POLICIES
The Fund is an investment company and follows accounting and reporting guidance under Financial Accounting Standards Board Accounting Standards Codification (“ASC”) Topic 946, “Financial Services-Investment Companies” including Accounting Standards Update 2013-08. The following is a summary of significant accounting policies followed by the Fund in the preparation of its financial statements. These policies are in conformity with generally accepted accounting principles in the United States of America (“GAAP”).
Estimates – The preparation of financial statements in conformity with GAAP requires management to make estimates and assumptions that affect the reported amounts of assets and liabilities and disclosure of contingent assets and liabilities at the date of the financial statements and the reported amounts of increases and decreases in net assets from operations during the reporting period. Actual results could differ from those estimates.
Foreign Currency Translation – The accounting records of the Fund are maintained in U.S. dollars. Foreign currency amounts are translated into U.S. dollars at the current rate of exchange each business day to determine the value of investments, and other assets and liabilities. Purchases and sales of foreign securities, and income and expenses, are
| Absolute Select Value ETF |
| Notes to the Financial Statements (continued) |
| March 31, 2023 |
translated at the prevailing rate of exchange on the respective date of these transactions. The Fund does not isolate that portion of the results of operations resulting from changes in foreign exchange rates on investments from fluctuations arising from changes in market prices of securities held. These fluctuations are included with the realized and unrealized gain or loss from investments. Net realized gain (loss) on foreign currency translations on the Statement of Operations represents currency gains (losses) realized between the trade and settlement dates on securities transactions, and the difference between the amount of investment income and foreign withholding taxes recorded on the Fund’s books and the U.S. dollar equivalent amounts actually received or paid. The change in unrealized currency gains (losses) on foreign currency translations for the period is reflected in the Statement of Operations.
Federal Income Taxes – The Fund makes no provision for federal income or excise tax. The Fund has qualified and intends to qualify each year as a regulated investment company (“RIC”) under subchapter M of the Internal Revenue Code of 1986, as amended, by complying with the requirements applicable to RICs and by distributing substantially all of its taxable income. The Fund also intends to distribute sufficient net investment income and net realized capital gains, if any, so that it will not be subject to excise tax on undistributed income and gains. If the required amount of net investment income or gains is not distributed, the Fund could incur a tax expense.
As of and during the fiscal year ended March 31, 2023, the Fund did not have any liabilities for any unrecognized tax benefits. The Fund recognizes interest and penalties, if any, related to unrecognized tax benefits as income tax expense in the Statement of Operations when incurred. During the year, the Fund did not incur any interest or penalties. Management of the Fund has reviewed tax positions taken in tax years that remain subject to examination by all major tax jurisdictions, including federal (i.e., the previous three tax year ends and the interim tax period since then, as applicable) and has concluded that no provision for unrecognized tax benefits or expenses is required in these financial statements and does not expect this to change over the next twelve months.
Expenses – Expenses incurred by the Trust that do not relate to the Fund are allocated to the individual funds of the Trust based on each Fund’s relative net assets or another appropriate basis (as determined by the Board).
Security Transactions and Related Income – The Fund follows industry practice and records security transactions on the trade date for financial reporting purposes. The specific identification method is used for determining gains or losses for financial statements and income tax purposes. Dividend income is recorded on the ex-dividend date and interest income is recorded on an accrual basis. Distributions received from investments in real estate investment trusts (“REITs”) that represent a return of capital or capital gain are
| Absolute Select Value ETF |
| Notes to the Financial Statements (continued) |
| March 31, 2023 |
recorded as a reduction of the cost of investment or as a realized gain, respectively. The calendar year-end amounts of ordinary income, capital gains, and return of capital included in distributions received from the Fund’s investments in REITs are reported to the Fund after the end of the calendar year; accordingly, the Fund estimates these amounts for accounting purposes until the characterization of REIT distributions is reported. Estimates are based on the most recent REIT distributions information available. Withholding taxes on foreign dividends and related reclaims have been provided for in accordance with the Fund’s understanding of the applicable country’s tax rules and rates.
Dividends and Distributions – The Fund intends to distribute substantially all of its net investment income, if any, at least semi-annually. The Fund intends to distribute its net realized long-term and short-term capital gains, if any, annually. Distributions to shareholders, which are determined in accordance with income tax regulations, are recorded on the ex-dividend date. The treatment for financial reporting purposes of distributions made to shareholders during the year from net investment income or net realized capital gains may differ from their ultimate treatment for federal income tax purposes. These differences are caused primarily by differences in the timing of the recognition of certain components of income, expense or realized capital gain for federal income tax purposes. Where such differences are permanent in nature, they are reclassified in the components of the net assets based on their ultimate characterization for federal income tax purposes. Any such reclassifications will have no effect on net assets, results of operations or net asset value (“NAV”) per share of the Fund.
For the fiscal year ended March 31, 2023, the Fund made the following reclassifications to increase (decrease) the components of net assets:
| | | | Accumulated Earnings | |
| Paid-In Capital | | | (Deficit) | |
| $ | 1,809,260 | | | $ | (1,809,260 | ) |
NOTE 3. SECURITIES VALUATION AND FAIR VALUE MEASUREMENTS
The Fund values its portfolio securities at fair value as of the close of regular trading on the New York Stock Exchange (“NYSE”) (normally 4:00 p.m. Eastern Time) on each business day the NYSE is open for business. Fair value is defined as the price that the Fund would receive upon selling an investment in a timely transaction to an independent buyer in the principal or most advantageous market of the investment. GAAP establishes a three-tier hierarchy to maximize the use of observable market data and minimize the use of unobservable inputs and to establish classification of fair value measurements for disclosure purposes.
| Absolute Select Value ETF |
| Notes to the Financial Statements (continued) |
| March 31, 2023 |
Inputs refer broadly to the assumptions that market participants would use in pricing the asset or liability, including assumptions about risk (the risk inherent in a particular valuation technique used to measure fair value including a pricing model and/or the risk inherent in the inputs to the valuation technique). Inputs may be observable or unobservable. Observable inputs are inputs that reflect the assumptions market participants would use in pricing the asset or liability developed based on market data obtained and available from sources independent of the reporting entity. Unobservable inputs are inputs that reflect the reporting entity’s own assumptions about the assumptions market participants would use in pricing the asset or liability developed based on the best information available in the circumstances.
Various inputs are used in determining the value of the Fund’s investments. These inputs are summarized in the three broad levels listed below.
| ● | Level 1 – unadjusted quoted prices in active markets for identical investments and/or registered investment companies where the value per share is determined and published and is the basis for current transactions for identical assets or liabilities at the valuation date |
| ● | Level 2 – other significant observable inputs (including, but not limited to, quoted prices for an identical security in an inactive market, quoted prices for similar securities, interest rates, prepayment speeds, credit risk, etc.) |
| ● | Level 3 – significant unobservable inputs (including the Fund’s own assumptions in determining fair value of investments based on the best information available) |
The inputs used to measure fair value may fall into different levels of the fair value hierarchy. In such cases, for disclosure purposes, the level in the fair value hierarchy which is reported is determined based on the lowest level input that is significant to the fair value measurement in its entirety.
Equity securities that are traded on any stock exchange are generally valued at the last quoted sale price on the security’s primary exchange. Lacking a last sale price, an exchange-traded security is generally valued at its last bid price. Securities traded in the Nasdaq over-the-counter market are generally valued at the Nasdaq Official Closing Price. When using market quotations and when the market is considered active, the security is classified as a Level 1 security. In the event that market quotations are not readily available or are considered unreliable due to market or other events, securities are valued in good faith by the Adviser, as Valuation Designee, under oversight of the Board’s Pricing & Liquidity Committee. The Adviser has adopted written policies and procedures for valuing securities and other assets in circumstances where market quotes are not readily available
| Absolute Select Value ETF |
| Notes to the Financial Statements (continued) |
| March 31, 2023 |
in conformity with guidelines adopted by the Board, . In the event that market quotes are not readily available, and the security or asset cannot be valued pursuant to one of the valuation methods, the value of the security or asset will be determined in good faith by the Valuation Designee pursuant to its policies and procedures. To assist the Valuation Designee in carrying out the responsibility to determine the fair value of any securities or other assets for which market quotations are not readily available the Trust has created a fair valuation pricing committee (the “Fair Value Committee”). The Fair Value Committee consists of the following standing members: (a) the Trust’s Treasurer or designee, (b) a representative of Ultimus and (c) on an ad hoc basis at a particular valuation time for which a fair valuation method is being determined for a Fund, a representative of the Adviser, which is the Valuation Designee. The Fair Value Committee will review any fair value provided by the Valuation Designee, subject to the ultimate review of the pricing and methodology by the Pricing & Liquidity Committee of the Board on a quarterly basis. Under these policies, the securities will be classified as Level 2 or 3 within the fair value hierarchy, depending on the inputs used.
Investments in mutual funds, including money market mutual funds, are generally priced at the ending NAV provided by the service agent of the mutual funds. These securities are categorized as Level 1 securities.
In accordance with the Trust’s valuation policies and fair value determinations pursuant to Rule 2a-5, the Valuation Designee is required to consider all appropriate factors relevant to the value of securities for which it has determined other pricing sources are not available or reliable as described above. No single method exists for determining fair value because fair value depends upon the circumstances of each individual case. As a general principle, the current fair value of a security being valued by the Valuation Designee would be the amount that the Fund might reasonably expect to receive upon the current sale. Methods that are in accordance with this principle may, for example, be based on (i) a multiple of earnings; (ii) a discount from market prices of a similar freely traded security (including a derivative security or a basket of securities traded on other markets, exchanges or among dealers); or (iii) yield to maturity with respect to debt issues, or a combination of these and other methods. Fair-value pricing is permitted if, in the Valuation Designee’s opinion, the validity of market quotations appears to be questionable based on factors such as evidence of a thin market in the security based on a small number of quotations, a significant event occurs after the close of a market but before the Fund’s NAV calculation that may affect a security’s value, or the Valuation Designee is aware of any other data that calls into question the reliability of market quotations.
| Absolute Select Value ETF |
| Notes to the Financial Statements (continued) |
| March 31, 2023 |
The following is a summary of the inputs used to value the Fund’s investments as of March 31, 2023:
| Valuation Inputs |
| Assets | | Level 1 | | | Level 2 | | | Level 3 | | | Total | |
| Common Stocks (a) | | $ | 69,078,871 | | | $ | — | | | $ | — | | | $ | 69,078,871 | |
| U.S. Government & Agencies | | | — | | | | 20,524,835 | | | | — | | | | 20,524,835 | |
| Total | | $ | 69,078,871 | | | $ | 20,524,835 | | | $ | — | | | $ | 89,603,706 | |
| (a) | Refer to Schedule of Investments for sector classifications. |
The Fund did not hold any investments at the end of the reporting period for which significant unobservable inputs (Level 3) were used in determining fair value; therefore, no reconciliation of Level 3 securities is included for this reporting period.
NOTE 4. FEES AND OTHER TRANSACTIONS WITH AFFILIATES AND OTHER SERVICE PROVIDERS
The Adviser, under the terms of the management agreement with the Trust with respect to the Fund (the “Agreement”), manages the Fund’s investments. As compensation for its management services, the Fund is obligated to pay the Adviser a management fee computed and accrued daily and paid monthly at an annual rate of 0.85% of the Fund’s average daily net assets. For the fiscal year ended March 31, 2023, before the waiver described below, the Adviser earned a management fee of $659,058 from the Fund.
The Adviser has contractually agreed to waive its management fee and/or reimburse expenses through July 31, 2024 so that total annual operating expenses (excluding portfolio transaction and other investment-related costs (including brokerage fees and commissions); taxes; borrowing costs (such as interest and dividend expenses on securities sold short); acquired fund fees and expenses; fees and expenses associated with investments in other collective investment vehicles or derivative instruments (including for example option and swap fees and expenses); any amounts payable pursuant to a distribution or service plan adopted in accordance with Rule 12b-1 under the 1940 Act; any administrative and/ or shareholder servicing fees payable pursuant to a plan adopted by the Board of Trustees; expenses incurred in connection with any merger or reorganization; extraordinary expenses (such as litigation expenses, indemnification of Trust officers and Trustees and contractual indemnification of Fund service providers); and other expenses that the Trustees agree have not been incurred in the ordinary course of the Fund’s business) do not exceed 0.85% of the Fund’s average daily net assets through July 31, 2024. For the fiscal year ended March 31, 2023, the Adviser waived fees of $237,336. At March 31, 2023, the Fund owed the Adviser $41,613.
| Absolute Select Value ETF |
| Notes to the Financial Statements (continued) |
| March 31, 2023 |
Each fee waiver/expense payment by the Adviser is subject to recoupment by the Adviser from the Fund in the three years following the date in which that particular waiver/expense payment occurred, but only if such recoupment can be achieved without exceeding the annual expense limitation in effect at the time of the waiver/expense payment and any expense limitation in effect at the time of the recoupment. As of March 31, 2023, the Adviser may seek repayment of management fees waived and expense reimbursements pursuant to the aforementioned conditions, from the Fund no later than the dates stated below:
| Recoverable Through | | | | |
| March 31, 2024 | | $ | 217,326 | |
| March 31, 2025 | | | 205,812 | |
| March 31, 2026 | | | 237,336 | |
Ultimus Fund Solutions, LLC (“Ultimus”) provides administration and fund accounting services to the Fund. The Fund pays Ultimus fees in accordance with the agreements for such services.
Northern Lights Compliance Services, LLC (“NLCS”), an affiliate of Ultimus, provides a Chief Compliance Officer to the Trust, as well as related compliance services, pursuant to a consulting agreement between NLCS and the Trust. Under the terms of such agreement, NLCS receives fees from the Fund, which are approved annually by the Board.
Under the terms of a Distribution Agreement with the Trust, Northern Lights Distributors, LLC (the “Distributor”) serves as principal underwriter to the Fund. The Distributor is an affiliate of Ultimus. The Distributor is compensated by the Adviser (not the Fund) for acting as principal underwriter.
Certain officers and a Trustee of the Trust are also employees of Ultimus and such persons are not paid by the Fund for serving in such capacities.
The Board supervises the business activities of the Trust. Each Trustee serves as a trustee until termination of the Trust unless the Trustee dies, resigns, retires, or is removed. The Chairman of the Board and more than 75% of the Trustees are “Independent Trustees”, which means that they are not “interested persons” as defined in the 1940 Act. The Independent Trustees review and establish compensation at least annually. Each Independent Trustee of the Trust receives annual compensation, which is an established amount paid quarterly per fund in the Trust at the time of the regular quarterly Board meetings. The Chairman of the Board receives the highest compensation, commensurate with his additional duties and each Chair of a committee receives additional compensation as well. Independent Trustees also receive $1,000 for attending any special meeting that requires an in-person approval of a contract and $250 for the first hour and $200 for each additional hour for attending
| Absolute Select Value ETF |
| Notes to the Financial Statements (continued) |
| March 31, 2023 |
other special meetings. In addition, the Trust reimburses Independent Trustees for out-of-pocket expenses incurred in conjunction with attendance at meetings.
NOTE 5. INVESTMENT TRANSACTIONS
For the fiscal year ended March 31, 2023, purchases and sales of investment securities, other than short-term investments, were $14,992,578 and $15,289,178, respectively. There were $4,747,719 purchases of long-term U.S. government obligations during the fiscal year ended March 31, 2023.
For the fiscal year ended March 31, 2023, purchases and sales for in-kind transactions were $30,834,817 and $7,215,207, respectively.
For the fiscal year ended March 31, 2023, the Fund had in-kind net realized gains of $1,809,626.
NOTE 6. CAPITAL SHARE TRANSACTIONS
Shares are not individually redeemable and may be redeemed by the Fund at NAV only in large blocks known as “Creation Units”. Only Authorized Participants or transactions done through an Authorized Participant are permitted to purchase or redeem Creation Units from the Fund. An Authorized Participant is either (i) a broker-dealer or other participant in the clearing process through the Continuous Net Settlement System of the National Securities Clearing Corporation or (ii) a Depository Trust Company participant and, in each case, must have executed a Participant Agreement with the Distributor. Such transactions are generally permitted on an in-kind basis, with a balancing cash component to equate the transaction to the NAV per share of the Fund on the transaction date. Cash may be substituted equivalent to the value of certain securities generally when they are not available in sufficient quantity for delivery, not eligible for trading by the Authorized Participant or as a result of other market circumstances. In addition, the Fund may impose transaction fees on purchases and redemptions of Fund shares to cover the custodial and other costs incurred by the Fund in effecting trades. A fixed fee payable to the Custodian may be imposed on each creation and redemption transaction regardless of the number of Creation Units involved in the transaction (“Fixed Fee”). Purchases and redemptions of Creation Units for cash or involving cash-in-lieu are required to pay an additional variable charge to compensate the Fund and its ongoing shareholders for brokerage and market impact expenses relating to Creation Unit transactions (“Variable Charge”, and together with the Fixed Fee, the “Transaction Fees”). Transactions in capital shares for the Fund are disclosed in the Statement of Changes in Net Assets. For the fiscal year ended March 31, 2023, the Fund received $9,500 and $0 in fixed fees and variable fees, respectively. The Transaction Fees for the Fund are listed in the table below:
| Fixed Fee | | Variable Charge |
| $250 | | 2.00%* |
| * | The maximum Transaction Fee may be up to 2.00% of the amount invested. |
| Absolute Select Value ETF |
| Notes to the Financial Statements (continued) |
| March 31, 2023 |
NOTE 7. FEDERAL TAX INFORMATION
At March 31, 2023, the net unrealized appreciation (depreciation) and tax cost of investments for tax purposes was as follows:
| Gross unrealized appreciation | | $ | 6,585,885 | |
| Gross unrealized depreciation | | | (2,536,011 | ) |
| Net unrealized appreciation on investments | | $ | 4,049,874 | |
| Tax cost of investments | | $ | 85,553,832 | |
The tax character of distributions paid for the fiscal years ended March 31, 2023 and March 31, 2022 were as follows:
| | | 2023 | | | 2022 | |
| Distributions paid from: | | | | | | | | |
| Ordinary income(a) | | $ | 982,915 | | | $ | 329,315 | |
| Total distributions paid | | $ | 982,915 | | | $ | 329,315 | |
| (a) | Short-term capital gain distributions are treated as ordinary income for tax purposes. |
At March 31, 2023, the Fund’s most recent fiscal year end, the components of accumulated earnings (deficit) on a tax basis were as follows:
| Undistributed ordinary income | | $ | 925,258 | |
| Accumulated capital and other losses | | | (2,119,126 | ) |
| Unrealized appreciation on investments | | | 4,049,874 | |
| Total accumulated earnings | | $ | 2,856,006 | |
The difference between book basis and tax basis undistributed net investment income/ (loss), accumulated net realized gain/(loss), and unrealized appreciation/(depreciation) from investments is primarily attributable to the tax deferral of losses on wash sales.
At March 31, 2023, the Fund had $1,069,548 short-term and $1,049,578 long-term capital loss carry forwards for federal income tax purposes available to offset future capital gains. These capital loss carryforwards do not expire. At March 31, 2023, the Fund did not utilize capital loss carry forwards.
| Absolute Select Value ETF |
| Notes to the Financial Statements (continued) |
| March 31, 2023 |
NOTE 8. COMMITMENTS AND CONTINGENCIES
The Trust indemnifies its officers and Trustees for certain liabilities that may arise from their performance of their duties to the Trust or the Fund. Additionally, in the normal course of business, the Trust enters into contracts that contain a variety of representations and warranties which provide general indemnifications. The Trust’s maximum exposure under these arrangements is unknown, as this would involve future claims that may be made against the Trust that have not yet occurred.
NOTE 9. SUBSEQUENT EVENTS
Management of the Fund has evaluated the need for disclosures and/or adjustments resulting from subsequent events through the date at which these financial statements were issued. Based upon this evaluation, management has determined there were no items requiring adjustment of the financial statements or additional disclosure.
| Report of Independent Registered Public Accounting Firm |
To the Shareholders of Absolute Select Value ETF and
Board of Trustees of Unified Series Trust
Opinion on the Financial Statements
We have audited the accompanying statement of assets and liabilities, including the schedule of investments, of Absolute Select Value ETF, formerly Absolute Core Strategy ETF, (the “Fund”) a series of Unified Series Trust, as of March 31, 2023, the related statement of operations for the year then ended, the statements of changes in net assets for each of the two years in the period then ended, the related notes, and the financial highlights for each of the three years in the period then ended and the period January 21, 2020 (commencement of operations) through March 31, 2020 (collectively referred to as the “financial statements”). In our opinion, the financial statements present fairly, in all material respects, the financial position of the Fund as of March 31, 2023, the results of its operations for the year then ended, the changes in net assets for each of the two years in the period then ended, and the financial highlights for each of the three years in the period then ended and the period January 21, 2020 (commencement of operations) through March 31, 2020, in conformity with accounting principles generally accepted in the United States of America.
Basis for Opinion
These financial statements are the responsibility of the Fund’s management. Our responsibility is to express an opinion on the Fund’s financial statements based on our audits. We are a public accounting firm registered with the Public Company Accounting Oversight Board (United States) (“PCAOB”) and are required to be independent with respect to the Fund in accordance with the U.S. federal securities laws and the applicable rules and regulations of the Securities and Exchange Commission and the PCAOB.
We conducted our audits in accordance with the standards of the PCAOB. Those standards require that we plan and perform the audit to obtain reasonable assurance about whether the financial statements are free of material misstatement whether due to error or fraud.
Our audits included performing procedures to assess the risks of material misstatement of the financial statements, whether due to error or fraud, and performing procedures that respond to those risks. Such procedures included examining, on a test basis, evidence regarding the amounts and disclosures in the financial statements. Our procedures included confirmation of securities owned as of March 31, 2023, by correspondence with the custodian. Our audits also included evaluating the accounting principles used and significant estimates made by management, as well as evaluating the overall presentation of the financial statements. We believe that our audits provide a reasonable basis for our opinion.
We have served as the Fund’s auditor since 2020.
COHEN & COMPANY, LTD.
Chicago, Illinois
May 22, 2023
| Summary of Fund Expenses (Unaudited) |
As a shareholder of the Fund, you incur two types of costs: (1) transaction costs and (2) ongoing costs, including management fees and other Fund expenses. These examples are intended to help you understand your ongoing costs (in dollars) of investing in the Fund and to compare these costs with the ongoing costs of investing in other funds. You may pay brokerage commissions on purchases and sales of exchange-traded fund shares, which are not reflected in the example. The example is based on an investment of $1,000 invested at the beginning of the period and held for the entire period from October 1, 2022 through March 31, 2023.
Actual Expenses
The first line of the table below provides information about actual account values and actual expenses. You may use the information in this line, together with the amount you invested, to estimate the expenses that you paid over the period. Simply divide your account value by $1,000 (for example, an $8,600 account value divided by $1,000 = 8.6), then multiply the result by the number in the first line under the heading “Expenses Paid During Period” to estimate the expenses you paid on your account during this period.
Hypothetical Example for Comparison Purposes
The second line of the table below provides information about hypothetical account values and hypothetical expenses based on the Fund’s actual expense ratio and an assumed rate of return of 5% per year before expenses, which is not the Fund’s actual return. The hypothetical account values and expenses may not be used to estimate the actual ending account balance or expenses you paid for the period. You may use this information to compare the ongoing costs of investing in the Fund and other funds. To do so, compare this 5% hypothetical example with the 5% hypothetical examples that appear in the shareholder reports of other funds.
Expenses shown in the table are meant to highlight your ongoing costs only and do not reflect any transactional costs. Therefore, the second line of the table below is useful in comparing ongoing costs only and will not help you determine the relative total costs of owning different funds. In addition, if transaction costs were included, your costs would have been higher.
| | | Beginning | | | Ending | | | | | | |
| | | Account | | | Account | | | Expenses | | | |
| | | Value | | | Value | | | Paid | | | Annualized |
| | | October 1, | | | March 31, | | | During | | | Expense |
| | | 2022 | | | 2023 | | | Period(a) | | | Ratio |
| Actual | | $ | 1,000.00 | | | $ | 1,122.20 | | | $ | 4.50 | | | 0.85% |
| Hypothetical(b) | | $ | 1,000.00 | | | $ | 1,020.69 | | | $ | 4.28 | | | 0.85% |
| (a) | Expenses are equal to the Fund’s annualized expense ratios, multiplied by the average account value over the period, multiplied by 182/365 (to reflect the one-half year period). |
| (b) | Hypothetical assumes 5% annual return before expenses. |
| Additional Federal Income Tax Information (Unaudited) |
The Form 1099-DIV you receive in January 2024 will show the tax status of all distributions paid to your account in calendar year 2023. Shareholders are advised to consult their own tax adviser with respect to the tax consequences of their investment in the Fund. As required by the Internal Revenue Code and/or regulations, shareholders must be notified regarding the status of qualified dividend income for individuals and the dividends received deduction for corporations.
Qualified Dividend Income. The Fund designates approximately 80% or up to the maximum amount of such dividends allowable pursuant to the Internal Revenue Code, as qualified dividend income eligible for a reduced tax rate.
Qualified Business Income. The Fund designates approximately 3% of its ordinary income dividends, or up to the maximum amount of such dividends allowable pursuant to the Internal Revenue Code, as qualified business income.
Dividends Received Deduction. Corporate shareholders are generally entitled to take the dividends received deduction on the portion of the Fund’s dividend distribution that qualifies under tax law. For the Fund’s calendar year 2023 ordinary income dividends, 47% qualifies for the corporate dividends received deduction.
| Trustees and Officers (Unaudited) |
GENERAL QUALIFICATIONS. The Board supervises the business activities of the Trust. Each Trustee serves as a trustee until termination of the Trust unless the Trustee dies, resigns, retires, or is removed. The Chair of the Board and more than 75% of the Trustees are “Independent Trustees”, which means that they are not “interested persons” (as defined in the 1940 Act) of the Trust or any adviser, sub-adviser or distributor of the Trust.
The following table provides information regarding the Independent Trustees.
Name, Address*, (Year of Birth),
Position with Trust**,
Term of Position with Trust | | Principal Occupation During Past 5 Years and Other
Directorships |
Daniel J. Condon (1950) Chair, May 2022 to present; Chair of the Audit Committee; Chair of the Governance & Nominating Committee, May 2020 to May 2022; Independent Trustee, December 2002 to present | | Current: Retired (2017 – present). Previous: Peak Income Plus Fund (May 2022 – February 2023). |
Kenneth G.Y. Grant (1949) Chair of the Governance & Nominating Committee, May 2022 to present; Chair, January 2017 to May 2022; Independent Trustee, May 2008 to present | | Current: Director, Standpoint Multi-Asset (Cayman) Fund, Ltd. (2019 – present); Director, Advisors Charitable Gift Fund (2020 – present), a Donor Advised Fund; Trustee, Peak Income Plus Fund (May 2022 – present). Previous: EVP, Benefit Plans Administrative Services, Inc., provider of retirement benefit plans administration (2019 – 2020); Director, Northeast Retirement Services (NRS) LLC, a transfer agent and fund administrator; and Director, Global Trust Company (GTC), a non-depository trust company sponsoring private investment products (2003 – 2019); EVP, NRS (2003 – 2019); GTC, EVP (2008 – 2019); EVP, Savings Banks Retirement Association (2003 – 2019), provider of qualified retirement benefit plans. |
Ronald C. Tritschler (1952) Chair of the Audit Committee, May 2022 to present; Independent Trustee, January 2007 to present; Interested Trustee, December 2002 to December 2006 | | Current: Chief Executive Officer, Director and Legal Counsel of The Webb Companies, a national real estate company, (2001– present); Director, Standpoint Multi-Asset (Cayman) Fund, Ltd. (2020 – present); Director of First State Bank of the Southeast (2000 – present). Previous: Trustee, Peak Income Plus Fund (May 2022 – February 2023). |
| Trustees and Officers (Unaudited) (continued) |
Catharine B. McGauley (1977) Chair of the Pricing & Liquidity Committee, November 2022 to present; Independent Trustee, September 2022 to present | | Current: Lead Portfolio Manager of Atlantic Charter Insurance, a workers’ compensation insurer, (2010 – present); Investment Advisor for a Family Office (2015 – present); Senior Analyst/Advisor for a Boston real estate company and related family (2010 – present). Previous: Trustee, Peak Income Plus Fund (May 2022 – February 2023). |
Freddie Jacobs, Jr. (1970) Independent Trustee, September 2022 to present | | Current: Chief Operating Officer and Chief Risk Officer Northeast Retirement Services LLC (NRS), and its subsidiary, Global Trust Company (GTC). NRS is a transfer agent and fund administrator, GTC is a non-depository trust company sponsoring private investment products (2021 – present); Trustee of Buckingham Browne & Nichols (BBN) (2018 – present); Member of the Finance Committee, BBN (2017 – present); Chair Board of Directors of Crispus Attucks Fund (2020 – present); Board Member of Camp Harbor View (2020 – present); Trustee, Peak Income Plus Fund (May 2022 – February 2023). Previous: SVP, Senior Risk Officer NRS (2013 – 2021); Trustee, Peak Income Plus Fund (2022 – February 2023). |
| * | The address for each Trustee is 225 Pictoria Drive, Suite 450, Cincinnati, Ohio 45246. |
| ** | As of the date of this report, the Trust consists of 31 series. |
The following table provides information regarding the Interested Trustees and Officers of the Trust.
Name, Address*, (Year of Birth),
Position with Trust,
Term of Position with Trust | | Principal Occupation During Past 5 Years and Other
Directorships |
David R. Carson (1958) Interested Trustee, August 2020 to present; President, January 2016 to August 2021 | | Current: Senior Vice President Client Strategies of Ultimus Fund Solutions, LLC, (2013 – present); Interested Trustee, Peak Income Plus Fund (May 2022 – present). Previous: Interested Trustee of Ultimus Managers Trust, (January 2021 – April 2023); Interested Trustee, Mammoth Institutional Credit Access Fund and Mammoth Institutional Equity Access Fund (November 2022 – May 2023). |
| Trustees and Officers (Unaudited) (continued) |
Martin R. Dean (1963) President, August 2021 to present; Vice President, November 2020 to August 2021; Chief Compliance Officer, April 2021 to August 2021; Assistant Chief Compliance Officer, January 2016 to April 2021 | | Current: President, Northern Lights Compliance Services (2023 – present); Senior Vice President, Head of Fund Compliance of Ultimus Fund Solutions, LLC (January 2016 – January 2023). |
Zachary P. Richmond (1980) Treasurer and Chief Financial Officer, November 2014 to present | | Current: Vice President, Director of Financial Administration for Ultimus Fund Solutions, LLC, (2015 – present). |
Gweneth K. Gosselink (1955) Chief Compliance Officer, August 2021 to present | | Current: Assistant Vice President, Senior Compliance Officer of Ultimus Fund Solutions, LLC, since 2019. Previous: Chief Operating Officer & CCO at Miles Capital, Inc. (2013 – 2019). |
Elisabeth Dahl (1962) Secretary, May 2017 to present; Assistant Secretary, March 2016 to May 2017 | | Current: Attorney, Ultimus Fund Solutions, LLC since March 2016. |
Stephen Preston (1966) AML Compliance Officer, May 2017 to present | | Current: Vice President and Chief Compliance Officer, Ultimus Fund Solutions, LLC and Ultimus Fund Distributors, LLC, since 2011. |
Lynn E. Wood (1946) Assistant Chief Compliance Officer, April 2021 to present; Chief Compliance Officer, October 2004 to April 2021 | | Current: Managing Member, Buttonwood Compliance Partners, LLC, since 2013. |
| * | The address for each Officer is 225 Pictoria Drive, Suite 450, Cincinnati, Ohio 45246. |
| Other Information (Unaudited) |
The Fund’s Statement of Additional Information (“SAI”) includes additional information about the Trustees and is available without charge, upon request. You may call toll-free at (833) 267-3383 to request a copy of the SAI or to make shareholder inquiries.
A description of the policies and procedures that the Fund uses to determine how to vote proxies relating to portfolio securities and information regarding how the Fund voted those proxies during the most recent twelve month period ended June 30, are available (1) without charge upon request by calling the Fund at (833) 267-3383 and (2) in Fund documents filed with the SEC on the SEC’s website at www.sec.gov.
TRUSTEES
Daniel J. Condon, Chair
David R. Carson
Kenneth G.Y. Grant
Freddie Jacobs, Jr.
Catharine B. McGauley
Ronald C. Tritschler | INDEPENDENT REGISTERED
PUBLIC ACCOUNTING FIRM
Cohen & Company, Ltd.
151 North Franklin Street, Suite 575
Chicago, IL 60606 |
| | |
| | |
OFFICERS
Martin R. Dean, President
Gweneth K. Gosselink,
Chief Compliance Officer
Zachary P. Richmond,
Treasurer and Chief Financial Officer
Lynn E. Wood, Assistant Chief
Compliance Officer | LEGAL COUNSEL
Thompson Hine LLP
312 Walnut Street, 20th Floor
Cincinnati, OH 45202 |
| | |
| | |
INVESTMENT ADVISER
Absolute Investment Advisers LLC
4 North Street, Suite 2
Hingham, MA 02043 | CUSTODIAN
Brown Brothers Harriman & Co.
50 Post Office Square
Boston, MA 02110 |
| | |
| | |
DISTRIBUTOR
Northern Lights Distributors, LLC
4221 North 203rd Street, Suite 100
Elkhorn, NE 68022 | ADMINISTRATOR
Ultimus Fund Solutions, LLC
225 Pictoria Drive, Suite 450
Cincinnati, OH 45246 |
| | |
This report is intended only for the information of shareholders or those who have received the Fund’s prospectus which contains information about the Fund’s management fee and expenses. Please read the prospectus carefully before investing.
Distributed by Northern Lights Distributors, LLC Member FINRA/SIPC
Absolute Select-AR-23
Item 2. Code of Ethics.
As of the end of the period covered by this report, the registrant has adopted a code of ethics that applies to the registrant’s principal executive officer, principal financial officer, principal accounting officer or controller, or persons performing similar functions, regardless of whether these individuals are employed by the registrant or a third party. Pursuant to Item 12(a)(1), a copy of registrant’s code of ethics is filed as an exhibit to this Form N-CSR. During the period covered by this report, the code of ethics has not been amended, and the registrant has not granted any waivers, including implicit waivers, from the provisions of the code of ethics.
Item 3. Audit Committee Financial Expert.
(a)(1) The registrant’s Board of Trustees has determined that the registrant has at least one audit committee financial expert serving on its audit committee.
(a)(2) The audit committee financial expert is Freddie Jacobs, Jr., who is “independent” for purposes of this Item 3 of Form N-CSR.
.
Item 4. Principal Accountant Fees and Services.
The Dean Funds: FY 2023 $42,300
FY 2022 $26,250
The Absolute Core Strategy ETF FY 2023 $15,150
FY 2022 $14,100
The Dean Funds: FY 2023 $0
FY 2022 $0
The Absolute Core Strategy ETF FY 2023 $0
FY 2022 $0
The Dean Funds: FY 2023 $9,900
FY 2022 $6,600
The Absolute Core Strategy ETF FY 2023 $3,300
FY 2022 $3,300
Nature of the fees: Preparation of the 1120 RIC and Excise review
The Dean Funds: FY 2023 $0
FY 2022 $0
The Absolute Core Strategy ETF FY 2023 $0
FY 2022 $0
| (e) | (1) Audit Committee’s Pre-Approval Policies |
The Audit Committee Charter requires the Audit Committee to be responsible for the selection, retention or termination of auditors and, in connection therewith, to (i) evaluate the proposed fees and other compensation, if any, to be paid to the auditors, (ii) evaluate the independence of the auditors, (iii) pre-approve all audit services and, when appropriate, any non-audit services provided by the independent auditors to the Trust, (iv) pre-approve, when appropriate, any non-audit services provided by the independent auditors to the Trust's investment adviser, or any entity controlling, controlled by, or under common control with the investment adviser and that provides ongoing services to the Trust if the engagement relates directly to the operations and financial reporting of the Trust, and (v) receive the auditors’ specific representations as to their independence;
(2) Percentages of Services Approved by the Audit Committee
None of the services described in paragraph (b) through (d) of this Item were approved by the audit committee pursuant to paragraph (c)(7)(i)(C) of Rule 2-01 of Regulation S-X.
(f) During audit of registrant's financial statements for the most recent fiscal year, less than 50 percent of the hours expended on the principal accountant's engagement were attributed to work performed by persons other than the principal accountant's full-time, permanent employees.
(g) The aggregate non-audit fees billed by the registrant's accountant for services rendered to the registrant, and rendered to the registrant's investment adviser (not including any sub-adviser whose role is primarily portfolio management and is subcontracted with or overseen by another investment adviser), and any entity controlling, controlled by, or under common control with the adviser that provides ongoing services to the registrant:
Registrant Adviser
The Dean Funds:
FY 2023 $ 0 $ 0
FY 2022 $ 0 $ 0
The Absolute Core Strategy ETF
FY 2023 $ 0 $ 0
FY 2022 $ 0 $ 0
(h) Not applicable. The auditor performed no services for the registrant’s investment adviser or any entity controlling, controlled by, or under common control with the investment adviser that provides ongoing services to the registrant.
Item 5. Audit Committee of Listed Companies. Certain series of the registrant that appear in the shareholder report included in Item 1 are listed issuers as defined in Rule 10A-3 under the Securities Exchange Act of 1934, as amended (the “Exchange Act”) and have a separately-designated standing audit committee established in accordance with Section 3(a)(58)A of the Exchange Act. The registrant’s audit committee members is Freddie Jacobs, Jr.
Item 6. Schedule of Investments. Schedule filed with Item 1.
Item 7. Disclosure of Proxy Voting Policies and Procedures for Closed-End Management Investment Companies. NOT APPLICABLE – applies to closed-end funds only
Item 8. Portfolio Managers of Closed-End Investment Companies. NOT APPLICABLE – applies to closed-end funds only
Item 9. Purchases of Equity Securities by Closed-End Management Investment Company and Affiliated Purchasers. NOT APPLICABLE – applies to closed-end funds only
Item 10. Submission of Matters to a Vote of Security Holders.
The registrant has not adopted procedures by which shareholders may recommend nominees to the registrant’s board of trustees.
Item 11. Controls and Procedures.
(a) Based on their evaluation of the registrant’s disclosure controls and procedures (as defined in Rule 30a-3(c) under the Investment Company Act of 1940, as amended (the “Act”)) as of a date within 90 days of the filing date of this report, the registrant’s principal executive officer and principal financial officer have concluded that such disclosure controls and procedures are reasonably designed and are operating effectively to ensure that material information relating to the registrant is made known to them by others within those entities, particularly during the period in which this report is being prepared, and that the information required in filings on Form N-CSR is recorded, processed, summarized, and reported on a timely basis.
(b) There were no significant changes in the registrant’s internal control over financial reporting that occurred during the period covered by this report that have materially affected, or are reasonably likely to materially affect, the registrant’s internal control over financial reporting.
Item 12. Disclosure of Securities Lending Activities for Closed-End Investment Companies.
Not Applicable.
Item 13. Exhibits.
(a)(1) Code of Ethics for Senior Financial Officers is filed herewith.
(a)(2) A separate certification for each principal executive officer and principal financial officer of the registrant as required by Rule 30a-2(a) under the Act (17 CFR 270.30a-2(a)): Attached hereto
| (2) | Change in the registrant’s independent public accountants: Not applicable |
(b) Certifications pursuant to Rule 30a-2(b) are furnished herewith.
SIGNATURES
Pursuant to the requirements of the Securities Exchange Act of 1934 and the Investment Company Act of 1940, the registrant has duly caused this report to be signed on its behalf by the undersigned, thereunto duly authorized.
(Registrant) Unified Series Trust
By _ s/ Martin R. Dean______________
Martin R. Dean, President
Date_6/6/2023____
Pursuant to the requirements of the Securities Exchange Act of 1934 and the Investment Company Act of 1940, this report has been signed below by the following persons on behalf of the registrant and in the capacities and on the dates indicated.
By ___/s/ Martin R. Dean________
Martin R. Dean, President
Date_6/6/2023__
By ____/s/ Zachary P. Richmond____________
Zachary P. Richmond, Treasurer
Date__6/6/2023______