united states
securities and exchange commission
washington, d.c. 20549
form n-csr
certified shareholder report of registered management
investment companies
Investment Company Act file number 811-21237
Unified Series Trust
(Exact name of registrant as specified in charter)
225 Pictoria Drive, Suite 450
Cincinnati, OH 45246
(Address of principal executive offices)
(Zip code)
Zachary P. Richmond
Ultimus Fund Solutions, LLC
225 Pictoria Drive. Suite 450
Cincinnati, OH 45246
(Name and address of agent for service)
Registrant’s telephone number, including area code: 513-587-3400
Date of fiscal year end: 9/30
Date of reporting period: 9/30/23
Form N-CSR is to be used by management investment companies to file reports with the Commission not later than 10 days after the transmission to stockholders of any report that is required to be transmitted to stockholders under Rule 30e-1 under the Investment Company Act of 1940 (17 CFR 270.30e-1). The Commission may use the information provided on Form N-CSR in its regulatory, disclosure review, inspection and policymaking roles.
A registrant is required to disclose the information specified by Form N-CSR, and the Commission will make this information public. A registrant is not required to respond to the collection of information contained in Form N-CSR unless the Form displays a currently valid Office of Management and Budget ("OMB") control number. Please direct comments concerning the accuracy of the information collection burden estimate and any suggestions for reducing the burden to Secretary, Securities and Exchange Commission, 450 Fifth Street, NW, Washington, DC 20549-0609. The OMB has reviewed this collection of information under the clearance requirements of 44 U.S.C. § 3507.
Item 1. Reports to Stockholders.
| (a) | PRINTER: Insert the Appleseed Fund, Ballast Small/Mid Cap ETF and Channel Short Duration Income Fund 9/30/23 annual reports here. |

Annual Report
September 30, 2023
Fund Adviser:
Pekin Hardy Strauss, Inc.
227 West Monroe Street, Suite 3625
Chicago, IL 60606
Toll Free (800) 470-1029
www.appleseedfund.com

October 30, 2023
Dear Appleseed Shareholder:
“I’m still trying to process why long-end interest rates are increasing.”
– Austan Goolsbee, President of the Federal Reserve Bank of Chicago September 2023
Bloomberg Aggregate Bond Index
Investment Returns |
| Year | Total Returns |
| 2021 | -1.6% |
| 2022 | -13.0% |
| 2023 YTD* | -1.0% |
The Bloomberg US Aggregate Bond Index is the most well-known benchmark for the U.S. bond market. Over the past 20 years, annual investment returns from this index have averaged 3.0%, which is well below its longer-term average. Post-2020, investment returns from the bond market have been particularly weak, as demonstrated in the table on the left.1 Bond investors have been hurt by rising interest rates, which have stifled bond prices and limited total returns. For investors in Treasury bonds with maturities of more than 20 years, the investment losses since the peak of bond prices (and lows in yields) in August 2020 are commensurate with the losses sustained by equities in the S&P 500 Index during the Global Financial Crisis from peak to trough.1
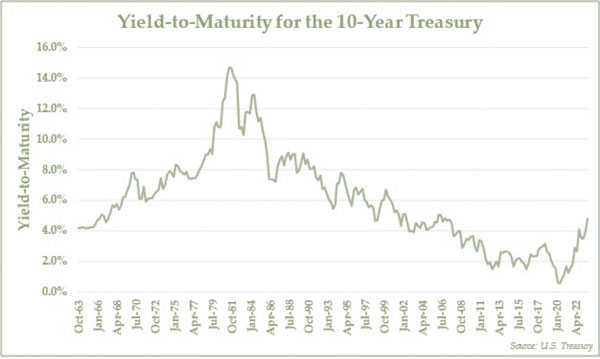
We highlighted in our February 2021 investment commentary the seemingly massive risks associated with the bond market at the time. At the time of publication, the 10-year Treasury bond’s yield-to-maturity was merely 1.1%, and the inflation-adjusted rate of return offered to investors was decidedly negative. Roughly 75% of the global bond market paid a yield-to-maturity of less than 1%, and only 10% of the global bond market offered a yield-to-maturity of more than 3%. A record number of global bonds traded with a negative yield-to-maturity, representing about $17 trillion in total value, which means that holders were guaranteed to receive a negative investment return from holding these bonds to maturity.2
| 1 | Source: www.bloomberg.com/markets/rates-bonds/blooberg-fixed-income-indices. |
| www.appleseedfund.com | (800) 470-1029 |
The juxtaposition of the January 2021 bond market relative to today’s bond market could not be starker. Yields-to-maturity on the 10-year Treasury bond and the 30-year Treasury bond are higher than they were prior to the beginning of the Global Financial Crisis. For the last 18 months, the Federal Reserve has been raising short-term interest rates for the purpose of stemming rising inflation. Over the past 2.5 years, both short-term and long-term interest rates rose; however, since mid-summer 2023, the ascent in long-term interest rates has been surprisingly violent and rather unexpected. Reflecting this trend, the yield-to-maturity on the 10-year Treasury is up 24% year-to-date and 825% since August 2020.3
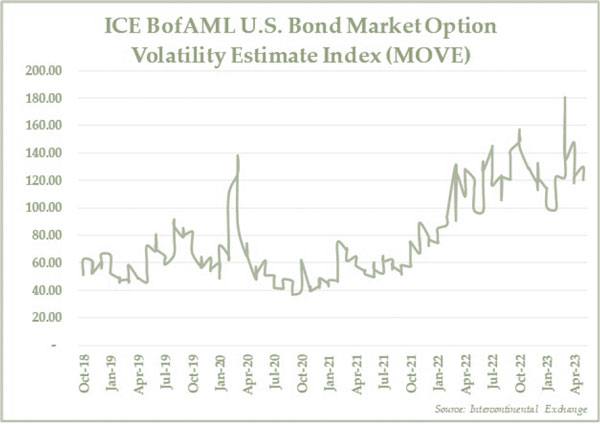
Notably, it is not just the absolute level of interest rates that have been rising; in addition, bond market volatility has tripled over the past two years. The ICE BofAML U.S. Bond Market Option Volatility Estimate Index (the “MOVE Index”) measures U.S. interest rate volatility. The MOVE Index helps to define general market risk and investor sentiment, meaning that recent swings upwards in the MOVE Index reflect increasing fears of future turmoil in the Treasury market.4
| 4 | The data in the chart on the top of the next page looks more disjointed than that in many graphs, given the big moves in the MOVE Index that can happen from month-to-month. |
| www.appleseedfund.com | (800) 470-1029 |
While Chicago Federal Reserve Bank President Austan Goolsbee claims that he is merely trying to process why long-term interest rates are rising, it seems to us that colossal Federal deficits are pressuring investors’ ability and/or willingness to absorb the enormous and increasing Treasury bond issuances that are taking place. Foreigners own roughly 30% of U.S. Treasuries, and demand from these investors has waned, particularly from China and Japan. Another large U.S. Treasury holder, the Federal Reserve, has been steadily selling off its holdings at a pace of ~$60 billion/month (along with an incremental ~$35 billion in mortgage-backed securities). Simultaneously, since the Federal government is running a significant $2 trillion deficit, the Department of the Treasury has been on a borrowing bender, raising $1.7 trillion in 2023 YTD, up a whopping 80% vs. 2022. In summary, the recent volatile and upward moves in interest rates mean that the immense size of the U.S. deficit and its worrisome trajectory are finally starting to matter.
| www.appleseedfund.com | (800) 470-1029 |
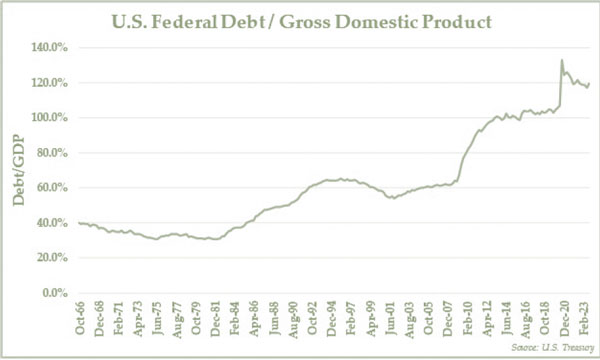
Today, the gross Federal debt stands at $33 trillion (and climbing), and U.S. government debt currently stands at 119% of GDP.5 These figures warrant some context – on a per person basis, this liability represents nearly $100,000 in Federal debt. Of the OECD nations, only Italy (151%), Greece (192%), and Japan (255%) currently have a greater debt/GDP ratio than that of the United States. With an assumed rise in interest rates of only 0.05%/year from current levels, the Congressional Budget Office (CBO) believes that debt/GDP will nearly double in the next 30 years to 231%.
Nearly 29% of Federal debt maturing in the next year will need to be refinanced from a near zero cost to an interest rate cost of 4.8% - 5.6%, depending on the duration of bonds auctioned.5 Interest expenses represented about 8% of total Federal outlays in 2022; by the end of 2023, that share is projected by the CBO to rise to 14% and will exceed the costs generated by the Department of Defense as well as Medicaid. At the current trajectory of Federal spending and tax receipts, debt/GDP is anticipated to continue to climb at a high rate until interest expenses surpasses all other Federal programs within the next 30 years and will account for nearly 40% of Federal tax receipts.6
| 5 | Source: The Federal Reserve Bank of St. Louis. |
| 6 | Peter J. Peterson Institute. |
| www.appleseedfund.com | (800) 470-1029 |
In the face of the recent dysfunction in Washington, we believe that it is more likely than not that the Federal government will merely kick the proverbial can down the road once again, as all options for reducing the debt/GDP ratio represent veritable career suicide. Beyond the growing interest expenses, the main contributors to future Federal deficits are Medicare and Social Security entitlement payments; cutting these entitlements would undoubtedly result in angry voters firing many of their D.C. representatives. In addition, defense spending is not likely to slow any time soon, given that the United States has embroiled itself in wars in Ukraine and in the Middle East. Increased income taxation is a somewhat improbable scenario for now, not only because of the lack of political consensus about taxation, but also because ironically it may reduce GDP growth. Ultimately, it seems that the politically palatable and realistic scenario is continued inflation to lower the future value of the U.S. debt burden and associated interest costs.
At some unknowable point in the future, these worsening deficit trends may cause the bond market to seize up, as it did in the March 2020, and the financial wherewithal of the U.S. Treasury would jump to front and center in investors’ minds. Such bond market gyrations would negatively impact all financial markets, given that the Treasury market is the market from which all other capital markets take their cues; the 10-Year Treasury interest rate is the most meaningful price for the most important asset across the globe. The Federal Reserve would have little choice but to act decisively in the face of a Treasury market crisis, should liquidity dry up, bond prices plummet, and yields spike.
Acting decisively would mean that the Federal Reserve would need to aggressively purchase Treasury bonds once again to cap borrowing costs, given the implied exploding interest costs and the considerable debt load borne by the Federal government. Instead of purchasing bonds directly, the Federal Reserve could modify regulations to nudge the banking system into buying more Treasuries. The policy term to describe these interest-rate-capping policies, whether direct or via the banking system, is “yield curve control.”
Yield curve control, once taken, would stand in direct contradiction with the Federal Reserve’s current policy, which is to keep interest rates higher for longer to stem the fires of inflation. Lowering the cost of debt capital in an
| www.appleseedfund.com | (800) 470-1029 |
inflationary environment would be stimulative and would stoke inflation that much more. It would also result in a depreciation in the U.S. dollar, such as what took place during the last major intervention in March 2020.
Should this scenario occur, we believe that yield curve control would impact various asset classes in the following ways:
With corporate credit spreads within historical ranges, investors are currently not paid exceptionally well to bear much credit risk, especially if the economy is heading into a recession. Long-dated Treasury bonds are particularly sensitive to interest rates and, in our view, still do not compensate investors adequately.
Meanwhile, short-dated U.S. Treasuries continue to represent particular value right now, as they offer a ~5.5% yield to maturity with no credit risk, limited interest rate risk, and near-zero liquidity risk.
Interest rate volatility weighs on stock prices, causing investor skittishness and compression of stock valuation multiples. As bonds increasingly offer higher yields, investors will incrementally move money from stocks to bonds. Should the Federal Reserve pivot and implement yield curve control, investors would quickly move back into stocks, as stocks would likely outperform bonds in a highly inflationary environment.
Historically, value stocks have demonstrated that they perform relatively better than growth stocks in an inflationary environment due to their already compressed valuation ratios. Sectors that historically have performed well in inflationary environments include energy, commodities, consumer staples, and agriculture.
Real estate becomes a useful and popular store of value amid inflation while generating increased rental income. Tangible assets that have scarcity value like gold should rise in price with a depreciating dollar.
To clarify, we are not saying that yield curve control is hiding right around the bend. The combination of increased volatility in the Treasury market, spiking funding costs, growing political dysfunction, and mounting government deficits
| www.appleseedfund.com | (800) 470-1029 |
is likely to turn out to be a wicked cocktail for investors at some knowable point in the future. Investors are now beginning to recognize that the scale and trajectory of borrowing and absence of a viable solution are going to threaten markets and the economy in a way that has not been seen for a very long time.
Performance and Portfolio Changes
Over the 12 months ended 9/30/2023, Appleseed Fund Investor Class has generated an absolute return of 1.06%, underperforming the Morningstar Global Markets Small-Mid Cap Index, which generated a total return of 15.13%. Throughout most of the past year, Appleseed Fund was positioned for an inflationary, slow growth economy. With disinflation starting late last year, causing a ripping stock market, Appleseed’s cautious positioning held back investment returns. In particular, Appleseed Fund has held a material position in index puts throughout the year, which has been the biggest detractor of investment performance by far.
Appleseed Fund added three new names to the portfolio in the past three months: Dollar General (DG), Wesco International (WCC), and Genko Shipping & Trading (GNK). DG is the leading U.S. discount dollar store retailer with over 19,000 stores in 47 states. We believe DG’s stock price has been uncharacteristically weak this year due to a confluence of issues: inflation squeezing the core customer, labor limitations and execution challenges that are keeping the stores unevenly stocked, multiple guidance downgrades, margin squeezes, rising interest costs, and inflationary construction costs. Nevertheless, DG offers tremendous value to investors, beyond its compelling valuation. DG has an advantageously located store network with low rent and labor costs; its footprint is focused on thinly populated areas that cannot support numerous retailers. The Company’s business is highly stable with predictable sales and margins, while comps have been positive every year over the past 30 years, excluding the post-COVID-19 hangover year (and possibly the current fiscal year). It is important to note that its small basket sizes limits online competition. Not only does this business have high returns on capital and historically consistent margins, but it is also a highly defensive business in that rural consumers’ dollars go further than at any other retailer. Lastly, DG recently brought back well respected former CEO Todd Vasos out of retirement to right the ship.
| www.appleseedfund.com | (800) 470-1029 |
WCC and GNK are direct beneficiaries of rising inflation. With a 100-year operating history, WCC is the market leader in electrical distribution products in North America. With low capital expenditure requirements, the free cash flow generation capability of this business is impressive, and the Company plans to aggressively return the excess cash to shareholders. An owner of drybulk ships, GNK’s stock price has been cut in one-half from its June 2022 price, despite its balance sheet improvement, an unwavering commitment to return excess free cash flow to shareholders, and an industry-low cash flow breakeven rate. Despite a constructive market backdrop with industry orderbooks at low levels and China’s expected recovery, the stock price only trades at roughly two-thirds of its net asset value. With a fetching valuation, we believe GNK and WCC’s future investment returns should be attractive to Appleseed investors in the years ahead.
Within the equity portion of the portfolio, the biggest contributors to the Fund’s performance over the past 12 months were Boardwalk REIT (BEI. UT-CA), Samsung Electronics (005930-KR), MRC Global (MRC), Sprouts Farmers Markets (SFM) and Ardelyx (ARDX). The most significant detractors from performance over the past 12 months have been Fannie Mae preferreds (FNMAT and FNMAS), Dollar General (DG) Heron Therapeutics (HRTX), Synovus (SNV), and index puts used for hedging purposes.
Currently, Appleseed Fund is positioned defensively in light of this bearish outlook on the economy. With regards to equities, we are favoring companies in the consumer staples, healthcare, and agriculture sectors as well as inexpensive, out-of-favor value stocks. We do not believe that inflation is under control, as most of the long-term drivers of inflation remain in place. As an example, the Federal Reserve may make incremental progress on reported inflation, but falling U.S. Treasury receipts without a decline in unemployment is a highly problematic signal. The U.S. fiscal situation needs the dollar down and inflation back up to avoid significant fiscal problems in the near-term.
Beyond equities, Appleseed Fund is overweight U.S. Treasuries and physical gold trusts. We own Treasuries because, as previously mentioned, short-term Treasuries have become attractive for the first time in many years. We own gold because gold should help to reduce portfolio volatility and is likely to perform well in an environment where inflation remains persistently elevated even while real growth is slowing.
| www.appleseedfund.com | (800) 470-1029 |
We thank Appleseed Fund shareholders for their continued support of us in the management of their investable assets.
Sincerely,
Adam Strauss, CFA
William Pekin, CFA
Joseph Plevelich, CFA
Shaun Roach, CFA
Joshua Strauss, CFA
Appleseed Fund Portfolio Managers
The Fund’s Top Ten Holdings can be found at www.appleseedfund.com
Diversification does not ensure a profit or guarantee against loss.
This commentary is prepared by Pekin Hardy Strauss, Inc. (dba “Pekin Hardy Strauss Wealth Management”, “Pekin Hardy”) for informational purposes only and is not intended as an offer or solicitation for the purchase or sale of any security. The information contained herein is neither investment advice nor a legal opinion. The views expressed are those of the authors as of the date of publication of this report, and are subject to change at any time due to changes in market or economic conditions. Pekin Hardy cannot assure that the type of investments discussed herein will outperform any other investment strategy in the future. Although information has been obtained from and is based upon sources Pekin Hardy believes to be reliable, we do not guarantee their accuracy. There are no assurances that any predicted results will actually occur. The Bloomberg US Aggregate Bond Index is a broad benchmark index for the U.S. bond market. The index covers all major types of bonds, including taxable corporate bonds, Treasury bonds, and municipal bonds. The S&P 500 Index includes a representative sample of 500 hundred companies in leading industries of the U.S. economy, focusing on the large-cap segment of the market. The MOVE index, or ICE BofA U.S. Bond Market Option Volatility Estimate Index, is a crucial gauge of interest rate volatility in the U.S. Treasury market calculated from options prices, which reflect the collective expectations of market participants about future volatility.
Investments in commodities such as gold may be affected by overall market movements, changes in interest rates, and other factors such as embargoes and international economic and political developments. Commodities are assets that have tangible properties, such as oil, metals, and agricultural products. These instruments may subject the Fund to greater volatility than investments in traditional securities.
The views and opinions expressed in this material are those of the authors. While we believe we have a reasonable basis for our appraisals and we have confidence in our opinions, actual results may differ materially from those we anticipate. These opinions are current as of the date of this letter but are subject to change. There is no guarantee that any forecasts or opinions in this material will be realized. Information should not be construed as investment advice nor be considered a recommendation to buy, sell, or hold any particular security.
You should consider the Fund’s investment objectives, risks, charges, and expenses carefully before you invest. The Fund’s prospectus contains important information about the Fund’s investment objectives, potential risks, management fees, charges and expenses, and other information and should be read carefully before investing. You may obtain a current copy of the Fund’s prospectus or performance data current to the most recent month by calling 1-800-470-1029.
| www.appleseedfund.com | (800) 470-1029 |
| INVESTMENT RESULTS – (Unaudited) |
| | Average Annual Total Returns(a) | |
| | (for the periods ended September 30, 2023) | |
| | | | | | Since | Since | |
| | | One | Five | Ten | Inception | Inception | |
| | | Year | Year | Year | (12/08/06) | (1/31/11) | |
| | Appleseed Fund | | | | | | |
| | Investor Class | 1.06% | 2.56% | 3.05% | 5.17% | N/A | |
| | Institutional Class | 1.21% | 2.73% | 3.25% | N/A | 4.76% | |
| | Morningstar Global Markets | | | | | | |
| | Small-Mid Cap Index(b) | 15.13% | 3.97% | 6.24% | 5.70% | 6.71% | |
| | | | | | | | |
| | | | | | Expense Ratios(c) | |
| | | | | | Investor | Institutional | |
| | | | | | Class | Class | |
| | Gross | | | | 1.57% | 1.32% | |
| | With Applicable Waivers | | | | 1.23% | 1.04% | |
The performance quoted represents past performance, which does not guarantee future results. The investment return and principal value of an investment will fluctuate so that an investor’s shares, when redeemed, may be worth more or less than their original cost. The returns shown do not reflect deduction of taxes that a shareholder would pay on Appleseed Fund (the “Fund”) distributions or the redemption of Fund shares. Current performance of the Fund may be lower or higher than the performance quoted.The Fund’s investment objectives, risks, charges and expenses should be considered carefully before investing. Performance data current to the most recent month-end may be obtained by calling (800) 470-1029.
| (a) | Return figures reflect any change in price per share and assume the reinvestment of all distributions. The Fund’s returns reflect any fee reductions during the applicable period. If such fee reductions had not occurred, the quoted performances would have been lower. |
| (b) | The Morningstar Global Markets Small-Mid Cap Index (the “Morningstar Index”) measures the performance of global equity markets targeting the top 71% to 97% of stocks by market capitalization in both developed and emerging markets. The Morningstar Index does not incorporate Environmental, Social, or Governance (ESG) criteria. The Morningstar Index returns do not reflect the deduction of expenses, which have been deducted from the Fund’s returns. The Morningstar Index returns assume reinvestment of all distributions and do not reflect the deduction of taxes and fees. An individual cannot invest directly in the Morningstar Index. However, an individual may be able to invest in exchange-traded funds or other investment vehicles that attempt to track the performance of a benchmark index. The Fund is not sponsored, endorsed, sold or promoted by Morningstar, Inc. or any of its affiliates (all such entities, collectively, “Morningstar Entities”).The Morningstar Entities make no representation or warranty, express or implied, to individuals who invest in the Fund or any member of the public regarding the advisability of investing in equity securities generally or in the Fund in particular or the ability of the Fund to track the Morningstar Indices or general equity market performance.THE MORNINGSTAR ENTITIES DO NOT GUARANTEETHE ACCURACY AND/ORTHE COMPLETENESS OFTHE FUND OR ANY DATA INCLUDEDTHEREIN AND MORNINGSTAR ENTITIES SHALL HAVE NO LIABILITY FOR ANY ERRORS, OMISSIONS, OR INTERRUPTIONS THEREIN. |
| (c) | The expense ratios, which include acquired fund fees and expenses of 0.09%, are from the Fund’s prospectus dated January 28, 2023. Pekin Hardy Strauss, Inc. (the “Adviser”) has contractually agreed to waive its management fee and/or reimburse expenses through January 31, 2024 so that total annual operating expenses (excluding portfolio transaction and other investment-related costs (including brokerage fees and commissions); taxes; borrowing costs (such as interest and dividend expenses on securities sold short); acquired fund fees and expenses; fees and expenses associated |
| www.appleseedfund.com | (800) 470-1029 |
| INVESTMENT RESULTS – continued (Unaudited) |
with investments in other collective investment vehicles or derivative instruments (including for example option and swap fees and expenses); any amounts payable pursuant to a distribution or service plan adopted in accordance with Rule 12b-1 under the Investment Company Act of 1940, as amended; any administrative and/or shareholder servicing fees payable pursuant to a plan adopted by the Board of Trustees; expenses incurred in connection with any merger or reorganization; extraordinary expenses (such as litigation expenses, indemnification of Trust officers and Trustees and contractual indemnification of Fund service providers); and other expenses that the Trustees agree have not been incurred in the ordinary course of the Fund’s business) do not exceed 0.95% of the Fund’s average daily net assets. Each waiver/expense payment by the Adviser is subject to recoupment by the Adviser from the Fund in the three years following the date the particular waiver/expense payment occurred, but only if such recoupment can be achieved without exceeding the annual expense limitation in effect at the time of the waiver/expense payment and any expense limitation in effect at the time of the recoupment. This expense cap may not be terminated prior to this date except by the Board of Trustees upon 60 days’ written notice to the Adviser. Additional information pertaining to the Fund’s expense ratios as of September 30, 2023 can be found in the financial highlights, which do not include acquired fund fees and expenses.
You should consider the Fund’s investment objectives, risks, charges and expenses carefully before you invest. The Fund’s prospectus contains important information about the Fund’s investment objectives, potential risks, management fees, charges and expenses, and other information and should be read carefully before investing. You may obtain a current copy of the Fund’s prospectus or performance data current to the most recent month-end by calling (800) 470-1029.
| www.appleseedfund.com | (800) 470-1029 |
| INVESTMENT RESULTS – continued (Unaudited) |
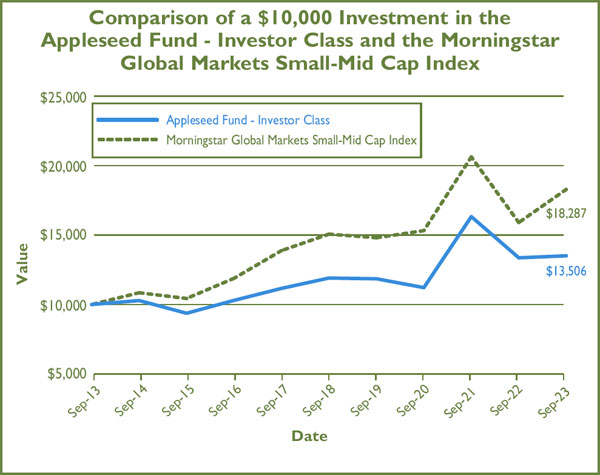
This graph shows the value of a hypothetical initial investment of $10,000 made on September 30, 2013 for the Investor Class and held through September 30, 2023. The Morningstar Global Markets Small-Mid Cap Index measures the performance of global equity markets targeting the top 71% to 97% of stocks by market capitalization in both developed and emerging markets. The index returns assume reinvestment of all distributions and do not reflect the deduction of taxes and fees. Individuals cannot invest directly in an index. However, an individual may invest in exchange-traded funds or other investment vehicles that attempt to track the performance of a benchmark index. THE FUND’S RETURNS REPRESENT PAST PERFORMANCE AND DO NOT GUARANTEE FUTURE RESULTS. The returns shown do not reflect deduction of taxes that a shareholder would pay on Fund distributions or the redemption of Fund shares. Investment returns and principal values will fluctuate so that your shares, when redeemed, may be worth more or less than their original purchase price.
Current performance of the Fund may be lower or higher than the performance quoted. For more information on the Fund, and to obtain performance data current to the most recent month-end or to request a prospectus, please call (800) 470-1029. The Fund’s investment objectives, risks, charges and expenses should be considered carefully before investing. The prospectus contains this and other important information about the Fund and should be read carefully before investing.
The Fund is distributed by Ultimus Fund Distributors, LLC, member FINRA/SIPC.
| www.appleseedfund.com | (800) 470-1029 |
| INVESTMENT RESULTS – continued (Unaudited) |
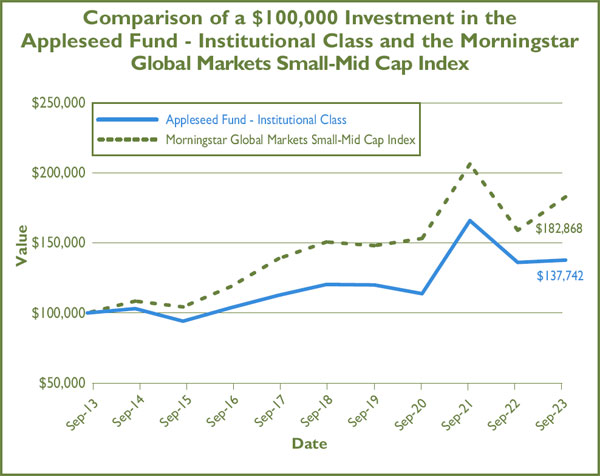
This graph shows the value of a hypothetical initial investment of $100,000 made on September 30, 2013 for the Institutional Class and held through September 30, 2023.The Morningstar Global Markets Small-Mid Cap Index measures the performance of global equity markets targeting the top 71% to 97% of stocks by market capitalization in both developed and emerging markets. The index returns assume reinvestment of all distributions and do not reflect the deduction of taxes and fees. Individuals cannot invest directly in an index. However, an individual may invest in exchange-traded funds or other investment vehicles that attempt to track the performance of a benchmark index. THE FUND’S RETURNS REPRESENT PAST PERFORMANCE AND DO NOT GUARANTEE FUTURE RESULTS. The returns shown do not reflect deduction of taxes that a shareholder would pay on Fund distributions or the redemption of Fund shares. Investment returns and principal values will fluctuate so that your shares, when redeemed, may be worth more or less than their original purchase price.
Current performance of the Fund may be lower or higher than the performance quoted. For more information on the Fund, and to obtain performance data current to the most recent month-end or to request a prospectus, please call (800) 470-1029. The Fund’s investment objectives, risks, charges and expenses should be considered carefully before investing. The prospectus contains this and other important information about the Fund and should be read carefully before investing.
The Fund is distributed by Ultimus Fund Distributors, LLC, member FINRA/SIPC.
| www.appleseedfund.com | (800) 470-1029 |
| FUND HOLDINGS – (Unaudited) |
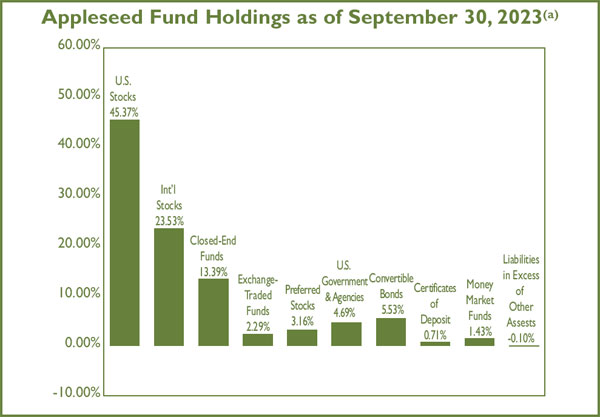
| (a) | As a percentage of net assets. |
The Fund invests primarily in a portfolio of equity securities of companies that are undervalued in the opinion of the Adviser. The investment objective of the Fund is long-term capital appreciation.
Availability of Portfolio Schedule (Unaudited)
The Fund files its complete schedule of portfolio holdings with the Securities and Exchange Commission (the “SEC”) for the first and third quarters of each fiscal year as an exhibit to its reports on Form N-PORT. The Fund’s Form N-PORT reports are available on the SEC’s website at www.sec.gov and on the Fund’s website at www.appleseedfund.com.
| APPLESEED FUND |
| SCHEDULE OF INVESTMENTS |
| September 30, 2023 |
| | | | | | Fair | |
| Common Stocks — 68.90% | | Shares | | | Value | |
| | | | | | | | | |
| Canada — 4.55% | | | | | | | | |
| Real Estate — 4.55% | | | | | | | | |
| Boardwalk Real Estate Investment Trust | | | 65,000 | | | $ | 3,197,263 | |
| Total Canada | | | | | | | 3,197,263 | |
| France — 3.18% | | | | | | | | |
| Communications — 3.18% | | | | | | | | |
| Bollore SA | | | 415,000 | | | | 2,233,164 | |
| Total France | | | | | | | 2,233,164 | |
| Ireland — 5.46% | | | | | | | | |
| Financials — 3.34% | | | | | | | | |
| AerCap Holdings NV(a) | | | 37,500 | | | | 2,350,125 | |
| Health Care — 2.12% | | | | | | | | |
| Medtronic PLC | | | 19,000 | | | | 1,488,840 | |
| Total Ireland | | | | | | | 3,838,965 | |
| Israel — 3.19% | | | | | | | | |
| Industrials — 3.19% | | | | | | | | |
| Ituran Location and Control Ltd. | | | 75,000 | | | | 2,242,500 | |
| Total Israel | | | | | | | 2,242,500 | |
| Japan — 2.35% | | | | | | | | |
| Technology — 2.35% | | | | | | | | |
| Sony Group Corp. - ADR | | | 20,000 | | | | 1,648,200 | |
| Total Japan | | | | | | | 1,648,200 | |
| Russia — 0.00% | | | | | | | | |
| Financials — 0.00% | | | | | | | | |
| Moscow Exchange MICEX-RTS PJSC - ADR(a)(b)(c) | | | 1,300,000 | | | | 133 | |
| Sberbank of Russia PJSC - ADR(a)(b)(c) | | | 324,000 | | | | 3 | |
| Total Russia | | | | | | | 136 | |
| South Korea — 2.38% | | | | | | | | |
| Technology — 2.38% | | | | | | | | |
| Samsung Electronics Co. Ltd. | | | 33,000 | | | | 1,669,786 | |
| Total South Korea | | | | | | | 1,669,786 | |
| Switzerland — 2.42% | | | | | | | | |
| Health Care — 2.42% | | | | | | | | |
| Roche Holding AG - ADR | | | 50,000 | | | | 1,696,500 | |
| Total Switzerland | | | | | | | 1,696,500 | |
| United States — 45.37% | | | | | | | | |
| Consumer Discretionary — 3.27% | | | | | | | | |
| VF Corporation | | | 130,000 | | | | 2,297,100 | |
See accompanying notes which are an integral part of these financial statements.
| APPLESEED FUND |
| SCHEDULE OF INVESTMENTS – continued |
| September 30, 2023 |
| | | | | | Fair | |
| Common Stocks — 68.90 — continued | | Shares | | | Value | |
| | | | | | | |
| United States — 45.37% — continued | | | | | | | | |
| Consumer Staples — 8.46% | | | | | | | | |
| Dollar General Corp | | | 27,500 | | | $ | 2,909,500 | |
| Herbalife Nutrition Ltd.(a) | | | 125,000 | | | | 1,748,750 | |
| Sprouts Farmers Market, Inc.(a) | | | 30,000 | | | | 1,284,000 | |
| | | | | | | | 5,942,250 | |
| Energy — 3.21% | | | | | | | | |
| MRC Global, Inc.(a) | | | 220,000 | | | | 2,255,000 | |
| Financials — 7.08% | | | | | | | | |
| CNB Financial Corp. | | | 95,000 | | | | 1,720,450 | |
| Evercore, Inc., Class A | | | 10,500 | | | | 1,447,740 | |
| Synovus Financial Corp. | | | 65,000 | | | | 1,807,000 | |
| | | | | | | | 4,975,190 | |
| Health Care — 1.74% | | | | | | | | |
| Ardelyx, Inc.(a) | | | 300,000 | | | | 1,224,000 | |
| Industrials — 6.22% | | | | | | | | |
| Genco Shipping & Trading Ltd. | | | 105,000 | | | | 1,468,950 | |
| Stanley Black & Decker, Inc. | | | 17,500 | | | | 1,462,650 | |
| WESCO International, Inc. | | | 10,000 | | | | 1,438,200 | |
| | | | | | | | 4,369,800 | |
| Materials — 7.57% | | | | | | | | |
| CF Industries Holdings, Inc. | | | 33,000 | | | | 2,829,420 | |
| Mosaic Co. (The) | | | 70,000 | | | | 2,492,000 | |
| | | | | | | | 5,321,420 | |
| Real Estate — 2.26% | | | | | | | | |
| Alexander & Baldwin, Inc. | | | 95,000 | | | | 1,589,350 | |
| Technology — 5.56% | | | | | | | | |
| Lumentum Holdings, Inc.(a) | | | 40,000 | | | | 1,807,200 | |
| SS&C Technologies Holdings, Inc. | | | 40,000 | | | | 2,101,600 | |
| | | | | | | | 3,908,800 | |
| Total United States | | | | | | | 31,882,910 | |
| TOTAL COMMON STOCKS | | | | | | | | |
| (Cost $46,937,408) | | | | | | | 48,409,424 | |
See accompanying notes which are an integral part of these financial statements.
| APPLESEED FUND |
| SCHEDULE OF INVESTMENTS – continued |
| September 30, 2023 |
| | | Shares/ | | | | |
| | | Principal | | | Fair | |
| Closed End Funds — 13.39% | | Amount | | | Value | |
| | | | | | | | | |
| Canada — 13.39% | | | | | | | | |
| Sprott Physical Gold Trust(a) | | | 550,000 | | | $ | 7,876,000 | |
| Sprott Physical Uranium Trust(a) | | | 90,000 | | | | 1,534,500 | |
| TOTAL CLOSED END FUNDS | | | | | | | | |
| (Cost $7,343,781) | | | | | | | 9,410,500 | |
| | | | | | | | | |
| Exchange-Traded Funds — 2.29% | | | | | | | | |
| | | | | | | | | |
| United States — 2.29% | | | | | | | | |
| VanEck Merk Gold Shares(a) | | | 90,000 | | | | 1,610,100 | |
| TOTAL EXCHANGE-TRADED FUNDS | | | | | | | | |
| (Cost $1,559,808) | | | | | | | 1,610,100 | |
| | | | | | | | | |
| Preferred Stocks — 3.16% | | | | | | | | |
| | | | | | | | | |
| United States — 3.16% | | | | | | | | |
| Financials — 3.16% | | | | | | | | |
| Federal National Mortgage Association, | | | | | | | | |
| Series S, 5.25% | | | 490,000 | | | | 1,087,800 | |
| Federal National Mortgage Association, | | | | | | | | |
| Series T, 8.25% | | | 490,000 | | | | 1,131,900 | |
| TOTAL PREFERRED STOCKS | | | | | | | | |
| (Cost $2,249,482) | | | | | | | 2,219,700 | |
| | | | | | | | | |
| U.S. Government & Agencies — 4.69% | | | | | | | | |
| | | | | | | | | |
| United States Treasury Inflation Indexed Bonds | | | | | | | | |
| 0.63%, 1/15/2024(d) | | $ | 1,179,036 | | | | 1,167,949 | |
| United States Treasury Inflation Indexed Bonds | | | | | | | | |
| 0.50%, 1/15/2028(d) | | | 1,239,210 | | | | 1,143,010 | |
| United States Treasury Note/Bond 1.50%, | | | | | | | | |
| 2/29/2024 | | | 1,000,000 | | | | 983,926 | |
| TOTAL U.S. GOVERNMENT & AGENCIES | | | | | | | | |
| (Cost $3,340,783) | | | | | | | 3,294,885 | |
See accompanying notes which are an integral part of these financial statements.
| APPLESEED FUND |
| SCHEDULE OF INVESTMENTS – continued |
| September 30, 2023 |
| | | Shares/ | | | | |
| | | Principal | | | Fair | |
| Convertible Bonds — 5.53% | | Amount | | | Value | |
| | | | | | | | | |
| Herbalife Nutrition Ltd., 2.63%, 3/15/2024 | | $ | 2,250,000 | | | $ | 2,201,625 | |
| Lumentum Holdings, Inc., 0.50%, 12/15/2026 | | | 2,000,000 | | | | 1,686,000 | |
| | | | | | | | | |
| TOTAL CONVERTIBLE BONDS | | | | | | | | |
| (Cost $4,473,975) | | | | | | | 3,887,625 | |
| | | | | | | | | |
| Certificates of Deposit — 0.71% | | | | | | | | |
| | | | | | | | | |
| Community Development Bank, | | | | | | | | |
| 1.40%, 3/8/2024 | | | 250,000 | | | | 250,000 | |
| Spring Bank, | | | | | | | | |
| 3.50%, 3/29/2024 | | | 250,000 | | | | 250,000 | |
| TOTAL CERTIFICATES OF DEPOSIT | | | | | | | | |
| (Cost $500,000) | | | | | | | 500,000 | |
| | | | | | | | | |
| Money Market Funds — 1.43% | | | | | | | | |
| | | | | | | | | |
| Federated Hermes Government Obligations Fund, Institutional Class, 5.20%(e). | | | 1,006,398 | | | | 1,006,398 | |
| TOTAL MONEY MARKET FUNDS | | | | | | | | |
| (Cost $1,006,398) | | | | | | | 1,006,398 | |
| Total Investments — 100.10% | | | | | | | | |
| (Cost $67,411,635) | | | | | | | 70,338,632 | |
| Liabilities in Excess of Other Assets — (0.10)% | | | | | | | (71,141 | ) |
| Net Assets — 100.00% | | | | | | $ | 70,267,491 | |
| (a) | Non-income producing security. |
| (b) | Security is currently being valued according to the fair value procedures. |
| (c) | Illiquid security. The total fair value of these securities as of September 30, 2023 was $136, representing 0.00% of net assets. |
| (d) | Principal amount of security is adjusted periodically based on changes in the Consumer Price Index. |
| (e) | Rate disclosed is the seven day effective yield as of September 30, 2023. |
ADR — American Depositary Receipt
See accompanying notes which are an integral part of these financial statements.
| APPLESEED FUND |
| STATEMENT OF ASSETS AND LIABILITIES |
| September 30, 2023 |
| Assets | | | | |
| Investments in securities, at fair value (cost $67,411,635) | | $ | 70,338,632 | |
| Cash at broker | | | 2,277 | |
| Receivable for fund shares sold | | | 762 | |
| Receivable for investments sold | | | 89,713 | |
| Dividends receivable | | | 101,854 | |
| Tax reclaims receivable | | | 57,168 | |
| Prepaid expenses | | | 11,596 | |
| Total Assets | | | 70,602,002 | |
| Liabilities | | | | |
| Payable for fund shares redeemed | | | 252,761 | |
| Payable to Adviser, net of waiver | | | 26,398 | |
| Payable for Administrative Service Plan fees, Investor Class, net of waiver | | | 4,050 | |
| Payable to affiliates | | | 12,091 | |
| Other accrued expenses | | | 39,211 | |
| Total Liabilities | | | 334,511 | |
| Net Assets | | $ | 70,267,491 | |
| Net Assets consist of: | | | | |
| Paid-in capital | | | 72,861,381 | |
| Accumulated deficit | | | (2,593,890 | ) |
| Net Assets | | $ | 70,267,491 | |
| Net Assets: Investor Class | | $ | 25,066,061 | |
| Shares outstanding (unlimited number of shares authorized, no par value) | | | 1,963,191 | |
| Net asset value, offering and redemption price per share(a) | | $ | 12.77 | |
| Net Assets: Institutional Class | | $ | 45,201,430 | |
| Shares outstanding (unlimited number of shares authorized, no par value) | | | 3,513,275 | |
| Net asset value, offering and redemption price per share(a) | | $ | 12.87 | |
| (a) | The Fund charges a 2.00% redemption fee on shares redeemed within 90 calendar days of purchase. Shares are redeemed at the Net Asset Value if held longer than 90 calendar days. |
See accompanying notes which are an integral part of these financial statements.
| APPLESEED FUND |
| STATEMENT OF OPERATIONS |
| For the year ended September 30, 2023 |
| Investment Income | | | | |
| Dividend income (net of foreign taxes withheld of 43,523) | | $ | 933,302 | |
| Interest income | | | 101,363 | |
| Total investment income | | | 1,034,665 | |
| | | | | |
| Expenses | | | | |
| Adviser | | | 668,830 | |
| Administrative services plan, Investor Class | | | 70,844 | |
| Administration | | | 68,244 | |
| Fund accounting | | | 41,434 | |
| Registration | | | 40,650 | |
| Transfer agent | | | 37,852 | |
| Custodian | | | 32,708 | |
| Report printing | | | 24,940 | |
| Legal | | | 24,166 | |
| Audit and tax | | | 21,010 | |
| Trustee | | | 17,964 | |
| Chief Compliance Officer | | | 8,500 | |
| Insurance | | | 3,465 | |
| Pricing | | | 2,385 | |
| Miscellaneous | | | 45,392 | |
| Total expenses | | | 1,108,384 | |
| Fees waived and/or expenses reimbursed by Adviser | | | (290,346 | ) |
| Administrative services plan waiver | | | (17,002 | ) |
| Net operating expenses | | | 801,036 | |
| | | | | |
| Net investment income | | | 233,629 | |
| | | | | |
| Net Realized and Change in Unrealized Gain (Loss) on Investments | | | | |
| Net realized gain (loss) on: | | | | |
| Investment securities | | | 6,759,309 | |
| Purchased options | | | (6,799,156 | ) |
| Written options | | | 241,602 | |
| Foreign currency translations | | | (21,305 | ) |
| Change in unrealized appreciation (depreciation) on: | | | | |
| Investment securities | | | 3,164,740 | |
| Purchased options | | | (2,125,514 | ) |
| Written options | | | (245,629 | ) |
| Foreign currency translations | | | 498 | |
| Net realized and unrealized gain (loss) on investment securities, purchased options, written options and foreign currency translations | | | 974,545 | |
| Net increase in net assets resulting from operations | | $ | 1,208,174 | |
See accompanying notes which are an integral part of these financial statements.
| APPLESEED FUND |
| STATEMENTS OF CHANGES IN NET ASSETS |
| | | For the | | | For the | |
| | | Year Ended | | | Year Ended | |
| | | September 30, | | | September 30, | |
| | | 2023 | | | 2022 | |
| Increase (Decrease) in Net Assets due to: | | | | | | | | |
| | | | | | | | | |
| Operations | | | | | | | | |
| Net investment income | | $ | 233,629 | | | $ | 1,169,059 | |
| Net realized gain (loss) on investment securities, purchased options, written options and foreign currency translations | | | 180,450 | | | | (41,515 | ) |
| Change in unrealized appreciation (depreciation) on investment securities, purchased options, written options and foreign currency translations | | | 794,095 | | | | (19,568,687 | ) |
| Net increase (decrease) in net assets resulting from operations | | | 1,208,174 | | | | (18,441,143 | ) |
| | | | | | | | | |
| Distributions to Shareholders from Earnings: | | | | | | | | |
| Investor Class | | | (192,869 | ) | | | (2,410,273 | ) |
| Institutional Class | | | (331,402 | ) | | | (4,111,288 | ) |
| Total distributions | | | (524,271 | ) | | | (6,521,561 | ) |
| | | | | | | | | |
| Capital Transactions - Investor Class | | | | | | | | |
| Proceeds from shares sold | | | 1,283,416 | | | | 4,089,214 | |
| Reinvestment of distributions | | | 187,424 | | | | 2,327,948 | |
| Amount paid for shares redeemed | | | (5,735,761 | ) | | | (7,706,736 | ) |
| Proceeds from redemption fees(a) | | | 1,205 | | | | 4,016 | |
| Total Investor Class | | | (4,263,716 | ) | | | (1,285,558 | ) |
| | | | | | | | | |
| Capital Transactions - Institutional Class | | | | | | | | |
| Proceeds from shares sold | | | 5,015,506 | | | | 10,530,847 | |
| Reinvestment of distributions | | | 328,360 | | | | 4,077,001 | |
| Amount paid for shares redeemed | | | (13,122,814 | ) | | | (11,701,397 | ) |
| Proceeds from redemption fees(a) | | | 408 | | | | 668 | |
| Total Institutional Class | | | (7,778,540 | ) | | | 2,907,119 | |
| Net increase (decrease) in net assets resulting from capital transactions | | | (12,042,256 | ) | | | 1,621,561 | |
| Total Decrease in Net Assets | | | (11,358,353 | ) | | | (23,341,143 | ) |
See accompanying notes which are an integral part of these financial statements.
| APPLESEED FUND |
| STATEMENTS OF CHANGES IN NET ASSETS – continued |
| | | For the | | | For the | |
| | | Year Ended | | | Year Ended | |
| | | September 30, | | | September 30, | |
| | | 2023 | | | 2022 | |
| Net Assets | | | | | | | | |
| Beginning of year | | $ | 81,625,844 | | | $ | 104,966,987 | |
| End of year | | $ | 70,267,491 | | | $ | 81,625,844 | |
| | | | | | | | | |
| Share Transactions - Investor Class | | | | | | | | |
| Shares sold | | | 97,352 | | | | 256,124 | |
| Shares issued in reinvestment of distributions | | | 14,451 | | | | 142,862 | |
| Shares redeemed | | | (435,438 | ) | | | (511,548 | ) |
| Total Investor Class | | | (323,635 | ) | | | (112,562 | ) |
| | | | | | | | | |
| Share Transactions - Institutional Class | | | | | | | | |
| Shares sold | | | 374,940 | | | | 715,949 | |
| Shares issued in reinvestment of distributions | | | 25,162 | | | | 248,632 | |
| Shares redeemed | | | (991,986 | ) | | | (798,358 | ) |
| Total Institutional Class | | | (591,884 | ) | | | 166,223 | |
| Net increase (decrease) in shares outstanding | | | (915,519 | ) | | | 53,661 | |
| (a) | The Fund charges a 2.00% redemption fee on shares redeemed within 90 calendar days of purchase. Shares are redeemed at the Net Asset Value if held longer than 90 calendar days. |
See accompanying notes which are an integral part of these financial statements.
| APPLESEED FUND — INVESTOR CLASS |
| FINANCIAL HIGHLIGHTS |
(For a share outstanding during each year)
| | | For the | | | For the | |
| | | Year Ended | | | Year Ended | |
| | | September 30, | | | September 30, | |
| | | 2023 | | | 2022 | |
| Selected Per Share Data: | | | | | | | | |
| Net asset value, beginning of year | | $ | 12.72 | | | $ | 16.50 | |
| Investment operations: | | | | | | | | |
| Net investment income (loss)(a) | | | (0.02 | ) | | | 0.15 | |
| Net realized and unrealized gain (loss) on investments | | | 0.94 | | | | (2.93 | ) |
| Total from investment operations | | | 0.92 | | | | (2.78 | ) |
| Less distributions to shareholders from: | | | | | | | | |
| Net investment income | | | — | | | | (0.17 | ) |
| Net realized gains | | | (0.87 | ) | | | (0.83 | ) |
| Total distributions | | | (0.87 | ) | | | (1.00 | ) |
| Paid-in capital from redemption fees | | | — | (c) | | | — | (c) |
| Net asset value, end of year | | $ | 12.77 | | | $ | 12.72 | |
| Total Return(d) | | | 1.06 | % | | | (18.15 | )% |
| | | | | | | | | |
| Ratios and Supplemental Data: | | | | | | | | |
| Net assets, end of year (000 omitted) | | $ | 25,066 | | | $ | 29,096 | |
| Ratio of net expenses to average net assets(e)(f) | | | 1.14 | % | | | 1.14 | % |
| Ratio of expenses to average net assets before waiver and reimbursement(e) | | | 1.61 | % | | | 1.48 | % |
| Ratio of net investment income to average net assets(e) | | | 0.17 | % | | | 1.11 | % |
| Portfolio turnover rate(g) | | | 63 | % | | | 110 | % |
| | | | | | | | | |
| (a) | Recognition of net investment income by the Fund is affected by the timing of the declaration of dividends by the underlying funds in which the Fund invests. |
| (b) | Calculation based on the average number of shares outstanding during the period |
| (c) | Rounds to less than $0.005 per share. |
| (d) | Total return represents the rate that the investor would have earned or lost on an investment in the Fund, assuming reinvestment of distributions. |
| (e) | These ratios exclude the impact of expenses of the underlying security holdings as represented in the Schedule of Investments. |
| (f) | Excluding dividend and interest expense, the ratios of net expenses to average net assets were 1.14%, 1.14%, 1.14%, 1.14% and 1.14% for the fiscal years ended September 30, 2023, 2022, 2021, 2020 and 2019, respectively. |
| (g) | Portfolio turnover is calculated on the basis on the Fund as a whole without distinguishing among the classes of shares. |
See accompanying notes which are an integral part of these financial statements.
| For the | | | For the | | | For the | |
| Year Ended | | | Year Ended | | | Year Ended | |
| September 30, | | | September 30, | | | September 30, | |
| 2021 | | | 2020 | | | 2019 | |
| | | | | | | | |
| $ | 11.51 | | | $ | 12.51 | | | $ | 13.77 | |
| | | | | | | | | | | |
| | 0.05 | | | | 0.01 | (b) | | | 0.08 | |
| | 5.14 | | | | (0.64 | ) | | | (0.15 | ) |
| | 5.19 | | | | (0.63 | ) | | | (0.07 | ) |
| | | | | | | | | | | |
| | (0.21 | ) | | | (0.37 | ) | | | (0.01 | ) |
| | — | | | | — | | | | (1.19 | ) |
| | (0.21 | ) | | | (0.37 | ) | | | (1.20 | ) |
| | 0.01 | | | | — | (c) | | | 0.01 | |
| $ | 16.50 | | | $ | 11.51 | | | $ | 12.51 | |
| | 45.55 | % | | | (5.37 | )% | | | (0.44 | )% |
| | | | | | | | | | | |
| | | | | | | | | | | |
| $ | 39,598 | | | $ | 30,359 | | | $ | 54,725 | |
| | 1.14 | % | | | 1.14 | % | | | 1.14 | % |
| | | | | | | | | | | |
| | 1.43 | % | | | 1.45 | % | | | 1.36 | % |
| | 0.37 | % | | | 0.06 | % | | | 0.72 | % |
| | 86 | % | | | 89 | % | | | 79 | % |
| | | | | | | | | | | |
See accompanying notes which are an integral part of these financial statements.
| APPLESEED FUND — INSTITUTIONAL CLASS |
| FINANCIAL HIGHLIGHTS |
(For a share outstanding during each year)
| | | For the | | | For the | |
| | | Year Ended | | | Year Ended | |
| | | September 30, | | | September 30, | |
| | | 2023 | | | 2022 | |
| Selected Per Share Data: | | | | | | | | |
| Net asset value, beginning of year | | $ | 12.80 | | | $ | 16.60 | |
| Investment operations: | | | | | | | | |
| Net investment income(a) | | | 0.01 | | | | 0.20 | |
| Net realized and unrealized gain (loss) on investments | | | 0.93 | | | | (2.97 | ) |
| Total from investment operations | | | 0.94 | | | | (2.77 | ) |
| Less distributions to shareholders from: | | | | | | | | |
| Net investment income | | | — | | | | (0.20 | ) |
| Net realized gains | | | (0.87 | ) | | | (0.83 | ) |
| Total distributions | | | (0.87 | ) | | | (1.03 | ) |
| Paid-in capital from redemption fees | | | — | (c) | | | — | (c) |
| Net asset value, end of year | | $ | 12.87 | | | $ | 12.80 | |
| Total Return(d) | | | 1.21 | % | | | (17.99 | )% |
| | | | | | | | | |
| Ratios and Supplemental Data: | | | | | | | | |
| Net assets, end of year (000 omitted) | | $ | 45,201 | | | $ | 52,530 | |
| Ratio of net expenses to average net assets(e)(f) | | | 0.95 | % | | | 0.95 | % |
| Ratio of expenses to average net assets before waiver and reimbursement(e) | | | 1.30 | % | | | 1.23 | % |
| Ratio of net investment income to average net assets(e) | | | 0.37 | % | | | 1.25 | % |
| Portfolio turnover rate(g) | | | 63 | % | | | 110 | % |
| | | | | | | | | |
| (a) | Recognition of net investment income by the Fund is affected by the timing of the declaration of dividends by the underlying funds in which the Fund invests. |
| (b) | Calculation based on the average number of shares outstanding during the period. |
| (c) | Rounds to less than $0.005 per share. |
| (d) | Total return represents the rate that the investor would have earned or lost on an investment in the Fund, assuming reinvestment of distributions. |
| (e) | These ratios exclude the impact of expenses of the underlying security holdings as represented in the Schedule of Investments. |
| (f) | Excluding dividend and interest expense, the ratios of net expenses to average net assets were 0.95%, 0.95%, 0.95%, 0.95% and 0.95% for the fiscal years ended September 30, 2023, 2022, 2021, 2020 and 2019, respectively. |
| (g) | Portfolio turnover is calculated on the basis on the Fund as a whole without distinguishing among the classes of shares. |
See accompanying notes which are an integral part of these financial statements.
| For the | | | For the | | | For the | |
| Year Ended | | | Year Ended | | | Year Ended | |
| September 30, | | | September 30, | | | September 30, | |
| 2021 | | | 2020 | | | 2019 | |
| | | | | | | | |
| $ | 11.58 | | | $ | 12.59 | | | $ | 13.86 | |
| | | | | | | | | | | |
| | 0.06 | | | | 0.03 | (b) | | | 0.14 | |
| | 5.20 | | | | (0.65 | ) | | | (0.18 | ) |
| | 5.26 | | | | (0.62 | ) | | | (0.04 | ) |
| | | | | | | | | | | |
| | (0.24 | ) | | | (0.39 | ) | | | (0.04 | ) |
| | — | | | | — | | | | (1.19 | ) |
| | (0.24 | ) | | | (0.39 | ) | | | (1.23 | ) |
| | — | (c) | | | — | (c) | | | — | (c) |
| $ | 16.60 | | | $ | 11.58 | | | $ | 12.59 | |
| | 45.85 | % | | | (5.20 | )% | | | (0.28 | )% |
| | | | | | | | | | | |
| | | | | | | | | | | |
| $ | 65,369 | | | $ | 54,447 | | | $ | 93,269 | |
| | 0.95 | % | | | 0.95 | % | | | 0.95 | % |
| | | | | | | | | | | |
| | 1.19 | % | | | 1.20 | % | | | 1.11 | % |
| | 0.58 | % | | | 0.23 | % | | | 0.95 | % |
| | 86 | % | | | 89 | % | | | 79 | % |
| | | | | | | | | | | |
See accompanying notes which are an integral part of these financial statements.
| APPLESEED FUND |
| NOTES TO FINANCIAL STATEMENTS |
| September 30, 2023 |
NOTE 1. ORGANIZATION
Appleseed Fund (the “Fund”) is registered under the Investment Company Act of 1940, as amended (the “1940 Act”), as a non-diversified series of Unified Series Trust (the “Trust”) on September 11, 2006. The Trust is an open-end investment company established under the laws of Ohio by an Agreement and Declaration of Trust dated October 14, 2002, as amended (the “Trust Agreement”). The Trust Agreement permits the Board of Trustees of the Trust (the “Board”) to issue an unlimited number of shares of beneficial interest of separate series. The Fund is one of a series of funds currently authorized by the Board. The Fund’s investment adviser is Pekin Hardy Strauss, Inc. (the “Adviser”). The investment objective of the Fund is to provide long-term capital appreciation.
The Fund currently offers two classes of shares, Investor Class and Institutional Class. Investor Class shares were first offered to the public on December 8, 2006; and Institutional Class shares were first offered to the public on January 31, 2011. Each share represents an equal proportionate interest in the assets and liabilities belonging to the applicable class and is entitled to such dividends and distributions out of income belonging to the applicable class as are declared by the Board. The primary difference between the two classes is attributable to the administrative service fee arrangements for the Investor Class. On matters that affect the Fund as a whole, each class has the same voting and other rights and preferences as any other class. On matters that affect only one class, only shareholders of that class may vote. Each class votes separately on matters affecting only that class, or on matters expressly required to be voted on separately by state or federal law. Shares of each class of a series have the same voting and other rights and preferences as the other classes and series of the Trust for matters that affect the Trust as a whole. The Fund may offer additional classes of shares in the future.
Non-Diversification Risk – As a non-diversified fund, the Fund’s portfolio may focus on a limited number of companies. Because the Fund may hold the securities of fewer issuers than a diversified fund, the poor performance of an individual security in the Fund’s portfolio may have a greater negative impact on the Fund’s performance than if the Fund’s asset were diversified among a larger number of portfolio securities.
| APPLESEED FUND |
| NOTES TO FINANCIAL STATEMENTS – continued |
| September 30, 2023 |
NOTE 2. SIGNIFICANT ACCOUNTING POLICIES
The Fund is an investment company and follows accounting and reporting guidance under Financial Accounting Standards Board Accounting Standards Codification (“ASC”) Topic 946, “Financial Services-Investment Companies.” The following is a summary of significant accounting policies followed by the Fund in the preparation of its financial statements. These policies are in conformity with generally accepted accounting principles in the United States of America (“GAAP”).
Regulatory Update – Tailored Shareholder Reports for Mutual Funds and Exchange-Traded Funds (“ETFs”) – Effective January 24, 2023, the Securities and Exchange Commission adopted rule and form amendments to require mutual funds and ETFs to transmit concise and visually engaging streamlined annual and semiannual reports to shareholders that highlight key information. Other information, including financial statements, will no longer appear in a streamlined shareholder report but must be available online, delivered free of charge upon request, and filed on a semiannual basis on Form N-CSR. The rule and form amendments have a compliance date of July 24, 2024. At this time, management is evaluating the impact of these amendments on the shareholder reports for the Fund.
Estimates – The preparation of financial statements in conformity with GAAP requires management to make estimates and assumptions that affect the reported amounts of assets and liabilities and disclosure of contingent assets and liabilities at the date of the financial statements and the reported amounts of increases and decreases in net assets from operations during the reporting period. Actual results could differ from those estimates.
Foreign Currency Translation – The accounting records of the Fund are maintained in U.S. dollars. Foreign currency amounts are translated into U.S. dollars at the current rate of exchange each business day to determine the value of investments, and other assets and liabilities. Purchases and sales of foreign securities, and income and expenses, are translated at the prevailing rate of exchange on the respective date of these transactions. The Fund does not isolate that portion of the results of operations resulting from changes in foreign exchange rates on investments from fluctuations arising from changes in market prices of securities held. These fluctuations are included with the realized and unrealized gain or loss from investments. Net realized gain (loss) on
| APPLESEED FUND |
| NOTES TO FINANCIAL STATEMENTS – continued |
| September 30, 2023 |
NOTE 2. SIGNIFICANT ACCOUNTING POLICIES — continued
foreign currency translations on the Statement of Operations represents currency gains (losses) realized between the trade and settlement dates on securities transactions, and the difference between the amount of investment income and foreign withholding taxes recorded on the Fund’s books and the U.S. dollar equivalent amounts actually received or paid. The change in unrealized currency gains (losses) on foreign currency translations for the period is reflected in the Statement of Operations.
Short Sales – The Fund may make short sales as part of its overall portfolio management strategies or to offset a potential decline in value of a security. The Fund may engage in short sales with respect to various types of securities, including exchange-traded funds (“ETFs”) and futures. A short sale involves the sale of a security that is borrowed from a broker or other institution to complete the sale. The Fund may engage in short sales with respect to securities it owns, as well as securities that it does not own. Short sales expose the Fund to the risk that it will be required to acquire, convert, or exchange securities to replace the borrowed securities (also known as “covering” the short position) at a time when the securities sold short have appreciated in value, thus resulting in a loss to the Fund. The Fund’s investment performance may also suffer if the Fund is required to close out a short position earlier than it had intended. The Fund will be required to pledge its liquid assets to the broker in order to secure its performance on short sales. As a result, the assets pledged may not be available to meet the Fund’s needs for immediate cash or other liquidity. In addition, the Fund may be subject to expenses related to short sales that are not typically associated with investing in securities directly, such as costs of borrowing and margin account maintenance costs associated with the Fund’s open short positions. These types of short sales expenses are sometimes referred to as the “negative cost of carry,” and will tend to cause the Fund to lose money on a short sale even in instances where the price of the underlying security sold short does not change over the duration of the short sale. Dividend expenses on securities sold short and borrowing costs are not covered under the Adviser’s expense limitation agreement with the Fund and, therefore, these expenses will be borne by the shareholders of the Fund. The Fund’s ESG investment screens are not applied to short sales.
| APPLESEED FUND |
| NOTES TO FINANCIAL STATEMENTS – continued |
| September 30, 2023 |
NOTE 2. SIGNIFICANT ACCOUNTING POLICIES — continued
Federal Income Taxes – The Fund makes no provision for federal income or excise tax. The Fund has qualified and intends to qualify each year as a regulated investment company (“RIC”) under subchapter M of the Internal Revenue Code of 1986, as amended, by complying with the requirements applicable to RICs and by distributing substantially all of its taxable income. The Fund also intends to distribute sufficient net investment income and net realized capital gains, if any, so that it will not be subject to excise tax on undistributed income and gains. If the required amount of net investment income or gains is not distributed, the Fund could incur a tax expense.
As of and during the fiscal year ended September 30, 2023, the Fund did not have any liabilities for any unrecognized tax benefits. The Fund recognizes interest and penalties, if any, related to unrecognized tax benefits as income tax expense in the Statement of Operations when incurred. During the fiscal year, the Fund did not incur any interest or penalties. Management of the Fund has reviewed tax positions taken in tax years that remain subject to examination by all major tax jurisdictions, including federal (i.e., the previous three years tax year ends and the interim tax period since then, as applicable) and has concluded that no provision for unrecognized tax benefits or expenses is required in these financial statements and does not expect this to change over the next twelve months.
Expenses – Expenses incurred by the Trust that do not relate to a specific fund of the Trust are allocated to the individual funds based on each fund’s relative net assets or another appropriate basis (as determined by the Board). Expenses specifically attributable to any class are borne by that class. Income, realized gains and losses, unrealized appreciation and depreciation, and fund-wide expenses not allocated to a particular class shall be allocated to each class based on the net assets of that class in relation to the net assets of the entire fund.
Security Transactions and Related Income – The Fund follows industry practice and records security transactions on the trade date for financial reporting purposes. The specific identification method is used for determining gains or losses for financial statements and income tax purposes. Dividend income is recorded on the ex-dividend date and
| APPLESEED FUND |
| NOTES TO FINANCIAL STATEMENTS – continued |
| September 30, 2023 |
NOTE 2. SIGNIFICANT ACCOUNTING POLICIES — continued
interest income is recorded on an accrual basis. Dividend income from Real Estate Investment Trusts (“REITs”) and distributions from Limited Partnerships are recognized on the ex-date. The calendar year end classification of distributions received from REITs during the fiscal year are reported subsequent to year end; accordingly, the Fund estimates the character of REIT distributions based on the most recent information available. Income or loss from Limited Partnerships is reclassified in the components of net assets upon receipt of K-1’s. Discounts and premiums on securities purchased are amortized or accreted using the effective interest method. Withholding taxes on foreign dividends have been provided for in accordance with the Fund’s understanding of the applicable country’s tax rules and rates. The ability of issuers of debt securities held by the Fund to meet their obligations may be affected by economic and political developments in a specific country or region.
Redemption Fees – The Fund charges a 2.00% redemption fee, applicable to each share class, for shares redeemed within 90 calendar days of purchase. These fees are deducted from the redemption proceeds otherwise payable to the shareholder. The Fund will retain the fee charged as an increase in paid-in capital and such fees become part of the Fund’s daily net asset value (“NAV”) calculation.
Dividends and Distributions – The Fund intends to distribute its net investment income and net realized long-term and short-term capital gains, if any, at least annually. Dividends and distributions to shareholders, which are determined in accordance with income tax regulations, are recorded on the ex-dividend date. The treatment for financial reporting purposes of distributions made to shareholders during the period from net investment income or net realized capital gains may differ from their ultimate treatment for federal income tax purposes. These differences are caused primarily by differences in the timing of the recognition of certain components of income, expense or realized capital gain for federal income tax purposes. Where such differences are permanent in nature, they are reclassified among the components of net assets based on their ultimate characterization for federal income tax purposes. Any such reclassifications will have no effect on net assets, results of operations or NAV per share of the Fund.
| APPLESEED FUND |
| NOTES TO FINANCIAL STATEMENTS – continued |
| September 30, 2023 |
NOTE 2. SIGNIFICANT ACCOUNTING POLICIES — continued
For the fiscal year ended September 30, 2023, the Fund made the following reclassifications to increase (decrease) the components of net assets:
| | | Accumulated |
| Paid-In Capital | | Earnings |
| $(1) | | $1 |
NOTE 3. SECURITIES VALUATION AND FAIR VALUE MEASUREMENTS
The Fund values its portfolio securities at fair value as of the close of regular trading on the New York Stock Exchange (“NYSE”) (normally 4:00 p.m. Eastern Time) on each business day the NYSE is open for business. Fair value is defined as the price that the Fund would receive upon selling an investment in a timely transaction to an independent buyer in the principal or most advantageous market of the investment. GAAP establishes a three-tier hierarchy to maximize the use of observable market data and minimize the use of unobservable inputs and to establish classification of fair value measurements for disclosure purposes.
Inputs refer broadly to the assumptions that market participants would use in pricing the asset or liability, including assumptions about risk (the risk inherent in a particular valuation technique used to measure fair value including a pricing model and/or the risk inherent in the inputs to the valuation technique). Inputs may be observable or unobservable. Observable inputs are inputs that reflect the assumptions market participants would use in pricing the asset or liability developed based on market data obtained and available from sources independent of the reporting entity. Unobservable inputs are inputs that reflect the
| APPLESEED FUND |
| NOTES TO FINANCIAL STATEMENTS – continued |
| September 30, 2023 |
NOTE 3. SECURITIES VALUATION AND FAIR VALUE MEASUREMENTS — continued
reporting entity’s own assumptions about the assumptions market participants would use in pricing the asset or liability developed based on the best information available in the circumstances.
Various inputs are used in determining the value of the Fund’s investments. These inputs are summarized in the three broad levels listed below.
| ● | Level 1 – unadjusted quoted prices in active markets for identical investments and/or registered investment companies where the value per share is determined and published and is the basis for current transactions for identical assets or liabilities at the valuation date |
| ● | Level 2 – other significant observable inputs (including, but not limited to, quoted prices for an identical security in an inactive market, quoted prices for similar securities, interest rates, prepayment speeds, credit risk, etc.) |
| ● | Level 3 – significant unobservable inputs (including the Fund’s own assumptions in determining fair value of investments based on the best information available) |
The inputs used to measure fair value may fall into different levels of the fair value hierarchy. In such cases, for disclosure purposes, the level in the fair value hierarchy which is reported is determined based on the lowest level input that is significant to the fair value measurement in its entirety.
Equity securities that are traded on any stock exchange are generally valued at the last quoted sale price on the security’s primary exchange. Lacking a last sale price, an exchange-traded security is generally valued at its last bid price. Securities traded in the Nasdaq over-the-counter market are generally valued at the Nasdaq Official Closing Price. When using market quotations and when the market is considered active, the security is classified as a Level 1 security. In the event that market quotations are not readily available or are considered unreliable due to market or other events, securities are valued in good faith by the Adviser, as Valuation Designee, under the oversight of the Board’s Pricing & Liquidity Committee. The Adviser has adopted written policies and procedures for valuing securities and other assets in circumstances where market quotes are not readily available. In the event that market quotes are not
| APPLESEED FUND |
| NOTES TO FINANCIAL STATEMENTS – continued |
| September 30, 2023 |
NOTE 3. SECURITIES VALUATION AND FAIR VALUE MEASUREMENTS — continued
readily available, and the security or asset cannot be valued pursuant to one of the valuation methods, the value of the security or asset will be determined in good faith by the Valuation Designee pursuant to its policies and procedures. To assist the Valuation Designee in carrying out the responsibility to determine the fair value of any securities or other assets for which market quotations are not readily available, the Trust has created a fair valuation pricing committee (the “Fair Value Committee”). The Fair Value Committee consists of the following standing members: (a) the Trust’s Treasurer or designee, (b) a representative of Ultimus and (c) on an ad hoc basis at a particular valuation time for which a fair valuation method is being determined for a Fund, a representative of the Adviser, which is the Valuation Designee. The Fair Value Committee will review any fair value provided by the Valuation Designee, subject to the ultimate review of the pricing methodology by the Pricing & Liquidity Committee of the Board on a quarterly basis. Under these policies, the securities will be classified as Level 2 or 3 within the fair value hierarchy, depending on the inputs used.
Investments in mutual funds, including money market mutual funds, are generally priced at the ending NAV provided by the service agent of the mutual funds. These securities are categorized as Level 1 securities.
Debt securities are valued by using the mean between the closing bid and ask prices provided by a pricing service. If the closing bid and ask prices are not readily available, the pricing service may provide a price determined by a matrix pricing method. Matrix pricing is a mathematical technique used to value fixed income securities without relying exclusively on quoted prices. Matrix pricing takes into consideration recent transactions, yield, liquidity, risk, credit quality, coupon, maturity, type of issue and any other factors or market data the pricing service deems relevant for the actual security being priced and for other securities with similar characteristics. These securities will generally be categorized as Level 2 securities. If the Board or the Adviser decides that a price provided by the pricing service does not accurately reflect the fair value of the securities or when prices are not readily available from a pricing service, securities are valued at fair value as determined by the Valuation Designee, in conformity
| APPLESEED FUND |
| NOTES TO FINANCIAL STATEMENTS – continued |
| September 30, 2023 |
NOTE 3. SECURITIES VALUATION AND FAIR VALUE MEASUREMENTS — continued
with guidelines adopted by and subject to review of the Board through its Pricing & Liquidity Committee. These securities will generally be categorized as Level 3 securities.
Certificates of deposit are priced at their original cost, which approximates their fair value, through maturity date. These securities will be classified as Level 2 securities.
Option contracts are generally traded on an exchange and are generally valued at the last trade price, as provided by a pricing service. If there is no such reported sale on the valuation date, long positions are valued at the most recent bid price, and short positions are valued at the most recent ask price. The option contracts will generally be categorized as Level 1 securities unless the market is considered inactive or the absence of a last bid or ask price, in which case, they will be categorized as Level 2 securities.
In accordance with the Trust’s valuation policies and fair value determinations pursuant to Rule 2a-5 under the 1940 Act, the Valuation Designee is required to consider all appropriate factors relevant to the value of securities for which it has determined other pricing sources are not available or reliable as described above. No single method exists for determining fair value because fair value depends upon the circumstances of each individual case. As a general principle, the current fair value of a security being valued by the Valuation Designee would be the amount that the Fund might reasonably expect to receive upon the current sale. Methods that are in accordance with this principle may, for example, be based on (i) a multiple of earnings; (ii) a discount from market prices of a similar freely traded security (including a derivative security or a basket of securities traded on other markets, exchanges or among dealers); or (iii) yield to maturity with respect to debt issues, or a combination of these and other methods. Fair-value pricing is permitted if, in the Valuation Designee’s opinion, the validity of market quotations appears to be questionable based on factors such as evidence of a thin market in the security based on a small number of quotations, a significant event occurs after the close of a market but before the Fund’s NAV calculation that may affect a security’s value, or the Valuation Designee is aware of any other data that calls into question the reliability of market quotations.
| APPLESEED FUND |
| NOTES TO FINANCIAL STATEMENTS – continued |
| September 30, 2023 |
NOTE 3. SECURITIES VALUATION AND FAIR VALUE MEASUREMENTS — continued
The Valuation Designee may obtain assistance from others in fulfilling its duties. For example, it may seek assistance from pricing services, fund administrators, sub-advisers, accountants, or counsel; it may also consult the Trust’s Fair Value Committee. The Valuation Designee, however, remains responsible for the final fair value determination any may not designate or assign that responsibility to any third party.
The following is a summary of the inputs used to value the Fund’s investments as of September 30, 2023:
| | | | | | Valuation Inputs | | | | |
| Assets | | Level 1 | | | Level 2 | | | Level 3 | | | Total | |
| Common Stocks(a) | | $ | 48,409,288 | | | $ | — | | | $ | 136 | | | $ | 48,409,424 | |
| Closed-End Funds | | | 9,410,500 | | | | — | | | | — | | | | 9,410,500 | |
| Exchange-Traded Funds | | | 1,610,100 | | | | — | | | | — | | | | 1,610,100 | |
| Preferred Stocks | | | 2,219,700 | | | | — | | | | — | | | | 2,219,700 | |
| U.S. Government & Agencies | | | — | | | | 3,294,885 | | | | — | | | | 3,294,885 | |
| Convertible Bonds | | | — | | | | 3,887,625 | | | | — | | | | 3,887,625 | |
| Certificates of Deposit | | | — | | | | 500,000 | | | | — | | | | 500,000 | |
| Money Market Funds | | | 1,006,398 | | | | — | | | | — | | | | 1,006,398 | |
| Total | | $ | 62,655,986 | | | $ | 7,682,510 | | | $ | 136 | | | $ | 70,338,632 | |
| (a) | Refer to Schedule of Investments for sector classifications. |
A reconciliation of Level 3 investments and disclosures of significant unobservable inputs are presented when the Fund has a significant amount of Level 3 investments at the end of the period in relation to Net Assets. Management has concluded that Level 3 investments are not material in relation to Net Assets.
For the fiscal year ended September 30, 2023, there were no significant changes into/out of Level 3.
NOTE 4. DERIVATIVE TRANSACTIONS
The Fund may engage in options and futures transactions, which are sometimes referred to as derivative transactions. The Fund uses derivative instruments for any purpose consistent with its investment objective, such as for hedging or obtaining interest rate exposure. The
| APPLESEED FUND |
| NOTES TO FINANCIAL STATEMENTS – continued |
| September 30, 2023 |
NOTE 4. DERIVATIVE TRANSACTIONS — continued
Fund also may use derivative instruments to obtain market exposure (that is, for speculative purposes rather than hedging). The Adviser may establish a position in the derivatives market as a substitute for buying, selling, or holding certain securities. The use of derivative instruments may provide a less expensive, more expedient or more specifically focused way to invest than traditional securities would.
Written Options Contracts – The Fund may write options contracts for which premiums received are recorded as liabilities and are subsequently adjusted to the current value of the options written. Premiums received from writing options which expire are treated as realized gains. Premiums received from writing options which are either exercised or closed are offset against the proceeds received or the amount paid on the transaction to determine realized gains or losses. Investing in written options contracts exposes a Fund to equity price risk.
The following table identifies the effect of derivative instruments on the Statement of Operations for the fiscal year ended September 30, 2023.
For the fiscal year ended September 30, 2023:
| | | | | | | | Change in | |
| | | Location of Gain (Loss) on | | Realized Gain | | | Unrealized | |
| | | Derivatives on the Statement | | (Loss) on | | | Depreciation on | |
| Derivatives | | of Operations | | Derivatives | | | Derivatives | |
| Equity Price Risk: | | | | | | | | | | |
| Purchased options | | Net realized gain and change in unrealized appreciation (depreciation) on investment securities | | $ | (6,799,156 | ) | | $ | (2,125,514 | ) |
| Written options | | Net realized gain and change in unrealized appreciation (depreciation) on investment securities | | | 241,602 | | | | (245,629 | ) |
The following table summarizes the average ending monthly fair value of derivatives outstanding during the fiscal year ended September 30, 2023:
| | | Average | |
| Derivatives | | Market Value | |
| Purchased options | | $ | 902,741 | |
The Fund did not hold any derivatives at September 30, 2023.
| APPLESEED FUND |
| NOTES TO FINANCIAL STATEMENTS – continued |
| September 30, 2023 |
NOTE 5. FEES AND OTHER TRANSACTIONS WITH AFFILIATES
The Adviser, under the terms of the management agreement with the Trust with respect to the Fund (the “Agreement”), manages the Fund’s investments. As compensation for its management services, the Fund is obligated to pay the Adviser a management fee computed and accrued daily and paid monthly at an annual rate of 0.85% of the Fund’s average daily net assets. For the fiscal year ended September 30, 2023, before the waiver described below, the Adviser earned a fee of $668,830 from the Fund. The Adviser has contractually agreed to waive its management fee and/or reimburse expenses through January 31, 2024 so that total annual operating expenses (excluding portfolio transaction and other investment-related costs (including brokerage fees and commissions); taxes; borrowing costs (such as interest and dividend expenses on securities sold short); acquired fund fees and expenses; fees and expenses associated with investments in other collective investment vehicles or derivative instruments (including for example option and swap fees and expenses); any amounts payable pursuant to a distribution or service plan adopted in accordance with Rule 12b-1 under the 1940 Act; any administrative and/or shareholder servicing fees payable pursuant to a plan adopted by the Board; expenses incurred in connection with any merger or reorganization; extraordinary expenses (such as litigation expenses, indemnification of Trust officers and Trustees and contractual indemnification of Fund service providers); and other expenses that the Trustees agree have not been incurred in the ordinary course of the Fund’s business) do not exceed 0.95% of the Fund’s average daily net assets. For the fiscal year ended September 30, 2023, the Adviser waived management fees of $290,346. At September 30, 2023, the Adviser was owed $26,398 from the Fund for management services.
Each fee waiver/expense payment by the Adviser is subject to recoupment by the Adviser from the Fund in the three years following the date in which that particular waiver/expense payment occurred, but only if such recoupment can be achieved without exceeding the annual expense limitation in effect at the time of the waiver/expense payment and any expense limitation in effect at the time of the recoupment. As of
| APPLESEED FUND |
| NOTES TO FINANCIAL STATEMENTS – continued |
| September 30, 2023 |
NOTE 5. FEES AND OTHER TRANSACTIONS WITH AFFILIATES — continued
September 30, 2023 the Adviser may seek repayment of management fees waived and expenses reimbursed pursuant to the aforementioned conditions, from the Fund no later than the dates stated below:
| Recoverable through | | | | |
| September 30, 2024 | | $ | 251,241 | |
| September 30, 2025 | | | 270,978 | |
| September 30, 2026 | | | 290,346 | |
Ultimus Fund Solutions, LLC (“Ultimus”) provides administration, fund accounting and transfer agent services to the Fund. The Fund pays Ultimus fees in accordance with the agreements for such services.
Northern Lights Compliance Services, LLC (“NLCS”), an affiliate of Ultimus, provides a Chief Compliance Officer to the Trust, as well as related compliance services, pursuant to a consulting agreement between NLCS and the Trust. Under the terms of such agreement, NLCS receives fees from the Fund, which are approved annually by the Board.
Under the terms of a Distribution Agreement with the Trust, Ultimus Fund Distributors, LLC (the “Distributor”) serves as principal underwriter to the Fund. The Distributor is a wholly-owned subsidiary of Ultimus. The Distributor is compensated by the Adviser (not the Fund) for acting as principal underwriter.
Certain officers of the Trust are also employees of Ultimus and such persons are not paid by the Fund for serving in such capacities. One Trustee is a former employee of Ultimus who is not currently paid by the Fund for serving in such capacity.
The Board supervises the business activities of the Trust. Each Trustee serves as a trustee until termination of the Trust unless the Trustee dies, resigns, retires, or is removed. The Chair of the Board and more than 75% of the Trustees are “Independent Trustees,” which means that they are not “interested persons” as defined in the 1940 Act. The Independent Trustees review and establish compensation at least annually. Each Independent Trustee of the Trust receives annual compensation, which is an established amount paid quarterly per fund in the Trust at the time of the regular quarterly Board meetings. The Chair of the Board receives
| APPLESEED FUND |
| NOTES TO FINANCIAL STATEMENTS – continued |
| September 30, 2023 |
NOTE 5. FEES AND OTHER TRANSACTIONS WITH AFFILIATES — continued
the highest compensation, commensurate with his additional duties and each Chair of a committee receives additional compensation as well. Independent Trustees also receive additional fees for attending any special meetings. In addition, the Trust reimburses Independent Trustees for out-of-pocket expenses incurred in conjunction with attendance at meetings.
The Fund has adopted an Administrative Services Plan with respect to Investor Class shares, pursuant to which the Fund pays an annual fee of 0.25% of the average daily net assets of the Fund’s Investor Class shares to reimburse the Adviser for compensating financial intermediaries who provide administrative services to the Investor Class shareholders. The Adviser has contractually agreed to waive its receipt of payments under the Administrative Services Plan, to the extent such payments exceed an annual rate of 0.19% of the average daily net assets of Investor Class shares. This contractual waiver is in effect through January 31, 2024. Financial intermediaries eligible to receive payments under the Administrative Services Plan include mutual fund supermarkets and other platforms sponsored by any 401(k) plan, bank, trust company or broker-dealer that have entered into an agreement with the Fund or the Fund’s distributor to sell the Fund’s Investor Class shares. For purposes of the Administrative Services Plan, administrative services include, but are not limited to (i) acting as record holder and nominee of Investor Class shares beneficially owned by the financial intermediary’s customers; (ii) providing sub-accounting services to such customers; (iii) processing and issuing confirmations with respect to orders to purchase, redeem or exchange Investor Class shares; (iv) processing dividend payments; and (v) providing periodic account statements. For the fiscal year ended September 30, 2023, the Investor Class incurred Administrative Services fees of $70,844 ($53,842 after the waiver described above). At September 30, 2023, $4,050 was owed to the Adviser pursuant to the Administrative Services Plan.
The Trust, with respect to the Investor Class shares of the Fund, has adopted a Distribution Plan under Rule 12b-1 of the 1940 Act, pursuant to which the Fund is authorized to pay a fee of up to 0.25% of the average daily net assets of the Investor Class shares of the Fund to the Adviser or any bank, broker-dealer, investment adviser or other financial intermediary
| APPLESEED FUND |
| NOTES TO FINANCIAL STATEMENTS – continued |
| September 30, 2023 |
NOTE 5. FEES AND OTHER TRANSACTIONS WITH AFFILIATES — continued
that assists the Fund in the sale and distribution of its Investor Class shares or that provides shareholder servicing. The Fund does not currently intend to activate the Plan, but may do so upon 60 days’ notice to shareholders. If the Plan is activated, these fees will, over time, increase the cost of your investment and may cost you more than paying other types of sales charges because these fees are paid out of the Fund’s assets on an on-going basis.
NOTE 6. INVESTMENT TRANSACTIONS
For the fiscal year ended September 30, 2023, purchases and sales of investment securities, other than short-term investments, were as follows:
| Purchases | | $ | 47,133,439 | |
| Sales | | | 64,404,432 | |
There were no purchases or sales of long-term U.S. government obligations during the fiscal year ended September 30, 2023.
NOTE 7. FEDERAL TAX INFORMATION
At September 30, 2023, the net unrealized appreciation (depreciation) of investments, including securities sold short and written options, for tax purposes was as follows:
| Gross unrealized appreciation | | $ | 7,668,569 | |
| Gross unrealized depreciation | | | (7,328,185 | ) |
| Net unrealized appreciation on investments | | $ | 340,384 | |
| | | | | |
| Tax cost of investments | | $ | 69,998,248 | |
The tax character of distributions paid for the fiscal years ended September 30, 2023 and September 30, 2022 were as follows:
| | | 2023 | | | 2022 | |
| Distributions paid from: | | | | | | |
| Ordinary income(a) | | $ | 8,705 | | | $ | 1,354,411 | |
| Net long term capital gains | | | 515,566 | | | | 5,167,150 | |
| Total distributions paid | | $ | 524,271 | | | $ | 6,521,561 | |
| (a) | Short-term capital gain distributions are treated as ordinary income for tax purposes. |
| APPLESEED FUND |
| NOTES TO FINANCIAL STATEMENTS – continued |
| September 30, 2023 |
NOTE 7. FEDERAL TAX INFORMATION — continued
At September 30, 2023, the components of accumulated earnings (deficit) on a tax basis were as follows:
| Undistributed ordinary income | | $ | 765,962 | |
| Accumulated capital and other losses | | | (3,695,829 | ) |
| Unrealized appreciation on investments | | | 335,976 | |
| Total accumulated earnings | | $ | (2,593,891 | ) |
At September 30, 2023, the difference between book basis and tax basis unrealized appreciation (depreciation) is attributable to the tax deferral of losses on wash sales and basis adjustments for investments in passive foreign investment companies.
Currency and qualified late year ordinary losses and specified gains realized after October 31, and net investment losses realized after December 31 of the Fund’s fiscal year may be deferred and treated as occurring on the first business day of the following fiscal year for tax purposes. For the fiscal year ended September 30, 2023, the Fund deferred $3,695,829 in late year ordinary losses.
NOTE 8. COMMITMENTS AND CONTINGENCIES
The Trust indemnifies its officers and Trustees for certain liabilities that may arise from their performance of their duties to the Trust or the Fund. Additionally, in the normal course of business, the Trust enters into contracts that contain a variety of representations and warranties which provide general indemnifications. The Trust’s maximum exposure under these arrangements is unknown, as this would involve future claims that may be made against the Trust that have not yet occurred.
NOTE 9. SUBSEQUENT EVENTS
Management of the Fund has evaluated the need for disclosures and/ or adjustments resulting from subsequent events through the date at which these financial statements were issued. Based upon this evaluation, management has determined there were no items requiring adjustment of the financial statements or additional disclosure.
| REPORT OF INDEPENDENT |
| REGISTERED PUBLIC ACCOUNTING FIRM |
To the Shareholders of Appleseed Fund and
Board of Trustees of Unified Series Trust
Opinion on the Financial Statements
We have audited the accompanying statement of assets and liabilities, including the schedule of investments, of Appleseed Fund (the “Fund”), a series of Unified Series Trust, as of September 30, 2023, the related statement of operations for the year then ended, the statements of changes in net assets for each of the two years in the period then ended, the related notes, and the financial highlights for each of the five years in the period then ended (collectively referred to as the “financial statements”). In our opinion, the financial statements present fairly, in all material respects, the financial position of the Fund as of September 30, 2023, the results of its operations for the year then ended, the changes in net assets for each of the two years in the period then ended, and the financial highlights for each of the five years in the period then ended, in conformity with accounting principles generally accepted in the United States of America.
Basis for Opinion
These financial statements are the responsibility of the Fund’s management. Our responsibility is to express an opinion on the Fund’s financial statements based on our audits. We are a public accounting firm registered with the Public Company Accounting Oversight Board (United States) (“PCAOB”) and are required to be independent with respect to the Fund in accordance with the U.S. federal securities laws and the applicable rules and regulations of the Securities and Exchange Commission and the PCAOB.
We conducted our audits in accordance with the standards of the PCAOB. Those standards require that we plan and perform the audits to obtain reasonable assurance about whether the financial statements are free of material misstatement whether due to error or fraud.
Our audits included performing procedures to assess the risks of material misstatement of the financial statements, whether due to error or fraud, and performing procedures that respond to those risks. Such procedures included examining, on a test basis, evidence regarding the amounts and disclosures in the financial statements. Our procedures included confirmation of securities owned as of September 30, 2023, by correspondence with the custodian and brokers. Our audits also included evaluating the accounting principles used
| REPORT OF INDEPENDENT |
| REGISTERED PUBLIC ACCOUNTING FIRM – continued |
and significant estimates made by management, as well as evaluating the overall presentation of the financial statements. We believe that our audits provide a reasonable basis for our opinion.
We have served as the Fund’s auditor since 2007.

COHEN & COMPANY, LTD.
Chicago, Illinois
November 22, 2023
| LIQUIDITY RISK MANAGEMENT PROGRAM – (Unaudited) |
The Trust has adopted and implemented a written liquidity risk management program (the “Program”) as required by Rule 22e-4 (the “Liquidity Rule”) under the 1940 Act. The Program is reasonably designed to assess and manage the Fund’s liquidity risk of each individual series of the Trust (each a “Fund” and collectively, the “Funds”), taking into consideration, among other factors, the Fund’s investment strategy and the liquidity of its portfolio investments during normal and reasonably foreseeable stressed conditions; its short and long-term cash flow projections; and its cash holdings and access to other funding sources. The Board approved the appointment of the Liquidity Administrator Committee, comprising certain Trust officers and employees of the Adviser. The Liquidity Administrator Committee maintains Program oversight and reports to the Board on at least an annual basis regarding the Program’s operational effectiveness through a written report (the “Report”). The Program’s most recent Report, which was presented to the Board for consideration at its meeting held on August 14-15, 2023, outlined the operation of the Program and the adequacy and effectiveness of the Program’s implementation. During the review period, the Funds did not experience unusual stress or disruption to their operations related to purchase and redemption activity. Also, during the review period each Fund held adequate levels of cash and highly liquid investments to meet shareholder redemption activities in accordance with such Fund’s prospectus and within the requirements of the 1940 Act. The Report concluded that the Program is reasonably designed to prevent violation of the Liquidity Rule and has been effectively implemented.
| SUMMARY OF FUND EXPENSES – (Unaudited) |
As a shareholder of the Fund, you incur two types of costs: (1) transaction costs, including redemption fees; and (2) ongoing costs, including management fees, distribution (12b-1) fees and other Fund expenses. The example is intended to help you understand your ongoing costs (in dollars) of investing in the Fund and to compare these costs with the ongoing costs of investing in other funds. You may pay brokerage commissions on purchases and sales of exchange-traded fund shares, which are not reflected in the example. The example is based on an investment of $1,000 invested at the beginning of the period and held for the entire period from April 1, 2023 through September 30, 2023.
Actual Expenses
The first line of the table for each class provides information about actual account values and actual expenses. You may use the information in these lines, together with the amount you invested, to estimate the expenses that you paid over the period. Simply divide your account value by $1,000 (for example, an $8,600 account value divided by $1,000 = 8.60), then multiply the result by the number in the first line under the heading “Expenses Paid During Period” to estimate the expenses you paid on your account during this period.
Hypothetical Example for Comparison Purposes
The second line of the table for each class provides information about hypothetical account values and hypothetical expenses based on the Fund’s actual expense ratios and an assumed rate of return of 5% per year before expenses, which is not the Fund’s actual return. The hypothetical account values and expenses may not be used to estimate the actual ending account balances or expenses you paid for the period. You may use this information to compare the ongoing costs of investing in the Fund and other funds. To do so, compare this 5% hypothetical example with the 5% hypothetical examples that appear in the shareholder reports of other funds.
Expenses shown in the table are meant to highlight your ongoing costs only and do not reflect any transactional costs. Therefore, the second line of the table for each class is useful in comparing ongoing costs only and will not help you determine the relative total costs of owning different funds. In addition, if transaction costs were included, your costs would have been higher.
| SUMMARY OF FUND EXPENSES – continued (Unaudited) |
| | | | | Beginning | | Ending | | | | |
| | | | | Account Value | | Account Value | | Expenses | | Annualized |
| | | | | April 1, | | September 30, | | Paid During | | Expense |
| APPLESEED FUND | | 2023 | | 2023 | | Period(a) | | Ratio |
| Investor | | | | | | | | | | |
| Class | | Actual | | $1,000.00 | | $958.70 | | $5.60 | | 1.14% |
| | | Hypothetical(b) | | $1,000.00 | | $1,019.35 | | $5.77 | | 1.14% |
| Institutional | | | | | | | | | | |
| Class | | Actual | | $1,000.00 | | $959.70 | | $4.67 | | 0.95% |
| | | Hypothetical(b) | | $1,000.00 | | $1,020.31 | | $4.81 | | 0.95% |
| (a) | Expenses are equal to the Fund’s annualized expense ratios, multiplied by the average account value over the period, multiplied by 183/365 (to reflect the one-half year period). |
| (b) | Hypothetical assumes 5% annual return before expenses. |
| ADDITIONAL FEDERAL INCOME TAX INFORMATION – (Unaudited) |
The Form 1099-DIV you receive in January 2024 will show the tax status of all distributions paid to your account in calendar year 2023. Shareholders are advised to consult their own tax adviser with respect to the tax consequences of their investment in the Fund. As required by the Internal Revenue Code and/ or regulations, shareholders must be notified regarding the status of qualified dividend income for individuals and the dividends received deduction for corporations.
Qualified Dividend Income. The Fund designates approximately 100% or up to the maximum amount of such dividends allowable pursuant to the Internal Revenue Code, as qualified dividend income eligible for a reduced tax rate.
Dividends Received Deduction. Corporate shareholders are generally entitled to take the dividends received deduction on the portion of the Fund’s dividend distribution that qualifies under tax law. For the Fund’s calendar year 2023 ordinary income dividends, 78.10% qualifies for the corporate dividends received deduction.
For the fiscal year ended September 30, 2023, the Fund designated $515,566 as long-term capital gain distributions.
| TRUSTEES AND OFFICERS – (Unaudited) |
GENERAL QUALIFICATIONS. The Board supervises the business activities of the Trust. Each Trustee serves as a trustee until termination of the Trust unless the Trustee dies, resigns, retires, or is removed. The Chair of the Board and more than 75% of the Trustees are “Independent Trustees”, which means that they are not “interested persons” (as defined in the 1940 Act) of the Trust or any adviser, sub-adviser or distributor of the Trust.
The following table provides information regarding the Independent Trustees.
Name, Address*, (Year of
Birth), Position with Trust**,
Term of Position with Trust | | Principal Occupation During Past 5
Years and Other Directorships |
| Daniel J. Condon (1950) Chair, May 2022 to present; Chair of the Audit Committee; Chair of the Governance & Nominating Committee, May 2020 to May 2022; Independent Trustee, December 2002 to present | | Current: Retired (2017 - present). Previous: Peak Income Plus Fund (May 2022 – February 2023). |
| Kenneth G.Y. Grant (1949) Chair of the Governance & Nominating Committee, May 2022 to present; Chair, January 2017 to May 2022; Independent Trustee, May 2008 to present | | Current: Director, Standpoint Multi-Asset (Cayman) Fund, Ltd. (2019 – present); Director, Advisors Charitable Gift Fund (2020 – present), a Donor Advised Fund; Trustee, Peak Income Plus Fund (May 2022 – present). Previous: EVP, Benefit Plans Administrative Services, Inc., provider of retirement benefit plans administration (2019 – 2020); Director, Northeast Retirement Services (NRS) LLC, a transfer agent and fund administrator; and Director, Global Trust Company (GTC), a non-depository trust company sponsoring private investment products (2003 – 2019); EVP, NRS (2003 – 2019); GTC, EVP (2008 – 2019); EVP, Savings Banks Retirement Association (2003 – 2019), provider of qualified retirement benefit plans. |
| Ronald C. Tritschler (1952) Chair of the Audit Committee, May 2022 to present; Independent Trustee, January 2007 to present; Interested Trustee, December 2002 to December 2006 | | Current: Chief Executive Officer, Director and Legal Counsel of The Webb Companies, a national real estate company, (2001– present); Director, Standpoint Multi- Asset (Cayman) Fund, Ltd. (2020 – present); Director of First State Bank of the Southeast (2000 – present). Previous: Trustee, Peak Income Plus Fund (May 2022 – February 2023). |
| TRUSTEES AND OFFICERS – continued (Unaudited) |
Name, Address*, (Year of
Birth), Position with Trust**,
Term of Position with Trust | | Principal Occupation During Past 5
Years and Other Directorships |
| Catharine B. McGauley (1977) Chair of the Pricing & Liquidity Committee, November 2022 to present; Independent Trustee, September 2022 to present | | Current: Lead Portfolio Manager of Atlantic Charter Insurance, a workers’ compensation insurer, (2010 – present); Investment Advisor for a Family Office (2015 – present); Senior Analyst/ Advisor for a Boston real estate company and related family (2010 – present). Previous: Trustee, Peak Income Plus Fund (May 2022 – February 2023). |
| Freddie Jacobs, Jr. (1970) Independent Trustee, September 2022 to present | | Current: Chief Operating Officer and Chief Risk Officer Northeast Retirement Services LLC (NRS), and its subsidiary, Global Trust Company (GTC). NRS is a transfer agent and fund administrator, GTC is a non- depository trust company sponsoring private investment products (2021 – present); Trustee of Buckingham Browne & Nichols (BBN) (2018 – present); Member of the Finance Committee, BBN (2017 – present); Chair Board of Directors of Crispus Attucks Fund (2020 – present); Board Member of Camp Harbor View (2020 – present); Trustee, Peak Income Plus Fund (May 2022 – February 2023); Director, Sportsmen’s Tennis and Education Center (2019 – present). Previous: SVP, Senior Risk Officer NRS (2013 – 2021); Trustee, Peak Income Plus Fund (May 2022 – February 2023).* |
| * | The address for each Trustee is 225 Pictoria Drive, Suite 450, Cincinnati, Ohio 45246. |
| ** | As of the date of this report, the Trust consists of 29 series. |
| TRUSTEES AND OFFICERS – continued (Unaudited) |
The following table provides information regarding the Interested Trustee and Officers of the Trust.
Name, Address*, (Year of
Birth), Position with Trust,
Term of Position with Trust | | Principal Occupation During Past 5
Years and Other Directorships |
| David R. Carson (1958) Interested Trustee, August 2020 to present; President, January 2016 to August 2021 | | Current: Retired (2023 – present). Interested Trustee, Mammoth Institutional Credit Access Fund and Mammoth Institutional Equity Access Fund (November 2022 – present); Interested Trustee, Peak Income Plus Fund (May 2022 – present). Previous: Interested Trustee of Ultimus Managers Trust, (January 2021 – April 2023); Senior Vice President Client Strategies of Ultimus Fund Solutions, LLC, (2013 – April 2023). |
| Martin R. Dean (1963) President, August 2021 to present; Vice President, November 2020 to August 2021; Chief Compliance Officer, April 2021 to August 2021; Assistant Chief Compliance Officer, January 2016 to April 2021 | | Current: President, Northern Lights Compliance Services (2023 – present). Previous: Senior Vice President, Head of Fund Compliance of Ultimus Fund Solutions, LLC (2016 – January 2023). |
| Zachary P. Richmond (1980) Treasurer and Chief Financial Officer, November 2014 to present | | Current: Vice President, Director of Financial Administration for Ultimus Fund Solutions, LLC, (2015 – present). |
| Gweneth K. Gosselink (1955) Chief Compliance Officer, August 2021 to present | | Current: Vice President, Senior Compliance Officer of Ultimus Fund Solutions, LLC, since 2019. Previous: Chief Operating Officer & CCO at Miles Capital, Inc. (2013 – 2019). |
| Elisabeth Dahl (1962) Secretary, May 2017 to present; Assistant Secretary, March 2016 to May 2017 | | Current: Attorney, Ultimus Fund Solutions, LLC since March 2016. |
| Timothy J. Shaloo (1970) AML Compliance Officer, August 2023 to present | | Current: AVP, Compliance Officer, Northern Lights Compliance Services, LLC (2021 - present). Previous: Compliance Specialist, Ultimus Fund Solutions, LLC (2016 – 2020). |
| * | The address for each Officer is 225 Pictoria Drive, Suite 450, Cincinnati, Ohio 45246. |
| OTHER INFORMATION – (Unaudited) |
The Fund’s Statement of Additional Information (“SAI”) includes additional information about the trustees and is available without charge, upon request. You may call toll-free at (800) 431-1716 to request a copy of the SAI or to make shareholder inquiries.
| MANAGEMENT AGREEMENT RENEWAL – (Unaudited) |
The Appleseed Fund (the “Fund”) is a series of Unified Series Trust (the “Trust”). The Trust’s Board of Trustees (the “Board”) oversees the management of the Fund and, as required by law, has considered the renewal of the Fund’s management agreement with its investment adviser, Pekin Hardy Strauss, Inc. (“Pekin”). In connection with such approval, the Board requested and evaluated all information that the Trustees deemed reasonably necessary under the circumstances.
The Trustees held a teleconference on August 9, 2023 to review and discuss materials compiled by Ultimus Fund Solutions, LLC, the Trust’s administrator, with regard to the management agreement between the Trust and Pekin. At the Trustees’ quarterly meeting held in August 2023, the Board interviewed certain executives of Pekin, including Pekin’s Chief Compliance Officer, its Senior Research Analyst, and its Portfolio Manager. After discussion, the Trustees, including the Trustees who are not “interested persons” (as that term is defined in the Investment Company Act of 1940, as amended) of the Trust or Pekin (the “Independent Trustees”), approved the renewal of the management agreement between the Trust and Pekin for an additional year. The Trustees’ renewal of the Fund’s management agreement was based on a consideration of all the information provided to the Trustees, and was not the result of any single factor. Some of the factors that figured particularly in the Trustees’ deliberations are described below, although individual Trustees may have evaluated this information differently, ascribing different weights to various factors.
| (i) | The Nature, Extent, and Quality of Services. The Trustees reviewed and considered information regarding the nature, extent, and quality of services that Pekin provides to the Fund, which include, but are not limited to, providing a continuous investment program for the Fund, adhering to the Fund’s investment restrictions, complying with the Trust’s policies and procedures, and voting proxies on behalf of the Fund. The Trustees considered the qualifications and experience of Pekin’s portfolio managers who are responsible for the day-to-day management of the Fund’s portfolio, as well as the qualifications and experience of the other individuals at Pekin who provide services to the Fund. The Trustees discussed succession planning with Pekin and noted Pekin remains nimble and attributes long-term success to diligent research and compliance. The Trustees concluded that they were satisfied with the nature, extent, and quality of investment management services provided by Pekin to the Fund. |
| MANAGEMENT AGREEMENT RENEWAL – continued (Unaudited) |
| (ii) | Fund Performance. The Trustees next reviewed and discussed the Fund’s performance for periods ended May 31, 2023. The Trustees observed that the Fund’s Institutional Class shares had underperformed its benchmark, the Morningstar Global Markets SMID Cap Index, the median of the Morningstar Global Allocation Category, and the peer group median for the one-year, five-year, and since inception periods. The Trustees noted that over the three-year period, the Fund outperformed the category median but underperformed the benchmark and peer group median. The Trustees reviewed and discussed the Fund’s ESG mandate and how that may have impacted Fund performance, also noting that the Fund benefitted from securities selection over the long term. The Trustees acknowledged Pekin’s explanation that underperformance was attributable to the Fund’s investment selection, exposure to small and micro capitalization companies, defensive positions, and value orientation. It was the consensus of the Trustees that Pekin was managing the strategy consistent with the Fund’s mandate. |
| (iii) | Fee Rate and Profitability. The Trustees reviewed a fee and expense comparison for funds in the Fund’s peer group and Morningstar Global Allocation Category, which indicated that the Fund’s management fee was higher than the averages and the medians of the peer group and Morningstar category. The comparison indicated that the Fund’s net expense ratio was higher than the Morningstar category average and median, but equal to its peer group median and lower than the peer group average. The Trustees recalled that Pekin justified its higher net expense ratio due to the inability to benefit from economies of scale in the same manner as the larger funds in its Morningstar category and that its peer group was comprised of funds that were similar in size to the Fund making it a more apt comparison in terms of fees and expenses. The Trustees considered Pekin’s explanation that the amount of work required by its socially responsible investing strategy justifies the higher management fee. |
The Trustees also considered a profitability analysis prepared by Pekin for its management of the Fund, which indicated that Pekin is earning a profit as a result of managing the Fund. The Trustees acknowledged Pekin’s position that its profits before marketing expenses were reasonable due to the unique nature of the Fund’s strategy, the resources and time spent to manage the Fund, and the reputational and regulatory risk incurred as
| MANAGEMENT AGREEMENT RENEWAL – continued (Unaudited) |
a result of services provided to the Fund. The Trustees determined that the level of profit was not excessive in light of Pekin’s justifications and the services provided to the Fund.
The Trustees also recalled their review of the Fund’s Administrative Services Plan and considered other potential benefits that Pekin may receive in connection with its management of the Fund, including third-party research obtained by soft dollars, which may be used to benefit the Fund along with Pekin’s other advisory clients. After considering the above information, the Trustees concluded that the current management fee for the Fund represents reasonable compensation in light of the nature and quality of Pekin’s services to the Fund, the fees paid by competitive mutual funds, and the profitability of Pekin’s services to the Fund.
| (iv) | Economies of Scale. In determining the reasonableness of the management fee, the Trustees also considered the extent to which Pekin will realize economies of scale as the Fund grows larger. The Trustees determined that, in light of the current size of the Fund and Pekin’s level of profitability in managing the Fund, Pekin is not yet benefitting from economies of scale in managing the Fund and therefore it is premature to reduce the management fee or introduce breakpoints at this time. |
| PRIVACY NOTICE |
| | Rev: March 2021 |
| FACTS | WHAT DOES APPLESEED FUND (THE “FUND”) DO WITH YOUR PERSONAL INFORMATION? |
| Why? | Financial companies choose how they share your personal information. Federal law gives consumers the right to limit some but not all sharing. Federal law also requires us to tell you how we collect, share, and protect your personal information. Please read this notice carefully to understand what we do. |
| What? | The types of personal information we collect and share depend on the product or service you have with us. This information can include: ● Social Security number ● account balances and account transactions ● transaction or loss history and purchase history ● checking account information and wire transfer instructions When you are no longer our customer, we continue to share your information as described in this notice. |
| How? | All financial companies need to share customers’ personal information to run their everyday business. In the section below, we list the reasons financial companies can share their customers’ personal information; the reasons the Fund chooses to share; and whether you can limit this sharing. |
| Reasons we can share your personal information | Does the Fund
share? |
For our everyday business purposes—
such as to process your transactions, maintain your account(s), respond to court orders and legal investigations, or report to credit bureaus | Yes |
For our marketing purposes—
to offer our products and services to you | No |
| For joint marketing with other financial companies | No |
For our affiliates’ everyday business purposes—
information about your transactions and experiences | No |
For our affiliates’ everyday business purposes—
information about your creditworthiness | No |
| For nonaffiliates to market to you | No |
| Questions? | Call (800) 470-1029 |
| Who we are |
| Who is providing this notice? | Appleseed Fund Ultimus Fund Distributors, LLC (Distributor) Ultimus Fund Solutions, LLC (Administrator) |
| What we do |
| How does the Fund protect my personal information? | To protect your personal information from unauthorized access and use, we use security measures that comply with federal law. These measures include computer safeguards and secured files and buildings. Our service providers are held accountable for adhering to strict policies and procedures to prevent any misuse of your nonpublic personal information. |
| How does the Fund collect my personal information? | We collect your personal information, for example, when you ● open an account or deposit money ● buy securities from us or sell securities to us ● make deposits or withdrawals from your account or provide account information ● give us your account information ● make a wire transfer ● tell us who receives the money ● tell us where to send the money ● show your government-issued ID ● show your driver’s license |
| Why can’t I limit all sharing? | Federal law gives you the right to limit only ● sharing for affiliates’ everyday business purposes—information about your creditworthiness ● affiliates from using your information to market to you ● sharing for nonaffiliates to market to you State laws and individual companies may give you additional rights to limit sharing. |
| Definitions |
| Affiliates | Companies related by common ownership or control. They can be financial and nonfinancial companies. ● Perkin Hardy Strauss, Inc., the investment adviser to the Fund, could be deemed to be an affiliate. |
| Nonaffiliates | Companies not related by common ownership or control. They can be financial and nonfinancial companies. ● The Fund does not share your personal information with nonaffiliates so they can market to you |
| Joint marketing | A formal agreement between nonaffiliated financial companies that together market financial products or services to you. ● The Fund doesn’t jointly market. |
[THIS PAGE INTENTIONALLY LEFT BLANK]
PROXY VOTING
A description of the policies and procedures that the Fund uses to determine how to vote proxies relating to portfolio securities and information regarding how the Fund voted those proxies during the most recent twelve month period ended June 30, are available (1) without charge upon request by calling the Fund at (800) 470-1029 and (2) in Fund documents filed with the SEC on the SEC’s website at www.sec.gov.
TRUSTEES
Daniel J. Condon, Chair
David R. Carson
Kenneth G.Y. Grant
Freddie Jacobs, Jr.
Catharine B. McGauley
Ronald C. Tritschler OFFICERS
Martin R. Dean, President
Gweneth K. Gosselink, Chief Compliance Officer
Zachary P. Richmond, Treasurer and Chief Financial Officer INVESTMENT ADVISER
Pekin Hardy Strauss, Inc.
227 West Monroe Street, Suite 3625
Chicago, IL 60606 DISTRIBUTOR
Ultimus Fund Distributors, LLC
225 Pictoria Drive, Suite 450
Cincinnati, OH 45246 | INDEPENDENT REGISTERED
PUBLIC ACCOUNTING FIRM
Cohen & Company, Ltd.
151 North Franklin Street, Suite 575
Chicago, IL 60606 LEGAL COUNSEL
Thompson Hine LLP
312 Walnut Street, 20th Floor
Cincinnati, OH 45202 CUSTODIAN
U.S. Bank, N.A.
425 Walnut Street
Cincinnati, OH 45202 ADMINISTRATOR, TRANSFER AGENT AND FUND ACCOUNTANT
Ultimus Fund Solutions, LLC
225 Pictoria Drive, Suite 450
Cincinnati, OH 45246 |
This report is intended only for the information of shareholders or those who have received the Fund’s prospectus which contains information about the Fund’s management fee and expenses. Please read the prospectus carefully before investing.
Distributed by Ultimus Fund Distributors, LLC
Member FINRA/SIPC

Appleseed-AR-23
| |
 |
| |
| |
| |
| |
| |
| |
| |
| |
| Ballast Small/Mid Cap ETF (MGMT) |
| |
| NYSE Arca, Inc. |
| |
| |
| |
| Annual Report |
| |
| September 30, 2023 |
| |
| |
| |
| |
| |
| |
| |
| |
| |
| |
| |
| |
| |
| |
| |
| Fund Adviser: |
| Ballast Asset Management, LP |
| 2911 Turtle Creek Blvd, Suite 840 |
| Dallas, TX 75219 |
| 1-866-383-6468 |
Management Discussion of Fund Performance – (Unaudited)
The Ballast Small/Mid-Cap ETF (MGMT) is a value-focused, actively managed equity ETF that primarily invests in a broad universe of domestic equity securities of small and medium-capitalization companies. We use fundamental, bottom-up analysis for stock selection, portfolio construction, and risk management.
For the year ended September 30, 2023, the ETF returned 19.79% versus the Russell 2500 Value Index’s 11.34% return. The ~8.5% outperformance relative to the benchmark came from a combination of security selection and sector allocation. From a sector perspective, a significant overweight to Energy and underweight to Financials (specifically Banks) were the two most significant drivers of positive relative performance. An underweight position within Industrials was the only material detractor to relative performance from a sector perspective.
In terms of security selection, Natural Resource Partners, L.P., UFP Technologies, Inc., Climb Global Solutions, Inc., CONSOL Energy, Inc. and Farmer Mac (Federal Agricultural Mortgage Corp.) were the biggest contributors to performance over the last year. Collectively, those five securities made up over 100% of the 8.5% outperformance during the year. Conversely, Rimini Street, Inc., Richardson Electronics Ltd., First Citizens BancShares, Inc., Olaplex Holdings, Inc., and Polished Inc. were the biggest detractors from performance. Those five securities detracted over 4% from performance on the year.
As we enter this new fiscal year, we continue to maintain a significant overweight position to Energy and Technology, with a material underweight position to Financials (particularly Banks) and Real Estate (REITs). That positioning results from a bottom-up view of the securities of businesses we find most attractive at the moment. Specifically, we continue to find attractive opportunities to invest within the energy complex via businesses with good oil and gas producing assets, low levels of debt, high returns on capital and management teams with a favorable shareholder mindset. Within Technology, our investments tend to be in businesses that are out of the mainstream technology hot topics (e.g., Generative AI, Cloud Computing, etc.), but rather more established businesses trading at attractive prices relative to our valuation based on current levels of earnings and cash flow.
Our underweight within Financials reflects our view that Banks have yet to fully price the risks we believe they face in this environment. When Silicon Valley Bank revealed the extent of unrecognized losses on longer date Treasury investments, which many banks had on their balance sheets, we dramatically reduced our exposure to banks. Although Fed lending facilities help mitigate the risk of unrecognized losses in held to maturity securities, we are also concerned that a combination of higher Fed Funds rates and lower loan growth could materially impact Bank profitability in the short to medium term. Additionally, if the U.S. happens to go through a recession over the next year or so, we are concerned about credit losses on Banks’ current loan books, particularly within Commercial Real Estate. Our underweight position to REITs stems from our view that higher interest rates not only
Management Discussion of Fund Performance – (Unaudited) (continued)
increase borrowing costs for REITs, but also increase the required rate of return of Real Estate investors (cap rates), and thus tends to drive down the price of the real assets. We are also simply finding better ideas elsewhere in the market.
From a macro perspective, we believe the U.S. economy is at an elevated risk of entering an economic recession in 2024. There are a uniquely elevated number of global crosscurrents at the moment that inform our view. Those risks include tight monetary policy, a reduction/reversal of fiscal policy (e.g., the end to the freeze on student loan debt repayment), geopolitical conflict and stubbornly high inflation, to name a few. We believe that broadly available macroeconomic data is dated, and that microeconomic commentary paints a very different picture of the current conditions. Specifically, management and corporate commentary regarding recent levels of demand activity, hiring patterns, late payment/default rates, more difficult borrowing conditions, and a slower recovery within China, to name a few. While these data points are admittedly more anecdotal than broader government provided data, we believe it is more “real time.”
Macro risk aside, we continue to find unique opportunities to invest in businesses at attractive valuations that we believe are more insulated from these macro risk factors. While each investment comes with some level of risk, we believe the return potential for many of these specific opportunities is more idiosyncratic (i.e., not influenced as much by the above macro factors, but more company-specific). We believe those situations should provide the opportunity for higher risk adjusted returns even if overall economic activity deteriorates. Furthermore, the overall levels of valuations within the small and mid-cap value universe remain remarkably low relative to historical valuations. We think that timing the market is practically impossible, so we tend to remain fully invested to capitalize on our expectation of an expansion in earnings multiples on small and mid-cap stocks to more normal levels as the elevated risks and uncertainties eventually recede.
Investment Results (Unaudited)
Average Annual Total Returns* as of September 30, 2023
| | | | Since |
| | | | Inception |
| | | | December 2, |
| | One Year | | 2020 |
| Ballast Small/Mid Cap ETF - NAV | 19.79% | | 12.44% |
| Ballast Small/Mid Cap ETF - Market Price | 19.66% | | 12.47% |
| Russell 2500 Value Index(a) | 11.34% | | 6.38% |
Total annual operating expenses, as disclosed in the Ballast Small/Mid Cap ETF’s (the “Fund”) prospectus dated January 28, 2023, were 1.10% of average daily net assets (1.37% before fee waivers/expense reimbursements by Ballast Asset Management, LP (the “Adviser”)). The Adviser has contractually agreed to waive its management fee and/or reimburse expenses so that total annual Fund operating expenses, excluding portfolio transaction and other investment-related costs (including brokerage fees and commissions); taxes; borrowing costs (such as interest and dividend expenses on securities sold short); acquired fund fees and expenses; fees and expenses associated with investments in other collective investment vehicles or derivative instruments (including for example option and swap fees and expenses); any administrative and/or shareholder servicing fees payable pursuant to a plan adopted by the Board of Trustees; expenses incurred in connection with any merger or reorganization; extraordinary expenses (such as litigation expenses, indemnification of Trust officers and Trustees and contractual indemnification of Fund service providers); and other expenses that the Trustees agree have not been incurred in the ordinary course of the Fund’s business, do not exceed 1.10% through January 31, 2024. This expense cap may not be terminated prior to this date except by the Board of Trustees. Each waiver/expense payment by the Adviser is subject to recoupment by the Adviser from the Fund in the three years following the date the particular waiver/expense payment occurred, but only if such recoupment can be achieved without exceeding the annual expense limitation in effect at the time of the waiver/expense payment and any expense limitation in effect at the time of the recoupment. Additional information pertaining to the Fund’s expense ratios as of September 30, 2023 can be found in the financial highlights.
The performance quoted represents past performance, which does not guarantee future results. The investment return and principal value of an investment will fluctuate so that an investor’s shares, when redeemed, may be worth more or less than their original cost. The returns shown do not reflect deduction of taxes that a shareholder would pay on Fund distributions or the redemption of Fund shares. Current performance of the Fund may be lower or higher than the performance quoted. The Fund’s investment objective, risks, charges and expenses should be considered carefully before investing. Performance data current to the most recent month-end may be obtained by calling (866) 383-6468. The Fund’s per share net asset value (“NAV”) is the value of one share of the Fund as calculated in accordance with the standard formula for valuing shares. The NAV return is based on the NAV of the Fund and the market return is based on the market price per share of the Fund. The price used to calculate market return (“Market Price”) is determined by using the midpoint between the highest bid and the lowest offer on the primary stock exchange on which the shares of the Fund are listed for trading, as of the time that the Fund’s NAV is calculated. Market Price and NAV returns assume that dividends and capital gain distributions have been reinvested in the Fund at Market Price and NAV, respectively. Since exchange-traded funds are bought and sold at prices set by the market, which can result in a premium or discount to NAV, the returns calculated using Market Price can differ from those calculated using NAV.
| * | Return figures reflect any change in price per share and assume the reinvestment of all distributions. The Fund’s returns reflect any fee reductions during the applicable periods. If such fee reductions had not occurred, the quoted performance would have been lower. |
Investment Results (Unaudited) (continued)
| (a) | The Russell 2500 Value Index (“the Index”) is a widely recognized unmanaged index of equity securities and is representative of a broader domestic equity market and range of securities than is found in the Fund’s portfolio. Individuals cannot invest directly in the Index; however, an individual can invest in exchange-traded funds or other investment vehicles that attempt to track the performance of a benchmark index. |
The Fund’s investment objective, strategies, risks, charges and expenses should be considered carefully before investing. The prospectus contains this and other important information about the Fund and may be obtained by calling (866) 383-6468. Please read it carefully before investing.
Investment Results (Unaudited) (continued)
Comparison of the Growth of a $10,000 Investment in the Ballast Small/Mid Cap ETF — NAV, Ballast Small/Mid Cap ETF — Market and the Russell 2500 Value Index (Unaudited)
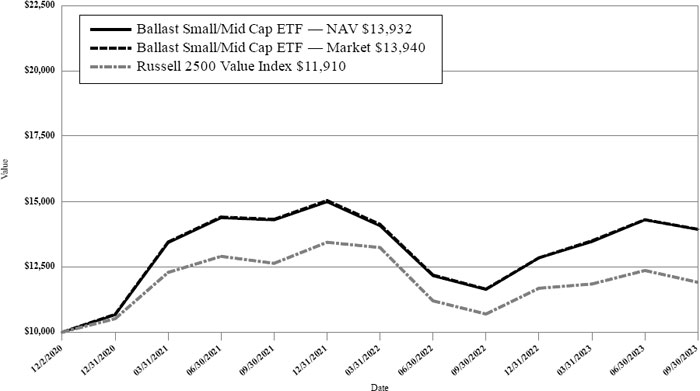
This graph shows the value of a hypothetical initial investment of $10,000 made on December 2, 2020 (commencement of operations) for the Fund and held through September 30, 2023. The Russell 2500 Value Index is a widely recognized unmanaged index of equity securities and is representative of a broader domestic equity market. and range of securities than is found in the Fund’s portfolio. Individuals cannot invest directly in an index; however, an individual may invest in exchange-traded funds or other investment vehicles that attempt to track the performance of a benchmark index. THE FUND’S RETURNS REPRESENT PAST PERFORMANCE AND DO NOT GUARANTEE OR PREDICT FUTURE RESULTS. The returns shown do not reflect deduction of taxes that a shareholder would pay on Fund distributions or the redemption of Fund shares. Investment returns and principal values will fluctuate so that an investor’s shares, when redeemed, may be worth more or less than their original cost.
Current performance may be lower or higher than the performance data quoted. For more information on the Fund, and to obtain performance data current to the most recent month-end, or to request a prospectus, please call (866) 383-6468. You should carefully consider the investment objective, risks, charges and expenses of the Fund before investing. The Fund’s prospectus contains this and other information about the Fund and should be read carefully before investing.
The Fund is distributed by Northern Lights Distributors, LLC, Member FINRA/SIPC.
Fund Holdings (Unaudited)
Ballast Small/Mid Cap ETF Holdings as of September 30, 2023.*
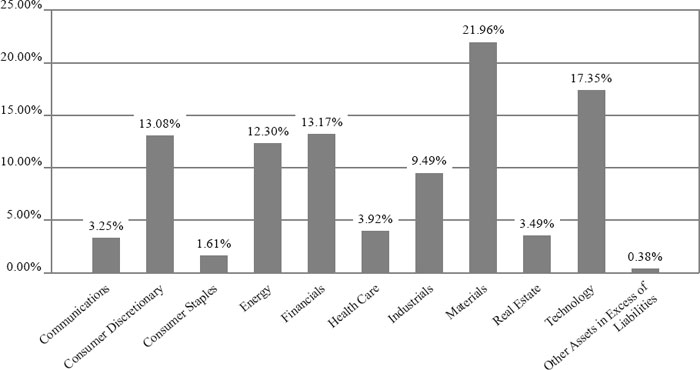
| * | As a percentage of net assets. |
The Fund seeks to generate positive risk adjusted returns as its investment objective.
Portfolio holdings are subject to change.
Availability of Portfolio Schedule (Unaudited)
The Fund files its complete schedule of portfolio holdings with the Securities and Exchange Commission (the “SEC”) for the first and third quarters of each fiscal year as an exhibit to its reports on Form N-PORT. The Fund’s Form N-PORT reports are available on the SEC’s website at www.sec.gov or on the Fund’s website at www.etf.mgmtetf.com.
| Ballast Small/Mid Cap ETF |
| Schedule of Investments |
| September 30, 2023 |
| | | Shares | | | Fair Value | |
| COMMON STOCKS — 99.62% | | | | | | | | |
| Communications — 3.25% | | | | | | | | |
| Criteo S.A. - ADR(a) | | | 90,880 | | | $ | 2,653,696 | |
| TripAdvisor, Inc.(a) | | | 55,936 | | | | 927,419 | |
| | | | | | | | 3,581,115 | |
| Consumer Discretionary — 13.08% | | | | | | | | |
| American Eagle Outfitters, Inc. | | | 110,574 | | | | 1,836,634 | |
| America’s Car-Mart, Inc.(a) | | | 29,732 | | | | 2,705,315 | |
| BorgWarner, Inc. | | | 57,600 | | | | 2,325,312 | |
| Cavco Industries, Inc.(a) | | | 6,843 | | | | 1,817,911 | |
| Global Business Travel Group Inc.(a) | | | 228,888 | | | | 1,258,884 | |
| Phinia, Inc. | | | 64,092 | | | | 1,717,025 | |
| Wayside Technology Group, Inc. | | | 64,000 | | | | 2,752,640 | |
| | | | | | | | 14,413,721 | |
| Consumer Staples — 1.61% | | | | | | | | |
| Olaplex Holdings, Inc.(a) | | | 266,130 | | | | 518,954 | |
| Sprouts Farmers Market, Inc.(a) | | | 29,250 | | | | 1,251,900 | |
| | | | | | | | 1,770,854 | |
| Energy — 12.30% | | | | | | | | |
| Epsilon Energy Ltd. | | | 243,782 | | | | 1,287,169 | |
| Green Plains, Inc.(a) | | | 112,512 | | | | 3,386,611 | |
| Kosmos Energy Ltd.(a) | | | 262,832 | | | | 2,149,967 | |
| Sitio Royalties Corp., Class A | | | 66,549 | | | | 1,611,151 | |
| Solaris Oilfield Infrastructure, Inc., Class A | | | 302,208 | | | | 3,221,537 | |
| Unit Corp. | | | 34,723 | | | | 1,899,348 | |
| | | | | | | | 13,555,783 | |
| Financials — 13.17% | | | | | | | | |
| Capital Bancorp, Inc. | | | 125,312 | | | | 2,397,219 | |
| Everest Re Group Ltd. | | | 6,400 | | | | 2,378,688 | |
| Federal Agricultural Mortgage Corp., Class C | | | 23,168 | | | | 3,574,822 | |
| International General Insurance Holdings Ltd. | | | 177,292 | | | | 1,999,854 | |
| International Money Express, Inc.(a) | | | 83,752 | | | | 1,417,921 | |
| MGIC Investment Corp. | | | 164,224 | | | | 2,740,899 | |
| | | | | | | | 14,509,403 | |
| Health Care — 3.92% | | | | | | | | |
| Bausch + Lomb Corp.(a) | | | 132,390 | | | | 2,244,010 | |
| iRadimed Corp. | | | 25,088 | | | | 1,113,155 | |
| QuidelOrtho Corp.(a) | | | 13,131 | | | | 959,088 | |
| | | | | | | | 4,316,253 | |
| Industrials — 9.49% | | | | | | | | |
| AZZ, Inc. | | | 67,235 | | | | 3,064,571 | |
| Eagle Bulk Shipping, Inc. | | | 26,845 | | | | 1,128,295 | |
| Landstar System, Inc. | | | 15,104 | | | | 2,672,502 | |
| Lennox International, Inc. | | | 6,656 | | | | 2,492,273 | |
| Timken Co. (The) | | | 14,930 | | | | 1,097,206 | |
| | | | | | | | 10,454,847 | |
| Materials — 21.96% | | | | | | | | |
| Bioceres Crop Solutions Corp.(a) | | | 195,763 | | | | 2,210,164 | |
| Compass Minerals International, Inc. | | | 74,112 | | | | 2,071,430 | |
| | | | | | | | | |
See accompanying notes which are an integral part of these financial statements.
| Ballast Small/Mid Cap ETF |
| Schedule of Investments (continued) |
| September 30, 2023 |
| | | Shares | | | Fair Value | |
| COMMON STOCKS — 99.62% (continued) | | | | | | | | |
| Materials — 21.96% (continued) | | | | | | | | |
| CONSOL Energy, Inc. | | | 37,144 | | | $ | 3,896,777 | |
| Eagle Materials, Inc. | | | 18,560 | | | | 3,090,611 | |
| Ecovyst, Inc.(a) | | | 168,600 | | | | 1,659,024 | |
| Huntsman Corp. | | | 83,584 | | | | 2,039,450 | |
| Natural Resource Partners, L.P. | | | 67,200 | | | | 5,300,064 | |
| Northern Technologies International Corp. | | | 217,728 | | | | 2,911,023 | |
| UFP Technologies, Inc.(a) | | | 6,333 | | | | 1,022,463 | |
| | | | | | | | 24,201,006 | |
| Real Estate — 3.49% | | | | | | | | |
| EPR Properties | | | 44,800 | | | | 1,860,992 | |
| Lamar Advertising Co., Class A | | | 23,808 | | | | 1,987,254 | |
| | | | | | | | 3,848,246 | |
| Technology — 17.35% | | | | | | | | |
| Amdocs Ltd. | | | 24,979 | | | | 2,110,476 | |
| Cass Information Systems, Inc. | | | 69,815 | | | | 2,600,609 | |
| Extreme Networks, Inc.(a) | | | 79,722 | | | | 1,930,069 | |
| F5, Inc.(a) | | | 11,512 | | | | 1,855,044 | |
| Genpact Ltd. | | | 29,250 | | | | 1,058,850 | |
| IPG Photonics Corp.(a) | | | 11,520 | | | | 1,169,741 | |
| Knowles Corp.(a) | | | 90,184 | | | | 1,335,625 | |
| RCM Technologies, Inc.(a) | | | 54,019 | | | | 1,055,531 | |
| Richardson Electronics Ltd. | | | 83,737 | | | | 915,245 | |
| Rimini Street, Inc.(a) | | | 501,982 | | | | 1,104,360 | |
| Teradata Corp.(a) | | | 88,320 | | | | 3,976,166 | |
| | | | | | | | 19,111,716 | |
| | | | | | | | | |
| Total Investments — 99.62% (Cost $108,961,817) | | | | | | | 109,762,944 | |
| | | | | | | | | |
| Other Assets in Excess of Liabilities — 0.38% | | | | | | | 421,302 | |
| | | | | | | | | |
| NET ASSETS — 100.00% | | | | | | $ | 110,184,246 | |
| (a) | Non-income producing security. |
ADR — American Depositary Receipt
See accompanying notes which are an integral part of these financial statements.
| Ballast Small/Mid Cap ETF |
| Statement of Assets and Liabilities |
| September 30, 2023 |
| Assets | | | | |
| Investments in securities, at fair value (cost $108,961,817) | | $ | 109,762,944 | |
| Cash | | | 2,172,032 | |
| Receivable for investments sold | | | 188,409 | |
| Dividends receivable | | | 27,608 | |
| Tax reclaims receivable | | | 1,055 | |
| Prepaid expenses | | | 2,337 | |
| Total Assets | | | 112,154,385 | |
| | | | | |
| Liabilities | | | | |
| Payable for investments purchased | | | 1,847,524 | |
| Payable to Adviser, net of waiver | | | 72,497 | |
| Payable to affiliates | | | 10,161 | |
| Payable to audit and tax | | | 19,261 | |
| Other accrued expenses | | | 20,696 | |
| Total Liabilities | | | 1,970,139 | |
| Net Assets | | $ | 110,184,246 | |
| | | | | |
| Net Assets consist of: | | | | |
| Paid-in capital | | $ | 117,399,983 | |
| Accumulated deficit | | | (7,215,737 | ) |
| Net Assets | | $ | 110,184,246 | |
| Shares outstanding (unlimited number of shares authorized, no par value) | | | 3,200,000 | |
| Net asset value per share | | $ | 34.43 | |
See accompanying notes which are an integral part of these financial statements.
| Ballast Small/Mid Cap ETF |
| Statement of Operations |
| For the year ended September 30, 2023 |
| Investment Income | | | | |
| Dividend income | | $ | 1,404,386 | |
| Total investment income | | | 1,404,386 | |
| | | | | |
| Expenses | | | | |
| Adviser | | | 722,683 | |
| Administration | | | 69,540 | |
| Legal | | | 22,853 | |
| Compliance services | | | 19,999 | |
| Audit and tax | | | 18,642 | |
| Trustee | | | 17,964 | |
| Custodian | | | 16,051 | |
| Report printing | | | 12,914 | |
| Transfer agent | | | 10,434 | |
| Insurance | | | 3,117 | |
| Pricing | | | 1,127 | |
| Miscellaneous | | | 41,921 | |
| Total expenses | | | 957,245 | |
| Fees waived by Adviser | | | (118,925 | ) |
| Net operating expenses | | | 838,320 | |
| Net investment income | | | 566,066 | |
| | | | | |
| Net Realized and Change in Unrealized Gain (Loss) on Investments | | | | |
| Net realized gain (loss) on: | | | | |
| Investment securities | | | (958,799 | ) |
| Change in unrealized appreciation on: | | | | |
| Investment securities | | | 11,694,986 | |
| Net realized and unrealized gain (loss) on investment securities | | | 10,736,187 | |
| Net increase in net assets resulting from operations | | $ | 11,302,253 | |
See accompanying notes which are an integral part of these financial statements.
| Ballast Small/Mid Cap ETF |
| Statements of Changes in Net Assets |
| | | For the | | | For the | |
| | | Year Ended | | | Year Ended | |
| | | September 30, | | | September 30, | |
| | | 2023 | | | 2022 | |
| Increase (Decrease) in Net Assets due to: | | | | | | | | |
| Operations | | | | | | | | |
| Net investment income | | $ | 566,066 | | | $ | 545,617 | |
| Net realized loss on investment securities | | | (958,799 | ) | | | (1,565,196 | ) |
| Change in unrealized appreciation (depreciation) on investment securities | | | 11,694,986 | | | | (12,145,398 | ) |
| Net increase (decrease) in net assets resulting from operations | | | 11,302,253 | | | | (13,164,977 | ) |
| | | | | | | | | |
| Distributions to Shareholders from: | | | | | | | | |
| Earnings | | | (593,244 | ) | | | (120,500 | ) |
| Total distributions | | | (593,244 | ) | | | (120,500 | ) |
| | | | | | | | | |
| Capital Transactions | | | | | | | | |
| Proceeds from shares sold | | | 49,012,422 | | | | 48,030,316 | |
| Amount paid for shares redeemed | | | (8,978,396 | ) | | | (12,811,113 | ) |
| Net increase in net assets resulting from capital transactions | | | 40,034,026 | | | | 35,219,203 | |
| Total Increase in Net Assets | | | 50,743,035 | | | | 21,933,726 | |
| | | | | | | | | |
| Net Assets | | | | | | | | |
| Beginning of year | | $ | 59,441,211 | | | $ | 37,507,485 | |
| End of year | | $ | 110,184,246 | | | $ | 59,441,211 | |
| | | | | | | | | |
| Share Transactions | | | | | | | | |
| Shares sold | | | 1,425,000 | | | | 1,375,000 | |
| Shares redeemed | | | (275,000 | ) | | | (375,000 | ) |
| Net increase in shares outstanding | | | 1,150,000 | | | | 1,000,000 | |
See accompanying notes which are an integral part of these financial statements.
| Ballast Small/Mid Cap ETF |
| Financial Highlights |
| (For a share outstanding during each period) |
| | | | | | | | | For the | |
| | | For the | | | For the | | | Period | |
| | | Year Ended | | | Year Ended | | | Ended | |
| | | September | | | September | | | September | |
| | | 30, 2023 | | | 30, 2022 | | | 30, 2021(a) | |
| Selected Per Share Data: | | | | | | | | | | | | |
| Net asset value, beginning of period | | $ | 29.00 | | | $ | 35.72 | | | $ | 25.00 | |
| | | | | | | | | | | | | |
| Investment operations: | | | | | | | | | | | | |
| Net investment income | | | 0.20 | | | | 0.30 | | | | 0.02 | |
| Net realized and unrealized gain (loss) on investments | | | 5.52 | | | | (6.92 | ) | | | 10.70 | |
| Total from investment operations | | | 5.72 | | | | (6.62 | ) | | | 10.72 | |
| | | | | | | | | | | | | |
| Less distributions to shareholders from: | | | | | | | | | | | | |
| Net investment income | | | (0.29 | ) | | | (0.10 | ) | | | — | |
| Total distributions | | | (0.29 | ) | | | (0.10 | ) | | | — | |
| | | | | | | | | | | | | |
| Net asset value, end of period | | $ | 34.43 | | | $ | 29.00 | | | $ | 35.72 | |
| Market price, end of period | | $ | 34.45 | | | $ | 29.05 | | | $ | 35.80 | |
| | | | | | | | | | | | | |
| Total Return(b) | | | 19.79 | % | | | (18.60 | )% | | | 42.88 | % (c) |
| | | | | | | | | | | | | |
| Ratios and Supplemental Data: | | | | | | | | | | | | |
| Net assets, end of period (000 omitted) | | $ | 110,184 | | | $ | 59,441 | | | $ | 37,507 | |
| Ratio of net expenses to average net assets | | | 1.10 | % | | | 1.10 | % | | | 1.10 | % (d) |
| Ratio of expenses to average net assets before waiver and reimbursement | | | 1.26 | % | | | 1.37 | % | | | 2.08 | % (d) |
| Ratio of net investment income to average net assets | | | 0.74 | % | | | 1.00 | % | | | 0.10 | % (d) |
| Portfolio turnover rate(e) | | | 25 | % | | | 29 | % | | | 8 | % (c) |
| (a) | For the period December 2, 2020 (commencement of operations) to September 30, 2021. |
| (b) | Total return is calculated assuming a purchase of shares at net asset value on the first day and a sale at net asset value on the last day of the period. Distributions are assumed, for the purpose of this calculation, to be reinvested at the ex-dividend date net asset value per share on their respective payment dates. |
| (e) | Portfolio turnover rate excludes securities received or delivered from in-kind processing of creations or redemptions. |
See accompanying notes which are an integral part of these financial statements.
Ballast Small/Mid Cap ETF
Notes to the Financial Statements
September 30, 2023
NOTE 1. ORGANIZATION
Ballast Small/Mid Cap ETF (the “Fund”) was organized as a diversified series of Unified Series Trust (the “Trust”) on November 18, 2020, and is registered under the Investment Company Act of 1940, as amended (the “1940 Act”). The Trust is an open-end investment company established under the laws of Ohio by an Agreement and Declaration of Trust dated October 14, 2002, as amended (the “Trust Agreement”). The Trust Agreement permits the Board of Trustees of the Trust (the “Board”) to issue an unlimited number of shares of beneficial interest of separate series. The Fund is one of a series of funds currently authorized by the Board. The Fund’s investment adviser is Ballast Asset Management, LP (the “Adviser”). The Fund seeks to generate positive risk adjusted returns as its investment objective.
NOTE 2. SIGNIFICANT ACCOUNTING POLICIES
The Fund is an investment company and follows accounting and reporting guidance under Financial Accounting Standards Board Accounting Standards Codification (“ASC”) Topic 946, “Financial Services-Investment Companies”. The following is a summary of significant accounting policies followed by the Fund in the preparation of its financial statements. These policies are in conformity with generally accepted accounting principles in the United States of America (“GAAP”).
Regulatory Update – Tailored Shareholder Reports for Mutual Funds and Exchange-Traded Funds (“ETFs”) – Effective January 24, 2023, the Securities and Exchange Commission adopted rule and form amendments to require mutual funds and ETFs to transmit concise and visually engaging streamlined annual and semiannual reports to shareholders that highlight key information. Other information, including financial statements, will no longer appear in a streamlined shareholder report but must be available online, delivered free of charge upon request, and filed on a semiannual basis on Form N-CSR. The rule and form amendments have a compliance date of July 24, 2024. At this time, management is evaluating the impact of these amendments on the shareholder reports for the Fund.
Estimates – The preparation of financial statements in conformity with GAAP requires management to make estimates and assumptions that affect the reported amounts of assets and liabilities and disclosure of contingent assets and liabilities at the date of the financial statements and the reported amounts of increases and decreases in net assets from operations during the reporting period. Actual results could differ from those estimates.
Federal Income Taxes – The Fund makes no provision for federal income or excise tax. The Fund has qualified and intends to qualify each year as a regulated investment
Ballast Small/Mid Cap ETF
Notes to the Financial Statements (continued)
September 30, 2023
company (“RIC”) under subchapter M of the Internal Revenue Code of 1986, as amended, by complying with the requirements applicable to RICs and by distributing substantially all of its taxable income. The Fund also intends to distribute sufficient net investment income and net realized capital gains, if any, so that it will not be subject to excise tax on undistributed income and gains. If the required amount of net investment income or gains is not distributed, the Fund could incur a tax expense.
As of and during the fiscal year ended September 30, 2023, the Fund did not have any liabilities for any unrecognized tax benefits. The Fund recognizes interest and penalties, if any, related to unrecognized tax benefits as income tax expense in the Statement of Operations when incurred. During the year, the Fund did not incur any interest or penalties. Management of the Fund has reviewed tax positions taken in tax years that remain subject to examination by all major tax jurisdictions, including federal (i.e., the previous three tax year ends and the interim tax period since then, as applicable) and has concluded that no provision for unrecognized tax benefits or expenses is required in these financial statements and does not expect this to change over the next twelve months.
Expenses – Expenses incurred by the Trust that do not relate to a specific fund of the Trust are allocated to the individual funds of the Trust based on each fund’s relative net assets or another appropriate basis (as determined by the Board).
Security Transactions and Related Income – The Fund follows industry practice and records security transactions on the trade date for financial reporting purposes. The specific identification method is used for determining gains or losses for financial statements and income tax purposes. Dividend income is recorded on the ex-dividend date and interest income is recorded on an accrual basis. Distributions received from investments in real estate investment trusts (“REITs”) that represent a return of capital or capital gain are recorded as a reduction of the cost of investment or as a realized gain, respectively. The calendar year-end amounts of ordinary income, capital gains, and return of capital included in distributions received from the Fund’s investments in REITs are reported to the Fund after the end of the calendar year; accordingly, the Fund estimates these amounts for accounting purposes until the characterization of REIT distributions is reported. Estimates are based on the most recent REIT distributions information available. Withholding taxes on foreign dividends and related reclaims have been provided for in accordance with the Fund’s understanding of the applicable country’s tax rules and rates. Discounts and premiums on securities purchased are accreted or amortized using the effective interest method.
Dividends and Distributions – The Fund intends to distribute its net investment income and net realized long-term and short-term capital gains, if any, at least annually. Dividends and distributions to shareholders, which are determined in accordance with income tax
Ballast Small/Mid Cap ETF
Notes to the Financial Statements (continued)
September 30, 2023
regulations, are recorded on the ex-dividend date. The treatment for financial reporting purposes of distributions made to shareholders during the period from net investment income or net realized capital gains may differ from their ultimate treatment for federal income tax purposes. These differences are caused primarily by differences in the timing of the recognition of certain components of income, expense or realized capital gain for federal income tax purposes. Where such differences are permanent in nature, they are reclassified among the components of net assets based on their ultimate characterization for federal income tax purposes. Any such reclassifications will have no effect on net assets, results of operations or net asset value (“NAV”) per share of the Fund.
For the fiscal year ended September 30, 2023, the Fund made the following reclassifications to increase (decrease) the components of net assets:
| | | Accumulated Earnings |
| Paid-In Capital | | (Deficit) |
| $2,969,905 | | $(2,969,905) |
NOTE 3. SECURITIES VALUATION AND FAIR VALUE MEASUREMENTS
The Fund values its portfolio securities at fair value as of the close of regular trading on the New York Stock Exchange (“NYSE”) (normally 4:00 p.m. Eastern Time) on each business day the NYSE is open for business. Fair value is defined as the price that the Fund would receive upon selling an investment in a timely transaction to an independent buyer in the principal or most advantageous market of the investment. GAAP establishes a three-tier hierarchy to maximize the use of observable market data and minimize the use of unobservable inputs and to establish classification of fair value measurements for disclosure purposes.
Inputs refer broadly to the assumptions that market participants would use in pricing the asset or liability, including assumptions about risk (the risk inherent in a particular valuation technique used to measure fair value including a pricing model and/or the risk inherent in the inputs to the valuation technique). Inputs may be observable or unobservable. Observable inputs are inputs that reflect the assumptions market participants would use in pricing the asset or liability developed based on market data obtained and available from sources independent of the reporting entity. Unobservable inputs are inputs that reflect the reporting entity’s own assumptions about the assumptions market participants would use in pricing the asset or liability developed based on the best information available in the circumstances.
Ballast Small/Mid Cap ETF
Notes to the Financial Statements (continued)
September 30, 2023
Various inputs are used in determining the value of the Fund’s investments. These inputs are summarized in the three broad levels listed below.
| ● | Level 1 – unadjusted quoted prices in active markets for identical investments and/or registered investment companies where the value per share is determined and published and is the basis for current transactions for identical assets or liabilities at the valuation date |
| ● | Level 2 – other significant observable inputs (including, but not limited to, quoted prices for an identical security in an inactive market, quoted prices for similar securities, interest rates, prepayment speeds, credit risk, etc.) |
| ● | Level 3 – significant unobservable inputs (including the Fund’s own assumptions in determining fair value of investments based on the best information available) |
The inputs used to measure fair value may fall into different levels of the fair value hierarchy. In such cases, for disclosure purposes, the level in the fair value hierarchy which is reported is determined based on the lowest level input that is significant to the fair value measurement in its entirety.
Equity securities that are traded on any stock exchange are generally valued at the last quoted sale price on the security’s primary exchange. Lacking a last sale price, an exchange-traded security is generally valued at its last bid price. Securities traded in the Nasdaq over-the-counter market are generally valued at the Nasdaq Official Closing Price. When using market quotations and when the market is considered active, the security is classified as a Level 1 security. In the event that market quotations are not readily available or are considered unreliable due to market or other events, securities are valued in good faith by the Adviser, as Valuation Designee, under oversight of the Board’s Pricing & Liquidity Committee. The Adviser has adopted written policies and procedures for valuing securities and other assets in circumstances where market quotes are not readily available in conformity with guidelines adopted by the Board. In the event that market quotes are not readily available, and the security or asset cannot be valued pursuant to one of the valuation methods, the value of the security or asset will be determined in good faith by the Valuation Designee pursuant to its policies and procedures. Any fair value provided by the Valuation Designee is subject to the ultimate review of the pricing methodology by the Pricing & Liquidity Committee of the Board on a quarterly basis. Under these policies, the securities will be classified as Level 2 or 3 within the fair value hierarchy, depending on the inputs used.
In accordance with the Trust’s valuation policies and fair value determinations pursuant to Rule 2a-5 under the 1940 Act, the Valuation Designee is required to consider all appropriate
Ballast Small/Mid Cap ETF
Notes to the Financial Statements (continued)
September 30, 2023
factors relevant to the value of securities for which it has determined other pricing sources are not available or reliable as described above. No single method exists for determining fair value because fair value depends upon the circumstances of each individual case. As a general principle, the current fair value of a security being valued by the Valuation Designee would be the amount that the Fund might reasonably expect to receive upon the current sale. Methods that are in accordance with this principle may, for example, be based on (i) a multiple of earnings; (ii) a discount from market prices of a similar freely traded security (including a derivative security or a basket of securities traded on other markets, exchanges or among dealers); or (iii) yield to maturity with respect to debt issues, or a combination of these and other methods. Fair-value pricing is permitted if, in the Valuation Designee’s opinion, the validity of market quotations appears to be questionable based on factors such as evidence of a thin market in the security based on a small number of quotations, a significant event occurs after the close of a market but before the Fund’s NAV calculation that may affect a security’s value, or the Valuation Designee is aware of any other data that calls into question the reliability of market quotations. The Valuation Designee may obtain assistance from others in fulfilling its duties. For example, it may seek assistance from pricing services, fund administrators, sub-advisers, accountants, or counsel; it may also consult the Trust’s Fair Value Committee. The Valuation Designee, however, remains responsible for the final fair value determination and may not designate or assign that responsibility to any third party.
The following is a summary of the inputs used to value the Fund’s investments as of September 30, 2023:
| | | | | | Valuation Inputs | | | | | | | |
| Assets | | Level 1 | | | Level 2 | | | Level 3 | | | Total | |
| Common Stocks (a) | | $ | 109,762,944 | | | $ | — | | | $ | — | | | $ | 109,762,944 | |
| Total | | $ | 109,762,944 | | | $ | — | | | $ | — | | | $ | 109,762,944 | |
| (a) | Refer to Schedule of Investments for sector classifications. |
The Fund did not hold any investments at the end of the reporting period for which significant unobservable inputs (Level 3) were used in determining fair value; therefore, no reconciliation of Level 3 securities is included for this reporting period.
NOTE 4. FEES AND OTHER TRANSACTIONS WITH AFFILIATES AND OTHER SERVICE PROVIDERS
The Adviser, under the terms of the management agreement with the Trust with respect to the Fund (the “Agreement”), manages the Fund’s investments. As compensation for its management services, the Fund is obligated to pay the Adviser a fee computed and accrued daily and paid monthly at an annual rate of 0.95% of the Fund’s average daily net assets.
Ballast Small/Mid Cap ETF
Notes to the Financial Statements (continued)
September 30, 2023
For the fiscal year ended September 30, 2023, before the waiver described below, the Adviser earned a management fee of $722,683 from the Fund.
The Adviser has contractually agreed to waive its management fee and/or reimburse expenses through January 31, 2024 so that total annual operating expenses (excluding portfolio transaction and other investment-related costs (including brokerage fees and commissions); taxes; borrowing costs (such as interest and dividend expenses on securities sold short); acquired fund fees and expenses; fees and expenses associated with investments in other collective investment vehicles or derivative instruments (including for example option and swap fees and expenses); any administrative and/or shareholder servicing fees payable pursuant to a plan adopted by the Board of Trustees; expenses incurred in connection with any merger or reorganization; extraordinary expenses (such as litigation expenses, indemnification of Trust officers and Trustees and contractual indemnification of Fund service providers); and other expenses that the Trustees agree have not been incurred in the ordinary course of the Fund’s business) do not exceed 1.10% of the Fund’s average daily net assets. For the fiscal year ended September 30, 2023, the Adviser waived fees and reimbursed Fund expenses of $118,925. At September 30, 2023, the Fund owed the Adviser $72,497.
Each fee waiver/expense payment by the Adviser is subject to recoupment by the Adviser from the Fund in the three years following the date in which that particular waiver/expense payment occurred, but only if such recoupment can be achieved without exceeding the annual expense limitation in effect at the time of the waiver/expense payment and any expense limitation in effect at the time of the recoupment. As of September 30, 2023 the Adviser may seek repayment of management fees waived and expense reimbursements pursuant to the aforementioned conditions, from the Fund no later than the dates stated below:
| Recoverable Through | | | |
| September 30, 2024 | | $ | 165,632 | |
| September 30, 2025 | | | 147,001 | |
| September 30, 2026 | | | 118,925 | |
Ultimus Fund Solutions, LLC (“Ultimus”) provides administration and fund accounting services to the Fund. The Fund pays Ultimus fees in accordance with the agreements for such services.
Northern Lights Compliance Services, LLC (“NLCS”), an affiliate of Ultimus, provides a Chief Compliance Officer to the Trust, as well as related compliance services, pursuant to a consulting agreement between NLCS and the Trust. Under the terms of such agreement, NLCS receives fees from the Fund, which are approved annually by the Board.
Ballast Small/Mid Cap ETF
Notes to the Financial Statements (continued)
September 30, 2023
Under the terms of a Distribution Agreement with the Trust, Northern Lights Distributors, LLC (the “Distributor”) serves as principal underwriter to the Fund. The Distributor is an affiliate of Ultimus. The Distributor is compensated by the Adviser (not the Fund) for acting as principal underwriter.
Certain officers of the Trust are also employees of Ultimus and such persons are not paid by the Fund for serving in such capacities. One Trustee is a former employee of Ultimus who is not currently paid by the Fund for serving in such capacity.
The Board supervises the business activities of the Trust. Each Trustee serves as a trustee until termination of the Trust unless the Trustee dies, resigns, retires, or is removed. The Chair of the Board and more than 75% of the Trustees are “Independent Trustees,” which means that they are not “interested persons” as defined in the 1940 Act. The Independent Trustees review and establish compensation at least annually. Each Independent Trustee of the Trust receives annual compensation, which is an established amount paid quarterly per fund in the Trust at the time of the regular quarterly Board meetings. The Chair of the Board receives the highest compensation, commensurate with his additional duties and each Chair of a committee receives additional compensation as well. Independent Trustees also receive additional fees for attending any special meeting. In addition, the Trust reimburses Independent Trustees for out-of-pocket expenses incurred in conjunction with attendance at meetings.
NOTE 5. INVESTMENT TRANSACTIONS
For the fiscal year ended September 30, 2023, purchases and sales of investment securities, other than short-term investments, were $21,385,462 and $19,219,984, respectively.
For the fiscal year ended September 30, 2023, purchases and sales for in-kind transactions were $47,568,397 and $9,864,626, respectively.
For the fiscal year ended September 30, 2023, the Fund had in-kind net realized gains of $2,989,943.
There were no purchases or sales of long-term U.S. government obligations during the fiscal year ended September 30, 2023.
NOTE 6. CAPITAL SHARE TRANSACTIONS
Shares are not individually redeemable and may be redeemed by the Fund at NAV only in large blocks known as “Creation Units” of 25,000 shares. Only Authorized Participants or transactions done through an Authorized Participant are permitted to purchase or redeem Creation Units from the Fund. An Authorized Participant is either (i) a broker-dealer or other participant in the clearing process through the Continuous Net Settlement System of
Ballast Small/Mid Cap ETF
Notes to the Financial Statements (continued)
September 30, 2023
the National Securities Clearing Corporation or (ii) a Depository Trust Company participant and, in each case, must have executed a Participant Agreement with the Distributor. Such transactions are generally permitted on an in-kind basis, with a balancing cash component to equate the transaction to the NAV per share of the Fund on the transaction date. Cash may be substituted equivalent to the value of certain securities generally when they are not available in sufficient quantity for delivery, not eligible for trading by the Authorized Participant, or as a result of other market circumstances. In addition, the Fund may impose transaction fees on purchases and redemptions of Fund shares to cover the custodial and other costs incurred by the Fund in effecting trades. A fixed fee payable to the Custodian may be imposed on each creation and redemption transaction regardless of the number of Creation Units involved in the transaction (“Fixed Fee”). Purchases and redemptions of Creation Units for cash or involving cash-in-lieu are required to pay an additional variable charge to compensate the Fund and its ongoing shareholders for brokerage and market impact expenses relating to Creation Unit transactions (“Variable Charge,” and together with the Fixed Fee, the “Transaction Fees”). Transactions in capital shares for the Fund are disclosed in the Statements of Changes in Net Assets. For the fiscal year ended September 30, 2023, the Fund received $8,750 and $0 in fixed fees and variable fees, respectively. The Transaction Fees for the Fund are listed in the table below:
| Fixed Fee | Variable Charge |
| $350 | 2.00%* |
| * | The maximum Transaction Fee may be up to 2.00% of the amount invested. |
NOTE 7. FEDERAL TAX INFORMATION
At September 30, 2023, the net unrealized appreciation (depreciation) and tax cost of investments for tax purposes was as follows:
| Gross unrealized appreciation | | $ | 9,704,895 | |
| Gross unrealized depreciation | | | (9,162,122 | ) |
| Net unrealized appreciation on investments | | $ | 542,773 | |
| Tax cost of investments | | $ | 109,220,171 | |
The tax character of distributions paid for the fiscal years ended September 30, 2023 and September 30, 2022 were as follows:
| | | 2023 | | | 2022 | |
| Distributions paid from: | | | | | | | | |
| Ordinary income(a) | | $ | 593,243 | | | $ | 120,500 | |
| Total distributions paid | | $ | 593,243 | | | $ | 120,500 | |
| (a) | Short-term capital gain distributions are treated as ordinary income for tax purposes. |
Ballast Small/Mid Cap ETF
Notes to the Financial Statements (continued)
September 30, 2023
At September 30, 2023, the components of accumulated earnings (deficit) on a tax basis were as follows:
| Undistributed ordinary income | | $ | 476,010 | |
| Accumulated capital and other losses | | | (8,234,520 | ) |
| Unrealized appreciation on investments | | | 542,773 | |
| Total accumulated deficits | | $ | (7,215,737 | ) |
As of September 30, 2023, the Fund had accumulated short-term capital loss carryforwards of $4,984,580 and long-term capital loss carryforwards of $3,249,940, not subject to expiration.
NOTE 8. COMMITMENTS AND CONTINGENCIES
The Trust indemnifies its officers and Trustees for certain liabilities that may arise from their performance of their duties to the Trust or the Fund. Additionally, in the normal course of business, the Trust enters into contracts that contain a variety of representations and warranties which provide general indemnifications. The Trust’s maximum exposure under these arrangements is unknown, as this would involve future claims that may be made against the Trust that have not yet occurred.
NOTE 9. SUBSEQUENT EVENTS
Management of the Fund has evaluated the need for disclosures and/or adjustments resulting from subsequent events through the date at which these financial statements were issued. Based upon this evaluation, management has determined there were no items requiring adjustment of the financial statements or additional disclosure.
Report of Independent Registered Public Accounting Firm
To the Shareholders of Ballast Small/Mid Cap ETF and
Board of Trustees of Unified Series Trust
Opinion on the Financial Statements
We have audited the accompanying statement of assets and liabilities, including the schedule of investments, of Ballast Small/Mid Cap ETF (the “Fund”), a series of Unified Series Trust, as of September 30, 2023, the related statement of operations for the year then ended, the statements of changes in net assets for each of the two years in the period then ended, the related notes, and the financial highlights for each of the two years in the period then ended and the period from December 2, 2020 (commencement of operations) through September 30, 2021 (collectively referred to as the “financial statements”). In our opinion, the financial statements present fairly, in all material respects, the financial position of the Fund as of September 30, 2023, the results of its operations for the year then ended, the changes in net assets for each of the two years in the period then ended, and the financial highlights for each of the two years in the period then ended and the period from December 2, 2020 (commencement of operations) through September 30, 2021 , in conformity with accounting principles generally accepted in the United States of America.
Basis for Opinion
These financial statements are the responsibility of the Fund’s management. Our responsibility is to express an opinion on the Fund’s financial statements based on our audits. We are a public accounting firm registered with the Public Company Accounting Oversight Board (United States) (“PCAOB”) and are required to be independent with respect to the Fund in accordance with the U.S. federal securities laws and the applicable rules and regulations of the Securities and Exchange Commission and the PCAOB.
We conducted our audits in accordance with the standards of the PCAOB. Those standards require that we plan and perform the audits to obtain reasonable assurance about whether the financial statements are free of material misstatement whether due to error or fraud.
Our audits included performing procedures to assess the risks of material misstatement of the financial statements, whether due to error or fraud, and performing procedures that respond to those risks. Such procedures included examining, on a test basis, evidence regarding the amounts and disclosures in the financial statements. Our procedures included confirmation of securities owned as of September 30, 2023, by correspondence with the custodian and brokers; when replies were not received from brokers, we performed other auditing procedures. Our audits also included evaluating the accounting principles used and significant estimates made by management, as well as evaluating the overall presentation of the financial statements. We believe that our audits provide a reasonable basis for our opinion.
We have served as the Fund’s auditor since 2021.

COHEN & COMPANY, LTD.
Chicago, Illinois
November 22, 2023
Liquidity Risk Management Program (Unaudited)
The Trust has adopted and implemented a written liquidity risk management program (the “Program”) as required by Rule 22e-4 (the “Liquidity Rule”) under the 1940 Act. The Program is reasonably designed to assess and manage the Fund’s liquidity risk of each individual series of the Trust (each a “Fund” and collectively, the “Funds”), taking into consideration, among other factors, the Fund’s investment strategy and the liquidity of its portfolio investments during normal and reasonably foreseeable stressed conditions; its short and long-term cash flow projections; and its cash holdings and access to other funding sources. The Board approved the appointment of the Liquidity Administrator Committee, comprising certain Trust officers and employees of the Adviser. The Liquidity Administrator Committee maintains Program oversight and reports to the Board on at least an annual basis regarding the Program’s operational effectiveness through a written report (the “Report”). The most recent Report, which was presented to the Board for consideration at its meeting held on August 14-15, 2023, outlined the operation of the Program and the adequacy and effectiveness of the Program’s implementation. During the review period, the Funds did not experience unusual stress or disruption to their operations related to purchase and redemption activity. Also, during the review period each Fund held adequate levels of cash and highly liquid investments to meet shareholder redemption activities in accordance with such Fund’s prospectus and within the requirements of the 1940 Act. The Report concluded that the Program is reasonably designed to prevent violation of the Liquidity Rule and has been effectively implemented.
Summary of Fund Expenses (Unaudited)
As a shareholder of the Fund, you incur two types of costs: (1) transaction costs and (2) ongoing costs, including management fees and other Fund expenses. These examples are intended to help you understand your ongoing costs (in dollars) of investing in the Fund and to compare these costs with the ongoing costs of investing in other funds. You may pay brokerage commissions on purchases and sales of exchange-traded fund shares, which are not reflected in the example. The example is based on an investment of $1,000 invested at the beginning of the period and held for the entire period from April 1, 2023 through September 30, 2023.
Actual Expenses
The first line of the table below provides information about actual account values and actual expenses. You may use the information in this line, together with the amount you invested, to estimate the expenses that you paid over the period. Simply divide your account value by $1,000 (for example, an $8,600 account value divided by $1,000 = 8.6), then multiply the result by the number in the first line under the heading “Expenses Paid During Period” to estimate the expenses you paid on your account during this period.
Hypothetical Example for Comparison Purposes
The second line of the table below provides information about hypothetical account values and hypothetical expenses based on the Fund’s actual expense ratio and an assumed rate of return of 5% per year before expenses, which is not the Fund’s actual return. The hypothetical account values and expenses may not be used to estimate the actual ending account balance or expenses you paid for the period. You may use this information to compare the ongoing costs of investing in the Fund and other funds. To do so, compare this 5% hypothetical example with the 5% hypothetical examples that appear in the shareholder reports of other funds.
Expenses shown in the table are meant to highlight your ongoing costs only and do not reflect any transactional costs. Therefore, the second line of the table below is useful in comparing ongoing costs only and will not help you determine the relative total costs of owning different funds. In addition, if transaction costs were included, your costs would have been higher.
| | | Beginning | | Ending | | | | |
| | | Account | | Account | | Expenses | | |
| | | Value | | Value | | Paid | | Annualized |
| | | April 1, | | September | | During | | Expense |
| | | 2023 | | 30, 2023 | | Period(a) | | Ratio |
| | Actual | $1,000.00 | | $1,035.20 | | $5.61 | | 1.10% |
| | Hypothetical(b) | $1,000.00 | | $1,019.55 | | $5.57 | | 1.10% |
| (a) | Expenses are equal to the Fund’s annualized expense ratios, multiplied by the average account value over the period, multiplied by 183/365 (to reflect the one-half year period). |
| (b) | Hypothetical assumes 5% annual return before expenses. |
Additional Federal Income Tax Information (Unaudited)
The Form 1099-DIV you receive in January 2024 will show the tax status of all distributions paid to your account in calendar year 2023. Shareholders are advised to consult their own tax adviser with respect to the tax consequences of their investment in the Fund. As required by the Internal Revenue Code and/or regulations, shareholders must be notified regarding the status of qualified dividend income for individuals and the dividends received deduction for corporations.
Qualified Dividend Income. The Fund designates approximately 100% or up to the maximum amount of such dividends allowable pursuant to the Internal Revenue Code, as qualified dividend income eligible for a reduced tax rate.
Qualified Business Income. The Fund designates approximately 0% of its ordinary income dividends, or up to the maximum amount of such dividends allowable pursuant to the Internal Revenue Code, as qualified business income.
Dividends Received Deduction. Corporate shareholders are generally entitled to take the dividends received deduction on the portion of the Fund’s dividend distribution that qualifies under tax law. For the Fund’s calendar year 2023 ordinary income dividends, 100% qualifies for the corporate dividends received deduction.
Trustees and Officers (Unaudited)
GENERAL QUALIFICATIONS. The Board supervises the business activities of the Trust. Each Trustee serves as a trustee until termination of the Trust unless the Trustee dies, resigns, retires, or is removed. The Chair of the Board and more than 75% of the Trustees are “Independent Trustees”, which means that they are not “interested persons” (as defined in the 1940 Act) of the Trust or any adviser, sub-adviser or distributor of the Trust.
The following table provides information regarding the Independent Trustees.
Name, Address*, (Year of Birth),
Position with Trust**,
Term of Position with Trust | | Principal Occupation During Past 5 Years and Other
Directorships |
Daniel J. Condon (1950)
Chair, May 2022 to present; Chair of the Audit Committee; Chair of the Governance & Nominating Committee, May 2020 to May 2022; Independent Trustee, December 2002 to present | | Current: Retired (2017 – present). Previous: Peak Income Plus Fund (May 2022 – February 2023). |
Kenneth G.Y. Grant (1949)
Chair of the Governance & Nominating Committee, May 2022 to present; Chair, January 2017 to May 2022; Independent Trustee, May 2008 to present | | Current: Director, Standpoint Multi-Asset (Cayman) Fund, Ltd. (2019 – present); Director, Advisors Charitable Gift Fund (2020 – present), a Donor Advised Fund; Trustee. Trustee, Peak Income Plus Fund (May 2022 – present). Previous: EVP, Benefit Plans Administrative Services, Inc., provider of retirement benefit plans administration (2019 – 2020); Director, Northeast Retirement Services (NRS) LLC, a transfer agent and fund administrator; and Director, Global Trust Company (GTC), a non-depository trust company sponsoring private investment products (2003 – 2019); EVP, NRS (2003 – 2019); GTC, EVP (2008 – 2019); EVP, Savings Banks Retirement Association (2003 – 2019), provider of qualified retirement benefit plans. |
Ronald C. Tritschler (1952) Chair of the Audit Committee, May 2022 to present; Independent Trustee, January 2007 to present; Interested Trustee, December 2002 to December 2006 | | Current: Chief Executive Officer, Director and Legal Counsel of The Webb Companies, a national real estate company, (2001– present); Director, Standpoint Multi-Asset (Cayman) Fund, Ltd. (2020 – present); Director of First State Bank of the Southeast (2000 – present). Previous: Trustee, Peak Income Plus Fund (May 2022 – February 2023). |
Catharine B. McGauley (1977)
Chair of the Pricing & Liquidity Committee, November 2022 to present; Independent Trustee, September 2022 to present | | Current: Lead Portfolio Manager of Atlantic Charter Insurance, a workers’ compensation insurer, (2010 – present); Investment Advisor for a Family Office (2015 – present); Senior Analyst/Advisor for a Boston real estate company and related family (2010 – present). Previous: Trustee, Peak Income Plus Fund (May 2022 – February 2023). |
Freddie Jacobs, Jr. (1970)
Independent Trustee, September 2022 to present | | Current: Chief Operating Officer and Chief Risk Officer Northeast Retirement Services LLC (NRS), and its subsidiary, Global Trust Company (GTC). NRS is a transfer agent and fund administrator, GTC is a non-depository trust company sponsoring private investment products (2021 – present); Chair, Board of Crispus Attucks Fund (2020 – present); Board Member of Camp Harbor View (2020 – present); Director, Sportsmen’s Tennis and Education Center (2019 – present). Previous: SVP, Senior Risk Officer NRS (2013 – 2021); Trustee, Peak Income Plus Fund (May 2022 – February 2023); Trustee of Buckingham Browne & Nichols (2017 - June 2023). |
| * | The address for each Trustee is 225 Pictoria Drive, Suite 450, Cincinnati, Ohio 45246. |
| ** | As of the date of this report, the Trust consists of 29 series. |
Trustees and Officers (Unaudited) (continued)
The following table provides information regarding the Interested Trustees and Officers of the Trust.
Name, Address*, (Year of Birth),
Position with Trust,
Term of Position with Trust | | Principal Occupation During Past 5 Years and Other
Directorships |
David R. Carson (1958)
Interested Trustee, August 2020 to present; President, January 2016 to August 2021 | | Current: Retired (2023 – present); Interested Trustee, Mammoth Institutional Credit Access Fund and Mammoth Institutional Equity Access Fund (November 2022 – present); Interested Trustee, Peak Income Plus Fund (May 2022 – present). Previous: Interested Trustee of Ultimus Managers Trust, (January 2021 – April 2023); Senior Vice President Client Strategies of Ultimus Fund Solutions, LLC, (2013 – April 2023). |
Martin R. Dean (1963)
President, August 2021 to present; Vice President, November 2020 to August 2021; Chief Compliance Officer, April 2021 to August 2021; Assistant Chief Compliance Officer, January 2016 to April 2021 | | Current: President, Northern Lights Compliance Services (2023 – present). Previous: Senior Vice President, Head of Fund Compliance of Ultimus Fund Solutions, LLC (2016 – January 2023). |
Zachary P. Richmond (1980)
Treasurer and Chief Financial Officer, November 2014 to present | | Current: Vice President, Director of Financial Administration for Ultimus Fund Solutions, LLC, (2015 – present). |
Gweneth K. Gosselink (1955)
Chief Compliance Officer, August 2021 to present | | Current: Vice President, Senior Compliance Officer of Ultimus Fund Solutions, LLC, since 2019. Previous: Chief Operating Officer & CCO at Miles Capital, Inc. (2013 – 2019). |
Elisabeth Dahl (1962)
Secretary, May 2017 to present; Assistant Secretary, March 2016 to May 2017 | | Current: Attorney, Ultimus Fund Solutions, LLC since March 2016. |
Timothy J. Shaloo (1970)
AML Compliance Officer, August 2023 to present | | Current: AVP, Compliance Officer, Northern Lights Compliance Services, LLC (2021 – present). Previous: Compliance Specialist, Ultimus Fund Solutions, LLC (2016 – 2020). |
| * | The address for each Officer is 225 Pictoria Drive, Suite 450, Cincinnati, Ohio 45246. |
Other Information (Unaudited)
The Fund’s Statement of Additional Information (“SAI”) includes additional information about the trustees and is available without charge, upon request. You may call toll-free at (866) 383-6468 to request a copy of the SAI or to make shareholder inquiries.
Proxy Voting
A description of the policies and procedures that the Fund uses to determine how to vote proxies relating to portfolio securities and information regarding how the Fund voted those proxies during the most recent twelve month period ended June 30, are available (1) without charge upon request by calling the Fund at (866) 383-6468 and (2) in Fund documents filed with the SEC on the SEC’s website at www.sec.gov.
TRUSTEES
Daniel J. Condon, Chair
David R. Carson
Kenneth G.Y. Grant
Freddie Jacobs, Jr.
Catharine B. McGauley
Ronald C. Tritschler | INDEPENDENT REGISTERED
PUBLIC ACCOUNTING FIRM
Cohen & Company, Ltd.
151 North Franklin Street, Suite 575
Chicago, IL 60606 |
| | |
OFFICERS
Martin R. Dean, President
Gweneth K. Gosselink, Chief Compliance Officer
Zachary P. Richmond, Treasurer and Chief Financial Officer | LEGAL COUNSEL
Thompson Hine LLP
312 Walnut Street, 20th Floor
Cincinnati, OH 45202 |
| | |
INVESTMENT ADVISER
Ballast Asset Management, LP
2301 Cedar Springs Road, Suite 450
Dallas, TX 75201 | CUSTODIAN
Brown Brothers Harriman & Co.
50 Post Office Square
Boston, MA 02110 |
| | |
DISTRIBUTOR
Northern Lights Distributors, LLC
4221 North 203rd Street, Suite 100
Elkhorn, NE 68022 | ADMINISTRATOR
Ultimus Fund Solutions, LLC
225 Pictoria Drive, Suite 450
Cincinnati, OH 45246 |
This report is intended only for the information of shareholders or those who have received the Fund’s prospectus which contains information about the Fund’s management fee and expenses. Please read the prospectus carefully before investing.
Distributed by Northern Lights Distributors, LLC Member FINRA/SIPC
Ballast Small-AR-23
| |
| |
| |
| |
| |
 |
| |
| |
| |
| |
| |
| |
| |
| |
| |
| |
| Channel Short Duration Income Fund |
| |
| |
| |
| |
| |
| Annual Report |
| |
| September 30, 2023 |
| |
| |
| |
| |
| |
| |
| |
| |
| |
| |
| Fund Adviser: |
Channel Investment Partners LLC
3033 Wilson Boulevard, Suite 700
Arlington, VA 22201
Toll Free (877) 627-8504 |
Channel Short Duration Income Fund
Management’s Discussion of Fund Performance (Unaudited)
September 30, 2023
Dear Shareholders:
Market Review
“Hit me with your best shot
Why don’t you hit me with your best shot
Hit me with your best shot
Fire away”
The famous Pat Benatar chorus from her hit song “Hit Me with Your Best Shot,” We are sure, was never meant to describe the US consumer and Congressional spending supporting economic growth but here we are. A resilient consumer, flush with trillions in stimulus dollars, remained strong over the last year to defy broad predictions of a 2023 recession. Stimulus proved to be far more than needed as the flexible workforce adapted post Covid shutdowns to remain productive and the Federal Reserve far behind the curve in slowing rampant inflation. The Federal Reserve (“Fed”) raised interest rates from 0% in January 2022 to between 4.75-5.00% in March 2023 before pausing, then raising a couple more times before pausing between 5.25-5.50% in July 2023. Quantitative tightening (QT), the program of Fed balance sheet reduction, is also ongoing. US GDP remains strong while the US Treasury continues to run record deficits. We continue to be in a “Mexican standoff” between the Federal Reserve and those, mainly Congress, that want to spend more and more money beyond what is sustainable.
The Fed is hitting with their “best shot” to orchestrate an economic “soft landing” yet the effects are slow to work through the economy. We have long maintained the Fed’s approach to slowing the economy is wrong through stale interest rate models and too much communication. Also, the last tool used should be the first one unwound which, in this case, is Quantitative Tightening (QT) as the counter to Quantitative Easing (QE). One of the reasons the economy and inflation has remained far more resilient than expected is because the market pricing of a near-term recession kept intermediate and long US Treasury yields lower for longer. Many loans made based on the 10-year US treasury note (i.e., mortgages, construction loans, etc.) did not feel the effects of the front-end Fed hikes as the treasury curve inverted and remained inverted. Only recently, when the market accepted a recession is not happening in 2023, did interest rates rise and, ironically, start to tighten lending standards and loan demand to slow the economy.
Channel Short Duration Income Fund
Management’s Discussion of Fund Performance (Unaudited) (continued)
September 30, 2023
The market swings of Fed rate expectations, pace of QT, and expected Treasury debt issuance have reduced market liquidity and investor reluctance to extend duration out the treasury curve, aka term premium. The unprecedented negative total returns for much of 2023 in the treasury market for a third straight year has investors cautious while history says there is great opportunity in extending duration now.
The 2 year US treasury note is mostly anchored to the federal funds rate. The 2-5 year US treasury note curve is a good gauge of expected federal funds rates as the 5 year note has historically been the most sensitive part of the treasury curve to expected rates. It was inverted as little as -0.14% on 10/11/22, further inverted as much as -0.78% on 7/19/23, and settled at - 0.44% on 9/30/23. Historically, an inverted yield curve means the economy’s growth, as measured by GDP, has peaked without additional fiscal stimulus and the federal funds rate is restrictive.
There is a misconception that recessions start with an inverted yield curve. The yield curve is more of a predictive tool and the treasury curve starts to normalize, steepen, once the economy enters a recession due to Fed rate cuts. Most of the yield curve remained inverted for the fund year which served, ironically, as less restrictive to the economy with so much financing in “the real world” happening based on the 10 year treasury note yield. The 2-10 year US treasury note difference averaged -0.70% over the fund year meaning the Federal Reserve needed to raise rates and/or increase QT to impact the most meaningful corporate and consumer financing rates.
Corporate investment grade credit spreads, an area of focus for us, became less volatile as investors piled in to support issuances from corporations wisely using proceeds to deliver, make acquisitions, and/or adjust their capital structures. The weighted average spread of the Bloomberg US Credit Index on 9/30/22 was +159 basis points (bps) and compressed to +121 bps on 9/30/23, quickly rebounding back from the March 2023 widening on regional bank default concerns. To start the Channel Short Duration Income Fund’s (the “Fund”) fiscal year, 9/30/22, the 5 year and 10 year US treasuries yielded 4.09% and 3.83%, respectively. To finish the Fund’s fiscal year on 9/30/23, those same two maturity notes yielded 4.61% and 4.57%, respectively. We believe the Fed’s “best shot” has yet to play out but history says we are more likely to experience another boom and bust than a “soft landing” from Fed policy.
Portfolio Overview
The Channel Short Duration Income Fund (the “Fund”) maintained higher than benchmark corporate credit exposure as we saw opportunity for spread compression to drive capital
Channel Short Duration Income Fund
Management’s Discussion of Fund Performance (Unaudited) (continued)
September 30, 2023
appreciation while receiving relatively attractive coupon income. More specifically, oversold credits like banks, energy, and airline debt, fundamental credit improvement and deleveraging situations in telecommunications, media, energy, and insurance, and short dated high yield debt were prominent holdings in the Fund. The Fund avoided consumer cyclical, transportation, and technology debt as pricing did not offer much value for the risks. Channel Investment Partner’s general view was that corporate credit is for holding and US treasuries are for trading in the previous and current market. We did not see a recession in 2023 as likely, unlike many others,
primarily due to still available stimulative low rates 5 years and longer due to investor demand. The portfolio was positioned accordingly based on risk/reward opportunities.
Performance
For the 12-month period ended September 30, 2023, the Fund’s total return was 8.94%, net of fees. This compares to the Bloomberg U.S. 1-5 year Government/Credit Bond Index total return of 2.62% for the same period. For additional comparison, the Bloomberg U.S. Intermediate Government/Credit Bond Index total return was 2.20% over the same period. A higher concentration of investment grade credit risk along with some high yield credit risk contributed to strong absolute performance while Fund expenses detracted from relative performance. The average duration of the Fund’s portfolio relative to the respective benchmarks also contributed modestly to comparative outperformance. An active US treasury systematic rates trading strategy also contributed to the Fund’s total
Investment Results (Unaudited)
Average Annual Total Returns* as of September 30, 2023
| | One Year | | Five Year | | Ten Year |
| Channel Short Duration Income Fund | 8.94% | | 3.28% | | 2.31% |
| Bloomberg U.S. 1-5 Year Government/Credit Bond Index(a) | 2.62% | | 1.14% | | 1.10% |
| Bloomberg U.S. Intermediate Government/Credit Bond Index(b) | 2.20% | | 1.02% | | 1.27% |
Total annual operating expenses as disclosed in the Channel Short Duration Income Fund (the “Fund”) prospectus dated January 28, 2023 were 1.15% of average daily net assets (0.95% after fee waivers/expense reimbursement by Channel Investment Partners LLC (the “Adviser”)). The Adviser has contractually agreed to waive its management fee and to the extent necessary, reimburse certain Fund operating expenses through January 31, 2024 so that the total annual operating expenses, excluding portfolio transaction and other investment-related costs (including brokerage fees and commissions); taxes; borrowing costs (such as interest and dividend expenses on securities sold short); acquired fund fees and expenses; fees and expenses associated with investments in other collective investment vehicles or derivative instruments (including for example option and swap fees and expenses); any amounts payable pursuant to a distribution or service plan adopted in accordance with Rule 12b-1 under the Investment Company Act of 1940; any administrative and/or shareholder servicing fees payable pursuant to a plan adopted by the Board; expenses incurred in connection with any merger or reorganization; extraordinary expenses (such as litigation expenses, indemnification of Trust officers and Trustees and contractual indemnification of Fund service providers); and other expenses that the Trustees agree have not been incurred in the ordinary course of the Fund’s business, do not exceed 0.95% of the Fund’s average daily net assets. This expense cap may not be terminated prior to this date except by the Board upon sixty (60) days’ written notice to the Adviser. Each waiver/expense payment by the Adviser is subject to recoupment by the Adviser from the Fund in the three years following the date the particular waiver/expense payment occurred, but only if such recoupment can be achieved without exceeding the annual expense limitation in effect at the time of the waiver/expense payment and any expense limitation in effect at the time of the recoupment. Additional information pertaining to the Fund’s expense ratios as of September 30, 2023 can be found in the financial highlights.
The performance quoted represents past performance, which does not guarantee future results. The investment return and principal value of an investment will fluctuate so that an investor’s shares, when redeemed, may be worth more or less than their original cost. The returns shown do not reflect deduction of taxes that a shareholder would pay on Fund distributions or the redemption of Fund shares. Current performance of the Fund may be lower or higher than the performance quoted. The Fund’s investment objectives, risks, charges and expenses should be considered carefully before investing. Performance data current to the most recent month-end may be obtained by calling (877) 627-8504.
| * | Return figures reflect any change in price per share and assume the reinvestment of all distributions. The Fund’s returns reflect any fee reductions during the applicable periods. If such fee reductions had not occurred, the quoted performance would have been lower. |
| (a) | The Bloomberg U.S. 1-5 Year Government/Credit Bond Index (the “U.S. 1-5 Year Government/ Credit Bond Index”) is a widely recognized unmanaged index of bond prices and is representative of a broader market and range of securities than is found in the Fund’s portfolio. The U.S. 1-5 Year Government/Credit Bond Index measures the performance of U.S. dollar-denominated U.S. Treasury bonds, government related bonds and investment grade U.S. corporate bonds that have a |
Investment Results (Unaudited) (continued)
remaining maturity of greater than or equal to one year and less than five years.
| (b) | The Bloomberg U.S. Intermediate Government/Credit Bond Index (the “U.S. Intermediate Government/Credit Bond Index”) is a widely recognized unmanaged index of bond prices and is representative of a broader market and range of securities than is found in the Fund’s portfolio. The U.S. Intermediate Government/Credit Bond Index measures the performance of U.S. Dollar-denominated U.S. Treasury bonds, government-related bonds and investment grade U.S. corporate bonds that have a remaining maturity of greater than one year and less than ten years. The U.S. |
Intermediate Government/Credit Bond Index assumes reinvestment of all distributions and excludes the effect of taxes and fees. Individuals cannot invest directly in the U.S. Intermediate Government/ Credit Bond Index; however, an individual may invest in exchange-traded funds or other investment vehicles that attempt to track the performance of a benchmark index
You should consider the Fund’s investment objectives, risks, charges and expenses carefully before investing. The Fund’s prospectus contains important information about the Fund’s investment objectives, potential risks, management fees, charges and expenses, and other information and should be read carefully before investing. You may obtain a current copy of the Fund’s prospectus or performance data current to the most recent month-end by calling (877) 627-8504.
Investment Results (Unaudited) (continued)
Comparison of the Growth of a $10,000 Investment in the Channel Short Duration Income Fund, Bloomberg U.S. 1-5 Year Government/Credit Bond Index and the Bloomberg U.S. Intermediate Government/Credit Bond Index®
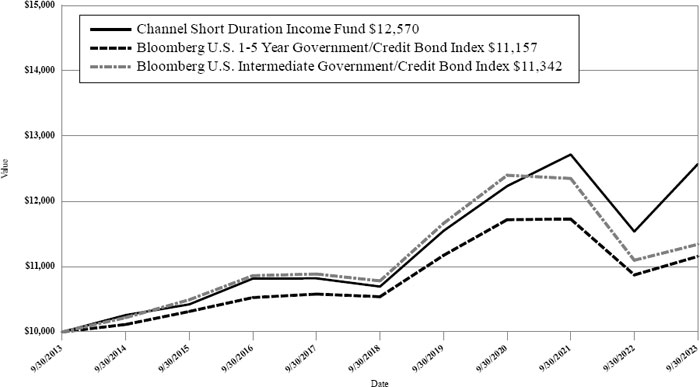
This graph shows the value of a hypothetical initial investment of $10,000 made on September 30, 2013 for the Fund and held through September 30, 2023. The Bloomberg U.S. 1-5 Year Government/ Credit Bond Index and the Bloomberg U.S. Intermediate Government/Credit Bond Index are widely recognized unmanaged indices of bond prices and are representative of a broader market and range of securities than is found in the Fund’s portfolio. Individuals cannot invest directly in the index; however, an individual may invest in exchange-traded funds or other investment vehicles that attempt to track the performance of a benchmark index. THE FUND’S RETURNS REPRESENTS PAST PERFORMANCE AND DO NOT GUARANTEE FUTURE RESULTS. The returns shown do not reflect deduction of taxes that a shareholder would pay on Fund distributions or the redemption of Fund shares. Investment returns and principal values will fluctuate so that your shares, when redeemed, may be worth more or less than their original cost.
Current performance may be lower or higher than the performance data quoted. For more information on the Fund, and to obtain performance data current to the most recent month-end, or to request a prospectus, please call (877) 627-8504. You should carefully consider the investment objectives, potential risks, management fees, and charges and expenses of the Fund before investing. The Fund’s prospectus contains this and other information about the Fund and should be read carefully before investing.
The Fund is distributed by Ultimus Fund Distributors, LLC, Member FINRA/SIPC.
FUND HOLDINGS (Unaudited)
Channel Short Duration Income Fund Holdings as of September 30, 2023*
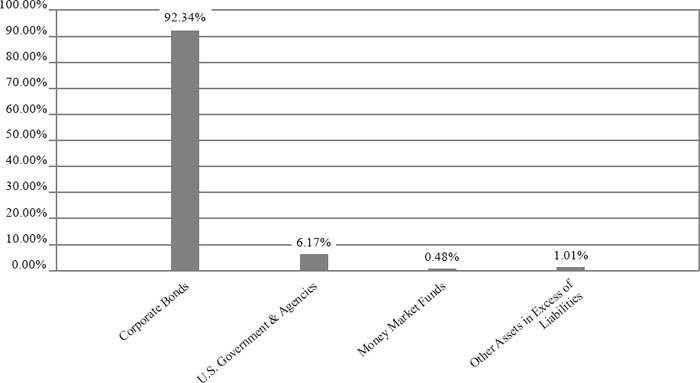
| * | As a percentage of net assets. |
The investment objective of the Channel Short Duration Income Fund is total return, comprised of both income and capital appreciation.
Portfolio holdings are subject to change.
AVAILABILITY OF PORTFOLIO SCHEDULE (Unaudited)
The Fund files its complete schedule of portfolio holdings with the Securities and Exchange Commission (the “SEC”) for the first and third quarters of each fiscal year as an exhibit to its reports on Form N-PORT. The Fund’s Form N-PORT reports are available on the SEC’s website at www.sec.gov.
| Channel Short Duration Income Fund |
| Schedule of Investments |
| September 30, 2023 |
| | | Principal | | | | |
| | | Amount | | | Fair Value | |
| CORPORATE BONDS — 92.34% | | | | | | | | |
| Corporate Bonds - Domestic — 89.44% | | | | | | | | |
| Ally Financial, Inc., 1.45%, 10/2/2023 | | $ | 750,000 | | | $ | 750,000 | |
| American Airlines Pass Through Trust, Series 2017-2, 3.70%, 10/15/2025 | | | 370,852 | | | | 353,108 | |
| American Airlines Pass Through Trust, Series 2016-3, 3.75%, 10/15/2025 | | | 1,065,809 | | | | 1,001,998 | |
| American Airlines Pass Through Trust, Series 2016-2, 3.65%, 12/15/2029 | | | 975,800 | | | | 848,645 | |
| American Electric Power Company, Inc., 5.70%, 8/15/2025 | | | 700,000 | | | | 696,510 | |
| Apache Corp, 4.38%, 10/15/2028 | | | 750,000 | | | | 679,351 | |
| AT&T Inc, 4.35%, 3/1/2029 (FIXED) | | | 350,000 | | | | 325,933 | |
| B&G Foods, Inc., 5.25%, 9/15/2027 | | | 400,000 | | | | 335,333 | |
| Bank of America Corp., 3.56%, 4/23/2027 | | | 400,000 | | | | 375,415 | |
| Callon Petroleum Co., 6.38%, 7/1/2026 | | | 500,000 | | | | 491,061 | |
| Celanese US Holdings LLC, 6.33%, 7/15/2029 | | | 600,000 | | | | 588,402 | |
| Charles Schwab Corp./The, 6.14%, 8/24/2034 | | | 500,000 | | | | 486,178 | |
| Cheniere Energy Partners LP, 4.50%, 10/1/2029 | | | 1,000,000 | | | | 905,778 | |
| Comerica, Inc., 2.50%, 7/23/2024 | | | 1,200,000 | | | | 1,148,353 | |
| Comerica, Inc., 4.00%, 7/27/2025 | | | 300,000 | | | | 280,427 | |
| Continental Airlines Pass Through Trust, Series 2012-2 A, 4.00%, 10/29/2024 | | | 1,478,487 | | | | 1,438,962 | |
| CoreCivic, Inc., 8.25%, 4/15/2026 | | | 500,000 | | | | 507,844 | |
| DCP Midstream Operating LP, 5.38%, 7/15/2025 | | | 600,000 | | | | 591,950 | |
| Delta Air Lines, Inc., Series 2019-1, 3.20%, 4/25/2024 | | | 400,000 | | | | 392,495 | |
| Deutsche Bank AG/New York NY, 3.96%, 11/26/2025 (SOFRRATE + 258bps) | | | 350,000 | | | | 337,968 | |
| Discovery Communications LLC, 4.13%, 5/15/2029 | | | 500,000 | | | | 446,222 | |
| DISH DBS Corp., 5.88%, 11/15/2024 | | | 600,000 | | | | 559,161 | |
| Edison International, 5.38%, 9/15/2069 (3MO LIBOR + 370bps) | | | 700,000 | | | | 622,127 | |
| Enable Midstream Partners LP, 4.95%, 5/15/2028 (FIXED) | | | 500,000 | | | | 478,397 | |
| Energy Transfer LP, 6.50%, 11/15/2167 (3MO LIBOR + 465bps)(a) | | | 1,000,000 | | | | 921,239 | |
| EQT Corp., 5.70%, 4/1/2028 | | | 750,000 | | | | 735,565 | |
| First Horizon Bank, 5.75%, 5/1/2030 | | | 330,000 | | | | 294,150 | |
| Genworth Holdings, Inc., 7.32%, 11/15/2036 (3MO LIBOR + 200bps) | | | 2,500,000 | | | | 1,687,797 | |
| Goldman Sachs Group, Inc./The, 0.93%, 10/21/2024 (SOFRRATE + 49bps)(a) | | | 500,000 | | | | 496,224 | |
| Gulfport Energy Corp., 8.00%, 5/17/2026 | | | 500,000 | | | | 500,960 | |
| iHeartCommunications, Inc., 8.38%, 5/1/2027 | | | 750,000 | | | | 539,288 | |
| KeyBank NA, 5.63%, 6/14/2024 (SOFRRATE + 32bps)(a) | | | 800,000 | | | | 788,683 | |
| KeyBank NA, 3.30%, 6/1/2025 | | | 750,000 | | | | 703,788 | |
| Occidental Petroleum Corp., 7.20%, 3/15/2029 | | | 250,000 | | | | 257,410 | |
| Occidental Petroleum Corp., 8.50%, 7/15/2027 | | | 500,000 | | | | 535,860 | |
| Ovintiv, Inc., 5.65%, 5/15/2028 | | | 500,000 | | | | 489,285 | |
| ProAssurance Corp., 5.30%, 11/15/2023 | | | 250,000 | | | | 249,771 | |
| Sprint Capital Corp., 6.88%, 11/15/2028 | | | 600,000 | | | | 620,231 | |
| Synovus Bank/Columbus GA, 5.63%, 2/15/2028 | | | 500,000 | | | | 451,801 | |
| T-Mobile USA, Inc., 2.63%, 2/15/2029 | | | 300,000 | | | | 254,470 | |
| Truist Bank, Series J, 3.80%, 10/30/2026 | | | 500,000 | | | | 459,588 | |
| United Airlines Pass Through Trust, Series 2013-1, 4.30%, 8/15/2025 | | | 138,313 | | | | 132,737 | |
| United Airlines Pass Through Trust, Series 2014-1, 4.00%, 4/11/2026 | | | 730,352 | | | | 691,983 | |
| United Airlines Pass Through Trust, Series 2014-2, 3.75%, 9/3/2026 | | | 885,336 | | | | 825,912 | |
| | | | | | | | | |
See accompanying notes which are an integral part of these financial statements.
| Channel Short Duration Income Fund |
| Schedule of Investments (continued) |
| September 30, 2023 |
| | | Principal | | | | |
| | | Amount | | | Fair Value | |
| CORPORATE BONDS — 92.34% - continued | | | | | | | | |
| Corporate Bonds - Domestic — 89.44% - continued | | | | | | | | |
| United Airlines Pass Through Trust, Series 2020-1, 5.88%, 4/15/2029 | | $ | 409,700 | | | $ | 406,123 | |
| US Airways Pass Through Trust, Series 13-1, 3.95%, 11/15/2025 | | | 411,018 | | | | 389,059 | |
| Western Midstream Operating LP, 4.50%, 3/1/2028 | | | 350,000 | | | | 325,683 | |
| | | | | | | | | |
| TOTAL CORPORATE BONDS — DOMESTIC (Cost $27,542,582) | | | | | | | 27,399,225 | |
| | | | | | | | | |
| Corporate Bonds - Foreign — 2.90% | | | | | | | | |
| Corporate Bonds - Ireland — 1.61% | | | | | | | | |
| AerCap Ireland Capital DAC, 6.15%, 9/30/2030 | | | 500,000 | | | | 493,248 | |
| | | | | | | | | |
| Corporate Bonds - Switzerland — 1.29% | | | | | | | | |
| Credit Suisse AG, 4.75%, 8/9/2024 | | | 400,000 | | | | 394,512 | |
| | | | | | | | | |
| TOTAL CORPORATE BONDS — FOREIGN (Cost $879,025) | | | | | | | 887,760 | |
| | | | | | | | | |
| TOTAL CORPORATE BONDS (Cost $28,421,607) | | | | | | | 28,286,985 | |
| | | | | | | | | |
| U.S. GOVERNMENT & AGENCIES — 6.17% | | | | | | | | |
| United States Treasury Note, 3.88%, 8/15/2033 | | | 2,000,000 | | | | 1,890,000 | |
| TOTAL U.S. GOVERNMENT & AGENCIES (Cost $1,928,784) | | | | | | | 1,890,000 | |
| | | | | | | | | |
| | | Shares | | | | | |
| MONEY MARKET FUNDS — 0.48% | | | | | | | | |
| Fidelity Investments Money Market Government Portfolio, Class I, 5.23%(b) | | | 145,927 | | | | 145,927 | |
| | | | | | | | | |
| TOTAL MONEY MARKET FUNDS (Cost $145,927) | | | | | | | 145,927 | |
| | | | | | | | | |
| TOTAL INVESTMENTS — 98.99% (Cost $30,496,318) | | | | | | | 30,322,912 | |
| | | | | | | | | |
| Other Assets in Excess of Liabilities — 1.01% | | | | | | | 309,369 | |
| | | | | | | | | |
| NET ASSETS — 100.00% | | | | | | $ | 30,632,281 | |
| (a) | Variable rate security. The rate shown is the effective interest rate as of September 30, 2023. The benchmark on which the rate is calculated is shown parenthetically. |
| (b) | Rate disclosed is the seven day effective yield as of September 30, 2023. |
See accompanying notes which are an integral part of these financial statements.
| Channel Short Duration Income Fund |
| Statement of Assets and Liabilities |
| September 30, 2023 |
| Assets | | | | |
| Investments in securities at fair value (cost $30,496,318) | | $ | 30,322,912 | |
| Receivable for investments sold | | | 9,387,716 | |
| Dividends and interest receivable | | | 437,514 | |
| Prepaid expenses | | | 12,034 | |
| Total Assets | | | 40,160,176 | |
| | | | | |
| Liabilities | | | | |
| Payable for fund shares redeemed | | | 1,299 | |
| Payable for investments purchased | | | 9,340,730 | |
| Payable for distribution to shareholders | | | 138,055 | |
| Payable to Adviser | | | 5,327 | |
| Payable to Administrator | | | 8,098 | |
| Other accrued expenses | | | 34,386 | |
| Total Liabilities | | | 9,527,895 | |
| | | | | |
| Net Assets | | $ | 30,632,281 | |
| Net Assets consist of: | | | | |
| Paid-in capital | | $ | 33,306,794 | |
| Accumulated deficit | | | (2,674,513 | ) |
| Net Assets | | $ | 30,632,281 | |
| Shares outstanding (unlimited number of shares authorized, no par value) | | | 3,270,358 | |
| Net asset value (“NAV”), offering and redemption price per share(a) | | $ | 9.37 | |
| (a) | The Fund charges a 1.00% redemption fee on shares redeemed within 60 days or less of purchase. Shares are redeemed at the NAV if held longer than 60 calendar days. |
See accompanying notes which are an integral part of these financial statements.
| Channel Short Duration Income Fund |
| Statement of Operations |
| For the year ended September 30, 2023 |
| Investment Income | | | | |
| Interest income | | $ | 1,981,087 | |
| Dividend income | | | 21,283 | |
| Total investment income | | | 2,002,370 | |
| | | | | |
| Expenses | | | | |
| Adviser | | | 123,204 | |
| Custodian | | | 33,018 | |
| Fund accounting | | | 28,690 | |
| Administration | | | 23,416 | |
| Legal | | | 22,940 | |
| Registration | | | 22,007 | |
| Audit and tax preparation | | | 18,911 | |
| Trustee | | | 17,965 | |
| Transfer agent | | | 12,300 | |
| Compliance services | | | 12,000 | |
| Pricing | | | 7,950 | |
| Report printing | | | 7,156 | |
| Insurance | | | 2,884 | |
| Miscellaneous | | | 30,178 | |
| Total expenses | | | 362,619 | |
| Fees waived by Adviser | | | (69,992 | ) |
| Net operating expenses | | | 292,627 | |
| Net investment income | | | 1,709,743 | |
| | | | | |
| Net Realized and Change in Unrealized Gain (Loss) on Investments | | | | |
| Net realized loss on investment securities transactions | | | (900,164 | ) |
| Net change in unrealized appreciation of investment securities | | | 1,829,018 | |
| Net realized and change in unrealized gain on investments | | | 928,854 | |
| Net increase in net assets resulting from operations | | $ | 2,638,597 | |
See accompanying notes which are an integral part of these financial statements.
| Channel Short Duration Income Fund |
| Statements of Changes in Net Assets |
| | | For the | | | For the | |
| | | Year Ended | | | Year Ended | |
| | | September 30, | | | September 30, | |
| | | 2023 | | | 2022 | |
| Increase (Decrease) in Net Assets due to: | | | | | | | | |
| Operations | | | | | | | | |
| Net investment income | | $ | 1,709,743 | | | $ | 791,790 | |
| Net realized loss on investment securities transactions | | | (900,164 | ) | | | (1,535,606 | ) |
| Net change in unrealized appreciation (depreciation) of investment securities | | | 1,829,018 | | | | (2,348,604 | ) |
| Net increase (decrease) in net assets resulting from operations | | | 2,638,597 | | | | (3,092,420 | ) |
| | | | | | | | | |
| Distributions to Shareholders From: | | | | | | | | |
| Earnings | | | (1,700,980 | ) | | | (1,430,656 | ) |
| Total distributions | | | (1,700,980 | ) | | | (1,430,656 | ) |
| | | | | | | | | |
| Capital Transactions | | | | | | | | |
| Proceeds from shares sold | | | 2,374,802 | | | | 5,660,390 | |
| Reinvestment of distributions | | | 89,953 | | | | 155,647 | |
| Amount paid for shares redeemed | | | (2,751,222 | ) | | | (3,697,533 | ) |
| Net increase (decrease) in net assets resulting from capital transactions | | | (286,467 | ) | | | 2,118,504 | |
| Total Increase (Decrease) in Net Assets | | | 651,150 | | | | (2,404,572 | ) |
| | | | | | | | | |
| Net Assets | | | | | | | | |
| Beginning of year | | | 29,981,131 | | | | 32,385,703 | |
| End of year | | $ | 30,632,281 | | | $ | 29,981,131 | |
| | | | | | | | | |
| Share Transactions | | | | | | | | |
| Shares sold | | | 253,909 | | | | 564,467 | |
| Shares issued in reinvestment of distributions | | | 9,590 | | | | 15,787 | |
| Shares redeemed | | | (293,185 | ) | | | (374,447 | ) |
| Net increase (decrease) in shares outstanding | | | (29,686 | ) | | | 205,807 | |
See accompanying notes which are an integral part of these financial statements.
| Channel Short Duration Income Fund |
| Financial Highlights |
| (For a share outstanding during each year) |
| | | For the | | | For the | | | For the | | | For the | | | For the | |
| | | Year Ended | | | Year Ended | | | Year Ended | | | Year Ended | | | Year Ended | |
| | | September | | | September | | | September | | | September | | | September | |
| | | 30, 2023 | | | 30, 2022 | | | 30, 2021 | | | 30, 2020 | | | 30, 2019 | |
| Selected Per Share Data: | | | | | | | | | | | | | | | | | | | | |
| Net asset value, beginning of year | | $ | 9.09 | | | $ | 10.47 | | | $ | 11.04 | | | $ | 10.62 | | | $ | 10.05 | |
| | | | | | | | | | | | | | | | | | | | | |
| Investment operations: | | | | | | | | | | | | | | | | | | | | |
| Net investment income | | | 0.52 | | | | 0.24 | | | | 0.17 | | | | 0.19 | | | | 0.22 | |
| Net realized and unrealized gain (loss) | | | 0.28 | | | | (1.19 | ) | | | 0.24 | | | | 0.43 | | | | 0.57 | |
| Total from investment operations | | | 0.80 | | | | (0.95 | ) | | | 0.41 | | | | 0.62 | | | | 0.79 | |
| | | | | | | | | | | | | | | | | | | | | |
| Less distributions to shareholders from: | | | | | | | | | | | | | | | | | | | | |
| Net investment income | | | (0.52 | ) | | | (0.24 | ) | | | (0.17 | ) | | | (0.20 | ) | | | (0.22 | ) |
| Net realized gains | | | — | | | | (0.19 | ) | | | (0.81 | ) | | | — | | | | — | |
| Total distributions | | | (0.52 | ) | | | (0.43 | ) | | | (0.98 | ) | | | (0.20 | ) | | | (0.22 | ) |
| | | | | | | | | | | | | | | | | | | | | |
| Net asset value, end of year | | $ | 9.37 | | | $ | 9.09 | | | $ | 10.47 | | | $ | 11.04 | | | $ | 10.62 | |
| | | | | | | | | | | | | | | | | | | | | |
| Total Return(a) | | | 8.94 | % | | | (9.27 | )% | | | 3.96 | % | | | 5.92 | % | | | 7.98 | % |
| | | | | | | | | | | | | | | | | | | | | |
| Ratios and Supplemental Data: | | | | | | | | | | | | | | | | | | | | |
| Net assets, end of year (000 omitted) | | $ | 30,632 | | | $ | 29,981 | | | $ | 32,386 | | | $ | 30,432 | | | $ | 37,343 | |
| Ratio of net expenses to average net assets | | | 0.95 | % | | | 0.95 | % | | | 0.95 | % | | | 0.80 | % | | | 0.80 | % |
| Ratio of expenses to average net assets before reimbursement/recoupment | | | 1.18 | % | | | 1.15 | % | | | 1.10 | % | | | 0.89 | % | | | 0.90 | % |
| Ratio of net investment income to average net assets | | | 5.55 | % | | | 2.47 | % | | | 1.64 | % | | | 1.73 | % | | | 2.16 | % |
| Portfolio turnover rate | | | 4,404 | % (b) | | | 6,521 | % (b) | | | 1,659 | % (b) | | | 178 | % (c) | | | 18 | % |
| (a) | Total return represents the rate that the investor would have earned or lost on an investment in the Fund, assuming reinvestment of distributions. |
| (b) | Turnover may be elevated in times of market volatility as part of a systematic U.S. Treasury trading strategy used to manage overall portfolio risk with the possibility of generating excess returns. |
| (c) | Elevated portfolio turnover rate is due to adviser change during the fiscal 30, year ended September 2020. |
See accompanying notes which are an integral part of these financial statements.
Channel Short Duration Income Fund
Notes to the Financial Statements
September 30, 2023
NOTE 1. ORGANIZATION
Channel Short Duration Income Fund (the “Fund”) was organized as a diversified series of Unified Series Trust (the “Trust”) on June 15, 2005, and is registered under the Investment Company Act of 1940, as amended (the “1940 Act”). The Trust is an open-end investment company established under the laws of Ohio by an Agreement and Declaration of Trust dated October 14, 2002, as amended (the “Trust Agreement”). The Trust Agreement permits the Board of Trustees of the Trust (“the Board”) to issue an unlimited number of shares of beneficial interest of separate series. The Fund is one of a series of funds currently authorized by the Board. The Fund commenced operations on October 4, 2005. The investment adviser to the Fund is Channel Investment Partners LLC (the “Adviser”). The Fund seeks to provide total return, comprised of both income and capital appreciation.
NOTE 2. SIGNIFICANT ACCOUNTING POLICIES
The Fund is an investment company and follows accounting and reporting guidance under Financial Accounting Standards Board Accounting Standards Codification (“ASC”) Topic 946, “Financial Services-Investment Companies”. The following is a summary of significant accounting policies followed by the Fund in the preparation of its financial statements. These policies are in conformity with generally accepted accounting principles in the United States of America (“GAAP”).
Regulatory Update – Tailored Shareholder Reports for Mutual Funds and Exchange-Traded Funds (“ETFs”) – Effective January 24, 2023, the Securities and Exchange Commission adopted rule and form amendments to require mutual funds and ETFs to transmit concise and visually engaging streamlined annual and semiannual reports to shareholders that highlight key information. Other information, including financial statements, will no longer appear in a streamlined shareholder report but must be available online, delivered free of charge upon request, and filed on a semiannual basis on Form N-CSR. The rule and form amendments have a compliance date of July 24, 2024. At this time, management is evaluating the impact of these amendments on the shareholder reports for the Fund.
Estimates – The preparation of financial statements in conformity with GAAP requires management to make estimates and assumptions that affect the reported amounts of assets and liabilities and disclosure of contingent assets and liabilities at the date of the financial statements and the reported amounts of increases and decreases in net assets from operations during the reporting period. Actual results could differ from those estimates.
Federal Income Taxes – The Fund makes no provision for federal income or excise tax. The Fund has qualified and intends to qualify each year as a regulated investment
Channel Short Duration Income Fund
Notes to the Financial Statements (continued)
September 30, 2023
company (“RIC”) under subchapter M of the Internal Revenue Code of 1986, as amended, by complying with the requirements applicable to RICs and by distributing substantially all of its taxable income. The Fund also intends to distribute sufficient net investment income and net realized capital gains, if any, so that it will not be subject to excise tax on undistributed income and gains. If the required amount of net investment income or gains is not distributed, the Fund could incur a tax expense.
As of and during the fiscal year ended September 30, 2023, the Fund did not have any liabilities for any unrecognized tax benefits. The Fund recognizes interest and penalties, if any, related to unrecognized tax benefits as income tax expense in the Statement of Operations when incurred. During the year, the Fund did not incur any interest or penalties. Management of the Fund has reviewed tax positions taken in tax years that remain subject to examination by all major tax jurisdictions, including federal (i.e., the previous three tax year ends and the interim tax period since then, as applicable) and has concluded that no provision for unrecognized tax benefits or expenses is required in these financial statements and does not expect this to change over the next twelve months.
Expenses – Expenses incurred by the Trust that do not relate to a specific fund of the Trust are allocated to the individual funds of the Trust based on each fund’s relative net assets or another appropriate basis (as determined by the Board).
Security Transactions and Related Income – The Fund follows industry practice and records security transactions on the trade date for financial reporting purposes. The specific identification method is used for determining gains or losses for financial statement and income tax purposes. Dividend income is recorded on the ex-dividend date and interest income is recorded on an accrual basis. Non-cash income, if any, is recorded at the fair market value of the securities received. Withholding taxes on foreign dividends, if any, have been provided for in accordance with the Fund’s understanding of the applicable country’s tax rules and rates.
Dividends and Distributions – The Fund intends to distribute substantially all of its net investment income, if any, monthly. The Fund intends to distribute its net realized long-term and short-term capital gains, if any, annually. Distributions to shareholders, which are determined in accordance with income tax regulations, are recorded on the ex-dividend date. The treatment for financial reporting purposes of distributions made to shareholders during the year from net investment income or net realized capital gains may differ from their ultimate treatment for federal income tax purposes. These differences are caused primarily by differences in the timing of the recognition of certain components of income, expense or realized capital gain for federal income tax purposes. Where such differences are permanent in nature, they are reclassified in the components of the net assets based on their ultimate characterization for federal income tax purposes. Any such reclassifications
Channel Short Duration Income Fund
Notes to the Financial Statements (continued)
September 30, 2023
will have no effect on net assets, results of operations or net asset value (“NAV”) per share of the Fund.
NOTE 3. SECURITIES VALUATION AND FAIR VALUE MEASUREMENTS
The Fund values its portfolio securities at fair value as of the close of regular trading on the New York Stock Exchange (“NYSE”) (normally 4:00 p.m. Eastern Time) on each business day the NYSE is open for business. Fair value is defined as the price that the Fund would receive upon selling an investment in a timely transaction to an independent buyer in the principal or most advantageous market of the investment. GAAP establishes a three-tier hierarchy to maximize the use of observable market data and minimize the use of unobservable inputs and to establish classification of fair value measurements for disclosure purposes.
Inputs refer broadly to the assumptions that market participants would use in pricing the asset or liability, including assumptions about risk (the risk inherent in a particular valuation technique used to measure fair value including a pricing model and/or the risk inherent in the inputs to the valuation technique). Inputs may be observable or unobservable. Observable inputs are inputs that reflect the assumptions market participants would use in pricing the asset or liability developed based on market data obtained and available from sources independent of the reporting entity. Unobservable inputs are inputs that reflect the reporting entity’s own assumptions about the assumptions market participants would use in pricing the asset or liability developed based on the best information available in the circumstances.
Various inputs are used in determining the value of the Fund’s investments. These inputs are summarized in the three broad levels listed below.
| ● | Level 1 – unadjusted quoted prices in active markets for identical investments and/or registered investment companies where the value per share is determined and published and is the basis for current transactions for identical assets or liabilities at the valuation date |
| ● | Level 2 – other significant observable inputs (including, but not limited to, quoted prices for an identical security in an inactive market, quoted prices for similar securities, interest rates, prepayment speeds, credit risk, etc.) |
| ● | Level 3 – significant unobservable inputs (including the Fund’s own assumptions in determining fair value of investments based on the best information available) |
The inputs used to measure fair value may fall into different levels of the fair value hierarchy. In such cases, for disclosure purposes, the level in the fair value hierarchy which
Channel Short Duration Income Fund
Notes to the Financial Statements (continued)
September 30, 2023
is reported is determined based on the lowest level input that is significant to the fair value measurement in its entirety.
Debt securities are valued by using the mean between the closing bid and ask prices provided by a pricing service. If the closing bid and ask prices are not readily available, the pricing service may provide a price determined by a matrix pricing method. Matrix pricing is a mathematical technique used to value fixed income securities without relying exclusively on quoted prices. Matrix pricing takes into consideration recent transactions, yield, liquidity, risk, credit quality, coupon, maturity, type of issue and any other factors or market data the pricing service deems relevant for the actual security being priced and for other securities with similar characteristics. These securities will generally be categorized as Level 2 securities. If the Adviser, as Valuation Designee, decides that a price provided by the pricing service does not accurately reflect the fair value of the securities or when prices are not readily available from a pricing service, securities are valued at fair value as determined by the Valuation Designee, in conformity with the Valuation Designee’s valuation policies and procedures which comply with guidelines adopted by the Board. All fair value pricing and the pricing methodology are subject to review and approval by the Board’s Pricing & Liquidity Committee. These securities will generally be categorized as Level 3 securities.
Investments in mutual funds, including money market mutual funds, are generally priced at the ending NAV provided by the service agent of the mutual funds. These securities are categorized as Level 1 securities.
In accordance with the Trust’s valuation policies and fair value determinations pursuant to Rule 2a-5 under the 1940 Act, the Valuation Designee is required to consider all appropriate factors relevant to the value of securities for which it has determined other pricing sources are not available or reliable as described above. No single method exists for determining fair value because fair value depends upon the circumstances of each individual case. As a general principle, the current fair value of a security being valued by the Valuation Designee would be the amount that the Fund might reasonably expect to receive upon the current sale. Methods that are in accordance with this principle may, for example, be based on (i) a multiple of earnings; (ii) a discount from market prices of a similar freely traded security (including a derivative security or a basket of securities traded on other markets, exchanges or among dealers); or (iii) yield to maturity with respect to debt issues, or a combination of these and other methods. Fair-value pricing is permitted if, in the Valuation Designee’s opinion, the validity of market quotations appears to be questionable based on factors such as evidence of a thin market in the security based on a small number of quotations, a significant event occurs after the close of a market but before a Fund’s NAV calculation that may affect a security’s value, or the Valuation Designee is aware of
Channel Short Duration Income Fund
Notes to the Financial Statements (continued)
September 30, 2023
any other data that calls into question the reliability of market quotations. The Valuation Designee may obtain assistance from others in fulfilling its duties. For example, it may seek assistance from pricing services, fund administrators, sub-advisers, accountants, or counsel; it may also consult the Trust’s Fair Value Committee. The Valuation Designee, however, remains responsible for the final fair value determination and may not designate or assign that responsibility to any third party.
The following is a summary of the inputs used to value the Fund’s investments as of September 30, 2023:
| | | | | | Valuation Inputs | | | | | | | |
| Assets | | Level 1 | | | Level 2 | | | Level 3 | | | Total | |
| Domestic Corporate Bonds | | $ | — | | | $ | 27,399,225 | | | $ | — | | | $ | 27,399,225 | |
| Foreign Corporate Bonds | | | — | | | | 887,760 | | | | — | | | | 887,760 | |
| U.S. Government & Agencies | | | — | | | | 1,890,000 | | | | — | | | | 1,890,000 | |
| Money Market Funds | | | 145,927 | | | | — | | | | — | | | | 145,927 | |
| Total | | $ | 145,927 | | | $ | 30,176,985 | | | $ | — | | | $ | 30,322,912 | |
The Fund did not hold any investments at the end of the reporting period for which significant unobservable inputs (Level 3) were used in determining fair value; therefore, no reconciliation of Level 3 securities is included for this reporting period.
NOTE 4. FEES AND OTHER TRANSACTIONS WITH AFFILIATES AND OTHER SERVICE PROVIDERS
The Adviser, under the terms of the management agreement with the Trust with respect to the Fund (the “Agreement”), manages the Fund’s investments. As compensation for its management services, the Fund is obligated to pay the Adviser a management fee computed and accrued daily and paid monthly at an annual rate of 0.40% of the Fund’s average daily net assets. For the fiscal year ended September 30, 2023, the Adviser earned fees of $123,204, from the Fund. At September 30, 2023, the Adviser was owed $5,327 from the Fund.
The Adviser has contractually agreed to waive its management fee and/or reimburse expenses through January 31, 2024 so that the Fund’s total annual operating expenses, excluding portfolio transaction and other investment-related costs (including brokerage fees and commissions); taxes; borrowing costs (such as interest and dividend expenses on securities sold short); acquired fund fees and expenses; fees and expenses associated with investments in other collective investment vehicles or derivative instruments (including, for example, option and swap fees and expenses); any amounts payable pursuant to a distribution or service plan adopted in accordance with Rule 12b-1 under the 1940 Act, as amended; any administrative and/or shareholder servicing fees payable pursuant to a plan adopted by the Board of Trustees; expenses incurred in connection with any merger
Channel Short Duration Income Fund
Notes to the Financial Statements (continued)
September 30, 2023
or reorganization; extraordinary expenses (such as litigation expenses, indemnification of Trust officers and Trustees and contractual indemnification of Fund service providers); and other expenses that the Trustees agree have not been incurred in the ordinary course of Fund’s business, do not exceed 0.95% of the Fund’s average daily net assets. For the fiscal year ended September 30, 2023, the Adviser waived fees of $69,992.
Each waiver/expense payment by the Adviser is subject to recoupment by the Adviser from the Fund in the three years following the date the particular waiver/expense payment occurred, but only if such recoupment can be achieved without exceeding the applicable annual expense limitation in effect at the time of the waiver/expense payment and any expense limitation in effect at the time of recoupment. As of September 30, 2023, the Adviser may seek repayment of management fees waived and expense reimbursements pursuant to the aforementioned conditions, from the Fund no later than the dates stated below:
| Recoverable Through | | | | |
| September 30, 2024 | | $ | 44,501 | |
| September 30, 2025 | | | 65,182 | |
| September 30, 2026 | | | 69,992 | |
Ultimus Fund Solutions, LLC (“Ultimus”) provides administration, fund accounting and transfer agent services to the Fund. The Fund pays Ultimus fees in accordance with the agreements for such services.
Northern Lights Compliance Services, LLC (“NLCS”), an affiliate of Ultimus, provides a Chief Compliance Officer to the Trust, as well as related compliance services, pursuant to a consulting agreement between NLCS and the Trust. Under the terms of such agreement, NLCS receives fees from the Fund, which are approved annually by the Board.
Under the terms of a Distribution Agreement with the Trust, Ultimus Fund Distributors, LLC (the “Distributor”) serves as principal underwriter to the Fund. The Distributor is a wholly-owned subsidiary of Ultimus. The Distributor is compensated by the Adviser (not the Fund) for acting as principal underwriter.
Certain officers of the Trust are also employees of Ultimus and such persons are not paid by the Fund for serving in such capacities. One Trustee is a former employee of Ultimus who is not currently paid by the Fund for serving in such capacity.
The Board supervises the business activities of the Trust. Each Trustee serves as a trustee until termination of the Trust unless the Trustee dies, resigns, retires, or is removed. The
Channel Short Duration Income Fund
Notes to the Financial Statements (continued)
September 30, 2023
Chair of the Board and more than 75% of the Trustees are “Independent Trustees,” which means that they are not “interested persons” as defined in the 1940 Act. The Independent Trustees review and establish compensation at least annually. Each Independent Trustee of the Trust receives annual compensation, which is an established amount paid quarterly per fund in the Trust at the time of the regular quarterly Board meetings. The Chair of the Board receives the highest compensation, commensurate with his additional duties and each Chair of a committee receives additional compensation as well. Independent Trustees also receive additional fees for attending any special meetings. In addition, the Trust reimburses Independent Trustees for out-of-pocket expenses incurred in conjunction with attendance at meetings.
NOTE 5. PURCHASES AND SALES OF SECURITIES
For the fiscal year ended September 30, 2023, purchases and sales of investment securities, other than short-term investments and short-term U.S. government obligations were as follows:
| Purchases | | | | |
| U.S. Government Obligations | | $ | 1,170,973,004 | |
| Other | | | 152,783,990 | |
| Sales | | | | |
| U.S. Government Obligations | | $ | 1,174,561,525 | |
| Other | | | 149,585,277 | |
NOTE 6. FEDERAL TAX INFORMATION
At September 30, 2023, the net unrealized appreciation (depreciation) and tax cost of investments for tax purposes was as follows:
| Gross unrealized appreciation | | $ | 481,465 | |
| Gross unrealized depreciation | | | (799,842 | ) |
| Net unrealized appreciation/(depreciation) on investments | | $ | (298,377 | ) |
| Tax cost of investments | | $ | 30,621,289 | |
The tax character of distributions paid for the fiscal years ended September 30, 2023 and September 30, 2022 were as follows:
| | | 2023 | | | 2022 | |
| Distributions paid from: | | | | | | | | |
| Ordinary income(a) | | $ | 1,562,379 | | | $ | 1,138,385 | |
| Long-term capital gains | | $ | — | | | $ | 338,851 | |
| Total distributions paid | | $ | 1,562,379 | | | $ | 1,477,236 | |
| (a) | Short-term capital gain distributions are treated as ordinary income for tax purposes. |
Channel Short Duration Income Fund
Notes to the Financial Statements (continued)
September 30, 2023
At September 30, 2023, the components of accumulated earnings (deficit) on a tax basis were as follows:
| Undistributed ordinary income | | $ | 157,854 | |
| Distributions payable | | | (138,055 | ) |
| Accumulated capital and other losses | | | (2,395,935 | ) |
| Unrealized depreciation on investments | | | (298,377 | ) |
| Total accumulated deficits | | $ | (2,674,513 | ) |
At September 30, 2023, the difference between book basis and tax basis unrealized appreciation (depreciation) is primarily attributable to the tax deferral of wash sales and dividends payable.
As of September 30, 2023, the Fund had accumulated short-term capital loss carryforwards of $1,691,540 and long-term capital loss carryforwards of $704,395, not subject to expiration.
NOTE 7. COMMITMENTS AND CONTINGENCIES
The Trust indemnifies its officers and Trustees for certain liabilities that may arise from their performance of their duties to the Trust or the Fund. Additionally, in the normal course of business, the Trust enters into contracts that contain a variety of representations and warranties which provide general indemnifications. The Trust’s maximum exposure under these arrangements is unknown, as this would involve future claims that may be made against the Trust that have not yet occurred.
NOTE 8. SUBSEQUENT EVENTS
Management of the Fund has evaluated the need for disclosures and/or adjustments resulting from subsequent events through the date at which these financial statements were issued. Based upon this evaluation, management has determined there were no items requiring adjustment of the financial statements or additional disclosure.
Report of Independent Registered Public Accounting Firm
To the Shareholders of Channel Short Duration Income Fund and
Board of Trustees of Unified Series Trust
Opinion on the Financial Statements
We have audited the accompanying statement of assets and liabilities, including the schedule of investments, of Channel Short Duration Income Fund (the “Fund”), a series of Unified Series Trust, as of September 30, 2023, the related statement of operations for the year then ended, the statements of changes in net assets for each of the two years in the period then ended, the related notes, and the financial highlights for each of the five years in the period then ended (collectively referred to as the “financial statements”). In our opinion, the financial statements present fairly, in all material respects, the financial position of the Fund as of September 30, 2023, the results of its operations for the year then ended, the changes in net assets for each of the two years in the period then ended, and the financial highlights for each of the five years in the period then ended, in conformity with accounting principles generally accepted in the United States of America.
Basis for Opinion
These financial statements are the responsibility of the Fund’s management. Our responsibility is to express an opinion on the Fund’s financial statements based on our audits. We are a public accounting firm registered with the Public Company Accounting Oversight Board (United States) (“PCAOB”) and are required to be independent with respect to the Fund in accordance with the U.S. federal securities laws and the applicable rules and regulations of the Securities and Exchange Commission and the PCAOB.
We conducted our audits in accordance with the standards of the PCAOB. Those standards require that we plan and perform the audits to obtain reasonable assurance about whether the financial statements are free of material misstatement whether due to error or fraud.
Our audits included performing procedures to assess the risks of material misstatement of the financial statements, whether due to error or fraud, and performing procedures that respond to those risks. Such procedures included examining, on a test basis, evidence regarding the amounts and disclosures in the financial statements. Our procedures included confirmation of securities owned as of September 30, 2023, by correspondence with the custodian and brokers; when replies were not received from brokers, we performed other auditing procedures. Our audits also included evaluating the accounting principles used and significant estimates made by management, as well as evaluating the overall presentation of the financial statements. We believe that our audits provide a reasonable basis for our opinion.
We have served as the Fund’s auditor since 2006.

COHEN & COMPANY, LTD.
Chicago, Illinois
November 22, 2023
Liquidity Risk Management Program (Unaudited)
The Trust has adopted and implemented a written liquidity risk management program (the “Program”) as required by Rule 22e-4 (the “Liquidity Rule”) under the 1940 Act. The Program is reasonably designed to assess and manage the Fund’s liquidity risk of each individual series of the Trust (each a “Fund” and collectively, the “Funds”), taking into consideration, among other factors, the Fund’s investment strategy and the liquidity of its portfolio investments during normal and reasonably foreseeable stressed conditions; its short and long-term cash flow projections; and its cash holdings and access to other funding sources. The Board approved the appointment of the Liquidity Administrator Committee, comprising certain Trust officers and employees of the Adviser. The Liquidity Administrator Committee maintains Program oversight and reports to the Board on at least an annual basis regarding the Program’s operational effectiveness through a written report (the “Report”). The most recent Report, which was presented to the Board for consideration at its meeting held on August 14-15, 2023, outlined the operation of the Program and the adequacy and effectiveness of the Program’s implementation. During the review period, the Funds did not experience unusual stress or disruption to their operations related to purchase and redemption activity. Also, during the review period each Fund held adequate levels of cash and highly liquid investments to meet shareholder redemption activities in accordance with such Fund’s prospectus and within the requirements of the 1940 Act. The Report concluded that the Program is reasonably designed to prevent violation of the Liquidity Rule and has been effectively implemented.
Summary of Fund Expenses (Unaudited)
As a shareholder of the Fund, you incur two types of costs: (1) transaction costs, including redemption fees; and (2) ongoing costs, including management fees and other Fund expenses. These examples are intended to help you understand your ongoing costs (in dollars) of investing in the Fund and to compare these costs with the ongoing costs of investing in other mutual funds. The example is based on an investment of $1,000 invested at the beginning of the period and held for the entire period from April 1, 2023 through September 30, 2023.
Actual Expenses
The first line of the table below provides information about actual account values and actual expenses. You may use the information in this line, together with the amount you invested, to estimate the expenses that you paid over the period. Simply divide your account value by $1,000 (for example, an $8,600 account value divided by $1,000 = 8.6), then multiply the result by the number in the first line under the heading “Expenses Paid During Period” to estimate the expenses you paid on your account during this period.
Hypothetical Example for Comparison Purposes
The second line of the table below provides information about hypothetical account values and hypothetical expenses based on the Fund’s actual expense ratio and an assumed rate of return of 5% per year before expenses, which is not the Fund’s actual return. The hypothetical account values and expenses may not be used to estimate the actual ending account balance or expenses you paid for the period. You may use this information to compare the ongoing costs of investing in the Fund and other funds. To do so, compare this 5% hypothetical example with the 5% hypothetical examples that appear in the shareholder reports of other funds.
Expenses shown in the table are meant to highlight your ongoing costs only and do not reflect any transactional costs. Therefore, the second line of the table below is useful in comparing ongoing costs only and will not help you determine the relative total costs of owning different funds. In addition, if transaction costs were included, your costs would have been higher.
| | | Beginning | | Ending | | | | |
| | | Account | | Account | | Expenses | | |
| | | Value | | Value | | Paid | | Annualized |
| | | April 1, | | September | | During | | Expense |
| | | 2023 | | 30, 2023 | | Period(a) | | Ratio |
| | Actual | $1,000.00 | | $1,018.70 | | $4.81 | | 0.95% |
| | Hypothetical(b) | $1,000.00 | | $1,020.31 | | $4.81 | | 0.95% |
| (a) | Expenses are equal to the Fund’s annualized expense ratios, multiplied by the average account value over the period, multiplied by 183/365 (to reflect the one-half year period). |
| (b) | Hypothetical assumes 5% annual return before expenses. |
Trustees and Officers (Unaudited)
GENERAL QUALIFICATIONS. The Board supervises the business activities of the Trust. Each Trustee serves as a trustee until termination of the Trust unless the Trustee dies, resigns, retires, or is removed. The Chair of the Board and more than 75% of the Trustees are “Independent Trustees”, which means that they are not “interested persons” (as defined in the 1940 Act) of the Trust or any adviser, sub-adviser or distributor of the Trust.
The following table provides information regarding the Independent Trustees.
Name, Address*, (Year of Birth),
Position with Trust**,
Term of Position with Trust | | Principal Occupation During Past 5 Years and Other
Directorships |
Daniel J. Condon (1950)
Chair, May 2022 to present; Chair of the Audit Committee; Chair of the Governance & Nominating Committee, May 2020 to May 2022; Independent Trustee, December 2002 to present | | Current: Retired (2017 – present). Previous: Peak Income Plus Fund (May 2022 – February 2023). |
Kenneth G.Y. Grant (1949)
Chair of the Governance & Nominating Committee, May 2022 to present; Chair, January 2017 to May 2022; Independent Trustee, May 2008 to present | | Current: Director, Standpoint Multi-Asset (Cayman) Fund, Ltd. (2019 – present); Director, Advisors Charitable Gift Fund (2020 – present), a Donor Advised Fund; Trustee, Peak Income Plus Fund (May 2022 – present). Previous: EVP, Benefit Plans Administrative Services, Inc., provider of retirement benefit plans administration (2019 – 2020); Director, Northeast Retirement Services (NRS) LLC, a transfer agent and fund administrator; and Director, Global Trust Company (GTC), a non-depository trust company sponsoring private investment products (2003 – 2019); EVP, NRS (2003 – 2019); GTC, EVP (2008 – 2019); EVP, Savings Banks Retirement Association (2003 – 2019), provider of qualified retirement benefit plans. |
Ronald C. Tritschler (1952)
Chair of the Audit Committee, May 2022 to present; Independent Trustee, January 2007 to present; Interested Trustee, December 2002 to December 2006 | | Current: Chief Executive Officer, Director and Legal Counsel of The Webb Companies, a national real estate company, (2001– present); Director, Standpoint Multi-Asset (Cayman) Fund, Ltd. (2020 – present); Director of First State Bank of the Southeast (2000 – present). Previous: Trustee, Peak Income Plus Fund (May 2022 – February 2023). |
Catharine B. McGauley (1977)
Chair of the Pricing & Liquidity Committee, November 2022 to present; Independent Trustee, September 2022 to present | | Current: Lead Portfolio Manager of Atlantic Charter Insurance, a workers’ compensation insurer, (2010 – present); Investment Advisor for a Family Office (2015 – present); Senior Analyst/Advisor for a Boston real estate company and related family (2010 – present). Previous: Trustee, Peak Income Plus Fund (May 2022 – February 2023). |
Freddie Jacobs, Jr. (1970)
Independent Trustee, September 2022 to present | | Current: Chief Operating Officer and Chief Risk Officer Northeast Retirement Services LLC (NRS), and its subsidiary, Global Trust Company (GTC). NRS is a transfer agent and fund administrator, GTC is a non-depository trust company sponsoring private investment products (2021 – present); Chair, Board of Crispus Attucks Fund (2020 – present); Board Member of Camp Harbor View (2020 – present); Director, Sportsmen’s Tennis and Education Center (2019 – present). Previous: SVP, Senior Risk Officer NRS (2013 – 2021); Trustee, Peak Income Plus Fund (May 2022 – February 2023); Trustee of Buckingham Browne & Nichols (2017 - June 2023). |
| * | The address for each Trustee is 225 Pictoria Drive, Suite 450, Cincinnati, Ohio 45246. |
| ** | As of the date of this report, the Trust consists of 29 series. |
Trustees and Officers (Unaudited) (continued)
The following table provides information regarding the Interested Trustees and Officers of the Trust.
Name, Address*, (Year of Birth),
Position with Trust,
Term of Position with Trust | | Principal Occupation During Past 5 Years and Other
Directorships |
David R. Carson (1958)
Interested Trustee, August 2020 to present; President, January 2016 to August 2021 | | Current: Retired (2023 – present); Interested Trustee, Mammoth Institutional Credit Access Fund and Mammoth Institutional Equity Access Fund (November 2022 – present); Interested Trustee, Peak Income Plus Fund (May 2022 – present). Previous: Interested Trustee of Ultimus Managers Trust, (January 2021 – April 2023); Senior Vice President Client Strategies of Ultimus Fund Solutions, LLC, (2013 – April 2023). |
Martin R. Dean (1963)
President, August 2021 to present; Vice President, November 2020 to August 2021; Chief Compliance Officer, April 2021 to August 2021; Assistant Chief Compliance Officer, January 2016 to April 2021 | | Current: President, Northern Lights Compliance Services (2023 – present). Previous: Senior Vice President, Head of Fund Compliance of Ultimus Fund Solutions, LLC (2016 – January 2023). |
Zachary P. Richmond (1980)
Treasurer and Chief Financial Officer, November 2014 to present | | Current: Vice President, Director of Financial Administration for Ultimus Fund Solutions, LLC, (2015 – present). |
Gweneth K. Gosselink (1955)
Chief Compliance Officer, August 2021 to present | | Current: Vice President, Senior Compliance Officer of Ultimus Fund Solutions, LLC, since 2019. Previous: Chief Operating Officer & CCO at Miles Capital, Inc. (2013 – 2019). |
Elisabeth Dahl (1962)
Secretary, May 2017 to present; Assistant Secretary, March 2016 to May 2017 | | Current: Attorney, Ultimus Fund Solutions, LLC since March 2016. |
Timothy J. Shaloo (1970)
AML Compliance Officer, August 2023 to present | | Current: AVP, Compliance Officer, Northern Lights Compliance Services, LLC (2021 – present). Previous: Compliance Specialist, Ultimus Fund Solutions, LLC (2016 – 2020). |
| * | The address for each Officer is 225 Pictoria Drive, Suite 450, Cincinnati, Ohio 45246. |
Other Information (Unaudited)
The Fund’s Statement of Additional Information (“SAI”) includes additional information about the trustees and is available without charge, upon request. You may call toll-free at (877) 627-8504 to request a copy of the SAI or to make shareholder inquiries.
| Privacy Notice | |
| | |
| | Rev: March 2021 |
| FACTS | WHAT DOES CHANNEL SHORT DURATION INCOME FUND (THE “FUND”) DO WITH YOUR PERSONAL INFORMATION? |
| Why? | Financial companies choose how they share your personal information. Federal law gives consumers the right to limit some but not all sharing. Federal law also requires us to tell you how we collect, share, and protect your personal information. Please read this notice carefully to understand what we do. |
| What? | The types of personal information we collect and share depend on the product or service you have with us. This information can include: ■ Social Security number ■ account balances and account transactions ■ transaction or loss history and purchase history ■ checking account information and wire transfer instructions When you are no longer our customer, we continue to share your information as described in this notice. |
| How? | All financial companies need to share customers’ personal information to run their everyday business. In the section below, we list the reasons financial companies can share their customers’ personal information; the reasons the Fund chooses to share; and whether you can limit this sharing. |
| Reasons we can share your personal information | Does the Fund share? |
For our everyday business purposes— such as to process your transactions, maintain your account(s), respond to court orders and legal investigations, or report to credit bureaus | Yes |
For our marketing purposes— to offer our products and services to you | No |
| For joint marketing with other financial companies | No |
For our affiliates’ everyday business purposes— information about your transactions and experiences | No |
For our affiliates’ everyday business purposes— information about your creditworthiness | No |
| For nonaffiliates to market to you | No |
| Questions? | Call (877) 627-8504 |
| Who we are |
| Who is providing this notice? | Channel Short Duration Income Fund Ultimus Fund Distributors, LLC (Distributor) Ultimus Fund Solutions, LLC (Administrator) |
| What we do |
| How does the Fund protect my personal information? | To protect your personal information from unauthorized access and use, we use security measures that comply with federal law. These measures include computer safeguards and secured files and buildings. Our service providers are held accountable for adhering to strict policies and procedures to prevent any misuse of your nonpublic personal information. |
| How does the Fund collect my personal information? | We collect your personal information, for example, when you ■ open an account or deposit money ■ buy securities from us or sell securities to us ■ make deposits or withdrawals from your account ■ give us your account information ■ make a wire transfer ■ tell us who receives the money ■ tell us where to send the money ■ show your government-issued ID ■ show your driver’s license |
| Why can’t I limit all sharing? | Federal law gives you the right to limit only ■ sharing for affiliates’ everyday business purposes— information about your creditworthiness ■ affiliates from using your information to market to you ■ sharing for nonaffiliates to market to you State laws and individual companies may give you additional rights to limit sharing. |
| Definitions |
| Affiliates | Companies related by common ownership or control. They can be financial and nonfinancial companies. ■ Channel Investment Partners, LLC, the investment adviser to the Fund, could be deemed to be an affiliate. |
| Nonaffiliates | Companies not related by common ownership or control. They can be financial and nonfinancial companies. ■ The Fund does not share your personal information with nonaffiliates so they can market to you |
| Joint marketing | A formal agreement between nonaffiliated financial companies that together market financial products or services to you. ■ The Fund does not jointly market. |
Proxy Voting
A description of the policies and procedures that the Fund uses to determine how to vote proxies relating to portfolio securities and information regarding how the Fund voted those proxies during the most recent twelve month period ended June 30, are available (1) without charge upon request by calling the Fund at (877) 627-8504 and (2) in Fund documents filed with the SEC on the SEC’s website at www.sec.gov.
TRUSTEES
Daniel J. Condon, Chair
David R. Carson
Kenneth G.Y. Grant
Freddie Jacobs, Jr.
Catharine B. McGauley
Ronald C. Tritschler | INDEPENDENT REGISTERED
PUBLIC ACCOUNTING FIRM
Cohen & Company, Ltd.
151 North Franklin Street, Suite 575
Chicago, IL 60606 |
| | |
OFFICERS
Martin R. Dean, President
Gweneth K. Gosselink, Chief Compliance Officer
Zachary P. Richmond, Treasurer and Chief Financial Officer | LEGAL COUNSEL
Thompson Hine LLP
312 Walnut Street, 20th Floor
Cincinnati, OH 45202 |
| | |
INVESTMENT ADVISER
Channel Investment Partners LLC
3033 Wilson Boulevard, Suite 700
Arlington, VA 22201 | CUSTODIAN
Huntington National Bank
41 South High Street
Columbus, OH 43215 |
| | |
DISTRIBUTOR
Ultimus Fund Distributors, LLC
225 Pictoria Drive, Suite 450
Cincinnati, OH 45246 | ADMINISTRATOR, TRANSFER AGENT AND FUND ACCOUNTANT
Ultimus Fund Solutions, LLC
225 Pictoria Drive, Suite 450
Cincinnati, OH 45246 |
This report is intended only for the information of shareholders or those who have received the Fund’s prospectus which contains information about the Fund’s management fee and expenses. Please read the prospectus carefully before investing.
Distributed by Ultimus Fund Distributors, LLC
Member FINRA/SIPC
Channel-AR-23
Item 2. Code of Ethics.
(a) As of the end of the period covered by this report, the registrant has adopted a code of ethics that applies to the registrant's principal executive officer, principal financial officer, principal accounting officer or controller, or persons performing similar functions, regardless of whether these individuals are employed by the registrant or a third party.
(b) For purposes of this item, “code of ethics” means written standards that are reasonably designed to deter wrongdoing and to promote:
| (1) | Honest and ethical conduct, including the ethical handling of actual or apparent conflicts of interest between personal and professional relationships; |
| (2) | Full, fair, accurate, timely, and understandable disclosure in reports and documents that a registrant files with, or submits to, the Commission and in other public communications made by the registrant; |
(3) Compliance with applicable governmental laws, rules, and regulations;
| (4) | The prompt internal reporting of violations of the code to an appropriate person or persons identified in the code; and |
(5) Accountability for adherence to the code.
(c) Amendments: During the period covered by the report, there have not been any amendments to the provisions of the code of ethics.
(d) Waivers: During the period covered by the report, the registrant has not granted any express or implicit waivers from the provisions of the code of ethics.
(e) Posting: We do not intend to post the Code of Ethics for the Officers or any amendments or waivers on a website.
(f) Availability: The Code of Ethics for the Officers can be obtained, free of charge by calling the toll-free number for the appropriate Fund.
Item 3. Audit Committee Financial Expert.
(a) Certain series of the registrant that appear in the shareholder report included in Item 1 are listed issuers as defined in Rule 10A-3 under the Securities Exchange Act of 1934, as amended (the “Exchange Act”) and have a separately-designated standing audit committee established in accordance with Section 3(a)(58)A of the Exchange Act. The registrant’s audit committee member is Freddie Jacobs, Jr.
Item 4. Principal Accountant Fees and Services.
Channel Fund: FY 2023 $15,700
FY 2022 $15,700
Appleseed Fund: FY 2023 $17,300
FY 2022 $17,300
Ballast Fund: FY 2023 $15,150
FY 2022 $15,150
Registrant
Channel Fund: FY 2023 $ 0
FY 2022 $ 0
Appleseed Fund: FY 2023 $ 0
FY 2022 $ 0
Ballast Fund: FY 2023 $ 0
FY 2022 $ 0
Registrant
Channel Fund: FY 2023 $ 3,300
FY 2022 $ 3,300
Appleseed Fund: FY 2023 $ 3,800
FY 2022 $ 3,800
Ballast Fund: FY 2023 $ 3,800
FY 2022 $ 3,800
Nature of the fees: Preparation of the 1120 RIC and Excise review
Registrant
Channel Fund: FY 2023 $ 0
FY 2022 $ 0
Appleseed Fund: FY 2023 $ 0
FY 2022 $ 0
FY 2023 $ 0
FY 2022 $ 0
Nature of the fees: Transfer Agency system conversion testing
| (e) | (1) Audit Committee’s Pre-Approval Policies |
The Audit Committee Charter requires the Audit Committee to be responsible for the selection, retention or termination of auditors and, in connection therewith, to (i) evaluate the proposed fees and other compensation, if any, to be paid to the auditors, (ii) evaluate the independence of the auditors, (iii) pre-approve all audit services and, when appropriate, any non-audit services provided by the independent auditors to the Trust, (iv) pre-approve, when appropriate, any non-audit services provided by the independent auditors to the Trust’s investment adviser, or any entity controlling, controlled by, or under common control with the investment adviser and that provides ongoing services to the Trust if the engagement relates directly to the operations and financial reporting of the Trust, and (v) receive the auditors’ specific representations as to their independence;
| (2) | None of the services described in paragraph (b) through (d) of this Item were approved by the audit committee pursuant to paragraph (c)(7)(i)(C) of Rule 2-01 of Regulation S-X. |
(f) During audit of registrant’s financial statements for the most recent fiscal year, less than 50 percent of the hours expended on the principal accountant’s engagement were attributed to work performed by persons other than the principal accountant’s full-time, permanent employees.
(g) The aggregate non-audit fees billed by the registrant’s accountant for services rendered to the registrant, and rendered to the registrant’s investment adviser (not including any sub-adviser whose role is primarily portfolio management and is subcontracted with or overseen by another investment adviser), and any entity controlling, controlled by, or under common control with the adviser that provides ongoing services to the registrant:
Registrant Adviser
FY 2023 $ 0 $ 0
FY 2022 $ 0 $ 0
(h) Not applicable. The auditor performed no services for the registrant’s investment adviser or any entity controlling, controlled by, or under common control with the investment adviser that provides ongoing services to the registrant.
(i) Not applicable.
(j) Not applicable.
Item 5. Audit Committee of Listed Companies. Certain series of the registrant that appear in the shareholder report included in Item 1 are listed issuers as defined in Rule 10A-3 under the Securities Exchange Act of 1934, as amended (the “Exchange Act”) and have a separately-designated standing audit committee established in accordance with Section 3(a)(58)A of the Exchange Act. The registrant’s audit committee member is Freddie Jacobs, Jr.
Item 6. Schedule of Investments. Schedule filed with Item 1.
Item 7. Disclosure of Proxy Voting Policies and Procedures for Closed-End Management Investment Companies. NOT APPLICABLE – applies to closed-end funds only
Item 8. Portfolio Managers of Closed-End Investment Companies. NOT APPLICABLE – applies to closed-end funds only
Item 9. Purchases of Equity Securities by Closed-End Management Investment Company and Affiliated Purchasers. NOT APPLICABLE – applies to closed-end funds only
Item 10. Submission of Matters to a Vote of Security Holders.
The registrant has not adopted procedures by which shareholders may recommend nominees to the registrant’s board of trustees.
Item 11. Controls and Procedures.
(a) Based on their evaluation of the registrant’s disclosure controls and procedures (as defined in Rule 30a-3(c) under the Investment Company Act of 1940, as amended (the “Act”)) as of a date within 90 days of the filing date of this report, the registrant’s principal executive officer and principal financial officer have concluded that such disclosure controls and procedures are reasonably designed and are operating effectively to ensure that material information relating to the registrant is made known to them by others within those entities, particularly during the period in which this report is being prepared, and that the information required in filings on Form N-CSR is recorded, processed, summarized, and reported on a timely basis.
(b) There were no changes in the registrant's internal control over financial reporting (as defined in Rule 30a-3(d) under the Investment Company Act of 1940) that occurred during the period covered by this report that have materially affected, or are reasonably likely to materially affect, the registrant's internal control over financial reporting.
Item 12. Disclosure of Securities Lending Activities for Closed-End Investment Companies.
Not Applicable.
Item 13. Exhibits.
(a) (1) Code is filed herewith
(3) Not Applicable
SIGNATURES
Pursuant to the requirements of the Securities Exchange Act of 1934 and the Investment Company Act of 1940, the registrant has duly caused this report to be signed on its behalf by the undersigned, thereunto duly authorized.
(Registrant) Unified Series Trust
By /s/ Martin R. Dean
Martin R. Dean, President
Date 12/8/2023
Pursuant to the requirements of the Securities Exchange Act of 1934 and the Investment Company Act of 1940, this report has been signed below by the following persons on behalf of the registrant and in the capacities and on the dates indicated.
By ___ /s/Martin R. Dean
Martin R. Dean, President
Date 12/8/2023
By _ /s/ Zachary P. Richmond
Zachary P. Richmond, Treasurer
Date 12/8/2023