Table of Contents
UNITED STATES
SECURITIES AND EXCHANGE COMMISSION
Washington, D.C. 20549
FORM N-CSR
CERTIFIED SHAREHOLDER REPORT OF REGISTERED
MANAGEMENT INVESTMENT COMPANIES
Investment Company Act file number 811- 21261
Rydex ETF Trust
(Exact name of registrant as specified in charter)
805 King Farm Boulevard, Suite 600
Rockville, Maryland 20850
(Address of principal executive offices) (Zip code)
Donald C. Cacciapaglia
Rydex ETF Trust
805 King Farm Boulevard, Suite 600
Rockville, Maryland 20850
(Name and address of agent for service)
Registrant’s telephone number, including area code: 1-301-296-5100
Date of fiscal year end: October 31
Date of reporting period: October 31, 2012
Form N-CSR is to be used by management investment companies to file reports with the Commission not later than 10 days after the transmission to stockholders of any report that is required to be transmitted to stockholders under Rule 30e-1 under the Investment Company Act of 1940 (17 CFR 270.30e-1). The Commission may use the information provided on Form N-CSR in its regulatory, disclosure review, inspection, and policymaking roles.
A registrant is required to disclose the information specified by Form N-CSR, and the Commission will make this information public. A registrant is not required to respond to the collection of information contained in Form N-CSR unless the Form displays a currently valid Office of Management and Budget (“OMB”) control number. Please direct comments concerning the accuracy of the information collection burden estimate and any suggestions for reducing the burden to Secretary, Securities and Exchange Commission, 450 Fifth Street, NW, Washington, DC 20549-0609. The OMB has reviewed this collection of information under the clearance requirements of 44 U.S.C. § 3507.
Table of Contents
Item 1. Reports to Stockholders.
Table of Contents

OCTOBER 31, 2012
GUGGENHEIM ETFs
ANNUAL REPORT

| EWMD | GUGGENHEIM S&P MIDCAP 400® EQUAL WEIGHT ETF | |
(formerly, RYDEX S&P MIDCAP 400 EQUAL WEIGHT ETF) | ||
| EWSM | GUGGENHEIM S&P SMALLCAP 600® EQUAL WEIGHT ETF | |
(formerly, RYDEX S&P SMALLCAP 600 EQUAL WEIGHT ETF) | ||
| EWRM | GUGGENHEIM RUSSELL MIDCAP® EQUAL WEIGHT ETF | |
(formerly, RYDEX RUSSELL MIDCAP® EQUAL WEIGHT ETF) | ||
| EWRI | GUGGENHEIM RUSSELL 1000® EQUAL WEIGHT ETF | |
(formerly, RYDEX RUSSELL 1000® EQUAL WEIGHT ETF) | ||
| EWRS | GUGGENHEIM RUSSELL 2000® EQUAL WEIGHT ETF | |
(formerly, RYDEX RUSSELL 2000® EQUAL WEIGHT ETF) | ||
| EWEF | GUGGENHEIM MSCI EAFE EQUAL WEIGHT ETF | |
(formerly, RYDEX MSCI EAFE EQUAL WEIGHT ETF) | ||
| EWEM | GUGGENHEIM MSCI EMERGING MARKETS EQUAL WEIGHT ETF | |
(formerly, RYDEX MSCI EMERGING MARKETS EQUAL WEIGHT ETF) | ||
| RCD | GUGGENHEIM S&P 500® EQUAL WEIGHT CONSUMER DISCRETIONARY ETF | |
(formerly, RYDEX S&P 500 EQUAL WEIGHT CONSUMER DISCRETIONARY ETF) | ||
| RHS | GUGGENHEIM S&P 500® EQUAL WEIGHT CONSUMER STAPLES ETF | |
(formerly, RYDEX S&P 500 EQUAL WEIGHT CONSUMER STAPLES ETF) | ||
| RYE | GUGGENHEIM S&P 500® EQUAL WEIGHT ENERGY ETF | |
(formerly, RYDEX S&P 500 EQUAL WEIGHT ENERGY ETF) | ||
| RYF | GUGGENHEIM S&P 500® EQUAL WEIGHT FINANCIALS ETF | |
(formerly, RYDEX S&P 500 EQUAL WEIGHT FINANCIALS ETF) | ||
| RYH | GUGGENHEIM S&P 500® EQUAL WEIGHT HEALTH CARE ETF | |
(formerly, RYDEX S&P 500 EQUAL WEIGHT HEALTH CARE ETF) | ||
| RGI | GUGGENHEIM S&P 500® EQUAL WEIGHT INDUSTRIALS ETF | |
(formerly, RYDEX S&P 500 EQUAL WEIGHT INDUSTRIALS ETF) | ||
| RTM | GUGGENHEIM S&P 500® EQUAL WEIGHT MATERIALS ETF | |
(formerly, RYDEX S&P 500 EQUAL WEIGHT MATERIALS ETF) | ||
| RYT | GUGGENHEIM S&P 500® EQUAL WEIGHT TECHNOLOGY ETF | |
(formerly, RYDEX S&P 500 EQUAL WEIGHT TECHNOLOGY ETF) | ||
| RYU | GUGGENHEIM S&P 500® EQUAL WEIGHT UTILITIES ETF | |
(formerly, RYDEX S&P 500 EQUAL WEIGHT UTILITIES ETF) |
Table of Contents
| TABLE OF CONTENTS |
| 2 | ||||
| 4 | ||||
| 6 | ||||
| 11 | ||||
| 12 | ||||
| 43 | ||||
| 131 | ||||
| 136 | ||||
| 140 | ||||
| 149 | ||||
| 165 | ||||
| 175 | ||||
| 176 | ||||
| 177 | ||||
| 180 | ||||
| GUGGENHEIM ETFS ANNUAL REPORT | 1 |
Table of Contents
| October 31, 2012 |
Dear Shareholder:
Security Investors, LLC (the “Investment Adviser”) is pleased to present the annual shareholder report for 16 of our exchange traded funds (“ETFs”).
The Investment Adviser is part of Guggenheim Investments which represents the investment management businesses of Guggenheim Partners, LLC, a global, diversified financial services firm.
This report covers performance of the following ETFs for the annual period ended October 31, 2012, with the name of each Fund followed by its ticker symbol:
| – | Guggenheim S&P MidCap 400® Equal Weight ETF (EWMD) |
| – | Guggenheim S&P SmallCap 600® Equal Weight ETF (EWSM) |
| – | Guggenheim Russell Midcap® Equal Weight ETF (EWRM) |
| – | Guggenheim Russell 1000® Equal Weight ETF (EWRI) |
| – | Guggenheim Russell 2000® Equal Weight ETF (EWRS) |
| – | Guggenheim MSCI EAFE Equal Weight ETF (EWEF) |
| – | Guggenheim MSCI Emerging Markets Equal Weight ETF (EWEM) |
| – | Guggenheim S&P 500® Equal Weight Consumer Discretionary ETF (RCD) |
| – | Guggenheim S&P 500® Equal Weight Consumer Staples ETF (RHS) |
| – | Guggenheim S&P 500® Equal Weight Energy ETF (RYE) |
| – | Guggenheim S&P 500® Equal Weight Financials ETF (RYF) |
| – | Guggenheim S&P 500® Equal Weight Health Care ETF (RYH) |
| – | Guggenheim S&P 500® Equal Weight Industrials ETF (RGI) |
| – | Guggenheim S&P 500® Equal Weight Materials ETF (RTM) |
| – | Guggenheim S&P 500® Equal Weight Technology ETF (RYT) |
| – | Guggenheim S&P 500® Equal Weight Utilities ETF (RYU) |
Rydex Distributors, LLC, the distributor of the Funds, is committed to providing investors with innovative investment solutions; as of the date of this report we offer 26 ETFs with a wide range of domestic and global themes, as well as equity and fixed-income mutual funds. We have built on the investment management strengths of Guggenheim Investments and worked with a diverse group of index providers to create some of the most distinctive ETFs available.
Rydex Distributors, LLC is affiliated with Guggenheim Partners and Security Investors.
| 2 | GUGGENHEIM ETFS ANNUAL REPORT |
Table of Contents
To learn more about economic and market conditions over the 12 months ended October 31, 2012, we encourage you to read the Economic and Market Overview section of the report, which follows this letter, and the Manager’s Analysis for each ETF.
Sincerely,

Donald C. Cacciapaglia
President
November 30, 2012
Read each fund’s prospectus and summary prospectus (if available) carefully before investing. It contains the fund’s investment objectives, risks, charges, expenses and other information, which should be considered carefully before investing. Obtain a prospectus and summary prospectus (if available) at www.guggenheiminvestments.com or call 800.820.0888.
Guggenheim Equal Weight and Sector Equal Weight ETFs may not be suitable for all investors. Investing in sector funds is more volatile than investing in broadly diversified funds, as there is a greater risk due to the concentration of the funds’ holdings in issuers of similar offerings. Guggenheim Investments Equal Weight ETFs may not be suitable for all investors. Investment returns and principal value will fluctuate so that when shares are redeemed, they may be worth more or less than original cost. Most investors will also incur customary brokerage commissions when buying or selling shares of an ETF. Investments in securities are subject to market risks that may cause their prices to fluctuate over time. Please review a prospectus carefully for more information of the risks associated with each ETF.
| GUGGENHEIM ETFS ANNUAL REPORT | 3 |
Table of Contents
|
Shareholder Expense Example
As a shareholder of the Rydex ETF Trust, you incur transaction costs such as creation and redemption fees or brokerage charges, and ongoing costs including advisory fees, trustee fees and, if applicable, distribution fees. All other Trust expenses are paid by the advisor. This Example is intended to help you understand your ongoing costs (in dollars) of investing in a Fund and to compare these costs with the ongoing costs of investing in other mutual funds.
The example in the table is based on an investment of $1,000 invested on April 30, 2012 and held for the six months ended October 31, 2012.
Actual Expenses
The first table below provides information about actual account values and actual expenses. You may use the information in this table, together with the amount you invested, to estimate the expenses that you incurred over the period. Simply divide your account value by $1,000 (for example, an $8,600 account value divided by $1,000 = 8.6), then multiply the result by the number in the first table under the heading entitled “Expenses Paid During the Six-Month Period” to estimate the expenses attributable to your investment during this period.
Hypothetical Example for Comparison Purposes
The second table below provides information about hypothetical account values and hypothetical expenses based on a Fund’s actual expense ratio and an assumed rate of return of 5% per year before expenses, which is not a Fund’s actual return. Thus, you should not use the hypothetical account values and expenses to estimate the actual ending account balance or your expenses for the period. Rather, these figures are provided to enable you to compare the ongoing costs of investing in a Fund and other funds. To do so, compare this 5% hypothetical example with the 5% hypothetical examples that appear in the shareholder reports of other funds.
Please note that the expenses shown in the table are meant to highlight your ongoing costs only and do not reflect any transaction costs, such as creation and redemption fees, or brokerage charges. Therefore, the second table is useful in comparing ongoing costs only, and will not help you determine the relative total costs of owning different funds. In addition, if these transaction costs were included, your costs would have been higher.
| Expense Ratio | Beginning Account Value 04/30/12 | Ending Account Value 10/31/12 | Expenses Paid During Six-Month Period* 04/30/12 to 10/31/12 | |||||||||||||
Actual | ||||||||||||||||
Guggenheim S&P MidCap 400® Equal Weight ETF | 0.40% | $ | 1,000.00 | $ | 996.80 | $ | 2.01 | |||||||||
Guggenheim S&P SmallCap 600® Equal Weight ETF | 0.41% | 1,000.00 | 1,012.60 | 2.07 | ||||||||||||
Guggenheim Russell MidCap® Equal Weight ETF | 0.40% | 1,000.00 | 998.40 | 2.01 | ||||||||||||
Guggenheim Russell 1000® Equal Weight ETF | 0.40% | 1,000.00 | 1,002.30 | 2.01 | ||||||||||||
Guggenheim Russell 2000® Equal Weight ETF | 0.40% | 1,000.00 | 1,000.90 | 2.01 | ||||||||||||
Guggenheim MSCI EAFE Equal Weight ETF | 0.55% | 1,000.00 | 994.70 | 2.76 | ||||||||||||
Guggenheim MSCI Emerging Markets Equal Weight ETF | 0.62% | 1,000.00 | 983.20 | 3.09 | ||||||||||||
Guggenheim S&P 500® Equal Weight Consumer Discretionary ETF | 0.50% | 1,000.00 | 1,008.20 | 2.52 | ||||||||||||
Guggenheim S&P 500® Equal Weight Consumer Staples ETF | 0.50% | 1,000.00 | 1,036.50 | 2.56 | ||||||||||||
| 4 | GUGGENHEIM ETFS ANNUAL REPORT |
Table of Contents
FEES AND EXPENSES (Unaudited) (concluded)
|
| Expense Ratio | Beginning Account Value 04/30/12 | Ending Account Value 10/31/12 | Expenses Paid During Six-Month Period* 04/30/12 to 10/31/12 | |||||||||||||
Guggenheim S&P 500® Equal Weight Energy ETF | 0.50% | $ | 1,000.00 | $ | 1,002.80 | $ | 2.52 | |||||||||
Guggenheim S&P 500® Equal Weight Financial ETF | 0.50% | 1,000.00 | 1,036.40 | 2.56 | ||||||||||||
Guggenheim S&P 500® Equal Weight Health Care ETF | 0.50% | 1,000.00 | 1,045.60 | 2.57 | ||||||||||||
Guggenheim S&P 500® Equal Weight Industrials ETF | 0.50% | 1,000.00 | 1,011.60 | 2.53 | ||||||||||||
Guggenheim S&P 500® Equal Weight Materials ETF | 0.50% | 1,000.00 | 974.90 | 2.48 | ||||||||||||
Guggenheim S&P 500® Equal Weight Technology ETF | 0.50% | 1,000.00 | 914.10 | 2.41 | ||||||||||||
Guggenheim S&P 500® Equal Weight Utilities ETF | 0.50% | 1,000.00 | 1,115.40 | 2.66 | ||||||||||||
Hypothetical (assuming a 5% return before expenses) |
| |||||||||||||||
Guggenheim S&P MidCap 400® Equal Weight ETF | 0.40% | 1,000.00 | 1,023.13 | 2.03 | ||||||||||||
Guggenheim S&P SmallCap 600® Equal Weight ETF | 0.41% | 1,000.00 | 1,023.08 | 2.08 | ||||||||||||
Guggenheim Russell MidCap® Equal Weight ETF | 0.40% | 1,000.00 | 1,023.13 | 2.03 | ||||||||||||
Guggenheim Russell 1000® Equal Weight ETF | 0.40% | 1,000.00 | 1,023.13 | 2.03 | ||||||||||||
Guggenheim Russell 2000® Equal Weight ETF | 0.40% | 1,000.00 | 1,023.13 | 2.03 | ||||||||||||
Guggenheim MSCI EAFE Equal Weight ETF | 0.55% | 1,000.00 | 1,022.37 | 2.80 | ||||||||||||
Guggenheim MSCI Emerging Markets Equal Weight ETF | 0.62% | 1,000.00 | 1,022.02 | 3.15 | ||||||||||||
Guggenheim S&P 500® Equal Weight Consumer Discretionary ETF | 0.50% | 1,000.00 | 1,022.62 | 2.54 | ||||||||||||
Guggenheim S&P 500® Equal Weight Consumer Staples ETF | 0.50% | 1,000.00 | 1,022.62 | 2.54 | ||||||||||||
Guggenheim S&P 500® Equal Weight Energy ETF | 0.50% | 1,000.00 | 1,022.62 | 2.54 | ||||||||||||
Guggenheim S&P 500® Equal Weight Financial ETF | 0.50% | 1,000.00 | 1,022.62 | 2.54 | ||||||||||||
Guggenheim S&P 500® Equal Weight Health Care ETF | �� | 0.50% | 1,000.00 | 1,022.62 | 2.54 | |||||||||||
Guggenheim S&P 500® Equal Weight Industrials ETF | 0.50% | 1,000.00 | 1,022.62 | 2.54 | ||||||||||||
Guggenheim S&P 500® Equal Weight Materials ETF | 0.50% | 1,000.00 | 1,022.62 | 2.54 | ||||||||||||
Guggenheim S&P 500® Equal Weight Technology ETF | 0.50% | 1,000.00 | 1,022.62 | 2.54 | ||||||||||||
Guggenheim S&P 500® Equal Weight Utilities ETF | 0.50% | 1,000.00 | 1,022.62 | 2.54 | ||||||||||||
| * | Expenses are equal to the Fund’s annualized expense ratio multiplied by the average account value over the period, multiplied by 184/366 (to reflect one-half year period). |
| GUGGENHEIM ETFS ANNUAL REPORT | 5 |
Table of Contents
|
Amidst the negative headlines concerning the potential fiscal cliff in the U.S., further turmoil in Europe and worsening economic data from China, the U.S. economy has shown surprising resilience, with signs of rising consumer sentiment and a recovery in housing. The U.S. housing market appears to have passed its bottom and real estate prices have begun to pick up. Our expectation is that a period of continued low interest rates will likely reinforce the rise in home prices and sales. Rising home prices will increase household net worth, which will translate into greater consumption via the wealth effect, and is supportive of overall economic growth. The recent rise in headline inflation, led by increases in energy and food prices, is likely to be transitory. Inflationary pressures should remain muted in the medium-term given the substantial slack in the economy.
The U.S. economy continues to press forward despite the current headwinds, and we believe the current macroeconomic environment remains constructive for risk assets, especially in the U.S. Stocks in the U.S. appear to be undervalued by most measures, and should benefit from continued capital inflow and the Federal Reserve’s accommodative monetary policy. We continue to see attractive value in credit products on a relative basis, though this positive outlook is limited to spread (or non-government) sectors.
On the international front, uncertainty continues to weigh on European markets. European policymakers appear to be coming closer to a consensus on the need for a fiscal union, albeit at a glacial pace. In China, a recent batch of economic data suggests that the odds of a hard landing have increased materially. We expect an announcement of additional stimulus measures after the government transition next year; although a stimulus would be supportive of economic growth, we expect China’s headline growth to slow from its breakneck pace of the past decade.
Beginning in mid-November 2011, the U.S. stock market moved up fairly consistently, except for a second-quarter pullback caused by lower earnings and GDP. For the 12-month period ended October 31, 2012, the Standard & Poor’s 500® Index* (the “S&P 500”) returned 15.21%.
Most international markets had positive returns, but were not nearly as strong as the U.S. market. The Morgan Stanley Capital International Europe-Australasia-Far East (the “MSCI EAFE”) Index* returned 4.61%. The MSCI EAFE Index* is composed of approximately 1,100 companies in 20 developed countries in Europe and the Pacific Basin. The MSCI Emerging Markets Index* returned 2.63%.
The search for yield continued to attract investors to the U.S. bond markets, helping performance, with lower-rated bonds outperforming higher-quality issues. The return of the Barclays U.S. Aggregate Bond Index, which is a proxy for the U.S. investment grade bond market, returned 5.25%, while return of the Barclays U.S. Corporate High Yield Index* was 13.61%. Reflecting the Federal Reserve’s continuing accommodative monetary policy, interest rates on short-term securities remained at their lowest levels in many years; the return of the Bank of America Merrill Lynch 3 Month U.S. Treasury Bill Index* was 0.08%.
The opinions and forecasts expressed may not actually come to pass. This information is subject to change at any time, based on market and other conditions, and should not be construed as a recommendation of any specific security or strategy.
* Index Definitions:
The following indices are referenced throughout this report. Indices are unmanaged and not available for direct investment. Index performance does not reflect transaction costs, fees or expenses.
The Barclays U.S. Aggregate Bond Index is a broad-based benchmark that measures the investment grade, U.S. dollar denominated, fixed-rate taxable bond market, including U.S. Treasuries, government-related and corporate securities, MBS (agency fixed-rate and hybrid ARM pass-throughs), ABS, and CMBS.
The Barclays U.S. Corporate High Yield Index measures the market of USD-denominated, non-investment grade, fixed-rate, taxable corporate bonds.
| 6 | GUGGENHEIM ETFS ANNUAL REPORT |
Table of Contents
ECONOMIC AND MARKET OVERVIEW (continued)
|
The Bank of America Merrill Lynch 3-Month U.S. Treasury Bill Index tracks 3-month U.S. government securities.
The MSCI EAFE Index is a capitalization weighted measure of stock markets in Europe, Australasia and the Far East.
The MSCI Emerging Markets Index is a free float-adjusted market capitalization weighted index that is designed to measure equity market performance in the global emerging markets.
The S&P 500® Index is a capitalization-weighted index that measures the performance of the large-capitalization sector of the U.S. equity market and includes 500 widely held common stocks chosen for market size, liquidity and industry group representation.
The Standard & Poor’s (S&P) MidCap 400® Equal Weight Index is an unmanaged equal-weighted version of the S&P MidCap 400® Index, which measures the performance of the mid-cap segment of the U.S. equity universe. The S&P MidCap 400® Equal Weight Index has the same constituents as the unmanaged capitalization-weighted S&P MidCap 400® Index, but each company in the equal-weighted index is allocated a fixed weight, and is rebalanced quarterly.
The Standard & Poor’s (S&P) MidCap 400® Index is a capitalization-weighted index that measures the performance of the mid-cap segment of the U.S. equity universe and includes 400 domestic mid-cap stocks chosen for market capitalization, liquidity, and industry group representation.
The Standard & Poor’s (S&P) SmallCap 600® Equal Weight Index is an unmanaged equal-weighted version of the S&P SmallCap 600® Index, which measures the performance of the small-cap segment of the U.S. equity universe. The S&P SmallCap 600® Equal Weight Index has the same constituents as the unmanaged capitalization-weighted S&P SmallCap 600® Index, but each company in the equal-weighted index is allocated a fixed weight, and is rebalanced quarterly.
The Standard & Poor’s (S&P) SmallCap 600® Index is a capitalization-weighted index that measures the performance of the small-cap segment of the U.S. equity universe and includes 600 domestic small-cap stocks chosen for market capitalization, liquidity, and industry group representation.
The Russell 1000® Equal Weight Index is an unmanaged equal-weighted version of the Russell 1000® Index, which is an unmanaged capitalization-weighted index representing the U.S. large-cap market. The Russell 1000® Equal Weight Index offers sector equal weight exposure by equally weighting the nine sectors within the Index and then equally weighting the securities within each sector.
The Russell 1000® Index measures the performance of the large-cap segment of the U.S. equity universe. It is a subset of the Russell 3000® Index and includes approximately 1,000 of the largest securities based on a combination of their market cap and current index membership. The Russell 1000® represents approximately 92% of the U.S. market.
The Russell Midcap® Equal Weight Index is an unmanaged equal-weighted version of the Russell Midcap® Index, which is an unmanaged capitalization-weighted index representing the U.S. mid-cap market. The Russell Midcap Equal Weight Index offers sector equal weight exposure by equally weighting the nine sectors within the Index and then equally weighting the securities within each sector.
The Russell Midcap® Index measures the performance of the 800 smallest companies in the Russell 1000® Index, which represent approximately 31% of the total market capitalization of the Russell 1000® Index.
The Russell 2000® Equal Weight Index is an unmanaged equal-weighted version of the Russell 2000® Index, which is an unmanaged capitalization-weighted index representing the U.S. small-cap market. The Russell 2000® Equal Weight Index offers sector equal weight exposure by equally weighting the nine sectors within the Index and then equally weighting the securities within each sector.
| GUGGENHEIM ETFS ANNUAL REPORT | 7 |
Table of Contents
ECONOMIC AND MARKET OVERVIEW (continued)
|
The Russell 2000® Index measures the performance of the small-cap value segment of the U.S. equity universe. The Russell 2000® Index measures the performance of the 2,000 smallest companies in the Russell 3000® Index, which represents approximately 10% of the total market capitalization of the Russell 3000® Index. The Russell 3000® Index measures the performance of the largest 3,000 U.S. companies representing approximately 98% of the investable U.S. equity market.
The MSCI EAFE (Europe, Australasia, Far East) Equal Weighted Index equally weights the issuers in the MSCI EAFE Index (the MSCI EAFE cap-weighted index, which is a free float-adjusted market capitalization index that is designed to measure the equity market performance of developed markets, excluding the U.S. and Canada). The MSCI EAFE Equal Weighted Index provides an alternative to market-cap indices, as each issuer has the same weight on the rebalancing date.
The MSCI Emerging Markets Equal Weighted Index equally weights the securities in the MSCI Emerging Markets Index (the MSCI Emerging Markets cap-weighted index), which is a free float-adjusted market capitalization index that is designed to measure the equity market performance of emerging markets. In the MSCI Emerging Markets Equal Weighted Index, each security has the same weight, which means that the weight of each security is set to unity of the rebalancing date.
The S&P 500® Equal Weight Index Consumer Discretionary is an unmanaged equal weighted version of the S&P 500® Consumer Discretionary Index that consists of the common stocks of the following industries: automobiles and components, consumer durables, apparel, hotels, restaurants, leisure, media and retailing that comprise the Consumer Discretionary sector of the S&P 500® Index.
The S&P 500® Consumer Discretionary Index is a sub-index of the S&P 500® Index, a capitalization-weighted index covering 500 industrial, utility, transportation and financial companies of the U.S. markets (mostly NYSE Euronext issues). The Consumer Discretionary index includes companies in the following industries: automobiles and components, consumer durables, apparel, hotels, restaurants, leisure, media and retailing.
The S&P 500® Equal Weight Index Consumer Staples is an unmanaged equal weighted version of the S&P 500® Consumer Staples Index that consists of the common stocks of the following industries: food and drug retailing, beverages, food products, tobacco, household products and personal products that comprise the Consumer Staples sector of the S&P 500® Index.
The S&P 500® Consumer Staples Index is a sub-index of the S&P 500® Index, a capitalization-weighted index covering 500 industrial, utility, transportation and financial companies of the U.S. markets (mostly NYSE Euronext issues). The Consumer Staples index comprises companies whose businesses are less sensitive to economic cycles. It includes manufacturers and distributors of food, beverages and tobacco and producers of non-durable household goods and personal products. It also includes food & drug retailing companies as well as hypermarkets and consumer super centers.
The S&P 500® Equal Weight Index Energy is an unmanaged equal weighted version of the S&P 500® Energy Index that consists of the common stocks of the following industries: oil and gas exploration, production, marketing, refining and/or transportation and energy equipment and services industries that comprise the Energy sector of the S&P 500® Index.
The S&P 500® Energy Index is a sub-index of the S&P 500® Index, a capitalization-weighted index covering 500 industrial, utility, transportation and financial companies of the U.S. markets (mostly NYSE Euronext issues). The Energy index comprises companies whose businesses are dominated by either of the following activities: The construction or provision of oil rigs, drilling equipment and other energy-related equipment and services, including seismic data collection; companies engaged in the exploration, production, marketing, refining and/or transportation of oil and gas products, coal and other consumable fuels.
| 8 | GUGGENHEIM ETFS ANNUAL REPORT |
Table of Contents
ECONOMIC AND MARKET OVERVIEW (continued)
|
The S&P 500® Equal Weight Index Financials is an unmanaged equal weighted version of the S&P 500® Financials Index that consists of the common stocks of the following industries: banks, diversified financials, brokerage, asset management insurance and real estate, including investment trusts that comprise the Financials sector of the S&P 500® Index.
The S&P 500® Financials Index is a sub-index of the S&P 500® Index, a capitalization-weighted index covering 500 industrial, utility, transportation and financial companies of the U.S. markets (mostly NYSE Euronext issues). The Financials index contains companies involved in activities such as banking, mortgage finance, consumer finance, specialized finance, investment banking and brokerage, asset management and custody, corporate lending, insurance, and financial investment, and real estate, including REITs.
The S&P 500® Equal Weight Index Health Care is an unmanaged equal weighted version of the S&P 500® Health Care Index that consists of the common stocks of the following industries: health care equipment and supplies, health care providers and services, and biotechnology and pharmaceuticals that comprise the Health Care sector of the S&P 500® Index.
The S&P 500® Health Care Index is a sub-index of the S&P 500® Index, a capitalization-weighted index covering 500 industrial, utility, transportation and financial companies of the U.S. markets (mostly NYSE Euronext issues). The Health Care index encompasses two main industry groups. The first includes companies who manufacture health care equipment and supplies or provide health care related services, including distributors of health care products, providers of basic health-care services, and owners and operators of health care facilities and organizations. The first group also includes companies operating in the health care technology industry. The second group includes companies primarily involved in the research, development, production and marketing of pharmaceuticals, biotechnology and life sciences products.
The S&P 500® Equal Weight Index Industrials is an unmanaged equal weighted version of the S&P 500® Industrials Index that consists of the common stocks of the following industries: aerospace and defense, building products, construction and engineering, electrical equipment, conglomerates, machinery; commercial services and supplies, air freight and logistics, airlines, and marine, road and rail transportation infrastructure that comprise the 52 Industrials sector of the S&P 500® Index.
The S&P 500® Industrials Index is a sub-index of the S&P 500® Index, a capitalization-weighted index covering 500 industrial, utility, transportation and financial companies of the U.S. markets (mostly NYSE Euronext issues). The Industrials index includes companies whose businesses are dominated by one of the following activities: the manufacture and distribution of capital goods, including aerospace & defense, construction, engineering & building products, electrical equipment and industrial machinery; the provision of commercial services and supplies, including printing, environmental, office and security services; the provision of professional services, including employment and research & consulting services; or the provision of transportation services, including airlines, couriers, marine, road & rail and transportation infrastructure.
The S&P 500® Equal Weight Index Materials is an unmanaged equal weighted version of the S&P 500® Materials Index that consists of the common stocks of the following industries: chemicals, construction materials, containers and packaging, metals and mining, and paper and forest products that comprise the Materials sector of the S&P 500® Index.
The S&P 500® Materials Index is a sub-index of the S&P 500® Index, a capitalization-weighted index covering 500 industrial, utility, transportation and financial companies of the U.S. markets (mostly NYSE Euronext issues). The Materials index encompasses a wide range of commodity-related manufacturing industries. Included in this sector are companies that manufacture chemicals, construction materials, glass, paper, forest products and related packaging products, and metals, minerals and mining companies, including producers of steel.
| GUGGENHEIM ETFS ANNUAL REPORT | 9 |
Table of Contents
ECONOMIC AND MARKET OVERVIEW (concluded)
|
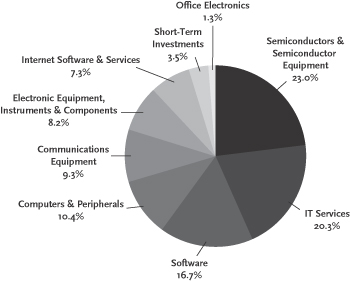
The S&P 500® Equal Weight Index Technology is an unmanaged equal weighted version of the S&P 500® Information Technology Index that consists of the common stocks of the following industries: internet equipment, computers and peripherals, electronic equipment, office electronics and instruments, semiconductor equipment and products, diversified telecommunication services, and wireless telecommunication services that comprise the Information Technology sector of the S&P 500® Index.
The S&P 500® Information Technology Index is a sub-index of the S&P 500® Index, a capitalization-weighted index covering 500 industrial, utility, transportation and financial companies of the U.S. markets (mostly NYSE Euronext issues). The Information Technology index covers the following general areas: Technology software & services, including companies that primarily develop software in various fields such as the Internet, applications, systems, databases management and/or home entertainment, and companies that provide information technology consulting and services, as well as data processing and outsourced services; secondly, Technology Hardware & Equipment, including manufacturers and distributors of communications equipment, computers & peripherals, electronic equipment and related instruments; and thirdly, Semiconductors & Semiconductor Equipment Manufacturers.
The S&P 500® Equal Weight Total Return Index Telecommunication Services & Utilities is an unmanaged equal weighted version of the S&P 500® Telecommunication Services Index and S&P 500® Utilities Index that consists of the common stocks of the following industries: electric utilities, gas utilities, multi-utilities and unregulated power and water utilities, telecommunication service companies, including fixed-line, cellular, wireless, high bandwidth and fiber-optic cable networks that comprise the Telecommunications Services and Utilities sectors of the S&P 500® Index.
The S&P 500® Telecommunications Services Index is a sub-index of the S&P 500® Index, a capitalization-weighted index covering 500 industrial, utility, transportation and financial companies of the U.S. markets (mostly NYSE Euronext issues). The Telecommunications Services index contains companies that provide communications services primarily through a fixed-line, cellular, wireless, high bandwidth and/or fiber optic cable network.
The S&P 500® Utilities Index is a sub-index of the S&P 500® Index, a capitalization-weighted index covering 500 industrial, utility, transportation and financial companies of the U.S. markets (mostly NYSE Euronext issues). The Utilities index encompasses those companies considered electric, gas or water utilities, or companies that operate as independent producers and/or distributors of power.
| 10 | GUGGENHEIM ETFS ANNUAL REPORT |
Table of Contents
| MANAGER’S ANALYSIS (Unaudited) | October 31, 2012 |
GUGGENHEIM S&P MIDCAP 400® EQUAL WEIGHT ETF
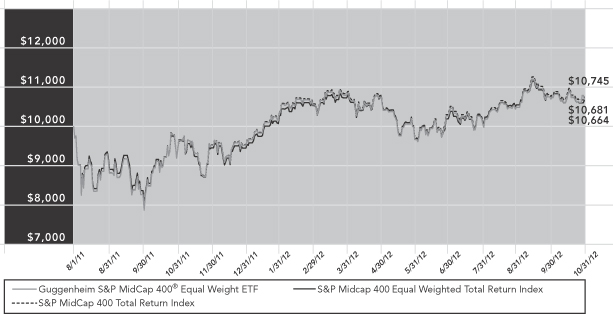
Guggenheim S&P MidCap 400® Equal Weight ETF returned 12.19% for the one-year period ended October 31, 2012, compared with the benchmark S&P MidCap 400® Equal Weight Total Return Index (12.76%). The cap-weighted S&P MidCap 400® Total Return Index returned 12.11%. During the period, EWMD achieved over 99% correlation to its benchmark on a daily basis.
The Financials sector was the largest contributor to return for the period, followed by the Industrials sector. The only sector detracting from return was the Energy sector.
Top contributors to Fund return included KB Home and United Rentals, Inc., while Patriot Coal Corp. and RadioShack Corp. and were the largest detractors.
Cumulative Fund Performance: August 1, 2011 – October 31, 2012
| TOTAL RETURNS FOR THE PERIOD ENDED OCTOBER 31, 2012 | ||||||||
| One Year | Since Inception (08/01/11) | |||||||
Guggenheim S&P MidCap 400® Equal Weight ETF | 12.19 | % | 5.39 | % | ||||
S&P MidCap 400 Equal Weight Total Return Index | 12.76 | % | 5.92 | % | ||||
S&P MidCap 400 Total Return Index | 12.11 | % | 5.28 | % | ||||
The returns presented above do not reflect the effect of taxes. Index returns represent total returns. Performance displayed represents past performance, which is no guarantee of future results.
Fund performance is subject to daily market volatility and may be better or worse since the end of the last quarter. For up-to-date fund performance, call 800.820.0888 or visit guggenheiminvestments.com.
| GUGGENHEIM ETFS ANNUAL REPORT | 11 |
Table of Contents
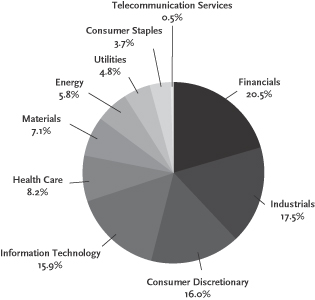
| PORTFOLIO SUMMARY (Unaudited) | October 31, 2012 |
GUGGENHEIM S&P MIDCAP 400® EQUAL WEIGHT ETF
Sector Allocations*
| Top 10 Holdings* | ||||
| Description | % of Net Assets | |||
Barnes & Noble, Inc. | 0.35% | |||
SUPERVALU, Inc. | 0.34% | |||
Warnaco Group, Inc.(The) | 0.34% | |||
Alpha Natural Resources, Inc. | 0.32% | |||
Lamar Advertising Co. — Class A | 0.31% | |||
KB Home | 0.31% | |||
PVH Corp. | 0.31% | |||
DeVry, Inc. | 0.30% | |||
Allscripts Healthcare Solutions, Inc. | 0.30% | |||
DreamWorks Animation SKG, Inc. — Class A | 0.30% | |||
| * | The Fund’s Top Ten Holdings are expressed as a percentage of net assets and the Sector Allocations are expressed as a percentage of the Fund’s equity investments market value. These percentages may change over time. |
| 12 | GUGGENHEIM ETFS ANNUAL REPORT |
Table of Contents
| MANAGER’S ANALYSIS (Unaudited) | October 31, 2012 |
GUGGENHEIM S&P SMALLCAP 600® EQUAL WEIGHT ETF
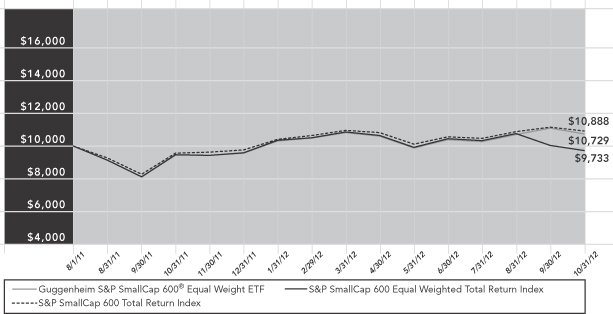
Guggenheim S&P SmallCap 600® Equal Weight ETF returned 13.30% for the one-year period ended October 31, 2012, compared with the benchmark S&P SmallCap 600® Equal Weight Total Return Index (13.87%). The cap-weighted S&P SmallCap 600® Total Return Index returned 13.60%. During the period, EWSM achieved over 99% correlation to its benchmark on a daily basis.
The Consumer Discretionary sector was the largest contributor to return for the period, followed by the Financials sector. The sectors detracting the most from performance were Energy and Telecommunication Services.
Top contributors to Fund return included Headwaters, Inc. and Lumber Liquidators Holdings, Inc. while Savient Pharmaceuticals, Inc. and Overseas Shipholding Group, Inc. were the largest detractors.
Cumulative Fund Performance: August 1, 2011 – October 31, 2012
| TOTAL RETURNS FOR THE PERIOD ENDED OCTOBER 31, 2012 | ||||||||
| One Year | Since Inception (08/01/11) | |||||||
Guggenheim S&P SmallCap 600® Equal Weight ETF | 13.30 | % | 5.79 | % | ||||
S&P SmallCap 600 Equal Weight Total Return Index | 13.87 | % | 6.33 | % | ||||
S&P SmallCap 600 Total Return Index | 13.60 | % | 7.05 | % | ||||
The returns presented above do not reflect the effect of taxes. Index returns represent total returns. Performance displayed represents past performance, which is no guarantee of future results.
Fund performance is subject to daily market volatility and may be better or worse since the end of the last quarter. For up-to-date fund performance, call 800.820.0888 or visit guggenheiminvestments.com.
| GUGGENHEIM ETFS ANNUAL REPORT | 13 |
Table of Contents
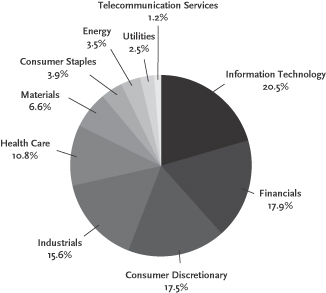
PORTFOLIO SUMMARY (Unaudited)
| October 31, 2012
|
GUGGENHEIM S&P SMALLCAP 600® EQUAL WEIGHT ETF
Sector Allocations*
| Top 10 Holdings* | ||||
| Description | % of Net Assets | |||
Coldwater Creek, Inc. | 0.26% | |||
Cymer, Inc. | 0.25% | |||
Ceradyne, Inc. | 0.24% | �� | ||
eHealth, Inc. | 0.22% | |||
PSS World Medical, Inc. | 0.22% | |||
Zale Corp. | 0.22% | |||
OPNET Technologies, Inc. | 0.22% | |||
JDA Software Group, Inc. | 0.22% | |||
Stamps.com, Inc. | 0.21% | |||
Ethan Allen Interiors, Inc. | 0.21% | |||
| * | The Fund’s Top Ten Holdings are expressed as a percentage of net assets and the Sector Allocations are expressed as a percentage of the Fund’s equity investments market value. These percentages may change over time. |
| 14 | GUGGENHEIM ETFS ANNUAL REPORT |
Table of Contents
MANAGER’S ANALYSIS (Unaudited)
| October 31, 2012
|
GUGGENHEIM RUSSELL MIDCAP® EQUAL WEIGHT ETF
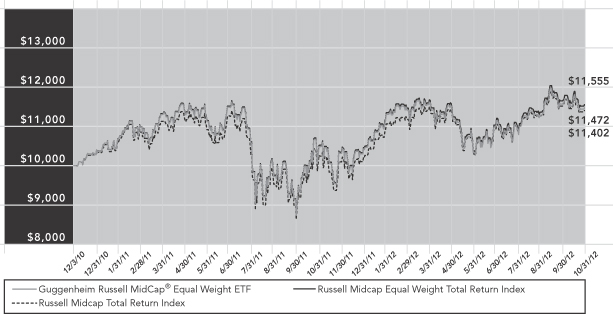
Guggenheim Russell MidCap® Equal Weight ETF returned 10.52% for the one-year period ended October 31, 2012, compared with the benchmark Russell Midcap® Equal Weighted Total Return Index (10.98%). The cap-weighted Russell Midcap® Total Return Index returned 12.15%. During the period, EWRM achieved over 99% correlation to its benchmark on a daily basis.
The Health Care and Industrials sectors contributed most to return for the period. The sectors detracting from return were Information Technology and Energy.
Top contributors to Fund return included Cobalt International Energy, Inc. and Constellation Brands, Inc., Class A, while Arch Coal, Inc. and Molycorp, Inc. were the largest detractors.
Cumulative Fund Performance: December 3, 2010 – October 31, 2012
| TOTAL RETURNS FOR THE PERIOD ENDED OCTOBER 31, 2012 | ||||||||
| One Year | Since Inception (12/03/10) | |||||||
Guggenheim Russell MidCap® Equal Weight ETF | 10.52 | % | 7.44 | % | ||||
Russell Midcap Equal Weight Total Return Index | 10.98 | % | 7.86 | % | ||||
Russell Midcap Total Return Index | 12.15 | % | 7.11 | % | ||||
The returns presented above do not reflect the effect of taxes. Index returns represent total returns. Performance displayed represents past performance, which is no guarantee of future results.
Fund performance is subject to daily market volatility and may be better or worse since the end of the last quarter. For up-to-date fund performance, call 800.820.0888 or visit guggenheiminvestments.com.
| GUGGENHEIM ETFS ANNUAL REPORT | 15 |
Table of Contents
PORTFOLIO SUMMARY (Unaudited)
| October 31, 2012
|
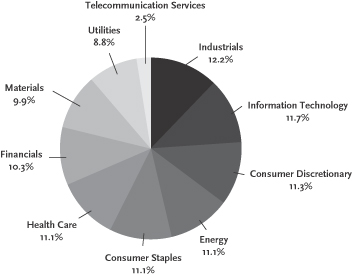
GUGGENHEIM RUSSELL MIDCAP® EQUAL WEIGHT ETF
Sector Allocations*
| Top 10 Holdings* | ||||
| Description | % of Net Assets | |||
Herbalife Ltd. | 0.37% | |||
Ingredion, Inc. | 0.37% | |||
Constellation Brands, Inc. — Class A | 0.36% | |||
Dean Foods Co. | 0.36% | |||
Bunge Ltd. | 0.35% | |||
Kroger Co. (The) | 0.35% | |||
Tyson Foods, Inc. — Class A | 0.35% | |||
Smithfield Foods, Inc. | 0.35% | |||
GNC Holdings, Inc. — Class A | 0.34% | |||
H.J. Heinz Co. | 0.34% | |||
| * | The Fund’s Top Ten Holdings are expressed as a percentage of net assets and the Sector Allocations are expressed as a percentage of the Fund’s equity investments market value. These percentages may change over time. |
| 16 | GUGGENHEIM ETFS ANNUAL REPORT |
Table of Contents
MANAGER’S ANALYSIS (Unaudited)
| October 31, 2012
|
GUGGENHEIM RUSSELL 1000® EQUAL WEIGHT ETF
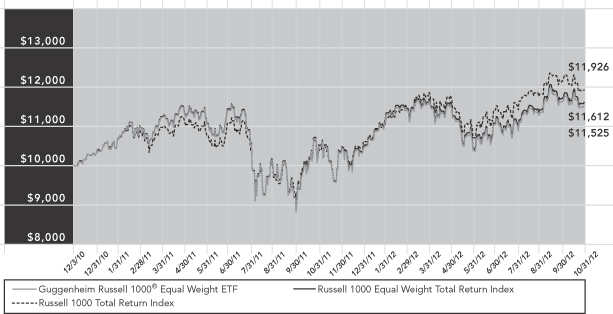
Guggenheim Russell 1000® Equal Weight ETF returned 10.83% for the one-year period ended October 31, 2012, compared with the benchmark Russell 1000® Equal Weighted Total Return Index (11.34%). The cap-weighted Russell 1000® Total Return Index returned 14.97%. During the period, EWRI achieved over 99% correlation to its benchmark on a daily basis.
The Health Care and Financials sectors contributed most to return for the period. The only sector detracting from return was Information Technology.
Top contributors to Fund return included Cobalt International Energy, Inc. and Sprint Nextel, Inc., while Molycorp, Inc. and NII Holdings, Inc. were the largest detractors.
Cumulative Fund Performance: December 3, 2010 – October 31, 2012
| TOTAL RETURNS FOR THE PERIOD ENDED OCTOBER 31, 2012 | ||||||||
| One Year | Since Inception (12/03/10) | |||||||
Guggenheim Russell 1000® Equal Weight ETF | 10.83 | % | 7.71 | % | ||||
Russell 1000 Equal Weight Total Return Index | 11.34 | % | 8.14 | % | ||||
Russell 1000 Total Return Index | 14.97 | % | 9.66 | % | ||||
The returns presented above do not reflect the effect of taxes. Index returns represent total returns. Performance displayed represents past performance, which is no guarantee of future results.
Fund performance is subject to daily market volatility and may be better or worse since the end of the last quarter. For up-to-date fund performance, call 800.820.0888 or visit guggenheiminvestments.com.
| GUGGENHEIM ETFS ANNUAL REPORT | 17 |
Table of Contents
PORTFOLIO SUMMARY (Unaudited)
| October 31, 2012
|
GUGGENHEIM RUSSELL 1000® EQUAL WEIGHT ETF
Sector Allocations*

| Top 10 Holdings* | ||||
| Description | % of Net Assets | |||
Herbalife Ltd. | 0.26% | |||
Ingredion, Inc. | 0.26% | |||
Constellation Brands, Inc. — Class A | 0.25% | |||
Dean Foods Co. | 0.25% | |||
Clearwire Corp. — Class A | 0.25% | |||
Bunge Ltd. | 0.25% | |||
Kroger Co.(The) | 0.25% | |||
Tyson Foods, Inc. — Class A | 0.24% | |||
Smithfield Foods, Inc. | 0.24% | |||
GNC Holdings, Inc. — Class A | 0.24% | |||
| * | The Fund’s Top Ten Holdings are expressed as a percentage of net assets and the Sector Allocations are expressed as a percentage of the Fund’s equity investments market value. These percentages may change over time. |
| 18 | GUGGENHEIM ETFS ANNUAL REPORT |
Table of Contents
MANAGER’S ANALYSIS (Unaudited)
| October 31, 2012
|
GUGGENHEIM RUSSELL 2000® EQUAL WEIGHT ETF
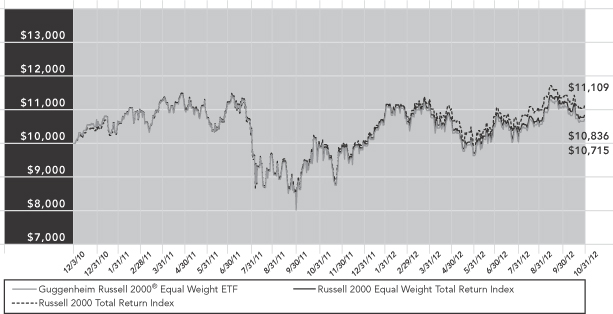
Guggenheim Russell 2000® Equal Weight ETF returned 9.08% for the one-year period ended October 31, 2012, compared with the benchmark Russell 2000® Equal Weighted Total Return Index (9.78%). The cap-weighted Russell 2000® Total Return Index returned 12.08%. During the period, EWRS achieved over 99% correlation to its benchmark on a daily basis.
The Financials and Health Care sectors contributed most to return for the period. The sectors detracting the most from return were Energy and Information Technology.
Top contributors to Fund return included Smart Balance, Inc. and SureWest Communications, while Patriot Coal Corp. and Dynegy, Inc. were the largest detractors.
Cumulative Fund Performance: December 3, 2010 – October 31, 2012
| TOTAL RETURNS FOR THE PERIOD ENDED OCTOBER 31, 2012 | ||||||
| One Year | Since Inception (12/03/10) | |||||
Guggenheim Russell 2000® Equal Weight ETF | 9.08 | % | 3.67% | |||
Russell 2000 Equal Weight Total Return Index | 9.78 | % | 4.29% | |||
Russell 2000 Total Return Index | 12.08 | % | 5.66% | |||
The returns presented above do not reflect the effect of taxes. Index returns represent total returns. Performance displayed represents past performance, which is no guarantee of future results.
Fund performance is subject to daily market volatility and may be better or worse since the end of the last quarter. For up-to-date fund performance, call 800.820.0888 or visit guggenheiminvestments.com.
| GUGGENHEIM ETFS ANNUAL REPORT | 19 |
Table of Contents
PORTFOLIO SUMMARY (Unaudited)
| October 31, 2012
|
GUGGENHEIM RUSSELL 2000® EQUAL WEIGHT ETF
Sector Allocations*
| Top 10 Holdings* | ||||
| Description | % of Net Assets | |||
SSGA Government Money Market Fund | 0.69% | |||
Schiff Nutrition International, Inc. | 0.31% | |||
SUPERVALU, Inc. | 0.29% | |||
Spectrum Brands Holdings, Inc. | 0.25% | |||
Pilgrim’s Pride Corp. | 0.25% | |||
Petmed Express, Inc. | 0.25% | |||
Post Holdings, Inc. | 0.24% | |||
Nature’s Sunshine Products, Inc. | 0.24% | |||
Andersons, Inc. (The) | 0.23% | |||
Sanderson Farms, Inc. | 0.23% | |||
| * | The Fund’s Top Ten Holdings are expressed as a percentage of net assets and the Sector Allocations are expressed as a percentage of the Fund’s equity investments market value. These percentages may change over time. |
| 20 | GUGGENHEIM ETFS ANNUAL REPORT |
Table of Contents
MANAGER’S ANALYSIS (Unaudited)
| October 31, 2012
|
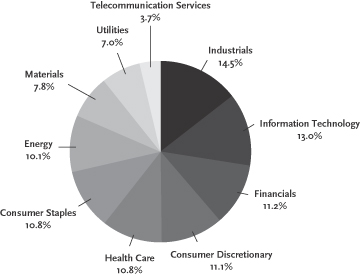
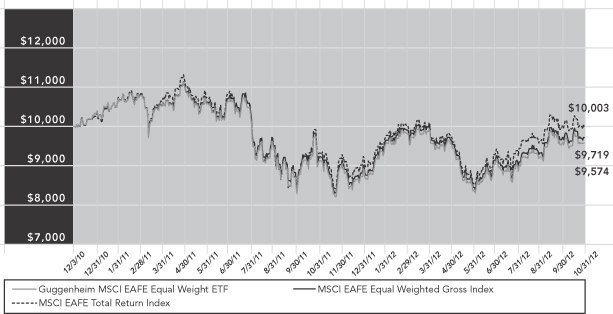
GUGGENHEIM MSCI EAFE EQUAL WEIGHT ETF
Guggenheim MSCI EAFE Equal Weight ETF returned 2.21% for the one-year period ended October 31, 2012, compared with the benchmark MSCI EAFE Equal Weighted Index (2.74%). The cap-weighted MSCI EAFE Total Return Index returned 4.61%. During the period, EWEF achieved over 99% correlation to its benchmark on a daily basis.
The Financials and Health Care sectors contributed most to return for the period. The sectors detracting the most from return were Information Technology and Materials.
Top contributors to Fund return included KBC Group N.V. and New World Development Co. Ltd., while Sharp Corp. and Elpida Memory, Inc. were the largest detractors.
Cumulative Fund Performance: December 3, 2010 – October 31, 2012
| TOTAL RETURNS FOR THE PERIOD ENDED OCTOBER 31, 2012 | ||||||||
| One Year | Since Inception (12/03/10) | |||||||
Guggenheim MSCI EAFE Equal Weight ETF | 2.21 | % | (2.25) | % | ||||
MSCI EAFE Equal Weighted Index | 2.74 | % | (1.48) | % | ||||
MSCI EAFE Total Return Index | 4.61 | % | 0.02 | % | ||||
The returns presented above do not reflect the effect of taxes. Index returns represent total returns. Performance displayed represents past performance, which is no guarantee of future results.
Fund performance is subject to daily market volatility and may be better or worse since the end of the last quarter. For up-to-date fund performance, call 800.820.0888 or visit guggenheiminvestments.com.
| GUGGENHEIM ETFS ANNUAL REPORT | 21 |
Table of Contents
PORTFOLIO SUMMARY (Unaudited)
| October 31, 2012
|
GUGGENHEIM MSCI EAFE EQUAL WEIGHT ETF
Sector Allocations*
| Top 10 Holdings* | ||||
| Description | % of Net Assets | |||
FUJI Heavy Industries Ltd. | 0.26 | % | ||
City Developments Ltd. | 0.26 | % | ||
Nippon Steel Corp. | 0.24 | % | ||
Kyocera Corp. | 0.24 | % | ||
Keppel Corp., Ltd. | 0.24 | % | ||
Singapore Airlines Ltd. | 0.24 | % | ||
Central Japan Railway Co. | 0.23 | % | ||
Ricoh Co., Ltd. | 0.23 | % | ||
Sekisui Chemical Co., Ltd. | 0.22 | % | ||
Taisho Pharmaceutical Holdings Co., Ltd. | 0.22 | % | ||
| * | The Fund’s Top Ten Holdings are expressed as a percentage of net assets and the Sector Allocations are expressed as a percentage of the Fund’s equity investments market value. These percentages may change over time. |
| 22 | GUGGENHEIM ETFS ANNUAL REPORT |
Table of Contents
MANAGER’S ANALYSIS (Unaudited)
| October 31, 2012
|
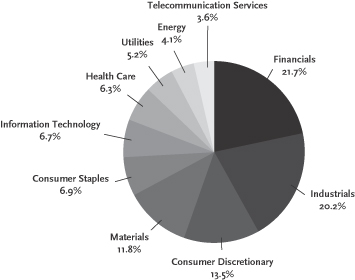
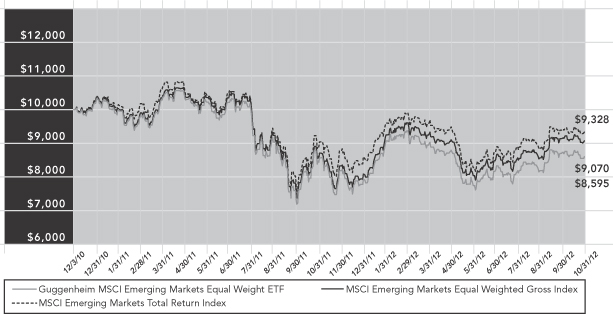
GUGGENHEIM MSCI EMERGING MARKETS EQUAL WEIGHT ETF
Guggenheim MSCI Emerging Markets Equal Weight ETF returned 0.10% for the one-year period ended October 31, 2012, compared with the benchmark MSCI Emerging Markets Equal Weighted Index (3.40%). The cap-weighted MSCI Emerging Markets Total Return Index returned 2.63%. During the period, EWEM achieved over 99% correlation to its benchmark on a daily basis.
The Consumer Staples and Financials sectors contributed most to return for the period. The sectors detracting the most from return were Materials and Information Technology.
Top contributors to Fund return included Cemex SAB de CV ADS and Korea Gas Corp., while iShares MSCI Brazil Index Fund and Wisdom Tree India Earnings Fund were the largest detractors.
Cumulative Fund Performance: December 3, 2010 – October 31, 2012
| TOTAL RETURNS FOR THE PERIOD ENDED OCTOBER 31, 2012 | ||||||||
| One Year | Since Inception (12/03/10) | |||||||
Guggenheim MSCI Emerging Markets Equal Weight ETF | 0.10 | % | (7.61 | )% | ||||
MSCI Emerging Markets Equal Weighted Index | 3.40 | % | (4.98 | )% | ||||
MSCI Emerging Markets Total Return Index | 2.63 | % | (3.58 | )% | ||||
The returns presented above do not reflect the effect of taxes. Index returns represent total returns. Performance displayed represents past performance, which is no guarantee of future results.
Fund performance is subject to daily market volatility and may be better or worse since the end of the last quarter. For up-to-date fund performance, call 800.820.0888 or visit guggenheiminvestments.com.
| GUGGENHEIM ETFS ANNUAL REPORT | 23 |
Table of Contents
PORTFOLIO SUMMARY (Unaudited)
| October 31, 2012
|
GUGGENHEIM MSCI EMERGING MARKETS EQUAL WEIGHT ETF
Sector Allocations*
| Top 10 Holdings* | ||||
| Description | % of Net Assets | |||
Wisdomtree India Earnings Fund | 8.15% | |||
Ishares MSCI Brazil Index Fund | 5.76% | |||
Mediatek, Inc. | 0.33% | |||
Asustek Computer, Inc. | 0.33% | |||
Fomento Economico Mexicano SAB De CV ADR | 0.27% | |||
China Rongsheng Heavy Industries Group Holdings Ltd. | 0.26% | |||
ENN Energy Holdings Ltd. | 0.25% | |||
Anta Sports Products Ltd. | 0.25% | |||
Nine Dragons Paper Holdings Ltd. | 0.25% | |||
Cia De Saneamento Basico Do Estado De Sao Paulo ADR | 0.25% | |||
| * | The Fund’s Top Ten Holdings are expressed as a percentage of net assets and the Sector Allocations are expressed as a percentage of the Fund’s equity investments market value. These percentages may change over time. |
| 24 | GUGGENHEIM ETFS ANNUAL REPORT |
Table of Contents
MANAGER’S ANALYSIS (Unaudited)
| October 31, 2012
|
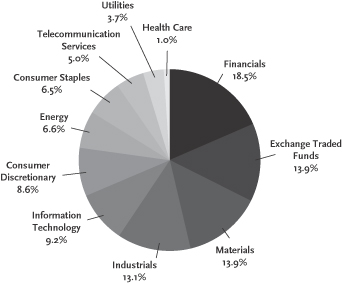
GUGGENHEIM S&P 500® EQUAL WEIGHT CONSUMER DISCRETIONARY ETF
For the one-year period ended October 31, 2012, Guggenheim S&P 500® Equal Weight Consumer Discretionary ETF returned 17.05%, compared to its benchmark, the S&P 500® Equal Weight Total Return Index Consumer Discretionary, which delivered 17.69%, and the capitalization-weighted S&P 500® Consumer Discretionary Total Return Index, which returned 20.22% in the same time period. RCD achieved over 99% correlation to its benchmark on a daily basis. The ETF outperformed the broad-market S&P 500 Total Return Index by almost two percentage points.
The media industry and household durables group were the largest industries contributing to return. The professional services group and the textiles, apparel and luxury goods group were the largest detractors from return.
Pulte Group, Inc. and Expedia, Inc. were among the stocks with largest positive contributions to performance for the year. Abercrombie & Fitch Co.—Class A and Apollo Group, Inc.—Class A were among the stocks with the largest negative contributions to performance.
Cumulative Fund Performance: November 1, 2006 – October 31, 2012
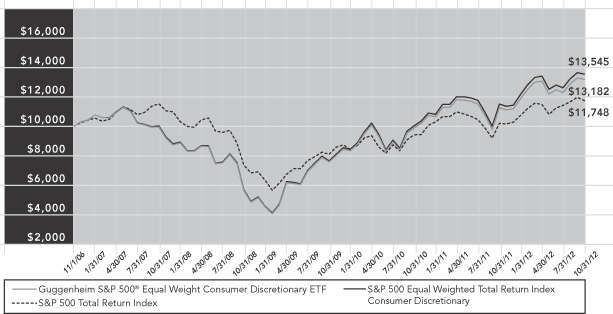
| AVERAGE ANNUAL TOTAL RETURNS FOR THE PERIOD ENDED OCTOBER 31, 2012 | ||||||||||||||||
| One Year | Three Year | Five Year | Since Inception (11/01/06) | |||||||||||||
Guggenheim S&P 500® Equal Weight Consumer Discretionary ETF | 17.05% | 20.23% | 5.76% | 4.71% | ||||||||||||
S&P 500 Equal Weight Total Return Index Consumer Discretionary | 17.69% | 20.93% | 6.20% | 5.19% | ||||||||||||
S&P 500 Total Return Index | 15.21% | 13.21% | 0.36% | 2.72% | ||||||||||||
The returns presented above do not reflect the effect of taxes. Index returns represent total returns. Performance displayed represents past performance, which is no guarantee of future results.
Fund performance is subject to daily market volatility and may be better or worse since the end of the last quarter. For up-to-date fund performance, call 800.820.0888 or visit guggenheiminvestments.com.
| GUGGENHEIM ETFS ANNUAL REPORT | 25 |
Table of Contents
PORTFOLIO SUMMARY (Unaudited)
| October 31, 2012
|
GUGGENHEIM S&P 500® EQUAL WEIGHT CONSUMER DISCRETIONARY ETF
Sector Allocations*
| Top 10 Holdings* | ||||
| Description | % of Net Assets | |||
Netflix, Inc. | 1.70% | |||
Whirlpool Corp. | 1.53% | |||
Lowe’s Cos., Inc. | 1.43% | |||
Time Warner Cable, Inc. | 1.40% | |||
Wynn Resorts Ltd. | 1.39% | |||
O’Reilly Automotive, Inc. | 1.39% | |||
Autozone, Inc. | 1.39% | |||
Comcast Corp. — Class A | 1.38% | |||
Leggett & Platt, Inc. | 1.38% | |||
Ford Motor Co. | 1.38% | |||
| * | The Fund’s Top Ten Holdings are expressed as a percentage of net assets and the Sector Allocations are expressed as a percentage of the Fund’s equity investments market value. These percentages may change over time. |
| 26 | GUGGENHEIM ETFS ANNUAL REPORT |
Table of Contents
MANAGER’S ANALYSIS (Unaudited)
| October 31, 2012
|
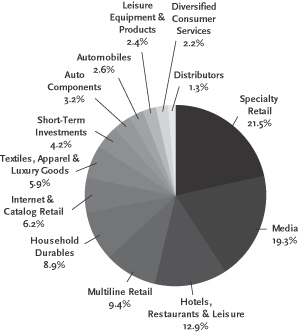
GUGGENHEIM S&P 500® EQUAL WEIGHT CONSUMER STAPLES ETF
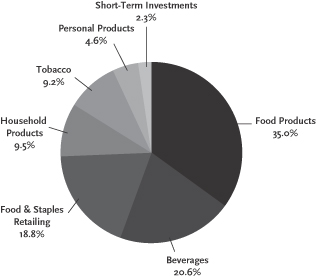
For the one-year period ended October 31, 2012, Guggenheim S&P 500® Equal Weight Consumer Staples ETF returned 14.19%. For the same period, its benchmark, the S&P 500® Equal Weight Total Return Index Consumer Staples, returned 14.89%, while the cap-weighted S&P 500® Consumer Staples Total Return Index delivered a return of 17.55%. RHS achieved over 99% correlation to its benchmark on a daily basis. The ETF underperformed the broad-market S&P 500 Index by about one percentage point.
The food products industry and the beverages industry were the two largest contributors to return. The personal products group and the household products group were the industries contributing least to return.
Constellation Brands, Inc.—Class A and Dean Foods Co. were among the stocks with largest positive contributions to performance for the year. Monster Beverage Corp. and SUPERVALU Inc. were among the stocks with the largest negative contributions to performance.
Cumulative Fund Performance: November 1, 2006 – October 31, 2012
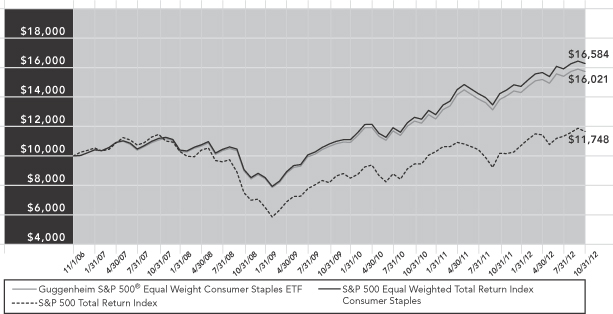
| AVERAGE ANNUAL TOTAL RETURNS FOR THE PERIOD ENDED OCTOBER 31, 2012 | ||||||||||||||||
| One Year | Three Year | Five Year | Since Inception (11/01/06) | |||||||||||||
Guggenheim S&P 500® Equal Weight Consumer Staples ETF | 14.19% | 14.47% | 7.53% | 8.17% | ||||||||||||
S&P 500 Equal Weight Total Return Index Consumer Staples | 14.89% | 15.21% | 8.06% | 8.80% | ||||||||||||
S&P 500 Total Return Index | 15.21% | 13.21% | 0.36% | 2.72% | ||||||||||||
The returns presented above do not reflect the effect of taxes. Index returns represent total returns. Performance displayed represents past performance, which is no guarantee of future results.
Fund performance is subject to daily market volatility and may be better or worse since the end of the last quarter. For up-to-date fund performance, call 800.820.0888 or visit guggenheiminvestments.com.
| GUGGENHEIM ETFS ANNUAL REPORT | 27 |
Table of Contents
PORTFOLIO SUMMARY (Unaudited)
| October 31, 2012
|
GUGGENHEIM S&P 500® EQUAL WEIGHT CONSUMER STAPLES ETF
Sector Allocations*
| Top 10 Holdings* | ||||
| Description | % of Net Assets | |||
Constellation Brands, Inc. — Class A | 2.64% | |||
Conagra Foods, Inc. | 2.61% | |||
Kroger Co. (The) | 2.55% | |||
Dean Foods Co. | 2.51% | |||
Kellogg Co. | 2.50% | |||
General Mills, Inc. | 2.48% | |||
Clorox Co. (The) | 2.46% | |||
Sysco Corp. | 2.46% | |||
H.J. Heinz Co. | 2.46% | |||
Tyson Foods, Inc. — Class A | 2.45% | |||
| * | The Fund’s Top Ten Holdings are expressed as a percentage of net assets and the Sector Allocations are expressed as a percentage of the Fund’s equity investments market value. These percentages may change over time. |
| 28 | GUGGENHEIM ETFS ANNUAL REPORT |
Table of Contents
MANAGER’S ANALYSIS (Unaudited)
| October 31, 2012
|
GUGGENHEIM S&P 500® EQUAL WEIGHT ENERGY ETF
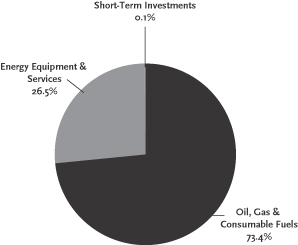
For the one-year period ended October 31, 2012, Guggenheim S&P 500® Equal Weight Energy ETF returned 0.58%. For the same period, its benchmark, the S&P 500® Equal Weight Total Return Index Energy, returned 1.10%, underperforming the cap-weighted S&P 500® Energy Index’s 6.51% total return. RYE achieved over 99% correlation to its benchmark on a daily basis. The ETF underperformed the S&P 500 Index by about 15 percentage points.
The oil, gas and consumable fuels industry was the largest contributor to return. The only other industry composing this Fund, energy equipment and services, detracted from return.
Tesoro Corp. and Marathon Petroleum Corp. were among the stocks with largest positive contributions to performance for the year. Alpha Natural Resources, Inc. and Peabody Energy Corp. were among the stocks with the largest negative contributions to performance.
Cumulative Fund Performance: November 1, 2006 – October 31, 2012

| AVERAGE ANNUAL TOTAL RETURNS FOR THE PERIOD ENDED OCTOBER 31, 2012 | ||||||||||||||||
| One Year | Three Year | Five Year | Since Inception (11/01/06) | |||||||||||||
Guggenheim S&P 500® Equal Weight Energy ETF | 0.58% | 11.17% | 0.25% | 6.03% | ||||||||||||
S&P 500 Equal Weight Total Return Index Energy | 1.10% | 11.80% | 0.85% | 6.66% | ||||||||||||
S&P 500 Total Return Index | 15.21% | 13.21% | 0.36% | 2.72% | ||||||||||||
The returns presented above do not reflect the effect of taxes. Index returns represent total returns. Performance displayed represents past performance, which is no guarantee of future results.
Fund performance is subject to daily market volatility and may be better or worse since the end of the last quarter. For up-to-date fund performance, call 800.820.0888 or visit guggenheiminvestments.com.
| GUGGENHEIM ETFS ANNUAL REPORT | 29 |
Table of Contents
PORTFOLIO SUMMARY (Unaudited)
| October 31, 2012
|
GUGGENHEIM S&P 500® EQUAL WEIGHT ENERGY ETF
Sector Allocations*
| Top 10 Holdings* | ||||
| Description | % of Net Assets | |||
Peabody Energy Corp. | 2.69% | |||
CONSOL Energy, Inc. | 2.65% | |||
Murphy Oil Corp. | 2.64% | |||
Cabot Oil & Gas Corp. | 2.53% | |||
EQT Corp. | 2.53% | |||
Phillips 66 | 2.49% | |||
Diamond Offshore Drilling, Inc. | 2.48% | |||
Spectra Energy Corp. | 2.48% | |||
Williams Cos., Inc. (The) | 2.46% | |||
ENSCO PLC — Class A | 2.46% | |||
| * | The Fund’s Top Ten Holdings are expressed as a percentage of net assets and the Sector Allocations are expressed as a percentage of the Fund’s equity investments market value. These percentages may change over time. |
| 30 | GUGGENHEIM ETFS ANNUAL REPORT |
Table of Contents
MANAGER’S ANALYSIS (Unaudited)
| October 31, 2012
|
GUGGENHEIM S&P 500® EQUAL WEIGHT FINANCIALS ETF
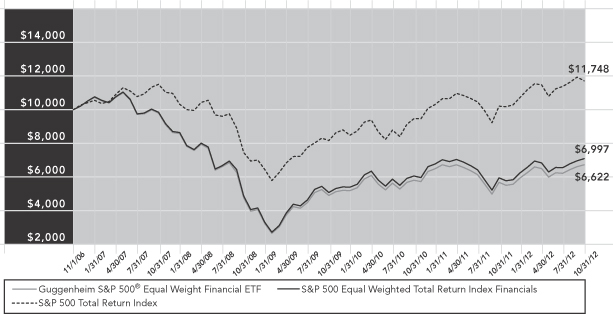
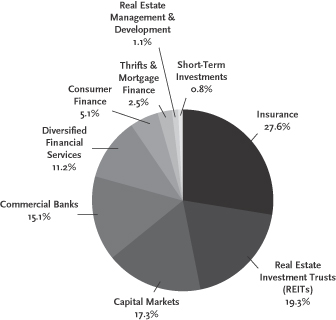
For the one-year period ended October 31, 2012, Guggenheim S&P 500® Equal Weight Financials ETF returned 19.32%. For the same period, its benchmark, the S&P 500® Equal Weight Total Return Index Financials, returned 20.01%, underperforming the cap-weighted S&P 500® Financials Index’s 20.17% total return. RYF achieved a daily correlation of over 99% to its benchmark on a daily basis. The ETF outperformed the S&P 500 Index by about four percentage points.
The commercial banks industry and the insurance industry were the largest contributors to return. No industry detracted from return, but the industries contributing least to performance were the real estate management and development industry and the thrifts and mortgage finance group.
Regions Financial Corp. and Discover Financial Services were among the stocks bringing the largest positive contributions to performance for the year. E*Trade Financial Corp. and Unum Group were among the stocks with the largest negative contributions to performance.
Cumulative Fund Performance: November 1, 2006 – October 31, 2012
| AVERAGE ANNUAL TOTAL RETURNS FOR THE PERIOD ENDED OCTOBER 31, 2012 | ||||||||||||||
| One Year | Three Year | Five Year | Since Inception (11/01/06) | |||||||||||
Guggenheim S&P 500® Equal Weight Financials ETF | 19.32% | 11.69% | (7.50)% | (6.64)% | ||||||||||
S&P 500 Equal Weight Total Return Index Financials | 20.01% | 12.32% | (6.57)% | (5.78)% | ||||||||||
S&P 500 Total Return Index | 15.21% | 13.21% | 0.36% | 2.72% | ||||||||||
The returns presented above do not reflect the effect of taxes. Index returns represent total returns. Performance displayed represents past performance, which is no guarantee of future results.
Fund performance is subject to daily market volatility and may be better or worse since the end of the last quarter. For up-to-date fund performance, call 800.820.0888 or visit guggenheiminvestments.com.
| GUGGENHEIM ETFS ANNUAL REPORT | 31 |
Table of Contents
PORTFOLIO SUMMARY (Unaudited)
| October 31, 2012
|
GUGGENHEIM S&P 500® EQUAL WEIGHT FINANCIALS ETF
Sector Allocations*
| Top 10 Holdings* | ||||
| Description | % of Net Assets | |||
Moody’s Corp. | 1.39% | |||
M&T Bank Corp. | 1.39% | |||
Citigroup, Inc. | 1.36% | |||
Progressive Corp. (The) | 1.36% | |||
Hudson City Bancorp, Inc. | 1.35% | |||
Federated Investors, Inc. — Class B | 1.35% | |||
Hartford Financial Services Group, Inc. | 1.35% | |||
American Tower Corp. | 1.34% | |||
SLM Corp. | 1.33% | |||
Bank of New York Mellon Corp. (The) | 1.32% | |||
| * | The Fund’s Top Ten Holdings are expressed as a percentage of net assets and the Sector Allocations are expressed as a percentage of the Fund’s equity investments market value. These percentages may change over time. |
| 32 | GUGGENHEIM ETFS ANNUAL REPORT |
Table of Contents
MANAGER’S ANALYSIS (Unaudited)
| October 31, 2012
|
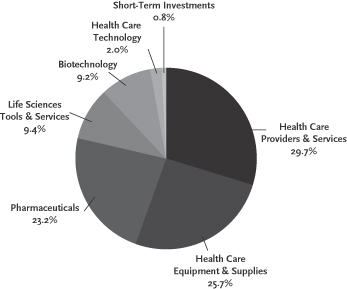
GUGGENHEIM S&P 500® EQUAL WEIGHT HEALTH CARE ETF
For the one-year period ended October 31, 2012, Guggenheim S&P 500® Equal Weight Health Care ETF returned 17.39%. For the same period, its benchmark, the S&P 500® Equal Weight Total Return Index Health Care, returned 18.06% while the cap-weighted S&P 500® Health Care Index delivered a 22.12% return. RYH achieved over 99% correlation to its benchmark on a daily basis. The ETF outperformed the S&P 500 Index by about two percentage points.
The pharmaceuticals and the health care providers and services groups were the largest contributors to return. No industry detracted, but health care technology and life sciences tools contributed least to return.
Gilead Sciences, Inc. and DaVita HealthCare Partners, Inc. were among the stocks with largest positive contributions to performance for the year. Boston Scientific Corp. and Humana, Inc. were among the stocks with the largest negative contributions to performance.
Cumulative Fund Performance: November 1, 2006 – October 31, 2012

| AVERAGE ANNUAL TOTAL RETURNS FOR THE PERIOD ENDED OCTOBER 31, 2012 | ||||||||||||||||
| One Year | Three Year | Five Year | Since Inception (11/01/06) | |||||||||||||
Guggenheim S&P 500® Equal Weight Health Care ETF | 17.39% | 15.91% | 6.47% | 8.21% | ||||||||||||
S&P 500 Equal Weight Total Return Index Health Care | 18.06% | 16.56% | 7.36% | 9.10% | ||||||||||||
S&P 500 Total Return Index | 15.21% | 13.21% | 0.36% | 2.72% | ||||||||||||
The returns presented above do not reflect the effect of taxes. Index returns represent total returns. Performance displayed represents past performance, which is no guarantee of future results.
Fund performance is subject to daily market volatility and may be better or worse since the end of the last quarter. For up-to-date fund performance, call 800.820.0888 or visit guggenheiminvestments.com.
| GUGGENHEIM ETFS ANNUAL REPORT | 33 |
Table of Contents
PORTFOLIO SUMMARY (Unaudited)
| October 31, 2012
|
GUGGENHEIM S&P 500® EQUAL WEIGHT HEALTH CARE ETF
Sector Allocations*
| Top 10 Holdings* | ||||
| Description | % of Net Assets | |||
Davita, Inc. | 2.19% | |||
Aetna, Inc. | 2.14% | |||
Varian Medical Systems, Inc. | 2.07% | |||
Gilead Sciences, Inc. | 2.07% | |||
Intuitive Surgical, Inc. | 2.07% | |||
Cardinal Health, Inc. | 2.05% | |||
McKesson Corp. | 2.04% | |||
CIGNA Corp. | 2.04% | |||
Amgen, Inc. | 2.04% | |||
Cerner Corp. | 2.02% | |||
| * | The Fund’s Top Ten Holdings are expressed as a percentage of net assets and the Sector Allocations are expressed as a percentage of the Fund’s equity investments market value. These percentages may change over time. |
| 34 | GUGGENHEIM ETFS ANNUAL REPORT |
Table of Contents
MANAGER’S ANALYSIS (Unaudited)
| October 31, 2012
|
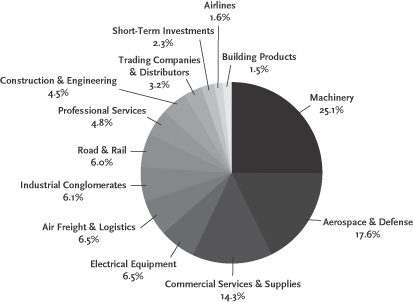
GUGGENHEIM S&P 500® EQUAL WEIGHT INDUSTRIALS ETF
For the one-year period ended October 31, 2012, Guggenheim S&P 500® Equal Weight Industrials ETF returned 12.64% compared to its benchmark S&P 500® Equal Weight Total Return Index Industrials, which returned 13.29%, and the capitalization-weighted S&P 500® Industrials Index, which had a 13.06% return. RGI achieved over 99% correlation to its benchmark on a daily basis. The ETF underperformed the S&P 500 Index by more than two percentage points.
The machinery industry and the aerospace and defense industry contributed the most to return. The air freight and logistics industry was the only detractor from return. The road and rail segment made the least contribution to return.
Masco Corp. and Ingersoll-Rand PLC were among the stocks with largest positive contributions to performance for the year. R.R. Donnelley & Sons Co. and Joy Global, Inc. were among the stocks with the largest negative contributions to performance.
Cumulative Fund Performance: November 1, 2006 – October 31, 2012

| AVERAGE ANNUAL TOTAL RETURNS FOR THE PERIOD ENDED OCTOBER 31, 2012 | ||||||||||||||||
| One Year | Three Year | Five Year | Since Inception (11/01/06) | |||||||||||||
Guggenheim S&P 500® Equal Weight Industrials ETF | 12.64% | 14.60% | 1.50% | 4.66% | ||||||||||||
S&P 500 Equal Weight Total Return Index Industrials | 13.29% | 15.20% | 2.08% | 5.24% | ||||||||||||
S&P 500 Total Return Index | 15.21% | 13.21% | 0.36% | 2.72% | ||||||||||||
The returns presented above do not reflect the effect of taxes. Index returns represent total returns. Performance displayed represents past performance, which is no guarantee of future results.
Fund performance is subject to daily market volatility and may be better or worse since the end of the last quarter. For up-to-date fund performance, call 800.820.0888 or visit guggenheiminvestments.com.
| GUGGENHEIM ETFS ANNUAL REPORT | 35 |
Table of Contents
PORTFOLIO SUMMARY (Unaudited)
| October 31, 2012
|
GUGGENHEIM S&P 500® EQUAL WEIGHT INDUSTRIALS ETF
Sector Allocations*
| Top 10 Holdings* | ||||
| Description | % of Net Assets | |||
Precision Castparts Corp. | 1.76% | |||
ADT Corp. (The) | 1.75% | |||
Equifax, Inc. | 1.73% | |||
C.H. Robinson Worldwide, Inc. | 1.73% | |||
Snap-On, Inc. | 1.73% | |||
Ryder System, Inc. | 1.72% | |||
Deere & Co. | 1.71% | |||
Iron Mountain, Inc. | 1.71% | |||
Roper Industries, Inc. | 1.70% | |||
Northrop Grumman Corp. | 1.70% | |||
| * | The Fund’s Top Ten Holdings are expressed as a percentage of net assets and the Sector Allocations are expressed as a percentage of the Fund’s equity investments market value. These percentages may change over time. |
| 36 | GUGGENHEIM ETFS ANNUAL REPORT |
Table of Contents
MANAGER’S ANALYSIS (Unaudited)
| October 31, 2012
|
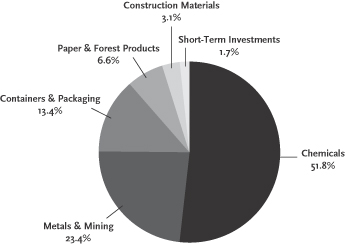
GUGGENHEIM S&P 500® EQUAL WEIGHT MATERIALS ETF
For the one-year period ended October 31, 2012, Guggenheim S&P 500® Equal Weight Materials ETF returned 8.99% compared to the benchmark S&P 500® Equal Weight Total Return Index Materials return of 9.56% and the capitalization-weighted S&P 500® Materials Index’s 7.41% return. RTM achieved over 99% correlation to its benchmark on a daily basis. The ETF underperformed the S&P 500 Index by about six percentage points.
The chemicals industry and the paper and forest products industry were the largest contributors to return. Metals and mining was the only industry to detract from return. The containers and packaging group contributed least to return.
Sherwin-Williams Co. and Eastman Chemical Co. were among the stocks with the largest positive contributions to performance for the year. Cliff’s Natural Resources, Inc. and Allegheny Technologies, Inc. were among the stocks with the largest negative contributions to performance.
Cumulative Fund Performance: November 1, 2006 – October 31, 2012

| AVERAGE ANNUAL TOTAL RETURNS FOR THE PERIOD ENDED OCTOBER 31, 2012 | ||||||||||||||||
| One Year | Three Year | Five Year | Since Inception (11/01/06) | |||||||||||||
Guggenheim S&P 500® Equal Weight Materials ETF | 8.99% | 12.06% | 2.54% | 5.85% | ||||||||||||
S&P 500 Equal Weight Total Return Index Materials | 9.56% | 12.69% | 3.27% | 6.64% | ||||||||||||
S&P 500 Total Return Index | 15.21% | 13.21% | 0.36% | 2.72% | ||||||||||||
The returns presented above do not reflect the effect of taxes. Index returns represent total returns. Performance displayed represents past performance, which is no guarantee of future results.
Fund performance is subject to daily market volatility and may be better or worse since the end of the last quarter. For up-to-date fund performance, call 800.820.0888 or visit guggenheiminvestments.com.
| GUGGENHEIM ETFS ANNUAL REPORT | 37 |
Table of Contents
PORTFOLIO SUMMARY (Unaudited)
| October 31, 2012
|
GUGGENHEIM S&P 500® EQUAL WEIGHT MATERIALS ETF
Sector Allocations*
| Top 10 Holdings* | ||||
| Description | % of Net Assets | |||
Ecolab, Inc. | 3.69% | |||
Airgas, Inc. | 3.68% | |||
International Flavors & Fragrances, Inc. | 3.64% | |||
Bemis Co., Inc. | 3.58% | |||
Eastman Chemical Co. | 3.43% | |||
International Paper Co. | 3.43% | |||
Lyondellbasell Industries NV — Class A | 3.40% | |||
Sealed Air Corp. | 3.38% | |||
Ball Corp. | 3.36% | |||
PPG Industries, Inc. | 3.35% | |||
| * | The Fund’s Top Ten Holdings are expressed as a percentage of net assets and the Sector Allocations are expressed as a percentage of the Fund’s equity investments market value. These percentages may change over time. |
| 38 | GUGGENHEIM ETFS ANNUAL REPORT |
Table of Contents
MANAGER’S ANALYSIS (Unaudited)
| October 31, 2012
|
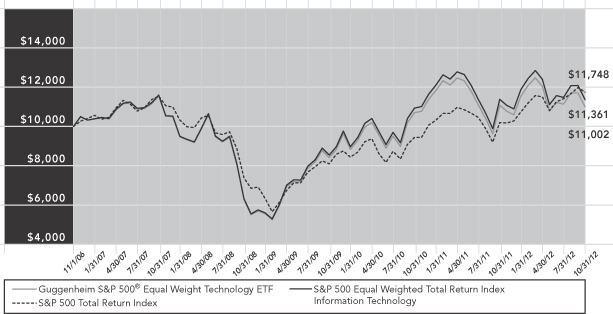
GUGGENHEIM S&P 500® EQUAL WEIGHT TECHNOLOGY ETF
For the one-year period ended October 31, 2012, Guggenheim S&P 500® Equal Weight Technology ETF returned -0.71% compared to its benchmark S&P 500® Equal Weight Total Return Index Technology, which returned -0.19%, and the capitalization-weighted S&P 500® Technology Index, which had a return of 10.71%. RYT achieved over 99% correlation to its benchmark on a daily basis. The ETF underperformed the S&P 500 Index by about 16 percentage points.
The IT services group and the internet software and services group were the largest contributors to return. The semiconductor group and computers and peripherals group were the largest detractors from return.
Akamai Technologies, Inc. and Apple, Inc. were among the stocks with largest positive contributions to performance for the year. Advanced Micro Devices, Inc. and Electronic Arts, Inc. were among the stocks with the largest negative contributions to performance.
Cumulative Fund Performance: November 1, 2006 – October 31, 2012
| AVERAGE ANNUAL TOTAL RETURNS FOR THE PERIOD ENDED OCTOBER 31, 2012 | ||||||||||||||||
| One Year | Three Year | Five Year | Since Inception (11/01/06) | |||||||||||||
Guggenheim S&P 500® Equal Weight Technology ETF | (0.71) | % | 9.35 | % | (0.96) | % | 1.60 | % | ||||||||
S&P 500 Equal Weight Total Return Index Information Technology | (0.19) | % | 9.99 | % | (0.41) | % | 2.15 | % | ||||||||
S&P 500 Total Return Index | 15.21 | % | 13.21 | % | 0.36 | % | 2.72 | % | ||||||||
The returns presented above do not reflect the effect of taxes. Index returns represent total returns. Performance displayed represents past performance, which is no guarantee of future results.
Fund performance is subject to daily market volatility and may be better or worse since the end of the last quarter. For up-to-date fund performance, call 800.820.0888 or visit guggenheiminvestments.com.
| GUGGENHEIM ETFS ANNUAL REPORT | 39 |
Table of Contents
PORTFOLIO SUMMARY (Unaudited)
| October 31, 2012
|
GUGGENHEIM S&P 500® EQUAL WEIGHT TECHNOLOGY ETF
Sector Allocations*
| Top 10 Holdings* | ||||
| Description | % of Net Assets | |||
Yahoo!, Inc. | 1.70% | |||
Fiserv, Inc. | 1.66% | |||
Fidelity National Information Services, Inc. | 1.65% | |||
Visa, Inc. — Class A | 1.65% | |||
LAM Research Corp. | 1.64% | |||
Accenture PLC — Class A | 1.63% | |||
Motorola Solutions, Inc. | 1.63% | |||
Adobe Systems, Inc. | 1.62% | |||
Mastercard, Inc. — Class A | 1.61% | |||
Automatic Data Processing, Inc. | 1.57% | |||
| * | The Fund’s Top Ten Holdings are expressed as a percentage of net assets and the Sector Allocations are expressed as a percentage of the Fund’s equity investments market value. These percentages may change over time. |
| 40 | GUGGENHEIM ETFS ANNUAL REPORT |
Table of Contents
MANAGER’S ANALYSIS (Unaudited)
| October 31, 2012
|
GUGGENHEIM S&P 500® EQUAL WEIGHT UTILITIES ETF
For the one-year period ended October 31, 2012, Guggenheim S&P 500® Equal Weight Utilities ETF returned 15.98% while its benchmark, the S&P 500® Equal Weight Telecommunication Services & Utilities Total Return Index, returned 16.71%. RYU had a 99% correlation to its benchmark on a daily basis. The ETF, which includes the telecommunications sector, performed in-line with the S&P 500 Index.
The multi-utilities group and the wireless telecommunications services group were the largest contributors to return. No group detracted from return, but the independent power producers group contributed least to return.
Sprint Nextel Corp. and Metro PCS Communications, Inc. were among the stocks with largest positive contributions to performance for the year. Exelon Corp. and Windstream Corp. were among the stocks with the largest negative contributions to performance.
Cumulative Fund Performance: November 1, 2006 – October 31, 2012

| AVERAGE ANNUAL TOTAL RETURNS FOR THE PERIOD ENDED OCTOBER 31, 2012 | ||||||||||||||||
| One Year | Three Year | Five Year | Since Inception (11/01/06) | |||||||||||||
Guggenheim S&P 500® Equal Weight Utilities ETF | 15.98% | 17.00% | 3.21% | 5.30% | ||||||||||||
S&P 500 Equal Weight Total Return Index Telecommunications | 16.71% | 17.77% | 3.80% | 5.90% | ||||||||||||
S&P 500 Total Return Index | 15.21% | 13.21% | 0.36% | 2.72% | ||||||||||||
The returns presented above do not reflect the effect of taxes. Index returns represent total returns. Performance displayed represents past performance, which is no guarantee of future results.
Fund performance is subject to daily market volatility and may be better or worse since the end of the last quarter. For up-to-date fund performance, call 800.820.0888 or visit guggenheiminvestments.com.
| GUGGENHEIM ETFS ANNUAL REPORT | 41 |
Table of Contents
PORTFOLIO SUMMARY (Unaudited)
| October 31, 2012
|
GUGGENHEIM S&P 500® EQUAL WEIGHT UTILITIES ETF
Sector Allocations*
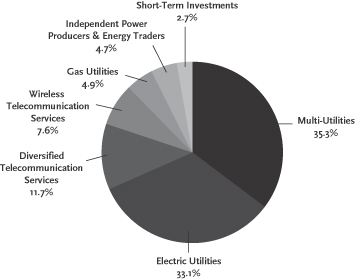
| Top 10 Holdings* | ||||
| Description | % of Net Assets | |||
Entergy Corp. | 2.69% | |||
Sempra Energy | 2.69% | |||
Firstenergy Corp. | 2.68% | |||
DTE Energy Co. | 2.68% | |||
Sprint Nextel Corp. | 2.67% | |||
Crown Castle International Corp. | 2.66% | |||
CMS Energy Corp. | 2.66% | |||
Pepco Holdings, Inc. | 2.65% | |||
Northeast Utilities | 2.64% | |||
Southern Co. | 2.63% | |||
| * | The Fund’s Top Ten Holdings are expressed as a percentage of net assets and the Sector Allocations are expressed as a percentage of the Fund’s equity investments market value. These percentages may change over time. |
| 42 | GUGGENHEIM ETFS ANNUAL REPORT |
Table of Contents
| SCHEDULE OF INVESTMENTS | October 31, 2012 |
GUGGENHEIM S&P MIDCAP 400® EQUAL WEIGHT ETF
| SHARES | VALUE | |||||||
COMMON STOCKS - 99.8% |
| |||||||
Aerospace & Defense - 1.6% |
| |||||||
Alliant Techsystems, Inc. | 161 | $ | 9,224 | |||||
BE Aerospace, Inc.* | 198 | 8,928 | ||||||
Esterline Technologies Corp.* | 139 | 8,033 | ||||||
Exelis, Inc. | 761 | 8,417 | ||||||
Huntington Ingalls Industries, Inc.* | 196 | 8,306 | ||||||
Triumph Group, Inc. | 134 | 8,766 | ||||||
|
| |||||||
Total Aerospace & Defense |
| 51,674 | ||||||
|
| |||||||
Air Freight & Logistics - 0.3% | ||||||||
UTi Worldwide, Inc. | 588 | 8,167 | ||||||
|
| |||||||
Total Air Freight & Logistics |
| 8,167 | ||||||
|
| |||||||
Airlines - 0.6% | ||||||||
Alaska Air Group, Inc.* | 238 | 9,101 | ||||||
JetBlue Airways Corp.* | 1,660 | 8,781 | ||||||
|
| |||||||
Total Airlines |
| 17,882 | ||||||
|
| |||||||
Auto Components - 0.2% | ||||||||
Gentex Corp. | 433 | 7,456 | ||||||
|
| |||||||
Total Auto Components |
| 7,456 | ||||||
|
| |||||||
Automobiles - 0.3% | ||||||||
Thor Industries, Inc. | 229 | 8,709 | ||||||
|
| |||||||
Total Automobiles |
| 8,709 | ||||||
|
| |||||||
Biotechnology - 0.7% | ||||||||
Regeneron Pharmaceuticals, Inc.* | 55 | 7,827 | ||||||
United Therapeutics Corp.* | 144 | 6,576 | ||||||
Vertex Pharmaceuticals, Inc.* | 141 | 6,802 | ||||||
|
| |||||||
Total Biotechnology |
| 21,205 | ||||||
|
| |||||||
Building Products - 0.5% | ||||||||
Fortune Brands Home & Security, Inc.* | 291 | 8,276 | ||||||
Lennox International, Inc. | 177 | 8,859 | ||||||
|
| |||||||
Total Building Products |
| 17,135 | ||||||
|
| |||||||
Capital Markets - 2.2% | ||||||||
Affiliated Managers Group, Inc.* | 64 | 8,096 | ||||||
Apollo Investment Corp. | 1,014 | 8,061 | ||||||
Eaton Vance Corp. | 277 | 7,795 | ||||||
Greenhill & Co., Inc. | 159 | 7,587 | ||||||
Janus Capital Group, Inc. | 875 | 7,437 | ||||||
Jefferies Group, Inc. | 512 | 7,291 | ||||||
Raymond James Financial, Inc. | 213 | 8,124 | ||||||
SEI Investments Co. | 360 | 7,877 | ||||||
Waddell & Reed Financial, Inc. — Class A | 241 | 8,033 | ||||||
|
| |||||||
Total Capital Markets |
| 70,301 | ||||||
|
| |||||||
Chemicals - 3.0% | ||||||||
Albemarle Corp. | 152 | 8,377 | ||||||
Ashland, Inc. | 108 | 7,684 | ||||||
Cabot Corp. | 209 | 7,474 | ||||||
Cytec Industries, Inc. | 119 | 8,190 | ||||||
Intrepid Potash, Inc.* | 337 | 7,323 | ||||||
Minerals Technologies, Inc. | 111 | 7,954 | ||||||
NewMarket Corp. | 32 | 8,682 | ||||||
Olin Corp. | 354 | 7,342 | ||||||
| SHARES | VALUE | |||||||
RPM International, Inc. | 282 | $ | 7,518 | |||||
Scotts Miracle-Gro Co.(The) — Class A | 184 | 7,877 | ||||||
Sensient Technologies Corp. | 221 | 8,040 | ||||||
Valspar Corp. | 143 | 8,012 | ||||||
|
| |||||||
Total Chemicals |
| 94,473 | ||||||
|
| |||||||
Commercial Banks - 5.4% | ||||||||
Associated Banc-Corp. | 596 | 7,683 | ||||||
BancorpSouth, Inc. | 528 | 7,471 | ||||||
Bank of Hawaii Corp. | 168 | 7,419 | ||||||
Cathay General Bancorp | 453 | 8,014 | ||||||
City National Corp. | 151 | 7,716 | ||||||
Commerce Bancshares, Inc. | 193 | 7,349 | ||||||
Cullen/Frost Bankers, Inc. | 137 | 7,576 | ||||||
East West Bancorp, Inc. | 358 | 7,622 | ||||||
First Niagara Financial Group, Inc. | 976 | 8,081 | ||||||
FirstMerit Corp. | 540 | 7,484 | ||||||
Fulton Financial Corp. | 771 | 7,494 | ||||||
Hancock Holding Co. | 248 | 7,834 | ||||||
International Bancshares Corp. | 408 | 7,405 | ||||||
Prosperity Bancshares, Inc. | 182 | 7,619 | ||||||
Signature Bank* | 119 | 8,478 | ||||||
SVB Financial Group* | 132 | 7,470 | ||||||
Synovus Financial Corp.a | 3,367 | 8,249 | ||||||
TCF Financial Corp. | 667 | 7,631 | ||||||
Trustmark Corp. | 322 | 7,557 | ||||||
Valley National Bancorp | 767 | 7,471 | ||||||
Webster Financial Corp. | 338 | 7,436 | ||||||
Westamerica Bancorp | 169 | 7,456 | ||||||
|
| |||||||
Total Commercial Banks |
| 168,515 | ||||||
|
| |||||||
Commercial Services & Supplies - 2.6% | ||||||||
Brink’s Co.(The) | 331 | 8,709 | ||||||
Clean Harbors, Inc.* | 151 | 8,811 | ||||||
Copart, Inc.* | 296 | 8,522 | ||||||
Corrections Corp. of America | 237 | 7,975 | ||||||
Deluxe Corp. | 256 | 8,066 | ||||||
Herman Miller, Inc. | 378 | 7,329 | ||||||
HNI Corp. | 259 | 7,128 | ||||||
Mine Safety Appliances Co. | 215 | 8,299 | ||||||
Rollins, Inc. | 341 | 7,730 | ||||||
Waste Connections, Inc. | 277 | 9,094 | ||||||
|
| |||||||
Total Commercial Services & Supplies |
| 81,663 | ||||||
|
| |||||||
Communications Equipment - 1.6% | ||||||||
ADTRAN, Inc. | 404 | 6,823 | ||||||
Ciena Corp.* | 553 | 6,863 | ||||||
InterDigital, Inc. | 222 | 8,456 | ||||||
Plantronics, Inc. | 218 | 7,072 | ||||||
Polycom, Inc.* | 684 | 6,854 | ||||||
Riverbed Technology, Inc.* | 360 | 6,649 | ||||||
Tellabs, Inc. | 2,173 | 6,345 | ||||||
|
| |||||||
Total Communications Equipment |
| 49,062 | ||||||
|
| |||||||
Computers & Peripherals - 0.9% | ||||||||
Diebold, Inc. | 237 | 7,051 | ||||||
Lexmark International, Inc. — Class A | 315 | 6,697 | ||||||
| See Notes to Financial Statements. | GUGGENHEIM ETFS ANNUAL REPORT | 43 |
Table of Contents
| SCHEDULE OF INVESTMENTS (continued) | October 31, 2012 |
GUGGENHEIM S&P MIDCAP 400® EQUAL WEIGHT ETF
| SHARES | VALUE | |||||||
NCR Corp.* | 337 | $ | 7,171 | |||||
QLogic Corp.* | 636 | 5,966 | ||||||
|
| |||||||
Total Computers & Peripherals |
| 26,885 | ||||||
|
| |||||||
Construction & Engineering - 1.3% | ||||||||
Aecom Technology Corp.* | 380 | 8,159 | ||||||
Granite Construction, Inc. | 276 | 8,338 | ||||||
KBR, Inc. | 257 | 7,160 | ||||||
Shaw Group, Inc.(The)* | 188 | 8,232 | ||||||
URS Corp. | 218 | 7,299 | ||||||
|
| |||||||
Total Construction & Engineering |
| 39,188 | ||||||
|
| |||||||
Construction Materials - 0.2% |
| |||||||
Martin Marietta Materials, Inc. | 90 | 7,408 | ||||||
|
| |||||||
Total Construction Materials |
| 7,408 | ||||||
|
| |||||||
Containers & Packaging - 1.6% | ||||||||
AptarGroup, Inc. | 157 | 8,051 | ||||||
Greif, Inc. — Class A | 177 | 7,427 | ||||||
Packaging Corp. of America | 248 | 8,747 | ||||||
Rock-Tenn Co. — Class A | 121 | 8,856 | ||||||
Silgan Holdings, Inc. | 189 | 8,186 | ||||||
Sonoco Products Co. | 266 | 8,280 | ||||||
|
| |||||||
Total Containers & Packaging |
| 49,547 | ||||||
|
| |||||||
Distributors - 0.3% | ||||||||
LKQ Corp.* | 420 | 8,774 | ||||||
|
| |||||||
Total Distributors |
| 8,774 | ||||||
|
| |||||||
Diversified Consumer Services - 1.6% | ||||||||
DeVry, Inc. | 359 | 9,427 | ||||||
ITT Educational Services, Inc.* | 205 | 4,405 | ||||||
Matthews International Corp. — Class A | 263 | 7,567 | ||||||
Regis Corp. | 430 | 7,164 | ||||||
Service Corp. International | 587 | 8,241 | ||||||
Sotheby’s | 231 | 7,191 | ||||||
Strayer Education, Inc. | 121 | 6,953 | ||||||
|
| |||||||
Total Diversified Consumer Services |
| 50,948 | ||||||
|
| |||||||
Diversified Financial Services - 0.5% | ||||||||
CBOE Holdings, Inc. | 280 | 8,257 | ||||||
MSCI, Inc. — Class A* | 224 | 6,035 | ||||||
|
| |||||||
Total Diversified Financial Services |
| 14,292 | ||||||
|
| |||||||
Diversified Telecommunication Services - 0.3% |
| |||||||
tw telecom, Inc.* | 318 | 8,099 | ||||||
|
| |||||||
Total Diversified Telecommunication Services |
| 8,099 | ||||||
|
| |||||||
Electric Utilities - 2.2% | ||||||||
Cleco Corp. | 197 | 8,501 | ||||||
Great Plains Energy, Inc. | 370 | 8,303 | ||||||
Hawaiian Electric Industries, Inc. | 301 | 7,790 | ||||||
IDACORP, Inc. | 194 | 8,676 | ||||||
NV Energy, Inc. | 455 | 8,649 | ||||||
OGE Energy Corp. | 149 | 8,579 | ||||||
PNM Resources, Inc. | 397 | 8,797 | ||||||
Westar Energy, Inc. | 280 | 8,316 | ||||||
|
| |||||||
Total Electric Utilities |
| 67,611 | ||||||
|
| |||||||
| SHARES | VALUE | |||||||
Electrical Equipment - 1.2% | ||||||||
Acuity Brands, Inc. | 120 | $ | 7,764 | |||||
AMETEK, Inc. | 227 | 8,070 | ||||||
General Cable Corp.* | 257 | 7,332 | ||||||
Hubbell, Inc. — Class B | �� | 102 | 8,540 | |||||
Regal-Beloit Corp. | 113 | 7,365 | ||||||
|
| |||||||
Total Electrical Equipment |
| 39,071 | ||||||
|
| |||||||
Electronic Equipment, Instruments & Components - 1.8% |
| |||||||
Arrow Electronics, Inc.* | 218 | 7,680 | ||||||
Avnet, Inc.* | 246 | 7,048 | ||||||
Ingram Micro, Inc. — Class A* | 494 | 7,509 | ||||||
Itron, Inc.* | 179 | 7,350 | ||||||
National Instruments Corp. | 298 | 7,021 | ||||||
Tech Data Corp.* | 163 | 7,222 | ||||||
Trimble Navigation, Ltd.* | 154 | 7,266 | ||||||
Vishay Intertechnology, Inc.* | 747 | 6,185 | ||||||
|
| |||||||
Total Electronic Equipment, Instruments & Components |
| 57,281 | ||||||
|
| |||||||
Energy Equipment & Services - 2.6% |
| |||||||
Atwood Oceanics, Inc.* | 167 | 7,983 | ||||||
CARBO Ceramics, Inc. | 111 | 8,208 | ||||||
Dresser-Rand Group, Inc.* | 148 | 7,626 | ||||||
Dril-Quip, Inc.* | 110 | 7,619 | ||||||
Helix Energy Solutions Group, Inc.* | 400 | 6,916 | ||||||
Oceaneering International, Inc. | 143 | 7,483 | ||||||
Oil States International, Inc.* | 95 | 6,945 | ||||||
Patterson-UTI Energy, Inc. | 471 | 7,621 | ||||||
Superior Energy Services, Inc.* | 342 | 6,953 | ||||||
Tidewater, Inc. | 163 | 7,744 | ||||||
Unit Corp.* | 180 | 7,263 | ||||||
|
| |||||||
Total Energy Equipment & Services |
| 82,361 | ||||||
|
| |||||||
Food & Staples Retailing - 0.6% | ||||||||
Harris Teeter Supermarkets, Inc. | 203 | 7,602 | ||||||
SUPERVALU, Inc.a | 3,409 | 10,602 | ||||||
|
| |||||||
Total Food & Staples Retailing |
| 18,204 | ||||||
|
| |||||||
Food Products - 2.3% | ||||||||
Flowers Foods, Inc. | 399 | 7,856 | ||||||
Green Mountain Coffee Roasters, Inc.*,a | 264 | 6,378 | ||||||
Hillshire Brands Co. | 304 | 7,907 | ||||||
Ingredion, Inc. | 148 | 9,096 | ||||||
Lancaster Colony Corp. | 113 | 8,224 | ||||||
Post Holdings, Inc.* | 269 | 8,487 | ||||||
Ralcorp Holdings, Inc.* | 113 | 8,158 | ||||||
Smithfield Foods, Inc.* | 399 | 8,168 | ||||||
Tootsie Roll Industries, Inc.a | 308 | 8,208 | ||||||
|
| |||||||
Total Food Products |
| 72,482 | ||||||
|
| |||||||
Gas Utilities - 1.3% | ||||||||
Atmos Energy Corp. | 232 | 8,345 | ||||||
National Fuel Gas Co. | 151 | 7,958 | ||||||
Questar Corp. | 407 | 8,237 | ||||||
| 44 | GUGGENHEIM ETFS ANNUAL REPORT | See Notes to Financial Statements. |
Table of Contents
| SCHEDULE OF INVESTMENTS (continued) | October��31, 2012 |
GUGGENHEIM S&P MIDCAP 400® EQUAL WEIGHT ETF
| SHARES | VALUE | |||||||
UGI Corp. | 269 | $ | 8,686 | |||||
WGL Holdings, Inc. | 205 | 8,153 | ||||||
|
| |||||||
Total Gas Utilities |
| 41,379 | ||||||
|
| |||||||
Health Care Equipment & Supplies - 2.3% |
| |||||||
Cooper Cos., Inc.(The) | 88 | 8,446 | ||||||
Hill-Rom Holdings, Inc. | 271 | 7,612 | ||||||
Hologic, Inc.* | 392 | 8,083 | ||||||
IDEXX Laboratories, Inc.* | 82 | 7,888 | ||||||
Masimo Corp.* | 341 | 7,492 | ||||||
ResMed, Inc. | 207 | 8,268 | ||||||
STERIS Corp. | 232 | 8,262 | ||||||
Teleflex, Inc. | 117 | 7,950 | ||||||
Thoratec Corp.* | 240 | 8,568 | ||||||
|
| |||||||
Total Health Care Equipment & Supplies |
| 72,569 | ||||||
|
| |||||||
Health Care Providers & Services - 3.1% | ||||||||
AMERIGROUP Corp.* | 90 | 8,221 | ||||||
Community Health Systems, Inc.* | 288 | 7,897 | ||||||
Health Management Associates, Inc. — Class A* | 975 | 7,117 | ||||||
Health Net, Inc.* | 363 | 7,812 | ||||||
Henry Schein, Inc.* | 107 | 7,894 | ||||||
HMS Holdings Corp.* | 253 | 5,842 | ||||||
LifePoint Hospitals, Inc.* | 190 | 6,715 | ||||||
Mednax, Inc.* | 111 | 7,657 | ||||||
Omnicare, Inc. | 231 | 7,976 | ||||||
Owens & Minor, Inc. | 281 | 8,000 | ||||||
Universal Health Services, Inc. — Class B | 188 | 7,781 | ||||||
VCA Antech, Inc.* | 405 | 7,930 | ||||||
WellCare Health Plans, Inc.* | 137 | 6,521 | ||||||
|
| |||||||
Total Health Care Providers & Services |
| 97,363 | ||||||
|
| |||||||
Health Care Technology - 0.3% | ||||||||
Allscripts Healthcare Solutions, Inc.* | 716 | 9,251 | ||||||
|
| |||||||
Total Health Care Technology |
| 9,251 | ||||||
|
| |||||||
Hotels, Restaurants & Leisure - 2.5% | ||||||||
Bally Technologies, Inc.* | 174 | 8,686 | ||||||
Bob Evans Farms, Inc. | 201 | 7,652 | ||||||
Brinker International, Inc. | 233 | 7,176 | ||||||
Cheesecake Factory, Inc.(The) | 234 | 7,736 | ||||||
International Speedway Corp. — Class A | 287 | 7,319 | ||||||
Life Time Fitness, Inc.* | 169 | 7,586 | ||||||
Panera Bread Co. — Class A* | 48 | 8,095 | ||||||
Scientific Games Corp. — Class A* | 982 | 8,082 | ||||||
Wendy’s Co.(The) | 1,794 | 7,660 | ||||||
WMS Industries, Inc.* | 464 | 7,624 | ||||||
|
| |||||||
Total Hotels, Restaurants & Leisure |
| 77,616 | ||||||
|
| |||||||
Household Durables - 2.0% | ||||||||
Jarden Corp. | 153 | 7,619 | ||||||
KB Home | 602 | 9,620 | ||||||
MDC Holdings, Inc. | 212 | 8,107 | ||||||
Mohawk Industries, Inc.* | 104 | 8,681 | ||||||
NVR, Inc.* | 9 | 8,134 | ||||||
Tempur-Pedic International, Inc.* | 236 | 6,240 | ||||||
| SHARES | VALUE | |||||||
Toll Brothers, Inc.* | 226 | $ | 7,460 | |||||
Tupperware Brands Corp. | 142 | 8,392 | ||||||
|
| |||||||
Total Household Durables |
| 64,253 | ||||||
|
| |||||||
Household Products - 0.5% | ||||||||
Church & Dwight Co., Inc. | 154 | 7,817 | ||||||
Energizer Holdings, Inc. | 120 | 8,756 | ||||||
|
| |||||||
Total Household Products |
| 16,573 | ||||||
|
| |||||||
Industrial Conglomerates - 0.3% | ||||||||
Carlisle Cos., Inc. | 149 | 8,277 | ||||||
|
| |||||||
Total Industrial Conglomerates |
| 8,277 | ||||||
|
| |||||||
Insurance - 4.4% | ||||||||
Alleghany Corp.* | 23 | 7,995 | ||||||
American Financial Group, Inc. | 211 | 8,187 | ||||||
Arthur J. Gallagher & Co. | 220 | 7,797 | ||||||
Aspen Insurance Holdings Ltd. | 267 | 8,638 | ||||||
Brown & Brown, Inc. | 308 | 7,869 | ||||||
Everest Re Group Ltd. | 74 | 8,218 | ||||||
Fidelity National Financial, Inc. — Class A | 413 | 8,842 | ||||||
First American Financial Corp. | 391 | 8,895 | ||||||
Hanover Insurance Group, Inc.(The) | 216 | 7,800 | ||||||
HCC Insurance Holdings, Inc. | 241 | 8,589 | ||||||
Kemper Corp. | 257 | 7,967 | ||||||
Mercury General Corp. | 206 | 8,349 | ||||||
Old Republic International Corp. | 847 | 8,368 | ||||||
Protective Life Corp. | 287 | 7,835 | ||||||
Reinsurance Group of America, Inc. | 137 | 7,250 | ||||||
StanCorp Financial Group, Inc. | 252 | 8,656 | ||||||
W.R. Berkley Corp. | 213 | 8,284 | ||||||
|
| |||||||
Total Insurance |
| 139,539 | ||||||
|
| |||||||
Internet & Catalog Retail - 0.3% | ||||||||
HSN, Inc. | 171 | 8,895 | ||||||
|
| |||||||
Total Internet & Catalog Retail |
| 8,895 | ||||||
|
| |||||||
Internet Software & Services - 1.2% | ||||||||
AOL, Inc.* | 242 | 8,308 | ||||||
Equinix, Inc.* | 42 | 7,577 | ||||||
Monster Worldwide, Inc.* | 997 | 6,202 | ||||||
Rackspace Hosting, Inc.* | 125 | 7,961 | ||||||
ValueClick, Inc.* | 473 | 7,885 | ||||||
|
| |||||||
Total Internet Software & Services |
| 37,933 | ||||||
|
| |||||||
IT Services - 3.5% | ||||||||
Acxiom Corp.* | 444 | 8,103 | ||||||
Alliance Data Systems Corp.* | 58 | 8,297 | ||||||
Broadridge Financial Solutions, Inc. | 339 | 7,780 | ||||||
Convergys Corp. | 511 | 8,590 | ||||||
CoreLogic, Inc.* | 305 | 7,259 | ||||||
DST Systems, Inc. | 149 | 8,499 | ||||||
Gartner, Inc.* | 165 | 7,658 | ||||||
Global Payments, Inc. | 189 | 8,080 | ||||||
Jack Henry & Associates, Inc. | 218 | 8,284 | ||||||
Lender Processing Services, Inc. | 283 | 6,823 | ||||||
Mantech International Corp. — Class A | 352 | 8,085 | ||||||
NeuStar, Inc. — Class A* | 207 | 7,574 | ||||||
| See Notes to Financial Statements. | GUGGENHEIM ETFS ANNUAL REPORT | 45 |
Table of Contents
| SCHEDULE OF INVESTMENTS (continued) | October 31, 2012 |
GUGGENHEIM S&P MIDCAP 400® EQUAL WEIGHT ETF
| SHARES | VALUE | |||||||
VeriFone Systems, Inc.* | 259 | $ | 7,677 | |||||
WEX, Inc.* | 113 | 8,337 | ||||||
|
| |||||||
Total IT Services |
| 111,046 | ||||||
|
| |||||||
Leisure Equipment & Products - 0.3% | ||||||||
Polaris Industries, Inc. | 96 | 8,112 | ||||||
|
| |||||||
Total Leisure Equipment & Products |
| 8,112 | ||||||
|
| |||||||
Life Sciences Tools & Services - 1.3% | ||||||||
Bio-Rad Laboratories, Inc. — Class A* | 75 | 7,601 | ||||||
Charles River Laboratories International, Inc.* | 213 | 7,949 | ||||||
Covance, Inc.* | 173 | 8,427 | ||||||
Mettler-Toledo International, Inc.* | 46 | 7,791 | ||||||
Techne Corp. | 113 | 7,612 | ||||||
|
| |||||||
Total Life Sciences Tools & Services |
| 39,380 | ||||||
|
| |||||||
Machinery - 5.0% | ||||||||
AGCO Corp.* | 174 | 7,919 | ||||||
CLARCOR, Inc. | 165 | 7,465 | ||||||
Crane Co. | 199 | 8,354 | ||||||
Donaldson Co., Inc. | 223 | 7,196 | ||||||
Gardner Denver, Inc. | 129 | 8,944 | ||||||
Graco, Inc. | 156 | 7,497 | ||||||
Harsco Corp. | 371 | 7,416 | ||||||
IDEX Corp. | 198 | 8,421 | ||||||
ITT Corp. | 381 | 7,925 | ||||||
Kennametal, Inc. | 207 | 7,332 | ||||||
Lincoln Electric Holdings, Inc. | 194 | 8,414 | ||||||
Nordson Corp. | 132 | 7,792 | ||||||
Oshkosh Corp.* | 276 | 8,274 | ||||||
SPX Corp. | 119 | 8,162 | ||||||
Terex Corp.* | 322 | 7,261 | ||||||
Timken Co. | 194 | 7,661 | ||||||
Trinity Industries, Inc. | 245 | 7,664 | ||||||
Valmont Industries, Inc. | 60 | 8,106 | ||||||
Wabtec Corp. | 99 | 8,108 | ||||||
Woodward, Inc. | 221 | 7,403 | ||||||
|
| |||||||
Total Machinery |
| 157,314 | ||||||
|
| |||||||
Marine - 0.5% | ||||||||
Kirby Corp.* | 140 | 8,047 | ||||||
Matson, Inc. | 350 | 7,438 | ||||||
|
| |||||||
Total Marine |
| 15,485 | ||||||
|
| |||||||
Media - 2.4% | ||||||||
AMC Networks, Inc. — Class A* | 196 | 9,157 | ||||||
Cinemark Holdings, Inc. | 341 | 8,419 | ||||||
DreamWorks Animation SKG, Inc. — Class A*,a | 454 | 9,248 | ||||||
John Wiley & Sons, Inc. — Class A | 175 | 7,592 | ||||||
Lamar Advertising Co. — Class A* | 250 | 9,812 | ||||||
Meredith Corp. | 220 | 7,363 | ||||||
New York Times Co.(The) — Class A* | 838 | 6,855 | ||||||
Scholastic Corp. | 244 | 8,050 | ||||||
Valassis Communications, Inc.* | 300 | 7,806 | ||||||
|
| |||||||
Total Media |
| 74,302 | ||||||
|
| |||||||
| SHARES | VALUE | |||||||
Metals & Mining - 1.7% | ||||||||
Carpenter Technology Corp. | 147 | $ | 7,146 | |||||
Commercial Metals Co. | 549 | 7,554 | ||||||
Compass Minerals International, Inc. | 114 | 8,989 | ||||||
Reliance Steel & Aluminum Co. | 142 | 7,716 | ||||||
Royal Gold, Inc. | 87 | 7,663 | ||||||
Steel Dynamics, Inc. | 631 | 7,982 | ||||||
Worthington Industries, Inc. | 339 | 7,329 | ||||||
|
| |||||||
Total Metals & Mining |
| 54,379 | ||||||
|
| |||||||
Multi-Utilities - 1.1% | ||||||||
Alliant Energy Corp. | 186 | 8,314 | ||||||
Black Hills Corp. | 232 | 8,299 | ||||||
MDU Resources Group, Inc. | 363 | 7,888 | ||||||
Vectren Corp. | 289 | 8,546 | ||||||
|
| |||||||
Total Multi-Utilities |
| 33,047 | ||||||
|
| |||||||
Multiline Retail - 0.2% | ||||||||
Saks, Inc.*,a | 706 | 7,258 | ||||||
|
| |||||||
Total Multiline Retail |
| 7,258 | ||||||
|
| |||||||
Office Electronics - 0.2% | ||||||||
Zebra Technologies Corp. — Class A* | 214 | 7,689 | ||||||
|
| |||||||
Total Office Electronics |
| 7,689 | ||||||
|
| |||||||
Oil, Gas & Consumable Fuels - 3.1% | ||||||||
Alpha Natural Resources, Inc.* | 1,184 | 10,147 | ||||||
Arch Coal, Inc. | 1,039 | 8,270 | ||||||
Bill Barrett Corp.* | 309 | 7,079 | ||||||
Cimarex Energy Co. | 130 | 7,433 | ||||||
Energen Corp. | 148 | 6,904 | ||||||
Forest Oil Corp.* | 895 | 6,784 | ||||||
HollyFrontier Corp. | 196 | 7,572 | ||||||
Northern Oil and Gas, Inc.* | 424 | 6,428 | ||||||
Plains Exploration & Production Co.* | 205 | 7,310 | ||||||
Quicksilver Resources, Inc.* | 1,830 | 7,082 | ||||||
Rosetta Resources, Inc.* | 165 | 7,597 | ||||||
SM Energy Co. | 142 | 7,657 | ||||||
World Fuel Services Corp. | 217 | 7,530 | ||||||
|
| |||||||
Total Oil, Gas & Consumable Fuels |
| 97,793 | ||||||
|
| |||||||
Paper & Forest Products - 0.5% | ||||||||
Domtar Corp. | 105 | 8,374 | ||||||
Louisiana-Pacific Corp.* | 552 | 8,716 | ||||||
|
| |||||||
Total Paper & Forest Products |
| 17,090 | ||||||
|
| |||||||
Pharmaceuticals - 0.5% | ||||||||
Endo Health Solutions, Inc.* | 244 | 6,993 | ||||||
Medicis Pharmaceutical Corp. — Class A | 189 | 8,205 | ||||||
|
| |||||||
Total Pharmaceuticals |
| 15,198 | ||||||
|
| |||||||
Professional Services - 1.0% | ||||||||
Corporate Executive Board Co.(The) | 163 | 7,328 | ||||||
FTI Consulting, Inc.* | 285 | 7,399 | ||||||
Manpower, Inc. | 197 | 7,474 | ||||||
Towers Watson & Co. — Class A | 152 | 8,164 | ||||||
|
| |||||||
Total Professional Services |
| 30,365 | ||||||
|
| |||||||
| 46 | GUGGENHEIM ETFS ANNUAL REPORT | See Notes to Financial Statements. |
Table of Contents
| SCHEDULE OF INVESTMENTS (continued) | October 31, 2012 |
GUGGENHEIM S&P MIDCAP 400® EQUAL WEIGHT ETF
| SHARES | VALUE | |||||||
Real Estate Investment Trusts (REITs) - 6.7% |
| |||||||
Alexandria Real Estate Equities, Inc. | 107 | $ | 7,536 | |||||
American Campus Communities, Inc. | 179 | 8,110 | ||||||
BioMed Realty Trust, Inc. | 415 | 7,935 | ||||||
BRE Properties, Inc. | 165 | 7,978 | ||||||
Camden Property Trust | 120 | 7,876 | ||||||
Corporate Office Properties Trust | 327 | 8,159 | ||||||
Duke Realty Corp. | 521 | 7,544 | ||||||
Equity One, Inc. | 378 | 7,900 | ||||||
Essex Property Trust, Inc. | 53 | 7,950 | ||||||
Federal Realty Investment Trust | 76 | 8,195 | ||||||
Highwoods Properties, Inc. | 241 | 7,772 | ||||||
Home Properties, Inc. | 128 | 7,781 | ||||||
Hospitality Properties Trust | 328 | 7,583 | ||||||
Liberty Property Trust | 213 | 7,481 | ||||||
Macerich Co.(The) | 134 | 7,638 | ||||||
Mack-Cali Realty Corp. | 292 | 7,589 | ||||||
National Retail Properties, Inc. | 259 | 8,205 | ||||||
Omega Healthcare Investors, Inc. | 334 | 7,662 | ||||||
Potlatch Corp. | 215 | 8,273 | ||||||
Rayonier, Inc. | 160 | 7,842 | ||||||
Realty Income Corp. | 195 | 7,658 | ||||||
Regency Centers Corp. | 163 | 7,827 | ||||||
Senior Housing Properties Trust | 363 | 7,979 | ||||||
SL Green Realty Corp. | 96 | 7,229 | ||||||
Taubman Centers, Inc. | 101 | 7,933 | ||||||
UDR, Inc. | 312 | 7,572 | ||||||
Weingarten Realty Investors | 285 | 7,695 | ||||||
|
| |||||||
Total Real Estate Investment Trusts (REITs) |
| 210,902 | ||||||
|
| |||||||
Real Estate Management & Development - 0.5% |
| |||||||
Alexander & Baldwin, Inc.* | 269 | 7,782 | ||||||
Jones Lang LaSalle, Inc. | 98 | 7,619 | ||||||
|
| |||||||
Total Real Estate Management & Development |
| 15,401 | ||||||
|
| |||||||
Road & Rail - 1.6% | ||||||||
Con-way, Inc. | 269 | 7,831 | ||||||
Genesee & Wyoming, Inc. — Class A* | 120 | 8,696 | ||||||
JB Hunt Transport Services, Inc. | 157 | 9,216 | ||||||
Kansas City Southern | 98 | 7,885 | ||||||
Landstar System, Inc. | 166 | 8,408 | ||||||
Werner Enterprises, Inc. | 375 | 8,685 | ||||||
|
| |||||||
Total Road & Rail |
| 50,721 | ||||||
|
| |||||||
Semiconductors & Semiconductor Equipment - 2.7% |
| |||||||
Atmel Corp.* | 1,266 | 5,906 | ||||||
Cree, Inc.* | 283 | 8,583 | ||||||
Cypress Semiconductor Corp.* | 624 | 6,184 | ||||||
Fairchild Semiconductor International, Inc.* | 548 | 6,444 | ||||||
Integrated Device Technology, Inc.* | 1,290 | 7,018 | ||||||
International Rectifier Corp.* | 431 | 6,676 | ||||||
Intersil Corp. — Class A | 856 | 6,035 | ||||||
MEMC Electronic Materials, Inc.* | 2,559 | 6,449 | ||||||
RF Micro Devices, Inc.* | 1,911 | 8,427 | ||||||
Semtech Corp.* | 303 | 7,566 | ||||||
| SHARES | VALUE | |||||||
Silicon Laboratories, Inc.* | 209 | $ | 8,448 | |||||
Skyworks Solutions, Inc.* | 277 | 6,482 | ||||||
|
| |||||||
Total Semiconductors & Semiconductor Equipment |
| 84,218 | ||||||
|
| |||||||
Software - 3.9% | ||||||||
ACI Worldwide, Inc.* | 181 | 7,077 | ||||||
Advent Software, Inc.* | 330 | 7,161 | ||||||
ANSYS, Inc.* | 112 | 7,939 | ||||||
Cadence Design Systems, Inc.* | 607 | 7,685 | ||||||
Compuware Corp.* | 811 | 7,023 | ||||||
Concur Technologies, Inc.* | 109 | 7,219 | ||||||
Factset Research Systems, Inc. | 79 | 7,153 | ||||||
Fair Isaac Corp. | 180 | 8,388 | ||||||
Informatica Corp.* | 212 | 5,754 | ||||||
Mentor Graphics Corp.* | 485 | 7,527 | ||||||
MICROS Systems, Inc.* | 155 | 7,035 | ||||||
Parametric Technology Corp.* | 338 | 6,821 | ||||||
Rovi Corp.* | 495 | 6,697 | ||||||
Solarwinds, Inc.* | 138 | 6,981 | ||||||
Solera Holdings, Inc. | 187 | 8,754 | ||||||
Synopsys, Inc.* | 244 | 7,857 | ||||||
TIBCO Software, Inc.* | 261 | 6,580 | ||||||
|
| |||||||
Total Software |
| 123,651 | ||||||
|
| |||||||
Specialty Retail - 4.3% | ||||||||
Aaron’s, Inc. | 286 | 8,817 | ||||||
Advance Auto Parts, Inc. | 121 | 8,584 | ||||||
Aeropostale, Inc.* | 554 | 6,620 | ||||||
American Eagle Outfitters, Inc. | 348 | 7,263 | ||||||
ANN, Inc.* | 210 | 7,384 | ||||||
Ascena Retail Group, Inc.* | 384 | 7,603 | ||||||
Barnes & Noble, Inc.* | 657 | 11,064 | ||||||
Cabela’s, Inc.* | 149 | 6,677 | ||||||
Chico’s FAS, Inc. | 430 | 7,998 | ||||||
Dick’s Sporting Goods, Inc. | 157 | 7,850 | ||||||
Foot Locker, Inc. | 223 | 7,471 | ||||||
Guess?, Inc. | 295 | 7,310 | ||||||
Office Depot, Inc.* | 3,326 | 8,248 | ||||||
Rent-A-Center, Inc. | 221 | 7,366 | ||||||
Signet Jewelers Ltd. | 162 | 8,385 | ||||||
Tractor Supply Co. | 85 | 8,180 | ||||||
Williams-Sonoma, Inc. | 184 | 8,506 | ||||||
|
| |||||||
Total Specialty Retail |
| 135,326 | ||||||
|
| |||||||
Textiles, Apparel & Luxury Goods - 1.5% | ||||||||
Carter’s, Inc.* | 145 | 7,839 | ||||||
Deckers Outdoor Corp.* | 168 | 4,810 | ||||||
Hanesbrands, Inc.* | 243 | 8,133 | ||||||
PVH Corp. | 87 | 9,569 | ||||||
Under Armour, Inc. — Class A* | 137 | 7,160 | ||||||
Warnaco Group, Inc.(The)* | 149 | 10,516 | ||||||
|
| |||||||
Total Textiles, Apparel & Luxury Goods |
| 48,027 | ||||||
|
| |||||||
Thrifts & Mortgage Finance - 0.8% | ||||||||
Astoria Financial Corp. | 752 | 7,543 | ||||||
New York Community Bancorp, Inc. | 582 | 8,066 | ||||||
| See Notes to Financial Statements. | GUGGENHEIM ETFS ANNUAL REPORT | 47 |
Table of Contents
| SCHEDULE OF INVESTMENTS (concluded) | October 31, 2012 |
GUGGENHEIM S&P MIDCAP 400® EQUAL WEIGHT ETF
| SHARES | VALUE | |||||||
Washington Federal, Inc. | 479 | $ | 8,038 | |||||
|
| |||||||
Total Thrifts & Mortgage Finance |
| 23,647 | ||||||
|
| |||||||
Tobacco - 0.3% | ||||||||
Universal Corp. | 169 | 8,376 | ||||||
|
| |||||||
Total Tobacco |
| 8,376 | ||||||
|
| |||||||
Trading Companies & Distributors - 1.0% |
| |||||||
GATX Corp. | 183 | 7,587 | ||||||
MSC Industrial Direct Co., Inc. — Class A | 111 | 8,281 | ||||||
United Rentals, Inc.* | 220 | 8,945 | ||||||
Watsco, Inc. | 105 | 7,177 | ||||||
|
| |||||||
Total Trading Companies & Distributors |
| 31,990 | ||||||
|
| |||||||
Water Utilities - 0.3% | ||||||||
Aqua America, Inc. | 332 | 8,429 | ||||||
|
| |||||||
Total Water Utilities |
| 8,429 | ||||||
|
| |||||||
Wireless Telecommunication Services - 0.3% |
| |||||||
Telephone & Data Systems, Inc. | 321 | 7,983 | ||||||
|
| |||||||
Total Wireless Telecommunication Services |
| 7,983 | ||||||
|
| |||||||
Total Common Stocks | 3,129,170 | |||||||
|
| |||||||
SHORT TERM INVESTMENTS - 0.2% | ||||||||
SSgA Government Money Market Fund | 6,442 | 6,442 | ||||||
|
| |||||||
Total Short Term Investments | 6,442 | |||||||
|
| |||||||
| FACE AMOUNT | VALUE | |||||||
SECURITIES LENDING COLLATERAL - 0.5%e |
| |||||||
Joint Repurchase Agreements: | ||||||||
Merrill Lynch, Fenner & Smith, Inc. | $ | 6,045 | $ | 6,045 | ||||
RBS Securities, Inc. | 10,278 | 10,278 | ||||||
|
| |||||||
Total Securities Lending Collateral |
| 16,323 | ||||||
|
| |||||||
Total Investments - 100.5%c |
| 3,151,935 | ||||||
|
| |||||||
Other Assets and Liabilities, net - (0.5)%d |
| (15,286 | ) | |||||
|
| |||||||
Net Assets - 100.0% | $ | 3,136,649 | ||||||
|
| |||||||
| * | Non-Income Producing Security. |
| a | All or a portion of this security was on loan as of October 31, 2012. |
| b | Values determined based on Level 2 inputs (Note F). |
| c | Unless otherwise indicated, the values of the Investments are determined based on Level 1 inputs. |
| d | Amount represents less than 0.05% of net assets. |
| e | Securities lending collateral (Note I). |
| 48 | GUGGENHEIM ETFS ANNUAL REPORT | See Notes to Financial Statements. |
Table of Contents
| SCHEDULE OF INVESTMENTS | October 31, 2012 |
GUGGENHEIM S&P SMALLCAP 600® EQUAL WEIGHT ETF
| SHARES | VALUE | |||||||
COMMON STOCKS - 100.0% |
| |||||||
Aerospace & Defense - 2.1% |
| |||||||
AAR Corp. | 164 | $ | 2,475 | |||||
Aerovironment, Inc.* | 122 | 2,683 | ||||||
American Science & Engineering, Inc. | 45 | 2,861 | ||||||
Ceradyne, Inc. | 110 | 3,846 | ||||||
Cubic Corp. | 55 | 2,684 | ||||||
Curtiss-Wright Corp. | 86 | 2,655 | ||||||
Engility Holdings, Inc.* | 159 | 3,021 | ||||||
GenCorp, Inc.* | 281 | 2,478 | ||||||
Moog, Inc. — Class A* | 70 | 2,591 | ||||||
National Presto Industries, Inc. | 39 | 2,900 | ||||||
Orbital Sciences Corp.* | 186 | 2,492 | ||||||
Teledyne Technologies, Inc.* | 43 | 2,753 | ||||||
|
| |||||||
Total Aerospace & Defense | 33,439 | |||||||
|
| |||||||
Air Freight & Logistics - 0.4% |
| |||||||
Forward Air Corp. | 79 | 2,636 | ||||||
Hub Group, Inc. — Class A* | 91 | 2,822 | ||||||
|
| |||||||
Total Air Freight & Logistics | 5,458 | |||||||
|
| |||||||
Airlines - 0.4% |
| |||||||
Allegiant Travel Co.* | 43 | 3,128 | ||||||
SkyWest, Inc. | 259 | 2,836 | ||||||
|
| |||||||
Total Airlines | 5,964 | |||||||
|
| |||||||
Auto Components - 0.7% |
| |||||||
Drew Industries, Inc.* | 94 | 2,977 | ||||||
Spartan Motors, Inc. | 523 | 2,458 | ||||||
Standard Motor Products, Inc. | 145 | 2,723 | ||||||
Superior Industries International, Inc. | 153 | 2,615 | ||||||
|
| |||||||
Total Auto Components | 10,773 | |||||||
|
| |||||||
Automobiles - 0.2% |
| |||||||
Winnebago Industries, Inc.* | 226 | 2,848 | ||||||
|
| |||||||
Total Automobiles | 2,848 | |||||||
|
| |||||||
Beverages - 0.2% |
| |||||||
Boston Beer Co., Inc. — Class A* | 26 | 2,797 | ||||||
|
| |||||||
Total Beverages | 2,797 | |||||||
|
| |||||||
Biotechnology - 0.9% |
| |||||||
Acorda Therapeutics, Inc.* | 109 | 2,611 | ||||||
ArQule, Inc.* | 505 | 1,268 | ||||||
Cubist Pharmaceuticals, Inc.* | 58 | 2,488 | ||||||
Emergent Biosolutions, Inc.* | 188 | 2,498 | ||||||
Momenta Pharmaceuticals, Inc.* | 187 | 2,371 | ||||||
Spectrum Pharmaceuticals, Inc.*,a | 233 | 2,600 | ||||||
|
| |||||||
Total Biotechnology | 13,836 | |||||||
|
| |||||||
Building Products - 1.6% |
| |||||||
AAON, Inc. | 137 | 2,874 | ||||||
AO Smith Corp. | 50 | 3,038 | ||||||
Apogee Enterprises, Inc. | 158 | 3,218 | ||||||
Gibraltar Industries, Inc.* | 210 | 2,617 | ||||||
Griffon Corp. | 272 | 2,761 | ||||||
NCI Building Systems, Inc.* | 238 | 2,668 | ||||||
Quanex Building Products Corp. | 147 | 2,906 | ||||||
Simpson Manufacturing Co., Inc. | 96 | 2,924 | ||||||
| SHARES | VALUE | |||||||
Universal Forest Products, Inc. | 67 | $ | 2,580 | |||||
|
| |||||||
Total Building Products | 25,586 | |||||||
|
| |||||||
Capital Markets - 1.5% |
| |||||||
Calamos Asset Management, | 240 | 2,592 | ||||||
Financial Engines, Inc.* | 122 | 2,929 | ||||||
HFF, Inc. — Class A* | 175 | 2,438 | ||||||
Investment Technology Group, Inc.* | 309 | 2,608 | ||||||
Piper Jaffray Cos.* | 101 | 2,712 | ||||||
Prospect Capital Corp. | 234 | 2,770 | ||||||
Stifel Financial Corp.* | 77 | 2,441 | ||||||
SWS Group, Inc.* | 440 | 2,504 | ||||||
Virtus Investment Partners, Inc.* | 30 | 2,880 | ||||||
|
| |||||||
Total Capital Markets | 23,874 | |||||||
|
| |||||||
Chemicals - 2.8% |
| |||||||
A. Schulman, Inc. | 110 | 2,823 | ||||||
American Vanguard Corp. | 90 | 3,216 | ||||||
Balchem Corp. | 74 | 2,577 | ||||||
Calgon Carbon Corp.* | 192 | 2,379 | ||||||
H.B. Fuller Co. | 83 | 2,523 | ||||||
Hawkins, Inc. | 69 | 2,698 | ||||||
Innophos Holdings, Inc. | 56 | 2,668 | ||||||
Koppers Holdings, Inc. | 76 | 2,713 | ||||||
Kraton Performance Polymers, Inc.* | 110 | 2,400 | ||||||
LSB Industries, Inc.* | 65 | 2,618 | ||||||
OM Group, Inc.* | 132 | 2,670 | ||||||
PolyOne Corp. | 164 | 3,105 | ||||||
Quaker Chemical Corp. | 59 | 3,126 | ||||||
Stepan Co. | 29 | 2,778 | ||||||
Tredegar Corp. | 150 | 2,546 | ||||||
Zep, Inc. | 192 | 2,751 | ||||||
|
| |||||||
Total Chemicals | 43,591 | |||||||
|
| |||||||
Commercial Banks - 5.8% |
| |||||||
Bank of the Ozarks, Inc. | 81 | 2,652 | ||||||
BBCN Bancorp, Inc. | 215 | 2,565 | ||||||
Boston Private Financial Holdings, Inc. | 276 | 2,545 | ||||||
City Holding Co. | 78 | 2,739 | ||||||
Columbia Banking System, Inc. | 143 | 2,533 | ||||||
Community Bank System, Inc. | 96 | 2,649 | ||||||
CVB Financial Corp. | 220 | 2,380 | ||||||
First BanCorp* | 644 | 2,731 | ||||||
First Commonwealth Financial Corp. | 371 | 2,430 | ||||||
First Financial Bancorp | 157 | 2,465 | ||||||
First Financial Bankshares, Inc. | 77 | 2,790 | ||||||
First Midwest Bancorp, Inc. | 211 | 2,610 | ||||||
FNB Corp. | 234 | 2,511 | ||||||
Glacier Bancorp, Inc. | 174 | 2,523 | ||||||
Hanmi Financial Corp.* | 214 | 2,656 | ||||||
Home BancShares, Inc. | 82 | 2,840 | ||||||
Independent Bank Corp. | 90 | 2,656 | ||||||
National Penn Bancshares, Inc. | 290 | 2,590 | ||||||
NBT Bancorp, Inc. | 127 | 2,701 | ||||||
Old National Bancorp | 201 | 2,466 | ||||||
| See Notes to Financial Statements. | GUGGENHEIM ETFS ANNUAL REPORT | 49 |
Table of Contents
| SCHEDULE OF INVESTMENTS (continued) | October 31, 2012 |
GUGGENHEIM S&P SMALLCAP 600® EQUAL WEIGHT ETF
| SHARES | VALUE | |||||||
PacWest Bancorp | 113 | $ | 2,543 | |||||
Pinnacle Financial Partners, Inc.* | 137 | 2,678 | ||||||
PrivateBancorp, Inc. | 162 | 2,618 | ||||||
S&T Bancorp, Inc. | 151 | 2,653 | ||||||
Simmons First National Corp. — Class A | 114 | 2,837 | ||||||
Sterling Bancorp | 266 | 2,540 | ||||||
Susquehanna Bancshares, Inc. | 251 | 2,603 | ||||||
Texas Capital Bancshares, Inc.* | 58 | 2,753 | ||||||
Tompkins Financial Corp. | 69 | 2,793 | ||||||
UMB Financial Corp. | 54 | 2,405 | ||||||
Umpqua Holdings Corp. | 206 | 2,491 | ||||||
United Bankshares, Inc. | 109 | 2,597 | ||||||
United Community Banks, Inc.* | 324 | 2,819 | ||||||
Wilshire Bancorp, Inc.* | 420 | 2,734 | ||||||
Wintrust Financial Corp. | 72 | 2,660 | ||||||
|
| |||||||
Total Commercial Banks | 91,756 | |||||||
|
| |||||||
Commercial Services & Supplies - 2.5% |
| |||||||
ABM Industries, Inc. | 149 | 2,831 | ||||||
Consolidated Graphics, Inc.* | 97 | 2,862 | ||||||
Encore Capital Group, Inc.* | 93 | 2,697 | ||||||
G&K Services, Inc. — Class A | 83 | 2,677 | ||||||
Geo Group, Inc.(The) | 101 | 2,800 | ||||||
Healthcare Services Group, Inc. | 129 | 3,083 | ||||||
Interface, Inc. | 192 | 2,748 | ||||||
Mobile Mini, Inc.* | 162 | 2,822 | ||||||
Portfolio Recovery Associates, Inc.* | 28 | 2,930 | ||||||
SYKES Enterprises, Inc.* | 204 | 2,778 | ||||||
Tetra Tech, Inc.* | 102 | 2,646 | ||||||
UniFirst Corp. | 41 | 2,852 | ||||||
United Stationers, Inc. | 102 | 2,960 | ||||||
Viad Corp. | 122 | 2,588 | ||||||
|
| |||||||
Total Commercial Services & Supplies | 39,274 | |||||||
|
| |||||||
Communications Equipment - 1.7% |
| |||||||
Arris Group, Inc.* | 199 | 2,734 | ||||||
Bel Fuse, Inc. — Class B | 142 | 2,352 | ||||||
Black Box Corp. | 104 | 2,280 | ||||||
Comtech Telecommunications Corp. | 97 | 2,442 | ||||||
Digi International, Inc.* | 258 | 2,430 | ||||||
Harmonic, Inc.* | 566 | 2,456 | ||||||
Netgear, Inc.* | 71 | 2,521 | ||||||
Oplink Communications, Inc.* | 165 | 2,452 | ||||||
PC-Tel, Inc. | 397 | 2,589 | ||||||
Symmetricom, Inc.* | 416 | 2,558 | ||||||
Viasat, Inc.* | 69 | 2,680 | ||||||
|
| |||||||
Total Communications Equipment | 27,494 | |||||||
|
| |||||||
Computers & Peripherals - 1.0% |
| |||||||
3D Systems Corp.* | 71 | 3,088 | ||||||
Avid Technology, Inc.* | 285 | 1,673 | ||||||
Intermec, Inc.* | 419 | 2,841 | ||||||
Intevac, Inc.* | 442 | 2,210 | ||||||
Novatel Wireless, Inc.* | 1,415 | 2,335 | ||||||
Super Micro Computer, Inc.* | 210 | 1,661 | ||||||
| SHARES | VALUE | |||||||
Synaptics, Inc.* | 105 | $ | 2,432 | |||||
|
| |||||||
Total Computers & Peripherals | 16,240 | |||||||
|
| |||||||
Construction & Engineering - 0.8% |
| |||||||
Aegion Corp.* | 128 | 2,364 | ||||||
Comfort Systems USA, Inc. | 243 | 2,649 | ||||||
Dycom Industries, Inc.* | 190 | 2,706 | ||||||
EMCOR Group, Inc. | 93 | 2,991 | ||||||
Orion Marine Group, Inc.* | 351 | 2,348 | ||||||
|
| |||||||
Total Construction & Engineering | 13,058 | |||||||
|
| |||||||
Construction Materials - 0.6% |
| |||||||
Eagle Materials, Inc. | 60 | 3,178 | ||||||
Headwaters, Inc.* | 374 | 2,689 | ||||||
Texas Industries, Inc.* | 63 | 2,717 | ||||||
|
| |||||||
Total Construction Materials | 8,584 | |||||||
|
| |||||||
Consumer Finance - 0.6% |
| |||||||
Cash America International, Inc. | 68 | 2,658 | ||||||
EZCORP, Inc. — Class A* | 112 | 2,202 | ||||||
First Cash Financial Services, Inc.* | 59 | 2,635 | ||||||
World Acceptance Corp.* | 37 | 2,470 | ||||||
|
| |||||||
Total Consumer Finance | 9,965 | |||||||
|
| |||||||
Containers & Packaging - 0.2% |
| |||||||
Myers Industries, Inc. | 172 | 2,551 | ||||||
|
| |||||||
Total Containers & Packaging | 2,551 | |||||||
|
| |||||||
Distributors - 0.3% |
| |||||||
Pool Corp. | 69 | 2,906 | ||||||
VOXX International Corp.* | 358 | 2,227 | ||||||
|
| |||||||
Total Distributors | 5,133 | |||||||
|
| |||||||
Diversified Consumer Services - 1.3% |
| |||||||
American Public Education, Inc.* | 72 | 2,623 | ||||||
Capella Education Co.* | 76 | 2,373 | ||||||
Career Education Corp.* | 693 | 2,356 | ||||||
Coinstar, Inc.* | 53 | 2,488 | ||||||
Corinthian Colleges, Inc.* | 1,090 | 2,976 | ||||||
Hillenbrand, Inc. | 145 | 2,968 | ||||||
Lincoln Educational Services Corp. | 630 | 2,337 | ||||||
Universal Technical Institute, Inc. | 212 | 2,718 | ||||||
|
| |||||||
Total Diversified Consumer Services | 20,839 | |||||||
|
| |||||||
Diversified Financial Services - 0.4% |
| |||||||
Interactive Brokers Group, Inc. — Class A | 194 | 2,765 | ||||||
MarketAxess Holdings, Inc. | 89 | 2,780 | ||||||
|
| |||||||
Total Diversified Financial Services | 5,545 | |||||||
|
| |||||||
Diversified Telecommunication Services - 0.9% |
| |||||||
Atlantic Tele-Network, Inc. | 69 | 2,859 | ||||||
Cbeyond, Inc.* | 306 | 2,344 | ||||||
Cincinnati Bell, Inc.* | 517 | 2,694 | ||||||
General Communication, Inc. — Class A* | 310 | 2,709 | ||||||
Lumos Networks Corp. | 333 | 2,621 | ||||||
Neutral Tandem, Inc. | 265 | 1,224 | ||||||
|
| |||||||
Total Diversified Telecommunication Services | 14,451 | |||||||
|
| |||||||
| 50 | GUGGENHEIM ETFS ANNUAL REPORT | See Notes to Financial Statements. |
Table of Contents
| SCHEDULE OF INVESTMENTS (continued) | October 31, 2012 |
GUGGENHEIM S&P SMALLCAP 600® EQUAL WEIGHT ETF
| SHARES | VALUE | |||||||
Electric Utilities - 0.7% |
| |||||||
Allete, Inc. | 68 | $ | 2,830 | |||||
El Paso Electric Co. | 84 | 2,855 | ||||||
UIL Holdings Corp. | 78 | 2,821 | ||||||
UNS Energy Corp. | 68 | 2,900 | ||||||
|
| |||||||
Total Electric Utilities | 11,406 | |||||||
|
| �� | ||||||
Electrical Equipment - 1.6% |
| |||||||
AZZ, Inc. | 80 | 3,155 | ||||||
Belden, Inc. | 71 | 2,542 | ||||||
Brady Corp. — Class A | 92 | 2,830 | ||||||
Encore Wire Corp. | 94 | 2,901 | ||||||
EnerSys* | 73 | 2,517 | ||||||
Franklin Electric Co., Inc. | 46 | 2,665 | ||||||
II-VI, Inc.* | 143 | 2,361 | ||||||
Powell Industries, Inc.* | 69 | 2,745 | ||||||
Vicor Corp.* | 420 | 2,679 | ||||||
|
| |||||||
Total Electrical Equipment | 24,395 | |||||||
|
| |||||||
Electronic Equipment, Instruments & Components - 4.7% |
| |||||||
Agilysys, Inc.* | 323 | 2,639 | ||||||
Anixter International, Inc. | 44 | 2,579 | ||||||
Badger Meter, Inc. | 76 | 3,256 | ||||||
Benchmark Electronics, Inc.* | 166 | 2,460 | ||||||
Checkpoint Systems, Inc.* | 317 | 2,574 | ||||||
Cognex Corp. | 75 | 2,734 | ||||||
Coherent, Inc.* | 61 | 2,785 | ||||||
CTS Corp. | 264 | 2,186 | ||||||
Daktronics, Inc. | 290 | 2,543 | ||||||
DTS, Inc.* | 114 | 2,392 | ||||||
Electro Scientific Industries, Inc. | 214 | 2,286 | ||||||
FARO Technologies, Inc.* | 66 | 2,653 | ||||||
FEI Co. | 51 | 2,808 | ||||||
Insight Enterprises, Inc.* | 144 | 2,328 | ||||||
Littelfuse, Inc. | 50 | 2,680 | ||||||
Measurement Specialties, Inc.* | 83 | 2,707 | ||||||
Mercury Computer Systems, Inc.* | 268 | 2,196 | ||||||
Methode Electronics, Inc. | 267 | 2,702 | ||||||
MTS Systems Corp. | 52 | 2,621 | ||||||
Newport Corp.* | 213 | 2,305 | ||||||
OSI Systems, Inc.* | 38 | 3,011 | ||||||
Park Electrochemical Corp. | 101 | 2,507 | ||||||
Plexus Corp.* | 83 | 2,234 | ||||||
Radisys Corp.* | 751 | 2,133 | ||||||
Rofin-Sinar Technologies, Inc.* | 125 | 2,276 | ||||||
Rogers Corp.* | 63 | 2,483 | ||||||
Scansource, Inc.* | 84 | 2,457 | ||||||
SYNNEX Corp.* | 78 | 2,526 | ||||||
TTM Technologies, Inc.* | 258 | 2,322 | ||||||
|
| |||||||
Total Electronic Equipment, Instruments & Components | 73,383 | |||||||
|
| |||||||
Energy Equipment & Services - 1.9% |
| |||||||
Basic Energy Services, Inc.* | 205 | 2,130 | ||||||
Bristow Group, Inc. | 54 | 2,696 | ||||||
Exterran Holdings, Inc.* | 143 | 2,857 | ||||||
| SHARES | VALUE | |||||||
Geospace Technologies Corp.* | 48 | $ | 3,107 | |||||
Gulf Island Fabrication, Inc. | 95 | 2,254 | ||||||
Hornbeck Offshore Services, Inc.* | 69 | 2,390 | ||||||
ION Geophysical Corp.* | 363 | 2,345 | ||||||
Lufkin Industries, Inc. | 45 | 2,251 | ||||||
Matrix Service Co.* | 239 | 2,507 | ||||||
Pioneer Energy Services Corp.* | 306 | 2,020 | ||||||
SEACOR Holdings, Inc.* | 31 | 2,719 | ||||||
Tetra Technologies, Inc.* | 403 | 2,156 | ||||||
|
| |||||||
Total Energy Equipment & Services | 29,432 | |||||||
|
| |||||||
Food & Staples Retailing - 0.8% |
| |||||||
Andersons, Inc.(The) | 69 | 2,710 | ||||||
Casey’s General Stores, Inc. | 48 | 2,475 | ||||||
Nash Finch Co. | 127 | 2,442 | ||||||
Spartan Stores, Inc. | 174 | 2,499 | ||||||
United Natural Foods, Inc.* | 47 | 2,502 | ||||||
|
| |||||||
Total Food & Staples Retailing | 12,628 | |||||||
|
| |||||||
Food Products - 1.9% |
| |||||||
B&G Foods, Inc. | 92 | 2,785 | ||||||
Cal-Maine Foods, Inc. | 68 | 2,933 | ||||||
Calavo Growers, Inc. | 117 | 2,762 | ||||||
Darling International, Inc.* | 160 | 2,645 | ||||||
Diamond Foods, Inc. | 142 | 2,630 | ||||||
Hain Celestial Group, Inc.(The)* | 41 | 2,370 | ||||||
J&J Snack Foods Corp. | 49 | 2,806 | ||||||
Sanderson Farms, Inc. | 62 | 2,808 | ||||||
Seneca Foods Corp. — Class A* | 95 | 2,716 | ||||||
Snyders-Lance, Inc. | 112 | 2,838 | ||||||
TreeHouse Foods, Inc.* | 55 | 2,945 | ||||||
|
| |||||||
Total Food Products | 30,238 | |||||||
|
| |||||||
Gas Utilities - 1.0% |
| |||||||
Laclede Group, Inc.(The) | 67 | 2,790 | ||||||
New Jersey Resources Corp. | 61 | 2,712 | ||||||
Northwest Natural Gas Co. | 57 | 2,652 | ||||||
Piedmont Natural Gas Co., Inc. | 86 | 2,741 | ||||||
South Jersey Industries, Inc. | 53 | 2,681 | ||||||
Southwest Gas Corp. | 64 | 2,782 | ||||||
|
| |||||||
Total Gas Utilities | 16,358 | |||||||
|
| |||||||
Health Care Equipment & Supplies - 3.6% |
| |||||||
Abaxis, Inc.* | 79 | 2,906 | ||||||
Align Technology, Inc.* | 73 | 1,940 | ||||||
Analogic Corp. | 35 | 2,578 | ||||||
Cantel Medical Corp. | 104 | 2,705 | ||||||
CONMED Corp. | 99 | 2,738 | ||||||
CryoLife, Inc. | 475 | 2,940 | ||||||
Cyberonics, Inc.* | 56 | 2,590 | ||||||
Greatbatch, Inc.* | 114 | 2,506 | ||||||
Haemonetics Corp.* | 36 | 2,941 | ||||||
ICU Medical, Inc.* | 48 | 2,848 | ||||||
Integra LifeSciences Holdings Corp.* | 69 | 2,639 | ||||||
Invacare Corp. | 187 | 2,553 | ||||||
Meridian Bioscience, Inc. | 153 | 3,022 | ||||||
Merit Medical Systems, Inc.* | 185 | 2,671 | ||||||
| See Notes to Financial Statements. | GUGGENHEIM ETFS ANNUAL REPORT | 51 |
Table of Contents
| SCHEDULE OF INVESTMENTS (continued) | October 31, 2012 |
GUGGENHEIM S&P SMALLCAP 600® EQUAL WEIGHT ETF
| SHARES | VALUE | |||||||
Natus Medical, Inc.* | 225 | $ | 2,543 | |||||
Neogen Corp.* | 72 | 3,081 | ||||||
NuVasive, Inc.* | 126 | 1,817 | ||||||
Palomar Medical Technologies, Inc.* | 337 | 2,908 | ||||||
SurModics, Inc.* | 140 | 2,517 | ||||||
Symmetry Medical, Inc.* | 290 | 2,656 | ||||||
West Pharmaceutical Services, Inc. | 57 | 3,071 | ||||||
|
| |||||||
Total Health Care Equipment & Supplies | 56,170 | |||||||
|
| |||||||
Health Care Providers & Services - 3.8% |
| |||||||
Air Methods Corp.* | 24 | 2,631 | ||||||
Almost Family, Inc.* | 130 | 2,695 | ||||||
Amedisys, Inc.* | 182 | 2,009 | ||||||
AMN Healthcare Services, Inc.* | 287 | 2,847 | ||||||
Amsurg Corp.* | 101 | 2,881 | ||||||
Bio-Reference Labs, Inc.* | 100 | 2,776 | ||||||
Centene Corp.* | 75 | 2,849 | ||||||
Chemed Corp. | 39 | 2,623 | ||||||
CorVel Corp.* | 62 | 2,637 | ||||||
Cross Country Healthcare, Inc.* | 595 | 2,618 | ||||||
Ensign Group, Inc.(The) | 93 | 2,712 | ||||||
Gentiva Health Services, Inc.* | 223 | 2,096 | ||||||
Hanger, Inc.* | 98 | 2,484 | ||||||
Healthways, Inc.* | 245 | 2,384 | ||||||
IPC The Hospitalist Co., Inc.* | 58 | 2,000 | ||||||
Kindred Healthcare, Inc.* | 224 | 2,195 | ||||||
Landauer, Inc. | 47 | 2,724 | ||||||
LHC Group, Inc.* | 151 | 2,646 | ||||||
Magellan Health Services, Inc.* | 56 | 2,808 | ||||||
Molina Healthcare, Inc.* | 121 | 3,033 | ||||||
MWI Veterinary Supply, Inc.* | 26 | 2,731 | ||||||
PharMerica Corp.* | 211 | 2,578 | ||||||
PSS World Medical, Inc.* | 121 | 3,463 | ||||||
|
| |||||||
Total Health Care Providers & Services | 60,420 | |||||||
|
| |||||||
Health Care Technology - 0.8% |
| |||||||
Computer Programs & Systems, Inc. | 51 | 2,489 | ||||||
HealthStream, Inc.* | 95 | 2,426 | ||||||
Medidata Solutions, Inc.* | 72 | 3,026 | ||||||
Omnicell, Inc.* | 190 | 2,770 | ||||||
Quality Systems, Inc. | 143 | 2,496 | ||||||
|
| |||||||
Total Health Care Technology | 13,207 | |||||||
|
| |||||||
Hotels, Restaurants & Leisure - 3.6% |
| |||||||
Biglari Holdings, Inc.* | 7 | 2,475 | ||||||
BJ’s Restaurants, Inc.* | 64 | 2,115 | ||||||
Boyd Gaming Corp.* | 400 | 2,468 | ||||||
Buffalo Wild Wings, Inc.* | 34 | 2,582 | ||||||
CEC Entertainment, Inc. | 89 | 2,759 | ||||||
Cracker Barrel Old Country Store, Inc. | 44 | 2,801 | ||||||
DineEquity, Inc.* | 50 | 3,135 | ||||||
Interval Leisure Group, Inc. | 138 | 2,630 | ||||||
Jack in the Box, Inc.* | 98 | 2,549 | ||||||
Marcus Corp. | 232 | 2,529 | ||||||
Marriott Vacations Worldwide Corp.* | 78 | 3,069 | ||||||
Monarch Casino & Resort, Inc.* | 347 | 3,165 | ||||||
| SHARES | VALUE | |||||||
Multimedia Games Holding Co., Inc.* | 179 | $ | 2,846 | |||||
Papa John’s International, Inc.* | 54 | 2,879 | ||||||
Pinnacle Entertainment, Inc.* | 232 | 2,960 | ||||||
Red Robin Gourmet Burgers, Inc.* | 83 | 2,772 | ||||||
Ruby Tuesday, Inc.* | 373 | 2,693 | ||||||
Ruth’s Hospitality Group, Inc* | 423 | 2,813 | ||||||
SHFL Entertainment, Inc.* | 188 | 2,657 | ||||||
Sonic Corp.* | 275 | 2,742 | ||||||
Texas Roadhouse, Inc. | 164 | 2,670 | ||||||
|
| |||||||
Total Hotels, Restaurants & Leisure | 57,309 | |||||||
|
| |||||||
Household Durables - 1.8% |
| |||||||
American Greetings Corp. — Class A | 172 | 2,953 | ||||||
Blyth, Inc. | 66 | 1,507 | ||||||
Ethan Allen Interiors, Inc. | 114 | 3,353 | ||||||
Helen of Troy Ltd.* | 83 | 2,508 | ||||||
iRobot Corp.* | 106 | 1,905 | ||||||
La-Z-Boy, Inc.* | 181 | 2,936 | ||||||
M/I Homes, Inc.* | 135 | 3,004 | ||||||
Meritage Homes Corp.* | 68 | 2,515 | ||||||
Ryland Group, Inc.(The) | 89 | 3,014 | ||||||
Standard Pacific Corp.* | 376 | 2,594 | ||||||
Universal Electronics, Inc.* | 161 | 2,763 | ||||||
|
| |||||||
Total Household Durables | 29,052 | |||||||
|
| |||||||
Household Products - 0.3% |
| |||||||
Central Garden & Pet Co. — Class A* | 238 | 2,682 | ||||||
WD-40 Co. | 54 | 2,585 | ||||||
|
| |||||||
Total Household Products | 5,267 | |||||||
|
| |||||||
Industrial Conglomerates - 0.2% |
| |||||||
Standex International Corp. | 63 | 2,913 | ||||||
|
| |||||||
Total Industrial Conglomerates | 2,913 | |||||||
|
| |||||||
Insurance - 2.9% |
| |||||||
AMERISAFE, Inc.* | 105 | 2,756 | ||||||
eHealth, Inc.* | 163 | 3,537 | ||||||
Employers Holdings, Inc. | 149 | 2,719 | ||||||
Horace Mann Educators Corp. | 151 | 2,901 | ||||||
Infinity Property & Casualty Corp. | 45 | 2,570 | ||||||
Meadowbrook Insurance Group, Inc. | 354 | 1,990 | ||||||
National Financial Partners Corp.* | 172 | 3,156 | ||||||
Navigators Group, Inc.(The)* | 55 | 2,919 | ||||||
Presidential Life Corp. | 201 | 2,810 | ||||||
ProAssurance Corp. | 31 | 2,771 | ||||||
RLI Corp. | 42 | 2,864 | ||||||
Safety Insurance Group, Inc. | 61 | 2,827 | ||||||
Selective Insurance Group, Inc. | 147 | 2,718 | ||||||
Stewart Information Services Corp. | 137 | 3,195 | ||||||
Tower Group, Inc. | 146 | 2,631 | ||||||
United Fire Group, Inc. | 122 | 2,900 | ||||||
|
| |||||||
Total Insurance | 45,264 | |||||||
|
| |||||||
Internet & Catalog Retail - 0.5% |
| |||||||
Blue Nile, Inc.* | 67 | 2,530 | ||||||
Nutrisystem, Inc. | 260 | 2,504 | ||||||
PetMed Express, Inc. | 264 | 2,878 | ||||||
|
| |||||||
Total Internet & Catalog Retail | 7,912 | |||||||
|
| |||||||
| 52 | GUGGENHEIM ETFS ANNUAL REPORT | See Notes to Financial Statements. |
Table of Contents
| SCHEDULE OF INVESTMENTS (continued) | October 31, 2012 |
GUGGENHEIM S&P SMALLCAP 600® EQUAL WEIGHT ETF
| SHARES | VALUE | |||||||
Internet Software & Services - 2.5% |
| |||||||
Blucora, Inc.* | 158 | $ | 2,773 | |||||
comScore, Inc.* | 186 | 2,636 | ||||||
DealerTrack Holdings, Inc.* | 100 | 2,733 | ||||||
Dice Holdings, Inc.* | 328 | 2,896 | ||||||
Digital River, Inc.* | 162 | 2,323 | ||||||
j2 Global, Inc. | 92 | 2,764 | ||||||
Liquidity Services, Inc.* | 52 | 2,144 | ||||||
LivePerson, Inc.* | 150 | 2,353 | ||||||
LogMeIn, Inc.* | 117 | 2,888 | ||||||
OpenTable, Inc.* | 57 | 2,677 | ||||||
Perficient, Inc.* | 244 | 2,774 | ||||||
QuinStreet, Inc.* | 321 | 1,965 | ||||||
Stamps.com, Inc.* | 123 | 3,385 | ||||||
United Online, Inc. | 497 | 2,664 | ||||||
XO Group, Inc.* | 322 | 2,592 | ||||||
|
| |||||||
Total Internet Software & Services | 39,567 | |||||||
|
| |||||||
IT Services - 2.1% |
| |||||||
CACI International, Inc. — Class A* | 50 | 2,521 | ||||||
Cardtronics, Inc.* | 92 | 2,614 | ||||||
CIBER, Inc.* | 798 | 2,490 | ||||||
CSG Systems International, Inc.* | 124 | 2,555 | ||||||
ExlService Holdings, Inc.* | 100 | 2,964 | ||||||
Forrester Research, Inc. | 93 | 2,691 | ||||||
Heartland Payment Systems, Inc. | 87 | 2,269 | ||||||
Higher One Holdings, Inc.* | 219 | 2,766 | ||||||
iGate Corp.* | 158 | 2,536 | ||||||
MAXIMUS, Inc. | 49 | 2,704 | ||||||
NCI, Inc. — Class A* | 376 | 2,113 | ||||||
TeleTech Holdings, Inc.* | 158 | 2,661 | ||||||
Virtusa Corp.* | 156 | 2,677 | ||||||
|
| |||||||
Total IT Services | 33,561 | |||||||
|
| |||||||
Leisure Equipment & Products - 0.8% |
| |||||||
Arctic Cat, Inc.* | 63 | 2,285 | ||||||
Brunswick Corp. | 110 | 2,595 | ||||||
Callaway Golf Co. | 449 | 2,451 | ||||||
Jakks Pacific, Inc. | 171 | 2,208 | ||||||
Sturm Ruger & Co., Inc. | 57 | 2,692 | ||||||
|
| |||||||
Total Leisure Equipment & Products | 12,231 | |||||||
|
| |||||||
Life Sciences Tools & Services - 0.8% |
| |||||||
Affymetrix, Inc.* | 680 | 2,155 | ||||||
Cambrex Corp.* | 222 | 2,682 | ||||||
Enzo Biochem, Inc.* | 1,429 | 2,858 | ||||||
Luminex Corp.* | 136 | 2,187 | ||||||
PAREXEL International Corp.* | 91 | 2,793 | ||||||
|
| |||||||
Total Life Sciences Tools & Services | 12,675 | |||||||
|
| |||||||
Machinery - 3.2% |
| |||||||
Actuant Corp. — Class A | 93 | 2,626 | ||||||
Albany International Corp. — Class A | 123 | 2,702 | ||||||
Astec Industries, Inc.* | 83 | 2,390 | ||||||
Barnes Group, Inc. | 108 | 2,471 | ||||||
Briggs & Stratton Corp. | 142 | 2,805 | ||||||
Cascade Corp. | 50 | 3,250 | ||||||
| SHARES | VALUE | |||||||
CIRCOR International, Inc. | 73 | $ | 2,518 | |||||
EnPro Industries, Inc.* | 72 | 2,632 | ||||||
ESCO Technologies, Inc. | 72 | 2,696 | ||||||
Federal Signal Corp.* | 430 | 2,481 | ||||||
John Bean Technologies Corp. | 162 | 2,498 | ||||||
Kaydon Corp. | 118 | 2,638 | ||||||
Lindsay Corp. | 40 | 3,055 | ||||||
Lydall, Inc.* | 204 | 2,634 | ||||||
Mueller Industries, Inc. | 60 | 2,628 | ||||||
Robbins & Myers, Inc. | 47 | 2,786 | ||||||
Tennant Co. | 63 | 2,357 | ||||||
Toro Co.(The) | 71 | 2,998 | ||||||
Watts Water Technologies, Inc. — Class A | 70 | 2,816 | ||||||
|
| |||||||
Total Machinery | 50,981 | |||||||
|
| |||||||
Media - 0.8% |
| |||||||
Arbitron, Inc. | 73 | 2,654 | ||||||
Digital Generation, Inc.* | 228 | 2,120 | ||||||
E.W. Scripps Co. — Class A* | 255 | 2,706 | ||||||
Harte-Hanks, Inc. | 383 | 2,133 | ||||||
Live Nation Entertainment, Inc.* | 306 | 2,800 | ||||||
|
| |||||||
Total Media | 12,413 | |||||||
|
| |||||||
Metals & Mining - 1.8% |
| |||||||
A.M. Castle & Co.* | 213 | 2,588 | ||||||
AK Steel Holding Corp. | 477 | 2,404 | ||||||
AMCOL International Corp. | 79 | 2,495 | ||||||
Century Aluminum Co.* | 333 | 2,381 | ||||||
Globe Specialty Metals, Inc. | 164 | 2,465 | ||||||
Haynes International, Inc. | 49 | 2,483 | ||||||
Kaiser Aluminum Corp. | 48 | 2,908 | ||||||
Materion Corp. | 111 | 2,326 | ||||||
Olympic Steel, Inc. | 152 | 2,736 | ||||||
RTI International Metals, Inc.* | 113 | 2,575 | ||||||
SunCoke Energy, Inc.* | 163 | 2,619 | ||||||
|
| |||||||
Total Metals & Mining | 27,980 | |||||||
|
| |||||||
Multi-Utilities - 0.5% |
| |||||||
Avista Corp. | 110 | 2,796 | ||||||
CH Energy Group, Inc. | 43 | 2,796 | ||||||
NorthWestern Corp. | 77 | 2,758 | ||||||
|
| |||||||
Total Multi-Utilities | 8,350 | |||||||
|
| |||||||
Multiline Retail - 0.3% |
| |||||||
Fred’s, Inc. — Class A | 195 | 2,642 | ||||||
Tuesday Morning Corp.* | 445 | 2,657 | ||||||
|
| |||||||
Total Multiline Retail | 5,299 | |||||||
|
| |||||||
Oil, Gas & Consumable Fuels - 1.7% |
| |||||||
Approach Resources, Inc.* | 81 | 1,995 | ||||||
Carrizo Oil & Gas, Inc.* | 95 | 2,548 | ||||||
Cloud Peak Energy, Inc.* | 142 | 2,996 | ||||||
Comstock Resources, Inc.* | 143 | 2,448 | ||||||
Contango Oil & Gas Co.* | 52 | 2,556 | ||||||
Gulfport Energy Corp.* | 89 | 2,953 | ||||||
PDC Energy, Inc.* | 83 | 2,512 | ||||||
Penn Virginia Corp. | 390 | 1,763 | ||||||
| See Notes to Financial Statements. | GUGGENHEIM ETFS ANNUAL REPORT | 53 |
Table of Contents
| SCHEDULE OF INVESTMENTS (continued) | October 31, 2012 |
GUGGENHEIM S&P SMALLCAP 600® EQUAL WEIGHT ETF
| SHARES | VALUE | |||||||
Petroquest Energy, Inc.* | 401 | $ | 2,446 | |||||
Stone Energy Corp.* | 101 | 2,383 | ||||||
Swift Energy Co.* | 121 | 2,022 | ||||||
|
| |||||||
Total Oil, Gas & Consumable Fuels | 26,622 | |||||||
|
| |||||||
Paper & Forest Products - 1.3% |
| |||||||
Buckeye Technologies, Inc. | 86 | 2,253 | ||||||
Clearwater Paper Corp.* | 67 | 2,649 | ||||||
Deltic Timber Corp. | 42 | 2,850 | ||||||
KapStone Paper and Packaging Corp.* | 133 | 2,922 | ||||||
Neenah Paper, Inc. | 92 | 2,383 | ||||||
PH Glatfelter Co. | 162 | 2,885 | ||||||
Schweitzer-Mauduit International, Inc. | 81 | 2,838 | ||||||
Wausau Paper Corp. | 295 | 2,440 | ||||||
|
| |||||||
Total Paper & Forest Products | 21,220 | |||||||
|
| |||||||
Personal Products - 0.5% |
| |||||||
Inter Parfums, Inc. | 163 | 2,976 | ||||||
Medifast, Inc.* | 101 | 2,578 | ||||||
Prestige Brands Holdings, Inc.* | 169 | 2,939 | ||||||
|
| |||||||
Total Personal Products | 8,493 | |||||||
|
| |||||||
Pharmaceuticals - 0.9% |
| |||||||
Akorn, Inc.* | 196 | 2,354 | ||||||
Hi-Tech Pharmacal Co., Inc.* | 85 | 2,665 | ||||||
Medicines Co.(The)* | 110 | 2,411 | ||||||
Questcor Pharmaceuticals, Inc. | 56 | 1,427 | ||||||
Salix Pharmaceuticals Ltd.* | 65 | 2,537 | ||||||
ViroPharma, Inc.* | 100 | 2,525 | ||||||
|
| |||||||
Total Pharmaceuticals | 13,919 | |||||||
|
| |||||||
Professional Services 1.8% |
| |||||||
CDI Corp. | 156 | 2,682 | ||||||
Dolan Co.(The)* | 601 | 2,782 | ||||||
Exponent, Inc.* | 51 | 2,804 | ||||||
Heidrick & Struggles International, Inc. | 194 | 2,297 | ||||||
Insperity, Inc. | 106 | 2,768 | ||||||
Kelly Services, Inc. — Class A | 203 | 2,698 | ||||||
Korn/Ferry International* | 183 | 2,450 | ||||||
Navigant Consulting, Inc.* | 240 | 2,493 | ||||||
On Assignment, Inc.* | 147 | 2,805 | ||||||
Resources Connection, Inc. | 211 | 2,604 | ||||||
TrueBlue, Inc.* | 161 | 2,101 | ||||||
|
| |||||||
Total Professional Services | 28,484 | |||||||
|
| |||||||
Real Estate Investment Trusts (REITs) - 5.1% |
| |||||||
Acadia Realty Trust | 109 | 2,799 | ||||||
Cedar Realty Trust, Inc. | 494 | 2,613 | ||||||
Colonial Properties Trust | 126 | 2,726 | ||||||
Cousins Properties, Inc. | 335 | 2,817 | ||||||
DiamondRock Hospitality Co. | 269 | 2,281 | ||||||
EastGroup Properties, Inc. | 50 | 2,603 | ||||||
Entertainment Properties Trust | 58 | 2,578 | ||||||
Extra Space Storage, Inc. | 80 | 2,759 | ||||||
Franklin Street Properties Corp. | 230 | 2,624 | ||||||
Getty Realty Corp. | 147 | 2,692 | ||||||
Government Properties Income Trust | 115 | 2,552 | ||||||
Healthcare Realty Trust, Inc. | 113 | 2,654 | ||||||
| SHARES | VALUE | |||||||
Inland Real Estate Corp. | 322 | $ | 2,631 | |||||
Kilroy Realty Corp. | 57 | 2,531 | ||||||
Kite Realty Group Trust | 532 | 2,910 | ||||||
LaSalle Hotel Properties | 97 | 2,322 | ||||||
Lexington Realty Trust | 275 | 2,610 | ||||||
LTC Properties, Inc. | 82 | 2,707 | ||||||
Medical Properties Trust, Inc. | 260 | 2,985 | ||||||
Mid-America Apartment Communities, Inc. | 41 | 2,653 | ||||||
Parkway Properties, Inc. | 225 | 3,098 | ||||||
Pennsylvania Real Estate Investment Trust | 164 | 2,711 | ||||||
Post Properties, Inc. | 55 | 2,685 | ||||||
PS Business Parks, Inc. | 40 | 2,565 | ||||||
Sabra Health Care REIT, Inc. | 142 | 3,155 | ||||||
Saul Centers, Inc. | 62 | 2,683 | ||||||
Sovran Self Storage, Inc. | 49 | 2,832 | ||||||
Tanger Factory Outlet Centers, Inc. | 83 | 2,612 | ||||||
Universal Health Realty Income Trust | 61 | 3,016 | ||||||
Urstadt Biddle Properties, Inc. — Class A | 139 | 2,633 | ||||||
|
| |||||||
Total Real Estate Investment Trusts (REITs) | 81,037 | |||||||
|
| |||||||
Real Estate Management & Development - 0.2% |
| |||||||
Forestar Group, Inc.* | 155 | 2,482 | ||||||
|
| |||||||
Total Real Estate Management & Development | 2,482 | |||||||
|
| |||||||
Road & Rail - 0.7% |
| |||||||
Arkansas Best Corp. | 332 | 2,673 | ||||||
Heartland Express, Inc. | 209 | 2,915 | ||||||
Knight Transportation, Inc. | 193 | 2,918 | ||||||
Old Dominion Freight Line, Inc.* | 91 | 3,052 | ||||||
|
| |||||||
Total Road & Rail | 11,558 | |||||||
|
| |||||||
Semiconductors & Semiconductor Equipment - 5.2% |
| |||||||
Advanced Energy Industries, Inc.* | 204 | 2,409 | ||||||
ATMI, Inc.* | 138 | 2,725 | ||||||
Brooks Automation, Inc. | 330 | 2,383 | ||||||
Cabot Microelectronics Corp. | 79 | 2,354 | ||||||
CEVA, Inc.* | 162 | 2,454 | ||||||
Cirrus Logic, Inc.* | 63 | 2,568 | ||||||
Cohu, Inc. | 280 | 2,464 | ||||||
Cymer, Inc.* | 49 | 3,905 | ||||||
Diodes, Inc.* | 143 | 2,168 | ||||||
DSP Group, Inc.* | 468 | 2,574 | ||||||
Entropic Communications, Inc.* | 434 | 2,088 | ||||||
Exar Corp.* | 351 | 3,001 | ||||||
GT Advanced Technologies, Inc.* | 430 | 1,866 | ||||||
Hittite Microwave Corp.* | 50 | 2,832 | ||||||
Kopin Corp.* | 730 | 2,745 | ||||||
Kulicke & Soffa Industries, Inc.* | 233 | 2,391 | ||||||
Micrel, Inc. | 255 | 2,471 | ||||||
Microsemi Corp.* | 128 | 2,458 | ||||||
MKS Instruments, Inc. | 100 | 2,363 | ||||||
Monolithic Power Systems, Inc.* | 132 | 2,565 | ||||||
| 54 | GUGGENHEIM ETFS ANNUAL REPORT | See Notes to Financial Statements. |
Table of Contents
| SCHEDULE OF INVESTMENTS (continued) | October 31, 2012 |
GUGGENHEIM S&P SMALLCAP 600® EQUAL WEIGHT ETF
| SHARES | VALUE | |||||||
Nanometrics, Inc.* | 180 | $ | 2,477 | |||||
Pericom Semiconductor Corp.* | 321 | 2,481 | ||||||
Power Integrations, Inc. | 80 | 2,366 | ||||||
Rubicon Technology, Inc.* | 289 | 2,511 | ||||||
Rudolph Technologies, Inc.* | 274 | 2,606 | ||||||
Sigma Designs, Inc.* | 441 | 2,619 | ||||||
STR Holdings, Inc.* | 829 | 1,782 | ||||||
Supertex, Inc.* | 144 | 2,752 | ||||||
Tessera Technologies, Inc. | 188 | 2,664 | ||||||
TriQuint Semiconductor, Inc.* | 471 | 2,214 | ||||||
Ultratech, Inc.* | 83 | 2,565 | ||||||
Veeco Instruments, Inc.* | 74 | 2,272 | ||||||
Volterra Semiconductor Corp.* | 118 | 2,144 | ||||||
|
| |||||||
Total Semiconductors & Semiconductor Equipment | 82,237 | |||||||
|
| |||||||
Software - 3.2% |
| |||||||
Blackbaud, Inc. | 115 | 2,734 | ||||||
Bottomline Technologies, Inc.* | 118 | 2,761 | ||||||
CommVault Systems, Inc.* | 48 | 2,999 | ||||||
Ebix, Inc. | 114 | 2,484 | ||||||
EPIQ Systems, Inc. | 210 | 2,564 | ||||||
Interactive Intelligence Group, Inc.* | 90 | 2,854 | ||||||
JDA Software Group, Inc.* | 89 | 3,394 | ||||||
Manhattan Associates, Inc.* | 49 | 2,940 | ||||||
MicroStrategy, Inc. — Class A* | 21 | 1,984 | ||||||
Monotype Imaging Holdings, Inc. | 179 | 2,741 | ||||||
Netscout Systems, Inc.* | 107 | 2,646 | ||||||
OPNET Technologies, Inc. | 81 | 3,437 | ||||||
Progress Software Corp.* | 136 | 2,682 | ||||||
Sourcefire, Inc.* | 51 | 2,182 | ||||||
Synchronoss Technologies, Inc.* | 114 | 2,336 | ||||||
Take-Two Interactive Software, Inc.* | 256 | 2,854 | ||||||
Tyler Technologies, Inc.* | 67 | 3,203 | ||||||
VASCO Data Security International, Inc.* | 288 | 2,039 | ||||||
Websense, Inc.* | 169 | 2,234 | ||||||
|
| |||||||
Total Software | 51,068 | |||||||
|
| |||||||
Specialty Retail - 5.2% |
| |||||||
Big 5 Sporting Goods Corp. | 303 | 2,706 | ||||||
Brown Shoe Co., Inc. | 178 | 2,809 | ||||||
Buckle, Inc.(The) | 59 | 2,665 | ||||||
Cato Corp.(The) — Class A | 89 | 2,526 | ||||||
Children’s Place Retail Stores, Inc.(The)* | 46 | 2,688 | ||||||
Christopher & Banks Corp.* | 846 | 2,640 | ||||||
Coldwater Creek, Inc.* | 973 | 4,038 | ||||||
Finish Line, Inc.(The) — Class A | 119 | 2,476 | ||||||
Genesco, Inc.* | 39 | 2,235 | ||||||
Group 1 Automotive, Inc. | 46 | 2,852 | ||||||
Haverty Furniture Cos., Inc. | 204 | 3,062 | ||||||
Hibbett Sports, Inc.* | 48 | 2,592 | ||||||
HOT Topic, Inc. | 306 | 2,632 | ||||||
JOS A Bank Clothiers, Inc.* | 55 | 2,573 | ||||||
Kirkland’s, Inc.* | 278 | 2,666 | ||||||
Lithia Motors, Inc. — Class A | 86 | 2,941 | ||||||
Lumber Liquidators Holdings, Inc.* | 52 | 2,903 | ||||||
| SHARES | VALUE | |||||||
MarineMax, Inc.* | 306 | $ | 2,518 | |||||
Men’s Wearhouse, Inc.(The) | 75 | 2,459 | ||||||
Monro Muffler Brake, Inc. | 72 | 2,442 | ||||||
OfficeMax, Inc. | 344 | 2,528 | ||||||
Pep Boys- Manny, Moe & Jack | 274 | 2,737 | ||||||
Rue21, Inc.* | 83 | 2,499 | ||||||
Select Comfort Corp.* | 83 | 2,310 | ||||||
Sonic Automotive, Inc. — Class A | 144 | 2,794 | ||||||
Stage Stores, Inc. | 127 | 3,111 | ||||||
Stein Mart, Inc.* | 314 | 2,468 | ||||||
Vitamin Shoppe, Inc.* | 48 | 2,747 | ||||||
Zale Corp.* | 481 | 3,454 | ||||||
Zumiez, Inc.* | 99 | 2,506 | ||||||
|
| |||||||
Total Specialty Retail | 81,577 | |||||||
|
| |||||||
Textiles, Apparel & Luxury Goods - 2.0% |
| |||||||
Crocs, Inc.* | 157 | 1,978 | ||||||
Fifth & Pacific Cos., Inc.* | 205 | 2,251 | ||||||
Iconix Brand Group, Inc.* | 142 | 2,628 | ||||||
K-Swiss, Inc. — Class A* | 796 | 1,815 | ||||||
Maidenform Brands, Inc.* | 125 | 2,339 | ||||||
Movado Group, Inc. | 76 | 2,408 | ||||||
Oxford Industries, Inc. | 49 | 2,719 | ||||||
Perry Ellis International, Inc.* | 122 | 2,518 | ||||||
Quiksilver, Inc.* | 807 | 2,582 | ||||||
Skechers U.S.A., Inc. — Class A* | 131 | 2,175 | ||||||
Steven Madden Ltd.* | 63 | 2,704 | ||||||
True Religion Apparel, Inc. | 123 | 3,155 | ||||||
Wolverine World Wide, Inc. | 62 | 2,596 | ||||||
|
| |||||||
Total Textiles, Apparel & Luxury Goods | 31,868 | |||||||
|
| |||||||
Thrifts & Mortgage Finance - 1.4% |
| |||||||
Bank Mutual Corp. | 637 | 2,873 | ||||||
Brookline Bancorp, Inc. | 309 | 2,620 | ||||||
Dime Community Bancshares, Inc. | 190 | 2,755 | ||||||
Northwest Bancshares, Inc. | 225 | 2,678 | ||||||
Oritani Financial Corp. | 186 | 2,842 | ||||||
Provident Financial Services, Inc. | 175 | 2,625 | ||||||
TrustCo Bank Corp. NY | 476 | 2,656 | ||||||
ViewPoint Financial Group, Inc. | 150 | 3,120 | ||||||
|
| |||||||
Total Thrifts & Mortgage Finance | 22,169 | |||||||
|
| |||||||
Tobacco - 0.2% |
| |||||||
Alliance One International, Inc.* | 873 | 2,654 | ||||||
|
| |||||||
Total Tobacco | 2,654 | |||||||
|
| |||||||
Trading Companies & Distributors - 0.3% |
| |||||||
Applied Industrial Technologies, Inc. | 64 | 2,598 | ||||||
Kaman Corp. | 76 | 2,827 | ||||||
|
| |||||||
Total Trading Companies & Distributors | 5,425 | |||||||
|
| |||||||
Water Utilities - 0.2% |
| |||||||
American States Water Co. | 64 | 2,817 | ||||||
|
| |||||||
Total Water Utilities | 2,817 | |||||||
|
| |||||||
| See Notes to Financial Statements. | GUGGENHEIM ETFS ANNUAL REPORT | 55 |
Table of Contents
| SCHEDULE OF INVESTMENTS (concluded) | October 31, 2012 |
GUGGENHEIM S&P SMALLCAP 600® EQUAL WEIGHT ETF
| SHARES | VALUE | |||||||
Wireless Telecommunication Services - 0.3% |
| |||||||
NTELOS Holdings Corp. | 169 | $ | 2,577 | |||||
USA Mobility, Inc. | 237 | 2,619 | ||||||
|
| |||||||
Total Wireless Telecommunication Services | 5,196 | |||||||
|
| |||||||
Total Common Stocks |
| 1,580,293 | ||||||
|
| |||||||
SHORT TERM INVESTMENTS - 0.1% |
| |||||||
SSgA Government Money Market Fund | 1,860 | 1,860 | ||||||
|
| |||||||
Total Short Term Investments |
| 1,860 | ||||||
|
| |||||||
FACE | ||||||||
SECURITIES LENDING COLLATERAL - 0.1%d |
| |||||||
Joint Repurchase Agreements: | ||||||||
Merrill Lynch, Fenner & Smith, Inc. | $ | 511 | 511 | |||||
RBS Securities, Inc. | 869 | 869 | ||||||
|
| |||||||
Total Securities Lending Collateral | 1,380 | |||||||
|
| |||||||
Total Investments 100.2%c | 1,583,533 | |||||||
|
| |||||||
Other Assets and Liabilities, net - (0.2)% | (3,424 | ) | ||||||
|
| |||||||
Net Assets - 100.0% | $ | 1,580,109 | ||||||
|
| |||||||
| * | Non-Income Producing Security. |
| a | All or a portion of this security was on loan as of October 31, 2012. |
| b | Values determined based on Level 2 inputs (Note F). |
| c | Unless otherwise indicated, the values of the Investments are determined based on Level 1 inputs. |
| d | Securities lending collateral (Note I). |
| 56 | GUGGENHEIM ETFS ANNUAL REPORT | See Notes to Financial Statements. |
Table of Contents
| SCHEDULE OF INVESTMENTS | October 31, 2012 |
GUGGENHEIM RUSSELL MIDCAP® EQUAL WEIGHT ETF
| SHARES | VALUE | |||||||
COMMON STOCKS - 99.8% |
| |||||||
Aerospace & Defense - 1.1% |
| |||||||
Alliant Techsystems, Inc. | 1,042 | $ | 59,696 | |||||
BE Aerospace, Inc.* | 1,232 | 55,551 | ||||||
Engility Holdings, Inc.* | 2,868 | 54,492 | ||||||
Exelis, Inc. | 4,909 | 54,294 | ||||||
Huntington Ingalls Industries, Inc.* | 1,230 | 52,127 | ||||||
L-3 Communications Holdings, Inc. | 711 | 52,472 | ||||||
Rockwell Collins, Inc. | 979 | 52,455 | ||||||
Spirit Aerosystems Holdings, | 2,301 | 35,965 | ||||||
Textron, Inc. | 1,971 | 49,689 | ||||||
TransDigm Group, Inc. | 353 | 47,023 | ||||||
Triumph Group, Inc. | 856 | 55,999 | ||||||
|
| |||||||
Total Aerospace & Defense | 569,763 | |||||||
|
| |||||||
Air Freight & Logistics - 0.3% |
| |||||||
C.H. Robinson Worldwide, Inc. | 867 | 52,306 | ||||||
Expeditors International of Washington, Inc. | 1,422 | 52,059 | ||||||
UTi Worldwide, Inc. | 3,792 | 52,671 | ||||||
|
| |||||||
Total Air Freight & Logistics | 157,036 | |||||||
|
| |||||||
Airlines - 0.4% |
| |||||||
Copa Holdings SA — Class A | 622 | 57,734 | ||||||
Delta Air Lines, Inc.* | 5,676 | 54,660 | ||||||
Southwest Airlines Co. | 5,792 | 51,086 | ||||||
United Continental Holdings, Inc.* | 2,582 | 49,600 | ||||||
|
| |||||||
Total Airlines | 213,080 | |||||||
|
| |||||||
Auto Components - 0.7% |
| |||||||
Allison Transmission Holdings, Inc.a | 2,626 | 53,019 | ||||||
BorgWarner, Inc.* | 615 | 40,479 | ||||||
Delphi Automotive PLC* | 1,370 | 43,073 | ||||||
Gentex Corp. | 2,499 | 43,033 | ||||||
Goodyear Tire & Rubber Co. (The)* | 3,532 | 40,300 | ||||||
Lear Corp. | 1,139 | 48,521 | ||||||
TRW Automotive Holdings Corp.* | 995 | 46,278 | ||||||
Visteon Corp.* | 982 | 43,306 | ||||||
|
| |||||||
Total Auto Components | 358,009 | |||||||
|
| |||||||
Automobiles - 0.3% |
| |||||||
Harley-Davidson, Inc. | 1,014 | 47,414 | ||||||
Tesla Motors, Inc.*,a | 1,554 | 43,714 | ||||||
Thor Industries, Inc. | 1,255 | 47,728 | ||||||
|
| |||||||
Total Automobiles | 138,856 | |||||||
|
| |||||||
Beverages - 2.2% |
| |||||||
Beam, Inc. | 3,022 | 167,902 | ||||||
Brown-Forman Corp. — Class B | 2,680 | 171,681 | ||||||
Coca-Cola Enterprises, Inc. | 5,624 | 176,819 | ||||||
Constellation Brands, Inc. — Class A* | 5,384 | 190,270 | ||||||
Dr Pepper Snapple Group, Inc. | 3,964 | 169,857 | ||||||
Molson Coors Brewing Co. — Class B | 3,834 | 165,399 | ||||||
Monster Beverage Corp.* | 3,207 | 143,257 | ||||||
|
| |||||||
Total Beverages | 1,185,185 | |||||||
|
| |||||||
| SHARES | VALUE | |||||||
Biotechnology - 1.5% |
| |||||||
Alexion Pharmaceuticals, Inc.* | 760 | $ | 68,689 | |||||
Ariad Pharmaceuticals, Inc.* | 3,739 | 80,576 | ||||||
BioMarin Pharmaceutical, Inc.* | 2,151 | 79,673 | ||||||
Incyte Corp.*,a | 4,890 | 78,044 | ||||||
Medivation, Inc.* | 1,595 | 81,536 | ||||||
Myriad Genetics, Inc.* | 3,281 | 85,864 | ||||||
Onyx Pharmaceuticals, Inc.* | 1,041 | 81,573 | ||||||
Regeneron Pharmaceuticals, Inc.* | 593 | 84,384 | ||||||
United Therapeutics Corp.* | 1,506 | 68,779 | ||||||
Vertex Pharmaceuticals, Inc.* | 1,539 | 74,241 | ||||||
|
| |||||||
Total Biotechnology | 783,359 | |||||||
|
| |||||||
Building Products - 0.8% |
| |||||||
Armstrong World Industries, Inc. | 2,003 | 103,755 | ||||||
Fortune Brands Home & Security, Inc.* | 1,559 | 44,338 | ||||||
Lennox International, Inc. | 1,874 | 93,794 | ||||||
Masco Corp. | 6,014 | 90,751 | ||||||
Owens Corning* | 2,718 | 91,298 | ||||||
|
| |||||||
Total Building Products | 423,936 | |||||||
|
| |||||||
Capital Markets - 1.2% |
| |||||||
Affiliated Managers Group, Inc.* | 267 | 33,775 | ||||||
American Capital Ltd.* | 2,811 | 33,142 | ||||||
Ameriprise Financial, Inc. | 579 | 33,796 | ||||||
Ares Capital Corp. | 1,912 | 33,384 | ||||||
E*Trade Financial Corp.* | 3,689 | 30,840 | ||||||
Eaton Vance Corp. | 1,126 | 31,686 | ||||||
Federated Investors, Inc. — Class Ba | 1,519 | 35,302 | ||||||
Invesco Ltd. | 1,301 | 31,640 | ||||||
Janus Capital Group, Inc. | 3,556 | 30,226 | ||||||
Jefferies Group, Inc. | 2,301 | 32,766 | ||||||
Lazard Ltd. — Class A | 1,115 | 32,848 | ||||||
Legg Mason, Inc. | 1,302 | 33,175 | ||||||
LPL Financial Holdings, Inc. | 1,157 | 33,784 | ||||||
Northern Trust Corp. | 689 | 32,920 | ||||||
Raymond James Financial, Inc. | 876 | 33,411 | ||||||
SEI Investments Co. | 1,493 | 32,667 | ||||||
T. Rowe Price Group, Inc. | 514 | 33,379 | ||||||
TD Ameritrade Holding Corp. | 2,056 | 32,259 | ||||||
Waddell & Reed Financial, | 994 | 33,130 | ||||||
|
| |||||||
Total Capital Markets | 624,130 | |||||||
|
| |||||||
Chemicals - 4.1% |
| |||||||
Airgas, Inc. | 1,117 | 99,379 | ||||||
Albemarle Corp. | 1,809 | 99,694 | ||||||
Ashland, Inc. | 1,349 | 95,981 | ||||||
Cabot Corp. | 2,507 | 89,650 | ||||||
Celanese Corp. — Series A | 2,476 | 94,063 | ||||||
CF Industries Holdings, Inc. | 436 | 89,463 | ||||||
Cytec Industries, Inc. | 1,461 | 100,546 | ||||||
Eastman Chemical Co. | 1,669 | 98,872 | ||||||
FMC Corp. | 1,661 | 88,897 | ||||||
Huntsman Corp. | 6,264 | 94,211 | ||||||
International Flavors & Fragrances, Inc. | 1,561 | 100,872 | ||||||
| See Notes to Financial Statements. | GUGGENHEIM ETFS ANNUAL REPORT | 57 |
Table of Contents
| SCHEDULE OF INVESTMENTS (continued) | October 31, 2012 |
GUGGENHEIM RUSSELL MIDCAP® EQUAL WEIGHT ETF
| SHARES | VALUE | |||||||
Intrepid Potash, Inc.* | 4,394 | $ | 95,482 | |||||
Kronos Worldwide, Inc.a | 6,198 | 82,743 | ||||||
NewMarket Corp. | 386 | 104,726 | ||||||
PPG Industries, Inc. | 812 | 95,069 | ||||||
Rockwood Holdings, Inc. | 2,030 | 93,177 | ||||||
RPM International, Inc. | 3,240 | 86,378 | ||||||
Scotts Miracle-Gro Co.(The) — Class A | 2,141 | 91,656 | ||||||
Sherwin — Williams Co.(The) | 632 | 90,111 | ||||||
Sigma-Aldrich Corp. | 1,279 | 89,709 | ||||||
Valspar Corp. | 1,627 | 91,161 | ||||||
Westlake Chemical Corp. | 1,286 | 97,813 | ||||||
WR Grace & Co* | 1,565 | 100,410 | ||||||
|
| |||||||
Total Chemicals | 2,170,063 | |||||||
|
| |||||||
Commercial Banks - 1.8% |
| |||||||
Associated Banc — Corp. | 2,477 | 31,929 | ||||||
Bank of Hawaii Corp. | 702 | 31,000 | ||||||
BankUnited, Inc. | 1,306 | 30,965 | ||||||
BOK Financial Corp. | 552 | 32,375 | ||||||
CapitalSource, Inc. | 4,366 | 34,535 | ||||||
CIT Group, Inc.* | 801 | 29,813 | ||||||
City National Corp. | 625 | 31,938 | ||||||
Comerica, Inc. | 1,052 | 31,360 | ||||||
Commerce Bancshares, Inc. | 798 | 30,388 | ||||||
Cullen/Frost Bankers, Inc. | 560 | 30,968 | ||||||
East West Bancorp, Inc. | 1,505 | 32,042 | ||||||
Fifth Third Bancorp | 2,080 | 30,222 | ||||||
First Citizens BancShares | 197 | 33,244 | ||||||
First Horizon National Corp. | 3,353 | 31,217 | ||||||
First Niagara Financial Group, Inc. | 4,014 | 33,236 | ||||||
First Republic Bank | 939 | 32,255 | ||||||
Fulton Financial Corp. | 3,275 | 31,833 | ||||||
Huntington Bancshares, Inc. | 4,751 | 30,359 | ||||||
KeyCorp | 3,689 | 31,061 | ||||||
M&T Bank Corp. | 342 | 35,602 | ||||||
Popular, Inc.* | 1,843 | 35,625 | ||||||
Regions Financial Corp. | 4,487 | 29,255 | ||||||
Signature Bank* | 487 | 34,694 | ||||||
SunTrust Banks, Inc. | 1,147 | 31,199 | ||||||
SVB Financial Group* | 534 | 30,219 | ||||||
Synovus Financial Corp.a | 13,205 | 32,352 | ||||||
TCF Financial Corp. | 2,794 | 31,963 | ||||||
Valley National Bancorp | 3,245 | 31,606 | ||||||
Zions Bancorp | 1,592 | 34,180 | ||||||
|
| |||||||
Total Commercial Banks | 927,435 | |||||||
|
| |||||||
Commercial Services & Supplies - 1.4% |
| |||||||
Avery Dennison Corp. | 1,641 | 53,135 | ||||||
Cintas Corp. | 1,237 | 51,719 | ||||||
Clean Harbors, Inc.* | 1,057 | 61,676 | ||||||
Copart, Inc.* | 1,868 | 53,780 | ||||||
Corrections Corp. of America | 1,557 | 52,393 | ||||||
Covanta Holding Corp. | 2,985 | 54,267 | ||||||
Iron Mountain, Inc. | 1,521 | 52,627 | ||||||
| SHARES | VALUE | |||||||
KAR Auction Services, Inc.* | 2,151 | $ | 43,020 | |||||
Pitney Bowes, Inc.a | 3,667 | 52,658 | ||||||
R.R. Donnelley & Sons Co.a | 4,667 | 46,763 | ||||||
Republic Services, Inc. | 1,849 | 52,419 | ||||||
Rollins, Inc. | 2,180 | 49,421 | ||||||
Stericycle, Inc.* | 560 | 53,066 | ||||||
Waste Connections, Inc. | 1,695 | 55,647 | ||||||
|
| |||||||
Total Commercial Services & Supplies | 732,591 | |||||||
|
| |||||||
Communications Equipment - 1.0% |
| |||||||
Acme Packet, Inc.* | 3,463 | 57,278 | ||||||
Brocade Communications Systems, Inc.* | 10,083 | 53,440 | ||||||
EchoStar Corp. — Class A* | 2,153 | 68,379 | ||||||
F5 Networks, Inc.* | 567 | 46,766 | ||||||
Harris Corp. | 1,189 | 54,433 | ||||||
JDS Uniphase Corp.* | 4,918 | 47,655 | ||||||
Juniper Networks, Inc.* | 3,399 | 56,322 | ||||||
Palo Alto Networks, Inc.* | 945 | 51,956 | ||||||
Polycom, Inc.* | 5,963 | 59,749 | ||||||
Riverbed Technology, Inc.* | 2,658 | 49,093 | ||||||
|
| |||||||
Total Communications Equipment | 545,071 | |||||||
|
| |||||||
Computers & Peripherals - 0.7% |
| |||||||
Diebold, Inc. | 1,822 | 54,204 | ||||||
Fusion-io, Inc.*,a | 2,059 | 48,592 | ||||||
Lexmark International, Inc. — Class Aa | 2,291 | 48,707 | ||||||
NCR Corp.* | 2,631 | 55,988 | ||||||
NetApp, Inc.* | 1,763 | 47,425 | ||||||
SanDisk Corp.* | 1,384 | 57,796 | ||||||
Western Digital Corp. | 1,531 | 52,406 | ||||||
|
| |||||||
Total Computers & Peripherals | 365,118 | |||||||
|
| |||||||
Construction & Engineering - 0.8% |
| |||||||
Aecom Technology Corp.* | 2,452 | 52,644 | ||||||
Chicago Bridge & Iron Co. NV | 1,355 | 50,880 | ||||||
Fluor Corp. | 903 | 50,433 | ||||||
Jacobs Engineering Group, Inc.* | 1,247 | 48,122 | ||||||
KBR, Inc. | 1,743 | 48,560 | ||||||
Quanta Services, Inc.* | 2,071 | 53,701 | ||||||
Shaw Group, Inc.(The)* | 1,178 | 51,585 | ||||||
URS Corp. | 1,451 | 48,579 | ||||||
|
| |||||||
Total Construction & Engineering | 404,504 | |||||||
|
| |||||||
Construction Materials - 0.3% |
| |||||||
Martin Marietta Materials, Inc. | 1,097 | 90,294 | ||||||
Vulcan Materials Co. | 2,027 | 93,181 | ||||||
|
| |||||||
Total Construction Materials | 183,475 | |||||||
|
| |||||||
Consumer Finance - 0.1% |
| |||||||
SLM Corp. | 2,016 | 35,441 | ||||||
|
| |||||||
Total Consumer Finance | 35,441 | |||||||
|
| |||||||
Containers & Packaging - 2.0% |
| |||||||
AptarGroup, Inc. | 1,798 | 92,201 | ||||||
Ball Corp. | 2,213 | 94,783 | ||||||
Bemis Co., Inc. | 2,957 | 97,729 | ||||||
| 58 | GUGGENHEIM ETFS ANNUAL REPORT | See Notes to Financial Statements. |
Table of Contents
| SCHEDULE OF INVESTMENTS (continued) | October 31, 2012 |
GUGGENHEIM RUSSELL MIDCAP® EQUAL WEIGHT ETF
| SHARES | VALUE | |||||||
Crown Holdings, Inc.* | 2,543 | $ | 97,270 | |||||
Greif, Inc. — Class A | 2,141 | 89,836 | ||||||
Owens-Illinois, Inc.* | 4,961 | 96,690 | ||||||
Packaging Corp. of America | 2,659 | 93,783 | ||||||
Rock-Tenn Co. — Class A | 1,292 | 94,562 | ||||||
Sealed Air Corp. | 5,964 | 96,736 | ||||||
Silgan Holdings, Inc. | 2,195 | 95,065 | ||||||
Sonoco Products Co. | 3,014 | 93,826 | ||||||
|
| |||||||
Total Containers & Packaging | 1,042,481 | |||||||
|
| |||||||
Distributors - 0.2% |
| |||||||
Genuine Parts Co. | 694 | 43,430 | ||||||
LKQ Corp.* | 2,238 | 46,752 | ||||||
|
| |||||||
Total Distributors | 90,182 | |||||||
|
| |||||||
Diversified Consumer Services - 0.5% | ||||||||
Apollo Group, Inc. — Class A* | 1,529 | 30,702 | ||||||
DeVry, Inc. | 1,924 | 50,524 | ||||||
H&R Block, Inc. | 2,536 | 44,887 | ||||||
ITT Educational Services, Inc.* | 1,288 | 27,679 | ||||||
Service Corp. International | 3,222 | 45,237 | ||||||
Weight Watchers International, Inc. | 831 | 41,758 | ||||||
|
| |||||||
Total Diversified Consumer Services | 240,787 | |||||||
|
| |||||||
Diversified Financial Services - 0.5% |
| |||||||
CBOE Holdings, Inc. | 1,088 | 32,085 | ||||||
Interactive Brokers Group, | 2,313 | 32,960 | ||||||
IntercontinentalExchange, Inc.* | 240 | 31,440 | ||||||
Leucadia National Corp. | 1,405 | 31,893 | ||||||
Moody’s Corp. | 728 | 35,060 | ||||||
MSCI, Inc. — Class A* | 922 | 24,839 | ||||||
NASDAQ OMX Group, Inc.(The) | 1,396 | 33,239 | ||||||
NYSE Euronext | 1,302 | 32,238 | ||||||
|
| |||||||
Total Diversified Financial Services | 253,754 | |||||||
|
| |||||||
Diversified Telecommunication Services - 0.9% |
| |||||||
Frontier Communications Corp.a | 25,085 | 118,401 | ||||||
Level 3 Communications, Inc.* | 5,343 | 109,532 | ||||||
tw telecom, Inc.* | 4,700 | 119,709 | ||||||
Windstream Corp.a | 11,337 | 108,155 | ||||||
|
| |||||||
Total Diversified Telecommunication Services | 455,797 | |||||||
|
| |||||||
Electric Utilities - 3.1% |
| |||||||
Edison International | 2,677 | 125,658 | ||||||
Entergy Corp. | 1,774 | 128,757 | ||||||
Great Plains Energy, Inc. | 5,469 | 122,724 | ||||||
Hawaiian Electric Industries, Inc. | 4,593 | 118,867 | ||||||
ITC Holdings Corp. | 1,638 | 130,418 | ||||||
Northeast Utilities | 3,225 | 126,742 | ||||||
NV Energy, Inc. | 6,789 | 129,059 | ||||||
OGE Energy Corp. | 2,193 | 126,273 | ||||||
Pepco Holdings, Inc. | 6,477 | 128,698 | ||||||
Pinnacle West Capital Corp. | 2,306 | 122,149 | ||||||
PPL Corp. | 4,232 | 125,183 | ||||||
| SHARES | VALUE | |||||||
Westar Energy, Inc. | 4,127 | $ | 122,572 | |||||
Xcel Energy, Inc. | 4,436 | 125,317 | ||||||
|
| |||||||
Total Electric Utilities | 1,632,417 | |||||||
|
| |||||||
Electrical Equipment - 1.1% |
| |||||||
AMETEK, Inc. | 1,449 | 51,512 | ||||||
Babcock & Wilcox Co.(The)* | 1,994 | 51,385 | ||||||
Cooper Industries PLC | 690 | 51,709 | ||||||
General Cable Corp.* | 1,733 | 49,442 | ||||||
GrafTech International, Ltd.* | 5,626 | 59,129 | ||||||
Hubbell, Inc. — Class B | 637 | 53,330 | ||||||
Polypore International, Inc.* | 2,814 | 99,278 | ||||||
Regal-Beloit Corp. | 722 | 47,060 | ||||||
Rockwell Automation, Inc. | 733 | 52,087 | ||||||
Roper Industries, Inc. | 465 | 50,764 | ||||||
|
| |||||||
Total Electrical Equipment | 565,696 | |||||||
|
| |||||||
Electronic Equipment, Instruments & Components - 1.6% |
| |||||||
Amphenol Corp. — Class A | 1,009 | 60,671 | ||||||
Arrow Electronics, Inc.* | 1,842 | 64,894 | ||||||
Avnet, Inc.* | 2,099 | 60,136 | ||||||
AVX Corp. | 6,226 | 61,264 | ||||||
Dolby Laboratories, Inc. — Class A* | 1,776 | 56,104 | ||||||
FLIR Systems, Inc. | 2,512 | 48,808 | ||||||
Ingram Micro, Inc. — Class A* | 3,958 | 60,161 | ||||||
IPG Photonics Corp.* | 1,064 | 56,477 | ||||||
Itron, Inc.* | 1,182 | 48,533 | ||||||
Jabil Circuit, Inc. | 2,894 | 50,182 | ||||||
Molex, Inc. | 2,274 | 59,056 | ||||||
National Instruments Corp. | 1,989 | 46,861 | ||||||
Tech Data Corp.* | 1,319 | 58,445 | ||||||
Trimble Navigation, Ltd.* | 1,079 | 50,907 | ||||||
Vishay Intertechnology, Inc.* | 6,040 | 50,011 | ||||||
|
| |||||||
Total Electronic Equipment, Instruments & Components | 832,510 | |||||||
|
| |||||||
Energy Equipment & Services - 3.6% |
| |||||||
Atwood Oceanics, Inc.* | 2,430 | 116,154 | ||||||
Cameron International Corp.* | 1,968 | 99,660 | ||||||
CARBO Ceramics, Inc.a | 1,734 | 128,229 | ||||||
Diamond Offshore Drilling, Inc. | 1,655 | 114,592 | ||||||
Dresser-Rand Group, Inc.* | 2,042 | 105,224 | ||||||
FMC Technologies, Inc.* | 2,304 | 94,234 | ||||||
Helmerich & Payne, Inc. | 2,381 | 113,812 | ||||||
McDermott International, Inc.* | 9,069 | 97,129 | ||||||
Nabors Industries Ltd.* | 7,791 | 105,101 | ||||||
Oceaneering International, Inc. | 1,997 | 104,503 | ||||||
Oil States International, Inc.* | 1,383 | 101,097 | ||||||
Patterson-UTI Energy, Inc. | 6,862 | 111,027 | ||||||
Rowan Cos., PLC — Class A* | 3,212 | 101,853 | ||||||
RPC, Inc.a | 9,114 | 104,446 | ||||||
SEACOR Holdings, Inc.* | 1,324 | 116,128 | ||||||
Superior Energy Services, Inc.* | 5,170 | 105,106 | ||||||
Tidewater, Inc. | 1,043 | 49,553 | ||||||
| See Notes to Financial Statements. | GUGGENHEIM ETFS ANNUAL REPORT | 59 |
Table of Contents
| SCHEDULE OF INVESTMENTS (continued) | October 31, 2012 |
GUGGENHEIM RUSSELL MIDCAP® EQUAL WEIGHT ETF
| SHARES | VALUE | |||||||
Unit Corp.* | 2,654 | $ | 107,089 | |||||
|
| |||||||
Total Energy Equipment & Services | 1,874,937 | |||||||
|
| |||||||
Food & Staples Retailing - 1.3% |
| |||||||
Fresh Market, Inc. (The)* | 2,984 | 169,223 | ||||||
Kroger Co. (The) | 7,379 | 186,099 | ||||||
Safeway, Inc.a | 10,585 | 172,641 | ||||||
Whole Foods Market, Inc. | 1,762 | 166,914 | ||||||
|
| |||||||
Total Food & Staples Retailing | 694,877 | |||||||
|
| |||||||
Food Products - 5.7% |
| |||||||
Bunge Ltd. | 2,621 | 186,170 | ||||||
Campbell Soup Co.a | 4,972 | 175,362 | ||||||
ConAgra Foods, Inc. | 6,323 | 176,032 | ||||||
Dean Foods Co.* | 11,253 | 189,501 | ||||||
Flowers Foods, Inc. | 8,502 | 167,404 | ||||||
Green Mountain Coffee Roasters, Inc.*,a | 7,252 | 175,208 | ||||||
H.J. Heinz Co. | 3,102 | 178,396 | ||||||
Hershey Co. (The) | 2,442 | 168,132 | ||||||
Hillshire Brands Co. | 6,513 | 169,403 | ||||||
Hormel Foods Corp. | 5,965 | 176,146 | ||||||
Ingredion, Inc. | 3,165 | 194,521 | ||||||
J.M. Smucker Co. (The) | 2,012 | 172,308 | ||||||
McCormick & Co., Inc. | 2,742 | 168,962 | ||||||
Mead Johnson Nutrition Co. | 2,352 | 145,024 | ||||||
Ralcorp Holdings, Inc.* | 2,372 | 171,235 | ||||||
Smithfield Foods, Inc.* | 8,931 | 182,818 | ||||||
Tyson Foods, Inc. — Class A | 10,878 | 182,859 | ||||||
|
| |||||||
Total Food Products | 2,979,481 | |||||||
|
| |||||||
Gas Utilities - 1.4% |
| |||||||
AGL Resources, Inc. | 2,970 | 121,265 | ||||||
Atmos Energy Corp. | 3,401 | 122,334 | ||||||
National Fuel Gas Co. | 2,288 | 120,578 | ||||||
Oneok, Inc. | 2,604 | 123,169 | ||||||
Questar Corp. | 6,106 | 123,585 | ||||||
UGI Corp. | 3,906 | 126,125 | ||||||
|
| |||||||
Total Gas Utilities | 737,056 | |||||||
|
| |||||||
Health Care Equipment & Supplies - 2.7% |
| |||||||
Alere, Inc.* | 4,375 | 84,000 | ||||||
Boston Scientific Corp.* | 15,380 | 79,053 | ||||||
C.R. Bard, Inc. | 825 | 79,357 | ||||||
CareFusion Corp.* | 3,087 | 81,991 | ||||||
Cooper Cos., Inc. (The) | 917 | 88,014 | ||||||
DENTSPLY International, Inc. | 2,293 | 84,474 | ||||||
Edwards Lifesciences Corp.* | 830 | 72,069 | ||||||
Hill-Rom Holdings, Inc. | 2,986 | 83,877 | ||||||
Hologic, Inc.* | 4,210 | 86,810 | ||||||
IDEXX Laboratories, Inc.* | 867 | 83,405 | ||||||
ResMed, Inc. | 2,164 | 86,430 | ||||||
Sirona Dental Systems, Inc.* | 1,532 | 87,722 | ||||||
St Jude Medical, Inc. | 2,052 | 78,510 | ||||||
Teleflex, Inc. | 1,249 | 84,870 | ||||||
Thoratec Corp.* | 2,489 | 88,857 | ||||||
Varian Medical Systems, Inc.* | 1,437 | 95,934 | ||||||
| SHARES | VALUE | |||||||
Zimmer Holdings, Inc. | 1,296 | $ | 83,216 | |||||
|
| |||||||
Total Health Care Equipment & Supplies | 1,428,589 | |||||||
|
| |||||||
Health Care Providers & Services - 3.5% |
| |||||||
AMERIGROUP Corp.* | 951 | 86,864 | ||||||
AmerisourceBergen Corp. | 2,231 | 87,991 | ||||||
Brookdale Senior Living, Inc.* | 3,797 | 89,078 | ||||||
Catamaran Corp.* | 1,753 | 82,671 | ||||||
CIGNA Corp. | 1,849 | 94,299 | ||||||
Community Health Systems, Inc.* | 3,043 | 83,439 | ||||||
Coventry Health Care, Inc. | 2,072 | 90,422 | ||||||
DaVita, Inc.* | 863 | 97,105 | ||||||
HCA Holdings, Inc. | 2,720 | 77,275 | ||||||
Health Management Associates, | 10,547 | 76,993 | ||||||
Health Net, Inc.* | 3,970 | 85,434 | ||||||
Henry Schein, Inc.* | 1,079 | 79,609 | ||||||
Humana, Inc. | 1,223 | 90,832 | ||||||
Laboratory Corp. of America Holdings* | 950 | 80,494 | ||||||
LifePoint Hospitals, Inc.* | 2,027 | 71,634 | ||||||
Mednax, Inc.* | 1,162 | 80,155 | ||||||
Omnicare, Inc. | 2,608 | 90,054 | ||||||
Patterson Cos., Inc. | 2,482 | 82,899 | ||||||
Quest Diagnostics, Inc. | 1,373 | 79,250 | ||||||
Tenet Healthcare Corp.* | 3,548 | 83,733 | ||||||
Universal Health Services, Inc. — Class B | 1,929 | 79,841 | ||||||
VCA Antech, Inc.* | 4,455 | 87,229 | ||||||
|
| |||||||
Total Health Care Providers & Services | 1,857,301 | |||||||
|
| |||||||
Health Care Technology - 0.4% |
| |||||||
Allscripts Healthcare Solutions, Inc.* | 8,040 | 103,877 | ||||||
Cerner Corp.* | 1,157 | 88,152 | ||||||
|
| |||||||
Total Health Care Technology | 192,029 | |||||||
|
| |||||||
Hotels, Restaurants & Leisure - 1.3% |
| |||||||
Bally Technologies, Inc.* | 919 | 45,877 | ||||||
Brinker International, Inc. | 1,243 | 38,284 | ||||||
Chipotle Mexican Grill, Inc.* | 133 | 33,853 | ||||||
Choice Hotels International, Inc. | 1,349 | 42,210 | ||||||
Darden Restaurants, Inc. | 770 | 40,517 | ||||||
Dunkin’ Brands Group, Inc. | 1,460 | 45,260 | ||||||
Hyatt Hotels Corp. — Class A* | 1,080 | 39,420 | ||||||
International Game Technology | 3,369 | 43,258 | ||||||
Marriott International, Inc. — Class A | 1,098 | 40,055 | ||||||
MGM Resorts International* | 4,108 | 42,353 | ||||||
Panera Bread Co. — Class A* | 251 | 42,329 | ||||||
Penn National Gaming, Inc.* | 1,023 | 41,360 | ||||||
Royal Caribbean Cruises Ltd. | 1,405 | 47,306 | ||||||
Starwood Hotels & Resorts Worldwide, Inc. | 751 | 38,939 | ||||||
Wendy’s Co.(The) | 9,343 | 39,895 | ||||||
Wyndham Worldwide Corp. | 818 | 41,227 | ||||||
| 60 | GUGGENHEIM ETFS ANNUAL REPORT | See Notes to Financial Statements. |
Table of Contents
| SCHEDULE OF INVESTMENTS (continued) | October 31, 2012 |
GUGGENHEIM RUSSELL MIDCAP® EQUAL WEIGHT ETF
| SHARES | VALUE | |||||||
Wynn Resorts Ltd. | 377 | $ | 45,640 | |||||
|
| |||||||
Total Hotels, Restaurants & Leisure | 707,783 | |||||||
|
| |||||||
Household Durables - 1.2% |
| |||||||
DR Horton, Inc. | 1,977 | 41,438 | ||||||
Garmin Ltd. | 1,047 | 39,776 | ||||||
Harman International Industries, Inc. | 917 | 38,450 | ||||||
Jarden Corp. | 820 | 40,836 | ||||||
Leggett & Platt, Inc. | 1,732 | 45,950 | ||||||
Lennar Corp. — Class Aa | 1,185 | 44,402 | ||||||
Mohawk Industries, Inc.* | 535 | 44,656 | ||||||
Newell Rubbermaid, Inc. | 2,253 | 46,502 | ||||||
NVR, Inc.* | 50 | 45,187 | ||||||
PulteGroup, Inc.* | 2,676 | 46,402 | ||||||
Tempur-Pedic International, Inc.* | 1,559 | 41,220 | ||||||
Toll Brothers, Inc.* | 1,211 | 39,975 | ||||||
Tupperware Brands Corp. | 784 | 46,334 | ||||||
Whirlpool Corp. | 516 | 50,403 | ||||||
|
| |||||||
Total Household Durables | 611,531 | |||||||
|
| |||||||
Household Products - 1.0% |
| |||||||
Church & Dwight Co., Inc. | 3,207 | 162,787 | ||||||
Clorox Co.(The) | 2,426 | 175,400 | ||||||
Energizer Holdings, Inc. | 2,297 | 167,612 | ||||||
|
| |||||||
Total Household Products | 505,799 | |||||||
|
| |||||||
Independent Power Producers & Energy Traders - 0.7% |
| |||||||
AES Corp.(The) | 11,101 | 116,005 | ||||||
Calpine Corp.* | 7,191 | 126,562 | ||||||
NRG Energy, Inc. | 5,648 | 121,771 | ||||||
|
| |||||||
Total Independent Power Producers & Energy Traders | 364,338 | |||||||
|
| |||||||
Industrial Conglomerates - 0.1% |
| |||||||
Carlisle Cos., Inc. | 973 | 54,050 | ||||||
|
| |||||||
Total Industrial Conglomerates | 54,050 | |||||||
|
| |||||||
Insurance - 2.7% |
| |||||||
Alleghany Corp.* | 92 | 31,979 | ||||||
Allied World Assurance Co. Holdings AG | 423 | 33,967 | ||||||
American Financial Group, Inc. | 862 | 33,446 | ||||||
American National Insurance Co. | 455 | 33,242 | ||||||
Aon PLC | 623 | 33,611 | ||||||
Arch Capital Group Ltd.* | 785 | 34,658 | ||||||
Arthur J. Gallagher & Co. | 883 | 31,294 | ||||||
Aspen Insurance Holdings Ltd. | 1,063 | 34,388 | ||||||
Assurant, Inc. | 871 | 32,932 | ||||||
Assured Guaranty Ltd. | 2,376 | 33,003 | ||||||
Axis Capital Holdings Ltd. | 928 | 33,612 | ||||||
Brown & Brown, Inc. | 1,239 | 31,656 | ||||||
Cincinnati Financial Corp. | 844 | 33,625 | ||||||
CNA Financial Corp. | 1,209 | 35,520 | ||||||
Endurance Specialty Holdings Ltd. | 837 | 33,940 | ||||||
Erie Indemnity Co. — Class A | 501 | 31,172 | ||||||
Everest Re Group Ltd. | 301 | 33,426 | ||||||
Fidelity National Financial, Inc. — Class A | 1,529 | 32,736 | ||||||
| SHARES | VALUE | |||||||
Genworth Financial, Inc. — Class A* | 6,258 | $ | 37,298 | |||||
Hanover Insurance Group, Inc.(The) | 875 | 31,596 | ||||||
Hartford Financial Services Group, Inc. | 1,720 | 37,341 | ||||||
HCC Insurance Holdings, Inc. | 955 | 34,036 | ||||||
Kemper Corp. | 1,046 | 32,426 | ||||||
Lincoln National Corp. | 1,334 | 33,070 | ||||||
Markel Corp.* | 71 | 33,508 | ||||||
MBIA, Inc.* | 3,138 | 31,066 | ||||||
Mercury General Corp. | 832 | 33,721 | ||||||
Old Republic International Corp. | 3,461 | 34,195 | ||||||
PartnerRe Ltd. | 434 | 35,154 | ||||||
Principal Financial Group, Inc. | 1,207 | 33,241 | ||||||
ProAssurance Corp. | 367 | 32,810 | ||||||
Progressive Corp.(The) | 1,553 | 34,632 | ||||||
Protective Life Corp. | 1,240 | 33,852 | ||||||
Reinsurance Group of America, Inc. | 561 | 29,688 | ||||||
RenaissanceRe Holdings Ltd. | 424 | 34,497 | ||||||
StanCorp Financial Group, Inc. | 1,031 | 35,415 | ||||||
Torchmark Corp. | 630 | 31,872 | ||||||
Unum Group | 1,675 | 33,969 | ||||||
Validus Holdings Ltd. | 961 | 34,404 | ||||||
W.R. Berkley Corp. | 873 | 33,951 | ||||||
White Mountains Insurance Group Ltd. | 63 | 32,300 | ||||||
XL Group PLC | 1,352 | 33,448 | ||||||
|
| |||||||
Total Insurance | 1,405,697 | |||||||
|
| |||||||
Internet & Catalog Retail - 0.6% |
| |||||||
Expedia, Inc. | 739 | 43,712 | ||||||
Groupon, Inc.*,a | 12,568 | 51,780 | ||||||
HomeAway, Inc.*,a | 1,793 | 46,098 | ||||||
Liberty Interactive Corp. — Series A* | 2,368 | 47,360 | ||||||
Liberty Ventures* | 880 | 50,081 | ||||||
Netflix, Inc.*,a | 799 | 63,193 | ||||||
TripAdvisor, Inc.* | 1,274 | 38,589 | ||||||
|
| |||||||
Total Internet & Catalog Retail | 340,813 | |||||||
|
| |||||||
Internet Software & Services - 0.7% |
| |||||||
Akamai Technologies, Inc.* | 1,579 | 59,986 | ||||||
AOL, Inc.* | 1,803 | 61,897 | ||||||
Equinix, Inc.* | 307 | 55,386 | ||||||
IAC/InterActiveCorp | 1,152 | 55,699 | ||||||
LinkedIn Corp. — Class A* | 506 | 54,106 | ||||||
Rackspace Hosting, Inc.* | 927 | 59,041 | ||||||
VeriSign, Inc.* | 1,270 | 47,079 | ||||||
|
| |||||||
Total Internet Software & Services | 393,194 | |||||||
|
| |||||||
IT Services - 1.9% |
| |||||||
Alliance Data Systems Corp.* | 227 | 32,472 | ||||||
Amdocs Ltd. | 1,848 | 61,113 | ||||||
Booz Allen Hamilton Holding Corp. | 3,724 | 49,827 | ||||||
Broadridge Financial Solutions, Inc. | 1,395 | 32,015 | ||||||
Computer Sciences Corp. | 1,897 | 57,764 | ||||||
CoreLogic, Inc.* | 1,218 | 28,988 | ||||||
DST Systems, Inc. | 1,082 | 61,717 | ||||||
Fidelity National Information Services, Inc. | 1,003 | 32,969 | ||||||
| See Notes to Financial Statements. | GUGGENHEIM ETFS ANNUAL REPORT | 61 |
Table of Contents
| SCHEDULE OF INVESTMENTS (continued) | October 31, 2012 |
GUGGENHEIM RUSSELL MIDCAP® EQUAL WEIGHT ETF
| SHARES | VALUE | |||||||
Fiserv, Inc.* | 443 | $ | 33,199 | |||||
FleetCor Technologies, Inc.* | 736 | 34,894 | ||||||
Gartner, Inc.* | 1,310 | 60,797 | ||||||
Genpact Ltd. | 3,040 | 53,535 | ||||||
Global Payments, Inc. | 743 | 31,763 | ||||||
Jack Henry & Associates, Inc. | 862 | 32,756 | ||||||
Lender Processing Services, Inc. | 1,147 | 27,654 | ||||||
NeuStar, Inc. — Class A* | 1,522 | 55,690 | ||||||
Paychex, Inc. | 1,532 | 49,683 | ||||||
SAIC, Inc. | 4,975 | 54,675 | ||||||
Teradata Corp.* | 813 | 55,536 | ||||||
Total System Services, Inc. | 1,362 | 30,631 | ||||||
Vantiv, Inc. — Class A* | 1,436 | 28,979 | ||||||
VeriFone Systems, Inc.* | 2,022 | 59,932 | ||||||
Western Union Co.(The) | 1,763 | 22,390 | ||||||
|
| |||||||
Total IT Services | 988,979 | |||||||
|
| |||||||
Leisure Equipment & Products - 0.2% |
| |||||||
Hasbro, Inc. | 1,145 | 41,209 | ||||||
Mattel, Inc. | 1,209 | 44,467 | ||||||
Polaris Industries, Inc. | 537 | 45,376 | ||||||
|
| |||||||
Total Leisure Equipment & Products | 131,052 | |||||||
|
| |||||||
Life Sciences Tools & Services - 1.7% |
| |||||||
Agilent Technologies, Inc. | 1,336 | 48,083 | ||||||
Bio-Rad Laboratories, Inc. — Class A* | 803 | 81,384 | ||||||
Bruker Corp.* | 6,687 | 80,846 | ||||||
Charles River Laboratories International, Inc.* | 2,271 | 84,754 | ||||||
Covance, Inc.* | 1,838 | 89,529 | ||||||
Illumina, Inc.* | 1,824 | 86,658 | ||||||
Life Technologies Corp.* | 1,770 | 86,571 | ||||||
Mettler-Toledo International, Inc.* | 300 | 50,811 | ||||||
PerkinElmer, Inc. | 2,924 | 90,439 | ||||||
QIAGEN NV* | 4,648 | 81,107 | ||||||
Techne Corp. | 1,191 | 80,226 | ||||||
Waters Corp.* | 609 | 49,822 | ||||||
|
| |||||||
Total Life Sciences Tools & Services | 910,230 | |||||||
|
| |||||||
Machinery - 3.7% |
| |||||||
AGCO Corp.* | 1,105 | 50,289 | ||||||
CNH Global NV* | 1,289 | 57,747 | ||||||
Colfax Corp.* | 1,453 | 49,969 | ||||||
Crane Co. | 1,266 | 53,147 | ||||||
Donaldson Co., Inc. | 1,455 | 46,953 | ||||||
Dover Corp. | 866 | 50,419 | ||||||
Eaton Corp. | 1,109 | 52,367 | ||||||
Flowserve Corp. | 398 | 53,925 | ||||||
Gardner Denver, Inc. | 862 | 59,762 | ||||||
Graco, Inc. | 1,019 | 48,973 | ||||||
Harsco Corp. | 2,473 | 49,435 | ||||||
IDEX Corp. | 1,234 | 52,482 | ||||||
Ingersoll-Rand PLC | 1,135 | 53,379 | ||||||
ITT Corp. | 2,468 | 51,334 | ||||||
Joy Global, Inc. | 900 | 56,205 | ||||||
| SHARES | VALUE | |||||||
Kennametal, Inc. | 1,394 | $ | 49,375 | |||||
Lincoln Electric Holdings, Inc. | 1,313 | 56,945 | ||||||
Manitowoc Co., Inc.(The) | 3,911 | 55,732 | ||||||
Navistar International Corp.*,a | 2,378 | 44,587 | ||||||
Nordson Corp. | 865 | 51,061 | ||||||
Oshkosh Corp.* | 1,858 | 55,703 | ||||||
PACCAR, Inc. | 1,264 | 54,782 | ||||||
Pall Corp. | 802 | 50,494 | ||||||
Parker Hannifin Corp. | 616 | 48,455 | ||||||
Pentair Ltd. | 1,423 | 60,108 | ||||||
Snap-on, Inc. | 603 | 46,630 | ||||||
SPX Corp. | 794 | 54,460 | ||||||
Stanley Black & Decker, Inc. | 675 | 46,777 | ||||||
Terex Corp.* | 2,312 | 52,136 | ||||||
Timken Co. | 2,502 | 98,804 | ||||||
Toro Co.(The) | 1,325 | 55,941 | ||||||
Trinity Industries, Inc. | 1,655 | 51,768 | ||||||
Valmont Industries, Inc. | 719 | 97,137 | ||||||
WABCO Holdings, Inc.* | 763 | 44,689 | ||||||
Wabtec Corp. | 650 | 53,235 | ||||||
Xylem, Inc. | 2,015 | 48,884 | ||||||
|
| |||||||
Total Machinery | 1,964,089 | |||||||
|
| |||||||
Marine - 0.2% |
| |||||||
Kirby Corp.* | 927 | 53,284 | ||||||
Matson, Inc. | 2,470 | 52,487 | ||||||
|
| |||||||
Total Marine | 105,771 | |||||||
|
| |||||||
Media - 2.0% |
| |||||||
AMC Networks, Inc. — Class A* | 1,022 | 47,748 | ||||||
Cablevision Systems Corp. — Class A | 2,703 | 47,086 | ||||||
Charter Communications, Inc. —Class A* | 569 | 44,046 | ||||||
Cinemark Holdings, Inc. | 1,884 | 46,516 | ||||||
Clear Channel Outdoor Holdings, | 7,347 | 48,931 | ||||||
Discovery Communications, | 735 | 43,380 | ||||||
DISH Network Corp. — Class A | 1,380 | 49,169 | ||||||
DreamWorks Animation SKG, | 2,501 | 50,945 | ||||||
Gannett Co., Inc. | 2,368 | 40,019 | ||||||
Interpublic Group of Cos., Inc.(The) | 3,820 | 38,582 | ||||||
John Wiley & Sons, Inc. — Class A | 914 | 39,649 | ||||||
Lamar Advertising Co. — Class A* | 1,161 | 45,569 | ||||||
Liberty Global, Inc. — Class A* | 713 | 42,801 | ||||||
Liberty Media Corp. — Liberty | 420 | 46,901 | ||||||
Madison Square Garden Co. | 1,080 | 44,453 | ||||||
McGraw-Hill Cos., Inc.(The) | 795 | 43,948 | ||||||
Morningstar, Inc. | 520 | 32,750 | ||||||
Omnicom Group, Inc. | 814 | 38,999 | ||||||
Pandora Media, Inc.*,a | 4,140 | 34,735 | ||||||
Regal Entertainment Group — Class Aa | 3,112 | 47,800 | ||||||
| 62 | GUGGENHEIM ETFS ANNUAL REPORT | See Notes to Financial Statements. |
Table of Contents
| SCHEDULE OF INVESTMENTS (continued) | October 31, 2012 |
GUGGENHEIM RUSSELL MIDCAP® EQUAL WEIGHT ETF
| SHARES | VALUE | |||||||
Scripps Networks Interactive, | 702 | $ | 42,626 | |||||
Sirius XM Radio, Inc.* | 17,400 | 48,720 | ||||||
Virgin Media, Inc. | 1,459 | 47,768 | ||||||
Washington Post Co.(The) — Class B | 119 | 39,688 | ||||||
|
| |||||||
Total Media | 1,052,829 | |||||||
|
| |||||||
Metals & Mining - 2.9% |
| |||||||
Alcoa, Inc. | 10,573 | 90,611 | ||||||
Allegheny Technologies, Inc. | 2,954 | 77,838 | ||||||
Allied Nevada Gold Corp.* | 2,462 | 90,897 | ||||||
Carpenter Technology Corp. | 1,808 | 87,887 | ||||||
Cliffs Natural Resources, Inc. | 2,399 | 87,012 | ||||||
Commercial Metals Co. | 7,107 | 97,792 | ||||||
Compass Minerals International, Inc. | 1,231 | 97,064 | ||||||
Molycorp, Inc.*,a | 8,458 | 87,963 | ||||||
Nucor Corp. | 2,433 | 97,636 | ||||||
Reliance Steel & Aluminum Co. | 1,812 | 98,464 | ||||||
Royal Gold, Inc. | 997 | 87,816 | ||||||
Steel Dynamics, Inc. | 8,271 | 104,628 | ||||||
Tahoe Resources, Inc.* | 4,725 | 96,579 | ||||||
Titanium Metals Corp. | 7,239 | 84,769 | ||||||
United States Steel Corp.a | 4,896 | 99,829 | ||||||
Walter Energy, Inc. | 3,431 | 119,948 | ||||||
|
| |||||||
Total Metals & Mining | 1,506,733 | |||||||
|
| |||||||
Multi-Utilities - 3.1% |
| |||||||
Alliant Energy Corp. | 2,810 | 125,607 | ||||||
Ameren Corp. | 3,744 | 123,103 | ||||||
CenterPoint Energy, Inc. | 5,727 | 124,104 | ||||||
CMS Energy Corp. | 5,251 | 127,704 | ||||||
DTE Energy Co. | 2,054 | 127,553 | ||||||
Integrys Energy Group, Inc. | 2,331 | 125,967 | ||||||
MDU Resources Group, Inc. | 5,491 | 119,319 | ||||||
NiSource, Inc. | 4,809 | 122,485 | ||||||
SCANA Corp. | 2,523 | 123,829 | ||||||
Sempra Energy | 1,887 | 131,618 | ||||||
TECO Energy, Inc. | 6,950 | 124,197 | ||||||
Vectren Corp. | 4,289 | 126,826 | ||||||
Wisconsin Energy Corp. | 3,280 | 126,182 | ||||||
|
| |||||||
Total Multi-Utilities | 1,628,494 | |||||||
|
| |||||||
Multiline Retail - 0.8% |
| |||||||
Big Lots, Inc.* | 1,453 | 42,326 | ||||||
Dillard’s, Inc. — Class A | 579 | 44,583 | ||||||
Dollar General Corp.* | 815 | 39,625 | ||||||
Dollar Tree, Inc.* | 882 | 35,165 | ||||||
Family Dollar Stores, Inc. | 681 | 44,919 | ||||||
J.C. Penney Co., Inc. | 1,742 | 41,825 | ||||||
Kohl’s Corp. | 840 | 44,755 | ||||||
Macy’s, Inc. | 1,139 | 43,362 | ||||||
Nordstrom, Inc. | 783 | 44,451 | ||||||
Sears Canada, Inc.* | 332 | 3,608 | ||||||
Sears Holdings Corp.* | 777 | 48,695 | ||||||
|
| |||||||
Total Multiline Retail | 433,314 | |||||||
|
| |||||||
| SHARES | VALUE | |||||||
Office Electronics - 0.2% |
| |||||||
Xerox Corp. | 6,994 | $ | 45,042 | |||||
Zebra Technologies Corp. — Class A* | 1,353 | 48,613 | ||||||
|
| |||||||
Total Office Electronics | 93,655 | |||||||
|
| |||||||
Oil, Gas & Consumable Fuels - 7.5% |
| |||||||
Alpha Natural Resources, Inc.* | 16,988 | 145,587 | ||||||
Cabot Oil & Gas Corp. | 2,545 | 119,564 | ||||||
Cheniere Energy, Inc.* | 7,049 | 113,418 | ||||||
Chesapeake Energy Corp. | 5,820 | 117,913 | ||||||
Cimarex Energy Co. | 1,898 | 108,528 | ||||||
Cobalt International Energy, Inc.* | 5,027 | 104,612 | ||||||
Concho Resources, Inc.* | 1,157 | 99,641 | ||||||
CONSOL Energy, Inc. | 3,801 | 133,643 | ||||||
Continental Resources, Inc.* | 1,467 | 105,419 | ||||||
Denbury Resources, Inc.* | 6,729 | 103,156 | ||||||
Energen Corp. | 2,358 | 110,001 | ||||||
EQT Corp. | 1,946 | 117,986 | ||||||
EXCO Resources, Inc. | 14,298 | 115,814 | ||||||
Golar LNG Ltd. | 2,893 | 112,914 | ||||||
HollyFrontier Corp. | 2,756 | 106,464 | ||||||
Kosmos Energy Ltd.* | 9,763 | 111,103 | ||||||
Laredo Petroleum Holdings, Inc.* | 5,113 | 103,743 | ||||||
Marathon Petroleum Corp. | 2,071 | 113,760 | ||||||
Murphy Oil Corp. | 2,044 | 122,640 | ||||||
Newfield Exploration Co.* | 3,477 | 94,296 | ||||||
Noble Energy, Inc. | 1,208 | 114,772 | ||||||
Peabody Energy Corp. | 5,055 | 141,034 | ||||||
Pioneer Natural Resources Co. | 1,079 | 113,996 | ||||||
Plains Exploration & Production Co.* | 2,876 | 102,558 | ||||||
QEP Resources, Inc. | 3,580 | 103,820 | ||||||
Range Resources Corp. | 1,656 | 108,236 | ||||||
SandRidge Energy, Inc.* | 15,826 | 98,438 | ||||||
SM Energy Co. | 2,190 | 118,085 | ||||||
Southwestern Energy Co.* | 3,340 | 115,898 | ||||||
Teekay Corp. | 1,650 | 50,506 | ||||||
Tesoro Corp. | 2,706 | 102,043 | ||||||
Ultra Petroleum Corp.*,a | 5,133 | 117,084 | ||||||
Valero Energy Corp. | 3,530 | 102,723 | ||||||
Whiting Petroleum Corp.* | 2,351 | 98,789 | ||||||
World Fuel Services Corp. | 3,123 | 108,368 | ||||||
WPX Energy, Inc.* | 6,766 | 114,616 | ||||||
|
| |||||||
Total Oil, Gas & Consumable Fuels | 3,971,168 | |||||||
|
| |||||||
Paper & Forest Products - 0.5% |
| |||||||
Domtar Corp. | 1,216 | 96,976 | ||||||
International Paper Co. | 2,599 | 93,122 | ||||||
MeadWestvaco Corp. | 3,060 | 90,852 | ||||||
|
| |||||||
Total Paper & Forest Products | 280,950 | |||||||
|
| |||||||
Personal Products 0.6% |
| |||||||
Avon Products, Inc. | 2,726 | 42,226 | ||||||
Herbalife Ltd. | 3,796 | 194,925 | ||||||
Nu Skin Enterprises, Inc. — Class Aa | 1,171 | 55,423 | ||||||
|
| |||||||
Total Personal Products | 292,574 | |||||||
|
| |||||||
| See Notes to Financial Statements. | GUGGENHEIM ETFS ANNUAL REPORT | 63 |
Table of Contents
| SCHEDULE OF INVESTMENTS (continued) | October 31, 2012 |
GUGGENHEIM RUSSELL MIDCAP® EQUAL WEIGHT ETF
| SHARES | VALUE | |||||||
Pharmaceuticals - 1.2% |
| |||||||
Endo Health Solutions, Inc.* | 2,707 | $ | 77,583 | |||||
Forest Laboratories, Inc.* | 2,398 | 80,837 | ||||||
Hospira, Inc.* | 2,536 | 77,830 | ||||||
Mylan, Inc.* | 3,578 | 90,667 | ||||||
Perrigo Co. | 742 | 85,337 | ||||||
Salix Pharmaceuticals Ltd.* | 2,009 | 78,431 | ||||||
Warner Chilcott PLC — Class A | 6,530 | 75,617 | ||||||
Watson Pharmaceuticals, Inc.* | 1,042 | 89,560 | ||||||
|
| |||||||
Total Pharmaceuticals | 655,862 | |||||||
|
| |||||||
Professional Services - 0.7% |
| |||||||
Dun & Bradstreet Corp.(The) | 404 | 32,740 | ||||||
Equifax, Inc. | 705 | 35,278 | ||||||
IHS, Inc. — Class A* | 545 | 45,993 | ||||||
Manpower, Inc. | 1,354 | 51,371 | ||||||
Nielsen Holdings NV* | 1,456 | 42,108 | ||||||
Robert Half International, Inc. | 1,941 | 52,193 | ||||||
Towers Watson & Co. — Class A | 955 | 51,293 | ||||||
Verisk Analytics, Inc. — Class A* | 1,094 | 55,794 | ||||||
|
| |||||||
Total Professional Services | 366,770 | |||||||
|
| |||||||
Real Estate Investment Trusts (REITs) - 3.3% |
| |||||||
Alexandria Real Estate Equities, Inc. | 438 | 30,848 | ||||||
American Campus Communities, Inc. | 747 | 33,847 | ||||||
American Capital Agency Corp. | 934 | 30,841 | ||||||
Annaly Capital Management, Inc. | 1,849 | 29,843 | ||||||
Apartment Investment & Management | 1,248 | 33,309 | ||||||
AvalonBay Communities, Inc. | 239 | 32,399 | ||||||
BioMed Realty Trust, Inc. | 1,715 | 32,791 | ||||||
Boston Properties, Inc. | 292 | 31,040 | ||||||
Brandywine Realty Trust | 2,645 | 30,682 | ||||||
BRE Properties, Inc. | 694 | 33,555 | ||||||
Camden Property Trust | 499 | 32,749 | ||||||
CBL & Associates Properties, Inc. | 1,483 | 33,175 | ||||||
Chimera Investment Corp. | 11,513 | 30,740 | ||||||
CommonWealth REIT | 2,215 | 30,368 | ||||||
Corporate Office Properties Trust | 1,341 | 33,458 | ||||||
DDR Corp. | 2,108 | 32,379 | ||||||
Digital Realty Trust, Inc. | 480 | 29,486 | ||||||
Douglas Emmett, Inc. | 1,407 | 32,994 | ||||||
Duke Realty Corp. | 2,192 | 31,740 | ||||||
Equity Lifestyle Properties, Inc. | 468 | 31,510 | ||||||
Essex Property Trust, Inc. | 217 | 32,550 | ||||||
Extra Space Storage, Inc. | 975 | 33,628 | ||||||
Federal Realty Investment Trust | 312 | 33,643 | ||||||
General Growth Properties, Inc. | 1,686 | 33,147 | ||||||
Hatteras Financial Corp. | 1,105 | 30,133 | ||||||
HCP, Inc. | 732 | 32,428 | ||||||
Health Care REIT, Inc. | 566 | 33,637 | ||||||
Home Properties, Inc. | 524 | 31,854 | ||||||
Hospitality Properties Trust | 1,355 | 31,328 | ||||||
Host Hotels & Resorts, Inc. | 2,005 | 28,992 | ||||||
Kilroy Realty Corp. | 709 | 31,487 | ||||||
| SHARES | VALUE | |||||||
Kimco Realty Corp. | 1,597 | $ | 31,173 | |||||
Liberty Property Trust | 879 | 30,870 | ||||||
Macerich Co.(The) | 564 | 32,148 | ||||||
Mack-Cali Realty Corp. | 1,213 | 31,526 | ||||||
MFA Financial, Inc. | 3,780 | 30,883 | ||||||
Mid-America Apartment | 498 | 32,226 | ||||||
National Retail Properties, Inc. | 1,060 | 33,581 | ||||||
Piedmont Office Realty Trust, | 1,841 | 32,770 | ||||||
Plum Creek Timber Co., Inc. | 730 | 32,047 | ||||||
Post Properties, Inc. | 672 | 32,800 | ||||||
ProLogis, Inc. | 944 | 32,370 | ||||||
Rayonier, Inc. | 652 | 31,954 | ||||||
Realty Income Corp. | 793 | 31,141 | ||||||
Regency Centers Corp. | 665 | 31,933 | ||||||
Retail Properties of America, | 2,794 | 34,199 | ||||||
Senior Housing Properties Trust | 1,478 | 32,486 | ||||||
SL Green Realty Corp. | 403 | 30,346 | ||||||
Tanger Factory Outlet Centers, Inc. | 1,009 | 31,753 | ||||||
Taubman Centers, Inc. | 418 | 32,834 | ||||||
UDR, Inc. | 1,302 | 31,599 | ||||||
Ventas, Inc. | 521 | 32,964 | ||||||
Vornado Realty Trust | 399 | 32,004 | ||||||
Weingarten Realty Investors | 1,169 | 31,563 | ||||||
Weyerhaeuser Co. | 1,221 | 33,809 | ||||||
|
| |||||||
Total Real Estate Investment Trusts (REITs) | 1,761,560 | |||||||
|
| |||||||
Real Estate Management & Development - 0.4% |
| |||||||
Alexander & Baldwin, Inc.* | 1,085 | 31,389 | ||||||
CBRE Group, Inc.* | 1,745 | 31,445 | ||||||
Forest City Enterprises, Inc. — Class A* | 2,110 | 33,865 | ||||||
Howard Hughes Corp.(The)* | 460 | 32,200 | ||||||
Jones Lang LaSalle, Inc. | 420 | 32,651 | ||||||
St Joe Co.(The)*,a | 1,602 | 31,720 | ||||||
|
| |||||||
Total Real Estate Management & Development | 193,270 | |||||||
|
| |||||||
Road & Rail - 0.6% |
| |||||||
Con-way, Inc. | 1,904 | 55,426 | ||||||
Hertz Global Holdings, Inc.* | 3,122 | 41,429 | ||||||
JB Hunt Transport Services, Inc. | 1,000 | 58,700 | ||||||
Kansas City Southern | 671 | 53,989 | ||||||
Landstar System, Inc. | 1,076 | 54,499 | ||||||
Ryder System, Inc. | 1,311 | 59,152 | ||||||
|
| |||||||
Total Road & Rail | 323,195 | |||||||
|
| |||||||
Semiconductors & Semiconductor Equipment - 2.7% |
| |||||||
Advanced Micro Devices, Inc.*,a | 18,507 | 37,939 | ||||||
Altera Corp. | 1,723 | 52,517 | ||||||
Analog Devices, Inc. | 1,556 | 60,855 | ||||||
Applied Materials, Inc. | 5,449 | 57,759 | ||||||
Atmel Corp.* | 11,138 | 51,959 | ||||||
Avago Technologies Ltd. | 1,840 | 60,775 | ||||||
| 64 | GUGGENHEIM ETFS ANNUAL REPORT | See Notes to Financial Statements. |
Table of Contents
| SCHEDULE OF INVESTMENTS (continued) | October 31, 2012 |
GUGGENHEIM RUSSELL MIDCAP® EQUAL WEIGHT ETF
| SHARES | VALUE | |||||||
Cree, Inc.* | 2,378 | $ | 72,125 | |||||
Cypress Semiconductor Corp.* | 5,647 | 55,962 | ||||||
Fairchild Semiconductor International, Inc.* | 4,520 | 53,155 | ||||||
Freescale Semiconductor Ltd.*,a | 6,634 | 59,308 | ||||||
KLA-Tencor Corp. | 1,296 | 60,290 | ||||||
Lam Research Corp.* | 1,906 | 67,472 | ||||||
Linear Technology Corp. | 1,912 | 59,769 | ||||||
LSI Corp.* | 8,623 | 59,068 | ||||||
Marvell Technology Group Ltd. | 6,570 | 51,837 | ||||||
Maxim Integrated Products, Inc. | 2,321 | 63,886 | ||||||
Microchip Technology, Inc. | 1,844 | 57,809 | ||||||
Micron Technology, Inc.* | 9,951 | 53,984 | ||||||
NVIDIA Corp.* | 4,528 | 54,200 | ||||||
ON Semiconductor Corp.* | 9,951 | 61,199 | ||||||
PMC — Sierra, Inc.* | 10,394 | 48,644 | ||||||
Silicon Laboratories, Inc.* | 1,678 | 67,825 | ||||||
Skyworks Solutions, Inc.* | 2,584 | 60,466 | ||||||
Teradyne, Inc.*,a | 4,239 | 61,974 | ||||||
Xilinx, Inc. | 1,796 | 58,837 | ||||||
|
| |||||||
Total Semiconductors & Semiconductor Equipment | 1,449,614 | |||||||
|
| |||||||
Software - 2.8% |
| |||||||
Activision Blizzard, Inc. | 5,215 | 56,791 | ||||||
ANSYS, Inc.* | 839 | 59,468 | ||||||
Autodesk, Inc.* | 1,847 | 58,808 | ||||||
BMC Software, Inc.* | 1,451 | 59,056 | ||||||
CA, Inc. | 2,330 | 52,472 | ||||||
Cadence Design Systems, Inc.* | 4,724 | 59,806 | ||||||
Citrix Systems, Inc.* | 808 | 49,942 | ||||||
Compuware Corp.* | 6,163 | 53,372 | ||||||
Concur Technologies, Inc.* | 820 | 54,309 | ||||||
Electronic Arts, Inc.* | 4,791 | 59,169 | ||||||
Factset Research Systems, Inc. | 329 | 29,791 | ||||||
Fortinet, Inc.* | 2,349 | 45,500 | ||||||
Informatica Corp.* | 1,800 | 48,852 | ||||||
Intuit, Inc. | 1,049 | 62,332 | ||||||
MICROS Systems, Inc.* | 1,239 | 56,238 | ||||||
NetSuite, Inc.* | 996 | 63,256 | ||||||
Nuance Communications, Inc.* | 2,495 | 55,539 | ||||||
Red Hat, Inc.* | 1,103 | 54,235 | ||||||
Rovi Corp.* | 4,074 | 55,121 | ||||||
ServiceNow, Inc.* | 1,518 | 46,527 | ||||||
Solarwinds, Inc.* | 1,048 | 53,018 | ||||||
Solera Holdings, Inc. | 1,407 | 65,862 | ||||||
Splunk, Inc.* | 1,650 | 46,282 | ||||||
Symantec Corp.* | 3,363 | 61,173 | ||||||
Synopsys, Inc.* | 1,847 | 59,473 | ||||||
TIBCO Software, Inc.* | 2,042 | 51,479 | ||||||
Zynga, Inc. — Class A* | 21,601 | 48,602 | ||||||
|
| |||||||
Total Software | 1,466,473 | |||||||
|
| |||||||
| SHARES | VALUE | |||||||
Specialty Retail - 2.7% |
| |||||||
Aaron’s, Inc. | 1,543 | $ | 47,571 | |||||
Abercrombie & Fitch Co. — Class A | 1,243 | 38,011 | ||||||
Advance Auto Parts, Inc. | 637 | 45,189 | ||||||
American Eagle Outfitters, Inc. | 2,022 | 42,199 | ||||||
Ascena Retail Group, Inc.* | 2,016 | 39,917 | ||||||
AutoNation, Inc.*,a | 998 | 44,311 | ||||||
AutoZone, Inc.* | 117 | 43,875 | ||||||
Bed Bath & Beyond, Inc.* | 693 | 39,972 | ||||||
Best Buy Co., Inc. | 2,539 | 38,618 | ||||||
CarMax, Inc.* | 1,511 | 50,996 | ||||||
Chico’s FAS, Inc. | 2,379 | 44,250 | ||||||
Dick’s Sporting Goods, Inc. | 834 | 41,700 | ||||||
DSW, Inc. — Class A | 660 | 41,310 | ||||||
Foot Locker, Inc. | 1,201 | 40,234 | ||||||
GameStop Corp. — Class Aa | 2,058 | 46,984 | ||||||
Gap, Inc.(The) | 1,212 | 43,293 | ||||||
GNC Holdings, Inc. — Class A | 4,649 | 179,777 | ||||||
Guess?, Inc. | 1,719 | 42,597 | ||||||
Limited Brands, Inc. | 871 | 41,712 | ||||||
O’Reilly Automotive, Inc.* | 509 | 43,611 | ||||||
PetSmart, Inc. | 629 | 41,759 | ||||||
Ross Stores, Inc. | 664 | 40,471 | ||||||
Sally Beauty Holdings, Inc.* | 1,672 | 40,262 | ||||||
Signet Jewelers Ltd. | 879 | 45,497 | ||||||
Staples, Inc. | 3,649 | 42,018 | ||||||
Tiffany & Co. | 697 | 44,064 | ||||||
Tractor Supply Co. | 443 | 42,634 | ||||||
Ulta Salon Cosmetics & Fragrance, Inc. | 442 | 40,761 | ||||||
Urban Outfitters, Inc.* | 1,133 | 40,516 | ||||||
Williams-Sonoma, Inc. | 992 | 45,860 | ||||||
|
| |||||||
Total Specialty Retail | 1,419,969 | |||||||
|
| |||||||
Textiles, Apparel & Luxury Goods - 0.7% |
| |||||||
Carter’s, Inc.* | 788 | 42,599 | ||||||
Deckers Outdoor Corp.*,a | 1,229 | 35,186 | ||||||
Fossil, Inc.* | 506 | 44,073 | ||||||
Hanesbrands, Inc.* | 1,352 | 45,251 | ||||||
Michael Kors Holdings Ltd.* | 821 | 44,901 | ||||||
PVH Corp. | 463 | 50,925 | ||||||
Ralph Lauren Corp. | 284 | 43,648 | ||||||
Under Armour, Inc. — Class A*,a | 787 | 41,129 | ||||||
V.F. Corp. | 273 | 42,719 | ||||||
|
| |||||||
Total Textiles, Apparel & Luxury Goods | 390,431 | |||||||
|
| |||||||
Thrifts & Mortgage Finance - 0.4% |
| |||||||
Capitol Federal Financial, Inc. | 2,735 | 32,574 | ||||||
Hudson City Bancorp, Inc. | 4,095 | 34,746 | ||||||
New York Community Bancorp, Inc.a | 2,316 | 32,100 | ||||||
People’s United Financial, Inc. | 2,671 | 32,132 | ||||||
TFS Financial Corp.* | 3,575 | 31,996 | ||||||
Washington Federal, Inc. | 1,912 | 32,083 | ||||||
|
| |||||||
Total Thrifts & Mortgage Finance | 195,631 | |||||||
|
| |||||||
| See Notes to Financial Statements. | GUGGENHEIM ETFS ANNUAL REPORT | 65 |
Table of Contents
| SCHEDULE OF INVESTMENTS (concluded) | October 31, 2012 |
GUGGENHEIM RUSSELL MIDCAP® EQUAL WEIGHT ETF
| SHARES | VALUE | |||||||
Tobacco - 0.3% |
| |||||||
Lorillard, Inc. | 1,467 | $ | 170,187 | |||||
|
| |||||||
Total Tobacco | 170,187 | |||||||
|
| |||||||
Trading Companies & Distributors - 1.0% |
| |||||||
Air Lease Corp.* | 2,509 | 52,237 | ||||||
Fastenal Co. | 2,160 | 96,552 | ||||||
GATX Corp. | 1,165 | 48,301 | ||||||
MRC Global, Inc.* | 3,774 | 92,274 | ||||||
MSC Industrial Direct Co., Inc. — Class A | 727 | 54,234 | ||||||
United Rentals, Inc.* | 1,487 | 60,462 | ||||||
W.W. Grainger, Inc. | 248 | 49,950 | ||||||
WESCO International, Inc.* | 898 | 58,262 | ||||||
|
| |||||||
Total Trading Companies & Distributors | 512,272 | |||||||
|
| |||||||
Water Utilities - 0.5% |
| |||||||
American Water Works Co., Inc. | 3,316 | 121,830 | ||||||
Aqua America, Inc. | 4,985 | 126,569 | ||||||
|
| |||||||
Total Water Utilities | 248,399 | |||||||
|
| |||||||
Wireless Telecommunication Services - 1.7% |
| |||||||
Clearwire Corp. — Class A*,a | 83,446 | 166,892 | ||||||
Crown Castle International Corp.* | 954 | 63,680 | ||||||
MetroPCS Communications, Inc.* | 10,630 | 108,532 | ||||||
NII Holdings, Inc.*,a | 16,140 | 128,636 | ||||||
SBA Communications Corp. — Class A* | 992 | 66,097 | ||||||
Sprint Nextel Corp.* | 22,182 | 122,888 | ||||||
Telephone & Data Systems, Inc. | 4,810 | 119,625 | ||||||
United States Cellular Corp.* | 3,157 | 116,777 | ||||||
|
| |||||||
Total Wireless Telecommunication Services |
| 893,127 | ||||||
|
| |||||||
Total Common Stocks | 52,484,749 | |||||||
|
| |||||||
SHORT TERM INVESTMENTS - 0.2% |
| |||||||
SSgA Government Money Market Fund | 105,288 | 105,288 | ||||||
|
| |||||||
Total Short Term Investments | 105,288 | |||||||
|
| |||||||
| FACE AMOUNT | VALUE | |||||||
SECURITIES LENDING COLLATERAL - 2.6%d |
| |||||||
Joint Repurchase Agreements: | ||||||||
Merrill Lynch, Fenner & Smith, Inc. | $ | 515,754 | $ | 515,754 | ||||
RBS Securities, Inc. | 876,911 | 876,911 | ||||||
|
| |||||||
Total Securities Lending Collateral | 1,392,665 | |||||||
|
| |||||||
Total Investments 102.6%c | 53,982,702 | |||||||
|
| |||||||
Other Assets and Liabilities, net - (2.6)% |
| (1,366,151 | ) | |||||
|
| |||||||
Net Assets - 100.0% | $ | 52,616,551 | ||||||
|
| |||||||
| * | Non-Income Producing Security. |
| a | All or a portion of this security was on loan as of October 31, 2012. |
| b | Values determined based on Level 2 inputs (Note F). |
| c | Unless otherwise indicated, the values of the Investments are determined based on Level 1 inputs. |
| d | Securities lending collateral (Note I). |
| 66 | GUGGENHEIM ETFS ANNUAL REPORT | See Notes to Financial Statements. |
Table of Contents
| SCHEDULE OF INVESTMENTS | October 31, 2012 |
GUGGENHEIM RUSSELL 1000® EQUAL WEIGHT ETF
| SHARES | VALUE | |||||||
COMMON STOCKS - 99.7% |
| |||||||
Aerospace & Defense - 1.6% |
| |||||||
Alliant Techsystems, Inc. | 639 | $ | 36,608 | |||||
BE Aerospace, Inc.* | 755 | 34,043 | ||||||
Boeing Co.(The) | 453 | 31,909 | ||||||
Engility Holdings, Inc.* | 1,759 | 33,421 | ||||||
Exelis, Inc. | 3,011 | 33,302 | ||||||
General Dynamics Corp. | 473 | 32,202 | ||||||
Honeywell International, Inc. | 530 | 32,457 | ||||||
Huntington Ingalls Industries, Inc.* | 754 | 31,955 | ||||||
L-3 Communications Holdings, Inc. | 437 | 32,251 | ||||||
Lockheed Martin Corp. | 344 | 32,222 | ||||||
Northrop Grumman Corp. | 478 | 32,834 | ||||||
Precision Castparts Corp. | 362 | 62,651 | ||||||
Raytheon Co. | 542 | 30,656 | ||||||
Rockwell Collins, Inc. | 600 | 32,148 | ||||||
Spirit Aerosystems Holdings, Inc. — Class A* | 1,411 | 22,054 | ||||||
Textron, Inc. | 1,209 | 30,479 | ||||||
TransDigm Group, Inc. | 216 | 28,773 | ||||||
Triumph Group, Inc. | 525 | 34,345 | ||||||
United Technologies Corp. | 399 | 31,186 | ||||||
|
| |||||||
Total Aerospace & Defense |
| 635,496 | ||||||
|
| |||||||
Air Freight & Logistics - 0.4% | ||||||||
C.H. Robinson Worldwide, Inc. | 532 | 32,096 | ||||||
Expeditors International of Washington, Inc. | 872 | 31,924 | ||||||
FedEx Corp. | 372 | 34,220 | ||||||
United Parcel Service, Inc. — Class B | 436 | 31,937 | ||||||
UTi Worldwide, Inc. | 2,326 | 32,308 | ||||||
|
| |||||||
Total Air Freight & Logistics |
| 162,485 | ||||||
|
| |||||||
Airlines - 0.3% | ||||||||
Copa Holdings SA — Class A | 382 | 35,457 | ||||||
Delta Air Lines, Inc.* | 3,482 | 33,532 | ||||||
Southwest Airlines Co. | 3,553 | 31,338 | ||||||
United Continental Holdings, Inc.* | 1,583 | 30,409 | ||||||
|
| |||||||
Total Airlines |
| 130,736 | ||||||
|
| |||||||
Auto Components - 0.6% | ||||||||
Allison Transmission Holdings, Inc.a | 1,610 | 32,506 | ||||||
BorgWarner, Inc.* | 379 | 24,946 | ||||||
Delphi Automotive PLC* | 843 | 26,504 | ||||||
Gentex Corp. | 1,538 | 26,484 | ||||||
Goodyear Tire & Rubber Co. (The)* | 2,174 | 24,805 | ||||||
Johnson Controls, Inc. | 962 | 24,771 | ||||||
Lear Corp. | 701 | 29,863 | ||||||
TRW Automotive Holdings Corp.* | 613 | 28,511 | ||||||
Visteon Corp.* | 604 | 26,636 | ||||||
|
| |||||||
Total Auto Components |
| 245,026 | ||||||
|
| |||||||
Automobiles - 0.4% | ||||||||
Ford Motor Co. | 2,622 | 29,262 | ||||||
General Motors Co.* | 1,125 | 28,688 | ||||||
Harley-Davidson, Inc. | 624 | 29,178 | ||||||
| SHARES | VALUE | |||||||
Tesla Motors, Inc.*,a | 957 | $ | 26,920 | |||||
Thor Industries, Inc. | 773 | 29,397 | ||||||
|
| |||||||
Total Automobiles |
| 143,445 | ||||||
|
| |||||||
Beverages - 2.0% | ||||||||
Beam, Inc. | 1,555 | 86,396 | ||||||
Brown-Forman Corp. — Class B | 1,379 | 88,339 | ||||||
Coca-Cola Co.(The) | 2,364 | 87,894 | ||||||
Coca-Cola Enterprises, Inc. | 2,893 | 90,956 | ||||||
Constellation Brands, Inc. — Class A* | 2,769 | 97,856 | ||||||
Dr Pepper Snapple Group, Inc. | 2,039 | 87,371 | ||||||
Molson Coors Brewing Co. — Class B | 1,972 | 85,072 | ||||||
Monster Beverage Corp.* | 1,650 | 73,705 | ||||||
PepsiCo, Inc. | 1,266 | 87,658 | ||||||
|
| |||||||
Total Beverages |
| 785,247 | ||||||
|
| |||||||
Biotechnology - 1.6% | ||||||||
Alexion Pharmaceuticals, Inc.* | 417 | 37,688 | ||||||
Amgen, Inc. | 566 | 48,985 | ||||||
Ariad Pharmaceuticals, Inc.* | 2,048 | 44,134 | ||||||
Biogen Idec, Inc.* | 311 | 42,986 | ||||||
BioMarin Pharmaceutical, Inc.* | 1,179 | 43,670 | ||||||
Celgene Corp.* | 623 | 45,678 | ||||||
Gilead Sciences, Inc.* | 706 | 47,415 | ||||||
Incyte Corp.*,a | 2,679 | 42,757 | ||||||
Medivation, Inc.* | 874 | 44,679 | ||||||
Myriad Genetics, Inc.* | 1,797 | 47,028 | ||||||
Onyx Pharmaceuticals, Inc.* | 571 | 44,744 | ||||||
Regeneron Pharmaceuticals, Inc.* | 325 | 46,248 | ||||||
United Therapeutics Corp.* | 825 | 37,678 | ||||||
Vertex Pharmaceuticals, Inc.* | 843 | 40,666 | ||||||
|
| |||||||
Total Biotechnology |
| 614,356 | ||||||
|
| |||||||
Building Products - 0.7% | ||||||||
Armstrong World Industries, Inc. | 1,247 | 64,595 | ||||||
Fortune Brands Home & Security, Inc.* | 960 | 27,303 | ||||||
Lennox International, Inc. | 1,167 | 58,408 | ||||||
Masco Corp. | 3,746 | 56,527 | ||||||
Owens Corning* | 1,692 | 56,834 | ||||||
|
| |||||||
Total Building Products |
| 263,667 | ||||||
|
| |||||||
Capital Markets - 1.4% | ||||||||
Affiliated Managers Group, Inc.* | 165 | 20,872 | ||||||
American Capital Ltd.* | 1,739 | 20,503 | ||||||
Ameriprise Financial, Inc. | 359 | 20,955 | ||||||
Ares Capital Corp. | 1,183 | 20,655 | ||||||
Bank of New York Mellon Corp. (The) | 885 | 21,868 | ||||||
BlackRock, Inc. | 113 | 21,434 | ||||||
Charles Schwab Corp.(The) | 1,553 | 21,090 | ||||||
E*Trade Financial Corp.* | 2,283 | 19,086 | ||||||
Eaton Vance Corp. | 697 | 19,613 | ||||||
Federated Investors, Inc. — Class Ba | 940 | 21,846 | ||||||
Franklin Resources, Inc. | 161 | 20,576 | ||||||
Goldman Sachs Group, Inc. (The) | 177 | 21,663 | ||||||
Invesco Ltd. | 805 | 19,578 | ||||||
Janus Capital Group, Inc. | 2,201 | 18,708 | ||||||
| See Notes to Financial Statements. | GUGGENHEIM ETFS ANNUAL REPORT | 67 |
Table of Contents
| SCHEDULE OF INVESTMENTS (continued) | October 31, 2012 |
GUGGENHEIM RUSSELL 1000® EQUAL WEIGHT ETF
| SHARES | VALUE | |||||||
Jefferies Group, Inc. | 1,424 | $ | 20,278 | |||||
Lazard Ltd. — Class A | 690 | 20,327 | ||||||
Legg Mason, Inc. | 806 | 20,537 | ||||||
LPL Financial Holdings, Inc. | 716 | 20,907 | ||||||
Morgan Stanley | 1,207 | 20,978 | ||||||
Northern Trust Corp. | 427 | 20,402 | ||||||
Raymond James Financial, Inc. | 543 | 20,710 | ||||||
SEI Investments Co. | 924 | 20,217 | ||||||
State Street Corp. | 473 | 21,082 | ||||||
T. Rowe Price Group, Inc. | 319 | 20,716 | ||||||
TD Ameritrade Holding Corp. | 1,273 | 19,973 | ||||||
Waddell & Reed Financial, Inc. — Class A | 615 | 20,498 | ||||||
|
| |||||||
Total Capital Markets |
| 535,072 | ||||||
|
| |||||||
Chemicals - 4.6% | ||||||||
Air Products & Chemicals, Inc. | 698 | 54,116 | ||||||
Airgas, Inc. | 695 | 61,834 | ||||||
Albemarle Corp. | 1,127 | 62,109 | ||||||
Ashland, Inc. | 840 | 59,766 | ||||||
Cabot Corp. | 1,561 | 55,821 | ||||||
Celanese Corp. — Series A | 1,541 | 58,543 | ||||||
CF Industries Holdings, Inc. | 272 | 55,812 | ||||||
Cytec Industries, Inc. | 910 | 62,626 | ||||||
Dow Chemical Co.(The) | 1,954 | 57,252 | ||||||
Du Pont (E.I.) de Nemours & Co. | 1,153 | 51,332 | ||||||
Eastman Chemical Co. | 1,039 | 61,550 | ||||||
Ecolab, Inc. | 913 | 63,545 | ||||||
FMC Corp. | 1,034 | 55,340 | ||||||
Huntsman Corp. | 3,901 | 58,671 | ||||||
International Flavors & Fragrances, Inc. | 972 | 62,811 | ||||||
Intrepid Potash, Inc.* | 2,736 | 59,453 | ||||||
Kronos Worldwide, Inc.a | 3,860 | 51,531 | ||||||
LyondellBasell Industries NV — Class A | 1,146 | 61,185 | ||||||
Monsanto Co. | 643 | 55,343 | ||||||
Mosaic Co.(The) | 1,011 | 52,916 | ||||||
NewMarket Corp. | 240 | 65,114 | ||||||
PPG Industries, Inc. | 506 | 59,242 | ||||||
Praxair, Inc. | 548 | 58,203 | ||||||
Rockwood Holdings, Inc. | 1,265 | 58,063 | ||||||
RPM International, Inc. | 2,018 | 53,800 | ||||||
Scotts Miracle-Gro Co.(The) — Class A | 1,333 | 57,066 | ||||||
Sherwin-Williams Co.(The) | 394 | 56,177 | ||||||
Sigma-Aldrich Corp. | 797 | 55,902 | ||||||
Valspar Corp. | 1,013 | 56,758 | ||||||
Westlake Chemical Corp. | 801 | 60,924 | ||||||
WR Grace & Co* | 974 | 62,492 | ||||||
|
| |||||||
Total Chemicals |
| 1,805,297 | ||||||
|
| |||||||
Commercial Banks - 1.7% | ||||||||
Associated Banc-Corp. | 1,533 | 19,760 | ||||||
Bank of Hawaii Corp. | 435 | 19,210 | ||||||
BankUnited, Inc. | 808 | 19,158 | ||||||
BB&T Corp. | 603 | 17,457 | ||||||
BOK Financial Corp. | 342 | 20,058 | ||||||
| SHARES | VALUE | |||||||
CapitalSource, Inc. | 2,703 | $ | 21,381 | |||||
CIT Group, Inc.* | 496 | 18,461 | ||||||
City National Corp. | 388 | 19,827 | ||||||
Comerica, Inc. | 650 | 19,376 | ||||||
Commerce Bancshares, Inc. | 495 | 18,850 | ||||||
Cullen/Frost Bankers, Inc. | 347 | 19,189 | ||||||
East West Bancorp, Inc. | 932 | 19,842 | ||||||
Fifth Third Bancorp | 1,288 | 18,715 | ||||||
First Citizens BancShares Inc. — Class A | 122 | 20,587 | ||||||
First Horizon National Corp. | 2,075 | 19,318 | ||||||
First Niagara Financial Group, Inc. | 2,484 | 20,568 | ||||||
First Republic Bank | 581 | 19,957 | ||||||
Fulton Financial Corp. | 2,026 | 19,693 | ||||||
Huntington Bancshares, Inc. | 2,940 | 18,787 | ||||||
KeyCorp | 2,283 | 19,223 | ||||||
M&T Bank Corp. | 212 | 22,069 | ||||||
PNC Financial Services Group, Inc. | 311 | 18,097 | ||||||
Popular, Inc.* | 1,141 | 22,056 | ||||||
Regions Financial Corp. | 2,777 | 18,106 | ||||||
Signature Bank* | 301 | 21,443 | ||||||
SunTrust Banks, Inc. | 710 | 19,312 | ||||||
SVB Financial Group* | 331 | 18,731 | ||||||
Synovus Financial Corp.a | 8,173 | 20,024 | ||||||
TCF Financial Corp. | 1,728 | 19,768 | ||||||
US Bancorp | 587 | 19,494 | ||||||
Valley National Bancorpa | 2,008 | 19,558 | ||||||
Wells Fargo & Co. | 577 | 19,439 | ||||||
Zions Bancorp | 985 | 21,148 | ||||||
|
| |||||||
Total Commercial Banks |
| 648,662 | ||||||
|
| |||||||
Commercial Services & Supplies - 1.3% | ||||||||
ADT Corp.(The)* | 291 | 12,079 | ||||||
Avery Dennison Corp. | 1,007 | 32,607 | ||||||
Cintas Corp. | 759 | 31,734 | ||||||
Clean Harbors, Inc.* | 648 | 37,811 | ||||||
Copart, Inc.* | 1,146 | 32,993 | ||||||
Corrections Corp. of America | 955 | 32,136 | ||||||
Covanta Holding Corp. | 1,831 | 33,288 | ||||||
Iron Mountain, Inc. | 933 | 32,282 | ||||||
KAR Auction Services, Inc.* | 1,324 | 26,480 | ||||||
Pitney Bowes, Inc.a | 2,250 | 32,310 | ||||||
R.R. Donnelley & Sons Co.a | 2,863 | 28,687 | ||||||
Republic Services, Inc. | 1,133 | 32,121 | ||||||
Rollins, Inc. | 1,337 | 30,310 | ||||||
Stericycle, Inc.* | 344 | 32,597 | ||||||
Waste Connections, Inc. | 1,039 | 34,110 | ||||||
Waste Management, Inc. | 979 | 32,052 | ||||||
|
| |||||||
Total Commercial Services & Supplies |
| 493,597 | ||||||
|
| |||||||
Communications Equipment - 1.1% | ||||||||
Acme Packet, Inc.* | 2,110 | 34,899 | ||||||
Brocade Communications Systems, Inc.* | 6,145 | 32,569 | ||||||
Cisco Systems, Inc. | 1,983 | 33,989 | ||||||
| 68 | GUGGENHEIM ETFS ANNUAL REPORT | See Notes to Financial Statements. |
Table of Contents
| SCHEDULE OF INVESTMENTS (continued) | October 31, 2012 |
GUGGENHEIM RUSSELL 1000® EQUAL WEIGHT ETF
| SHARES | VALUE | |||||||
EchoStar Corp. — Class A* | 1,312 | $ | 41,669 | |||||
F5 Networks, Inc.* | 346 | 28,538 | ||||||
Harris Corp. | 725 | 33,191 | ||||||
JDS Uniphase Corp.* | 2,996 | 29,031 | ||||||
Juniper Networks, Inc.* | 2,071 | 34,316 | ||||||
Motorola Solutions, Inc. | 728 | 37,623 | ||||||
Palo Alto Networks, Inc.* | 577 | 31,723 | ||||||
Polycom, Inc.* | 3,634 | 36,413 | ||||||
QUALCOMM, Inc. | 591 | 34,618 | ||||||
Riverbed Technology, Inc.* | 1,620 | 29,921 | ||||||
|
| |||||||
Total Communications Equipment |
| 438,500 | ||||||
|
| |||||||
Computers & Peripherals - 0.9% | ||||||||
Apple, Inc. | 55 | 32,730 | ||||||
Dell, Inc. | 3,711 | 34,253 | ||||||
Diebold, Inc. | 1,110 | 33,022 | ||||||
EMC Corp.* | 1,361 | 33,236 | ||||||
Fusion-io, Inc.*,a | 1,256 | 29,642 | ||||||
Hewlett-Packard Co. | 2,213 | 30,650 | ||||||
Lexmark International, Inc. — Class Aa | 1,405 | 29,870 | ||||||
NCR Corp.* | 1,603 | 34,112 | ||||||
NetApp, Inc.* | 1,075 | 28,917 | ||||||
SanDisk Corp.* | 843 | 35,204 | ||||||
Western Digital Corp. | 933 | 31,937 | ||||||
|
| |||||||
Total Computers & Peripherals |
| 353,573 | ||||||
|
| |||||||
Construction & Engineering - 0.6% | ||||||||
Aecom Technology Corp.* | 1,503 | 32,270 | ||||||
Chicago Bridge & Iron Co. NV | 831 | 31,204 | ||||||
Fluor Corp. | 554 | 30,941 | ||||||
Jacobs Engineering Group, Inc.* | 765 | 29,521 | ||||||
KBR, Inc. | 1,069 | 29,782 | ||||||
Quanta Services, Inc.* | 1,270 | 32,931 | ||||||
Shaw Group, Inc.(The)* | 722 | 31,617 | ||||||
URS Corp. | 890 | 29,797 | ||||||
|
| |||||||
Total Construction & Engineering |
| 248,063 | ||||||
|
| |||||||
Construction Materials - 0.3% | ||||||||
Martin Marietta Materials, Inc. | 684 | 56,300 | ||||||
Vulcan Materials Co. | 1,262 | 58,014 | ||||||
|
| |||||||
Total Construction Materials |
| 114,314 | ||||||
|
| |||||||
Consumer Finance - 0.2% |
| |||||||
American Express Co. | 351 | 19,646 | ||||||
Capital One Financial Corp. | 359 | 21,601 | ||||||
Discover Financial Services | 532 | 21,812 | ||||||
SLM Corp. | 1,247 | 21,922 | ||||||
|
| |||||||
Total Consumer Finance |
| 84,981 | ||||||
|
| |||||||
Containers & Packaging - 1.7% | ||||||||
AptarGroup, Inc. | 1,120 | 57,433 | ||||||
Ball Corp. | 1,378 | 59,020 | ||||||
Bemis Co., Inc. | 1,841 | 60,845 | ||||||
Crown Holdings, Inc.* | 1,583 | 60,550 | ||||||
Greif, Inc. — Class A | 1,333 | 55,933 | ||||||
Owens-Illinois, Inc.* | 3,090 | 60,224 | ||||||
Packaging Corp. of America | 1,655 | 58,372 | ||||||
| SHARES | VALUE | |||||||
Rock-Tenn Co. — Class A | 804 | $ | 58,845 | |||||
Sealed Air Corp. | 3,715 | 60,257 | ||||||
Silgan Holdings, Inc. | 1,367 | 59,205 | ||||||
Sonoco Products Co. | 1,877 | 58,431 | ||||||
|
| |||||||
Total Containers & Packaging |
| 649,115 | ||||||
|
| |||||||
Distributors - 0.1% | ||||||||
Genuine Parts Co. | 428 | 26,784 | ||||||
LKQ Corp.* | 1,378 | 28,787 | ||||||
|
| |||||||
Total Distributors |
| 55,571 | ||||||
|
| |||||||
Diversified Consumer Services - 0.4% | ||||||||
Apollo Group, Inc. — Class A* | 941 | 18,895 | ||||||
DeVry, Inc. | 1,185 | 31,118 | ||||||
H&R Block, Inc. | 1,561 | 27,630 | ||||||
ITT Educational Services, Inc.* | 793 | 17,042 | ||||||
Service Corp. International | 1,983 | 27,841 | ||||||
Weight Watchers International, Inc. | 511 | 25,678 | ||||||
|
| |||||||
Total Diversified Consumer Services |
| 148,204 | ||||||
|
| |||||||
Diversified Financial Services - 0.6% | ||||||||
Bank of America Corp. | 2,245 | 20,923 | ||||||
CBOE Holdings, Inc. | 673 | 19,847 | ||||||
Citigroup, Inc. | 610 | 22,808 | ||||||
CME Group, Inc. | 350 | 19,575 | ||||||
Interactive Brokers Group, Inc. — Class A | 1,431 | 20,392 | ||||||
IntercontinentalExchange, Inc.* | 148 | 19,388 | ||||||
JPMorgan Chase & Co. | 495 | 20,632 | ||||||
Leucadia National Corp. | 869 | 19,726 | ||||||
Moody’s Corp. | 451 | 21,720 | ||||||
MSCI, Inc. — Class A* | 571 | 15,383 | ||||||
NASDAQ OMX Group, Inc.(The) | 864 | 20,572 | ||||||
NYSE Euronext | 805 | 19,932 | ||||||
|
| |||||||
Total Diversified Financial Services |
| 240,898 | ||||||
|
| |||||||
Diversified Telecommunication Services - 1.2% |
| |||||||
AT&T, Inc. | 1,881 | 65,064 | ||||||
CenturyLink, Inc. | 1,705 | 65,438 | ||||||
Frontier Communications Corp.a | 14,633 | 69,068 | ||||||
Level 3 Communications, Inc.* | 3,117 | 63,898 | ||||||
tw telecom, Inc.* | 2,741 | 69,813 | ||||||
Verizon Communications, Inc. | 1,568 | 69,995 | ||||||
Windstream Corp.a | 6,614 | 63,098 | ||||||
|
| |||||||
Total Diversified Telecommunication Services |
| 466,374 | ||||||
|
| |||||||
Electric Utilities - 3.6% | ||||||||
American Electric Power Co., Inc. | 1,613 | 71,682 | ||||||
Duke Energy Corp. | 1,112 | 73,047 | ||||||
Edison International | 1,562 | 73,320 | ||||||
Entergy Corp. | 1,035 | 75,120 | ||||||
Exelon Corp. | 2,009 | 71,882 | ||||||
FirstEnergy Corp. | 1,615 | 73,838 | ||||||
Great Plains Energy, Inc. | 3,190 | 71,584 | ||||||
Hawaiian Electric Industries, Inc. | 2,679 | 69,332 | ||||||
ITC Holdings Corp. | 956 | 76,117 | ||||||
NextEra Energy, Inc. | 1,028 | 72,022 | ||||||
| See Notes to Financial Statements. | GUGGENHEIM ETFS ANNUAL REPORT | 69 |
Table of Contents
| SCHEDULE OF INVESTMENTS (continued) | October 31, 2012 |
GUGGENHEIM RUSSELL 1000® EQUAL WEIGHT ETF
| SHARES | VALUE | |||||||
Northeast Utilities | 1,881 | $ | 73,923 | |||||
NV Energy, Inc. | 3,960 | 75,279 | ||||||
OGE Energy Corp. | 1,280 | 73,702 | ||||||
Pepco Holdings, Inc. | 3,779 | 75,089 | ||||||
Pinnacle West Capital Corp. | 1,346 | 71,298 | ||||||
PPL Corp. | 2,470 | 73,063 | ||||||
Southern Co.(The) | 1,564 | 73,258 | ||||||
Westar Energy, Inc. | 2,408 | 71,518 | ||||||
Xcel Energy, Inc. | 2,589 | 73,139 | ||||||
|
| |||||||
Total Electric Utilities |
| 1,388,213 | ||||||
|
| |||||||
Electrical Equipment - 1.0% | ||||||||
AMETEK, Inc. | 889 | 31,604 | ||||||
Babcock & Wilcox Co.(The)* | 1,223 | 31,517 | ||||||
Cooper Industries PLC | 423 | 31,700 | ||||||
Emerson Electric Co. | 650 | 31,479 | ||||||
General Cable Corp.* | 1,063 | 30,327 | ||||||
GrafTech International, Ltd.* | 3,451 | 36,270 | ||||||
Hubbell, Inc. — Class B | 391 | 32,735 | ||||||
Polypore International, Inc.*,a | 1,751 | 61,775 | ||||||
Regal-Beloit Corp. | 443 | 28,875 | ||||||
Rockwell Automation, Inc. | 450 | 31,977 | ||||||
Roper Industries, Inc. | 285 | 31,113 | ||||||
|
| |||||||
Total Electrical Equipment |
| 379,372 | ||||||
|
| |||||||
Electronic Equipment, Instruments & Components - 1.4% |
| |||||||
Amphenol Corp. — Class A | 615 | 36,980 | ||||||
Arrow Electronics, Inc.* | 1,123 | 39,563 | ||||||
Avnet, Inc.* | 1,279 | 36,643 | ||||||
AVX Corp. | 3,794 | 37,333 | ||||||
Corning, Inc. | 2,861 | 33,617 | ||||||
Dolby Laboratories, Inc. — Class A* | 1,082 | 34,180 | ||||||
FLIR Systems, Inc. | 1,541 | 29,942 | ||||||
Ingram Micro, Inc. — Class A* | 2,412 | 36,662 | ||||||
IPG Photonics Corp.* | 648 | 34,396 | ||||||
Itron, Inc.* | 725 | 29,769 | ||||||
Jabil Circuit, Inc. | 1,764 | 30,588 | ||||||
Molex, Inc. | 1,386 | 35,994 | ||||||
National Instruments Corp. | 1,220 | 28,743 | ||||||
Tech Data Corp.* | 803 | 35,581 | ||||||
Trimble Navigation, Ltd.* | 662 | 31,233 | ||||||
Vishay Intertechnology, Inc.* | 3,681 | 30,479 | ||||||
|
| |||||||
Total Electronic Equipment, Instruments & Components |
| 541,703 | ||||||
|
| |||||||
Energy Equipment & Services - 3.3% | ||||||||
Atwood Oceanics, Inc.* | 1,345 | 64,291 | ||||||
Baker Hughes, Inc. | 1,328 | 55,736 | ||||||
Cameron International Corp.* | 1,089 | 55,147 | ||||||
CARBO Ceramics, Inc.a | 960 | 70,992 | ||||||
Diamond Offshore Drilling, Inc. | 916 | 63,424 | ||||||
Dresser-Rand Group, Inc.* | 1,130 | 58,229 | ||||||
FMC Technologies, Inc.* | 1,276 | 52,188 | ||||||
Halliburton Co. | 1,768 | 57,089 | ||||||
Helmerich & Payne, Inc. | 1,317 | 62,953 | ||||||
McDermott International, Inc.* | 5,019 | 53,753 | ||||||
| SHARES | VALUE | |||||||
Nabors Industries Ltd.* | 4,312 | $ | 58,169 | |||||
National Oilwell Varco, Inc. | 766 | 56,454 | ||||||
Oceaneering International, Inc. | 1,105 | 57,825 | ||||||
Oil States International, Inc.* | 765 | 55,922 | ||||||
Patterson-UTI Energy, Inc. | 3,797 | 61,435 | ||||||
Rowan Cos., PLC — Class A* | 1,777 | 56,349 | ||||||
RPC, Inc.a | 5,044 | 57,804 | ||||||
Schlumberger Ltd. | 846 | 58,822 | ||||||
SEACOR Holdings, Inc.* | 732 | 64,204 | ||||||
Superior Energy Services, Inc.* | 2,861 | 58,164 | ||||||
Tidewater, Inc. | 640 | 30,406 | ||||||
Unit Corp.* | 1,468 | 59,234 | ||||||
|
| |||||||
Total Energy Equipment & Services |
| 1,268,590 | ||||||
|
| |||||||
Food & Staples Retailing - 1.7% | ||||||||
Costco Wholesale Corp. | 261 | 25,690 | ||||||
CVS Caremark Corp. | 1,870 | 86,768 | ||||||
Fresh Market, Inc.(The)* | 1,535 | 87,050 | ||||||
Kroger Co.(The) | 3,796 | 95,735 | ||||||
Safeway, Inc.a | 5,445 | 88,808 | ||||||
Sysco Corp. | 2,886 | 89,668 | ||||||
Wal-Mart Stores, Inc. | 357 | 26,782 | ||||||
Walgreen Co. | 2,470 | 87,018 | ||||||
Whole Foods Market, Inc. | 906 | 85,826 | ||||||
|
| |||||||
Total Food & Staples Retailing |
| 673,345 | ||||||
|
| |||||||
Food Products - 4.8% | ||||||||
Archer-Daniels-Midland Co. | 3,220 | 86,425 | ||||||
Bunge Ltd. | 1,349 | 95,819 | ||||||
Campbell Soup Co.a | 2,558 | 90,221 | ||||||
ConAgra Foods, Inc. | 3,253 | 90,563 | ||||||
Dean Foods Co.* | 5,789 | 97,487 | ||||||
Flowers Foods, Inc. | 4,373 | 86,104 | ||||||
General Mills, Inc. | 2,221 | 89,018 | ||||||
Green Mountain Coffee Roasters, Inc.*,a | 3,730 | 90,117 | ||||||
H.J. Heinz Co. | 1,595 | 91,728 | ||||||
Hershey Co.(The) | 1,256 | 86,476 | ||||||
Hillshire Brands Co. | 3,350 | 87,133 | ||||||
Hormel Foods Corp. | 3,069 | 90,628 | ||||||
Ingredion, Inc. | 1,628 | 100,057 | ||||||
J.M. Smucker Co.(The) | 1,035 | 88,637 | ||||||
Kellogg Co. | 1,718 | 89,886 | ||||||
Kraft Foods Group, Inc.* | 717 | 32,609 | ||||||
McCormick & Co., Inc. | 1,410 | 86,884 | ||||||
Mead Johnson Nutrition Co. | 1,210 | 74,609 | ||||||
Mondelez International, Inc. — Class A | 2,156 | 57,220 | ||||||
Ralcorp Holdings, Inc.* | 1,220 | 88,072 | ||||||
Smithfield Foods, Inc.* | 4,594 | 94,039 | ||||||
Tyson Foods, Inc. — Class A | 5,596 | 94,069 | ||||||
|
| |||||||
Total Food Products |
| 1,887,801 | ||||||
|
| |||||||
Gas Utilities - 1.1% | ||||||||
AGL Resources, Inc. | 1,731 | 70,677 | ||||||
Atmos Energy Corp. | 1,983 | 71,328 | ||||||
National Fuel Gas Co. | 1,335 | 70,354 | ||||||
Oneok, Inc. | 1,519 | 71,849 | ||||||
| 70 | GUGGENHEIM ETFS ANNUAL REPORT | See Notes to Financial Statements. |
Table of Contents
| SCHEDULE OF INVESTMENTS (continued) | October 31, 2012 |
GUGGENHEIM RUSSELL 1000® EQUAL WEIGHT ETF
| SHARES | VALUE | |||||||
Questar Corp. | 3,562 | $ | 72,095 | |||||
UGI Corp. | 2,278 | 73,557 | ||||||
|
| |||||||
Total Gas Utilities |
| 429,860 | ||||||
|
| |||||||
Health Care Equipment & Supplies - 2.7% |
| |||||||
Alere, Inc.* | 2,397 | 46,022 | ||||||
Baxter International, Inc. | 780 | 48,851 | ||||||
Becton, Dickinson and Co. | 601 | 45,484 | ||||||
Boston Scientific Corp.* | 8,427 | 43,315 | ||||||
C.R. Bard, Inc. | 453 | 43,574 | ||||||
CareFusion Corp.* | 1,691 | 44,913 | ||||||
Cooper Cos., Inc.(The) | 503 | 48,278 | ||||||
Covidien PLC | 797 | 43,795 | ||||||
DENTSPLY International, Inc. | 1,257 | 46,308 | ||||||
Edwards Lifesciences Corp.* | 455 | 39,508 | ||||||
Hill-Rom Holdings, Inc. | 1,635 | 45,927 | ||||||
Hologic, Inc.* | 2,306 | 47,550 | ||||||
IDEXX Laboratories, Inc.* | 475 | 45,695 | ||||||
Intuitive Surgical, Inc.* | 93 | 50,427 | ||||||
Medtronic, Inc. | 1,096 | 45,572 | ||||||
ResMed, Inc. | 1,186 | 47,369 | ||||||
Sirona Dental Systems, Inc.* | 840 | 48,098 | ||||||
St Jude Medical, Inc. | 1,124 | 43,004 | ||||||
Stryker Corp. | 847 | 44,552 | ||||||
Teleflex, Inc. | 685 | 46,546 | ||||||
Thoratec Corp.* | 1,363 | 48,659 | ||||||
Varian Medical Systems, Inc.* | 787 | 52,540 | ||||||
Zimmer Holdings, Inc. | 710 | 45,589 | ||||||
|
| |||||||
Total Health Care Equipment & Supplies |
| 1,061,576 | ||||||
|
| |||||||
Health Care Providers & Services - 3.4% | ||||||||
Aetna, Inc. | 1,190 | 52,003 | ||||||
AMERIGROUP Corp.* | 521 | 47,588 | ||||||
AmerisourceBergen Corp. | 1,222 | 48,196 | ||||||
Brookdale Senior Living, Inc.* | 2,081 | 48,820 | ||||||
Cardinal Health, Inc. | 1,215 | 49,973 | ||||||
Catamaran Corp.* | 961 | 45,321 | ||||||
CIGNA Corp. | 1,013 | 51,663 | ||||||
Community Health Systems, Inc.* | 1,668 | 45,737 | ||||||
Coventry Health Care, Inc. | 1,135 | 49,531 | ||||||
DaVita, Inc.* | 474 | 53,334 | ||||||
Express Scripts Holding Co.* | 755 | 46,463 | ||||||
HCA Holdings, Inc. | 1,490 | 42,331 | ||||||
Health Management Associates, Inc. —Class A* | 5,780 | 42,194 | ||||||
Health Net, Inc.* | 2,176 | 46,828 | ||||||
Henry Schein, Inc.* | 592 | 43,678 | ||||||
Humana, Inc. | 670 | 49,761 | ||||||
Laboratory Corp. of America Holdings* | 521 | 44,144 | ||||||
LifePoint Hospitals, Inc.* | 1,111 | 39,263 | ||||||
McKesson Corp. | 542 | 50,574 | ||||||
Mednax, Inc.* | 637 | 43,940 | ||||||
Omnicare, Inc. | 1,429 | 49,343 | ||||||
Patterson Cos., Inc. | 1,360 | 45,424 | ||||||
Quest Diagnostics, Inc. | 752 | 43,405 | ||||||
| SHARES | VALUE | |||||||
Tenet Healthcare Corp.* | 1,945 | $ | 45,902 | |||||
UnitedHealth Group, Inc. | 844 | 47,264 | ||||||
Universal Health Services, Inc. — Class B | 1,057 | 43,749 | ||||||
VCA Antech, Inc.* | 2,441 | 47,795 | ||||||
WellPoint, Inc. | 811 | 49,698 | ||||||
|
| |||||||
Total Health Care Providers & Services |
| 1,313,922 | ||||||
|
| |||||||
Health Care Technology - 0.3% | ||||||||
Allscripts Healthcare Solutions, Inc.* | 4,406 | 56,925 | ||||||
Cerner Corp.* | 635 | 48,381 | ||||||
|
| |||||||
Total Health Care Technology |
| 105,306 | ||||||
|
| |||||||
Hotels, Restaurants & Leisure - 1.5% | ||||||||
Bally Technologies, Inc.* | 566 | 28,255 | ||||||
Brinker International, Inc. | 765 | 23,562 | ||||||
Carnival Corp. | 713 | 27,008 | ||||||
Chipotle Mexican Grill, Inc.* | 82 | 20,871 | ||||||
Choice Hotels International, Inc. | 830 | 25,971 | ||||||
Darden Restaurants, Inc. | 474 | 24,942 | ||||||
Dunkin’ Brands Group, Inc. | 898 | 27,838 | ||||||
Hyatt Hotels Corp. — Class A* | 665 | 24,272 | ||||||
International Game Technology | 2,073 | 26,617 | ||||||
Las Vegas Sands Corp. | 581 | 26,982 | ||||||
Marriott International, Inc. — Class A | 675 | 24,624 | ||||||
McDonald’s Corp. | 285 | 24,738 | ||||||
MGM Resorts International* | 2,529 | 26,074 | ||||||
Panera Bread Co. — Class A* | 155 | 26,139 | ||||||
Penn National Gaming, Inc.* | 629 | 25,430 | ||||||
Royal Caribbean Cruises Ltd. | 865 | 29,124 | ||||||
Starbucks Corp. | 524 | 24,052 | ||||||
Starwood Hotels & Resorts Worldwide, Inc. | 462 | 23,955 | ||||||
Wendy’s Co.(The) | 5,751 | 24,557 | ||||||
Wyndham Worldwide Corp. | 504 | 25,402 | ||||||
Wynn Resorts Ltd. | 232 | 28,086 | ||||||
Yum! Brands, Inc. | 397 | 27,834 | ||||||
|
| |||||||
Total Hotels, Restaurants & Leisure |
| 566,333 | ||||||
|
| |||||||
Household Durables - 1.0% | ||||||||
DR Horton, Inc. | 1,217 | 25,508 | ||||||
Garmin Ltd. | 644 | 24,466 | ||||||
Harman International Industries, Inc. | 565 | 23,691 | ||||||
Jarden Corp. | 505 | 25,149 | ||||||
Leggett & Platt, Inc. | 1,066 | 28,281 | ||||||
Lennar Corp. — Class A | 730 | 27,353 | ||||||
Mohawk Industries, Inc.* | 329 | 27,462 | ||||||
Newell Rubbermaid, Inc. | 1,386 | 28,607 | ||||||
NVR, Inc.* | 30 | 27,112 | ||||||
PulteGroup, Inc.* | 1,647 | 28,559 | ||||||
Tempur-Pedic International, Inc.* | 960 | 25,382 | ||||||
Toll Brothers, Inc.* | 745 | 24,593 | ||||||
Tupperware Brands Corp. | 483 | 28,545 | ||||||
Whirlpool Corp. | 318 | 31,062 | ||||||
|
| |||||||
Total Household Durables |
| 375,770 | ||||||
|
| |||||||
| See Notes to Financial Statements. | GUGGENHEIM ETFS ANNUAL REPORT | 71 |
Table of Contents
| SCHEDULE OF INVESTMENTS (continued) | October 31, 2012 |
GUGGENHEIM RUSSELL 1000® EQUAL WEIGHT ETF
| SHARES | VALUE | |||||||
Household Products - 1.3% | ||||||||
Church & Dwight Co., Inc. | 1,649 | $ | 83,703 | |||||
Clorox Co.(The) | 1,248 | 90,230 | ||||||
Colgate-Palmolive Co. | 835 | 87,642 | ||||||
Energizer Holdings, Inc. | 1,181 | 86,178 | ||||||
Kimberly-Clark Corp. | 1,042 | 86,955 | ||||||
Procter & Gamble Co.(The) | 1,281 | 88,696 | ||||||
|
| |||||||
Total Household Products |
| 523,404 | ||||||
|
| |||||||
Independent Power Producers & Energy Traders - 0.5% |
| |||||||
AES Corp.(The) | 6,476 | 67,674 | ||||||
Calpine Corp.* | 4,195 | 73,832 | ||||||
NRG Energy, Inc. | 3,294 | 71,019 | ||||||
|
| |||||||
Total Independent Power Producers & Energy Traders |
| 212,525 | ||||||
|
| |||||||
Industrial Conglomerates - 0.4% | ||||||||
3M Co. | 339 | 29,696 | ||||||
Carlisle Cos., Inc. | 597 | 33,163 | ||||||
Danaher Corp. | 576 | 29,796 | ||||||
General Electric Co. | 1,407 | 29,632 | ||||||
Tyco International Ltd. | 573 | 15,397 | ||||||
|
| |||||||
Total Industrial Conglomerates |
| 137,684 | ||||||
|
| |||||||
Insurance - 2.8% | ||||||||
ACE Ltd. | 266 | 20,921 | ||||||
AFLAC, Inc. | 421 | 20,957 | ||||||
Alleghany Corp.* | 57 | 19,813 | ||||||
Allied World Assurance Co. | 261 | 20,958 | ||||||
Allstate Corp.(The) | 502 | 20,070 | ||||||
American Financial Group, Inc. | 533 | 20,680 | ||||||
American International Group, Inc.* | 605 | 21,133 | ||||||
American National Insurance Co. | 281 | 20,530 | ||||||
Aon PLC | 386 | 20,825 | ||||||
Arch Capital Group Ltd.* | 486 | 21,457 | ||||||
Arthur J. Gallagher & Co. | 547 | 19,386 | ||||||
Aspen Insurance Holdings Ltd. | 658 | 21,286 | ||||||
Assurant, Inc. | 539 | 20,380 | ||||||
Assured Guaranty Ltd. | 1,470 | 20,418 | ||||||
Axis Capital Holdings Ltd. | 575 | 20,827 | ||||||
Berkshire Hathaway, Inc. — Class B* | 228 | 19,688 | ||||||
Brown & Brown, Inc. | 766 | 19,571 | ||||||
Chubb Corp.(The) | 263 | 20,246 | ||||||
Cincinnati Financial Corp. | 523 | 20,836 | ||||||
CNA Financial Corp. | 748 | 21,976 | ||||||
Endurance Specialty Holdings Ltd. | 519 | 21,046 | ||||||
Erie Indemnity Co. — Class A | 311 | 19,350 | ||||||
Everest Re Group Ltd. | 186 | 20,655 | ||||||
Fidelity National Financial, Inc. — Class A | 946 | 20,254 | ||||||
Genworth Financial, Inc. — Class A* | 3,874 | 23,089 | ||||||
Hanover Insurance Group, Inc.(The) | 543 | 19,608 | ||||||
Hartford Financial Services Group, Inc. | 1,065 | 23,121 | ||||||
HCC Insurance Holdings, Inc. | 592 | 21,099 | ||||||
Kemper Corp. | 647 | 20,057 | ||||||
| SHARES | VALUE | |||||||
Lincoln National Corp. | 825 | $ | 20,452 | |||||
Loews Corp. | 486 | 20,548 | ||||||
Markel Corp.* | 44 | 20,765 | ||||||
Marsh & McLennan Cos., Inc. | 591 | 20,112 | ||||||
MBIA, Inc.* | 1,942 | 19,226 | ||||||
Mercury General Corp. | 515 | 20,873 | ||||||
MetLife, Inc. | 577 | 20,478 | ||||||
Old Republic International Corp. | 2,141 | 21,153 | ||||||
PartnerRe Ltd. | 269 | 21,789 | ||||||
Principal Financial Group, Inc. | 748 | 20,600 | ||||||
ProAssurance Corp. | 227 | 20,294 | ||||||
Progressive Corp.(The) | 961 | 21,430 | ||||||
Protective Life Corp. | 767 | 20,939 | ||||||
Prudential Financial, Inc. | 361 | 20,595 | ||||||
Reinsurance Group of America, Inc. | 347 | 18,363 | ||||||
RenaissanceRe Holdings Ltd. | 262 | 21,316 | ||||||
StanCorp Financial Group, Inc. | 639 | 21,950 | ||||||
Torchmark Corp. | 391 | 19,781 | ||||||
Travelers Cos., Inc.(The) | 293 | 20,785 | ||||||
Unum Group | 1,037 | 21,030 | ||||||
Validus Holdings Ltd. | 595 | 21,301 | ||||||
W.R. Berkley Corp. | 541 | 21,040 | ||||||
White Mountains Insurance Group Ltd. | 39 | 19,995 | ||||||
XL Group PLC | 836 | 20,683 | ||||||
|
| |||||||
Total Insurance |
| 1,095,735 | ||||||
|
| |||||||
Internet & Catalog Retail - 0.7% | ||||||||
Amazon.com, Inc.* | 105 | 24,446 | ||||||
Expedia, Inc. | 456 | 26,973 | ||||||
Groupon, Inc.*,a | 7,658 | 31,551 | ||||||
HomeAway, Inc.*,a | 1,103 | 28,358 | ||||||
Liberty Interactive Corp. — Series A* | 1,457 | 29,140 | ||||||
Liberty Ventures* | 543 | 30,902 | ||||||
Netflix, Inc.* | 492 | 38,912 | ||||||
priceline.com, Inc.* | 42 | 24,098 | ||||||
TripAdvisor, Inc.* | 784 | 23,748 | ||||||
|
| |||||||
Total Internet & Catalog Retail |
| 258,128 | ||||||
|
| |||||||
Internet Software & Services - 1.0% | ||||||||
Akamai Technologies, Inc.* | 962 | 36,546 | ||||||
AOL, Inc.* | 1,099 | 37,729 | ||||||
eBay, Inc.* | 551 | 26,608 | ||||||
Equinix, Inc.* | 187 | 33,737 | ||||||
Facebook, Inc. — Class A* | 1,822 | 38,471 | ||||||
Google, Inc. — Class A* | 49 | 33,309 | ||||||
IAC/InterActiveCorp | 702 | 33,942 | ||||||
LinkedIn Corp. — Class A* | 308 | 32,934 | ||||||
Rackspace Hosting, Inc.* | 566 | 36,049 | ||||||
VeriSign, Inc.* | 774 | 28,692 | ||||||
Yahoo!, Inc.* | 2,361 | 39,688 | ||||||
|
| |||||||
Total Internet Software & Services |
| 377,705 | ||||||
|
| |||||||
IT Services - 2.0% | ||||||||
Accenture PLC — Class A | 484 | 32,626 | ||||||
Alliance Data Systems Corp.* | 141 | 20,170 | ||||||
Amdocs Ltd. | 1,126 | 37,237 | ||||||
| 72 | GUGGENHEIM ETFS ANNUAL REPORT | See Notes to Financial Statements. |
Table of Contents
| SCHEDULE OF INVESTMENTS (continued) | October 31, 2012 |
GUGGENHEIM RUSSELL 1000® EQUAL WEIGHT ETF
| SHARES | VALUE | |||||||
Automatic Data Processing, Inc. | 538 | $ | 31,091 | |||||
Booz Allen Hamilton Holding Corp. | 2,284 | 30,560 | ||||||
Broadridge Financial Solutions, Inc. | 864 | 19,829 | ||||||
Cognizant Technology Solutions | 545 | 36,324 | ||||||
Computer Sciences Corp. | 1,156 | 35,200 | ||||||
CoreLogic, Inc.* | 754 | 17,945 | ||||||
DST Systems, Inc. | 660 | 37,646 | ||||||
Fidelity National Information Services, Inc. | 621 | 20,412 | ||||||
Fiserv, Inc.* | 275 | 20,609 | ||||||
FleetCor Technologies, Inc.* | 456 | 21,619 | ||||||
Gartner, Inc.* | 799 | 37,082 | ||||||
Genpact Ltd. | 1,864 | 32,825 | ||||||
Global Payments, Inc. | 460 | 19,665 | ||||||
International Business Machines Corp. | 181 | 35,210 | ||||||
Jack Henry & Associates, Inc. | 533 | 20,254 | ||||||
Lender Processing Services, Inc. | 710 | 17,118 | ||||||
Mastercard, Inc. — Class A | 44 | 20,281 | ||||||
NeuStar, Inc. — Class A* | 927 | 33,919 | ||||||
Paychex, Inc. | 940 | 30,484 | ||||||
SAIC, Inc. | 3,032 | 33,322 | ||||||
Teradata Corp.* | 496 | 33,882 | ||||||
Total System Services, Inc. | 843 | 18,959 | ||||||
Vantiv, Inc. — Class A* | 889 | 17,940 | ||||||
VeriFone Systems, Inc.* | 1,233 | 36,546 | ||||||
Visa, Inc. — Class A | 148 | 20,537 | ||||||
Western Union Co.(The) | 1,092 | 13,868 | ||||||
|
| |||||||
Total IT Services |
| 783,160 | ||||||
|
| |||||||
Leisure Equipment & Products - 0.2% | ||||||||
Hasbro, Inc. | 705 | 25,373 | ||||||
Mattel, Inc. | 744 | 27,364 | ||||||
Polaris Industries, Inc. | 330 | 27,885 | ||||||
|
| |||||||
Total Leisure Equipment & Products |
| 80,622 | ||||||
|
| |||||||
Life Sciences Tools & Services - 1.4% | ||||||||
Agilent Technologies, Inc. | 820 | 29,512 | ||||||
Bio-Rad Laboratories, Inc. — Class A* | 440 | 44,594 | ||||||
Bruker Corp.* | 3,665 | 44,310 | ||||||
Charles River Laboratories International, Inc.* | 1,244 | 46,426 | ||||||
Covance, Inc.* | 1,007 | 49,051 | ||||||
Illumina, Inc.*,a | 1,000 | 47,510 | ||||||
Life Technologies Corp.* | 970 | 47,443 | ||||||
Mettler-Toledo International, Inc.* | 184 | 31,164 | ||||||
PerkinElmer, Inc. | 1,602 | 49,550 | ||||||
QIAGEN NV*,a | 2,547 | 44,445 | ||||||
Techne Corp. | 653 | 43,986 | ||||||
Thermo Fisher Scientific, Inc. | 804 | 49,092 | ||||||
Waters Corp.* | 373 | 30,515 | ||||||
|
| |||||||
Total Life Sciences Tools & Services |
| 557,598 | ||||||
|
| |||||||
Machinery - 3.4% | ||||||||
AGCO Corp.* | 678 | 30,856 | ||||||
Caterpillar, Inc. | 362 | 30,701 | ||||||
| SHARES | VALUE | |||||||
CNH Global NV* | 790 | $ | 35,392 | |||||
Colfax Corp.* | 891 | 30,642 | ||||||
Crane Co. | 777 | 32,618 | ||||||
Cummins, Inc. | 340 | 31,817 | ||||||
Deere & Co. | 385 | 32,894 | ||||||
Donaldson Co., Inc. | 892 | 28,785 | ||||||
Dover Corp. | 531 | 30,915 | ||||||
Eaton Corp. | 680 | 32,110 | ||||||
Flowserve Corp. | 245 | 33,195 | ||||||
Gardner Denver, Inc. | 529 | 36,676 | ||||||
Graco, Inc. | 625 | 30,038 | ||||||
Harsco Corp. | 1,516 | 30,305 | ||||||
IDEX Corp. | 756 | 32,153 | ||||||
Illinois Tool Works, Inc. | 526 | 32,260 | ||||||
Ingersoll-Rand PLC | 696 | 32,733 | ||||||
ITT Corp. | 1,513 | 31,470 | ||||||
Joy Global, Inc. | 552 | 34,472 | ||||||
Kennametal, Inc. | 854 | 30,249 | ||||||
Lincoln Electric Holdings, Inc. | 805 | 34,913 | ||||||
Manitowoc Co., Inc.(The) | 2,399 | 34,186 | ||||||
Navistar International Corp.* | 1,459 | 27,356 | ||||||
Nordson Corp. | 530 | 31,286 | ||||||
Oshkosh Corp.* | 1,140 | 34,177 | ||||||
PACCAR, Inc. | 775 | 33,589 | ||||||
Pall Corp. | 492 | 30,976 | ||||||
Parker Hannifin Corp. | 377 | 29,655 | ||||||
Pentair Ltd. | 1,002 | 42,324 | ||||||
Snap-on, Inc. | 372 | 28,767 | ||||||
SPX Corp. | 487 | 33,403 | ||||||
Stanley Black & Decker, Inc. | 414 | 28,690 | ||||||
Terex Corp.* | 1,418 | 31,976 | ||||||
Timken Co. | 1,558 | 61,525 | ||||||
Toro Co.(The) | 812 | 34,283 | ||||||
Trinity Industries, Inc. | 1,015 | 31,749 | ||||||
Valmont Industries, Inc. | 448 | 60,525 | ||||||
WABCO Holdings, Inc.* | 469 | 27,469 | ||||||
Wabtec Corp. | 398 | 32,596 | ||||||
Xylem, Inc. | 1,236 | 29,985 | ||||||
|
| |||||||
Total Machinery |
| 1,339,711 | ||||||
|
| |||||||
Marine - 0.2% | ||||||||
Kirby Corp.* | 569 | 32,706 | ||||||
Matson, Inc. | 1,515 | 32,194 | ||||||
|
| |||||||
Total Marine |
| 64,900 | ||||||
|
| |||||||
Media - 2.2% | ||||||||
AMC Networks, Inc. — Class A* | 629 | 29,387 | ||||||
Cablevision Systems Corp. — Class A | 1,663 | 28,969 | ||||||
CBS Corp. — Class B | 728 | 23,587 | ||||||
Charter Communications, Inc. — Class A* | 351 | 27,171 | ||||||
Cinemark Holdings, Inc. | 1,160 | 28,640 | ||||||
Clear Channel Outdoor Holdings, | 4,522 | 30,117 | ||||||
Comcast Corp. — Class A | 738 | 27,682 | ||||||
| See Notes to Financial Statements. | GUGGENHEIM ETFS ANNUAL REPORT | 73 |
Table of Contents
| SCHEDULE OF INVESTMENTS (continued) | October 31, 2012 |
GUGGENHEIM RUSSELL 1000® EQUAL WEIGHT ETF
| SHARES | VALUE | |||||||
DIRECTV* | 500 | $ | 25,555 | |||||
Discovery Communications, Inc. — | 453 | 26,736 | ||||||
DISH Network Corp. — Class A | 849 | 30,250 | ||||||
DreamWorks Animation SKG, Inc. — Class A*,a | 1,539 | 31,349 | ||||||
Gannett Co., Inc. | 1,457 | 24,623 | ||||||
Interpublic Group of Cos., Inc.(The) | 2,351 | 23,745 | ||||||
John Wiley & Sons, Inc. — Class A | 562 | 24,380 | ||||||
Lamar Advertising Co. — Class A* | 715 | 28,064 | ||||||
Liberty Global, Inc. — Class A* | 439 | 26,353 | ||||||
Liberty Media Corp. — Liberty | 258 | 28,811 | ||||||
Madison Square Garden Co.(The) — Class A* | 665 | 27,371 | ||||||
McGraw-Hill Cos., Inc.(The) | 489 | 27,032 | ||||||
Morningstar, Inc. | 322 | 20,280 | ||||||
News Corp. — Class A | 1,083 | 25,905 | ||||||
Omnicom Group, Inc. | 502 | 24,051 | ||||||
Pandora Media, Inc.*,a | 2,549 | 21,386 | ||||||
Regal Entertainment Group — Class Aa | 1,915 | 29,414 | ||||||
Scripps Networks Interactive, Inc. —Class A | 433 | 26,292 | ||||||
Sirius XM Radio, Inc.* | 10,710 | 29,988 | ||||||
Thomson Reuters Corp. | 687 | 19,415 | ||||||
Time Warner Cable, Inc. | 279 | 27,652 | ||||||
Time Warner, Inc. | 588 | 25,549 | ||||||
Viacom, Inc. — Class B | 486 | 24,917 | ||||||
Virgin Media, Inc. | 898 | 29,401 | ||||||
Walt Disney Co.(The) | 504 | 24,731 | ||||||
Washington Post Co.(The) — Class B | 73 | 24,346 | ||||||
|
| |||||||
Total Media |
| 873,149 | ||||||
|
| |||||||
Metals & Mining - 2.8% | ||||||||
Alcoa, Inc. | 6,584 | 56,425 | ||||||
Allegheny Technologies, Inc. | 1,839 | 48,458 | ||||||
Allied Nevada Gold Corp.* | 1,534 | 56,635 | ||||||
Carpenter Technology Corp. | 1,126 | 54,735 | ||||||
Cliffs Natural Resources, Inc. | 1,494 | 54,187 | ||||||
Commercial Metals Co. | 4,426 | 60,902 | ||||||
Compass Minerals International, Inc. | 766 | 60,399 | ||||||
Freeport-McMoRan Copper & Gold, Inc. | 1,480 | 57,542 | ||||||
Molycorp, Inc.*,a | 5,267 | 54,777 | ||||||
Newmont Mining Corp. | 1,057 | 57,659 | ||||||
Nucor Corp. | 1,515 | 60,797 | ||||||
Reliance Steel & Aluminum Co. | 1,129 | 61,350 | ||||||
Royal Gold, Inc. | 621 | 54,698 | ||||||
Southern Copper Corp. | 1,709 | 65,113 | ||||||
Steel Dynamics, Inc. | 5,150 | 65,148 | ||||||
Tahoe Resources, Inc.* | 2,942 | 60,134 | ||||||
Titanium Metals Corp. | 4,508 | 52,789 | ||||||
United States Steel Corp.a | 3,049 | 62,169 | ||||||
Walter Energy, Inc. | 1,899 | 66,389 | ||||||
|
| |||||||
Total Metals & Mining |
| 1,110,306 | ||||||
|
| |||||||
| SHARES | VALUE | |||||||
Multi-Utilities - 3.2% | ||||||||
Alliant Energy Corp. | 1,638 | $ | 73,219 | |||||
Ameren Corp. | 2,184 | 71,810 | ||||||
CenterPoint Energy, Inc. | 3,340 | 72,378 | ||||||
CMS Energy Corp. | 3,063 | 74,492 | ||||||
Consolidated Edison, Inc. | 1,203 | 72,637 | ||||||
Dominion Resources, Inc. | 1,359 | 71,728 | ||||||
DTE Energy Co. | 1,198 | 74,396 | ||||||
Integrys Energy Group, Inc. | 1,359 | 73,440 | ||||||
MDU Resources Group, Inc. | 3,203 | 69,601 | ||||||
NiSource, Inc. | 2,805 | 71,443 | ||||||
PG&E Corp. | 1,677 | 71,306 | ||||||
Public Service Enterprise Group, Inc. | 2,249 | 72,058 | ||||||
SCANA Corp. | 1,472 | 72,246 | ||||||
Sempra Energy | 1,101 | 76,795 | ||||||
TECO Energy, Inc. | 4,055 | 72,463 | ||||||
Vectren Corp. | 2,502 | 73,984 | ||||||
Wisconsin Energy Corp. | 1,913 | 73,593 | ||||||
|
| |||||||
Total Multi-Utilities |
| 1,237,589 | ||||||
|
| |||||||
Multiline Retail - 0.8% | ||||||||
Big Lots, Inc.* | 894 | 26,042 | ||||||
Dillard’s, Inc. — Class A | 357 | 27,489 | ||||||
Dollar General Corp.* | 502 | 24,407 | ||||||
Dollar Tree, Inc.* | 544 | 21,690 | ||||||
Family Dollar Stores, Inc. | 419 | 27,637 | ||||||
J.C. Penney Co., Inc. | 1,073 | 25,763 | ||||||
Kohl’s Corp. | 518 | 27,599 | ||||||
Macy’s, Inc. | 701 | 26,687 | ||||||
Nordstrom, Inc. | 482 | 27,363 | ||||||
Sears Canada, Inc.* | 205 | 2,228 | ||||||
Sears Holdings Corp.* | 479 | 30,019 | ||||||
Target Corp. | 412 | 26,265 | ||||||
|
| |||||||
Total Multiline Retail |
| 293,189 | ||||||
|
| |||||||
Office Electronics - 0.1% | ||||||||
Xerox Corp. | 4,290 | 27,628 | ||||||
Zebra Technologies Corp. — Class A* | 830 | 29,822 | ||||||
|
| |||||||
Total Office Electronics |
| 57,450 | ||||||
|
| |||||||
Oil, Gas & Consumable Fuels - 7.8% | ||||||||
Alpha Natural Resources, Inc.* | 9,400 | 80,558 | ||||||
Anadarko Petroleum Corp. | 889 | 61,172 | ||||||
Apache Corp. | 720 | 59,580 | ||||||
Cabot Oil & Gas Corp. | 1,408 | 66,148 | ||||||
Cheniere Energy, Inc.* | 3,901 | 62,767 | ||||||
Chesapeake Energy Corp. | 3,220 | 65,237 | ||||||
Chevron Corp. | 526 | 57,971 | ||||||
Cimarex Energy Co. | 1,051 | 60,096 | ||||||
Cobalt International Energy, Inc.* | 2,782 | 57,894 | ||||||
Concho Resources, Inc.* | 640 | 55,117 | ||||||
ConocoPhillips | 1,071 | 61,957 | ||||||
CONSOL Energy, Inc. | 2,104 | 73,977 | ||||||
Continental Resources, Inc.* | 811 | 58,279 | ||||||
Denbury Resources, Inc.* | 3,724 | 57,089 | ||||||
Devon Energy Corp. | 1,034 | 60,189 | ||||||
| 74 | GUGGENHEIM ETFS ANNUAL REPORT | See Notes to Financial Statements. |
Table of Contents
| SCHEDULE OF INVESTMENTS (continued) | October 31, 2012 |
GUGGENHEIM RUSSELL 1000® EQUAL WEIGHT ETF
| SHARES | VALUE | |||||||
Energen Corp. | 1,376 | $ | 64,190 | |||||
EOG Resources, Inc. | 547 | 63,720 | ||||||
EQT Corp. | 1,077 | 65,299 | ||||||
EXCO Resources, Inc. | 7,913 | 64,095 | ||||||
Exxon Mobil Corp. | 670 | 61,084 | ||||||
Golar LNG Ltd. | 1,601 | 62,487 | ||||||
Hess Corp. | 1,147 | 59,942 | ||||||
HollyFrontier Corp. | 1,524 | 58,872 | ||||||
Kinder Morgan, Inc. | 1,730 | 60,048 | ||||||
Kosmos Energy Ltd.* | 5,402 | 61,475 | ||||||
Laredo Petroleum Holdings, Inc.* | 2,829 | 57,400 | ||||||
Marathon Oil Corp. | 2,047 | 61,533 | ||||||
Marathon Petroleum Corp. | 1,146 | 62,950 | ||||||
Murphy Oil Corp. | 1,131 | 67,860 | ||||||
Newfield Exploration Co.* | 1,924 | 52,179 | ||||||
Noble Energy, Inc. | 669 | 63,562 | ||||||
Occidental Petroleum Corp. | 720 | 56,851 | ||||||
Peabody Energy Corp. | 2,797 | 78,036 | ||||||
Phillips 66 | 1,337 | 63,053 | ||||||
Pioneer Natural Resources Co. | 597 | 63,073 | ||||||
Plains Exploration & Production Co.* | 1,591 | 56,735 | ||||||
QEP Resources, Inc. | 1,981 | 57,449 | ||||||
Range Resources Corp. | 916 | 59,870 | ||||||
SandRidge Energy, Inc.* | 8,758 | 54,475 | ||||||
SM Energy Co. | 1,212 | 65,351 | ||||||
Southwestern Energy Co.* | 1,847 | 64,091 | ||||||
Spectra Energy Corp. | 2,101 | 60,656 | ||||||
Teekay Corp. | 1,012 | 30,977 | ||||||
Tesoro Corp. | 1,497 | 56,452 | ||||||
Ultra Petroleum Corp.*,a | 2,841 | 64,803 | ||||||
Valero Energy Corp. | 1,953 | 56,832 | ||||||
Whiting Petroleum Corp.* | 1,301 | 54,668 | ||||||
Williams Cos., Inc.(The) | 1,769 | 61,897 | ||||||
World Fuel Services Corp. | 1,727 | 59,927 | ||||||
WPX Energy, Inc.* | 3,745 | 63,440 | ||||||
|
| |||||||
Total Oil, Gas & Consumable Fuels |
| 3,053,363 | ||||||
|
| |||||||
Paper & Forest Products - 0.4% | ||||||||
Domtar Corp. | 758 | 60,451 | ||||||
International Paper Co. | 1,617 | 57,937 | ||||||
MeadWestvaco Corp. | 1,905 | 56,559 | ||||||
|
| |||||||
Total Paper & Forest Products |
| 174,947 | ||||||
|
| |||||||
Personal Products - 0.5% | ||||||||
Avon Products, Inc. | 1,677 | 25,977 | ||||||
Estee Lauder Cos., Inc.(The) — Class A | 431 | 26,558 | ||||||
Herbalife Ltd. | 1,952 | 100,235 | ||||||
Nu Skin Enterprises, Inc. — Class Aa | 720 | 34,078 | ||||||
|
| |||||||
Total Personal Products |
| 186,848 | ||||||
|
| |||||||
Pharmaceuticals - 1.8% | ||||||||
Abbott Laboratories | 682 | 44,685 | ||||||
Allergan, Inc. | 521 | 46,848 | ||||||
Bristol-Myers Squibb Co. | 1,397 | 46,450 | ||||||
Eli Lilly & Co. | 1,000 | 48,630 | ||||||
Endo Health Solutions, Inc.* | 1,484 | 42,531 | ||||||
| SHARES | VALUE | |||||||
Forest Laboratories, Inc.* | 1,314 | $ | 44,295 | |||||
Hospira, Inc.* | 1,389 | 42,628 | ||||||
Johnson & Johnson | 685 | 48,512 | ||||||
Merck & Co., Inc. | 1,052 | 48,003 | ||||||
Mylan, Inc.* | 1,960 | 49,666 | ||||||
Perrigo Co. | 407 | 46,809 | ||||||
Pfizer, Inc. | 1,909 | 47,477 | ||||||
Salix Pharmaceuticals Ltd.* | 1,101 | 42,983 | ||||||
Warner Chilcott PLC — Class A | 3,579 | 41,445 | ||||||
Watson Pharmaceuticals, Inc.* | 571 | 49,078 | ||||||
|
| |||||||
Total Pharmaceuticals |
| 690,040 | ||||||
|
| |||||||
Professional Services - 0.6% | ||||||||
Dun & Bradstreet Corp.(The) | 250 | 20,260 | ||||||
Equifax, Inc. | 436 | 21,817 | ||||||
IHS, Inc. — Class A* | 335 | 28,271 | ||||||
Manpower, Inc. | 830 | 31,490 | ||||||
Nielsen Holdings NV* | 896 | 25,912 | ||||||
Robert Half International, Inc. | 1,190 | 31,999 | ||||||
Towers Watson & Co. — Class A | 587 | 31,528 | ||||||
Verisk Analytics, Inc. — Class A* | 671 | 34,221 | ||||||
|
| |||||||
Total Professional Services |
| 225,498 | ||||||
|
| |||||||
Real Estate Investment Trusts (REITs) - 3.0% |
| |||||||
Alexandria Real Estate Equities, Inc. | 272 | 19,157 | ||||||
American Campus Communities, Inc. | 462 | 20,933 | ||||||
American Capital Agency Corp. | 578 | 19,086 | ||||||
American Tower Corp. | 286 | 21,533 | ||||||
Annaly Capital Management, Inc. | 1,144 | 18,464 | ||||||
Apartment Investment & Management Co. — Class A | 773 | 20,631 | ||||||
AvalonBay Communities, Inc. | 148 | 20,063 | ||||||
BioMed Realty Trust, Inc. | 1,061 | 20,286 | ||||||
Boston Properties, Inc. | 181 | 19,240 | ||||||
Brandywine Realty Trust | 1,637 | 18,989 | ||||||
BRE Properties, Inc. | 431 | 20,839 | ||||||
Camden Property Trust | 309 | 20,280 | ||||||
CBL & Associates Properties, Inc. | 918 | 20,536 | ||||||
Chimera Investment Corp. | 7,125 | 19,024 | ||||||
CommonWealth REIT | 1,372 | 18,810 | ||||||
Corporate Office Properties Trust | 830 | 20,709 | ||||||
DDR Corp. | 1,305 | 20,045 | ||||||
Digital Realty Trust, Inc. | 298 | 18,306 | ||||||
Douglas Emmett, Inc. | 871 | 20,425 | ||||||
Duke Realty Corp. | 1,357 | 19,649 | ||||||
Equity Lifestyle Properties, Inc. | 290 | 19,526 | ||||||
Equity Residential | 351 | 20,151 | ||||||
Essex Property Trust, Inc. | 134 | 20,100 | ||||||
Extra Space Storage, Inc. | 604 | 20,832 | ||||||
Federal Realty Investment Trust | 193 | 20,811 | ||||||
General Growth Properties, Inc. | 1,043 | 20,505 | ||||||
Hatteras Financial Corp. | 684 | 18,653 | ||||||
HCP, Inc. | 453 | 20,068 | ||||||
Health Care REIT, Inc. | 351 | 20,860 | ||||||
Home Properties, Inc. | 324 | 19,696 | ||||||
| See Notes to Financial Statements. | GUGGENHEIM ETFS ANNUAL REPORT | 75 |
Table of Contents
| SCHEDULE OF INVESTMENTS (continued) | October 31, 2012 |
GUGGENHEIM RUSSELL 1000® EQUAL WEIGHT ETF
| SHARES | VALUE | |||||||
Hospitality Properties Trust | 839 | $ | 19,398 | |||||
Host Hotels & Resorts, Inc. | 1,241 | 17,945 | ||||||
Kilroy Realty Corp. | 439 | 19,496 | ||||||
Kimco Realty Corp. | 989 | 19,305 | ||||||
Liberty Property Trust | 545 | 19,140 | ||||||
Macerich Co.(The) | 349 | 19,893 | ||||||
Mack-Cali Realty Corp. | 751 | 19,518 | ||||||
MFA Financial, Inc. | 2,339 | 19,110 | ||||||
Mid-America Apartment Communities, Inc. | 308 | 19,931 | ||||||
National Retail Properties, Inc. | 656 | 20,782 | ||||||
Piedmont Office Realty Trust, Inc. — Class A | 1,140 | 20,292 | ||||||
Plum Creek Timber Co., Inc. | 452 | 19,843 | ||||||
Post Properties, Inc. | 416 | 20,305 | ||||||
ProLogis, Inc. | 584 | 20,025 | ||||||
Public Storage | 143 | 19,824 | ||||||
Rayonier, Inc. | 404 | 19,800 | ||||||
Realty Income Corp. | 490 | 19,242 | ||||||
Regency Centers Corp. | 412 | 19,784 | ||||||
Retail Properties of America, Inc. — Class A | 1,728 | 21,151 | ||||||
Senior Housing Properties Trust | 915 | 20,112 | ||||||
Simon Property Group, Inc. | 132 | 20,092 | ||||||
SL Green Realty Corp. | 250 | 18,825 | ||||||
Tanger Factory Outlet Centers, Inc. | 624 | 19,637 | ||||||
Taubman Centers, Inc. | 259 | 20,344 | ||||||
UDR, Inc. | 806 | 19,562 | ||||||
Ventas, Inc. | 323 | 20,436 | ||||||
Vornado Realty Trust | 248 | 19,892 | ||||||
Weingarten Realty Investors | 723 | 19,521 | ||||||
Weyerhaeuser Co. | 756 | 20,934 | ||||||
|
| |||||||
Total Real Estate Investment Trusts (REITs) |
| 1,172,346 | ||||||
|
| |||||||
Real Estate Management & Development - 0.3% |
| |||||||
Alexander & Baldwin, Inc.* | 671 | 19,412 | ||||||
CBRE Group, Inc.* | 1,080 | 19,461 | ||||||
Forest City Enterprises, Inc. — Class A* | 1,306 | 20,961 | ||||||
Howard Hughes Corp.(The)* | 284 | 19,880 | ||||||
Jones Lang LaSalle, Inc. | 259 | 20,135 | ||||||
St Joe Co.(The)*,a | 991 | 19,622 | ||||||
|
| |||||||
Total Real Estate Management & Development |
| 119,471 | ||||||
|
| |||||||
Road & Rail - 0.7% | ||||||||
Con-way, Inc. | 1,168 | 34,000 | ||||||
CSX Corp. | 1,484 | 30,377 | ||||||
Hertz Global Holdings, Inc.* | 1,921 | 25,492 | ||||||
JB Hunt Transport Services, Inc. | 614 | 36,042 | ||||||
Kansas City Southern | 412 | 33,150 | ||||||
Landstar System, Inc. | 660 | 33,429 | ||||||
Norfolk Southern Corp. | 483 | 29,632 | ||||||
Ryder System, Inc. | 804 | 36,276 | ||||||
Union Pacific Corp. | 261 | 32,111 | ||||||
|
| |||||||
Total Road & Rail |
| 290,509 | ||||||
|
| |||||||
| SHARES | VALUE | |||||||
Semiconductors & Semiconductor Equipment - 2.5% |
| |||||||
Advanced Micro Devices, Inc.*,a | 11,278 | $ | 23,120 | |||||
Altera Corp. | 1,050 | 32,004 | ||||||
Analog Devices, Inc. | 948 | 37,076 | ||||||
Applied Materials, Inc. | 3,321 | 35,203 | ||||||
Atmel Corp.* | 6,788 | 31,666 | ||||||
Avago Technologies Ltd. | 1,122 | 37,060 | ||||||
Broadcom Corp. — Class A* | 1,071 | 33,774 | ||||||
Cree, Inc.* | 1,448 | 43,918 | ||||||
Cypress Semiconductor Corp.* | 3,441 | 34,100 | ||||||
Fairchild Semiconductor International, Inc.* | 2,754 | 32,387 | ||||||
Freescale Semiconductor Ltd.* | 4,043 | 36,144 | ||||||
Intel Corp. | 1,643 | 35,530 | ||||||
KLA-Tencor Corp. | 789 | 36,704 | ||||||
Lam Research Corp.* | 1,162 | 41,135 | ||||||
Linear Technology Corp. | 1,165 | 36,418 | ||||||
LSI Corp.* | 5,255 | 35,997 | ||||||
Marvell Technology Group Ltd. | 4,003 | 31,584 | ||||||
Maxim Integrated Products, Inc. | 1,414 | 38,920 | ||||||
Microchip Technology, Inc. | 1,124 | 35,237 | ||||||
Micron Technology, Inc.* | 6,064 | 32,897 | ||||||
NVIDIA Corp.* | 2,759 | 33,025 | ||||||
ON Semiconductor Corp.* | 6,064 | 37,294 | ||||||
PMC — Sierra, Inc.* | 6,334 | 29,643 | ||||||
Silicon Laboratories, Inc.* | 1,023 | 41,350 | ||||||
Skyworks Solutions, Inc.* | 1,575 | 36,855 | ||||||
Teradyne, Inc.*,a | 2,583 | 37,763 | ||||||
Texas Instruments, Inc. | 1,329 | 37,332 | ||||||
Xilinx, Inc. | 1,095 | 35,872 | ||||||
|
| |||||||
Total Semiconductors & Semiconductor Equipment |
| 990,008 | ||||||
|
| |||||||
Software - 2.7% | ||||||||
Activision Blizzard, Inc. | 3,178 | 34,608 | ||||||
Adobe Systems, Inc.* | 1,125 | 38,250 | ||||||
ANSYS, Inc.* | 511 | 36,220 | ||||||
Autodesk, Inc.* | 1,125 | 35,820 | ||||||
BMC Software, Inc.* | 883 | 35,938 | ||||||
CA, Inc. | 1,420 | 31,978 | ||||||
Cadence Design Systems, Inc.* | 2,878 | 36,436 | ||||||
Citrix Systems, Inc.* | 492 | 30,411 | ||||||
Compuware Corp.* | 3,756 | 32,527 | ||||||
Concur Technologies, Inc.* | 500 | 33,115 | ||||||
Electronic Arts, Inc.* | 2,919 | 36,050 | ||||||
Factset Research Systems, Inc. | 204 | 18,472 | ||||||
Fortinet, Inc.* | 1,431 | 27,719 | ||||||
Informatica Corp.* | 1,097 | 29,773 | ||||||
Intuit, Inc. | 639 | 37,969 | ||||||
MICROS Systems, Inc.* | 755 | 34,270 | ||||||
Microsoft Corp. | 1,217 | 34,727 | ||||||
NetSuite, Inc.* | 607 | 38,551 | ||||||
Nuance Communications, Inc.* | 1,520 | 33,835 | ||||||
Oracle Corp. | 1,182 | 36,701 | ||||||
Red Hat, Inc.* | 671 | 32,993 | ||||||
Rovi Corp.* | 2,483 | 33,595 | ||||||
| 76 | GUGGENHEIM ETFS ANNUAL REPORT | See Notes to Financial Statements. |
Table of Contents
| SCHEDULE OF INVESTMENTS (continued) | October 31, 2012 |
GUGGENHEIM RUSSELL 1000® EQUAL WEIGHT ETF
| SHARES | VALUE | |||||||
Salesforce.com, Inc.* | 244 | $ | 35,619 | |||||
ServiceNow, Inc.* | 925 | 28,351 | ||||||
Solarwinds, Inc.* | 639 | 32,327 | ||||||
Solera Holdings, Inc. | 857 | 40,116 | ||||||
Splunk, Inc.* | 1,006 | 28,218 | ||||||
Symantec Corp.* | 2,049 | 37,271 | ||||||
Synopsys, Inc.* | 1,125 | 36,225 | ||||||
TIBCO Software, Inc.* | 1,244 | 31,361 | ||||||
VMware, Inc. — Class A* | 385 | 32,636 | ||||||
Zynga, Inc. — Class A* | 13,164 | 29,619 | ||||||
|
| |||||||
Total Software |
| 1,071,701 | ||||||
|
| |||||||
Specialty Retail - 2.4% | ||||||||
Aaron’s, Inc. | 949 | 29,258 | ||||||
Abercrombie & Fitch Co. — Class A | 765 | 23,394 | ||||||
Advance Auto Parts, Inc. | 392 | 27,808 | ||||||
American Eagle Outfitters, Inc. | 1,245 | 25,983 | ||||||
Ascena Retail Group, Inc.* | 1,241 | 24,572 | ||||||
AutoNation, Inc.*,a | 615 | 27,306 | ||||||
AutoZone, Inc.* | 72 | 27,000 | ||||||
Bed Bath & Beyond, Inc.* | 428 | 24,687 | ||||||
Best Buy Co., Inc. | 1,562 | 23,758 | ||||||
CarMax, Inc.* | 929 | 31,354 | ||||||
Chico’s FAS, Inc. | 1,464 | 27,230 | ||||||
Dick’s Sporting Goods, Inc. | 513 | 25,650 | ||||||
DSW, Inc. — Class A | 407 | 25,474 | ||||||
Foot Locker, Inc. | 739 | 24,756 | ||||||
GameStop Corp. — Class Aa | 1,267 | 28,926 | ||||||
Gap, Inc.(The) | 745 | 26,611 | ||||||
GNC Holdings, Inc. — Class A | 2,392 | 92,499 | ||||||
Guess?, Inc. | 1,059 | 26,242 | ||||||
Home Depot, Inc. | 443 | 27,191 | ||||||
Limited Brands, Inc. | 536 | 25,669 | ||||||
Lowe’s Cos., Inc. | 892 | 28,883 | ||||||
O’Reilly Automotive, Inc.* | 314 | 26,903 | ||||||
PetSmart, Inc. | 388 | 25,759 | ||||||
Ross Stores, Inc. | 409 | 24,929 | ||||||
Sally Beauty Holdings, Inc.* | 1,029 | 24,778 | ||||||
Signet Jewelers Ltd. | 542 | 28,054 | ||||||
Staples, Inc. | 2,246 | 25,863 | ||||||
Tiffany & Co. | 430 | 27,185 | ||||||
TJX Cos., Inc. | 600 | 24,978 | ||||||
Tractor Supply Co. | 273 | 26,273 | ||||||
Ulta Salon Cosmetics & Fragrance, Inc. | 273 | 25,176 | ||||||
Urban Outfitters, Inc.* | 697 | 24,925 | ||||||
Williams-Sonoma, Inc. | 611 | 28,247 | ||||||
|
| |||||||
Total Specialty Retail |
| 937,321 | ||||||
|
| |||||||
Textiles, Apparel & Luxury Goods - 0.8% | ||||||||
Carter’s, Inc.* | 485 | 26,219 | ||||||
Coach, Inc. | 489 | 27,408 | ||||||
Deckers Outdoor Corp.*,a | 756 | 21,644 | ||||||
Fossil, Inc.* | 312 | 27,175 | ||||||
Hanesbrands, Inc.* | 832 | 27,847 | ||||||
Michael Kors Holdings Ltd.* | 506 | 27,673 | ||||||
| SHARES | VALUE | |||||||
NIKE, Inc. — Class B | 278 | $ | 25,404 | |||||
PVH Corp. | 285 | 31,347 | ||||||
Ralph Lauren Corp. | 175 | 26,896 | ||||||
Under Armour, Inc. — Class A*,a | 485 | 25,346 | ||||||
V.F. Corp. | 168 | 26,289 | ||||||
|
| |||||||
Total Textiles, Apparel & Luxury Goods |
| 293,248 | ||||||
|
| |||||||
Thrifts & Mortgage Finance - 0.3% | ||||||||
Capitol Federal Financial, Inc. | 1,692 | 20,152 | ||||||
Hudson City Bancorp, Inc. | 2,535 | 21,509 | ||||||
New York Community Bancorp, Inc. | 1,433 | 19,861 | ||||||
People’s United Financial, Inc. | 1,653 | 19,886 | ||||||
TFS Financial Corp.* | 2,212 | 19,797 | ||||||
Washington Federal, Inc. | 1,184 | 19,868 | ||||||
|
| |||||||
Total Thrifts & Mortgage Finance |
| 121,073 | ||||||
|
| |||||||
Tobacco - 0.9% | ||||||||
Altria Group, Inc. | 2,619 | 83,284 | ||||||
Lorillard, Inc. | 755 | 87,588 | ||||||
Philip Morris International, Inc. | 989 | 87,586 | ||||||
Reynolds American, Inc. | 2,043 | 85,070 | ||||||
|
| |||||||
Total Tobacco |
| 343,528 | ||||||
|
| |||||||
Trading Companies & Distributors - 0.8% |
| |||||||
Air Lease Corp.* | 1,538 | 32,021 | ||||||
Fastenal Co. | 1,345 | 60,121 | ||||||
GATX Corp. | 714 | 29,602 | ||||||
MRC Global, Inc.* | 2,350 | 57,458 | ||||||
MSC Industrial Direct Co., Inc. — Class A | 446 | 33,272 | ||||||
United Rentals, Inc.* | 912 | 37,082 | ||||||
W.W. Grainger, Inc. | 152 | 30,614 | ||||||
WESCO International, Inc.* | 551 | 35,749 | ||||||
|
| |||||||
Total Trading Companies & Distributors |
| 315,919 | ||||||
|
| |||||||
Water Utilities - 0.4% | ||||||||
American Water Works Co., Inc. | 1,934 | 71,055 | ||||||
Aqua America, Inc. | 2,908 | 73,834 | ||||||
|
| |||||||
Total Water Utilities |
| 144,889 | ||||||
|
| |||||||
Wireless Telecommunication Services - 1.3% |
| |||||||
Clearwire Corp. — Class A*,a | 48,680 | 97,360 | ||||||
Crown Castle International Corp.* | 581 | 38,782 | ||||||
MetroPCS Communications, Inc.* | 6,201 | 63,312 | ||||||
NII Holdings, Inc.*,a | 9,415 | 75,037 | ||||||
SBA Communications Corp. — Class A* | 604 | 40,244 | ||||||
Sprint Nextel Corp.* | 12,940 | 71,688 | ||||||
Telephone & Data Systems, Inc. | 2,806 | 69,785 | ||||||
United States Cellular Corp.* | 1,841 | 68,098 | ||||||
|
| |||||||
Total Wireless Telecommunication Services |
| 524,306 | ||||||
|
| |||||||
Total Common Stocks |
| 38,912,340 | ||||||
|
| |||||||
SHORT TERM INVESTMENTS - 0.2% |
| |||||||
SSgA Government Money Market Fund | 75,785 | 75,785 | ||||||
|
| |||||||
Total Short Term Investments |
| 75,785 | ||||||
|
| |||||||
| See Notes to Financial Statements. | GUGGENHEIM ETFS ANNUAL REPORT | 77 |
Table of Contents
| SCHEDULE OF INVESTMENTS (concluded) | October 31, 2012 |
GUGGENHEIM RUSSELL 1000® EQUAL WEIGHT ETF
| FACE AMOUNT | VALUE | |||||||
SECURITIES LENDING COLLATERAL - 2.1%d |
| |||||||
Joint Repurchase Agreements: | ||||||||
Merrill Lynch, Fenner & Smith, Inc. | $ | 302,236 | $ | 302,236 | ||||
RBS Securities, Inc. | 513,877 | 513,877 | ||||||
|
| |||||||
Total Securities Lending Collateral | 816,113 | |||||||
|
| |||||||
Total Investments 102.0%c | 39,804,238 | |||||||
|
| |||||||
Other Assets and Liabilities, net - (2.0)% |
| (793,003 | ) | |||||
|
| |||||||
Net Assets - 100.0% | $ | 39,011,235 | ||||||
|
| |||||||
| * | Non-Income Producing Security. |
| a | All or a portion of this security was on loan as of October 31, 2012. |
| b | Values determined based on Level 2 inputs (Note F). |
| c | Unless otherwise indicated, the values of the Investments are determined based on Level 1 inputs. |
| d | Securities lending collateral (Note I). |
| PLC | — Public Limited Company |
| 78 | GUGGENHEIM ETFS ANNUAL REPORT | See Notes to Financial Statements. |
Table of Contents
| SCHEDULE OF INVESTMENTS | October 31, 2012 |
GUGGENHEIM RUSSELL 2000® EQUAL WEIGHT ETF
| SHARES | VALUE | |||||||
COMMON STOCKS - 99.3% |
| |||||||
Aerospace & Defense - 1.1% |
| |||||||
AAR Corp. | 398 | $ | 6,006 | |||||
Aerovironment, Inc.* | 271 | 5,959 | ||||||
American Science & Engineering, Inc. | 85 | 5,404 | ||||||
API Technologies Corp.* | 2,149 | 5,673 | ||||||
Astronics Corp.* | 32 | 727 | ||||||
Astronics Corp.* | 212 | 4,920 | ||||||
Ceradyne, Inc. | 258 | 9,020 | ||||||
CPI Aerostructures, Inc.* | 585 | 6,441 | ||||||
Cubic Corp. | 127 | 6,198 | ||||||
Curtiss-Wright Corp. | 195 | 6,020 | ||||||
DigitalGlobe, Inc.* | 265 | 6,874 | ||||||
Esterline Technologies Corp.* | 114 | 6,588 | ||||||
GenCorp, Inc.* | 663 | 5,848 | ||||||
GeoEye, Inc.* | 205 | 6,431 | ||||||
HEICO Corp. | 166 | 6,412 | ||||||
Hexcel Corp.* | 563 | 14,390 | ||||||
KEYW Holding Corp.(The)* | 455 | 5,524 | ||||||
Kratos Defense & Security Solutions, Inc.* | 1,064 | 5,863 | ||||||
LMI Aerospace, Inc.* | 313 | 6,285 | ||||||
Moog, Inc. — Class A* | 165 | 6,107 | ||||||
National Presto Industries, Inc. | 75 | 5,576 | ||||||
Orbital Sciences Corp.* | 432 | 5,789 | ||||||
SIFCO Industries, Inc. | 341 | 5,712 | ||||||
Sypris Solutions, Inc. | 881 | 5,550 | ||||||
Taser International, Inc.* | 1,093 | 8,536 | ||||||
Teledyne Technologies, Inc.* | 100 | 6,403 | ||||||
|
| |||||||
Total Aerospace & Defense |
| 164,256 | ||||||
|
| |||||||
Air Freight & Logistics - 0.4% |
| |||||||
Air Transport Services Group, Inc.* | 1,398 | 5,382 | ||||||
Atlas Air Worldwide Holdings, Inc.* | 121 | 6,654 | ||||||
Echo Global Logistics, Inc.* | 368 | 6,186 | ||||||
Forward Air Corp. | 206 | 6,874 | ||||||
Hub Group, Inc. — Class A* | 210 | 6,512 | ||||||
Pacer International, Inc.* | 1,614 | 5,778 | ||||||
Park-Ohio Holdings Corp.* | 286 | 6,327 | ||||||
XPO Logistics, Inc.* | 519 | 7,126 | ||||||
|
| |||||||
Total Air Freight & Logistics |
| 50,839 | ||||||
|
| |||||||
Airlines - 0.4% |
| |||||||
Alaska Air Group, Inc.* | 189 | 7,227 | ||||||
Allegiant Travel Co.* | 99 | 7,201 | ||||||
Hawaiian Holdings, Inc.* | 1,126 | 6,677 | ||||||
JetBlue Airways Corp.* | 1,303 | 6,893 | ||||||
Republic Airways Holdings, Inc.* | 1,311 | 6,122 | ||||||
SkyWest, Inc. | 617 | 6,756 | ||||||
Spirit Airlines, Inc.* | 370 | 6,494 | ||||||
US Airways Group, Inc.*,a | 619 | 7,540 | ||||||
|
| |||||||
Total Airlines |
| 54,910 | ||||||
|
| |||||||
Auto Components - 0.6% |
| |||||||
American Axle & Manufacturing Holdings, Inc.* | 511 | 5,555 | ||||||
| SHARES | VALUE | |||||||
Cooper Tire & Rubber Co. | 280 | $ | 5,636 | |||||
Dana Holding Corp. | 451 | 5,935 | ||||||
Dorman Products, Inc.* | 177 | 5,407 | ||||||
Drew Industries, Inc.* | 183 | 5,796 | ||||||
Exide Technologies* | 1,808 | 5,514 | ||||||
Federal-Mogul Corp.* | 590 | 4,449 | ||||||
Fuel Systems Solutions, Inc.* | 328 | 5,337 | ||||||
Gentherm, Inc.* | 478 | 5,745 | ||||||
Modine Manufacturing Co.* | 866 | 5,889 | ||||||
Spartan Motors, Inc. | 1,247 | 5,861 | ||||||
Standard Motor Products, Inc. | 310 | 5,822 | ||||||
Stoneridge, Inc.* | 1,204 | 5,984 | ||||||
Superior Industries International, Inc. | 323 | 5,520 | ||||||
Tenneco, Inc.* | 200 | 6,110 | ||||||
Tower International, Inc.* | 727 | 5,147 | ||||||
|
| |||||||
Total Auto Components |
| 89,707 | ||||||
|
| |||||||
Automobiles - 0.0%b |
| |||||||
Winnebago Industries, Inc.* | 440 | 5,544 | ||||||
|
| |||||||
Total Automobiles |
| 5,544 | ||||||
|
| |||||||
Beverages - 0.9% |
| |||||||
Boston Beer Co., Inc. — Class A* | 294 | 31,628 | ||||||
Central European Distribution Corp.*,a | 10,666 | 27,518 | ||||||
Coca-Cola Bottling Co. Consolidated | 478 | 32,858 | ||||||
National Beverage Corp.* | 2,109 | 31,361 | ||||||
|
| |||||||
Total Beverages |
| 123,365 | ||||||
|
| |||||||
Biotechnology - 3.4% |
| |||||||
Achillion Pharmaceuticals, Inc.* | 637 | 6,013 | ||||||
Acorda Therapeutics, Inc.* | 242 | 5,796 | ||||||
Aegerion Pharmaceuticals, Inc.* | 405 | 9,104 | ||||||
Affymax, Inc.* | 293 | 6,678 | ||||||
Agenus, Inc.* | 1,300 | 5,811 | ||||||
Alkermes PLC* | 304 | 5,633 | ||||||
Alnylam Pharmaceuticals, Inc.* | 321 | 5,191 | ||||||
AMAG Pharmaceuticals, Inc.* | 355 | 5,495 | ||||||
Amicus Therapeutics, Inc.* | 1,116 | 5,658 | ||||||
Anacor Pharmaceuticals, Inc.* | 917 | 5,273 | ||||||
Arena Pharmaceuticals, Inc.* | 740 | 5,853 | ||||||
ArQule, Inc.* | 1,246 | 3,127 | ||||||
Array Biopharma, Inc.* | 1,089 | 4,508 | ||||||
Astex Pharmaceuticals, Inc.* | 1,980 | 4,712 | ||||||
AVEO Pharmaceuticals, Inc.* | 621 | 4,738 | ||||||
BioCryst Pharmaceuticals, Inc.* | 1,520 | 4,423 | ||||||
Biospecifics Technologies Corp.* | 317 | 5,072 | ||||||
Biotime, Inc.* | 1,406 | 5,357 | ||||||
Celldex Therapeutics, Inc.* | 1,011 | 5,571 | ||||||
Cepheid, Inc.* | 160 | 4,850 | ||||||
ChemoCentryx, Inc.* | 524 | 5,916 | ||||||
Clovis Oncology, Inc.* | 296 | 6,385 | ||||||
Codexis, Inc.* | 1,961 | 5,099 | ||||||
Coronado Biosciences, Inc.* | 1,116 | 5,915 | ||||||
Cubist Pharmaceuticals, Inc.* | 130 | 5,577 | ||||||
Curis, Inc.* | 1,494 | 5,692 | ||||||
Cytori Therapeutics, Inc.*,a | 1,311 | 4,838 | ||||||
| See Notes to Financial Statements. | GUGGENHEIM ETFS ANNUAL REPORT | 79 |
Table of Contents
| SCHEDULE OF INVESTMENTS (continued) | October 31, 2012 |
GUGGENHEIM RUSSELL 2000® EQUAL WEIGHT ETF
| SHARES | VALUE | |||||||
Dendreon Corp.*,a | 1,311 | $ | 4,982 | |||||
Discovery Laboratories, Inc.* | 1,867 | 4,499 | ||||||
Durata Therapeutics, Inc.* | 699 | 5,564 | ||||||
Dusa Pharmaceuticals, Inc.* | 921 | 6,318 | ||||||
Dyax Corp.* | 2,486 | 7,458 | ||||||
Dynavax Technologies Corp.* | 1,309 | 5,419 | ||||||
Emergent Biosolutions, Inc.* | 432 | 5,741 | ||||||
Enzon Pharmaceuticals, Inc.* | 902 | 5,926 | ||||||
Exact Sciences Corp.* | 552 | 5,222 | ||||||
Exelixis, Inc.*,a | 1,248 | 5,928 | ||||||
Genomic Health, Inc.* | 175 | 5,469 | ||||||
Geron Corp.* | 3,656 | 4,863 | ||||||
GTx, Inc.* | 1,269 | 5,089 | ||||||
Halozyme Therapeutics, Inc.* | 801 | 4,237 | ||||||
Idenix Pharmaceuticals, Inc.* | 1,387 | 4,938 | ||||||
ImmunoCellular Therapeutics Ltd.* | 2,151 | 3,850 | ||||||
Immunogen, Inc.*,a | 386 | 4,277 | ||||||
Immunomedics, Inc.* | 1,731 | 5,730 | ||||||
Infinity Pharmaceuticals, Inc.* | 269 | 6,023 | ||||||
InterMune, Inc.* | 691 | 5,493 | ||||||
Ironwood Pharmaceuticals, Inc.* | 468 | 5,443 | ||||||
Isis Pharmaceuticals, Inc.* | 419 | 3,624 | ||||||
Keryx Biopharmaceuticals, Inc.*,a | 2,319 | 5,774 | ||||||
Lexicon Pharmaceuticals, Inc.* | 2,438 | 5,047 | ||||||
Ligand Pharmaceuticals, Inc. — Class B* | 352 | 5,428 | ||||||
MannKind Corp.*,a | 2,212 | 4,181 | ||||||
Maxygen, Inc. | 2,328 | 5,680 | ||||||
Merrimack Pharmaceuticals, Inc.* | 688 | 4,252 | ||||||
Momenta Pharmaceuticals, Inc.* | 430 | 5,452 | ||||||
Neurocrine Biosciences, Inc.* | 792 | 5,805 | ||||||
NewLink Genetics Corp.* | 387 | 5,337 | ||||||
Novavax, Inc.* | 3,047 | 6,399 | ||||||
NPS Pharmaceuticals, Inc.* | 699 | 6,459 | ||||||
OncoGenex Pharmaceutical, Inc.* | 431 | 5,344 | ||||||
Oncothyreon, Inc.* | 1,098 | 5,578 | ||||||
Opko Health, Inc.* | 1,505 | 6,441 | ||||||
Orexigen Therapeutics, Inc.* | 1,091 | 5,815 | ||||||
Osiris Therapeutics, Inc.* | 614 | 6,447 | ||||||
PDL BioPharma, Inc. | 807 | 6,012 | ||||||
Pharmacyclics, Inc.* | 100 | 6,107 | ||||||
Progenics Pharmaceuticals, Inc.* | 1,889 | 5,384 | ||||||
Raptor Pharmaceutical Corp.*,a | 1,145 | 5,324 | ||||||
Repligen Corp.* | 987 | 5,034 | ||||||
Rigel Pharmaceuticals, Inc.* | 602 | 5,364 | ||||||
Sangamo Biosciences, Inc.* | 1,014 | 5,638 | ||||||
Seattle Genetics, Inc.* | 235 | 5,913 | ||||||
SIGA Technologies, Inc.* | 1,823 | 5,287 | ||||||
Spectrum Pharmaceuticals, Inc.*,a | 527 | 5,881 | ||||||
Sunesis Pharmaceuticals, Inc.* | 1,087 | 4,685 | ||||||
Synageva BioPharma Corp.* | 114 | 4,820 | ||||||
Synergy Pharmaceuticals, Inc.* | 1,328 | 5,259 | ||||||
Synta Pharmaceuticals Corp.*,a | 782 | 6,154 | ||||||
Targacept, Inc.* | 1,266 | 5,165 | ||||||
| SHARES | VALUE | |||||||
TESARO, Inc.* | 444 | $ | 7,219 | |||||
Theravance, Inc.* | 241 | 5,425 | ||||||
Threshold Pharmaceuticals, Inc.*,a | 865 | 3,555 | ||||||
Trius Therapeutics, Inc.* | 1,075 | 5,891 | ||||||
Vanda Pharmaceuticals, Inc.* | 1,523 | 5,163 | ||||||
Verastem, Inc.* | 656 | 5,209 | ||||||
Vical, Inc.* | 1,357 | 4,627 | ||||||
XOMA Corp.* | 1,631 | 4,469 | ||||||
ZIOPHARM Oncology, Inc.* | 1,122 | 5,285 | ||||||
|
| |||||||
Total Biotechnology | 482,687 | |||||||
|
| |||||||
Building Products - 1.4% |
| |||||||
AAON, Inc. | 678 | 14,224 | ||||||
Ameresco, Inc. — Class A* | 1,256 | 13,891 | ||||||
American Woodmark Corp.* | 281 | 6,463 | ||||||
AO Smith Corp. | 111 | 6,746 | ||||||
Apogee Enterprises, Inc. | 664 | 13,526 | ||||||
Builders FirstSource, Inc.* | 2,595 | 14,299 | ||||||
Gibraltar Industries, Inc.* | 1,016 | 12,659 | ||||||
Griffon Corp. | 1,286 | 13,053 | ||||||
Insteel Industries, Inc. | 1,146 | 13,294 | ||||||
NCI Building Systems, Inc.* | 1,247 | 13,979 | ||||||
Nortek, Inc.* | 243 | 14,461 | ||||||
Quanex Building Products Corp. | 679 | 13,424 | ||||||
Simpson Manufacturing Co., Inc. | 453 | 13,798 | ||||||
Trex Co., Inc.* | 397 | 13,871 | ||||||
Universal Forest Products, Inc. | 318 | 12,243 | ||||||
USG Corp.* | 609 | 16,266 | ||||||
|
| |||||||
Total Building Products | 206,197 | |||||||
|
| |||||||
Capital Markets - 1.6% |
| |||||||
Apollo Investment Corp. | 462 | 3,673 | ||||||
Arlington Asset Investment Corp. — Class A | 139 | 3,093 | ||||||
Artio Global Investors, Inc. | 1,156 | 2,751 | ||||||
BGC Partners, Inc. — Class A | 730 | 3,416 | ||||||
BlackRock Kelso Capital Corp. | 370 | 3,704 | ||||||
Calamos Asset Management, Inc. — Class A | 296 | 3,197 | ||||||
Capital Southwest Corp. | 31 | 3,340 | ||||||
CIFC Corp.* | 468 | 3,159 | ||||||
Cohen & Steers, Inc. | 116 | 3,247 | ||||||
Cowen Group, Inc. — Class A* | 1,251 | 3,178 | ||||||
Diamond Hill Investment Group, Inc. | 45 | 3,464 | ||||||
Duff & Phelps Corp. — Class A | 255 | 3,170 | ||||||
Epoch Holding Corp. | 152 | 3,332 | ||||||
Evercore Partners, Inc. — Class A | 128 | 3,571 | ||||||
FBR & Co.* | 1,097 | 3,269 | ||||||
Fidus Investment Corp. | 213 | 3,578 | ||||||
Fifth Street Finance Corp. | 326 | 3,557 | ||||||
Financial Engines, Inc.* | 146 | 3,505 | ||||||
Firsthand Technology Value Fund, Inc.* | 205 | 3,678 | ||||||
FXCM, Inc. — Class A | 364 | 3,276 | ||||||
GAMCO Investors, Inc. — Class A | 70 | 3,430 | ||||||
GFI Group, Inc. | 1,097 | 3,467 | ||||||
| 80 | GUGGENHEIM ETFS ANNUAL REPORT | See Notes to Financial Statements. |
Table of Contents
| SCHEDULE OF INVESTMENTS (continued) | October 31, 2012 |
GUGGENHEIM RUSSELL 2000® EQUAL WEIGHT ETF
| SHARES | VALUE | |||||||
Gladstone Capital Corp. | 405 | $ | 3,605 | |||||
Gladstone Investment Corp. | 448 | 3,315 | ||||||
Golub Capital BDC, Inc. | 226 | 3,532 | ||||||
Greenhill & Co., Inc. | 69 | 3,293 | ||||||
GSV Capital Corp.* | 404 | 3,147 | ||||||
Harris & Harris Group, Inc.* | 902 | 3,094 | ||||||
Hercules Technology Growth Capital, Inc. | 308 | 3,326 | ||||||
HFF, Inc. — Class A* | 233 | 3,246 | ||||||
Horizon Technology Finance Corp. | 215 | 3,507 | ||||||
ICG Group, Inc.* | 537 | 5,628 | ||||||
INTL. FCStone, Inc.* | 180 | 3,335 | ||||||
Investment Technology Group, Inc.* | 394 | 3,325 | ||||||
JMP Group, Inc. | 629 | 3,485 | ||||||
KBW, Inc. | 212 | 3,445 | ||||||
KCAP Financial, Inc. | 377 | 3,419 | ||||||
Knight Capital Group, Inc. — Class A* | 1,454 | 3,824 | ||||||
Ladenburg Thalmann Financial Services, Inc.* | 2,566 | 3,336 | ||||||
Main Street Capital Corp. | 120 | 3,604 | ||||||
Manning & Napier, Inc. | 271 | 3,526 | ||||||
MCG Capital Corp. | �� | 743 | 3,462 | |||||
Medallion Financial Corp. | 294 | 3,678 | ||||||
Medley Capital Corp. | 251 | 3,614 | ||||||
MVC Capital, Inc. | 276 | 3,411 | ||||||
New Mountain Finance Corp. | 242 | 3,628 | ||||||
NGP Capital Resources Co. | 458 | 3,357 | ||||||
Oppenheimer Holdings, Inc. — Class A | 206 | 3,354 | ||||||
PennantPark Investment Corp. | 338 | 3,718 | ||||||
Piper Jaffray Cos.* | 138 | 3,705 | ||||||
Prospect Capital Corp. | 300 | 3,552 | ||||||
Pzena Investment Management, Inc. — Class A | 672 | 3,790 | ||||||
Safeguard Scientifics, Inc.* | 350 | 5,547 | ||||||
Solar Capital Ltd. | 159 | 3,625 | ||||||
Solar Senior Capital Ltd. | 197 | 3,459 | ||||||
Stifel Financial Corp.* | 103 | 3,265 | ||||||
SWS Group, Inc.* | 572 | 3,255 | ||||||
TCP Capital Corp. | 226 | 3,465 | ||||||
THL Credit, Inc. | 252 | 3,596 | ||||||
TICC Capital Corp. | 348 | 3,612 | ||||||
Triangle Capital Corp. | 141 | 3,670 | ||||||
Virtus Investment Partners, Inc.* | 40 | 3,840 | ||||||
Walter Investment Management Corp.* | 92 | 4,446 | ||||||
Westwood Holdings Group, Inc. | 89 | 3,455 | ||||||
WisdomTree Investments, Inc.* | 515 | 3,301 | ||||||
|
| |||||||
Total Capital Markets | 228,852 | |||||||
|
| |||||||
Chemicals - 3.1% |
| |||||||
A. Schulman, Inc. | 546 | 14,010 | ||||||
ADA-ES, Inc.* | 267 | 5,204 | ||||||
American Vanguard Corp. | 395 | 14,113 | ||||||
Arabian American Development Co.* | 1,531 | 13,075 | ||||||
Balchem Corp. | 359 | 12,504 | ||||||
Calgon Carbon Corp.* | 933 | 11,560 | ||||||
| SHARES | VALUE | |||||||
Chase Corp. | 718 | $ | 13,233 | |||||
Chemtura Corp.* | 781 | 12,441 | ||||||
Ferro Corp.* | 3,561 | 9,365 | ||||||
Flotek Industries, Inc.* | 1,188 | 13,199 | ||||||
FutureFuel Corp. | 1,087 | 12,816 | ||||||
Georgia Gulf Corp. | 358 | 12,670 | ||||||
GSE Holding, Inc.* | 790 | 6,288 | ||||||
H.B. Fuller Co. | 400 | 12,160 | ||||||
Hawkins, Inc. | 324 | 12,668 | ||||||
Innophos Holdings, Inc. | 271 | 12,913 | ||||||
Innospec, Inc.* | 414 | 13,405 | ||||||
KMG Chemicals, Inc. | 739 | 12,622 | ||||||
Koppers Holdings, Inc. | 375 | 13,387 | ||||||
Kraton Performance Polymers, Inc.* | 505 | 11,019 | ||||||
Landec Corp.* | 1,163 | 12,584 | ||||||
LSB Industries, Inc.* | 307 | 12,363 | ||||||
Minerals Technologies, Inc. | 186 | 13,329 | ||||||
Olin Corp. | 612 | 12,693 | ||||||
OM Group, Inc.* | 704 | 14,242 | ||||||
Omnova Solutions, Inc.* | 1,518 | 11,901 | ||||||
PolyOne Corp. | 801 | 15,163 | ||||||
Quaker Chemical Corp. | 281 | 14,890 | ||||||
Sensient Technologies Corp. | 363 | 13,206 | ||||||
Spartech Corp.* | 2,516 | 21,537 | ||||||
Stepan Co. | 137 | 13,125 | ||||||
TPC Group, Inc.* | 321 | 14,439 | ||||||
Tredegar Corp. | 763 | 12,948 | ||||||
Zep, Inc. | 870 | 12,467 | ||||||
Zoltek Cos., Inc.* | 1,682 | 11,522 | ||||||
|
| |||||||
Total Chemicals | 445,061 | |||||||
|
| |||||||
Commercial Banks - 3.8% |
| |||||||
1st Source Corp. | 156 | 3,465 | ||||||
1st United Bancorp, Inc.* | 544 | 3,269 | ||||||
Access National Corp. | 253 | 3,337 | ||||||
Alliance Financial Corp. | 86 | 3,894 | ||||||
American National Bankshares, Inc. | 154 | 3,232 | ||||||
Ameris Bancorp* | 275 | 2,934 | ||||||
Ames National Corp. | 165 | 3,264 | ||||||
Arrow Financial Corp. | 139 | 3,392 | ||||||
Bancfirst Corp. | 80 | 3,517 | ||||||
Banco Latinoamericano de Comercio Exterior SA — Class E | 156 | 3,510 | ||||||
Bancorp, Inc.(The)* | 339 | 3,854 | ||||||
BancorpSouth, Inc. | 233 | 3,297 | ||||||
Bank of Kentucky Financial Corp. | 130 | 3,268 | ||||||
Bank of Marin Bancorp | 81 | 3,024 | ||||||
Bank of the Ozarks, Inc. | 103 | 3,372 | ||||||
Banner Corp. | 137 | 3,972 | ||||||
Bar Harbor Bankshares | 97 | 3,440 | ||||||
BBCN Bancorp, Inc. | 280 | 3,340 | ||||||
Berkshire Bancorp, Inc.* | 412 | 3,428 | ||||||
Boston Private Financial Holdings, Inc. | 362 | 3,338 | ||||||
Bridge Bancorp, Inc. | 152 | 3,040 | ||||||
Bridge Capital Holdings* | 225 | 3,364 | ||||||
| See Notes to Financial Statements. | GUGGENHEIM ETFS ANNUAL REPORT | 81 |
Table of Contents
| SCHEDULE OF INVESTMENTS (continued) | October 31, 2012 |
GUGGENHEIM RUSSELL 2000® EQUAL WEIGHT ETF
| SHARES | VALUE | |||||||
Bryn Mawr Bank Corp. | 160 | $ | 3,622 | |||||
BSB Bancorp, Inc.* | 273 | 3,519 | ||||||
C&F Financial Corp. | 88 | 3,454 | ||||||
Camden National Corp. | 95 | 3,315 | ||||||
Capital City Bank Group, Inc.* | 333 | 3,380 | ||||||
Cardinal Financial Corp. | 242 | 3,865 | ||||||
Cascade Bancorp* | 678 | 3,376 | ||||||
Cathay General Bancorp | 199 | 3,520 | ||||||
Center Bancorp, Inc. | 294 | 3,349 | ||||||
Centerstate Banks, Inc. | 393 | 3,407 | ||||||
Central Pacific Financial Corp.* | 242 | 3,478 | ||||||
Century Bancorp, Inc. — Class A | 109 | 3,565 | ||||||
Chemical Financial Corp. | 143 | 3,363 | ||||||
Citizens & Northern Corp. | 176 | 3,268 | ||||||
Citizens Republic Bancorp, Inc.* | 178 | 3,229 | ||||||
City Holding Co. | 97 | 3,407 | ||||||
CNB Financial Corp. | 200 | 3,436 | ||||||
CoBiz Financial, Inc. | 497 | 3,544 | ||||||
Columbia Banking System, Inc. | 186 | 3,294 | ||||||
Community Bank System, Inc. | 122 | 3,366 | ||||||
Community Trust Bancorp, Inc. | 97 | 3,290 | ||||||
CVB Financial Corp. | 289 | 3,127 | ||||||
Eagle Bancorp, Inc.* | 203 | 4,235 | ||||||
Enterprise Bancorp, Inc. | 202 | 3,448 | ||||||
Enterprise Financial Services Corp. | 252 | 3,528 | ||||||
Farmers National Banc Corp. | 549 | 3,398 | ||||||
Fidelity Southern Corp.* | 367 | 3,589 | ||||||
Financial Institutions, Inc. | 184 | 3,503 | ||||||
First BanCorp* | 788 | 3,341 | ||||||
First Bancorp | 300 | 3,135 | ||||||
First Bancorp., Inc. | 189 | 3,115 | ||||||
First Busey Corp. | 715 | 3,375 | ||||||
First California Financial Group, Inc.* | 501 | 3,382 | ||||||
First Commonwealth Financial Corp. | 488 | 3,196 | ||||||
First Community Bancshares, Inc. | 223 | 3,341 | ||||||
First Connecticut Bancorp, Inc. | 266 | 3,642 | ||||||
First Financial Bancorp | 203 | 3,187 | ||||||
First Financial Bankshares, Inc. | 96 | 3,478 | ||||||
First Financial Corp. | 108 | 3,304 | ||||||
First Interstate Bancsystem, Inc. | 227 | 3,412 | ||||||
First Merchants Corp. | 228 | 3,354 | ||||||
First Midwest Bancorp, Inc. | 275 | 3,402 | ||||||
First of Long Island Corp.(The) | 112 | 3,359 | ||||||
FirstMerit Corp. | 234 | 3,243 | ||||||
FNB Corp. | 305 | 3,273 | ||||||
FNB United Corp.* | 295 | 3,531 | ||||||
German American Bancorp, Inc. | 141 | 3,180 | ||||||
Glacier Bancorp, Inc. | 223 | 3,234 | ||||||
Great Southern Bancorp, Inc. | 113 | 3,206 | ||||||
Guaranty Bancorp* | 1,646 | 3,012 | ||||||
Hancock Holding Co. | 109 | 3,443 | ||||||
Hanmi Financial Corp.* | 268 | 3,326 | ||||||
Heartland Financial USA, Inc. | 124 | 3,559 | ||||||
Heritage Commerce Corp.* | 504 | 3,321 | ||||||
| SHARES | VALUE | |||||||
Heritage Financial Corp. | 237 | $ | 3,278 | |||||
Heritage Oaks Bancorp* | 596 | 3,242 | ||||||
Home BancShares, Inc. | 102 | 3,533 | ||||||
HomeTrust Bancshares, Inc.* | 267 | 3,645 | ||||||
Horizon Bancorp | 122 | 3,538 | ||||||
Hudson Valley Holding Corp. | 198 | 3,190 | ||||||
Iberiabank Corp. | 73 | 3,635 | ||||||
Independent Bank Corp. | 113 | 3,335 | ||||||
International Bancshares Corp. | 180 | 3,267 | ||||||
Investors Bancorp, Inc. | 191 | 3,436 | ||||||
Lakeland Bancorp, Inc. | 329 | 3,267 | ||||||
Lakeland Financial Corp. | 125 | 3,336 | ||||||
MainSource Financial Group, Inc. | 273 | 3,418 | ||||||
MB Financial, Inc. | 172 | 3,485 | ||||||
Mercantile Bank Corp.* | 200 | 3,306 | ||||||
Merchants Bancshares, Inc. | 119 | 3,484 | ||||||
Metro Bancorp, Inc.* | 277 | 3,595 | ||||||
MetroCorp Bancshares, Inc.* | 323 | 3,275 | ||||||
Middleburg Financial Corp. | 197 | 3,321 | ||||||
Midsouth Bancorp, Inc. | 221 | 3,425 | ||||||
MidWestOne Financial Group, Inc. | 161 | 3,252 | ||||||
National Bankshares, Inc. | 101 | 3,182 | ||||||
National Penn Bancshares, Inc. | 373 | 3,331 | ||||||
NBT Bancorp, Inc. | 156 | 3,318 | ||||||
Northrim BanCorp, Inc. | 169 | 3,808 | ||||||
Old National Bancorp | 254 | 3,117 | ||||||
OmniAmerican Bancorp, Inc.* | 154 | 3,525 | ||||||
Oriental Financial Group, Inc. | 323 | 3,805 | ||||||
Pacific Capital Bancorp* | 76 | 3,489 | ||||||
Pacific Continental Corp. | 389 | 3,614 | ||||||
Pacific Mercantile Bancorp* | 529 | 3,793 | ||||||
PacWest Bancorp | 148 | 3,330 | ||||||
Park National Corp. | 50 | 3,327 | ||||||
Park Sterling Corp.* | 692 | 3,460 | ||||||
Peapack Gladstone Financial Corp. | 222 | 3,439 | ||||||
Penns Woods Bancorp, Inc. | 80 | 3,242 | ||||||
Peoples Bancorp, Inc. | 151 | 3,216 | ||||||
Pinnacle Financial Partners, Inc.* | 177 | 3,460 | ||||||
Preferred Bank* | 245 | 3,481 | ||||||
PrivateBancorp, Inc. | 213 | 3,442 | ||||||
Prosperity Bancshares, Inc. | 82 | 3,433 | ||||||
Renasant Corp. | 183 | 3,369 | ||||||
Republic Bancorp, Inc. — Class A | 153 | 3,308 | ||||||
S&T Bancorp, Inc. | 195 | 3,426 | ||||||
S.Y. Bancorp, Inc. | 145 | 3,419 | ||||||
Sandy Spring Bancorp, Inc. | 180 | 3,442 | ||||||
SCBT Financial Corp. | 86 | 3,412 | ||||||
Seacoast Banking Corp. of Florida* | 2,181 | 3,490 | ||||||
Sierra Bancorp | 281 | 3,161 | ||||||
Simmons First National Corp. — Class A | 140 | 3,485 | ||||||
Southside Bancshares, Inc. | 160 | 3,266 | ||||||
Southwest Bancorp, Inc.* | 326 | 3,518 | ||||||
State Bank Financial Corp. | 213 | 3,231 | ||||||
| 82 | GUGGENHEIM ETFS ANNUAL REPORT | See Notes to Financial Statements. |
Table of Contents
| SCHEDULE OF INVESTMENTS (continued) | October 31, 2012 |
GUGGENHEIM RUSSELL 2000® EQUAL WEIGHT ETF
| SHARES | VALUE | |||||||
StellarOne Corp. | 263 | $ | 3,608 | |||||
Sterling Bancorp | 346 | 3,304 | ||||||
Sterling Financial Corp. | 155 | 3,295 | ||||||
Suffolk Bancorp* | 233 | 3,500 | ||||||
Sun Bancorp, Inc.* | 1,080 | 3,337 | ||||||
Susquehanna Bancshares, Inc. | 326 | 3,381 | ||||||
Taylor Capital Group, Inc.* | 206 | 3,848 | ||||||
Texas Capital Bancshares, Inc.* | 72 | 3,418 | ||||||
Tompkins Financial Corp. | 85 | 3,441 | ||||||
TowneBank | 226 | 3,519 | ||||||
Trico Bancshares | 210 | 3,528 | ||||||
Trustmark Corp. | 140 | 3,286 | ||||||
UMB Financial Corp. | 71 | 3,162 | ||||||
Umpqua Holdings Corp. | 268 | 3,240 | ||||||
Union First Market Bankshares Corp. | 226 | 3,548 | ||||||
United Bankshares, Inc. | 141 | 3,360 | ||||||
United Community Banks, Inc.* | 416 | 3,619 | ||||||
Univest Corp. of Pennsylvania | 195 | 3,299 | ||||||
Virginia Commerce Bancorp, Inc.* | 396 | 3,627 | ||||||
Washington Banking Co. | 246 | 3,363 | �� | |||||
Washington Trust Bancorp, Inc. | 131 | 3,536 | ||||||
Webster Financial Corp. | 145 | 3,190 | ||||||
WesBanco, Inc. | 164 | 3,608 | ||||||
West Bancorp, Inc. | 292 | 3,186 | ||||||
West Coast Bancorp | 173 | 3,809 | ||||||
Westamerica Bancorp | 73 | 3,221 | ||||||
Western Alliance Bancorp* | 343 | 3,519 | ||||||
Wilshire Bancorp, Inc.* | 547 | 3,561 | ||||||
Wintrust Financial Corp. | 91 | 3,362 | ||||||
|
| |||||||
Total Commercial Banks | 538,054 | |||||||
|
| |||||||
Commercial Services & Supplies - 2.2% |
| |||||||
ABM Industries, Inc. | 336 | 6,384 | ||||||
ACCO Brands Corp.* | 1,026 | 7,428 | ||||||
Acorn Energy, Inc. | 611 | 5,200 | ||||||
American Reprographics Co.* | 1,189 | 4,554 | ||||||
Asset Acceptance Capital Corp.* | 467 | 2,979 | ||||||
Asta Funding, Inc. | 372 | 3,489 | ||||||
AT Cross Co. — Class A* | 612 | 5,796 | ||||||
Brink’s Co.(The) | 252 | 6,630 | ||||||
Casella Waste Systems, Inc. — Class A* | 1,184 | 5,423 | ||||||
Ceco Environmental Corp. | 646 | 5,717 | ||||||
Cenveo, Inc.* | 2,521 | 5,067 | ||||||
Consolidated Graphics, Inc.* | 237 | 6,994 | ||||||
Courier Corp. | 445 | 5,362 | ||||||
Deluxe Corp. | 203 | 6,397 | ||||||
Encore Capital Group, Inc.* | 123 | 3,567 | ||||||
EnergySolutions, Inc.* | 2,338 | 6,687 | ||||||
EnerNOC, Inc.* | 1,178 | 14,513 | ||||||
Ennis, Inc. | 388 | 5,936 | ||||||
G&K Services, Inc. — Class A | 201 | 6,482 | ||||||
Geo Group, Inc.(The) | 230 | 6,376 | ||||||
Healthcare Services Group, Inc. | 286 | 6,835 | ||||||
Heritage-Crystal Clean, Inc.* | 316 | 5,593 | ||||||
Herman Miller, Inc. | 336 | 6,515 | ||||||
| SHARES | VALUE | |||||||
HNI Corp. | 249 | $ | 6,852 | |||||
InnerWorkings, Inc.* | 505 | 7,282 | ||||||
Interface, Inc. | 994 | 14,224 | ||||||
Intersections, Inc. | 332 | 3,084 | ||||||
Kimball International, Inc. — Class B | 508 | 6,066 | ||||||
Knoll, Inc. | 464 | 6,677 | ||||||
McGrath Rentcorp | 238 | 6,250 | ||||||
Metalico, Inc.* | 2,338 | 4,980 | ||||||
Mine Safety Appliances Co. | 173 | 6,678 | ||||||
Mobile Mini, Inc.* | 380 | 6,620 | ||||||
Multi-Color Corp. | 270 | 6,134 | ||||||
Performant Financial Corp.* | 632 | 6,238 | ||||||
Portfolio Recovery Associates, Inc.* | 34 | 3,558 | ||||||
Quad/Graphics, Inc. | 357 | 6,544 | ||||||
Schawk, Inc. | 454 | 5,602 | ||||||
Standard Parking Corp.* | 275 | 6,284 | ||||||
Steelcase, Inc. — Class A | 671 | 6,717 | ||||||
Swisher Hygiene, Inc.*,a | 4,447 | 6,582 | ||||||
SYKES Enterprises, Inc.* | 468 | 6,374 | ||||||
Team, Inc.* | 200 | 6,556 | ||||||
Tetra Tech, Inc.* | 239 | 6,200 | ||||||
TMS International Corp. — Class A* | 1,299 | 13,613 | ||||||
TRC Cos., Inc.* | 831 | 5,991 | ||||||
UniFirst Corp. | 95 | 6,609 | ||||||
United Stationers, Inc. | 239 | 6,936 | ||||||
US Ecology, Inc. | 304 | 7,214 | ||||||
Viad Corp. | 267 | 5,663 | ||||||
|
| |||||||
Total Commercial Services & Supplies | 321,452 | |||||||
|
| |||||||
Communications Equipment - 1.5% |
| |||||||
ADTRAN, Inc. | 281 | 4,746 | ||||||
Anaren, Inc.* | 275 | 4,958 | ||||||
Arris Group, Inc.* | 419 | 5,757 | ||||||
Aruba Networks, Inc.* | 272 | 4,942 | ||||||
Aviat Networks, Inc.* | 2,229 | 5,082 | ||||||
Aware, Inc. | 890 | 5,420 | ||||||
Bel Fuse, Inc. — Class B | 288 | 4,769 | ||||||
Black Box Corp. | 211 | 4,625 | ||||||
CalAmp Corp.* | 776 | 6,891 | ||||||
Calix, Inc.* | 873 | 5,806 | ||||||
Ciena Corp.* | 413 | 5,125 | ||||||
Comtech Telecommunications Corp. | 196 | 4,933 | ||||||
Digi International, Inc.* | 525 | 4,946 | ||||||
Emulex Corp.* | 726 | 5,053 | ||||||
Extreme Networks* | 1,645 | 5,363 | ||||||
Finisar Corp.* | 369 | 4,251 | ||||||
Globecomm Systems, Inc.* | 506 | 5,490 | ||||||
Harmonic, Inc.* | 1,176 | 5,104 | ||||||
Infinera Corp.* | 1,001 | 4,925 | ||||||
InterDigital, Inc. | 168 | 6,399 | ||||||
Ixia* | 348 | 4,876 | ||||||
KVH Industries, Inc.* | 413 | 5,708 | ||||||
Loral Space & Communications, Inc. | 77 | 6,057 | ||||||
Netgear, Inc.* | 143 | 5,078 | ||||||
Numerex Corp. — Class A* | 498 | 5,717 | ||||||
| See Notes to Financial Statements. | GUGGENHEIM ETFS ANNUAL REPORT | 83 |
Table of Contents
| SCHEDULE OF INVESTMENTS (continued) | October 31, 2012 |
GUGGENHEIM RUSSELL 2000® EQUAL WEIGHT ETF
| SHARES | VALUE | |||||||
Oclaro, Inc.* | 1,996 | $ | 3,932 | |||||
Oplink Communications, Inc.* | 334 | 4,963 | ||||||
Parkervision, Inc.*,a | 2,352 | 3,669 | ||||||
PC-Tel, Inc. | 773 | 5,040 | ||||||
Plantronics, Inc. | 152 | 4,931 | ||||||
Procera Networks, Inc.* | 241 | 5,459 | ||||||
ShoreTel, Inc.* | 1,365 | 6,047 | ||||||
Sonus Networks, Inc.* | 2,736 | 5,089 | ||||||
Sycamore Networks, Inc. | 353 | 2,040 | ||||||
Symmetricom, Inc.* | 794 | 4,883 | ||||||
Tellabs, Inc. | 1,553 | 4,535 | ||||||
Telular Corp. | 561 | 5,604 | ||||||
Tessco Technologies, Inc. | 277 | 5,762 | ||||||
Ubiquiti Networks, Inc.* | 468 | 5,522 | ||||||
Viasat, Inc.* | 151 | 5,865 | ||||||
Westell Technologies, Inc. — Class A* | 2,583 | 5,269 | ||||||
|
| |||||||
Total Communications Equipment | 210,631 | |||||||
|
| |||||||
Computers & Peripherals - 0.6% |
| |||||||
3D Systems Corp.* | 162 | 7,047 | ||||||
Avid Technology, Inc.* | 581 | 3,411 | ||||||
Cray, Inc.* | 442 | 5,379 | ||||||
Datalink Corp.* | 652 | 5,307 | ||||||
Electronics for Imaging, Inc.* | 386 | 6,701 | ||||||
Imation Corp.* | 955 | 4,364 | ||||||
Immersion Corp.* | 998 | 4,311 | ||||||
Intermec, Inc.* | 868 | 5,885 | ||||||
Intevac, Inc.* | 912 | 4,560 | ||||||
OCZ Technology Group, Inc.* | 1,557 | 2,102 | ||||||
QLogic Corp.* | 480 | 4,502 | ||||||
Quantum Corp.* | 3,498 | 3,673 | ||||||
Silicon Graphics International Corp.* | 664 | 5,126 | ||||||
STEC, Inc.* | 809 | 4,749 | ||||||
Stratasys, Inc.* | 98 | 6,534 | ||||||
Super Micro Computer, Inc.* | 457 | 3,615 | ||||||
Synaptics, Inc.* | 223 | 5,165 | ||||||
|
| |||||||
Total Computers & Peripherals | 82,431 | |||||||
|
| |||||||
Construction & Engineering - 0.8% |
| |||||||
Aegion Corp.* | 324 | 5,984 | ||||||
Argan, Inc. | 372 | 6,618 | ||||||
Comfort Systems USA, Inc. | 1,172 | 12,775 | ||||||
Dycom Industries, Inc.* | 447 | 6,365 | ||||||
EMCOR Group, Inc. | 218 | 7,011 | ||||||
Furmanite Corp.* | 1,110 | 5,605 | ||||||
Granite Construction, Inc. | 223 | 6,737 | ||||||
Great Lakes Dredge & Dock Corp. | 826 | 6,567 | ||||||
Layne Christensen Co.* | 314 | 6,999 | ||||||
MasTec, Inc.* | 314 | 7,084 | ||||||
Michael Baker Corp.* | 270 | 6,105 | ||||||
MYR Group, Inc.* | 322 | 6,820 | ||||||
Northwest Pipe Co.* | 517 | 11,881 | ||||||
Orion Marine Group, Inc.* | 820 | 5,486 | ||||||
Primoris Services Corp. | 490 | 6,845 | ||||||
Sterling Construction Co., Inc.* | 640 | 5,696 | ||||||
| SHARES | VALUE | |||||||
Tutor Perini Corp.* | 561 | $ | 5,688 | |||||
|
| |||||||
Total Construction & Engineering | 120,266 | |||||||
|
| |||||||
Construction Materials - 0.4% |
| |||||||
Eagle Materials, Inc. | 296 | 15,679 | ||||||
Headwaters, Inc.* | 1,989 | 14,301 | ||||||
Texas Industries, Inc.* | 322 | 13,888 | ||||||
United States Lime & Minerals, Inc.* | 270 | 11,829 | ||||||
|
| |||||||
Total Construction Materials | 55,697 | |||||||
|
| |||||||
Consumer Finance - 0.3% |
| |||||||
Cash America International, Inc. | 93 | 3,635 | ||||||
Credit Acceptance Corp.* | 40 | 3,266 | ||||||
DFC Global Corp.* | 205 | 3,454 | ||||||
EZCORP, Inc. — Class A* | 150 | 2,949 | ||||||
First Cash Financial Services, Inc.* | 76 | 3,394 | ||||||
First Marblehead Corp.(The)* | 3,324 | 3,125 | ||||||
Green Dot Corp. — Class A* | 274 | 2,792 | ||||||
Nelnet, Inc. — Class A | 147 | 3,588 | ||||||
Netspend Holdings, Inc.* | 364 | 3,899 | ||||||
Nicholas Financial, Inc. | 261 | 3,396 | ||||||
Regional Management Corp.* | 202 | 3,531 | ||||||
World Acceptance Corp.* | 50 | 3,338 | ||||||
|
| |||||||
Total Consumer Finance | 40,367 | |||||||
|
| |||||||
Containers & Packaging - 0.5% |
| |||||||
AEP Industries, Inc.* | 226 | 14,448 | ||||||
Boise, Inc. | 1,515 | 12,711 | ||||||
Graphic Packaging Holding Co.* | 2,279 | 13,492 | ||||||
Myers Industries, Inc. | 837 | 12,413 | ||||||
UFP Technologies, Inc.* | 744 | 12,350 | ||||||
|
| |||||||
Total Containers & Packaging | 65,414 | |||||||
|
| |||||||
Distributors - 0.3% |
| |||||||
Core-Mark Holding Co., Inc. | 681 | 32,600 | ||||||
Pool Corp. | 136 | 5,728 | ||||||
VOXX International Corp.* | 761 | 4,733 | ||||||
Weyco Group, Inc. | 233 | 5,471 | ||||||
|
| |||||||
Total Distributors | 48,532 | |||||||
|
| |||||||
Diversified Consumer Services - 0.9% |
| |||||||
American Public Education, Inc.* | 159 | 5,792 | ||||||
Ascent Capital Group, Inc. — Series A* | 119 | 7,075 | ||||||
Bridgepoint Education, Inc.* | 559 | 5,590 | ||||||
Capella Education Co.* | 162 | 5,058 | ||||||
Career Education Corp.* | 1,524 | 5,182 | ||||||
Carriage Services, Inc. | 587 | 6,240 | ||||||
Coinstar, Inc.* | 127 | 5,961 | ||||||
Collectors Universe | 398 | 4,776 | ||||||
Corinthian Colleges, Inc.* | 2,304 | 6,290 | ||||||
Education Management Corp.* | 1,709 | 5,435 | ||||||
Grand Canyon Education, Inc.* | 246 | 5,353 | ||||||
Hillenbrand, Inc. | 303 | 6,202 | ||||||
K12, Inc.* | 280 | 5,732 | ||||||
Lincoln Educational Services Corp. | 1,342 | 4,979 | ||||||
Mac-Gray Corp. | 462 | 6,006 | ||||||
Matthews International Corp. — Class A | 186 | 5,351 | ||||||
| 84 | GUGGENHEIM ETFS ANNUAL REPORT | See Notes to Financial Statements. |
Table of Contents
| SCHEDULE OF INVESTMENTS (continued) | October 31, 2012 |
GUGGENHEIM RUSSELL 2000® EQUAL WEIGHT ETF
| SHARES | VALUE | |||||||
National American University Holdings, Inc. | 1,206 | $ | 4,945 | |||||
Regis Corp. | 305 | 5,081 | ||||||
Sotheby’s | 180 | 5,603 | ||||||
Steiner Leisure Ltd.* | 119 | 5,226 | ||||||
Stewart Enterprises, Inc. — Class A | 685 | 5,322 | ||||||
Strayer Education, Inc. | 90 | 5,171 | ||||||
Universal Technical Institute, Inc. | 423 | 5,423 | ||||||
|
| |||||||
Total Diversified Consumer Services | 127,793 | |||||||
|
| |||||||
Diversified Financial Services - 0.3% |
| |||||||
California First National Bancorp | 203 | 3,709 | ||||||
Gain Capital Holdings, Inc. | 721 | 3,316 | ||||||
MarketAxess Holdings, Inc. | 108 | 3,374 | ||||||
Marlin Business Services Corp. | 304 | 6,867 | ||||||
MicroFinancial, Inc. | 676 | 5,327 | ||||||
NewStar Financial, Inc.* | 294 | 3,675 | ||||||
PHH Corp.* | 312 | 6,493 | ||||||
PICO Holdings, Inc.* | 152 | 3,365 | ||||||
Resource America, Inc. — Class A | 521 | 3,522 | ||||||
|
| |||||||
Total Diversified Financial Services | 39,648 | |||||||
|
| |||||||
Diversified Telecommunication Services - 2.9% |
| |||||||
8x8, Inc.* | 4,403 | 28,840 | ||||||
Atlantic Tele-Network, Inc. | 690 | 28,594 | ||||||
Cbeyond, Inc.* | 3,058 | 23,424 | ||||||
Cincinnati Bell, Inc.* | 5,215 | 27,170 | ||||||
Cogent Communications Group, Inc. | 1,338 | 29,048 | ||||||
Consolidated Communications Holdings, Inc. | 1,673 | 25,831 | ||||||
General Communication, Inc. — Class A* | 2,918 | 25,503 | ||||||
Hawaiian Telcom Holdco, Inc.* | 1,641 | 28,012 | ||||||
inContact, Inc.* | 4,582 | 26,392 | ||||||
Iridium Communications, Inc.* | 3,757 | 27,764 | ||||||
magicJack VocalTec Ltd.* | 1,225 | 24,929 | ||||||
Neutral Tandem, Inc. | 3,093 | 14,290 | ||||||
Premiere Global Services, Inc.* | 3,070 | 26,095 | ||||||
Primus Telecommunications Group, Inc. | 1,940 | 28,382 | ||||||
Towerstream Corp.*,a | 7,523 | 26,481 | ||||||
Vonage Holdings Corp.* | 12,845 | 29,158 | ||||||
|
| |||||||
Total Diversified Telecommunication Services | 419,913 | |||||||
|
| |||||||
Electric Utilities - 2.5% |
| |||||||
Allete, Inc. | 699 | 29,092 | ||||||
Cleco Corp. | 696 | 30,032 | ||||||
El Paso Electric Co. | 852 | 28,960 | ||||||
Empire District Electric Co. (The) | 1,357 | 29,460 | ||||||
IDACORP, Inc. | 678 | 30,320 | ||||||
MGE Energy, Inc. | 543 | 28,584 | ||||||
Otter Tail Corp. | 1,230 | 29,680 | ||||||
PNM Resources, Inc. | 1,398 | 30,980 | ||||||
Portland General Electric Co. | 1,080 | 29,592 | ||||||
UIL Holdings Corp. | 830 | 30,021 | ||||||
Unitil Corp. | 1,076 | 28,611 | ||||||
| SHARES | VALUE | |||||||
UNS Energy Corp. | 700 | $ | 29,848 | |||||
|
| |||||||
Total Electric Utilities | 355,180 | |||||||
|
| |||||||
Electrical Equipment - 1.2% |
| |||||||
Acuity Brands, Inc. | 210 | 13,587 | ||||||
American Superconductor Corp.* | 1,643 | 5,898 | ||||||
AZZ, Inc. | 183 | 7,218 | ||||||
Belden, Inc. | 359 | 12,852 | ||||||
Brady Corp. — Class A | 215 | 6,613 | ||||||
Capstone Turbine Corp.* | 14,826 | 14,826 | ||||||
Coleman Cable, Inc. | 667 | 6,330 | ||||||
Encore Wire Corp. | 459 | 14,165 | ||||||
EnerSys* | 180 | 6,206 | ||||||
Franklin Electric Co., Inc. | 105 | 6,084 | ||||||
FuelCell Energy, Inc.*,a | 17,212 | 16,016 | ||||||
Generac Holdings, Inc. | 275 | 9,350 | ||||||
Global Power Equipment Group, Inc. | 340 | 5,746 | ||||||
II-VI, Inc.* | 293 | 4,837 | ||||||
LSI Industries, Inc. | 1,956 | 13,262 | ||||||
Powell Industries, Inc.* | 165 | 6,564 | ||||||
Preformed Line Products Co. | 122 | 6,572 | ||||||
Thermon Group Holdings, Inc.* | 259 | 6,434 | ||||||
Vicor Corp.* | 980 | 6,252 | ||||||
|
| |||||||
Total Electrical Equipment | 168,812 | |||||||
|
| |||||||
Electronic Equipment, Instruments & Components - 1.9% |
| |||||||
Aeroflex Holding Corp.* | 839 | 5,336 | ||||||
Agilysys, Inc.* | 643 | 5,253 | ||||||
Anixter International, Inc. | 96 | 5,628 | ||||||
Audience, Inc.* | 877 | 6,599 | ||||||
Badger Meter, Inc. | 171 | 7,326 | ||||||
Benchmark Electronics, Inc.* | 348 | 5,157 | ||||||
Checkpoint Systems, Inc.* | 669 | 5,432 | ||||||
Cognex Corp. | 159 | 5,797 | ||||||
Coherent, Inc.* | 115 | 5,250 | ||||||
CTS Corp. | 551 | 4,562 | ||||||
Daktronics, Inc. | 582 | 5,104 | ||||||
DTS, Inc.* | 246 | 5,161 | ||||||
Echelon Corp.* | 1,548 | 5,124 | ||||||
Electro Rent Corp. | 360 | 5,659 | ||||||
Electro Scientific Industries, Inc. | 439 | 4,689 | ||||||
Fabrinet* | 468 | 4,507 | ||||||
FARO Technologies, Inc.* | 154 | 6,191 | ||||||
FEI Co. | 104 | 5,725 | ||||||
GSI Group, Inc.* | 611 | 4,747 | ||||||
Insight Enterprises, Inc.* | 302 | 4,883 | ||||||
InvenSense, Inc.* | 455 | 5,096 | ||||||
Kemet Corp.* | 1,268 | 5,757 | ||||||
Key Tronic Corp.* | 542 | 6,152 | ||||||
Littelfuse, Inc. | 113 | 6,057 | ||||||
Maxwell Technologies, Inc.* | 782 | 5,091 | ||||||
Measurement Specialties, Inc.* | 192 | 6,261 | ||||||
Mercury Computer Systems, Inc.* | 522 | 4,278 | ||||||
Mesa Laboratories, Inc. | 133 | 6,486 | ||||||
Methode Electronics, Inc. | 549 | 5,556 | ||||||
| See Notes to Financial Statements. | GUGGENHEIM ETFS ANNUAL REPORT | 85 |
Table of Contents
| SCHEDULE OF INVESTMENTS (continued) | October 31, 2012 |
GUGGENHEIM RUSSELL 2000® EQUAL WEIGHT ETF
| SHARES | VALUE | |||||||
MTS Systems Corp. | 122 | $ | 6,150 | |||||
Multi-Fineline Electronix, Inc.* | 249 | 5,264 | ||||||
Neonode, Inc.* | 1,506 | 5,708 | ||||||
Newport Corp.* | �� | 484 | 5,237 | |||||
OSI Systems, Inc.* | 84 | 6,657 | ||||||
Park Electrochemical Corp. | 215 | 5,336 | ||||||
PC Connection, Inc. | 467 | 4,805 | ||||||
Plexus Corp.* | 175 | 4,709 | ||||||
Power-One, Inc.* | 1,118 | 4,506 | ||||||
Radisys Corp.* | 1,553 | 4,411 | ||||||
RealD, Inc.* | 639 | 5,975 | ||||||
Richardson Electronics Ltd. | 463 | 5,394 | ||||||
Rofin-Sinar Technologies, Inc.* | 271 | 4,935 | ||||||
Rogers Corp.* | 128 | 5,044 | ||||||
Sanmina-SCI Corp.* | 606 | 5,387 | ||||||
Scansource, Inc.* | 170 | 4,972 | ||||||
SYNNEX Corp.* | 161 | 5,215 | ||||||
TTM Technologies, Inc.* | 576 | 5,184 | ||||||
Universal Display Corp.* | 155 | 5,081 | ||||||
Viasystems Group, Inc.* | 325 | 4,976 | ||||||
Vishay Precision Group, Inc.* | 451 | 5,886 | ||||||
Zygo Corp.* | 340 | 6,331 | ||||||
|
| |||||||
Total Electronic Equipment, Instruments & Components | 276,027 | |||||||
|
| |||||||
Energy Equipment & Services - 3.0% |
| |||||||
Basic Energy Services, Inc.* | 1,325 | 13,767 | ||||||
Bolt Technology Corp. | 1,025 | 14,760 | ||||||
Bristow Group, Inc. | 124 | 6,190 | ||||||
C&J Energy Services, Inc.* | 717 | 13,896 | ||||||
Cal Dive International, Inc.*,a | 8,913 | 11,230 | ||||||
Dawson Geophysical Co.* | 611 | 14,597 | ||||||
Dril-Quip, Inc.* | 208 | 14,406 | ||||||
Exterran Holdings, Inc.* | 760 | 15,185 | ||||||
Forum Energy Technologies, Inc.* | 611 | 13,631 | ||||||
Geospace Technologies Corp.* | 258 | 16,700 | ||||||
Global Geophysical Services, Inc.* | 2,560 | 11,827 | ||||||
Gulf Island Fabrication, Inc. | 525 | 12,458 | ||||||
Gulfmark Offshore, Inc. — Class A* | 194 | 6,270 | ||||||
Heckmann Corp.*,a | 3,557 | 12,450 | ||||||
Helix Energy Solutions Group, Inc.* | 801 | 13,849 | ||||||
Hercules Offshore, Inc.* | 3,069 | 14,609 | ||||||
Hornbeck Offshore Services, Inc.* | 402 | 13,925 | ||||||
ION Geophysical Corp.* | 2,155 | 13,921 | ||||||
Key Energy Services, Inc.* | 2,100 | 13,734 | ||||||
Lufkin Industries, Inc. | 264 | 13,203 | ||||||
Matrix Service Co.* | 1,399 | 14,676 | ||||||
Mitcham Industries, Inc.* | 889 | 12,046 | ||||||
Natural Gas Services Group, Inc.* | 1,002 | 15,892 | ||||||
Newpark Resources, Inc.* | 2,029 | 13,777 | ||||||
Parker Drilling Co.* | 3,491 | 15,116 | ||||||
PHI, Inc.* | 201 | 6,289 | ||||||
Pioneer Energy Services Corp.* | 1,800 | 11,880 | ||||||
RigNet, Inc.* | 814 | 15,116 | ||||||
Tesco Corp.* | 1,378 | 12,140 | ||||||
| SHARES | VALUE | |||||||
Tetra Technologies, Inc.* | 2,411 | $ | 12,899 | |||||
TGC Industries, Inc.* | 2,112 | 15,544 | ||||||
Vantage Drilling Co.* | 8,273 | 15,222 | ||||||
Willbros Group, Inc.* | 2,698 | 13,787 | ||||||
|
| |||||||
Total Energy Equipment & Services | 434,992 | |||||||
|
| |||||||
Food & Staples Retailing - 3.0% |
| |||||||
Andersons, Inc.(The) | 855 | 33,584 | ||||||
Casey’s General Stores, Inc. | 553 | 28,507 | ||||||
Chefs’ Warehouse, Inc.(The)* | 1,891 | 29,197 | ||||||
Harris Teeter Supermarkets, Inc. | 803 | 30,072 | ||||||
Ingles Markets, Inc. — Class A | 1,927 | 31,217 | ||||||
Nash Finch Co. | 1,463 | 28,134 | ||||||
Pantry, Inc.(The)* | 2,129 | 28,241 | ||||||
Pricesmart, Inc. | 74 | 6,141 | ||||||
Rite Aid Corp.* | 25,754 | 29,875 | ||||||
Spartan Stores, Inc. | 2,018 | 28,979 | ||||||
SUPERVALU, Inc.a | 13,310 | 41,394 | ||||||
Susser Holdings Corp.* | 852 | 30,621 | ||||||
United Natural Foods, Inc.* | 532 | 28,324 | ||||||
Village Super Market, Inc. — Class A | 837 | 30,693 | ||||||
Weis Markets, Inc. | 744 | 30,623 | ||||||
|
| |||||||
Total Food & Staples Retailing | 435,602 | |||||||
|
| |||||||
Food Products - 4.2% |
| |||||||
Annie’s, Inc.* | 692 | 27,334 | ||||||
B&G Foods, Inc. | 996 | 30,149 | ||||||
Cal-Maine Foods, Inc. | 711 | 30,665 | ||||||
Calavo Growers, Inc. | 1,328 | 31,354 | ||||||
Chiquita Brands International, Inc.* | 4,077 | 29,395 | ||||||
Darling International, Inc.* | 352 | 5,819 | ||||||
Diamond Foods, Inc.a | 1,570 | 29,076 | ||||||
Dole Food Co., Inc.*,a | 2,259 | 28,441 | ||||||
Fresh Del Monte Produce, Inc. | 1,245 | 31,337 | ||||||
Griffin Land & Nurseries, Inc. | 107 | 2,777 | ||||||
Hain Celestial Group, Inc.(The)* | 502 | 29,016 | ||||||
J&J Snack Foods Corp. | 552 | 31,613 | ||||||
Lancaster Colony Corp. | 431 | 31,368 | ||||||
Pilgrim’s Pride Corp.* | 6,335 | 35,666 | ||||||
Post Holdings, Inc.* | 1,099 | 34,673 | ||||||
Sanderson Farms, Inc. | 726 | 32,880 | ||||||
Seneca Foods Corp. — Class A* | 1,049 | 29,986 | ||||||
Smart Balance, Inc.* | 2,642 | 31,440 | ||||||
Snyders-Lance, Inc. | 1,263 | 32,004 | ||||||
Tootsie Roll Industries, Inc.a | 1,187 | 31,634 | ||||||
TreeHouse Foods, Inc.* | 605 | 32,398 | ||||||
|
| |||||||
Total Food Products | 599,025 | |||||||
|
| |||||||
Gas Utilities - 1.6% |
| |||||||
Chesapeake Utilities Corp. | 620 | 29,121 | ||||||
Laclede Group, Inc.(The) | 689 | 28,690 | ||||||
New Jersey Resources Corp. | 632 | 28,099 | ||||||
Northwest Natural Gas Co. | 602 | 28,011 | ||||||
Piedmont Natural Gas Co., Inc. | 891 | 28,396 | ||||||
South Jersey Industries, Inc. | 554 | 28,027 | ||||||
Southwest Gas Corp. | 663 | 28,821 | ||||||
| 86 | GUGGENHEIM ETFS ANNUAL REPORT | See Notes to Financial Statements. |
Table of Contents
| SCHEDULE OF INVESTMENTS (continued) | October 31, 2012 |
GUGGENHEIM RUSSELL 2000® EQUAL WEIGHT ETF
| SHARES | VALUE | |||||||
WGL Holdings, Inc. | 726 | $ | 28,873 | |||||
|
| |||||||
Total Gas Utilities | 228,038 | |||||||
|
| |||||||
Health Care Equipment & Supplies - 2.9% |
| |||||||
Abaxis, Inc.* | 171 | 6,289 | ||||||
ABIOMED, Inc.* | 280 | 5,550 | ||||||
Accuray, Inc.* | 883 | 6,146 | ||||||
Align Technology, Inc.* | 167 | 4,439 | ||||||
Alphatec Holdings, Inc.* | 3,813 | 6,558 | ||||||
Analogic Corp. | 77 | 5,672 | ||||||
AngioDynamics, Inc.* | 491 | 5,268 | ||||||
Anika Therapeutics, Inc.* | 397 | 4,450 | ||||||
Antares Pharma, Inc.* | 1,378 | 5,250 | ||||||
Arthrocare Corp.* | 192 | 5,775 | ||||||
AtriCure, Inc.* | 801 | 5,142 | ||||||
Atrion Corp. | 28 | 5,691 | ||||||
Cantel Medical Corp. | 223 | 5,800 | ||||||
Cardiovascular Systems, Inc.* | 563 | 6,576 | ||||||
Cerus Corp.* | 1,839 | 5,719 | ||||||
Conceptus, Inc.* | 305 | 5,746 | ||||||
CONMED Corp. | 220 | 6,085 | ||||||
CryoLife, Inc. | 939 | 5,812 | ||||||
Cyberonics, Inc.* | 119 | 5,504 | ||||||
Cynosure, Inc. — Class A* | 233 | 6,137 | ||||||
Derma Sciences, Inc.* | 602 | 6,797 | ||||||
DexCom, Inc.* | 419 | 5,489 | ||||||
Endologix, Inc.* | 443 | 5,963 | ||||||
EnteroMedics, Inc.* | 1,539 | 4,632 | ||||||
Exactech, Inc.* | 357 | 5,962 | ||||||
Globus Medical, Inc.* | 372 | 6,384 | ||||||
Greatbatch, Inc.* | 252 | 5,539 | ||||||
Haemonetics Corp.* | 77 | 6,291 | ||||||
Hansen Medical, Inc.*,a | 3,221 | 7,312 | ||||||
HeartWare International, Inc.* | 66 | 5,543 | ||||||
ICU Medical, Inc.* | 105 | 6,230 | ||||||
Insulet Corp.* | 284 | 6,024 | ||||||
Integra LifeSciences Holdings Corp.* | 147 | 5,623 | ||||||
Invacare Corp. | 416 | 5,678 | ||||||
IRIS International, Inc.* | 319 | 6,217 | ||||||
MAKO Surgical Corp.* | 349 | 5,287 | ||||||
Masimo Corp.* | 253 | 5,558 | ||||||
Meridian Bioscience, Inc. | 326 | 6,438 | ||||||
Merit Medical Systems, Inc.* | 415 | 5,993 | ||||||
Natus Medical, Inc.* | 475 | 5,367 | ||||||
Navidea Biopharmaceuticals, Inc.*,a | 2,045 | 5,726 | ||||||
Neogen Corp.* | 145 | 6,205 | ||||||
NuVasive, Inc.* | 275 | 3,965 | ||||||
NxStage Medical, Inc.* | 491 | 5,499 | ||||||
OraSure Technologies, Inc.* | 585 | 5,300 | ||||||
Orthofix International NV* | 140 | 5,552 | ||||||
Palomar Medical Technologies, Inc.* | 647 | 5,584 | ||||||
PhotoMedex, Inc.* | 2,292 | 30,506 | ||||||
Quidel Corp.* | 337 | 5,908 | ||||||
Rochester Medical Corp.* | 518 | 5,434 | ||||||
Rockwell Medical Technologies, Inc.* | 783 | 5,630 | ||||||
| SHARES | VALUE | |||||||
RTI Biologics, Inc.* | 1,512 | $ | 6,139 | |||||
Solta Medical, Inc.* | 1,999 | 5,897 | ||||||
Spectranetics Corp.* | 435 | 6,334 | ||||||
Staar Surgical Co.* | 840 | 5,410 | ||||||
STERIS Corp. | 174 | 6,196 | ||||||
SurModics, Inc.* | 300 | 5,394 | ||||||
Symmetry Medical, Inc.* | 639 | 5,853 | ||||||
Tornier NV* | 326 | 5,575 | ||||||
Unilife Corp.*,a | 2,005 | 5,494 | ||||||
Utah Medical Products, Inc. | 184 | 6,260 | ||||||
Vascular Solutions, Inc.* | 436 | 6,571 | ||||||
Volcano Corp.* | 219 | 6,268 | ||||||
West Pharmaceutical Services, Inc. | 119 | 6,411 | ||||||
Wright Medical Group, Inc.* | 285 | 5,791 | ||||||
Young Innovations, Inc. | 162 | 5,532 | ||||||
Zeltiq Aesthetics, Inc.* | 1,031 | 6,000 | ||||||
|
| |||||||
Total Health Care Equipment & Supplies | 412,370 | |||||||
|
| |||||||
Health Care Providers & Services - 2.1% | ||||||||
Acadia Healthcare Co., Inc.* | 270 | 5,554 | ||||||
Accretive Health, Inc.* | 567 | 6,685 | ||||||
Air Methods Corp.* | 52 | 5,701 | ||||||
Almost Family, Inc.* | 289 | 5,991 | ||||||
Amedisys, Inc.* | 429 | 4,736 | ||||||
AMN Healthcare Services, Inc.* | 691 | 6,855 | ||||||
Amsurg Corp.* | 219 | 6,246 | ||||||
Assisted Living Concepts, Inc. — Class A | 818 | 6,470 | ||||||
Bio-Reference Labs, Inc.* | 222 | 6,163 | ||||||
BioScrip, Inc.* | 695 | 6,401 | ||||||
Capital Senior Living Corp.* | 442 | 7,107 | ||||||
Centene Corp.* | 171 | 6,495 | ||||||
Chemed Corp. | 89 | 5,985 | ||||||
Chindex International, Inc.* | 584 | 6,056 | ||||||
CorVel Corp.* | 138 | 5,869 | ||||||
Cross Country Healthcare, Inc.* | 1,331 | 5,856 | ||||||
Emeritus Corp.* | 295 | 6,623 | ||||||
Ensign Group, Inc.(The) | 207 | 6,036 | ||||||
ExamWorks Group, Inc.* | 425 | 5,959 | ||||||
Five Star Quality Care, Inc.* | 1,219 | 6,412 | ||||||
Gentiva Health Services, Inc.* | 524 | 4,926 | ||||||
Hanger, Inc.* | 224 | 5,678 | ||||||
HealthSouth Corp.* | 259 | 5,732 | ||||||
Healthways, Inc.* | 534 | 5,196 | ||||||
HMS Holdings Corp.* | 194 | 4,479 | ||||||
IPC The Hospitalist Co., Inc.* | 133 | 4,587 | ||||||
Kindred Healthcare, Inc.* | 541 | 5,302 | ||||||
Landauer, Inc. | 105 | 6,085 | ||||||
LHC Group, Inc.* | 337 | 5,904 | ||||||
Magellan Health Services, Inc.* | 124 | 6,219 | ||||||
Metropolitan Health Networks, Inc.* | 702 | 7,673 | ||||||
Molina Healthcare, Inc.* | 255 | 6,393 | ||||||
MWI Veterinary Supply, Inc.* | 58 | 6,091 | ||||||
National Healthcare Corp. | 129 | 6,143 | ||||||
National Research Corp. | 123 | 6,234 | ||||||
| See Notes to Financial Statements. | GUGGENHEIM ETFS ANNUAL REPORT | 87 |
Table of Contents
| SCHEDULE OF INVESTMENTS (continued) | October 31, 2012 |
GUGGENHEIM RUSSELL 2000® EQUAL WEIGHT ETF
| SHARES | VALUE | |||||||
Owens & Minor, Inc. | 206 | $ | 5,865 | |||||
PDI, Inc.* | 822 | 5,631 | ||||||
PharMerica Corp.* | 487 | 5,951 | ||||||
Providence Service Corp.(The)* | 489 | 4,988 | ||||||
PSS World Medical, Inc.* | 270 | 7,727 | ||||||
Select Medical Holdings Corp.* | 560 | 5,930 | ||||||
Skilled Healthcare Group, Inc. — Class A* | 910 | 7,071 | ||||||
Sun Healthcare Group, Inc.* | 735 | 6,218 | ||||||
Sunrise Senior Living, Inc.* | 436 | 6,274 | ||||||
Team Health Holdings, Inc.* | 230 | 6,120 | ||||||
Triple-S Management Corp. — Class B* | 299 | 5,394 | ||||||
Universal American Corp.* | 658 | 5,948 | ||||||
US Physical Therapy, Inc. | 228 | 6,088 | ||||||
Vanguard Health Systems, Inc.* | 511 | 4,946 | ||||||
WellCare Health Plans, Inc.* | 109 | 5,188 | ||||||
|
| |||||||
Total Health Care Providers & Services | 299,181 | |||||||
|
| |||||||
Health Care Technology - 0.5% | ||||||||
athenahealth, Inc.* | 70 | 4,500 | ||||||
Computer Programs & Systems, Inc. | 113 | 5,516 | ||||||
Epocrates, Inc.* | 570 | 5,575 | ||||||
Greenway Medical Technologies* | 382 | 6,337 | ||||||
HealthStream, Inc.* | 191 | 4,878 | ||||||
MedAssets, Inc.* | 364 | 6,454 | ||||||
Medidata Solutions, Inc.* | 153 | 6,429 | ||||||
Mediware Information Systems* | 284 | 6,231 | ||||||
Merge Healthcare, Inc.* | 1,640 | 5,592 | ||||||
Omnicell, Inc.* | 451 | 6,576 | ||||||
Quality Systems, Inc. | 337 | 5,881 | ||||||
Vocera Communications, Inc.* | 179 | 4,813 | ||||||
|
| |||||||
Total Health Care Technology | 68,782 | |||||||
|
| |||||||
Hotels, Restaurants & Leisure - 2.3% |
| |||||||
AFC Enterprises, Inc.* | 225 | 5,697 | ||||||
Ameristar Casinos, Inc. | 317 | 5,785 | ||||||
Biglari Holdings, Inc.* | 15 | 5,304 | ||||||
BJ’s Restaurants, Inc.* | 128 | 4,230 | ||||||
Bloomin’ Brands, Inc.* | 369 | 5,044 | ||||||
Bluegreen Corp.* | 899 | 5,331 | ||||||
Bob Evans Farms, Inc. | 142 | 5,406 | ||||||
Boyd Gaming Corp.* | 847 | 5,226 | ||||||
Bravo Brio Restaurant Group, Inc.* | 378 | 4,990 | ||||||
Buffalo Wild Wings, Inc.* | 68 | 5,165 | ||||||
Caesars Entertainment Corp.* | 843 | 4,881 | ||||||
Caribou Coffee Co., Inc.* | 409 | 4,896 | ||||||
Carrols Restaurant Group, Inc.* | 939 | 6,028 | ||||||
CEC Entertainment, Inc. | 184 | 5,704 | ||||||
Cheesecake Factory, Inc.(The) | 159 | 5,257 | ||||||
Churchill Downs, Inc. | 93 | 6,076 | ||||||
Chuy’s Holdings, Inc.* | 248 | 6,059 | ||||||
Cracker Barrel Old Country Store, Inc. | 84 | 5,347 | ||||||
Del Frisco’s Restaurant Group, Inc.* | 375 | 5,550 | ||||||
Denny’s Corp.* | 1,115 | 5,129 | ||||||
DineEquity, Inc.* | 99 | 6,207 | ||||||
Domino’s Pizza, Inc. | 157 | 6,377 | ||||||
| SHARES | VALUE | |||||||
Einstein Noah Restaurant Group, Inc. | 320 | $ | 4,938 | |||||
Fiesta Restaurant Group, Inc.* | 347 | 4,587 | ||||||
Frisch’s Restaurants, Inc. | 265 | 4,738 | ||||||
Ignite Restaurant Group, Inc.* | 393 | 4,504 | ||||||
International Speedway Corp. — Class A | 197 | 5,024 | ||||||
Interval Leisure Group, Inc. | 299 | 5,699 | ||||||
Isle of Capri Casinos, Inc.* | 816 | 4,961 | ||||||
Jack in the Box, Inc.* | 199 | 5,176 | ||||||
Jamba, Inc.* | 2,477 | 5,425 | ||||||
Krispy Kreme Doughnuts, Inc.* | 724 | 5,379 | ||||||
Life Time Fitness, Inc.* | 124 | 5,566 | ||||||
Luby’s, Inc.* | 840 | 5,368 | ||||||
Marcus Corp. | 511 | 5,570 | ||||||
Marriott Vacations Worldwide Corp.* | 158 | 6,216 | ||||||
Monarch Casino & Resort, Inc.* | 696 | 6,348 | ||||||
Morgans Hotel Group Co.* | 923 | 5,953 | ||||||
MTR Gaming Group, Inc.* | 1,323 | 4,617 | ||||||
Multimedia Games Holding Co., Inc.* | 364 | 5,788 | ||||||
Nathan’s Famous, Inc.* | 177 | 4,905 | ||||||
Orient-Express Hotels Ltd. — Class A* | 636 | 7,460 | ||||||
Papa John’s International, Inc.* | 107 | 5,705 | ||||||
Pinnacle Entertainment, Inc.* | 460 | 5,870 | ||||||
Premier Exhibitions, Inc.* | 2,372 | 6,499 | ||||||
Red Lion Hotels Corp.* | 880 | 5,799 | ||||||
Red Robin Gourmet Burgers, Inc.* | 175 | 5,845 | ||||||
Ruby Tuesday, Inc.* | 773 | 5,581 | ||||||
Ruth’s Hospitality Group, Inc* | 872 | 5,799 | ||||||
Ryman Hospitality Properties* | 145 | 5,656 | ||||||
Scientific Games Corp. — Class A* | 712 | 5,860 | ||||||
SHFL Entertainment, Inc.* | 363 | 5,129 | ||||||
Six Flags Entertainment Corp. | 95 | 5,425 | ||||||
Sonic Corp.* | 534 | 5,324 | ||||||
Speedway Motorsports, Inc. | 354 | 5,770 | ||||||
Texas Roadhouse, Inc. | 329 | 5,356 | ||||||
Town Sports International Holdings, Inc.* | 443 | 5,582 | ||||||
Vail Resorts, Inc. | 99 | 5,621 | ||||||
WMS Industries, Inc.* | 354 | 5,816 | ||||||
|
| |||||||
Total Hotels, Restaurants & Leisure | 324,548 | |||||||
|
| |||||||
Household Durables - 1.0% |
| |||||||
American Greetings Corp. — Class A | 392 | 6,731 | ||||||
Bassett Furniture Industries, Inc. | 454 | 5,207 | ||||||
Beazer Homes USA, Inc.* | 308 | 5,079 | ||||||
Blyth, Inc. | 173 | 3,951 | ||||||
Cavco Industries, Inc.* | 122 | 5,898 | ||||||
CSS Industries, Inc. | 267 | 5,367 | ||||||
Ethan Allen Interiors, Inc. | 242 | 7,117 | ||||||
Flexsteel Industries, Inc. | 271 | 5,455 | ||||||
Helen of Troy Ltd.* | 174 | 5,258 | ||||||
Hooker Furniture Corp. | 429 | 5,852 | ||||||
Hovnanian Enterprises, Inc. — Class A* | 1,549 | 6,661 | ||||||
iRobot Corp.* | 238 | 4,277 | ||||||
KB Home | 390 | 6,232 | ||||||
La-Z-Boy, Inc.* | 389 | 6,310 | ||||||
| 88 | GUGGENHEIM ETFS ANNUAL REPORT | See Notes to Financial Statements. |
Table of Contents
| SCHEDULE OF INVESTMENTS (continued) | October 31, 2012 |
GUGGENHEIM RUSSELL 2000® EQUAL WEIGHT ETF
| SHARES | VALUE | |||||||
Libbey, Inc.* | 362 | $ | 6,498 | |||||
Lifetime Brands, Inc. | 465 | 5,162 | ||||||
M/I Homes, Inc.* | 267 | 5,941 | ||||||
MDC Holdings, Inc. | 142 | 5,430 | ||||||
Meritage Homes Corp.* | 137 | 5,066 | ||||||
NACCO Industries, Inc. — Class A | 57 | 2,886 | ||||||
Ryland Group, Inc.(The) | 177 | 5,995 | ||||||
Sealy Corp.*,a | 2,627 | 5,858 | ||||||
Skullcandy, Inc.* | 439 | 5,316 | ||||||
Standard Pacific Corp.* | 786 | 5,423 | ||||||
Universal Electronics, Inc.* | 331 | 5,680 | ||||||
Zagg, Inc.* | 634 | 4,552 | ||||||
|
| |||||||
Total Household Durables | 143,202 | |||||||
|
| |||||||
Household Products - 0.7% |
| |||||||
Central Garden & Pet Co. — Class A* | 463 | 5,218 | ||||||
Harbinger Group, Inc.* | 1,554 | 13,598 | ||||||
Oil-Dri Corp. of America | 576 | 12,902 | ||||||
Spectrum Brands Holdings, Inc.* | 792 | 36,028 | ||||||
WD-40 Co. | 595 | 28,477 | ||||||
|
| |||||||
Total Household Products | 96,223 | |||||||
|
| |||||||
Independent Power Producers & Energy Traders - 0.6% |
| |||||||
Atlantic Power Corp. | 1,974 | 29,650 | ||||||
GenOn Energy, Inc.* | 11,313 | 29,074 | ||||||
Ormat Technologies, Inc. | 1,541 | 29,325 | ||||||
|
| |||||||
Total Independent Power Producers & Energy Traders | 88,049 | |||||||
|
| |||||||
Industrial Conglomerates - 0.3% |
| |||||||
Raven Industries, Inc. | 212 | 5,785 | ||||||
Seaboard Corp.* | 14 | 31,939 | ||||||
Standex International Corp. | 142 | 6,566 | ||||||
|
| |||||||
Total Industrial Conglomerates | 44,290 | |||||||
|
| |||||||
Insurance - 1.3% |
| |||||||
Alterra Capital Holdings Ltd. | 144 | 3,518 | ||||||
American Equity Investment Life Holding Co. | 300 | 3,453 | ||||||
American Safety Insurance Holdings Ltd.* | 185 | 3,119 | ||||||
AMERISAFE, Inc.* | 132 | 3,465 | ||||||
Amtrust Financial Services, Inc. | 137 | 3,315 | ||||||
Argo Group International Holdings Ltd. | 109 | 3,750 | ||||||
Baldwin & Lyons, Inc. — Class B | 146 | 3,555 | ||||||
Citizens, Inc.* | 329 | 3,353 | ||||||
CNO Financial Group, Inc. | 364 | 3,487 | ||||||
Crawford & Co. — Class B | 697 | 3,840 | ||||||
Donegal Group, Inc. — Class A | 247 | 3,201 | ||||||
Eastern Insurance Holdings, Inc. | 209 | 3,515 | ||||||
eHealth, Inc.* | 192 | 4,166 | ||||||
EMC Insurance Group, Inc. | 176 | 3,939 | ||||||
Employers Holdings, Inc. | 185 | 3,376 | ||||||
Enstar Group Ltd.* | 34 | 3,400 | ||||||
FBL Financial Group, Inc. — Class A | 104 | 3,550 | ||||||
First American Financial Corp. | 157 | 3,572 | ||||||
Flagstone Reinsurance Holdings SA | 408 | 3,607 | ||||||
| SHARES | VALUE | |||||||
Fortegra Financial Corp.* | 425 | $ | 3,774 | |||||
Global Indemnity PLC* | 158 | 3,504 | ||||||
Greenlight Capital Re, Ltd. — Class A* | 139 | 3,551 | ||||||
Hallmark Financial Services* | 437 | 3,334 | ||||||
Hilltop Holdings, Inc.* | 279 | 3,792 | ||||||
Homeowners Choice, Inc. | 150 | 3,330 | ||||||
Horace Mann Educators Corp. | 192 | 3,688 | ||||||
Independence Holding Co. | 341 | 2,980 | ||||||
Infinity Property & Casualty Corp. | 56 | 3,198 | ||||||
Investors Title Co. | 53 | 3,477 | ||||||
Kansas City Life Insurance Co. | 90 | 3,271 | ||||||
Maiden Holdings Ltd. | 387 | 3,270 | ||||||
Meadowbrook Insurance Group, Inc. | 442 | 2,484 | ||||||
Montpelier Re Holdings Ltd. | 155 | 3,545 | ||||||
National Financial Partners Corp.* | 208 | 3,817 | ||||||
National Interstate Corp. | 135 | 3,503 | ||||||
National Western Life Insurance | 24 | 3,369 | ||||||
Navigators Group, Inc.(The)* | 70 | 3,716 | ||||||
OneBeacon Insurance Group | 260 | 3,510 | ||||||
Phoenix Cos., Inc.(The)* | 123 | 3,707 | ||||||
Platinum Underwriters Holdings Ltd. | 85 | 3,774 | ||||||
Presidential Life Corp. | 250 | 3,495 | ||||||
Primerica, Inc. | 120 | 3,391 | ||||||
RLI Corp. | 52 | 3,545 | ||||||
Safety Insurance Group, Inc. | 76 | 3,523 | ||||||
SeaBright Holdings, Inc. | 314 | 3,445 | ||||||
Selective Insurance Group, Inc. | 185 | 3,421 | ||||||
State Auto Financial Corp. | 210 | 3,389 | ||||||
Stewart Information Services Corp. | 173 | 4,034 | ||||||
Symetra Financial Corp. | 280 | 3,346 | ||||||
Tower Group, Inc. | 179 | 3,226 | ||||||
United Fire Group, Inc. | 137 | 3,257 | ||||||
Universal Insurance Holdings, Inc. | 906 | 3,579 | ||||||
|
| |||||||
Total Insurance | 181,426 | |||||||
|
| |||||||
Internet & Catalog Retail - 0.7% |
| |||||||
1-800-FLOWERS.COM, Inc. — Class A* | 1,495 | 5,427 | ||||||
Blue Nile, Inc.* | 154 | 5,817 | ||||||
CafePress, Inc.* | 605 | 3,588 | ||||||
Geeknet, Inc.* | 291 | 5,288 | ||||||
HSN, Inc. | 117 | 6,086 | ||||||
Kayak Software Corp.* | 168 | 5,566 | ||||||
Nutrisystem, Inc. | 521 | 5,017 | ||||||
Orbitz Worldwide, Inc.* | 2,106 | 5,202 | ||||||
Overstock.com, Inc.* | 543 | 8,188 | ||||||
PetMed Express, Inc. | 3,236 | 35,272 | ||||||
Shutterfly, Inc.* | 184 | 5,568 | ||||||
US Auto Parts Network, Inc.* | 1,584 | 4,736 | ||||||
|
| |||||||
Total Internet & Catalog Retail | 95,755 | |||||||
|
| |||||||
Internet Software & Services - 2.4% |
| |||||||
Active Network Inc.(The)* | 451 | 3,996 | ||||||
Ancestry.com, Inc.* | 186 | 5,878 | ||||||
| See Notes to Financial Statements. | GUGGENHEIM ETFS ANNUAL REPORT | 89 |
Table of Contents
| SCHEDULE OF INVESTMENTS (continued) | October 31, 2012 |
GUGGENHEIM RUSSELL 2000® EQUAL WEIGHT ETF
| SHARES | VALUE | |||||||
Angie’s List, Inc.* | 573 | $ | 6,555 | |||||
Bankrate, Inc.* | 342 | 3,670 | ||||||
Bazaarvoice, Inc.* | 364 | 4,645 | ||||||
Blucora, Inc.* | 315 | 5,528 | ||||||
Brightcove, Inc.* | 480 | 6,058 | ||||||
Carbonite, Inc.* | 777 | 6,006 | ||||||
comScore, Inc.* | 362 | 5,130 | ||||||
Constant Contact, Inc.* | 309 | 3,813 | ||||||
Cornerstone OnDemand, Inc.* | 181 | 5,066 | ||||||
CoStar Group, Inc.* | 78 | 6,466 | ||||||
DealerTrack Holdings, Inc.* | 197 | 5,384 | ||||||
Demand Media, Inc.* | 490 | 4,180 | ||||||
Demandware, Inc.* | 178 | 5,285 | ||||||
Dice Holdings, Inc.* | 761 | 6,720 | ||||||
Digital River, Inc.* | 327 | 4,689 | ||||||
E2open, Inc.* | 389 | 6,807 | ||||||
EarthLink, Inc. | 780 | 4,945 | ||||||
Envestnet, Inc.* | 472 | 6,599 | ||||||
ExactTarget, Inc.* | 239 | 5,573 | ||||||
Internap Network Services Corp.* | 759 | 5,199 | ||||||
IntraLinks Holdings, Inc.* | 861 | 4,813 | ||||||
j2 Global, Inc. | 924 | 27,757 | ||||||
Keynote Systems, Inc. | 378 | 5,402 | ||||||
KIT Digital, Inc.*,a | 1,830 | 5,087 | ||||||
Limelight Networks, Inc.* | 2,332 | 4,920 | ||||||
Liquidity Services, Inc.* | 126 | 5,195 | ||||||
LivePerson, Inc.* | 311 | 4,880 | ||||||
LogMeIn, Inc.* | 245 | 6,047 | ||||||
Marchex, Inc. — Class B | 1,540 | 6,299 | ||||||
Market Leader, Inc.* | 520 | 3,536 | ||||||
MeetMe, Inc.*,a | 1,899 | 8,033 | ||||||
Millennial Media, Inc.* | 387 | 6,204 | ||||||
Monster Worldwide, Inc.* | 882 | 5,486 | ||||||
Move, Inc.* | 669 | 5,546 | ||||||
NIC, Inc. | 378 | 5,405 | ||||||
OpenTable, Inc.* | 132 | 6,200 | ||||||
Perficient, Inc.* | 481 | 5,469 | ||||||
QuinStreet, Inc.* | 658 | 4,027 | ||||||
RealNetworks, Inc.* | 664 | 5,026 | ||||||
Responsys, Inc.* | 545 | 4,872 | ||||||
Saba Software, Inc.* | 576 | 5,806 | ||||||
SciQuest, Inc.* | 307 | 4,660 | ||||||
Spark Networks, Inc.* | 886 | 5,812 | ||||||
SPS Commerce, Inc.* | 153 | 5,546 | ||||||
Stamps.com, Inc.* | 240 | 6,605 | ||||||
support.com, Inc.* | 1,301 | 6,037 | ||||||
Synacor, Inc.* | 727 | 3,984 | ||||||
TechTarget, Inc.* | 966 | 4,617 | ||||||
Travelzoo, Inc.* | 240 | 4,284 | ||||||
United Online, Inc. | 1,007 | 5,397 | ||||||
Unwired Planet, Inc.* | 2,909 | 4,102 | ||||||
ValueClick, Inc.* | 324 | 5,401 | ||||||
VistaPrint NV* | 159 | 4,845 | ||||||
Vocus, Inc.* | 283 | 5,023 | ||||||
| SHARES | VALUE | |||||||
Web.com Group, Inc.* | 305 | $ | 4,813 | |||||
WebMD Health Corp.* | 419 | 6,247 | ||||||
XO Group, Inc.* | 672 | 5,410 | ||||||
Yelp, Inc.* | 217 | 5,230 | ||||||
Zix Corp.* | 1,946 | 5,643 | ||||||
|
| |||||||
Total Internet Software & Services | 347,858 | |||||||
|
| |||||||
IT Services - 1.2% |
| |||||||
Acxiom Corp.* | 297 | 5,420 | ||||||
CACI International, Inc. — Class A* | 104 | 5,245 | ||||||
Cardtronics, Inc.* | 118 | 3,352 | ||||||
Cass Information Systems, Inc. | 83 | 3,483 | ||||||
CIBER, Inc.* | 1,607 | 5,014 | ||||||
Computer Task Group, Inc.* | 344 | 6,416 | ||||||
Convergys Corp. | 395 | 6,640 | ||||||
CSG Systems International, Inc.* | 253 | 5,214 | ||||||
EPAM Systems, Inc.* | 293 | 5,268 | ||||||
Euronet Worldwide, Inc.* | 200 | 4,058 | ||||||
ExlService Holdings, Inc.* | 224 | 6,639 | ||||||
Forrester Research, Inc. | 219 | 6,338 | ||||||
Global Cash Access Holdings, Inc.* | 437 | 3,081 | ||||||
Hackett Group, Inc.(The)* | 1,563 | 6,080 | ||||||
Heartland Payment Systems, Inc. | 108 | 2,817 | ||||||
Higher One Holdings, Inc.* | 263 | 3,322 | ||||||
iGate Corp.* | 301 | 4,831 | ||||||
Innodata Isogen, Inc.* | 1,551 | 5,568 | ||||||
Lionbridge Technologies, Inc.* | 1,675 | 5,310 | ||||||
Mantech International Corp. — Class A | 227 | 5,214 | ||||||
Mattersight Corp.* | 921 | 5,093 | ||||||
MAXIMUS, Inc. | 109 | 6,015 | ||||||
ModusLink Global Solutions, Inc.* | 1,486 | 4,354 | ||||||
MoneyGram International, Inc.* | 229 | 3,559 | ||||||
PRGX Global, Inc.* | 746 | 5,834 | ||||||
Sapient Corp.* | 525 | 5,397 | ||||||
ServiceSource International, Inc.*,a | 623 | 5,613 | ||||||
Syntel, Inc. | 90 | 5,365 | ||||||
TeleTech Holdings, Inc.* | 374 | 6,298 | ||||||
TNS, Inc.* | 369 | 5,284 | ||||||
Unisys Corp.* | 263 | 4,484 | ||||||
Virtusa Corp.* | 309 | 5,302 | ||||||
WEX, Inc.* | 51 | 3,763 | ||||||
|
| |||||||
Total IT Services | 165,671 | |||||||
|
| |||||||
Leisure Equipment & Products - 0.4% |
| |||||||
Arctic Cat, Inc.* | 134 | 4,860 | ||||||
Black Diamond, Inc.* | 623 | 5,919 | ||||||
Brunswick Corp. | 243 | 5,732 | ||||||
Callaway Golf Co. | 910 | 4,969 | ||||||
Jakks Pacific, Inc. | 387 | 4,996 | ||||||
Johnson Outdoors, Inc. — Class A* | 263 | 5,131 | ||||||
Leapfrog Enterprises, Inc.* | 658 | 5,817 | ||||||
Marine Products Corp. | 939 | 5,568 | ||||||
Smith & Wesson Holding Corp.* | 543 | 5,213 | ||||||
Steinway Musical Instruments, Inc.* | 229 | 5,528 | ||||||
Sturm Ruger & Co., Inc. | 118 | 5,573 | ||||||
|
| |||||||
Total Leisure Equipment & Products | 59,306 | |||||||
|
| |||||||
| 90 | GUGGENHEIM ETFS ANNUAL REPORT | See Notes to Financial Statements. |
Table of Contents
| SCHEDULE OF INVESTMENTS (continued) | October 31, 2012 |
GUGGENHEIM RUSSELL 2000® EQUAL WEIGHT ETF
| SHARES | VALUE | |||||||
Life Sciences Tools & Services - 0.3% |
| |||||||
Affymetrix, Inc.* | 1,476 | $ | 4,679 | |||||
Cambrex Corp.* | 505 | 6,100 | ||||||
Fluidigm Corp.* | 367 | 5,538 | ||||||
Furiex Pharmaceuticals, Inc.* | 318 | 6,096 | ||||||
Harvard Bioscience, Inc.* | 1,391 | 5,592 | ||||||
Luminex Corp.* | 306 | 4,921 | ||||||
Pacific Biosciences of California, Inc.* | 3,188 | 4,144 | ||||||
PAREXEL International Corp.* | 205 | 6,291 | ||||||
Sequenom, Inc.* | 1,791 | 5,570 | ||||||
|
| |||||||
Total Life Sciences Tools & Services | 48,931 | |||||||
|
| |||||||
Machinery - 3.0% |
| |||||||
Accuride Corp.* | 1,392 | 3,717 | ||||||
Actuant Corp. — Class A | 213 | 6,015 | ||||||
Alamo Group, Inc. | 193 | 6,465 | ||||||
Albany International Corp. — Class A | 291 | 6,393 | ||||||
Altra Holdings, Inc. | 330 | 5,947 | ||||||
American Railcar Industries, Inc.* | 206 | 6,052 | ||||||
Ampco-Pittsburgh Corp. | 715 | 12,627 | ||||||
Astec Industries, Inc.* | 202 | 5,818 | ||||||
Barnes Group, Inc. | 252 | 5,766 | ||||||
Blount International, Inc.* | 480 | 6,350 | ||||||
Briggs & Stratton Corp. | 337 | 6,656 | ||||||
Cascade Corp. | 119 | 7,734 | ||||||
Chart Industries, Inc.* | 85 | 6,017 | ||||||
CIRCOR International, Inc. | 166 | 5,725 | ||||||
CLARCOR, Inc. | 296 | 13,391 | ||||||
Columbus McKinnon Corp.* | 413 | 6,183 | ||||||
Commercial Vehicle Group, Inc.* | 786 | 5,966 | ||||||
Douglas Dynamics, Inc. | 424 | 6,440 | ||||||
Dynamic Materials Corp. | 838 | 11,246 | ||||||
Eastern Co. (The) | 716 | 11,456 | ||||||
Energy Recovery, Inc.* | 2,201 | 6,537 | ||||||
EnPro Industries, Inc.* | 177 | 6,471 | ||||||
ESCO Technologies, Inc. | 165 | 6,178 | ||||||
Federal Signal Corp.* | 1,021 | 5,891 | ||||||
Flow International Corp.* | 1,719 | 5,707 | ||||||
FreightCar America, Inc. | 339 | 6,526 | ||||||
Gorman-Rupp Co.(The) | 234 | 6,318 | ||||||
Graham Corp. | 331 | 5,948 | ||||||
Greenbrier Cos., Inc.* | 376 | 6,546 | ||||||
Hardinge, Inc. | 619 | 6,425 | ||||||
Hurco Cos., Inc.* | 271 | 6,228 | ||||||
Hyster-Yale Materials Handling, Inc.* | 57 | 2,342 | ||||||
Hyster-Yale Materials Handling, | 56 | 2,300 | ||||||
John Bean Technologies Corp. | 382 | 5,890 | ||||||
Kadant, Inc.* | 264 | 6,413 | ||||||
Kaydon Corp. | 583 | 13,036 | ||||||
LB Foster Co. — Class A | 394 | 13,006 | ||||||
Lindsay Corp. | 92 | 7,026 | ||||||
Lydall, Inc.* | 457 | 5,900 | ||||||
Meritor, Inc.* | 1,314 | 5,808 | ||||||
Met-Pro Corp. | 707 | 6,420 | ||||||
| SHARES | VALUE | |||||||
Middleby Corp.* | 55 | $ | 6,872 | |||||
Miller Industries, Inc. | 400 | 6,140 | ||||||
Mueller Industries, Inc. | 291 | 12,746 | ||||||
Mueller Water Products, Inc. — Series A | 2,808 | 14,630 | ||||||
NN, Inc.* | 1,479 | 12,246 | ||||||
PMFG, Inc.* | 800 | 5,200 | ||||||
Proto Labs, Inc.* | 189 | 6,558 | ||||||
RBC Bearings, Inc.* | 270 | 13,408 | ||||||
Rexnord Corp.* | 728 | 13,191 | ||||||
Robbins & Myers, Inc. | 107 | 6,343 | ||||||
Sauer-Danfoss, Inc. | 159 | 6,369 | ||||||
Sun Hydraulics Corp. | 241 | 6,420 | ||||||
Tennant Co. | 149 | 5,576 | ||||||
Titan International, Inc.a | 369 | 7,742 | ||||||
Trimas Corp.* | 263 | 6,596 | ||||||
Twin Disc, Inc. | 347 | 5,260 | ||||||
Wabash National Corp.* | 942 | 5,944 | ||||||
Watts Water Technologies, Inc. — Class A | 166 | 6,678 | ||||||
Woodward, Inc. | 186 | 6,231 | ||||||
|
| |||||||
Total Machinery | 437,030 | |||||||
|
| |||||||
Marine - 0.1% |
| |||||||
Genco Shipping & Trading Ltd.* | 1,781 | 5,414 | ||||||
International Shipholding Corp. | 384 | 6,421 | ||||||
Rand Logistics, Inc.* | 823 | 5,333 | ||||||
|
| |||||||
Total Marine | 17,168 | |||||||
|
| |||||||
Media - 1.4% |
| |||||||
Arbitron, Inc. | 148 | 5,381 | ||||||
Belo Corp. — Class A | 711 | 5,318 | ||||||
Carmike Cinemas, Inc.* | 478 | 6,510 | ||||||
Central European Media Enterprises Ltd. — Class A* | 833 | 4,465 | ||||||
Crown Media Holdings, Inc. — Class A* | 3,307 | 5,754 | ||||||
Cumulus Media, Inc. — Class A* | 2,059 | 5,065 | ||||||
Daily Journal Corp.* | 62 | 5,860 | ||||||
Digital Generation, Inc.* | 500 | 4,650 | ||||||
E.W. Scripps Co. — Class A* | 531 | 5,634 | ||||||
Entercom Communications Corp. — Class A* | 805 | 5,241 | ||||||
Entravision Communications Corp. — Class A | 4,074 | 5,500 | ||||||
Fisher Communications, Inc. | 152 | 3,837 | ||||||
Global Sources Ltd.* | 968 | 5,537 | ||||||
Harte-Hanks, Inc. | 816 | 4,545 | ||||||
Journal Communications, | 1,065 | 5,975 | ||||||
LIN TV Corp. — Class A* | 1,310 | 7,349 | ||||||
Lions Gate Entertainment Corp.* | 381 | 6,355 | ||||||
Live Nation Entertainment, Inc.* | 654 | 5,984 | ||||||
Martha Stewart Living Omnimedia — Class A | 1,751 | 5,060 | ||||||
| See Notes to Financial Statements. | GUGGENHEIM ETFS ANNUAL REPORT | 91 |
Table of Contents
| SCHEDULE OF INVESTMENTS (continued) | October 31, 2012 |
GUGGENHEIM RUSSELL 2000® EQUAL WEIGHT ETF
| SHARES | VALUE | |||||||
McClatchy Co.(The) — Class A*,a | 2,488 | $ | 7,091 | |||||
MDC Partners, Inc. | 462 | 5,225 | ||||||
Meredith Corp. | 158 | 5,288 | ||||||
National CineMedia, Inc. | 356 | 5,504 | ||||||
New York Times Co.(The) — Class A* | 586 | 4,794 | ||||||
Nexstar Broadcasting Group, | 512 | 5,566 | ||||||
Outdoor Channel Holdings, Inc. | 773 | 5,612 | ||||||
ReachLocal, Inc.* | 444 | 5,479 | ||||||
Reading International, Inc. — Class A* | 935 | 5,657 | ||||||
Rentrak Corp.* | 334 | 5,675 | ||||||
Saga Communications, Inc. — Class A* | 146 | 6,193 | ||||||
Salem Communications Corp. — Class A | 1,071 | 6,383 | ||||||
Scholastic Corp. | 172 | 5,674 | ||||||
Sinclair Broadcast Group, Inc. — Class A | 473 | 5,960 | ||||||
Valassis Communications, Inc.* | 220 | 5,724 | ||||||
World Wrestling Entertainment, Inc. — Class A | 680 | 5,501 | ||||||
|
| |||||||
Total Media | 195,346 | |||||||
|
| |||||||
Metals & Mining - 2.9% |
| |||||||
A.M. Castle & Co.* | 514 | 6,245 | ||||||
AK Steel Holding Corp. | 2,745 | 13,835 | ||||||
AMCOL International Corp. | 385 | 12,158 | ||||||
Century Aluminum Co.* | 1,825 | 13,049 | ||||||
Coeur d’Alene Mines Corp.* | 484 | 14,960 | ||||||
General Moly, Inc.* | 4,271 | 15,803 | ||||||
Globe Specialty Metals, Inc. | 865 | 13,001 | ||||||
Gold Reserve, Inc.* | 4,612 | 14,943 | ||||||
Gold Resource Corp. | 617 | 10,316 | ||||||
Golden Minerals Co.* | 2,625 | 11,471 | ||||||
Golden Star Resources Ltd.*,a | 7,220 | 14,440 | ||||||
Haynes International, Inc. | 251 | 12,721 | ||||||
Hecla Mining Co. | 2,056 | 13,529 | ||||||
Horsehead Holding Corp.* | 1,357 | 12,281 | ||||||
Kaiser Aluminum Corp. | 234 | 14,176 | ||||||
Materion Corp. | 559 | 11,711 | ||||||
McEwen Mining, Inc.* | 2,999 | 14,575 | ||||||
Metals USA Holdings Corp.* | 989 | 14,420 | ||||||
Midway Gold Corp.* | 8,408 | 14,294 | ||||||
Noranda Aluminum Holding Corp. | 1,906 | 11,684 | ||||||
Olympic Steel, Inc. | 759 | 13,662 | ||||||
Paramount Gold and Silver Corp.*,a | 5,070 | 13,486 | ||||||
Revett Minerals, Inc.* | 3,919 | 14,030 | ||||||
RTI International Metals, Inc.* | 568 | 12,945 | ||||||
Schnitzer Steel Industries, Inc. — Class A | 479 | 13,656 | ||||||
Stillwater Mining Co.* | 1,162 | 12,096 | ||||||
SunCoke Energy, Inc.* | 932 | 14,977 | ||||||
Universal Stainless & Alloy* | 346 | 11,902 | ||||||
US Antimony Corp.*,a | 6,387 | 13,030 | ||||||
US Silica Holdings, Inc.*,a | 942 | 12,058 | ||||||
| SHARES | VALUE | |||||||
Vista Gold Corp.* | 3,659 | $ | 12,184 | |||||
Worthington Industries, Inc. | 591 | 12,777 | ||||||
|
| |||||||
Total Metals & Mining | 416,415 | |||||||
|
| |||||||
Multi-Utilities - 0.8% |
| |||||||
Avista Corp. | 1,133 | 28,801 | ||||||
Black Hills Corp. | 825 | 29,510 | ||||||
CH Energy Group, Inc. | 451 | 29,328 | ||||||
NorthWestern Corp. | 791 | 28,326 | ||||||
|
| |||||||
Total Multi-Utilities | 115,965 | |||||||
|
| |||||||
Multiline Retail - 0.2% |
| |||||||
Bon-Ton Stores, Inc.(The) | 564 | 6,926 | ||||||
Fred’s, Inc. — Class A | 391 | 5,298 | ||||||
Gordmans Stores, Inc.* | 316 | 4,759 | ||||||
Saks, Inc.*,a | 534 | 5,490 | ||||||
Tuesday Morning Corp.* | 887 | 5,295 | ||||||
|
| |||||||
Total Multiline Retail | 27,768 | |||||||
|
| |||||||
Oil, Gas & Consumable Fuels - 7.0% |
| |||||||
Abraxas Petroleum Corp.* | 6,427 | 13,304 | ||||||
Alon USA Energy, Inc. | 1,092 | 14,338 | ||||||
Amyris, Inc.* | 3,920 | 10,074 | ||||||
Apco Oil and Gas International, Inc. | 917 | 11,655 | ||||||
Approach Resources, Inc.* | 510 | 12,561 | ||||||
Arch Coal, Inc. | 2,404 | 19,136 | ||||||
Berry Petroleum Co. — Class A | 373 | 14,364 | ||||||
Bill Barrett Corp.* | 601 | 13,769 | ||||||
Bonanza Creek Energy, Inc.* | 650 | 16,100 | ||||||
BPZ Resources, Inc.*,a | 5,025 | 14,472 | ||||||
Callon Petroleum Co.* | 2,471 | 14,134 | ||||||
Carrizo Oil & Gas, Inc.* | 576 | 15,448 | ||||||
Clayton Williams Energy, Inc.* | 286 | 12,112 | ||||||
Clean Energy Fuels Corp.* | 1,146 | 13,122 | ||||||
Cloud Peak Energy, Inc.* | 845 | 17,829 | ||||||
Comstock Resources, Inc.* | 815 | 13,953 | ||||||
Contango Oil & Gas Co.* | 294 | 14,453 | ||||||
Crimson Exploration, Inc.* | 3,419 | 12,377 | ||||||
Crosstex Energy, Inc. | 1,069 | 14,624 | ||||||
CVR Energy, Inc.* | 402 | 14,773 | ||||||
Delek US Holdings, Inc. | 584 | 15,038 | ||||||
Endeavour International Corp.* | 1,591 | 11,551 | ||||||
Energy XXI (Bermuda) Ltd. | 416 | 13,770 | ||||||
EPL Oil & Gas, Inc.* | 723 | 15,646 | ||||||
Evolution Petroleum Corp.* | 1,846 | 15,137 | ||||||
Forest Oil Corp.* | 1,842 | 13,962 | ||||||
Frontline Ltd.* | 1,639 | 5,196 | ||||||
FX Energy, Inc.* | 1,910 | 9,225 | ||||||
GasLog Ltd.* | 553 | 6,382 | ||||||
Gastar Exploration Ltd.* | 8,656 | 9,695 | ||||||
Goodrich Petroleum Corp.*,a | 1,145 | 14,118 | ||||||
Green Plains Renewable Energy, Inc.* | 2,467 | 19,070 | ||||||
Gulfport Energy Corp.* | 510 | 16,922 | ||||||
Halcon Resources Corp.* | 2,089 | 13,516 | ||||||
Harvest Natural Resources, Inc.* | 1,664 | 14,527 | ||||||
Isramco, Inc.* | 129 | 12,994 | ||||||
| 92 | GUGGENHEIM ETFS ANNUAL REPORT | See Notes to Financial Statements. |
Table of Contents
| SCHEDULE OF INVESTMENTS (continued) | October 31, 2012 |
GUGGENHEIM RUSSELL 2000® EQUAL WEIGHT ETF
| SHARES | VALUE | |||||||
KiOR, Inc. — Class A*,a | 1,806 | $ | 11,920 | |||||
Knightsbridge Tankers Ltd. | 961 | 6,122 | ||||||
Kodiak Oil & Gas Corp.* | 1,607 | 14,849 | ||||||
Magnum Hunter Resources Corp.*,a | 3,365 | 12,854 | ||||||
Matador Resources Co.* | 1,484 | 13,104 | ||||||
McMoRan Exploration Co.* | 1,238 | 14,769 | ||||||
Midstates Petroleum Co., Inc.* | 1,745 | 10,767 | ||||||
Miller Energy Resources, Inc.*,a | 2,891 | 13,067 | ||||||
Nordic American Tankers Ltd. | 625 | 5,250 | ||||||
Northern Oil and Gas, Inc.* | 870 | 13,189 | ||||||
Oasis Petroleum, Inc.* | 515 | 15,126 | ||||||
Overseas Shipholding Group, Inc.a | 944 | 1,057 | ||||||
Panhandle Oil and Gas, Inc. — Class A | 479 | 12,971 | ||||||
PDC Energy, Inc.* | 489 | 14,802 | ||||||
Penn Virginia Corp. | 2,447 | 11,060 | ||||||
Petroquest Energy, Inc.* | 2,358 | 14,384 | ||||||
Quicksilver Resources, Inc.*,a | 3,635 | 14,067 | ||||||
Rentech, Inc.* | 5,129 | 13,233 | ||||||
Resolute Energy Corp.* | 1,637 | 14,537 | ||||||
REX American Resources Corp.* | 807 | 14,211 | ||||||
Rex Energy Corp.* | 1,121 | 14,842 | ||||||
Rosetta Resources, Inc.* | 317 | 14,595 | ||||||
Sanchez Energy Corp.* | 771 | 13,924 | ||||||
Saratoga Resources, Inc.* | 2,733 | 13,556 | ||||||
Scorpio Tankers, Inc.* | 1,065 | 5,804 | ||||||
SemGroup Corp. — Class A* | 403 | 15,572 | ||||||
Ship Finance International Ltd. | 406 | 6,244 | ||||||
Solazyme, Inc.* | 1,318 | 10,676 | ||||||
Stone Energy Corp.* | 578 | 13,635 | ||||||
Swift Energy Co.* | 695 | 11,613 | ||||||
Synergy Resources Corp.* | 4,148 | 17,629 | ||||||
Targa Resources Corp. | 298 | 15,177 | ||||||
Teekay Tankers Ltd. — Class A | 1,661 | 5,714 | ||||||
Triangle Petroleum Corp.* | 1,983 | 12,671 | ||||||
Uranerz Energy Corp.*,a | 8,200 | 13,612 | ||||||
Uranium Energy Corp.*,a | 4,994 | 11,786 | ||||||
Vaalco Energy, Inc.* | 1,768 | 14,445 | ||||||
W&T Offshore, Inc. | 776 | 13,153 | ||||||
Warren Resources, Inc.* | 4,910 | 13,993 | ||||||
Western Refining, Inc. | 561 | 13,952 | ||||||
Westmoreland Coal Co.* | 1,537 | 15,800 | ||||||
|
| |||||||
Total Oil, Gas & Consumable Fuels | 999,079 | |||||||
|
| |||||||
Paper & Forest Products - 0.9% |
| |||||||
Buckeye Technologies, Inc. | 420 | 11,004 | ||||||
Clearwater Paper Corp.* | 324 | 12,811 | ||||||
Deltic Timber Corp. | 198 | 13,436 | ||||||
KapStone Paper and Packaging Corp.* | 604 | 13,270 | ||||||
Louisiana-Pacific Corp.* | 1,002 | 15,821 | ||||||
Neenah Paper, Inc. | 458 | 11,862 | ||||||
PH Glatfelter Co. | 749 | 13,340 | ||||||
Resolute Forest Products* | 985 | 12,017 | ||||||
Schweitzer-Mauduit International, Inc. | 399 | 13,977 | ||||||
Wausau Paper Corp. | 1,407 | 11,636 | ||||||
|
| |||||||
Total Paper & Forest Products | 129,174 | |||||||
|
| |||||||
| SHARES | VALUE | |||||||
Personal Products - 1.1% |
| |||||||
Elizabeth Arden, Inc.* | 121 | $ | 5,709 | |||||
Inter Parfums, Inc. | 309 | 5,642 | ||||||
Medifast, Inc.* | 1,199 | 30,599 | ||||||
Nature’s Sunshine Products, Inc. | 1,957 | 33,641 | ||||||
Prestige Brands Holdings, Inc.* | 373 | 6,487 | ||||||
Revlon, Inc. — Class A* | 366 | 5,636 | ||||||
Schiff Nutrition International, Inc.* | 1,298 | 43,924 | ||||||
USANA Health Sciences, Inc.* | 674 | 29,076 | ||||||
|
| |||||||
Total Personal Products | 160,714 | |||||||
|
| |||||||
Pharmaceuticals - 1.6% |
| |||||||
Akorn, Inc.* | 516 | 6,197 | ||||||
Ampio Pharmaceuticals, Inc.* | 1,501 | 6,004 | ||||||
Auxilium Pharmaceuticals, Inc.* | 263 | 5,386 | ||||||
AVANIR Pharmaceuticals, Inc. — Class A* | 1,855 | 5,305 | ||||||
BioDelivery Sciences International, Inc.* | 1,006 | 5,141 | ||||||
Cadence Pharmaceuticals, Inc.* | 1,546 | 5,473 | ||||||
Corcept Therapeutics, Inc.* | 2,294 | 5,735 | ||||||
Cornerstone Therapeutics, Inc.* | 1,233 | 6,029 | ||||||
Cumberland Pharmaceuticals, Inc.* | 970 | 5,694 | ||||||
Depomed, Inc.* | 1,079 | 6,096 | ||||||
Endocyte, Inc.* | 616 | 5,895 | ||||||
Hi-Tech Pharmacal Co., Inc.* | 186 | 5,831 | ||||||
Horizon Pharma, Inc.* | 1,791 | 4,621 | ||||||
Impax Laboratories, Inc.* | 234 | 4,973 | ||||||
Jazz Pharmaceuticals PLC* | 110 | 5,910 | ||||||
Lannett Co., Inc.* | 1,269 | 5,596 | ||||||
MAP Pharmaceuticals, Inc.* | 412 | 6,353 | ||||||
Medicines Co.(The)* | 238 | 5,217 | ||||||
Medicis Pharmaceutical Corp. — Class A | 143 | 6,208 | ||||||
Nektar Therapeutics*,a | 595 | 5,355 | ||||||
Obagi Medical Products, Inc.* | 495 | 6,103 | ||||||
Omeros Corp.* | 641 | 6,025 | ||||||
Optimer Pharmaceuticals, Inc.* | 442 | 4,217 | ||||||
Pacira Pharmaceuticals, Inc.* | 341 | 5,415 | ||||||
Pain Therapeutics, Inc.* | 1,258 | 5,875 | ||||||
Pernix Therapeutics Holdings* | 882 | 6,950 | ||||||
Pozen, Inc.* | 956 | 5,727 | ||||||
Questcor Pharmaceuticals, Inc.a | 322 | 8,205 | ||||||
Repros Therapeutics, Inc.* | 409 | 5,898 | ||||||
Sagent Pharmaceuticals, Inc.* | 388 | 5,851 | ||||||
Santarus, Inc.* | 710 | 6,482 | ||||||
Sciclone Pharmaceuticals, Inc.* | 1,128 | 6,215 | ||||||
Sucampo Pharmaceuticals, Inc. — Class A* | 1,372 | 6,846 | ||||||
Transcept Pharmaceuticals, Inc.* | 1,158 | 5,894 | ||||||
Ventrus Biosciences, Inc.* | 1,731 | 5,435 | ||||||
ViroPharma, Inc.* | 202 | 5,101 | ||||||
Vivus, Inc.* | 339 | 5,051 | ||||||
XenoPort, Inc.* | 559 | 4,601 | ||||||
| See Notes to Financial Statements. | GUGGENHEIM ETFS ANNUAL REPORT | 93 |
Table of Contents
| SCHEDULE OF INVESTMENTS (continued) | October 31, 2012 |
GUGGENHEIM RUSSELL 2000® EQUAL WEIGHT ETF
| SHARES | VALUE | |||||||
Zogenix, Inc.* | 2,311 | $ | 5,639 | |||||
|
| |||||||
Total Pharmaceuticals | 224,549 | |||||||
|
| |||||||
Professional Services - 1.5% |
| |||||||
Acacia Research Corp.* | 200 | 5,194 | ||||||
Advisory Board Co.(The)* | 136 | 6,460 | ||||||
Barrett Business Services, Inc. | 225 | 6,712 | ||||||
CBIZ, Inc.* | 1,065 | 5,879 | ||||||
CDI Corp. | 372 | 6,395 | ||||||
Corporate Executive Board Co.(The) | 121 | 5,440 | ||||||
CRA International, Inc.* | 370 | 6,194 | ||||||
Dolan Co.(The)* | 1,124 | 5,204 | ||||||
Exponent, Inc.* | 114 | 6,268 | ||||||
Franklin Covey Co.* | 468 | 5,625 | ||||||
FTI Consulting, Inc.* | 239 | 6,204 | ||||||
GP Strategies Corp.* | 334 | 6,429 | ||||||
Heidrick & Struggles International, Inc. | 500 | 5,920 | ||||||
Hill International, Inc.* | 1,507 | 5,109 | ||||||
Hudson Global, Inc.* | 1,392 | 5,624 | ||||||
Huron Consulting Group, Inc.* | 179 | 5,164 | ||||||
ICF International, Inc.* | 301 | 5,523 | ||||||
Insperity, Inc. | 253 | 6,606 | ||||||
Kelly Services, Inc. — Class A | 503 | 6,685 | ||||||
Kforce, Inc.* | 520 | 5,798 | ||||||
Korn/Ferry International* | 414 | 5,543 | ||||||
Mistras Group, Inc.* | 278 | 6,141 | ||||||
Navigant Consulting, Inc.* | 575 | 5,974 | ||||||
Odyssey Marine Exploration, Inc.* | 1,927 | 5,569 | ||||||
On Assignment, Inc.* | 314 | 5,991 | ||||||
Pendrell Corp.* | 27,236 | 32,411 | ||||||
Resources Connection, Inc. | 482 | 5,948 | ||||||
RPX Corp.* | 547 | 5,760 | ||||||
TrueBlue, Inc.* | 395 | 5,155 | ||||||
VSE Corp. | 264 | 6,244 | ||||||
WageWorks, Inc.* | 363 | 7,038 | ||||||
|
| |||||||
Total Professional Services | 210,207 | |||||||
|
| |||||||
Real Estate Investment Trusts (REITs) - 2.4% |
| |||||||
Acadia Realty Trust | 139 | 3,570 | ||||||
AG Mortgage Investment Trust, Inc. | 146 | 3,497 | ||||||
Agree Realty Corp. | 135 | 3,407 | ||||||
Alexander’s, Inc. | 8 | 3,552 | ||||||
American Assets Trust, Inc. | 130 | 3,532 | ||||||
American Capital Mortgage Investment Corp. | 139 | 3,465 | ||||||
American Realty Capital Trust, Inc. | 299 | 3,370 | ||||||
AmREIT, Inc. | 235 | 3,828 | ||||||
Anworth Mortgage Asset Corp. | 512 | 3,144 | ||||||
Apollo Commercial Real Estate Finance, Inc. | 192 | 3,247 | ||||||
Apollo Residential Mortgage, Inc. | 149 | 3,303 | ||||||
Ares Commercial Real Estate Corp. | 205 | 3,460 | ||||||
ARMOUR Residential REIT, Inc. | 462 | 3,326 | ||||||
Ashford Hospitality Trust, Inc. | 428 | 3,677 | ||||||
Associated Estates Realty Corp. | 236 | 3,538 | ||||||
Campus Crest Communities, Inc. | 323 | 3,582 | ||||||
| SHARES | VALUE | |||||||
CapLease, Inc. | 675 | $ | 3,463 | |||||
Capstead Mortgage Corp. | 243 | 2,994 | ||||||
Cedar Realty Trust, Inc. | 625 | 3,306 | ||||||
Chatham Lodging Trust | 245 | 3,173 | ||||||
Chesapeake Lodging Trust | 176 | 3,318 | ||||||
Colonial Properties Trust | 166 | 3,591 | ||||||
Colony Financial, Inc. | 180 | 3,602 | ||||||
Coresite Realty Corp. | 131 | 2,978 | ||||||
Cousins Properties, Inc. | 446 | 3,751 | ||||||
CreXus Investment Corp. | 314 | 3,532 | ||||||
CubeSmart | 271 | 3,556 | ||||||
CYS Investments, Inc. | 247 | 3,315 | ||||||
DCT Industrial Trust, Inc. | 543 | 3,502 | ||||||
DiamondRock Hospitality Co. | 360 | 3,053 | ||||||
DuPont Fabros Technology, Inc. | 141 | 3,026 | ||||||
Dynex Capital, Inc. | 321 | 3,184 | ||||||
EastGroup Properties, Inc. | 66 | 3,436 | ||||||
Education Realty Trust, Inc. | 322 | 3,391 | ||||||
Entertainment Properties Trust | 77 | 3,423 | ||||||
Equity One, Inc. | 169 | 3,532 | ||||||
Excel Trust, Inc. | 298 | 3,665 | ||||||
FelCor Lodging Trust, Inc.* | 717 | 3,155 | ||||||
First Industrial Realty Trust, Inc.* | 267 | 3,564 | ||||||
First Potomac Realty Trust | 268 | 3,192 | ||||||
Franklin Street Properties Corp. | 303 | 3,457 | ||||||
Getty Realty Corp. | 196 | 3,589 | ||||||
Gladstone Commercial Corp. | 190 | 3,502 | ||||||
Glimcher Realty Trust | 332 | 3,542 | ||||||
Government Properties Income Trust | 149 | 3,306 | ||||||
Gramercy Capital Corp.* | 1,175 | 3,419 | ||||||
Gyrodyne Co. of America, Inc.* | 32 | 3,417 | ||||||
Healthcare Realty Trust, Inc. | 152 | 3,570 | ||||||
Hersha Hospitality Trust | 688 | 3,144 | ||||||
Highwoods Properties, Inc. | 107 | 3,451 | ||||||
Hudson Pacific Properties, Inc. | 192 | 3,642 | ||||||
Inland Real Estate Corp. | 414 | 3,382 | ||||||
Invesco Mortgage Capital, Inc. | 172 | 3,686 | ||||||
Investors Real Estate Trust | 425 | 3,578 | ||||||
iStar Financial, Inc.* | 437 | 3,815 | ||||||
Kite Realty Group Trust | 666 | 3,643 | ||||||
LaSalle Hotel Properties | 132 | 3,160 | ||||||
Lexington Realty Trust | 359 | 3,407 | ||||||
LTC Properties, Inc. | 108 | 3,565 | ||||||
Medical Properties Trust, Inc. | 337 | 3,869 | ||||||
Mission West Properties, Inc. | 398 | 3,295 | ||||||
Monmouth Real Estate Investment Corp. — Class A | 313 | 3,474 | ||||||
National Health Investors, Inc. | 67 | 3,578 | ||||||
New York Mortgage Trust, Inc. | 466 | 3,192 | ||||||
NorthStar Realty Finance Corp. | 555 | 3,646 | ||||||
Omega Healthcare Investors, Inc. | 152 | 3,487 | ||||||
One Liberty Properties, Inc. | 184 | 3,476 | ||||||
Parkway Properties, Inc. | 263 | 3,622 | ||||||
Pebblebrook Hotel Trust | 146 | 3,098 | ||||||
| 94 | GUGGENHEIM ETFS ANNUAL REPORT | See Notes to Financial Statements. |
Table of Contents
| SCHEDULE OF INVESTMENTS (continued) | October 31, 2012 |
GUGGENHEIM RUSSELL 2000® EQUAL WEIGHT ETF
| SHARES | VALUE | |||||||
Pennsylvania Real Estate Investment Trust | 219 | $ | 3,620 | |||||
Pennymac Mortgage Investment Trust | 149 | 3,791 | ||||||
Potlatch Corp. | 92 | 3,540 | ||||||
PS Business Parks, Inc. | 52 | 3,335 | ||||||
RAIT Financial Trust | 671 | 3,744 | ||||||
Ramco-Gershenson Properties Trust | 269 | 3,486 | ||||||
Redwood Trust, Inc. | 238 | 3,710 | ||||||
Resource Capital Corp. | 564 | 3,305 | ||||||
Retail Opportunity Investments Corp. | 274 | 3,469 | ||||||
RLJ Lodging Trust | 184 | 3,279 | ||||||
Rouse Properties, Inc. | 242 | 3,645 | ||||||
Sabra Health Care REIT, Inc. | 171 | 3,800 | ||||||
Saul Centers, Inc. | 77 | 3,332 | ||||||
Select Income REIT | 142 | 3,509 | ||||||
Sovran Self Storage, Inc. | 61 | 3,526 | ||||||
STAG Industrial, Inc. | 216 | 3,741 | ||||||
Starwood Property Trust, Inc. | 145 | 3,323 | ||||||
Strategic Hotels & Resorts, Inc.* | 569 | 3,124 | ||||||
Summit Hotel Properties, Inc. | 410 | 3,387 | ||||||
Sun Communities, Inc. | 79 | 3,316 | ||||||
Sunstone Hotel Investors, Inc.* | 316 | 3,122 | ||||||
Terreno Realty Corp. | 222 | 3,388 | ||||||
Two Harbors Investment Corp. | 300 | 3,579 | ||||||
UMH Properties, Inc. | 293 | 3,079 | ||||||
Universal Health Realty Income Trust | 76 | 3,757 | ||||||
Urstadt Biddle Properties, Inc. — Class A | 170 | 3,220 | ||||||
Washington Real Estate Investment Trust | 129 | 3,317 | ||||||
Western Asset Mortgage Capital Corp. | 145 | 3,110 | ||||||
Whitestone REIT | 262 | 3,529 | ||||||
Winthrop Realty Trust | 309 | 3,380 | ||||||
|
| |||||||
Total Real Estate Investment Trusts (REITs) | 340,675 | |||||||
|
| |||||||
Real Estate Management & Development - 0.2% |
| |||||||
AV Homes, Inc.* | 240 | 3,528 | ||||||
Consolidated-Tomoka Land Co. | 107 | 3,512 | ||||||
Forestar Group, Inc.* | 210 | 3,362 | ||||||
Kennedy-Wilson Holdings, Inc. | 249 | 3,536 | ||||||
Tejon Ranch Co.* | 118 | 3,533 | ||||||
Thomas Properties Group, Inc. | 598 | 3,193 | ||||||
Zillow, Inc.* | 84 | 3,138 | ||||||
|
| |||||||
Total Real Estate Management & Development | 23,802 | |||||||
|
| |||||||
Road & Rail - 0.8% |
| |||||||
Amerco, Inc. | 53 | 6,124 | ||||||
Arkansas Best Corp. | 808 | 6,504 | ||||||
Avis Budget Group, Inc.* | 364 | 6,017 | ||||||
Celadon Group, Inc. | 390 | 6,669 | ||||||
Dollar Thrifty Automotive Group, Inc.* | 65 | 5,005 | ||||||
Genesee & Wyoming, Inc. — Class A* | 98 | 7,102 | ||||||
Heartland Express, Inc. | 481 | 6,710 | ||||||
Knight Transportation, Inc. | 447 | 6,759 | ||||||
| SHARES | VALUE | |||||||
Marten Transport Ltd. | 374 | $ | 6,919 | |||||
Old Dominion Freight Line, Inc.* | 216 | 7,245 | ||||||
Patriot Transportation Holding, Inc.* | 240 | 6,720 | ||||||
Quality Distribution, Inc.* | 681 | 5,856 | ||||||
Roadrunner Transportation Systems, Inc.* | 390 | 6,798 | ||||||
Saia, Inc.* | 313 | 7,074 | ||||||
Swift Transportation Co.* | 757 | 7,381 | ||||||
Universal Truckload Services, Inc. | 394 | 6,241 | ||||||
Werner Enterprises, Inc. | 302 | 6,994 | ||||||
Zipcar, Inc.* | 705 | 4,420 | ||||||
|
| |||||||
Total Road & Rail | 116,538 | |||||||
|
| |||||||
Semiconductors & Semiconductor Equipment - 3.0% |
| |||||||
Advanced Energy Industries, Inc.* | 504 | 5,952 | ||||||
Alpha & Omega Semiconductor Ltd.* | 625 | 5,325 | ||||||
Amkor Technology, Inc.* | 1,237 | 5,344 | ||||||
Anadigics, Inc.* | 4,684 | 6,839 | ||||||
Applied Micro Circuits Corp.* | 1,090 | 6,322 | ||||||
ATMI, Inc.* | 292 | 5,767 | ||||||
Axcelis Technologies, Inc.* | 4,849 | 4,444 | ||||||
AXT, Inc.* | 1,593 | 5,113 | ||||||
Brooks Automation, Inc. | 702 | 5,068 | ||||||
Cabot Microelectronics Corp. | 378 | 11,264 | ||||||
Cavium, Inc.* | 165 | 5,475 | ||||||
CEVA, Inc.* | 379 | 5,742 | ||||||
Cirrus Logic, Inc.* | 143 | 5,829 | ||||||
Cohu, Inc. | 582 | 5,122 | ||||||
Cymer, Inc.* | 107 | 8,527 | ||||||
Diodes, Inc.* | 318 | 4,821 | ||||||
DSP Group, Inc.* | 897 | 4,933 | ||||||
Entegris, Inc.* | 670 | 5,501 | ||||||
Entropic Communications, Inc.* | 938 | 4,512 | ||||||
Exar Corp.* | 719 | 6,147 | ||||||
First Solar, Inc.*,a | 729 | 17,722 | ||||||
Formfactor, Inc.* | 984 | 4,487 | ||||||
GSI Technology, Inc.* | 1,117 | 6,244 | ||||||
GT Advanced Technologies, Inc.*,a | 2,655 | 11,523 | ||||||
Hittite Microwave Corp.* | 101 | 5,721 | ||||||
Inphi Corp.* | 570 | 4,771 | ||||||
Integrated Device Technology, Inc.* | 935 | 5,086 | ||||||
Integrated Silicon Solution, Inc.* | 573 | 4,899 | ||||||
Intermolecular, Inc.* | 802 | 5,622 | ||||||
International Rectifier Corp.* | 324 | 5,019 | ||||||
Intersil Corp. — Class A | 618 | 4,357 | ||||||
IXYS Corp.* | 572 | 5,445 | ||||||
Kopin Corp.* | 1,490 | 5,602 | ||||||
Lattice Semiconductor Corp.* | 1,439 | 5,583 | ||||||
LTX-Credence Corp.* | 1,014 | 5,648 | ||||||
M/A-COM Technology Solutions Holdings, Inc.* | 442 | 5,521 | ||||||
Mattson Technology, Inc.* | 5,818 | 5,222 | ||||||
MaxLinear, Inc. — Class A* | 864 | 4,907 | ||||||
MEMC Electronic Materials, Inc.* | 1,960 | 4,939 | ||||||
Micrel, Inc. | 530 | 5,136 | ||||||
| See Notes to Financial Statements. | GUGGENHEIM ETFS ANNUAL REPORT | 95 |
Table of Contents
| SCHEDULE OF INVESTMENTS (continued) | October 31, 2012 |
GUGGENHEIM RUSSELL 2000® EQUAL WEIGHT ETF
| SHARES | VALUE | |||||||
Microsemi Corp.* | 271 | $ | 5,203 | |||||
Mindspeed Technologies, Inc.* | 1,655 | 5,643 | ||||||
MIPS Technologies, Inc.* | 779 | 5,445 | ||||||
MKS Instruments, Inc. | 219 | 5,175 | ||||||
Monolithic Power Systems, Inc.* | 280 | 5,440 | ||||||
MoSys, Inc.* | 1,462 | 5,906 | ||||||
Nanometrics, Inc.* | 392 | 5,394 | ||||||
NeoPhotonics Corp.* | 935 | 4,909 | ||||||
NVE Corp.* | 94 | 4,869 | ||||||
Omnivision Technologies, Inc.* | 381 | 5,448 | ||||||
PDF Solutions, Inc.* | 418 | 5,534 | ||||||
Peregrine Semiconductor Corp.* | 310 | 5,490 | ||||||
Pericom Semiconductor Corp.* | 634 | 4,901 | ||||||
Photronics, Inc.* | 1,012 | 4,949 | ||||||
PLX Technology, Inc.* | 937 | 4,057 | ||||||
Power Integrations, Inc. | 174 | 5,147 | ||||||
QuickLogic Corp.* | 1,887 | 4,944 | ||||||
Rambus, Inc.* | 1,051 | 5,087 | ||||||
RF Micro Devices, Inc.* | 1,365 | 6,020 | ||||||
Rubicon Technology, Inc.* | 559 | 4,858 | ||||||
Rudolph Technologies, Inc.* | 526 | 5,002 | ||||||
Semtech Corp.* | 215 | 5,369 | ||||||
Sigma Designs, Inc.* | 838 | 4,978 | ||||||
Silicon Image, Inc.* | 1,220 | 5,368 | ||||||
Spansion, Inc. — Class A* | 479 | 5,312 | ||||||
STR Holdings, Inc.*,a | 4,538 | 9,757 | ||||||
SunPower Corp.*,a | 3,255 | 14,029 | ||||||
Supertex, Inc.* | 307 | 5,867 | ||||||
Tessera Technologies, Inc. | 398 | 5,640 | ||||||
TriQuint Semiconductor, Inc.* | 1,073 | 5,043 | ||||||
Ultra Clean Holdings* | 973 | 4,505 | ||||||
Ultratech, Inc.* | 176 | 5,440 | ||||||
Veeco Instruments, Inc.* | 178 | 5,465 | ||||||
Volterra Semiconductor Corp.* | 258 | 4,688 | ||||||
|
| |||||||
Total Semiconductors & Semiconductor Equipment | 432,383 | |||||||
|
| |||||||
Software - 2.3% |
| |||||||
Accelrys, Inc.* | 717 | 6,417 | ||||||
ACI Worldwide, Inc.* | 132 | 5,161 | ||||||
Actuate Corp.* | 861 | 4,589 | ||||||
Advent Software, Inc.* | 140 | 3,038 | ||||||
American Software, Inc. — Class A | 688 | 5,635 | ||||||
Aspen Technology, Inc.* | 216 | 5,352 | ||||||
AVG Technologies NV* | 551 | 5,780 | ||||||
Blackbaud, Inc. | 225 | 5,348 | ||||||
Bottomline Technologies, Inc.* | 232 | 5,429 | ||||||
BroadSoft, Inc.* | 143 | 5,465 | ||||||
Callidus Software, Inc.* | 1,218 | 5,652 | ||||||
CommVault Systems, Inc.* | 99 | 6,185 | ||||||
Comverse Technology, Inc.* | 897 | 5,911 | ||||||
Digimarc Corp. | 249 | 4,890 | ||||||
Ebix, Inc. | 231 | 5,034 | ||||||
Ellie Mae, Inc.* | 198 | 4,950 | ||||||
Eloqua, Inc.* | 308 | 7,186 | ||||||
| SHARES | VALUE | |||||||
EPIQ Systems, Inc. | 413 | $ | 5,043 | |||||
ePlus, Inc.* | 143 | 5,115 | ||||||
Exa Corp.* | 542 | 6,699 | ||||||
Fair Isaac Corp. | 78 | 3,635 | ||||||
FalconStor Software, Inc.* | 2,424 | 5,381 | ||||||
Glu Mobile, Inc.*,a | 1,171 | 3,712 | ||||||
Guidance Software, Inc.* | 492 | 5,993 | ||||||
Guidewire Software, Inc.* | 184 | 5,638 | ||||||
Imperva, Inc.* | 151 | 4,761 | ||||||
Infoblox, Inc.* | 234 | 3,887 | ||||||
Interactive Intelligence Group, Inc.* | 188 | 5,961 | ||||||
JDA Software Group, Inc.* | 177 | 6,751 | ||||||
Jive Software, Inc.* | 367 | 4,110 | ||||||
Kenexa Corp.* | 121 | 5,561 | ||||||
Manhattan Associates, Inc.* | 97 | 5,820 | ||||||
Mentor Graphics Corp.* | 351 | 5,448 | ||||||
MicroStrategy, Inc. — Class A* | 41 | 3,873 | ||||||
Monotype Imaging Holdings, Inc. | 362 | 5,542 | ||||||
Netscout Systems, Inc.* | 219 | 5,416 | ||||||
OPNET Technologies, Inc. | 165 | 7,001 | ||||||
Parametric Technology Corp.* | 253 | 5,106 | ||||||
Pegasystems, Inc. | 190 | 4,459 | ||||||
Pervasive Software, Inc.* | 639 | 5,483 | ||||||
Progress Software Corp.* | 281 | 5,541 | ||||||
Proofpoint, Inc.* | 380 | 5,020 | ||||||
PROS Holdings, Inc.* | 295 | 5,702 | ||||||
QAD, Inc. — Class A* | 409 | 5,002 | ||||||
QLIK Technologies, Inc.* | 241 | 4,437 | ||||||
RealPage, Inc.* | 242 | 5,283 | ||||||
Rosetta Stone, Inc.* | 441 | 5,164 | ||||||
Sapiens International Corp. NV* | 1,462 | 5,044 | ||||||
SeaChange International, Inc.* | 703 | 6,362 | ||||||
Sourcefire, Inc.* | 110 | 4,707 | ||||||
SS&C Technologies Holdings, Inc.* | 221 | 5,311 | ||||||
Synchronoss Technologies, Inc.* | 241 | 4,938 | ||||||
Take-Two Interactive Software, Inc.* | 528 | 5,887 | ||||||
Tangoe, Inc.* | 420 | 5,426 | ||||||
TeleNav, Inc.* | 920 | 6,477 | ||||||
TiVo, Inc.* | 553 | 5,613 | ||||||
Tyler Technologies, Inc.* | 131 | 6,263 | ||||||
Ultimate Software Group, Inc.* | 56 | 5,676 | ||||||
VASCO Data Security International, Inc.* | 581 | 4,113 | ||||||
Verint Systems, Inc.* | 203 | 5,536 | ||||||
VirnetX Holding Corp.* | 208 | 6,250 | ||||||
Websense, Inc.* | 348 | 4,601 | ||||||
|
| |||||||
Total Software | 330,770 | |||||||
|
| |||||||
Specialty Retail - 2.2% |
| |||||||
Aeropostale, Inc.* | 411 | 4,911 | ||||||
America’s Car-Mart, Inc.* | 124 | 5,191 | ||||||
ANN, Inc.* | 149 | 5,239 | ||||||
Asbury Automotive Group, Inc.* | 201 | 6,376 | ||||||
Barnes & Noble, Inc.* | 459 | 7,730 | ||||||
Bebe Stores, Inc. | 1,129 | 4,572 | ||||||
| 96 | GUGGENHEIM ETFS ANNUAL REPORT | See Notes to Financial Statements. |
Table of Contents
| SCHEDULE OF INVESTMENTS (continued) | October 31, 2012 |
GUGGENHEIM RUSSELL 2000® EQUAL WEIGHT ETF
| SHARES | VALUE | |||||||
Big 5 Sporting Goods Corp. | 579 | $ | 5,170 | |||||
Body Central Corp.* | 541 | 5,405 | ||||||
Brown Shoe Co., Inc. | 362 | 5,712 | ||||||
Buckle, Inc.(The) | 124 | 5,601 | ||||||
Cabela’s, Inc.* | 106 | 4,750 | ||||||
Casual Male Retail Group, Inc.* | 1,284 | 4,956 | ||||||
Cato Corp.(The) — Class A | 187 | 5,307 | ||||||
Children’s Place Retail Stores, Inc.(The)* | 95 | 5,551 | ||||||
Citi Trends, Inc.* | 464 | 5,698 | ||||||
Conn’s, Inc.* | 252 | 6,383 | ||||||
Destination Maternity Corp. | 294 | 5,574 | ||||||
Express, Inc.* | 374 | 4,163 | ||||||
Finish Line, Inc.(The) — Class A | 249 | 5,180 | ||||||
Five Below, Inc.* | 145 | 4,805 | ||||||
Francesca’s Holdings Corp.* | 186 | 5,493 | ||||||
Genesco, Inc.* | 84 | 4,813 | ||||||
Group 1 Automotive, Inc. | 94 | 5,829 | ||||||
Haverty Furniture Cos., Inc. | 409 | 6,139 | ||||||
hhgregg, Inc.* | 794 | 4,796 | ||||||
Hibbett Sports, Inc.* | 95 | 5,129 | ||||||
HOT Topic, Inc. | 645 | 5,547 | ||||||
JOS A Bank Clothiers, Inc.* | 116 | 5,428 | ||||||
Kirkland’s, Inc.* | 561 | 5,380 | ||||||
Lithia Motors, Inc. — Class A | 172 | 5,882 | ||||||
Lumber Liquidators Holdings, Inc.* | 110 | 6,140 | ||||||
MarineMax, Inc.* | 649 | 5,341 | ||||||
Mattress Firm Holding Corp.* | 194 | 6,210 | ||||||
Men’s Wearhouse, Inc.(The) | 163 | 5,345 | ||||||
Monro Muffler Brake, Inc. | 158 | 5,359 | ||||||
New York & Co., Inc.* | 1,562 | 5,264 | ||||||
Office Depot, Inc.* | 2,179 | 5,404 | ||||||
OfficeMax, Inc. | 714 | 5,248 | ||||||
Penske Automotive Group, Inc. | 184 | 5,630 | ||||||
Pep Boys- Manny, Moe & Jack | 558 | 5,574 | ||||||
Pier 1 Imports, Inc. | 299 | 6,100 | ||||||
RadioShack Corp.a | 2,196 | 4,919 | ||||||
Rent-A-Center, Inc. | 158 | 5,266 | ||||||
Rue21, Inc.* | 180 | 5,420 | ||||||
Select Comfort Corp.* | 178 | 4,954 | ||||||
Shoe Carnival, Inc. | 238 | 5,564 | ||||||
Sonic Automotive, Inc. — Class A | 296 | 5,742 | ||||||
Stage Stores, Inc. | 264 | 6,468 | ||||||
Stein Mart, Inc.* | 662 | 5,203 | ||||||
Systemax, Inc.* | 472 | 5,164 | ||||||
Teavana Holdings, Inc.* | 424 | 4,473 | ||||||
Tilly’s, Inc.* | 314 | 5,068 | ||||||
Vitamin Shoppe, Inc.* | 98 | 5,610 | ||||||
West Marine, Inc.* | 529 | 5,470 | ||||||
Wet Seal, Inc.(The) — Class A* | 1,796 | 5,137 | ||||||
Winmark Corp. | 102 | 5,435 | ||||||
Zumiez, Inc.* | 221 | 5,594 | ||||||
|
| |||||||
Total Specialty Retail | 309,812 | |||||||
|
| |||||||
| SHARES | VALUE | |||||||
Textiles, Apparel & Luxury Goods - 1.1% |
| |||||||
Cherokee, Inc. | 386 | $ | 5,562 | |||||
Columbia Sportswear Co. | 106 | 5,978 | ||||||
Crocs, Inc.* | 345 | 4,347 | ||||||
Culp, Inc. | 1,116 | 14,106 | ||||||
Delta Apparel, Inc.* | 405 | 6,132 | ||||||
Fifth & Pacific Cos., Inc.* | 435 | 4,776 | ||||||
G-III Apparel Group Ltd.* | 157 | 5,803 | ||||||
Iconix Brand Group, Inc.* | 310 | 5,738 | ||||||
Jones Group, Inc.(The) | 439 | 5,185 | ||||||
K-Swiss, Inc. — Class A* | 1,814 | 4,136 | ||||||
Maidenform Brands, Inc.* | 261 | 4,883 | ||||||
Movado Group, Inc. | 165 | 5,229 | ||||||
Oxford Industries, Inc. | 100 | 5,548 | ||||||
Perry Ellis International, Inc.* | 257 | 5,305 | ||||||
Quiksilver, Inc.* | 1,698 | 5,434 | ||||||
R.G. Barry Corp. | 383 | 5,837 | ||||||
Skechers U.S.A., Inc. — Class A* | 285 | 4,731 | ||||||
Steven Madden Ltd.* | 134 | 5,751 | ||||||
True Religion Apparel, Inc. | 261 | 6,695 | ||||||
Tumi Holdings, Inc.* | 233 | 5,219 | ||||||
Unifi, Inc.* | 1,044 | 14,647 | ||||||
Vera Bradley, Inc.*,a | 245 | 7,303 | ||||||
Warnaco Group, Inc.(The)* | 111 | 7,834 | ||||||
Wolverine World Wide, Inc. | 126 | 5,276 | ||||||
|
| |||||||
Total Textiles, Apparel & Luxury Goods | 151,455 | |||||||
|
| |||||||
Thrifts & Mortgage Finance - 1.4% |
| |||||||
Astoria Financial Corp. | 338 | 3,390 | ||||||
Bank Mutual Corp. | 769 | 3,468 | ||||||
BankFinancial Corp. | 389 | 3,124 | ||||||
Beneficial Mutual Bancorp, Inc.* | 359 | 3,403 | ||||||
Berkshire Hills Bancorp, Inc. | 154 | 3,616 | ||||||
BofI Holding, Inc.* | 134 | 3,768 | ||||||
Brookline Bancorp, Inc. | 390 | 3,307 | ||||||
Cape Bancorp, Inc.* | 373 | 3,305 | ||||||
Charter Financial Corp. | 358 | 3,498 | ||||||
Clifton Savings Bancorp, Inc. | 325 | 3,594 | ||||||
Dime Community Bancshares, Inc. | 240 | 3,480 | ||||||
Doral Financial Corp.* | 3,324 | 3,157 | ||||||
ESB Financial Corp. | 250 | 3,373 | ||||||
ESSA Bancorp, Inc. | 345 | 3,478 | ||||||
EverBank Financial Corp. | 263 | 4,008 | ||||||
Federal Agricultural Mortgage Corp. — Class C | 135 | 3,803 | ||||||
First Defiance Financial Corp. | 197 | 3,487 | ||||||
First Federal Bancshares of Arkansas, Inc.* | 356 | 3,578 | ||||||
First Financial Holdings, Inc. | 271 | 3,821 | ||||||
First Financial Northwest, Inc.* | 437 | 3,452 | ||||||
First Pactrust Bancorp, Inc. | 278 | 3,269 | ||||||
Flushing Financial Corp. | 221 | 3,437 | ||||||
Fox Chase Bancorp, Inc. | 228 | 3,548 | ||||||
Franklin Financial Corp.* | 203 | 3,498 | ||||||
Heritage Financial Group, Inc. | 260 | 3,479 | ||||||
| See Notes to Financial Statements. | GUGGENHEIM ETFS ANNUAL REPORT | 97 |
Table of Contents
| SCHEDULE OF INVESTMENTS (continued) | October 31, 2012 |
GUGGENHEIM RUSSELL 2000® EQUAL WEIGHT ETF
| SHARES | VALUE | |||||||
Hingham Institution for Savings | 54 | $ | 3,669 | |||||
Home Bancorp, Inc.* | 191 | 3,612 | ||||||
Home Federal Bancorp, Inc. | 308 | 3,517 | ||||||
Home Loan Servicing Solutions Ltd. | 218 | 4,229 | ||||||
HomeStreet, Inc.* | 94 | 4,209 | ||||||
Kaiser Federal Financial Group, Inc. | 226 | 3,487 | ||||||
Kearny Financial Corp. | 353 | 3,336 | ||||||
Meridian Interstate Bancorp, Inc.* | 214 | 3,614 | ||||||
MGIC Investment Corp.* | 2,342 | 4,028 | ||||||
NASB Financial, Inc.* | 152 | 3,481 | ||||||
Nationstar Mortgage Holdings, Inc.* | 106 | 3,830 | ||||||
Northfield Bancorp, Inc. | 222 | 3,605 | ||||||
Northwest Bancshares, Inc. | 282 | 3,356 | ||||||
OceanFirst Financial Corp. | 237 | 3,304 | ||||||
Ocwen Financial Corp.* | 126 | 4,860 | ||||||
Oritani Financial Corp. | 234 | 3,576 | ||||||
Peoples Federal Bancshares, Inc. | 202 | 3,444 | ||||||
Provident Financial Holdings, Inc. | 250 | 3,692 | ||||||
Provident Financial Services, Inc. | 220 | 3,300 | ||||||
Provident New York Bancorp | 365 | 3,332 | ||||||
Radian Group, Inc. | 812 | 3,808 | ||||||
Rockville Financial, Inc. | 296 | 3,934 | ||||||
Roma Financial Corp. | 367 | 3,233 | ||||||
SI Financial Group, Inc. | 300 | 3,300 | ||||||
Territorial Bancorp, Inc. | 150 | 3,390 | ||||||
Tree.com, Inc.* | 226 | 3,266 | ||||||
TrustCo Bank Corp. NY | 601 | 3,354 | ||||||
United Financial Bancorp, Inc. | 242 | 3,720 | ||||||
ViewPoint Financial Group, Inc. | 182 | 3,786 | ||||||
Walker & Dunlop, Inc.* | 227 | 3,770 | ||||||
Waterstone Financial, Inc.* | 695 | 3,753 | ||||||
Westfield Financial, Inc. | 465 | 3,390 | ||||||
WSFS Financial Corp. | 85 | 3,600 | ||||||
|
| |||||||
Total Thrifts & Mortgage Finance | 207,126 | |||||||
|
| |||||||
Tobacco - 0.8% |
| |||||||
Alliance One International, Inc.* | 9,747 | 29,631 | ||||||
Star Scientific, Inc.*,a | 9,484 | 28,736 | ||||||
Universal Corp. | 628 | 31,124 | ||||||
Vector Group Ltd. | 1,904 | 31,340 | ||||||
|
| |||||||
Total Tobacco | 120,831 | |||||||
|
| |||||||
Trading Companies & Distributors - 1.0% |
| |||||||
Aceto Corp. | 1,427 | 14,299 | ||||||
Aircastle Ltd. | 554 | 6,166 | ||||||
Applied Industrial Technologies, Inc. | 149 | 6,048 | ||||||
Beacon Roofing Supply, Inc.* | 475 | 15,361 | ||||||
CAI International, Inc.* | 308 | 6,825 | ||||||
DXP Enterprises, Inc.* | 131 | 6,449 | ||||||
Edgen Group, Inc.* | 1,783 | 13,569 | ||||||
H&E Equipment Services, Inc. | 515 | 7,838 | ||||||
Houston Wire & Cable Co. | 581 | 6,432 | ||||||
Kaman Corp. | 176 | 6,547 | ||||||
Rush Enterprises, Inc. — Class A* | 334 | 6,346 | ||||||
SeaCube Container Leasing Ltd. | 346 | 6,408 | ||||||
TAL International Group, Inc. | 187 | 6,384 | ||||||
| SHARES | VALUE | |||||||
Textainer Group Holdings Ltd. | 210 | $ | 6,342 | |||||
Titan Machinery, Inc.* | 318 | 7,521 | ||||||
Watsco, Inc. | 172 | 11,756 | ||||||
Willis Lease Finance Corp.* | 514 | 7,309 | ||||||
|
| |||||||
Total Trading Companies & Distributors | 141,600 | |||||||
|
| |||||||
Transportation Infrastructure - 0.0%b |
| |||||||
Wesco Aircraft Holdings, Inc.* | 434 | 5,794 | ||||||
|
| |||||||
Total Transportation Infrastructure | 5,794 | |||||||
|
| |||||||
Water Utilities - 1.4% |
| |||||||
American States Water Co. | 674 | 29,669 | ||||||
Artesian Resources Corp. — Class A | 1,272 | 29,269 | ||||||
California Water Service Group | 1,585 | 29,196 | ||||||
Connecticut Water Service, Inc. | 939 | 28,762 | ||||||
Middlesex Water Co. | 1,525 | 29,493 | ||||||
SJW Corp. | 1,159 | 28,094 | ||||||
York Water Co. | 1,600 | 27,792 | ||||||
|
| |||||||
Total Water Utilities | 202,275 | |||||||
|
| |||||||
Wireless Telecommunication Services - 0.7% |
| |||||||
Leap Wireless International, Inc.*,a | 4,390 | 23,443 | ||||||
NTELOS Holdings Corp. | 1,749 | 26,672 | ||||||
Shenandoah Telecommunications Co. | 1,662 | 26,127 | ||||||
USA Mobility, Inc. | 2,470 | 27,293 | ||||||
|
| |||||||
Total Wireless Telecommunication Services | 103,535 | |||||||
|
| |||||||
Total Common Stocks |
| 14,214,895 | ||||||
|
| |||||||
SHORT TERM INVESTMENTS - 0.7% |
| |||||||
SSgA Government Money Market Fund | 99,170 | 99,170 | ||||||
|
| |||||||
Total Short Term Investments | 99,170 | |||||||
|
| |||||||
FACE | ||||||||
SECURITIES LENDING COLLATERAL - 2.2%e |
| |||||||
Joint Repurchase Agreements: | ||||||||
Merrill Lynch, Fenner & Smith, Inc. | $ | 118,714 | 118,714 | |||||
| 98 | GUGGENHEIM ETFS ANNUAL REPORT | See Notes to Financial Statements. |
Table of Contents
| SCHEDULE OF INVESTMENTS (concluded) | October 31, 2012 |
GUGGENHEIM RUSSELL 2000® EQUAL WEIGHT ETF
| FACE AMOUNT | VALUE | |||||||
RBS Securities, Inc. | $ | 201,844 | $ | 201,844 | ||||
|
| |||||||
Total Securities Lending Collateral | 320,558 | |||||||
|
| |||||||
Total Investments - 102.2%d |
| 14,634,623 | ||||||
|
| |||||||
Other Assets and Liabilities, net - (2.2)%b |
| (316,915 | ) | |||||
|
| |||||||
Net Assets - 100.0% | $ | 14,317,708 | ||||||
|
| |||||||
| * | Non-Income Producing Security. |
| a | All or a portion of this security was on loan as of October 31, 2012. |
| b | Amount represents less than 0.05% of net assets. |
| c | Values determined based on Level 2 inputs (Note F). |
| d | Unless otherwise indicated, the values of the Investments are determined based on Level 1 inputs. |
| e | Securities lending collateral (Note I). |
| See Notes to Financial Statements. | GUGGENHEIM ETFS ANNUAL REPORT | 99 |
Table of Contents
| SCHEDULE OF INVESTMENTS | October 31, 2012 |
GUGGENHEIM MSCI EAFE EQUAL WEIGHT ETF
| SHARES | VALUE | |||||||
COMMON STOCKS - 99.4% |
| |||||||
Aerospace & Defense - 1.1% |
| |||||||
BAE Systems PLC | 2,580 | $ | 12,977 | |||||
Cobham PLC | 3,741 | 12,958 | ||||||
European Aeronautic Defence and Space Co. NV | 346 | 12,289 | ||||||
Finmeccanica SpA* | 2,915 | 14,437 | ||||||
Meggitt PLC | 2,007 | 12,481 | ||||||
Rolls-Royce Holdings PLC — Class C* | 942 | 12,968 | ||||||
Safran SA | 357 | 14,199 | ||||||
Thales SA | 389 | 13,678 | ||||||
Zodiac Aerospace | 133 | 13,611 | ||||||
|
| |||||||
Total Aerospace & Defense | 119,598 | |||||||
|
| |||||||
Air Freight & Logistics - 0.5% |
| |||||||
Deutsche Post AG | 672 | 13,318 | ||||||
TNT Express NV | 1,151 | 12,120 | ||||||
Toll Holdings Ltd. | 2,685 | 12,362 | ||||||
Yamato Holdings Co., Ltd. | 900 | 13,681 | ||||||
|
| |||||||
Total Air Freight & Logistics | 51,481 | |||||||
|
| |||||||
Airlines - 1.0% |
| |||||||
All Nippon Airways Co., Ltd. | 6,000 | 12,686 | ||||||
Cathay Pacific Airways Ltd. | 9,000 | 16,304 | ||||||
Deutsche Lufthansa AG | 1,056 | 16,133 | ||||||
International Consolidated Airlines | 5,718 | 15,019 | ||||||
Qantas Airways Ltd.* | 10,771 | 14,855 | ||||||
Ryanair Holdings PLC ADR* | 296 | 9,546 | ||||||
Singapore Airlines Ltd. | 3,000 | 26,065 | ||||||
|
| |||||||
Total Airlines | 110,608 | |||||||
|
| |||||||
Auto Components - 1.6% |
| |||||||
Aisin Seiki Co., Ltd. | 300 | 8,715 | ||||||
Bridgestone Corp. | 600 | 13,955 | ||||||
Cie Generale des Etablissements | 181 | 15,541 | ||||||
Continental AG | 130 | 13,027 | ||||||
Denso Corp. | 300 | 9,379 | ||||||
GKN PLC | 3,829 | 12,806 | ||||||
NHK Spring Co., Ltd. | 1,200 | 9,984 | ||||||
NOK Corp. | 900 | 14,390 | ||||||
Nokian Renkaat OYJ | 334 | 13,849 | ||||||
Pirelli & C SpA | 1,187 | 13,743 | ||||||
Stanley Electric Co., Ltd. | 900 | 12,386 | ||||||
Sumitomo Rubber Industries Ltd. | 1,200 | 14,097 | ||||||
Toyota Boshoku Corp. | 1,200 | 11,335 | ||||||
Toyota Industries Corp. | 600 | 17,115 | ||||||
|
| |||||||
Total Auto Components | 180,322 | |||||||
|
| |||||||
Automobiles - 2.0% |
| |||||||
Bayerische Motoren Werke AG | 178 | 14,173 | ||||||
Daimler AG | 248 | 11,577 | ||||||
Fiat SpA* | 2,277 | 11,094 | ||||||
Fuji Heavy Industries Ltd. | 3,000 | 28,788 | ||||||
Honda Motor Co., Ltd. | 300 | 8,970 | ||||||
Isuzu Motors Ltd. | 3,000 | 15,839 | ||||||
| SHARES | VALUE | |||||||
Mazda Motor Corp.* | 12,000 | $ | 14,262 | |||||
Mitsubishi Motors Corp.* | 15,000 | 12,949 | ||||||
Nissan Motor Co., Ltd. | 1,500 | 12,536 | ||||||
Peugeot SA* | 1,707 | 10,918 | ||||||
Porsche Automobil Holding SE | 249 | 16,526 | ||||||
Renault SA | 278 | 12,432 | ||||||
Suzuki Motor Corp. | 600 | 13,572 | ||||||
Toyota Motor Corp. | 300 | 11,504 | ||||||
Volkswagen AG | 75 | 15,511 | ||||||
Yamaha Motor Co., Ltd. | 1,500 | 14,319 | ||||||
|
| |||||||
Total Automobiles | 224,970 | |||||||
|
| |||||||
Beverages - 1.2% |
| |||||||
Anheuser-Busch InBev NV | 154 | 12,873 | ||||||
Asahi Group Holdings Ltd. | 600 | 13,655 | ||||||
Carlsberg A/S — Class B | 156 | 13,455 | ||||||
Coca-Cola Amatil Ltd. | 962 | 13,417 | ||||||
Diageo PLC | 468 | 13,353 | ||||||
Heineken Holding NV | 285 | 14,458 | ||||||
Heineken NV | 232 | 14,299 | ||||||
Pernod-Ricard SA | 124 | 13,341 | ||||||
Remy Cointreau SA | 112 | 11,613 | ||||||
SABMiller PLC | 290 | 12,402 | ||||||
|
| |||||||
Total Beverages | 132,866 | |||||||
|
| |||||||
Biotechnology - 0.4% |
| |||||||
Actelion Ltd.* | 275 | 13,266 | ||||||
CSL Ltd. | 284 | 13,988 | ||||||
Grifols SA* | 462 | 16,020 | ||||||
|
| |||||||
Total Biotechnology | 43,274 | |||||||
|
| |||||||
Building Products - 1.0% |
| |||||||
Asahi Glass Co., Ltd. | 3,000 | 20,343 | ||||||
Assa Abloy AB — Series B | 426 | 14,195 | ||||||
Cie de St-Gobain | 379 | 13,353 | ||||||
Daikin Industries Ltd. | 600 | 16,574 | ||||||
Geberit AG* | 60 | 12,371 | ||||||
LIXIL Group Corp. | 600 | 13,249 | ||||||
TOTO Ltd. | 3,000 | 22,445 | ||||||
|
| |||||||
Total Building Products | 112,530 | |||||||
|
| |||||||
Capital Markets - 2.4% |
| |||||||
3i Group PLC | 3,937 | 13,662 | ||||||
Aberdeen Asset Management PLC | 2,944 | 15,391 | ||||||
Credit Suisse Group AG* | 684 | 15,859 | ||||||
Daiwa Securities Group, Inc. | 3,000 | 11,935 | ||||||
Deutsche Bank AG | 376 | 17,038 | ||||||
GAM Holding AG* | 1,123 | 15,678 | ||||||
ICAP PLC | 2,546 | 13,335 | ||||||
Investec PLC | 2,253 | 13,227 | ||||||
Julius Baer Group Ltd.* | 391 | 13,562 | ||||||
Macquarie Group Ltd. | 469 | 15,514 | ||||||
Man Group PLC | 11,341 | 14,333 | ||||||
Mediobanca SpA | 2,832 | 16,132 | ||||||
Nomura Holdings, Inc. | 3,700 | 13,332 | ||||||
Partners Group Holding AG | 68 | 14,393 | ||||||
Ratos AB | 1,458 | 12,514 | ||||||
| 100 | GUGGENHEIM ETFS ANNUAL REPORT | See Notes to Financial Statements. |
Table of Contents
| SCHEDULE OF INVESTMENTS (continued) | October 31, 2012 |
GUGGENHEIM MSCI EAFE EQUAL WEIGHT ETF
| SHARES | VALUE | |||||||
SBI Holdings, Inc.a | 2,100 | $ | 14,660 | |||||
Schroders PLC | 580 | 14,240 | ||||||
UBS AG* | 1,162 | 17,420 | ||||||
|
| |||||||
Total Capital Markets | 262,225 | |||||||
|
| |||||||
Chemicals - 4.9% |
| |||||||
Air Liquide SA | 111 | 13,089 | ||||||
Akzo Nobel NV | 225 | 12,237 | ||||||
Arkema SA | 154 | 14,037 | ||||||
Asahi Kasei Corp. | 3,000 | 16,477 | ||||||
BASF SE | 162 | 13,420 | ||||||
Croda International PLC | 345 | 12,233 | ||||||
Daicel Corp. | 3,000 | 17,978 | ||||||
Denki Kagaku Kogyo KK | 3,000 | 9,233 | ||||||
Givaudan SA* | 15 | 15,013 | ||||||
Hitachi Chemical Co., Ltd. | 900 | 12,667 | ||||||
Incitec Pivot Ltd. | 4,314 | 14,136 | ||||||
Israel Chemicals Ltd. | 1,201 | 15,019 | ||||||
Israel Corp., Ltd.(The) | 24 | 16,304 | ||||||
Johnson Matthey PLC | 337 | 12,210 | ||||||
JSR Corp. | 900 | 15,403 | ||||||
K+S AG | 270 | 12,770 | ||||||
Koninklijke DSM NV | 275 | 14,117 | ||||||
Kuraray Co., Ltd. | 1,200 | 13,917 | ||||||
Lanxess AG | 173 | 14,287 | ||||||
Linde AG | 83 | 13,955 | ||||||
Mitsubishi Chemical Holdings Corp. | 3,000 | 11,860 | ||||||
Mitsubishi Gas Chemical Co., Inc. | 3,000 | 14,788 | ||||||
Mitsui Chemicals, Inc. | 6,000 | 12,386 | ||||||
Nitto Denko Corp. | 300 | 13,587 | ||||||
Novozymes A/S — Series B | 465 | 12,844 | ||||||
Orica Ltd. | 518 | 13,493 | ||||||
Shin-Etsu Chemical Co., Ltd. | 300 | 16,890 | ||||||
Showa Denko KKa | 9,000 | 13,737 | ||||||
Sika AG | 6 | 12,519 | ||||||
Solvay SA | 112 | 13,462 | ||||||
Sumitomo Chemical Co., Ltd. | 6,000 | 16,815 | ||||||
Syngenta AG | 37 | 14,455 | ||||||
Taiyo Nippon Sanso Corp. | 3,000 | 16,439 | ||||||
Teijin Ltd. | 6,000 | 13,737 | ||||||
Toray Industries, Inc. | 3,000 | 17,490 | ||||||
Tosoh Corp. | 6,000 | 11,710 | ||||||
Ube Industries Ltd. | 6,000 | 13,662 | ||||||
Wacker Chemie AGa | 201 | 11,351 | ||||||
Yara International ASA | 263 | 12,373 | ||||||
|
| |||||||
Total Chemicals | 542,100 | |||||||
|
| |||||||
Commercial Banks - 7.2% |
| |||||||
Aozora Bank Ltd. | 3,000 | 8,445 | ||||||
Australia & New Zealand Banking Group Ltd. | 503 | 13,274 | ||||||
Banca Monte dei Paschi di Siena SpA* | 47,460 | 13,099 | ||||||
Banco Bilbao Vizcaya Argentaria SA | 1,776 | 14,814 | ||||||
Banco de Sabadell SAa | 4,889 | 11,898 | ||||||
Banco Espirito Santo SA* | 19,272 | 18,730 | ||||||
Banco Popolare SC* | 9,041 | 14,410 | ||||||
| SHARES | VALUE | |||||||
Banco Popular Espanol SAa | 5,810 | $ | 9,057 | |||||
Banco Santander SA | 1,912 | 14,343 | ||||||
Bank Hapoalim BM* | 4,181 | 16,417 | ||||||
Bank Leumi Le-Israel BM* | 5,640 | 18,141 | ||||||
Bank of East Asia Ltd. | 3,600 | 13,355 | ||||||
Bank of Yokohama Ltd.(The) | 3,000 | 13,775 | ||||||
Bankia SA* | 7,591 | 11,410 | ||||||
Banque Cantonale Vaudoise | 23 | 12,189 | ||||||
Barclays PLC | 4,414 | 16,178 | ||||||
Bendigo and Adelaide Bank Ltd. | 1,656 | 13,875 | ||||||
BNP Paribas SA | 302 | 15,188 | ||||||
BOC Hong Kong Holdings Ltd. | 4,500 | 13,848 | ||||||
CaixaBank | 3,495 | 13,224 | ||||||
Chiba Bank Ltd.(The) | 3,000 | 17,490 | ||||||
Commerzbank AG* | 8,232 | 15,766 | ||||||
Commonwealth Bank of Australia | 231 | 13,833 | ||||||
Credit Agricole SA* | 2,388 | 17,972 | ||||||
Danske Bank A/S* | 755 | 11,804 | ||||||
DnB ASA | 1,145 | 14,279 | ||||||
Erste Group Bank AG* | 656 | 16,470 | ||||||
Fukuoka Financial Group, Inc. | 3,000 | 11,710 | ||||||
Hang Seng Bank Ltd. | 900 | 13,819 | ||||||
HSBC Holdings PLC | 1,472 | 14,438 | ||||||
Intesa Sanpaolo SpA | 8,505 | 13,655 | ||||||
KBC Groep NV | 604 | 14,174 | ||||||
Lloyds Banking Group PLC* | 24,361 | 15,924 | ||||||
Mitsubishi UFJ Financial Group, Inc. | 2,700 | 12,194 | ||||||
Mizuho Financial Group, Inc. | 8,100 | 12,667 | ||||||
National Australia Bank Ltd. | 518 | 13,853 | ||||||
National Bank of Greece SA ADR* | 7,835 | 18,569 | ||||||
Natixis | 4,867 | 15,943 | ||||||
Nordea Bank AB | 1,452 | 13,184 | ||||||
Oversea-Chinese Banking Corp., Ltd. | 3,000 | 22,376 | ||||||
Raiffeisen Bank International AG | 393 | 15,710 | ||||||
Resona Holdings, Inc. | 3,300 | 14,244 | ||||||
Royal Bank of Scotland Group PLC* | 3,552 | 15,794 | ||||||
Seven Bank Ltd. | 4,800 | 13,692 | ||||||
Shinsei Bank Ltd. | 12,000 | 17,565 | ||||||
Skandinaviska Enskilda Banken | 1,722 | 14,274 | ||||||
Societe Generale* | 497 | 15,794 | ||||||
Standard Chartered PLC | 580 | 13,675 | ||||||
Sumitomo Mitsui Financial Group, Inc. | 300 | 9,173 | ||||||
Sumitomo Mitsui Trust Holdings, Inc. | 6,000 | 18,166 | ||||||
Svenska Handelsbanken AB | 373 | 12,772 | ||||||
Swedbank AB | 746 | 13,829 | ||||||
UniCredit SpA* | 3,347 | 14,772 | ||||||
Unione di Banche Italiane SCPA | 3,959 | 15,554 | ||||||
Westpac Banking Corp. | 506 | 13,385 | ||||||
|
| |||||||
Total Commercial Banks | 794,189 | |||||||
|
| |||||||
Commercial Services & Supplies - 1.3% |
| |||||||
Aggreko PLC | 354 | 12,262 | ||||||
Babcock International Group PLC | 893 | 14,070 | ||||||
Brambles Ltd. | 1,762 | 13,265 | ||||||
| See Notes to Financial Statements. | GUGGENHEIM ETFS ANNUAL REPORT | 101 |
Table of Contents
| SCHEDULE OF INVESTMENTS (continued) | October 31, 2012 |
GUGGENHEIM MSCI EAFE EQUAL WEIGHT ETF
| SHARES | VALUE | |||||||
Edenred | 482 | $ | 13,944 | |||||
G4S PLC | 3,179 | 13,341 | ||||||
Secom Co., Ltd. | 300 | 15,257 | ||||||
Securitas AB | 1,712 | 12,446 | ||||||
Serco Group PLC | 1,443 | 13,170 | ||||||
Societe BIC SA | 121 | 14,751 | ||||||
Toppan Printing Co., Ltd. | 3,000 | 17,303 | ||||||
|
| |||||||
Total Commercial Services & Supplies | 139,809 | |||||||
|
| |||||||
Communications Equipment - 0.3% |
| |||||||
Alcatel-Lucenta | 11,366 | 11,562 | ||||||
Nokia OYJ | 4,353 | 11,721 | ||||||
Telefonaktiebolaget LM Ericsson — Class B | 1,356 | 11,914 | ||||||
|
| |||||||
Total Communications Equipment | 35,197 | |||||||
|
| |||||||
Computers & Peripherals - 0.4% |
| |||||||
Fujitsu Ltd. | 3,000 | 11,522 | ||||||
Gemalto NV | 163 | 14,705 | ||||||
Seiko Epson Corp. | 2,100 | 11,639 | ||||||
Toshiba Corp. | 3,000 | 11,110 | ||||||
|
| |||||||
Total Computers & Peripherals | 48,976 | |||||||
|
| |||||||
Construction & Engineering - 1.7% |
| |||||||
ACS Actividades de Construccion y | 691 | 14,747 | ||||||
Balfour Beatty PLC | 2,762 | 14,026 | ||||||
Bouygues SA | 533 | 12,815 | ||||||
Ferrovial SA | 1,089 | 15,381 | ||||||
Hochtief AG* | 278 | 13,783 | ||||||
Kajima Corp. | 6,000 | 16,590 | ||||||
Koninklijke Boskalis Westminster NV | 379 | 14,434 | ||||||
Leighton Holdings Ltd. | 769 | 14,274 | ||||||
Obayashi Corp. | 3,000 | 13,399 | ||||||
Shimizu Corp. | 3,000 | 10,021 | ||||||
Skanska AB — Class B | 882 | 13,784 | ||||||
Taisei Corp. | 6,000 | 16,514 | ||||||
Vinci SA | 299 | 13,229 | ||||||
|
| |||||||
Total Construction & Engineering | 182,997 | |||||||
|
| |||||||
Construction Materials - 1.0% |
| |||||||
Boral Ltd. | 3,532 | 13,148 | ||||||
CRH PLC ADR | 592 | 11,041 | ||||||
Fletcher Building Ltd. | 2,549 | 14,753 | ||||||
HeidelbergCement AG | 261 | 13,829 | ||||||
Holcim Ltd.* | 213 | 14,536 | ||||||
James Hardie Industries PLC | 1,497 | 14,328 | ||||||
Lafarge SA | 272 | 15,924 | ||||||
Taiheiyo Cement Corp. | 6,000 | 12,761 | ||||||
|
| |||||||
Total Construction Materials | 110,320 | |||||||
|
| |||||||
Consumer Finance - 0.2% |
| |||||||
Aeon Credit Service Co., Ltd. | 600 | 12,716 | ||||||
Credit Saison Co., Ltd. | 600 | 13,159 | ||||||
|
| |||||||
Total Consumer Finance | 25,875 | |||||||
|
| |||||||
Containers & Packaging - 0.4% |
| |||||||
Amcor Ltd. | 1,604 | 13,140 | ||||||
| SHARES | VALUE | |||||||
Rexam PLC | 1,924 | $ | 13,846 | |||||
Toyo Seikan Kaisha Ltd. | 1,200 | 12,731 | ||||||
|
| |||||||
Total Containers & Packaging | 39,717 | |||||||
|
| |||||||
Distributors - 0.1% |
| |||||||
Li & Fung Ltd. | 6,000 | 10,064 | ||||||
|
| |||||||
Total Distributors | 10,064 | |||||||
|
| |||||||
Diversified Consumer Services - 0.1% |
| |||||||
Benesse Holdings, Inc. | 300 | 14,431 | ||||||
|
| |||||||
Total Diversified Consumer Services | 14,431 | |||||||
|
| |||||||
Diversified Financial Services - 1.9% |
| |||||||
ASX Ltd. | 403 | 12,411 | ||||||
Deutsche Boerse AG | 245 | 13,258 | ||||||
Exor SpA | 546 | 14,065 | ||||||
First Pacific Co., Ltd. | 11,910 | 13,262 | ||||||
Groupe Bruxelles Lambert SA | 189 | 13,950 | ||||||
Hong Kong Exchanges and Clearing Ltd. | 900 | 14,853 | ||||||
ING Groep NV* | 1,725 | 15,236 | ||||||
Investment AB Kinnevik — Class B | 676 | 12,908 | ||||||
Investor AB — Series B | 627 | 13,824 | ||||||
London Stock Exchange Group PLC | 826 | 12,981 | ||||||
Mitsubishi UFJ Lease & Finance Co., Ltd. | 300 | 12,911 | ||||||
ORIX Corp. | 150 | 15,388 | ||||||
Pohjola Bank PLC — Series A | 1,106 | 15,048 | ||||||
Singapore Exchange Ltd. | 3,000 | 16,549 | ||||||
Wendel SA | 175 | 15,418 | ||||||
|
| |||||||
Total Diversified Financial Services | 212,062 | |||||||
|
| |||||||
Diversified Telecommunication Services - 2.7% |
| |||||||
Belgacom SA | 445 | 13,003 | ||||||
Bezeq The Israeli Telecommunication | 11,463 | 13,969 | ||||||
BT Group PLC | 3,666 | 12,550 | ||||||
Deutsche Telekom AG | 1,083 | 12,362 | ||||||
Elisa OYJ | 621 | 13,310 | ||||||
France Telecom SA | 941 | 10,489 | ||||||
Iliad SA | 89 | 13,706 | ||||||
Inmarsat PLC | 1,432 | 13,069 | ||||||
Koninklijke KPN NV | 1,511 | 9,537 | ||||||
Nippon Telegraph & Telephone Corp. | 300 | 13,643 | ||||||
Portugal Telecom SGPS SA | 2,613 | 13,141 | ||||||
Singapore Telecommunications Ltd. | 6,000 | 15,835 | ||||||
Swisscom AG | 32 | 13,296 | ||||||
TDC A/S | 1,949 | 13,424 | ||||||
Telecom Corp. of New Zealand Ltd. | 6,697 | 13,241 | ||||||
Telecom Italia SpA | 13,707 | 12,620 | ||||||
Telefonica SA | 997 | 13,126 | ||||||
Telekom Austria AG | 1,596 | 10,051 | ||||||
Telenet Group Holding NV | 331 | 15,173 | ||||||
Telenor ASA | 737 | 14,471 | ||||||
TeliaSonera AB | 1,930 | 12,702 | ||||||
Telstra Corp., Ltd. | 3,249 | 13,948 | ||||||
Vivendi SA | 660 | 13,500 | ||||||
|
| |||||||
Total Diversified Telecommunication Services | 300,166 | |||||||
|
| |||||||
| 102 | GUGGENHEIM ETFS ANNUAL REPORT | See Notes to Financial Statements. |
Table of Contents
| SCHEDULE OF INVESTMENTS (continued) | October 31, 2012 |
GUGGENHEIM MSCI EAFE EQUAL WEIGHT ETF
| SHARES | VALUE | |||||||
Electric Utilities - 2.6% |
| |||||||
Acciona SA | 278 | $ | 17,053 | |||||
Cheung Kong Infrastructure Holdings Ltd. | 3,000 | 17,574 | ||||||
Chubu Electric Power Co., Inc. | 1,200 | 12,356 | ||||||
Chugoku Electric Power Co., Inc.(The) | 900 | 9,661 | ||||||
CLP Holdings Ltd. | 1,500 | 12,794 | ||||||
EDF SA | 627 | 13,264 | ||||||
EDP — Energias de Portugal SA | 5,433 | 14,756 | ||||||
Enel SpA | 3,948 | 14,836 | ||||||
Fortum OYJ | 710 | 13,129 | ||||||
Hokkaido Electric Power Co., Inc. | 1,800 | 14,795 | ||||||
Hokuriku Electric Power Co. | 1,200 | 11,905 | ||||||
Iberdrola SA | 3,311 | 17,119 | ||||||
Kansai Electric Power Co., Inc.(The) | 1,800 | 13,827 | ||||||
Kyushu Electric Power Co., Inc. | 1,800 | 13,624 | ||||||
Power Assets Holdings Ltd. | 1,500 | 12,755 | ||||||
Red Electrica Corp. SA | 296 | 13,875 | ||||||
Shikoku Electric Power Co., Inc. | 1,200 | 12,806 | ||||||
SSE PLC | 562 | 13,110 | ||||||
Terna Rete Elettrica Nazionale SpA | 3,692 | 13,874 | ||||||
Tohoku Electric Power Co., Inc.* | 1,800 | 13,242 | ||||||
Tokyo Electric Power Co., Inc.(The)* | 7,700 | 12,523 | ||||||
|
| |||||||
Total Electric Utilities | 288,878 | |||||||
|
| |||||||
Electrical Equipment - 1.6% |
| |||||||
ABB Ltd. | 752 | 13,551 | ||||||
Alstom SA | 367 | 12,531 | ||||||
Fuji Electric Co., Ltd. | 6,000 | 12,161 | ||||||
Furukawa Electric Co., Ltd.* | 6,000 | 11,935 | ||||||
GS Yuasa Corp. | 3,000 | 11,710 | ||||||
Legrand SA | 375 | 14,442 | ||||||
Mitsubishi Electric Corp. | 3,000 | 22,369 | ||||||
Nidec Corp. | 300 | 21,319 | ||||||
Prysmian SpA | 801 | 15,403 | ||||||
Schneider Electric SA | 204 | 12,751 | ||||||
Sumitomo Electric Industries Ltd. | 1,200 | 12,881 | ||||||
Ushio, Inc. | 1,200 | 12,641 | ||||||
|
| |||||||
Total Electrical Equipment | 173,694 | |||||||
|
| |||||||
Electronic Equipment, Instruments & Components - 1.8% |
| |||||||
Citizen Holdings Co., Ltd. | 2,400 | 12,161 | ||||||
FUJIFILM Holdings Corp. | 900 | 15,156 | ||||||
Hamamatsu Photonics KK | 300 | 10,378 | ||||||
Hexagon AB — Class B | 660 | 15,178 | ||||||
Hitachi High-Technologies Corp. | 600 | 13,114 | ||||||
Hitachi Ltd. | 3,000 | 15,876 | ||||||
Hoya Corp. | 600 | 12,131 | ||||||
Ibiden Co., Ltd. | 900 | 11,316 | ||||||
Kyocera Corp. | 300 | 26,310 | ||||||
Murata Manufacturing Co., Ltd. | 300 | 14,563 | ||||||
Omron Corp. | 600 | 11,935 | ||||||
Shimadzu Corp. | 3,000 | 20,155 | ||||||
TDK Corp. | 300 | 11,249 | ||||||
Yokogawa Electric Corp. | 1,200 | 13,632 | ||||||
|
| |||||||
Total Electronic Equipment, Instruments & Components | 203,154 | |||||||
|
| |||||||
| SHARES | VALUE | |||||||
Energy Equipment & Services - 1.5% |
| |||||||
Aker Solutions ASA | 716 | $ | 14,046 | |||||
AMEC PLC | 763 | 13,030 | ||||||
Cie Generale de Geophysique — Veritas* | 459 | 14,994 | ||||||
Fugro NV | 210 | 14,194 | ||||||
Petrofac Ltd. | 559 | 14,445 | ||||||
Saipem SpA | 278 | 12,485 | ||||||
SBM Offshore NV* | 922 | 12,043 | ||||||
Seadrill Ltd. | 317 | 12,815 | ||||||
Subsea 7 SA | 567 | 12,424 | ||||||
Technip SA | 127 | 14,301 | ||||||
Tenaris SA | 621 | 11,612 | ||||||
Transocean Ltd. | 257 | 11,699 | ||||||
WorleyParsons Ltd. | 467 | 11,946 | ||||||
|
| |||||||
Total Energy Equipment & Services | 170,034 | |||||||
|
| |||||||
Food & Staples Retailing - 2.5% |
| |||||||
Aeon Co., Ltd. | 1,200 | 13,076 | ||||||
Carrefour SA | 595 | 14,371 | ||||||
Casino Guichard Perrachon SA | 138 | 12,049 | ||||||
Colruyt SA | 272 | 12,421 | ||||||
Delhaize Group SA | 323 | 12,345 | ||||||
Distribuidora Internacional de | 2,581 | 15,619 | ||||||
FamilyMart Co., Ltd. | 300 | 14,525 | ||||||
J Sainsbury PLC | 2,441 | 13,945 | ||||||
Jeronimo Martins SGPS SA | 772 | 13,505 | ||||||
Kesko OYJ | 468 | 14,645 | ||||||
Koninklijke Ahold NV | 1,030 | 13,110 | ||||||
Lawson, Inc. | 300 | 22,032 | ||||||
Metcash Ltd. | 3,428 | 13,010 | ||||||
Metro AG | 420 | 12,096 | ||||||
Olam International Ltd.a | 9,000 | 14,532 | ||||||
Seven & I Holdings Co., Ltd. | 300 | 9,241 | ||||||
Tesco PLC | 2,451 | 12,630 | ||||||
Wesfarmers Ltd. | 367 | 13,232 | ||||||
WM Morrison Supermarkets PLC | 2,771 | 11,960 | ||||||
Woolworths Ltd. | 429 | 13,083 | ||||||
|
| |||||||
Total Food & Staples Retailing | 271,427 | |||||||
|
| |||||||
Food Products - 1.9% |
| |||||||
Aryzta AG* | 259 | 12,933 | ||||||
Associated British Foods PLC | 616 | 13,745 | ||||||
Danone SA | 207 | 12,721 | ||||||
Golden Agri-Resources Ltd. | 24,000 | 12,295 | ||||||
Kerry Group PLC — Class A | 279 | 14,624 | ||||||
MEIJI Holdings Co., Ltd. | 300 | 13,718 | ||||||
Nestle SA | 207 | 13,138 | ||||||
Nisshin Seifun Group, Inc. | 1,500 | 18,710 | ||||||
Nissin Foods Holdings Co., Ltd. | 300 | 11,335 | ||||||
Suedzucker AG | 386 | 14,953 | ||||||
Tate & Lyle PLC | 1,245 | 14,562 | ||||||
Unilever NV | 372 | 13,656 | ||||||
Unilever PLC | 374 | 13,924 | ||||||
| See Notes to Financial Statements. | GUGGENHEIM ETFS ANNUAL REPORT | 103 |
Table of Contents
| SCHEDULE OF INVESTMENTS (continued) | October 31, 2012 |
GUGGENHEIM MSCI EAFE EQUAL WEIGHT ETF
| SHARES | VALUE | |||||||
Wilmar International Ltd. | 6,000 | $ | 15,196 | |||||
Yakult Honsha Co., Ltd. | 300 | 13,962 | ||||||
|
| |||||||
Total Food Products | 209,472 | |||||||
|
| |||||||
Gas Utilities - 1.1% |
| |||||||
APA Group | 2,600 | 13,912 | ||||||
Enagas SA | 713 | 14,173 | ||||||
Gas Natural SDG SA | 1,048 | 16,255 | ||||||
Hong Kong & China Gas Co., Ltd. | 6,600 | 17,543 | ||||||
Osaka Gas Co., Ltd. | 3,000 | 12,348 | ||||||
Snam SpA | 3,085 | 13,648 | ||||||
Toho Gas Co., Ltd. | 3,000 | 18,166 | ||||||
Tokyo Gas Co., Ltd. | 3,000 | 15,876 | ||||||
|
| |||||||
Total Gas Utilities | 121,921 | |||||||
|
| |||||||
Health Care Equipment & Supplies - 1.4% |
| |||||||
Cie Generale d’Optique Essilor International SA | 138 | 12,437 | ||||||
Cochlear Ltd. | 183 | 13,509 | ||||||
Coloplast A/S — Class B | 65 | 14,250 | ||||||
Elekta AB | 1,016 | 14,470 | ||||||
Getinge AB — Class B | 441 | 13,558 | ||||||
Olympus Corp.* | 600 | 10,464 | ||||||
Smith & Nephew PLC | 1,250 | 13,191 | ||||||
Sonova Holding AG* | 142 | 14,281 | ||||||
Straumann Holding AG | 109 | 13,449 | ||||||
Sysmex Corp. | 300 | 14,094 | ||||||
Terumo Corp. | 300 | 12,911 | ||||||
William Demant Holding A/S* | 151 | 12,984 | ||||||
|
| |||||||
Total Health Care Equipment & Supplies | 159,598 | |||||||
|
| |||||||
Health Care Providers & Services - 0.8% |
| |||||||
Celesio AG | 707 | 13,682 | ||||||
Fresenius Medical Care AG & Co. KGaA | 176 | 12,359 | ||||||
Fresenius SE & Co. KGaA | 122 | 13,912 | ||||||
Miraca Holdings, Inc. | 300 | 12,667 | ||||||
Ramsay Health Care Ltd. | 494 | 12,171 | ||||||
Sonic Healthcare Ltd. | 962 | 12,968 | ||||||
Suzuken Co., Ltd. | 300 | 9,455 | ||||||
|
| |||||||
Total Health Care Providers & Services | 87,214 | |||||||
|
| |||||||
Hotels, Restaurants & Leisure - 2.3% |
| |||||||
Accor SA | 386 | 12,039 | ||||||
Autogrill SpA | 1,520 | 15,530 | ||||||
Carnival PLC | 363 | 14,410 | ||||||
Compass Group PLC | 1,195 | 13,091 | ||||||
Crown Ltd. | 1,417 | 14,282 | ||||||
Echo Entertainment Group Ltd. | 3,074 | 11,188 | ||||||
Galaxy Entertainment Group Ltd.* | 6,000 | 20,632 | ||||||
Genting Singapore PLC | 12,000 | 13,082 | ||||||
Intercontinental Hotels Group PLC | 475 | 11,708 | ||||||
MGM China Holdings Ltd. | 8,281 | 14,959 | ||||||
Sands China Ltd. | 3,600 | 13,541 | ||||||
SJM Holdings Ltd. | 6,000 | 13,068 | ||||||
Sodexo | 161 | 12,386 | ||||||
TABCORP Holdings Ltd. | 4,162 | 12,257 | ||||||
Tatts Group Ltd. | 4,692 | 13,623 | ||||||
| SHARES | VALUE | |||||||
TUI Travel PLC | 3,886 | $ | 15,714 | |||||
Whitbread PLC | 379 | 14,349 | ||||||
Wynn Macau Ltd. | 6,000 | 16,994 | ||||||
|
| |||||||
Total Hotels, Restaurants & Leisure | 252,853 | |||||||
|
| |||||||
Household Durables - 1.2% |
| |||||||
Casio Computer Co., Ltd. | 1,800 | 13,737 | ||||||
Electrolux AB — Series B | 553 | 14,143 | ||||||
Husqvarna AB | 2,710 | 15,716 | ||||||
Panasonic Corp. | 1,800 | 11,575 | ||||||
Rinnai Corp. | 300 | 20,455 | ||||||
Sekisui Chemical Co., Ltd. | 3,000 | 24,584 | ||||||
Sharp Corp. | 6,000 | 12,911 | ||||||
Sony Corp. | 1,200 | 14,323 | ||||||
|
| |||||||
Total Household Durables | 127,444 | |||||||
|
| |||||||
Household Products - 0.5% |
| |||||||
Henkel AG & Co. KGaA | 173 | 13,811 | ||||||
Reckitt Benckiser Group PLC | 222 | 13,412 | ||||||
Svenska Cellulosa AB — Class B | 725 | 14,117 | ||||||
Unicharm Corp. | 300 | 16,214 | ||||||
|
| |||||||
Total Household Products | 57,554 | |||||||
|
| |||||||
Independent Power Producers & Energy Traders - 0.3% |
| |||||||
Electric Power Development Co., Ltd. | 600 | 15,336 | ||||||
Enel Green Power SpA | 8,005 | 13,609 | ||||||
|
| |||||||
Total Independent Power Producers & Energy Traders | 28,945 | |||||||
| �� | |||||||
Industrial Conglomerates - 1.1% |
| |||||||
Fraser and Neave Ltd. | 3,000 | 22,524 | ||||||
Keppel Corp., Ltd. | 3,000 | 26,212 | ||||||
Koninklijke Philips Electronics NV | 565 | 14,123 | ||||||
Orkla ASA | 1,739 | 13,737 | ||||||
SembCorp Industries Ltd. | 3,000 | 13,376 | ||||||
Siemens AG | 136 | 13,665 | ||||||
Smiths Group PLC | 746 | 12,691 | ||||||
|
| |||||||
Total Industrial Conglomerates | 116,328 | |||||||
|
| |||||||
Insurance - 4.5% |
| |||||||
Admiral Group PLC | 680 | 12,138 | ||||||
Aegon NV | 2,612 | 14,581 | ||||||
Ageas | 586 | 14,910 | ||||||
AIA Group Ltd. | 3,600 | 14,261 | ||||||
Allianz SE | 114 | 14,131 | ||||||
AMP Ltd. | 2,802 | 13,336 | ||||||
Assicurazioni Generali SpA | 932 | 15,144 | ||||||
Aviva PLC | 2,527 | 13,492 | ||||||
AXA SA | 908 | 14,431 | ||||||
Baloise Holding AG | 176 | 14,704 | ||||||
Dai-ichi Life Insurance Co., Ltd.(The) | 12 | 13,812 | ||||||
Delta Lloyd NV | 955 | 15,877 | ||||||
Gjensidige Forsikring ASA | 1,015 | 14,809 | ||||||
Hannover Rueckversicherung AG | 213 | 14,979 | ||||||
Insurance Australia Group Ltd. | 3,021 | 14,379 | ||||||
Legal & General Group PLC | 6,348 | 13,704 | ||||||
Mapfre SA | 5,271 | 14,603 | ||||||
MS&AD Insurance Group Holdings | 900 | 15,235 | ||||||
| 104 | GUGGENHEIM ETFS ANNUAL REPORT | See Notes to Financial Statements. |
Table of Contents
| SCHEDULE OF INVESTMENTS (continued) | October 31, 2012 |
GUGGENHEIM MSCI EAFE EQUAL WEIGHT ETF
| SHARES | VALUE | |||||||
Muenchener Rueckversicherungs AG | 92 | $ | 14,782 | |||||
NKSJ Holdings, Inc. | 600 | 10,922 | ||||||
Old Mutual PLC | 4,948 | 13,711 | ||||||
Prudential PLC | 1,039 | 14,203 | ||||||
QBE Insurance Group Ltd. | 979 | 13,380 | ||||||
Resolution Ltd. | 3,742 | 13,160 | ||||||
RSA Insurance Group PLC | 7,132 | 12,903 | ||||||
Sampo OYJ | 453 | 14,194 | ||||||
SCOR SE | 533 | 14,221 | ||||||
Sony Financial Holdings, Inc. | 900 | 16,034 | ||||||
Standard Life PLC | 3,081 | 14,494 | ||||||
Suncorp Group Ltd. | 1,382 | 13,471 | ||||||
Swiss Life Holding AG* | 115 | 14,474 | ||||||
Swiss Re AG* | 207 | 14,305 | ||||||
T&D Holdings, Inc. | 1,200 | 13,091 | ||||||
Tokio Marine Holdings, Inc. | 600 | 15,861 | ||||||
Zurich Insurance Group AG* | 53 | 13,062 | ||||||
|
| |||||||
Total Insurance | 494,794 | |||||||
|
| |||||||
Internet & Catalog Retail - 0.1% |
| |||||||
Rakuten, Inc. | 1,479 | 13,286 | ||||||
|
| |||||||
Total Internet & Catalog Retail | 13,286 | |||||||
|
| |||||||
Internet Software & Services - 0.6% |
| |||||||
Dena Co., Ltd. | 600 | 18,699 | ||||||
Gree, Inc. | 900 | 15,674 | ||||||
United Internet AG | 648 | 12,960 | ||||||
Yahoo Japan Corp. | 40 | 13,747 | ||||||
|
| |||||||
Total Internet Software & Services | 61,080 | |||||||
|
| |||||||
IT Services - 0.9% |
| |||||||
Amadeus IT Holding SA — Series A | 583 | 14,429 | ||||||
AtoS | 222 | 14,904 | ||||||
Cap Gemini SA | 352 | 14,792 | ||||||
Computershare Ltd. | 1,459 | 13,147 | ||||||
Itochu Techno-Solutions Corp. | 300 | 15,501 | ||||||
Nomura Research Institute Ltd. | 600 | 12,724 | ||||||
NTT Data Corp. | 3 | 9,755 | ||||||
|
| |||||||
Total IT Services | 95,252 | |||||||
|
| |||||||
Leisure Equipment & Products - 0.8% |
| |||||||
Namco Bandai Holdings, Inc. | 900 | 14,120 | ||||||
Nikon Corp. | 600 | 15,238 | ||||||
Sankyo Co., Ltd. | 300 | 13,568 | ||||||
Sega Sammy Holdings, Inc. | 600 | 11,297 | ||||||
Shimano, Inc. | 300 | 18,879 | ||||||
Yamaha Corp. | 1,200 | 10,765 | ||||||
|
| |||||||
Total Leisure Equipment & Products | 83,867 | |||||||
|
| |||||||
Life Sciences Tools & Services - 0.2% |
| |||||||
Lonza Group AG* | 284 | 14,398 | ||||||
QIAGEN NV* | 723 | 12,559 | ||||||
|
| |||||||
Total Life Sciences Tools & Services | 26,957 | |||||||
|
| |||||||
Machinery - 4.6% |
| |||||||
Alfa Laval AB | 763 | 13,247 | ||||||
Amada Co., Ltd. | 3,000 | 15,201 | ||||||
Andritz AG | 252 | 15,174 | ||||||
| SHARES | VALUE | |||||||
Atlas Copco AB — Class A | 586 | $ | 14,404 | |||||
Fiat Industrial SpA | 1,244 | 13,468 | ||||||
GEA Group AG | 497 | 15,514 | ||||||
Hino Motors Ltd. | 3,000 | 23,120 | ||||||
Hitachi Construction Machinery Co., Ltd. | 900 | 14,762 | ||||||
IHI Corp. | 6,000 | 12,611 | ||||||
IMI PLC | 967 | 14,870 | ||||||
Invensys PLC | 3,390 | 12,441 | ||||||
Japan Steel Works Ltd.(The) | 3,000 | 17,753 | ||||||
JTEKT Corp. | 1,500 | 11,260 | ||||||
Kawasaki Heavy Industries Ltd. | 6,000 | 12,311 | ||||||
Komatsu Ltd. | 600 | 12,551 | ||||||
Kone OYJ — Class B | 210 | 15,035 | ||||||
Kurita Water Industries Ltd. | 600 | 13,602 | ||||||
Makita Corp. | 300 | 11,842 | ||||||
MAN SE | 142 | 14,317 | ||||||
Metso OYJ | 367 | 12,873 | ||||||
Mitsubishi Heavy Industries Ltd. | 3,000 | 12,611 | ||||||
Nabtesco Corp. | 600 | 11,155 | ||||||
NSK Ltd. | 3,000 | 16,439 | ||||||
NTN Corp. | 6,000 | 10,734 | ||||||
Sandvik AB | 974 | 13,505 | ||||||
Scania AB — Class B | 758 | 14,428 | ||||||
Schindler Holding AG | 104 | 13,704 | ||||||
SembCorp Marine Ltd. | 3,000 | 11,582 | ||||||
SKF AB | 595 | 13,406 | ||||||
Sulzer AG | 98 | 14,186 | ||||||
Sumitomo Heavy Industries Ltd. | 3,000 | 10,734 | ||||||
THK Co., Ltd. | 900 | 14,942 | ||||||
Vallourec SA | 281 | 11,555 | ||||||
Volvo AB — Class B | 1,059 | 14,244 | ||||||
Wartsila OYJ | 405 | 16,379 | ||||||
Weir Group PLC (The) | 494 | 13,864 | ||||||
Yangzijiang Shipbuilding Holdings Ltd. | 18,000 | 13,352 | ||||||
|
| |||||||
Total Machinery | 513,176 | |||||||
|
| |||||||
Marine - 0.9% |
| |||||||
AP Moller — Maersk A/S — Class B | 3 | 20,929 | ||||||
Kawasaki Kisen Kaisha Ltd.* | 9,000 | 11,372 | ||||||
Kuehne + Nagel International AG | 112 | 13,074 | ||||||
Mitsui OSK Lines Ltd. | 6,000 | 14,337 | ||||||
Neptune Orient Lines Ltd.* | 15,000 | 14,262 | ||||||
Nippon Yusen KK | 6,000 | 11,410 | ||||||
Orient Overseas International Ltd. | 3,000 | 18,968 | ||||||
|
| |||||||
Total Marine | 104,352 | |||||||
|
| |||||||
Media - 2.2% |
| |||||||
Axel Springer AG | 288 | 12,349 | ||||||
British Sky Broadcasting Group PLC | 1,086 | 12,405 | ||||||
Dentsu, Inc. | 600 | 14,135 | ||||||
Eutelsat Communications SA | 434 | 13,891 | ||||||
Fairfax Media Ltd. | 28,078 | 11,500 | ||||||
ITV PLC | 9,948 | 13,871 | ||||||
Kabel Deutschland Holding AG | 192 | 13,830 | ||||||
Lagardere SCA | 465 | 12,705 | ||||||
Mediaset SpA | 6,499 | 11,369 | ||||||
| See Notes to Financial Statements. | GUGGENHEIM ETFS ANNUAL REPORT | 105 |
Table of Contents
| SCHEDULE OF INVESTMENTS (continued) | October 31, 2012 |
GUGGENHEIM MSCI EAFE EQUAL WEIGHT ETF
| SHARES | VALUE | |||||||
Modern Times Group AB — Class B | 287 | $ | 8,737 | |||||
Pearson PLC | 662 | 13,278 | ||||||
ProSiebenSat.1 Media AG | 552 | 15,378 | ||||||
Publicis Groupe SA | 256 | 13,788 | ||||||
Reed Elsevier NV | 988 | 13,270 | ||||||
Reed Elsevier PLC | 1,376 | 13,434 | ||||||
SES SA | 497 | 13,750 | ||||||
Singapore Press Holdings Ltd. | 3,000 | 9,934 | ||||||
Wolters Kluwer NV | 719 | 13,910 | ||||||
WPP PLC | 968 | 12,468 | ||||||
|
| |||||||
Total Media | 244,002 | |||||||
|
| |||||||
Metals & Mining - 4.9% |
| |||||||
Acerinox SA | 1,201 | 12,512 | ||||||
Alumina Ltd. | 17,007 | 17,018 | ||||||
Anglo American PLC | 462 | 14,164 | ||||||
Antofagasta PLC | 746 | 15,107 | ||||||
ArcelorMittal | 882 | 13,063 | ||||||
BHP Billiton Ltd. | 383 | 13,602 | ||||||
BHP Billiton PLC | 424 | 13,563 | ||||||
Boliden AB | 914 | 15,965 | ||||||
Daido Steel Co., Ltd. | 3,000 | 12,986 | ||||||
Eurasian Natural Resources Corp. PLC | 2,632 | 13,895 | ||||||
Evraz PLC | 3,587 | 13,650 | ||||||
Fortescue Metals Group Ltd. | 3,482 | 14,732 | ||||||
Fresnillo PLC | 527 | 16,293 | ||||||
Glencore International PLC | 2,209 | 12,208 | ||||||
Iluka Resources Ltd. | 1,347 | 13,856 | ||||||
JFE Holdings, Inc. | 900 | 12,667 | ||||||
Kazakhmys PLC | 1,363 | 15,569 | ||||||
Kobe Steel Ltd. | 15,000 | 13,137 | ||||||
Lonmin PLC | 1,377 | 11,380 | ||||||
Lynas Corp., Ltd.* | 18,791 | 14,224 | ||||||
Mitsubishi Materials Corp. | 6,000 | 17,415 | ||||||
Newcrest Mining Ltd. | 488 | 13,374 | ||||||
Nippon Steel & Sumitomo Metal | 12,000 | 26,423 | ||||||
Norsk Hydro ASA | 3,029 | 13,619 | ||||||
OZ Minerals Ltd. | 2,000 | 16,985 | ||||||
Randgold Resources Ltd. | 133 | 15,856 | ||||||
Rio Tinto Ltd. | 257 | 15,174 | ||||||
Rio Tinto PLC | 302 | 15,105 | ||||||
Salzgitter AG | 349 | 15,098 | ||||||
Sims Metal Management Ltd. | 1,395 | 13,626 | ||||||
SSAB AB — Class A | 1,748 | 12,503 | ||||||
ThyssenKrupp AG | 669 | 15,218 | ||||||
Umicore SA | 275 | 14,110 | ||||||
Vedanta Resources PLC | 949 | 17,338 | ||||||
Voestalpine AG | 448 | 14,107 | ||||||
Xstrata PLC | 899 | 14,181 | ||||||
Yamato Kogyo Co., Ltd. | 300 | 8,411 | ||||||
|
| |||||||
Total Metals & Mining | 538,134 | |||||||
|
| |||||||
Multi-Utilities - 0.9% |
| |||||||
AGL Energy Ltd. | 812 | 12,243 | ||||||
Centrica PLC | 2,419 | 12,631 | ||||||
E.ON AG | 565 | 12,834 | ||||||
| SHARES | VALUE | |||||||
GDF Suez | 530 | $ | 12,159 | |||||
National Grid PLC | 1,175 | 13,374 | ||||||
RWE AG | 308 | 14,070 | ||||||
Suez Environnement Co. | 1,150 | 12,209 | ||||||
Veolia Environnement SA | 1,203 | 11,905 | ||||||
|
| |||||||
Total Multi-Utilities | 101,425 | |||||||
|
| |||||||
Multiline Retail - 1.0% |
| |||||||
Harvey Norman Holdings Ltd. | 6,121 | 12,092 | ||||||
Isetan Mitsukoshi Holdings Ltd. | 1,200 | 11,725 | ||||||
J Front Retailing Co., Ltd. | 3,000 | 15,576 | ||||||
Marks & Spencer Group PLC | 2,172 | 13,780 | ||||||
Marui Group Co., Ltd. | 1,800 | 12,926 | ||||||
Next PLC | 225 | 12,926 | ||||||
PPR | 81 | 14,238 | ||||||
Takashimaya Co., Ltd. | 3,000 | 19,705 | ||||||
|
| |||||||
Total Multiline Retail | 112,968 | |||||||
|
| |||||||
Office Electronics - 0.5% |
| |||||||
Brother Industries Ltd. | 1,200 | 11,290 | ||||||
Canon, Inc. | 300 | 9,676 | ||||||
Konica Minolta Holdings, Inc. | 1,500 | 9,946 | ||||||
Ricoh Co., Ltd. | 3,000 | 25,034 | ||||||
|
| |||||||
Total Office Electronics | 55,946 | |||||||
|
| |||||||
Oil, Gas & Consumable Fuels - 2.5% |
| |||||||
BG Group PLC | 597 | 11,037 | ||||||
BP PLC | 1,750 | 12,498 | ||||||
Caltex Australia Ltd. | 814 | 14,383 | ||||||
Cosmo Oil Co., Ltd. | 6,000 | 10,659 | ||||||
ENI SpA | 591 | 13,563 | ||||||
Galp Energia SGPS SA - Class B | 867 | 13,875 | ||||||
Inpex Corp. | 3 | 17,077 | ||||||
Japan Petroleum Exploration Co. | 300 | 11,279 | ||||||
JX Holdings, Inc. | 2,300 | 12,229 | ||||||
Lundin Petroleum AB* | 597 | 14,288 | ||||||
Neste Oil OYJ | 1,169 | 14,610 | ||||||
OMV AG | 391 | 14,288 | ||||||
Origin Energy Ltd. | 1,061 | 12,498 | ||||||
Repsol YPF SA | 731 | 14,606 | ||||||
Royal Dutch Shell PLC — Class A | 355 | 12,153 | ||||||
Santos Ltd. | 1,121 | 13,380 | ||||||
Showa Shell Sekiyu KK | 2,400 | 13,332 | ||||||
Statoil ASA | 490 | 12,093 | ||||||
Total SA | 271 | 13,632 | ||||||
Tullow Oil PLC | 601 | 13,594 | ||||||
Woodside Petroleum Ltd. | 367 | 13,091 | ||||||
|
| |||||||
Total Oil, Gas & Consumable Fuels | 278,165 | |||||||
|
| |||||||
Paper & Forest Products - 0.6% |
| |||||||
Holmen AB | 506 | 14,908 | ||||||
Nippon Paper Group, Inc. | 1,200 | 13,707 | ||||||
Oji Holdings | 3,000 | 8,783 | ||||||
Stora Enso OYJ — Series R | 2,093 | 13,202 | ||||||
UPM-Kymmene OYJ | 1,171 | 12,534 | ||||||
|
| |||||||
Total Paper & Forest Products | 63,134 | |||||||
|
| |||||||
| 106 | GUGGENHEIM ETFS ANNUAL REPORT | See Notes to Financial Statements. |
Table of Contents
| SCHEDULE OF INVESTMENTS (continued) | October 31, 2012 |
GUGGENHEIM MSCI EAFE EQUAL WEIGHT ETF
| SHARES | VALUE | |||||||
Personal Products - 0.4% |
| |||||||
Beiersdorf AG | 187 | $ | 13,596 | |||||
Kao Corp. | 300 | 8,415 | ||||||
L’Oreal SA | 107 | 13,625 | ||||||
Shiseido Co., Ltd. | 900 | 11,373 | ||||||
|
| |||||||
Total Personal Products | 47,009 | |||||||
|
| |||||||
Pharmaceuticals - 3.4% |
| |||||||
Astellas Pharma, Inc. | 300 | 14,882 | ||||||
AstraZeneca PLC | 281 | 13,027 | ||||||
Bayer AG | 166 | 14,453 | ||||||
Chugai Pharmaceutical Co., Ltd. | 600 | 12,146 | ||||||
Daiichi Sankyo Co., Ltd. | 900 | 13,737 | ||||||
Dainippon Sumitomo Pharma Co., Ltd. | 1,200 | 13,767 | ||||||
Eisai Co., Ltd. | 300 | 13,343 | ||||||
Elan Corp. PLC ADR* | 1,183 | 12,776 | ||||||
GlaxoSmithKline PLC | 536 | 11,973 | ||||||
Hisamitsu Pharmaceutical Co., Inc. | 300 | 15,501 | ||||||
Merck KGaA | 115 | 14,693 | ||||||
Mitsubishi Tanabe Pharma Corp. | 900 | 12,960 | ||||||
Novartis AG | 228 | 13,723 | ||||||
Novo Nordisk A/S | 84 | 13,534 | ||||||
Ono Pharmaceutical Co., Ltd. | 300 | 18,091 | ||||||
Orion OYJ — Class B | 612 | 15,131 | ||||||
Otsuka Holdings Co., Ltd. | 300 | 9,229 | ||||||
Roche Holding AG | 74 | 14,232 | ||||||
Sanofi | 157 | 13,797 | ||||||
Santen Pharmaceutical Co., Ltd. | 300 | 13,118 | ||||||
Shionogi & Co., Ltd. | 900 | 14,908 | ||||||
Shire PLC | 420 | 11,794 | ||||||
Taisho Pharmaceutical Holdings Co., Ltd. | 300 | 24,171 | ||||||
Takeda Pharmaceutical Co., Ltd. | 300 | 13,925 | ||||||
Teva Pharmaceutical Industries Ltd. ADR | 305 | 12,328 | ||||||
Tsumura & Co. | 300 | 9,571 | ||||||
UCB SA | 266 | 15,511 | ||||||
|
| |||||||
Total Pharmaceuticals | 376,321 | |||||||
|
| |||||||
Professional Services - 1.0% |
| |||||||
Adecco SA* | 300 | 14,511 | ||||||
ALS Ltd. | 1,448 | 13,919 | ||||||
Bureau Veritas SA | 141 | 14,969 | ||||||
Capita PLC | 1,133 | 13,197 | ||||||
Experian PLC | 838 | 14,446 | ||||||
Intertek Group PLC | 294 | 13,352 | ||||||
Randstad Holding NV | 399 | 13,021 | ||||||
SGS SA | 6 | 12,706 | ||||||
|
| |||||||
Total Professional Services | 110,121 | |||||||
|
| |||||||
Real Estate Investment Trusts (REITs) - 2.9% |
| |||||||
Ascendas Real Estate Investment Trust | 6,000 | 11,606 | ||||||
British Land Co. PLC | 1,524 | 12,976 | ||||||
Capital Shopping Centres Group PLC | 2,370 | 12,715 | ||||||
CapitaMall Trust | 9,000 | 15,565 | ||||||
Centro Retail Australia REIT | 5,904 | 13,163 | ||||||
CFS Retail Property Trust | 6,440 | 13,055 | ||||||
| SHARES | VALUE | |||||||
Corio NV | 305 | $ | 13,586 | |||||
Dexus Property Group | 12,949 | 13,226 | ||||||
Fonciere Des Regions | 179 | 14,385 | ||||||
Gecina SA | 135 | 14,946 | ||||||
Goodman Group | 3,051 | 14,015 | ||||||
GPT Group | 3,504 | 12,935 | ||||||
Hammerson PLC | 1,789 | 13,598 | ||||||
Japan Retail Fund Investment Corp. | 9 | 16,383 | ||||||
Klepierre | 386 | 14,308 | ||||||
Land Securities Group PLC | 1,060 | 13,730 | ||||||
Link REIT (The) | 3,000 | 14,923 | ||||||
Mirvac Group | 9,328 | 14,557 | ||||||
Segro PLC | 3,422 | 13,099 | ||||||
Stockland | 3,796 | 13,620 | ||||||
Unibail-Rodamco SE | 67 | 15,093 | ||||||
Westfield Group | 1,256 | 13,884 | ||||||
Westfield Retail Trust | 4,270 | 13,726 | ||||||
|
| |||||||
Total Real Estate Investment Trusts (REITs) | 319,094 | |||||||
|
| |||||||
Real Estate Management & Development - 2.5% |
| |||||||
Aeon Mall Co., Ltd. | 600 | 15,546 | ||||||
CapitaLand Ltd. | 6,000 | 16,081 | ||||||
City Developments Ltd. | 3,000 | 28,179 | ||||||
Global Logistic Properties Ltd. | 6,000 | 12,639 | ||||||
Hang Lung Properties Ltd. | 3,000 | 10,432 | ||||||
Henderson Land Development Co., Ltd. | 3,000 | 20,787 | ||||||
IMMOFINANZ AG* | 3,914 | 15,114 | ||||||
Keppel Land Ltd. | 6,000 | 16,721 | ||||||
Kerry Properties Ltd. | 3,000 | 14,884 | ||||||
Lend Lease Group | 1,489 | 13,387 | ||||||
New World Development Co., Ltd. | 12,000 | 18,549 | ||||||
Nomura Real Estate Holdings, Inc. | 900 | 16,135 | ||||||
Sino Land Co., Ltd. | 6,000 | 10,746 | ||||||
Swire Pacific Ltd. — Class A | 1,500 | 17,797 | ||||||
Swiss Prime Site AG* | 157 | 13,108 | ||||||
Tokyu Land Corp. | 3,000 | 16,815 | ||||||
Wharf Holdings Ltd. | 3,000 | 20,535 | ||||||
|
| |||||||
Total Real Estate Management & Development | 277,455 | |||||||
|
| |||||||
Road & Rail - 1.8% |
| |||||||
Asciano Ltd. | 2,676 | 12,653 | ||||||
Central Japan Railway Co. | 300 | 25,785 | ||||||
DSV A/S | 570 | 12,813 | ||||||
East Japan Railway Co. | 300 | 20,568 | ||||||
Hankyu Hanshin Holdings, Inc. | 3,000 | 16,590 | ||||||
Keio Corp. | 3,000 | 22,745 | ||||||
Kintetsu Corp. | 3,000 | 11,748 | ||||||
MTR Corp. | 3,000 | 11,729 | ||||||
Nippon Express Co., Ltd. | 3,000 | 10,960 | ||||||
QR National Ltd. | 3,677 | 14,260 | ||||||
Tobu Railway Co., Ltd. | 3,000 | 15,914 | ||||||
Tokyu Corp. | 3,000 | 15,238 | ||||||
West Japan Railway Co. | 300 | 13,080 | ||||||
|
| |||||||
Total Road & Rail | 204,083 | |||||||
|
| |||||||
| See Notes to Financial Statements. | GUGGENHEIM ETFS ANNUAL REPORT | 107 |
Table of Contents
| SCHEDULE OF INVESTMENTS (continued) | October 31, 2012 |
GUGGENHEIM MSCI EAFE EQUAL WEIGHT ETF
| SHARES | VALUE | |||||||
Semiconductors & Semiconductor Equipment - 1.1% |
| |||||||
Advantest Corp. | 900 | $ | 11,350 | |||||
ARM Holdings PLC | 1,417 | 15,181 | ||||||
ASM Pacific Technology Ltd. | 1,200 | 13,378 | ||||||
ASML Holding NV | 228 | 12,542 | ||||||
Infineon Technologies AG | 1,860 | 12,653 | ||||||
Mellanox Technologies Ltd.* | 109 | 8,266 | ||||||
Rohm Co., Ltd. | 300 | 9,665 | ||||||
STMicroelectronics NV | 2,205 | 12,963 | ||||||
Sumco Corp.* | 1,800 | 12,296 | ||||||
Tokyo Electron Ltd. | 300 | 13,455 | ||||||
|
| |||||||
Total Semiconductors & Semiconductor Equipment | 121,749 | |||||||
|
| |||||||
Software - 1.1% |
| |||||||
Dassault Systemes SA | 130 | 13,694 | ||||||
Konami Corp. | 600 | 13,730 | ||||||
Nexon Co., Ltd.* | 886 | 10,785 | ||||||
NICE Systems Ltd. ADR* | 297 | 9,890 | ||||||
Oracle Corp. Japan | 300 | 13,324 | ||||||
Sage Group PLC (The) | 2,795 | 13,990 | ||||||
SAP AG | 207 | 15,075 | ||||||
Square Enix Holdings Co., Ltd. | 900 | 12,667 | ||||||
Trend Micro, Inc. | 600 | 16,785 | ||||||
|
| |||||||
Total Software | 119,940 | |||||||
|
| |||||||
Specialty Retail - 0.9% |
| |||||||
ABC-Mart, Inc. | 300 | 13,137 | ||||||
Hennes & Mauritz AB | 358 | 12,112 | ||||||
Inditex SA | 118 | 15,052 | ||||||
Kingfisher PLC | 2,941 | 13,717 | ||||||
Nitori Holdings Co., Ltd. | 150 | 12,236 | ||||||
Sanrio Co., Ltd. | 300 | 9,867 | ||||||
USS Co., Ltd. | 120 | 12,596 | ||||||
Yamada Denki Co., Ltd. | 270 | 11,688 | ||||||
|
| |||||||
Total Specialty Retail | 100,405 | |||||||
|
| |||||||
Textiles, Apparel & Luxury Goods - 1.1% |
| |||||||
Adidas AG | 161 | 13,713 | ||||||
Asics Corp. | 900 | 13,050 | ||||||
Burberry Group PLC | 610 | 11,459 | ||||||
Christian Dior SA | 89 | 12,772 | ||||||
Cie Financiere Richemont SA — Class A | 207 | 13,426 | ||||||
Hugo Boss AG | 142 | 14,211 | ||||||
Luxottica Group SpA | 369 | 14,034 | ||||||
LVMH Moet Hennessy Louis Vuitton SA | 81 | 13,162 | ||||||
Swatch Group AG (The) | 33 | 13,658 | ||||||
|
| |||||||
Total Textiles, Apparel & Luxury Goods | 119,485 | |||||||
|
| |||||||
Tobacco - 0.4% |
| |||||||
British American Tobacco PLC | 251 | 12,412 | ||||||
Imperial Tobacco Group PLC | 317 | 11,951 | ||||||
Japan Tobacco, Inc. | 296 | 8,169 | ||||||
Swedish Match AB | 314 | 10,695 | ||||||
|
| |||||||
Total Tobacco | 43,227 | |||||||
|
| |||||||
| SHARES | VALUE | |||||||
Trading Companies & Distributors - 1.4% |
| |||||||
Brenntag AG | 104 | $ | 13,104 | |||||
Bunzl PLC | 755 | 12,468 | ||||||
ITOCHU Corp. | 1,200 | 11,995 | ||||||
Marubeni Corp. | 3,000 | 19,404 | ||||||
Mitsubishi Corp. | 600 | 10,697 | ||||||
Mitsui & Co., Ltd. | 900 | 12,667 | ||||||
Noble Group Ltd. | 15,000 | 16,106 | ||||||
Rexel SA | 674 | 12,197 | ||||||
Sojitz Corp. | 9,500 | 11,767 | ||||||
Sumitomo Corp. | 900 | 12,251 | ||||||
Toyota Tsusho Corp. | 600 | 13,076 | ||||||
Wolseley PLC | 331 | 14,446 | ||||||
|
| |||||||
Total Trading Companies & Distributors | 160,178 | |||||||
|
| |||||||
Transportation Infrastructure - 1.1% | ||||||||
Abertis Infraestructuras SA | 970 | 14,606 | ||||||
Aeroports de Paris | 161 | 12,444 | ||||||
Atlantia SpA | 931 | 15,357 | ||||||
Fraport AG Frankfurt Airport Services Worldwide | 234 | 13,718 | ||||||
Groupe Eurotunnel SA | 1,754 | 13,332 | ||||||
Hutchison Port Holdings Trust | 18,000 | 14,040 | ||||||
Koninklijke Vopak NV | 204 | 14,198 | ||||||
Sydney Airport | 3,850 | 13,534 | ||||||
Transurban Group | 2,126 | 13,404 | ||||||
|
| |||||||
Total Transportation Infrastructure | 124,633 | |||||||
|
| |||||||
Water Utilities - 0.2% |
| |||||||
Severn Trent PLC | 449 | 11,617 | ||||||
United Utilities Group PLC | 1,175 | 12,816 | ||||||
|
| |||||||
Total Water Utilities | 24,433 | |||||||
|
| |||||||
Wireless Telecommunication Services - 0.9% |
| |||||||
KDDI Corp. | 300 | 23,270 | ||||||
Millicom International Cellular SA | 151 | 13,040 | ||||||
Mobistar SA | 411 | 10,870 | ||||||
NTT DoCoMo, Inc. | 9 | 13,208 | ||||||
Softbank Corp. | 300 | 9,484 | ||||||
Tele2 AB — Class B | 779 | 12,996 | ||||||
Vodafone Group PLC | 4,427 | 12,000 | ||||||
|
| |||||||
Total Wireless Telecommunication Services | 94,868 | |||||||
|
| |||||||
Total Common Stocks | 10,991,832 | |||||||
|
| |||||||
RIGHTS - 0.0%b |
| |||||||
Aerospace & Defenseb - 0.0% |
| |||||||
Rolls-Royce Holdings PLC, — Class C, expires 12/03/12 | 71,592 | 115 | ||||||
|
| |||||||
Total Aerospace & Defense | 115 | |||||||
|
| |||||||
Commercial Banksb - 0.0% |
| |||||||
Banco Santander SA, | 1,912 | 377 | ||||||
|
| |||||||
Total Commercial Banks | 377 | |||||||
|
| |||||||
Total Rights | 492 | |||||||
|
| |||||||
| 108 | GUGGENHEIM ETFS ANNUAL REPORT | See Notes to Financial Statements. |
Table of Contents
| SCHEDULE OF INVESTMENTS (concluded) | October 31, 2012 |
GUGGENHEIM MSCI EAFE EQUAL WEIGHT ETF
| SHARES | VALUE | |||||||
SHORT TERM INVESTMENTS - 0.2% |
| |||||||
SSgA Government Money Market Fund | 17,691 | $ | 17,691 | |||||
|
| |||||||
Total Short Term Investments | 17,691 | |||||||
|
| |||||||
FACE | ||||||||
SECURITIES LENDING COLLATERAL - 0.4%e |
| |||||||
Joint Repurchase Agreements: | ||||||||
Merrill Lynch, Fenner & Smith, Inc. issued 10/31/12 at 0.28% | $ | 15,876 | 15,876 | |||||
RBS Securities, Inc. | 26,994 | 26,994 | ||||||
|
| |||||||
Total Securities Lending Collateral | 42,870 | |||||||
|
| |||||||
Total Investments 100.0%d | 11,052,885 | |||||||
|
| |||||||
Other Assets and Liabilities, net - 0.0%b |
| 3,246 | ||||||
|
| |||||||
Net Assets - 100.0% |
| $ | 11,056,131 | |||||
|
| |||||||
INVESTMENT CONCENTRATION
At October 31, 2012, the investment diversification of the Fund “by country” was as follows:
| Country | % of Total Investments | |||
Japan | 30.76% | |||
Britain | 11.81% | |||
Australia | 8.09% | |||
France | 7.76% | |||
Germany | 5.94% | |||
Sweden | 3.90% | |||
Switzerland | 3.64% | |||
Italy | 3.04% | |||
Spain | 2.98% | |||
Hong Kong | 2.96% | |||
Netherlands | 2.81% | |||
Singapore | 2.68% | |||
Finland | 1.77% | |||
Belgium | 1.47% | |||
Norway | 0.99% | |||
Israel | 0.92% | |||
Denmark | 0.90% | |||
Austria | 0.78% | |||
Jersey | 0.76% | |||
Swaziland | 0.73% | |||
Bermuda | 0.73% | |||
Portugal | 0.67% | |||
Luxembourg | 0.58% | |||
Ireland | 0.56% | |||
United States | 0.55% | |||
Cayman Islands | 0.40% | |||
Slovenia | 0.36% | |||
New Zealand | 0.25% | |||
Georgia | 0.24% | |||
Niger Republic | 0.24% | |||
Greece | 0.17% | |||
Samoa | 0.14% | |||
Guernsey | 0.12% | |||
Isle Of Man | 0.12% | |||
Mauritius | 0.11% | |||
Iceland | 0.07% | |||
Total Investments | 100.00% | |||
| * | Non-Income Producing Security. |
| a | All or a portion of this security was on loan as of October 31, 2012. |
| b | Amount represents less than 0.05% of net assets. |
| c | Values determined based on Level 2 inputs (Note F). |
| d | Unless otherwise indicated, the values of the Investments are determined based on Level 1 inputs. |
| e | Securities lending collateral (Note I). |
| ADR | — American Depositary Receipt |
| PLC | — Public Limited Company |
| See Notes to Financial Statements. | GUGGENHEIM ETFS ANNUAL REPORT | 109 |
Table of Contents
| SCHEDULE OF INVESTMENTS | October 31, 2012 |
GUGGENHEIM MSCI EMERGING MARKETS EQUAL WEIGHT ETF
| SHARES | VALUE | |||||||
COMMON STOCKS - 86.0% |
| |||||||
Aerospace & Defense - 0.4% |
| |||||||
Embraer SA ADR | 765 | $ | 21,351 | |||||
Korea Aerospace Industries Ltd. | 1,000 | 25,124 | ||||||
|
| |||||||
Total Aerospace & Defense |
| 46,475 | ||||||
|
| |||||||
Air Freight & Logistics - 0.2% | ||||||||
Hyundai Glovis Co., Ltd. | 110 | 22,896 | ||||||
|
| |||||||
Total Air Freight & Logistics |
| 22,896 | ||||||
|
| |||||||
Airlines - 1.6% | ||||||||
Air China Ltd. — Class H | 40,000 | 28,387 | ||||||
AirAsia BHD | 19,600 | 19,497 | ||||||
China Airlines Ltd.* | 59,000 | 23,024 | ||||||
China Southern Airlines Co., Ltd. — Class H | 56,000 | 26,519 | ||||||
Eva Airways Corp.* | 39,000 | 22,629 | ||||||
Gol Linhas Aereas Inteligentes SA ADR* | 4,722 | 23,563 | ||||||
Korean Air Lines Co., Ltd.* | 554 | 24,865 | ||||||
Latam Airlines Group SA ADR | 787 | 19,510 | ||||||
Turk Hava Yollari* | 11,454 | 26,489 | ||||||
|
| |||||||
Total Airlines |
| 214,483 | ||||||
|
| |||||||
Auto Components - 1.0% | ||||||||
Cheng Shin Rubber Industry Co. Ltd. | 8,260 | 20,670 | ||||||
Hankook Tire Co., Ltd.* | 545 | 22,987 | ||||||
Hyundai Mobis | 83 | 21,157 | ||||||
Hyundai Wia Corp. | 142 | 22,981 | ||||||
Mando Corp. | 153 | 20,202 | ||||||
Nan Kang Rubber Tire Co., Ltd. | 19,759 | 22,862 | ||||||
|
| |||||||
Total Auto Components |
| 130,859 | ||||||
|
| |||||||
Automobiles - 1.9% | ||||||||
Astra International Tbk PT | 31,500 | 26,400 | ||||||
Brilliance China Automotive Holdings Ltd.* | 24,000 | 29,977 | ||||||
Byd Co., Ltd. — Class H* | 12,000 | 23,690 | ||||||
China Motor Corp. | 24,000 | 21,607 | ||||||
Dongfeng Motor Group Co., Ltd. — Class H | 16,000 | 19,819 | ||||||
Geely Automobile Holdings Ltd. | �� | 60,000 | 25,780 | |||||
Great Wall Motor Co., Ltd. — Class H | 10,000 | 27,484 | ||||||
Guangzhou Automobile Group Co., | 32,000 | 21,925 | ||||||
Hyundai Motor Co. | 102 | 20,997 | ||||||
Kia Motors Corp. | 327 | 18,170 | ||||||
Yulon Motor Co., Ltd. | 12,000 | 20,991 | ||||||
|
| |||||||
Total Automobiles |
| 256,840 | ||||||
|
| |||||||
Beverages - 0.6% | ||||||||
Coca-Cola Femsa SAB de CV ADR | 191 | 24,431 | ||||||
Fomento Economico Mexicano SAB de CV ADR | 393 | 35,610 | ||||||
Grupo Modelo SAB de CV — Series C | 2,361 | 20,816 | ||||||
|
| |||||||
Total Beverages |
| 80,857 | ||||||
|
| |||||||
| SHARES | VALUE | |||||||
Building Products - 0.2% | ||||||||
KCC Corp. | 87 | $ | 24,410 | |||||
|
| |||||||
Total Building Products |
| 24,410 | ||||||
|
| |||||||
Capital Markets - 1.4% | ||||||||
China Everbright Ltd. | 16,000 | 23,288 | ||||||
CITIC Securities Co., Ltd. | 13,772 | 25,838 | ||||||
Daewoo Securities Co., Ltd. | 2,250 | 22,694 | ||||||
Hyundai Securities Co., Ltd. | 2,960 | 22,717 | ||||||
Investec Ltd. | 3,703 | 21,709 | ||||||
Samsung Securities Co., Ltd. | 518 | 23,202 | ||||||
Woori Investment & Securities Co., Ltd. | 2,250 | 21,766 | ||||||
Yuanta Financial Holding Co., Ltd. | 48,000 | 21,689 | ||||||
|
| |||||||
Total Capital Markets |
| 182,903 | ||||||
|
| |||||||
Chemicals - 3.9% | ||||||||
Braskem SA ADR | 1,574 | 20,588 | ||||||
Cheil Industries, Inc. | 244 | 20,896 | ||||||
China Petrochemical Development Corp. | 27,500 | 19,110 | ||||||
Formosa Chemicals & Fibre Corp. | 8,000 | 18,951 | ||||||
Formosa Plastics Corp. | 8,000 | 21,799 | ||||||
Hanwha Chemical Corp. | 1,180 | 19,584 | ||||||
Hanwha Corp. | 790 | 22,564 | ||||||
Honam Petrochemical Corp. | 106 | 21,674 | ||||||
Huabao International Holdings Ltd. | 44,000 | 21,971 | ||||||
Hyosung Corp. | 417 | 22,980 | ||||||
KP Chemical Corp. | 2,090 | 20,697 | ||||||
Kumho Petro chemical Co., Ltd. | 223 | 21,879 | ||||||
LCY Chemical Corp. | 16,000 | 16,541 | ||||||
LG Chem Ltd. | 83 | 23,288 | ||||||
Mexichem SAB de CV | 4,722 | 23,410 | ||||||
Nan Ya Plastics Corp. | 12,000 | 21,155 | ||||||
OCI Co., Ltd. | 130 | 18,357 | ||||||
Petronas Chemicals Group BHD | 10,400 | 22,193 | ||||||
PTT Global Chemical PCL | 11,411 | 22,710 | ||||||
Sociedad Quimica y Minera de Chile SA ADR | 393 | 22,735 | ||||||
Taiwan Fertilizer Co., Ltd. | 8,000 | 19,060 | ||||||
TSRC Corp. | 11,900 | 24,279 | ||||||
Uralkali OJSC GDR | 567 | 22,215 | ||||||
Yingde Gases | 27,500 | 26,081 | ||||||
|
| |||||||
Total Chemicals |
| 514,717 | ||||||
|
| |||||||
Commercial Banks - 10.6% | ||||||||
ABSA Group Ltd. | 1,322 | 21,154 | ||||||
Agricultural Bank of China Ltd. — Class H | 59,000 | 25,579 | ||||||
Akbank TAS | 5,694 | 27,415 | ||||||
Asya Katilim Bankasi AS* | 21,280 | 23,836 | ||||||
Banco de Chile | 162,467 | 24,216 | ||||||
Banco Santander Brasil SA ADR | 2,778 | 18,890 | ||||||
Banco Santander Chile ADR | 1,020 | 27,734 | ||||||
BanColombia SA ADR | 393 | 25,160 | ||||||
Bangkok Bank PCL | 3,541 | 20,911 | ||||||
Bank Central Asia Tbk PT | 28,500 | 24,331 | ||||||
Bank Mandiri (Persero) Tbk PT | 28,000 | 24,050 | ||||||
| 110 | GUGGENHEIM ETFS ANNUAL REPORT | See Notes to Financial Statements. |
Table of Contents
| SCHEDULE OF INVESTMENTS (continued) | October 31, 2012 |
GUGGENHEIM MSCI EMERGING MARKETS EQUAL WEIGHT ETF
| SHARES | VALUE | |||||||
Bank Negara Indonesia Persero Tbk PT | 55,500 | $ | 22,246 | |||||
Bank of Ayudhya PCL | 22,429 | 21,953 | ||||||
Bank of China Ltd. — Class H | 58,000 | 23,873 | ||||||
Bank of Communications Co., Ltd. — Class H | 35,000 | 25,019 | ||||||
Bank Pekao SA | 496 | 23,801 | ||||||
Bank Rakyat Indonesia Persero Tbk PT | 31,500 | 24,269 | ||||||
BDO Unibank, Inc.* | 15,545 | 24,151 | ||||||
BS Financial Group, Inc. | 2,150 | 24,347 | ||||||
Chang Hwa Commercial Bank | 44,010 | 22,222 | ||||||
China Citic Bank Corp., Ltd. — Class H | 47,000 | 24,015 | ||||||
China Construction Bank Corp. — Class H | 35,000 | 26,374 | ||||||
China Development Financial Holding Corp.* | 94,000 | 21,012 | ||||||
China Merchants Bank Co., Ltd. — Class H | 14,000 | 26,157 | ||||||
China Minsheng Banking Corp., Ltd. — Class H | 27,500 | 25,016 | ||||||
Chinatrust Financial Holding Co., Ltd. | 39,168 | 21,587 | ||||||
Chongqing Rural Commercial Bank Co., Ltd. — Class H | 55,000 | 25,832 | ||||||
CIMB Group Holdings BHD | 9,200 | 23,045 | ||||||
Credicorp Ltd. | 185 | 23,928 | ||||||
E.Sun Financial Holding Co., Ltd. | 40,200 | 20,160 | ||||||
First Financial Holding Co., Ltd. | 41,340 | 23,491 | ||||||
Grupo Financiero Banorte SAB de CV — Class O | 4,328 | 24,056 | ||||||
Hana Financial Group, Inc. | 750 | 21,834 | ||||||
HDFC Bank Ltd. ADR | 787 | 29,426 | ||||||
Hua Nan Financial Holdings Co., Ltd. | 40,100 | 21,071 | ||||||
Industrial & Commercial Bank of | 39,000 | 25,815 | ||||||
Industrial Bank of Korea | 2,120 | 23,327 | ||||||
Kasikornbank PCL | 4,328 | 25,417 | ||||||
KB Financial Group, Inc. ADR | 787 | 26,797 | ||||||
Komercni Banka AS | 118 | 24,057 | ||||||
Korea Exchange Bank* | 2,960 | 20,519 | ||||||
Krung Thai Bank PCL | 42,497 | 24,958 | ||||||
Malayan Banking BHD | 7,500 | 22,234 | ||||||
Mega Financial Holding Co., Ltd. | 31,480 | 22,899 | ||||||
Nedbank Group Ltd. | 1,031 | 21,215 | ||||||
OTP Bank PLC | 1,424 | 27,033 | ||||||
Powszechna Kasa Oszczednosci Bank Polski SA | 2,125 | 23,739 | ||||||
Shinhan Financial Group Co., Ltd. ADR | 786 | 26,897 | ||||||
Siam Commercial Bank PCL | 4,722 | 24,804 | ||||||
Standard Bank Group Ltd. | 1,696 | 20,882 | ||||||
State Bank of India GDR | 315 | 25,956 | ||||||
Taishin Financial Holding Co., Ltd. | 59,193 | 21,175 | ||||||
Turkiye Garanti Bankasi AS | 5,277 | 25,172 | ||||||
Turkiye Halk Bankasi AS | 2,542 | 22,382 | ||||||
Turkiye Is Bankasi | 7,461 | 25,362 | ||||||
Turkiye Vakiflar Bankasi Tao | 9,908 | 23,300 | ||||||
| SHARES | VALUE | |||||||
VTB Bank OJSC GDR | 6,709 | $ | 23,119 | |||||
Woori Finance Holdings Co., Ltd. | 2,390 | 22,572 | ||||||
Yapi ve Kredi Bankasi AS* | 9,672 | 24,793 | ||||||
|
| |||||||
Total Commercial Banks |
| 1,406,585 | ||||||
|
| |||||||
Communications Equipment - 0.2% | ||||||||
ZTE Corp. — Class H | 16,600 | 23,390 | ||||||
|
| |||||||
Total Communications Equipment |
| 23,390 | ||||||
|
| |||||||
Computers & Peripherals - 1.8% | ||||||||
Acer, Inc.* | 24,000 | 18,567 | ||||||
Asustek Computer, Inc. | 4,100 | 43,930 | ||||||
Catcher Technology Co., Ltd. | 4,000 | 17,390 | ||||||
Compal Electronics, Inc. | 28,000 | 17,636 | ||||||
Foxconn Technology Co., Ltd. | 4,300 | 14,940 | ||||||
Lenovo Group Ltd. | 24,000 | 19,293 | ||||||
Lite-On Technology Corp. | 20,090 | 25,583 | ||||||
Pegatron Corp.* | 16,000 | 20,211 | ||||||
Quanta Computer, Inc. | 8,000 | 18,294 | ||||||
Simplo Technology Co., Ltd. | 4,400 | 21,689 | ||||||
Wistron Corp. | 19,800 | 19,012 | ||||||
|
| |||||||
Total Computers & Peripherals |
| 236,545 | ||||||
|
| |||||||
Construction & Engineering - 2.6% | ||||||||
Aveng Ltd. | 5,997 | 21,329 | ||||||
China Communications Construction Co., Ltd. — Class H | 28,000 | 26,266 | ||||||
China Railway Construction Corp., Ltd. — Class H | 29,500 | 29,309 | ||||||
China Railway Group Ltd. — Class H | 59,000 | 30,071 | ||||||
CTCI Corp. | 11,805 | 23,479 | ||||||
Daelim Industrial Co., Ltd. | 283 | 19,695 | ||||||
Daewoo Engineering & Construction Co., Ltd.* | 2,600 | 22,124 | ||||||
Doosan Heavy Industries and Construction Co., Ltd. | 425 | 18,199 | ||||||
GS Engineering & Construction Corp. | 358 | 20,155 | ||||||
Hyundai Development Co. | 1,220 | 21,925 | ||||||
Hyundai Engineering & Construction Co., Ltd. | 393 | 23,675 | ||||||
IJM Corp. BHD | 13,200 | 21,711 | ||||||
Larsen & Toubro Ltd. GDR | 905 | 27,684 | ||||||
Orascom Construction Industries GDR | 492 | 20,123 | ||||||
Samsung Engineering Co., Ltd. | 130 | 16,986 | ||||||
|
| |||||||
Total Construction & Engineering |
| 342,731 | ||||||
|
| |||||||
Construction Materials - 2.3% | ||||||||
Anhui Conch Cement Co., Ltd. — Class H | 8,000 | 27,664 | ||||||
Asia Cement Corp. | 20,055 | 24,989 | ||||||
BBMG Corp. — Class H | 35,500 | 30,507 | ||||||
Cemex SAB de CV ADR* | 2,754 | 24,896 | ||||||
China National Building Material Co., Ltd. — Class H | 24,000 | 30,596 | ||||||
China Resources Cement Holdings Ltd. | 48,000 | 32,640 | ||||||
China Shanshui Cement Group Ltd. | 43,000 | 32,014 | ||||||
Indocement Tunggal Prakarsa Tbk PT | 12,000 | 26,736 | ||||||
Semen Gresik Persero Tbk PT | 18,500 | 28,699 | ||||||
| See Notes to Financial Statements. | GUGGENHEIM ETFS ANNUAL REPORT | 111 |
Table of Contents
| SCHEDULE OF INVESTMENTS (continued) | October 31, 2012 |
GUGGENHEIM MSCI EMERGING MARKETS EQUAL WEIGHT ETF
| SHARES | VALUE | |||||||
Siam Cement PCL | 2,000 | $ | 27,145 | |||||
Taiwan Cement Corp. | 20,000 | 25,640 | ||||||
|
| |||||||
Total Construction Materials |
| 311,526 | ||||||
|
| |||||||
Consumer Finance - 0.2% | ||||||||
Samsung Card Co., Ltd. | 710 | 27,473 | ||||||
|
| |||||||
Total Consumer Finance |
| 27,473 | ||||||
|
| |||||||
Distributors - 0.3% | ||||||||
Dah Chong Hong Holdings Ltd. | 24,000 | 22,637 | ||||||
Imperial Holdings Ltd. | 929 | 21,036 | ||||||
|
| |||||||
Total Distributors |
| 43,673 | ||||||
|
| |||||||
Diversified Financial Services - 1.2% | ||||||||
African Bank Investments Ltd. | 5,753 | 19,390 | ||||||
AMMB Holdings BHD | 11,200 | 23,459 | ||||||
FirstRand Ltd. | 6,780 | 22,431 | ||||||
Fubon Financial Holding Co., Ltd. | 24,148 | 24,799 | ||||||
Haci Omer Sabanci Holding AS | 5,332 | 28,109 | ||||||
Remgro Ltd. | 1,306 | 22,294 | ||||||
RMB Holdings Ltd. | 5,076 | 22,196 | ||||||
|
| |||||||
Total Diversified Financial Services |
| 162,678 | ||||||
|
| |||||||
Diversified Telecommunication Services - 2.0% |
| |||||||
China Telecom Corp., Ltd. — Class H | 40,000 | 23,793 | ||||||
China Unicom Hong Kong Ltd. ADR | 1,180 | 18,986 | ||||||
Chunghwa Telecom Co., Ltd. ADR | 787 | 24,460 | ||||||
KT Corp. ADR | 1,574 | 26,679 | ||||||
LG Uplus Corp. | 3,350 | 21,410 | ||||||
Oi SA ADR | 5,902 | 23,608 | ||||||
Telefonica Brasil SA ADR | 1,180 | 25,984 | ||||||
Telefonica Czech Republic AS | 1,058 | 21,051 | ||||||
Telekom Malaysia BHD | 11,500 | 22,577 | ||||||
Telekomunikacja Polska SA | 4,435 | 16,742 | ||||||
Telekomunikasi Indonesia Tbk PT ADR | 393 | 15,976 | ||||||
Turk Telekomunikasyon AS | 5,678 | 22,149 | ||||||
|
| |||||||
Total Diversified Telecommunication Services |
| 263,415 | ||||||
|
| |||||||
Electric Utilities - 1.6% |
| |||||||
Centrais Eletricas Brasileiras SA ADR | 3,148 | 17,503 | ||||||
CEZ AS | 578 | 21,289 | ||||||
Cia Energetica de Minas Gerais ADR | 1,180 | 14,148 | ||||||
Cia Paranaense de Energia ADR | 1,180 | 17,417 | ||||||
CPFL Energia SA ADR | 1,180 | 27,482 | ||||||
Enersis SA ADR | 1,180 | 19,989 | ||||||
Federal Hydrogenerating Co. JSC ADR | 9,176 | 21,784 | ||||||
Korea Electric Power Corp. ADR* | 1,967 | 25,355 | ||||||
PGE SA | 4,053 | 21,947 | ||||||
Tenaga Nasional BHD | 10,300 | 23,501 | ||||||
|
| |||||||
Total Electric Utilities |
| 210,415 | ||||||
|
| |||||||
Electrical Equipment - 0.9% | ||||||||
Dongfang Electric Corp., Ltd. — Class H | 15,800 | 26,462 | ||||||
LS Corp. | 283 | 23,147 | ||||||
LS Industrial Systems Co., Ltd. | 390 | 24,389 | ||||||
Shanghai Electric Group Co., Ltd. — Class H | 56,000 | 22,761 | ||||||
| SHARES | VALUE | |||||||
Zhuzhou CSR Times Electric Co., Ltd. — Class H | 8,000 | $ | 23,535 | |||||
|
| |||||||
Total Electrical Equipment |
| 120,294 | ||||||
|
| |||||||
Electronic Equipment, Instruments & Components - 3.0% |
| |||||||
AU Optronics Corp. ADR* | 7,083 | 26,774 | ||||||
Cheng Uei Precision Industry Co., Ltd. | 12,260 | 27,153 | ||||||
Chimei Innolux Corp.* | 67,000 | 25,000 | ||||||
Delta Electronics, Inc. | 8,000 | 27,331 | ||||||
E Ink Holdings, Inc. | 24,000 | 19,307 | ||||||
Everlight Electronics Co., Ltd. | 16,000 | 16,705 | ||||||
Hon Hai Precision Industry Co., Ltd. GDR | 3,904 | 23,678 | ||||||
LG Display Co., Ltd. ADR* | 1,967 | 29,190 | ||||||
LG Innotek Co., Ltd.* | 279 | 19,263 | ||||||
Nan Ya Printed Circuit Board Corp. | 12,000 | 13,782 | ||||||
Samsung Electro-Mechanics Co., Ltd. | 260 | 22,267 | ||||||
Samsung SDI Co., Ltd. | 177 | 22,235 | ||||||
Synnex Technology International Corp. | 12,000 | 25,386 | ||||||
Tripod Technology Corp. | 12,000 | 23,209 | ||||||
Unimicron Technology Corp. | 20,000 | 20,471 | ||||||
Wintek Corp.* | 43,498 | 17,198 | ||||||
WPG Holdings Ltd. | 19,350 | 23,382 | ||||||
Zhen Ding Technology Holding Ltd. | 7,870 | 20,798 | ||||||
|
| |||||||
Total Electronic Equipment, Instruments & Components |
| 403,129 | ||||||
|
| |||||||
Energy Equipment & Services - 0.4% | ||||||||
Bumi Armada BHD | 18,100 | 23,294 | ||||||
China Oilfield Services Ltd. — Class H | 16,000 | 30,348 | ||||||
|
| |||||||
Total Energy Equipment & Services |
| 53,642 | ||||||
|
| |||||||
Food & Staples Retailing - 2.3% | ||||||||
BIM Birlesik Magazalar AS | 550 | 25,515 | ||||||
Cencosud SA | 3,821 | 20,832 | ||||||
China Resources Enterprise Ltd. | 8,000 | 26,013 | ||||||
Cia Brasileira de Distribuicao Grupo Pao de Acucar ADR | 393 | 18,369 | ||||||
CP ALL PCL | 20,461 | 26,536 | ||||||
E-Mart Co., Ltd. | 102 | 22,119 | ||||||
Eurocash SA | 1,885 | 23,005 | ||||||
Magnit OJSC GDR | 704 | 24,992 | ||||||
Massmart Holdings Ltd. | 1,136 | 22,774 | ||||||
President Chain Store Corp. | 4,000 | 19,786 | ||||||
Shoprite Holdings Ltd. | 1,106 | 22,669 | ||||||
Sun Art Retail Group Ltd. | 18,000 | 24,480 | ||||||
Wal-Mart de Mexico SAB de CV — Series V | 8,415 | 24,862 | ||||||
|
| |||||||
Total Food & Staples Retailing |
| 301,952 | ||||||
|
| |||||||
Food Products - 2.6% | ||||||||
Charoen Pokphand Foods PCL | 22,035 | 25,342 | ||||||
China Mengniu Dairy Co., Ltd. | 8,000 | 24,258 | ||||||
China Yurun Food Group Ltd.* | 35,000 | 25,651 | ||||||
CJ CheilJedang Corp. | 83 | 26,066 | ||||||
Indofood Sukses Makmur Tbk PT | 39,500 | 23,441 | ||||||
IOI Corp. BHD | 13,200 | 21,928 | ||||||
Kuala Lumpur Kepong BHD | 3,200 | 22,503 | ||||||
| 112 | GUGGENHEIM ETFS ANNUAL REPORT | See Notes to Financial Statements. |
Table of Contents
| SCHEDULE OF INVESTMENTS (continued) | October 31, 2012 |
GUGGENHEIM MSCI EMERGING MARKETS EQUAL WEIGHT ETF
| SHARES | VALUE | |||||||
Orion Corp. | 28 | $ | 26,290 | |||||
Standard Foods Corp. | 7,920 | 20,307 | ||||||
Tiger Brands Ltd. | 669 | 21,195 | ||||||
Tingyi Cayman Islands Holding Corp. | 8,000 | 23,793 | ||||||
Uni-President China Holdings Ltd. | 23,609 | 29,701 | ||||||
Uni-President Enterprises Corp. | 16,194 | 28,604 | ||||||
Want Want China Holdings Ltd. | 20,000 | 27,355 | ||||||
|
| |||||||
Total Food Products |
| 346,434 | ||||||
|
| |||||||
Gas Utilities - 0.8% | ||||||||
China Gas Holdings Ltd. | 40,000 | 21,780 | ||||||
ENN Energy Holdings Ltd. | 8,000 | 33,290 | ||||||
Korea Gas Corp. | 430 | 30,202 | ||||||
Perusahaan Gas Negara Persero Tbk PT | 57,000 | 27,595 | ||||||
|
| |||||||
Total Gas Utilities |
| 112,867 | ||||||
|
| |||||||
Health Care Equipment & Supplies - 0.2% |
| |||||||
Shandong Weigao Group Medical Polymer Co., Ltd. — Class H | 16,000 | 21,636 | ||||||
|
| |||||||
Total Health Care Equipment & Supplies |
| 21,636 | ||||||
|
| |||||||
Health Care Providers & Services - 0.3% | ||||||||
Life Healthcare Group Holdings Ltd. | 5,765 | 21,730 | ||||||
Sinopharm Group Co. — Class H | 6,400 | 21,512 | ||||||
|
| |||||||
Total Health Care Providers & Services |
| 43,242 | ||||||
|
| |||||||
Hotels, Restaurants & Leisure - 0.5% | ||||||||
Genting BHD | 7,900 | 22,953 | ||||||
Genting Malaysia BHD | 19,700 | 23,218 | ||||||
Kangwon Land, Inc. | 1,100 | 25,619 | ||||||
|
| |||||||
Total Hotels, Restaurants & Leisure |
| 71,790 | ||||||
|
| |||||||
Household Durables - 0.7% | ||||||||
Haier Electronics Group Co., Ltd.* | 19,922 | 25,474 | ||||||
LG Electronics, Inc. | 354 | 24,637 | ||||||
Steinhoff International Holdings Ltd.* | 7,091 | 23,753 | ||||||
Woongjin Coway Co., Ltd. | 630 | 22,933 | ||||||
|
| |||||||
Total Household Durables |
| 96,797 | ||||||
|
| |||||||
Household Products - 0.2% | ||||||||
LG Household & Health Care Ltd. | 39 | 22,922 | ||||||
|
| |||||||
Total Household Products |
| 22,922 | ||||||
|
| |||||||
Independent Power Producers & Energy Traders - 0.6% |
| |||||||
China Longyuan Power Group Corp. — Class H | 35,000 | 22,806 | ||||||
China Resources Power Holdings Co., Ltd. | 8,000 | 17,135 | ||||||
Empresa Nacional de Electricidad SA ADR | 393 | 18,813 | ||||||
Huaneng Power International, Inc. — Class H | 32,000 | 25,600 | ||||||
|
| |||||||
Total Independent Power Producers & Energy Traders |
| 84,354 | ||||||
|
| |||||||
Industrial Conglomerates - 2.7% | ||||||||
Alfa SAB de CV — Class A | 15,740 | 29,042 | ||||||
Beijing Enterprises Holdings Ltd. | 4,000 | 25,832 | ||||||
Bidvest Group Ltd. | 913 | 21,720 | ||||||
Citic Pacific Ltd. | 16,000 | 20,397 | ||||||
CJ Corp. | 303 | 29,589 | ||||||
DMCI Holdings, Inc. | 16,700 | 21,891 | ||||||
| SHARES | VALUE | |||||||
Doosan Corp. | 189 | $ | 21,835 | |||||
Far Eastern New Century Corp. | 20,630 | 21,363 | ||||||
KOC Holding AS | 5,662 | 26,567 | ||||||
LG Corp. | 401 | 24,488 | ||||||
Samsung Techwin Co., Ltd. | 347 | 18,168 | ||||||
Shanghai Industrial Holdings Ltd. | 8,000 | 25,703 | ||||||
Sime Darby BHD | 7,200 | 23,117 | ||||||
SK Holdings Co., Ltd. | 150 | 20,906 | ||||||
SM Investments Corp. | 1,340 | 26,120 | ||||||
|
| |||||||
Total Industrial Conglomerates |
| 356,738 | ||||||
|
| |||||||
Insurance - 2.5% | ||||||||
Cathay Financial Holding Co., Ltd. | 24,150 | 24,264 | ||||||
China Life Insurance Co., Ltd.* | 25,106 | 19,595 | ||||||
China Life Insurance Co., Ltd. — Class H | 8,000 | 23,638 | ||||||
China Pacific Insurance Group Co., | 7,800 | 24,457 | ||||||
Dongbu Insurance Co., Ltd. | 593 | 26,888 | ||||||
Hanwha Life Insurance Co., Ltd. | 3,430 | 24,185 | ||||||
Hyundai Marine & Fire Insurance Co., Ltd. | 790 | 25,534 | ||||||
PICC Property & Casualty Co., Ltd. — Class H | 16,000 | 21,306 | ||||||
Ping An Insurance Group Co. of China Ltd. — Class H | 4,000 | 31,690 | ||||||
Powszechny Zaklad Ubezpieczen SA | 220 | 25,686 | ||||||
Samsung Fire & Marine Insurance Co., Ltd. | 110 | 24,056 | ||||||
Samsung Life Insurance Co., Ltd. | 260 | 22,410 | ||||||
Sanlam Ltd. | 5,068 | 22,563 | ||||||
Shin Kong Financial Holding Co., Ltd.* | 83,000 | 21,508 | ||||||
|
| |||||||
Total Insurance |
| 337,780 | ||||||
|
| |||||||
Internet Software & Services - 0.4% | ||||||||
NHN Corp. | 94 | 21,763 | ||||||
Tencent Holdings Ltd. | 800 | 28,284 | ||||||
|
| |||||||
Total Internet Software & Services |
| 50,047 | ||||||
|
| |||||||
IT Services - 0.3% | ||||||||
SK C&C Co., Ltd. | 228 | 20,007 | ||||||
Wipro Ltd. ADR | 2,754 | 21,261 | ||||||
|
| |||||||
Total IT Services |
| 41,268 | ||||||
|
| |||||||
Machinery - 2.3% | ||||||||
Airtac International Group | 3,935 | 18,454 | ||||||
China Rongsheng Heavy Industries Group Holdings Ltd. | 161,500 | 34,800 | ||||||
CSR Corp., Ltd. — Class H | 31,000 | 24,080 | ||||||
Daewoo Shipbuilding & Marine Engineering Co., Ltd. | 1,020 | 21,885 | ||||||
Doosan Infracore Co., Ltd.* | 1,420 | 20,963 | ||||||
Hiwin Technologies Corp. | 4,150 | 26,708 | ||||||
Hyundai Heavy Industries Co., Ltd. | 106 | 22,257 | ||||||
Hyundai Mipo Dockyard | 205 | 21,899 | ||||||
Samsung Heavy Industries Co., Ltd. | 680 | 20,794 | ||||||
Sany Heavy Equipment International Holdings Co., Ltd. | 43,000 | 22,582 | ||||||
| See Notes to Financial Statements. | GUGGENHEIM ETFS ANNUAL REPORT | 113 |
Table of Contents
| SCHEDULE OF INVESTMENTS (continued) | October 31, 2012 |
GUGGENHEIM MSCI EMERGING MARKETS EQUAL WEIGHT ETF
| SHARES | VALUE | |||||||
United Tractors Tbk PT | 10,000 | $ | 21,968 | |||||
Weichai Power Co., Ltd. — Class H | 8,000 | 28,335 | ||||||
Zoomlion Heavy Industry Science and Technology Co., Ltd. — Class H | 20,400 | 27,481 | ||||||
|
| |||||||
Total Machinery |
| 312,206 | ||||||
|
| |||||||
Marine - 1.0% | ||||||||
China COSCO Holdings Co., Ltd. — Class H* | 57,000 | 28,316 | ||||||
China Shipping Container Lines Co., | 110,000 | 29,380 | ||||||
China Shipping Development Co., Ltd. — Class H | 56,000 | 29,409 | ||||||
Evergreen Marine Corp. Taiwan Ltd.* | 39,499 | 20,350 | ||||||
Yang Ming Marine Transport Corp.* | 55,000 | 21,463 | ||||||
|
| |||||||
Total Marine |
| 128,918 | ||||||
|
| |||||||
Media - 0.5% | ||||||||
BEC World PCL | 13,530 | 26,045 | ||||||
Grupo Televisa SA ADR | 787 | 17,786 | ||||||
Naspers Ltd. — Class N | 386 | 24,977 | ||||||
|
| |||||||
Total Media |
| 68,808 | ||||||
|
| |||||||
Metals & Mining - 6.9% | ||||||||
African Rainbow Minerals Ltd. | 1,279 | 26,685 | ||||||
Aluminum Corp. of China Ltd. ADR* | 2,361 | 25,428 | ||||||
Angang Steel Co., Ltd. — Class H* | 48,000 | 28,800 | ||||||
Anglo American Platinum Ltd. | 441 | 20,430 | ||||||
AngloGold Ashanti Ltd. ADR | 787 | 26,742 | ||||||
ArcelorMittal South Africa Ltd.* | 4,458 | 17,116 | ||||||
Assore Ltd. | 610 | 25,103 | ||||||
CAP SA | 638 | 21,971 | ||||||
China Steel Corp. | 27,360 | 23,508 | ||||||
Cia de Minas Buenaventura SA ADR | 787 | 28,143 | ||||||
Cia Siderurgica Nacional SA ADR(a) | 4,722 | 25,688 | ||||||
Dongkuk Steel Mill Co., Ltd. | 1,590 | 20,411 | ||||||
Eregli Demir ve Celik Fabrikalari TAS | 19,624 | 23,293 | ||||||
Gerdau SA ADR | 2,361 | 20,753 | ||||||
Gold Fields Ltd. ADR | 1,967 | 24,607 | ||||||
Grupo Mexico SAB de CV — Series B | 7,476 | 23,967 | ||||||
Harmony Gold Mining Co., Ltd. ADR | 2,361 | 19,596 | ||||||
Hyundai Hysco Co., Ltd. | 520 | 20,789 | ||||||
Hyundai Steel Co. | 295 | 21,234 | ||||||
Impala Platinum Holdings Ltd. | 1,381 | 24,765 | ||||||
Industrias Penoles SAB de CV | 531 | 26,465 | ||||||
Jiangxi Copper Co., Ltd. — Class H | 12,000 | 31,045 | ||||||
KGHM Polska Miedz SA | 571 | 28,740 | ||||||
Korea Zinc Co., Ltd. | 63 | 25,879 | ||||||
Koza Altin Isletmeleri AS | 1,141 | 24,797 | ||||||
Kumba Iron Ore Ltd. | 359 | 22,367 | ||||||
Mechel ADR | 3,918 | 24,879 | ||||||
MMC Norilsk Nickel OJSC ADR | 1,463 | 22,442 | ||||||
Novolipetsk Steel OJSC GDR | 1,295 | 24,463 | ||||||
POSCO ADR | 393 | 30,803 | ||||||
Severstal OAO GDR | 1,889 | 22,914 | ||||||
Shougang Fushan Resources Group Ltd. | 86,000 | 30,072 | ||||||
| SHARES | VALUE | |||||||
Southern Copper Corp. | 787 | $ | 29,985 | |||||
Sterlite Industries (India) Ltd. ADR | 3,229 | 24,185 | ||||||
Vale SA ADR | 1,184 | 21,691 | ||||||
Zhaojin Mining Industry Co., Ltd. — Class H | 16,000 | 26,839 | ||||||
Zijin Mining Group Co., Ltd. — Class H | 70,000 | 28,181 | ||||||
|
| |||||||
Total Metals & Mining |
| 914,776 | ||||||
|
| |||||||
Multiline Retail - 1.6% | ||||||||
Far Eastern Department Stores Co., Ltd. | 23,920 | 22,518 | ||||||
Golden Eagle Retail Group Ltd. | 12,000 | 26,322 | ||||||
Hyundai Department Store Co., Ltd. | 173 | 21,494 | ||||||
Intime Department Store Group Co., Ltd. | 21,500 | 25,467 | ||||||
Lotte Shopping Co., Ltd. | 79 | 24,448 | ||||||
Parkson Retail Group Ltd. | 27,500 | 23,277 | ||||||
S.A.C.I. Falabella | 2,357 | 24,150 | ||||||
Shinsegae Co., Ltd. | 112 | �� | 20,026 | |||||
Woolworths Holdings Ltd. | 3,116 | 23,426 | ||||||
|
| |||||||
Total Multiline Retail |
| 211,128 | ||||||
|
| |||||||
Oil, Gas & Consumable Fuels - 6.2% | ||||||||
Adaro Energy Tbk PT | 157,500 | 22,465 | ||||||
Banpu PCL | 1,574 | 20,542 | ||||||
Bumi Resources Tbk PT | 336,500 | 23,122 | ||||||
China Coal Energy Co., Ltd. — Class H | 28,000 | 27,819 | ||||||
China Petroleum & Chemical Corp.—Class H | 24,000 | 25,486 | ||||||
China Shenhua Energy Co., Ltd. — Class H | 6,000 | 25,548 | ||||||
CNOOC Ltd. ADR | 120 | 24,666 | ||||||
Ecopetrol SA ADR | 393 | 23,270 | ||||||
Empresas COPEC SA | 1,558 | 22,326 | ||||||
Exxaro Resources Ltd. | 1,224 | 24,412 | ||||||
Formosa Petrochemical Corp. | 8,000 | 23,278 | ||||||
Gazprom OAO ADR | 2,314 | 21,138 | ||||||
GS Holdings | 386 | 24,280 | ||||||
Indo Tambangraya Megah Tbk PT | 6,000 | 25,393 | ||||||
IRPC PCL | 185,726 | 26,056 | ||||||
Kunlun Energy Co., Ltd. | 16,000 | 29,729 | ||||||
Lukoil OAO ADR | 382 | 23,092 | ||||||
MOL Hungarian Oil and Gas PLC | 307 | 26,668 | ||||||
NovaTek OAO GDR | 185 | 21,090 | ||||||
PetroChina Co., Ltd. — Class H | 16,000 | 21,843 | ||||||
Petroleo Brasileiro SA ADR | 1,180 | 25,028 | ||||||
Polski Koncern Naftowy Orlen SA* | 1,861 | 25,514 | ||||||
Polskie Gornictwo Naftowe i Gazownictwo SA* | 18,301 | 22,627 | ||||||
PTT Exploration & Production PCL | 4,722 | 25,574 | ||||||
PTT PCL | 1,967 | 20,408 | ||||||
Rosneft Oil Co. GDR | 3,675 | 27,195 | ||||||
S-Oil Corp. | 240 | 21,984 | ||||||
Sasol Ltd. ADR | 393 | 16,667 | ||||||
SK Innovation Co., Ltd. | 153 | 22,517 | ||||||
Surgutneftegas SP ADR | 2,546 | 22,150 | ||||||
Tatneft ADR | 574 | 22,237 | ||||||
| 114 | GUGGENHEIM ETFS ANNUAL REPORT | See Notes to Financial Statements. |
Table of Contents
| SCHEDULE OF INVESTMENTS (continued) | October 31, 2012 |
GUGGENHEIM MSCI EMERGING MARKETS EQUAL WEIGHT ETF
| SHARES | VALUE | |||||||
Thai Oil PCL | 10,624 | $ | 23,137 | |||||
Tupras Turkiye Petrol Rafinerileri AS | 992 | 24,213 | ||||||
Ultrapar Participacoes SA ADR | 1,180 | 24,579 | ||||||
Yanzhou Coal Mining Co., Ltd. — Class H | 16,000 | 24,072 | ||||||
|
| |||||||
Total Oil, Gas & Consumable Fuels |
| 830,125 | ||||||
|
| |||||||
Paper & Forest Products - 0.8% | ||||||||
Empresas CMPC SA | 6,015 | 23,041 | ||||||
Fibria Celulose SA ADR* | 2,754 | 24,263 | ||||||
Nine Dragons Paper Holdings Ltd. | 47,000 | 33,112 | ||||||
Sappi Ltd.* | 8,255 | 23,277 | ||||||
|
| |||||||
Total Paper & Forest Products |
| 103,693 | ||||||
|
| |||||||
Personal Products - 0.5% | ||||||||
Amorepacific Corp. | 24 | 27,288 | ||||||
AMOREPACIFIC Group | 59 | 25,426 | ||||||
Hengan International Group Co., Ltd. | 2,000 | 18,219 | ||||||
|
| |||||||
Total Personal Products |
| 70,933 | ||||||
|
| |||||||
Pharmaceuticals - 0.5% |
| |||||||
Aspen Pharmacare Holdings Ltd.* | 1,330 | 24,156 | ||||||
Celltrion, Inc. | 797 | 19,622 | ||||||
Dr. Reddy’s Laboratories Ltd. ADR | 787 | 25,609 | ||||||
|
| |||||||
Total Pharmaceuticals |
| 69,387 | ||||||
|
| |||||||
Real Estate Investment Trusts (REITs) - 0.2% |
| |||||||
Emlak Konut Gayrimenkul Yatirim Ortakligi AS | 15,551 | 23,138 | ||||||
|
| |||||||
Total Real Estate Investment Trusts (REITs) |
| 23,138 | ||||||
|
| |||||||
Real Estate Management & Development - 2.4% |
| |||||||
Agile Property Holdings Ltd. | 16,000 | 18,188 | ||||||
China Overseas Land & Investment Ltd. | 8,000 | 20,955 | ||||||
China Resources Land Ltd. | 8,000 | 18,271 | ||||||
Country Garden Holdings Co., Ltd.* | 62,750 | 25,181 | ||||||
Evergrande Real Estate Group Ltd. | 59,000 | 25,808 | ||||||
Growthpoint Properties Ltd. | 7,039 | 19,104 | ||||||
Guangzhou R&F Properties Co., Ltd. — Class H | 18,800 | 23,118 | ||||||
Highwealth Construction Corp. | 12,000 | 16,657 | ||||||
Longfor Properties Co., Ltd. | 15,500 | 27,360 | ||||||
Poly Property Group Co., Ltd.* | 44,000 | 26,740 | ||||||
Ruentex Development Co., Ltd. | 12,000 | 20,128 | ||||||
Shimao Property Holdings Ltd. | 14,000 | 26,735 | ||||||
Soho China Ltd. | 35,500 | 24,140 | ||||||
UEM Land Holdings BHD* | 37,400 | 26,030 | ||||||
|
| |||||||
Total Real Estate Management & Development |
| 318,415 | ||||||
|
| |||||||
Semiconductors & Semiconductor Equipment - 3.4% |
| |||||||
Advanced Semiconductor Engineering, Inc. | 31,357 | 23,615 | ||||||
Epistar Corp. | 12,000 | 19,101 | ||||||
GCL-Poly Energy Holdings Ltd.a | 146,000 | 25,997 | ||||||
Kinsus Interconnect Technology Corp. | 8,000 | 21,991 | ||||||
Macronix International | 82,810 | 21,544 | ||||||
MediaTek, Inc. | 4,000 | 44,433 | ||||||
Motech Industries, Inc.* | 23,499 | 18,099 | ||||||
| SHARES | VALUE | |||||||
Novatek Microelectronics Corp. | 8,000 | $ | 30,124 | |||||
Phison Electronics Corp. | 4,000 | 30,740 | ||||||
Powertech Technology, Inc. | 12,000 | 18,650 | ||||||
Radiant Opto-Electronics Corp. | 4,118 | 17,128 | ||||||
Realtek Semiconductor Corp. | 12,120 | 22,819 | ||||||
Richtek Technology Corp. | 4,000 | 21,771 | ||||||
Samsung Electronics Co., Ltd. GDR | 39 | 23,517 | ||||||
Siliconware Precision Industries Co. ADR | 3,935 | 18,888 | ||||||
Sino-American Silicon Products, Inc. | 20,000 | 19,307 | ||||||
SK Hynix, Inc.* | 1,180 | 26,887 | ||||||
Taiwan Semiconductor Manufacturing Co., Ltd. ADR | 1,571 | 24,979 | ||||||
United Microelectronics Corp. ADR | 11,018 | 20,714 | ||||||
|
| |||||||
Total Semiconductors & Semiconductor Equipment |
| 450,304 | ||||||
|
| |||||||
Software - 0.1% | ||||||||
NCSoft Corp. | 98 | 18,781 | ||||||
|
| |||||||
Total Software |
| 18,781 | ||||||
|
| |||||||
Specialty Retail - 1.4% | ||||||||
Belle International Holdings Ltd. | 12,000 | 22,359 | ||||||
China ZhengTong Auto Services Holdings Ltd.* | 37,500 | 25,403 | ||||||
Foschini Group Ltd.(The) | 1,354 | 19,594 | ||||||
GOME Electrical Appliances Holding Ltd. | 260,000 | 27,174 | ||||||
Hengdeli Holdings Ltd. | 80,000 | 25,187 | ||||||
Mr Price Group Ltd. | 1,373 | 21,141 | ||||||
Truworths International Ltd. | 1,956 | 21,226 | ||||||
Zhongsheng Group Holdings Ltd. | 17,500 | 22,626 | ||||||
|
| |||||||
Total Specialty Retail |
| 184,710 | ||||||
|
| |||||||
Textiles, Apparel & Luxury Goods - 0.6% |
| |||||||
Anta Sports Products Ltd. | 39,000 | 33,213 | ||||||
Indorama Ventures PCL | 24,710 | 21,566 | ||||||
Ruentex Industries Ltd. | 12,000 | 27,070 | ||||||
|
| |||||||
Total Textiles, Apparel & Luxury Goods |
| 81,849 | ||||||
|
| |||||||
Tobacco - 0.3% | ||||||||
Gudang Garam Tbk PT | 4,000 | 20,469 | ||||||
KT&G Corp. | 291 | 22,173 | ||||||
|
| |||||||
Total Tobacco |
| 42,642 | ||||||
|
| |||||||
Trading Companies & Distributors - 0.7% |
| |||||||
Barloworld Ltd. | 2,664 | 21,513 | ||||||
Daewoo International Corp. | 750 | 28,815 | ||||||
Samsung C&T Corp. | 386 | 20,988 | ||||||
SK Networks Co., Ltd. | 2,720 | 23,818 | ||||||
|
| |||||||
Total Trading Companies & Distributors |
| 95,134 | ||||||
|
| |||||||
Transportation Infrastructure - 0.5% | ||||||||
China Merchants Holdings International Co., Ltd. | 8,000 | 26,529 | ||||||
COSCO Pacific Ltd. | 16,000 | 23,618 | ||||||
Jasa Marga Persero Tbk PT | 37,381 | 22,572 | ||||||
|
| |||||||
Total Transportation Infrastructure |
| 72,719 | ||||||
|
| |||||||
| See Notes to Financial Statements. | GUGGENHEIM ETFS ANNUAL REPORT | 115 |
Table of Contents
| SCHEDULE OF INVESTMENTS (continued) | October 31, 2012 |
GUGGENHEIM MSCI EMERGING MARKETS EQUAL WEIGHT ETF
| SHARES | VALUE | |||||||
Water Utilities - 0.6% | ||||||||
Aguas Andinas SA | 33,895 | $ | 22,723 | |||||
Cia de Saneamento Basico do Estado de Sao Paulo ADR | 393 | 33,016 | ||||||
Guangdong Investment Ltd. | 32,000 | 26,178 | ||||||
|
| |||||||
Total Water Utilities |
| 81,917 | ||||||
|
| |||||||
Wireless Telecommunication Services - 3.1% |
| |||||||
Advanced Info Service PCL | 3,148 | 20,285 | ||||||
America Movil SAB de CV ADR — Series L | 787 | 19,903 | ||||||
Axiata Group BHD | 11,500 | 24,654 | ||||||
China Mobile Ltd. ADR | 393 | 21,768 | ||||||
DiGi.Com Bhd | 14,600 | 25,452 | ||||||
ENTEL Chile SA | 1,133 | 23,053 | ||||||
Far EasTone Telecommunications Co., Ltd. | 8,000 | 18,458 | ||||||
Maxis Bhd | 9,900 | 22,621 | ||||||
Mobile Telesystems OJSC ADR | 1,180 | 20,225 | ||||||
MTN Group Ltd. | 1,196 | 21,494 | ||||||
Orascom Telecom Holding SAE GDR* | 7,606 | 22,856 | ||||||
Philippine Long Distance Telephone Co. ADR | 393 | 24,967 | ||||||
Sistema JSFC GDR | 1,157 | 21,231 | ||||||
SK Telecom Co., Ltd. ADR | 1,574 | 24,602 | ||||||
Taiwan Mobile Co., Ltd. | 8,000 | 27,933 | ||||||
Tim Participacoes SA ADR | 1,180 | 20,509 | ||||||
Turkcell Iletisim Hizmetleri AS ADR* | 1,574 | 23,909 | ||||||
Vodacom Group Ltd. | 1,763 | 22,151 | ||||||
|
| |||||||
Total Wireless Telecommunication Services |
| 406,071 | ||||||
|
| |||||||
Total Common Stocks |
| 11,453,417 | ||||||
|
| |||||||
| SHARES | VALUE | |||||||
EXCHANGE TRADED FUNDS - 13.9% | ||||||||
iShares MSCI Brazil Index Fund | 14,400 | $ | 767,808 | |||||
WisdomTree India Earnings Fund | 60,000 | 1,086,000 | ||||||
|
| |||||||
Total Exchange Traded Funds |
| 1,853,808 | ||||||
|
| |||||||
SHORT TERM INVESTMENTS - 0.1% | ||||||||
SSgA Government Money Market Fund | 13,888 | 13,888 | ||||||
|
| |||||||
Total Short Term Investments |
| 13,888 | ||||||
|
| |||||||
FACE | ||||||||
SECURITIES LENDING COLLATERAL - 0.2%d |
| |||||||
Joint Repurchase Agreements: | ||||||||
Merrill Lynch, Fenner & Smith, Inc. | $ | 9,446 | 9,446 | |||||
RBS Securities, Inc. | 16,060 | 16,060 | ||||||
|
| |||||||
Total Securities Lending Collateral |
| 25,506 | ||||||
|
| |||||||
Total Investments 100.2%c | 13,346,619 | |||||||
|
| |||||||
Other Assets and Liabilities, net - (0.2)% |
| (21,544 | ) | |||||
|
| |||||||
Net Assets - 100.0% |
| $ | 13,325,075 | |||||
|
| |||||||
| * | Non-Income Producing Security. |
| a | All or a portion of this security was on loan as of October 31, 2012. |
| b | Values determined based on Level 2 inputs (Note F). |
| c | Unless otherwise indicated, the values of the Investments are determined based on Level 1 inputs. |
| d | Securities lending collateral (Note I). |
| ADR | — American Depositary Receipt |
| GDR | — Global Depository Receipt |
| PLC | — Public Limited Company |
| 116 | GUGGENHEIM ETFS ANNUAL REPORT | See Notes to Financial Statements. |
Table of Contents
| SCHEDULE OF INVESTMENTS (concluded) | October 31, 2012 |
GUGGENHEIM MSCI EMERGING MARKETS EQUAL WEIGHT ETF
INVESTMENT CONCENTRATION
At October 31, 2012, the investment diversification of the Fund ‘‘by country’’ was as follows:
| Country | % of Total Investments | |||
United States | 14.41 | % | ||
South Korea | 14.22 | % | ||
Taiwan | 14.21 | % | ||
China | 9.91 | % | ||
South Africa | 5.61 | % | ||
Cayman Islands | 4.51 | % | ||
Hong Kong | 3.20 | % | ||
Turkey | 3.15 | % | ||
Thailand | 3.02 | % | ||
Indonesia | 2.85 | % | ||
Russia | 2.74 | % | ||
Brazil | 2.65 | % | ||
Malaysia | 2.54 | % | ||
Mexico | 2.21 | % | ||
Chile | 2.18 | % | ||
Slovakia | 1.97 | % | ||
Bermuda | 1.78 | % | ||
Switzerland | 1.65 | % | ||
Poland | 1.59 | % | ||
India | 1.15 | % | ||
Saudi Arabia | 0.84 | % | ||
Philippines | 0.73 | % | ||
Morocco | 0.56 | % | ||
Belize | 0.53 | % | ||
Czech | 0.50 | % | ||
Hungary | 0.40 | % | ||
Colombia | 0.36 | % | ||
Egypt | 0.32 | % | ||
Peru | 0.21 | % | ||
Total Investments | 100.00 | % | ||
| See Notes to Financial Statements. | GUGGENHEIM ETFS ANNUAL REPORT | 117 |
Table of Contents
| SCHEDULE OF INVESTMENTS | October 31, 2012 |
GUGGENHEIM S&P 500® EQUAL WEIGHT CONSUMER DISCRETIONARY ETF
| SHARES | VALUE | |||||||
COMMON STOCKS - 99.9% | ||||||||
Auto Components - 3.3% | ||||||||
BorgWarner, Inc.* | 6,881 | $ | 452,908 | |||||
Goodyear Tire & Rubber Co.(The)* | 39,778 | 453,867 | ||||||
Johnson Controls, Inc. | 18,403 | 473,877 | ||||||
|
| |||||||
Total Auto Components |
| 1,380,652 | ||||||
|
| |||||||
Automobiles - 2.7% | ||||||||
Ford Motor Co. | 51,033 | 569,528 | ||||||
Harley-Davidson, Inc. | 11,600 | 542,416 | ||||||
|
| |||||||
Total Automobiles |
| 1,111,944 | ||||||
|
| |||||||
Distributors - 1.3% | ||||||||
Genuine Parts Co. | 8,509 | 532,493 | ||||||
|
| |||||||
Total Distributors |
| 532,493 | ||||||
|
| |||||||
Diversified Consumer Services - 2.2% | ||||||||
Apollo Group, Inc. — Class A* | 18,266 | 366,781 | ||||||
H&R Block, Inc. | 31,741 | 561,816 | ||||||
|
| |||||||
Total Diversified Consumer Services |
| 928,597 | ||||||
|
| |||||||
Hotels, Restaurants & Leisure - 13.5% | ||||||||
Carnival Corp. | 14,158 | 536,305 | ||||||
Chipotle Mexican Grill, Inc.* | 1,596 | 406,230 | ||||||
Darden Restaurants, Inc. | 9,945 | 523,306 | ||||||
International Game Technology | 40,651 | 521,959 | ||||||
Marriott International, Inc. — Class A | 12,919 | 471,285 | ||||||
McDonald’s Corp. | 5,860 | 508,648 | ||||||
Starbucks Corp. | 10,651 | 488,881 | ||||||
Starwood Hotels & Resorts Worldwide, Inc. | 8,853 | 459,028 | ||||||
Wyndham Worldwide Corp. | 9,998 | 503,899 | ||||||
Wynn Resorts Ltd. | 4,756 | 575,761 | ||||||
Yum! Brands, Inc. | 8,074 | 566,068 | ||||||
|
| |||||||
Total Hotels, Restaurants & Leisure |
| 5,561,370 | ||||||
|
| |||||||
Household Durables - 9.3% | ||||||||
DR Horton, Inc. | 24,438 | 512,221 | ||||||
Harman International Industries, Inc. | 10,882 | 456,282 | ||||||
Leggett & Platt, Inc. | 21,496 | 570,289 | ||||||
Lennar Corp. — Class Aa | 14,735 | 552,120 | ||||||
Newell Rubbermaid, Inc. | 27,265 | 562,750 | ||||||
PulteGroup, Inc.* | 32,532 | 564,105 | ||||||
Whirlpool Corp. | 6,449 | 629,938 | ||||||
|
| |||||||
Total Household Durables |
| 3,847,705 | ||||||
|
| |||||||
Internet & Catalog Retail - 6.5% | ||||||||
Amazon.com, Inc.* | 2,056 | 478,678 | ||||||
Expedia, Inc. | 9,616 | 568,786 | ||||||
Netflix, Inc.*,a | 8,881 | 702,398 | ||||||
priceline.com, Inc.* | 844 | 484,262 | ||||||
TripAdvisor, Inc.* | 14,902 | 451,382 | ||||||
|
| |||||||
Total Internet & Catalog Retail |
| 2,685,506 | ||||||
|
| |||||||
Leisure Equipment & Products - 2.5% | ||||||||
Hasbro, Inc.a | 13,449 | 484,029 | ||||||
Mattel, Inc. | 14,856 | 546,404 | ||||||
|
| |||||||
Total Leisure Equipment & Products |
| 1,030,433 | ||||||
|
| |||||||
| SHARES | VALUE | |||||||
Media - 20.2% | ||||||||
Cablevision Systems Corp. — Class A | 31,650 | $ | 551,343 | |||||
CBS Corp. — Class B | 14,467 | 468,731 | ||||||
Comcast Corp. — Class A | 15,224 | 571,052 | ||||||
DIRECTV* | 9,929 | 507,471 | ||||||
Discovery Communications, Inc. — Class A* | 9,147 | 539,856 | ||||||
Gannett Co., Inc. | 30,570 | 516,633 | ||||||
Interpublic Group of Cos., Inc. (The) | 46,128 | 465,893 | ||||||
McGraw-Hill Cos., Inc.(The) | 10,044 | 555,232 | ||||||
News Corp. — Class A | 21,784 | 521,073 | ||||||
Omnicom Group, Inc. | 9,963 | 477,327 | ||||||
Scripps Networks Interactive, Inc. — Class A | 8,623 | 523,589 | ||||||
Time Warner Cable, Inc. | 5,817 | 576,523 | ||||||
Time Warner, Inc. | 12,019 | 522,226 | ||||||
Viacom, Inc. — Class B | 10,310 | 528,594 | ||||||
Walt Disney Co.(The) | 10,264 | 503,654 | ||||||
Washington Post Co.(The) — Class Ba | 1,494 | 498,264 | ||||||
|
| |||||||
Total Media |
| 8,327,461 | ||||||
|
| |||||||
Multiline Retail - 9.8% | ||||||||
Big Lots, Inc.* | 16,883 | 491,802 | ||||||
Dollar Tree, Inc.* | 11,384 | 453,880 | ||||||
Family Dollar Stores, Inc. | 8,370 | 552,085 | ||||||
J.C. Penney Co., Inc.a | 18,648 | 447,738 | ||||||
Kohl’s Corp. | 10,063 | 536,157 | ||||||
Macy’s, Inc. | 13,695 | 521,369 | ||||||
Nordstrom, Inc. | 9,337 | 530,062 | ||||||
Target Corp. | 8,311 | 529,826 | ||||||
|
| |||||||
Total Multiline Retail |
| 4,062,919 | ||||||
|
| |||||||
Specialty Retail - 22.5% | ||||||||
Abercrombie & Fitch Co. — Class A | 13,652 | 417,478 | ||||||
AutoNation, Inc.*,a | 12,745 | 565,878 | ||||||
AutoZone, Inc.* | 1,526 | 572,250 | ||||||
Bed Bath & Beyond, Inc.* | 7,504 | 432,831 | ||||||
Best Buy Co., Inc. | 28,922 | 439,904 | ||||||
CarMax, Inc.* | 16,616 | 560,790 | ||||||
GameStop Corp. — Class Aa | 23,212 | 529,930 | ||||||
Gap, Inc.(The) | 15,267 | 545,337 | ||||||
Home Depot, Inc. | 9,039 | 554,814 | ||||||
Limited Brands, Inc. | 10,680 | 511,465 | ||||||
Lowe’s Cos., Inc. | 18,280 | 591,906 | ||||||
O’Reilly Automotive, Inc.* | 6,685 | 572,771 | ||||||
PetSmart, Inc. | 7,768 | 515,718 | ||||||
Ross Stores, Inc. | 7,897 | 481,322 | ||||||
Staples, Inc. | 44,013 | 506,810 | ||||||
Tiffany & Co. | 8,192 | 517,898 | ||||||
TJX Cos., Inc. | 11,567 | 481,534 | ||||||
Urban Outfitters, Inc.* | 13,534 | 483,976 | ||||||
|
| |||||||
Total Specialty Retail |
| 9,282,612 | ||||||
|
| |||||||
| 118 | GUGGENHEIM ETFS ANNUAL REPORT | See Notes to Financial Statements. |
Table of Contents
| SCHEDULE OF INVESTMENTS (concluded) | October 31, 2012 |
GUGGENHEIM S&P 500® EQUAL WEIGHT CONSUMER DISCRETIONARY ETF
| SHARES | VALUE | |||||||
Textiles, Apparel & Luxury Goods - 6.1% |
| |||||||
Coach, Inc. | 8,660 | $ | 485,393 | |||||
Fossil, Inc.* | 5,742 | 500,128 | ||||||
NIKE, Inc. — Class B | 5,562 | 508,255 | ||||||
Ralph Lauren Corp. | 3,300 | 507,177 | ||||||
V.F. Corp. | 3,270 | 511,690 | ||||||
|
| |||||||
Total Textiles, Apparel & Luxury Goods |
| 2,512,643 | ||||||
|
| |||||||
Total Common Stocks |
| 41,264,335 | ||||||
|
| |||||||
SHORT TERM INVESTMENTS - 0.1% |
| |||||||
SSgA Government Money Market Fund | 43,851 | 43,851 | ||||||
|
| |||||||
Total Short Term Investments |
| 43,851 | ||||||
|
| |||||||
FACE | ||||||||
SECURITIES LENDING COLLATERAL - 4.3%d |
| |||||||
Joint Repurchase Agreements: | ||||||||
Merrill Lynch, Fenner & Smith, Inc. | $ | 665,191 | 665,191 | |||||
RBS Securities, Inc. | 1,130,991 | 1,130,991 | ||||||
|
| |||||||
Total Securities Lending Collateral |
| 1,796,182 | ||||||
|
| |||||||
Total Investments 104.3%c | 43,104,368 | |||||||
|
| |||||||
Other Assets and Liabilities, net – (4.3)% |
| (1,790,117 | ) | |||||
|
| |||||||
Net Assets – 100.0% | $ | 41,314,251 | ||||||
|
| |||||||
| * | Non-Income Producing Security. |
| a | All or a portion of this security was on loan as of October 31, 2012. |
| b | Values determined based on Level 2 inputs (Note F). |
| c | Unless otherwise indicated, the values of the Investments are determined based on Level 1 inputs. |
| d | Securities lending collateral (Note I). |
| See Notes to Financial Statements. | GUGGENHEIM ETFS ANNUAL REPORT | 119 |
Table of Contents
| SCHEDULE OF INVESTMENTS | October 31, 2012 |
GUGGENHEIM S&P 500® EQUAL WEIGHT CONSUMER STAPLES ETF
| SHARES | VALUE | |||||||
COMMON STOCKS - 99.7% |
| |||||||
Beverages - 21.0% |
| |||||||
Beam, Inc. | 16,681 | $ | 926,796 | |||||
Brown-Forman Corp. - Class B | 15,325 | 981,719 | ||||||
Coca-Cola Co.(The) | 25,805 | 959,430 | ||||||
Coca-Cola Enterprises, Inc. | 31,553 | 992,026 | ||||||
Constellation Brands, Inc. — Class A* | 30,556 | 1,079,849 | ||||||
Dr Pepper Snapple Group, Inc. | 22,313 | 956,112 | ||||||
Molson Coors Brewing Co. — Class B | 21,443 | 925,051 | ||||||
Monster Beverage Corp.* | 18,295 | 817,238 | ||||||
PepsiCo, Inc. | 13,957 | 966,383 | ||||||
|
| |||||||
Total Beverages | 8,604,604 | |||||||
|
| |||||||
Food & Staples Retailing - 19.2% |
| |||||||
Costco Wholesale Corp. | 9,625 | 947,389 | ||||||
CVS Caremark Corp. | 21,154 | 981,546 | ||||||
Kroger Co.(The) | 41,326 | 1,042,242 | ||||||
Safeway, Inc.a | 58,337 | 951,476 | ||||||
Sysco Corp. | 32,410 | 1,006,979 | ||||||
Wal-Mart Stores, Inc. | 13,205 | 990,639 | ||||||
Walgreen Co. | 27,305 | 961,955 | ||||||
Whole Foods Market, Inc. | 10,062 | 953,173 | ||||||
|
| |||||||
Total Food & Staples Retailing | 7,835,399 | |||||||
|
| |||||||
Food Products - 35.7% |
| |||||||
Archer-Daniels-Midland Co. | 36,177 | 970,991 | ||||||
Campbell Soup Co.a | 28,471 | 1,004,172 | ||||||
ConAgra Foods, Inc. | 38,439 | 1,070,142 | ||||||
Dean Foods Co.* | 60,979 | 1,026,886 | ||||||
General Mills, Inc. | 25,292 | 1,013,703 | ||||||
H.J. Heinz Co. | 17,503 | 1,006,598 | ||||||
Hershey Co.(The) | 14,031 | 966,034 | ||||||
Hormel Foods Corp. | 33,938 | 1,002,189 | ||||||
J.M. Smucker Co.(The) | 11,425 | 978,437 | ||||||
Kellogg Co. | 19,598 | 1,025,367 | ||||||
Kraft Foods Group, Inc.* | 17,159 | 780,391 | ||||||
McCormick & Co., Inc. | 15,774 | 971,994 | ||||||
Mead Johnson Nutrition Co. | 13,087 | 806,945 | ||||||
Mondelez International, Inc. — Class A | 37,657 | 999,417 | ||||||
Tyson Foods, Inc. — Class A | 59,759 | 1,004,549 | ||||||
|
| |||||||
Total Food Products | 14,627,815 | |||||||
|
| |||||||
Household Products - 9.7% |
| |||||||
Clorox Co.(The) | 13,933 | 1,007,356 | ||||||
Colgate-Palmolive Co. | 9,481 | 995,126 | ||||||
Kimberly-Clark Corp. | 11,897 | 992,805 | ||||||
Procter & Gamble Co.(The) | 14,223 | 984,800 | ||||||
|
| |||||||
Total Household Products | 3,980,087 | |||||||
|
| |||||||
| SHARES | VALUE | |||||||
Personal Products - 4.7% |
| |||||||
Avon Products, Inc. | 60,379 | $ | 935,271 | |||||
Estee Lauder Cos., Inc.(The) — | 16,062 | 989,740 | ||||||
|
| |||||||
Total Personal Products | 1,925,011 | |||||||
|
| |||||||
Tobacco - 9.4% |
| |||||||
Altria Group, Inc. | 29,862 | 949,612 | ||||||
Lorillard, Inc. | 8,538 | 990,493 | ||||||
Philip Morris International, Inc. | 10,992 | 973,452 | ||||||
Reynolds American, Inc. | 22,377 | 931,778 | ||||||
|
| |||||||
Total Tobacco | 3,845,335 | |||||||
|
| |||||||
Total Common Stocks | 40,818,251 | |||||||
|
| |||||||
SHORT TERM INVESTMENTS - 0.2% |
| |||||||
SSgA Government Money Market Fund | 86,958 | 86,958 | ||||||
|
| |||||||
Total Short Term Investments | 86,958 | |||||||
|
| |||||||
FACE | ||||||||
SECURITIES LENDING COLLATERAL - 2.2%d |
| |||||||
Joint Repurchase Agreements: | ||||||||
Merrill Lynch, Fenner & Smith, Inc. | $ | 329,382 | 329,382 | |||||
RBS Securities, Inc. | 560,031 | 560,031 | ||||||
|
| |||||||
Total Securities Lending Collateral | 889,413 | |||||||
|
| |||||||
Total Investments - 102.1%c |
| 41,794,622 | ||||||
|
| |||||||
Other Assets and Liabilities, net - (2.1)% | (850,311 | ) | ||||||
|
| |||||||
Net Assets - 100.0% | $ | 40,944,311 | ||||||
|
| |||||||
| * | Non-Income Producing Security. |
| a | All or a portion of this security was on loan as of October 31, 2012. |
| b | Values determined based on Level 2 inputs (Note F). |
| c | Unless otherwise indicated, the values of the Investments are determined based on Level 1 inputs. |
| d | Securities lending collateral (Note I). |
| 120 | GUGGENHEIM ETFS ANNUAL REPORT | See Notes to Financial Statements. |
Table of Contents
| SCHEDULE OF INVESTMENTS | October 31, 2012 |
GUGGENHEIM S&P 500® EQUAL WEIGHT ENERGY ETF
| SHARES | VALUE | |||||||
COMMON STOCKS - 99.8% |
| |||||||
Energy Equipment & Services - 26.4% |
| |||||||
Baker Hughes, Inc. | 15,804 | $ | 663,294 | |||||
Cameron International Corp.* | 13,404 | 678,779 | ||||||
Diamond Offshore Drilling, Inc. | 11,455 | 793,144 | ||||||
Ensco PLC — Class A | 13,606 | 786,699 | ||||||
FMC Technologies, Inc.* | 15,828 | 647,365 | ||||||
Halliburton Co. | 21,122 | 682,029 | ||||||
Helmerich & Payne, Inc. | 15,357 | 734,065 | ||||||
Nabors Industries Ltd.* | 47,381 | 639,170 | ||||||
National Oilwell Varco, Inc. | 9,324 | 687,179 | ||||||
Noble Corp. | 20,529 | 774,764 | ||||||
Rowan Cos., PLC — Class A* | 21,292 | 675,169 | ||||||
Schlumberger Ltd. | 10,190 | 708,511 | ||||||
|
| |||||||
Total Energy Equipment & Services | 8,470,168 | |||||||
|
| |||||||
Oil, Gas & Consumable Fuels - 73.4% |
| |||||||
Anadarko Petroleum Corp. | 10,462 | 719,890 | ||||||
Apache Corp. | 8,553 | 707,761 | ||||||
Cabot Oil & Gas Corp. | 17,243 | 810,076 | ||||||
Chesapeake Energy Corp. | 38,540 | 780,820 | ||||||
Chevron Corp. | 6,746 | 743,477 | ||||||
ConocoPhillips | 13,586 | 785,950 | ||||||
CONSOL Energy, Inc. | 24,096 | 847,215 | ||||||
Denbury Resources, Inc.* | 44,803 | 686,830 | ||||||
Devon Energy Corp. | 12,455 | 725,006 | ||||||
EOG Resources, Inc. | 6,722 | 783,046 | ||||||
EQT Corp. | 13,349 | 809,350 | ||||||
Exxon Mobil Corp. | 8,568 | 781,145 | ||||||
Hess Corp. | 14,108 | 737,284 | ||||||
Kinder Morgan, Inc. | 21,826 | 757,580 | ||||||
Marathon Oil Corp. | 25,436 | 764,606 | ||||||
Marathon Petroleum Corp. | 14,219 | 781,050 | ||||||
Murphy Oil Corp. | 14,060 | 843,600 | ||||||
Newfield Exploration Co.* | 22,459 | 609,088 | ||||||
Noble Energy, Inc. | 8,173 | 776,517 | ||||||
Occidental Petroleum Corp. | 8,600 | 679,056 | ||||||
Peabody Energy Corp. | 30,877 | 861,468 | ||||||
Phillips 66 | 16,923 | 798,089 | ||||||
Pioneer Natural Resources Co. | 6,987 | 738,176 | ||||||
QEP Resources, Inc. | 23,803 | 690,287 | ||||||
Range Resources Corp. | 11,281 | 737,326 | ||||||
Southwestern Energy Co.* | 22,190 | 769,993 | ||||||
Spectra Energy Corp. | 27,457 | 792,684 | ||||||
Tesoro Corp. | 19,359 | 730,028 | ||||||
Valero Energy Corp. | 23,432 | 681,871 | ||||||
Williams Cos., Inc.(The) | 22,530 | 788,325 | ||||||
WPX Energy, Inc.* | 45,242 | 766,399 | ||||||
|
| |||||||
Total Oil, Gas & Consumable Fuels | 23,483,993 | |||||||
|
| |||||||
Total Common Stocks | 31,954,161 | |||||||
|
| |||||||
| SHARES | VALUE | |||||||
SHORT TERM INVESTMENTS - 0.1% |
| |||||||
SSgA Government Money Market Fund | 28,094 | $ | 28,094 | |||||
|
| |||||||
Total Short Term Investments | 28,094 | |||||||
|
| |||||||
Total Investments - 99.9%a | 31,982,255 | |||||||
|
| |||||||
Other Assets and Liabilities, net - 0.1% | 21,420 | |||||||
|
| |||||||
Net Assets - 100.0% | $ | 32,003,675 | ||||||
|
| |||||||
| * | Non-Income Producing Security. |
| a | Unless otherwise indicated, the values of the Investments are determined based on Level 1 inputs. |
| See Notes to Financial Statements. | GUGGENHEIM ETFS ANNUAL REPORT | 121 |
Table of Contents
| SCHEDULE OF INVESTMENTS | October 31, 2012 |
GUGGENHEIM S&P 500® EQUAL WEIGHT FINANCIAL ETF
| SHARES | VALUE | |||||||
COMMON STOCKS - 99.8% |
| |||||||
Capital Markets - 17.4% |
| |||||||
Ameriprise Financial, Inc. | 3,064 | $ | 178,846 | |||||
Bank of New York Mellon Corp.(The) | 7,681 | 189,797 | ||||||
BlackRock, Inc. | 992 | 188,163 | ||||||
Charles Schwab Corp.(The) | 12,573 | 170,741 | ||||||
E*Trade Financial Corp.* | 18,363 | 153,515 | ||||||
Federated Investors, Inc. — Class Ba | 8,341 | 193,845 | ||||||
Franklin Resources, Inc. | 1,418 | 181,220 | ||||||
Goldman Sachs Group, Inc.(The) | 1,495 | 182,973 | ||||||
Invesco Ltd. | 7,027 | 170,897 | ||||||
Legg Mason, Inc. | 6,732 | 171,531 | ||||||
Morgan Stanley | 9,947 | 172,879 | ||||||
Northern Trust Corp. | 3,693 | 176,451 | ||||||
State Street Corp. | 4,131 | 184,119 | ||||||
T. Rowe Price Group, Inc. | 2,757 | 179,040 | ||||||
|
| |||||||
Total Capital Markets | 2,494,017 | |||||||
|
| |||||||
Commercial Banks - 15.2% |
| |||||||
BB&T Corp. | 5,338 | 154,535 | ||||||
Comerica, Inc. | 5,493 | 163,746 | ||||||
Fifth Third Bancorp | 11,497 | 167,052 | ||||||
First Horizon National Corp. | 17,735 | 165,113 | ||||||
Huntington Bancshares, Inc. | 25,199 | 161,022 | ||||||
KeyCorp | 20,070 | 168,989 | ||||||
M&T Bank Corp. | 1,914 | 199,248 | ||||||
PNC Financial Services Group, Inc. | 2,717 | 158,102 | ||||||
Regions Financial Corp. | 23,810 | 155,241 | ||||||
SunTrust Banks, Inc. | 6,066 | 164,995 | ||||||
US Bancorp | 5,194 | 172,493 | ||||||
Wells Fargo & Co. | 5,022 | 169,191 | ||||||
Zions Bancorp | 8,498 | 182,452 | ||||||
|
| |||||||
Total Commercial Banks | 2,182,179 | |||||||
|
| |||||||
Consumer Finance - 5.1% |
| |||||||
American Express Co. | 3,061 | 171,324 | ||||||
Capital One Financial Corp. | 3,056 | 183,880 | ||||||
Discover Financial Services | 4,616 | 189,256 | ||||||
SLM Corp. | 10,812 | 190,075 | ||||||
|
| |||||||
Total Consumer Finance | 734,535 | |||||||
|
| |||||||
Diversified Financial Services - 11.3% |
| |||||||
Bank of America Corp. | 18,998 | 177,061 | ||||||
Citigroup, Inc. | 5,215 | 194,989 | ||||||
CME Group, Inc. | 3,081 | 172,320 | ||||||
IntercontinentalExchange, Inc.* | 1,295 | 169,645 | ||||||
JPMorgan Chase & Co. | 4,364 | 181,892 | ||||||
Leucadia National Corp. | 7,595 | 172,407 | ||||||
Moody’s Corp. | 4,140 | 199,382 | ||||||
NASDAQ OMX Group, Inc.(The) | 7,414 | 176,527 | ||||||
NYSE Euronext | 6,752 | 167,180 | ||||||
|
| |||||||
Total Diversified Financial Services | 1,611,403 | |||||||
|
| |||||||
Insurance - 27.7% |
| |||||||
ACE Ltd. | 2,355 | 185,221 | ||||||
AFLAC, Inc. | 3,653 | 181,846 | ||||||
Allstate Corp.(The) | 4,552 | 181,989 | ||||||
| SHARES | VALUE | |||||||
American International Group, Inc.* | 5,181 | $ | 180,972 | |||||
Aon PLC | 3,416 | 184,293 | ||||||
Assurant, Inc. | 4,754 | 179,749 | ||||||
Berkshire Hathaway, Inc. — Class B* | 2,046 | 176,672 | ||||||
Chubb Corp.(The) | 2,385 | 183,597 | ||||||
Cincinnati Financial Corp. | 4,548 | 181,192 | ||||||
Genworth Financial, Inc. — Class A* | 29,646 | 176,690 | ||||||
Hartford Financial Services Group, Inc. | 8,920 | 193,653 | ||||||
Lincoln National Corp. | 7,032 | 174,323 | ||||||
Loews Corp. | 4,250 | 179,690 | ||||||
Marsh & McLennan Cos., Inc. | 5,199 | 176,922 | ||||||
MetLife, Inc. | 5,005 | 177,628 | ||||||
Principal Financial Group, Inc. | 6,222 | 171,354 | ||||||
Progressive Corp.(The) | 8,718 | 194,412 | ||||||
Prudential Financial, Inc. | 3,094 | 176,513 | ||||||
Torchmark Corp. | 3,439 | 173,979 | ||||||
Travelers Cos., Inc.(The) | 2,645 | 187,636 | ||||||
Unum Group | 8,672 | 175,868 | ||||||
XL Group PLC | 7,352 | 181,889 | ||||||
|
| |||||||
Total Insurance | 3,976,088 | |||||||
|
| |||||||
Real Estate Investment Trusts (REITs) - 19.4% |
| |||||||
American Tower Corp. | 2,543 | 191,462 | ||||||
Apartment Investment & Management Co. — Class A | 6,617 | 176,608 | ||||||
AvalonBay Communities, Inc. | 1,284 | 174,059 | ||||||
Boston Properties, Inc. | 1,563 | 166,147 | ||||||
Equity Residential | 3,013 | 172,976 | ||||||
HCP, Inc. | 3,908 | 173,124 | ||||||
Health Care REIT, Inc. | 3,102 | 184,352 | ||||||
Host Hotels & Resorts, Inc. | 10,518 | 152,090 | ||||||
Kimco Realty Corp. | 8,627 | 168,399 | ||||||
Plum Creek Timber Co., Inc. | 4,154 | 182,361 | ||||||
ProLogis, Inc. | 4,919 | 168,672 | ||||||
Public Storage | 1,219 | 168,990 | ||||||
Simon Property Group, Inc. | 1,115 | 169,714 | ||||||
Ventas, Inc. | 2,789 | 176,460 | ||||||
Vornado Realty Trust | 2,132 | 171,008 | ||||||
Weyerhaeuser Co. | 6,682 | 185,025 | ||||||
|
| |||||||
Total Real Estate Investment Trusts (REITs) | 2,781,447 | |||||||
|
| |||||||
Real Estate Management & Development - 1.1% |
| |||||||
CBRE Group, Inc.* | 8,911 | 160,576 | ||||||
|
| |||||||
Total Real Estate Management & Development | 160,576 | |||||||
|
| |||||||
Thrifts & Mortgage Finance - 2.6% |
| |||||||
Hudson City Bancorp, Inc. | 22,850 | 193,882 | ||||||
People’s United Financial, Inc. | 14,572 | 175,301 | ||||||
|
| |||||||
Total Thrifts & Mortgage Finance | 369,183 | |||||||
|
| |||||||
Total Common Stocks | 14,309,428 | |||||||
|
| |||||||
| 122 | GUGGENHEIM ETFS ANNUAL REPORT | See Notes to Financial Statements. |
Table of Contents
| SCHEDULE OF INVESTMENTS (concluded) | October 31, 2012 |
GUGGENHEIM S&P 500® EQUAL WEIGHT FINANCIAL ETF
| SHARES | VALUE | |||||||
SHORT TERM INVESTMENTS - 0.2% |
| |||||||
SSgA Government Money Market Fund | 24,504 | $ | 24,504 | |||||
|
| |||||||
Total Short Term Investments | 24,504 | |||||||
|
| |||||||
FACE | ||||||||
SECURITIES LENDING COLLATERAL - 0.6%d |
| |||||||
Joint Repurchase Agreements: | ||||||||
Merrill Lynch, Fenner & Smith, Inc. | $ | 31,671 | 31,671 | |||||
RBS Securities, Inc. | 53,849 | 53,849 | ||||||
|
| |||||||
Total Securities Lending Collateral | 85,520 | |||||||
|
| |||||||
Total Investments 100.6%c | 14,419,452 | |||||||
|
| |||||||
Other Assets and Liabilities, net - (0.6)% | (80,931 | ) | ||||||
|
| |||||||
Net Assets - 100.0% | $ | 14,338,521 | ||||||
|
| |||||||
| * | Non-Income Producing Security. |
| a | All or a portion of this security was on loan as of October 31, 2012. |
| b | Values determined based on Level 2 inputs (Note F). |
| c | Unless otherwise indicated, the values of the Investments are determined based on Level 1 inputs. |
| d | Securities lending collateral (Note I). |
| See Notes to Financial Statements. | GUGGENHEIM ETFS ANNUAL REPORT | 123 |
Table of Contents
| SCHEDULE OF INVESTMENTS | October 31, 2012 |
GUGGENHEIM S&P 500® EQUAL WEIGHT HEALTH CARE ETF
| SHARES | VALUE | |||||||
COMMON STOCKS - 99.2% | ||||||||
Biotechnology - 9.2% | ||||||||
Alexion Pharmaceuticals, Inc.* | 6,646 | $ | 600,665 | |||||
Amgen, Inc. | 9,032 | 781,674 | ||||||
Biogen Idec, Inc.* | 4,764 | 658,480 | ||||||
Celgene Corp.* | 9,634 | 706,365 | ||||||
Gilead Sciences, Inc.* | 11,847 | 795,645 | ||||||
|
| |||||||
Total Biotechnology |
| 3,542,829 | ||||||
|
| |||||||
Health Care Equipment & Supplies - 25.7% |
| |||||||
Baxter International, Inc. | 12,152 | 761,080 | ||||||
Becton, Dickinson and Co. | 9,283 | 702,537 | ||||||
Boston Scientific Corp.* | 126,256 | 648,956 | ||||||
C.R. Bard, Inc. | 7,183 | 690,933 | ||||||
CareFusion Corp.* | 26,380 | 700,653 | ||||||
Covidien PLC | 12,453 | 684,292 | ||||||
DENTSPLY International, Inc. | 19,516 | 718,969 | ||||||
Edwards Lifesciences Corp.* | 6,992 | 607,115 | ||||||
Intuitive Surgical, Inc.* | 1,466 | 794,895 | ||||||
Medtronic, Inc. | 17,072 | 709,854 | ||||||
St Jude Medical, Inc. | 17,531 | 670,736 | ||||||
Stryker Corp. | 13,122 | 690,217 | ||||||
Varian Medical Systems, Inc.* | 11,933 | 796,647 | ||||||
Zimmer Holdings, Inc. | 10,988 | 705,540 | ||||||
|
| |||||||
Total Health Care Equipment & Supplies |
| 9,882,424 | ||||||
|
| |||||||
Health Care Providers & Services - 29.7% |
| |||||||
Aetna, Inc. | 18,823 | 822,565 | ||||||
AmerisourceBergen Corp. | 19,665 | 775,587 | ||||||
Cardinal Health, Inc. | 19,144 | 787,393 | ||||||
CIGNA Corp. | 15,371 | 783,921 | ||||||
Coventry Health Care, Inc. | 17,675 | 771,337 | ||||||
DaVita, Inc.* | 7,459 | 839,287 | ||||||
Express Scripts Holding Co.* | 11,694 | 719,649 | ||||||
Humana, Inc. | 10,333 | 767,432 | ||||||
Laboratory Corp. of America Holdings* | 8,078 | 684,449 | ||||||
McKesson Corp. | 8,405 | 784,270 | ||||||
Patterson Cos., Inc. | 21,369 | 713,725 | ||||||
Quest Diagnostics, Inc. | 11,943 | 689,350 | ||||||
Tenet Healthcare Corp.* | 31,890 | 752,604 | ||||||
UnitedHealth Group, Inc. | 13,547 | 758,632 | ||||||
WellPoint, Inc. | 12,596 | 771,883 | ||||||
|
| |||||||
Total Health Care Providers & Services |
| 11,422,084 | ||||||
|
| |||||||
Health Care Technology - 2.0% | ||||||||
Cerner Corp.* | 10,207 | 777,671 | ||||||
|
| |||||||
Total Health Care Technology |
| 777,671 | ||||||
|
| |||||||
| SHARES | VALUE | |||||||
Life Sciences Tools & Services - 9.4% | ||||||||
Agilent Technologies, Inc. | 18,497 | $ | 665,707 | |||||
Life Technologies Corp.* | 15,016 | 734,432 | ||||||
PerkinElmer, Inc. | 24,206 | 748,692 | ||||||
Thermo Fisher Scientific, Inc. | 12,123 | 740,230 | ||||||
Waters Corp.* | 8,643 | 707,084 | ||||||
|
| |||||||
Total Life Sciences Tools & Services |
| 3,596,145 | ||||||
|
| |||||||
Pharmaceuticals - 23.2% | ||||||||
Abbott Laboratories | 10,765 | 705,323 | ||||||
Allergan, Inc. | 8,239 | 740,851 | ||||||
Bristol-Myers Squibb Co. | 22,103 | 734,925 | ||||||
Eli Lilly & Co. | 15,731 | 764,999 | ||||||
Forest Laboratories, Inc.* | 21,076 | 710,472 | ||||||
Hospira, Inc.* | 21,197 | 650,536 | ||||||
Johnson & Johnson | 10,732 | 760,040 | ||||||
Merck & Co., Inc. | 16,847 | 768,729 | ||||||
Mylan, Inc.* | 30,237 | 766,206 | ||||||
Perrigo Co. | 6,538 | 751,935 | ||||||
Pfizer, Inc. | 30,873 | 767,811 | ||||||
Watson Pharmaceuticals, Inc.* | 8,974 | 771,315 | ||||||
|
| |||||||
Total Pharmaceuticals |
| 8,893,142 | ||||||
|
| |||||||
Total Common Stocks |
| 38,114,295 | ||||||
|
| |||||||
SHORT TERM INVESTMENTS - 0.8% | ||||||||
SSgA Government Money Market Fund | 296,632 | 296,632 | ||||||
|
| |||||||
Total Short Term Investments |
| 296,632 | ||||||
|
| |||||||
Total Investments 100.0%a | 38,410,927 | |||||||
|
| |||||||
Other Assets and Liabilities, net - 0.0%b |
| 7,774 | ||||||
|
| |||||||
Net Assets - 100.0% |
| $ | 38,418,701 | |||||
|
| |||||||
| * | Non-Income Producing Security. |
| a | Unless otherwise indicated, the values of the Investments are determined based on Level 1 inputs. |
| b | Amount represents less than 0.1% of net assets. |
| 124 | GUGGENHEIM ETFS ANNUAL REPORT | See Notes to Financial Statements. |
Table of Contents
| SCHEDULE OF INVESTMENTS | October 31, 2012 |
GUGGENHEIM S&P 500® EQUAL WEIGHT INDUSTRIALS ETF
| SHARES | VALUE | |||||||
COMMON STOCKS - 99.6% |
| |||||||
Aerospace & Defense - 18.0% |
| |||||||
Boeing Co.(The) | 3,931 | $ | 276,900 | |||||
General Dynamics Corp. | 4,196 | 285,664 | ||||||
Honeywell International, Inc. | 4,593 | 281,275 | ||||||
L-3 Communications Holdings, Inc. | 3,834 | 282,949 | ||||||
Lockheed Martin Corp. | 3,030 | 283,820 | ||||||
Northrop Grumman Corp. | 4,225 | 290,215 | ||||||
Precision Castparts Corp. | 1,736 | 300,450 | ||||||
Raytheon Co. | 4,849 | 274,259 | ||||||
Rockwell Collins, Inc. | 5,277 | 282,742 | ||||||
Textron, Inc. | 9,881 | 249,100 | ||||||
United Technologies Corp. | 3,399 | 265,666 | ||||||
|
| |||||||
Total Aerospace & Defense | 3,073,040 | |||||||
|
| |||||||
Air Freight & Logistics - 6.6% |
| |||||||
C.H. Robinson Worldwide, Inc. | 4,893 | 295,194 | ||||||
Expeditors International of Washington, Inc. | 7,156 | 261,981 | ||||||
FedEx Corp. | 3,110 | 286,089 | ||||||
United Parcel Service, Inc. — Class B | 3,803 | 278,570 | ||||||
|
| |||||||
Total Air Freight & Logistics | 1,121,834 | |||||||
|
| |||||||
Airlines - 1.6% |
| |||||||
Southwest Airlines Co. | 30,898 | 272,520 | ||||||
|
| |||||||
Total Airlines | 272,520 | |||||||
|
| |||||||
Building Products - 1.6% |
| |||||||
Masco Corp. | 17,736 | 267,636 | ||||||
|
| |||||||
Total Building Products | 267,636 | |||||||
|
| |||||||
Commercial Services & Supplies - 14.6% |
| |||||||
ADT Corp.(The)* | 7,220 | 299,702 | ||||||
Avery Dennison Corp. | 8,801 | 284,976 | ||||||
Cintas Corp. | 6,718 | 280,880 | ||||||
Iron Mountain, Inc. | 8,416 | 291,194 | ||||||
Pitney Bowes, Inc.a | 18,353 | 263,549 | ||||||
R.R. Donnelley & Sons Co.a | 23,629 | 236,763 | ||||||
Republic Services, Inc. | 9,796 | 277,717 | ||||||
Stericycle, Inc.* | 3,008 | 285,038 | ||||||
Waste Management, Inc. | 8,252 | 270,170 | ||||||
|
| |||||||
Total Commercial Services & Supplies | 2,489,989 | |||||||
|
| |||||||
Construction & Engineering - 4.6% |
| |||||||
Fluor Corp. | 4,659 | 260,205 | ||||||
Jacobs Engineering Group, Inc.* | 6,469 | 249,639 | ||||||
Quanta Services, Inc.* | 10,854 | 281,444 | ||||||
|
| |||||||
Total Construction & Engineering | 791,288 | |||||||
|
| |||||||
Electrical Equipment - 6.6% |
| |||||||
Cooper Industries PLC | 3,739 | 280,201 | ||||||
Emerson Electric Co. | 5,626 | 272,467 | ||||||
Rockwell Automation, Inc. | 3,957 | 281,184 | ||||||
Roper Industries, Inc. | 2,664 | 290,829 | ||||||
|
| |||||||
Total Electrical Equipment | 1,124,681 | |||||||
|
| |||||||
Industrial Conglomerates - 6.2% |
| |||||||
3M Co. | 2,982 | 261,223 | ||||||
Danaher Corp. | 5,118 | 264,754 | ||||||
| SHARES | VALUE | |||||||
General Electric Co. | 12,676 | $ | 266,957 | |||||
Tyco International Ltd. | 10,325 | 277,433 | ||||||
|
| |||||||
Total Industrial Conglomerates | 1,070,367 | |||||||
|
| |||||||
Machinery - 25.6% |
| |||||||
Caterpillar, Inc. | 3,008 | 255,108 | ||||||
Cummins, Inc. | 2,731 | 255,567 | ||||||
Deere & Co. | 3,417 | 291,948 | ||||||
Dover Corp. | 4,547 | 264,726 | ||||||
Eaton Corp.a | 5,935 | 280,251 | ||||||
Flowserve Corp. | 2,079 | 281,684 | ||||||
Illinois Tool Works, Inc. | 4,584 | 281,137 | ||||||
Ingersoll-Rand PLC | 6,069 | 285,425 | ||||||
Joy Global, Inc. | 4,549 | 284,085 | ||||||
PACCAR, Inc. | 6,511 | 282,187 | ||||||
Pall Corp. | 4,373 | 275,324 | ||||||
Parker Hannifin Corp. | 3,244 | 255,173 | ||||||
Pentair Ltd. | 6,262 | 264,507 | ||||||
Snap-on, Inc. | 3,817 | 295,169 | ||||||
Stanley Black & Decker, Inc. | 3,655 | 253,291 | ||||||
Xylem, Inc. | 10,961 | 265,914 | ||||||
|
| |||||||
Total Machinery | 4,371,496 | |||||||
|
| |||||||
Professional Services - 4.9% |
| |||||||
Dun & Bradstreet Corp. (The) | 3,329 | 269,782 | ||||||
Equifax, Inc. | 5,919 | 296,187 | ||||||
Robert Half International, Inc. | 10,210 | 274,547 | ||||||
|
| |||||||
Total Professional Services | 840,516 | |||||||
|
| |||||||
Road & Rail - 6.1% |
| |||||||
CSX Corp. | 12,101 | 247,708 | ||||||
Norfolk Southern Corp. | 3,752 | 230,185 | ||||||
Ryder System, Inc. | 6,518 | 294,092 | ||||||
Union Pacific Corp. | 2,181 | 268,328 | ||||||
|
| |||||||
Total Road & Rail | 1,040,313 | |||||||
|
| |||||||
Trading Companies & Distributors - 3.2% |
| |||||||
Fastenal Co. | 6,332 | 283,040 | ||||||
W.W. Grainger, Inc. | 1,360 | 273,918 | ||||||
|
| |||||||
Total Trading Companies & Distributors |
| 556,958 | ||||||
|
| |||||||
Total Common Stocks |
| 17,020,638 | ||||||
|
| |||||||
SHORT TERM INVESTMENTS - 0.1% |
| |||||||
SSgA Government Money Market Fund | 14,377 | 14,377 | ||||||
|
| |||||||
Total Short Term Investments | 14,377 | |||||||
|
| |||||||
| See Notes to Financial Statements. | GUGGENHEIM ETFS ANNUAL REPORT | 125 |
Table of Contents
| SCHEDULE OF INVESTMENTS (concluded) | October 31, 2012 |
GUGGENHEIM S&P 500® EQUAL WEIGHT INDUSTRIALS ETF
| FACE AMOUNT | VALUE | |||||||
SECURITIES LENDING COLLATERAL - 2.3%d |
| |||||||
Joint Repurchase Agreements: | ||||||||
Merrill Lynch, Fenner & Smith, Inc. | $ | 143,660 | $ | 143,660 | ||||
RBS Securities, Inc. | 244,258 | 244,258 | ||||||
|
| |||||||
Total Securities Lending Collateral | 387,918 | |||||||
|
| |||||||
Total Investments 102.0%c | 17,422,933 | |||||||
|
| |||||||
Other Assets and Liabilities, net - (2.0)% |
| (341,252 | ) | |||||
|
| |||||||
Net Assets - 100.0% | $ | 17,081,681 | ||||||
|
| |||||||
| * | Non-Income Producing Security. |
| a | All or a portion of this security was on loan as of October 31, 2012. |
| b | Values determined based on Level 2 inputs (Note F). |
| c | Unless otherwise indicated, the values of the Investments are determined based on Level 1 inputs. |
| d | Securities lending collateral (Note I). |
| 126 | GUGGENHEIM ETFS ANNUAL REPORT | See Notes to Financial Statements. |
Table of Contents
| SCHEDULE OF INVESTMENTS | October 31, 2012 |
GUGGENHEIM S&P 500® EQUAL WEIGHT MATERIALS ETF
| SHARES | VALUE | |||||||
COMMON STOCKS - 99.9% |
| |||||||
Chemicals - 52.6% |
| |||||||
Air Products & Chemicals, Inc. | 13,265 | $ | 1,028,435 | |||||
Airgas, Inc. | 13,826 | 1,230,099 | ||||||
CF Industries Holdings, Inc. | 5,070 | 1,040,313 | ||||||
Dow Chemical Co.(The) | 35,173 | 1,030,569 | ||||||
Du Pont (E.I.) de Nemours & Co. | 21,709 | 966,485 | ||||||
Eastman Chemical Co. | 19,344 | 1,145,939 | ||||||
Ecolab, Inc. | 17,688 | 1,231,085 | ||||||
FMC Corp. | 19,373 | 1,036,843 | ||||||
International Flavors & Fragrances, Inc. | 18,828 | 1,216,665 | ||||||
LyondellBasell Industries | 21,233 | 1,133,630 | ||||||
Monsanto Co. | 12,749 | 1,097,306 | ||||||
Mosaic Co.(The) | 18,658 | 976,560 | ||||||
PPG Industries, Inc. | 9,545 | 1,117,529 | ||||||
Praxair, Inc. | 10,509 | 1,116,161 | ||||||
Sherwin-Williams Co.(The) | 7,758 | 1,106,136 | ||||||
Sigma-Aldrich Corp. | 15,386 | 1,079,174 | ||||||
|
| |||||||
Total Chemicals | 17,552,929 | |||||||
|
| |||||||
Construction Materials - 3.2% |
| |||||||
Vulcan Materials Co. | 23,070 | 1,060,528 | ||||||
|
| |||||||
Total Construction Materials | 1,060,528 | |||||||
|
| |||||||
Containers & Packaging - 13.6% |
| |||||||
Ball Corp. | 26,207 | 1,122,446 | ||||||
Bemis Co., Inc. | 36,194 | 1,196,212 | ||||||
Owens-Illinois, Inc.* | 56,797 | 1,106,973 | ||||||
Sealed Air Corp. | 69,586 | 1,128,685 | ||||||
|
| |||||||
Total Containers & Packaging | 4,554,316 | |||||||
|
| |||||||
Metals & Mining - 23.8% |
| |||||||
Alcoa, Inc. | 115,267 | 987,838 | ||||||
Allegheny Technologies, Inc. | 30,863 | 813,240 | ||||||
Cliffs Natural Resources, Inc. | 24,902 | 903,196 | ||||||
Freeport-McMoRan Copper & Gold, Inc. | 26,598 | 1,034,130 | ||||||
Newmont Mining Corp. | 19,832 | 1,081,836 | ||||||
Nucor Corp. | 27,834 | 1,116,978 | ||||||
Titanium Metals Corp. | 82,011 | 960,349 | ||||||
United States Steel Corp.a | 50,752 | 1,034,833 | ||||||
|
| |||||||
Total Metals & Mining | 7,932,400 | |||||||
|
| |||||||
Paper & Forest Products - 6.7% |
| |||||||
International Paper Co. | 31,935 | 1,144,231 | ||||||
MeadWestvaco Corp. | 36,812 | 1,092,948 | ||||||
|
| |||||||
Total Paper & Forest Products | 2,237,179 | |||||||
|
| |||||||
Total Common Stocks |
| 33,337,352 | ||||||
|
| |||||||
| SHARES | VALUE | |||||||
SHORT TERM INVESTMENTS - 0.1% |
| |||||||
SSgA Government Money Market Fund | 29,171 | $ | 29,171 | |||||
|
| |||||||
Total Short Term Investments | 29,171 | |||||||
|
| |||||||
FACE | ||||||||
SECURITIES LENDING COLLATERAL - 1.6%d |
| |||||||
Joint Repurchase Agreements: | ||||||||
Merrill Lynch, Fenner & Smith, Inc. | $ | 203,835 | 203,835 | |||||
RBS Securities, Inc. | 346,571 | 346,571 | ||||||
|
| |||||||
Total Securities Lending Collateral |
| 550,406 | ||||||
|
| |||||||
Total Investments 101.6%c | 33,916,929 | |||||||
|
| |||||||
Other Assets and Liabilities, net - (1.6)% |
| (529,149 | ) | |||||
|
| |||||||
Net Assets - 100.0% | $ | 33,387,780 | ||||||
|
| |||||||
| * | Non-Income Producing Security. |
| a | All or a portion of this security was on loan as of October 31, 2012. |
| b | Values determined based on Level 2 inputs (Note F). |
| c | Unless otherwise indicated, the values of the Investments are determined based on Level 1 inputs. |
| d | Securities lending collateral (Note I). |
| See Notes to Financial Statements. | GUGGENHEIM ETFS ANNUAL REPORT | 127 |
Table of Contents
| SCHEDULE OF INVESTMENTS | October 31, 2012 |
GUGGENHEIM S&P 500® EQUAL WEIGHT TECHNOLOGY ETF
| SHARES | VALUE | |||||||
COMMON STOCKS - 99.9% | ||||||||
Communications Equipment - 9.7% | ||||||||
Cisco Systems, Inc. | 82,016 | $ | 1,405,754 | |||||
F5 Networks, Inc.* | 15,418 | 1,271,677 | ||||||
Harris Corp. | 31,640 | 1,448,479 | ||||||
JDS Uniphase Corp.* | 118,932 | 1,152,451 | ||||||
Juniper Networks, Inc.* | 82,696 | 1,370,273 | ||||||
Motorola Solutions, Inc. | 31,626 | 1,634,432 | ||||||
QUALCOMM, Inc. | 24,640 | 1,443,288 | ||||||
|
| |||||||
Total Communications Equipment |
| 9,726,354 | ||||||
|
| |||||||
Computers & Peripherals - 10.7% | ||||||||
Apple, Inc. | 2,310 | 1,374,681 | ||||||
Dell, Inc. | 147,593 | 1,362,283 | ||||||
EMC Corp.* | 57,375 | 1,401,098 | ||||||
Hewlett-Packard Co. | 87,971 | 1,218,398 | ||||||
NetApp, Inc.* | 44,636 | 1,200,708 | ||||||
SanDisk Corp.* | 34,982 | 1,460,848 | ||||||
Seagate Technology PLC | 52,445 | 1,432,798 | ||||||
Western Digital Corp. | 38,929 | 1,332,540 | ||||||
|
| |||||||
Total Computers & Peripherals |
| 10,783,354 | ||||||
|
| |||||||
Electronic Equipment, Instruments & Components - 8.5% |
| |||||||
Amphenol Corp. — Class A | 25,303 | 1,521,469 | ||||||
Corning, Inc. | 121,834 | 1,431,549 | ||||||
FLIR Systems, Inc. | 75,830 | 1,473,377 | ||||||
Jabil Circuit, Inc. | 70,420 | 1,221,083 | ||||||
Molex, Inc.a | 57,192 | 1,485,276 | ||||||
TE Connectivity Ltd. | 43,070 | 1,385,993 | ||||||
|
| |||||||
Total Electronic Equipment, Instruments & Components |
| 8,518,747 | ||||||
|
| |||||||
Internet Software & Services - 7.5% | ||||||||
Akamai Technologies, Inc.* | 40,953 | 1,555,804 | ||||||
eBay, Inc.* | 31,986 | 1,544,604 | ||||||
Google, Inc. — Class A* | 2,253 | 1,531,522 | ||||||
VeriSign, Inc.* | 33,456 | 1,240,214 | ||||||
Yahoo!, Inc.* | 101,358 | 1,703,828 | ||||||
|
| |||||||
Total Internet Software & Services |
| 7,575,972 | ||||||
|
| |||||||
IT Services - 21.0% | ||||||||
Accenture PLC — Class A | 24,257 | 1,635,164 | ||||||
Automatic Data Processing, Inc. | 27,350 | 1,580,556 | ||||||
Cognizant Technology Solutions Corp. — Class A* | 22,515 | 1,500,625 | ||||||
Computer Sciences Corp. | 46,092 | 1,403,501 | ||||||
Fidelity National Information Services, Inc. | 50,424 | 1,657,437 | ||||||
Fiserv, Inc.* | 22,267 | 1,668,689 | ||||||
International Business Machines Corp. | 7,729 | 1,503,522 | ||||||
Mastercard, Inc. — Class A | 3,517 | 1,621,091 | ||||||
Paychex, Inc. | 46,386 | 1,504,298 | ||||||
SAIC, Inc. | 123,144 | 1,353,353 | ||||||
Teradata Corp.* | 21,243 | 1,451,109 | ||||||
Total System Services, Inc. | 66,991 | 1,506,628 | ||||||
| SHARES | VALUE | |||||||
Visa, Inc. — Class A | 11,909 | $ | 1,652,493 | |||||
Western Union Co.(The) | 83,648 | 1,062,330 | ||||||
|
| |||||||
Total IT Services |
| 21,100,796 | ||||||
|
| |||||||
Office Electronics - 1.3% | ||||||||
Xerox Corp. | 203,363 | 1,309,658 | ||||||
|
| |||||||
Total Office Electronics |
| 1,309,658 | ||||||
|
| |||||||
Semiconductors & Semiconductor Equipment - 23.9% |
| |||||||
Advanced Micro Devices, Inc.*,a | 409,858 | 840,209 | ||||||
Altera Corp. | 41,888 | 1,276,746 | ||||||
Analog Devices, Inc. | 38,346 | 1,499,712 | ||||||
Applied Materials, Inc. | 132,657 | 1,406,164 | ||||||
Broadcom Corp. — Class A* | 44,116 | 1,391,198 | ||||||
First Solar, Inc.*,a | 64,953 | 1,579,007 | ||||||
Intel Corp. | 68,398 | 1,479,107 | ||||||
KLA-Tencor Corp. | 30,459 | 1,416,953 | ||||||
Lam Research Corp.* | 46,530 | 1,647,162 | ||||||
Linear Technology Corp. | 47,473 | 1,484,006 | ||||||
LSI Corp.* | 202,597 | 1,387,789 | ||||||
Microchip Technology, Inc.a | 46,530 | 1,458,716 | ||||||
Micron Technology, Inc.* | 238,577 | 1,294,280 | ||||||
NVIDIA Corp.* | 115,497 | 1,382,499 | ||||||
Teradyne, Inc.*,a | 97,290 | 1,422,380 | ||||||
Texas Instruments, Inc. | 54,075 | 1,518,967 | ||||||
Xilinx, Inc. | 45,371 | 1,486,354 | ||||||
|
| |||||||
Total Semiconductors & Semiconductor Equipment |
| 23,971,249 | ||||||
|
| |||||||
Software - 17.3% | ||||||||
Adobe Systems, Inc.* | 47,947 | 1,630,198 | ||||||
Autodesk, Inc.* | 47,762 | 1,520,742 | ||||||
BMC Software, Inc.* | 37,093 | 1,509,685 | ||||||
CA, Inc. | 58,527 | 1,318,028 | ||||||
Citrix Systems, Inc.* | 19,556 | 1,208,756 | ||||||
Electronic Arts, Inc.* | 110,237 | 1,361,427 | ||||||
Intuit, Inc. | 26,519 | 1,575,759 | ||||||
Microsoft Corp. | 51,213 | 1,461,363 | ||||||
Oracle Corp. | 48,513 | 1,506,329 | ||||||
Red Hat, Inc.* | 26,639 | 1,309,840 | ||||||
Salesforce.com, Inc.* | 10,022 | 1,463,011 | ||||||
Symantec Corp.* | 83,511 | 1,519,065 | ||||||
|
| |||||||
Total Software |
| 17,384,203 | ||||||
|
| |||||||
Total Common Stocks |
| 100,370,333 | ||||||
|
| |||||||
SHORT TERM INVESTMENTS - 0.1% |
| |||||||
SSgA Government Money Market Fund | 97,705 | 97,705 | ||||||
|
| |||||||
Total Short Term Investments |
| 97,705 | ||||||
|
| |||||||
| 128 | GUGGENHEIM ETFS ANNUAL REPORT | See Notes to Financial Statements. |
Table of Contents
| SCHEDULE OF INVESTMENTS (concluded) | October 31, 2012 |
GUGGENHEIM S&P 500® EQUAL WEIGHT TECHNOLOGY ETF
| FACE AMOUNT | Value | |||||||
SECURITIES LENDING COLLATERAL - 3.5%d |
| |||||||
Joint Repurchase Agreements: | ||||||||
Merrill Lynch, Fenner & Smith, Inc. | $ | 1,310,994 | $ | 1,310,994 | ||||
RBS Securities, Inc. | 2,229,017 | 2,229,017 | ||||||
|
| |||||||
Total Securities Lending Collateral | 3,540,011 | |||||||
|
| |||||||
Total Investments 103.5%c | 104,008,049 | |||||||
|
| |||||||
Other Assets and Liabilities, net - (3.5)% |
| (3,528,798 | ) | |||||
|
| |||||||
Net Assets - 100.0% | $ | 100,479,251 | ||||||
|
| |||||||
| * | Non-Income Producing Security. |
| a | All or a portion of this security was on loan as of October 31, 2012. |
| b | Values determined based on Level 2 inputs (Note F). |
| c | Unless otherwise indicated, the values of the Investments are determined based on Level 1 inputs. |
| d | Securities lending collateral (Note I). |
| See Notes to Financial Statements. | GUGGENHEIM ETFS ANNUAL REPORT | 129 |
Table of Contents
| SCHEDULE OF INVESTMENTS | October 31, 2012 |
GUGGENHEIM S&P 500® EQUAL WEIGHT UTILITIES ETF
| SHARES | VALUE | |||||||
COMMON STOCKS - 99.6% | ||||||||
Diversified Telecommunication Services - 12.0% |
| |||||||
AT&T, Inc. | 28,813 | $ | 996,642 | |||||
CenturyLink, Inc. | 25,336 | 972,396 | ||||||
Frontier Communications Corp.a | 230,868 | 1,089,697 | ||||||
Verizon Communications, Inc. | 24,107 | 1,076,136 | ||||||
Windstream Corp.a | 99,586 | 950,050 | ||||||
|
| |||||||
Total Diversified Telecommunication Services |
| 5,084,921 | ||||||
|
| |||||||
Electric Utilities - 33.9% | ||||||||
American Electric Power Co., Inc. | 24,589 | 1,092,735 | ||||||
Duke Energy Corp. | 16,726 | 1,098,731 | ||||||
Edison International | 23,768 | 1,115,670 | ||||||
Entergy Corp. | 15,706 | 1,139,942 | ||||||
Exelon Corp. | 29,871 | 1,068,784 | ||||||
FirstEnergy Corp. | 24,804 | 1,134,039 | ||||||
NextEra Energy, Inc. | 15,834 | 1,109,330 | ||||||
Northeast Utilities | 28,438 | 1,117,613 | ||||||
Pepco Holdings, Inc. | 56,532 | 1,123,291 | ||||||
Pinnacle West Capital Corp. | 20,048 | 1,061,943 | ||||||
PPL Corp. | 36,930 | 1,092,389 | ||||||
Southern Co.(The) | 23,833 | 1,116,338 | ||||||
Xcel Energy, Inc. | 38,147 | 1,077,653 | ||||||
|
| |||||||
Total Electric Utilities |
| 14,348,458 | ||||||
|
| |||||||
Gas Utilities - 5.0% | ||||||||
AGL Resources, Inc. | 26,050 | 1,063,622 | ||||||
Oneok, Inc. | 22,795 | 1,078,203 | ||||||
|
| |||||||
Total Gas Utilities |
| 2,141,825 | ||||||
|
| |||||||
Independent Power Producers & Energy Traders - 4.7% |
| |||||||
AES Corp.(The) | 92,785 | 969,603 | ||||||
NRG Energy, Inc. | 48,577 | 1,047,320 | ||||||
|
| |||||||
Total Independent Power Producers & Energy Traders |
| 2,016,923 | ||||||
|
| |||||||
Multi-Utilities - 36.2% | ||||||||
Ameren Corp. | 32,862 | 1,080,503 | ||||||
CenterPoint Energy, Inc. | 51,073 | 1,106,752 | ||||||
CMS Energy Corp. | 46,291 | 1,125,797 | ||||||
Consolidated Edison, Inc. | 17,949 | 1,083,761 | ||||||
Dominion Resources, Inc. | 20,321 | 1,072,542 | ||||||
DTE Energy Co. | 18,255 | 1,133,635 | ||||||
Integrys Energy Group, Inc. | 20,075 | 1,084,853 | ||||||
NiSource, Inc. | 41,916 | 1,067,600 | ||||||
PG&E Corp. | 24,821 | 1,055,389 | ||||||
Public Service Enterprise Group, Inc. | 33,693 | 1,079,524 | ||||||
SCANA Corp. | 22,174 | 1,088,300 | ||||||
Sempra Energy | 16,318 | 1,138,180 | ||||||
| SHARES | VALUE | |||||||
TECO Energy, Inc. | 61,486 | $ | 1,098,755 | |||||
Wisconsin Energy Corp. | 28,727 | 1,105,128 | ||||||
|
| |||||||
Total Multi-Utilities |
| 15,320,719 | ||||||
|
| |||||||
Wireless Telecommunication Services - 7.8% |
| |||||||
Crown Castle International Corp.* | 16,909 | 1,128,676 | ||||||
MetroPCS Communications, Inc.* | 100,993 | 1,031,138 | ||||||
Sprint Nextel Corp.* | 204,094 | 1,130,681 | ||||||
|
| |||||||
Total Wireless Telecommunication Services |
| 3,290,495 | ||||||
|
| |||||||
Total Common Stocks |
| 42,203,341 | ||||||
|
| |||||||
SHORT TERM INVESTMENTS - 0.3% |
| |||||||
SSgA Government Money Market Fund | 108,297 | 108,297 | ||||||
|
| |||||||
Total Short Term Investments |
| 108,297 | ||||||
|
| |||||||
FACE | ||||||||
SECURITIES LENDING COLLATERAL - 2.5%d |
| |||||||
Joint Repurchase Agreements: | ||||||||
Merrill Lynch, Fenner & Smith, Inc. | $ | 397,836 | 397,836 | |||||
RBS Securities, Inc. | 676,421 | 676,421 | ||||||
|
| |||||||
Total Securities Lending Collateral |
| 1,074,257 | ||||||
|
| |||||||
Total Investments 102.4%c | 43,385,895 | |||||||
|
| |||||||
Other Assets and Liabilities, net - (2.4)% |
| (1,022,316 | ) | |||||
|
| |||||||
Net Assets - 100.0% | $ | 42,363,579 | ||||||
|
| |||||||
| * | Non-Income Producing Security. |
| a | All or a portion of this security was on loan as of October 31, 2012. |
| b | Values determined based on Level 2 inputs (Note F). |
| c | Unless otherwise indicated, the values of the Investments are determined based on Level 1 inputs. |
| d | Securities lending collateral (Note I). |
| 130 | GUGGENHEIM ETFS ANNUAL REPORT | See Notes to Financial Statements. |
Table of Contents
| STATEMENTS OF ASSETS AND LIABILITIES | October 31, 2012 |
| Guggenheim S&P MidCap 400® Equal Weight ETF | Guggenheim S&P SmallCap 600® Equal Weight ETF | Guggenheim Russell MidCap® Equal Weight ETF | ||||||||||
| ASSETS: | ||||||||||||
Investments, at value*—including $15,445; $1,271 and $1,335,014 of securities loaned, respectively | $ | 3,151,935 | $ | 1,583,533 | $ | 53,982,702 | ||||||
Cash | 525 | — | — | |||||||||
Receivables: | ||||||||||||
Investments sold | — | 451 | — | |||||||||
Dividends and interest | 1,580 | 596 | 48,010 | |||||||||
Total assets | 3,154,040 | 1,584,580 | 54,030,712 | |||||||||
| LIABILITIES: | ||||||||||||
Payable upon return of securities loaned | 16,323 | 1,380 | 1,392,665 | |||||||||
Payable for: | ||||||||||||
Investments purchased | — | 2,547 | 3,608 | |||||||||
Accrued management fees | 1,068 | 544 | 17,888 | |||||||||
Total liabilities | 17,391 | 4,471 | 1,414,161 | |||||||||
| NETASSETS | $ | 3,136,649 | $ | 1,580,109 | $ | 52,616,551 | ||||||
| NETASSETSCONSISTOF: | ||||||||||||
Paid-in capital | $ | 3,151,339 | $ | 1,645,771 | $ | 51,606,142 | ||||||
Undistributed net investment income | 314 | — | 34,632 | |||||||||
Accumulated net realized loss on investments | (38,445 | ) | (20,081 | ) | (828,345 | ) | ||||||
Net unrealized appreciation (depreciation) on investments | 23,441 | (45,581 | ) | 1,804,122 | ||||||||
| NETASSETS | $ | 3,136,649 | $ | 1,580,109 | $ | 52,616,551 | ||||||
Shares outstanding (unlimited shares authorized), no par value | 100,000 | 50,000 | 1,550,000 | |||||||||
Net asset value, offering price and repurchase price per share | $31.37 | $31.60 | $33.95 | |||||||||
*Total cost of investments | $ | 3,128,494 | $ | 1,629,114 | $ | 52,178,580 | ||||||
| See Notes to Financial Statements. | GUGGENHEIM ETFS ANNUAL REPORT | 131 |
Table of Contents
| STATEMENTS OF ASSETS AND LIABILITIES (continued) | October 31, 2012 |
| Guggenheim Russell 1000® Equal Weight ETF | Guggenheim Russell 2000® Equal Weight ETF | Guggenhei MSCI EAFE Equal Weight ETF | Guggenheim MSCI Emerging Markets Equal Weight ETF | |||||||||||||
| ASSETS: | ||||||||||||||||
Investments, at value*—including $781,900; $296,662; $40,479 and $23,264 of securities loaned, respectively | $ | 39,804,238 | $ | 14,634,623 | $ | 11,052,885 | $ | 13,346,619 | ||||||||
Foreign currency, at value (cost $—; $—; $4,236 and $13,032, respectively) | — | — | 4,222 | 13,319 | ||||||||||||
Cash | — | 829 | — | — | ||||||||||||
Receivables: | ||||||||||||||||
Dividends and interest | 38,265 | 7,746 | 47,176 | 8,581 | ||||||||||||
Receivable from manager | — | — | — | 1,254 | ||||||||||||
Total assets | 39,842,503 | 14,643,198 | 11,104,283 | 13,369,773 | ||||||||||||
| LIABILITIES: | ||||||||||||||||
Payable upon return of securities loaned | 816,113 | 320,558 | 42,870 | 25,506 | ||||||||||||
Payable for: | ||||||||||||||||
Investments purchased | 2,228 | — | 115 | 3 | ||||||||||||
Accrued management fees | 12,927 | 4,932 | 5,167 | 7,978 | ||||||||||||
Capital gains tax | — | — | — | 11,211 | ||||||||||||
Total liabilities | 831,268 | 325,490 | 48,152 | 44,698 | ||||||||||||
| NETASSETS | $ | 39,011,235 | $ | 14,317,708 | $ | 11,056,131 | $ | 13,325,075 | ||||||||
| NETASSETSCONSISTOF: | ||||||||||||||||
Paid-in capital | $ | 38,745,656 | $ | 16,196,814 | $ | 12,918,843 | $ | 16,247,347 | ||||||||
Undistributed (distributions in excess of) net investment income | 32,780 | 18,281 | 19,781 | (1,018 | ) | |||||||||||
Accumulated net realized loss on investments and foreign currency | (592,596 | ) | (1,294,462 | ) | (696,422 | ) | (1,794,920 | ) | ||||||||
Net unrealized appreciation (depreciation) on investments and foreign currency | 825,395 | (602,925 | ) | (1,186,071 | ) | (1,126,334 | ) | |||||||||
| NETASSETS | $ | 39,011,235 | $ | 14,317,708 | $ | 11,056,131 | $ | 13,325,075 | ||||||||
Shares outstanding (unlimited shares authorized), no par value | 1,150,000 | 450,000 | 300,000 | 400,000 | ||||||||||||
Net asset value, offering price and repurchase price per share | $33.92 | $31.82 | $36.85 | $33.31 | ||||||||||||
*Total cost of investments | $ | 38,978,843 | $ | 15,237,548 | $ | 12,237,515 | $ | 14,462,191 | ||||||||
| 132 | GUGGENHEIM ETFS ANNUAL REPORT | See Notes to Financial Statements. |
Table of Contents
| STATEMENTS OF ASSETS AND LIABILITIES (continued) | October 31, 2012 |
| Guggenheim S&P 500® Equal Weight Consumer Discretionary ETF | Guggenheim S&P 500® Equal Weight Consumer Staples ETF | Guggenheim S&P 500® Equal Weight Energy ETF | ||||||||||
| ASSETS: | ||||||||||||
Investments, at value*—including $1,756,343; $869,610 and $— of securities loaned, respectively | $ | 43,104,368 | $ | 41,794,622 | $ | 31,982,255 | ||||||
Receivables: | ||||||||||||
Dividends and interest | 24,650 | 56,911 | 35,200 | |||||||||
Total assets | 43,129,018 | 41,851,533 | 32,017,455 | |||||||||
| LIABILITIES: | ||||||||||||
Payable upon return of securities loaned | 1,796,182 | 889,413 | — | |||||||||
Payable for: | ||||||||||||
Accrued management fees | 18,585 | 17,809 | 13,780 | |||||||||
Total liabilities | 1,814,767 | 907,222 | 13,780 | |||||||||
| NETASSETS | $ | 41,314,251 | $ | 40,944,311 | $ | 32,003,675 | ||||||
| NETASSETSCONSISTOF: | ||||||||||||
Paid-in capital | $ | 44,141,085 | $ | 43,118,183 | $ | 39,871,002 | ||||||
Undistributed net investment income | 13,782 | 67,418 | 21,763 | |||||||||
Accumulated net realized loss on investments | (3,232,620 | ) | (785,391 | ) | (3,930,615 | ) | ||||||
Net unrealized appreciation (depreciation) on investments | 392,004 | (1,455,899 | ) | (3,958,475 | ) | |||||||
| NETASSETS | $ | 41,314,251 | $ | 40,944,311 | $ | 32,003,675 | ||||||
Shares outstanding (unlimited shares authorized), no par value | 750,000 | 600,000 | 500,005 | |||||||||
Net asset value, offering price and repurchase price per share | $55.09 | $68.24 | $64.01 | |||||||||
*Total cost of investments | $ | 42,712,364 | $ | 43,250,521 | $ | 35,940,730 | ||||||
| See Notes to Financial Statements. | GUGGENHEIM ETFS ANNUAL REPORT | 133 |
Table of Contents
| STATEMENTS OF ASSETS AND LIABILITIES (continued) | October 31, 2012 |
| Guggenheim S&P 500® Equal Weight Financials ETF | Guggenheim S&P 500® Equal Weight Health Care ETF | Guggenheim S&P 500® Equal Weight Industrials ETF | Guggenheim S&P 500® Equal Weight Materials ETF | |||||||||||||
| ASSETS: | ||||||||||||||||
Investments, at value*—including $83,714; $—; $376,486 and $535,095 of securities loaned, respectively | $ | 14,419,452 | $ | 38,410,927 | $ | 17,422,933 | $ | 33,916,929 | ||||||||
Receivables: | ||||||||||||||||
Dividends and interest | 10,673 | 36,933 | 54,270 | 35,625 | ||||||||||||
Total assets | 14,430,125 | 38,447,860 | 17,477,203 | 33,952,554 | ||||||||||||
| LIABILITIES: | ||||||||||||||||
Payable upon return of securities loaned | 85,520 | — | 387,918 | 550,406 | ||||||||||||
Payable for: | ||||||||||||||||
Accrued management fees | 6,084 | 29,159 | 7,604 | 14,368 | ||||||||||||
Total liabilities | 91,604 | 29,159 | 395,522 | 564,774 | ||||||||||||
| NETASSETS | $ | 14,338,521 | $ | 38,418,701 | $ | 17,081,681 | $ | 33,387,780 | ||||||||
| NETASSETSCONSISTOF: | ||||||||||||||||
Paid-in capital | $ | 20,543,214 | $ | 45,026,661 | $ | 18,908,892 | $ | 30,199,497 | ||||||||
Undistributed net investment income | — | 67,544 | 49,373 | 9,241 | ||||||||||||
Accumulated net realized loss on investments | (6,772,532 | ) | (5,016,058 | ) | (1,213,334 | ) | (1,158,594 | ) | ||||||||
Net unrealized appreciation (depreciation) on investments | 567,839 | (1,659,446 | ) | (663,250 | ) | 4,337,636 | ||||||||||
| NETASSETS | $ | 14,338,521 | $ | 38,418,701 | $ | 17,081,681 | $ | 33,387,780 | ||||||||
Shares outstanding (unlimited shares authorized), no par value | 500,000 | 500,000 | 300,000 | 550,000 | ||||||||||||
Net asset value, offering price and repurchase price per share | $28.68 | $76.84 | $56.94 | $60.71 | ||||||||||||
*Total cost of investments | $ | 13,851,613 | $ | 40,070,373 | $ | 18,086,183 | $ | 29,579,293 | ||||||||
| 134 | GUGGENHEIM ETFS ANNUAL REPORT | See Notes to Financial Statements. |
Table of Contents
| STATEMENTS OF ASSETS AND LIABILITIES (concluded) | October 31, 2012 |
| Guggenheim S&P 500® Equal Weight Technology ETF | Guggenheim S&P 500® Equal Weight Utilities ETF | |||||||
| ASSETS: | ||||||||
Investments, at value*—including $3,249,683 and $1,027,098 of securities loaned, respectively | $ | 104,008,049 | $ | 43,385,895 | ||||
Receivables: | ||||||||
Dividends and interest | 56,768 | 70,551 | ||||||
Total assets | 104,064,817 | 43,456,446 | ||||||
| LIABILITIES: | ||||||||
Payable upon return of securities loaned | 3,540,011 | 1,074,257 | ||||||
Payable for: | ||||||||
Accrued management fees | 45,555 | 18,610 | ||||||
Total liabilities | 3,585,566 | 1,092,867 | ||||||
| NETASSETS | $ | 100,479,251 | $ | 42,363,579 | ||||
| NETASSETSCONSISTOF: | ||||||||
Paid-in capital | $ | 124,874,976 | $ | 39,497,857 | ||||
Undistributed net investment income | 52,623 | 53,335 | ||||||
Accumulated net realized loss on investments | (9,386,519 | ) | (463,272 | ) | ||||
Net unrealized appreciation (depreciation) on investments | (15,061,829 | ) | 3,275,659 | |||||
| NETASSETS | $ | 100,479,251 | $ | 42,363,579 | ||||
Shares outstanding (unlimited shares authorized), no par value | 1,950,000 | 700,000 | ||||||
Net asset value, offering price and repurchase price per share | $51.53 | $60.52 | ||||||
*Total cost of investments | $ | 119,069,878 | $ | 40,110,236 | ||||
| See Notes to Financial Statements. | GUGGENHEIM ETFS ANNUAL REPORT | 135 |
Table of Contents
| STATEMENTS OF OPERATIONS |
For the Year Ended October 31, 2012
| Guggenheim S&P MidCap 400® Equal Weight ETF | Guggenheim S&P SmallCap 600® Equal Weight ETF | Guggenheim Russell MidCap® Equal Weight ETF | ||||||||||
| INVESTMENT INCOME: | ||||||||||||
Dividends, net of foreign taxes withheld* | $ | 45,557 | $ | 65,950 | $ | 936,609 | ||||||
Income from securities lending | 90 | 5 | 3,741 | |||||||||
Total investment income | 45,647 | 65,955 | 940,350 | |||||||||
| EXPENSES: | ||||||||||||
Management fee | 11,902 | 19,672 | 209,321 | |||||||||
Trustee fees | 177 | 354 | 3,201 | |||||||||
Total expenses | 12,079 | 20,026 | 212,522 | |||||||||
Net investment income | 33,568 | 45,929 | 727,828 | |||||||||
| NET REALIZEDAND UNREALIZED GAIN (LOSS): | ||||||||||||
Net realized gain (loss) on: | ||||||||||||
Investments | (7,548 | ) | 120,469 | (652,757 | ) | |||||||
In-kind redemptions | 131,377 | 693,832 | 2,323,288 | |||||||||
Net realized gain | 123,829 | 814,301 | 1,670,531 | |||||||||
Net change in unrealized appreciation (depreciation) on: | ||||||||||||
Investments | 166,102 | (72,825 | ) | 2,095,289 | ||||||||
Net realized and unrealized gain | 289,931 | 741,476 | 3,765,820 | |||||||||
Net increase in net assets resulting from operations | $ | 323,499 | $ | 787,405 | $ | 4,493,648 | ||||||
* Foreign taxes withheld | $ | — | $ | — | $ | 163 | ||||||
| 136 | GUGGENHEIM ETFS ANNUAL REPORT | See Notes to Financial Statements. |
Table of Contents
| STATEMENTS OF OPERATIONS (continued) |
For the Year Ended October 31, 2012
| Guggenheim Russell 1000® Equal Weight ETF | Guggenheim Russell 2000® Equal Weight ETF | Guggenheim MSCI EAFE Equal Weight ETF | Guggenheim MSCI Emerging Markets Equal Weight ETF | |||||||||||||
| INVESTMENT INCOME: | ||||||||||||||||
Dividends, net of foreign taxes withheld* | $ | 722,699 | $ | 276,066 | $ | 344,507 | $ | 301,700 | ||||||||
Income from securities lending | 1,934 | 1,959 | 122 | 96 | ||||||||||||
Total investment income | 724,633 | 278,025 | 344,629 | 301,796 | ||||||||||||
| EXPENSES: | ||||||||||||||||
Management fee | 147,413 | 73,829 | 59,179 | 93,028 | ||||||||||||
Trustee fees | 2,042 | 1,160 | 755 | — | ||||||||||||
Other fees | — | — | — | 2,264 | ||||||||||||
Total expenses | 149,455 | 74,989 | 59,934 | 95,292 | ||||||||||||
Less: | ||||||||||||||||
Expenses waived by advisor | — | — | — | (14,619 | ) | |||||||||||
Net investment income | 575,178 | 203,036 | 284,695 | 221,123 | ||||||||||||
| NET REALIZEDAND UNREALIZED GAIN (LOSS): | ||||||||||||||||
Net realized gain (loss) on: | ||||||||||||||||
Investments | (595,523 | ) | (1,046,732 | ) | (683,786 | ) | (1,234,896 | ) | ||||||||
In-kind redemptions | 1,026,078 | 1,418,816 | — | (559,885 | ) | |||||||||||
Capital gains tax | — | — | — | (6,862 | ) | |||||||||||
Foreign currency transactions | — | (19 | ) | (4,806 | ) | (24,140 | ) | |||||||||
Net realized gain (loss) | 430,555 | 372,065 | (688,592 | ) | (1,825,783 | ) | ||||||||||
Net change in unrealized appreciation (depreciation) on: | ||||||||||||||||
Investments | 2,435,374 | 942,940 | 635,910 | 1,130,965 | ||||||||||||
Capital gains tax | — | — | — | (8,492 | ) | |||||||||||
Foreign currency transactions | — | 15 | (905 | ) | 385 | |||||||||||
Net change in unrealized appreciation | 2,435,374 | 942,955 | 635,005 | 1,122,858 | ||||||||||||
Net realized and unrealized gain (loss) | 2,865,929 | 1,315,020 | (53,587 | ) | (702,925 | ) | ||||||||||
Net increase (decrease) in net assets resulting from operations | $ | 3,441,107 | $ | 1,518,056 | $ | 231,108 | $ | (481,802 | ) | |||||||
* Foreign taxes withheld | $ | 1,623 | $ | 510 | $ | 28,788 | $ | 35,481 | ||||||||
| See Notes to Financial Statements. | GUGGENHEIM ETFS ANNUAL REPORT | 137 |
Table of Contents
| STATEMENTS OF OPERATIONS (continued) |
For the Year Ended October 31, 2012
| Guggenheim S&P 500® Equal Weight Consumer Discretionary ETF | Guggenheim S&P 500® Equal Weight Consumer Staples ETF | Guggenheim S&P 500® Equal Weight Energy ETF | ||||||||||
| INVESTMENT INCOME: | ||||||||||||
Dividends | $ | 762,734 | $ | 1,001,862 | $ | 434,113 | ||||||
Income from securities lending | 1,028 | 526 | 61 | |||||||||
Total investment income | 763,762 | 1,002,388 | 434,174 | |||||||||
| EXPENSES: | ||||||||||||
Management fee | 222,562 | 189,550 | 157,800 | |||||||||
Total expenses | 222,562 | 189,550 | 157,800 | |||||||||
Net investment income | 541,200 | 812,838 | 276,374 | |||||||||
| NET REALIZEDAND UNREALIZED GAIN (LOSS): | ||||||||||||
Net realized gain (loss) on: | ||||||||||||
Investments | (533,868 | ) | (454,111 | ) | (1,783,897 | ) | ||||||
In-kind redemptions | 7,134,348 | 8,289,152 | (1,065,936 | ) | ||||||||
Net realized gain (loss) | 6,600,480 | 7,835,041 | (2,849,833 | ) | ||||||||
Net change in unrealized appreciation (depreciation) on: | ||||||||||||
Investments | (739,225 | ) | (3,884,698 | ) | 1,840,307 | |||||||
Net realized and unrealized gain (loss) | 5,861,255 | 3,950,343 | (1,009,526 | ) | ||||||||
Net increase (decrease) in net assets resulting from operations | $ | 6,402,455 | $ | 4,763,181 | $ | (733,152 | ) | |||||
| 138 | GUGGENHEIM ETFS ANNUAL REPORT | See Notes to Financial Statements. |
Table of Contents
| STATEMENTS OF OPERATIONS (concluded) |
For the Year Ended October 31, 2012
| Guggenheim S&P 500® Equal Weight Financials ETF | Guggenheim S&P 500® Equal Weight Health Care ETF | Guggenheim S&P 500® Equal Weight Industrials ETF | Guggenheim S&P 500® Equal Weight Materials ETF | Guggenheim S&P 500® Equal Weight Technology ETF | Guggenheim S&P 500® Equal Weight Utilities ETF | |||||||||||||||||||
| INVESTMENT INCOME: | ||||||||||||||||||||||||
Dividends, net of foreign taxes withheld* | $ | 297,499 | $ | 941,241 | $ | 590,538 | $ | 706,984 | $ | 1,530,713 | $ | 1,794,513 | ||||||||||||
Income from securities lending | 140 | — | 666 | 601 | 6,385 | 6,845 | ||||||||||||||||||
Total investment income | 297,639 | 941,241 | 591,204 | 707,585 | 1,537,098 | 1,801,358 | ||||||||||||||||||
| EXPENSES: | ||||||||||||||||||||||||
Management fee | 75,196 | 410,661 | 123,324 | 172,917 | 609,160 | 219,503 | ||||||||||||||||||
Total expenses | 75,196 | 410,661 | 123,324 | 172,917 | 609,160 | 219,503 | ||||||||||||||||||
Net investment income | 222,443 | 530,580 | 467,880 | 534,668 | 927,938 | 1,581,855 | ||||||||||||||||||
| NET REALIZEDAND UNREALIZED GAIN (LOSS): | ||||||||||||||||||||||||
Net realized gain (loss) on: | ||||||||||||||||||||||||
Investments | (558,279 | ) | (665,714 | ) | (160,651 | ) | (391,640 | ) | (7,911,038 | ) | 388,824 | |||||||||||||
In-kind redemptions | 590,648 | 8,413,624 | 2,395,274 | 1,549,751 | 18,416,559 | 2,879,519 | ||||||||||||||||||
Net realized gain | 32,369 | 7,747,910 | 2,234,623 | 1,158,111 | 10,505,521 | 3,268,343 | ||||||||||||||||||
Net change in unrealized appreciation (depreciation) on: | ||||||||||||||||||||||||
Investments | 2,304,637 | 656,908 | (516,072 | ) | 1,217,258 | (14,282,736 | ) | 1,919,100 | ||||||||||||||||
Net realized and unrealized gain | 2,337,006 | 8,404,818 | 1,718,551 | 2,375,369 | (3,777,215 | ) | 5,187,443 | |||||||||||||||||
Net increase in net assets resulting from operations | $ | 2,559,449 | $ | 8,935,398 | $ | 2,186,431 | $ | 2,910,037 | $ | (2,849,277 | ) | $ | 6,769,298 | |||||||||||
* Foreign taxes withheld | $ | — | $ | — | $ | 6 | $ | — | $ | — | $ | — | ||||||||||||
| See Notes to Financial Statements. | GUGGENHEIM ETFS ANNUAL REPORT | 139 |
Table of Contents
| STATEMENTS OF CHANGES IN NET ASSETS |
| Guggenheim S&P MidCap 400® Equal Weight ETF | ||||||||
| Year Ended October 31, 2012 | Period from August 1, 2011* to October 31, 2011 | |||||||
| INCREASE (DECREASE)IN NET ASSETSFROM OPERATIONS: | ||||||||
Net investment income | $ | 33,568 | $ | 7,921 | ||||
Net realized gain (loss) on investments | 123,829 | (9,545 | ) | |||||
Net change in unrealized appreciation (depreciation) on investments | 166,102 | (142,661 | ) | |||||
Net increase (decrease) in net assets resulting from operations | 323,499 | (144,285 | ) | |||||
| DISTRIBUTIONSTO SHAREHOLDERSFROM: | ||||||||
Net investment income | (32,938 | ) | (5,601 | ) | ||||
| SHAREHOLDER TRANSACTIONS: | ||||||||
Proceeds from shares purchased | 3,120,555 | 2,976,024 | ||||||
Value of shares redeemed | (3,100,605 | ) | — | |||||
Net increase in net assets resulting from share transactions | 19,950 | 2,976,024 | ||||||
Net increase in net assets | 310,511 | 2,826,138 | ||||||
| NETASSETS | ||||||||
Beginning of period | 2,826,138 | — | ||||||
End of period | $ | 3,136,649 | $ | 2,826,138 | ||||
Undistributed net investment income at end of period | $ | 314 | $ | 1,484 | ||||
| CHANGESINSHARESOUTSTANDING: | ||||||||
Shares sold | 100,000 | 100,000 | ||||||
Shares redeemed | (100,000 | ) | — | |||||
Net increase in shares | — | 100,000 | ||||||
| * | Commencement of operations |
| 140 | GUGGENHEIM ETFS ANNUAL REPORT | See Notes to Financial Statements. |
Table of Contents
| STATEMENTS OF CHANGES IN NET ASSETS (continued) |
| Guggenheim S&P SmallCap 600® Equal Weight ETF | Guggenheim Russell MidCap® Equal Weight ETF | |||||||||||||||
| Year Ended October 31, 2012 | Period from August 1, 2011* to October 31, 2011 | Year Ended October 31, 2012 | Period from December 3, 2010* to October 31, 2011 | |||||||||||||
| INCREASE (DECREASE)IN NET ASSETSFROM OPERATIONS: | ||||||||||||||||
Net investment income | $ | 45,929 | $ | 9,727 | $ | 727,828 | $ | 212,148 | ||||||||
Net realized gain (loss) on investments | 814,301 | (13,809 | ) | 1,670,531 | (112,004 | ) | ||||||||||
Net change in unrealized appreciation (depreciation) on investments | (72,825 | ) | 27,244 | 2,095,289 | (291,167 | ) | ||||||||||
Net increase (decrease) in net assets resulting from operations | 787,405 | 23,162 | 4,493,648 | (191,023 | ) | |||||||||||
| DISTRIBUTIONSTO SHAREHOLDERSFROM: | ||||||||||||||||
Net investment income | (48,916 | ) | (6,163 | ) | (712,539 | ) | (168,415 | ) | ||||||||
| SHAREHOLDER TRANSACTIONS: | ||||||||||||||||
Proceeds from shares purchased | — | 5,629,931 | 14,565,056 | 56,370,615 | ||||||||||||
Value of shares redeemed | (4,805,310 | ) | — | (20,237,192 | ) | (1,503,599 | ) | |||||||||
Net increase (decrease) in net assets resulting from share transactions | (4,805,310 | ) | 5,629,931 | (5,672,136 | ) | 54,867,016 | ||||||||||
Net increase (decrease) in net assets | (4,066,821 | ) | 5,646,930 | (1,891,027 | ) | 54,507,578 | ||||||||||
| NETASSETS | ||||||||||||||||
Beginning of period | 5,646,930 | — | 54,507,578 | — | ||||||||||||
End of period | $ | 1,580,109 | $ | 5,646,930 | $ | 52,616,551 | $ | 54,507,578 | ||||||||
Undistributed net investment income at end of period | $ | — | $ | 2,570 | $ | 34,632 | $ | 36,985 | ||||||||
| CHANGESINSHARESOUTSTANDING: | ||||||||||||||||
Shares sold | — | 200,000 | 450,000 | 1,800,000 | ||||||||||||
Shares redeemed | (150,000 | ) | — | (650,000 | ) | (50,000 | ) | |||||||||
Net increase (decrease) in shares | (150,000 | ) | 200,000 | (200,000 | ) | 1,750,000 | ||||||||||
| * | Commencement of operations |
| See Notes to Financial Statements. | GUGGENHEIM ETFS ANNUAL REPORT | 141 |
Table of Contents
| STATEMENTS OF CHANGES IN NET ASSETS (continued) |
| Guggenheim Russell 1000® Equal Weight ETF | Guggenheim Russell 2000® Equal Weight ETF | |||||||||||||||
| Year Ended October 31, 2012 | Period from December 3, 2010* to October 31, 2011 | Year Ended October 31, 2012 | Period from December 3, 2010* to October 31, 2011 | |||||||||||||
| INCREASE (DECREASE)IN NET ASSETSFROM OPERATIONS: | ||||||||||||||||
Net investment income | $ | 575,178 | $ | 191,289 | $ | 203,036 | $ | 97,504 | ||||||||
Net realized gain (loss) on investments | 430,555 | 70,622 | 372,065 | (275,792 | ) | |||||||||||
Net change in unrealized appreciation (depreciation) on investments | 2,435,374 | (1,609,979 | ) | 942,955 | (1,545,880 | ) | ||||||||||
Net increase (decrease) in net assets resulting from operations | 3,441,107 | (1,348,068 | ) | 1,518,056 | (1,724,168 | ) | ||||||||||
| DISTRIBUTIONSTO SHAREHOLDERSFROM: | ||||||||||||||||
Net investment income | (553,925 | ) | (165,561 | ) | (198,196 | ) | (82,186 | ) | ||||||||
| SHAREHOLDER TRANSACTIONS: | ||||||||||||||||
Proceeds from shares purchased | 11,210,761 | 37,147,734 | — | 25,390,228 | ||||||||||||
Value of shares redeemed | (9,269,418 | ) | (1,451,395 | ) | (10,586,026 | ) | — | |||||||||
Net increase (decrease) in net assets resulting from share transactions | 1,941,343 | 35,696,339 | (10,586,026 | ) | 25,390,228 | |||||||||||
Net increase (decrease) in net assets | 4,828,525 | 34,182,710 | (9,266,166 | ) | 23,583,874 | |||||||||||
| NETASSETS | ||||||||||||||||
Beginning of period | 34,182,710 | — | 23,583,874 | — | ||||||||||||
End of period | $ | 39,011,235 | $ | 34,182,710 | $ | 14,317,708 | $ | 23,583,874 | ||||||||
Undistributed net investment income at end of period | $ | 32,780 | $ | 21,192 | $ | 18,281 | $ | 11,261 | ||||||||
| CHANGESINSHARESOUTSTANDING: | ||||||||||||||||
Shares sold | 350,000 | 1,150,000 | — | 800,000 | ||||||||||||
Shares redeemed | (300,000 | ) | (50,000 | ) | (350,000 | ) | — | |||||||||
Net increase (decrease) in shares | 50,000 | 1,100,000 | (350,000 | ) | 800,000 | |||||||||||
| * | Commencement of operations |
| 142 | GUGGENHEIM ETFS ANNUAL REPORT | See Notes to Financial Statements. |
Table of Contents
| STATEMENTS OF CHANGES IN NET ASSETS (continued) |
| Guggenheim MSCI EAFE Equal Weight ETF | Guggenheim MSCI Emerging Markets Equal Weight ETF | |||||||||||||||
| Year Ended October 31, 2012 | Period from December 3, 2010* to October 31, 2011 | Year Ended October 31, 2012 | Period from December 3, 2010* to October 31, 2011 | |||||||||||||
| INCREASE (DECREASE)IN NET ASSETSFROM OPERATIONS: | ||||||||||||||||
Net investment income | $ | 284,695 | $ | 483,530 | $ | 221,123 | $ | 288,754 | ||||||||
Net realized gain (loss) on investments | (688,592 | ) | 338,989 | (1,825,783 | ) | (831,874 | ) | |||||||||
Net change in unrealized appreciation (depreciation) on investments | 635,005 | (1,821,076 | ) | 1,122,858 | (2,249,192 | ) | ||||||||||
Net increase (decrease) in net assets resulting from operations | 231,108 | (998,557 | ) | (481,802 | ) | (2,792,312 | ) | |||||||||
| DISTRIBUTIONSTO SHAREHOLDERSFROM: | ||||||||||||||||
Net investment income | (267,803 | ) | (491,348 | ) | (192,786 | ) | (160,394 | ) | ||||||||
Return of capital | — | — | (23,454 | ) | (155,130 | ) | ||||||||||
Total distributions to shareholders | (267,803 | ) | (491,348 | ) | (216,240 | ) | (315,524 | ) | ||||||||
| SHAREHOLDER TRANSACTIONS: | ||||||||||||||||
Proceeds from shares purchased | — | 24,728,819 | 3,217,848 | 27,283,677 | ||||||||||||
Value of shares redeemed | — | (12,146,088 | ) | (6,108,837 | ) | (7,261,735 | ) | |||||||||
Net increase (decrease) in net assets resulting from share transactions | — | 12,582,731 | (2,890,989 | ) | 20,021,942 | |||||||||||
Net increase (decrease) in net assets | (36,695 | ) | 11,092,826 | (3,589,031 | ) | 16,914,106 | ||||||||||
| NETASSETS | ||||||||||||||||
Beginning of period | 11,092,826 | — | 16,914,106 | — | ||||||||||||
End of period | $ | 11,056,131 | $ | 11,092,826 | $ | 13,325,075 | $ | 16,914,106 | ||||||||
Undistributed (distributions in excess of) net investment income at end of period | $ | 19,781 | $ | 19,048 | $ | (1,018 | ) | $ | (372 | ) | ||||||
| CHANGESINSHARESOUTSTANDING: | ||||||||||||||||
Shares sold | — | 600,000 | 100,000 | 700,000 | ||||||||||||
Shares redeemed | — | (300,000 | ) | (200,000 | ) | (200,000 | ) | |||||||||
Net increase (decrease) in shares | — | 300,000 | (100,000 | ) | 500,000 | |||||||||||
| * | Commencement of operations |
| See Notes to Financial Statements. | GUGGENHEIM ETFS ANNUAL REPORT | 143 |
Table of Contents
| STATEMENTS OF CHANGES IN NET ASSETS (continued) |
| Guggenheim S&P 500® Equal Weight Consumer Discretionary ETF | ||||||||
| Year Ended October 31, 2012 | Year Ended October 31, 2011 | |||||||
| INCREASE (DECREASE)IN NET ASSETSFROM OPERATIONS: | ||||||||
Net investment income | $ | 541,200 | $ | 299,451 | ||||
Net realized gain on investments | 6,600,480 | 2,977,327 | ||||||
Net change in unrealized depreciation on investments | (739,225 | ) | (739,044 | ) | ||||
Net increase in net assets resulting from operations | 6,402,455 | 2,537,734 | ||||||
| DISTRIBUTIONSTO SHAREHOLDERSFROM: | ||||||||
Net investment income | (540,416 | ) | (291,636 | ) | ||||
| SHAREHOLDER TRANSACTIONS: | ||||||||
Proceeds from shares purchased | 56,045,159 | 7,384,661 | ||||||
Value of shares redeemed | (42,059,685 | ) | (13,588,895 | ) | ||||
Net increase (decrease) in net assets resulting from share transactions | 13,985,474 | (6,204,234 | ) | |||||
Net increase (decrease) in net assets | 19,847,513 | (3,958,136 | ) | |||||
| NETASSETS | ||||||||
Beginning of year | 21,466,738 | 25,424,874 | ||||||
End of year | $ | 41,314,251 | $ | 21,466,738 | ||||
Undistributed net investment income at end of year | $ | 13,782 | $ | 12,998 | ||||
| CHANGESINSHARESOUTSTANDING: | ||||||||
Shares sold | 1,100,000 | 150,000 | ||||||
Shares redeemed | (800,000 | ) | (300,000 | ) | ||||
Net increase (decrease) in shares | 300,000 | (150,000 | ) | |||||
| 144 | GUGGENHEIM ETFS ANNUAL REPORT | See Notes to Financial Statements. |
Table of Contents
| STATEMENTS OF CHANGES IN NET ASSETS (continued) |
| Guggenheim S&P 500® Equal Weight Consumer Staples ETF | Guggenheim S&P 500® Equal Weight Energy ETF | |||||||||||||||
| Year Ended October 31, 2012 | Year Ended October 31, 2011 | Year Ended October 31, 2012 | Year Ended October 31, 2011 | |||||||||||||
| INCREASE (DECREASE)IN NET ASSETSFROM OPERATIONS: | ||||||||||||||||
Net investment income | $ | 812,838 | $ | 432,184 | $ | 276,374 | $ | 267,674 | ||||||||
Net realized gain (loss) on investments | 7,835,041 | 792,268 | (2,849,833 | ) | 4,427,435 | |||||||||||
Net change in unrealized appreciation (depreciation) on investments | (3,884,698 | ) | 834,186 | 1,840,307 | (7,248,237 | ) | ||||||||||
Net increase (decrease) in net assets resulting from operations | 4,763,181 | 2,058,638 | (733,152 | ) | (2,553,128 | ) | ||||||||||
| DISTRIBUTIONSTO SHAREHOLDERSFROM: | ||||||||||||||||
Net investment income | (802,431 | ) | (404,016 | ) | (257,933 | ) | (267,926 | ) | ||||||||
| SHAREHOLDER TRANSACTIONS: | ||||||||||||||||
Proceeds from shares purchased | 78,347,608 | 18,142,268 | 6,210,249 | 99,253,072 | ||||||||||||
Value of shares redeemed | (71,871,221 | ) | (3,145,222 | ) | (8,502,963 | ) | (77,266,420 | ) | ||||||||
Net increase (decrease) in net assets resulting from share transactions | 6,476,387 | 14,997,046 | (2,292,714 | ) | 21,986,652 | |||||||||||
Net increase (decrease) in net assets | 10,437,137 | 16,651,668 | (3,283,799 | ) | 19,165,598 | |||||||||||
| NETASSETS | ||||||||||||||||
Beginning of year | 30,507,174 | 13,855,506 | 35,287,474 | 16,121,876 | ||||||||||||
End of year | $ | 40,944,311 | $ | 30,507,174 | $ | 32,003,675 | $ | 35,287,474 | ||||||||
Undistributed net investment income at end of year | $ | 67,418 | $ | 57,011 | $ | 21,763 | $ | 3,322 | ||||||||
| CHANGESINSHARESOUTSTANDING: | ||||||||||||||||
Shares sold | 1,150,000 | 300,000 | 100,000 | 1,400,000 | ||||||||||||
Shares redeemed | (1,050,000 | ) | (50,000 | ) | (150,000 | ) | (1,150,000 | ) | ||||||||
Net increase (decrease) in shares | 100,000 | 250,000 | (50,000 | ) | 250,000 | |||||||||||
| See Notes to Financial Statements. | GUGGENHEIM ETFS ANNUAL REPORT | 145 |
Table of Contents
| STATEMENTS OF CHANGES IN NET ASSETS (continued) |
| Guggenheim S&P 500® Equal Weight Financial ETF | Guggenheim S&P 500® Equal Weight Health Care ETF | |||||||||||||||
| Year Ended October 31, 2012 | Year Ended October 31, 2011 | Year Ended October 31, 2012 | Year Ended October 31, 2011 | |||||||||||||
| INCREASE (DECREASE)IN NET ASSETSFROM OPERATIONS: | ||||||||||||||||
Net investment income | $ | 222,443 | $ | 293,728 | $ | 530,580 | $ | 251,237 | ||||||||
Net realized gain on investments | 32,369 | 1,299,016 | 7,747,910 | 3,987,029 | ||||||||||||
Net change in unrealized appreciation (depreciation) on investments | 2,304,637 | (2,262,770 | ) | 656,908 | (524,200 | ) | ||||||||||
Net increase (decrease) in net assets resulting from operations | 2,559,449 | (670,026 | ) | 8,935,398 | 3,714,066 | |||||||||||
| DISTRIBUTIONSTOSHAREHOLDERSFROM: | ||||||||||||||||
Net investment income | (224,168 | ) | (292,247 | ) | (499,910 | ) | (230,946 | ) | ||||||||
Return of capital | (51,231 | ) | — | — | — | |||||||||||
Total distributions to shareholders | (275,399 | ) | (292,247 | ) | (499,910 | ) | (230,946 | ) | ||||||||
| SHAREHOLDER TRANSACTIONS: | ||||||||||||||||
Proceeds from shares purchased | — | 8,493,107 | 475,933,235 | 182,857,489 | ||||||||||||
Value of shares redeemed | (5,078,734 | ) | (6,907,580 | ) | (499,145,695 | ) | (186,914,915 | ) | ||||||||
Net increase (decrease) in net assets resulting from share transactions | (5,078,734 | ) | 1,585,527 | (23,212,460 | ) | (4,057,426 | ) | |||||||||
Net increase (decrease) in net assets | (2,794,684 | ) | 623,254 | (14,776,972 | ) | (574,306 | ) | |||||||||
| NETASSETS | ||||||||||||||||
Beginning of year | 17,133,205 | 16,509,951 | 53,195,673 | 53,769,979 | ||||||||||||
End of year | $ | 14,338,521 | $ | 17,133,205 | $ | 38,418,701 | $ | 53,195,673 | ||||||||
Undistributed net investment income at end of year | $ | — | $ | — | $ | 67,544 | $ | 36,874 | ||||||||
| CHANGESINSHARESOUTSTANDING: | ||||||||||||||||
Shares sold | — | 300,000 | 6,550,000 | 2,800,000 | ||||||||||||
Shares redeemed | (200,000 | ) | (250,000 | ) | (6,850,000 | ) | (2,900,000 | ) | ||||||||
Net increase (decrease) in shares | (200,000 | ) | 50,000 | (300,000 | ) | (100,000 | ) | |||||||||
| 146 | GUGGENHEIM ETFS ANNUAL REPORT | See Notes to Financial Statements. |
Table of Contents
| STATEMENTS OF CHANGES IN NET ASSETS (continued) |
| Guggenheim S&P 500® Equal Weight Industrials ETF | Guggenheim S&P 500® Equal Weight Materials ETF | |||||||||||||||
| Year Ended October 31, 2012 | Year Ended October 31, 2011 | Year Ended October 31, 2012 | Year Ended October 31, 2011 | |||||||||||||
| INCREASE (DECREASE)IN NET ASSETSFROM OPERATIONS: | ||||||||||||||||
Net investment income | $ | 467,880 | $ | 607,514 | $ | 534,668 | $ | 578,712 | ||||||||
Net realized gain on investments | 2,234,623 | 7,115,513 | 1,158,111 | 1,631,549 | ||||||||||||
Net change in unrealized appreciation (depreciation) on investments | (516,072 | ) | (6,672,032 | ) | 1,217,258 | (2,893,215 | ) | |||||||||
Net increase (decrease) in net assets resulting from operations | 2,186,431 | 1,050,995 | 2,910,037 | (682,954 | ) | |||||||||||
| DISTRIBUTIONSTO SHAREHOLDERSFROM: | ||||||||||||||||
Net investment income | (419,866 | ) | (609,503 | ) | (529,218 | ) | (560,979 | ) | ||||||||
| SHAREHOLDER TRANSACTIONS: | ||||||||||||||||
Proceeds from shares purchased | 30,145,279 | 8,408,979 | — | 9,291,043 | ||||||||||||
Value of shares redeemed | (30,280,574 | ) | (35,505,013 | ) | (5,763,694 | ) | (5,671,266 | ) | ||||||||
Net increase (decrease) in net assets resulting from share transactions | (135,295 | ) | (27,096,034 | ) | (5,763,694 | ) | 3,619,777 | |||||||||
Net increase (decrease) in net assets | 1,631,270 | (26,654,542 | ) | (3,382,875 | ) | 2,375,844 | ||||||||||
| NETASSETS | ||||||||||||||||
Beginning of year | 15,450,411 | 42,104,953 | 36,770,655 | 34,394,811 | ||||||||||||
End of year | $ | 17,081,681 | $ | 15,450,411 | $ | 33,387,780 | $ | 36,770,655 | ||||||||
Undistributed net investment income at end of year | $ | 49,373 | $ | 7,527 | $ | 9,241 | $ | 29,012 | ||||||||
| CHANGESINSHARESOUTSTANDING: | ||||||||||||||||
Shares sold | 550,000 | 150,000 | — | 150,000 | ||||||||||||
Shares redeemed | (550,000 | ) | (700,000 | ) | (100,000 | ) | (100,000 | ) | ||||||||
Net increase (decrease) in shares | — | (550,000 | ) | (100,000 | ) | 50,000 | ||||||||||
| See Notes to Financial Statements. | GUGGENHEIM ETFS ANNUAL REPORT | 147 |
Table of Contents
| STATEMENTS OF CHANGES IN NET ASSETS (concluded) |
| Guggenheim S&P 500® Equal Weight Technology ETF | Guggenheim S&P 500® Equal Weight Utilities ETF | |||||||||||||||
| Year Ended October 31, 2012 | Year Ended October 31, 2011 | Year Ended October 31, 2012 | Year Ended October 31, 2011 | |||||||||||||
| INCREASE (DECREASE)IN NET ASSETSFROM OPERATIONS: | ||||||||||||||||
Net investment income | $ | 927,938 | $ | 641,534 | $ | 1,581,855 | $ | 887,068 | ||||||||
Net realized gain on investments | 10,505,521 | 5,230,243 | 3,268,343 | 2,071,458 | ||||||||||||
Net change in unrealized appreciation (depreciation) on investments | (14,282,736 | ) | (7,130,337 | ) | 1,919,100 | (334,844 | ) | |||||||||
Net increase (decrease) in net assets resulting from operations | (2,849,277 | ) | (1,258,560 | ) | 6,769,298 | 2,623,682 | ||||||||||
| DISTRIBUTIONSTO SHAREHOLDERSFROM: | ||||||||||||||||
Net investment income | (851,718 | ) | (622,234 | ) | (1,512,371 | ) | (868,554 | ) | ||||||||
| SHAREHOLDER TRANSACTIONS: | ||||||||||||||||
Proceeds from shares purchased | 132,237,404 | 68,792,638 | 21,944,215 | 18,642,716 | ||||||||||||
Value of shares redeemed | (137,742,483 | ) | (45,985,675 | ) | (17,254,801 | ) | (8,090,201 | ) | ||||||||
Net increase (decrease) in net assets resulting from share transactions | (5,505,079 | ) | 22,806,963 | 4,689,414 | 10,552,515 | |||||||||||
Net increase (decrease) in net assets | (9,206,074 | ) | 20,926,169 | 9,946,341 | 12,307,643 | |||||||||||
| NETASSETS | ||||||||||||||||
Beginning of year | 109,685,325 | 88,759,156 | 32,417,238 | 20,109,595 | ||||||||||||
End of year | $ | 100,479,251 | $ | 109,685,325 | $ | 42,363,579 | $ | 32,417,238 | ||||||||
Undistributed net investment income at end of year | $ | 52,623 | $ | — | $ | 53,335 | $ | 40,616 | ||||||||
| CHANGESINSHARESOUTSTANDING: | ||||||||||||||||
Shares sold | 2,350,000 | 1,300,000 | 400,000 | 350,000 | ||||||||||||
Shares redeemed | (2,500,000 | ) | (950,000 | ) | (300,000 | ) | (150,000 | ) | ||||||||
Net increase (decrease) in shares | (150,000 | ) | 350,000 | 100,000 | 200,000 | |||||||||||
| 148 | GUGGENHEIM ETFS ANNUAL REPORT | See Notes to Financial Statements. |
Table of Contents
GUGGENHEIM S&P MIDCAP 400® EQUAL WEIGHT ETF
| Year Ended October 31, 2012 | Period Ended October 31, | |||||||
Per Share Data: |
| |||||||
Net asset value, beginning of period | $28.26 | $29.76 | ||||||
Income from investment operations: | ||||||||
Net investment income** | 0.34 | 0.08 | ||||||
Net gain (loss) on investments (realized and unrealized) | 3.10 | (1.52 | ) | |||||
|
|
|
| |||||
Total from investment operations | 3.44 | (1.44 | ) | |||||
Less distributions from: | ||||||||
Net investment income | (0.33 | ) | (0.06 | ) | ||||
Net asset value, end of period | $31.37 | $28.26 | ||||||
|
|
|
| |||||
Total Return*** | 12.19% | (4.81% | ) | |||||
Ratios/Supplemental Data: | ||||||||
Net assets, end of period (in thousands) | $3,137 | $2,826 | ||||||
Ratio to average net assets of: | ||||||||
Net investment income | 1.13% | 1.20% | **** | |||||
Total expenses | 0.41% | 0.40% | **** | |||||
Portfolio turnover rate† | 24% | 7% | ||||||
| * | Fund commenced August 1, 2011. |
| ** | Based on average shares outstanding. |
| *** | Total investment return is calculated assuming an initial investment made at the net asset value at the beginning of the period, reinvestment of all dividends and distribution at net asset value during the period, and redemption on the last day of the period. Transaction fees are not reflected in the calculation of total investment return. Total investment return calculated for a period of less than one year is not annualized. |
| **** | Annualized. |
| † | Portfolio turnover does not include securities received or delivered from processing creations or redemptions. |
| See Notes to Financial Statements. | GUGGENHEIM ETFS ANNUAL REPORT | 149 |
Table of Contents
GUGGENHEIM S&P SMALLCAP 600® EQUAL WEIGHT ETF
FINANCIAL HIGHLIGHTS (continued)
| Year Ended October 31, 2012 | Period Ended October 31, | |||||||
Per Share Data: |
| |||||||
Net asset value, beginning of period | $28.23 | $29.85 | ||||||
Income from investment operations: | ||||||||
Net investment income** | 0.28 | 0.05 | ||||||
Net gain (loss) on investments (realized and unrealized) | 3.47 | (1.64 | ) | |||||
|
|
|
| |||||
Total from investment operations | 3.75 | (1.59 | ) | |||||
Less distributions from: | ||||||||
Net investment income | (0.38 | ) | (0.03 | ) | ||||
Net asset value, end of period | $31.60 | $28.23 | ||||||
|
|
|
| |||||
Total Return*** | 13.30% | (5.30% | ) | |||||
Ratios/Supplemental Data: | ||||||||
Net assets, end of period (in thousands) | $1,580 | $5,647 | ||||||
Ratio to average net assets of: | ||||||||
Net investment income | 0.93% | 0.82% | **** | |||||
Total expenses | 0.41% | 0.40% | **** | |||||
Portfolio turnover rate† | 26% | 8% | ||||||
| * | Fund commenced August 1, 2011. |
| ** | Based on average shares outstanding. |
| *** | Total investment return is calculated assuming an initial investment made at the net asset value at the beginning of the period, reinvestment of all dividends and distribution at net asset value during the period, and redemption on the last day of the period. Transaction fees are not reflected in the calculation of total investment return. Total investment return calculated for a period of less than one year is not annualized. |
| **** | Annualized. |
| † | Portfolio turnover does not include securities received or delivered from processing creations or redemptions. |
| 150 | GUGGENHEIM ETFS ANNUAL REPORT | See Notes to Financial Statements. |
Table of Contents
GUGGENHEIM RUSSELL MIDCAP® EQUAL WEIGHT ETF
FINANCIAL HIGHLIGHTS (continued)
| Year Ended October 31, 2012 | Period Ended October 31, | |||||||
Per Share Data: |
| |||||||
Net asset value, beginning of period | $31.15 | $30.21 | ||||||
Income from investment operations: | ||||||||
Net investment income** | 0.46 | 0.30 | ||||||
Net gain on investments (realized and unrealized) | 2.80 | 0.85 | ||||||
|
|
|
| |||||
Total from investment operations | 3.26 | 1.15 | ||||||
Less distributions from: | ||||||||
Net investment income | (0.46 | ) | (0.21 | ) | ||||
Net asset value, end of period | $33.95 | $31.15 | ||||||
|
|
|
| |||||
Total Return*** | 10.52% | 3.80% | ||||||
Ratios/Supplemental Data: | ||||||||
Net assets, end of period (in thousands) | $52,617 | $54,508 | ||||||
Ratio to average net assets of: | ||||||||
Net investment income | 1.39% | 1.06% | **** | |||||
Total expenses | 0.41% | 0.41% | **** | |||||
Portfolio turnover rate† | 33% | 30% | ||||||
| * | The Fund commenced operations on December 3, 2010. |
| ** | Based on average shares outstanding. |
| *** | Total investment return is calculated assuming an initial investment made at the net asset value at the beginning of the period, reinvestment of all dividends and distribution at net asset value during the period, and redemption on the last day of the period. Transaction fees are not reflected in the calculation of total investment return. Total investment return calculated for a period of less than one year is not annualized. |
| **** | Annualized. |
| † | Portfolio turnover does not include securities received or delivered from processing creations or redemptions. |
| See Notes to Financial Statements. | GUGGENHEIM ETFS ANNUAL REPORT | 151 |
Table of Contents
GUGGENHEIM RUSSELL 1000® EQUAL WEIGHT ETF
FINANCIAL HIGHLIGHTS (continued)
| Year Ended October 31, 2012 | Period Ended October 31, | |||||||
Per Share Data: |
| |||||||
Net asset value, beginning of period | $31.08 | $30.18 | ||||||
Income from investment operations: | ||||||||
Net investment income** | 0.51 | 0.36 | ||||||
Net gain on investments (realized and unrealized) | 2.83 | 0.85 | ||||||
|
|
|
| |||||
Total from investment operations | 3.34 | 1.21 | ||||||
Less distributions from: | ||||||||
Net investment income | (0.50 | ) | (0.31 | ) | ||||
Net asset value, end of period | $33.92 | $31.08 | ||||||
|
|
|
| |||||
Total Return*** | 10.83% | 4.00% | ||||||
Ratios/Supplemental Data: | ||||||||
Net assets, end of period (in thousands) | $39,011 | $34,183 | ||||||
Ratio to average net assets of: | ||||||||
Net investment income | 1.56% | 1.26% | **** | |||||
Total expenses | 0.41% | 0.41% | **** | |||||
Portfolio turnover rate† | 27% | 25% | ||||||
| * | The Fund commenced operations on December 3, 2010. |
| ** | Based on average shares outstanding. |
| *** | Total investment return is calculated assuming an initial investment made at the net asset value at the beginning of the period, reinvestment of all dividends and distribution at net asset value during the period, and redemption on the last day of the period. Transaction fees are not reflected in the calculation of total investment return. Total investment return calculated for a period of less than one year is not annualized. |
| **** | Annualized. |
| † | Portfolio turnover does not include securities received or delivered from processing creations or redemptions. |
| 152 | GUGGENHEIM ETFS ANNUAL REPORT | See Notes to Financial Statements. |
Table of Contents
GUGGENHEIM RUSSELL 2000® EQUAL WEIGHT ETF
FINANCIAL HIGHLIGHTS (continued)
| Year Ended October 31, 2012 | Period Ended October 31, | |||||||
Per Share Data: |
| |||||||
Net asset value, beginning of period | $29.48 | $30.19 | ||||||
Income from investment operations: | ||||||||
Net investment income** | 0.34 | 0.22 | ||||||
Net gain (loss) on investments (realized and unrealized) | 2.33 | (0.75 | ) | |||||
|
|
|
| |||||
Total from investment operations | 2.67 | (0.53 | ) | |||||
Less distributions from: | ||||||||
Net investment income | (0.33 | ) | (0.18 | ) | ||||
Net asset value, end of period | $31.82 | $29.48 | ||||||
|
|
|
| |||||
Total Return*** | 9.08% | (1.78% | ) | |||||
Ratios/Supplemental Data: | ||||||||
Net assets, end of period (in thousands) | $14,318 | $23,584 | ||||||
Ratio to average net assets of: | ||||||||
Net investment income | 1.10% | 0.79% | **** | |||||
Total expenses | 0.41% | 0.41% | **** | |||||
Portfolio turnover rate† | 43% | 38% | ||||||
| * | The Fund commenced operations on December 3, 2010. |
| ** | Based on average shares outstanding. |
| *** | Total investment return is calculated assuming an initial investment made at the net asset value at the beginning of the period, reinvestment of all dividends and distribution at net asset value during the period, and redemption on the last day of the period. Transaction fees are not reflected in the calculation of total investment return. Total investment return calculated for a period of less than one year is not annualized. |
| **** | Annualized. |
| † | Portfolio turnover does not include securities received or delivered from processing creations or redemptions. |
| See Notes to Financial Statements. | GUGGENHEIM ETFS ANNUAL REPORT | 153 |
Table of Contents
GUGGENHEIM MSCI EAFE EQUAL WEIGHT ETF
FINANCIAL HIGHLIGHTS (continued)
| Year Ended October 31, 2012 | Period Ended October 31, | |||||||
Per Share Data: |
| |||||||
Net asset value, beginning of period | $36.98 | $40.63 | ||||||
Income from investment operations: | ||||||||
Net investment income** | 0.95 | 1.11 | ||||||
Net loss on investments (realized and unrealized) | (0.19 | ) | (3.57 | ) | ||||
|
|
|
| |||||
Total from investment operations | 0.76 | (2.46 | ) | |||||
Less distributions from: | ||||||||
Net investment income | (0.89 | ) | (1.19 | ) | ||||
Net asset value, end of period | $36.85 | $36.98 | ||||||
|
|
|
| |||||
Total Return*** | 2.21% | (6.33% | ) | |||||
Ratios/Supplemental Data: | ||||||||
Net assets, end of period (in thousands) | $11,056 | $11,093 | ||||||
Ratio to average net assets of: | ||||||||
Net investment income | 2.65% | 2.96% | **** | |||||
Total expenses | 0.56% | 0.56% | **** | |||||
Portfolio turnover rate† | 26% | 24% | ||||||
| * | The Fund commenced operations on December 3, 2010. |
| ** | Based on average shares outstanding. |
| *** | Total investment return is calculated assuming an initial investment made at the net asset value at the beginning of the period, reinvestment of all dividends and distribution at net asset value during the period, and redemption on the last day of the period. Transaction fees are not reflected in the calculation of total investment return. Total investment return calculated for a period of less than one year is not annualized. |
| **** | Annualized. |
| † | Portfolio turnover does not include securities received or delivered from processing creations or redemptions. |
| 154 | GUGGENHEIM ETFS ANNUAL REPORT | See Notes to Financial Statements. |
Table of Contents
GUGGENHEIM MSCI EMERGING MARKETS EQUAL WEIGHT ETF
FINANCIAL HIGHLIGHTS (continued)
| Year Ended October 31, 2012 | Period Ended October 31, | |||||||
Per Share Data: |
| |||||||
Net asset value, beginning of period | $33.83 | $40.21 | ||||||
Income from investment operations: | ||||||||
Net investment income** | 0.55 | 0.69 | ||||||
Net loss on investments (realized and unrealized) | (0.53 | ) | (6.35 | ) | ||||
|
|
|
| |||||
Total from investment operations | 0.02 | (5.66 | ) | |||||
Less distributions from: | ||||||||
Net investment income | (0.48 | ) | (0.36 | ) | ||||
Return of capital | (0.06 | ) | (0.36 | ) | ||||
|
|
|
| |||||
Total distributions | (0.54 | ) | (0.72 | ) | ||||
Net asset value, end of period | $33.31 | $33.83 | ||||||
|
|
|
| |||||
Total Return*** | 0.10% | (14.13% | ) | |||||
Ratios/Supplemental Data: | ||||||||
Net assets, end of period (in thousands) | $13,325 | $16,914 | ||||||
Ratio to average net assets of: | ||||||||
Net investment income | 1.66% | 1.99% | ||||||
Total expenses | 0.72% | 0.71% | **** | |||||
Net expenses***** | 0.61% | 0.63% | **** | |||||
Portfolio turnover rate† | 39% | 63% | ||||||
| * | The Fund commenced operations on January 7, 2011. |
| ** | Based on average shares outstanding. |
| *** | Total investment return is calculated assuming an initial investment made at the net asset value at the beginning of the period, reinvestment of all dividends and distribution at net asset value during the period, and redemption on the last day of the period. Transaction fees are not reflected in the calculation of total investment return. Total investment return calculated for a period of less than one year is not annualized. |
| **** | Annualized. |
| ***** | Net expense information reflects the expense ratios after expense waivers. |
| † | Portfolio turnover does not include securities received or delivered from processing creations or redemptions. |
| See Notes to Financial Statements. | GUGGENHEIM ETFS ANNUAL REPORT | 155 |
Table of Contents
GUGGENHEIM S&P 500® EQUAL WEIGHT CONSUMER DISCRETIONARY ETF
FINANCIAL HIGHLIGHTS (continued)
| Year Ended October 31, 2012 | Year Ended October 31, 2011 | Year Ended October 31, 2010 | Year Ended October 31, 2009 | Year Ended October 31, 2008 | ||||||||||||||||
Per Share Data: |
| |||||||||||||||||||
Net asset value, beginning of period | $47.70 | $42.37 | $32.78 | $24.82 | $44.50 | |||||||||||||||
Income from investment operations: | ||||||||||||||||||||
Net investment income* | 0.64 | 0.56 | 0.35 | 0.40 | 0.53 | |||||||||||||||
Net gain (loss) on investments (realized and unrealized) | 7.46 | 5.31 | 9.56 | 7.93 | (19.59 | ) | ||||||||||||||
|
|
|
|
|
|
|
|
|
| |||||||||||
Total from investment operations | 8.10 | 5.87 | 9.91 | 8.33 | (19.06 | ) | ||||||||||||||
Less distributions from: | ||||||||||||||||||||
Net investment income | (0.71 | ) | (0.54 | ) | (0.32 | ) | (0.37 | ) | (0.62 | ) | ||||||||||
Net asset value, end of period | $55.09 | $47.70 | $42.37 | $32.78 | $24.82 | |||||||||||||||
|
|
|
|
|
|
|
|
|
| |||||||||||
Total Return** | 17.05% | 13.91% | 30.35% | 34.20% | (43.27% | ) | ||||||||||||||
Ratios/Supplemental Data: | ||||||||||||||||||||
Net assets, end of period (in thousands) | $41,314 | $21,467 | $25,425 | $11,474 | $3,722 | |||||||||||||||
Ratio to average net assets of: | ||||||||||||||||||||
Net investment income | 1.22% | 1.20% | 0.89% | 1.61% | 1.44% | |||||||||||||||
Total expenses | 0.50% | 0.50% | 0.50% | 0.50% | 0.50% | |||||||||||||||
Portfolio turnover rate† | 25% | 26% | 28% | 42% | 29% | |||||||||||||||
| * | Based on average shares outstanding. |
| ** | Total investment return is calculated assuming an initial investment made at the net asset value at the beginning of the period, reinvestment of all dividends and distribution at net asset value during the period, and redemption on the last day of the period. Transaction fees are not reflected in the calculation of total investment return. Total investment return calculated for a period of less than one year is not annualized. |
| † | Portfolio turnover does not include securities received or delivered from processing creations or redemptions. |
| 156 | GUGGENHEIM ETFS ANNUAL REPORT | See Notes to Financial Statements. |
Table of Contents
GUGGENHEIM S&P 500® EQUAL WEIGHT CONSUMER STAPLES ETF
FINANCIAL HIGHLIGHTS (continued)
| Year Ended October 31, 2012 | Year Ended October 31, 2011 | Year Ended October 31, 2010 | Year Ended October 31, 2009 | Year Ended October 31, 2008 | ||||||||||||||||
Per Share Data: |
| |||||||||||||||||||
Net asset value, beginning of period | $61.01 | $55.42 | $48.42 | $41.47 | $52.68 | |||||||||||||||
Income from investment operations: | ||||||||||||||||||||
Net investment income* | 1.41 | 1.31 | 1.14 | 1.04 | 0.88 | |||||||||||||||
Net gain (loss) on investments (realized and unrealized) | 7.20 | 5.49 | 6.95 | 6.91 | (11.22 | ) | ||||||||||||||
|
|
|
|
|
|
|
|
|
| |||||||||||
Total from investment operations | 8.61 | 6.80 | 8.09 | 7.95 | (10.34 | ) | ||||||||||||||
Less distributions from: | ||||||||||||||||||||
Net investment income | (1.38 | ) | (1.21 | ) | (1.09 | ) | (1.00 | ) | (0.87 | ) | ||||||||||
Net asset value, end of period | $68.24 | $61.01 | $55.42 | $48.42 | $41.47 | |||||||||||||||
|
|
|
|
|
|
|
|
|
| |||||||||||
Total Return** | 14.19% | 12.37% | 16.89% | 19.60% | (19.87% | ) | ||||||||||||||
Ratios/Supplemental Data: | ||||||||||||||||||||
Net assets, end of period (in thousands) | $40,944 | $30,507 | $13,856 | $9,685 | $10,368 | |||||||||||||||
Ratio to average net assets of: | ||||||||||||||||||||
Net investment income | 2.14% | 2.20% | 2.20% | 2.52% | 1.78% | |||||||||||||||
Total expenses | 0.50% | 0.50% | 0.50% | 0.50% | 0.50% | |||||||||||||||
Portfolio turnover rate† | 18% | 15% | 18% | 25% | 25% | |||||||||||||||
| * | Based on average shares outstanding. |
| ** | Total investment return is calculated assuming an initial investment made at the net asset value at the beginning of the period, reinvestment of all dividends and distribution at net asset value during the period, and redemption on the last day of the period. Transaction fees are not reflected in the calculation of total investment return. Total investment return calculated for a period of less than one year is not annualized. |
| † | Portfolio turnover does not include securities received or delivered from processing creations or redemptions. |
| See Notes to Financial Statements. | GUGGENHEIM ETFS ANNUAL REPORT | 157 |
Table of Contents
GUGGENHEIM S&P 500® EQUAL WEIGHT ENERGY ETF
FINANCIAL HIGHLIGHTS (continued)
| Year Ended October 31, 2012 | Year Ended October 31, 2011 | Year Ended October 31, 2010 | Year Ended October 31, 2009 | Year Ended October 31, 2008 | ||||||||||||||||
Per Share Data: |
| |||||||||||||||||||
Net asset value, beginning of period | $64.16 | $53.74 | $47.69 | $39.72 | $67.48 | |||||||||||||||
Income from investment operations: | ||||||||||||||||||||
Net investment income* | 0.55 | 0.36 | 0.44 | 0.46 | 0.33 | |||||||||||||||
Net gain (loss) on investments (realized and unrealized) | (0.19 | ) | 10.43 | 6.07 | 7.93 | (25.94 | ) | |||||||||||||
|
|
|
|
|
|
|
|
|
| |||||||||||
Total from investment operations | 0.36 | 10.79 | 6.51 | 8.39 | (25.61 | ) | ||||||||||||||
Less distributions from: | ||||||||||||||||||||
Net investment income | (0.51 | ) | (0.37 | ) | (0.46 | ) | (0.42 | ) | (0.35 | ) | ||||||||||
Net realized gains | — | — | — | — | (1.80 | ) | ||||||||||||||
|
|
|
|
|
|
|
|
|
| |||||||||||
Total distributions | (0.51 | ) | (0.37 | ) | (0.46 | ) | (0.42 | ) | (2.15 | ) | ||||||||||
Net asset value, end of period | $64.01 | $64.16 | $53.74 | $47.69 | $39.72 | |||||||||||||||
|
|
|
|
|
|
|
|
|
| |||||||||||
Total Return** | 0.58% | 20.09% | 13.74% | 21.39% | (39.28% | ) | ||||||||||||||
Ratios/Supplemental Data: | ||||||||||||||||||||
Net assets, end of period (in thousands) | $32,004 | $35,287 | $16,122 | $11,922 | $5,958 | |||||||||||||||
Ratio to average net assets of: | ||||||||||||||||||||
Net investment income | 0.88% | 0.53% | 0.87% | 1.16% | 0.50% | |||||||||||||||
Total expenses | 0.50% | 0.50% | 0.50% | 0.50% | 0.50% | |||||||||||||||
Portfolio turnover rate† | 30% | 23% | 31% | 33% | 38% | |||||||||||||||
| * | Based on average shares outstanding. |
| ** | Total investment return is calculated assuming an initial investment made at the net asset value at the beginning of the period, reinvestment of all dividends and distribution at net asset value during the period, and redemption on the last day of the period. Transaction fees are not reflected in the calculation of total investment return. Total investment return calculated for a period of less than one year is not annualized. |
| † | Portfolio turnover does not include securities received or delivered from processing creations or redemptions. |
| 158 | GUGGENHEIM ETFS ANNUAL REPORT | See Notes to Financial Statements. |
Table of Contents
GUGGENHEIM S&P 500® EQUAL WEIGHT FINANCIAL ETF
FINANCIAL HIGHLIGHTS (continued)
| Year Ended October 31, 2012 | Year Ended October 31, 2011 | Year Ended October 31, 2010 | Year Ended October 31, 2009 | Year Ended October 31, 2008 | ||||||||||||||||
Per Share Data: |
| |||||||||||||||||||
Net asset value, beginning of period | $24.48 | $25.40 | $21.53 | $21.41 | $46.67 | |||||||||||||||
Income from investment operations: | ||||||||||||||||||||
Net investment income* | 0.39 | 0.42 | 0.31 | 0.36 | 1.02 | |||||||||||||||
Net gain (loss) on investments (realized and unrealized) | 4.32 | (0.96 | ) | 3.87 | 0.18 | (25.40 | ) | |||||||||||||
|
|
|
|
|
|
|
|
|
| |||||||||||
Total from investment operations | 4.71 | (0.54 | ) | 4.18 | 0.54 | (24.38 | ) | |||||||||||||
Less distributions from: | ||||||||||||||||||||
Net investment income | (0.42 | ) | (0.38 | ) | (0.31 | ) | (0.42 | ) | (0.88 | ) | ||||||||||
Return of capital | (0.09 | ) | — | — | — | — | ||||||||||||||
|
|
|
|
|
|
|
|
|
| |||||||||||
Total distributions to shareholders | (0.51 | ) | (0.38 | ) | (0.31 | ) | (0.42 | ) | (0.88 | ) | ||||||||||
Net asset value, end of period | $28.68 | $24.48 | $25.40 | $21.53 | $21.41 | |||||||||||||||
|
|
|
|
|
|
|
|
|
| |||||||||||
Total Return** | 19.32% | (2.25% | ) | 19.46% | 3.15% | (52.88% | ) | |||||||||||||
Ratios/Supplemental Data: | ||||||||||||||||||||
Net assets, end of period (in thousands) | $14,339 | $17,133 | $16,510 | $13,995 | $10,705 | |||||||||||||||
Ratio to average net assets of: | ||||||||||||||||||||
Net investment income | 1.48% | 1.59% | 1.26% | 2.00% | 3.09% | |||||||||||||||
Total expenses | 0.50% | 0.50% | 0.50% | 0.50% | 0.50% | |||||||||||||||
Portfolio turnover rate† | 17% | 18% | 19% | 49% | 51% | |||||||||||||||
| * | Based on average shares outstanding. |
| ** | Total investment return is calculated assuming an initial investment made at the net asset value at the beginning of the period, reinvestment of all dividends and distribution at net asset value during the period, and redemption on the last day of the period. Transaction fees are not reflected in the calculation of total investment return. Total investment return calculated for a period of less than one year is not annualized. |
| † | Portfolio turnover does not include securities received or delivered from processing creations or redemptions. |
| See Notes to Financial Statements. | GUGGENHEIM ETFS ANNUAL REPORT | 159 |
Table of Contents
GUGGENHEIM S&P 500® EQUAL WEIGHT HEALTH CARE ETF
FINANCIAL HIGHLIGHTS (continued)
| Year Ended October 31, 2012 | Year Ended October 31, 2011 | Year Ended October 31, 2010 | Year Ended October 31, 2009 | Year Ended October 31, 2008 | ||||||||||||||||
Per Share Data: |
| |||||||||||||||||||
Net asset value, beginning of period | $66.49 | $59.74 | $50.56 | $42.21 | $57.94 | |||||||||||||||
Income from investment operations: | ||||||||||||||||||||
Net investment income* | 0.47 | 0.32 | 0.20 | 0.19 | 0.14 | |||||||||||||||
Net gain (loss) on investments (realized and unrealized) | 11.04 | 6.73 | 9.20 | 8.35 | (15.74 | ) | ||||||||||||||
|
|
|
|
|
|
|
|
|
| |||||||||||
Total from investment operations | 11.51 | 7.05 | 9.40 | 8.54 | (15.60 | ) | ||||||||||||||
Less distributions from: | ||||||||||||||||||||
Net investment income | (1.16 | ) | (0.30 | ) | (0.22 | ) | (0.19 | ) | (0.13 | ) | ||||||||||
Net asset value, end of period | $76.84 | $66.49 | $59.74 | $50.56 | $42.21 | |||||||||||||||
|
|
|
|
|
|
|
|
|
| |||||||||||
Total Return** | 17.39% | 11.80% | 18.64% | 20.31% | (26.98% | ) | ||||||||||||||
Ratios/Supplemental Data: | ||||||||||||||||||||
Net assets, end of period (in thousands) | $38,419 | $53,196 | $53,770 | $73,308 | $48,537 | |||||||||||||||
Ratio to average net assets of: | ||||||||||||||||||||
Net investment income | 0.65% | 0.47% | 0.35% | 0.42% | 0.26% | |||||||||||||||
Total expenses | 0.50% | 0.50% | 0.50% | 0.50% | 0.50% | |||||||||||||||
Portfolio turnover rate† | 15% | 19% | 20% | 38% | 26% | |||||||||||||||
| * | Based on average shares outstanding. |
| ** | Total investment return is calculated assuming an initial investment made at the net asset value at the beginning of the period, reinvestment of all dividends and distribution at net asset value during the period, and redemption on the last day of the period. Transaction fees are not reflected in the calculation of total investment return. Total investment return calculated for a period of less than one year is not annualized. |
| † | Portfolio turnover does not include securities received or delivered from processing creations or redemptions. |
| 160 | GUGGENHEIM ETFS ANNUAL REPORT | See Notes to Financial Statements. |
Table of Contents
GUGGENHEIM S&P 500® EQUAL WEIGHT INDUSTRIALS ETF
FINANCIAL HIGHLIGHTS (continued)
| Year Ended October 31, 2012 | Year Ended October 31, 2011 | Year Ended October 31, 2010 | Year Ended October 31, 2009 | Year Ended October 31, 2008 | ||||||||||||||||
Per Share Data: |
| |||||||||||||||||||
Net asset value, beginning of period | $51.50 | $49.54 | $39.76 | $35.73 | $59.37 | |||||||||||||||
Income from investment operations: | ||||||||||||||||||||
Net investment income* | 1.05 | 0.83 | 0.61 | 0.67 | 0.61 | |||||||||||||||
Net gain (loss) on investments (realized and unrealized) | 5.42 | 2.05 | 9.78 | 4.12 | (21.82 | ) | ||||||||||||||
|
|
|
|
|
|
|
|
|
| |||||||||||
Total from investment operations | 6.47 | 2.88 | 10.39 | 4.79 | (21.21 | ) | ||||||||||||||
Less distributions from: | ||||||||||||||||||||
Net investment income | (1.03 | ) | (0.92 | ) | (0.61 | ) | (0.76 | ) | (0.65 | ) | ||||||||||
Net realized gains | — | — | — | — | (1.78 | ) | ||||||||||||||
|
|
|
|
|
|
|
|
|
| |||||||||||
Total distributions | (1.03 | ) | (0.92 | ) | (0.61 | ) | (0.76 | ) | (2.43 | ) | ||||||||||
Net asset value, end of period | $56.94 | $51.50 | $49.54 | $39.76 | $35.73 | |||||||||||||||
|
|
|
|
|
|
|
|
|
| |||||||||||
Total Return** | 12.64% | 5.80% | 26.28% | 13.84% | (37.12% | ) | ||||||||||||||
Ratios/Supplemental Data: | ||||||||||||||||||||
Net assets, end of period (in thousands) | $17,082 | $15,450 | $42,105 | $17,890 | $7,146 | |||||||||||||||
Ratio to average net assets of: | ||||||||||||||||||||
Net investment income | 1.90% | 1.52% | 1.34% | 1.88% | 1.17% | |||||||||||||||
Total expenses | 0.50% | 0.50% | 0.50% | 0.50% | 0.50% | |||||||||||||||
Portfolio turnover rate† | 18% | 15% | 18% | 35% | 30% | |||||||||||||||
| * | Based on average shares outstanding. |
| ** | Total investment return is calculated assuming an initial investment made at the net asset value at the beginning of the period, reinvestment of all dividends and distribution at net asset value during the period, and redemption on the last day of the period. Transaction fees are not reflected in the calculation of total investment return. Total investment return calculated for a period of less than one year is not annualized. |
| † | Portfolio turnover does not include securities received or delivered from processing creations or redemptions. |
| See Notes to Financial Statements. | GUGGENHEIM ETFS ANNUAL REPORT | 161 |
Table of Contents
GUGGENHEIM S&P 500® EQUAL WEIGHT MATERIALS ETF
FINANCIAL HIGHLIGHTS (continued)
| Year Ended October 31, 2012 | Year Ended October 31, 2011 | Year Ended October 31, 2010 | Year Ended October 31, 2009 | Year Ended October 31, 2008 | ||||||||||||||||
Per Share Data: |
| |||||||||||||||||||
Net asset value, beginning of period | $56.57 | $57.32 | $45.78 | $34.37 | $59.42 | |||||||||||||||
Income from investment operations: | ||||||||||||||||||||
Net investment income* | 0.92 | 0.82 | 1.52 | 0.60 | 1.40 | |||||||||||||||
Net gain (loss) on investments (realized and unrealized) | 4.14 | (0.76 | ) | 11.65 | 11.49 | (25.11 | ) | |||||||||||||
|
|
|
|
|
|
|
|
|
| |||||||||||
Total from investment operations | 5.06 | 0.06 | 13.17 | 12.09 | (23.71 | ) | ||||||||||||||
Less distributions from: | ||||||||||||||||||||
Net investment income | (0.92 | ) | (0.81 | ) | (1.63 | ) | (0.68 | ) | (1.34 | ) | ||||||||||
Net asset value, end of period | $60.71 | $56.57 | $57.32 | $45.78 | $34.37 | |||||||||||||||
|
|
|
|
|
|
|
|
|
| |||||||||||
Total Return** | 8.99% | 0.04% | 29.05% | 35.82% | (40.67% | ) | ||||||||||||||
Ratios/Supplemental Data: | ||||||||||||||||||||
Net assets, end of period (in thousands) | $33,388 | $36,771 | $34,395 | $41,199 | $5,155 | |||||||||||||||
Ratio to average net assets of: | ||||||||||||||||||||
Net investment income | 1.55% | 1.33% | 2.88% | 1.41% | 2.69% | |||||||||||||||
Total expenses | 0.50% | 0.50% | 0.50% | 0.50% | 0.50% | |||||||||||||||
Portfolio turnover rate† | 20% | 21% | 27% | 57% | 34% | |||||||||||||||
| * | Based on average shares outstanding. |
| ** | Total investment return is calculated assuming an initial investment made at the net asset value at the beginning of the period, reinvestment of all dividends and distribution at net asset value during the period, and redemption on the last day of the period. Transaction fees are not reflected in the calculation of total investment return. Total investment return calculated for a period of less than one year is not annualized. |
| † | Portfolio turnover does not include securities received or delivered from processing creations or redemptions. |
| 162 | GUGGENHEIM ETFS ANNUAL REPORT | See Notes to Financial Statements. |
Table of Contents
GUGGENHEIM S&P 500® EQUAL WEIGHT TECHNOLOGY ETF
FINANCIAL HIGHLIGHTS (continued)
| Year Ended October 31, 2012 | Year Ended October 31, 2011 | Year Ended October 31, 2010 | Year Ended October 31, 2009 | Year Ended October 31, 2008 | ||||||||||||||||
Per Share Data: |
| |||||||||||||||||||
Net asset value, beginning of period | $52.23 | $50.72 | $39.98 | $29.98 | $55.18 | |||||||||||||||
Income from investment operations: | ||||||||||||||||||||
Net investment income* | 0.41 | 0.29 | 0.12 | 0.11 | 0.06 | |||||||||||||||
Net gain (loss) on investments (realized and unrealized) | (0.75 | ) | 1.49 | 10.75 | 10.03 | (25.19 | ) | |||||||||||||
|
|
|
|
|
|
|
|
|
| |||||||||||
Total from investment operations | (0.34 | ) | 1.78 | 10.87 | 10.14 | (25.13 | ) | |||||||||||||
Less distributions from: | ||||||||||||||||||||
Net investment income | (0.36 | ) | (0.27 | ) | (0.13 | ) | (0.14 | ) | (0.07 | ) | ||||||||||
Net asset value, end of period | $51.53 | $52.23 | $50.72 | $39.98 | $29.98 | |||||||||||||||
|
|
|
|
|
|
|
|
|
| |||||||||||
Total Return** | (0.71% | ) | 3.51% | 27.23% | 33.94% | (45.58% | ) | |||||||||||||
Ratios/Supplemental Data: | ||||||||||||||||||||
Net assets, end of period (in thousands) | $100,479 | $109,685 | $88,759 | $53,969 | $7,495 | |||||||||||||||
Ratio to average net assets of: | ||||||||||||||||||||
Net investment income | 0.76% | 0.54% | 0.26% | 0.30% | 0.14% | |||||||||||||||
Total expenses | 0.50% | 0.50% | 0.50% | 0.50% | 0.50% | |||||||||||||||
Portfolio turnover rate† | 25% | 29% | 25% | 30% | 36% | |||||||||||||||
| * | Based on average shares outstanding. |
| ** | Total investment return is calculated assuming an initial investment made at the net asset value at the beginning of the period, reinvestment of all dividends and distribution at net asset value during the period, and redemption on the last day of the period. Transaction fees are not reflected in the calculation of total investment return. Total investment return calculated for a period of less than one year is not annualized. |
| † | Portfolio turnover does not include securities received or delivered from processing creations or redemptions. |
| See Notes to Financial Statements. | GUGGENHEIM ETFS ANNUAL REPORT | 163 |
Table of Contents
GUGGENHEIM S&P 500® EQUAL WEIGHT UTILITIES ETF
FINANCIAL HIGHLIGHTS (concluded)
| Year Ended October 31, 2012 | Year Ended October 31, 2011 | Year Ended October 31, 2010 | Year Ended October 31, 2009 | Year Ended October 31, 2008 | ||||||||||||||||
Per Share Data: |
| |||||||||||||||||||
Net asset value, beginning of period | $54.03 | $50.27 | $42.13 | $41.18 | $62.28 | |||||||||||||||
Income from investment operations: | ||||||||||||||||||||
Net investment income* | 2.03 | 1.89 | 1.84 | 1.89 | 1.81 | |||||||||||||||
Net gain (loss) on investments (realized and unrealized) | 6.45 | 3.71 | 8.13 | 0.88 | (21.09 | ) | ||||||||||||||
|
|
|
|
|
|
|
|
|
| |||||||||||
Total from investment operations | 8.48 | 5.60 | 9.97 | 2.77 | (19.28 | ) | ||||||||||||||
Less distributions from: | ||||||||||||||||||||
Net investment income | (1.99 | ) | (1.84 | ) | (1.83 | ) | (1.82 | ) | (1.82 | ) | ||||||||||
Net asset value, end of period | $60.52 | $54.03 | $50.27 | $42.13 | $41.18 | |||||||||||||||
|
|
|
|
|
|
|
|
|
| |||||||||||
Total Return** | 15.98% | 11.29% | 24.10% | 6.97% | (31.63% | ) | ||||||||||||||
Ratios/Supplemental Data: | ||||||||||||||||||||
Net assets, end of period (in thousands) | $42,364 | $32,417 | $20,110 | $8,427 | $4,118 | |||||||||||||||
Ratio to average net assets of: | ||||||||||||||||||||
Net investment income | 3.60% | 3.60% | 3.95% | 4.64% | 3.30% | |||||||||||||||
Total expenses | 0.50% | 0.50% | 0.50% | 0.50% | 0.50% | |||||||||||||||
Portfolio turnover rate† | 22% | 15% | 16% | 26% | 25% | |||||||||||||||
| * | Based on average shares outstanding. |
| ** | Total investment return is calculated assuming an initial investment made at the net asset value at the beginning of the period, reinvestment of all dividends and distribution at net asset value during the period, and redemption on the last day of the period. Transaction fees are not reflected in the calculation of total investment return. Total investment return calculated for a period of less than one year is not annualized. |
| † | Portfolio turnover does not include securities received or delivered from processing creations or redemptions. |
| 164 | GUGGENHEIM ETFS ANNUAL REPORT | See Notes to Financial Statements. |
Table of Contents
|
1. Organization
Rydex ETF Trust (the “Trust”) is an open-end, management investment company registered under the Investment Company Act of 1940 (the “1940 Act”). The Trust was organized as a Delaware statutory trust on November 22, 2002. As of October 31, 2012, the Trust offers twenty-six portfolios, each of which represents a separate series of beneficial interest in the Trust. The financial statements herein relate to the following funds: Guggenheim S&P MidCap 400® Equal Weight ETF, Guggenheim S&P SmallCap 600® Equal Weight ETF, Guggenheim Russell MidCap® Equal Weight ETF, Guggenheim Russell 1000® Equal Weight ETF, Guggenheim Russell 2000® Equal Weight ETF, Guggenheim MSCI EAFE Equal Weight ETF, Guggenheim MSCI Emerging Markets Equal Weight ETF, Guggenheim S&P 500® Equal Weight Consumer Discretionary ETF, Guggenheim S&P 500® Equal Weight Consumer Staples ETF, Guggenheim S&P 500® Equal Weight Energy ETF, Guggenheim S&P 500® Equal Weight Financials ETF, Guggenheim S&P 500® Equal Weight Health Care ETF, Guggenheim S&P 500® Equal Weight Industrials ETF, Guggenheim S&P 500® Equal Weight Materials ETF, Guggenheim S&P 500® Equal Weight Technology ETF and Guggenheim S&P 500® Equal Weight Utilities ETF (each a “Fund”, and collectively, the “Funds”). Guggenheim S&P 500® Equal Weight ETF commenced operations on April 24, 2003. Guggenheim S&P MidCap 400® Equal Weight and Guggenheim S&P SmallCap 600® Equal Weight commenced operations on August 1, 2011. Guggenheim Russell MidCap® Equal Weight ETF, Guggenheim Russell 1000® Equal Weight ETF, Guggenheim Russell 2000® Equal Weight ETF, Guggenheim MSCI EAFE Equal Weight ETF and Guggenheim MSCI Emerging Markets Equal Weight ETF commenced operations on December 3, 2010. Guggenheim S&P 500® Equal Weight Consumer Discretionary ETF, Guggenheim S&P 500® Equal Weight Consumer Staples ETF, Guggenheim S&P 500® Equal Weight Energy ETF, Guggenheim S&P 500® Equal Weight Financials ETF, Guggenheim S&P 500® Equal Weight Health Care ETF, Guggenheim S&P 500® Equal Weight Industrials ETF, Guggenheim S&P 500® Equal Weight Materials ETF, Guggenheim S&P 500® Equal Weight Technology ETF and Guggenheim S&P 500® Equal Weight Utilities ETF commenced operations on November 1, 2006.
The Funds’ investment objective is to replicate as closely as possible, before fees and expenses, the daily performance of an index representing publicly traded equity securities (the “Underlying Index”). The Guggenheim S&P MidCap 400® Equal Weight ETF tracks the S&P MidCap 400® Equal Weight Index, the Guggenheim S&P SmallCap 600® Equal Weight ETF tracks the S&P SmallCap 600® Equal Weight Index, the Guggenheim Russell MidCap® Equal Weight ETF tracks the Russell MidCap® Equal Weight Index, the Guggenheim Russell 1000® Equal Weight ETF tracks the Russell 1000® Equal Weight Index, the Guggenheim Russell 2000® Equal Weight
ETF tracks the Russell 2000® Equal Weight Index, the Guggenheim MSCI EAFE Equal Weight ETF tracks the MSCI EAFE Equal Weighted Index, the Guggenheim MSCI Emerging Markets Equal Weight ETF tracks the MSCI Emerging Markets Equal Weighted Index, the Guggenheim S&P 500® Equal Weight Consumer Discretionary ETF tracks the S&P 500® Equal Weight Consumer Discretionary Index, the Guggenheim S&P 500® Equal Weight Consumer Staples ETF tracks the S&P 500® Equal Weight Consumer Staples Index, the Guggenheim S&P 500® Equal Weight Energy ETF tracks the S&P 500® Equal Weight Energy Index, the Guggenheim S&P 500® Equal Weight Financials ETF tracks the S&P 500® Equal Weight Financials Index, the Guggenheim S&P 500® Equal Weight Health Care ETF tracks the S&P 500® Equal Weight Health Care Index, the Guggenheim S&P 500® Equal Weight Industrials ETF tracks the S&P 500® Equal Weight Industrials Index, the Guggenheim S&P 500® Equal Weight Materials ETF tracks the S&P 500® Equal Weight Materials Index, the Guggenheim S&P 500® Equal Weight Technology ETF tracks the S&P 500® Equal Weight Information Technology Index and the Guggenheim S&P 500® Equal Weight Utilities ETF tracks the S&P 500® Equal Weight Telecommunication Services & Utilities Index. The Funds seek to achieve their objective by investing in common stocks or ETFs, where applicable, that comprise the Underlying Index. The Funds use a “replication” strategy to track the Underlying Index. “Replication” refers to investing in substantially all of the securities in the Underlying Index in approximately the same proportions as in the Underlying Index.
The Funds operate as index funds and are not actively managed. Adverse performance of a security in the Funds’ portfolio will ordinarily not result in the elimination of the security from the Funds’ portfolio.
The Funds issue and redeem shares on a continuous basis, at Net Asset Value per share (“NAV”), only in aggregation of 50,000 shares called a “Creation Unit”. Creation Units are issued and redeemed principally in-kind for securities included in the Underlying Index.
Guggenheim Investments (“GI”) provides advisory services and Rydex Distributors, LLC (“RDL”) acts as principal underwriter for the Trust. GI and RDL are affiliated entities.
2. Significant Accounting Policies
The following significant accounting policies are in conformity with U.S. generally accepted accounting principles (“U.S. GAAP”) and are consistently followed by the Trust. This requires management to make estimates and assumptions that affect the reported amount of assets and liabilities and disclosure of contingent assets and liabilities at the date of the financial statements and the reported amounts of revenues and expenses during the reporting period. Actual results could differ from these estimates. All time references are based on Eastern Time.
| GUGGENHEIM ETFS ANNUAL REPORT | 165 |
Table of Contents
| NOTES TO FINANCIAL STATEMENTS (continued) |
A. Security Valuation
Equity securities listed on an exchange (New York Stock Exchange (“NYSE”) or American Stock Exchange) are valued at the last quoted sales price as of the close of business on the NYSE, usually 4:00 p.m. on the valuation date. Equity securities listed on the NASDAQ market system are valued at the NASDAQ Official Closing Price on the valuation date. The Funds invest in money market mutual funds, which are valued at their NAV.
Investments for which market quotations are not readily available are fair valued as determined in good faith by GI under the direction of the Board of Trustees using methods established or ratified by the Board of Trustees. These methods include, but are not limited to: (i) using general information as to how these securities and assets trade; and (ii) using other information and considerations, including current values in related markets.
If events occur after the close of a foreign exchange that will affect the value of a Fund’s portfolio securities before the time as of which the NAV is calculated (a “significant event”), the security will generally be priced using a fair value procedure. If the Valuation Committee determines a significant event has occurred, it will evaluate the impact of that event on an affected security or securities, to determine whether a fair value adjustment would materially affect the Funds’ NAV. Some of the factors which may be considered by the Board of Trustees in determining fair value are fundamental analytical data relating to the investment, the nature and duration of any restrictions on disposition, trading in similar securities of the same issuer or comparable companies, information from broker-dealers, and an evaluation of the forces that influence the market in which the securities are purchased and sold.
Generally, trading in foreign securities markets is substantially completed each day at various times prior to the close of the NYSE. The values of foreign securities are determined as of the close of such foreign markets or the close of the NYSE, if earlier. All investments quoted in foreign currency are valued in U.S. dollars on the basis of the foreign currency exchange rates prevailing at the close of business. Investments in foreign securities may involve risks not present in domestic investments. The Valuation Committee will determine the current value of such foreign securities by taking into consideration certain factors which may include those discussed above, as well as the following factors, among others: the value of the securities traded on other foreign markets, ADR trading, closed-end fund trading, foreign currency exchange activity, and the trading prices of financial products that are tied to foreign securities such as World Equity Benchmark Shares. In addition, the Board of Trustees has authorized the Valuation Committee and Administrator to use prices and other information supplied by a third party pricing vendor in valuing foreign securities.
Debt securities with a maturity of greater than 60 days at acquisition are valued at prices that reflect broker/dealer supplied valuations or are obtained from independent pricing services, which may consider the trade activity, treasury yields, yield or price of bonds of comparable quality, coupon, maturity, and type, as well as prices quoted by dealers who make markets in such securities. Short-term debt securities with a maturity of 60 days or less at acquisition and repurchase agreements are valued at amortized cost, which approximates market value.
B. Security Transactions and Income Recognition
Security transactions are recorded on the trade date for financial reporting purposes. Realized gains and losses from securities transactions are recorded using the identified cost basis. Proceeds from lawsuits related to investment holdings are recorded as realized gains in the respective fund. Dividend income is recorded on the ex-dividend date, net of applicable taxes withheld by foreign countries. Taxable non-cash dividends are recorded as dividend income. Interest income, including amortization of premiums and accretion of discounts, is accrued on a daily basis. Distributions received from investments in REITs are recorded as dividend income on the ex-dividend date, subject to reclassification upon notice of the character of such distribution by the issuer.
C. Repurchase Agreements
The Funds may enter into repurchase agreements with financial institutions. In a repurchase agreement, a Fund buys a security and the seller simultaneously agrees to repurchase the security on a specified future date at an agreed-upon price. The repurchase price reflects an agreed-upon interest rate during the time the Fund’s money is invested in the security. Because the security constitutes collateral for the repurchase obligation, a repurchase agreement can be considered a collateralized loan. The Funds follow certain procedures designed to minimize the risks inherent in such agreements. These procedures include effecting repurchase transactions only with large, well-capitalized and well-established financial institutions whose condition will be continually monitored by GI. In addition, the value of the collateral underlying the repurchase agreement will always be at least equal to the repurchase price, including any accrued interest earned on the repurchase agreement. In the event of a default or bankruptcy by a selling financial institution, the Funds will seek to liquidate such collateral. However, the exercising of the Funds right to liquidate such collateral could involve certain costs or delays and, to the extent that proceeds from any sale upon a default of the obligation to repurchase were less than the repurchase price, the Funds could suffer a loss. It is the current policy of the Funds not to invest in repurchase agreements that do not mature within seven days if any such investment, together with any other illiquid assets held by the Funds, amounts to more than 15% of a Funds net assets. The investments of the Funds in repurchase agreements, at times,
| 166 | GUGGENHEIM ETFS ANNUAL REPORT |
Table of Contents
NOTES TO FINANCIAL STATEMENTS (continued)
|
may be substantial when, in the view of GI, liquidity or other considerations so warrant.
D. Foreign Currency Transactions
The accounting records of the Funds are maintained in U.S. dollars. All assets and liabilities initially expressed in foreign currencies are converted into U.S. dollars at prevailing exchange rates. Purchases and sales of investment securities, dividend and interest income, and certain expenses are translated at the rates of exchange prevailing on the respective dates of such transactions. Changes in the relationship of these foreign currencies to the U.S. dollar can significantly affect the value of the investments and earnings of the Funds. Foreign investments may also subject the Fund to foreign government exchange restrictions, expropriation, taxation or other political, social or economic developments, all of which could affect the market and/or credit risk of the investments.
The Funds do not isolate that portion of the results of operations resulting from changes in the foreign exchange rates on investments from the fluctuations arising from changes in the market prices of securities held. Such fluctuations are included with the net realized and unrealized gain or loss on investments.
Net realized foreign exchange gains or losses arise from the difference between asset and liability amounts initially stated in foreign currencies and the U.S. dollar value of the amounts actually received or paid. Net unrealized foreign exchange gains or losses arise from changes in the value of portfolio securities and other assets and liabilities at the end of the reporting period, resulting from changes in the exchange rates.
E. Federal Income Taxes
The Funds intend to comply with the provisions of Subchapter M of the Internal Revenue Code applicable to regulated investment companies and will distribute substantially all taxable net investment income and capital gains sufficient to relieve the funds from all, or substantially all, federal income, excise and state income taxes. Therefore, no provision for Federal or state income tax is required.
Tax positions taken or expected to be taken in the course of preparing the Funds’ tax returns are evaluated to determine whether the tax positions are “more-likely-than-not” of being sustained by the applicable tax authority. Tax positions not deemed to meet the more-likely-than-not threshold would be recorded as a tax benefit or expense in the current year. Management has analyzed the Funds’ tax positions taken on Federal income tax returns for all open tax years (fiscal years 2009 – 2012), and has concluded that no provision for income tax was required in the Funds’ financial statements.
Income and capital gain distributions are determined in accordance with Federal income tax regulations, which may differ from U.S. GAAP. These differences are primarily due to differing treatments for in-kind redemptions, income reclassifications from REITs and losses deferred due to wash sales.
The RIC Modernization Act of 2010 was signed into law on December 22, 2010 and sought to simplify some of the tax provisions applicable to regulated investment companies and the tax reporting to their shareholders, and to improve the tax efficiency of certain fund structures. The changes were generally effective for taxable years beginning after the date of enactment.
One of the more prominent changes addresses capital loss carryforwards. Funds are permitted to carry forward capital losses incurred in taxable years beginning after December 22, 2010 for an unlimited period. However, any losses incurred during those future taxable years will be required to be utilized prior to the losses incurred in pre-enactment taxable years. Under pre-enactment law, capital losses could be carried forward for eight years, and carried forward as short-term capital, irrespective of the character of the original loss. As a result of this ordering rule, pre-enactment capital loss carryforwards may potentially expire unused. Additionally, post-enactment capital losses that are carried forward will retain their character as either short-term or long-term capital losses rather than being considered all short-term as under previous law.
| GUGGENHEIM ETFS ANNUAL REPORT | 167 |
Table of Contents
NOTES TO FINANCIAL STATEMENTS (continued)
|
In order to present paid-in-capital, undistributed net investment income (loss) and accumulated net realized gain (loss) on investments on the statement of assets and liabilities that more closely represent their tax character, certain adjustments have been made to these accounts. These adjustments have no effect on net assets or NAV. The most significant of these adjustments are for net capital gains resulting from in-kind redemptions, because they are non-taxable to the Funds, and therefore are not distributed to existing Fund shareholders, or net capital losses resulting from in-kind redemptions which are classified to paid-in-capital. For the year ended October 31, 2012, the adjustments for the Funds were as follows:
Paid-In Capital | Undistributed Net Investment Income (Loss) | Accumulated Net Realized Gain (Loss) | ||||||||||
Guggenheim S&P MidCap 400® Equal Weight ETF | $ | 155,364 | $ | (1,800 | ) | $ | (153,564 | ) | ||||
Guggenheim S&P SmallCap 600® Equal Weight ETF | 821,150 | 417 | (821,567 | ) | ||||||||
Guggenheim Russell MidCap® Equal Weight ETF | 2,237,813 | (17,642 | ) | (2,220,171 | ) | |||||||
Guggenheim Russell 1000® Equal Weight ETF | 1,001,254 | (9,665 | ) | (991,589 | ) | |||||||
Guggenheim Russell 2000® Equal Weight ETF | 1,392,629 | 2,180 | (1,394,809 | ) | ||||||||
Guggenheim MSCI EAFE Equal Weight ETF | 21,705 | (16,159 | ) | (5,546 | ) | |||||||
Guggenheim MSCI Emerging Markets Equal Weight ETF | (585,801 | ) | (5,529 | ) | 591,330 | |||||||
Guggenheim S&P 500® Equal Weight Consumer Discretionary ETF | 6,965,849 | — | (6,965,849 | ) | ||||||||
Guggenheim S&P 500® Equal Weight Consumer Staples ETF | 8,158,264 | — | (8,158,264 | ) | ||||||||
Guggenheim S&P 500® Equal Weight Energy ETF | (1,220,273 | ) | — | 1,220,273 | ||||||||
Guggenheim S&P 500® Equal Weight Financials ETF | 470,832 | 64,134 | (534,966 | ) | ||||||||
Guggenheim S&P 500® Equal Weight Health Care ETF | 8,211,319 | — | (8,211,319 | ) | ||||||||
Guggenheim S&P 500® Equal Weight Industrials ETF | 2,296,405 | (6,168 | ) | (2,290,237 | ) | |||||||
Guggenheim S&P 500® Equal Weight Materials ETF | 1,299,036 | (25,221 | ) | (1,273,815 | ) | |||||||
Guggenheim S&P 500® Equal Weight Technology ETF | 17,029,231 | (23,597 | ) | (17,005,634 | ) | |||||||
Guggenheim S&P 500® Equal Weight Utilities ETF | 2,802,202 | (56,765 | ) | (2,745,437 | ) | |||||||
Tax basis capital losses in excess of capital gains are carried forward to offset future net capital gains. For the year ended October 31, 2012, the following capital loss carryforward amounts expired or were used to offset current year net realized capital gains:
Guggenheim S&P MidCap 400® Equal Weight ETF | $ | 8,840 | ||
Guggenheim S&P SmallCap 600® Equal Weight ETF | 2,011 | |||
Guggenheim Russell MidCap® Equal Weight ETF | — | |||
Guggenheim Russell 1000® Equal Weight ETF | — | |||
Guggenheim Russell 2000® Equal Weight ETF | — | |||
Guggenheim MSCI EAFE Equal Weight ETF | — | |||
Guggenheim MSCI Emerging Markets Equal Weight ETF | — | |||
Guggenheim S&P 500® Equal Weight Consumer Discretionary ETF | — | |||
Guggenheim S&P 500® Equal Weight Consumer Staples ETF | — | |||
Guggenheim S&P 500® Equal Weight Energy ETF | — | |||
Guggenheim S&P 500® Equal Weight Financials ETF | — | |||
Guggenheim S&P 500® Equal Weight Health Care ETF | — | |||
Guggenheim S&P 500® Equal Weight Industrials ETF | — | |||
Guggenheim S&P 500® Equal Weight Materials ETF | — | |||
Guggenheim S&P 500® Equal Weight Technology ETF | — | |||
Guggenheim S&P 500® Equal Weight Utilities ETF | 470,178 |
| 168 | GUGGENHEIM ETFS ANNUAL REPORT |
Table of Contents
| NOTES TO FINANCIAL STATEMENTS (continued) |
The tax character of distributable earnings (accumulated losses) at October 31, 2012 was as follows:
| Undistributed Ordinary Income | Undistributed Long Term Capital Gain | Capital Loss Carryfoward | Unrealized Appreciation (Depreciation) | |||||||||||||
Guggenheim S&P MidCap 400® Equal Weight ETF | $ | 314 | $ | — | $ | — | $ | (15,004 | ) | |||||||
Guggenheim S&P SmallCap 600® Equal Weight ETF | — | — | — | (65,662 | ) | |||||||||||
Guggenheim Russell MidCap® Equal Weight ETF | 48,015 | — | (743,175 | ) | 1,705,569 | |||||||||||
Guggenheim Russell 1000® Equal Weight ETF | 40,861 | — | (557,721 | ) | 782,436 | |||||||||||
Guggenheim Russell 2000® Equal Weight ETF | 22,412 | — | (1,251,319 | ) | (650,207 | ) | ||||||||||
Guggenheim MSCI EAFE Equal Weight ETF | 59,762 | — | (692,945 | ) | (1,229,529 | ) | ||||||||||
Guggenheim MSCI Emerging Markets Equal Weight ETF | — | — | (1,059,097 | ) | (1,863,175 | ) | ||||||||||
Guggenheim S&P 500® Equal Weight Consumer Discretionary ETF | 13,782 | — | (3,086,530 | ) | �� | 245,914 | ||||||||||
Guggenheim S&P 500® Equal Weight Consumer Staples ETF | 67,418 | — | (745,840 | ) | (1,495,450 | ) | ||||||||||
Guggenheim S&P 500® Equal Weight Energy ETF | 21,763 | — | (3,825,648 | ) | (4,063,442 | ) | ||||||||||
Guggenheim S&P 500® Equal Weight Financials ETF | — | — | (6,724,408 | ) | 519,715 | |||||||||||
Guggenheim S&P 500® Equal Weight Health Care ETF | 67,544 | — | (5,007,804 | ) | (1,667,700 | ) | ||||||||||
Guggenheim S&P 500® Equal Weight Industrials ETF | 49,373 | — | (1,207,250 | ) | (669,334 | ) | ||||||||||
Guggenheim S&P 500® Equal Weight Materials ETF | 9,241 | — | (882,006 | ) | 4,061,049 | |||||||||||
Guggenheim S&P 500® Equal Weight Technology ETF | 52,623 | — | (9,001,603 | ) | (15,446,745 | ) | ||||||||||
Guggenheim S&P 500® Equal Weight Utilities ETF | 53,335 | — | (379,253 | ) | 3,191,640 | |||||||||||
A summary of the expiration of capital loss carryforward is as follows:
| Unlimited | ||||||||||||||||||||||||
| 2016 | 2017 | 2018 | 2019 | Short | Long Term | |||||||||||||||||||
Guggenheim S&P MidCap 400® Equal Weight ETF | $ | — | $ | — | $ | — | $ | — | $ | — | $ | — | ||||||||||||
Guggenheim S&P SmallCap 600® Equal Weight ETF | — | — | — | — | — | — | ||||||||||||||||||
Guggenheim Russell MidCap® Equal Weight ETF | — | — | — | 201,788 | 85,132 | 456,255 | ||||||||||||||||||
Guggenheim Russell 1000® Equal Weight ETF | — | — | — | 312 | 203,035 | 354,374 | ||||||||||||||||||
Guggenheim Russell 2000® Equal Weight ETF | — | — | — | 259,648 | 595,748 | 395,923 | ||||||||||||||||||
Guggenheim MSCI EAFE Equal Weight ETF | — | — | — | — | 398,198 | 294,747 | ||||||||||||||||||
Guggenheim MSCI Emerging Markets Equal Weight ETF | — | — | — | 18,800 | 701,371 | 338,926 | ||||||||||||||||||
Guggenheim S&P 500® Equal Weight Consumer Discretionary ETF | 800,018 | 1,981,333 | — | — | — | 305,179 | ||||||||||||||||||
Guggenheim S&P 500® Equal Weight Consumer Staples ETF | 32,363 | 195,890 | — | 61,000 | 82,050 | 374,537 | ||||||||||||||||||
Guggenheim S&P 500® Equal Weight Energy ETF | — | 1,743,348 | 393,314 | 128,371 | 371,070 | 1,189,545 | ||||||||||||||||||
Guggenheim S&P 500® Equal Weight Financials ETF | 1,772,479 | 4,062,086 | 376,840 | — | 113,885 | 399,118 | ||||||||||||||||||
Guggenheim S&P 500® Equal Weight Health Care ETF | 929,808 | 3,545,994 | — | 66,030 | 75,831 | 390,141 | ||||||||||||||||||
Guggenheim S&P 500® Equal Weight Industrials ETF | — | 1,121,641 | — | — | — | 85,609 | ||||||||||||||||||
Guggenheim S&P 500® Equal Weight Materials ETF | — | 576,552 | — | — | — | 305,454 | ||||||||||||||||||
Guggenheim S&P 500® Equal Weight Technology ETF | — | 2,331,453 | — | — | 2,723,942 | 3,946,208 | ||||||||||||||||||
Guggenheim S&P 500® Equal Weight Utilities ETF | — | 45,644 | 333,609 | — | — | — | ||||||||||||||||||
The tax character of distributions paid during the year ended October 31, 2012 was as follows:
| Ordinary Income | Return of Capital | |||||||
Guggenheim S&P MidCap 400® Equal Weight ETF | $ | 32,938 | $ | — | ||||
Guggenheim S&P SmallCap 600® Equal Weight ETF | 48,916 | — | ||||||
Guggenheim Russell MidCap® Equal Weight ETF | 712,539 | — | ||||||
Guggenheim Russell 1000® Equal Weight ETF | 553,925 | — | ||||||
Guggenheim Russell 2000® Equal Weight ETF | 198,196 | — | ||||||
Guggenheim MSCI EAFE Equal Weight ETF | 267,803 | — | ||||||
Guggenheim MSCI Emerging Markets Equal Weight ETF | 192,786 | 23,454 | ||||||
Guggenheim S&P 500® Equal Weight Consumer Discretionary ETF | 540,416 | — | ||||||
Guggenheim S&P 500® Equal Weight Consumer Staples ETF | 802,431 | — | ||||||
Guggenheim S&P 500® Equal Weight Energy ETF | 257,933 | — | ||||||
Guggenheim S&P 500® Equal Weight Financials ETF | 224,168 | 51,231 | ||||||
Guggenheim S&P 500® Equal Weight Health Care ETF | 449,910 | — | ||||||
Guggenheim S&P 500® Equal Weight Industrials ETF | 419,866 | — | ||||||
Guggenheim S&P 500® Equal Weight Materials ETF | 529,218 | — | ||||||
Guggenheim S&P 500® Equal Weight Technology ETF | 851,718 | — | ||||||
Guggenheim S&P 500® Equal Weight Utilities ETF | 1,512,371 | — | ||||||
| GUGGENHEIM ETFS ANNUAL REPORT | 169 |
Table of Contents
NOTES TO FINANCIAL STATEMENTS (continued)
|
The tax character of distributions paid during the year ended October 31, 2011 was as follows:
| Ordinary Income | Return of Capital | |||||||
Guggenheim S&P MidCap 400® Equal Weight ETF | $ | 5,601 | $ | — | ||||
Guggenheim S&P SmallCap 600® Equal Weight ETF | 6,163 | — | ||||||
Guggenheim Russell MidCap® Equal Weight ETF | 168,415 | — | ||||||
Guggenheim Russell 1000® Equal Weight ETF | 165,561 | — | ||||||
Guggenheim Russell 2000® Equal Weight ETF | 82,186 | — | ||||||
Guggenheim MSCI EAFE Equal Weight ETF | 491,348 | — | ||||||
Guggenheim MSCI Emerging Markets Equal Weight ETF | 160,394 | 155,130 | ||||||
Guggenheim MSCI ACWI Equal Weight ETF | 83,619 | — | ||||||
Guggenheim S&P 500® Equal Weight Consumer Discretionary ETF | 291,636 | — | ||||||
Guggenheim S&P 500® Equal Weight Consumer Staples ETF | 404,016 | — | ||||||
Guggenheim S&P 500® Equal Weight Energy ETF | 267,926 | — | ||||||
Guggenheim S&P 500® Equal Weight Financials ETF | 292,247 | — | ||||||
Guggenheim S&P 500® Equal Weight Health Care ETF | 230,946 | — | ||||||
Guggenheim S&P 500® Equal Weight Industrials ETF | 609,503 | — | ||||||
Guggenheim S&P 500® Equal Weight Materials ETF | 560,979 | — | ||||||
Guggenheim S&P 500® Equal Weight Technology ETF | 622,234 | — | ||||||
Guggenheim S&P 500® Equal Weight Utilities ETF | 868,554 | — | ||||||
At October 31, 2012, the identified cost of investments in securities owned by each Fund for Federal income tax purposes and the gross unrealized appreciation and depreciation were as follows:
| Identified Cost | Gross Unrealized Appreciation | Gross Unrealized Depreciation | Net Unrealized Appreciation (Depreciation) | |||||||||||||
Guggenheim S&P MidCap 400® Equal Weight ETF | $ | 3,150,616 | $ | 229,280 | $ | (244,284 | ) | $ | (15,004 | ) | ||||||
Guggenheim S&P SmallCap 600® Equal Weight ETF | 1,647,814 | 174,487 | (240,148 | ) | (65,661 | ) | ||||||||||
Guggenheim Russell MidCap® Equal Weight ETF | 50,884,469 | 5,491,767 | (3,786,199 | ) | 1,705,568 | |||||||||||
Guggenheim Russell 1000® Equal Weight ETF | 38,205,689 | 3,588,895 | (2,806,459 | ) | 782,436 | |||||||||||
Guggenheim Russell 2000® Equal Weight ETF | 14,964,272 | 1,521,813 | (2,172,020 | ) | (650,207 | ) | ||||||||||
Guggenheim MSCI EAFE Equal Weight ETF | 12,238,103 | 729,528 | (1,957,616 | ) | (1,228,088 | ) | ||||||||||
Guggenheim MSCI Emerging Markets Equal Weight ETF | 15,199,032 | 879,431 | (2,731,844 | ) | (1,852,413 | ) | ||||||||||
Guggenheim S&P 500® Equal Weight Consumer Discretionary ETF | 41,062,272 | 3,419,208 | (3,173,294 | ) | 245,914 | |||||||||||
Guggenheim S&P 500® Equal Weight Consumer Staples ETF | 42,400,659 | 224,951 | (1,720,401 | ) | (1,495,450 | ) | ||||||||||
Guggenheim S&P 500® Equal Weight Energy ETF | 36,045,697 | 1,772,075 | (5,835,517 | ) | (4,063,442 | ) | ||||||||||
Guggenheim S&P 500® Equal Weight Financials ETF | 13,899,737 | 1,501,659 | (981,944 | ) | 519,715 | |||||||||||
Guggenheim S&P 500® Equal Weight Health Care ETF | 40,078,627 | 479,773 | (2,147,472 | ) | (1,667,699 | ) | ||||||||||
Guggenheim S&P 500® Equal Weight Industrials ETF | 17,704,349 | 727,361 | (1,396,695 | ) | (669,334 | ) | ||||||||||
Guggenheim S&P 500® Equal Weight Materials ETF | 29,305,474 | 6,838,783 | (2,777,734 | ) | 4,061,049 | |||||||||||
Guggenheim S&P 500® Equal Weight Technology ETF | 115,914,783 | 2,301,292 | (17,748,037 | ) | (15,446,745 | ) | ||||||||||
Guggenheim S&P 500® Equal Weight Utilities ETF | 39,119,998 | 3,901,143 | (709,503 | ) | 3,191,640 | |||||||||||
F. Fair Value Measurement
In accordance with U.S. GAAP, fair value is defined as the price that the Fund would receive to sell an investment or pay to transfer a liability in an orderly transaction with an independent buyer in the principal market, or, in the absence of a principal market, the most advantageous market for the investment or liability. A three-tier hierarchy is utilized to distinguish between (1) inputs that reflect the assumptions market participants would use in pricing an asset or liability developed based on market data obtained from sources independent of the reporting entity (observable inputs) and (2) inputs that reflect the reporting entity’s own assumptions about the assumptions market participants would use in pricing an asset or liability developed based on the best information available in the circumstances (unobservable inputs) and to establish classification of fair value measurements for disclosure purposes. Various inputs are used in determining the value of the Funds’ investments. The inputs are summarized in the three broad levels listed below:
| Level 1 — | quoted prices in active markets for identical securities. |
| Level 2 — | other significant observable inputs (including quoted prices for similar securities, interest rates, prepayment speeds, credit risk, etc.). |
| Level 3 — | significant unobservable inputs (including the fund’s own assumptions used to determine the fair value of investments). |
The inputs or methodologies used for valuing securities are not necessarily an indication of the risk associated with investing in those securities.
| 170 | GUGGENHEIM ETFS ANNUAL REPORT |
Table of Contents
| NOTES TO FINANCIAL STATEMENTS (continued) |
The following table summarizes the inputs used to value the Funds’ net assets as of October 31, 2012:
| Fund | Level 1 Investments in Securities | Level 2 Investments in Securities | Level 3 Investments in Securities | Total | ||||||||||||
Guggenheim S&P MidCap 400® Equal Weight ETF | $ | 3,135,612 | $ | 16,323 | $ | — | $ | 3,151,935 | ||||||||
Guggenheim S&P SmallCap 600® Equal Weight ETF | 1,582,153 | 1,380 | — | 1,583,533 | ||||||||||||
Guggenheim Russell MidCap® Equal Weight ETF | 52,590,037 | 1,392,665 | — | 53,982,702 | ||||||||||||
Guggenheim Russell 1000® Equal Weight ETF | 38,988,125 | 816,113 | — | 39,804,238 | ||||||||||||
Guggenheim Russell 2000® Equal Weight ETF | 14,314,065 | 320,558 | — | 14,634,623 | ||||||||||||
Guggenheim MSCI EAFE Equal Weight ETF | 11,010,015 | 42,870 | — | 11,052,885 | ||||||||||||
Guggenheim MSCI Emerging Markets Equal Weight ETF | 13,321,113 | 25,506 | — | 13,346,619 | ||||||||||||
Guggenheim S&P 500® Equal Weight Consumer Discretionary ETF | 41,308,186 | 1,796,182 | — | 43,104,368 | ||||||||||||
Guggenheim S&P 500® Equal Weight Consumer Staples ETF | 40,905,209 | 889,413 | — | 41,794,622 | ||||||||||||
Guggenheim S&P 500® Equal Weight Energy ETF | 31,982,255 | — | — | 31,982,255 | ||||||||||||
Guggenheim S&P 500® Equal Weight Financials ETF | 14,333,932 | 85,520 | — | 14,419,452 | ||||||||||||
Guggenheim S&P 500® Equal Weight Health Care ETF | 38,410,927 | — | — | 38,410,927 | ||||||||||||
Guggenheim S&P 500® Equal Weight Industrials ETF | 17,035,015 | 387,918 | — | 17,422,933 | ||||||||||||
Guggenheim S&P 500® Equal Weight Materials ETF | 33,366,523 | 550,406 | — | 33,916,929 | ||||||||||||
Guggenheim S&P 500® Equal Weight Technology ETF | 100,468,038 | 3,540,011 | — | 104,008,049 | ||||||||||||
Guggenheim S&P 500® Equal Weight Utilities ETF | 42,311,638 | 1,074,257 | — | 43,385,895 | ||||||||||||
For the year ended October 31, 2012, there were no Level 3 investments or transfers between levels.
G. Dividends and Distributions
Distributions of net investment income and net realized gains, if any, in all the Funds, are declared and paid at least annually. Distributions are recorded on the ex-dividend date and are determined in accordance with income tax regulations which may differ from U.S. GAAP.
H. Risk and Uncertainties
The Funds invest in various investments which are exposed to risk, such as market risk. Due to the level of risk associated with certain investments it is at least reasonably possible that changes in the values of investment securities will occur in the near term and that such changes could materially affect amounts reported in the financial statements. The Guggenheim S&P 500 Equal Weight ETFs are non-diversified funds, subjecting them to a greater risk than funds that are diversified.
Throughout the normal course of business, the Funds enter into contracts that contain a variety of representations and warranties which provide general indemnifications. The Funds’ maximum exposure under these arrangements is unknown, as this would involve future claims that may be made against the Funds and/or their affiliates that have not yet occurred. However, based on experience the Funds expect the risk of loss to be remote.
I. Portfolio Securities Loaned
The Funds may lend their securities to approved brokers to earn additional income. Security lending income shown on the statement of operations is shown net of rebates paid to the borrowers and earnings on cash collateral investments shared with the lending agent. Within this arrangement, the Funds act as the lender, Credit Suisse acts as the lending agent, and other approved registered broker dealers act as the borrowers. The Funds receive cash collateral, valued at 102% of the value of the securities on loan. Under the terms of the Funds’ securities lending agreement with Credit Suisse, cash collateral is invested in one or more joint repurchase agreements collateralized by obligations of the U.S. Treasury or Government Agencies. The Funds bear the risk of loss on cash collateral investments. Collateral is maintained over the life of the loan in an amount not less than the value of loaned securities, as determined at the close of fund business each day; any additional collateral required due to changes in security values is delivered to the funds the next business day. Although the collateral mitigates the risk, the Funds could experience a delay in recovering its securities and a possible loss of income or value if the borrower fails to return the securities. The Funds have the right under the securities lending agreement to recover the securities from the borrower on demand.
| GUGGENHEIM ETFS ANNUAL REPORT | 171 |
Table of Contents
NOTES TO FINANCIAL STATEMENTS (continued)
|
At October 31, 2012, the Funds participated in securities lending as follows:
| Value of Securities Loaned | Cash Collateral Received | |||||||
Guggenheim S&P MidCap 400® Equal Weight ETF | $ | 15,445 | $ | 16,323 | ||||
Guggenheim S&P SmallCap 600® Equal Weight ETF | 1,271 | 1,380 | ||||||
Guggenheim Russell MidCap Equal Weight ETF | 1,335,014 | 1,392,665 | ||||||
Guggenheim Russell 1000® Equal Weight ETF | 781,900 | 816,113 | ||||||
Guggenheim Russell 2000® Equal Weight ETF | 296,662 | 320,558 | ||||||
Guggenheim MSCI EAFE Equal Weight ETF | 40,479 | 42,870 | ||||||
Guggenheim MSCI Emerging Markets Equal Weight ETF | 23,264 | 25,506 | ||||||
Guggenheim S&P 500® Equal Weight Consumer Discretionary ETF | 1,756,343 | 1,796,182 | ||||||
Guggenheim S&P 500® Equal Weight Consumer Staples ETF | 869,610 | 889,413 | ||||||
Guggenheim S&P 500® Equal Weight Energy ETF | — | — | ||||||
Guggenheim S&P 500® Equal Weight Financials ETF | 83,714 | 85,520 | ||||||
Guggenheim S&P 500® Equal Weight Health Care ETF | — | — | ||||||
Guggenheim S&P 500® Equal Weight Industrials ETF | 376,486 | 387,918 | ||||||
Guggenheim S&P 500® Equal Weight Materials ETF | 535,095 | 550,406 | ||||||
Guggenheim S&P 500® Equal Weight Technology ETF | 3,249,683 | 3,540,011 | ||||||
Guggenheim S&P 500® Equal Weight Utilities ETF | 1,027,098 | 1,074,257 | ||||||
The following represents a breakdown of the collateral for the joint repurchase agreements at October 31, 2012:
| Counterparty and Terms of Agreement | Face Value | Repurchase Price | Collateral | Par Value | Fair Value | |||||||||||||
Merrill Lynch, Pierce, Fenner & Smith, Inc. | $ | 40,000,000 | $ | 40,000,311 | US Treasury 0.625% 04/15/13 | $ | 37,278,800 | $ | 40,788,895 | |||||||||
RBS Securities, Inc. | 68,010,000 | 68,012,041 | Fannie Mae Note 5.375% 07/15/16 | 58,330,000 | 69,372,283 | |||||||||||||
3. Advisory, Administration and Other Transactions with Affiliates
GI determines the composition of the portfolio of securities that must be delivered in exchange for the issuance of Creation Units and periodically adjusts the composition of the portfolio of the Funds to conform to changes in the composition of the relevant index. For these services, GI receives a management fee at the annual rate shown below as a percentage of the average daily net assets of the Funds.
| Advisory Fee | ||||
Guggenheim S&P MidCap 400® Equal Weight ETF | 0.40 | % | ||
Guggenheim S&P SmallCap 600® Equal Weight ETF | 0.40 | % | ||
Guggenheim Russell MidCap® Equal Weight ETF | 0.40 | % | ||
Guggenheim Russell 1000® Equal Weight ETF | 0.40 | % | ||
Guggenheim Russell 2000® Equal Weight ETF | 0.40 | % | ||
Guggenheim MSCI EAFE Equal Weight ETF | 0.55 | % | ||
Guggenheim MSCI Emerging Markets Equal Weight ETF | 0.70 | % | ||
Guggenheim S&P 500® Equal Weight Consumer Discretionary ETF | 0.50 | % | ||
Guggenheim S&P 500® Equal Weight Consumer Staples ETF | 0.50 | % | ||
Guggenheim S&P 500® Equal Weight Energy ETF | 0.50 | % | ||
Guggenheim S&P 500® Equal Weight Financials ETF | 0.50 | % | ||
Guggenheim S&P 500® Equal Weight Health Care ETF | 0.50 | % | ||
Guggenheim S&P 500® Equal Weight Industrials ETF | 0.50 | % | ||
Guggenheim S&P 500® Equal Weight Materials ETF | 0.50 | % | ||
Guggenheim S&P 500® Equal Weight Technology ETF | 0.50 | % | ||
Guggenheim S&P 500® Equal Weight Utilities ETF | 0.50 | % | ||
GI pays all expenses of the Funds, including the cost of transfer agency, custody, fund administration, legal, audit and other services, except: interest, taxes, distribution fees or expenses, Trustee Fees (where applicable) and extraordinary expenses.
For the Guggenheim MSCI Emerging Markets Equal Weight ETF, the Advisor has contractually agreed to reduce fees and/or reimburse expenses to the extent necessary to keep the Fund’s net operating expenses (excluding interest, taxes, brokerage commissions, dividends on securities sold short, distribution fees and expenses, and extraordinary expenses (“Excluded Expenses”))
| 172 | GUGGENHEIM ETFS ANNUAL REPORT |
Table of Contents
NOTES TO FINANCIAL STATEMENTS (continued)
|
plus Acquired Fund Fees and Expense borne indirectly from exceeding 0.70% of the Fund’s average daily net assets until February 28, 2013. This agreement may be terminated only with the approval of the Fund’s Board of Trustees. In any event, this undertaking will continue until at least February 28, 2013.
Under an Administration Agreement, State Street Bank and Trust Company (the “Administrator”) provides various administrative and accounting services for the maintenance and operations of the Funds. Under a Custodian Agreement with the Trust, the Administrator maintains cash, securities and other assets of the Funds in separate accounts for each Fund, keeps all necessary accounts and records, and provides other services. The Administrator is required, upon the order of the Trust, to deliver securities held by the Custodian and to make payments for securities purchased by the Trust for the Funds. Pursuant to a Transfer Agency and Service Agreement with the Trust, the Administrator acts as a transfer agent for the Trust’s authorized and issued shares of beneficial interest, and as dividend disbursing agent of the Trust. GI compensates the Administrator directly for the foregoing services.
The Funds have adopted a Distribution Plan (the “Plan”) that allows the Funds to pay distribution fees to RDL and other firms that provide distribution services (“Service Providers”). If a Service Provider provides distribution services, the Funds will pay distribution fees to RDL at an annual rate not to exceed 0.25% of average daily net assets, pursuant to Rule 12b-1 of the 1940 Act. RDL will, in turn, pay the Service Provider out of its fees. No such fee is currently charged to the Funds.
4. Capital
At October 31, 2012, there were an unlimited number of no par value shares of beneficial interest authorized. There is a minimum transaction fee per transaction to those persons purchasing or redeeming Creation Units. An additional charge of up to three times the standard transaction fee may be imposed for purchases and redemptions effected outside the National Securities Clearing Corporation usual clearing process or for cash. Such transactions are generally permitted on an in-kind basis, with a balancing cash component to equate the transaction to the NAV of the Fund on the transaction date. Transaction fees are not charged to or paid by the Funds. The minimum transaction fees are:
| Minimum Transaction Fee | ||||
Guggenheim S&P MidCap 400® Equal Weight ETF | $ | 1,250 | ||
Guggenheim S&P SmallCap 600® Equal Weight ETF | 2,000 | |||
Guggenheim Russell MidCap® Equal Weight ETF | 2,000 | |||
Guggenheim Russell 1000® Equal Weight ETF | 2,500 | |||
Guggenheim Russell 2000® Equal Weight ETF | 3,000 | |||
Guggenheim MSCI EAFE Equal Weight ETF | 12,000 | |||
Guggenheim MSCI Emerging Markets Equal Weight ETF | 6,000 | |||
Guggenheim S&P 500® Equal Weight Consumer Discretionary ETF | 750 | |||
Guggenheim S&P 500® Equal Weight Consumer Staples ETF | 500 | |||
Guggenheim S&P 500® Equal Weight Energy ETF | 500 | |||
Guggenheim S&P 500® Equal Weight Financials ETF | 750 | |||
Guggenheim S&P 500® Equal Weight Health Care ETF | 500 | |||
Guggenheim S&P 500® Equal Weight Industrials ETF | 500 | |||
Guggenheim S&P 500® Equal Weight Materials ETF | 500 | |||
Guggenheim S&P 500® Equal Weight Technology ETF | 750 | |||
Guggenheim S&P 500® Equal Weight Utilities ETF | 500 | |||
5. Investment Transactions
For the year ended October 31, 2012, the Funds had investment transactions in-kind associated with subscriptions and redemptions as follows:
| Subscriptions | Redemptions | |||||||
Guggenheim S&P MidCap 400® Equal Weight ETF | $ | 1,580,410 | $ | 1,562,063 | ||||
Guggenheim S&P SmallCap 600® Equal Weight ETF | — | 4,799,130 | ||||||
Guggenheim Russell MidCap® Equal Weight ETF | 12,998,441 | 18,646,373 | ||||||
Guggenheim Russell 1000® Equal Weight ETF | 11,199,153 | 9,256,312 | ||||||
Guggenheim Russell 2000® Equal Weight ETF | — | 10,583,713.37 | ||||||
Guggenheim MSCI EAFE Equal Weight ETF | — | — | ||||||
Guggenheim MSCI Emerging Markets Equal Weight ETF | 2,065,052 | 3,937,244 | ||||||
Guggenheim S&P 500® Equal Weight Consumer Discretionary ETF | 56,024,776 | 41,990,845 | ||||||
Guggenheim S&P 500® Equal Weight Consumer Staples ETF | 74,567,081 | 68,194,655 | ||||||
Guggenheim S&P 500® Equal Weight Energy ETF | 6,197,147 | 8,495,001 | ||||||
Guggenheim S&P 500® Equal Weight Financials ETF | — | 5,051,813 | ||||||
| GUGGENHEIM ETFS ANNUAL REPORT | 173 |
Table of Contents
| NOTES TO FINANCIAL STATEMENTS (continued) |
| Subscriptions | Redemptions | |||||||
Guggenheim S&P 500® Equal Weight Health Care ETF | $ | 475,343,590 | $ | 498,598,293 | ||||
Guggenheim S&P 500® Equal Weight Industrials ETF | 30,124,739 | 30,226,210 | ||||||
Guggenheim S&P 500® Equal Weight Materials ETF | — | 5,752,353 | ||||||
Guggenheim S&P 500® Equal Weight Technology ETF | 123,713,078 | 129,177,221 | ||||||
Guggenheim S&P 500® Equal Weight Utilities ETF | 21,884,117 | 17,183,403 | ||||||
Purchases and sales of investment securities (excluding short-term investments, U.S. government and government agency obligations) for the Funds were as follows:
| Purchases | Sales | |||||||
Guggenheim S&P MidCap 400® Equal Weight ETF | $ | 722,529 | $ | 725,959 | ||||
Guggenheim S&P SmallCap 600® Equal Weight ETF | 1,326,873 | 1,285,349 | ||||||
Guggenheim Russell MidCap® Equal Weight ETF | 17,080,036 | 17,150,507 | ||||||
Guggenheim Russell 1000® Equal Weight ETF | 9,932,730 | 10,271,383 | ||||||
Guggenheim Russell 2000® Equal Weight ETF | 8,291,953 | 7,903,690 | ||||||
Guggenheim MSCI EAFE Equal Weight ETF | 2,797,585 | 2,742,792 | ||||||
Guggenheim MSCI Emerging Markets Equal Weight ETF | 5,123,775 | 6,071,993 | ||||||
Guggenheim S&P 500® Equal Weight Consumer Discretionary ETF | 10,887,676 | 11,697,774 | ||||||
Guggenheim S&P 500® Equal Weight Consumer Staples ETF | 6,841,542 | 7,382,111 | ||||||
Guggenheim S&P 500® Equal Weight Energy ETF | 9,565,422 | 9,714,082 | ||||||
Guggenheim S&P 500® Equal Weight Financials ETF | 2,478,694 | 2,609,281 | ||||||
Guggenheim S&P 500® Equal Weight Health Care ETF | 12,502,717 | 11,495,245 | ||||||
Guggenheim S&P 500® Equal Weight Industrials ETF | 4,285,278 | 4,298,180 | ||||||
Guggenheim S&P 500® Equal Weight Materials ETF | 6,985,013 | 7,197,368 | ||||||
Guggenheim S&P 500® Equal Weight Technology ETF | 31,387,800 | 30,190,589 | ||||||
Guggenheim S&P 500® Equal Weight Utilities ETF | 10,023,410 | 9,513,660 | ||||||
There were no purchases or sales of U.S. government or government agency obligations for the year ended October 31, 2012.
6. Legal Proceedings
Tribune Company
Rydex ETF Trust has been named as a defendant and a putative member of the proposed defendant class of shareholders in the case entitled Official Committee of Unsecured Creditors of Tribune Co. v. FitzSimons (In re Tribune Co.), No. 12-2652 (S.D.N.Y.) (formerly Adv. Pro. No. 10-54010 (Bankr. D. Del.)) (the “FitzSimons action”), as a result of ownership of shares in the Tribune Company (“Tribune”) in 2007 by certain series of the Rydex ETF Trust when Tribune effected a leveraged buyout transaction (“LBO”) by which Tribune converted to a privately-held company. In its complaint, the Unsecured Creditors Committee (the “UCC”) has alleged that, in connection with the LBO, insiders and major shareholders received proceeds for their Tribune stock using financing that the insiders knew would, and ultimately did, leave the Tribune insolvent. The UCC has asserted claims against certain insiders, major shareholders, professional advisers, and others involved in the LBO, and is attempting to obtain from these individuals and entities the proceeds paid out in connection with the LBO.
In June 2011, a group of Tribune creditors, not including the UCC, filed multiple actions involving state law constructive fraudulent conveyance claims against former Tribune shareholders (the “SCLFC actions”). Rydex ETF Trust has been named as a defendant in one or more of these suits. These cases have been consolidated together with the FitzSimons action in a multidistrict litigation proceeding captioned In re Tribune Co. Fraudulent Conveyance Litig., No. 11-2296 (S.D.N.Y.) (the “MDL proceeding”).
On September 7, 2012, the Court issued a Master Case Order in the MDL proceeding. This order designated several law firms to serve as members of executive committees of defense counsel in the FitzSimons action and in the SCLFC actions. The order also established a briefing schedule for motions to dismiss in the SLCFC actions; no schedule has yet been established in the Fitzsimons action. The Court also ordered that the plaintiffs’ deadline to serve summonses and complaints is extended through January 15, 2013. Finally, the Court ordered that merits discovery will be stayed until further order of the Court.
None of these lawsuits allege any wrongdoing on the part of Rydex ETF Trust. The following series of Rydex ETF Trust held shares of Tribune and tendered these shares as part of Tribune’s LBO: Guggenheim S&P 500® Equal Weight Consumer Discretionary Fund (the “Fund”). The value of the proceeds received by the foregoing Fund was $249,481. At this stage of the proceedings, Rydex ETF Trust is not able to make a reliable predication as to the outcome of these lawsuits or the effect, if any, on the Fund’s net asset value.
| 174 | GUGGENHEIM ETFS ANNUAL REPORT |
Table of Contents
REPORT OF INDEPENDENT REGISTERED PUBLIC ACCOUNTING FIRM
| ||
The Board of Trustees and Shareholders of Rydex ETF Trust
We have audited the accompanying statements of assets and liabilities, including the schedules of investments, of Guggenheim S&P MidCap 400® Equal Weight ETF, Guggenheim S&P SmallCap 600® Equal Weight ETF, Guggenheim Russell MidCap® Equal Weight ETF, Guggenheim Russell 1000® Equal Weight ETF, Guggenheim Russell 2000® Equal Weight ETF, Guggenheim MSCI EAFE Equal Weight ETF, Guggenheim MSCI Emerging Markets Equal Weight ETF, Guggenheim S&P 500® Equal Weight Consumer Discretionary ETF, Guggenheim S&P 500® Equal Weight Consumer Staples ETF, Guggenheim S&P 500® Equal Weight Energy ETF, Guggenheim S&P 500® Equal Weight Financials ETF, Guggenheim S&P 500® Equal Weight Health Care ETF, Guggenheim S&P 500® Equal Weight Industrials ETF, Guggenheim S&P 500® Equal Weight Materials ETF, Guggenheim S&P 500® Equal Weight Technology ETF, and Guggenheim S&P 500® Equal Weight Utilities ETF (sixteen of the series constituting the Rydex ETF Trust) (the “Funds”) as of October 31, 2012, and the related statements of operations for the year then ended, and the statements of changes in net assets and the financial highlights for each of the years or periods indicated therein. These financial statements and financial highlights are the responsibility of the Funds’ management. Our responsibility is to express an opinion on these financial statements and financial highlights based on our audits.
We conducted our audits in accordance with the standards of the Public Company Accounting Oversight Board (United States). Those standards require that we plan and perform the audit to obtain reasonable assurance about whether the financial statements and financial highlights are free of material misstatement. We were not engaged to perform an audit of the Funds’ internal control over financial reporting. Our audits included consideration of internal control over financial reporting as a basis for designing audit procedures that are appropriate in the circumstances, but not for the purpose of expressing an opinion on the effectiveness of the Funds’ internal control over financial reporting. Accordingly, we express no such opinion. An audit also includes examining, on a test basis, evidence supporting the amounts and disclosures in the financial statements and financial highlights, assessing the accounting principles used and significant estimates made by management, and evaluating the overall financial statement presentation. Our procedures included confirmation of securities owned as of October 31, 2012, by correspondence with the custodian and brokers or by other appropriate auditing procedures where replies from brokers were not received. We believe that our audits provide a reasonable basis for our opinion.
In our opinion, the financial statements and financial highlights referred to above present fairly, in all material respects, the financial position of the above listed Funds at October 31, 2012, the results of their operations for the year then ended, and the changes in their net assets and their financial highlights for each of the years or periods indicated therein, in conformity with U.S. generally accepted accounting principles.

McLean, Virginia
December 21, 2012
| GUGGENHEIM ETFS ANNUAL REPORT | 175 |
Table of Contents
|
Federal Income Tax Information
For federal income tax purposes, the following information is furnished with respect to the distributions paid by the Funds during the year ended October 31, 2012:
| Dividend Received Deduction | Long Term Capital Gains Distribution | Qualified Income Distribution | ||||||||||
Guggenheim S&P MidCap 400® Equal Weight ETF | 100.00 | % | $ | — | $ | 36,763 | ||||||
Guggenheim S&P SmallCap 600® Equal Weight ETF | 100.00 | % | — | 57,715 | ||||||||
Guggenheim Russell MidCap® Equal Weight ETF | 100.00 | % | — | 865,504 | ||||||||
Guggenheim Russell 1000® Equal Weight ETF | 100.00 | % | — | 679,315 | ||||||||
Guggenheim Russell 2000® Equal Weight ETF | 100.00 | % | — | 251,163 | ||||||||
Guggenheim MSCI EAFE Equal Weight ETF | 0.04 | % | — | 320,943 | ||||||||
Guggenheim MSCI Emerging Markets Equal Weight ETF | 0.52 | % | — | 186,868 | ||||||||
Guggenheim S&P 500® Equal Weight Consumer Discretionary ETF | 100.00 | % | — | 728,953 | ||||||||
Guggenheim S&P 500® Equal Weight Consumer Staples ETF | 100.00 | % | — | 916,629 | ||||||||
Guggenheim S&P 500® Equal Weight Energy ETF | 100.00 | % | — | 418,775 | ||||||||
Guggenheim S&P 500® Equal Weight Financials ETF | 100.00 | % | — | 247,841 | ||||||||
Guggenheim S&P 500® Equal Weight Health Care ETF | 100.00 | % | — | 602,544 | ||||||||
Guggenheim S&P 500® Equal Weight Industrials ETF | 100.00 | % | — | 566,371 | ||||||||
Guggenheim S&P 500® Equal Weight Materials ETF | 100.00 | % | — | 697,822 | ||||||||
Guggenheim S&P 500® Equal Weight Technology ETF | 100.00 | % | — | 1,484,854 | ||||||||
Guggenheim S&P 500® Equal Weight Utilities ETF | 100.00 | % | — | 1,786,759 | ||||||||
Foreign Taxes Credit
Guggenheim MSCI EAFE Equal Weight ETF and Guggenheim MSCI Emerging Markets Equal Weight ETF designates $24,039 and $34,496 as foreign taxes paid respectively. Guggenheim MSCI Emerging Markets Equal Weight ETF designates $309,947 as foreign source income earned for regular Federal income tax purposes.
Proxy Voting Information
A description of the policies and procedures that the Trust uses to determine how to vote proxies relating to securities held in the Funds’ portfolios is available, without charge and upon request, by calling 1.800.820.0888. This information is also available from the EDGAR database on the SEC’s website at http://www.sec.gov.
Information regarding how the Funds voted proxies relating to portfolio securities, during the most recent 12-month period ended June 30, 2012 is available, without charge, upon request, by calling 1.800.820.0888. The information is also available from the EDGAR database on the SEC’s website at http://www.sec.gov.
Quarterly Portfolio Schedules Information
The Trust files its complete schedule of portfolio holdings with the SEC for the first and third quarters of each fiscal year on Form N-Q; which are available on the SEC’s website at http://www.sec.gov. The Funds’ Forms N-Q may be reviewed and copied at the SEC’s Public Reference Room in Washington, DC, and that information on the operation of the Public Reference Room may be obtained by calling 1-800-SEC-0330. Copies of the portfolio holdings are also available to shareholders, without charge and upon request, by calling 1.800.820.0888.
Office Locations
The offices of Guggenheim Investments can be found in the following locations:
40 East 52nd Street
16th Floor
New York, NY 10022
(Headquarters)
Four Irvington Centre
805 King Farm Boulevard
Suite 600
Rockville, MD 20850
9401 Indian Creek Parkway
40 Corporate Woods
Suite 850
Overland Park, KS 66210
Premium/Discount Information
Information about the differences between the daily market price on secondary markets for shares and the NAV of each Fund can be found at guggenheiminvestments.com.
| 176 | GUGGENHEIM ETFS ANNUAL REPORT |
Table of Contents
INFORMATION ON BOARD OF TRUSTEES AND OFFICERS (Unaudited)
|
A Board of Trustees oversees the Trust, as well as other trusts of GI, in which its members have no stated term of service, and continue to serve after election until resignation. The Statement of Additional Information includes further information about Fund Trustees and Officers, and can be obtained without charge by calling 800.820.0888.
All Trustees and Officers may be reached c/o Guggenheim Investments, 805 King Farm Boulevard, Suite 600, Rockville, MD 20850.
TRUSTEE AND OFFICER
Name and | Length of Service (Year Began) | Number of | ||||||
Donald C. Cacciapaglia* | Rydex Series Funds – 2012 | 146 | ||||||
| (1951) | Rydex Variable Trust – 2012 | |||||||
Rydex Dynamic Funds – 2012 | ||||||||
Rydex ETF Trust – 2012 | ||||||||
Principal Occupations During Past Five Years: Current: Security Investors, LLC: President and CEO from April 2012 to present; Guggenheim Investments: President and Chief Administrative Officer from February 2010 to present; Previous: Channel Capital Group, Inc.: Chairman and CEO from April 2002 to February 2010
Positions held within the Trust: Trustee from 2012 to present; President from 2012 to present
INDEPENDENT TRUSTEES
Name and | Length of Service (Year Began) | Number of | ||||||
Corey A. Colehour | Rydex Series Funds – 1993 | 146 | ||||||
| (1945) | Rydex Variable Trust – 1998 | |||||||
Rydex Dynamic Funds – 1999 | ||||||||
Rydex ETF Trust – 2003 | ||||||||
Principal Occupations During Past Five Years: Current: Retired; Previous: President and Senior Vice President of Schield Management Company (registered investment adviser) from 2003 to 2006
Positions held within the Trust: Trustee from 1993 to present; Member of the Audit and Governance and Nominating Committees from 1995 to present
J. Kenneth Dalton | Rydex Series Funds – 1995 | 146 | ||||||
| (1941) | Rydex Variable Trust – 1998 | |||||||
Rydex Dynamic Funds – 1999 | ||||||||
Rydex ETF Trust – 2003 |
Principal Occupations During Past Five Years: Current: Retired
Positions held within the Trust: Trustee from 1995 to present; Member and Chairman of the Audit Committee from 1997 to present; Member of the Governance and Nominating Committees from 1995 to present; and Member of the Risk Oversight Committee from 2010 to present
John O. Demaret | Rydex Series Funds – 1997 | 146 | ||||||
| (1940) | Rydex Variable Trust – 1998 | |||||||
Rydex Dynamic Funds – 1999 | ||||||||
Rydex ETF Trust – 2003 |
Principal Occupations During Past Five Years: Current: Retired
Positions held within the Trust: Trustee from 1997 to present; Chairman of the Board from 2006 to present; Member of the Audit Committee from 1997 to present; and Member of the Risk Oversight Committee from 2010 to present
| GUGGENHEIM ETFS ANNUAL REPORT | 177 |
Table of Contents
| INFORMATION ON BOARD OF TRUSTEES AND OFFICERS (Unaudited) (continued) |
INDEPENDENT TRUSTEES – concluded
Name and | Length of Service (Year Began) | Number of | ||||||
Werner E. Keller | Rydex Series Funds – 2005 | 146 | ||||||
| (1940) | Rydex Variable Trust – 2005 | |||||||
Rydex Dynamic Funds – 2005 | ||||||||
Rydex ETF Trust – 2005 |
Principal Occupations During Past Five Years: Current: Founder and President of Keller Partners, LLC (investment research firm) from 2005 to present; Previous: Retired from 2001 to 2005
Positions held within the Trust: Vice Chairman of the Board of Trustees from 2010 to present; Trustee and Member of the Audit and Governance and Nominating Committees from 2005 to present; and Chairman and Member of the Risk Oversight Committee from 2010 to present
Thomas F. Lydon, Jr. | Rydex Series Funds – 2005 | 146 | ||||||
| (1960) | Rydex Variable Trust – 2005 | |||||||
Rydex Dynamic Funds – 2005 | ||||||||
Rydex ETF Trust – 2005 |
Principal Occupations During Past Five Years: Current: President of Global Trends Investments (registered investment adviser) from 1996 to present
Positions held within the Trust: Trustee and Member of the Audit and Governance and Nominating Committees from 2005 to present
Patrick T. McCarville | Rydex Series Funds – 1997 | 146 | ||||||
| (1942) | Rydex Variable Trust – 1998 | |||||||
Rydex Dynamic Funds – 1999 | ||||||||
Rydex ETF Trust – 2003 |
Principal Occupations During Past Five Years: Current: Retired; Previous: Chief Executive Officer of Par Industries, Inc., d/b/a Par Leasing from 1977 to 2010
Positions held within the Trust: Trustee from 1997 to present; Member of the Audit Committee from 1997 to present; and Chairman of the Governance and Nominating Committees from 1997 to present
Roger Somers | Rydex Series Funds – 1993 | 146 | ||||||
| (1944) | Rydex Variable Trust – 1998 | |||||||
Rydex Dynamic Funds – 1999 | ||||||||
Rydex ETF Trust – 2003 |
Principal Occupations During Past Five Years: Current: Founder and Chief Executive Officer of Arrow Limousine from 1965 to present
Positions held within the Trust: Trustee from 1993 to present; Member of the Audit and Governance and Nominating Committees from 1995 to present
| 178 | GUGGENHEIM ETFS ANNUAL REPORT |
Table of Contents
INFORMATION ON BOARD OF TRUSTEES AND OFFICERS (Unaudited) (continued)
|
EXECUTIVE OFFICERS
Name, Position and Year of Birth | Principal Occupations During Past Five Years | |
Michael P. Byrum* Vice President (1970) | Current: President, Security Benefit Asset Management Holdings, LLC; Senior Vice President, Security Investors, LLC; President & Chief Investment Officer, Rydex Holdings, LLC; Director & Chairman of the Board, Advisor Research Center, Inc.; and Manager, Rydex Specialized Products, LLC
Previous: Rydex Distributors, LLC (f/k/a Rydex Distributors, Inc.), Vice President (2009); Rydex Fund Services, LLC, Director (2009-2010), Secretary (2002-2010), Executive Vice President (2002-2006); Rydex Advisors, LLC (f/k/a PADCO Advisors, Inc.), Director (2008-2010), Chief Investment Officer (2006-2010), President (2004-2010), Secretary (2002-2010); Rydex Advisors II, LLC (f/k/a PADCO Advisors II, Inc.), Director (2008-2010), Chief Investment Officer (2006-2010), President (2004-2010), Secretary (2002-2010); Rydex Capital Partners, LLC, President & Secretary (2003-2007); Rydex Capital Partners II, LLC, (2003-2007); Rydex Holdings, LLC (f/k/a Rydex Holdings, Inc.), Secretary (2005-2008), Executive Vice President (2005-2006); Advisor Research Center, Inc., Secretary (2006-2009), Executive Vice President (2006); and Rydex Specialized Products, LLC, Secretary (2005-2008) | |
Nikolaos Bonos* Vice President and Treasurer (1963) | Current: Senior Vice President, Security Investors, LLC; Chief Executive Officer & Manager, Rydex Specialized Products, LLC; Chief Executive Officer & President, Rydex Fund Services, LLC; Vice President, Rydex Holdings, LLC; Treasurer, SBL Fund; Security Equity Fund; Security Income Fund; Security Large Cap Value Fund & Security Mid Cap Growth Fund; and Vice President, Security Benefit Asset Management Holdings, LLC
Previous: Security Global Investors, LLC, Senior Vice President (2010-2011); Rydex Advisors, LLC (f/k/a PADCO Advisors, Inc.) Senior Vice President (2006-2011); Rydex Fund Services, LLC (f/k/a Rydex Fund Services, Inc.), Director (2009) & Senior Vice President (2003-2006); and Rydex Specialized Products, LLC, Chief Financial Officer (2005-2009) | |
Elisabeth Miller* Chief Compliance Officer (1968) | Current: Chief Compliance Officer, Rydex Series Funds, Rydex Dynamic Funds, Rydex Variable Trust, Rydex ETF Trust, Security Equity Fund, Security Income Fund, Security Large Cap Value Fund, Security Mid Cap Growth Fund, SBL Fund, Security Investors, LLC, and Rydex Distributors, LLC
Previous: Senior Manager, Security Investors, LLC and Rydex Distributors, LLC (2004-2009) | |
Amy J. Lee* Vice President and Assistant Secretary (1961) | Current: Senior Vice President & Secretary, Security Investors, LLC; Secretary & Chief Compliance Officer, Security Distributors, Inc.; Vice President, Associate General Counsel & Assistant Secretary, Security Benefit Life Insurance Company and Security Benefit Corporation; Associate General Counsel, First Security Benefit Life Insurance and Annuity of New York; Vice President & Secretary, SBL Fund; Security Equity Fund; Security Income Fund; Security Large Cap Value Fund & Security Mid Cap Growth Fund; Vice President & Secretary, Rydex Holdings, LLC Secretary, Advisor Research Center, Inc., Rydex Specialized Products, LLC, Rydex Distributors, LLC and Rydex Fund Services, LLC; and Assistant Secretary, Security Benefit Clinic and Hospital
Previous: Security Global Investors, LLC, Senior Vice President & Secretary (2007-2011); Rydex Advisors, LLC (f/k/a PADCO Advisors, Inc.) & Rydex Advisors II, LLC (f/k/a PADCO Advisors II, Inc.), Senior Vice President & Secretary (2010-2011); and Brecek & Young Advisors, Inc., Director (2004-2008) | |
Joseph M. Arruda* Assistant Treasurer (1966) | Current: Assistant Treasurer, SBL Fund; Security Equity Fund; Security Income Fund; Security Large Cap Value Fund & Security Mid Cap Growth Fund; Vice President, Security Investors, LLC; and Chief Financial Officer & Manager, Rydex Specialized Products, LLC
Previous: Security Global Investors, LLC, Vice President (2010-2011); and Rydex Advisors, LLC (f/k/a PADCO Advisors, Inc.) & Rydex Advisors II, LLC (f/k/a PADCO Advisors II, Inc.), Vice President (2004-2011) | |
| * | Officers of the Funds are deemed to be “interested persons” of the Trust, within the meaning of Section 2(a)(19) of the 1940 Act, inasmuch as this person is affiliated with Guggenheim Investments. |
| GUGGENHEIM ETFS ANNUAL REPORT | 179 |
Table of Contents
| GUGGENHEIM INVESTMENTS PRIVACY POLICIES |
Rydex Funds, Guggenheim Funds, Rydex Investments, Rydex Distributors, Inc., Security Investors, LLC, Security Distributors, Inc. and Rydex Advisory Services (Collectively “Guggenheim Investments”)
When you become a Guggenheim Investments investor, you entrust us with not only your hard-earned money but also with personal and financial information about you. We recognize that your relationship with us is based on trust and that you expect us to act responsibly and in your best interests. Because we have access to this private information about you, we hold ourselves to the highest standards in its safekeeping and use. This means, most importantly, that we do not sell client information to anyone—whether it is your personal information or if you are a current or former Guggenheim Investments client.
The Information We Collect About You
In the course of doing business with shareholders and investors, we collect nonpublic personal information about you. You typically provide personal information when you complete a Guggenheim Investments account application or when you request a transaction that involves Rydex and Guggenheim Investments funds or one of the Guggenheim Investments affiliated companies. “Nonpublic personal information” is personally identifiable private information about you. For example, it includes information regarding your name and address, Social Security or taxpayer identification number, assets, income, account balance, bank account information and investment activity (e.g., purchase and redemption history).
How We Handle Your Personal Information
As emphasized above, we do not sell information about current or former clients or their accounts to third parties. Nor do we share such information, except when necessary to complete transactions at your request or to make you aware of related investment products and services that we offer. Additional details about how we handle your personal information are provided below. To complete certain transactions or account changes that you direct, it may be necessary to provide identifying information to companies, individuals or groups that are not affiliated with Guggenheim Investments. For example, if you ask to transfer assets from another financial institution to Guggenheim Investments, we will need to provide certain information about you to that company to complete the transaction. To alert you to other Guggenheim Investments investment products and services, we may share your information within the Guggenheim Investments family of affiliated companies. This would include, for example, sharing your information within Guggenheim Investments so we can make you aware of new Rydex and Guggenheim Investments funds or the services offered through another Guggenheim Investments affiliated company. In certain instances, we may contract with nonaffiliated companies to perform services for us. Where necessary, we will disclose information we have about you to these third parties. In all such cases, we provide the third party with only the information necessary to carry out its assigned responsibilities and only for that purpose. And we require these third parties to treat your private information with the same high degree of confidentiality that we do. In certain instances, we may share information with other financial institutions regarding individuals and entities in response to the U.S.A. Patriot Act. Finally, we will release information about you if you direct us to do so, if we are compelled by law to do so or in other circumstances permitted by law.
Opt Out Provisions
We do not sell your personal information to anyone. The law allows you to “opt out” of only certain kinds of information sharing with third parties. The firm does not share personal information about you with any third parties that triggers this opt-out right. This means YOU ARE ALREADY OPTED OUT.
How We Protect Privacy Online
Our concern for the privacy of our shareholders also extends to those who use our web site, guggenheiminvestments.com. Our web site uses some of the most secure forms of online communication available, including encryption technology, Secure Socket Layer (SSL) protocol, firewalls and user names and passwords. These technologies provide a high level of security and privacy when you access your account information or initiate online transactions. The Guggenheim Investments web site offers customized features that require our use of “http cookies”— tiny pieces of information that we ask your browser to store. However, we make very limited use of these cookies. We only use cookies for session management and security features on the Guggenheim Investments web site. We do not use them to pull data from your hard drive, to learn your email address, or to view data in cookies created by other web sites. We will not share the information in our cookies or give others access to it. See the legal information area on our web site for more details about web site security and privacy features.
| 180 | GUGGENHEIM ETFS ANNUAL REPORT |
Table of Contents
| GUGGENHEIM INVESTMENTS PRIVACY POLICIES (concluded) |
How We Safeguard Your Personal Information
We restrict access to nonpublic personal information about shareholders to our employees and in some cases to third parties (for example, the service providers described above) as permitted by law. We maintain strict physical, electronic and procedural safeguards that comply with federal standards to guard your nonpublic personal information.
We’ll Keep You Informed
As required by federal law, we will notify shareholders of our privacy policy annually. We reserve the right to modify this policy at any time, but rest assured that if we do change it, we will tell you promptly. You will also be able to access our privacy policy from our web site at guggenheiminvestments.com. Should you have any questions regarding our privacy policy, contact us at 800.820.0888 or 301.296.5100.
| GUGGENHEIM ETFS ANNUAL REPORT | 181 |
Table of Contents

805 King Farm Boulevard, Suite 600
Rockville, MD 20850
guggenheiminvestments.com
800.820.0888
ETF-ANN-1012x1013
Table of Contents

OCTOBER 31, 2012
GUGGENHEIM ETFs
ANNUAL REPORT

| XLG | GUGGENHEIM RUSSELL TOP 50® MEGA CAP ETF | |
(formerly, RYDEX RUSSELL TOP 50® ETF) | ||
| RPV | GUGGENHEIM S&P 500® PURE VALUE ETF | |
(formerly, RYDEX S&P 500 PURE VALUE ETF) | ||
| RPG | GUGGENHEIM S&P 500® PURE GROWTH ETF | |
(formerly, RYDEX S&P 500 PURE GROWTH ETF) | ||
| RFV | GUGGENHEIM S&P MIDCAP 400® PURE VALUE ETF | |
(formerly, RYDEX S&P MIDCAP 400 PURE VALUE ETF) | ||
| RFG | GUGGENHEIM S&P MIDCAP 400® PURE GROWTH ETF | |
(formerly, RYDEX S&P MIDCAP 400 PURE GROWTH ETF) | ||
| RZV | GUGGENHEIM S&P SMALLCAP 600® PURE VALUE ETF | |
(formerly, RYDEX S&P SMALLCAP 600 PURE VALUE ETF) | ||
| RZG | GUGGENHEIM S&P SMALLCAP 600® PURE GROWTH ETF | |
(formerly, RYDEX S&P SMALLCAP 600 PURE GROWTH ETF) |
Table of Contents
|
| 2 | ||||
| 4 | ||||
| 6 | ||||
| 9 | ||||
| 10 | ||||
| 23 | ||||
| 43 | ||||
| 45 | ||||
| 47 | ||||
| 51 | ||||
| 58 | ||||
| 65 | ||||
| 66 | ||||
| 68 | ||||
GUGGENHEIM INVESTMENTS PRIVACY POLICIES | 71 | |||
| GUGGENHEIM ETFS ANNUAL REPORT | 1 |
Table of Contents
| October 31, 2012 |
Dear Shareholder:
Security Investors, LLC (the “Investment Adviser”) is pleased to present the annual shareholder report for seven of our exchange traded funds (“ETFs”).
The Investment Adviser is part of Guggenheim Investments which represents the investment management businesses of Guggenheim Partners, LLC, a global, diversified financial services firm.
This report covers performance of the following ETFs for the annual period ended October 31, 2012, with the name of each Fund followed by its ticker symbol:
| – | Guggenheim Russell Top 50® Mega Cap ETF (XLG) |
| – | Guggenheim S&P 500® Pure Value ETF (RPV) |
| – | Guggenheim S&P 500® Pure Growth ETF (RPG) |
| – | Guggenheim S&P MidCap 400® Pure Value ETF (RFV) |
| – | Guggenheim S&P MidCap 400® Pure Growth ETF (RFG) |
| – | Guggenheim S&P SmallCap 600® Pure Value ETF (RZV) |
| – | Guggenheim S&P SmallCap 600® Pure Growth ETF (RZG) |
Rydex Distributors, LLC, the distributor of the Funds, is committed to providing investors with innovative investment solutions; as of the date of this report we offer 26 ETFs with a wide range of domestic and global themes, as well as equity and fixed-income mutual funds. We have built on the investment management strengths of Guggenheim Investments and worked with a diverse group of index providers to create some of the most distinctive ETFs available.
Rydex Distributors’, LLC is affiliated with Guggenheim Partners and Security Investors.
To learn more about economic and market conditions over the 12 months ended October 31, 2012, we encourage you to read the Economic and Market Overview section of the report, which follows this letter, and the Manager’s Analysis for each ETF.
Sincerely,

Donald C. Cacciapaglia
President
November 30, 2012
Read each fund’s prospectus and summary prospectus (if available) carefully before investing. It contains the fund’s investment objectives, risks, charges, expenses and other information, which should be considered carefully before investing. Obtain a prospectus and summary prospectus (if available) at www.guggenheiminvestments.com or call 800.820.0888.
Pure Style ETFs may not be suitable for all investors. The ETFs are subject to the risk that large, medium and small-capitalization stocks may under-perform other segments of the equity market or the equity market as a whole • Value stocks are subject to the risk that the intrinsic value of the stock may never be realized by the market or that the price goes down. Growth stocks typically invest a high portion of their earnings back into their business and may lack the dividend yield that could cushion their decline in a market downturn. Growth stocks may be more volatile than other stocks because they are more sensitive to investor perceptions regarding the growth potential of the issuing company. • The Funds are subject to the risk that unanticipated early closings of securities exchanges and other financial markets may result in the Funds’ inability to buy or sell securities or other
| 2 | GUGGENHEIM ETFS ANNUAL REPORT |
Table of Contents
| (concluded) |
financial instruments on that day. • In certain circumstances, it may be difficult for the Funds to purchase and sell particular investments within a reasonable time at a fair price. • Investments in securities, in general, are subject to market risks that may cause their prices to fluctuate over time. An investment in the Funds may lose money. • Unlike many investment companies, the Funds are not actively “managed.” This means that based on market and economic conditions, the Funds’ performance could be lower than other types of funds that may actively shift their portfolio assets to take advantage of market opportunities or to lessen the impact of a market decline. • Tracking error risk refers to the risk that the advisor may not be able to cause the Funds’ performance to match or correlate to that of the Funds’ underlying index, either on a daily or aggregate basis. Tracking error risk may cause the Funds’ performance to be less than you expect. • Shares may trade below their net asset value (“NAV”). The NAV of shares will fluctuate with changes in the market value of the Funds’ holdings. In addition, although the Funds’ shares are currently listed on NYSE Arca, Inc. (the “Exchange”), there can be no assurance that an active trading market for shares will develop or be maintained. • Each Fund is considered nondiversified and can invest a greater portion of its assets in securities of individual issuers than a diversified Fund. As a result, changes in the market value of a single security could cause greater fluctuations in the value of fund shares than would occur in a more diversified Fund. •See prospectus for more details
The Russell Top 50® Mega Cap ETF may not be suitable for all investors. • The Fund is subject to the risk that unanticipated early closings of securities exchanges and other financial markets may result in the Fund’s inability to buy or sell securities or other financial instruments on that day. • In certain circumstances, it may be difficult for the Fund to purchase and sell particular investments within a reasonable time at a fair price. • Investments in securities and derivatives, in general, are subject to market risks that may cause their prices to fluctuate over time. An investment in the Fund may lose money. • Unlike many investment companies, the Fund is not actively “managed.” This means that, based on market and economic conditions, the Fund’s performance could be lower than other types of mutual funds that may actively shift their portfolio assets to take advantage of market opportunities or to lessen the impact of a market decline.• Tracking error risk refers to the risk that the advisor may not be able to cause the Fund’s performance to match or correlate to that of the Fund’s underlying index, either on a daily or aggregate basis. Tracking error risk may cause the Fund’s performance to be less than you expect. • Shares may trade below their net asset value (“NAV”). The NAV of shares will fluctuate with changes in the market value of the Fund’s holdings. In addition, although the Fund’s shares are currently listed on NYSE Arca, Inc. (the “Exchange”), there can be no assurance that an active trading market for shares will develop or be maintained. • The Fund is subject to the risk that large-capitalization stocks may underperform other segments of the equity market or the equity market as a whole. See prospectus for more details
| GUGGENHEIM ETFS ANNUAL REPORT | 3 |
Table of Contents
|
Shareholder Expense Example
As a shareholder of the Rydex ETF Trust, you incur transaction costs such as creation and redemption fees or brokerage charges, and ongoing costs including advisory fees, trustee fees and, if applicable, distribution fees. All other Trust expenses are paid by the advisor. This Example is intended to help you understand your ongoing costs (in dollars) of investing in a Fund and to compare these costs with the ongoing costs of investing in other mutual funds.
The example in the table is based on an investment of $1,000 invested on April 30, 2012 and held for the six months ended October 31, 2012.
Actual Expenses
The first table below provides information about actual account values and actual expenses. You may use the information in this table, together with the amount you invested, to estimate the expenses that you incurred over the period. Simply divide your account value by $1,000 (for example, an $8,600 account value divided by $1,000 = 8.6), then multiply the result by the number in the first table under the heading entitled “Expenses Paid During the Six-Month Period” to estimate the expenses attributable to your investment during this period.
Hypothetical Example for Comparison Purposes
The second table below provides information about hypothetical account values and hypothetical expenses based on a Fund’s actual expense ratio and an assumed rate of return of 5% per year before expenses, which is not a Fund’s actual return. Thus, you should not use the hypothetical account values and expenses to estimate the actual ending account balance or your expenses for the period. Rather, these figures are provided to enable you to compare the ongoing costs of investing in a Fund and other funds. To do so, compare this 5% hypothetical example with the 5% hypothetical examples that appear in the shareholder reports of other funds.
Please note that the expenses shown in the table are meant to highlight your ongoing costs only and do not reflect any transaction costs, such as creation and redemption fees, or brokerage charges. Therefore, the second table is useful in comparing ongoing costs only, and will not help you determine the relative total costs of owning different funds. In addition, if these transaction costs were included, your costs would have been higher.
| Expense Ratio | Beginning Account Value 04/30/12 | Ending Account Value 10/31/12 | Expenses Paid During Six-Month Period* 04/30/12 to 10/31/12 | |||||||||||||
Actual | ||||||||||||||||
Guggenheim Russell Top 50® Mega Cap ETF | 0.20% | $ | 1,000.00 | $ | 1,029.10 | $ | 1.02 | |||||||||
Guggenheim S&P 500® Pure Value ETF | 0.35% | 1,000.00 | 1,048.00 | 1.80 | ||||||||||||
Guggenheim S&P 500® Pure Growth ETF | 0.35% | 1,000.00 | 977.80 | 1.74 | ||||||||||||
Guggenheim S&P MidCap 400® Pure Value ETF | 0.35% | 1,000.00 | 991.80 | 1.75 | ||||||||||||
Guggenheim S&P MidCap 400® Pure Growth ETF | 0.35% | 1,000.00 | 982.30 | 1.74 | ||||||||||||
Guggenheim S&P SmallCap 600® Pure Value ETF | 0.35% | 1,000.00 | 1,015.80 | 1.77 | ||||||||||||
Guggenheim S&P SmallCap 600® Pure Growth ETF | 0.35% | 1,000.00 | 993.50 | 1.75 | ||||||||||||
Hypothetical (assuming a 5% return before expenses) |
| |||||||||||||||
Guggenheim Russell Top 50® Mega Cap ETF | 0.20% | 1,000.00 | 1,024.13 | 1.02 | ||||||||||||
Guggenheim S&P 500® Pure Value ETF | 0.35% | 1,000.00 | 1,023.38 | 1.78 | ||||||||||||
Guggenheim S&P 500® Pure Growth ETF | 0.35% | 1,000.00 | 1,023.38 | 1.78 | ||||||||||||
| 4 | GUGGENHEIM ETFS ANNUAL REPORT |
Table of Contents
FEES AND EXPENSES (Unaudited) (concluded)
|
| Expense Ratio | Beginning Account Value 04/30/12 | Ending Account Value 10/31/12 | Expenses Paid During Six-Month Period* 04/30/12 to 10/31/12 | |||||||||||||
Guggenheim S&P MidCap 400® Pure Value ETF | 0.35% | $ | 1,000.00 | $ | 1,023.38 | $ | 1.78 | |||||||||
Guggenheim S&P MidCap 400® Pure Growth ETF | 0.35% | 1,000.00 | 1,023.38 | 1.78 | ||||||||||||
Guggenheim S&P SmallCap 600® Pure Value ETF | 0.35% | 1,000.00 | 1,023.38 | 1.78 | ||||||||||||
Guggenheim S&P SmallCap 600® Pure Growth ETF | 0.35% | 1,000.00 | 1,023.38 | 1.78 | ||||||||||||
| * | Expenses are equal to the Fund’s annualized expense ratio multiplied by the average account value over the period, multiplied by 184/366 (to reflect one-half year period). |
| GUGGENHEIM ETFS ANNUAL REPORT | 5 |
Table of Contents
|
Amidst the negative headlines concerning the potential fiscal cliff in the U.S., further turmoil in Europe and worsening economic data from China, the U.S. economy has shown surprising resilience, with signs of rising consumer sentiment and a recovery in housing. The U.S. housing market appears to have passed its bottom and real estate prices have begun to pick up. Our expectation is that a period of continued low interest rates will likely reinforce the rise in home prices and sales. Rising home prices will increase household net worth, which will translate into greater consumption via the wealth effect, and is supportive of overall economic growth. The recent rise in headline inflation, led by increases in energy and food prices, is likely to be transitory. Inflationary pressures should remain muted in the medium-term given the substantial slack in the economy.
The U.S. economy continues to press forward despite the current headwinds, and we believe the current macroeconomic environment remains constructive for risk assets, especially in the U.S. Stocks in the U.S. appear to be undervalued by most measures, and should benefit from continued capital inflow and the Federal Reserve’s accommodative monetary policy. We continue to see attractive value in credit products on a relative basis, though this positive outlook is limited to spread (or non-government) sectors.
On the international front, uncertainty continues to weigh on European markets. European policymakers appear to be coming closer to a consensus on the need for a fiscal union, albeit at a glacial pace. In China, a recent batch of economic data suggests that the odds of a hard landing have increased materially. We expect an announcement of additional stimulus measures after the government transition next year; although a stimulus would be supportive of economic growth, we expect China’s headline growth to slow from its breakneck pace of the past decade.
Beginning in mid-November 2011, the U.S. stock market moved up fairly consistently, except for a second-quarter pullback caused by lower earnings and GDP. For the 12-month period ended October 31, 2012, the Standard & Poor’s 500 Index (the “S&P 500”)* returned 15.21%.
Most international markets had positive returns, but were not nearly as strong as the U.S. market. The Morgan Stanley Capital International Europe-Australasia-Far East (the “MSCI EAFE”) Index* returned 4.61%. The MSCI EAFE Index is composed of approximately 1,100 companies in 20 developed countries in Europe and the Pacific Basin. The MSCI Emerging Markets Index* returned 2.63%.
The search for yield continued to attract investors to the U.S. bond markets, helping performance, with lower-rated bonds outperforming higher-quality issues. The return of the Barclays U.S. Aggregate Bond Index*, which is a proxy for the U.S. investment grade bond market, returned 5.25%, while return of the Barclays U.S. Corporate High Yield Index* was 13.61%. Reflecting the Federal Reserve’s continuing accommodative monetary policy, interest rates on short-term securities remained at their lowest levels in many years; the return of the Bank of America Merrill Lynch 3 Month U.S. Treasury Bill Index* was 0.08%.
The opinions and forecasts expressed may not actually come to pass. This information is subject to change at any time, based on market and other conditions, and should not be construed as a recommendation of any specific security or strategy.
* Index Definitions:
The following indices are referenced throughout this report. Indices are unmanaged and not available for direct investment. Index performance does not reflect transaction costs, fees or expenses.
The Barclays U.S. Aggregate Bond Index is a broad-based benchmark that measures the investment grade, U.S. dollar denominated, fixed-rate taxable bond market, including U.S. Treasuries, government-related and corporate securities, MBS (agency fixed-rate and hybrid ARM pass-throughs), ABS, and CMBS.
The Barclays U.S. Corporate High Yield Index measures the market of USD-denominated, non-investment grade, fixed-rate, taxable corporate bonds.
The Bank of America Merrill Lynch 3-Month U.S. Treasury Bill Index tracks 3-month U.S. government securities.
| 6 | GUGGENHEIM ETFS ANNUAL REPORT |
Table of Contents
ECONOMIC AND MARKET OVERVIEW (continued)
|
The MSCI EAFE Index is a capitalization weighted measure of stock markets in Europe, Australasia and the Far East.
The MSCI Emerging Markets Index is a free float-adjusted market capitalization weighted index that is designed to measure equity market performance in the global emerging markets.
The S&P 500® Index is a capitalization-weighted index that measures the performance of the large-capitalization sector of the U.S. equity market and includes 500 widely held common stocks chosen for market size, liquidity and industry group representation.
The Russell Top 50® Mega Cap Index measures the performance of the largest companies in the Russell 3000® Index, which measures the performance of the largest 3,000 U.S. companies and represents approximately 98% of the investable U.S. equity market. The Mega Cap Index includes approximately 50 of the largest securities based on a combination of their market cap and current index membership and represents approximately 40% of the total market capitalization of the Russell 3000.
The S&P 500® Pure Value Index is narrow in focus, containing only those stocks from the S&P (Standard & Poor’s) 500® Index (S&P 500), as selected by S&P, that exhibit strong value characteristics, and weights them by style score. It is a complement to the S&P 500® Value Index, which consists of all value companies in the S&P 500 and measures value across several risk factors, including book value to price ratio, earnings to price ratio, and sales to price ratio. The S&P 500 itself measures the performance of the large-capitalization sector of the U.S. equity market and includes 500 widely held common stocks chosen for market size, liquidity and industry group representation.
The S&P 500® Pure Growth Index is narrow in focus, containing only those stocks from the S&P (Standard & Poor’s) 500® Index (S&P 500), as selected by S&P, that exhibit strong growth characteristics, and weights them by style score. It is a complement to the S&P 500® Growth Index, which consists of all growth companies in the S&P 500 and measures growth across several risk factors, including sales growth, earnings change to price and momentum. The S&P 500 itself measures the performance of the large-capitalization sector of the U.S. equity market and includes 500 widely held common stocks chosen for market size, liquidity and industry group representation.
The Standard & Poor’s (S&P) MidCap 400® Index is a capitalization-weighted index that measures the performance of the mid-cap segment of the U.S. equity universe and includes 400 domestic mid-cap stocks chosen for market capitalization, liquidity, and industry group representation.
The S&P MidCap 400® Pure Value Index is narrow in focus, containing only those S&P (Standard & Poor’s) MidCap 400® Index (S&P 400) companies with strong value characteristics as selected by S&P. It is a complement to the S&P MidCap 400® Value Index, which consists of all value companies in the S&P 400 and measures value across several risk factors, including book value to price ratio, earnings to price ratio, and sales to price ratio. The S&P 400 itself measures the performance of the mid-capitalization sector of the U.S. equity market.
The S&P MidCap 400® Pure Growth Index is narrow in focus, containing only those S&P (Standard & Poor’s) MidCap 400® Index (S&P 400) companies with strong growth characteristics as selected by S&P. It is a complement to the S&P MidCap 400® Growth Index, which consists of all growth companies in the S&P 400 and measures growth across several risk factors, including sales growth, earnings change to price and momentum. The S&P 400 itself measures the performance of the mid-capitalization sector of the U.S. equity market.
The Standard & Poor’s (S&P) SmallCap 600® Index is a capitalization-weighted index that measures the performance of the small-cap segment of the U.S. equity universe and includes 600 domestic small-cap stocks chosen for market capitalization, liquidity, and industry group representation.
The S&P SmallCap 600® Pure Value Index is narrow in focus, containing only those S&P (Standard & Poor’s) SmallCap 600® Index (S&P 600) companies with strong value characteristics as selected by S&P. It is a complement to the S&P SmallCap 600® Value Index, which consists of all value companies in the S&P 600 and measures value
| GUGGENHEIM ETFS ANNUAL REPORT | 7 |
Table of Contents
ECONOMIC AND MARKET OVERVIEW (concluded)
|
across several risk factors, including book value to price ratio, earnings to price ratio, and sales to price ratio. The S&P 600 itself measures the performance of the small-capitalization sector of the U.S. equity market.
The S&P SmallCap 600® Pure Growth Index is narrow in focus, containing only those S&P (Standard & Poor’s) SmallCap 600® Index (S&P 400) companies with strong growth characteristics as selected by S&P. It is a complement to the S&P SmallCap 600® Growth Index, which consists of all growth companies in the S&P 600 and measures growth across several risk factors, including sales growth, earnings change to price and momentum. The S&P 600 itself measures the performance of the mid-capitalization sector of the U.S. equity market.
| 8 | GUGGENHEIM ETFS ANNUAL REPORT |
Table of Contents
MANAGER’S ANALYSIS (Unaudited)
| October 31, 2012 |
GUGGENHEIM RUSSELL TOP 50® MEGA CAP ETF
Guggenheim Russell Top 50® Mega Cap ETF (XLG) finished the one-year period ended October 31, 2012, at 18.11%, compared with the Russell Top 50® Mega Cap Total Return Index benchmark, which returned 18.40% for the same period. During the period, XLG achieved over 99% correlation to its benchmark on a daily basis.
The Information Technology sector was the largest contributor to performance, followed by Health Care. No sector detracted from performance. The Telecommunications Services sector contributed least to performance.
The top contributors to Fund return were Apple, Inc. and Exxon Mobil Corp. The largest detractors were Hewlett-Packard Co. and Oracle Corp.
Slow U.S. economic growth and an uncertain investment climate drove investors to safe harbors during the period. This benefited the largest cap stocks, which tend to be less volatile than other areas of the stock market, buoyed by typically more stable business models, steady growth and potential higher dividend yields.
Mega-cap stocks, as represented by the Russell Top 50 Mega Cap Index, outperformed all other cap sizes for the period, including large-cap stocks, mid-cap stocks and small-cap stocks. The returns of the S&P 500® Index, S&P MidCap 400® Index and SmallCap 600® Index, were 15.21%, 12.11% and 13.60%, respectively.
Cumulative Fund Performance: May 4, 2005 – October 31, 2012
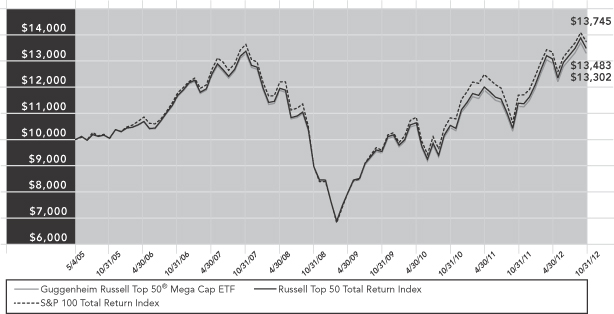
| AVERAGE ANNUAL TOTAL RETURNS FOR THE PERIOD ENDED OCTOBER 31, 2012 | ||||||||||||||||
| One Year | Three Year | Five Year | Since Inception (05/04/05) | |||||||||||||
Guggenheim Russell Top 50® Mega Cap ETF | 18.11% | 11.96% | 0.02% | 3.88% | ||||||||||||
Russell Top 50 Total Return Index | 18.40% | 12.21% | 0.16% | 4.07% | ||||||||||||
S&P 100 Total Return Index | 17.51% | 12.77% | 0.16% | 4.34% | ||||||||||||
The returns presented above do not reflect the effect of taxes. Index returns represent total returns. Performance displayed represents past performance, which is no guarantee of future results.
Fund performance is subject to daily market volatility and may be better or worse since the end of the last quarter. For up-to-date fund performance, call 800.820.0888 or visit guggenheiminvestments.com.
| GUGGENHEIM ETFS ANNUAL REPORT | 9 |
Table of Contents
| October 31, 2012 |
GUGGENHEIM RUSSELL TOP 50® MEGA CAP ETF
Sector Allocations*
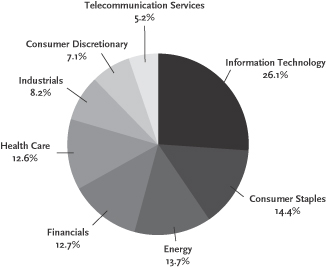
| Top 10 Holdings* | ||||
| Description | % of Net Assets | |||
Apple, Inc. | 8.71% | |||
Exxon Mobil Corp. | 6.67% | |||
General Electric Co. | 3.49% | |||
Chevron Corp. | 3.40% | |||
Microsoft Corp. | 3.36% | |||
International Business Machines Corp. | 3.32% | |||
AT&T, Inc. | 3.17% | |||
Johnson & Johnson | 3.04% | |||
Procter & Gamble Co.(The) | 2.97% | |||
Pfizer, Inc. | 2.91% | |||
| * | The Fund’s Top Ten Holdings are expressed as a percentage of net assets and the Sector Allocations are expressed as a percentage of the Fund’s equity investments market value. These percentages may change over time. |
| 10 | GUGGENHEIM ETFS ANNUAL REPORT |
Table of Contents
MANAGER’S ANALYSIS (Unaudited)
| October 31, 2012 |
GUGGENHEIM S&P 500® PURE VALUE ETF
For the one-year period ended October 31, 2012, Guggenheim S&P 500® Pure Value ETF returned 15.54%. Over the year, its benchmark, the S&P 500® Pure Value Total Return Index, posted a return of 16.11%. For the period, RPV achieved a correlation of over 99% to its benchmark of the daily price movement of the S&P 500® Pure Value Total Return Index.
The Financials sector was the largest contributor to performance during the period, followed by Energy. The only sector detracting from performance was Information Technology.
Stocks contributing the most to return were Whirlpool Corp. and American International Group, Inc., while Sears Holdings Corp. and R.R. Donnelley & Sons Co. were the largest detractors.
From a style perspective, value pure-style indices outperformed corresponding growth pure-style indices at each cap size (with the greatest differential in large caps). Within the value pure-style space, large-cap value stocks outperformed both mid-cap value stocks and small-cap value stocks.
The 16.11% return of the S&P 500 Pure Value Total Return Index slightly underperformed the S&P 500® Value Total Return Index, which returned 16.73%, but outperformed the broader S&P 500® Total Return Index, which returned 15.21% for the year.
Cumulative Fund Performance: March 1, 2006 – October 31, 2012
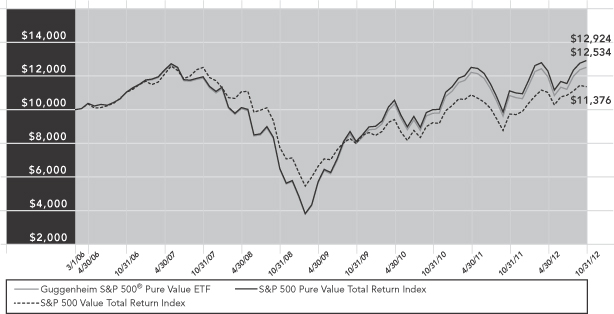
| AVERAGE ANNUAL TOTAL RETURNS FOR THE PERIOD ENDED OCTOBER 31, 2012 | ||||||||||||||||
| One Year | Three Year | Five Year | Since Inception (03/01/06) | |||||||||||||
Guggenheim S&P 500® Pure Value ETF | 15.54% | 16.25% | 1.06% | 3.44% | ||||||||||||
S&P 500 Pure Value Total Return Index | 16.11% | 16.79% | 1.57% | 3.92% | ||||||||||||
S&P 500 Value Total Return Index | 16.73% | 12.52% | – | 1.90% | 1.95% | |||||||||||
The returns presented above do not reflect the effect of taxes. Index returns represent total returns. Performance displayed represents past performance, which is no guarantee of future results.
Fund performance is subject to daily market volatility and may be better or worse since the end of the last quarter. For up-to-date fund performance, call 800.820.0888 or visit guggenheiminvestments.com.
| GUGGENHEIM ETFS ANNUAL REPORT | 11 |
Table of Contents
PORTFOLIO SUMMARY (Unaudited)
| October 31, 2012 | |
GUGGENHEIM S&P 500® PURE VALUE ETF | ||
Sector Allocations*
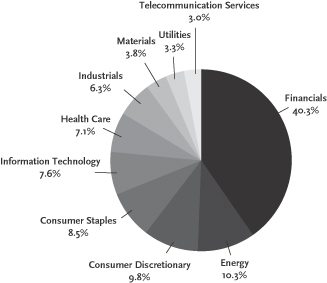
| Top 10 Holdings* | ||||
| Description | % of Net Assets | |||
Whirlpool Corp. | 3.33% | |||
American International Group, Inc. | 3.06% | |||
Computer Sciences Corp. | 2.55% | |||
Hartford Financial Services Group, Inc. | 2.12% | |||
Valero Energy Corp. | 2.11% | |||
Dean Foods Co. | 1.91% | |||
Tesoro Corp. | 1.89% | |||
Marathon Petroleum Corp. | 1.82% | |||
Sprint Nextel Corp. | 1.80% | |||
Bank Of America Corp. | 1.75% | |||
| * | The Fund’s Top Ten Holdings are expressed as a percentage of net assets and the Sector Allocations are expressed as a percentage of the Fund’s equity investments market value. These percentages may change over time. |
| 12 | GUGGENHEIM ETFS ANNUAL REPORT |
Table of Contents
MANAGER’S ANALYSIS (Unaudited)
| October 31, 2012 |
GUGGENHEIM S&P 500® PURE GROWTH ETF
For the one-year period ended October 31, 2012, Guggenheim S&P 500® Pure Growth ETF returned 7.72%. Over the year, its benchmark, the S&P 500® Pure Growth Total Return Index, produced a return of 8.13%. For the period, RPG achieved over 99% correlation to its benchmark on a daily basis.
Health Care was the sector contributing most to performance, followed by Financials. Industrials and Information Technology detracted most from performance for the year.
Stocks contributing the most to return were Gilead Sciences, Inc. and Apple, Inc., while Apollo Group, Inc.—Class A and Fossil, Inc. were the largest detractors from performance.
From a style perspective, growth pure-style indices underperformed corresponding value pure-style indices at each cap size (with the greatest differential in large caps). Within the growth pure-style space, small-cap growth stocks outperformed both large-cap growth stocks and mid-cap growth stocks.
The 8.13% return of the S&P 500 Pure Growth Total Return Index was lower than both the S&P 500® Growth Total Return Index, which returned 13.94%, and the broader S&P 500® Total Return Index, which returned 15.21% for the year.
Cumulative Fund Performance: March 1, 2006 – October 31, 2012

| AVERAGE ANNUAL TOTAL RETURNS FOR THE PERIOD ENDED OCTOBER 31, 2012 | ||||||||||||||||
| One Year | Three Year | Five Year | Since Inception (03/01/06) | |||||||||||||
Guggenheim S&P 500® Pure Growth ETF | 7.72% | 16.31% | 4.44% | 5.62% | ||||||||||||
S&P 500 Pure Growth Total Return Index | 8.13% | 16.78% | 4.80% | 6.00% | ||||||||||||
S&P 500 Growth Total Return Index | 13.94% | 13.93% | 2.53% | 5.00% | ||||||||||||
The returns presented above do not reflect the effect of taxes. Index returns represent total returns. Performance displayed represents past performance, which is no guarantee of future results.
Fund performance is subject to daily market volatility and may be better or worse since the end of the last quarter. For up-to-date fund performance, call 800.820.0888 or visit guggenheiminvestments.com.
| GUGGENHEIM ETFS ANNUAL REPORT | 13 |
Table of Contents
PORTFOLIO SUMMARY (Unaudited)
| October 31, 2012 | |
GUGGENHEIM S&P 500® PURE GROWTH ETF | ||
Sector Allocations*
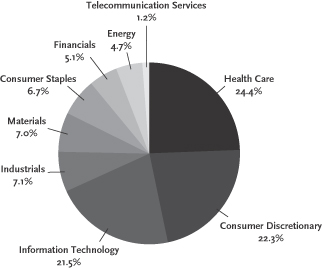
| Top 10 Holdings* | ||||
| Description | % of Net Assets | |||
Apple, Inc. | 1.79% | |||
Visa, Inc. - Class A | 1.60% | |||
Alexion Pharmaceuticals, Inc. | 1.46% | |||
Gilead Sciences, Inc. | 1.46% | |||
Discovery Communications, Inc. - Class A | 1.30% | |||
Express Scripts Holding Co. | 1.29% | |||
Biogen Idec, Inc. | 1.28% | |||
Intuitive Surgical, Inc. | 1.26% | |||
Ross Stores, Inc. | 1.25% | |||
Celgene Corp. | 1.22% | |||
| * | The Fund’s Top Ten Holdings are expressed as a percentage of net assets and the Sector Allocations are expressed as a percentage of the Fund’s equity investments market value. These percentages may change over time. |
| 14 | GUGGENHEIM ETFS ANNUAL REPORT |
Table of Contents
MANAGER’S ANALYSIS (Unaudited)
| October 31, 2012 |
GUGGENHEIM S&P MIDCAP 400® PURE VALUE ETF
For the one-year period ended October 31, 2012, Guggenheim S&P MidCap 400® Pure Value ETF returned 14.46%. Over the year, its benchmark, the S&P MidCap 400® Pure Value Total Return Index, posted a 15.16% return. RFV achieved over 99% correlation to its benchmark on a daily basis.
The Financials and Industrials sectors were the biggest contributors to performance. Two sectors detracted from performance of the fund: Information Technology and Energy.
Stocks contributing the most to return were First American Financial Corp. and Community Health Systems, Inc., while RadioShack Corp. and MEMC Electronic Materials, Inc. were the largest detractors.
From a style perspective, value pure-style indices outperformed corresponding growth pure-style indices at each cap size (with the greatest differential in large caps). Within the value pure-style space, large-cap value stocks outperformed both mid-cap value stocks and small-cap value stocks.
The 15.16% return of the S&P MidCap 400 Pure Value Total Return Index outperformed both the S&P MidCap 400® Value Total Return Index, which returned 14.57%, and the broader S&P MidCap 400® Total Return Index, which returned 12.11% for the year.
Cumulative Fund Performance: March 1, 2006 – October 31, 2012
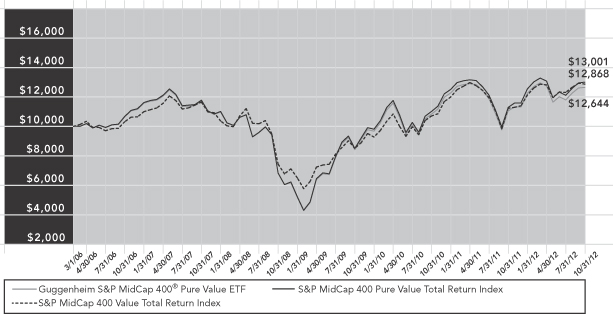
| AVERAGE ANNUAL TOTAL RETURNS FOR THE PERIOD ENDED OCTOBER 31, 2012 | ||||||||||||||||
| One Year | Three Year | Five Year | Since Inception (03/01/06) | |||||||||||||
Guggenheim S&P MidCap 400® Pure Value ETF | 14.46% | 14.56% | 1.55% | 3.58% | ||||||||||||
S&P MidCap 400 Pure Value Total Return Index | 15.16% | 15.21% | 1.99% | 4.01% | ||||||||||||
S&P MidCap 400 Value Total Return Index | 14.57% | 14.77% | 2.01% | 3.85% | ||||||||||||
The returns presented above do not reflect the effect of taxes. Index returns represent total returns. Performance displayed represents past performance, which is no guarantee of future results.
Fund performance is subject to daily market volatility and may be better or worse since the end of the last quarter. For up-to-date fund performance, call 800.820.0888 or visit guggenheiminvestments.com.
| GUGGENHEIM ETFS ANNUAL REPORT | 15 |
Table of Contents
PORTFOLIO SUMMARY (Unaudited)
| October 31, 2012 | |
GUGGENHEIM S&P MIDCAP 400® PURE VALUE ETF | ||
Sector Allocations*
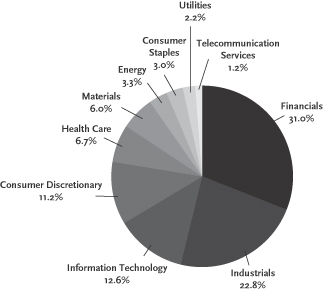
| Top 10 Holdings* | ||||
| Description | % of Net Assets | |||
First American Financial Corp. | 4.12% | |||
Community Health Systems, Inc. | 3.04% | |||
Exelis, Inc. | 2.94% | |||
ITT Corp. | 2.74% | |||
Oshkosh Corp. | 2.51% | |||
Huntington Ingalls Industries, Inc. | 2.10% | |||
JetBlue Airway’s Corp. | 2.09% | |||
Protective Life Corp. | 2.01% | |||
Astoria Financial Corp. | 1.89% | |||
URS Corp. | 1.79% | |||
| * | The Fund’s Top Ten Holdings are expressed as a percentage of net assets and the Sector Allocations are expressed as a percentage of the Fund’s equity investments market value. These percentages may change over time. |
| 16 | GUGGENHEIM ETFS ANNUAL REPORT |
Table of Contents
MANAGER’S ANALYSIS (Unaudited)
| October 31, 2012 |
GUGGENHEIM S&P MIDCAP 400® PURE GROWTH ETF
For the one-year period ended October 31, 2012, Guggenheim S&P MidCap 400® Pure Growth ETF returned 7.60%. Over the year, its benchmark, the S&P MidCap 400® Pure Growth Total Return Index, produced a 7.86% total return. RFG achieved over 99% correlation to its benchmark on a daily basis.
Health Care and Industrials were the sectors contributing most to performance. The sectors detracting most from performance were Energy and Consumer Staples.
Stocks contributing the most to return were Regeneron Pharmaceuticals, Inc. and Equinix, Inc., while Green Mountain Coffee Roasters, Inc. and Deckers Outdoor Corp. were the largest detractors.
From a style perspective, growth pure-style indices underperformed corresponding value indices at each cap size (with the greatest differential in large caps). Within the growth pure-style space, small-cap growth stocks outperformed both large-cap growth stocks and mid-cap growth stocks.
The 7.86% return of the S&P MidCap 400 Pure Growth Total Return Index underperformed both the S&P MidCap 400® Growth Total Return Index, which returned 9.80%, and the broader S&P MidCap 400® Total Return Index, which returned 12.11% for the year.
Cumulative Fund Performance: March 1, 2006 – October 31, 2012
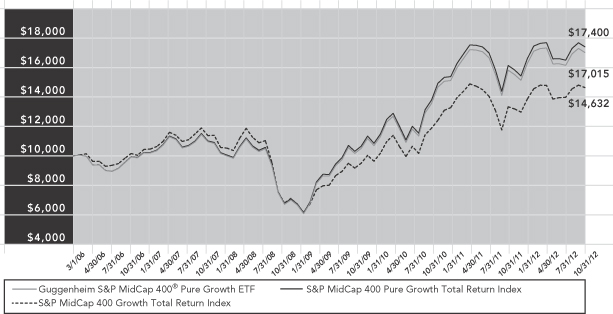
| AVERAGE ANNUAL TOTAL RETURNS FOR THE PERIOD ENDED OCTOBER 31, 2012 | ||||||||||||||||
| One Year | Three Year | Five Year | Since Inception (03/01/06) | |||||||||||||
Guggenheim S&P MidCap 400® Pure Growth ETF | 7.60% | 18.75% | 8.25% | 8.29% | ||||||||||||
S&P MidCap 400 Pure Growth Total Return Index | 7.86% | 19.08% | 8.61% | 8.66% | ||||||||||||
S&P MidCap 400 Growth Total Return Index | 9.80% | 16.87% | 4.24% | 5.87% | ||||||||||||
The returns presented above do not reflect the effect of taxes. Index returns represent total returns. Performance displayed represents past performance, which is no guarantee of future results.
Fund performance is subject to daily market volatility and may be better or worse since the end of the last quarter. For up-to-date fund performance, call 800.820.0888 or visit guggenheiminvestments.com.
| GUGGENHEIM ETFS ANNUAL REPORT | 17 |
Table of Contents
PORTFOLIO SUMMARY (Unaudited)
| October 31, 2012 | |
GUGGENHEIM S&P MIDCAP 400® PURE GROWTH ETF | ||
Sector Allocations*
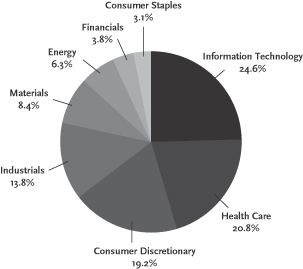
| Top 10 Holdings* | ||||
| Description | % of Net Assets | |||
Regeneron Pharmaceuticals, Inc. | 3.77% | |||
Equinix, Inc. | 2.52% | |||
Amerigroup Corp. | 2.43% | |||
Royal Gold, Inc. | 2.03% | |||
Alliance Data Systems Corp. | 2.01% | |||
Interdigital, Inc. | 1.99% | |||
PVH Corp. | 1.88% | |||
Newmarket Corp. | 1.86% | |||
Under Armour, Inc. - Class A | 1.78% | |||
Rackspace Hosting, Inc. | 1.75% | |||
| * | The Fund’s Top Ten Holdings are expressed as a percentage of net assets and the Sector Allocations are expressed as a percentage of the Fund’s equity investments market value. These percentages may change over time. |
| 18 | GUGGENHEIM ETFS ANNUAL REPORT |
Table of Contents
MANAGER’S ANALYSIS (Unaudited)
| October 31, 2012 |
GUGGENHEIM S&P SMALLCAP 600® PURE VALUE ETF
For the one-year period ended October 31, 2012, Guggenheim S&P SmallCap 600® Pure Value ETF returned 13.52%. Over the year, its benchmark, the S&P SmallCap 600® Pure Value Total Return Index, produced a 14.01% return. RZV achieved over 99% correlation to its benchmark on a daily basis.
The largest contributors to performance were the Consumer Discretionary sector and the Financials sector. Detracting from performance were the Information Technology and Telecommunication Services sectors.
Marriott Vacations Worldwide Corp. and Stewart Information Services Corp. were the holdings contributing most to return, while School Specialty, Inc. and Lincoln Educational Services Corp. were the largest detractors.
From a style perspective, value pure-style indices outperformed corresponding growth pure-style indices at each cap size (with the greatest differential in large caps). Within the value pure-style space, large-cap value stocks outperformed both mid-cap value stocks and small-cap value stocks.
The 14.01% return of the S&P SmallCap 600 Pure Value Index underperformed the S&P SmallCap 600® Value Index, which returned 15.49%, but outperformed the broader S&P SmallCap 600® Index, which returned 13.60% for the year.
Cumulative Fund Performance: March 1, 2006 – October 31, 2012
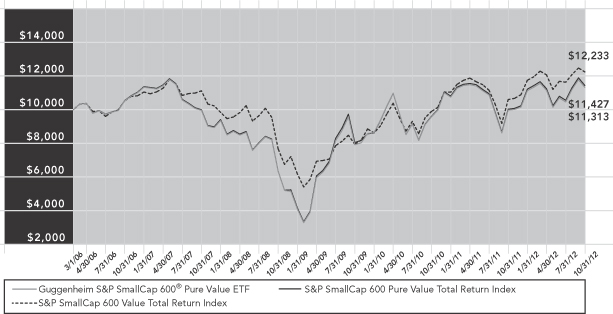
| AVERAGE ANNUAL TOTAL RETURNS FOR THE PERIOD ENDED OCTOBER 31, 2012 | ||||||||||||||||
| One Year | Three Year | Five Year | Since Inception (03/01/06) | |||||||||||||
Guggenheim S&P SmallCap 600® Pure Value ETF | 13.52% | 12.71% | 2.60% | 1.87% | ||||||||||||
S&P SmallCap 600 Pure Value Total Return Index | 14.01% | 12.42% | 2.73% | 2.02% | ||||||||||||
S&P SmallCap 600 Value Total Return Index | 15.49% | 15.51% | 1.94% | 3.07% | ||||||||||||
The returns presented above do not reflect the effect of taxes. Index returns represent total returns. Performance displayed represents past performance, which is no guarantee of future results.
Fund performance is subject to daily market volatility and may be better or worse since the end of the last quarter. For up-to-date fund performance, call 800.820.0888 or visit guggenheiminvestments.com.
| GUGGENHEIM ETFS ANNUAL REPORT | 19 |
Table of Contents
PORTFOLIO SUMMARY (Unaudited)
| October 31, 2012 | |
GUGGENHEIM S&P SMALLCAP 600® PURE VALUE ETF | ||
Sector Allocations*
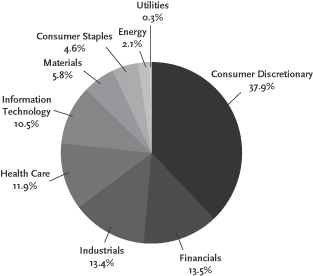
| Top 10 Holdings* | ||||
| Description | % of Net Assets | |||
Marriott Vacations Worldwide Corp. | 2.67% | |||
Tuesday Morning Corp. | 2.54% | |||
Gentiva Health Services, Inc. | 2.17% | |||
Stewart Information Services Corp. | 2.17% | |||
Healthways, Inc. | 1.89% | |||
Brown Shoe Co., Inc. | 1.87% | |||
Perry Ellis International, Inc. | 1.85% | |||
OfficeMax, INC. | 1.83% | |||
Stage Stores, Inc. | 1.49% | |||
Exterran Holdings, Inc. | 1.46% | |||
| * | The Fund’s Top Ten Holdings are expressed as a percentage of net assets and the Sector Allocations are expressed as a percentage of the Fund’s equity investments market value. These percentages may change over time. |
| 20 | GUGGENHEIM ETFS ANNUAL REPORT |
Table of Contents
MANAGER’S ANALYSIS (Unaudited)
| October 31, 2012 |
GUGGENHEIM S&P SMALLCAP 600® PURE GROWTH ETF
For the one-year period ended October 31, 2012, Guggenheim S&P SmallCap 600® Pure Growth ETF returned 9.44%. Over the year, its benchmark, the S&P SmallCap 600® Pure Growth Total Return Index, produced a 9.87% return. RZG achieved over 99% correlation to its benchmark on a daily basis.
The Information Technology and Health Care sectors were the largest contributors to performance. The Financials sector was the only one to detract from performance for the year.
Cirrus Logic, Inc. and Medidata Solutions, Inc. were the holdings contributing most to return, while BJ’s Restaurants, Inc. and Quality Systems, Inc. were the largest detractors.
From a style perspective, growth pure-style indices underperformed corresponding value pure-style indices at each cap size (with the greatest differential in large caps). Within the growth pure-style space, small-cap growth stocks outperformed both large-cap growth stocks and mid-cap growth stocks.
The 9.87% return of the S&P SmallCap 600 Pure Growth Total Return Index underperformed both the S&P SmallCap 600® Growth Total Return Index, which returned 11.87%, and the broader S&P SmallCap 600® Total Return Index, which returned 13.60% for the year.
Cumulative Fund Performance: March 1, 2006 – October 31, 2012
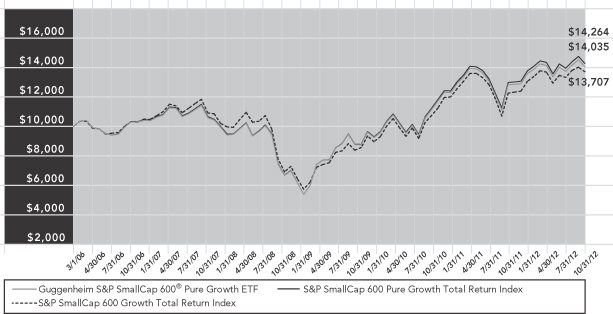
| AVERAGE ANNUAL TOTAL RETURNS FOR THE PERIOD ENDED OCTOBER 31, 2012 | ||||||||||||||||
| One Year | Three Year | Five Year | Since Inception (03/01/06) | |||||||||||||
Guggenheim S&P SmallCap 600® Pure Growth ETF | 9.44% | 17.03% | 4.19% | 5.21% | ||||||||||||
S&P SmallCap 600 Pure Growth Total Return Index | 9.87% | 17.55% | 4.40% | 5.47% | ||||||||||||
S&P SmallCap 600 Growth Total Return Index | 11.87% | 17.82% | 2.98% | 4.84% | ||||||||||||
The returns presented above do not reflect the effect of taxes. Index returns represent total returns. Performance displayed represents past performance, which is no guarantee of future results.
Fund performance is subject to daily market volatility and may be better or worse since the end of the last quarter. For up-to-date fund performance, call 800.820.0888 or visit guggenheiminvestments.com.
| GUGGENHEIM ETFS ANNUAL REPORT | 21 |
Table of Contents
PORTFOLIO SUMMARY (Unaudited)
| October 31, 2012 | |
GUGGENHEIM S&P SMALLCAP 600® PURE GROWTH ETF | ||
Sector Allocations*
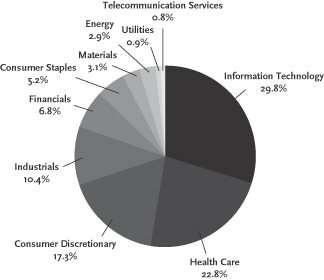
| Top 10 Holdings* | ||||
| Description | % of Net Assets | |||
Cirrus Logic, Inc. | 2.08% | |||
Medidata Solutions, Inc. | 1.55% | |||
MWI Veterinary Supply, Inc. | 1.55% | |||
Portfolio Recovery Associates, Inc. | 1.45% | |||
Allegiant Travel Co. | 1.43% | |||
Veeco Instruments, Inc. | 1.26% | |||
Buffalo Wild Wings, Inc. | 1.20% | |||
Commvault Systems, Inc. | 1.16% | |||
ICU Medical, Inc. | 1.13% | |||
DineEquity, Inc. | 1.10% | |||
| * | The Fund’s Top Ten Holdings are expressed as a percentage of net assets and the Sector Allocations are expressed as a percentage of the Fund’s equity investments market value. These percentages may change over time. |
| 22 | GUGGENHEIM ETFS ANNUAL REPORT |
Table of Contents
| SCHEDULE OF INVESTMENTS | October 31, 2012 |
GUGGENHEIM RUSSELL TOP 50® MEGA CAP ETF
| SHARES | VALUE | |||||||
COMMON STOCKS - 99.7% | ||||||||
Aerospace & Defense - 1.1% | ||||||||
United Technologies Corp. | 89,059 | $ | 6,960,852 | |||||
|
| |||||||
Total Aerospace & Defense | 6,960,852 | |||||||
|
| |||||||
Air Freight & Logistics - 0.8% | ||||||||
United Parcel Service, Inc. — Class B | 70,783 | 5,184,855 | ||||||
|
| |||||||
Total Air Freight & Logistics | 5,184,855 | |||||||
|
| |||||||
Beverages - 4.0% | ||||||||
Coca-Cola Co. (The) | 379,596 | 14,113,379 | ||||||
PepsiCo, Inc. | 152,817 | 10,581,049 | ||||||
|
| |||||||
Total Beverages | 24,694,428 | |||||||
|
| |||||||
Biotechnology - 1.1% | ||||||||
Amgen, Inc. | 75,997 | 6,577,160 | ||||||
|
| |||||||
Total Biotechnology | 6,577,160 | |||||||
|
| |||||||
Commercial Banks - 3.6% | ||||||||
US Bancorp | 185,078 | 6,146,440 | ||||||
Wells Fargo & Co. | 478,739 | 16,128,717 | ||||||
|
| |||||||
Total Commercial Banks | 22,275,157 | |||||||
|
| |||||||
Communications Equipment - 3.0% | ||||||||
Cisco Systems, Inc. | 523,440 | 8,971,762 | ||||||
QUALCOMM, Inc. | 167,508 | 9,811,781 | ||||||
|
| |||||||
Total Communications Equipment | 18,783,543 | |||||||
|
| |||||||
Computers & Peripherals - 8.7% | ||||||||
Apple, Inc. | 91,365 | 54,371,312 | ||||||
|
| |||||||
Total Computers & Peripherals | 54,371,312 | |||||||
|
| |||||||
Consumer Finance - 0.9% | ||||||||
American Express Co. | 97,837 | 5,475,937 | ||||||
|
| |||||||
Total Consumer Finance | 5,475,937 | |||||||
|
| |||||||
Diversified Financial Services - 5.8% | ||||||||
Bank of America Corp. | 1,053,014 | 9,814,090 | ||||||
Citigroup, Inc. | 286,509 | 10,712,572 | ||||||
JPMorgan Chase & Co. | 371,965 | 15,503,501 | ||||||
|
| |||||||
Total Diversified Financial Services | 36,030,163 | |||||||
|
| |||||||
Diversified Telecommunication Services - 5.2% |
| |||||||
AT&T, Inc. | 572,889 | 19,816,230 | ||||||
Verizon Communications, Inc. | 277,604 | 12,392,243 | ||||||
|
| |||||||
Total Diversified Telecommunication Services | 32,208,473 | |||||||
|
| |||||||
Energy Equipment & Services - 1.4% | ||||||||
Schlumberger Ltd. | 130,310 | 9,060,454 | ||||||
|
| |||||||
Total Energy Equipment & Services | 9,060,454 | |||||||
|
| |||||||
Food & Staples Retailing - 2.9% | ||||||||
CVS Caremark Corp. | 125,219 | 5,810,162 | ||||||
Wal-Mart Stores, Inc. | 165,146 | 12,389,253 | ||||||
|
| |||||||
Total Food & Staples Retailing | 18,199,415 | |||||||
|
| |||||||
| SHARES | VALUE | |||||||
Food Products - 1.2% | ||||||||
Kraft Foods Group, Inc.* | 57,749 | $ | 2,626,425 | |||||
Mondelez International, Inc. — Class A | 173,249 | 4,598,028 | ||||||
|
| |||||||
Total Food Products | 7,224,453 | |||||||
|
| |||||||
Health Care Providers & Services - 0.9% |
| |||||||
UnitedHealth Group, Inc. | 101,369 | 5,676,664 | ||||||
|
| |||||||
Total Health Care Providers & Services | 5,676,664 | |||||||
|
| |||||||
Hotels, Restaurants & Leisure - 1.4% |
| |||||||
McDonald’s Corp. | 99,298 | 8,619,066 | ||||||
|
| |||||||
Total Hotels, Restaurants & Leisure | 8,619,066 | |||||||
|
| |||||||
Household Products - 3.0% | ||||||||
Procter & Gamble Co. (The) | 267,748 | 18,538,872 | ||||||
|
| |||||||
Total Household Products | 18,538,872 | |||||||
|
| |||||||
Industrial Conglomerates - 4.4% | ||||||||
3M Co. | 67,798 | 5,939,105 | ||||||
General Electric Co. | 1,035,297 | 21,803,355 | ||||||
|
| |||||||
Total Industrial Conglomerates | 27,742,460 | |||||||
|
| |||||||
Insurance - 2.4% | ||||||||
Berkshire Hathaway, Inc. — Class B* | 174,014 | 15,026,109 | ||||||
|
| |||||||
Total Insurance | 15,026,109 | |||||||
|
| |||||||
Internet & Catalog Retail - 1.3% | ||||||||
Amazon.com, Inc.* | 35,355 | 8,231,351 | ||||||
|
| |||||||
Total Internet & Catalog Retail | 8,231,351 | |||||||
|
| |||||||
Internet Software & Services - 2.9% |
| |||||||
Facebook, Inc. — Class A* | 41,148 | 868,840 | ||||||
Google, Inc. — Class A* | 25,295 | 17,194,782 | ||||||
|
| |||||||
Total Internet Software & Services | 18,063,622 | |||||||
|
| |||||||
IT Services - 4.4% | ||||||||
International Business Machines Corp. | 106,511 | 20,719,585 | ||||||
Visa, Inc. — Class A | 51,065 | 7,085,779 | ||||||
|
| |||||||
Total IT Services | 27,805,364 | |||||||
|
| |||||||
Machinery - 0.9% | ||||||||
Caterpillar, Inc. | 63,764 | 5,407,825 | ||||||
|
| |||||||
Total Machinery | 5,407,825 | |||||||
|
| |||||||
Media - 2.9% | ||||||||
Comcast Corp. — Class A | 262,394 | 9,842,399 | ||||||
Walt Disney Co. (The) | 174,643 | 8,569,732 | ||||||
|
| |||||||
Total Media | 18,412,131 | |||||||
|
| |||||||
Oil, Gas & Consumable Fuels - 12.2% |
| |||||||
Chevron Corp. | 192,748 | 21,242,757 | ||||||
ConocoPhillips | 123,561 | 7,148,004 | ||||||
Exxon Mobil Corp. | 456,920 | 41,657,396 | ||||||
Occidental Petroleum Corp. | 79,251 | 6,257,659 | ||||||
|
| |||||||
Total Oil, Gas & Consumable Fuels | 76,305,816 | |||||||
|
| |||||||
| See Notes to Financial Statements. | GUGGENHEIM ETFS ANNUAL REPORT | 23 |
Table of Contents
| SCHEDULE OF INVESTMENTS (concluded) | October 31, 2012 |
GUGGENHEIM RUSSELL TOP 50® MEGA CAP ETF
| SHARES | VALUE | |||||||
Pharmaceuticals - 10.6% | ||||||||
Abbott Laboratories | 153,742 | $ | 10,073,176 | |||||
Bristol-Myers Squibb Co. | 165,043 | 5,487,680 | ||||||
Johnson & Johnson | 268,359 | 19,005,184 | ||||||
Merck & Co., Inc. | 297,195 | 13,561,008 | ||||||
Pfizer, Inc. | 731,684 | 18,196,981 | ||||||
|
| |||||||
Total Pharmaceuticals | 66,324,029 | |||||||
|
| |||||||
Road & Rail - 0.9% | ||||||||
Union Pacific Corp. | 46,529 | 5,724,463 | ||||||
|
| |||||||
Total Road & Rail | 5,724,463 | |||||||
|
| |||||||
Semiconductors & Semiconductor Equipment - 1.7% | ||||||||
Intel Corp. | 491,592 | 10,630,677 | ||||||
|
| |||||||
Total Semiconductors & Semiconductor Equipment | 10,630,677 | |||||||
|
| |||||||
Software - 5.2% | ||||||||
Microsoft Corp. | 735,497 | 20,987,407 | ||||||
Oracle Corp. | 373,343 | 11,592,300 | ||||||
|
| |||||||
Total Software | 32,579,707 | |||||||
|
| |||||||
Specialty Retail - 1.5% | ||||||||
Home Depot, Inc. | 149,563 | 9,180,177 | ||||||
|
| |||||||
Total Specialty Retail | 9,180,177 | |||||||
|
| |||||||
Tobacco - 3.4% | ||||||||
Altria Group, Inc. | 198,831 | 6,322,826 | ||||||
Philip Morris International, Inc. | 166,660 | 14,759,409 | ||||||
|
| |||||||
Total Tobacco | 21,082,235 | |||||||
|
| |||||||
Total Common Stocks | 622,396,770 | |||||||
|
| |||||||
| FACE AMOUNT | VALUE | |||||||
REPURCHASE AGREEMENTS - 0.2% |
| |||||||
State Street Bank & Trust Co., 0.010%, dated 10/31/12, to be repurchased at $1,315,000 on 11/01/12 collateralized by $1,340,000 FNMA at 0.74% due 06/04/15 with a value of $1,348,689b | $ | 1,315,000 | $ | 1,315,000 | ||||
|
| |||||||
Total Repurchase Agreements | 1,315,000 | |||||||
|
| |||||||
Total Investments 99.9%a | 623,711,770 | |||||||
|
| |||||||
Other Assets and Liabilities, net - 0.1% |
| 755,823 | ||||||
|
| |||||||
Net Assets - 100.0% | $ | 624,467,593 | ||||||
|
| |||||||
| * | Non-Income Producing Security. |
| a | Unless otherwise indicated, the values of the Investments are determined based on Level 1 inputs. |
| b | Values determined based on Level 2 inputs. |
FNMA — Federal National Mortgage Association
| 24 | GUGGENHEIM ETFS ANNUAL REPORT | See Notes to Financial Statements. |
Table of Contents
| SCHEDULE OF INVESTMENTS | October 31, 2012 |
GUGGENHEIM S&P 500® PURE VALUE ETF
| SHARES | VALUE | |||||||
COMMON STOCKS - 99.8% |
| |||||||
Aerospace & Defense - 2.5% |
| |||||||
L-3 Communications Holdings, Inc. | 12,659 | $ | 934,234 | |||||
Northrop Grumman Corp. | 12,844 | 882,255 | ||||||
Textron, Inc. | 13,648 | 344,066 | ||||||
|
| |||||||
Total Aerospace & Defense | 2,160,555 | |||||||
|
| |||||||
Airlines - 0.9% |
| |||||||
Southwest Airlines Co. | 82,143 | 724,501 | ||||||
|
| |||||||
Total Airlines | 724,501 | |||||||
|
| |||||||
Auto Components - 0.6% |
| |||||||
Goodyear Tire & Rubber Co. (The)* | 21,654 | 247,072 | ||||||
Johnson Controls, Inc. | 11,762 | 302,872 | ||||||
|
| |||||||
Total Auto Components | 549,944 | |||||||
|
| |||||||
Automobiles - 0.8% |
| |||||||
Ford Motor Co. | 62,105 | 693,092 | ||||||
|
| |||||||
Total Automobiles | 693,092 | |||||||
|
| |||||||
Beverages - 0.4% |
| |||||||
Molson Coors Brewing Co. — Class B | 8,127 | 350,599 | ||||||
|
| |||||||
Total Beverages | 350,599 | |||||||
|
| |||||||
Capital Markets - 5.6% |
| |||||||
Ameriprise Financial, Inc. | 8,582 | 500,931 | ||||||
Bank of New York Mellon Corp. (The) | 32,772 | 809,796 | ||||||
E*Trade Financial Corp.* | 79,656 | 665,924 | ||||||
Goldman Sachs Group, Inc. (The) | 7,759 | 949,624 | ||||||
Legg Mason, Inc. | 23,175 | 590,499 | ||||||
Morgan Stanley | 73,238 | 1,272,877 | ||||||
|
| |||||||
Total Capital Markets | 4,789,651 | |||||||
|
| |||||||
Chemicals - 0.4% |
| |||||||
Dow Chemical Co. (The) | 11,265 | 330,064 | ||||||
|
| |||||||
Total Chemicals | 330,064 | |||||||
|
| |||||||
Commercial Banks - 6.0% |
| |||||||
BB&T Corp. | 12,522 | 362,512 | ||||||
Comerica, Inc. | 15,371 | 458,209 | ||||||
Fifth Third Bancorp | 28,707 | 417,113 | ||||||
First Horizon National Corp. | 34,428 | 320,525 | ||||||
Huntington Bancshares, Inc. | 55,965 | 357,616 | ||||||
KeyCorp | 77,156 | 649,653 | ||||||
PNC Financial Services Group, Inc. | 7,285 | 423,914 | ||||||
Regions Financial Corp. | 108,134 | 705,034 | ||||||
SunTrust Banks, Inc. | 39,008 | 1,061,018 | ||||||
Wells Fargo & Co. | 11,014 | 371,062 | ||||||
|
| |||||||
Total Commercial Banks | 5,126,656 | |||||||
|
| |||||||
Commercial Services & Supplies - 1.6% |
| |||||||
Avery Dennison Corp. | 23,835 | 771,777 | ||||||
R.R. Donnelley & Sons Co.a | 59,834 | 599,537 | ||||||
|
| |||||||
Total Commercial Services & Supplies | 1,371,314 | |||||||
|
| |||||||
Communications Equipment - 0.5% |
| |||||||
Harris Corp. | 9,851 | 450,979 | ||||||
|
| |||||||
Total Communications Equipment | 450,979 | |||||||
|
| |||||||
| SHARES | VALUE | |||||||
Computers & Peripherals - 1.2% |
| |||||||
Dell, Inc. | 16,572 | $ | 152,960 | |||||
Hewlett-Packard Co. | 23,020 | 318,827 | ||||||
Western Digital Corp. | 16,622 | 568,971 | ||||||
|
| |||||||
Total Computers & Peripherals | 1,040,758 | |||||||
|
| |||||||
Construction & Engineering - 0.5% |
| |||||||
Jacobs Engineering Group, Inc.* | 10,275 | 396,512 | ||||||
|
| |||||||
Total Construction & Engineering | 396,512 | |||||||
|
| |||||||
Consumer Finance - 1.5% |
| |||||||
Capital One Financial Corp. | 15,833 | 952,672 | ||||||
SLM Corp. | 19,700 | 346,326 | ||||||
|
| |||||||
Total Consumer Finance | 1,298,998 | |||||||
|
| |||||||
Containers & Packaging - 1.5% |
| |||||||
Bemis Co., Inc. | 9,327 | 308,257 | ||||||
Owens-Illinois, Inc.* | 22,878 | 445,892 | ||||||
Sealed Air Corp. | 30,309 | 491,612 | ||||||
|
| |||||||
Total Containers & Packaging | 1,245,761 | |||||||
|
| |||||||
Diversified Financial Services - 6.1% |
| |||||||
Bank of America Corp. | 160,470 | 1,495,580 | ||||||
Citigroup, Inc. | 38,278 | 1,431,215 | ||||||
CME Group, Inc. | 5,837 | 326,463 | ||||||
JPMorgan Chase & Co. | 23,348 | 973,145 | ||||||
Leucadia National Corp. | 20,093 | 456,111 | ||||||
NASDAQ OMX Group, Inc. (The) | 13,264 | 315,816 | ||||||
NYSE Euronext | 10,011 | 247,872 | ||||||
|
| |||||||
Total Diversified Financial Services | 5,246,202 | |||||||
|
| |||||||
Diversified Telecommunication Services - 0.6% |
| |||||||
CenturyLink, Inc. | 6,992 | 268,353 | ||||||
Frontier Communications Corp.a | 54,119 | 255,442 | ||||||
|
| |||||||
Total Diversified Telecommunication Services | 523,795 | |||||||
|
| |||||||
Electric Utilities - 1.1% |
| |||||||
Edison International | 9,680 | 454,379 | ||||||
Pepco Holdings, Inc. | 22,974 | 456,494 | ||||||
|
| |||||||
Total Electric Utilities | 910,873 | |||||||
|
| |||||||
Electronic Equipment, Instruments & Components - 1.2% |
| |||||||
Corning, Inc. | 22,146 | 260,215 | ||||||
Jabil Circuit, Inc. | 44,205 | 766,515 | ||||||
|
| |||||||
Total Electronic Equipment, Instruments & Components | 1,026,730 | |||||||
|
| |||||||
Energy Equipment & Services - 0.2% |
| |||||||
Nabors Industries Ltd.* | 14,344 | 193,500 | ||||||
|
| |||||||
Total Energy Equipment & Services | 193,500 | |||||||
|
| |||||||
Food & Staples Retailing - 3.7% |
| |||||||
CVS Caremark Corp. | 11,837 | 549,237 | ||||||
Kroger Co. (The) | 34,928 | 880,884 | ||||||
Safeway, Inc.a | 50,479 | 823,312 | ||||||
Sysco Corp. | 11,096 | 344,753 | ||||||
Walgreen Co. | 15,183 | 534,897 | ||||||
|
| |||||||
Total Food & Staples Retailing | 3,133,083 | |||||||
|
| |||||||
| See Notes to Financial Statements. | GUGGENHEIM ETFS ANNUAL REPORT | 25 |
Table of Contents
| SCHEDULE OF INVESTMENTS (continued) | October 31, 2012 |
GUGGENHEIM S&P 500® PURE VALUE ETF
| SHARES | VALUE | |||||||
Food Products - 4.4% |
| |||||||
Archer-Daniels-Midland Co. | 43,509 | $ | 1,167,782 | |||||
Dean Foods Co.* | 97,241 | 1,637,538 | ||||||
Tyson Foods, Inc. — Class A | 57,021 | 958,523 | ||||||
|
| |||||||
Total Food Products | 3,763,843 | |||||||
|
| |||||||
Health Care Providers & Services - 6.6% |
| |||||||
AmerisourceBergen Corp. | 20,823 | 821,259 | ||||||
Cardinal Health, Inc. | 19,472 | 800,883 | ||||||
CIGNA Corp. | 10,724 | 546,924 | ||||||
Coventry Health Care, Inc. | 26,071 | 1,137,738 | ||||||
McKesson Corp. | 9,338 | 871,329 | ||||||
Tenet Healthcare Corp.* | 61,018 | 1,440,025 | ||||||
|
| |||||||
Total Health Care Providers & Services | 5,618,158 | |||||||
|
| |||||||
Household Durables - 3.3% |
| |||||||
Whirlpool Corp. | 29,138 | 2,846,200 | ||||||
|
| |||||||
Total Household Durables | 2,846,200 | |||||||
|
| |||||||
Independent Power Producers & Energy Traders - 1.5% |
| |||||||
NRG Energy, Inc. | 59,582 | 1,284,588 | ||||||
|
| |||||||
Total Independent Power Producers & Energy Traders | 1,284,588 | |||||||
|
| |||||||
Insurance - 18.8% |
| |||||||
ACE Ltd. | 6,356 | 499,899 | ||||||
Allstate Corp. (The) | 35,489 | 1,418,850 | ||||||
American International Group, Inc.* | 74,930 | 2,617,305 | ||||||
Assurant, Inc. | 20,202 | 763,838 | ||||||
Cincinnati Financial Corp. | 14,139 | 563,298 | ||||||
Genworth Financial, Inc. — Class A* | 207,962 | 1,239,454 | ||||||
Hartford Financial Services Group, Inc. | 83,661 | 1,816,280 | ||||||
Lincoln National Corp. | 58,444 | 1,448,827 | ||||||
Loews Corp. | 13,789 | 582,999 | ||||||
MetLife, Inc. | 34,552 | 1,226,251 | ||||||
Principal Financial Group, Inc. | 27,306 | 752,007 | ||||||
Prudential Financial, Inc. | 18,288 | 1,043,330 | ||||||
Torchmark Corp. | 6,318 | 319,628 | ||||||
Unum Group | 37,236 | 755,146 | ||||||
XL Group PLC | 40,783 | 1,008,971 | ||||||
|
| |||||||
Total Insurance | 16,056,083 | |||||||
|
| |||||||
IT Services - 3.2% |
| |||||||
Computer Sciences Corp. | 71,762 | 2,185,153 | ||||||
SAIC, Inc. | 53,753 | 590,745 | ||||||
|
| |||||||
Total IT Services | 2,775,898 | |||||||
|
| |||||||
Life Sciences Tools & Services - 0.5% |
| |||||||
PerkinElmer, Inc. | 13,267 | 410,348 | ||||||
|
| |||||||
Total Life Sciences Tools & Services | 410,348 | |||||||
|
| |||||||
Machinery - 0.6% |
| |||||||
Ingersoll-Rand PLC | 10,087 | 474,392 | ||||||
|
| |||||||
Total Machinery | 474,392 | |||||||
|
| |||||||
Media - 1.8% |
| |||||||
Gannett Co., Inc. | 55,352 | 935,449 | ||||||
Washington Post Co. (The) — Class Ba | 1,764 | 588,311 | ||||||
|
| |||||||
Total Media | 1,523,760 | |||||||
|
| |||||||
| SHARES | VALUE | |||||||
Metals & Mining - 1.4% |
| |||||||
Alcoa, Inc. | 82,898 | $ | 710,436 | |||||
United States Steel Corp.a | 23,710 | 483,447 | ||||||
|
| |||||||
Total Metals & Mining | 1,193,883 | |||||||
|
| |||||||
Multi-Utilities - 0.7% |
| |||||||
DTE Energy Co. | 4,902 | 304,414 | ||||||
Integrys Energy Group, Inc. | 5,663 | 306,029 | ||||||
|
| |||||||
Total Multi-Utilities | 610,443 | |||||||
|
| |||||||
Multiline Retail - 0.5% |
| |||||||
J.C. Penney Co., Inc.a | 16,941 | 406,753 | ||||||
|
| |||||||
Total Multiline Retail | 406,753 | |||||||
|
| |||||||
Office Electronics - 0.6% |
| |||||||
Xerox Corp. | 84,534 | 544,399 | ||||||
|
| |||||||
Total Office Electronics | 544,399 | |||||||
|
| |||||||
Oil, Gas & Consumable Fuels - 10.0% |
| |||||||
ConocoPhillips | 9,163 | 530,080 | ||||||
Hess Corp. | 10,440 | 545,594 | ||||||
Marathon Oil Corp. | 47,991 | 1,442,609 | ||||||
Marathon Petroleum Corp. | 28,406 | 1,560,342 | ||||||
Murphy Oil Corp. | 11,149 | 668,940 | ||||||
Phillips 66 | 8,757 | 412,980 | ||||||
Tesoro Corp. | 42,819 | 1,614,705 | ||||||
Valero Energy Corp. | 62,154 | 1,808,681 | ||||||
|
| |||||||
Total Oil, Gas & Consumable Fuels | 8,583,931 | |||||||
|
| |||||||
Paper & Forest Products - 0.6% |
| |||||||
International Paper Co. | 13,279 | 475,787 | ||||||
|
| |||||||
Total Paper & Forest Products | 475,787 | |||||||
|
| |||||||
Real Estate Investment Trusts (REITs) - 0.5% |
| |||||||
Weyerhaeuser Co. | 16,419 | 454,642 | ||||||
|
| |||||||
Total Real Estate Investment Trusts (REITs) | 454,642 | |||||||
|
| |||||||
Road & Rail 0.3% |
| |||||||
Ryder System, Inc. | 5,587 | 252,085 | ||||||
|
| |||||||
Total Road & Rail | 252,085 | |||||||
|
| |||||||
Semiconductors & Semiconductor Equipment - 0.8% |
| |||||||
Micron Technology, Inc.* | 122,349 | 663,743 | ||||||
|
| |||||||
Total Semiconductors & Semiconductor Equipment | 663,743 | |||||||
|
| |||||||
Specialty Retail - 2.7% |
| |||||||
AutoNation, Inc.*a | 7,692 | 341,525 | ||||||
Best Buy Co., Inc. | 39,180 | 595,928 | ||||||
GameStop Corp. — Class Aa | 39,727 | 906,967 | ||||||
Staples, Inc. | 43,314 | 498,761 | ||||||
|
| |||||||
Total Specialty Retail | 2,343,181 | |||||||
|
| |||||||
Thrifts & Mortgage Finance - 1.7% |
| |||||||
Hudson City Bancorp, Inc. | 173,185 | 1,469,475 | ||||||
|
| |||||||
Total Thrifts & Mortgage Finance | 1,469,475 | |||||||
|
| |||||||
| 26 | GUGGENHEIM ETFS ANNUAL REPORT | See Notes to Financial Statements. |
Table of Contents
| SCHEDULE OF INVESTMENTS (concluded) | October 31, 2012 |
GUGGENHEIM S&P 500® PURE VALUE ETF
| SHARES | VALUE | |||||||
Wireless Telecommunication Services - 2.4% |
| |||||||
MetroPCS Communications, Inc.* | 49,043 | $ | 500,729 | |||||
Sprint Nextel Corp.* | 278,029 | 1,540,281 | ||||||
|
| |||||||
Total Wireless Telecommunication Services | 2,041,010 | |||||||
|
| |||||||
Total Common Stocks |
| 85,356,169 | ||||||
|
| |||||||
SHORT TERM INVESTMENTS - 0.2% |
| |||||||
SSgA Government Money Market Fund | 198,486 | 198,486 | ||||||
|
| |||||||
Total Short Term Investments |
| 198,486 | ||||||
|
| |||||||
FACE | ||||||||
SECURITIES LENDING COLLATERAL - 2.6%d |
| |||||||
Joint Repurchase Agreements | ||||||||
Merrill Lynch, Fenner & Smith, Inc. issued 10/31/12 at 0.28% due 11/01/12b | $ | 835,045 | 835,045 | |||||
RBS Securities, Inc. | 1,419,785 | 1,419,785 | ||||||
|
| |||||||
Total Securities Lending Collateral |
| 2,254,830 | ||||||
|
| |||||||
Total Investments - 102.6%c |
| 87,809,485 | ||||||
|
| |||||||
Other Assets and Liabilities, net - (2.6)% |
| (2,226,597 | ) | |||||
|
| |||||||
Net Assets - 100.0% | $ | 85,582,888 | ||||||
|
| |||||||
| See Notes to Financial Statements. | GUGGENHEIM ETFS ANNUAL REPORT | 27 |
| * | Non-Income Producing Security. |
| a | All or a portion of this security was on loan as of October 31, 2012. |
| b | Values determined based on Level 2 inputs (Note E). |
| c | Unless otherwise indicated, the values of the Investments are determined based on Level 1 inputs. |
| d | Securities lending collateral (Note H). |
Table of Contents
| SCHEDULE OF INVESTMENTS | October 31, 2012 |
GUGGENHEIM S&P 500® PURE GROWTH ETF
| SHARES | VALUE | |||||||
COMMON STOCKS - 99.9% |
| |||||||
Aerospace & Defense - 0.7% |
| |||||||
Lockheed Martin Corp. | 23,998 | $ | 2,247,893 | |||||
|
| |||||||
Total Aerospace & Defense | 2,247,893 | |||||||
|
| |||||||
Air Freight & Logistics - 1.1% |
| |||||||
C.H. Robinson Worldwide, Inc. | 31,413 | 1,895,146 | ||||||
United Parcel Service, Inc. — Class B | 22,243 | 1,629,300 | ||||||
|
| |||||||
Total Air Freight & Logistics | 3,524,446 | |||||||
|
| |||||||
Beverages - 2.8% |
| |||||||
Brown-Forman Corp. — Class B | 23,776 | 1,523,091 | ||||||
Coca-Cola Co. (The) | 64,564 | 2,400,489 | ||||||
Monster Beverage Corp.* | 49,876 | 2,227,961 | ||||||
PepsiCo, Inc. | 43,955 | 3,043,444 | ||||||
|
| |||||||
Total Beverages | 9,194,985 | |||||||
|
| |||||||
Biotechnology - 6.3% |
| |||||||
Alexion Pharmaceuticals, Inc.* | 53,650 | 4,848,887 | ||||||
Amgen, Inc. | 34,192 | 2,959,147 | ||||||
Biogen Idec, Inc.* | 30,750 | 4,250,265 | ||||||
Celgene Corp.* | 55,487 | 4,068,307 | ||||||
Gilead Sciences, Inc.* | 71,994 | 4,835,117 | ||||||
|
| |||||||
Total Biotechnology | 20,961,723 | |||||||
|
| |||||||
Capital Markets - 1.8% |
| |||||||
BlackRock, Inc. | 10,649 | 2,019,902 | ||||||
Franklin Resources, Inc. | 20,256 | 2,588,717 | ||||||
T. Rowe Price Group, Inc. | 21,848 | 1,418,809 | ||||||
|
| |||||||
Total Capital Markets | 6,027,428 | |||||||
|
| |||||||
Chemicals - 5.6% |
| |||||||
CF Industries Holdings, Inc. | 11,610 | 2,382,256 | ||||||
Ecolab, Inc. | 30,648 | 2,133,101 | ||||||
FMC Corp. | 44,573 | 2,385,547 | ||||||
International Flavors & Fragrances, Inc. | 36,112 | 2,333,557 | ||||||
Monsanto Co. | 14,964 | 1,287,951 | ||||||
PPG Industries, Inc. | 19,356 | 2,266,200 | ||||||
Praxair, Inc. | 13,493 | 1,433,092 | ||||||
Sherwin-Williams Co. (The) | 16,744 | 2,387,360 | ||||||
Sigma-Aldrich Corp. | 27,567 | 1,933,549 | ||||||
|
| |||||||
Total Chemicals | 18,542,613 | |||||||
|
| |||||||
Commercial Services & Supplies - 1.2% |
| |||||||
Stericycle, Inc.* | 41,399 | 3,922,969 | ||||||
|
| |||||||
Total Commercial Services & Supplies | 3,922,969 | |||||||
|
| |||||||
Communications Equipment - 1.4% |
| |||||||
F5 Networks, Inc.* | 30,147 | 2,486,525 | ||||||
QUALCOMM, Inc. | 39,665 | 2,323,377 | ||||||
|
| |||||||
Total Communications Equipment | 4,809,902 | |||||||
|
| |||||||
Computers & Peripherals - 2.9% |
| |||||||
Apple, Inc. | 9,985 | 5,942,073 | ||||||
NetApp, Inc.* | 55,204 | 1,484,988 | ||||||
SanDisk Corp.* | 53,039 | 2,214,909 | ||||||
|
| |||||||
Total Computers & Peripherals | 9,641,970 | |||||||
|
| |||||||
| SHARES | VALUE | |||||||
Diversified Consumer Services - 0.4% |
| |||||||
Apollo Group, Inc. — Class A* | 68,500 | $ | 1,375,480 | |||||
|
| |||||||
Total Diversified Consumer Services | 1,375,480 | |||||||
|
| |||||||
Diversified Financial Services - 1.1% |
| |||||||
IntercontinentalExchange, Inc.* | 27,833 | 3,646,123 | ||||||
|
| |||||||
Total Diversified Financial Services | 3,646,123 | |||||||
|
| |||||||
Electrical Equipment - 0.9% |
| |||||||
Rockwell Automation, Inc. | 17,726 | 1,259,610 | ||||||
Roper Industries, Inc. | 14,866 | 1,622,921 | ||||||
|
| |||||||
Total Electrical Equipment | 2,882,531 | |||||||
|
| |||||||
Electronic Equipment, Instruments & Components - 0.7% |
| |||||||
Amphenol Corp. — Class A | 38,731 | 2,328,895 | ||||||
|
| |||||||
Total Electronic Equipment, Instruments & Components | 2,328,895 | |||||||
|
| |||||||
Energy Equipment & Services - 2.0% |
| |||||||
Cameron International Corp.* | 30,850 | 1,562,244 | ||||||
Diamond Offshore Drilling, Inc.a | 35,060 | 2,427,555 | ||||||
Helmerich & Payne, Inc. | 28,379 | 1,356,516 | ||||||
Schlumberger Ltd. | 16,664 | 1,158,648 | ||||||
|
| |||||||
Total Energy Equipment & Services | 6,504,963 | |||||||
|
| |||||||
Food Products - 1.4% |
| |||||||
Hershey Co. (The) | 29,955 | 2,062,402 | ||||||
Kellogg Co. | 26,406 | 1,381,562 | ||||||
Mead Johnson Nutrition Co. | 22,075 | 1,361,144 | ||||||
|
| |||||||
Total Food Products | 4,805,108 | |||||||
|
| |||||||
Health Care Equipment & Supplies - 6.9% |
| |||||||
Baxter International, Inc. | 36,921 | 2,312,362 | ||||||
Becton, Dickinson and Co. | 25,251 | 1,910,996 | ||||||
C.R. Bard, Inc. | 28,378 | 2,729,680 | ||||||
Edwards Lifesciences Corp.* | 36,098 | 3,134,389 | ||||||
Intuitive Surgical, Inc.* | 7,730 | 4,191,361 | ||||||
St Jude Medical, Inc. | 45,833 | 1,753,570 | ||||||
Stryker Corp. | 37,960 | 1,996,696 | ||||||
Varian Medical Systems, Inc.* | 37,197 | 2,483,272 | ||||||
Zimmer Holdings, Inc. | 35,411 | 2,273,740 | ||||||
|
| |||||||
Total Health Care Equipment & Supplies | 22,786,066 | |||||||
|
| |||||||
Health Care Providers & Services - 4.4% |
| |||||||
DaVita, Inc.* | 26,836 | 3,019,587 | ||||||
Express Scripts Holding Co.* | 69,416 | 4,271,861 | ||||||
Laboratory Corp. of America Holdings* | 30,198 | 2,558,676 | ||||||
Quest Diagnostics, Inc. | 33,519 | 1,934,717 | ||||||
UnitedHealth Group, Inc. | 51,737 | 2,897,272 | ||||||
|
| |||||||
Total Health Care Providers & Services | 14,682,113 | |||||||
|
| |||||||
Health Care Technology - 0.6% |
| |||||||
Cerner Corp.* | 28,043 | 2,136,596 | ||||||
|
| |||||||
Total Health Care Technology | 2,136,596 | |||||||
|
| |||||||
| 28 | GUGGENHEIM ETFS ANNUAL REPORT | See Notes to Financial Statements. |
Table of Contents
| SCHEDULE OF INVESTMENTS (continued) | October 31, 2012 |
GUGGENHEIM S&P 500® PURE GROWTH ETF
| SHARES | VALUE | |||||||
Hotels, Restaurants & Leisure - 2.9% |
| |||||||
Chipotle Mexican Grill, Inc.* | 10,016 | $ | 2,549,372 | |||||
McDonald’s Corp. | 19,677 | 1,707,964 | ||||||
Starbucks Corp. | 24,257 | 1,113,396 | ||||||
Wynn Resorts Ltd. | 18,567 | 2,247,721 | ||||||
Yum! Brands, Inc. | 31,226 | 2,189,255 | ||||||
|
| |||||||
Total Hotels, Restaurants & Leisure | 9,807,708 | |||||||
|
| |||||||
Household Products - 1.2% | ||||||||
Colgate-Palmolive Co. | 19,092 | 2,003,896 | ||||||
Kimberly-Clark Corp. | 22,248 | 1,856,596 | ||||||
|
| |||||||
Total Household Products | 3,860,492 | |||||||
|
| |||||||
Insurance - 0.8% | ||||||||
AFLAC, Inc. | 51,474 | 2,562,376 | ||||||
|
| |||||||
Total Insurance | 2,562,376 | |||||||
|
| |||||||
Internet & Catalog Retail - 3.6% | ||||||||
Amazon.com, Inc.* | 17,069 | 3,974,004 | ||||||
Netflix, Inc.*a | 49,965 | 3,951,732 | ||||||
priceline.com, Inc.* | 7,032 | 4,034,751 | ||||||
|
| |||||||
Total Internet & Catalog Retail | 11,960,487 | |||||||
|
| |||||||
Internet Software & Services - 1.7% | ||||||||
Akamai Technologies, Inc.* | 45,063 | 1,711,943 | ||||||
Google, Inc. — Class A* | 5,597 | 3,804,673 | ||||||
|
| |||||||
Total Internet Software & Services | 5,516,616 | |||||||
|
| |||||||
IT Services - 6.1% | ||||||||
Automatic Data Processing, Inc. | 32,713 | 1,890,484 | ||||||
Cognizant Technology Solutions Corp. — Class A* | 49,417 | 3,293,643 | ||||||
Fiserv, Inc.* | 29,993 | 2,247,676 | ||||||
International Business Machines Corp. | 8,676 | 1,687,743 | ||||||
Mastercard, Inc. — Class A | 6,956 | 3,206,229 | ||||||
Teradata Corp.* | 36,778 | 2,512,305 | ||||||
Visa, Inc. — Class A | 38,224 | 5,303,962 | ||||||
|
| |||||||
Total IT Services | 20,142,042 | |||||||
|
| |||||||
Life Sciences Tools & Services - 1.3% |
| |||||||
Life Technologies Corp.* | 45,870 | 2,243,501 | ||||||
Waters Corp.* | 24,338 | 1,991,092 | ||||||
|
| |||||||
Total Life Sciences Tools & Services | 4,234,593 | |||||||
|
| |||||||
Machinery - 1.4% | ||||||||
Deere & Co. | 23,586 | 2,015,188 | ||||||
Joy Global, Inc. | 14,703 | 918,202 | ||||||
Pall Corp. | 29,101 | 1,832,199 | ||||||
|
| |||||||
Total Machinery | 4,765,589 | |||||||
|
| |||||||
Media - 4.0% | ||||||||
DIRECTV* | 67,712 | 3,460,760 | ||||||
Discovery Communications, Inc. — Class A* | 73,031 | 4,310,290 | ||||||
Scripps Networks Interactive, Inc. — Class A | 60,047 | 3,646,054 | ||||||
Viacom, Inc. — Class B | 36,887 | 1,891,196 | ||||||
|
| |||||||
Total Media | 13,308,300 | |||||||
|
| |||||||
| SHARES | VALUE | |||||||
Metals & Mining - 1.4% | ||||||||
Cliffs Natural Resources, Inc. | 36,126 | $ | 1,310,290 | |||||
Newmont Mining Corp. | 61,608 | 3,360,716 | ||||||
|
| |||||||
Total Metals & Mining | 4,671,006 | |||||||
|
| |||||||
Multiline Retail - 1.9% |
| |||||||
Dollar Tree, Inc.* | 79,808 | 3,181,945 | ||||||
Family Dollar Stores, Inc. | 45,647 | 3,010,876 | ||||||
|
| |||||||
Total Multiline Retail | 6,192,821 | |||||||
|
| |||||||
Oil, Gas & Consumable Fuels - 2.8% |
| |||||||
Cabot Oil & Gas Corp. | 27,750 | 1,303,695 | ||||||
EOG Resources, Inc. | 18,802 | 2,190,245 | ||||||
Peabody Energy Corp. | 58,704 | 1,637,842 | ||||||
Pioneer Natural Resources Co. | 15,934 | 1,683,427 | ||||||
Southwestern Energy Co.* | 70,008 | 2,429,277 | ||||||
|
| |||||||
Total Oil, Gas & Consumable Fuels | 9,244,486 | |||||||
|
| |||||||
Personal Products - 0.4% |
| |||||||
Estee Lauder Cos., Inc. (The) — Class A | 24,589 | 1,515,174 | ||||||
|
| |||||||
Total Personal Products | 1,515,174 | |||||||
|
| |||||||
Pharmaceuticals - 4.8% |
| |||||||
Abbott Laboratories | 43,481 | 2,848,875 | ||||||
Allergan, Inc. | 19,960 | 1,794,803 | ||||||
Johnson & Johnson | 20,880 | 1,478,722 | ||||||
Mylan, Inc.* | 157,854 | 4,000,020 | ||||||
Perrigo Co. | 31,619 | 3,636,501 | ||||||
Watson Pharmaceuticals, Inc.* | 27,088 | 2,328,214 | ||||||
|
| |||||||
Total Pharmaceuticals | 16,087,135 | |||||||
|
| |||||||
Professional Services - 0.6% |
| |||||||
Dun & Bradstreet Corp. (The) | 24,815 | 2,011,008 | ||||||
|
| |||||||
Total Professional Services | 2,011,008 | |||||||
|
| |||||||
Real Estate Investment Trusts (REITs) - 1.4% |
| |||||||
American Tower Corp. | 43,529 | 3,277,298 | ||||||
Ventas, Inc. | 20,707 | 1,310,132 | ||||||
|
| |||||||
Total Real Estate Investment Trusts (REITs) | 4,587,430 | |||||||
|
| |||||||
Road & Rail - 0.6% |
| |||||||
Union Pacific Corp. | 15,322 | 1,885,066 | ||||||
|
| |||||||
Total Road & Rail | 1,885,066 | |||||||
|
| |||||||
Semiconductors & Semiconductor Equipment - 4.6% |
| |||||||
Altera Corp. | 74,724 | 2,277,587 | ||||||
Broadcom Corp. — Class A* | 76,259 | 2,404,827 | ||||||
First Solar, Inc.*a | 90,248 | 2,193,929 | ||||||
KLA-Tencor Corp. | 52,880 | 2,459,978 | ||||||
Lam Research Corp.* | 71,855 | 2,543,667 | ||||||
Microchip Technology, Inc.a | 62,345 | 1,954,516 | ||||||
Xilinx, Inc. | 48,430 | 1,586,567 | ||||||
|
| |||||||
Total Semiconductors & Semiconductor Equipment | 15,421,071 | |||||||
|
| |||||||
| See Notes to Financial Statements. | GUGGENHEIM ETFS ANNUAL REPORT | 29 |
Table of Contents
| SCHEDULE OF INVESTMENTS (concluded) | October 31, 2012 |
GUGGENHEIM S&P 500® PURE GROWTH ETF
| SHARES | VALUE | |||||||
Software - 4.0% |
| |||||||
Citrix Systems, Inc.* | 29,833 | $ | 1,843,978 | |||||
Intuit, Inc. | 43,774 | 2,601,051 | ||||||
Oracle Corp. | 62,332 | 1,935,409 | ||||||
Red Hat, Inc.* | 64,850 | 3,188,674 | ||||||
Salesforce.com, Inc.* | 26,797 | 3,911,826 | ||||||
|
| |||||||
Total Software | 13,480,938 | |||||||
|
| |||||||
Specialty Retail - 6.3% |
| |||||||
AutoZone, Inc.* | 10,700 | 4,012,500 | ||||||
Bed Bath & Beyond, Inc.* | 35,057 | 2,022,088 | ||||||
O’Reilly Automotive, Inc.* | 43,514 | 3,728,280 | ||||||
PetSmart, Inc. | 42,228 | 2,803,517 | ||||||
Ross Stores, Inc. | 67,954 | 4,141,796 | ||||||
Tiffany & Co. | 20,815 | 1,315,924 | ||||||
TJX Cos., Inc. | 74,268 | 3,091,777 | ||||||
|
| |||||||
Total Specialty Retail | 21,115,882 | |||||||
|
| |||||||
Textiles, Apparel & Luxury Goods - 3.1% |
| |||||||
Coach, Inc. | 51,336 | 2,877,383 | ||||||
Fossil, Inc.* | 27,703 | 2,412,931 | ||||||
NIKE, Inc. — Class B | 17,050 | 1,558,029 | ||||||
Ralph Lauren Corp. | 13,060 | 2,007,192 | ||||||
V.F. Corp. | 8,884 | 1,390,168 | ||||||
|
| |||||||
Total Textiles, Apparel & Luxury Goods | 10,245,703 | |||||||
|
| |||||||
Tobacco - 0.9% |
| |||||||
Philip Morris International, Inc. | 32,231 | 2,854,377 | ||||||
|
| |||||||
Total Tobacco | 2,854,377 | |||||||
|
| |||||||
Trading Companies & Distributors - 0.7% |
| |||||||
W.W. Grainger, Inc. | 11,709 | 2,358,310 | ||||||
|
| |||||||
Total Trading Companies & Distributors | 2,358,310 | |||||||
|
| |||||||
Wireless Telecommunication Services - 1.2% |
| |||||||
Crown Castle International Corp.* | 58,777 | 3,923,365 | ||||||
|
| |||||||
Total Wireless Telecommunication Services | 3,923,365 | |||||||
|
| |||||||
Total Common Stocks | 331,773,779 | |||||||
|
| |||||||
SHORT TERM INVESTMENTS - 0.1% |
| |||||||
SSgA Government Money Market Fund | 455,418 | 455,418 | ||||||
|
| |||||||
Total Short Term Investments | �� | 455,418 | ||||||
|
| |||||||
| FACE AMOUNT | VALUE | |||||||
SECURITIES LENDING COLLATERAL - 1.3%d |
| |||||||
Joint Repurchase Agreements | ||||||||
Merrill Lynch, Fenner & Smith Inc. | $ | 1,602,968 | $ | 1,602,968 | ||||
RBS Securities, Inc. | 2,725,446 | 2,725,446 | ||||||
|
| |||||||
Total Securities Lending Collateral | 4,328,414 | |||||||
|
| |||||||
Total Investments 101.3%c | 336,557,611 | |||||||
|
| |||||||
Other Assets and Liabilities, net - (1.3)% |
| (4,304,127 | ) | |||||
|
| |||||||
Net Assets - 100.0% | $ | 332,253,484 | ||||||
|
| |||||||
| * | Non-Income Producing Security. |
| a | All or a portion of this security was on loan as of October 31, 2012. |
| b | Values determined based on Level 2 inputs (Note E). |
| c | Unless otherwise indicated, the values of the Investments are determined based on Level 1 inputs. (Note G) |
| d | Securities lending collateral (Note H). |
| 30 | GUGGENHEIM ETFS ANNUAL REPORT | See Notes to Financial Statements. |
Table of Contents
| SCHEDULE OF INVESTMENTS | October 31, 2012 |
GUGGENHEIM S&P MIDCAP 400® PURE VALUE ETF
| SHARES | VALUE | |||||||
COMMON STOCKS - 99.9% |
| |||||||
Aerospace & Defense - 5.0% |
| |||||||
Exelis, Inc. | 93,025 | $ | 1,028,857 | |||||
Huntington Ingalls Industries, Inc.* | 17,332 | 734,530 | ||||||
|
| |||||||
Total Aerospace & Defense | 1,763,387 | |||||||
|
| |||||||
Air Freight & Logistics - 0.8% |
| |||||||
UTi Worldwide, Inc. | 20,875 | 289,954 | ||||||
|
| |||||||
Total Air Freight & Logistics | 289,954 | |||||||
|
| |||||||
Airlines - 2.1% |
| |||||||
JetBlue Airways Corp.* | 138,436 | 732,326 | ||||||
|
| |||||||
Total Airlines | 732,326 | |||||||
|
| |||||||
Automobiles - 1.1% |
| |||||||
Thor Industries, Inc. | 10,036 | 381,669 | ||||||
|
| |||||||
Total Automobiles | 381,669 | |||||||
|
| |||||||
Capital Markets - 2.9% |
| |||||||
Apollo Investment Corp. | 40,025 | 318,199 | ||||||
Janus Capital Group, Inc. | 34,153 | 290,300 | ||||||
Jefferies Group, Inc. | 28,588 | 407,093 | ||||||
|
| |||||||
Total Capital Markets | 1,015,592 | |||||||
|
| |||||||
Chemicals - 1.7% |
| |||||||
Ashland, Inc. | 3,874 | 275,635 | ||||||
Cabot Corp. | 4,004 | 143,183 | ||||||
Cytec Industries, Inc. | 2,774 | 190,907 | ||||||
|
| |||||||
Total Chemicals | 609,725 | |||||||
|
| |||||||
Commercial Banks - 4.5% |
| |||||||
Associated Banc-Corp. | 16,980 | 218,872 | ||||||
BancorpSouth, Inc. | 30,672 | 434,009 | ||||||
First Niagara Financial Group, Inc. | 36,218 | 299,885 | ||||||
Fulton Financial Corp. | 13,301 | 129,286 | ||||||
International Bancshares Corp. | 10,209 | 185,293 | ||||||
TCF Financial Corp. | 26,245 | 300,243 | ||||||
|
| |||||||
Total Commercial Banks | 1,567,588 | |||||||
|
| |||||||
Commercial Services & Supplies - 0.7% |
| |||||||
Brink’s Co. (The) | 8,673 | 228,187 | ||||||
|
| |||||||
Total Commercial Services & Supplies | 228,187 | |||||||
|
| |||||||
Communications Equipment - 0.8% |
| |||||||
Tellabs, Inc. | 93,226 | 272,220 | ||||||
|
| |||||||
Total Communications Equipment | 272,220 | |||||||
|
| |||||||
Computers & Peripherals - 0.6% |
| |||||||
Lexmark International, Inc. — Class Aa | 10,075 | 214,195 | ||||||
|
| |||||||
Total Computers & Peripherals | 214,195 | |||||||
|
| |||||||
Construction & Engineering - 3.6% |
| |||||||
Aecom Technology Corp.* | 20,217 | 434,059 | ||||||
KBR, Inc. | 7,711 | 214,829 | ||||||
URS Corp. | 18,744 | 627,549 | ||||||
|
| |||||||
Total Construction & Engineering | 1,276,437 | |||||||
|
| |||||||
Containers & Packaging - 0.5% |
| |||||||
Greif, Inc. — Class A | 3,913 | 164,189 | ||||||
|
| |||||||
Total Containers & Packaging | 164,189 | |||||||
|
| |||||||
| SHARES | VALUE | |||||||
Diversified Consumer Services - 1.0% |
| |||||||
Regis Corp. | 21,205 | $ | 353,275 | |||||
|
| |||||||
Total Diversified Consumer Services | 353,275 | |||||||
|
| |||||||
Electric Utilities - 1.1% |
| |||||||
Great Plains Energy, Inc. | 8,635 | 193,769 | ||||||
NV Energy, Inc. | 10,188 | 193,674 | ||||||
|
| |||||||
Total Electric Utilities | 387,443 | |||||||
|
| |||||||
Electrical Equipment - 1.7% |
| |||||||
General Cable Corp.* | 21,435 | 611,541 | ||||||
|
| |||||||
Total Electrical Equipment | 611,541 | |||||||
|
| |||||||
Electronic Equipment, Instruments & Components - 8.2% |
| |||||||
Arrow Electronics, Inc.* | 15,958 | 562,200 | ||||||
Avnet, Inc.* | 20,153 | 577,383 | ||||||
Ingram Micro, Inc. — Class A* | 39,403 | 598,926 | ||||||
Itron, Inc.* | 7,875 | 323,348 | ||||||
Tech Data Corp.* | 12,000 | 531,720 | ||||||
Vishay Intertechnology, Inc.* | 31,888 | 264,033 | ||||||
|
| |||||||
Total Electronic Equipment, Instruments & Components | 2,857,610 | |||||||
|
| |||||||
Food & Staples Retailing - 0.5% |
| |||||||
Harris Teeter Supermarkets, Inc. | 4,468 | 167,327 | ||||||
|
| |||||||
Total Food & Staples Retailing | 167,327 | |||||||
|
| |||||||
Food Products - 1.2% |
| |||||||
Smithfield Foods, Inc.* | 20,375 | 417,076 | ||||||
|
| |||||||
Total Food Products | 417,076 | |||||||
|
| |||||||
Gas Utilities - 1.1% |
| |||||||
Atmos Energy Corp. | 4,922 | 177,044 | ||||||
UGI Corp. | 6,398 | 206,592 | ||||||
|
| |||||||
Total Gas Utilities | 383,636 | |||||||
|
| |||||||
Health Care Providers & Services - 6.8% |
| |||||||
Community Health Systems, Inc.* | 38,807 | 1,064,088 | ||||||
Health Management Associates, Inc. — Class A* | 23,488 | 171,462 | ||||||
Health Net, Inc.* | 15,100 | 324,952 | ||||||
LifePoint Hospitals, Inc.* | 7,046 | 249,006 | ||||||
Omnicare, Inc. | 4,846 | 167,332 | ||||||
Owens & Minor, Inc. | 13,653 | 388,701 | ||||||
|
| |||||||
Total Health Care Providers & Services | 2,365,541 | |||||||
|
| |||||||
Hotels, Restaurants & Leisure - 1.0% |
| |||||||
Bob Evans Farms, Inc. | 4,783 | 182,089 | ||||||
Wendy’s Co. (The) | 37,583 | 160,479 | ||||||
|
| |||||||
Total Hotels, Restaurants & Leisure | 342,568 | |||||||
|
| |||||||
Household Durables - 2.1% |
| |||||||
KB Homea | 27,814 | 444,468 | ||||||
Mohawk Industries, Inc.* | 3,312 | 276,452 | ||||||
|
| |||||||
Total Household Durables | 720,920 | |||||||
|
| |||||||
Insurance - 20.2% |
| |||||||
American Financial Group, Inc. | 9,399 | 364,681 | ||||||
Aspen Insurance Holdings Ltd. | 19,218 | 621,702 | ||||||
Everest Re Group Ltd. | 4,250 | 471,963 | ||||||
| See Notes to Financial Statements. | GUGGENHEIM ETFS ANNUAL REPORT | 31 |
Table of Contents
| SCHEDULE OF INVESTMENTS (continued) | October 31, 2012 |
GUGGENHEIM S&P MIDCAP 400® PURE VALUE ETF
| SHARES | VALUE | |||||||
Fidelity National Financial, Inc. — Class A | 20,198 | $ | 432,439 | |||||
First American Financial Corp. | 63,457 | 1,443,647 | ||||||
Hanover Insurance Group, Inc. (The) | 15,313 | 552,952 | ||||||
HCC Insurance Holdings, Inc. | 9,148 | 326,035 | ||||||
Kemper Corp. | 15,185 | 470,735 | ||||||
Old Republic International Corp. | 56,801 | 561,194 | ||||||
Protective Life Corp. | 25,805 | 704,476 | ||||||
Reinsurance Group of America, Inc. | 10,592 | 560,529 | ||||||
StanCorp Financial Group, Inc. | 11,326 | 389,048 | ||||||
W.R. Berkley Corp. | 4,257 | 165,555 | ||||||
|
| |||||||
Total Insurance | 7,064,956 | |||||||
|
| |||||||
Internet Software & Services 0.3% |
| |||||||
Monster Worldwide, Inc.* | 19,353 | 120,376 | ||||||
|
| |||||||
Total Internet Software & Services | 120,376 | |||||||
|
| |||||||
IT Services - 0.9% |
| |||||||
CoreLogic, Inc.* | 12,491 | 297,286 | ||||||
|
| |||||||
Total IT Services | 297,286 | |||||||
|
| |||||||
Machinery - 7.1% |
| |||||||
AGCO Corp.* | 3,084 | 140,353 | ||||||
Harsco Corp. | 8,630 | 172,514 | ||||||
ITT Corp. | 46,149 | 959,899 | ||||||
Oshkosh Corp.* | 29,265 | 877,364 | ||||||
Terex Corp.* | 14,294 | 322,330 | ||||||
|
| |||||||
Total Machinery | 2,472,460 | |||||||
|
| |||||||
Media - 3.0% |
| |||||||
New York Times Co. (The) — Class A* | 37,776 | 309,008 | ||||||
Scholastic Corp. | 10,988 | 362,494 | ||||||
Valassis Communications, Inc.*a | 15,060 | 391,861 | ||||||
|
| |||||||
Total Media | 1,063,363 | |||||||
|
| |||||||
Metals & Mining - 2.8% |
| |||||||
Commercial Metals Co. | 20,616 | 283,676 | ||||||
Reliance Steel & Aluminum Co. | 4,129 | 224,370 | ||||||
Steel Dynamics, Inc. | 18,943 | 239,629 | ||||||
Worthington Industries, Inc. | 11,184 | 241,798 | ||||||
|
| |||||||
Total Metals & Mining | 989,473 | |||||||
|
| |||||||
Multiline Retail - 0.6% |
| |||||||
Saks, Inc.*a | 20,326 | 208,951 | ||||||
|
| |||||||
Total Multiline Retail | 208,951 | |||||||
|
| |||||||
Oil, Gas & Consumable Fuels - 3.3% |
| |||||||
Alpha Natural Resources, Inc.* | 31,174 | 267,161 | ||||||
Arch Coal, Inc. | 10,308 | 82,052 | ||||||
HollyFrontier Corp. | 11,160 | 431,111 | ||||||
Quicksilver Resources, Inc.*a | 17,097 | 66,165 | ||||||
World Fuel Services Corp. | 8,994 | 312,092 | ||||||
|
| |||||||
Total Oil, Gas & Consumable Fuels | 1,158,581 | |||||||
|
| |||||||
Paper & Forest Products - 0.9% |
| |||||||
Louisiana-Pacific Corp.* | 20,571 | 324,816 | ||||||
|
| |||||||
Total Paper & Forest Products | 324,816 | |||||||
|
| |||||||
| SHARES | VALUE | |||||||
Professional Services - 0.9% |
| |||||||
Manpower, Inc. | 8,369 | $ | 317,520 | |||||
|
| |||||||
Total Professional Services | 317,520 | |||||||
|
| |||||||
Road & Rail - 0.8% |
| |||||||
Con-way, Inc. | 9,885 | 287,752 | ||||||
|
| |||||||
Total Road & Rail | 287,752 | |||||||
|
| |||||||
Semiconductors & Semiconductor Equipment - 1.8% |
| |||||||
Fairchild Semiconductor International, Inc.* | 11,101 | 130,548 | ||||||
International Rectifier Corp.* | 10,099 | 156,433 | ||||||
MEMC Electronic Materials, Inc.* | 140,034 | 352,886 | ||||||
|
| |||||||
Total Semiconductors & Semiconductor Equipment | 639,867 | |||||||
|
| |||||||
Specialty Retail - 2.4% |
| |||||||
Barnes & Noble, Inc.*a | 21,739 | 366,085 | ||||||
Cabela’s, Inc.* | 2,527 | 113,235 | ||||||
Office Depot, Inc.* | 145,849 | 361,705 | ||||||
|
| |||||||
Total Specialty Retail | 841,025 | |||||||
|
| |||||||
Thrifts & Mortgage Finance - 3.4% |
| |||||||
Astoria Financial Corp. | 65,806 | 660,034 | ||||||
New York Community Bancorp, Inc.a | 15,794 | 218,905 | ||||||
Washington Federal, Inc. | 18,538 | 311,068 | ||||||
|
| |||||||
Total Thrifts & Mortgage Finance | 1,190,007 | |||||||
|
| |||||||
Tobacco - 1.3% |
| |||||||
Universal Corp. | 9,311 | 461,453 | ||||||
|
| |||||||
Total Tobacco | 461,453 | |||||||
|
| |||||||
Wireless Telecommunication Services - 1.2% |
| |||||||
Telephone & Data Systems, Inc. | 16,828 | 418,512 | ||||||
|
| |||||||
Total Wireless Telecommunication Services | 418,512 | |||||||
|
| |||||||
Total Common Stocks |
| 34,978,804 | ||||||
|
| |||||||
SHORT TERM INVESTMENTS - 0.1% |
| |||||||
SSgA Government Money Market Fund | 31,847 | 31,847 | ||||||
|
| |||||||
Total Short Term Investments | 31,847 | |||||||
|
| |||||||
FACE | ||||||||
SECURITIES LENDING COLLATERAL - 2.5%d |
| |||||||
Joint Repurchase Agreements | ||||||||
Merrill Lynch, Fenner & Smith, Inc. issued 10/31/12 at 0.28% due 11/01/12b | $ | 330,048 | 330,048 | |||||
| 32 | GUGGENHEIM ETFS ANNUAL REPORT | See Notes to Financial Statements. |
Table of Contents
| SCHEDULE OF INVESTMENTS (concluded) | October 31, 2012 |
GUGGENHEIM S&P MIDCAP 400® PURE VALUE ETF
| FACE AMOUNT | VALUE | |||||||
RBS Securities, Inc. | $ | 561,165 | $ | 561,165 | ||||
|
| |||||||
Total Securities Lending Collateral |
| 891,213 | ||||||
|
| |||||||
Total Investments 102.5%c | 35,901,864 | |||||||
|
| |||||||
Other Assets and Liabilities, net - (2.5)% |
| (886,721 | ) | |||||
|
| |||||||
Net Assets - 100.0% | $ | 35,015,143 | ||||||
|
| |||||||
| * | Non-Income Producing Security. |
| a | All or a portion of this security was on loan as of October 31, 2012. |
| b | Values determined based on Level 2 inputs (Note E). |
| c | Unless otherwise indicated, the values of the Investments are determined based on Level 1 inputs. |
| d | Securities lending collateral (Note H). |
| See Notes to Financial Statements. | GUGGENHEIM ETFS ANNUAL REPORT | 33 |
Table of Contents
| SCHEDULE OF INVESTMENTS | October 31, 2012 |
GUGGENHEIM S&P MIDCAP 400® PURE GROWTH ETF
| SHARES | VALUE | |||||||
COMMON STOCKS - 99.8% |
| |||||||
Aerospace & Defense - 1.7% |
| |||||||
Triumph Group, Inc. | 129,659 | $ | 8,482,292 | |||||
|
| |||||||
Total Aerospace & Defense | 8,482,292 | |||||||
|
| |||||||
Airlines - 1.1% |
| |||||||
Alaska Air Group, Inc.* | 154,275 | 5,899,476 | ||||||
|
| |||||||
Total Airlines | 5,899,476 | |||||||
|
| |||||||
Auto Components - 0.2% |
| |||||||
Gentex Corp. | 62,196 | 1,071,015 | ||||||
|
| |||||||
Total Auto Components | 1,071,015 | |||||||
|
| |||||||
Biotechnology - 5.2% |
| |||||||
Regeneron Pharmaceuticals, Inc.* | 135,454 | 19,275,104 | ||||||
United Therapeutics Corp.* | 155,991 | 7,124,109 | ||||||
|
| |||||||
Total Biotechnology | 26,399,213 | |||||||
|
| |||||||
Chemicals - 3.2% |
| |||||||
Albemarle Corp. | 63,735 | 3,512,436 | ||||||
Intrepid Potash, Inc.* | 145,696 | 3,165,974 | ||||||
NewMarket Corp. | 35,051 | 9,509,687 | ||||||
|
| |||||||
Total Chemicals | 16,188,097 | |||||||
|
| |||||||
Commercial Banks - 1.1% |
| |||||||
Signature Bank* | 78,061 | 5,561,066 | ||||||
|
| |||||||
Total Commercial Banks | 5,561,066 | |||||||
|
| |||||||
Commercial Services & Supplies - 2.1% |
| |||||||
Clean Harbors, Inc.* | 95,127 | 5,550,660 | ||||||
Copart, Inc.* | 175,715 | 5,058,835 | ||||||
|
| |||||||
Total Commercial Services & Supplies | 10,609,495 | |||||||
|
| |||||||
Communications Equipment - 2.8% |
| |||||||
ADTRAN, Inc.a | 99,513 | 1,680,774 | ||||||
InterDigital, Inc. | 267,574 | 10,191,894 | ||||||
Riverbed Technology, Inc.* | 141,230 | 2,608,518 | ||||||
|
| |||||||
Total Communications Equipment | 14,481,186 | |||||||
|
| |||||||
Containers & Packaging - 2.2% |
| |||||||
AptarGroup, Inc. | 73,415 | 3,764,721 | ||||||
Rock-Tenn Co. — Class A | 101,259 | 7,411,146 | ||||||
|
| |||||||
Total Containers & Packaging | 11,175,867 | |||||||
|
| |||||||
Distributors - 1.2% |
| |||||||
LKQ Corp.* | 297,637 | 6,217,637 | ||||||
|
| |||||||
Total Distributors | 6,217,637 | |||||||
|
| |||||||
Diversified Consumer Services - 3.1% |
| |||||||
DeVry, Inc. | 277,921 | 7,298,206 | ||||||
ITT Educational Services, Inc.*a | 175,089 | 3,762,663 | ||||||
Strayer Education, Inc.a | 84,001 | 4,826,697 | ||||||
|
| |||||||
Total Diversified Consumer Services | 15,887,566 | |||||||
|
| |||||||
Diversified Financial Services - 0.5% |
| |||||||
MSCI, Inc. — Class A* | 90,113 | 2,427,644 | ||||||
|
| |||||||
Total Diversified Financial Services | 2,427,644 | |||||||
|
| |||||||
| SHARES | VALUE | |||||||
Electrical Equipment - 0.7% |
| |||||||
AMETEK, Inc. | 96,684 | $ | 3,437,116 | |||||
|
| |||||||
Total Electrical Equipment | 3,437,116 | |||||||
|
| |||||||
Electronic Equipment, Instruments & Components - 0.4% |
| |||||||
Trimble Navigation, Ltd.* | 42,017 | 1,982,362 | ||||||
|
| |||||||
Total Electronic Equipment, Instruments & Components | 1,982,362 | |||||||
|
| |||||||
Energy Equipment & Services - 3.5% |
| |||||||
CARBO Ceramics, Inc.a | 46,002 | 3,401,848 | ||||||
Dresser-Rand Group, Inc.* | 84,487 | 4,353,615 | ||||||
Dril-Quip, Inc.* | 52,873 | 3,661,984 | ||||||
Oceaneering International, Inc. | 62,150 | 3,252,310 | ||||||
Oil States International, Inc.* | 44,731 | 3,269,836 | ||||||
|
| |||||||
Total Energy Equipment & Services | 17,939,593 | |||||||
|
| |||||||
Food Products - 2.6% |
| |||||||
Green Mountain Coffee Roasters, Inc.*a | 131,852 | 3,185,544 | ||||||
Ingredion, Inc. | 84,525 | 5,194,907 | ||||||
Lancaster Colony Corp. | 66,071 | 4,808,647 | ||||||
|
| |||||||
Total Food Products | 13,189,098 | |||||||
|
| |||||||
Health Care Equipment & Supplies - 4.3% |
| |||||||
Cooper Cos., Inc. (The) | 60,688 | 5,824,834 | ||||||
IDEXX Laboratories, Inc.* | 65,642 | 6,314,761 | ||||||
ResMed, Inc.a | 133,554 | 5,334,147 | ||||||
Thoratec Corp.* | 129,069 | 4,607,763 | ||||||
|
| |||||||
Total Health Care Equipment & Supplies | 22,081,505 | |||||||
|
| |||||||
Health Care Providers & Services - 5.6% |
| |||||||
AMERIGROUP Corp.* | 136,089 | 12,430,369 | ||||||
Henry Schein, Inc.* | 74,178 | 5,472,853 | ||||||
HMS Holdings Corp.* | 137,990 | 3,186,189 | ||||||
Mednax, Inc.* | 108,082 | 7,455,497 | ||||||
|
| |||||||
Total Health Care Providers & Services | 28,544,908 | |||||||
|
| |||||||
Health Care Technology - 0.4% |
| |||||||
Allscripts Healthcare Solutions, Inc.* | 151,109 | 1,952,328 | ||||||
|
| |||||||
Total Health Care Technology | 1,952,328 | |||||||
|
| |||||||
Hotels, Restaurants & Leisure - 2.3% |
| |||||||
Life Time Fitness, Inc.* | 88,951 | 3,993,010 | ||||||
Panera Bread Co. — Class A* | 45,778 | 7,720,002 | ||||||
|
| |||||||
Total Hotels, Restaurants & Leisure | 11,713,012 | |||||||
|
| |||||||
Household Durables - 1.4% |
| |||||||
Tempur-Pedic International, Inc.* | 113,847 | 3,010,115 | ||||||
Tupperware Brands Corp. | 73,856 | 4,364,889 | ||||||
|
| |||||||
Total Household Durables | 7,375,004 | |||||||
|
| |||||||
Household Products - 0.5% |
| |||||||
Church & Dwight Co., Inc. | 55,573 | 2,820,886 | ||||||
|
| |||||||
Total Household Products | 2,820,886 | |||||||
|
| |||||||
| 34 | GUGGENHEIM ETFS ANNUAL REPORT | See Notes to Financial Statements. |
Table of Contents
| SCHEDULE OF INVESTMENTS (continued) | October 31, 2012 |
GUGGENHEIM S&P MIDCAP 400® PURE GROWTH ETF
| SHARES | VALUE | |||||||
Internet Software & Services - 4.3% |
| |||||||
Equinix, Inc.* | 71,593 | $ | 12,916,093 | |||||
Rackspace Hosting, Inc.* | 140,378 | 8,940,675 | ||||||
|
| |||||||
Total Internet Software & Services | 21,856,768 | |||||||
|
| |||||||
IT Services - 6.7% |
| |||||||
Alliance Data Systems Corp.* | 71,794 | 10,270,132 | ||||||
Gartner, Inc.* | 56,868 | 2,639,244 | ||||||
Global Payments, Inc. | 118,275 | 5,056,256 | ||||||
Jack Henry & Associates, Inc. | 82,205 | 3,123,790 | ||||||
NeuStar, Inc. — Class A* | 65,126 | 2,382,960 | ||||||
VeriFone Systems, Inc.* | 116,974 | 3,467,110 | ||||||
WEX, Inc.* | 102,022 | 7,527,183 | ||||||
|
| |||||||
Total IT Services | 34,466,675 | |||||||
|
| |||||||
Leisure Equipment & Products - 1.1% |
| |||||||
Polaris Industries, Inc. | 69,502 | 5,872,919 | ||||||
|
| |||||||
Total Leisure Equipment & Products | 5,872,919 | |||||||
|
| |||||||
Life Sciences Tools & Services - 3.5% |
| |||||||
Bio-Rad Laboratories, Inc. — Class A* | 57,698 | 5,847,692 | ||||||
Covance, Inc.* | 65,678 | 3,199,175 | ||||||
Mettler-Toledo International, Inc.* | 28,529 | 4,831,957 | ||||||
Techne Corp. | 62,168 | 4,187,637 | ||||||
|
| |||||||
Total Life Sciences Tools & Services | 18,066,461 | |||||||
|
| |||||||
Machinery - 3.9% |
| |||||||
Donaldson Co., Inc. | 95,369 | 3,077,558 | ||||||
Gardner Denver, Inc. | 33,412 | 2,316,454 | ||||||
Valmont Industries, Inc. | 54,794 | 7,402,669 | ||||||
Wabtec Corp. | 53,576 | 4,387,874 | ||||||
Woodward, Inc. | 87,793 | 2,941,066 | ||||||
|
| |||||||
Total Machinery | 20,125,621 | |||||||
|
| |||||||
Metals & Mining - 3.1% |
| |||||||
Compass Minerals International, Inc. | 66,677 | 5,257,482 | ||||||
Royal Gold, Inc. | 117,752 | 10,371,596 | ||||||
|
| |||||||
Total Metals & Mining | 15,629,078 | |||||||
|
| |||||||
Office Electronics - 0.6% |
| |||||||
Zebra Technologies Corp. — Class A* | 82,038 | 2,947,625 | ||||||
|
| |||||||
Total Office Electronics | 2,947,625 | |||||||
|
| |||||||
Oil, Gas & Consumable Fuels - 2.8% |
| |||||||
Bill Barrett Corp.* | 158,754 | 3,637,054 | ||||||
Cimarex Energy Co. | 58,127 | 3,323,702 | ||||||
Northern Oil and Gas, Inc.* | 141,260 | 2,141,502 | ||||||
Rosetta Resources, Inc.* | 77,028 | 3,546,369 | ||||||
SM Energy Co. | 28,799 | 1,552,842 | ||||||
|
| |||||||
Total Oil, Gas & Consumable Fuels | 14,201,469 | |||||||
|
| |||||||
Pharmaceuticals - 1.8% |
| |||||||
Endo Health Solutions, Inc.* | 146,818 | 4,207,804 | ||||||
Medicis Pharmaceutical Corp. —Class A | 116,149 | 5,042,028 | ||||||
|
| |||||||
Total Pharmaceuticals | 9,249,832 | |||||||
|
| |||||||
| SHARES | VALUE | |||||||
Professional Services - 0.4% |
| |||||||
FTI Consulting, Inc.* | 83,017 | $ | 2,155,121 | |||||
|
| |||||||
Total Professional Services | 2,155,121 | |||||||
|
| |||||||
Real Estate Investment Trusts (REITs) - 2.2% |
| |||||||
Essex Property Trust, Inc. | 14,882 | 2,232,300 | ||||||
Federal Realty Investment Trust | 32,385 | 3,492,075 | ||||||
Home Properties, Inc. | 37,389 | 2,272,877 | ||||||
Taubman Centers, Inc. | 44,637 | 3,506,236 | ||||||
|
| |||||||
Total Real Estate Investment Trusts (REITs) | 11,503,488 | |||||||
|
| |||||||
Road & Rail - 1.9% |
| |||||||
Genesee & Wyoming, Inc. — Class A* | 80,280 | 5,817,892 | ||||||
JB Hunt Transport Services, Inc. | 68,665 | 4,030,635 | ||||||
|
| |||||||
Total Road & Rail | 9,848,527 | |||||||
|
| |||||||
Semiconductors & Semiconductor Equipment - 1.9% |
| |||||||
Semtech Corp.* | 155,167 | 3,874,520 | ||||||
Silicon Laboratories, Inc.* | 147,624 | 5,966,962 | ||||||
|
| |||||||
Total Semiconductors & Semiconductor Equipment | 9,841,482 | |||||||
|
| |||||||
Software - 7.8% |
| |||||||
ACI Worldwide, Inc.* | 76,162 | 2,977,934 | ||||||
Advent Software, Inc.* | 70,048 | 1,520,041 | ||||||
ANSYS, Inc.* | 80,711 | 5,720,796 | ||||||
Concur Technologies, Inc.* | 82,441 | 5,460,067 | ||||||
Factset Research Systems, Inc. | 55,471 | 5,022,899 | ||||||
Informatica Corp.* | 140,283 | 3,807,281 | ||||||
MICROS Systems, Inc.* | 59,969 | 2,721,993 | ||||||
Rovi Corp.* | 181,158 | 2,451,068 | ||||||
Solarwinds, Inc.* | 120,605 | 6,101,407 | ||||||
Solera Holdings, Inc. | 88,283 | 4,132,527 | ||||||
|
| |||||||
Total Software | 39,916,013 | |||||||
|
| |||||||
Specialty Retail - 2.9% |
| |||||||
Advance Auto Parts, Inc. | 93,414 | 6,626,789 | ||||||
Tractor Supply Co. | 83,351 | 8,021,700 | ||||||
|
| |||||||
Total Specialty Retail | 14,648,489 | |||||||
|
| |||||||
Textiles, Apparel & Luxury Goods - 6.9% |
| |||||||
Carter’s, Inc.* | 147,152 | 7,955,037 | ||||||
Deckers Outdoor Corp.*a | 74,591 | 2,135,540 | ||||||
PVH Corp. | 87,348 | 9,607,407 | ||||||
Under Armour, Inc. — Class A*a | 174,086 | 9,097,735 | ||||||
Warnaco Group, Inc. (The)* | 93,192 | 6,577,491 | ||||||
|
| |||||||
Total Textiles, Apparel & Luxury Goods | 35,373,210 | |||||||
|
| |||||||
Trading Companies & Distributors - 1.9% |
| |||||||
MSC Industrial Direct Co., Inc. — Class A | 56,860 | 4,241,756 | ||||||
Watsco, Inc. | 83,830 | 5,729,781 | ||||||
|
| |||||||
Total Trading Companies & Distributors | 9,971,537 | |||||||
|
| |||||||
Total Common Stocks | 511,110,681 | |||||||
|
| |||||||
| See Notes to Financial Statements. | GUGGENHEIM ETFS ANNUAL REPORT | 35 |
Table of Contents
| SCHEDULE OF INVESTMENTS (concluded) | October 31, 2012 |
GUGGENHEIM S&P MIDCAP 400® PURE GROWTH ETF
| SHARES | VALUE | |||||||
SHORT TERM INVESTMENTS - 0.1% |
| |||||||
SSgA Government Money Market Fund | 418,310 | $ | 418,310 | |||||
|
| |||||||
Total Short Term Investments | 418,310 | |||||||
|
| |||||||
FACE | ||||||||
SECURITIES LENDING COLLATERAL - 4.1%d |
| |||||||
Joint Repurchase Agreements |
| |||||||
Merrill Lynch, Fenner & Smith, Inc. issued 10/31/12 at 0.28% due 11/01/12b | $ | 7,679,708 | 7,679,708 | |||||
RBS Securities, Inc. issued 10/31/12 at 0.28% | 13,057,423 | 13,057,423 | ||||||
|
| |||||||
Total Securities Lending Collateral | 20,737,131 | |||||||
|
| |||||||
Total Investments 104.0%c | 532,266,122 | |||||||
|
| |||||||
Other Assets and Liabilities, net - (4.0)% |
| (20,385,507 | ) | |||||
|
| |||||||
Net Assets - 100.0% | $ | 511,880,615 | ||||||
|
| |||||||
| * | Non-Income Producing Security. |
| a | All or a portion of this security was on loan as of October 31, 2012. |
| b | Values determined based on Level 2 inputs (Note E). |
| c | Unless otherwise indicated, the values of the Investments are determined based on Level 1 inputs. |
| d | Securities lending collateral (Note H). |
| 36 | GUGGENHEIM ETFS ANNUAL REPORT | See Notes to Financial Statements. |
Table of Contents
| SCHEDULE OF INVESTMENTS | October 31, 2012 |
GUGGENHEIM S&P SMALLCAP 600® PURE VALUE ETF
| SHARES | VALUE | |||||||
COMMON STOCKS - 99.9% |
| |||||||
Aerospace & Defense - 0.7% |
| |||||||
AAR Corp. | 31,946 | $ | 482,065 | |||||
|
| |||||||
Total Aerospace & Defense | 482,065 | |||||||
|
| |||||||
Airlines - 1.2% |
| |||||||
SkyWest, Inc. | 81,712 | 894,746 | ||||||
|
| |||||||
Total Airlines | 894,746 | |||||||
|
| |||||||
Auto Components - 1.1% |
| |||||||
Spartan Motors, Inc. | 101,631 | 477,666 | ||||||
Superior Industries International, Inc. | 20,571 | 351,558 | ||||||
|
| |||||||
Total Auto Components | 829,224 | |||||||
|
| |||||||
Automobiles - 0.7% |
| |||||||
Winnebago Industries, Inc.* | 42,468 | 535,097 | ||||||
|
| |||||||
Total Automobiles | 535,097 | |||||||
|
| |||||||
Building Products - 2.2% |
| |||||||
Apogee Enterprises, Inc. | 16,964 | 345,557 | ||||||
Griffon Corp. | 52,131 | 529,130 | ||||||
Universal Forest Products, Inc. | 19,389 | 746,476 | ||||||
|
| |||||||
Total Building Products | 1,621,163 | |||||||
|
| |||||||
Capital Markets - 2.4% |
| |||||||
Calamos Asset Management, Inc. —Class A | 15,824 | 170,899 | ||||||
Investment Technology Group, Inc.* | 42,459 | 358,354 | ||||||
Piper Jaffray Cos.* | 26,675 | 716,224 | ||||||
Prospect Capital Corp.a | 17,729 | 209,911 | ||||||
SWS Group, Inc.* | 42,696 | 242,940 | ||||||
|
| |||||||
Total Capital Markets | 1,698,328 | |||||||
|
| |||||||
Chemicals - 2.5% |
| |||||||
A. Schulman, Inc. | 24,773 | 635,675 | ||||||
OM Group, Inc.* | 29,270 | 592,132 | ||||||
PolyOne Corp. | 30,380 | 575,094 | ||||||
|
| |||||||
Total Chemicals | 1,802,901 | |||||||
|
| |||||||
Commercial Banks - 3.0% |
| |||||||
First BanCorp* | 89,162 | 378,047 | ||||||
First Commonwealth Financial Corp. | 66,677 | 436,734 | ||||||
PrivateBancorp, Inc. | 19,334 | 312,438 | ||||||
Susquehanna Bancshares, Inc. | 42,828 | 444,126 | ||||||
United Community Banks, Inc.* | 29,388 | 255,676 | ||||||
Wintrust Financial Corp. | 9,838 | 363,514 | ||||||
|
| |||||||
Total Commercial Banks | 2,190,535 | |||||||
|
| |||||||
Commercial Services & Supplies - 2.1% |
| |||||||
ABM Industries, Inc. | 17,692 | 336,148 | ||||||
G&K Services, Inc. — Class A | 7,543 | 243,262 | ||||||
Geo Group, Inc. (The) | 10,156 | 281,524 | ||||||
United Stationers, Inc. | 10,487 | 304,333 | ||||||
Viad Corp. | 15,661 | 332,170 | ||||||
|
| |||||||
Total Commercial Services & Supplies | 1,497,437 | |||||||
|
| |||||||
Communications Equipment - 1.0% |
| |||||||
Bel Fuse, Inc. — Class B | 12,940 | 214,287 | ||||||
Black Box Corp. | 22,347 | 489,846 | ||||||
|
| |||||||
Total Communications Equipment | 704,133 | |||||||
|
| |||||||
| SHARES | VALUE | |||||||
Computers & Peripherals - 0.8% |
| |||||||
Avid Technology, Inc.* | 29,913 | $ | 175,589 | |||||
Intevac, Inc.* | 54,860 | 274,300 | ||||||
Novatel Wireless, Inc.* | 90,821 | 149,855 | ||||||
|
| |||||||
Total Computers & Peripherals | 599,744 | |||||||
|
| |||||||
Construction & Engineering - 2.4% |
| |||||||
Aegion Corp.* | 21,245 | 392,395 | ||||||
Comfort Systems USA, Inc. | 31,942 | 348,168 | ||||||
EMCOR Group, Inc. | 7,499 | 241,168 | ||||||
Orion Marine Group, Inc.* | 111,544 | 746,229 | ||||||
|
| |||||||
Total Construction & Engineering | 1,727,960 | |||||||
|
| |||||||
Distributors - 1.1% |
| |||||||
VOXX International Corp.* | 126,149 | 784,647 | ||||||
|
| |||||||
Total Distributors | 784,647 | |||||||
|
| |||||||
Diversified Consumer Services - 1.8% |
| |||||||
Career Education Corp.* | 133,900 | 455,260 | ||||||
Corinthian Colleges, Inc.* | 149,989 | 409,470 | ||||||
Lincoln Educational Services Corp. | 116,629 | 432,693 | ||||||
|
| |||||||
Total Diversified Consumer Services | 1,297,423 | |||||||
|
| |||||||
Electrical Equipment - 0.8% |
| |||||||
EnerSys* | 10,315 | 355,661 | ||||||
Powell Industries, Inc.* | 5,434 | 216,165 | ||||||
|
| |||||||
Total Electrical Equipment | 571,826 | |||||||
|
| |||||||
Electronic Equipment, Instruments & Components - 5.5% |
| |||||||
Anixter International, Inc. | 3,528 | 206,811 | ||||||
Benchmark Electronics, Inc.* | 48,671 | 721,304 | ||||||
Checkpoint Systems, Inc.* | 30,842 | 250,437 | ||||||
CTS Corp. | 36,082 | 298,759 | ||||||
Insight Enterprises, Inc.* | 41,306 | 667,918 | ||||||
Plexus Corp.* | 8,657 | 232,960 | ||||||
Radisys Corp.* | 102,521 | 291,160 | ||||||
Scansource, Inc.* | 10,243 | 299,608 | ||||||
SYNNEX Corp.* | 24,091 | 780,307 | ||||||
TTM Technologies, Inc.* | 21,201 | 190,809 | ||||||
|
| |||||||
Total Electronic Equipment, Instruments & Components | 3,940,073 | |||||||
|
| |||||||
Energy Equipment & Services - 2.1% |
| |||||||
Exterran Holdings, Inc.* | 52,640 | 1,051,747 | ||||||
Matrix Service Co.* | 42,730 | 448,238 | ||||||
|
| |||||||
Total Energy Equipment & Services | 1,499,985 | |||||||
|
| |||||||
Food & Staples Retailing - 2.0% |
| |||||||
Andersons, Inc. (The) | 11,780 | 462,719 | ||||||
Nash Finch Co. | 27,174 | 522,556 | ||||||
Spartan Stores, Inc. | 31,959 | 458,931 | ||||||
|
| |||||||
Total Food & Staples Retailing | 1,444,206 | |||||||
|
| |||||||
Food Products - 1.3% |
| |||||||
Seneca Foods Corp. — Class A* | 34,116 | 975,206 | ||||||
|
| |||||||
Total Food Products | 975,206 | |||||||
|
| |||||||
Gas Utilities - 0.3% |
| |||||||
Laclede Group, Inc. (The) | 4,451 | 185,340 | ||||||
|
| |||||||
Total Gas Utilities | 185,340 | |||||||
|
| |||||||
| See Notes to Financial Statements. | GUGGENHEIM ETFS ANNUAL REPORT | 37 |
Table of Contents
| SCHEDULE OF INVESTMENTS (continued) | October 31, 2012 |
GUGGENHEIM S&P SMALLCAP 600® PURE VALUE ETF
| SHARES | VALUE | |||||||
Health Care Equipment & Supplies - 1.1% |
| |||||||
Invacare Corp. | 19,187 | $ | 261,903 | |||||
Natus Medical, Inc.* | 20,907 | 236,249 | ||||||
Symmetry Medical, Inc.* | 29,157 | 267,078 | ||||||
|
| |||||||
Total Health Care Equipment & Supplies | 765,230 | |||||||
|
| |||||||
Health Care Providers & Services - 10.9% |
| |||||||
Almost Family, Inc.* | 42,787 | 886,974 | ||||||
Amedisys, Inc.* | 89,775 | 991,116 | ||||||
Cross Country Healthcare, Inc.* | 115,564 | 508,482 | ||||||
Gentiva Health Services, Inc.* | 166,063 | 1,560,992 | ||||||
Healthways, Inc.* | 140,132 | 1,363,484 | ||||||
Kindred Healthcare, Inc.* | 80,432 | 788,234 | ||||||
LHC Group, Inc.* | 39,101 | 685,050 | ||||||
Molina Healthcare, Inc.* | 24,918 | 624,694 | ||||||
PharMerica Corp.* | 35,464 | 433,370 | ||||||
|
| |||||||
Total Health Care Providers & Services | 7,842,396 | |||||||
|
| |||||||
Hotels, Restaurants & Leisure - 5.5% |
| |||||||
Boyd Gaming Corp.* | 125,910 | 776,865 | ||||||
Jack in the Box, Inc.* | 7,681 | 199,783 | ||||||
Marriott Vacations Worldwide Corp.* | 48,820 | 1,920,579 | ||||||
Red Robin Gourmet Burgers, Inc.* | 5,989 | 200,033 | ||||||
Ruby Tuesday, Inc.* | 87,311 | 630,385 | ||||||
Ruth’s Hospitality Group, Inc* | 36,893 | 245,338 | ||||||
|
| |||||||
Total Hotels, Restaurants & Leisure | 3,972,983 | |||||||
|
| |||||||
Household Durables - 3.8% |
| |||||||
American Greetings Corp. — Class A | 40,508 | 695,523 | ||||||
La-Z-Boy, Inc.* | 20,546 | 333,256 | ||||||
M/I Homes, Inc.* | 35,281 | 785,002 | ||||||
Standard Pacific Corp.*a | 99,949 | 689,648 | ||||||
Universal Electronics, Inc.* | 12,733 | 218,498 | ||||||
|
| |||||||
Total Household Durables | 2,721,927 | |||||||
|
| |||||||
Household Products 1.0% |
| |||||||
Central Garden & Pet Co. — Class A* | 64,149 | 722,959 | ||||||
|
| |||||||
Total Household Products | 722,959 | |||||||
|
| |||||||
Industrial Conglomerates - 0.3% |
| |||||||
Standex International Corp. | 4,971 | 229,859 | ||||||
|
| |||||||
Total Industrial Conglomerates | 229,859 | |||||||
|
| |||||||
Insurance - 7.2% |
| |||||||
Horace Mann Educators Corp. | 53,951 | 1,036,399 | ||||||
Meadowbrook Insurance Group, Inc. | 29,674 | 166,768 | ||||||
National Financial Partners Corp.* | 12,394 | 227,430 | ||||||
Presidential Life Corp. | 44,244 | 618,531 | ||||||
Safety Insurance Group, Inc. | 5,513 | 255,527 | ||||||
Selective Insurance Group, Inc. | 24,577 | 454,429 | ||||||
Stewart Information Services Corp.a | 66,933 | 1,560,878 | ||||||
Tower Group, Inc. | 21,561 | 388,529 | ||||||
United Fire Group, Inc. | 19,476 | 462,944 | ||||||
|
| |||||||
Total Insurance | 5,171,435 | |||||||
|
| |||||||
Internet Software & Services - 0.6% |
| |||||||
United Online, Inc. | 80,447 | 431,196 | ||||||
|
| |||||||
Total Internet Software & Services | 431,196 | |||||||
|
| |||||||
| SHARES | VALUE | |||||||
IT Services - 0.7% |
| |||||||
CIBER, Inc.* | 60,976 | $ | 190,245 | |||||
NCI, Inc. — Class A* | 55,086 | 309,583 | ||||||
|
| |||||||
Total IT Services | 499,828 | |||||||
|
| |||||||
Leisure Equipment & Products - 0.9% |
| |||||||
Callaway Golf Co. | 89,251 | 487,311 | ||||||
Jakks Pacific, Inc. | 10,896 | 140,667 | ||||||
|
| |||||||
Total Leisure Equipment & Products | 627,978 | |||||||
|
| |||||||
Machinery - 1.4% |
| |||||||
Briggs & Stratton Corp. | 26,708 | 527,483 | ||||||
Lydall, Inc.* | 35,900 | 463,469 | ||||||
|
| |||||||
Total Machinery | 990,952 | |||||||
|
| |||||||
Media - 1.4% |
| |||||||
Digital Generation, Inc.* | 34,801 | 323,649 | ||||||
E.W. Scripps Co. — Class A* | 34,474 | 365,769 | ||||||
Harte-Hanks, Inc. | 21,546 | 120,011 | ||||||
Live Nation Entertainment, Inc.* | 22,624 | 207,010 | ||||||
|
| |||||||
Total Media | 1,016,439 | |||||||
|
| |||||||
Metals & Mining - 2.2% |
| |||||||
A.M. Castle & Co.* | 30,650 | 372,397 | ||||||
AK Steel Holding Corp.a | 21,490 | 108,310 | ||||||
Century Aluminum Co.* | 32,897 | 235,214 | ||||||
Materion Corp. | 16,420 | 343,999 | ||||||
Olympic Steel, Inc. | 17,448 | 314,064 | ||||||
SunCoke Energy, Inc.* | 12,261 | 197,034 | ||||||
|
| |||||||
Total Metals & Mining | 1,571,018 | |||||||
|
| |||||||
Multiline Retail - 3.2% |
| |||||||
Fred’s, Inc. — Class A | 37,831 | 512,610 | ||||||
Tuesday Morning Corp.* | 307,079 | 1,833,262 | ||||||
|
| |||||||
Total Multiline Retail | 2,345,872 | |||||||
|
| |||||||
Paper & Forest Products - 1.1% |
| |||||||
Neenah Paper, Inc. | 14,332 | 371,199 | ||||||
Wausau Paper Corp. | 50,738 | 419,603 | ||||||
|
| |||||||
Total Paper & Forest Products | 790,802 | |||||||
|
| |||||||
Professional Services - 2.0% |
| |||||||
CDI Corp. | 36,514 | 627,676 | ||||||
Insperity, Inc. | 6,569 | 171,516 | ||||||
Kelly Services, Inc. — Class A | 50,648 | 673,112 | ||||||
|
| |||||||
Total Professional Services | 1,472,304 | |||||||
|
| |||||||
Real Estate Investment Trusts (REITs) - 0.9% |
| |||||||
Cedar Realty Trust, Inc. | 57,886 | 306,217 | ||||||
Parkway Properties, Inc. | 24,096 | 331,802 | ||||||
|
| |||||||
Total Real Estate Investment Trusts (REITs) | 638,019 | |||||||
|
| |||||||
Road & Rail - 0.2% |
| |||||||
Arkansas Best Corp. | 18,891 | 152,072 | ||||||
|
| |||||||
Total Road & Rail | 152,072 | |||||||
|
| |||||||
Semiconductors & Semiconductor Equipment - 1.9% |
| |||||||
Advanced Energy Industries, Inc.* | 20,714 | 244,632 | ||||||
Cohu, Inc. | 31,794 | 279,787 | ||||||
| 38 | GUGGENHEIM ETFS ANNUAL REPORT | See Notes to Financial Statements. |
Table of Contents
| SCHEDULE OF INVESTMENTS (concluded) | October 31, 2012 |
GUGGENHEIM S&P SMALLCAP 600® PURE VALUE ETF
| SHARES | VALUE | |||||||
DSP Group, Inc.* | 28,284 | $ | 155,562 | |||||
Pericom Semiconductor Corp.* | 34,391 | 265,843 | ||||||
Sigma Designs, Inc.* | 74,518 | 442,637 | ||||||
|
| |||||||
Total Semiconductors & Semiconductor Equipment | 1,388,461 | |||||||
|
| |||||||
Specialty Retail - 14.2% |
| |||||||
Big 5 Sporting Goods Corp. | 63,806 | 569,787 | ||||||
Brown Shoe Co., Inc. | 85,368 | 1,347,107 | ||||||
Christopher & Banks Corp.* | 148,584 | 463,582 | ||||||
Coldwater Creek, Inc.* | 88,494 | 367,250 | ||||||
Group 1 Automotive, Inc. | 9,701 | 601,559 | ||||||
Haverty Furniture Cos., Inc. | 27,374 | 410,884 | ||||||
Lithia Motors, Inc. — Class A | 16,329 | 558,452 | ||||||
MarineMax, Inc.* | 111,247 | 915,563 | ||||||
OfficeMax, Inc. | 179,305 | 1,317,892 | ||||||
Pep Boys- Manny, Moe & Jack | 45,356 | 453,106 | ||||||
Sonic Automotive, Inc. — Class A | 37,434 | 726,220 | ||||||
Stage Stores, Inc. | 43,716 | 1,071,042 | ||||||
Stein Mart, Inc.* | 101,354 | 796,642 | ||||||
Zale Corp.* | 90,762 | 651,671 | ||||||
|
| |||||||
Total Specialty Retail | 10,250,757 | |||||||
|
| |||||||
Textiles, Apparel & Luxury Goods - 4.1% |
| |||||||
Perry Ellis International, Inc.* | 64,569 | 1,332,704 | ||||||
Quiksilver, Inc.* | 182,333 | 583,466 | ||||||
Skechers U.S.A., Inc. — Class A* | 60,977 | 1,012,218 | ||||||
|
| |||||||
Total Textiles, Apparel & Luxury Goods | 2,928,388 | |||||||
|
| |||||||
Tobacco - 0.3% |
| |||||||
Alliance One International, Inc.* | 63,644 | 193,478 | ||||||
|
| |||||||
Total Tobacco | 193,478 | |||||||
|
| |||||||
Total Common Stocks | 72,006,392 | |||||||
|
| |||||||
SHORT TERM INVESTMENTS - 0.1% |
| |||||||
SSgA Government Money Market Fund | 60,310 | 60,310 | ||||||
|
| |||||||
Total Short Term Investments |
| 60,310 | ||||||
|
| |||||||
| FACE AMOUNT | VALUE | |||||||
SECURITIES LENDING COLLATERAL - 2.2%d |
| |||||||
Joint Repurchase Agreements |
| |||||||
Merrill Lynch Fenner & Smith, Inc. issued 10/31/12 at 0.28% | $ | 577,414 | $ | 577,414 | ||||
RBS Securities, Inc. | 981,748 | 981,748 | ||||||
|
| |||||||
Total Securities Lending Collateral | 1,559,162 | |||||||
|
| |||||||
Total Investments 102.2%c |
| 73,625,864 | ||||||
|
| |||||||
Other Assets and Liabilities, net - (2.2)% |
| (1,560,254 | ) | |||||
|
| |||||||
Net Assets - 100.0% | $ | 72,065,610 | ||||||
|
| |||||||
| * | Non-Income Producing Security. |
| a | All or a portion of this security was on loan as of October 31, 2012. |
| b | Values determined based on Level 2 inputs (Note E). |
| c | Unless otherwise indicated, the values of the Investments are determined based on Level 1 inputs. |
| d | Securities lending collateral (Note H). |
| See Notes to Financial Statements. | GUGGENHEIM ETFS ANNUAL REPORT | 39 |
Table of Contents
| SCHEDULE OF INVESTMENTS | October 31, 2012 |
GUGGENHEIM S&P SMALLCAP 600® PURE GROWTH ETF
| SHARES | VALUE | |||||||
COMMON STOCKS - 100.0% |
| |||||||
Aerospace & Defense - 3.1% |
| |||||||
Aerovironment, Inc.* | 7,760 | $ | 170,643 | |||||
American Science & Engineering, Inc. | 10,771 | 684,820 | ||||||
Cubic Corp. | 13,224 | 645,331 | ||||||
National Presto Industries, Inc. | 5,061 | 376,285 | ||||||
Teledyne Technologies, Inc.* | 6,044 | 386,997 | ||||||
|
| |||||||
Total Aerospace & Defense | 2,264,076 | |||||||
|
| |||||||
Air Freight & Logistics - 0.3% |
| |||||||
Forward Air Corp. | 6,824 | 227,717 | ||||||
|
| |||||||
Total Air Freight & Logistics | 227,717 | |||||||
|
| |||||||
Airlines - 1.4% |
| |||||||
Allegiant Travel Co.* | 14,450 | 1,051,093 | ||||||
|
| |||||||
Total Airlines | 1,051,093 | |||||||
|
| |||||||
Beverages - 0.9% |
| |||||||
Boston Beer Co., Inc. — Class A*a | 5,955 | 640,639 | ||||||
|
| |||||||
Total Beverages | 640,639 | |||||||
|
| |||||||
Biotechnology - 3.0% |
| |||||||
Acorda Therapeutics, Inc.* | 20,294 | 486,041 | ||||||
ArQule, Inc.* | 62,846 | 157,744 | ||||||
Cubist Pharmaceuticals, Inc.* | 15,356 | 658,772 | ||||||
Momenta Pharmaceuticals, Inc.* | 43,574 | 552,518 | ||||||
Spectrum Pharmaceuticals, Inc.*a | 30,609 | 341,597 | ||||||
|
| |||||||
Total Biotechnology | 2,196,672 | |||||||
|
| |||||||
Capital Markets - 0.6% |
| |||||||
Financial Engines, Inc.* | 19,750 | 474,198 | ||||||
|
| |||||||
Total Capital Markets | 474,198 | |||||||
|
| |||||||
Chemicals - 2.0% |
| |||||||
Balchem Corp. | 10,992 | 382,851 | ||||||
Hawkins, Inc. | 13,535 | 529,219 | ||||||
Innophos Holdings, Inc. | 11,735 | 559,173 | ||||||
|
| |||||||
Total Chemicals | 1,471,243 | |||||||
|
| |||||||
Commercial Services & Supplies - 1.5% |
| |||||||
Portfolio Recovery Associates, Inc.* | 10,142 | 1,061,360 | ||||||
|
| |||||||
Total Commercial Services & Supplies | 1,061,360 | |||||||
|
| |||||||
Communications Equipment - 0.7% |
| |||||||
Netgear, Inc.* | 8,016 | 284,648 | ||||||
ViaSat, Inc.* | 6,309 | 245,042 | ||||||
|
| |||||||
Total Communications Equipment | 529,690 | |||||||
|
| |||||||
Computers & Peripherals - 0.5% |
| |||||||
Synaptics, Inc.* | 16,042 | 371,533 | ||||||
|
| |||||||
Total Computers & Peripherals | 371,533 | |||||||
|
| |||||||
Consumer Finance - 2.5% |
| |||||||
Cash America International, Inc. | 11,601 | 453,483 | ||||||
EZCORP, Inc. — Class A* | 16,193 | 318,354 | ||||||
First Cash Financial Services, Inc.* | 7,916 | 353,529 | ||||||
World Acceptance Corp.* | 10,298 | 687,495 | ||||||
|
| |||||||
Total Consumer Finance | 1,812,861 | |||||||
|
| |||||||
| SHARES | VALUE | |||||||
Diversified Consumer Services - 2.6% |
| |||||||
American Public Education, Inc.* | 15,811 | $ | 575,995 | |||||
Capella Education Co.* | 18,241 | 569,484 | ||||||
Coinstar, Inc.*a | 16,222 | 761,460 | ||||||
|
| |||||||
Total Diversified Consumer Services | 1,906,939 | |||||||
|
| |||||||
Diversified Financial Services - 0.7% |
| |||||||
MarketAxess Holdings, Inc. | 15,588 | 486,969 | ||||||
|
| |||||||
Total Diversified Financial Services | 486,969 | |||||||
|
| |||||||
Diversified Telecommunication Services - 0.8% |
| |||||||
Atlantic Tele-Network, Inc. | 13,805 | 572,079 | ||||||
|
| |||||||
Total Diversified Telecommunication Services | 572,079 | |||||||
|
| |||||||
Electrical Equipment - 1.8% |
| |||||||
AZZ, Inc. | 15,025 | 592,586 | ||||||
Franklin Electric Co., Inc. | 8,593 | 497,879 | ||||||
II-VI, Inc.* | 15,010 | 247,815 | ||||||
|
| |||||||
Total Electrical Equipment | 1,338,280 | |||||||
|
| |||||||
Electronic Equipment, Instruments & Components - 4.3% |
| |||||||
Cognex Corp. | 12,015 | 438,067 | ||||||
Coherent, Inc.* | 17,233 | 786,686 | ||||||
DTS, Inc.* | 16,259 | 341,114 | ||||||
FARO Technologies, Inc.* | 4,833 | 194,287 | ||||||
Littelfuse, Inc. | 9,182 | 492,155 | ||||||
MTS Systems Corp. | 7,637 | 384,981 | ||||||
OSI Systems, Inc.* | 6,279 | 497,611 | ||||||
|
| |||||||
Total Electronic Equipment, Instruments & Components | 3,134,901 | |||||||
|
| |||||||
Energy Equipment & Services - 1.9% |
| |||||||
Geospace Technologies Corp.* | 6,566 | 425,017 | ||||||
Lufkin Industries, Inc. | 4,869 | 243,499 | ||||||
SEACOR Holdings, Inc.* | 8,347 | 732,115 | ||||||
|
| |||||||
Total Energy Equipment & Services | 1,400,631 | |||||||
|
| |||||||
Food & Staples Retailing - 0.8% |
| |||||||
Casey’s General Stores, Inc. | 11,720 | 604,166 | ||||||
|
| |||||||
Total Food & Staples Retailing | 604,166 | |||||||
|
| |||||||
Food Products - 2.1% |
| |||||||
J&J Snack Foods Corp. | 9,149 | 523,963 | ||||||
Sanderson Farms, Inc. | 12,070 | 546,651 | ||||||
TreeHouse Foods, Inc.* | 9,311 | 498,604 | ||||||
|
| |||||||
Total Food Products | 1,569,218 | |||||||
|
| |||||||
Gas Utilities - 0.4% |
| |||||||
South Jersey Industries, Inc. | 5,597 | 283,152 | ||||||
|
| |||||||
Total Gas Utilities | 283,152 | |||||||
|
| |||||||
Health Care Equipment & Supplies - 6.1% |
| |||||||
Abaxis, Inc.* | 9,956 | 366,182 | ||||||
Analogic Corp. | 7,877 | 580,220 | ||||||
Cyberonics, Inc.* | 15,349 | 709,891 | ||||||
Haemonetics Corp.* | 9,786 | 799,516 | ||||||
ICU Medical, Inc.* | 13,992 | 830,145 | ||||||
Neogen Corp.* | 14,730 | 630,297 | ||||||
NuVasive, Inc.* | 40,098 | 578,213 | ||||||
|
| |||||||
Total Health Care Equipment & Supplies | 4,494,464 | |||||||
|
| |||||||
| 40 | GUGGENHEIM ETFS ANNUAL REPORT | See Notes to Financial Statements. |
Table of Contents
| SCHEDULE OF INVESTMENTS (continued) | October 31, 2012 |
GUGGENHEIM S&P SMALLCAP 600® PURE GROWTH ETF
| SHARES | VALUE | |||||||
Health Care Providers & Services - 7.4% |
| |||||||
Air Methods Corp.* | 6,909 | $ | 757,434 | |||||
Chemed Corp. | 10,222 | 687,429 | ||||||
CorVel Corp.* | 12,749 | 542,215 | ||||||
Ensign Group, Inc. (The) | 16,797 | 489,801 | ||||||
IPC The Hospitalist Co., Inc.* | 14,955 | 515,798 | ||||||
Landauer, Inc. | 9,315 | 539,804 | ||||||
Magellan Health Services, Inc.* | 14,500 | 727,175 | ||||||
MWI Veterinary Supply, Inc.* | 10,807 | 1,134,951 | ||||||
|
| |||||||
Total Health Care Providers & Services | 5,394,607 | |||||||
|
| |||||||
Health Care Technology - 2.6% |
| |||||||
Computer Programs & Systems, Inc. | 10,961 | 535,006 | ||||||
Medidata Solutions, Inc.* | 27,092 | 1,138,406 | ||||||
Quality Systems, Inc. | 14,667 | 255,939 | ||||||
|
| |||||||
Total Health Care Technology | 1,929,351 | |||||||
|
| |||||||
Hotels, Restaurants & Leisure - 4.9% |
| |||||||
Biglari Holdings, Inc.* | 1,627 | 575,323 | ||||||
BJ’s Restaurants, Inc.* | 13,399 | 442,837 | ||||||
Buffalo Wild Wings, Inc.* | 11,611 | 881,855 | ||||||
CEC Entertainment, Inc. | 13,920 | 431,520 | ||||||
DineEquity, Inc.* | 12,888 | 808,078 | ||||||
Papa John’s International, Inc.* | 8,481 | 452,207 | ||||||
|
| |||||||
Total Hotels, Restaurants & Leisure | 3,591,820 | |||||||
|
| |||||||
Household Durables - 0.4% | ||||||||
iRobot Corp.* | 14,232 | 255,749 | ||||||
|
| |||||||
Total Household Durables | 255,749 | |||||||
|
| |||||||
Household Products - 0.4% |
| |||||||
WD-40 Co. | 6,228 | 298,072 | ||||||
|
| |||||||
Total Household Products | 298,072 | |||||||
|
| |||||||
Insurance - 1.8% |
| |||||||
Infinity Property & Casualty Corp. | 10,095 | 576,525 | ||||||
ProAssurance Corp. | 4,888 | 436,987 | ||||||
RLI Corp. | 4,287 | 292,288 | ||||||
|
| |||||||
Total Insurance | 1,305,800 | |||||||
|
| |||||||
Internet & Catalog Retail - 0.4% |
| |||||||
Blue Nile, Inc.*a | 6,823 | 257,705 | ||||||
|
| |||||||
Total Internet & Catalog Retail | 257,705 | |||||||
|
| |||||||
Internet Software & Services - 4.2% |
| |||||||
Blucora, Inc.* | 43,725 | 767,374 | ||||||
comScore, Inc.* | 13,551 | 192,018 | ||||||
j2 Global, Inc. | 9,111 | 273,694 | ||||||
Liquidity Services, Inc.* | 5,046 | 208,047 | ||||||
LivePerson, Inc.* | 19,308 | 302,942 | ||||||
LogMeIn, Inc.* | 14,721 | 363,314 | ||||||
OpenTable, Inc.*a | 14,936 | 701,544 | ||||||
Stamps.com, Inc.* | 11,066 | 304,536 | ||||||
|
| |||||||
Total Internet Software & Services | 3,113,469 | |||||||
|
| |||||||
IT Services - 2.3% |
| |||||||
CACI International, Inc. — Class A* | 11,777 | 593,914 | ||||||
Forrester Research, Inc. | 7,028 | 203,390 | ||||||
| SHARES | VALUE | |||||||
Higher One Holdings, Inc.*a | 19,019 | $ | 240,210 | |||||
MAXIMUS, Inc. | 12,286 | 677,942 | ||||||
|
| |||||||
Total IT Services | 1,715,456 | |||||||
|
| |||||||
Leisure Equipment & Products - 1.0% |
| |||||||
Sturm Ruger & Co., Inc.a | 15,319 | 723,516 | ||||||
|
| |||||||
Total Leisure Equipment & Products | 723,516 | |||||||
|
| |||||||
Life Sciences Tools & Services - 0.4% |
| |||||||
Luminex Corp.* | 16,352 | 262,940 | ||||||
|
| |||||||
Total Life Sciences Tools & Services | 262,940 | |||||||
|
| |||||||
Machinery - 1.2% |
| |||||||
Lindsay Corp. | 5,354 | 408,885 | ||||||
Toro Co. (The) | 11,925 | 503,473 | ||||||
|
| |||||||
Total Machinery | 912,358 | |||||||
|
| |||||||
Media - 0.5% |
| |||||||
Arbitron, Inc. | 9,135 | 332,149 | ||||||
|
| |||||||
Total Media | 332,149 | |||||||
|
| |||||||
Oil, Gas & Consumable Fuels - 1.0% |
| |||||||
Approach Resources, Inc.* | 9,404 | 231,621 | ||||||
Contango Oil & Gas Co.* | 10,701 | 526,061 | ||||||
|
| |||||||
Total Oil, Gas & Consumable Fuels | 757,682 | |||||||
|
| |||||||
Paper & Forest Products - 1.1% |
| |||||||
Deltic Timber Corp. | 6,536 | 443,533 | ||||||
Schweitzer-Mauduit International, Inc. | 11,045 | 386,906 | ||||||
|
| |||||||
Total Paper & Forest Products | 830,439 | |||||||
|
| |||||||
Personal Products - 1.0% |
| |||||||
Medifast, Inc.* | 28,280 | 721,706 | ||||||
|
| |||||||
Total Personal Products | 721,706 | |||||||
|
| |||||||
Pharmaceuticals - 3.4% |
| |||||||
Akorn, Inc.* | 23,632 | 283,820 | ||||||
Hi-Tech Pharmacal Co., Inc.* | 19,356 | 606,811 | ||||||
Medicines Co. (The)* | 27,349 | 599,490 | ||||||
Questcor Pharmaceuticals, Inc.a | 13,884 | 353,765 | ||||||
Salix Pharmaceuticals Ltd.* | 5,449 | 212,729 | ||||||
ViroPharma, Inc.* | 16,489 | 416,347 | ||||||
|
| |||||||
Total Pharmaceuticals | 2,472,962 | |||||||
|
| |||||||
Professional Services - 1.1% |
| |||||||
Dolan Co. (The)* | 60,002 | 277,809 | ||||||
Exponent, Inc.* | 9,657 | 530,942 | ||||||
|
| |||||||
Total Professional Services | 808,751 | |||||||
|
| |||||||
Real Estate Investment Trusts (REITs) - 1.2% |
| |||||||
EastGroup Properties, Inc. | 4,984 | 259,467 | ||||||
Mid-America Apartment Communities, Inc. | 4,634 | 299,866 | ||||||
PS Business Parks, Inc. | 4,955 | 317,764 | ||||||
|
| |||||||
Total Real Estate Investment Trusts (REITs) | 877,097 | |||||||
|
| |||||||
Semiconductors & Semiconductor Equipment - 10.0% |
| |||||||
Cabot Microelectronics Corp. | 8,461 | 252,138 | ||||||
CEVA, Inc.* | 8,419 | 127,548 | ||||||
Cirrus Logic, Inc.* | 37,450 | 1,526,462 | ||||||
Cymer, Inc.* | 7,913 | 630,587 | ||||||
| See Notes to Financial Statements. | GUGGENHEIM ETFS ANNUAL REPORT | 41 |
Table of Contents
| SCHEDULE OF INVESTMENTS (concluded) | October 31, 2012 |
GUGGENHEIM S&P SMALLCAP 600® PURE GROWTH ETF
| SHARES | VALUE | |||||||
Entropic Communications, Inc.* | 85,245 | $ | 410,028 | |||||
Exar Corp.* | 78,413 | 670,431 | ||||||
GT Advanced Technologies, Inc.*a | 49,164 | 213,372 | ||||||
Hittite Microwave Corp.* | 13,551 | 767,529 | ||||||
Kulicke & Soffa Industries, Inc.* | 59,854 | 614,102 | ||||||
Power Integrations, Inc. | 15,510 | 458,786 | ||||||
Rubicon Technology, Inc.*a | 47,586 | 413,522 | ||||||
Veeco Instruments, Inc.* | 29,938 | 919,096 | ||||||
Volterra Semiconductor Corp.* | 18,992 | 345,085 | ||||||
|
| |||||||
Total Semiconductors & Semiconductor Equipment | 7,348,686 | |||||||
|
| |||||||
Software - 7.6% |
| |||||||
Blackbaud, Inc. | 8,206 | 195,057 | ||||||
CommVault Systems, Inc.* | 13,646 | 852,465 | ||||||
Ebix, Inc. | 20,715 | 451,380 | ||||||
Interactive Intelligence Group, Inc.* | 12,242 | 388,194 | ||||||
JDA Software Group, Inc.* | 9,035 | 344,595 | ||||||
Manhattan Associates, Inc.* | 6,465 | 387,900 | ||||||
MicroStrategy, Inc. — Class A* | 4,559 | 430,689 | ||||||
Netscout Systems, Inc.* | 15,970 | 394,938 | ||||||
OPNET Technologies, Inc. | 10,457 | 443,690 | ||||||
Sourcefire, Inc.* | 16,706 | 714,850 | ||||||
Synchronoss Technologies, Inc.* | 8,036 | 164,658 | ||||||
Tyler Technologies, Inc.* | 12,822 | 613,020 | ||||||
Websense, Inc.* | 17,220 | 227,648 | ||||||
|
| |||||||
Total Software | 5,609,084 | |||||||
|
| |||||||
Specialty Retail - 5.8% |
| |||||||
Buckle, Inc. (The) | 13,673 | 617,609 | ||||||
Children’s Place Retail Stores, Inc. (The)* | 7,085 | 413,977 | ||||||
Genesco, Inc.* | 8,091 | 463,614 | ||||||
Hibbett Sports, Inc.* | 11,180 | 603,608 | ||||||
JOS A Bank Clothiers, Inc.* | 12,130 | 567,563 | ||||||
Monro Muffler Brake, Inc. | 12,450 | 422,304 | ||||||
Rue21, Inc.* | 18,771 | 565,195 | ||||||
Vitamin Shoppe, Inc.* | 10,295 | 589,286 | ||||||
|
| |||||||
Total Specialty Retail | 4,243,156 | |||||||
|
| |||||||
Textiles, Apparel & Luxury Goods - 1.8% |
| |||||||
Steven Madden Ltd.* | 15,929 | 683,673 | ||||||
True Religion Apparel, Inc. | 15,025 | 385,391 | ||||||
Wolverine World Wide, Inc. | 6,705 | 280,738 | ||||||
|
| |||||||
Total Textiles, Apparel & Luxury Goods | 1,349,802 | |||||||
|
| |||||||
| SHARES | VALUE | |||||||
Water Utilities - 0.5% |
| |||||||
American States Water Co. | 7,810 | $ | 343,796 | |||||
|
| |||||||
Total Water Utilities | 343,796 | |||||||
|
| |||||||
Total Common Stocks | 73,348,034 | |||||||
|
| |||||||
SHORT TERM INVESTMENTS - 0.0%b |
| |||||||
SSgA Government Money Market Fund | 23,928 | 23,928 | ||||||
|
| |||||||
Total Short Term Investments | 23,928 | |||||||
|
| |||||||
FACE | ||||||||
SECURITIES LENDING COLLATERAL - 2.9%d |
| |||||||
Joint Repurchase Agreements |
| |||||||
Merril Lynch, Fenner & Smith, Inc. | $ | 787,009 | 787,009 | |||||
RBS Securities, Inc. | 1,338,112 | 1,338,112 | ||||||
|
| |||||||
Total Securities Lending Collateral | 2,125,121 | |||||||
|
| |||||||
Total Investments 102.9%d | 75,497,083 | |||||||
|
| |||||||
Other Assets and Liabilities, net - (2.9)% |
| (2,137,600 | ) | |||||
|
| |||||||
Net Assets - 100.0% | $ | 73,359,483 | ||||||
|
| |||||||
| * | Non-Income Producing Security. |
| a | All or a portion of this security was on loan as of October 31, 2012. |
| b | Amount represents less than 0.05% of net assets. |
| c | Values determined based on Level 2 inputs (Note E). |
| d | Unless otherwise indicated, the values of the Investments are determined based on Level 1 inputs. |
| e | Securities lending collateral (Note H). |
| 42 | GUGGENHEIM ETFS ANNUAL REPORT | See Notes to Financial Statements. |
Table of Contents
| STATEMENTS OF ASSETS AND LIABILITIES | October 31, 2012 |
| Guggenheim Russell Top 50® Mega Cap ETF | Guggenheim S&P 500® Pure Value ETF | Guggenheim S&P 500® Pure Growth ETF | Guggenheim S&P MidCap 400® Pure Value ETF | |||||||||||||
| ASSETS: | ||||||||||||||||
Investments, at value*— including $ — ; $2,197,080; $4,239,210 and $863,724 of securities loaned, respectively | $ | 623,711,770 | $ | 87,809,485 | $ | 336,557,611 | $ | 35,901,864 | ||||||||
Cash | 769 | — | — | — | ||||||||||||
Receivables: | ||||||||||||||||
Fund shares sold | — | — | — | 1,749,882 | ||||||||||||
Dividends and Interest | 863,118 | 53,752 | 124,770 | 13,509 | ||||||||||||
Total assets | 624,575,657 | 87,863,237 | 336,682,381 | 37,665,255 | ||||||||||||
| LIABILITIES: | ||||||||||||||||
Payable upon return of securities loaned | — | 2,254,830 | 4,328,414 | 891,213 | ||||||||||||
Payable for: | ||||||||||||||||
Investments purchased | — | — | — | 1,748,949 | ||||||||||||
Accrued management fees | 108,064 | 25,519 | 100,483 | 9,950 | ||||||||||||
Total liabilities | 108,064 | 2,280,349 | 4,428,897 | 2,650,112 | ||||||||||||
| NET ASSETS | $ | 624,467,593 | $ | 85,582,888 | $ | 332,253,484 | $ | 35,015,143 | ||||||||
| NETASSETSCONSISTOF: | ||||||||||||||||
Paid-in capital | $ | 728,619,121 | $ | 92,132,381 | $ | 328,447,599 | $ | 37,769,235 | ||||||||
Undistributed net investment income | 1,107,227 | 36,334 | 58,605 | 8,655 | ||||||||||||
Accumulated net realized loss on investments | (109,275,676 | ) | (9,386,769 | ) | (24,339,934 | ) | (4,289,481 | ) | ||||||||
Net unrealized appreciation on investments | 4,016,921 | 2,800,942 | 28,087,214 | 1,526,734 | ||||||||||||
| NETASSETS | $ | 624,467,593 | $ | 85,582,888 | $ | 332,253,484 | $ | 35,015,143 | ||||||||
Shares outstanding (unlimited shares authorized), no par value | 6,000,785 | 2,652,836 | 6,950,299 | 1,000,499 | ||||||||||||
Net asset value, offering price and repurchase price per share | $104.06 | $32.26 | $47.80 | $35.00 | ||||||||||||
*Total cost of investments | $ | 619,694,849 | $ | 85,008,543 | $ | 308,470,397 | $ | 34,375,130 | ||||||||
| See Notes to Financial Statements. | GUGGENHEIM ETFS ANNUAL REPORT | 43 |
Table of Contents
| STATEMENTS OF ASSETS AND LIABILITIES (concluded) | October 31, 2012 |
| Guggenheim S&P MidCap 400® Pure Growth ETF | Guggenheim S&P SmallCap 600® Pure Value ETF | Guggenheim S&P SmallCap 600® Pure Growth ETF | ||||||||||
| ASSETS: | ||||||||||||
Investments, at value*—including $20,245,526; $1,472,597 and $2,054,532 of securities loaned, respectively | $ | 532,266,122 | $ | 73,625,864 | $ | 75,497,083 | ||||||
Cash | 419,150 | — | 804,523 | |||||||||
Receivables: | ||||||||||||
Investments sold | — | 214,745 | — | |||||||||
Dividends and Interest | 84,162 | 21,766 | 9,579 | |||||||||
Total assets | 532,769,434 | 73,862,375 | 76,311,185 | |||||||||
| LIABILITIES: | ||||||||||||
Payable upon return of securities loaned | 20,737,131 | 1,559,162 | 2,125,121 | |||||||||
Payable for: | ||||||||||||
Investments purchased | — | 33,723 | 804,522 | |||||||||
Due to custodian | — | 182,299 | — | |||||||||
Accrued management fees | 151,688 | 21,581 | 22,059 | |||||||||
Total liabilities | 20,888,819 | 1,796,765 | 2,951,702 | |||||||||
| NET ASSETS | $ | 511,880,615 | $ | 72,065,610 | $ | 73,359,483 | ||||||
| NETASSETSCONSISTOF: | ||||||||||||
Paid-in capital | $ | 531,532,242 | $ | 96,978,495 | $ | 74,596,663 | ||||||
Undistributed net investment income | 362,493 | — | — | |||||||||
Accumulated net realized loss on investments | (44,680,364 | ) | (23,961,513 | ) | (3,074,211 | ) | ||||||
Net unrealized appreciation (depreciation) on investments | 24,666,244 | (951,372 | ) | 1,837,031 | ||||||||
| NETASSETS | $ | 511,880,615 | $ | 72,065,610 | $ | 73,359,483 | ||||||
Shares outstanding (unlimited shares authorized), no par value | 5,800,021 | 1,800,040 | 1,350,004 | |||||||||
Net asset value, offering price and repurchase price per share | $88.25 | $40.04 | $54.34 | |||||||||
*Total cost of investments | $ | 507,599,878 | $ | 74,577,236 | $ | 73,660,052 | ||||||
| 44 | GUGGENHEIM ETFS ANNUAL REPORT | See Notes to Financial Statements. |
Table of Contents
| STATEMENTS OF OPERATIONS |
For the Year Ended October 31, 2012
| Guggenheim Russell Top 50® Mega Cap ETF | Guggenheim S&P 500® Pure Value ETF | Guggenheim S&P 500® Pure Growth ETF | Guggenheim S&P MidCap 400® Pure Value ETF | |||||||||||||
| INVESTMENT INCOME: | ||||||||||||||||
Dividends, net of foreign taxes withheld* | $ | 11,701,125 | $ | 1,629,702 | $ | 3,207,045 | $ | 623,520 | ||||||||
Income from securities lending | 77 | 4,265 | 9,885 | 1,196 | ||||||||||||
Interest | 74 | 2 | 14 | 1 | ||||||||||||
Total investment income | 11,701,276 | 1,633,969 | 3,216,944 | 624,717 | ||||||||||||
| EXPENSES: | ||||||||||||||||
Management fee | 980,674 | 293,053 | 1,061,772 | 127,855 | ||||||||||||
Other fees | 162 | — | — | — | ||||||||||||
Total expenses | 980,836 | 293,053 | 1,061,772 | 127,855 | ||||||||||||
Net investment income | 10,720,440 | 1,340,916 | 2,155,172 | 496,862 | ||||||||||||
| NET REALIZEDAND UNREALIZED GAIN (LOSS): | ||||||||||||||||
Net realized gain (loss) on: | ||||||||||||||||
Investments | (9,608,526 | ) | (1,250,632 | ) | (22,004,166 | ) | (1,580,044 | ) | ||||||||
In-kind redemptions | 46,133,674 | 2,775,916 | 4,548,262 | 1,346,075 | ||||||||||||
Net realized gain (loss) | 36,525,148 | 1,525,284 | (17,455,904 | ) | (233,969 | ) | ||||||||||
Net change in unrealized appreciation (depreciation) on: | ||||||||||||||||
Investments | 29,002,637 | 8,342,608 | 35,947,461 | 5,102,579 | ||||||||||||
Net realized and unrealized gain | 65,527,785 | 9,867,892 | 18,491,557 | 4,868,610 | ||||||||||||
Net increase in net assets resulting from operations | $ | 76,248,225 | $ | 11,208,808 | $ | 20,646,729 | $ | 5,365,472 | ||||||||
* Foreign taxes withheld | $ | 2,068 | $ | — | $ | — | $ | — | ||||||||
| See Notes to Financial Statements. | GUGGENHEIM ETFS ANNUAL REPORT | 45 |
Table of Contents
| STATEMENTS OF OPERATIONS (concluded) |
For the Year Ended October 31, 2012
| Guggenheim S&P MidCap 400® Pure Growth ETF | Guggenheim S&P SmallCap 600® Pure Value ETF | Guggenheim S&P SmallCap 600® Pure Growth ETF | ||||||||||
| INVESTMENT INCOME: | ||||||||||||
Dividends | $ | 3,144,884 | $ | 687,154 | $ | 494,966 | ||||||
Income from securities lending | 78,018 | 3,411 | 4,022 | |||||||||
Total investment income | 3,222,902 | 690,565 | 498,988 | |||||||||
| EXPENSES: | ||||||||||||
Management fee | 1,946,096 | 242,686 | 239,551 | |||||||||
Other fees | — | — | 66 | |||||||||
Total expenses | 1,946,096 | 242,686 | 239,617 | |||||||||
Net investment income | 1,276,806 | 447,879 | 259,371 | |||||||||
| NET REALIZEDAND UNREALIZED GAIN (LOSS): | ||||||||||||
Net realized gain (loss) on: | ||||||||||||
Investments | (45,895,340 | ) | (3,438,032 | ) | (2,201,565 | ) | ||||||
In-kind redemptions | 27,326,209 | 270,929 | 1,662,752 | |||||||||
Net realized loss | (18,569,131 | ) | (3,167,103 | ) | (538,813 | ) | ||||||
Net change in unrealized appreciation (depreciation) on: | ||||||||||||
Investments | 48,063,368 | 9,518,258 | 5,933,299 | |||||||||
Net realized and unrealized gain | 29,494,237 | 6,351,155 | 5,394,486 | |||||||||
Net increase in net assets resulting from operations | $ | 30,771,043 | $ | 6,799,034 | $ | 5,653,857 | ||||||
| 46 | GUGGENHEIM ETFS ANNUAL REPORT | See Notes to Financial Statements. |
Table of Contents
| STATEMENTS OF CHANGES IN NET ASSETS |
| Guggenheim Russell Top 50® Mega Cap ETF | Guggenheim S&P 500® Pure Value ETF | |||||||||||||||
| Year Ended October 31, 2012 | Year Ended October 31, 2011 | Year Ended October 31, 2012 | Year Ended October 31, 2011 | |||||||||||||
| INCREASE (DECREASE)IN NETASSETSFROM OPERATIONS: | ||||||||||||||||
Net investment income | $ | 10,720,440 | $ | 7,875,126 | $ | 1,340,916 | $ | 1,288,269 | ||||||||
Net realized gain (loss) on investments | 36,525,148 | (1,000,821 | ) | 1,525,284 | 1,122,980 | |||||||||||
Net change in unrealized appreciation (depreciation) on investments | 29,002,637 | 19,318,113 | 8,342,608 | (2,290,115 | ) | |||||||||||
Net increase in net assets resulting from operations | 76,248,225 | 26,192,418 | 11,208,808 | 121,134 | ||||||||||||
| DISTRIBUTIONSTO SHAREHOLDERSFROM: | ||||||||||||||||
Net investment income | (10,403,624 | ) | (7,603,764 | ) | (1,370,034 | ) | (1,211,677 | ) | ||||||||
| SHAREHOLDER TRANSACTIONS: | ||||||||||||||||
Proceeds from shares purchased | 376,572,367 | 150,183,009 | 17,479,492 | 60,757,533 | ||||||||||||
Value of shares redeemed | (272,358,663 | ) | (38,031,580 | ) | (21,285,657 | ) | (35,992,276 | ) | ||||||||
Net increase (decrease) in net assets resulting from share transactions | 104,213,704 | 112,151,429 | (3,806,165 | ) | 24,765,257 | |||||||||||
Net increase in net assets | 170,058,305 | 130,740,083 | 6,032,609 | 23,674,714 | ||||||||||||
| NETASSETS | ||||||||||||||||
Beginning of year | 454,409,288 | 323,669,205 | 79,550,279 | 55,875,565 | ||||||||||||
End of year | $ | 624,467,593 | $ | 454,409,288 | $ | 85,582,888 | $ | 79,550,279 | ||||||||
Undistributed net investment income at end of year | $ | 1,107,227 | $ | 790,411 | $ | 36,334 | $ | 81,520 | ||||||||
| CHANGESINSHARESOUTSTANDING: | ||||||||||||||||
Shares sold | 3,800,000 | 1,700,000 | 550,000 | 2,000,000 | ||||||||||||
Shares redeemed | (2,850,000 | ) | (450,000 | ) | (700,000 | ) | (1,350,000 | ) | ||||||||
Net increase (decrease) in shares | 950,000 | 1,250,000 | (150,000 | ) | 650,000 | |||||||||||
| See Notes to Financial Statements. | GUGGENHEIM ETFS ANNUAL REPORT | 47 |
Table of Contents
| STATEMENTS OF CHANGES IN NET ASSETS (continued) |
| Guggenheim S&P 500® Pure Growth ETF | Guggenheim S&P MidCap 400® Pure Value ETF | |||||||||||||||
| Year Ended October 31, 2012 | Year Ended October 31, 2011 | Year Ended October 31, 2012 | Year Ended October 31, 2011 | |||||||||||||
| INCREASE (DECREASE)IN NETASSETSFROM OPERATIONS: | ||||||||||||||||
Net investment income | $ | 2,155,172 | $ | 1,020,216 | $ | 496,862 | $ | 588,491 | ||||||||
Net realized gain (loss) on investments | (17,455,904 | ) | 23,480,072 | (233,969 | ) | 1,240,256 | ||||||||||
Net change in unrealized appreciation (depreciation) on investments | 35,947,461 | (23,088,187 | ) | 5,102,579 | (2,426,037 | ) | ||||||||||
Net increase (decrease) in net assets resulting from operations | 20,646,729 | 1,412,101 | 5,365,472 | (597,290 | ) | |||||||||||
| DISTRIBUTIONSTO SHAREHOLDERSFROM: | ||||||||||||||||
Net investment income | (2,094,006 | ) | (996,112 | ) | (516,543 | ) | (566,319 | ) | ||||||||
| SHAREHOLDER TRANSACTIONS: | ||||||||||||||||
Proceeds from shares purchased | 81,232,040 | 259,891,376 | 4,880,240 | 10,618,563 | ||||||||||||
Value of shares redeemed | (33,420,035 | ) | (141,889,014 | ) | (10,384,990 | ) | (16,872,735 | ) | ||||||||
Net increase (decrease) in net assets resulting from share transactions | 47,812,005 | 118,002,362 | (5,504,750 | ) | (6,254,172 | ) | ||||||||||
Net increase (decrease) in net assets | 66,364,728 | 118,418,351 | (655,821 | ) | (7,417,781 | ) | ||||||||||
| NETASSETS | ||||||||||||||||
Beginning of year | 265,888,756 | 147,470,405 | 35,670,964 | 43,088,745 | ||||||||||||
End of year | $ | 332,253,484 | $ | 265,888,756 | $ | 35,015,143 | $ | 35,670,964 | ||||||||
Undistributed net investment income at end of year | $ | 58,605 | $ | 15,198 | $ | 8,655 | $ | 28,336 | ||||||||
| CHANGESINSHARESOUTSTANDING: | ||||||||||||||||
Shares sold | 1,750,000 | 5,700,000 | 150,000 | 300,000 | ||||||||||||
Shares redeemed | (750,000 | ) | (3,400,000 | ) | (300,000 | ) | (550,000 | ) | ||||||||
Net increase (decrease) in shares | 1,000,000 | (2,300,000 | ) | (150,000 | ) | (250,000 | ) | |||||||||
| 48 | GUGGENHEIM ETFS ANNUAL REPORT | See Notes to Financial Statements. |
Table of Contents
| STATEMENTS OF CHANGES IN NET ASSETS (continued) |
| Guggenheim S&P MidCap 400® Pure Growth ETF | Guggenheim S&P SmallCap 600® Pure Value ETF | |||||||||||||||
| Year Ended October 31, 2012 | Year Ended October 31, 2011 | Year Ended October 31, 2012 | Year Ended October 31, 2011 | |||||||||||||
| INCREASE (DECREASE)IN NETASSETSFROM OPERATIONS: | ||||||||||||||||
Net investment income | $ | 1,276,806 | $ | 494,420 | $ | 447,879 | $ | 444,600 | ||||||||
Net realized gain (loss) on investments | (18,569,131 | ) | 69,090,697 | (3,167,103 | ) | 3,386,071 | ||||||||||
Net change in unrealized appreciation (depreciation) on investments | 48,063,368 | (51,357,329 | ) | 9,518,258 | 849,778 | |||||||||||
Net increase in net assets resulting from operations | 30,771,043 | 18,227,788 | 6,799,034 | 4,680,449 | ||||||||||||
| DISTRIBUTIONSTO SHAREHOLDERSFROM: | ||||||||||||||||
Net investment income | (980,107 | ) | (494,945 | ) | (452,652 | ) | (444,287 | ) | ||||||||
Return of Capital | — | — | (35,405 | ) | — | |||||||||||
Total distributions to shareholders | (980,107 | ) | (494,945 | ) | (488,057 | ) | (444,287 | ) | ||||||||
| SHAREHOLDER TRANSACTIONS: | ||||||||||||||||
Proceeds from shares purchased | 83,742,986 | 689,925,224 | 12,561,039 | 14,049,940 | ||||||||||||
Value of shares redeemed | (254,899,279 | ) | (346,841,356 | ) | (8,936,014 | ) | (43,539,405 | ) | ||||||||
Net increase (decrease) in net assets resulting from share transactions | (171,156,293 | ) | 343,083,868 | 3,625,025 | (29,489,465 | ) | ||||||||||
Net increase (decrease) in net assets | (141,365,357 | ) | 360,816,711 | 9,936,002 | (25,253,303 | ) | ||||||||||
| NETASSETS | ||||||||||||||||
Beginning of year | 653,245,972 | 292,429,261 | 62,129,608 | 87,382,911 | ||||||||||||
End of year | $ | 511,880,615 | $ | 653,245,972 | $ | 72,065,610 | $ | 62,129,608 | ||||||||
Undistributed net investment income at end of year | $ | 362,493 | $ | — | $ | — | $ | — | ||||||||
| CHANGESINSHARESOUTSTANDING: | ||||||||||||||||
Shares sold | 1,000,000 | 8,250,000 | 300,000 | 350,000 | ||||||||||||
Shares redeemed | (3,150,000 | ) | (4,450,000 | ) | (250,000 | ) | (1,150,000 | ) | ||||||||
Net increase (decrease) in shares | (2,150,000 | ) | 3,800,000 | 50,000 | (800,000 | ) | ||||||||||
| See Notes to Financial Statements. | GUGGENHEIM ETFS ANNUAL REPORT | 49 |
Table of Contents
| STATEMENTS OF CHANGES IN NET ASSETS (concluded) |
| Guggenheim S&P SmallCap 600® Pure Growth ETF | ||||||||
| Year Ended October 31, 2012 | Year Ended October 31, 2011 | |||||||
| INCREASE (DECREASE)IN NETASSETSFROM OPERATIONS: | ||||||||
Net investment income | $ | 259,371 | $ | 12,081 | ||||
Net realized loss on investments | (538,813 | ) | (1,667,405 | ) | ||||
Net change in unrealized appreciation (depreciation) on investments | 5,933,299 | (6,355,046 | ) | |||||
Net increase (decrease) in net assets resulting from operations | 5,653,857 | (8,010,370 | ) | |||||
| DISTRIBUTIONSTO SHAREHOLDERSFROM: | ||||||||
Net investment income | (263,737 | ) | (46,996 | ) | ||||
| SHAREHOLDER TRANSACTIONS: | ||||||||
Proceeds from shares purchased | 46,407,484 | 103,804,934 | ||||||
Value of shares redeemed | (13,310,670 | ) | (78,204,381 | ) | ||||
Net increase in net assets resulting from share transactions | 33,096,814 | 25,600,553 | ||||||
Net increase in net assets | 38,486,934 | 17,543,187 | ||||||
| NETASSETS | ||||||||
Beginning of year | 34,872,549 | 17,329,362 | ||||||
End of year | $ | 73,359,483 | $ | 34,872,549 | ||||
Undistributed net investment income at end of year | $ | — | $ | — | ||||
| CHANGESINSHARESOUTSTANDING: | ||||||||
Shares sold | 900,000 | 1,950,000 | ||||||
Shares redeemed | (250,000 | ) | (1,650,000 | ) | ||||
Net increase in shares | 650,000 | 300,000 | ||||||
| 50 | GUGGENHEIM ETFS ANNUAL REPORT | See Notes to Financial Statements. |
Table of Contents
GUGGENHEIM RUSSELL TOP 50® MEGA CAP ETF
| FINANCIAL HIGHLIGHTS |
| Year Ended October 31, 2012 | Year Ended October 31, 2011 | Year Ended October 31, 2010 | Year Ended October 31, 2009 | Year Ended October 31, 2008 | ||||||||||||||||
Per Share Data: |
| |||||||||||||||||||
Net asset value, beginning of period | $89.97 | $85.16 | $78.90 | $76.29 | $116.47 | |||||||||||||||
Income from investment operations: | ||||||||||||||||||||
Net investment income* | 2.17 | 1.87 | 1.72 | 1.95 | 2.34 | |||||||||||||||
Net gain (loss) on investments (realized and unrealized) | 14.02 | 4.74 | 6.26 | 2.61 | (40.20 | ) | ||||||||||||||
|
|
|
|
|
|
|
|
|
| |||||||||||
Total from investment operations | 16.19 | 6.61 | 7.98 | 4.56 | (37.86 | ) | ||||||||||||||
Less distributions from: | ||||||||||||||||||||
Net investment income | (2.10 | ) | (1.80 | ) | (1.72 | ) | (1.95 | ) | (2.32 | ) | ||||||||||
Net asset value, end of period | $104.06 | $89.97 | $85.16 | $78.90 | $76.29 | |||||||||||||||
|
|
|
|
|
|
|
|
|
| |||||||||||
Total Return** | 18.11% | 7.80% | 10.22% | 6.35% | (32.92% | ) | ||||||||||||||
Ratios/Supplemental Data: | ||||||||||||||||||||
Net assets, end of period (in thousands) | $624,468 | $454,409 | $323,669 | $315,662 | $434,878 | |||||||||||||||
Ratio to average net assets of: | ||||||||||||||||||||
Net investment income | 2.19% | 2.08% | 2.09% | 2.79% | 2.37% | |||||||||||||||
Total expenses | 0.20% | 0.20% | 0.20% | 0.20% | 0.20% | |||||||||||||||
Portfolio turnover rate† | 7% | 6% | 9% | 12% | 10% | |||||||||||||||
| * | Based on average shares outstanding. |
| ** | Total investment return is calculated assuming an initial investment made at the net asset value at the beginning of the period, reinvestment of all dividends and distribution at net asset value during the period, and redemption on the last day of the period. Transaction fees are not reflected in the calculation of total investment return. |
| † | Portfolio turnover does not include securities received or delivered from processing creations or redemptions. |
| See Notes to Financial Statements. | GUGGENHEIM ETFS ANNUAL REPORT | 51 |
Table of Contents
FINANCIAL HIGHLIGHTS (continued)
GUGGENHEIM S&P 500® PURE VALUE ETF
| Year Ended October 31, 2012 | Year Ended October 31, 2011 | Year Ended October 31, 2010 | Year Ended October 31, 2009 | Year Ended October 31, 2008 | ||||||||||||||||
Per Share Data: |
| |||||||||||||||||||
Net asset value, beginning of period | $28.38 | $25.95 | $21.46 | $17.98 | $34.46 | |||||||||||||||
Income from investment operations: | ||||||||||||||||||||
Net investment income* | 0.48 | 0.42 | 0.35 | 0.49 | 1.00 | |||||||||||||||
Net gain (loss) on investments (realized and unrealized) | 3.89 | 2.40 | 4.49 | 3.53 | (16.44 | ) | ||||||||||||||
|
|
|
|
|
|
|
|
|
| |||||||||||
Total from investment operations | 4.37 | 2.82 | 4.84 | 4.02 | (15.44 | ) | ||||||||||||||
Less distributions from: | ||||||||||||||||||||
Net investment income | (0.49 | ) | (0.39 | ) | (0.35 | ) | (0.54 | ) | (1.04 | ) | ||||||||||
Net asset value, end of period | $32.26 | $28.38 | $25.95 | $21.46 | $17.98 | |||||||||||||||
|
|
|
|
|
|
|
|
|
| |||||||||||
Total Return** | 15.54% | 10.84% | 22.67% | 23.73% | (45.76% | ) | ||||||||||||||
Ratios/Supplemental Data: | ||||||||||||||||||||
Net assets, end of period (in thousands) | $85,583 | $79,550 | $55,876 | $30,101 | $17,994 | |||||||||||||||
Ratio to average net assets of: | ||||||||||||||||||||
Net investment income | 1.60% | 1.44% | 1.38% | 2.92% | 3.63% | |||||||||||||||
Total expenses | 0.35% | 0.35% | 0.35% | 0.35% | 0.35% | |||||||||||||||
Portfolio turnover rate† | 37% | 23% | 27% | 45% | 53% | |||||||||||||||
| * | Based on average shares outstanding. |
| ** | Total investment return is calculated assuming an initial investment made at the net asset value at the beginning of the period, reinvestment of all dividends and distribution at net asset value during the period, and redemption on the last day of the period. Transaction fees are not reflected in the calculation of total investment return. |
| † | Portfolio turnover does not include securities received or delivered from processing creations or redemptions. |
| 52 | GUGGENHEIM ETFS ANNUAL REPORT | See Notes to Financial Statements. |
Table of Contents
GUGGENHEIM S&P 500® PURE GROWTH ETF
FINANCIAL HIGHLIGHTS (continued)
| Year Ended October 31, 2012 | Year Ended October 31, 2011 | Year Ended October 31, 2010 | Year Ended October 31, 2009 | Year Ended October 31, 2008 | ||||||||||||||||
Per Share Data: |
| |||||||||||||||||||
Net asset value, beginning of period | $44.68 | $40.40 | $30.85 | $24.40 | $39.59 | |||||||||||||||
Income from investment operations: | ||||||||||||||||||||
Net investment income* | 0.33 | 0.18 | 0.13 | 0.18 | 0.20 | |||||||||||||||
Net gain (loss) on investments (realized and unrealized) | 3.11 | 4.28 | 9.57 | 6.46 | (15.19 | ) | ||||||||||||||
|
|
|
|
|
|
|
|
|
| |||||||||||
Total from investment operations | 3.44 | 4.46 | 9.70 | 6.64 | (14.99 | ) | ||||||||||||||
Less distributions from: | ||||||||||||||||||||
Net investment income | (0.32 | ) | (0.18 | ) | (0.15 | ) | (0.19 | ) | (0.20 | ) | ||||||||||
Net asset value, end of period | $47.80 | $44.68 | $40.40 | $30.85 | $24.40 | |||||||||||||||
|
|
|
|
|
|
|
|
|
| |||||||||||
Total Return** | 7.72% | 11.06% | 31.51% | 27.41% | (38.00% | ) | ||||||||||||||
Ratios/Supplemental Data: | ||||||||||||||||||||
Net assets, end of period (in thousands) | $332,253 | $265,889 | $147,470 | $38,568 | $24,398 | |||||||||||||||
Ratio to average net assets of: | ||||||||||||||||||||
Net investment income | 0.71% | 0.41% | 0.37% | 0.69% | 0.57% | |||||||||||||||
Total expenses | 0.35% | 0.35% | 0.35% | 0.35% | 0.35% | |||||||||||||||
Portfolio turnover rate† | 35% | 21% | 31% | 27% | 30% | |||||||||||||||
| * | Based on average shares outstanding. |
| ** | Total investment return is calculated assuming an initial investment made at the net asset value at the beginning of the period, reinvestment of all dividends and distribution at net asset value during the period, and redemption on the last day of the period. Transaction fees are not reflected in the calculation of total investment return. |
| † | Portfolio turnover does not include securities received or delivered from processing creations or redemptions. |
| See Notes to Financial Statements. | GUGGENHEIM ETFS ANNUAL REPORT | 53 |
Table of Contents
FINANCIAL HIGHLIGHTS (continued)
GUGGENHEIM S&P MIDCAP 400® PURE VALUE ETF
| Year Ended October 31, 2012 | Year Ended October 31, 2011 | Year Ended October 31, 2010 | Year Ended October 31, 2009 | Year Ended October 31, 2008 | ||||||||||||||||
Per Share Data: |
| |||||||||||||||||||
Net asset value, beginning of period | $31.00 | $30.77 | $24.20 | $20.24 | $35.76 | |||||||||||||||
Income from investment operations: | ||||||||||||||||||||
Net investment income* | 0.46 | 0.41 | 0.36 | 0.59 | 0.87 | |||||||||||||||
Net gain (loss) on investments (realized and unrealized) | 4.01 | 0.22 | 6.57 | 3.92 | (15.54 | ) | ||||||||||||||
|
|
|
|
|
|
|
|
|
| |||||||||||
Total from investment operations | 4.47 | 0.63 | 6.93 | 4.51 | (14.67 | ) | ||||||||||||||
Less distributions from: | ||||||||||||||||||||
Net investment income | (0.47 | ) | (0.40 | ) | (0.36 | ) | (0.55 | ) | (0.84 | ) | ||||||||||
Net asset value, end of period | $35.00 | $31.00 | $30.77 | $24.20 | $20.24 | |||||||||||||||
|
|
|
|
|
|
|
|
|
| |||||||||||
Total Return** | 14.46% | 2.03% | 28.75% | 23.32% | (41.75% | ) | ||||||||||||||
Ratios/Supplemental Data: | ||||||||||||||||||||
Net assets, end of period (in thousands) | $35,015 | $35,671 | $43,089 | $22,997 | $10,126 | |||||||||||||||
Ratio to average net assets of: | ||||||||||||||||||||
Net investment income | 1.36% | 1.22% | 1.20% | 2.90% | 2.87% | |||||||||||||||
Total expenses | 0.35% | 0.35% | 0.35% | 0.35% | 0.35% | |||||||||||||||
Portfolio turnover rate† | 47% | 49% | 35% | 57% | 64% | |||||||||||||||
| * | Based on average shares outstanding. |
| ** | Total investment return is calculated assuming an initial investment made at the net asset value at the beginning of the period, reinvestment of all dividends and distribution at net asset value during the period, and redemption on the last day of the period. Transaction fees are not reflected in the calculation of total investment return. |
| † | Portfolio turnover does not include securities received or delivered from processing creations or redemptions. |
| 54 | GUGGENHEIM ETFS ANNUAL REPORT | See Notes to Financial Statements. |
Table of Contents
GUGGENHEIM S&P MIDCAP 400® PURE GROWTH ETF
FINANCIAL HIGHLIGHTS (continued)
| Year Ended October 31, 2012 | Year Ended October 31, 2011 | Year Ended October 31, 2010 | Year Ended October 31, 2009 | Year Ended October 31, 2008 | ||||||||||||||||
Per Share Data: |
| |||||||||||||||||||
Net asset value, beginning of period | $82.17 | $70.46 | $52.89 | $39.10 | $59.75 | |||||||||||||||
Income from investment operations: | ||||||||||||||||||||
Net investment income* | 0.20 | 0.07 | 0.02 | 0.09 | 0.02 | |||||||||||||||
Net gain (loss) on investments (realized and unrealized) | 6.04 | 11.72 | 17.59 | 13.79 | (20.63 | ) | ||||||||||||||
|
|
|
|
|
|
|
|
|
| |||||||||||
Total from investment operations | 6.24 | 11.79 | 17.61 | 13.88 | (20.61 | ) | ||||||||||||||
Less distributions from: | ||||||||||||||||||||
Net investment income | (0.16 | ) | (0.08 | ) | (0.04 | ) | (0.09 | ) | (0.04 | ) | ||||||||||
Net asset value, end of period | $88.25 | $82.17 | $70.46 | $52.89 | $39.10 | |||||||||||||||
|
|
|
|
|
|
|
|
|
| |||||||||||
Total Return** | 7.60% | 16.73% | 33.32% | 35.59% | (34.52% | ) | ||||||||||||||
Ratios/Supplemental Data: | ||||||||||||||||||||
Net assets, end of period (in thousands) | $511,881 | $653,246 | $292,429 | $108,432 | $17,596 | |||||||||||||||
Ratio to average net assets of: | ||||||||||||||||||||
Net investment income | 0.23% | 0.09% | 0.03% | 0.19% | 0.04% | |||||||||||||||
Total expenses | 0.35% | 0.35% | 0.35% | 0.35% | 0.35% | |||||||||||||||
Portfolio turnover rate† | 56% | 45% | 51% | 29% | 52% | |||||||||||||||
| * | Based on average shares outstanding. |
| ** | Total investment return is calculated assuming an initial investment made at the net asset value at the beginning of the period, reinvestment of all dividends and distribution at net asset value during the period, and redemption on the last day of the period. Transaction fees are not reflected in the calculation of total investment return. |
| † | Portfolio turnover does not include securities received or delivered from processing creations or redemptions. |
| See Notes to Financial Statements. | GUGGENHEIM ETFS ANNUAL REPORT | 55 |
Table of Contents
FINANCIAL HIGHLIGHTS (continued)
GUGGENHEIM S&P SMALLCAP 600® PURE VALUE ETF
| Year Ended October 31, 2012 | Year Ended October 31, 2011 | Year Ended October 31, 2010 | Year Ended October 31, 2009 | Year Ended October 31, 2008 | ||||||||||||||||
Per Share Data: |
| |||||||||||||||||||
Net asset value, beginning of period | $35.50 | $34.27 | $28.50 | $23.21 | $37.38 | |||||||||||||||
Income from investment operations: | ||||||||||||||||||||
Net investment income* | 0.25 | 0.20 | 0.20 | 0.32 | 0.79 | |||||||||||||||
Net gain (loss) on investments (realized and unrealized) | 4.56 | 1.23 | 5.78 | 5.29 | (14.26 | ) | ||||||||||||||
|
|
|
|
|
|
|
|
|
| |||||||||||
Total from investment operations | 4.81 | 1.43 | 5.98 | 5.61 | (13.47 | ) | ||||||||||||||
Less distributions from: | ||||||||||||||||||||
Net investment income | (0.25 | ) | (0.20 | ) | (0.21 | ) | (0.32 | ) | (0.70 | ) | ||||||||||
Return of capital | (0.02 | ) | — | — | — | — | ||||||||||||||
|
|
|
|
|
|
|
|
|
| |||||||||||
Total distribution to shareholders | (0.27 | ) | (0.20 | ) | (0.21 | ) | (0.32 | ) | (0.70 | ) | ||||||||||
Net asset value, end of period | $40.04 | $35.50 | $34.27 | $28.50 | $23.21 | |||||||||||||||
|
|
|
|
|
|
|
|
|
| |||||||||||
Total Return** | 13.52% | 4.16% | 21.07% | 25.00% | (36.48% | ) | ||||||||||||||
Ratios/Supplemental Data: | ||||||||||||||||||||
Net assets, end of period (in thousands) | $72,066 | $62,130 | $87,383 | $108,284 | $25,527 | |||||||||||||||
Ratio to average net assets of: | ||||||||||||||||||||
Net investment income | 0.65% | 0.53% | 0.60% | 1.18% | 2.57% | |||||||||||||||
Total expenses | 0.35% | 0.35% | 0.35% | 0.35% | 0.35% | |||||||||||||||
Portfolio turnover rate† | 48% | 76% | 62% | 43% | 50% | |||||||||||||||
| * | Based on average shares outstanding. |
| ** | Total investment return is calculated assuming an initial investment made at the net asset value at the beginning of the period, reinvestment of all dividends and distribution at net asset value during the period, and redemption on the last day of the period. Transaction fees are not reflected in the calculation of total investment return. |
| † | Portfolio turnover does not include securities received or delivered from processing creations or redemptions. |
| 56 | GUGGENHEIM ETFS ANNUAL REPORT | See Notes to Financial Statements. |
Table of Contents
GUGGENHEIM S&P SMALLCAP 600® PURE GROWTH ETF
FINANCIAL HIGHLIGHTS (concluded)
| Year Ended October 31, 2012 | Year Ended October 31, 2011 | Year Ended October 31, 2010 | Year Ended October 31, 2009 | Year Ended October 31, 2008 | ||||||||||||||||
Per Share Data: |
| |||||||||||||||||||
Net asset value, beginning of period | $49.82 | $43.32 | $34.13 | $29.03 | $44.92 | |||||||||||||||
Income from investment operations: | ||||||||||||||||||||
Net investment income* | 0.20 | 0.02 | 0.06 | 0.06 | 0.17 | |||||||||||||||
Net gain (loss) on investments (realized and unrealized) | 4.50 | 6.57 | 9.18 | 5.13 | (15.87 | ) | ||||||||||||||
|
|
|
|
|
|
|
|
|
| |||||||||||
Total from investment operations | 4.70 | 6.59 | 9.24 | 5.19 | (15.70 | ) | ||||||||||||||
Less distributions from: | ||||||||||||||||||||
Net investment income | (0.18 | ) | (0.09 | ) | (0.05 | ) | (0.09 | ) | (0.19 | ) | ||||||||||
Net asset value, end of period | $54.34 | $49.82 | $43.32 | $34.13 | $29.03 | |||||||||||||||
|
|
|
|
|
|
|
|
|
| |||||||||||
Total Return** | 9.44% | 15.22% | 27.11% | 17.93% | (35.05% | ) | ||||||||||||||
Ratios/Supplemental Data: | ||||||||||||||||||||
Net assets, end of period (in thousands) | $73,359 | $34,873 | $17,329 | $11,945 | $7,257 | |||||||||||||||
Ratio to average net assets of: | ||||||||||||||||||||
Net investment income | 0.38% | 0.03% | 0.14% | 0.21% | 0.44% | |||||||||||||||
Total expenses | 0.35% | 0.35% | 0.35% | 0.35% | 0.35% | |||||||||||||||
Portfolio turnover rate† | 44% | 33% | 55% | 46% | 63% | |||||||||||||||
| * | Based on average shares outstanding. |
| ** | Total investment return is calculated assuming an initial investment made at the net asset value at the beginning of the period, reinvestment of all dividends and distribution at net asset value during the period, and redemption on the last day of the period. Transaction fees are not reflected in the calculation of total investment return. |
| † | Portfolio turnover does not include securities received or delivered from processing creations or redemptions. |
| See Notes to Financial Statements. | GUGGENHEIM ETFS ANNUAL REPORT | 57 |
Table of Contents
|
1. Organization
Rydex ETF Trust (the “Trust”) is an open-end, management investment company registered under the Investment Company Act of 1940 (the “1940 Act”). The Trust was organized as a Delaware statutory trust on November 22, 2002. As of October 31, 2012, the Trust offers twenty-six portfolios, each of which represents a separate series of beneficial interest in the Trust. The financial statements herein relate to the following Funds: Guggenheim Russell Top 50® Mega Cap ETF, Guggenheim S&P 500® Pure Value ETF, Guggenheim S&P 500® Pure Growth ETF, Guggenheim S&P MidCap 400® Pure Value ETF, Guggenheim S&P 400® Pure Growth ETF, Guggenheim S&P SmallCap 600® Pure Value ETF and Guggenheim S&P SmallCap 600® Pure Growth ETF (each a “Fund”, and collectively, the “Funds”). Guggenheim Russell Top 50® Mega Cap ETF commenced operations on May 4, 2005. Guggenheim S&P 500® Pure Value ETF, Guggenheim S&P 500® Pure Growth ETF, Guggenheim S&P MidCap 400® Pure Value ETF, Guggenheim S&P MidCap 400® Pure Growth ETF, Guggenheim S&P SmallCap 600® Pure Value ETF and Guggenheim S&P SmallCap 600® Pure Growth ETF commenced operations on March 1, 2006.
The Funds’ investment objective is to replicate as closely as possible, before fees and expenses, the daily performance of an index representing publicly traded equity securities (the “Underlying Index”). The Guggenheim Russell Top 50® Mega Cap ETF tracks the Russell Top 50® Index. The Guggenheim S&P 500® Pure Value ETF tracks the S&P 500® Pure Value Index, the Guggenheim S&P 500® Pure Growth ETF tracks the S&P 500® Pure Growth Index, the Guggenheim S&P MidCap 400® Pure Value ETF tracks the S&P MidCap 400® Pure Value Index, the Guggenheim S&P MidCap 400® Pure Growth ETF tracks the S&P MidCap 400® Pure Growth Index, the Guggenheim S&P SmallCap 600® Pure Value ETF tracks the S&P SmallCap 600® Pure Value Index and the Guggenheim S&P SmallCap 600® Pure Growth ETF tracks the S&P SmallCap 600® Pure Growth Index. The Funds seek to achieve their objective by investing in common stocks or ETFs, where applicable, that comprise the Underlying Index. The Funds use a “replication” strategy to track the Underlying Index. “Replication” refers to investing in substantially all of the securities in the Underlying Index in approximately the same proportions as in the Underlying Index.
The Funds operate as index funds and are not actively managed. Adverse performance of a security in the Funds’ portfolio will ordinarily not result in the elimination of the security from the Funds’ portfolio.
The Funds issue and redeem shares on a continuous basis, at Net Asset Value per share (“NAV”), only in aggregation of 50,000 shares called a “Creation Unit”. Creation Units are issued and redeemed principally in-kind for securities included in the Underlying Index.
Guggenheim Investments (“GI”) provides advisory services and Rydex Distributors, LLC (“RDL”) acts as principal underwriter for the Trust. GI and RDL are affiliated entities.
2. Significant Accounting Policies
The following significant accounting policies are in conformity with U.S. generally accepted accounting principles (“U.S. GAAP”) and are consistently followed by the Trust. This requires management to make estimates and assumptions that affect the reported amount of assets and liabilities and disclosure of contingent assets and liabilities at the date of the financial statements and the reported amounts of revenues and expenses during the reporting period. Actual results could differ from these estimates. All time references are based on Eastern Time.
A. Security Valuation
Equity securities listed on an exchange (New York Stock Exchange (“NYSE”) or American Stock Exchange) are valued at the last quoted sales price as of the close of business on the NYSE, usually 4:00 p.m. on the valuation date. Equity securities listed on the NASDAQ market system are valued at the NASDAQ Official Closing Price on the valuation date.
Investments for which market quotations are not readily available are fair valued as determined in good faith by GI under the direction of the Board of Trustees using methods established or ratified by the Board of Trustees. These methods include, but are not limited to: (i) using general information as to how these securities and assets trade; and (ii) using other information and considerations, including current values in related markets.
Debt securities with a maturity of greater than 60 days at acquisition are valued at prices that reflect broker/dealer supplied valuations or are obtained from independent pricing services, which may consider the trade activity, treasury yields, yield or price of bonds of comparable quality, coupon, maturity, and type, as well as prices quoted by dealers who make markets in such securities. Short-term debt securities with a maturity of 60 days or less at acquisition and repurchase agreements are valued at amortized cost, which approximates market value.
B. Security Transactions and Income Recognition
Security transactions are recorded on the trade date for financial reporting purposes. Realized gains and losses from securities transactions are recorded using the identified cost basis. Proceeds from lawsuits related to investment holdings are recorded as realized gains in the respective fund. Dividend income is recorded on the ex-dividend date, net of applicable taxes withheld by foreign countries. Taxable non-cash dividends are recorded as dividend income. Interest income, including amortization of premiums and accretion of discounts, is accrued on a daily basis. Distributions received from investments in REITs are recorded as dividend income on the ex-dividend date, subject to reclassification upon notice of the character of such distribution by the issuer.
| 58 | GUGGENHEIM ETFS ANNUAL REPORT |
Table of Contents
NOTES TO FINANCIAL STATEMENTS (continued)
|
C. Repurchase Agreements
The Funds may enter into repurchase agreements with financial institutions. In a repurchase agreement, a Fund buys a security and the seller simultaneously agrees to repurchase the security on a specified future date at an agreed-upon price. The repurchase price reflects an agreed-upon interest rate during the time the Fund’s money is invested in the security. Because the security constitutes collateral for the repurchase obligation, a repurchase agreement can be considered a collateralized loan. The Funds follow certain procedures designed to minimize the risks inherent in such agreements. These procedures include effecting repurchase transactions only with large, well-capitalized and well-established financial institutions whose condition will be continually monitored by GI. In addition, the value of the collateral underlying the repurchase agreement will always be at least equal to the repurchase price, including any accrued interest earned on the repurchase agreement. In the event of a default or bankruptcy by a selling financial institution, the Funds will seek to liquidate such collateral. However, the exercising of the Funds right to liquidate such collateral could involve certain costs or delays and, to the extent that proceeds from any sale upon a default of the obligation to repurchase were less than the repurchase price, the Funds could suffer a loss. It is the current policy of the Funds not to invest in repurchase agreements that do not mature within seven days if any such investment, together with any other illiquid assets held by the Funds, amounts to more than 15% of a Funds net assets. The investments of the Funds in repurchase agreements, at times, may be substantial when, in the view of GI, liquidity or other considerations so warrant.
D. Federal Income Taxes
The Funds intend to comply with the provisions of Subchapter M of the Internal Revenue Code applicable to regulated investment companies and will distribute substantially all taxable net investment income and capital gains sufficient to relieve the funds from all, or substantially all, federal income, excise and state income taxes. Therefore, no provision for Federal or state income tax is required.
Tax positions taken or expected to be taken in the course of preparing the Funds’ tax returns are evaluated to determine whether the tax positions are “more-likely-than-not” of being sustained by the applicable tax authority. Tax positions not deemed to meet the more-likely-than-not threshold would be recorded as a tax benefit or expense in the current year. Management has analyzed the Funds’ tax positions taken, or to be taken, on Federal income tax returns for all open tax years (fiscal years 2009 — 2012), and has concluded that no provision for income tax was required in the Funds’ financial statements.
Income and capital gain distributions are determined in accordance with Federal income tax regulations, which may differ from U.S. GAAP. These differences are primarily due to differing treatments for in-kind redemptions, distributions in excess of current year earnings, excise taxes paid, income reclassifications from REITs and losses deferred due to wash sales.
The RIC Modernization Act of 2010 was signed into law on December 22, 2010 and sought to simplify some of the tax provisions applicable to regulated investment companies and the tax reporting to their shareholders, and to improve the tax efficiency of certain fund structures. The changes were generally effective for taxable years beginning after the date of enactment.
One of the more prominent changes addresses capital loss carryforwards. Funds are permitted to carry forward capital losses incurred in taxable years beginning after December 22, 2010 for an unlimited period. However, any losses incurred during those future taxable years will be required to be utilized prior to the losses incurred in pre-enactment taxable years. Under pre-enactment law, capital losses could be carried forward for eight years, and carried forward as short-term capital, irrespective of the character of the original loss. As a result of this ordering rule, pre-enactment capital loss carryforwards may potentially expire unused. Additionally, post-enactment capital losses that are carried forward will retain their character as either short-term or long-term capital losses rather than being considered all short-term as under previous law.
In order to present paid-in-capital, undistributed net investment income (loss) and accumulated net realized gain (loss) on investments on the statement of assets and liabilities that more closely represent their tax character, certain adjustments have been made to these accounts. These adjustments have no effect on net assets or NAV. The most significant of these adjustments are for net capital gains resulting from in-kind redemptions, because they are non-taxable to the Funds, and therefore are not distributed to existing Fund shareholders, or net capital losses resulting from in-kind redemptions which are classified to paid-in-capital. For the year ended October 31, 2012, the adjustments for the Funds were as follows:
Paid-In Capital | Undistributed Net Investment Income (Loss) | Accumulated Net Realized Gain (Loss) | ||||||||||
Guggenheim Russell Top 50® Mega Cap ETF | $ | 45,494,431 | $ | — | $ | (45,494,431 | ) | |||||
Guggenheim S&P 500® Pure Value ETF | 2,745,649 | (16,608 | ) | (2,729,581 | ) | |||||||
Guggenheim S&P 500® Pure Growth ETF | 4,294,595 | (17,759 | ) | (4,276,836 | ) | |||||||
Guggenheim S&P MidCap 400® Pure Value ETF | 1,218,933 | — | (1,218,933 | ) | ||||||||
Guggenheim S&P MidCap 400® Pure Growth ETF | 23,857,960 | 65,794 | (23,923,754 | ) | ||||||||
Guggenheim S&P SmallCap 600® Pure Value ETF | (289,297 | ) | 86,471 | 202,826 | ||||||||
Guggenheim S&P SmallCap 600® Pure Growth ETF | 1,599,256 | 4,366 | (1,603,622 | ) | ||||||||
| GUGGENHEIM ETFS ANNUAL REPORT | 59 |
Table of Contents
| NOTES TO FINANCIAL STATEMENTS (continued) |
Tax basis capital losses in excess of capital gains are carried forward to offset future net capital gains. For the year ended October 31, 2012, there were no capital loss carryforward amounts used to offset current year net realized capital gains.
The tax character of distributable earnings (accumulated losses) at October 31, 2012 was as follows:
Undistributed Ordinary Income | Undistributed Long Term Capital Gain | Capital Loss Carryfoward | Unrealized Appreciation (Depreciation) | |||||||||||||
Guggenheim Russell Top 50® Mega Cap ETF | 1,107,227 | $ | — | $ | (108,613,866 | ) | $ | 3,355,111 | ||||||||
Guggenheim S&P 500® Pure Value ETF | 36,334 | — | (9,203,973 | ) | 2,613,737 | |||||||||||
Guggenheim S&P 500® Pure Growth ETF | 58,605 | — | (23,560,646 | ) | 27,294,141 | |||||||||||
Guggenheim S&P MidCap 400® Pure Value ETF | 8,655 | — | (4,173,286 | ) | 1,410,539 | |||||||||||
Guggenheim S&P MidCap 400® Pure Growth ETF | 362,493 | — | (42,643,817 | ) | 22,629,698 | |||||||||||
Guggenheim S&P SmallCap 600® Pure Value ETF | — | — | (23,541,460 | ) | (1,371,425 | ) | ||||||||||
Guggenheim S&P SmallCap 600® Pure Growth ETF | — | — | (2,887,108 | ) | 1,649,928 | |||||||||||
A summary of the expiration of the capital loss carryforward is as follows:
| Unlimited | ||||||||||||||||||||||||||||||||||||
| 2013 | 2014 | 2015 | 2016 | 2017 | 2018 | 2019 | Short Term | Long Term | ||||||||||||||||||||||||||||
Guggenheim Russell Top 50® Mega Cap ETF | $ | 88,468 | $ | 675,404 | $ | 618,363 | $ | 32,651,414 | $ | 51,313,952 | $ | 10,584,384 | $ | 3,619,667 | $ | 1,098,452 | $ | 7,963,762 | ||||||||||||||||||
Guggenheim S&P 500® Pure Value ETF | — | — | — | — | 8,047,369 | — | — | 837,674 | 318,930 | |||||||||||||||||||||||||||
Guggenheim S&P 500® Pure Growth ETF | — | — | — | — | 2,292,413 | 138,571 | — | 18,658,510 | 2,471,152 | |||||||||||||||||||||||||||
Guggenheim S&P MidCap 400® Pure Value ETF | — | — | — | — | 2,758,055 | — | — | 619,140 | 796,091 | |||||||||||||||||||||||||||
Guggenheim S&P MidCap 400® Pure Growth ETF | — | — | — | — | — | — | — | 40,055,248 | 2,588,569 | |||||||||||||||||||||||||||
Guggenheim S&P SmallCap 600® Pure Value ETF | — | — | — | 2,551,142 | 9,954,238 | 8,325,244 | — | — | 2,710,836 | |||||||||||||||||||||||||||
Guggenheim S&P SmallCap 600® Pure Growth ETF | — | — | — | — | 799,865 | 46,873 | — | 1,477,788 | 562,582 | |||||||||||||||||||||||||||
The tax character of distributions paid during the year ended October 31, 2012 was as follows:
Ordinary Income | Return of Capital | |||||||
Guggenheim Russell Top 50® Mega Cap ETF | $ | 10,403,624 | $ | — | ||||
Guggenheim S&P 500® Pure Value ETF | 1,370,034 | — | ||||||
Guggenheim S&P 500® Pure Growth ETF | 2,094,006 | — | ||||||
Guggenheim S&P MidCap 400® Pure Value ETF | 516,543 | — | ||||||
Guggenheim S&P MidCap 400® Pure Growth ETF | 980,107 | — | ||||||
Guggenheim S&P SmallCap 600® Pure Value ETF | 452,652 | 35,405 | ||||||
Guggenheim S&P SmallCap 600® Pure Growth ETF | 263,737 | — | ||||||
The tax character of distributions paid during the year ended October 31, 2011 was as follows:
Ordinary Income | ||||
Guggenheim Russell Top 50® Mega Cap ETF | $ | 7,603,764 | ||
Guggenheim S&P 500® Pure Value ETF | 1,211,677 | |||
Guggenheim S&P 500® Pure Growth ETF | 996,112 | |||
Guggenheim S&P MidCap 400® Pure Value ETF | 566,319 | |||
Guggenheim S&P MidCap 400® Pure Growth ETF | 494,945 | |||
Guggenheim S&P SmallCap 600® Pure Value ETF | 444,287 | |||
Guggenheim S&P SmallCap 600® Pure Growth ETF | 46,996 | |||
At October 31, 2012, the identified cost of investments in securities owned by each Fund for Federal income tax purposes and the gross unrealized appreciation and depreciation were as follows:
| Identified Cost | Gross Unrealized Appreciation | Gross Unrealized Depreciation | Net Unrealized (Depreciation) | |||||||||||||
Guggenheim Russell Top 50® Mega Cap ETF | $ | 620,356,659 | $ | 44,373,638 | $ | 41,018,527 | $ | 3,355,111 | ||||||||
Guggenheim S&P 500® Pure Value ETF | 82,936,509 | 8,997,096 | 6,378,950 | 2,618,146 | ||||||||||||
Guggenheim S&P 500® Pure Growth ETF | 304,935,056 | 44,046,599 | 16,752,458 | 27,294,141 | ||||||||||||
Guggenheim S&P Midcap 400® Pure Value ETF | 34,491,325 | 3,613,081 | 2,202,542 | 1,410,539 | ||||||||||||
Guggenheim S&P Midcap 400® Pure Growth ETF | 488,899,293 | 78,505,424 | 55,875,726 | 22,629,698 | ||||||||||||
Guggenheim S&P Smallcap 600® Pure Value ETF | 74,997,289 | 8,940,558 | 10,311,983 | (1,371,425 | ) | |||||||||||
Guggenheim S&P Smallcap 600® Pure Growth ETF | 71,722,034 | 8,290,749 | 6,640,821 | 1,649,928 | ||||||||||||
| 60 | GUGGENHEIM ETFS ANNUAL REPORT |
Table of Contents
| NOTES TO FINANCIAL STATEMENTS (continued) |
E. Fair Value Measurement
In accordance with U.S. GAAP, fair value is defined as the price that the Fund would receive to sell an investment or pay to transfer a liability in an orderly transaction with an independent buyer in the principal market, or, in the absence of a principal market, the most advantageous market for the investment or liability. A three-tier hierarchy is utilized to distinguish between (1) inputs that reflect the assumptions market participants would use in pricing an asset or liability developed based on market data obtained from sources independent of the reporting entity (observable inputs) and (2) inputs that reflect the reporting entity’s own assumptions about the assumptions market participants would use in pricing an asset or liability developed based on the best information available in the circumstances (unobservable inputs) and to establish classification of fair value measurements for disclosure purposes. Various inputs are used in determining the value of the Funds’ investments. The inputs are summarized in the three broad levels listed below:
| Level 1 — | quoted prices in active markets for identical securities. |
| Level 2 — | other significant observable inputs (including quoted prices for similar securities, interest rates, prepayment speeds, credit risk, etc.). |
| Level 3 — | significant unobservable inputs (including the fund’s own assumptions used to determine the fair value of investments). |
The inputs or methodologies used for valuing securities are not necessarily an indication of the risk associated with investing in those securities.
The following table summarizes the inputs used to value the Funds’ net assets as of October 31, 2012:
| Fund | Level 1 Investments in Securities | Level 2 Investments in Securities | Level 3 Investments in Securities | Total | ||||||||||||
Guggenheim Russell Top 50® Mega Cap ETF | $ | 622,396,770 | $ | 1,315,000 | $ | — | $ | 623,711,770 | ||||||||
Guggenheim S&P 500® Pure Value ETF | 85,554,655 | 2,254,830 | — | 87,809,485 | ||||||||||||
Guggenheim S&P 500® Pure Growth ETF | 332,229,197 | 4,328,414 | — | 336,557,611 | ||||||||||||
Guggenheim S&P MidCap 400® Pure Value ETF | 35,010,651 | 891,213 | — | 35,901,864 | ||||||||||||
Guggenheim S&P MidCap 400® Pure Growth ETF | 511,528,991 | 20,737,131 | — | 532,266,122 | ||||||||||||
Guggenheim S&P SmallCap 600® Pure Value ETF | 72,066,702 | 1,559,162 | — | 73,625,864 | ||||||||||||
Guggenheim S&P SmallCap 600® Pure Growth ETF | 73,371,962 | 2,125,121 | — | 75,497,083 | ||||||||||||
For the year ended October 31, 2012, there were no Level 3 Investments or transfers between levels.
F. Dividends and Distributions
Distributions of net investment income and net realized gains, if any, in all the Funds, are declared and paid at least annually. Distributions are recorded on the ex-dividend date and are determined in accordance with income tax regulations which may differ from U.S. GAAP.
G. Risk and Uncertainties
The Funds invest in various investments which are exposed to risk, such as market risk. Due to the level of risk associated with certain investments it is at least reasonably possible that changes in the values of investment securities will occur in the near term and that such changes could materially affect amounts reported in the financial statements.
The Guggenheim Russell Top 50® Mega Cap ETF is a non-diversified fund, subjecting it to a greater risk than a fund that is diversified. Throughout the normal course of business, the Funds enter into contracts that contain a variety of representations and warranties which provide general indemnifications. The Funds’ maximum exposure under these arrangements is unknown, as this would involve future claims that may be made against the Funds and/or their affiliates that have not yet occurred. However, based on experience the Funds expect the risk of loss to be remote.
H. Portfolio Securities Loaned
The Funds may lend their securities to approved brokers to earn additional income. Security lending income shown on the statement of operations is shown net of rebates paid to the borrowers and earnings on cash collateral investments shared with the lending agent. Within this arrangement, the Funds act as the lender, Credit Suisse acts as the lending agent, and other approved registered broker dealers act as the borrowers. The Funds receive cash collateral, valued at 102% of the value of the securities on loan. Under the terms of the Funds’ securities lending agreement with Credit Suisse, cash collateral is invested in one or more joint repurchase agreements collateralized by obligations of the U.S. Treasury or Government Agencies. The Funds bear the risk of loss on cash collateral investments. Collateral is maintained over the life of the loan in an amount not less than the value of loaned securities, as determined at the close of fund business each day; any additional collateral required due to changes in security values is delivered to
| GUGGENHEIM ETFS ANNUAL REPORT | 61 |
Table of Contents
NOTES TO FINANCIAL STATEMENTS (continued)
|
the Funds the next business day. Although the collateral mitigates the risk, the Funds could experience a delay in recovering its securities and a possible loss of income or value if the borrower fails to return the securities. The Funds have the right under the securities lending agreement to recover the securities from the borrower on demand.
At October 31, 2012, the Funds participated in securities lending as follows:
| Value of Securities Loaned | Cash Collateral Received | |||||||
Guggenheim Russell Top 50® Mega Cap ETF | $ | — | $ | — | ||||
Guggenheim S&P 500® Pure Value ETF | 2,197,080 | 2,254,830 | ||||||
Guggenheim S&P 500® Pure Growth ETF | 4,239,210 | 4,328,414 | ||||||
Guggenheim S&P Midcap 400® Pure Value ETF | 863,724 | 891,213 | ||||||
Guggenheim S&P Midcap 400® Pure Growth ETF | 20,245,526 | 20,737,131 | ||||||
Guggenheim S&P Smallcap 600® Pure Value ETF | 1,472,597 | 1,559,162 | ||||||
Guggenheim S&P Smallcap 600® Pure Growth ETF | 2,054,532 | 2,125,121 | ||||||
The following represents a breakdown of the collateral for the joint repurchase agreements at October 31, 2012:
| Counterparty and Terms of Agreement | Face Value | Repurchase Price | Collateral | Par Value | Fair Value | |||||||||||||
Merrill Lynch, Pierce, Fenner & Smith, Inc. | $ | 40,000,000.00 |
| $ | 40,000,311 |
| US Treasury | $ | 37,278,800 |
| $ | 40,788,895 |
| |||||
RBS Securities, Inc. | $ | 68,010,000.00 |
| $ | 68,010,529 |
| Fannie Mae Note 5.375% Due 07/15/16 | $ | 58,330,000 |
| $ | 69,372,283 |
| |||||
3. Advisory, Administration and Other Transactions with Affiliates
GI determines the composition of the portfolio of securities that must be delivered in exchange for the issuance of Creation Units and periodically adjusts the composition of the portfolio of the Funds to conform to changes in the composition of the relevant index. For these services, GI receives a management fee at the annual rate shown below as a percentage of the average daily net assets of the Funds.
| Advisory Fee | ||||
Guggenheim Russell Top 50® Mega Cap ETF | 0.20 | % | ||
Guggenheim S&P 500® Pure Value ETF | 0.35 | % | ||
Guggenheim S&P 500® Pure Growth ETF | 0.35 | % | ||
Guggenheim S&P MidCap 400® Pure Value ETF | 0.35 | % | ||
Guggenheim S&P MidCap 400® Pure Growth ETF | 0.35 | % | ||
Guggenheim S&P SmallCap 600® Pure Value ETF | 0.35 | % | ||
Guggenheim S&P SmallCap 600® Pure Growth ETF | 0.35 | % | ||
GI pays all expenses of the Funds, including the cost of transfer agency, custody, fund administration, legal, audit and other services, except: interest, taxes, distribution fees or expenses and extraordinary expenses.
Under an Administration Agreement, State Street Bank and Trust Company (the “Administrator”) provides various administrative and accounting services for the maintenance and operations of the Funds. Under a Custodian Agreement with the Trust, the Administrator maintains cash, securities and other assets of the Funds in separate accounts for each Fund, keeps all necessary accounts and records, and provides other services. The Administrator is required, upon the order of the Trust, to deliver securities held by the Custodian and to make payments for securities purchased by the Trust for the Funds. Pursuant to a Transfer Agency and Service Agreement with the Trust, the Administrator acts as a transfer agent for the Trust’s authorized and issued shares of beneficial interest, and as dividend disbursing agent of the Trust. GI compensates the Administrator directly for the foregoing services.
The Funds have adopted a Distribution Plan (the “Plan”) that allows the Funds to pay distribution fees to RDL and other firms that provide distribution services (“Service Providers”). If a Service Provider provides distribution services, the Funds will pay distribution fees to RDL at an annual rate not to exceed 0.25% of average daily net assets, pursuant to Rule 12b-1 of the 1940 Act. RDL will, in turn, pay the Service Provider out of its fees. No such fee is currently charged to the Funds.
4. Capital
At October 31, 2012, there were an unlimited number of no par value shares of beneficial interest authorized. There is a minimum transaction fee per transaction to those persons purchasing or redeeming Creation Units. An additional charge of up to three times
| 62 | GUGGENHEIM ETFS ANNUAL REPORT |
Table of Contents
| NOTES TO FINANCIAL STATEMENTS (continued) |
the standard transaction fee may be imposed for purchases and redemptions effected outside the National Securities Clearing Corporation usual clearing process or for cash. Such transactions are generally permitted on an in-kind basis, with a balancing cash component to equate the transaction to the NAV of the Fund on the transaction date. Transaction fees are not charged to or paid by the Funds. The minimum transaction fees are:
Minimum Transaction Fee | ||||
Guggenheim Russell Top 50® Mega Cap ETF | $ | 500 | ||
Guggenheim S&P 500® Pure Value ETF | 1,000 | |||
Guggenheim S&P 500® Pure Growth ETF | 1,000 | |||
Guggenheim S&P MidCap 400® Pure Value ETF | 750 | |||
Guggenheim S&P MidCap 400® Pure Growth ETF | 750 | |||
Guggenheim S&P SmallCap 600® Pure Value ETF | 1,000 | |||
Guggenheim S&P SmallCap 600® Pure Growth ETF | 1,000 | |||
5. Investment Transactions
For the year ended October 31, 2012, the Funds had investment transactions in-kind associated with subscriptions and redemptions as follows:
| Subscriptions | Redemptions | |||||||
Guggenheim Russell Top 50® Mega Cap ETF | $ | 370,031,720 | $ | 266,226,058 | ||||
Guggenheim S&P 500® Pure Value ETF | 17,450,694 | 21,255,716 | ||||||
Guggenheim S&P 500® Pure Growth ETF | 81,193,704 | 33,386,032 | ||||||
Guggenheim S&P MidCap 400® Pure Value ETF | 4,873,141 | 10,373,732 | ||||||
Guggenheim S&P MidCap 400® Pure Growth ETF | 83,728,225 | 254,770,113 | ||||||
Guggenheim S&P SmallCap 600® Pure Value ETF | 12,538,533 | 8,918,666 | ||||||
Guggenheim S&P SmallCap 600® Pure Growth ETF | 46,333,333 | 13,300,262 | ||||||
Purchases and sales of investment securities (excluding short-term investments, U.S. government and government agency obligations) for the Funds were as follows:
| Purchases | Sales | |||||||
Guggenheim Russell Top 50® Mega Cap ETF | $ | 32,820,092 | $ | 32,455,776 | ||||
Guggenheim S&P 500® Pure Value ETF | 31,247,681 | 35,305,576 | ||||||
Guggenheim S&P 500® Pure Growth ETF | 107,053,737 | 118,750,901 | ||||||
Guggenheim S&P MidCap 400® Pure Value ETF | 17,079,604 | 19,076,351 | ||||||
Guggenheim S&P MidCap 400® Pure Growth ETF | 338,498,462 | 312,641,202 | ||||||
Guggenheim S&P SmallCap 600® Pure Value ETF | 33,289,767 | 33,352,482 | ||||||
Guggenheim S&P SmallCap 600® Pure Growth ETF | 31,730,623 | 29,775,589 | ||||||
There were no purchases or sales of U.S. government or government agency obligations for the year ended October 31, 2012.
6. Legal Proceedings
Lyondell Chemical Company
Rydex ETF Trust has been named as a defendant in Weisfelner, as Trustee of the LB Creditor Trust v. Fund 1 (In re Lyondell Co.), Adversary Proceeding No. 10-4609 (Bankr. S.D.N.Y.). In this action, the creditors of Lyondell Chemical Company (“Lyondell”) are seeking to recover money paid in connection with a pre-bankruptcy distribution by Lyondell to its shareholders pursuant to a December 2007 merger transaction. When the merger closed on December 20, 2007, all outstanding shares of Lyondell stock were converted into the right to receive $48 in cash. The creditors allege that the merged company, LyondellBasell Industries AF S.C.A., and many of its affiliates and subsidiaries filed for bankruptcy as a direct consequence of the merger transaction. The creditors allege that the shareholder payments constituted a fraud on creditors and should be paid back, and are advancing claims of constructive fraudulent transfer and intentional fraudulent transfer under state law. A motion to dismiss the lawsuit is currently pending before the Court.
This lawsuit does not allege any wrongdoing on the part of Rydex ETF Trust. The following series of Rydex ETF Trust received cash proceeds from the merger in the following amounts: Rydex S&P Midcap 400 Pure Value ETF Fund — $572,640. At this stage of the proceedings, Rydex ETF Trust is not able to make a reliable predication as to the outcome of this lawsuit or the effect, if any, on the Fund’s net asset value.
Tribune Company
Rydex ETF Trust has been named as a defendant and a putative member of the proposed defendant class of shareholders in the case entitled Official Committee of Unsecured Creditors of Tribune Co. v. FitzSimons (In re Tribune Co.), No. 12-2652 (S.D.N.Y.) (formerly Adv.
| GUGGENHEIM ETFS ANNUAL REPORT | 63 |
Table of Contents
NOTES TO FINANCIAL STATEMENTS (concluded)
|
Pro. No. 10-54010 (Bankr. D. Del.)) (the “FitzSimons action”), as a result of ownership of shares in the Tribune Company (“Tribune”) in 2007 by certain series of the Rydex ETF Trust when Tribune effected a leveraged buyout transaction (“LBO”) by which Tribune converted to a privately-held company. In its complaint, the Unsecured Creditors Committee (the “UCC”) has alleged that, in connection with the LBO, insiders and major shareholders received proceeds for their Tribune stock using financing that the insiders knew would, and ultimately did, leave the Tribune insolvent. The UCC has asserted claims against certain insiders, major shareholders, professional advisers, and others involved in the LBO, and is attempting to obtain from these individuals and entities the proceeds paid out in connection with the LBO.
In June 2011, a group of Tribune creditors, not including the UCC, filed multiple actions involving state law constructive fraudulent conveyance claims against former Tribune shareholders (the “SCLFC actions”). Rydex ETF Trust has been named as a defendant in one or more of these suits. These cases have been consolidated together with the FitzSimons action in a multidistrict litigation proceeding captioned In re Tribune Co. Fraudulent Conveyance Litig., No. 11-2296 (S.D.N.Y.) (the “MDL proceeding”).
On September 7, 2012, the Court issued a Master Case Order in the MDL proceeding. This order designated several law firms to serve as members of executive committees of defense counsel in the FitzSimons action and in the SCLFC actions. The order also established a briefing schedule for motions to dismiss in the SLCFC actions; no schedule has yet been established in the Fitzsimons action. The Court also ordered that the plaintiffs’ deadline to serve summonses and complaints is extended through January 15, 2013. Finally, the Court ordered that merits discovery will be stayed until further order of the Court.
None of these lawsuits allege any wrongdoing on the part of Rydex ETF Trust. The following series of Rydex ETF Trust held shares of Tribune and tendered these shares as part of Tribune’s LBO: Guggenheim S&P 500 Pure Value ETF (the “Fund”). The value of the proceeds received by the foregoing Fund was $197,050. At this stage of the proceedings, Rydex ETF Trust is not able to make a reliable predication as to the outcome of these lawsuits or the effect, if any, on the Fund’s net asset value.
| 64 | GUGGENHEIM ETFS ANNUAL REPORT |
Table of Contents
| REPORT OF INDEPENDENT REGISTERED PUBLIC ACCOUNTING FIRM | ||
The Board of Trustees and Shareholders of Rydex ETF Trust
We have audited the accompanying statements of assets and liabilities, including the schedules of investments, of Guggenheim Russell Top 50® Mega Cap ETF, Guggenheim S&P 500® Pure Value ETF, Guggenheim S&P 500® Pure Growth ETF, Guggenheim S&P MidCap 400® Pure Value ETF, Guggenheim S&P MidCap 400® Pure Growth ETF, Guggenheim S&P SmallCap 600® Pure Value ETF, and Guggenheim S&P SmallCap 600® Pure Growth ETF (seven of the series constituting the Guggenheim ETF Trust) (the “Funds”) as of October 31, 2012, and the related statements of operations for the year then ended, the statements of changes in net assets for each of the two years in the period then ended, and the financial highlights for each of the five years in the period then ended. These financial statements and financial highlights are the responsibility of the Funds’ management. Our responsibility is to express an opinion on these financial statements and financial highlights based on our audits.
We conducted our audits in accordance with the standards of the Public Company Accounting Oversight Board (United States). Those standards require that we plan and perform the audit to obtain reasonable assurance about whether the financial statements and financial highlights are free of material misstatement. We were not engaged to perform an audit of the Funds’ internal control over financial reporting. Our audits included consideration of internal control over financial reporting as a basis for designing audit procedures that are appropriate in the circumstances, but not for the purpose of expressing an opinion on the effectiveness of the Funds’ internal control over financial reporting. Accordingly, we express no such opinion. An audit also includes examining, on a test basis, evidence supporting the amounts and disclosures in the financial statements and financial highlights, assessing the accounting principles used and significant estimates made by management, and evaluating the overall financial statement presentation. Our procedures included confirmation of securities owned as of October 31, 2012, by correspondence with the custodian and brokers or by other appropriate auditing procedures where replies from brokers were not received. We believe that our audits provide a reasonable basis for our opinion.
In our opinion, the financial statements and financial highlights referred to above present fairly, in all material respects, the financial position of the above listed Funds at October 31, 2012, the results of their operations for the year then ended, the changes in their net assets for each of the two years in the period then ended, and their financial highlights for each of the five years in the period then ended, in conformity with U.S. generally accepted accounting principles.

McLean, Virginia
December 21, 2012
| GUGGENHEIM ETFS ANNUAL REPORT | 65 |
Table of Contents
|
Federal Income Tax Information
For federal income tax purposes, the following information is furnished with respect to the distributions paid by the Funds during the year ended October 31, 2012:
| Dividend Received Deduction | Long Term Capital Gains Distribution | Qualified Income Distribution | ||||||||||
Guggenheim Russell Top 50® Mega Cap ETF | 100.00 | % | $ | — | $ | 11,374,923 | ||||||
Guggenheim S&P 500® Pure Value ETF | 100.00 | % | — | 1,602,755 | ||||||||
Guggenheim S&P 500® Pure Growth ETF | 100.00 | % | — | 3,060,295 | ||||||||
Guggenheim S&P MidCap 400® Pure Value ETF | 100.00 | % | — | 598,310 | ||||||||
Guggenheim S&P MidCap 400® Pure Growth ETF | 100.00 | % | — | 2,852,988 | ||||||||
Guggenheim S&P SmallCap 600® Pure Value ETF | 100.00 | % | — | 689,289 | ||||||||
Guggenheim S&P SmallCap 600® Pure Growth ETF | 100.00 | % | — | 460,641 | ||||||||
Proxy Voting Information
A description of the policies and procedures that the Trust uses to determine how to vote proxies relating to securities held in the Funds’ portfolios is available, without charge and upon request, by calling 1.800.820.0888. This information is also available from the EDGAR database on the SEC’s website at http://www.sec.gov.
Information regarding how the Funds voted proxies relating to portfolio securities, during the most recent 12-month period ended June 30, 2012 is available, without charge, upon request, by calling 1.800.820.0888. The information is also available from the EDGAR database on the SEC’s website at http://www.sec.gov.
Quarterly Portfolio Schedules Information
The Trust files its complete schedule of portfolio holdings with the SEC for the first and third quarters of each fiscal year on Form N-Q; which are available on the SEC’s website at http://www.sec.gov. The Funds’ Forms N-Q may be reviewed and copied at the SEC’s Public Reference Room in Washington, DC, and that information on the operation of the Public Reference Room may be obtained by calling 1-800-SEC-0330. Copies of the portfolio holdings are also available to shareholders, without charge and upon request, by calling 1.800.820.0888.
Office Locations
The offices of Guggenheim Investments can be found in the following locations:
40 East 52nd Street
16th Floor
New York, NY 10022
(Headquarters)
Four Irvington Centre
805 King Farm Boulevard
Suite 600
Rockville, MD 20850
9401 Indian Creek Parkway
40 Corporate Woods
Suite 850
Overland Park, KS 66210
Premium/Discount Information
Information about the differences between the daily market price on secondary markets for shares and the NAV of each Fund can be found at guggenheiminvestments.com.
| 66 | GUGGENHEIM ETFS ANNUAL REPORT |
Table of Contents
OTHER INFORMATION (Unaudited) (concluded)
|
| GUGGENHEIM ETFS ANNUAL REPORT | 67 |
Table of Contents
INFORMATION ON BOARD OF TRUSTEES AND OFFICERS (Unaudited)
|
A Board of Trustees oversees the Trust, as well as other trusts of GI, in which its members have no stated term of service, and continue to serve after election until resignation. The Statement of Additional Information includes further information about Fund Trustees and Officers, and can be obtained without charge by calling 800.820.0888.
All Trustees and Officers may be reached c/o Guggenheim Investments, 805 King Farm Boulevard, Suite 600, Rockville, MD 20850.
TRUSTEE AND OFFICER
Name and Year of Birth | Length of Service (Year Began) | Number of | ||||||
Donald C. Cacciapaglia* | Rydex Series Funds – 2012 | 146 | ||||||
| (1951) | Rydex Variable Trust – 2012 | |||||||
Rydex Dynamic Funds – 2012 | ||||||||
Rydex ETF Trust – 2012 |
Principal Occupations During Past Five Years: Current: Security Investors, LLC: President and CEO from April 2012 to present; Guggenheim Investments: President and Chief Administrative Officer from February 2010 to present; Previous: Channel Capital Group, Inc.: Chairman and CEO from April 2002 to February 2010
Positions held within the Trust: Trustee from 2012 to present; President from 2012 to present
INDEPENDENT TRUSTEES
Name and Year of Birth | Length of Service (Year Began) | Number of | ||||||
Corey A. Colehour | Rydex Series Funds – 1993 | 146 | ||||||
| (1945) | Rydex Variable Trust – 1998 | |||||||
Rydex Dynamic Funds – 1999 | ||||||||
Rydex ETF Trust – 2003 |
Principal Occupations During Past Five Years: Current: Retired; Previous: President and Senior Vice President of Schield Management Company (registered investment adviser) from 2003 to 2006
Positions held within the Trust: Trustee from 1993 to present; Member of the Audit and Governance and Nominating Committees from 1995 to present
J. Kenneth Dalton | Rydex Series Funds – 1995 | 146 | ||||||
| (1941) | Rydex Variable Trust – 1998 | |||||||
Rydex Dynamic Funds – 1999 | ||||||||
Rydex ETF Trust – 2003 |
Principal Occupations During Past Five Years: Current: Retired
Positions held within the Trust: Trustee from 1995 to present; Member and Chairman of the Audit Committee from 1997 to present; Member of the Governance and Nominating Committees from 1995 to present; and Member of the Risk Oversight Committee from 2010 to present
John O. Demaret | Rydex Series Funds – 1997 | 146 | ||||||
| (1940) | Rydex Variable Trust – 1998 | |||||||
Rydex Dynamic Funds – 1999 | ||||||||
Rydex ETF Trust – 2003 |
Principal Occupations During Past Five Years: Current: Retired
Positions held within the Trust: Trustee from 1997 to present; Chairman of the Board from 2006 to present; Member of the Audit Committee from 1997 to present; and Member of the Risk Oversight Committee from 2010 to present
| 68 | GUGGENHEIM ETFS ANNUAL REPORT |
Table of Contents
| INFORMATION ON BOARD OF TRUSTEES AND OFFICERS (Unaudited) (continued) |
INDEPENDENT TRUSTEES – concluded
Name and Year of Birth | Length of Service (Year Began) | Number of | ||||||
Werner E. Keller | Rydex Series Funds – 2005 | 146 | ||||||
| (1940) | Rydex Variable Trust – 2005 | |||||||
Rydex Dynamic Funds – 2005 | ||||||||
Rydex ETF Trust – 2005 | �� |
Principal Occupations During Past Five Years: Current: Founder and President of Keller Partners, LLC (investment research firm) from 2005 to present; Previous: Retired from 2001 to 2005
Positions held within the Trust: Vice Chairman of the Board of Trustees from 2010 to present; Trustee and Member of the Audit and Governance and Nominating Committees from 2005 to present; and Chairman and Member of the Risk Oversight Committee from 2010 to present
Thomas F. Lydon, Jr. | Rydex Series Funds – 2005 | 146 | ||||||
| (1960) | Rydex Variable Trust – 2005 | |||||||
Rydex Dynamic Funds – 2005 | ||||||||
Rydex ETF Trust – 2005 |
Principal Occupations During Past Five Years: Current: President of Global Trends Investments (registered investment adviser) from 1996 to present
Positions held within the Trust: Trustee and Member of the Audit and Governance and Nominating Committees from 2005 to present
Patrick T. McCarville | Rydex Series Funds – 1997 | 146 | ||||||
| (1942) | Rydex Variable Trust – 1998 | |||||||
Rydex Dynamic Funds – 1999 | ||||||||
Rydex ETF Trust – 2003 |
Principal Occupations During Past Five Years: Current: Retired; Previous: Chief Executive Officer of Par Industries, Inc., d/b/a Par Leasing from 1977 to 2010
Positions held within the Trust: Trustee from 1997 to present; Member of the Audit Committee from 1997 to present; and Chairman of the Governance and Nominating Committees from 1997 to present
Roger Somers | Rydex Series Funds – 1993 | 146 | ||||||
| (1944) | Rydex Variable Trust – 1998 | |||||||
Rydex Dynamic Funds – 1999 | ||||||||
Rydex ETF Trust – 2003 |
Principal Occupations During Past Five Years: Current: Founder and Chief Executive Officer of Arrow Limousine from 1965 to present
Positions held within the Trust: Trustee from 1993 to present; Member of the Audit and Governance and Nominating Committees from 1995 to present
| GUGGENHEIM ETFS ANNUAL REPORT | 69 |
Table of Contents
| INFORMATION ON BOARD OF TRUSTEES AND OFFICERS (Unaudited) (concluded) |
EXECUTIVE OFFICERS
Name, Position and Year of Birth | Principal Occupations During Past Five Years | |
Michael P. Byrum* Vice President (1970) | Current: President, Security Benefit Asset Management Holdings, LLC; Senior Vice President, Security Investors, LLC; President & Chief Investment Officer, Rydex Holdings, LLC; Director & Chairman of the Board, Advisor Research Center, Inc.; and Manager, Rydex Specialized Products, LLC
Previous: Rydex Distributors, LLC (f/k/a Rydex Distributors, Inc.), Vice President (2009); Rydex Fund Services, LLC, Director (2009-2010), Secretary (2002-2010), Executive Vice President (2002-2006); Rydex Advisors, LLC (f/k/a PADCO Advisors, Inc.), Director (2008-2010), Chief Investment Officer (2006-2010), President (2004-2010), Secretary (2002-2010); Rydex Advisors II, LLC (f/k/a PADCO Advisors II, Inc.), Director (2008-2010), Chief Investment Officer (2006-2010), President (2004-2010), Secretary (2002-2010); Rydex Capital Partners, LLC, President & Secretary (2003-2007); Rydex Capital Partners II, LLC, (2003-2007); Rydex Holdings, LLC (f/k/a Rydex Holdings, Inc.), Secretary (2005-2008), Executive Vice President (2005-2006); Advisor Research Center, Inc., Secretary (2006-2009), Executive Vice President (2006); and Rydex Specialized Products, LLC, Secretary (2005-2008) | |
Nikolaos Bonos* Vice President and Treasurer (1963) | Current: Senior Vice President, Security Investors, LLC; Chief Executive Officer & Manager, Rydex Specialized Products, LLC; Chief Executive Officer & President, Rydex Fund Services, LLC; Vice President, Rydex Holdings, LLC; Treasurer, SBL Fund; Security Equity Fund; Security Income Fund; Security Large Cap Value Fund & Security Mid Cap Growth Fund; and Vice President, Security Benefit Asset Management Holdings, LLC
Previous: Security Global Investors, LLC, Senior Vice President (2010-2011); Rydex Advisors, LLC (f/k/a PADCO Advisors, Inc.) Senior Vice President (2006-2011); Rydex Fund Services, LLC (f/k/a Rydex Fund Services, Inc.), Director (2009) & Senior Vice President (2003-2006); and Rydex Specialized Products, LLC, Chief Financial Officer (2005-2009) | |
Elisabeth Miller* Chief Compliance Officer (1968) | Current: Chief Compliance Officer, Rydex Series Funds, Rydex Dynamic Funds, Rydex Variable Trust, Rydex ETF Trust, Security Equity Fund, Security Income Fund, Security Large Cap Value Fund, Security Mid Cap Growth Fund, SBL Fund, Security Investors, LLC, and Rydex Distributors, LLC
Previous: Senior Manager, Security Investors, LLC and Rydex Distributors, LLC (2004-2009) | |
Amy J. Lee* Vice President and Assistant Secretary (1961) | Current: Senior Vice President & Secretary, Security Investors, LLC; Secretary & Chief Compliance Officer, Security Distributors, Inc.; Vice President, Associate General Counsel & Assistant Secretary, Security Benefit Life Insurance Company and Security Benefit Corporation; Associate General Counsel, First Security Benefit Life Insurance and Annuity of New York; Vice President & Secretary, SBL Fund; Security Equity Fund; Security Income Fund; Security Large Cap Value Fund & Security Mid Cap Growth Fund; Vice President & Secretary, Rydex Holdings, LLC Secretary, Advisor Research Center, Inc., Rydex Specialized Products, LLC, Rydex Distributors, LLC and Rydex Fund Services, LLC; and Assistant Secretary, Security Benefit Clinic and Hospital
Previous: Security Global Investors, LLC, Senior Vice President & Secretary (2007-2011); Rydex Advisors, LLC (f/k/a PADCO Advisors, Inc.) & Rydex Advisors II, LLC (f/k/a PADCO Advisors II, Inc.), Senior Vice President & Secretary (2010-2011); and Brecek & Young Advisors, Inc., Director (2004-2008) | |
Joseph M. Arruda* Assistant Treasurer (1966) | Current: Assistant Treasurer, SBL Fund; Security Equity Fund; Security Income Fund; Security Large Cap Value Fund & Security Mid Cap Growth Fund; Vice President, Security Investors, LLC; and Chief Financial Officer & Manager, Rydex Specialized Products, LLC
Previous: Security Global Investors, LLC, Vice President (2010-2011); and Rydex Advisors, LLC (f/k/a PADCO Advisors, Inc.) & Rydex Advisors II, LLC (f/k/a PADCO Advisors II, Inc.), Vice President (2004-2011) | |
| * | Officers of the Funds are deemed to be “interested persons” of the Trust, within the meaning of Section 2(a)(19) of the 1940 Act, inasmuch as this person is affiliated with Guggenheim Investments. |
| 70 | GUGGENHEIM ETFS ANNUAL REPORT |
Table of Contents
| GUGGENHEIM INVESTMENTS PRIVACY POLICIES |
Rydex Funds, Guggenheim Funds, Rydex Investments, Rydex Distributors, Inc., Security Investors, LLC, Security Global Investors, LLC, Security Distributors, Inc. and Rydex Advisory Services (Collectively “Guggenheim Investments”)
When you become a Guggenheim Investments investor, you entrust us with not only your hard-earned money but also with personal and financial information about you. We recognize that your relationship with us is based on trust and that you expect us to act responsibly and in your best interests. Because we have access to this private information about you, we hold ourselves to the highest standards in its safekeeping and use. This means, most importantly, that we do not sell client information to anyone—whether it is your personal information or if you are a current or former Guggenheim Investments client.
The Information We Collect About You
In the course of doing business with shareholders and investors, we collect nonpublic personal information about you. You typically provide personal information when you complete a Guggenheim Investments account application or when you request a transaction that involves Rydex and Guggenheim Investments funds or one of the Guggenheim Investments affiliated companies. “Nonpublic personal information” is personally identifiable private information about you. For example, it includes information regarding your name and address, Social Security or taxpayer identification number, assets, income, account balance, bank account information and investment activity (e.g., purchase and redemption history).
How We Handle Your Personal Information
As emphasized above, we do not sell information about current or former clients or their accounts to third parties. Nor do we share such information, except when necessary to complete transactions at your request or to make you aware of related investment products and services that we offer. Additional details about how we handle your personal information are provided below. To complete certain transactions or account changes that you direct, it may be necessary to provide identifying information to companies, individuals or groups that are not affiliated with Guggenheim Investments. For example, if you ask to transfer assets from another financial institution to Guggenheim Investments, we will need to provide certain information about you to that company to complete the transaction. To alert you to other Guggenheim Investments investment products and services, we may share your information within the Guggenheim Investments family of affiliated companies. This would include, for example, sharing your information within Guggenheim Investments so we can make you aware of new Rydex and Guggenheim Investments funds or the services offered through another Guggenheim Investments affiliated company. In certain instances, we may contract with nonaffiliated companies to perform services for us. Where necessary, we will disclose information we have about you to these third parties. In all such cases, we provide the third party with only the information necessary to carry out its assigned responsibilities and only for that purpose. And we require these third parties to treat your private information with the same high degree of confidentiality that we do. In certain instances, we may share information with other financial institutions regarding individuals and entities in response to the U.S.A. Patriot Act. Finally, we will release information about you if you direct us to do so, if we are compelled by law to do so or in other circumstances permitted by law.
Opt Out Provisions
We do not sell your personal information to anyone. The law allows you to “opt out” of only certain kinds of information sharing with third parties. The firm does not share personal information about you with any third parties that triggers this opt-out right. This means YOU ARE ALREADY OPTED OUT.
How We Protect Privacy Online
Our concern for the privacy of our shareholders also extends to those who use our web site, guggenheiminvestments.com. Our web site uses some of the most secure forms of online communication available, including encryption technology, Secure Socket Layer (SSL) protocol, firewalls and user names and passwords. These technologies provide a high level of security and privacy when you access your account information or initiate online transactions. The Guggenheim Investments web site offers customized features that require our use of “http cookies”— tiny pieces of information that we ask your browser to store. However, we make very limited use of these cookies. We only use cookies for session management and security features on the Guggenheim Investments web site. We do not use them to pull data from your hard drive, to learn your email address, or to view data in cookies created by other web sites. We will not share the information in our cookies or give others access to it. See the legal information area on our web site for more details about web site security and privacy features.
| GUGGENHEIM ETFS ANNUAL REPORT | 71 |
Table of Contents
GUGGENHEIM INVESTMENTS PRIVACY POLICIES (concluded)
|
How We Safeguard Your Personal Information
We restrict access to nonpublic personal information about shareholders to our employees and in some cases to third parties (for example, the service providers described above) as permitted by law. We maintain strict physical, electronic and procedural safeguards that comply with federal standards to guard your nonpublic personal information.
We’ll Keep You Informed
As required by federal law, we will notify shareholders of our privacy policy annually. We reserve the right to modify this policy at any time, but rest assured that if we do change it, we will tell you promptly. You will also be able to access our privacy policy from our web site at guggenheiminvestments.com. Should you have any questions regarding our privacy policy, contact us at 800.820.0888 or 301.296.5100.
| 72 | GUGGENHEIM ETFS ANNUAL REPORT |
Table of Contents

805 King Farm Boulevard, Suite 600
Rockville, MD 20850
guggenheiminvestments.com
800.820.0888
ETF2-ANN-1012x1013
Table of Contents

OCTOBER 31, 2012
GUGGENHEIM ETFs
ANNUAL REPORT

| RSU | GUGGENHEIM 2x S&P 500® ETF | |
(formerly, RYDEX 2x S&P 500 ETF) | ||
| RSW | GUGGENHEIM INVERSE 2x S&P 500® ETF | |
(formerly, RYDEX INVERSE 2x S&P 500 ETF) |
Table of Contents
| TABLE OF CONTENTS |
| 2 | ||||
| 3 | ||||
| 4 | ||||
| 5 | ||||
| 6 | ||||
| 7 | ||||
| 9 | ||||
| 17 | ||||
| 18 | ||||
| 19 | ||||
| 20 | ||||
| 22 | ||||
| 29 | ||||
| 30 | ||||
| 31 | ||||
| 34 | ||||
| GUGGENHEIM ETFS ANNUAL REPORT | 1 |
Table of Contents
| October 31, 2012 |
Dear Shareholder:
Security Investors, LLC (the “Investment Adviser”) is pleased to present the annual shareholder report for two of our exchange traded funds (“ETFs”).
The Investment Adviser is part of Guggenheim Investments, which represents the investment management businesses of Guggenheim Partners, LLC, a global, diversified financial services firm.
This report covers performance of the following ETFs for the annual period ended October 31, 2012, with the name of each Fund followed by its ticker symbol:
| • | Guggenheim 2X S&P 500® ETF (RSU) |
| • | Guggenheim Inverse 2X S&P 500® ETF (RSW) |
Rydex Distributors, LLC, the distributor of the Funds, is committed to providing investors with innovative investment solutions; as of the date of this report we offer 26 ETFs with a wide range of domestic and global themes, as well as equity and fixed-income mutual funds. We have built on the investment management strengths of Guggenheim Investments and worked with a diverse group of index providers to create some of the most distinctive ETFs available. Rydex Distributors, LLC is affiliated with Guggenheim Partners and Security Investors.
To learn more about economic and market conditions over the 12 months ended October 31, 2012, we encourage you to read the Economic and Market Overview section of the report, which follows this letter, and the Manager’s Analysis for each ETF.
Sincerely,

Donald C. Cacciapaglia
President
November 30, 2012
Read each fund’s prospectus and summary prospectus (if available) carefully before investing. It contains the fund’s investment objectives, risks, charges, expenses and other information, which should be considered carefully before investing. Obtain a prospectus and summary prospectus (if available) at www.guggenheiminvestments.com or call 800.820.0888.
Leveraged and inverse ETFs are not suitable for all investors. • These ETFs should be utilized only by investors who (a) understand the risks associated with the use of leverage, (b) understand the consequences of seeking daily leveraged investment results, (c) understand the risk of shorting, and (d) intend to actively monitor and manage their investments. • The more an ETF invests in leveraged instruments, the more the leverage will magnify any gains or losses on those investments. • Inverse ETFs involve certain risks, which include increased volatility due to the ETFs’ possible use of short sales of securities and derivatives, such as options and futures. • The ETFs’ use of derivatives, such as futures, options and swap agreements, may expose the ETFs’ shareholders to additional risks that they would not be subject to if they invested directly in the securities underlying those derivatives. • Short-selling involves increased risks and costs. You risk paying more for a security than you received from its sale. • Leveraged and inverse ETFs seek to provide investment results that match the performance of a specific benchmark, before fees and expenses, on a daily basis. Because the ETFs seek to track the performance of their benchmark on a daily basis, mathematical compounding, especially with respect to those ETFs that use leverage as part of their investment strategy, may prevent an ETF from correlating with the monthly, quarterly, annual or other period performance of its benchmark. Due to the compounding of daily returns, leveraged and inverse ETFs’ returns over periods other than one day will likely differ in amount and possibly direction from the benchmark return for the same period. For those ETFs that consistently apply leverage, the value of the ETFs’ shares will tend to increase or decrease more than the value of any increase or decrease in its benchmark index. The ETFs rebalance their portfolios on a daily basis, increasing exposure in response to that day’s gains or reducing exposure in response to that day’s losses. Daily rebalancing will impair an ETF’s performance if the benchmark experiences volatility. Investors should monitor their leveraged and inverse ETFs’ holdings consistent with their strategies, as frequently as daily. • Investment returns and principal value will fluctuate so that when shares are redeemed, they may be worth more or less than original cost. Most investors will also incur customary brokerage commissions when buying or selling shares of an ETF. • ETF shares may trade below their net asset value (“NAV”). The NAV of shares will fluctuate with changes in the market value of an ETF’s holdings. In addition, there can be no assurance that an active trading market for shares will develop or be maintained. • For more on these and other risks, please read the prospectus.
| 2 | GUGGENHEIM ETFS ANNUAL REPORT |
Table of Contents
A BRIEF NOTE ON THE COMPOUNDING OF RETURNS (Unaudited)
|
The Funds described in this report are benchmarked daily to leveraged or inverse versions of published indices. To properly evaluate the performance of these funds, it is essential to understand the effect of mathematical compounding on their respective returns.
Because of the nonlinear effects of leverage applied over time, it is possible for a fund to perform in line with its benchmark for several individual periods in a row, yet seem to trail the benchmark over the entire period. It is also possible that a fund that performs in-line with its benchmark on a daily basis may seem to outperform its benchmark over longer periods.
An Example of Compounding
For example, consider a hypothetical fund that is designed to produce returns that correspond to 150% of an index. On the first day of a period, the index rises from a level of 100 to a level of 106, producing a 6% gain and an expectation that the fund will rise by 9%. On the same day, the fund’s Net Asset Value per share (“NAV”) increases from $10.00 to $10.90 for a gain of 9.0% — in line with its benchmark.
On day two, assume the index falls from 106 to 99 for a loss of about 6.6%. The fund, as expected, falls 9.9% to a price of $9.82. On each day, the fund performed exactly in line with its benchmark, but for the two-day period, the fund was down 1.8%, while the index was down only 1.0%. Without taking into account the daily compounding of returns, one would expect the fund to lose 1.5% and would see the fund as trailing by 0.3% when in fact it had performed perfectly. This example is summarized in the table below.
| Index Level | Index Performance | Fund Expectation | Fund NAV | Fund Performance | Assessment | |||||||||||||||||||
Start | 100 | $ | 10.00 | |||||||||||||||||||||
Day 1 | 106 | 6.00 | % | 9.00 | % | $ | 10.90 | 9.00 | % | In Line | ||||||||||||||
Day 2 | 99 | (6.60 | )% | (9.90 | )% | $ | 9.82 | (9.90 | )% | In Line | ||||||||||||||
Cumulative | (1.00 | )% | (1.50 | )% | (1.80 | )% | (0.30 | )% | ||||||||||||||||
As illustrated by this simple example, the effect of leverage can make it difficult to form expectations or judgments about fund performance given only the returns of the unleveraged index.
Because certain funds seek to track the performance of their benchmark on a daily basis, mathematical compounding, especially with respect to those funds that use leverage as part of their investment strategy, may prevent a fund from correlating with the monthly, quarterly, annual or other period performance of its benchmark. Due to the compounding of daily returns, leveraged and inverse funds’ returns over periods other than one day will likely differ in amount and possibly direction from the benchmark return for the same period. Investors should monitor their leveraged and inverse funds’ holdings consistent with their strategies, as frequently as daily. For those funds that consistently apply leverage, the value of the fund’s shares will tend to increase or decrease more than the value of any increase or decrease in its benchmark index. For more on correlation, leverage and other risks, please read the prospectus.
In general, any change in direction in an index will produce compounding that seems to work against an investor. Were the index to move in the same direction (either up or down) for two or more periods in a row, the compounding of those returns would work in an investor’s favor, causing the fund to seemingly beat its benchmark.
As a general rule of thumb, more leverage in a fund will magnify the compounding effect, while less leverage will generally produce results that are more in line with expectations. In addition, periods of high volatility in an underlying index will also cause the effects of compounding to be more pronounced, while lower volatility will produce a more muted effect.
| GUGGENHEIM ETFS ANNUAL REPORT | 3 |
Table of Contents
|
Shareholder Expense Example
As a shareholder of the Rydex ETF Trust, you incur transaction costs such as creation and redemption fees or brokerage charges, and ongoing costs including advisory fees, trustee fees and, if applicable, distribution fees. All other Trust expenses are paid by the advisor. This Example is intended to help you understand your ongoing costs (in dollars) of investing in a Fund and to compare these costs with the ongoing costs of investing in other mutual funds.
The example in the table is based on an investment of $1,000 invested on April 30, 2012 and held for the six months ended October 31, 2012.
Actual Expenses
The first table below provides information about actual account values and actual expenses. You may use the information in this table, together with the amount you invested, to estimate the expenses that you incurred over the period. Simply divide your account value by $1,000 (for example, an $8,600 account value divided by $1,000 = 8.6), then multiply the result by the number in the first table under the heading entitled “Expenses Paid During the Six-Month Period” to estimate the expenses attributable to your investment during this period.
Hypothetical Example for Comparison Purposes
The second table below provides information about hypothetical account values and hypothetical expenses based on a Fund’s actual expense ratio and an assumed rate of return of 5% per year before expenses, which is not a Fund’s actual return. Thus, you should not use the hypothetical account values and expenses to estimate the actual ending account balance or your expenses for the period. Rather, these figures are provided to enable you to compare the ongoing costs of investing in a Fund and other funds. To do so, compare this 5% hypothetical example with the 5% hypothetical examples that appear in the shareholder reports of other funds.
Please note that the expenses shown in the table are meant to highlight your ongoing costs only and do not reflect any transaction costs, such as creation and redemption fees, or brokerage charges. Therefore, the second table is useful in comparing ongoing costs only, and will not help you determine the relative total costs of owning different funds. In addition, if these transaction costs were included, your costs would have been higher.
| Expense Ratio | Beginning Account Value 04/30/12 | Ending Account Value 10/31/12 | Expenses Paid During Six-Month Period* 04/30/12 to 10/31/12 | |||||||||||||
Actual | ||||||||||||||||
Guggenheim 2x S&P 500® ETF | 0.70% | $ | 1,000.00 | $ | 1,029.90 | $ | 3.57 | |||||||||
Guggenheim Inverse 2x S&P 500® ETF | 0.70% | 1,000.00 | 928.60 | 3.39 | ||||||||||||
Hypothetical (assuming a 5% return before expenses) |
| |||||||||||||||
Guggenheim 2x S&P 500® ETF | 0.70% | 1,000.00 | 1,021.62 | 3.56 | ||||||||||||
Guggenheim Inverse 2x S&P 500® ETF | 0.70% | 1,000.00 | 1,021.62 | 3.56 | ||||||||||||
| * | Expenses are equal to the Fund’s annualized expense ratio multiplied by the average account value over the period, multiplied by 184/366 (to reflect one-half year period). |
| 4 | GUGGENHEIM ETFS ANNUAL REPORT |
Table of Contents
|
Amidst the negative headlines concerning the potential fiscal cliff in the U.S., further turmoil in Europe and worsening economic data from China, the U.S. economy has shown surprising resilience, with signs of rising consumer sentiment and a recovery in housing. The U.S. housing market appears to have passed its bottom and real estate prices have begun to pick up. Our expectation is that a period of continued low interest rates will likely reinforce the rise in home prices and sales. Rising home prices will increase household net worth, which will translate into greater consumption via the wealth effect, and is supportive of overall economic growth. The recent rise in headline inflation, led by increases in energy and food prices, is likely to be transitory. Inflationary pressures should remain muted in the medium-term given the substantial slack in the economy.
The U.S. economy continues to press forward despite the current headwinds, and we believe the current macroeconomic environment remains constructive for risk assets, especially in the U.S. Stocks in the U.S. appear to be undervalued by most measures, and should benefit from continued capital inflow and the Federal Reserve’s accommodative monetary policy. We continue to see attractive value in credit products on a relative basis, though this positive outlook is limited to spread (or non-government) sectors.
On the international front, uncertainty continues to weigh on European markets. European policymakers appear to be coming closer to a consensus on the need for a fiscal union, albeit at a glacial pace. In China, a recent batch of economic data suggests that the odds of a hard landing have increased materially. We expect an announcement of additional stimulus measures after the government transition next year; although a stimulus would be supportive of economic growth, we expect China’s headline growth to slow from its breakneck pace of the past decade.
Beginning in mid-November 2011, the U.S. stock market moved up fairly consistently, except for a second-quarter pullback caused by lower earnings and GDP. For the 12-month period ended October 31, 2012, the Standard & Poor’s 500 Index* (the “S&P 500”) returned 15.21%.
Most international markets had positive returns, but were not nearly as strong as the U.S. market. The Morgan Stanley Capital International Europe-Australasia-Far East (the “MSCI EAFE”) Index* returned 4.61%. The MSCI EAFE Index is composed of approximately 1,100 companies in 20 developed countries in Europe and the Pacific Basin. The MSCI Emerging Markets Index returned 2.63%.
The search for yield continued to attract investors to the U.S. bond markets, helping performance, with lower-rated bonds outperforming higher-quality issues. The return of the Barclays U.S. Aggregate Bond Index*, which is a proxy for the U.S. investment grade bond market, returned 5.25%, while return of the Barclays U.S. Corporate High Yield Index* was 13.61%. Reflecting the Federal Reserve’s continuing accommodative monetary policy, interest rates on short-term securities remained at their lowest levels in many years; the return of the Bank of America Merrill Lynch 3 Month U.S. Treasury Bill Index* was 0.08%.
The opinions and forecasts expressed may not actually come to pass. This information is subject to change at any time, based on market and other conditions, and should not be construed as a recommendation of any specific security or strategy.
* Index Definitions:
The following indices are referenced throughout this report. Indices are unmanaged and not available for direct investment. Index performance does not reflect transaction costs, fees or expenses.
The Barclays U.S. Aggregate Bond Index is a broad-based benchmark that measures the investment grade, U.S. dollar denominated, fixed-rate taxable bond market, including U.S. Treasuries, government-related and corporate securities, MBS (agency fixed-rate and hybrid ARM pass-throughs), ABS, and CMBS.
The Barclays U.S. Corporate High Yield Index measures the market of USD-denominated, non-investment grade, fixed-rate, taxable corporate bonds.
The Bank of America Merrill Lynch 3-Month U.S. Treasury Bill Index tracks 3-month U.S. government securities.
The MSCI EAFE Index is a capitalization weighted measure of stock markets in Europe, Australasia and the Far East.
The MSCI Emerging Markets Index is a free float-adjusted market capitalization weighted index that is designed to measure equity market performance in the global emerging markets.
The S&P 500® Index is a capitalization-weighted index that measures the performance of the large-capitalization sector of the U.S. equity market and includes 500 widely held common stocks chosen for market size, liquidity and industry group representation.
| GUGGENHEIM ETFS ANNUAL REPORT | 5 |
Table of Contents
MANAGER’S ANALYSIS (Unaudited)
| October 31, 2012
|
GUGGENHEIM 2x S&P 500® ETF
For the one-year period ended October 31, 2012, Guggenheim 2x S&P 500® ETF maintained a daily correlation of over 99% to its benchmark of 200% of the daily price movement of the S&P 500® Total Return Index. Guggenheim 2x S&P 500® ETF returned 28.44%, while the S&P 500 Total Return Index had performance of 15.21% over the same time period.
All sectors contributed to return for the period. The biggest performance contributors to the index were the Financials and Health Care sectors while Utilities and Materials contributed least. Apple, Inc. and Exxon Mobile Corp. were the stocks contributing most to the index return, while Hewlett-Packard Co. and Oracle Corp. were the largest detractors.
In order to gain leveraged exposure in the S&P 500 Index, the Guggenheim 2x S&P 500® ETF employs as its investment strategy a program of engaging in investing in leveraged derivative instruments, such as equity index swaps and futures contracts on stock indices. Due to the compounding of daily returns, leveraged and inverse funds’ returns over periods other than one day will likely differ in amount and possibly direction from the benchmark return for the same period. Investors should monitor their leveraged and inverse funds’ holdings to ensure that they are consistent with their strategies, as frequently as daily. The effects of compounding may cause the longer-term correlation of the fund to its benchmark to diminish. The apparent discrepancy between the leveraged and unleveraged indices is the result of compounding, which is described briefly on page 3 of this report.
Cumulative Fund Performance: November 5, 2007 – October 31, 2012
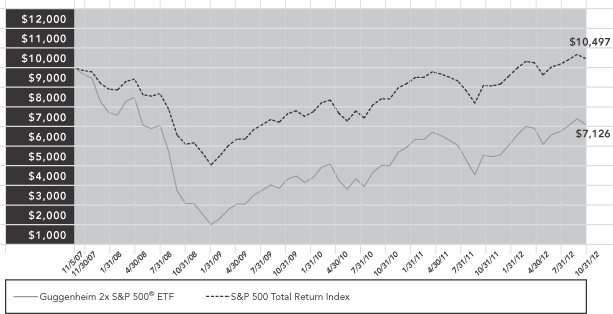
| AVERAGE ANNUAL TOTAL RETURNS FOR THE PERIOD ENDED OCTOBER 31, 2012 | ||||||||||
| One Year | Three Year | Since Inception | ||||||||
Guggenheim 2x S&P 500® ETF | 28.44% | 22.64% | (6.57)% | |||||||
S&P 500 Total Return Index | 15.21% | 13.21% | 0.98% | |||||||
The returns presented above do not reflect the effect of taxes. Index returns represent total returns. Performance displayed represents past performance, which is no guarantee of future results.
Fund performance is subject to daily market volatility and may be better or worse since the end of the last quarter. For up-to-date fund performance, call 800.820.0888 or visit guggenheiminvestments.com.
| 6 | GUGGENHEIM ETFS ANNUAL REPORT |
Table of Contents
| October 31, 2012
|
GUGGENHEIM 2x S&P 500® ETF
Sector Allocations*
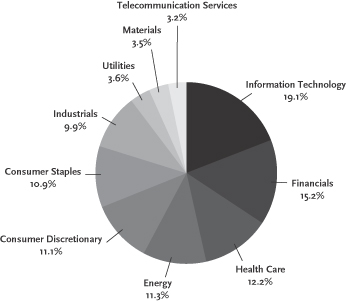
| Top 10 Holdings* | ||||
| Description | % of Net Assets | |||
Apple, Inc. | 3.72% | |||
Exxon Mobil Corp. | 2.80% | |||
General Electric Co. | 1.48% | |||
Chevron Corp. | 1.44% | |||
Microsoft Corp. | 1.43% | |||
International Business Machines Corp. | 1.39% | |||
AT&T, Inc. | 1.33% | |||
Johnson & Johnson | 1.30% | |||
Procter & Gamble Co.(The) | 1.27% | |||
Pfizer, Inc. | 1.24% | |||
| * | The Fund’s Top Ten Holdings are expressed as a percentage of net assets and the Sector Allocations are expressed as a percentage of the Fund’s equity investments market value. These percentages may change over time. |
| GUGGENHEIM ETFS ANNUAL REPORT | 7 |
Table of Contents
MANAGER’S ANALYSIS (Unaudited)
| October 31, 2012
|
GUGGENHEIM INVERSE 2x S&P 500® ETF
For the one-year period ended October 31, 2012, Guggenheim Inverse 2x S&P 500® ETF achieved a daily correlation of over 99% to its benchmark of -200% of the daily price movement of the S&P 500 Total Return Index. Guggenheim Inverse 2x S&P 500® ETF delivered a total return of –30.31%, while the S&P 500® Total Return Index had performance of 15.21% over the same time period.
All sectors contributed to return for the period. The biggest performance contributors to the index were the Financials and Health Care sectors while Materials and Utilities contributed least. Apple, Inc. and Exxon Mobile Corp. were the stocks contributing most to the index return, while Hewlett-Packard Co. and Oracle Corp. were the largest detractors.
In order to gain leveraged exposure in the S&P 500 Index, the Guggenheim Inverse 2x S&P 500 ETF employs as its investment strategy a program of engaging in investing in leveraged derivative instruments, such as equity index swaps and futures contracts on stock indices. Due to the compounding of daily returns, leveraged and inverse funds’ returns over periods other than one day will likely differ in amount and possibly direction from the benchmark return for the same period. Investors should monitor their leveraged and inverse funds’ holdings to ensure that they are consistent with their strategies, as frequently as daily. The effects of compounding may cause the longer-term correlation of the fund to its benchmark to diminish. The apparent discrepancy between the leveraged and unleveraged indices is the result of compounding, which is described briefly on page 3 of this report.
Cumulative Fund Performance: November 5, 2007 – October 31, 2012

| AVERAGE ANNUAL TOTAL RETURNS FOR THE PERIOD ENDED OCTOBER 31, 2012 | ||||||||||
| One Year | Three Year | Since Inception (11/05/07) | ||||||||
Guggenheim Inverse 2x S&P 500® ETF | (30.31)% | (30.02)% | (18.62)% | |||||||
S&P 500 Total Return Index | 15.21% | 13.21% | 0.98% | |||||||
The returns presented above do not reflect the effect of taxes. Index returns represent total returns. Performance displayed represents past performance, which is no guarantee of future results.
Fund performance is subject to daily market volatility and may be better or worse since the end of the last quarter. For up-to-date fund performance, call 800.820.0888 or visit guggenheiminvestments.com.
| 8 | GUGGENHEIM ETFS ANNUAL REPORT |
Table of Contents
| SCHEDULE OF INVESTMENTS | October 31, 2012 |
GUGGENHEIM 2x S&P 500® ETF
| SHARES | VALUE | |||||||
COMMON STOCKS - 84.1% |
| |||||||
Aerospace & Defense - 1.9% |
| |||||||
Boeing Co.(The) | 2,274 | $ | 160,181 | |||||
General Dynamics Corp. | 1,114 | 75,841 | ||||||
Honeywell International, Inc. | 2,624 | 160,694 | ||||||
L-3 Communications Holdings, Inc. | 324 | 23,911 | ||||||
Lockheed Martin Corp. | 904 | 84,678 | ||||||
Northrop Grumman Corp. | 831 | 57,081 | ||||||
Precision Castparts Corp. | 488 | 84,458 | ||||||
Raytheon Co. | 1,116 | 63,121 | ||||||
Rockwell Collins, Inc. | 477 | 25,558 | ||||||
Textron, Inc. | 945 | 23,823 | ||||||
United Technologies Corp. | 2,818 | 220,255 | ||||||
|
| |||||||
Total Aerospace & Defense | 979,601 | |||||||
|
| |||||||
Air Freight & Logistics - 0.6% |
| |||||||
C.H. Robinson Worldwide, Inc. | 543 | 32,759 | ||||||
Expeditors International of Washington, Inc. | 708 | 25,920 | ||||||
FedEx Corp. | 981 | 90,242 | ||||||
United Parcel Service, Inc. — Class B | 2,416 | 176,972 | ||||||
|
| |||||||
Total Air Freight & Logistics | 325,893 | |||||||
|
| |||||||
Airlines - 0.0%a |
| |||||||
Southwest Airlines Co. | 2,497 | 22,023 | ||||||
|
| |||||||
Total Airlines | 22,023 | |||||||
|
| |||||||
Auto Components - 0.2% |
| |||||||
BorgWarner, Inc.* | 384 | 25,275 | ||||||
Goodyear Tire & Rubber Co.(The)* | 823 | 9,391 | ||||||
Johnson Controls, Inc. | 2,299 | 59,199 | ||||||
|
| |||||||
Total Auto Components | 93,865 | |||||||
|
| |||||||
Automobiles - 0.4% |
| |||||||
Ford Motor Co. | 12,815 | 143,016 | ||||||
Harley-Davidson, Inc. | 766 | 35,818 | ||||||
|
| |||||||
Total Automobiles | 178,834 | |||||||
|
| |||||||
Beverages - 2.0% |
| |||||||
Beam, Inc. | 532 | 29,558 | ||||||
Brown-Forman Corp. — Class B | 508 | 32,543 | ||||||
Coca-Cola Co.(The) | 13,011 | 483,749 | ||||||
Coca-Cola Enterprises, Inc. | 930 | 29,239 | ||||||
Constellation Brands, Inc. — Class A* | 495 | 17,493 | ||||||
Dr Pepper Snapple Group, Inc. | 708 | 30,338 | ||||||
Molson Coors Brewing Co. — Class B | 523 | 22,562 | ||||||
Monster Beverage Corp.* | 517 | 23,094 | ||||||
PepsiCo, Inc. | 5,230 | 362,125 | ||||||
|
| |||||||
Total Beverages | 1,030,701 | |||||||
|
| |||||||
Biotechnology - 1.3% |
| |||||||
Alexion Pharmaceuticals, Inc.* | 650 | 58,747 | ||||||
Amgen, Inc. | 2,590 | 224,152 | ||||||
Biogen Idec, Inc.* | 793 | 109,608 | ||||||
Celgene Corp.* | 1,451 | 106,387 | ||||||
Gilead Sciences, Inc.* | 2,543 | 170,788 | ||||||
|
| |||||||
Total Biotechnology | 669,682 | |||||||
|
| |||||||
| SHARES | VALUE | |||||||
Building Products - 0.0%a |
| |||||||
Masco Corp. | 1,201 | $ | 18,123 | |||||
|
| |||||||
Total Building Products | 18,123 | |||||||
|
| |||||||
Capital Markets - 1.6% |
| |||||||
Ameriprise Financial, Inc. | 709 | 41,384 | ||||||
Bank of New York Mellon Corp.(The) | 3,969 | 98,074 | ||||||
BlackRock, Inc. | 430 | 81,563 | ||||||
Charles Schwab Corp.(The) | 3,682 | 50,002 | ||||||
E*Trade Financial Corp.* | 864 | 7,223 | ||||||
Federated Investors, Inc. — Class B | 314 | 7,297 | ||||||
Franklin Resources, Inc. | 463 | 59,171 | ||||||
Goldman Sachs Group, Inc.(The) | 1,514 | 185,299 | ||||||
Invesco Ltd. | 1,495 | 36,358 | ||||||
Legg Mason, Inc. | 403 | 10,269 | ||||||
Morgan Stanley | 4,647 | 80,765 | ||||||
Northern Trust Corp. | 735 | 35,118 | ||||||
State Street Corp. | 1,611 | 71,802 | ||||||
T. Rowe Price Group, Inc. | 854 | 55,459 | ||||||
|
| |||||||
Total Capital Markets | 819,784 | |||||||
|
| |||||||
Chemicals - 2.0% |
| |||||||
Air Products & Chemicals, Inc. | 710 | 55,046 | ||||||
Airgas, Inc. | 235 | 20,908 | ||||||
CF Industries Holdings, Inc. | 212 | 43,500 | ||||||
Dow Chemical Co.(The) | 4,027 | 117,991 | ||||||
Du Pont (E.I.) de Nemours & Co. | 3,125 | 139,125 | ||||||
Eastman Chemical Co. | 514 | 30,449 | ||||||
Ecolab, Inc. | 884 | 61,526 | ||||||
FMC Corp. | 462 | 24,726 | ||||||
International Flavors & Fragrances, Inc. | 275 | 17,771 | ||||||
LyondellBasell Industries NV — Class A | 1,141 | 60,918 | ||||||
Monsanto Co. | 1,791 | 154,151 | ||||||
Mosaic Co.(The) | 929 | 48,624 | ||||||
PPG Industries, Inc. | 513 | 60,062 | ||||||
Praxair, Inc. | 1,002 | 106,423 | ||||||
Sherwin-Williams Co.(The) | 286 | 40,778 | ||||||
Sigma-Aldrich Corp. | 405 | 28,407 | ||||||
|
| |||||||
Total Chemicals | 1,010,405 | |||||||
|
| |||||||
Commercial Banks - 2.4% |
| |||||||
BB&T Corp. | 2,349 | 68,004 | ||||||
Comerica, Inc. | 649 | 19,347 | ||||||
Fifth Third Bancorp | 3,087 | 44,854 | ||||||
First Horizon National Corp. | 836 | 7,783 | ||||||
Huntington Bancshares, Inc. | 2,884 | 18,429 | ||||||
KeyCorp | 3,170 | 26,692 | ||||||
M&T Bank Corp. | 403 | 41,952 | ||||||
PNC Financial Services Group, Inc. | 1,779 | 103,520 | ||||||
Regions Financial Corp. | 4,750 | 30,970 | ||||||
SunTrust Banks, Inc. | 1,809 | 49,205 | ||||||
US Bancorp | 6,368 | 211,481 | ||||||
Wells Fargo & Co. | 16,506 | 556,087 | ||||||
Zions Bancorp | 620 | 13,311 | ||||||
|
| |||||||
Total Commercial Banks | 1,191,635 | |||||||
|
| |||||||
| See Notes to Financial Statements. | GUGGENHEIM ETFS ANNUAL REPORT | 9 |
Table of Contents
| SCHEDULE OF INVESTMENTS (continued) | October 31, 2012 |
GUGGENHEIM 2x S&P 500® ETF
| SHARES | VALUE | |||||||
Commercial Services & Supplies - 0.4% |
| |||||||
ADT Corp.(The)* | 773 | $ | 32,087 | |||||
Avery Dennison Corp. | 340 | 11,009 | ||||||
Cintas Corp. | 360 | 15,052 | ||||||
Iron Mountain, Inc. | 507 | 17,542 | ||||||
Pitney Bowes, Inc. | 674 | 9,679 | ||||||
R.R. Donnelley & Sons Co.b | 606 | 6,072 | ||||||
Republic Services, Inc. | 1,005 | 28,492 | ||||||
Stericycle, Inc.* | 288 | 27,291 | ||||||
Waste Management, Inc. | 1,464 | 47,931 | ||||||
|
| |||||||
Total Commercial Services & Supplies | 195,155 | |||||||
|
| |||||||
Communications Equipment - 1.5% |
| |||||||
Cisco Systems, Inc. | 17,777 | 304,698 | ||||||
F5 Networks, Inc.* | 265 | 21,857 | ||||||
Harris Corp. | 381 | 17,442 | ||||||
JDS Uniphase Corp.* | 780 | 7,558 | ||||||
Juniper Networks, Inc.* | 1,769 | 29,313 | ||||||
Motorola Solutions, Inc. | 962 | 49,716 | ||||||
QUALCOMM, Inc. | 5,723 | 335,225 | ||||||
|
| |||||||
Total Communications Equipment | 765,809 | |||||||
|
| |||||||
Computers & Peripherals - 4.6% |
| |||||||
Apple, Inc. | 3,150 | 1,874,565 | ||||||
Dell, Inc. | 4,895 | 45,181 | ||||||
EMC Corp.* | 7,053 | 172,234 | ||||||
Hewlett-Packard Co. | 6,606 | 91,493 | ||||||
NetApp, Inc.* | 1,221 | 32,845 | ||||||
SanDisk Corp.* | 812 | 33,909 | ||||||
Seagate Technology PLC | 1,188 | 32,456 | ||||||
Western Digital Corp. | 748 | 25,604 | ||||||
|
| |||||||
Total Computers & Peripherals | 2,308,287 | |||||||
|
| |||||||
Construction & Engineering - 0.1% |
| |||||||
Fluor Corp. | 561 | 31,332 | ||||||
Jacobs Engineering Group, Inc.* | 437 | 16,864 | ||||||
Quanta Services, Inc.* | 716 | 18,566 | ||||||
|
| |||||||
Total Construction & Engineering | 66,762 | |||||||
|
| |||||||
Construction Materials - 0.0%a |
| |||||||
Vulcan Materials Co. | 436 | 20,043 | ||||||
|
| |||||||
Total Construction Materials | 20,043 | |||||||
|
| |||||||
Consumer Finance - 0.8% |
| |||||||
American Express Co. | 3,314 | 185,484 | ||||||
Capital One Financial Corp. | 1,952 | 117,452 | ||||||
Discover Financial Services | 1,730 | 70,930 | ||||||
SLM Corp. | 1,576 | 27,706 | ||||||
|
| |||||||
Total Consumer Finance | 401,572 | |||||||
|
| |||||||
Containers & Packaging - 0.1% |
| |||||||
Ball Corp. | 520 | 22,272 | ||||||
Bemis Co., Inc. | 347 | 11,468 | ||||||
Owens-Illinois, Inc.* | 555 | 10,817 | ||||||
Sealed Air Corp. | 588 | 9,537 | ||||||
|
| |||||||
Total Containers & Packaging | 54,094 | |||||||
|
| |||||||
| SHARES | VALUE | |||||||
Distributors - 0.1% |
| |||||||
Genuine Parts Co. | 521 | $ | 32,604 | |||||
|
| |||||||
Total Distributors | 32,604 | |||||||
|
| |||||||
Diversified Consumer Services - 0.0%a |
| |||||||
Apollo Group, Inc. — Class A* | 339 | 6,807 | ||||||
H&R Block, Inc. | 911 | 16,125 | ||||||
|
| |||||||
Total Diversified Consumer Services | 22,932 | |||||||
|
| |||||||
Diversified Financial Services - 2.8% |
| |||||||
Bank of America Corp. | 36,213 | 337,505 | ||||||
Citigroup, Inc. | 9,854 | 368,441 | ||||||
CME Group, Inc. | 1,027 | 57,440 | ||||||
IntercontinentalExchange, Inc.* | 244 | 31,964 | ||||||
JPMorgan Chase & Co. | 12,766 | 532,087 | ||||||
Leucadia National Corp. | 666 | 15,118 | ||||||
Moody’s Corp. | 649 | 31,256 | ||||||
NASDAQ OMX Group, Inc.(The) | 398 | 9,476 | ||||||
NYSE Euronext | 826 | 20,452 | ||||||
|
| |||||||
Total Diversified Financial Services | 1,403,739 | |||||||
|
| |||||||
Diversified Telecommunication Services - 2.4% |
| |||||||
AT&T, Inc. | 19,385 | 670,527 | ||||||
CenturyLink, Inc. | 2,091 | 80,253 | ||||||
Frontier Communications Corp.b | 3,355 | 15,836 | ||||||
Verizon Communications, Inc. | 9,574 | 427,383 | ||||||
Windstream Corp.b | 1,976 | 18,851 | ||||||
|
| |||||||
Total Diversified Telecommunication Services | 1,212,850 | |||||||
|
| |||||||
Electric Utilities - 1.8% |
| |||||||
American Electric Power Co., Inc. | 1,630 | 72,437 | ||||||
Duke Energy Corp. | 2,367 | 155,488 | ||||||
Edison International | 1,095 | 51,399 | ||||||
Entergy Corp. | 596 | 43,258 | ||||||
Exelon Corp. | 2,869 | 102,653 | ||||||
FirstEnergy Corp. | 1,406 | 64,282 | ||||||
NextEra Energy, Inc. | 1,420 | 99,485 | ||||||
Northeast Utilities | 1,055 | 41,461 | ||||||
Pepco Holdings, Inc. | 769 | 15,280 | ||||||
Pinnacle West Capital Corp. | 368 | 19,493 | ||||||
PPL Corp. | 1,951 | 57,711 | ||||||
Southern Co.(The) | 2,938 | 137,616 | ||||||
Xcel Energy, Inc. | 1,639 | 46,302 | ||||||
|
| |||||||
Total Electric Utilities | 906,865 | |||||||
|
| |||||||
Electrical Equipment - 0.4% |
| |||||||
Cooper Industries PLC | 538 | 40,318 | ||||||
Emerson Electric Co. | 2,444 | 118,363 | ||||||
Rockwell Automation, Inc. | 475 | 33,753 | ||||||
Roper Industries, Inc. | 329 | 35,917 | ||||||
|
| |||||||
Total Electrical Equipment | 228,351 | |||||||
|
| |||||||
Electronic Equipment, Instruments & Components - 0.3% |
| |||||||
Amphenol Corp. — Class A | 541 | 32,530 | ||||||
Corning, Inc. | 5,004 | 58,797 | ||||||
FLIR Systems, Inc. | 507 | 9,851 | ||||||
Jabil Circuit, Inc. | 629 | 10,907 | ||||||
| 10 | GUGGENHEIM ETFS ANNUAL REPORT | See Notes to Financial Statements. |
Table of Contents
| SCHEDULE OF INVESTMENTS (continued) | October 31, 2012 |
GUGGENHEIM 2x S&P 500® ETF
| SHARES | VALUE | |||||||
Molex, Inc. | 463 | $ | 12,024 | |||||
TE Connectivity Ltd. | 1,437 | 46,243 | ||||||
|
| |||||||
Total Electronic Equipment, Instruments & Components | 170,352 | |||||||
|
| |||||||
Energy Equipment & Services - 1.6% |
| |||||||
Baker Hughes, Inc. | 1,476 | 61,948 | ||||||
Cameron International Corp.* | 827 | 41,879 | ||||||
Diamond Offshore Drilling, Inc. | 235 | 16,271 | ||||||
Ensco PLC — Class A | 780 | 45,100 | ||||||
FMC Technologies, Inc.* | 802 | 32,802 | ||||||
Halliburton Co. | 3,119 | 100,712 | ||||||
Helmerich & Payne, Inc. | 357 | 17,065 | ||||||
Nabors Industries Ltd.* | 977 | 13,180 | ||||||
National Oilwell Varco, Inc. | 1,431 | 105,465 | ||||||
Noble Corp. | 849 | 32,041 | ||||||
Rowan Cos., PLC — Class A* | 417 | 13,223 | ||||||
Schlumberger Ltd. | 4,459 | 310,034 | ||||||
|
| |||||||
Total Energy Equipment & Services | 789,720 | |||||||
|
| |||||||
Food & Staples Retailing - 2.1% |
| |||||||
Costco Wholesale Corp. | 1,453 | 143,019 | ||||||
CVS Caremark Corp. | 4,277 | 198,453 | ||||||
Kroger Co.(The) | 1,830 | 46,152 | ||||||
Safeway, Inc.b | 804 | 13,113 | ||||||
Sysco Corp. | 1,970 | 61,208 | ||||||
Wal-Mart Stores, Inc. | 5,648 | 423,713 | ||||||
Walgreen Co. | 2,879 | 101,427 | ||||||
Whole Foods Market, Inc. | 578 | 54,754 | ||||||
|
| |||||||
Total Food & Staples Retailing | 1,041,839 | |||||||
|
| |||||||
Food Products - 1.5% |
| |||||||
Archer-Daniels-Midland Co. | 2,214 | 59,424 | ||||||
Campbell Soup Co. | 606 | 21,374 | ||||||
ConAgra Foods, Inc. | 1,365 | 38,002 | ||||||
Dean Foods Co.* | 621 | 10,458 | ||||||
General Mills, Inc. | 2,178 | 87,294 | ||||||
H.J. Heinz Co. | 1,076 | 61,881 | ||||||
Hershey Co.(The) | 509 | 35,045 | ||||||
Hormel Foods Corp. | 451 | 13,318 | ||||||
J.M. Smucker Co.(The) | 368 | 31,515 | ||||||
Kellogg Co. | 830 | 43,425 | ||||||
Kraft Foods Group, Inc.* | 1,988 | 90,414 | ||||||
McCormick & Co., Inc. | 445 | 27,421 | ||||||
Mead Johnson Nutrition Co. | 685 | 42,237 | ||||||
Mondelez International, Inc. — Class A | 5,963 | 158,258 | ||||||
Tyson Foods, Inc. — Class A | 973 | 16,356 | ||||||
|
| |||||||
Total Food Products | 736,422 | |||||||
|
| |||||||
Gas Utilities - 0.1% |
| |||||||
AGL Resources, Inc. | 396 | 16,169 | ||||||
Oneok, Inc. | 690 | 32,637 | ||||||
|
| |||||||
Total Gas Utilities | 48,806 | |||||||
|
| |||||||
Health Care Equipment & Supplies - 1.5% |
| |||||||
Baxter International, Inc. | 1,838 | 115,114 | ||||||
Becton, Dickinson and Co. | 670 | 50,706 | ||||||
| SHARES | VALUE | |||||||
Boston Scientific Corp.* | 4,768 | $ | 24,508 | |||||
C.R. Bard, Inc. | 261 | 25,106 | ||||||
CareFusion Corp.* | 745 | 19,787 | ||||||
Covidien PLC | 1,615 | 88,744 | ||||||
DENTSPLY International, Inc. | 478 | 17,610 | ||||||
Edwards Lifesciences Corp.* | 389 | 33,777 | ||||||
Intuitive Surgical, Inc.* | 132 | 71,573 | ||||||
Medtronic, Inc. | 3,428 | 142,536 | ||||||
St Jude Medical, Inc. | 1,055 | 40,364 | ||||||
Stryker Corp. | 972 | 51,127 | ||||||
Varian Medical Systems, Inc.* | 373 | 24,901 | ||||||
Zimmer Holdings, Inc. | 588 | 37,755 | ||||||
|
| |||||||
Total Health Care Equipment & Supplies | 743,608 | |||||||
|
| |||||||
Health Care Providers & Services - 1.7% |
| |||||||
Aetna, Inc. | 1,125 | 49,163 | ||||||
AmerisourceBergen Corp. | 845 | 33,327 | ||||||
Cardinal Health, Inc. | 1,146 | 47,135 | ||||||
CIGNA Corp. | 968 | 49,368 | ||||||
Coventry Health Care, Inc. | 450 | 19,638 | ||||||
DaVita, Inc.* | 286 | 32,181 | ||||||
Express Scripts Holding Co.* | 2,725 | 167,696 | ||||||
Humana, Inc. | 544 | 40,403 | ||||||
Laboratory Corp. of America Holdings* | 321 | 27,198 | ||||||
McKesson Corp. | 794 | 74,088 | ||||||
Patterson Cos., Inc. | 285 | 9,519 | ||||||
Quest Diagnostics, Inc. | 534 | 30,822 | ||||||
Tenet Healthcare Corp.* | 350 | 8,260 | ||||||
UnitedHealth Group, Inc. | 3,471 | 194,376 | ||||||
WellPoint, Inc. | 1,092 | 66,918 | ||||||
|
| |||||||
Total Health Care Providers & Services | 850,092 | |||||||
|
| |||||||
Health Care Technology - 0.1% |
| |||||||
Cerner Corp.* | 489 | 37,257 | ||||||
|
| |||||||
Total Health Care Technology | 37,257 | |||||||
|
| |||||||
Hotels, Restaurants & Leisure - 1.5% |
| |||||||
Carnival Corp. | 1,502 | 56,896 | ||||||
Chipotle Mexican Grill, Inc.* | 107 | 27,235 | ||||||
Darden Restaurants, Inc. | 431 | 22,679 | ||||||
International Game Technology | 897 | 11,517 | ||||||
Marriott International, Inc. — Class A | 845 | 30,825 | ||||||
McDonald’s Corp. | 3,389 | 294,165 | ||||||
Starbucks Corp. | 2,553 | 117,183 | ||||||
Starwood Hotels & Resorts Worldwide, Inc. | 661 | 34,273 | ||||||
Wyndham Worldwide Corp. | 477 | 24,041 | ||||||
Wynn Resorts Ltd. | 267 | 32,323 | ||||||
Yum! Brands, Inc. | 1,533 | 107,479 | ||||||
|
| |||||||
Total Hotels, Restaurants & Leisure | 758,616 | |||||||
|
| |||||||
Household Durables - 0.2% |
| |||||||
DR Horton, Inc. | 934 | 19,577 | ||||||
Harman International Industries, Inc. | 226 | 9,476 | ||||||
Leggett & Platt, Inc. | 473 | 12,549 | ||||||
Lennar Corp. — Class A | 546 | 20,458 | ||||||
Newell Rubbermaid, Inc. | 970 | 20,021 | ||||||
| See Notes to Financial Statements. | GUGGENHEIM ETFS ANNUAL REPORT | 11 |
Table of Contents
| SCHEDULE OF INVESTMENTS (continued) | October 31, 2012 |
GUGGENHEIM 2x S&P 500® ETF
| SHARES | VALUE | |||||||
PulteGroup, Inc.* | 1,135 | $ | 19,681 | |||||
Whirlpool Corp. | 260 | 25,397 | ||||||
|
| |||||||
Total Household Durables | 127,159 | |||||||
|
| |||||||
Household Products - 1.9% |
| |||||||
Clorox Co.(The) | 437 | 31,595 | ||||||
Colgate-Palmolive Co. | 1,497 | 157,125 | ||||||
Kimberly-Clark Corp. | 1,328 | 110,822 | ||||||
Procter & Gamble Co.(The) | 9,254 | 640,747 | ||||||
|
| |||||||
Total Household Products | 940,289 | |||||||
|
| |||||||
Independent Power Producers & Energy Traders - 0.1% |
| |||||||
AES Corp.(The) | 2,086 | 21,799 | ||||||
NRG Energy, Inc. | 765 | 16,493 | ||||||
|
| |||||||
Total Independent Power Producers & Energy Traders | 38,292 | |||||||
|
| |||||||
Industrial Conglomerates - 2.1% |
| |||||||
3M Co. | 2,137 | 187,201 | ||||||
Danaher Corp. | 1,962 | 101,494 | ||||||
General Electric Co. | 35,481 | 747,230 | ||||||
Tyco International Ltd. | 1,545 | 41,514 | ||||||
|
| |||||||
Total Industrial Conglomerates | 1,077,439 | |||||||
|
| |||||||
Insurance - 3.3% |
| |||||||
ACE Ltd. | 1,140 | 89,661 | ||||||
AFLAC, Inc. | 1,575 | 78,404 | ||||||
Allstate Corp.(The) | 1,630 | 65,167 | ||||||
American International Group, Inc.* | 3,919 | 136,891 | ||||||
Aon PLC | 1,083 | 58,428 | ||||||
Assurant, Inc. | 274 | 10,360 | ||||||
Berkshire Hathaway, Inc. — Class B* | 6,163 | 532,175 | ||||||
Chubb Corp.(The) | 894 | 68,820 | ||||||
Cincinnati Financial Corp. | 492 | 19,601 | ||||||
Genworth Financial, Inc. — Class A* | 1,653 | 9,852 | ||||||
Hartford Financial Services Group, Inc. | 1,465 | 31,805 | ||||||
Lincoln National Corp. | 937 | 23,228 | ||||||
Loews Corp. | 1,049 | 44,352 | ||||||
Marsh & McLennan Cos., Inc. | 1,828 | 62,207 | ||||||
MetLife, Inc. | 3,569 | 126,664 | ||||||
Principal Financial Group, Inc. | 932 | 25,667 | ||||||
Progressive Corp.(The) | 1,883 | 41,991 | ||||||
Prudential Financial, Inc. | 1,566 | 89,340 | ||||||
Torchmark Corp. | 319 | 16,138 | ||||||
Travelers Cos., Inc.(The) | 1,294 | 91,796 | ||||||
Unum Group | 941 | 19,084 | ||||||
XL Group PLC | 1,026 | 25,383 | ||||||
|
| |||||||
Total Insurance | 1,667,014 | |||||||
|
| |||||||
Internet & Catalog Retail - 0.8% |
| |||||||
Amazon.com, Inc.* | 1,215 | 282,876 | ||||||
Expedia, Inc. | 316 | 18,692 | ||||||
Netflix, Inc.* | 187 | 14,790 | ||||||
priceline.com, Inc.* | 168 | 96,393 | ||||||
TripAdvisor, Inc.* | 368 | 11,147 | ||||||
|
| |||||||
Total Internet & Catalog Retail | 423,898 | |||||||
|
| |||||||
| SHARES | VALUE | |||||||
Internet Software & Services - 1.8% |
| |||||||
Akamai Technologies, Inc.* | 596 | $ | 22,642 | |||||
eBay, Inc.* | 3,897 | 188,186 | ||||||
Google, Inc. — Class A* | 890 | 604,995 | ||||||
VeriSign, Inc.* | 526 | 19,499 | ||||||
Yahoo!, Inc.* | 3,504 | 58,902 | ||||||
|
| |||||||
Total Internet Software & Services | 894,224 | |||||||
|
| |||||||
IT Services - 3.2% |
| |||||||
Accenture PLC — Class A | 2,134 | 143,853 | ||||||
Automatic Data Processing, Inc. | 1,628 | 94,082 | ||||||
Cognizant Technology Solutions Corp. — Class A* | 1,003 | 66,850 | ||||||
Computer Sciences Corp. | 522 | 15,895 | ||||||
Fidelity National Information Services, Inc. | 842 | 27,676 | ||||||
Fiserv, Inc.* | 457 | 34,248 | ||||||
International Business Machines Corp. | 3,609 | 702,059 | ||||||
Mastercard, Inc. — Class A | 361 | 166,396 | ||||||
Paychex, Inc. | 1,085 | 35,186 | ||||||
SAIC, Inc. | 954 | 10,484 | ||||||
Teradata Corp.* | 567 | 38,732 | ||||||
Total System Services, Inc. | 544 | 12,235 | ||||||
Visa, Inc. — Class A | 1,758 | 243,940 | ||||||
Western Union Co.(The) | 2,024 | 25,705 | ||||||
|
| |||||||
Total IT Services | 1,617,341 | |||||||
|
| |||||||
Leisure Equipment & Products - 0.1% |
| |||||||
Hasbro, Inc. | 390 | 14,036 | ||||||
Mattel, Inc. | 1,146 | 42,150 | ||||||
|
| |||||||
Total Leisure Equipment & Products | 56,186 | |||||||
|
| |||||||
Life Sciences Tools & Services - 0.4% |
| |||||||
Agilent Technologies, Inc. | 1,170 | 42,108 | ||||||
Life Technologies Corp.* | 588 | 28,759 | ||||||
PerkinElmer, Inc. | 382 | 11,815 | ||||||
Thermo Fisher Scientific, Inc. | 1,228 | 74,982 | ||||||
Waters Corp.* | 294 | 24,052 | ||||||
|
| |||||||
Total Life Sciences Tools & Services | 181,716 | |||||||
|
| |||||||
Machinery - 1.7% |
| |||||||
Caterpillar, Inc. | 2,194 | 186,073 | ||||||
Cummins, Inc. | 595 | 55,680 | ||||||
Deere & Co. | 1,315 | 112,354 | ||||||
Dover Corp. | 614 | 35,747 | ||||||
Eaton Corp. | 1,134 | 53,547 | ||||||
Flowserve Corp. | 173 | 23,440 | ||||||
Illinois Tool Works, Inc. | 1,451 | 88,990 | ||||||
Ingersoll-Rand PLC | 964 | 45,337 | ||||||
Joy Global, Inc. | 355 | 22,170 | ||||||
PACCAR, Inc. | 1,188 | 51,488 | ||||||
Pall Corp. | 391 | 24,617 | ||||||
Parker Hannifin Corp. | 502 | 39,487 | ||||||
Pentair Ltd. | 704 | 29,737 | ||||||
Snap-on, Inc. | 196 | 15,157 | ||||||
Stanley Black & Decker, Inc. | 565 | 39,155 | ||||||
| 12 | GUGGENHEIM ETFS ANNUAL REPORT | See Notes to Financial Statements. |
Table of Contents
| SCHEDULE OF INVESTMENTS (continued) | October 31, 2012 |
GUGGENHEIM 2x S&P 500® ETF
| SHARES | VALUE | |||||||
Xylem, Inc. | 624 | $ | 15,138 | |||||
|
| |||||||
Total Machinery | 838,117 | |||||||
|
| |||||||
Media - 3.0% |
| |||||||
Cablevision Systems Corp. — Class A | 725 | 12,629 | ||||||
CBS Corp. — Class B | 2,001 | 64,832 | ||||||
Comcast Corp. — Class A | 8,991 | 337,252 | ||||||
DIRECTV* | 2,110 | 107,842 | ||||||
Discovery Communications, Inc. — Class A* | 831 | 49,046 | ||||||
Gannett Co., Inc. | 778 | 13,148 | ||||||
Interpublic Group of Cos., Inc.(The) | 1,470 | 14,847 | ||||||
McGraw-Hill Cos., Inc.(The) | 942 | 52,074 | ||||||
News Corp. — Class A | 6,841 | 163,637 | ||||||
Omnicom Group, Inc. | 893 | 42,784 | ||||||
Scripps Networks Interactive, Inc. —Class A | 291 | 17,670 | ||||||
Time Warner Cable, Inc. | 1,029 | 101,984 | ||||||
Time Warner, Inc. | 3,188 | 138,519 | ||||||
Viacom, Inc. — Class B | 1,592 | 81,622 | ||||||
Walt Disney Co.(The) | 6,028 | 295,794 | ||||||
Washington Post Co.(The) — Class B | 14 | 4,669 | ||||||
|
| |||||||
Total Media | 1,498,349 | |||||||
|
| |||||||
Metals & Mining - 0.6% |
| |||||||
Alcoa, Inc. | 3,586 | 30,732 | ||||||
Allegheny Technologies, Inc. | 361 | 9,512 | ||||||
Cliffs Natural Resources, Inc. | 478 | 17,337 | ||||||
Freeport-McMoRan Copper & Gold, Inc. | 3,189 | 123,988 | ||||||
Newmont Mining Corp. | 1,667 | 90,935 | ||||||
Nucor Corp. | 1,065 | 42,739 | ||||||
Titanium Metals Corp. | 247 | 2,892 | ||||||
United States Steel Corp. | 484 | 9,869 | ||||||
|
| |||||||
Total Metals & Mining | 328,004 | |||||||
|
| |||||||
Multi-Utilities - 1.1% |
| |||||||
Ameren Corp. | 815 | 26,797 | ||||||
CenterPoint Energy, Inc. | 1,435 | 31,097 | ||||||
CMS Energy Corp. | 890 | 21,645 | ||||||
Consolidated Edison, Inc. | 985 | 59,474 | ||||||
Dominion Resources, Inc. | 1,927 | 101,707 | ||||||
DTE Energy Co. | 578 | 35,894 | ||||||
Integrys Energy Group, Inc. | 261 | 14,104 | ||||||
NiSource, Inc. | 959 | 24,426 | ||||||
PG&E Corp. | 1,431 | 60,846 | ||||||
Public Service Enterprise Group, Inc. | 1,700 | 54,468 | ||||||
SCANA Corp. | 441 | 21,644 | ||||||
Sempra Energy | 755 | 52,661 | ||||||
TECO Energy, Inc. | 684 | 12,223 | ||||||
Wisconsin Energy Corp. | 774 | 29,776 | ||||||
|
| |||||||
Total Multi-Utilities | 546,762 | |||||||
|
| |||||||
Multiline Retail - 0.6% |
| |||||||
Big Lots, Inc.* | 199 | 5,797 | ||||||
Dollar Tree, Inc.* | 773 | 30,819 | ||||||
Family Dollar Stores, Inc. | 326 | 21,503 | ||||||
| SHARES | VALUE | |||||||
J.C. Penney Co., Inc. | 478 | $ | 11,477 | |||||
Kohl’s Corp. | 725 | 38,628 | ||||||
Macy’s, Inc. | 1,351 | 51,432 | ||||||
Nordstrom, Inc. | 514 | 29,180 | ||||||
Target Corp. | 2,201 | 140,314 | ||||||
|
| |||||||
Total Multiline Retail | 329,150 | |||||||
|
| |||||||
Office Electronics - 0.1% |
| |||||||
Xerox Corp. | 4,393 | 28,291 | ||||||
|
| |||||||
Total Office Electronics | 28,291 | |||||||
|
| |||||||
Oil, Gas & Consumable Fuels - 7.9% |
| |||||||
Anadarko Petroleum Corp. | 1,679 | 115,532 | ||||||
Apache Corp. | 1,314 | 108,734 | ||||||
Cabot Oil & Gas Corp. | 706 | 33,168 | ||||||
Chesapeake Energy Corp. | 1,743 | 35,313 | ||||||
Chevron Corp. | 6,592 | 726,504 | ||||||
ConocoPhillips | 4,081 | 236,086 | ||||||
CONSOL Energy, Inc. | 764 | 26,862 | ||||||
Denbury Resources, Inc.* | 1,313 | 20,128 | ||||||
Devon Energy Corp. | 1,265 | 73,636 | ||||||
EOG Resources, Inc. | 907 | 105,656 | ||||||
EQT Corp. | 503 | 30,497 | ||||||
Exxon Mobil Corp. | 15,509 | 1,413,956 | ||||||
Hess Corp. | 1,000 | 52,260 | ||||||
Kinder Morgan, Inc. | 2,126 | 73,793 | ||||||
Marathon Oil Corp. | 2,368 | 71,182 | ||||||
Marathon Petroleum Corp. | 1,137 | 62,455 | ||||||
Murphy Oil Corp. | 619 | 37,140 | ||||||
Newfield Exploration Co.* | 454 | 12,313 | ||||||
Noble Energy, Inc. | 598 | 56,816 | ||||||
Occidental Petroleum Corp. | 2,722 | 214,929 | ||||||
Peabody Energy Corp. | 902 | 25,166 | ||||||
Phillips 66 | 2,106 | 99,319 | ||||||
Pioneer Natural Resources Co. | 414 | 43,739 | ||||||
QEP Resources, Inc. | 598 | 17,342 | ||||||
Range Resources Corp. | 547 | 35,752 | ||||||
Southwestern Energy Co.* | 1,169 | 40,564 | ||||||
Spectra Energy Corp. | 2,195 | 63,370 | ||||||
Tesoro Corp. | 470 | 17,724 | ||||||
Valero Energy Corp. | 1,854 | 53,951 | ||||||
Williams Cos., Inc.(The) | 2,105 | 73,654 | ||||||
WPX Energy, Inc.* | 670 | 11,350 | ||||||
|
| |||||||
Total Oil, Gas & Consumable Fuels | 3,988,891 | |||||||
|
| |||||||
Paper & Forest Products - 0.1% |
| |||||||
International Paper Co. | 1,471 | 52,706 | ||||||
MeadWestvaco Corp. | 583 | 17,309 | ||||||
|
| |||||||
Total Paper & Forest Products | 70,015 | |||||||
|
| |||||||
Personal Products - 0.1% |
| |||||||
Avon Products, Inc. | 1,454 | 22,522 | ||||||
Estee Lauder Cos., Inc.(The) — Class A | 806 | 49,666 | ||||||
|
| |||||||
Total Personal Products | 72,188 | |||||||
|
| |||||||
| See Notes to Financial Statements. | GUGGENHEIM ETFS ANNUAL REPORT | 13 |
Table of Contents
| SCHEDULE OF INVESTMENTS (continued) | October 31, 2012 |
GUGGENHEIM 2x S&P 500® ETF
| SHARES | VALUE | |||||||
Pharmaceuticals - 5.3% |
| |||||||
Abbott Laboratories | 5,272 | $ | 345,422 | |||||
Allergan, Inc. | 1,033 | 92,887 | ||||||
Bristol-Myers Squibb Co. | 5,641 | 187,563 | ||||||
Eli Lilly & Co. | 3,432 | 166,898 | ||||||
Forest Laboratories, Inc.* | 785 | 26,462 | ||||||
Hospira, Inc.* | 555 | 17,033 | ||||||
Johnson & Johnson | 9,265 | 656,147 | ||||||
Merck & Co., Inc. | 10,233 | 466,932 | ||||||
Mylan, Inc.* | 1,365 | 34,589 | ||||||
Perrigo Co. | 295 | 33,928 | ||||||
Pfizer, Inc. | 25,098 | 624,187 | ||||||
Watson Pharmaceuticals, Inc.* | 429 | 36,873 | ||||||
|
| |||||||
Total Pharmaceuticals | 2,688,921 | |||||||
|
| |||||||
Professional Services - 0.1% |
| |||||||
Dun & Bradstreet Corp.(The) | 152 | 12,318 | ||||||
Equifax, Inc. | 402 | 20,116 | ||||||
Robert Half International, Inc. | 478 | 12,854 | ||||||
|
| |||||||
Total Professional Services | 45,288 | |||||||
|
| |||||||
Real Estate Investment Trusts (REITs) - 1.8% |
| |||||||
American Tower Corp. | 1,329 | 100,060 | ||||||
Apartment Investment & Management Co. — Class A | 489 | 13,051 | ||||||
AvalonBay Communities, Inc. | 325 | 44,057 | ||||||
Boston Properties, Inc. | 506 | 53,788 | ||||||
Equity Residential | 1,011 | 58,042 | ||||||
HCP, Inc. | 1,443 | 63,925 | ||||||
Health Care REIT, Inc. | 854 | 50,753 | ||||||
Host Hotels & Resorts, Inc. | 2,427 | 35,095 | ||||||
Kimco Realty Corp. | 1,369 | 26,723 | ||||||
Plum Creek Timber Co., Inc. | 543 | 23,838 | ||||||
ProLogis, Inc. | 1,549 | 53,115 | ||||||
Public Storage | 485 | 67,236 | ||||||
Simon Property Group, Inc. | 1,021 | 155,406 | ||||||
Ventas, Inc. | 993 | 62,827 | ||||||
Vornado Realty Trust | 567 | 45,479 | ||||||
Weyerhaeuser Co. | 1,806 | 50,008 | ||||||
|
| |||||||
Total Real Estate Investment Trusts (REITs) | 903,403 | |||||||
|
| |||||||
Real Estate Management & Development - 0.0%a |
| |||||||
CBRE Group, Inc.* | 1,015 | 18,290 | ||||||
|
| |||||||
Total Real Estate Management & Development | 18,290 | |||||||
|
| |||||||
Road & Rail - 0.7% |
| |||||||
CSX Corp. | 3,494 | 71,522 | ||||||
Norfolk Southern Corp. | 1,074 | 65,890 | ||||||
Ryder System, Inc. | 173 | 7,806 | ||||||
Union Pacific Corp. | 1,593 | 195,987 | ||||||
|
| |||||||
Total Road & Rail | 341,205 | |||||||
|
| |||||||
Semiconductors & Semiconductor Equipment - 1.7% |
| |||||||
Advanced Micro Devices, Inc.*b | 2,022 | 4,145 | ||||||
Altera Corp. | 1,075 | 32,766 | ||||||
| SHARES | VALUE | |||||||
Analog Devices, Inc. | 1,005 | $ | 39,306 | |||||
Applied Materials, Inc. | 4,157 | 44,064 | ||||||
Broadcom Corp. — Class A* | 1,728 | 54,492 | ||||||
First Solar, Inc.*b | 201 | 4,886 | ||||||
Intel Corp. | 16,810 | 363,516 | ||||||
KLA-Tencor Corp. | 559 | 26,005 | ||||||
Lam Research Corp.* | 612 | 21,665 | ||||||
Linear Technology Corp. | 773 | 24,164 | ||||||
LSI Corp.* | 1,874 | 12,837 | ||||||
Microchip Technology, Inc. | 650 | 20,377 | ||||||
Micron Technology, Inc.* | 3,420 | 18,553 | ||||||
NVIDIA Corp.* | 2,083 | 24,934 | ||||||
Teradyne, Inc.* | 630 | 9,211 | ||||||
Texas Instruments, Inc. | 3,825 | 107,444 | ||||||
Xilinx, Inc. | 881 | 28,862 | ||||||
|
| |||||||
Total Semiconductors & Semiconductor Equipment | 837,227 | |||||||
|
| |||||||
Software - 3.0% |
| |||||||
Adobe Systems, Inc.* | 1,653 | 56,202 | ||||||
Autodesk, Inc.* | 761 | 24,230 | ||||||
BMC Software, Inc.* | 493 | 20,065 | ||||||
CA, Inc. | 1,149 | 25,876 | ||||||
Citrix Systems, Inc.* | 629 | 38,879 | ||||||
Electronic Arts, Inc.* | 1,069 | 13,202 | ||||||
Intuit, Inc. | 927 | 55,082 | ||||||
Microsoft Corp. | 25,354 | 723,476 | ||||||
Oracle Corp. | 12,797 | 397,347 | ||||||
Red Hat, Inc.* | 649 | 31,911 | ||||||
Salesforce.com, Inc.* | 430 | 62,772 | ||||||
Symantec Corp.* | 2,362 | 42,965 | ||||||
|
| |||||||
Total Software | 1,492,007 | |||||||
|
| |||||||
Specialty Retail - 1.9% |
| |||||||
Abercrombie & Fitch Co. — Class A | 278 | 8,501 | ||||||
AutoNation, Inc.* | 131 | 5,816 | ||||||
AutoZone, Inc.* | 126 | 47,250 | ||||||
Bed Bath & Beyond, Inc.* | 781 | 45,048 | ||||||
Best Buy Co., Inc. | 894 | 13,598 | ||||||
CarMax, Inc.* | 767 | 25,886 | ||||||
GameStop Corp. — Class Ab | 416 | 9,497 | ||||||
Gap, Inc.(The) | 1,002 | 35,792 | ||||||
Home Depot, Inc. | 5,066 | 310,951 | ||||||
Limited Brands, Inc. | 802 | 38,408 | ||||||
Lowe’s Cos., Inc. | 3,832 | 124,080 | ||||||
O’Reilly Automotive, Inc.* | 400 | 34,272 | ||||||
PetSmart, Inc. | 362 | 24,033 | ||||||
Ross Stores, Inc. | 752 | 45,835 | ||||||
Staples, Inc. | 2,293 | 26,404 | ||||||
Tiffany & Co. | 400 | 25,288 | ||||||
TJX Cos., Inc. | 2,473 | 102,951 | ||||||
Urban Outfitters, Inc.* | 366 | 13,088 | ||||||
|
| |||||||
Total Specialty Retail | 936,698 | |||||||
|
| |||||||
Textiles, Apparel & Luxury Goods - 0.5% |
| |||||||
Coach, Inc. | 960 | 53,808 | ||||||
Fossil, Inc.* | 184 | 16,026 | ||||||
| 14 | GUGGENHEIM ETFS ANNUAL REPORT | See Notes to Financial Statements. |
Table of Contents
| SCHEDULE OF INVESTMENTS (concluded) | October 31, 2012 |
GUGGENHEIM 2x S&P 500® ETF
| SHARES | VALUE | |||||||
NIKE, Inc. — Class B | 1,235 | $ | 112,854 | |||||
Ralph Lauren Corp. | 205 | 31,507 | ||||||
V.F. Corp. | 295 | 46,162 | ||||||
|
| |||||||
Total Textiles, Apparel & Luxury Goods | 260,357 | |||||||
|
| |||||||
Thrifts & Mortgage Finance - 0.1% |
| |||||||
Hudson City Bancorp, Inc. | 1,597 | 13,551 | ||||||
People’s United Financial, Inc. | 1,181 | 14,207 | ||||||
|
| |||||||
Total Thrifts & Mortgage Finance | 27,758 | |||||||
|
| |||||||
Tobacco - 1.6% |
| |||||||
Altria Group, Inc. | 6,832 | 217,258 | ||||||
Lorillard, Inc. | 439 | 50,928 | ||||||
Philip Morris International, Inc. | 5,664 | 501,604 | ||||||
Reynolds American, Inc. | 1,103 | 45,929 | ||||||
|
| |||||||
Total Tobacco | 815,719 | |||||||
|
| |||||||
Trading Companies & Distributors - 0.2% |
| |||||||
Fastenal Co. | 905 | 40,454 | ||||||
W.W. Grainger, Inc. | 201 | 40,483 | ||||||
|
| |||||||
Total Trading Companies & Distributors | 80,937 | |||||||
|
| |||||||
Wireless Telecommunication Services - 0.3% |
| |||||||
Crown Castle International Corp.* | 985 | 65,749 | ||||||
MetroPCS Communications, Inc.* | 1,062 | 10,843 | ||||||
Sprint Nextel Corp.* | 10,083 | 55,860 | ||||||
|
| |||||||
Total Wireless Telecommunication Services | 132,452 | |||||||
|
| |||||||
Total Common Stocks |
| 42,439,908 | ||||||
|
| |||||||
FACE | ||||||||
REPURCHASE AGREEMENT - 2.3% |
| |||||||
State Street Bank & Trust Co., 0.01%, dated 10/31/12, to be repurchased at $1,163,000 on 11/01/12 collateralized by $1,185,000 FHLB at 2.90% due 09/05/25 with a value of $1,194,810c | $ | 1,163,000 | 1,163,000 | |||||
|
| |||||||
Total Repurchase Agreement |
| 1,163,000 | ||||||
|
| |||||||
| FACE AMOUNT | VALUE | |||||||
SECURITIES LENDING COLLATERAL - 0.1%e |
| |||||||
Joint Repurchase Agreements | ||||||||
Merrill Lynch, Fenner & Smith, Inc. issued 10/31/2012 at 0.28% due 11/01/12c | $ | 12,548 | $ | 12,548 | ||||
RBS Securities, Inc. issued 10/31/2012 at 0.28% due 11/01/12c | 21,335 | 21,335 | ||||||
|
| |||||||
Total Securities Lending Collateral |
| 33,883 | ||||||
|
| |||||||
Total Investments - 86.5%d |
| 43,636,791 | ||||||
|
| |||||||
Other Assets and Liabilities, net - 13.5% |
| 6,801,805 | ||||||
|
| |||||||
Net Assets - 100.0% | $ | 50,438,596 | ||||||
| CONTRACTS | UNREALIZED GAIN (LOSS) | |||||||
FUTURES CONTRACTS PURCHASED |
| |||||||
December 2012 S&P 500 Index Mini Futures Contracts (Aggregate Market Value of Contracts $14,679,638)d | 209 | $ | (291,305 | ) | ||||
UNITS | ||||||||
EQUITY INDEX SWAP AGREEMENTS PURCHASED |
| |||||||
Credit Suisse Capital, LLC November 2012 S&P 500 Index Swap, Terminating 11/30/12 (Notional Market Value $21,218,848)**c | 15,026 | $ | 3,312 | |||||
Goldman Sachs International November 2012 S&P 500 Index Swap, Terminating 11/30/12 (Notional Market Value $22,519,038 )**c | 15,947 | 3,510 | ||||||
|
| |||||||
(Total Notional Market Value $43,737,886) | $ | 6,822 | ||||||
|
| |||||||
| * | Non-Income Producing Security. |
| ** | Price return based on S&P 500 Index +/- financing at a variable rate. |
| a | Amount represents less than 0.05% of net assets. |
| b | All or a portion of this security was on loan as of October 31, 2012. |
| c | Values determined based on Level 2 inputs (Note G). |
| d | Unless otherwise indicated, the values of the Investments are determined based on Level 1 inputs. |
| e | Securities lending collateral (Note K). |
| FHLB | — Federal Home Loan Bank |
| PLC | — Public Limited Company |
| See Notes to Financial Statements. | GUGGENHEIM ETFS ANNUAL REPORT | 15 |
Table of Contents
| SCHEDULE OF INVESTMENTS | October 31, 2012 |
GUGGENHEIM INVERSE 2x S&P 500® ETF
| FACE AMOUNT | VALUE | |||||||
REPURCHASE AGREEMENT - 74.6% |
| |||||||
State Street Bank & Trust Co., 0.01%, dated 10/31/12, to be repurchased at $27,324,008 on 11/01/12 collateralized by $27,860,000 FNMA at 0.75% | $ | 27,324,000 | $ | 27,324,000 | ||||
|
| |||||||
Total Repurchase Agreement |
| 27,324,000 | ||||||
|
| |||||||
Total Investments - 74.6%b |
| 27,324,000 | ||||||
|
| |||||||
Other Assets and Liabilities, net - 25.4% |
| 9,280,493 | ||||||
|
| |||||||
Net Assets - 100.0% | $ | 36,604,493 | ||||||
| CONTRACTS | UNREALIZED GAIN (LOSS) | |||||||
FUTURES CONTRACTS SOLD SHORT |
| |||||||
December 2012 S&P 500 Index Mini Futures Contracts (Aggregate Market Value of Contracts $12,291,563)b | (175 | ) | $ | 243,460 | ||||
UNITS | ||||||||
EQUITY INDEX SWAP AGREEMENTS SOLD SHORT |
| |||||||
Credit Suisse Capital, LLC November 2012 S&P 500 Index Swap, Terminating 11/30/12 (Notional Market Value $45,582,633)*a | (32,279 | ) | $ | (7,094 | ) | |||
Goldman Sachs International November 2012 S&P 500 Index Swap, Terminating 11/30/12 (Notional Market Value $15,249,139)*a | (10,798 | ) | (2,357 | ) | ||||
|
| |||||||
(Total Notional Market Value $60,831,772) | $ | (9,451 | ) | |||||
|
| |||||||
| 16 | GUGGENHEIM ETFS ANNUAL REPORT | See Notes to Financial Statements. |
| * | Price return based on S&P 500 Index +/- financing at a variable rate. |
| a | Values determined based on Level 2 inputs (Note G). |
| b | Unless otherwise indicated, the values of the Investments are determined based on Level 1 inputs. |
| FNMA | — Federal National Mortgage Association |
Table of Contents
| STATEMENTS OF ASSETS AND LIABILITIES | October 31, 2012 |
| Guggenheim 2x S&P 500® ETF | Guggenheim Inverse 2x S&P 500® ETF | |||||||
| ASSETS: | ||||||||
Investments, at value* — including $32,623 and $— of securities loaned, respectively | $ | 42,439,908 | $ | — | ||||
Repurchase agreements, at value | 1,196,883 | 27,324,000 | ||||||
Total investments* | 43,636,791 | 27,324,000 | ||||||
Segregated cash for swaps | 6,100,972 | 8,679,862 | ||||||
Margin deposit for future contracts | 731,500 | 612,500 | ||||||
Unrealized appreciation on swaps | 6,822 | — | ||||||
Receivables: | ||||||||
Dividends and Interest | 55,419 | 8 | ||||||
Variation margin on futures contracts | — | 24,938 | ||||||
Equity index swap settlement | 4,839 | 1,009,151 | ||||||
Total assets | 50,536,343 | 37,650,459 | ||||||
| LIABILITIES: | ||||||||
Unrealized depreciation on swap agreements | — | 9,451 | ||||||
Payable upon return of securities loaned | 33,883 | — | ||||||
Payable for: | ||||||||
Variation margin on futures contracts | 29,783 | — | ||||||
Due to custodian | 415 | 1,014,462 | ||||||
Accrued management fees | 33,666 | 22,053 | ||||||
Total liabilities | 97,747 | 1,045,966 | ||||||
| NET ASSETS | $ | 50,438,596 | $ | 36,604,493 | ||||
| NETASSETSCONSISTOF: | ||||||||
Paid-in capital | $ | 45,371,790 | $ | 169,601,203 | ||||
Undistributed (distributions in excess of) net investment income | 9,397 | (237,255 | ) | |||||
Accumulated net realized gain (loss) on investments, futures and swaps | (3,104,248 | ) | (132,993,464 | ) | ||||
Net unrealized appreciation on investments, futures and swaps | 8,161,657 | 234,009 | ||||||
| NETASSETS | $ | 50,438,596 | $ | 36,604,493 | ||||
Shares outstanding (unlimited shares authorized), no par value | 1,000,002 | 1,600,000 | ||||||
Net asset value, offering price and repurchase price per share | $50.44 | $22.88 | ||||||
*Total cost of investments | $ | 35,190,651 | $ | 27,324,000 | ||||
| See Notes to Financial Statements. | GUGGENHEIM ETFS ANNUAL REPORT | 17 |
Table of Contents
| STATEMENTS OF OPERATIONS |
For the Year Ended October 31, 2012
| Guggenheim 2x S&P 500® ETF | Guggenheim Inverse 2x S&P 500® ETF | |||||||
| INVESTMENT INCOME: | ||||||||
Dividends | $ | 1,237,635 | $ | — | ||||
Interest | 311 | 3,651 | ||||||
Income from securities lending | 81 | — | ||||||
Total investment income | 1,238,027 | 3,651 | ||||||
| EXPENSES: | ||||||||
Management fee | 472,657 | 300,684 | ||||||
Trustee fees | 4,580 | 3,467 | ||||||
Total expenses | 477,237 | 304,151 | ||||||
Net investment income (loss) | 760,790 | (300,500 | ) | |||||
| NET REALIZEDAND UNREALIZED GAIN (LOSS): | ||||||||
Net realized gain (loss) on: | ||||||||
Investments | (292,990 | ) | — | |||||
In-kind redemptions | 12,968,748 | — | ||||||
Futures contracts | 4,816,938 | (3,407,968 | ) | |||||
Swap contracts | 7,783,828 | (12,473,618 | ) | |||||
Net realized gain (loss) | 25,276,524 | (15,881,586 | ) | |||||
Net change in unrealized appreciation (depreciation) on: | ||||||||
Investments | (5,574,570 | ) | — | |||||
Futures contracts | (1,747,258 | ) | 1,536,527 | |||||
Swap contracts | 537,837 | (1,279,041 | ) | |||||
Net change in unrealized appreciation (depreciation) on investments | (6,783,991 | ) | 257,486 | |||||
Net realized and unrealized gain (loss) | 18,492,533 | (15,624,100 | ) | |||||
Net increase (decrease) in net assets resulting from operations | $ | 19,253,323 | $ | (15,924,600 | ) | |||
| 18 | GUGGENHEIM ETFS ANNUAL REPORT | See Notes to Financial Statements. |
Table of Contents
| STATEMENTS OF CHANGES IN NET ASSETS |
| Guggenheim 2x S&P 500® ETF | Guggenheim Inverse 2x S&P 500® ETF | |||||||||||||||
| Year Ended October 31, 2012 | Year Ended October 31, 2011 | Year Ended October 31, 2012 | Year Ended October 31, 2011 | |||||||||||||
| INCREASE (DECREASE)IN NETASSETSFROM OPERATIONS: | ||||||||||||||||
Net investment income (loss) | $ | 760,790 | $ | 832,050 | $ | (300,500 | ) | $ | (414,624 | ) | ||||||
Net realized gain (loss) on investments | 25,276,524 | 7,271,159 | (15,881,586 | ) | (21,831,711 | ) | ||||||||||
Net change in unrealized appreciation (depreciation) on investments | (6,783,991 | ) | 1,517,229 | 257,486 | 1,679,620 | |||||||||||
Net increase (decrease) in net assets resulting from operations | 19,253,323 | 9,620,438 | (15,924,600 | ) | (20,566,715 | ) | ||||||||||
| DISTRIBUTIONSTO SHAREHOLDERSFROM: | ||||||||||||||||
Net investment income | (748,751 | ) | (849,031 | ) | — | — | ||||||||||
| SHAREHOLDER TRANSACTIONS: | ||||||||||||||||
Proceeds from shares purchased | — | 2,087,505 | 12,808,120 | 22,017,345 | ||||||||||||
Value of shares redeemed | (47,453,355 | ) | (11,417,222 | ) | (16,080,537 | ) | (29,862,599 | ) | ||||||||
Net decrease in net assets resulting from share transactions | (47,453,355 | ) | (9,329,717 | ) | (3,272,417 | ) | (7,845,254 | ) | ||||||||
Net decrease in net assets | (28,948,783 | ) | (558,310 | ) | (19,197,017 | ) | (28,411,969 | ) | ||||||||
| NETASSETS | ||||||||||||||||
Beginning of year | 79,387,379 | 79,945,689 | 55,801,510 | 84,213,479 | ||||||||||||
End of year | $ | 50,438,596 | $ | 79,387,379 | $ | 36,604,493 | $ | 55,801,510 | ||||||||
Undistributed (distributions in excess) of net investment income at end of year | $ | 9,397 | $ | 2,326 | $ | (237,255 | ) | $ | — | |||||||
| CHANGESINSHARESOUTSTANDING: | ||||||||||||||||
Shares sold | — | 50,000 | 500,000 | 600,000 | ||||||||||||
Shares redeemed | (1,000,000 | ) | (250,000 | ) | (600,000 | ) | (800,000 | ) | ||||||||
Net increase (decrease) in shares | (1,000,000 | ) | (200,000 | ) | (100,000 | ) | (200,000 | ) | ||||||||
| See Notes to Financial Statements. | GUGGENHEIM ETFS ANNUAL REPORT | 19 |
Table of Contents
GUGGENHEIM 2x S&P 500® ETF
| Year Ended October 31, 2012 | Year Ended October 31, 2011 | Year Ended October 31, 2010 | Year Ended October 31, 2009 | Year Ended October 31, 2008* | ||||||||||||||||
Per Share Data: |
| |||||||||||||||||||
Net asset value, beginning of year | $39.69 | $36.34 | $28.22 | $27.65 | $75.00 | |||||||||||||||
Income from investment operations: | ||||||||||||||||||||
Net investment income** | 0.51 | 0.41 | 0.33 | 0.31 | 0.61 | |||||||||||||||
Net gain (loss) on investments (realized and unrealized) | 10.74 | 3.36 | 8.13 | 0.57 | (47.27 | ) | ||||||||||||||
|
|
|
|
|
|
|
|
|
| |||||||||||
Total from investment operations | 11.25 | 3.77 | 8.46 | 0.88 | (46.66 | ) | ||||||||||||||
Less distributions from: | ||||||||||||||||||||
Net investment income | (0.50 | ) | (0.42 | ) | (0.34 | ) | (0.31 | ) | (0.69 | ) | ||||||||||
Net asset value, end of year | $50.44 | $39.69 | $36.34 | $28.22 | $27.65 | |||||||||||||||
|
|
|
|
|
|
|
|
|
| |||||||||||
Total Return*** | 28.44% | 10.36% | 30.12% | 3.51% | (62.68% | ) | ||||||||||||||
Ratios/Supplemental Data: | ||||||||||||||||||||
Net assets, end of year (in thousands) | $50,439 | $79,387 | $79,946 | $117,126 | $113,364 | |||||||||||||||
Ratio to average net assets of: | ||||||||||||||||||||
Net investment income | 1.13% | 0.98% | 1.01% | 1.43% | 1.35% | **** | ||||||||||||||
Total expenses | 0.71% | 0.71% | 0.71% | 0.70% | 0.70% | **** | ||||||||||||||
Portfolio turnover rate† | 12% | 41% | 23% | 69% | 44% | |||||||||||||||
| * | The Fund commenced operations on November 5, 2007. |
| ** | Based on average shares outstanding. |
| *** | Total investment return is calculated assuming an initial investment made at the net asset value at the beginning of the period, reinvestment of all dividends and distribution at net asset value during the period, and redemption on the last day of the period. Transaction fees are not reflected in the calculation of total investment return. Total investment return calculated for a period of less than one year is not annualized. |
| **** | Annualized. |
| † | Portfolio turnover rate is calculated without regard to instruments having a maturity of less than one year from acquisition or derivative instruments (including swap agreements and futures contracts). |
| 20 | GUGGENHEIM ETFS ANNUAL REPORT | See Notes to Financial Statements. |
Table of Contents
GUGGENHEIM INVERSE 2x S&P 500® ETF
FINANCIAL HIGHLIGHTS (concluded)
| Year Ended October 31, 2012 | Year Ended October 31, 2011 | Year Ended October 31, 2010 | Year Ended October 31, 2009 | Year Ended October 31, 2008* | ||||||||||||||||
Per Share Data: |
| |||||||||||||||||||
Net asset value, beginning of year | $32.82 | $44.32 | $66.76 | $132.21 | $75.00 | |||||||||||||||
Income from investment operations: | ||||||||||||||||||||
Net investment income (loss)** | (0.19 | ) | (0.25 | ) | (0.35 | ) | (0.61 | ) | 1.04 | |||||||||||
Net gain (loss) on investments (realized and unrealized) | (9.75 | ) | (11.25 | ) | (22.09 | ) | (46.79 | ) | 57.20 | |||||||||||
|
|
|
|
|
|
|
|
|
| |||||||||||
Total from investment operations | (9.94 | ) | (11.50 | ) | (22.44 | ) | (47.40 | ) | 58.24 | |||||||||||
Less distributions from: | ||||||||||||||||||||
Net investment income | — | — | — | — | (1.03 | ) | ||||||||||||||
Net realized gains | — | — | — | (18.05 | ) | — | ||||||||||||||
|
|
|
|
|
|
|
|
|
| |||||||||||
Total distributions | — | — | — | (18.05 | ) | (1.03 | ) | |||||||||||||
Net asset value, end of year | $22.88 | $32.82 | $44.32 | $66.76 | $132.21 | |||||||||||||||
|
|
|
|
|
|
|
|
|
| |||||||||||
Total Return*** | (30.31% | ) | (25.94% | ) | (33.61% | ) | (41.45% | ) | 78.27% | |||||||||||
Ratios/Supplemental Data: | ||||||||||||||||||||
Net assets, end of year (in thousands) | $36,604 | $55,802 | $84,213 | $103,474 | $66,106 | |||||||||||||||
Ratio to average net assets of: | ||||||||||||||||||||
Net investment income | (0.70% | ) | (0.68% | ) | (0.65% | ) | (0.64% | ) | 1.09% | **** | ||||||||||
Total expenses | 0.71% | 0.71% | 0.71% | 0.71% | 0.71% | **** | ||||||||||||||
Portfolio turnover rate† | — | — | — | — | — | |||||||||||||||
| * | The Fund commenced operations on November 5, 2007. |
| ** | Based on average shares outstanding. |
| *** | Total investment return is calculated assuming an initial investment made at the net asset value at the beginning of the period, reinvestment of all dividends and distribution at net asset value during the period, and redemption on the last day of the period. Transaction fees are not reflected in the calculation of total investment return. Total investment return calculated for a period of less than one year is not annualized. |
| **** | Annualized. |
| † | Portfolio turnover rate is calculated without regard to instruments having a maturity of less than one year from acquisition or derivative instruments (including swap agreements and futures contracts). |
| See Notes to Financial Statements. | GUGGENHEIM ETFS ANNUAL REPORT | 21 |
Table of Contents
|
1. Organization
Rydex ETF Trust (the “Trust”) is an open-end, management investment company registered under the Investment Company Act of 1940 (the “1940 Act”). The Trust was organized as a Delaware statutory trust on November 22, 2002. As of October 31, 2012, the Trust offers twenty-six portfolios, each of which represents a separate series of beneficial interest in the Trust. The financial statements herein relate to the following Funds: Guggenheim 2x S&P 500® ETF and Guggenheim Inverse 2x S&P 500® ETF (each a “Fund”, and collectively, the “Funds”). Guggenheim 2x S&P 500® ETF and Guggenheim Inverse 2x S&P 500® ETF commenced operations on November 5, 2007.
The Funds’ investment objective is to replicate as closely as possible, before fees and expenses, the daily performance of an index representing publicly traded equity securities (the “Underlying Index”). The Funds’ investment objective is to provide investment results that match the performance of a specific benchmark, before fees and expenses, on a daily basis. For Guggenheim 2x S&P 500® ETF (a “Leveraged Fund”), the Fund’s benchmark is 200% of the daily performance of an index representing publicly traded securities (the “Underlying Index”). For Guggenheim Inverse 2x S&P 500® ETF (a “Leveraged Inverse Fund”), the Fund’s benchmark is 200% of the daily inverse (opposite) performance of its Underlying Index. The Underlying Index for Guggenheim 2x S&P 500® ETF and Guggenheim Inverse 2x S&P 500® ETF is the S&P 500 Index.
The Funds operate as index funds and are not actively managed. Adverse performance of a security in the Funds’ portfolio will ordinarily not result in the elimination of the security from the Funds’ portfolio.
The Funds issue and redeem shares on a continuous basis, at Net Asset Value per share (“NAV”), only in aggregation of 50,000 shares called a “Creation Unit”. Creation Units are issued and redeemed principally in-kind for securities included in the Underlying Index.
Guggenheim Investments (“GI”) provides advisory services and Rydex Distributors, LLC (“RDL”) acts as principal underwriter for the Trust. GI and RDL are affiliated entities.
2. Significant Accounting Policies
The following significant accounting policies are in conformity with U.S. generally accepted accounting principles (“U.S. GAAP”) and are consistently followed by the Trust. This requires management to make estimates and assumptions that affect the reported amount of assets and liabilities and disclosure of contingent assets and liabilities at the date of the financial statements and the reported amounts of revenues and expenses during the reporting period. Actual results could differ
from these estimates. All time references are based on Eastern Time.
A. Security Valuation
Equity securities listed on an exchange (New York Stock Exchange (“NYSE”) or American Stock Exchange) are valued at the last quoted sales price as of the close of business on the NYSE, usually 4:00 p.m. on the valuation date. Equity securities listed on the NASDAQ market system are valued at the NASDAQ Official Closing Price on the valuation date.
Investments for which market quotations are not readily available are fair valued as determined in good faith by GI under the direction of the Board of Trustees using methods established or ratified by the Board of Trustees. These methods include, but are not limited to: (i) using general information as to how these securities and assets trade; (ii) in connection with futures contracts and options thereupon, and other derivative investments, information as to how (a) these contracts and other derivative investments trade in the futures or other derivative markets, respectively, and (b) the securities underlying these contracts and other derivative investments trade in the cash market; and (iii) other information and considerations, including current values in related markets.
The value of futures contracts purchased and sold by the Funds are accounted for using the unrealized gain or loss on the contracts that is determined by marking the contracts to their current realized settlement prices. Financial futures contracts are valued at the 4:00 p.m. price on the valuation date. In the event that the exchange for a specific futures contract closes earlier than 4:00 p.m., the futures contract is valued at the Official Settlement Price of the exchange. However, the underlying securities from which the futures contract value is derived are monitored until 4:00 p.m. to determine if fair valuation would provide a more accurate valuation.
The value of swap agreements entered into by a Fund is accounted for using the unrealized gain or loss on the agreements that is determined by marking the agreements to the last quoted value of the index that the swap pertains to at the close of the NYSE. The swap’s market value is then adjusted to include dividends accrued, financing charges and/or interest associated with the swap agreements.
Debt securities with a maturity of greater than 60 days at acquisition are valued at prices that reflect broker/dealer supplied valuations or are obtained from independent pricing services, which may consider the trade activity, treasury yields, yield or price of bonds of comparable quality, coupon, maturity, and type, as well as prices quoted by dealers who make markets in such securities. Short-term debt securities with a maturity of 60 days or less at acquisition and repurchase agreements are valued at amortized cost, which approximates market value.
| 22 | GUGGENHEIM ETFS ANNUAL REPORT |
Table of Contents
NOTES TO FINANCIAL STATEMENTS (continued)
|
B. Security Transactions and Income Recognition
Security transactions are recorded on the trade date for financial reporting purposes. Realized gains and losses from securities transactions are recorded using the identified cost basis. Proceeds from lawsuits related to investment holdings are recorded as realized gains in the respective fund. Dividend income is recorded on the ex-dividend date, net of applicable taxes withheld by foreign countries. Taxable non-cash dividends are recorded as dividend income. Interest income, including amortization of premiums and accretion of discounts, is accrued on a daily basis. Distributions received from investments in REITs are recorded as dividend income on the ex-dividend date, subject to reclassification upon notice of the character of such distribution by the issuer.
C. Repurchase Agreements
The Funds may enter into repurchase agreements with financial institutions. In a repurchase agreement, a Fund buys a security and the seller simultaneously agrees to repurchase the security on a specified future date at an agreed-upon price. The repurchase price reflects an agreed-upon interest rate during the time the Fund’s money is invested in the security. Because the security constitutes collateral for the repurchase obligation, a repurchase agreement can be considered a collateralized loan. The Funds follow certain procedures designed to minimize the risks inherent in such agreements. These procedures include effecting repurchase transactions only with large, well-capitalized and well-established financial institutions whose condition will be continually monitored by GI. In addition, the value of the collateral underlying the repurchase agreement will always be at least equal to the repurchase price, including any accrued interest earned on the repurchase agreement. In the event of a default or bankruptcy by a selling financial institution, the Funds will seek to liquidate such collateral. However, the exercising of the Funds right to liquidate such collateral could involve certain costs or delays and, to the extent that proceeds from any sale upon a default of the obligation to repurchase were less than the repurchase price, the Funds could suffer a loss. It is the current policy of the Funds not to invest in repurchase agreements that do not mature within seven days if any such investment, together with any other illiquid assets held by the Funds, amounts to more than 15% of a Funds net assets. The investments of the Funds in repurchase agreements, at times, may be substantial when, in the view of GI, liquidity or other considerations so warrant.
D. Futures Contracts
Upon entering into a contract, deposits and maintains as collateral an initial margin as required by the exchange on which the transaction is effected. Pursuant to the contract, the Fund agrees to receive from or pay to the broker an amount of cash equal to the daily fluctuation in value of the contract. Such receipts or payments are known as variation margin and are
recorded by the Fund as unrealized gains or losses. When the contract is closed, the Fund records a realized gain or loss equal to the difference between the value of the contract at the time it was opened and the value at the time it was closed.
E. Swap Agreements
The swap agreements are marked-to-market daily and the change, if any, is recorded as unrealized gain or loss. Payments received or made as a result of an agreement or termination of the agreement are recognized as realized gains or losses.
F. Federal Income Taxes
The Funds intend to comply with the provisions of Subchapter M of the Internal Revenue Code applicable to regulated investment companies and will distribute substantially all taxable net investment income and capital gains sufficient to relieve the funds from all, or substantially all, federal income, excise and state income taxes. Therefore, no provision for Federal or state income tax is required.
Tax positions taken or expected to be taken in the course of preparing the Funds’ tax returns are evaluated to determine whether the tax positions are “more-likely-than-not” of being sustained by the applicable tax authority. Tax positions not deemed to meet the more-likely-than-not threshold would be recorded as a tax benefit or expense in the current year. Management has analyzed the Funds’ tax positions taken on Federal income tax returns for all open tax years (fiscal years 2009-2012), and has concluded that no provision for income tax was required in the Funds’ financial statements.
Income and capital gain distributions are determined in accordance with Federal income tax regulations, which may differ from U.S. GAAP. These differences are primarily due to differing treatments for in-kind redemptions, mark-to-market on futures contracts, income reclassifications from REITs and losses deferred due to wash sales.
The RIC Modernization Act of 2010 was signed into law on December 22, 2010 and sought to simplify some of the tax provisions applicable to regulated investment companies and the tax reporting to their shareholders, and to improve the tax efficiency of certain fund structures. The changes were generally effective for taxable years beginning after the date of enactment.
One of the more prominent changes addresses capital loss carryforwards. Funds are permitted to carry forward capital losses incurred in taxable years beginning after December 22, 2010 for an unlimited period. However, any losses incurred during those future taxable years will be required to be utilized prior to the losses incurred in pre-enactment taxable years. Under pre-enactment law, capital losses could be carried forward for eight years, and carried forward as short-term capital, irrespective of the character of the original loss. As a result of this ordering rule, pre-enactment capital loss
| GUGGENHEIM ETFS ANNUAL REPORT | 23 |
Table of Contents
| NOTES TO FINANCIAL STATEMENTS (continued) |
carryforwards may potentially expire unused. Additionally, post-enactment capital losses that are carried forward will retain their character as either short-term or long-term capital losses rather than being considered all short-term as under previous law.
In order to present paid-in-capital, undistributed net investment income (loss) and accumulated net realized gain (loss) on investments on the statement of assets and liabilities that more closely represent their tax character, certain adjustments have been made to these accounts. These adjustments have no effect on net assets or NAV. The most significant of these adjustments are for net capital gains resulting from in-kind redemptions, because they are non-taxable to the Funds, and therefore are not distributed to existing Fund shareholders, or net capital losses resulting from in-kind redemptions, which are classified to paid-in-capital. For the year ended October 31, 2012, the adjustments for the Funds were as follows:
| Paid-In Capital | Undistributed Net Investment Income (Loss) | Accumulated Net Realized Gain (Loss) | ||||||||||
Guggenheim 2x S&P 500® ETF | $ | 18,666,056 | $ | (4,968) | $ | (18,661,088) | ||||||
Guggenheim Inverse 2x S&P 500® ETF | (63,245) | 63,245 | — | |||||||||
Tax basis capital losses in excess of capital gains are carried forward to offset future net capital gains. For the year ended October 31, 2012, the following capital loss carryforward amounts expired or were used to offset current year net realized capital gains:
Guggenheim 2x S&P 500® ETF | $ | 249,795 | ||
Guggenheim Inverse 2x S&P 500® ETF | — |
The tax character of distributable earnings (accumulated losses) at October 31, 2012 was as follows:
| Late Year Ordinary Loss Deferral | Undistributed Ordinary Income | Undistributed Long Term Capital Gain | Capital Loss Carryfoward | Unrealized Appreciation (Depreciation) | ||||||||||||||||
Guggenheim 2x S&P 500® ETF | $ | — | $ | 9,397 | $ | — | $ | — | $ | 5,057,409 | ||||||||||
Guggenheim Inverse 2x S&P 500® ETF | (237,255) | — | — | (132,767,941) | 8,486 | |||||||||||||||
A summary of the expiration of the capital loss carryforward is as follows:
| 2017 | 2018 | 2019 | Unlimited | ||||||||||||||||
| Short Term | Long Term | |||||||||||||||||||
Guggenheim 2x S&P 500® ETF | $ | — | $ | — | $ | — | $ | — | $ | — | ||||||||||
Guggenheim Inverse 2x S&P 500® ETF | 57,618,386 | 39,488,221 | 21,311,018 | 13,224,297 | 1,126,019 | |||||||||||||||
The tax character of distributions paid during the year ended October 31, 2012 was as follows:
| Ordinary Income | ||||
Guggenheim 2x S&P 500® ETF | $ | 748,751 | ||
Guggenheim Inverse 2x S&P 500® ETF | — | |||
The tax character of distributions paid during the year ended October 31, 2011 was as follows:
| Ordinary Income | ||||
Guggenheim 2x S&P 500® ETF | $ | 849,031 | ||
Guggenheim Inverse 2x S&P 500® ETF | — | |||
At October 31, 2012, the identified cost of investments in securities owned by each Fund for Federal income tax purposes and the gross unrealized appreciation and depreciation were as follows:
| Identified Cost | Gross Unrealized Appreciation | Gross Unrealized Depreciation | Net Unrealized Appreciation (Depreciation) | |||||||||||||
Guggenheim 2x S&P 500® ETF | $ | 38,530,902 | $ | 5,976,737 | $ | (904,731 | ) | $ | 5,072,006 | |||||||
Guggenheim Inverse 2x S&P 500® ETF | 27,324,000 | — | (9,451 | ) | (9,451 | ) | ||||||||||
G. Fair Value Measurement
In accordance with U.S. GAAP, fair value is defined as the price that the Fund would receive to sell an investment or pay to transfer a liability in an orderly transaction with an independent buyer in the principal market, or, in the absence of a principal market, the most advantageous market for the investment or liability. A three-tier hierarchy is utilized to distinguish between (1) inputs that reflect the assumptions market participants would use in pricing an asset or liability developed based on market data obtained from sources independent of the reporting entity (observable inputs) and (2) inputs that reflect the reporting entity’s own assumptions about the assumptions market participants would use in pricing an asset or liability developed based on the best information available in the circumstances (unobservable inputs) and to establish classification of fair value measurements for disclosure purposes. Various inputs are used in determining the value of the Funds’ investments. The inputs are summarized in the three broad levels listed below:
| Level 1 — | quoted prices in active markets for identical securities. |
| 24 | GUGGENHEIM ETFS ANNUAL REPORT |
Table of Contents
NOTES TO FINANCIAL STATEMENTS (continued)
|
| Level 2 — | other significant observable inputs (including quoted prices for similar securities, interest rates, prepayment speeds, credit risk, etc.). |
| Level 3 — | significant unobservable inputs (including the fund’s own assumptions used to determine the fair value of investments). |
The inputs or methodologies used for valuing securities are not necessarily an indication of the risk associated with investing in those securities.
The following table summarizes the inputs used to value the Funds’ net assets as of October 31, 2012:
| Fund | Level 1 Investments in Securities | Level 1 Other Financial Instruments | Level 2 Investments in Securities | Level 2 Other Financial Instruments | Level 3 Investments in Securities | Total | ||||||||||||||||||
Assets | ||||||||||||||||||||||||
Guggenheim 2x S&P 500® ETF | $ | 42,439,908 | $ | — | $ | 1,196,883 | $ | 6,822 | $ | — | $ | 43,643,613 | ||||||||||||
Guggenheim Inverse 2x S&P 500® ETF | — | 243,460 | 27,324,000 | — | — | 27,567,460 | ||||||||||||||||||
Liabilities | ||||||||||||||||||||||||
Guggenheim 2x S&P 500® ETF | — | 291,305 | — | — | — | 291,305 | ||||||||||||||||||
Guggenheim Inverse 2x S&P 500® ETF | — | — | — | 9,451 | — | 9,451 | ||||||||||||||||||
For the year ended October 31, 2012, there were no Level 3 Investments or transfers between levels.
H. Disclosures About Derivative Instruments and Hedging Activities
U.S. GAAP requires disclosures to enable investors to better understand how and why the Funds use derivative instruments, how these derivative instruments are accounted for and their effects on the Funds’ financial position and results of operations. None of the derivatives currently held by the Funds are being used as hedging instruments.
The Funds utilized derivatives for the following purposes:
| Fund | Index Exposure | |||
Guggenheim 2x S&P 500® ETF | X | |||
Guggenheim Inverse 2x S&P 500® ETF | X | |||
The following table represents the notional amount of derivative instruments outstanding, as an approximate percentage of the Funds’ net assets on a daily basis, while the risk to the Fund is limited to the profit earned on such derivatives.
| Approximate percentage of Fund’s net assets on a daily basis | ||||||||
| Fund | Long | Short | ||||||
Guggenheim 2x S&P 500® ETF | 115 | % | — | |||||
Guggenheim Inverse 2x S&P 500® ETF | — | 200 | % | |||||
The following is a summary of the location of derivative investments on the Funds’ Statements of Assets and Liabilities as of October 31, 2012:
| Location on the Statements of Assets and Liabilities | ||||||||
| Derivative Investment Type | Asset | Liability | ||||||
Equity Index Swap Contracts | Unrealized Appreciation on Swap Agreements | Unrealized Depreciation on Swap Agreements | ||||||
Equity Index Futures Contracts | Receivables: Variation Margin on Futures Contracts | Payables: Variation Margin on Futures Contracts | ||||||
The following table sets forth the fair value of the Funds’ derivative investments categorized by primary risk exposure at October 31, 2012:
| Asset Derivative Investments Value | ||||||||||||
| Portfolio | Total Value at October 31, 2012 | Equity Index Swap Contracts | Equity Index Futures Contracts* | |||||||||
Guggenheim 2x S&P 500® ETF | $ | 6,822 | $ | 6,822 | $ | — | ||||||
Guggenheim Inverse 2x S&P 500® ETF | 243,460 | — | 243,460 | |||||||||
| Liability Derivative Investments Value | ||||||||||||
| Portfolio | Total Value at October 31, 2012 | Equity Index Swap Contracts | Equity Index Futures Contracts* | |||||||||
Guggenheim 2x S&P 500® ETF | $ | 291,305 | $ | — | $ | 291,305 | ||||||
Guggenheim Inverse 2x S&P 500® ETF | 9,451 | 9,451 | — | |||||||||
| * | Includes cumulative appreciation (depreciation) of futures contracts as reported on the Schedule of Investments. Only current day’s variation margin is reported within the Statement of Assets and Liabilities. |
| GUGGENHEIM ETFS ANNUAL REPORT | 25 |
Table of Contents
| NOTES TO FINANCIAL STATEMENTS (continued) |
The following is a summary of the location of derivative investments on the Funds’ Statements of Operations year ended October 31, 2012:
| Derivative Investment Type | Location of Gain (Loss) on Derivatives | |
Equity Index Swap Contracts | Net Realized Gain (Loss) from: Swap Contracts | |
| Net Change in Unrealized Appreciation (Depreciation) on: Swap Contracts | ||
Equity Index Futures Contracts | Net Realized Gain (Loss) from: Futures Contracts | |
| Net Change in Unrealized Appreciation (Depreciation) on: Futures Contracts |
The following is a summary of the Funds’ realized gain (loss) and change in unrealized appreciation (depreciation) on derivative investments recognized on the Statements of Operations categorized by primary risk exposure for the year ended October 31, 2012:
| Realized Gain (Loss) on Derivative Investments Recognized in the Statement of Operations | ||||||||||||
| Portfolio | Total | Equity Index Swap Contracts | Equity Index Futures Contracts | |||||||||
Guggenheim 2x S&P 500® ETF | $ | 12,600,766 | $ | 7,783,828 | $ | 4,816,938 | ||||||
Guggenheim Inverse 2x S&P 500® ETF | (15,881,586 | ) | (12,473,618 | ) | (3,407,968 | ) | ||||||
| Change in Unrealized Appreciation (Depreciation) on Derivative Investments Recognized in the Statement of Operations | ||||||||||||
| Portfolio | Total | Equity Index Swap Contracts | Equity Index Futures Contracts | |||||||||
Guggenheim 2x S&P 500® ETF | $ | (1,209,421 | ) | $ | 537,837 | $ | (1,747,258 | ) | ||||
Guggenheim Inverse 2x S&P 500® ETF | 257,486 | (1,279,041 | ) | 1,536,527 | ||||||||
I. Dividends and Distributions
Distributions of net investment income and net realized gains, if any, in all the Funds, are declared and paid at least annually. Distributions are recorded on the ex-dividend date and are determined in accordance with income tax regulations which may differ from U.S. GAAP.
J. Risk and Uncertainties
The Funds invest in various investments which are exposed to risk, such as market risk. Due to the level of risk associated with certain investments it is at least reasonably possible that changes in the values of investment securities will occur in the near term and that such changes could materially affect amounts reported in the financial statements. The risk inherent in the use of futures and options contracts, and swap agreements, include i) adverse changes in the value of such instruments; ii) imperfect correlation between the price of the instruments and movements in the price of the underlying securities, indices, or futures contracts; iii) the possible absence of a liquid secondary market for any particular instrument at any time; and iv) the potential of counterparty default. The Funds have established strict counterparty credit guidelines and enter into transactions only with financial institutions of investment grade or better. The Trust monitors the counterparty credit risk.
Throughout the normal course of business, the Funds enter into contracts that contain a variety of representations and warranties which provide general indemnifications. The Funds’ maximum exposure under these arrangements is unknown, as this would involve future claims that may be made against the Funds and/or their affiliates that have not yet occurred. However, based on experience the Funds expect the risk of loss to be remote.
K. Portfolio Securities Loaned
The Funds may lend their securities to approved brokers to earn additional income. Security lending income shown on the statement of operations is shown net of rebates paid to the borrowers and earnings on cash collateral investments shared with the lending agent. Within this arrangement, the Funds act as the lender, Credit Suisse acts as the lending agent, and other approved registered broker dealers act as the borrowers. The Funds receive cash collateral, valued at 102% of the value of the securities on loan. Under the terms of the Funds’ securities lending agreement with Credit Suisse, cash collateral is invested in one or more joint repurchase agreements collateralized by obligations of the U.S. Treasury or Government Agencies. The Funds bear the risk of loss on cash collateral investments. Collateral is maintained over the life of the loan in an amount not less than the value of loaned securities, as determined at the close of fund business each day; any additional collateral required due to changes in security values is delivered to the Funds the next business day. Although the collateral mitigates the risk, the Funds could experience a delay in recovering its securities and a possible loss of income or value if the borrower fails to return the securities. The Funds have the right under the securities lending agreement to recover the securities from the borrower on demand.
| 26 | GUGGENHEIM ETFS ANNUAL REPORT |
Table of Contents
NOTES TO FINANCIAL STATEMENTS (continued)
|
At October 31, 2012, the Funds participated in securities lending as follows:
| Value of Securities Loaned | Cash Collateral Received | |||||||
Guggenheim 2x S&P 500® ETF | $ | 32,623 | $ | 33,883 | ||||
Guggenheim Inverse 2x S&P 500® ETF | — | — | ||||||
The following represents a breakdown of the collateral for the joint repurchase agreements at October 31, 2012:
| Counterparty and Terms of Agreement | Face Value | Repurchase Price | Collateral | Par Value | Fair Value | |||||||||||||
Merrill Lynch, Pierce, Fenner & Smith, Inc. | US Treasury | |||||||||||||||||
0.28% | 0.625% | |||||||||||||||||
Due 11/01/12 | $ | 40,000,000 | $ | 40,000,311 | 04/15/13 | $ | 37,278,800 | $ | 40,788,895 | |||||||||
RBS Securities, Inc. | Fannie Mae Note | |||||||||||||||||
0.28% | 5.375% | |||||||||||||||||
Due 11/01/12 | 68,010,000 | 68,012,041 | 07/15/16 | 58,330,000 | 69,372,283 | |||||||||||||
3. Advisory, Administration and Other Transactions with Affiliates
GI determines the composition of the portfolio of securities that must be delivered in exchange for the issuance of Creation Units and periodically adjusts the composition of the portfolio of the Funds to conform to changes in the composition of the relevant index. For these services, GI receives a management fee at the annual rate shown below as a percentage of the average daily net assets of the Funds.
| Advisory Fee | ||||
Guggenheim 2x S&P 500® ETF | 0.70 | % | ||
Guggenheim Inverse 2x S&P 500® ETF | 0.70 | % | ||
GI pays all expenses of the Funds, including the cost of transfer agency, custody, fund administration, legal, audit and other services, except: trustee fees, interest, taxes, distribution fees or expenses and extraordinary expenses.
Under an Administration Agreement, State Street Bank and Trust Company (the “Administrator”) provides various administrative and accounting services for the maintenance and operations of the Funds. Under a Custodian Agreement with the Trust, the Administrator maintains cash, securities and other assets of the Funds in separate accounts for each Fund, keeps all necessary accounts and records, and provides other services. The Administrator is required, upon the order of the Trust, to deliver securities held by the Custodian and to make payments for securities purchased by the Trust for the Funds. Pursuant to a Transfer Agency and Service Agreement with the Trust, the Administrator acts as a transfer agent for the Trust’s authorized and issued shares of beneficial interest, and as dividend disbursing agent of the Trust. GI compensates the Administrator directly for the foregoing services.
The Funds have adopted a Distribution Plan (the “Plan”) that allows the Funds to pay distribution fees to RDL and other firms that provide distribution services (“Service Providers”). If a Service Provider provides distribution services, the Funds will pay distribution fees to RDL at an annual rate not to exceed 0.25% of average daily net assets, pursuant to Rule 12b-1 of the 1940 Act. RDL will, in turn, pay the Service Provider out of its fees. No such fee is currently charged to the Funds.
4. Capital
At October 31, 2012, there were an unlimited number of no par value shares of beneficial interest authorized. There is a minimum transaction fee per transaction to those persons purchasing or redeeming Creation Units. An additional charge of up to three times the standard transaction fee may be imposed for purchases and redemptions effected outside the National Securities Clearing Corporation usual clearing process or for cash. Such transactions are generally permitted on an in-kind basis, with a balancing cash component to equate the transaction to the NAV of the Fund on the transaction date. Transaction fees are not charged to or paid by the Fund. The minimum transaction fees are:
| Minimum Transaction Fee | ||||
Guggenheim 2x S&P 500® ETF | $ | 2,000 | ||
Guggenheim Inverse 2x S&P 500® ETF | 50 | |||
| GUGGENHEIM ETFS ANNUAL REPORT | 27 |
Table of Contents
| NOTES TO FINANCIAL STATEMENTS (concluded) |
5. Investment Transactions
For the year ended October 31, 2012, the Funds had investment transactions in-kind associated with subscriptions and redemptions as follows:
| Subscriptions | Redemptions | |||||||
Guggenheim 2x S&P 500® ETF | $ | — | $ | 37,783,809 | ||||
Guggenheim Inverse 2x S&P 500® ETF | — | — | ||||||
Purchases and sales of investment securities (excluding short-term investments, U.S. government and government agency obligations) for the Funds were as follows:
| Purchases | Sales | |||||||
Guggenheim 2x S&P 500® ETF | $ | 14,996,376 | $ | 6,700,068 | ||||
Guggenheim Inverse 2x S&P 500® ETF | — | — | ||||||
6. Legal Proceedings
Tribune Company
Rydex ETF Trust has been named as a defendant and a putative member of the proposed defendant class of shareholders in the case entitled Official Committee of Unsecured Creditors of Tribune Co. v. FitzSimons (In re Tribune Co.), No. 12-2652 (S.D.N.Y.) (formerly Adv. Pro. No. 10-54010 (Bankr. D. Del.)) (the “FitzSimons action”), as a result of ownership of shares in the Tribune Company (“Tribune”) in 2007 by certain series of the Rydex ETF Trust when Tribune effected a leveraged buyout transaction (“LBO”) by which Tribune converted to a privately-held company. In its complaint, the Unsecured Creditors Committee (the “UCC”) has alleged that, in connection with the LBO, insiders and major shareholders received proceeds for their Tribune stock using financing that the insiders knew would, and ultimately did, leave the Tribune insolvent. The UCC has asserted claims against certain insiders, major shareholders, professional advisers, and others involved in the LBO, and is attempting to obtain from these individuals and entities the proceeds paid out in connection with the LBO.
In June 2011, a group of Tribune creditors, not including the UCC, filed multiple actions involving state law constructive fraudulent conveyance claims against former Tribune shareholders (the “SCLFC actions”). Rydex ETF Trust has been named as a defendant in one or more of these suits. These cases have been consolidated together with the FitzSimons action in a multidistrict litigation proceeding captioned In re Tribune Co. Fraudulent Conveyance Litig., No. 11-2296 (S.D.N.Y.) (the “MDL proceeding”).
On September 7, 2012, the Court issued a Master Case Order in the MDL proceeding. This order designated several law firms to serve as members of executive committees of defense counsel in the FitzSimons action and in the SCLFC actions. The order also established a briefing schedule for motions to dismiss in the SLCFC actions; no schedule has yet been established in the Fitzsimons action. The Court also ordered that the plaintiffs’ deadline to serve summonses and complaints is extended through January 15, 2013. Finally, the Court ordered that merits discovery will be stayed until further order of the Court.
None of these lawsuits allege any wrongdoing on the part of Rydex ETF Trust. The following series of Rydex ETF Trust held shares of Tribune and tendered these shares as part of Tribune’s LBO: Guggenheim 2x S&P 500 ETF (the “Fund”). The value of the proceeds received by the foregoing Fund was $1,699. At this stage of the proceedings, Rydex ETF Trust is not able to make a reliable predication as to the outcome of these lawsuits or the effect, if any, on the Fund’s net asset value.
| 28 | GUGGENHEIM ETFS ANNUAL REPORT |
Table of Contents
| REPORT OF INDEPENDENT REGISTERED PUBLIC ACCOUNTING FIRM | ||
The Board of Trustees and Shareholders of Rydex ETF Trust
We have audited the accompanying statements of assets and liabilities, including the schedules of investments, of Guggenheim 2x S&P 500® ETF and Guggenheim Inverse 2x S&P 500® ETF (two of the series constituting the Guggenheim ETF Trust) (the “Funds”) as of October 31, 2012, and the related statements of operations for the year then ended, the statements of changes in net assets for each of the two years in the period then ended, and the financial highlights for each of the four years in the period then ended and the period November 5, 2007 (commencement of operations) through October 31, 2008. These financial statements and financial highlights are the responsibility of the Funds’ management. Our responsibility is to express an opinion on these financial statements and financial highlights based on our audits.
We conducted our audits in accordance with the standards of the Public Company Accounting Oversight Board (United States). Those standards require that we plan and perform the audit to obtain reasonable assurance about whether the financial statements and financial highlights are free of material misstatement. We were not engaged to perform an audit of the Funds’ internal control over financial reporting. Our audits included consideration of internal control over financial reporting as a basis for designing audit procedures that are appropriate in the circumstances, but not for the purpose of expressing an opinion on the effectiveness of the Funds’ internal control over financial reporting. Accordingly, we express no such opinion. An audit also includes examining, on a test basis, evidence supporting the amounts and disclosures in the financial statements and financial highlights, assessing the accounting principles used and significant estimates made by management, and evaluating the overall financial statement presentation. Our procedures included confirmation of securities owned as of October 31, 2012, by correspondence with the custodian and brokers or by other appropriate auditing procedures where replies from brokers were not received. We believe that our audits provide a reasonable basis for our opinion.
In our opinion, the financial statements and financial highlights referred to above present fairly, in all material respects, the financial position of the above listed Funds at October 31, 2012, the results of their operations for the year then ended, the changes in their net assets for each of the two years in the period then ended, and their financial highlights for each of the four years in the period then ended and the period November 5, 2007 (commencement of operations) through October 31, 2008, in conformity with U.S. generally accepted accounting principles.

McLean, Virginia
December 21, 2012
| GUGGENHEIM ETFS ANNUAL REPORT | 29 |
Table of Contents
|
Federal Income Tax Information
For federal income tax purposes, the following information is furnished with respect to the distributions paid by the Funds during the year ended October 31, 2012:
| Dividend Received Deduction | Long Term Capital Gains Distribution | Qualified Income Distribution | ||||||||||
Guggenheim 2x S&P 500® ETF | 100.00 | % | $ | — | $ | 1,205,363 | ||||||
Guggenheim Inverse 2x S&P 500® ETF | 0.00 | % | — | — | ||||||||
Proxy Voting Information
A description of the policies and procedures that the Trust uses to determine how to vote proxies relating to securities held in the Funds’ portfolios is available, without charge and upon request, by calling 1.800.820.0888. This information is also available from the EDGAR database on the SEC’s website at http://www.sec.gov.
Information regarding how the Funds voted proxies relating to portfolio securities, during the most recent 12-month period ended June 30, 2012 is available, without charge, upon request, by calling 1.800.820.0888. The information is also available from the EDGAR database on the SEC’s website at http://www.sec.gov.
Quarterly Portfolio Schedules Information
The Trust files its complete schedule of portfolio holdings with the SEC for the first and third quarters of each fiscal year on Form N-Q; which are available on the SEC’s website at http://www.sec.gov. The Funds’ Forms N-Q may be reviewed and copied at the SEC’s Public Reference Room in Washington, DC, and that information on the operation of the Public Reference Room may be obtained by calling 1-800-SEC-0330. Copies of the portfolio holdings are also available to shareholders, without charge and upon request, by calling 1.800.820.0888.
Office Locations
The offices of Guggenheim Investments can be found in the following locations:
40 East 52nd Street
16th Floor
New York, NY 10022
(Headquarters)
Four Irvington Centre
805 King Farm Boulevard
Suite 600
Rockville, MD 20850
9401 Indian Creek Parkway
40 Corporate Woods
Suite 850
Overland Park, KS 66210
Premium/Discount Information
Information about the differences between the daily market price on secondary markets for shares and the NAV of each Fund can be found at guggenheiminvestments.com.
| 30 | GUGGENHEIM ETFS ANNUAL REPORT |
Table of Contents
| INFORMATION ON BOARD OF TRUSTEES AND OFFICERS (Unaudited) |
A Board of Trustees oversees the Trust, as well as other trusts of GI, in which its members have no stated term of service, and continue to serve after election until resignation. The Statement of Additional Information includes further information about Fund Trustees and Officers, and can be obtained without charge by calling 800.820.0888.
All Trustees and Officers may be reached c/o Guggenheim Investments, 805 King Farm Boulevard, Suite 600, Rockville, MD 20850.
TRUSTEE AND OFFICER
Name and | Length of Service (Year Began) | Number of | ||||||
Donald C. Cacciapaglia* | Rydex Series Funds – 2012 | 146 | ||||||
| (1951) | Rydex Variable Trust – 2012 | |||||||
Rydex Dynamic Funds – 2012 | ||||||||
Rydex ETF Trust – 2012 |
Principal Occupations During Past Five Years: Current: Security Investors, LLC: President and CEO from April 2012 to present; Guggenheim Investments: President and Chief Administrative Officer from February 2010 to present; Previous: Channel Capital Group, Inc.: Chairman and CEO from April 2002 to February 2010
Positions held within the Trust: Trustee from 2012 to present; President from 2012 to present
INDEPENDENT TRUSTEES
Name and | Length of Service (Year Began) | Number of | ||||||
Corey A. Colehour | Rydex Series Funds – 1993 | 146 | ||||||
| (1945) | Rydex Variable Trust – 1998 | |||||||
Rydex Dynamic Funds – 1999 | ||||||||
Rydex ETF Trust – 2003 |
Principal Occupations During Past Five Years: Current: Retired; Previous: President and Senior Vice President of Schield Management Company (registered investment adviser) from 2003 to 2006
Positions held within the Trust: Trustee from 1993 to present; Member of the Audit and Governance and Nominating Committees from 1995 to present
J. Kenneth Dalton | Rydex Series Funds – 1995 | 146 | ||||||
| (1941) | Rydex Variable Trust – 1998 | |||||||
Rydex Dynamic Funds – 1999 | ||||||||
Rydex ETF Trust – 2003 |
Principal Occupations During Past Five Years: Current: Retired
Positions held within the Trust: Trustee from 1995 to present; Member and Chairman of the Audit Committee from 1997 to present; Member of the Governance and Nominating Committees from 1995 to present; and Member of the Risk Oversight Committee from 2010 to present
John O. Demaret | Rydex Series Funds – 1997 | 146 | ||||||
| (1940) | Rydex Variable Trust – 1998 | |||||||
Rydex Dynamic Funds – 1999 | ||||||||
Rydex ETF Trust – 2003 |
Principal Occupations During Past Five Years: Current: Retired
Positions held within the Trust: Trustee from 1997 to present; Chairman of the Board from 2006 to present; Member of the Audit Committee from 1997 to present; and Member of the Risk Oversight Committee from 2010 to present
| GUGGENHEIM ETFS ANNUAL REPORT | 31 |
Table of Contents
INFORMATION ON BOARD OF TRUSTEES AND OFFICERS (Unaudited) (continued)
|
INDEPENDENT TRUSTEES – concluded
Name and | Length of Service (Year Began) | Number of | ||||||
Werner E. Keller | Rydex Series Funds – 2005 | 146 | ||||||
| (1940) | Rydex Variable Trust – 2005 | |||||||
Rydex Dynamic Funds – 2005 | ||||||||
Rydex ETF Trust – 2005 |
Principal Occupations During Past Five Years: Current: Founder and President of Keller Partners, LLC (investment research firm) from 2005 to present; Previous: Retired from 2001 to 2005
Positions held within the Trust: Vice Chairman of the Board of Trustees from 2010 to present; Trustee and Member of the Audit and Governance and Nominating Committees from 2005 to present; and Chairman and Member of the Risk Oversight Committee from 2010 to present
Thomas F. Lydon, Jr. | Rydex Series Funds – 2005 | 146 | ||||||
| (1960) | Rydex Variable Trust – 2005 | |||||||
Rydex Dynamic Funds – 2005 | ||||||||
Rydex ETF Trust – 2005 |
Principal Occupations During Past Five Years: Current: President of Global Trends Investments (registered investment adviser) from 1996 to present
Positions held within the Trust: Trustee and Member of the Audit and Governance and Nominating Committees from 2005 to present
Patrick T. McCarville | Rydex Series Funds – 1997 | 146 | ||||||
| (1942) | Rydex Variable Trust – 1998 | |||||||
Rydex Dynamic Funds – 1999 | ||||||||
Rydex ETF Trust – 2003 |
Principal Occupations During Past Five Years: Current: Retired; Previous: Chief Executive Officer of Par Industries, Inc., d/b/a Par Leasing from 1977 to 2010
Positions held within the Trust: Trustee from 1997 to present; Member of the Audit Committee from 1997 to present; and Chairman of the Governance and Nominating Committees from 1997 to present
Roger Somers | Rydex Series Funds – 1993 | 146 | ||||||
| (1944) | Rydex Variable Trust – 1998 | |||||||
Rydex Dynamic Funds – 1999 | ||||||||
Rydex ETF Trust – 2003 |
Principal Occupations During Past Five Years: Current: Founder and Chief Executive Officer of Arrow Limousine from 1965 to present
Positions held within the Trust: Trustee from 1993 to present; Member of the Audit and Governance and Nominating Committees from 1995 to present
| * | Officers of the Funds are deemed to be “interested persons” of the Trust, within the meaning of Section 2(a) (19) of the 1940 Act, inasmuch as this person is affiliated with Guggenheim Investments. |
| 32 | GUGGENHEIM ETFS ANNUAL REPORT |
Table of Contents
| INFORMATION ON BOARD OF TRUSTEES AND OFFICERS (Unaudited) (concluded) |
EXECUTIVE OFFICERS
Name, Position and Year of Birth | Principal Occupations During Past Five Years | |
Michael P. Byrum* Vice President (1970) | Current: President, Security Benefit Asset Management Holdings, LLC; Senior Vice President, Security Investors, LLC; President & Chief Investment Officer, Rydex Holdings, LLC; Director & Chairman of the Board, Advisor Research Center, Inc.; and Manager, Rydex Specialized Products, LLC
Previous: Rydex Distributors, LLC (f/k/a Rydex Distributors, Inc.), Vice President (2009); Rydex Fund Services, LLC, Director (2009-2010), Secretary (2002-2010), Executive Vice President (2002-2006); Rydex Advisors, LLC (f/k/a PADCO Advisors, Inc.), Director (2008-2010), Chief Investment Officer (2006-2010), President (2004-2010), Secretary (2002-2010); Rydex Advisors II, LLC (f/k/a PADCO Advisors II, Inc.), Director (2008-2010), Chief Investment Officer (2006-2010), President (2004-2010), Secretary (2002-2010); Rydex Capital Partners, LLC, President & Secretary (2003-2007); Rydex Capital Partners II, LLC, (2003-2007); Rydex Holdings, LLC (f/k/a Rydex Holdings, Inc.), Secretary (2005-2008), Executive Vice President (2005-2006); Advisor Research Center, Inc., Secretary (2006-2009), Executive Vice President (2006); and Rydex Specialized Products, LLC, Secretary (2005-2008) | |
Nikolaos Bonos* Vice President and Treasurer (1963) | Current: Senior Vice President, Security Investors, LLC; Chief Executive Officer & Manager, Rydex Specialized Products, LLC; Chief Executive Officer & President, Rydex Fund Services, LLC; Vice President, Rydex Holdings, LLC; Treasurer, SBL Fund; Security Equity Fund; Security Income Fund; Security Large Cap Value Fund & Security Mid Cap Growth Fund; and Vice President, Security Benefit Asset Management Holdings, LLC
Previous: Security Global Investors, LLC, Senior Vice President (2010-2011); Rydex Advisors, LLC (f/k/a PADCO Advisors, Inc.) Senior Vice President (2006-2011); Rydex Fund Services, LLC (f/k/a Rydex Fund Services, Inc.), Director (2009) & Senior Vice President (2003-2006); and Rydex Specialized Products, LLC, Chief Financial Officer (2005-2009) | |
Elisabeth Miller* Chief Compliance Officer (1968) | Current: Chief Compliance Officer, Rydex Series Funds, Rydex Dynamic Funds, Rydex Variable Trust, Rydex ETF Trust, Security Equity Fund, Security Income Fund, Security Large Cap Value Fund, Security Mid Cap Growth Fund, SBL Fund, Security Investors, LLC, and Rydex Distributors, LLC
Previous: Senior Manager, Security Investors, LLC and Rydex Distributors, LLC (2004-2009) | |
Amy J. Lee* Vice President and Assistant Secretary (1961) | Current: Senior Vice President & Secretary, Security Investors, LLC; Secretary & Chief Compliance Officer, Security Distributors, Inc.; Vice President, Associate General Counsel & Assistant Secretary, Security Benefit Life Insurance Company and Security Benefit Corporation; Associate General Counsel, First Security Benefit Life Insurance and Annuity of New York; Vice President & Secretary, SBL Fund; Security Equity Fund; Security Income Fund; Security Large Cap Value Fund & Security Mid Cap Growth Fund; Vice President & Secretary, Rydex Holdings, LLC Secretary, Advisor Research Center, Inc., Rydex Specialized Products, LLC, Rydex Distributors, LLC and Rydex Fund Services, LLC; and Assistant Secretary, Security Benefit Clinic and Hospital
Previous: Security Global Investors, LLC, Senior Vice President & Secretary (2007-2011); Rydex Advisors, LLC (f/k/a PADCO Advisors, Inc.) & Rydex Advisors II, LLC (f/k/a PADCO Advisors II, Inc.), Senior Vice President & Secretary (2010-2011); and Brecek & Young Advisors, Inc., Director (2004-2008) | |
Joseph M. Arruda* Assistant Treasurer (1966) | Current: Assistant Treasurer, SBL Fund; Security Equity Fund; Security Income Fund; Security Large Cap Value Fund & Security Mid Cap Growth Fund; Vice President, Security Investors, LLC; and Chief Financial Officer & Manager, Rydex Specialized Products, LLC
Previous: Security Global Investors, LLC, Vice President (2010-2011); and Rydex Advisors, LLC (f/k/a PADCO Advisors, Inc.) & Rydex Advisors II, LLC (f/k/a PADCO Advisors II, Inc.), Vice President (2004-2011) | |
| * | Officers of the Funds are deemed to be “interested persons” of the Trust, within the meaning of Section 2(a)(19) of the 1940 Act, inasmuch as this person is affiliated with Guggenheim Investments. |
| GUGGENHEIM ETFS ANNUAL REPORT | 33 |
Table of Contents
GUGGENHEIM INVESTMENTS PRIVACY POLICIES
|
Rydex Funds, Guggenheim Funds, Rydex Investments, Rydex Distributors, Inc., Security Investors, LLC, Security Distributors, Inc. and Rydex Advisory Services (Collectively “Guggenheim Investments”)
Our Commitment to You
When you become a Guggenheim Investments investor, you entrust us with not only your hard-earned money but also with personal and financial information about you. We recognize that your relationship with us is based on trust and that you expect us to act responsibly and in your best interests. Because we have access to this private information about you, we hold ourselves to the highest standards in its safekeeping and use. This means, most importantly, that we do not sell client information to anyone — whether it is your personal information or if you are a current or former Guggenheim Investments client.
The Information We Collect About You
In the course of doing business with shareholders and investors, we collect nonpublic personal information about you. You typically provide personal information when you complete a Guggenheim Investments account application or when you request a transaction that involves Rydex and Guggenheim Investments funds or one of the Guggenheim Investments affiliated companies. “Nonpublic personal information” is personally identifiable private information about you. For example, it includes information regarding your name and address, Social Security or taxpayer identification number, assets, income, account balance, bank account information and investment activity (e.g., purchase and redemption history).
How We Handle Your Personal Information
As emphasized above, we do not sell information about current or former clients or their accounts to third parties. Nor do we share such information, except when necessary to complete transactions at your request or to make you aware of related investment products and services that we offer. Additional details about how we handle your personal information are provided below. To complete certain transactions or account changes that you direct, it may be necessary to provide identifying information to companies, individuals or groups that are not affiliated with Guggenheim Investments. For example, if you ask to transfer assets from another financial institution to Guggenheim Investments, we will need to provide certain information about you to that company to complete the transaction. To alert you to other Guggenheim Investments investment products and services, we may share your information within the Guggenheim Investments family of affiliated companies. This would include, for example, sharing your information within Guggenheim Investments so we can make you aware of new Rydex and Guggenheim Investments funds or the services offered through another Guggenheim Investments affiliated company. In certain instances, we may contract with nonaffiliated companies to perform services for us. Where necessary, we will disclose information we have about you to these third parties. In all such cases, we provide the third party with only the information necessary to carry out its assigned responsibilities and only for that purpose. And we require these third parties to treat your private information with the same high degree of confidentiality that we do. In certain instances, we may share information with other financial institutions regarding individuals and entities in response to the U.S.A. Patriot Act. Finally, we will release information about you if you direct us to do so, if we are compelled by law to do so or in other circumstances permitted by law.
Opt Out Provisions
We do not sell your personal information to anyone. The law allows you to “opt out” of only certain kinds of information sharing with third parties. The firm does not share personal information about you with any third parties that triggers this opt-out right. This means YOU ARE ALREADY OPTED OUT.
How We Protect Privacy Online
Our concern for the privacy of our shareholders also extends to those who use our web site, guggenheiminvestments.com. Our web site uses some of the most secure forms of online communication available, including encryption technology, Secure Socket Layer (SSL) protocol, firewalls and user names and passwords. These technologies provide a high level of security and privacy when you access your account information or initiate online transactions. The Guggenheim Investments web site offers customized features that require our use of “http cookies” — tiny pieces of information that we ask your browser to store. However, we make very limited use of these cookies. We only use cookies for session management and security features on the Guggenheim Investments web site. We do not use them to pull data from your hard drive, to learn your email address, or to view data in cookies created by other web sites. We will not share the information in our cookies or give others access to it. See the legal information area on our web site for more details about web site security and privacy features.
| 34 | GUGGENHEIM ETFS ANNUAL REPORT |
Table of Contents
| GUGGENHEIM INVESTMENTS PRIVACY POLICIES (concluded) |
How We Safeguard Your Personal Information
We restrict access to nonpublic personal information about shareholders to our employees and in some cases to third parties (for example, the service providers described above) as permitted by law. We maintain strict physical, electronic and procedural safeguards that comply with federal standards to guard your nonpublic personal information.
We’ll Keep You Informed
As required by federal law, we will notify shareholders of our privacy policy annually. We reserve the right to modify this policy at any time, but rest assured that if we do change it, we will tell you promptly. You will also be able to access our privacy policy from our web site at guggenheiminvestments.com. Should you have any questions regarding our privacy policy, contact us at 800.820.0888 or 301.296.5100.
| GUGGENHEIM ETFS ANNUAL REPORT | 35 |
Table of Contents

805 King Farm Boulevard, Suite 600
Rockville, MD 20850
guggenheiminvestments.com
800.820.0888
ETF3-ANN-1012x1013
Table of Contents

OCTOBER 31, 2012
GUGGENHEIM ETFs
ANNUAL REPORT

| RSP | GUGGENHEIM S&P 500® EQUAL WEIGHT ETF | |
(formerly, RYDEX S&P 500 EQUAL WEIGHT ETF) |
Table of Contents
| TABLE OF CONTENTS |
| 2 | ||||
| 3 | ||||
| 4 | ||||
| 6 | ||||
| 7 | ||||
| 8 | ||||
| 15 | ||||
| 16 | ||||
| 17 | ||||
| 18 | ||||
| 19 | ||||
| 25 | ||||
| 26 | ||||
| 27 | ||||
| 30 | ||||
| GUGGENHEIM ETFS ANNUAL REPORT | 1 |
Table of Contents
| October 31, 2012 |
Dear Shareholder:
Security Investors, LLC (the “Investment Adviser”) is pleased to present the annual shareholder report for Guggenheim S&P 500® Equal Weight ETF (RSP).
The Investment Adviser is part of Guggenheim Investments which represents the investment management businesses of Guggenheim Partners, LLC, a global, diversified financial services firm.
This report covers performance of Guggenheim S&P 500® Equal Weight ETF (RSP) for the annual period ended October 31, 2012.
Rydex Distributors, LLC, the distributor of the Funds, is committed to providing investors with innovative investment solutions; as of the date of this report we offer 26 ETFs with a wide range of domestic and global themes, as well as equity and fixed-income mutual funds. We have built on the investment management strengths of Guggenheim Investments and worked with a diverse group of index providers to create some of the most distinctive ETFs available.
Rydex Distributors, LLC is affiliated with Guggenheim Partners and Security Investors.
To learn more about economic and market conditions over the 12 months ended October 31, 2012, we encourage you to read the Economic and Market Overview section of the report, which follows this letter, and the Manager’s Analysis for the ETF.
Sincerely,

Donald C. Cacciapaglia
President
November 30, 2012
Read each fund’s prospectus and summary prospectus (if available) carefully before investing. It contains the fund’s investment objectives, risks, charges, expenses and other information, which should be considered carefully before investing. Obtain a prospectus and summary prospectus (if available) at www.guggenheiminvestments.com or call 800.820.0888.
The Guggenheim S&P 500® Equal Weight ETF may not be suitable for all investors. • The Fund is subject to the risk that unanticipated early closings of securities exchanges and other financial markets may result in the Fund’s inability to buy or sell securities or other financial instruments on that day. • In certain circumstances, it may be difficult for the Fund to purchase and sell particular investments within a reasonable time at a fair price. • Investments in securities and derivatives, in general, are subject to market risks that may cause their prices to fluctuate over time. An investment in the Fund may lose money. • Unlike many investment companies, the Fund is not actively “managed.” This means that, based on market and economic conditions, the Fund’s performance could be lower than other types of mutual funds that may actively shift their portfolio assets to take advantage of market opportunities or to lessen the impact of a market decline. • Tracking error risk refers to the risk that the Advisor may not be able to cause the Fund’s performance to match or correlate to that of the Fund’s Underlying Index, either on a daily or aggregate basis. Tracking error risk may cause the Fund’s performance to be less than you expect. • Shares may trade below their net asset value (“NAV”). The NAV of shares will fluctuate with changes in the market value of the Fund’s holdings. In addition, although the Fund’s shares are currently listed on NYSE Arca, Inc. (the “Exchange”), there can be no assurance that an active trading market for shares will develop or be maintained. • The Fund is subject to the risk that large-capitalization stocks may underperform other segments of the equity market or the equity market as a whole. See prospectus for more details.
| 2 | GUGGENHEIM ETFS ANNUAL REPORT |
Table of Contents
|
Shareholder Expense Example
As a shareholder of the Rydex ETF Trust, you incur transaction costs such as creation and redemption fees or brokerage charges, and ongoing costs including advisory fees, trustee fees and, if applicable, distribution fees. All other Trust expenses are paid by the advisor. This Example is intended to help you understand your ongoing costs (in dollars) of investing in a Fund and to compare these costs with the ongoing costs of investing in other mutual funds.
The example in the table is based on an investment of $1,000 invested on April 30, 2012 and held for the six months ended October 31, 2012.
Actual Expenses
The first table below provides information about actual account values and actual expenses. You may use the information in this table, together with the amount you invested, to estimate the expenses that you incurred over the period. Simply divide your account value by $1,000 (for example, an $8,600 account value divided by $1,000 = 8.6), then multiply the result by the number in the first table under the heading entitled “Expenses Paid During the Six-Month Period” to estimate the expenses attributable to your investment during this period.
Hypothetical Example for Comparison Purposes
The second table below provides information about hypothetical account values and hypothetical expenses based on the Fund’s actual expense ratio and an assumed rate of return of 5% per year before expenses, which is not the Fund’s actual return. Thus, you should not use the hypothetical account values and expenses to estimate the actual ending account balance or your expenses for the period. Rather, these figures are provided to enable you to compare the ongoing costs of investing in a Fund and other funds. To do so, compare this 5% hypothetical example with the 5% hypothetical examples that appear in the shareholder reports of other funds.
Please note that the expenses shown in the table are meant to highlight your ongoing costs only and do not reflect any transaction costs, such as creation and redemption fees, or brokerage charges. Therefore, the second table is useful in comparing ongoing costs only, and will not help you determine the relative total costs of owning different funds. In addition, if these transaction costs were included, your costs would have been higher.
| Expense Ratio | Beginning Account Value 04/30/12 | Ending Account Value 10/31/12 | Expenses Paid During Six-Month Period* 04/30/12 to 10/31/12 | |||||||||||||
Actual | ||||||||||||||||
Guggenheim S&P® 500 Equal Weight ETF | 0.40% | $ | 1,000.00 | $ | 1,013.60 | $ | 2.02 | |||||||||
Hypothetical (assuming a 5% return before expenses) |
| |||||||||||||||
Guggenheim S&P 500® Equal Weight ETF | 0.40% | 1,000.00 | 1,023.13 | 2.03 | ||||||||||||
| * | Expenses are equal to the Fund’s annualized expense ratio multiplied by the average account value over the period, multiplied by 184/366 (to reflect one-half year period). |
| GUGGENHEIM ETFS ANNUAL REPORT | 3 |
Table of Contents
|
Amidst the negative headlines concerning the potential fiscal cliff in the U.S., further turmoil in Europe and worsening economic data from China, the U.S. economy has shown surprising resilience, with signs of rising consumer sentiment and a recovery in housing. The U.S. housing market appears to have passed its bottom and real estate prices have begun to pick up. Our expectation is that a period of continued low interest rates will likely reinforce the rise in home prices and sales. Rising home prices will increase household net worth, which will translate into greater consumption via the wealth effect, and is supportive of overall economic growth. The recent rise in headline inflation, led by increases in energy and food prices, is likely to be transitory. Inflationary pressures should remain muted in the medium-term given the substantial slack in the economy.
The U.S. economy continues to press forward despite the current headwinds, and we believe the current macroeconomic environment remains constructive for risk assets, especially in the U.S. Stocks in the U.S. appear to be undervalued by most measures, and should benefit from continued capital inflow and the Federal Reserve’s accommodative monetary policy. We continue to see attractive value in credit products on a relative basis, though this positive outlook is limited to spread (or non-government) sectors.
On the international front, uncertainty continues to weigh on European markets. European policymakers appear to be coming closer to a consensus on the need for a fiscal union, albeit at a glacial pace. In China, a recent batch of economic data suggests that the odds of a hard landing have increased materially. We expect an announcement of additional stimulus measures after the government transition next year; although a stimulus would be supportive of economic growth, we expect China’s headline growth to slow from its breakneck pace of the past decade.
Beginning in mid-November 2011, the U.S. stock market moved up fairly consistently, except for a second-quarter pullback caused by lower earnings and GDP. For the 12-month period ended October 31, 2012, the Standard & Poor’s 500 Index* (the “S&P 500”) returned 15.21%.
Most international markets had positive returns, but were not nearly as strong as the U.S. market. The Morgan Stanley Capital International Europe-Australasia-Far East (the “MSCI EAFE”) Index* returned 4.61%. The MSCI EAFE Index is composed of approximately 1,100 companies in 20 developed countries in Europe and the Pacific Basin. The MSCI Emerging Markets Index returned 2.63%.
The search for yield continued to attract investors to the U.S. bond markets, helping performance, with lower-rated bonds outperforming higher-quality issues. The return of the Barclays U.S. Aggregate Bond Index*, which is a proxy for the U.S. investment grade bond market, returned 5.25%, while return of the Barclays U.S. Corporate High Yield Index* was 13.61%. Reflecting the Federal Reserve’s continuing accommodative monetary policy, interest rates on short-term securities remained at their lowest levels in many years; the return of the Bank of America Merrill Lynch 3 Month U.S. Treasury Bill Index* was 0.08%.
The opinions and forecasts expressed may not actually come to pass. This information is subject to change at any time, based on market and other conditions, and should not be construed as a recommendation of any specific security or strategy.
*Index Definitions:
The following indices are referenced throughout this report. Indices are unmanaged and not available for direct investment. Index performance does not reflect transaction costs, fees or expenses.
The Barclays U.S. Aggregate Bond Index is a broad-based benchmark that measures the investment grade, U.S. dollar denominated, fixed-rate taxable bond market, including U.S. Treasuries, government-related and corporate securities, MBS (agency fixed-rate and hybrid ARM pass-throughs), ABS, and CMBS.
The Barclays U.S. Corporate High Yield Index measures the market of USD-denominated, non-investment grade, fixed-rate, taxable corporate bonds.
The Bank of America Merrill Lynch 3-Month U.S. Treasury Bill Index tracks 3-month U.S. government securities.
| 4 | GUGGENHEIM ETFS ANNUAL REPORT |
Table of Contents
ECONOMIC AND MARKET OVERVIEW (concluded)
|
The MSCI EAFE Index is a capitalization weighted measure of stock markets in Europe, Australasia and the Far East.
The MSCI Emerging Markets Index is a free float-adjusted market capitalization weighted index that is designed to measure equity market performance in the global emerging markets.
The S&P 500® Index is a capitalization-weighted index that measures the performance of the large-capitalization sector of the U.S. equity market and includes 500 widely held common stocks chosen for market size, liquidity and industry group representation.
The Standard & Poor’s (S&P) 500® Equal Weight Index is an unmanaged equal-weighted version of the S&P 500® Index, which measures the performance of the large-capitalization sector of the U.S. equity market and includes 500 widely held common stocks chosen for market size, liquidity and industry group representation. The S&P 500 Equal Weight Index has the same constituents as the unmanaged capitalization-weighted S&P 500 Index, but each company in the equal-weighted index is allocated a fixed weight, and is rebalanced quarterly.
| GUGGENHEIM ETFS ANNUAL REPORT | 5 |
Table of Contents
| MANAGER’S ANALYSIS (Unaudited) | October 31, 2012 |
GUGGENHEIM S&P 500® EQUAL WEIGHT ETF
Guggenheim S&P 500® Equal Weight ETF returned 12.42% for the one-year period ended October 31, 2012, compared with the benchmark S&P 500® Equal Weight Total Return Index which returned 12.96%. The cap-weighted S&P 500 Total Return Index returned 15.21%. During the period, RSP achieved over 99% correlation to its benchmark on a daily basis.
The Financials sector contributed most to performance, followed by the Consumer Discretionary sector. Information Technology was the only sector detracting from return.
Top contributors to Fund return included Pulte Group, Inc. and Sprint Nextel Corp., while Alpha Natural Resources, Inc. and Abercrombie & Fitch Co.—Class A were the largest detractors.
Cumulative Fund Performance: April 24, 2003 – October 31, 2012

| AVERAGE ANNUAL TOTAL RETURNS FOR THE PERIOD ENDED OCTOBER 31, 2012 | ||||||||||||||||
| One Year | Three Year | Five Year | Since Inception (04/24/03) | |||||||||||||
Guggenheim S&P 500® Equal Weight ETF | 12.42% | 14.55% | 2.05% | 9.28% | ||||||||||||
S&P Equal Weight Total Return Index | 12.96% | 15.09% | 2.74% | 9.89% | ||||||||||||
S&P 500 Total Return Index | 15.21% | 13.21% | 0.36% | 6.84% | ||||||||||||
The returns presented above do not reflect the effect of taxes. Index returns represent total returns. Performance displayed represents past performance, which is no guarantee of future results.
Fund performance is subject to daily market volatility and may be better or worse since the end of the last quarter. For up-to-date fund performance, call 800.820.0888 or visit guggenheiminvestments.com.
| 6 | GUGGENHEIM ETFS ANNUAL REPORT |
Table of Contents
| PORTFOLIO SUMMARY (Unaudited) | October 31, 2012 |
GUGGENHEIM S&P 500® EQUAL WEIGHT ETF
Sector Allocations*
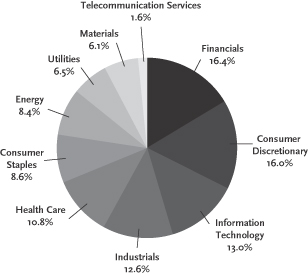
| * | The Fund’s Top Ten Holdings are expressed as a percentage of net assets and the Sector Allocations are expressed as a percentage of the Fund’s equity investments market value. These percentages may change over time. |
| GUGGENHEIM ETFS ANNUAL REPORT | 7 |
Table of Contents
| SCHEDULE OF INVESTMENTS | October 31, 2012 |
GUGGENHEIM S&P 500® EQUAL WEIGHT ETF
| SHARES | VALUE | |||||||
COMMON STOCKS - 99.6% |
| |||||||
Aerospace & Defense - 2.3% |
| |||||||
Boeing Co. (The) | 80,403 | $ | 5,663,587 | |||||
General Dynamics Corp. | 85,820 | 5,842,626 | ||||||
Honeywell International, Inc. | 93,924 | 5,751,906 | ||||||
L-3 Communications Holdings, Inc. | 78,399 | 5,785,846 | ||||||
Lockheed Martin Corp. | 61,948 | 5,802,669 | ||||||
Northrop Grumman Corp. | 86,388 | 5,933,992 | ||||||
Precision Castparts Corp. | 35,504 | 6,144,677 | ||||||
Raytheon Co. | 99,138 | 5,607,245 | ||||||
Rockwell Collins, Inc. | 107,908 | 5,781,711 | ||||||
Textron, Inc. | 202,064 | 5,094,033 | ||||||
United Technologies Corp. | 69,513 | 5,433,136 | ||||||
|
| |||||||
Total Aerospace & Defense | 62,841,428 | |||||||
|
| |||||||
Air Freight & Logistics - 0.8% |
| |||||||
C.H. Robinson Worldwide, Inc. | 100,054 | 6,036,258 | ||||||
Expeditors International of Washington, Inc. | 146,332 | 5,357,214 | ||||||
FedEx Corp. | 63,577 | 5,848,448 | ||||||
United Parcel Service, Inc. — Class B | 77,763 | 5,696,140 | ||||||
|
| |||||||
Total Air Freight & Logistics | 22,938,060 | |||||||
|
| |||||||
Airlines - 0.2% |
| |||||||
Southwest Airlines Co. | 631,826 | 5,572,705 | ||||||
|
| |||||||
Total Airlines | 5,572,705 | |||||||
|
| |||||||
Auto Components - 0.5% |
| |||||||
BorgWarner, Inc.* | 73,378 | 4,829,740 | ||||||
Goodyear Tire & Rubber Co. (The)* | 424,183 | 4,839,928 | ||||||
Johnson Controls, Inc. | 196,243 | 5,053,257 | ||||||
|
| |||||||
Total Auto Components | 14,722,925 | |||||||
|
| |||||||
Automobiles - 0.4% |
| |||||||
Ford Motor Co. | 544,204 | 6,073,317 | ||||||
Harley-Davidson, Inc. | 123,694 | 5,783,931 | ||||||
|
| |||||||
Total Automobiles | 11,857,248 | |||||||
|
| |||||||
Beverages - 1.8% |
| |||||||
Beam, Inc. | 97,191 | 5,399,932 | ||||||
Brown-Forman Corp. — Class B | 89,279 | 5,719,213 | ||||||
Coca-Cola Co. (The) | 150,341 | 5,589,678 | ||||||
Coca-Cola Enterprises, Inc. | 183,840 | 5,779,930 | ||||||
Constellation Brands, Inc. — Class A* | 178,019 | 6,291,191 | ||||||
Dr Pepper Snapple Group, Inc. | 129,996 | 5,570,329 | ||||||
Molson Coors Brewing Co. — Class B | 124,927 | 5,389,351 | ||||||
Monster Beverage Corp.* | 106,588 | 4,761,286 | ||||||
PepsiCo, Inc. | 81,319 | 5,630,527 | ||||||
|
| |||||||
Total Beverages | 50,131,437 | |||||||
|
| |||||||
Biotechnology - 1.0% |
| |||||||
Alexion Pharmaceuticals, Inc.* | 51,858 | 4,686,926 | ||||||
Amgen, Inc. | 70,429 | 6,095,278 | ||||||
| SHARES | VALUE | |||||||
Biogen Idec, Inc.* | 37,161 | $ | 5,136,394 | |||||
Celgene Corp.* | 75,132 | 5,508,678 | ||||||
Gilead Sciences, Inc.* | 92,402 | 6,205,718 | ||||||
|
| |||||||
Total Biotechnology | 27,632,994 | |||||||
|
| |||||||
Building Products - 0.2% |
| |||||||
Masco Corp. | 362,687 | 5,472,947 | ||||||
|
| |||||||
Total Building Products | 5,472,947 | |||||||
|
| |||||||
Capital Markets - 2.8% |
| |||||||
Ameriprise Financial, Inc. | 96,787 | 5,649,457 | ||||||
Bank of New York Mellon Corp. (The) | 242,608 | 5,994,844 | ||||||
BlackRock, Inc. | 31,345 | 5,945,520 | ||||||
Charles Schwab Corp. (The) | 397,131 | 5,393,039 | ||||||
E*Trade Financial Corp.* | 580,026 | 4,849,017 | ||||||
Federated Investors, Inc. — Class Ba | 263,462 | 6,122,857 | ||||||
Franklin Resources, Inc. | 44,784 | 5,723,395 | ||||||
Goldman Sachs Group, Inc. (The) | 47,222 | 5,779,501 | ||||||
Invesco Ltd. | 221,945 | 5,397,702 | ||||||
Legg Mason, Inc. | 212,636 | 5,417,965 | ||||||
Morgan Stanley | 314,183 | 5,460,501 | ||||||
Northern Trust Corp. | 116,649 | 5,573,489 | ||||||
State Street Corp. | 130,488 | 5,815,850 | ||||||
T. Rowe Price Group, Inc. | 87,072 | 5,654,456 | ||||||
|
| |||||||
Total Capital Markets | 78,777,593 | |||||||
|
| |||||||
Chemicals - 3.2% |
| |||||||
Air Products & Chemicals, Inc. | 67,017 | 5,195,828 | ||||||
Airgas, Inc. | 69,860 | 6,215,444 | ||||||
CF Industries Holdings, Inc. | 25,616 | 5,256,147 | ||||||
Dow Chemical Co. (The) | 177,711 | 5,206,932 | ||||||
Du Pont (E.I.) de Nemours & Co. | 109,681 | 4,882,998 | ||||||
Eastman Chemical Co. | 97,731 | 5,789,584 | ||||||
Ecolab, Inc. | 89,366 | 6,219,874 | ||||||
FMC Corp. | 97,876 | 5,238,324 | ||||||
International Flavors & Fragrances, Inc. | 95,129 | 6,147,236 | ||||||
LyondellBasell Industries NV — Class A | 107,282 | 5,727,786 | ||||||
Monsanto Co. | 64,415 | 5,544,199 | ||||||
Mosaic Co. (The) | 94,271 | 4,934,144 | ||||||
PPG Industries, Inc. | 48,225 | 5,646,183 | ||||||
Praxair, Inc. | 53,091 | 5,638,795 | ||||||
Sherwin-Williams Co. (The) | 39,194 | 5,588,281 | ||||||
Sigma-Aldrich Corp. | 77,734 | 5,452,263 | ||||||
|
| |||||||
Total Chemicals | 88,684,018 | |||||||
|
| |||||||
Commercial Banks - 2.5% |
| |||||||
BB&T Corp. | 168,594 | 4,880,796 | ||||||
Comerica, Inc. | 173,499 | 5,172,005 | ||||||
Fifth Third Bancorp | 363,150 | 5,276,570 | ||||||
First Horizon National Corp. | 560,164 | 5,215,127 | ||||||
Huntington Bancshares, Inc. | 797,018 | 5,092,945 | ||||||
KeyCorp | 633,917 | 5,337,581 | ||||||
M&T Bank Corp.a | 60,454 | 6,293,261 | ||||||
| 8 | GUGGENHEIM ETFS ANNUAL REPORT | See Notes to Financial Statements. |
Table of Contents
| SCHEDULE OF INVESTMENTS (continued) | October 31, 2012 |
GUGGENHEIM S&P 500® EQUAL WEIGHT ETF
| SHARES | VALUE | |||||||
PNC Financial Services Group, Inc. | 85,820 | $ | 4,993,866 | |||||
Regions Financial Corp. | 752,060 | 4,903,431 | ||||||
SunTrust Banks, Inc. | 191,607 | 5,211,710 | ||||||
US Bancorp | 164,064 | 5,448,566 | ||||||
Wells Fargo & Co. | 158,619 | 5,343,874 | ||||||
Zions Bancorp | 268,426 | 5,763,106 | ||||||
|
| |||||||
Total Commercial Banks | 68,932,838 | |||||||
|
| |||||||
Commercial Services & Supplies - 1.8% |
| |||||||
ADT Corp. (The)* | 147,652 | 6,129,034 | ||||||
Avery Dennison Corp. | 179,965 | 5,827,267 | ||||||
Cintas Corp. | 137,359 | 5,742,980 | ||||||
Iron Mountain, Inc. | 172,092 | 5,954,383 | ||||||
Pitney Bowes, Inc.a | 375,303 | 5,389,351 | ||||||
R.R. Donnelley & Sons Co.a | 483,182 | 4,841,484 | ||||||
Republic Services, Inc. | 200,310 | 5,678,788 | ||||||
Stericycle, Inc.* | 61,514 | 5,829,067 | ||||||
Waste Management, Inc. | 168,738 | 5,524,482 | ||||||
|
| |||||||
Total Commercial Services & Supplies | 50,916,836 | |||||||
|
| |||||||
Communications Equipment - 1.3% |
| |||||||
Cisco Systems, Inc. | 294,041 | 5,039,863 | ||||||
F5 Networks, Inc.* | 55,269 | 4,558,587 | ||||||
Harris Corp. | 113,440 | 5,193,283 | ||||||
JDS Uniphase Corp.* | 426,389 | 4,131,709 | ||||||
Juniper Networks, Inc.* | 296,470 | 4,912,508 | ||||||
Motorola Solutions, Inc. | 113,382 | 5,859,582 | ||||||
QUALCOMM, Inc. | 88,335 | 5,174,223 | ||||||
|
| |||||||
Total Communications Equipment | 34,869,755 | |||||||
|
| |||||||
Computers & Peripherals - 1.4% |
| |||||||
Apple, Inc. | 8,278 | 4,926,238 | ||||||
Dell, Inc. | 529,133 | 4,883,898 | ||||||
EMC Corp.* | 205,697 | 5,023,121 | ||||||
Hewlett-Packard Co. | 315,388 | 4,368,124 | ||||||
NetApp, Inc.* | 160,026 | 4,304,699 | ||||||
SanDisk Corp.* | 125,419 | 5,237,497 | ||||||
Seagate Technology PLC | 188,022 | 5,136,761 | ||||||
Western Digital Corp. | 139,566 | 4,777,344 | ||||||
|
| |||||||
Total Computers & Peripherals | 38,657,682 | |||||||
|
| |||||||
Construction & Engineering - 0.6% |
| |||||||
Fluor Corp. | 95,274 | 5,321,053 | ||||||
Jacobs Engineering Group, Inc.* | 132,290 | 5,105,071 | ||||||
Quanta Services, Inc.* | 221,945 | 5,755,034 | ||||||
|
| |||||||
Total Construction & Engineering | 16,181,158 | |||||||
|
| |||||||
Construction Materials - 0.2% |
| |||||||
Vulcan Materials Co. | 116,651 | 5,362,446 | ||||||
|
| |||||||
Total Construction Materials | 5,362,446 | |||||||
|
| |||||||
Consumer Finance - 0.8% |
| |||||||
American Express Co. | 96,671 | 5,410,676 | ||||||
Capital One Financial Corp. | 96,536 | 5,808,571 | ||||||
| SHARES | VALUE | |||||||
Discover Financial Services | 145,782 | $ | 5,977,062 | |||||
SLM Corp. | 341,514 | 6,003,816 | ||||||
|
| |||||||
Total Consumer Finance | 23,200,125 | |||||||
|
| |||||||
Containers & Packaging - 0.8% |
| |||||||
Ball Corp. | 132,406 | 5,670,949 | ||||||
Bemis Co., Inc. | 182,866 | 6,043,721 | ||||||
Owens-Illinois, Inc.* | 286,958 | 5,592,811 | ||||||
Sealed Air Corp. | 351,576 | 5,702,563 | ||||||
|
| |||||||
Total Containers & Packaging | 23,010,044 | |||||||
|
| |||||||
Distributors - 0.2% |
| |||||||
Genuine Parts Co. | 90,744 | 5,678,759 | ||||||
|
| |||||||
Total Distributors | 5,678,759 | |||||||
|
| |||||||
Diversified Consumer Services - 0.4% |
| |||||||
Apollo Group, Inc. — Class A* | 194,788 | 3,911,343 | ||||||
H&R Block, Inc. | 338,479 | 5,991,078 | ||||||
|
| |||||||
Total Diversified Consumer Services | 9,902,421 | |||||||
|
| |||||||
Diversified Financial Services - 1.8% |
| |||||||
Bank of America Corp. | 600,509 | 5,596,744 | ||||||
Citigroup, Inc. | 164,729 | 6,159,217 | ||||||
CME Group, Inc. | 97,307 | 5,442,381 | ||||||
IntercontinentalExchange, Inc.* | 40,920 | 5,360,520 | ||||||
JPMorgan Chase & Co. | 137,851 | 5,745,630 | ||||||
Leucadia National Corp. | 239,880 | 5,445,276 | ||||||
Moody’s Corp. | 130,777 | 6,298,220 | ||||||
NASDAQ OMX Group, Inc. (The) | 234,185 | 5,575,945 | ||||||
NYSE Euronext | 213,262 | 5,280,367 | ||||||
|
| |||||||
Total Diversified Financial Services | 50,904,300 | |||||||
|
| |||||||
Diversified Telecommunication Services - 1.0% |
| |||||||
AT&T, Inc. | 153,810 | 5,320,288 | ||||||
CenturyLink, Inc. | 135,239 | 5,190,473 | ||||||
Frontier Communications Corp.a | 1,232,399 | 5,816,923 | ||||||
Verizon Communications, Inc. | 128,676 | 5,744,097 | ||||||
Windstream Corp.a | 531,599 | 5,071,454 | ||||||
|
| |||||||
Total Diversified Telecommunication Services | 27,143,235 | |||||||
|
| |||||||
Electric Utilities - 2.8% |
| |||||||
American Electric Power Co., Inc. | 131,259 | 5,833,150 | ||||||
Duke Energy Corp. | 89,279 | 5,864,738 | ||||||
Edison International | 126,874 | 5,955,466 | ||||||
Entergy Corp. | 83,835 | 6,084,744 | ||||||
Exelon Corp. | 159,458 | 5,705,407 | ||||||
FirstEnergy Corp. | 132,406 | 6,053,602 | ||||||
NextEra Energy, Inc. | 84,528 | 5,922,032 | ||||||
Northeast Utilities | 151,806 | 5,965,976 | ||||||
Pepco Holdings, Inc. | 301,770 | 5,996,170 | ||||||
Pinnacle West Capital Corp. | 107,021 | 5,668,902 | ||||||
PPL Corp. | 197,129 | 5,831,076 | ||||||
Southern Co. (The) | 127,221 | 5,959,032 | ||||||
Xcel Energy, Inc. | 203,634 | 5,752,660 | ||||||
|
| |||||||
Total Electric Utilities | 76,592,955 | |||||||
|
| |||||||
| See Notes to Financial Statements. | GUGGENHEIM ETFS ANNUAL REPORT | 9 |
Table of Contents
| SCHEDULE OF INVESTMENTS (continued) | October 31, 2012 |
GUGGENHEIM S&P 500® EQUAL WEIGHT ETF
| SHARES | VALUE | |||||||
Electrical Equipment - 0.8% |
| |||||||
Cooper Industries PLC | 76,471 | $ | 5,730,736 | |||||
Emerson Electric Co. | 115,039 | 5,571,339 | ||||||
Rockwell Automation, Inc. | 80,914 | 5,749,749 | ||||||
Roper Industries, Inc. | 54,470 | 5,946,490 | ||||||
|
| |||||||
Total Electrical Equipment | 22,998,314 | |||||||
|
| |||||||
Electronic Equipment, Instruments & Components - 1.1% |
| |||||||
Amphenol Corp. — Class A | 90,715 | 5,454,693 | ||||||
Corning, Inc. | 436,788 | 5,132,259 | ||||||
FLIR Systems, Inc. | 271,856 | 5,282,162 | ||||||
Jabil Circuit, Inc. | 252,467 | 4,377,778 | ||||||
Molex, Inc.a | 205,042 | 5,324,941 | ||||||
TE Connectivity Ltd. | 154,407 | 4,968,817 | ||||||
|
| |||||||
Total Electronic Equipment, Instruments & Components | 30,540,650 | |||||||
|
| |||||||
Energy Equipment & Services - 2.2% |
| |||||||
Baker Hughes, Inc. | 114,529 | 4,806,782 | ||||||
Cameron International Corp.* | 97,134 | 4,918,866 | ||||||
Diamond Offshore Drilling, Inc.a | 83,005 | 5,747,266 | ||||||
Ensco PLC — Class A | 98,599 | 5,700,994 | ||||||
FMC Technologies, Inc.* | 114,702 | 4,691,312 | ||||||
Halliburton Co. | 153,068 | 4,942,566 | ||||||
Helmerich & Payne, Inc. | 111,291 | 5,319,710 | ||||||
Nabors Industries Ltd.* | 343,345 | 4,631,724 | ||||||
National Oilwell Varco, Inc. | 67,567 | 4,979,688 | ||||||
Noble Corp. | 148,770 | 5,614,580 | ||||||
Rowan Cos., PLC — Class A* | 154,302 | 4,892,916 | ||||||
Schlumberger Ltd. | 73,840 | 5,134,095 | ||||||
|
| |||||||
Total Energy Equipment & Services | 61,380,499 | |||||||
|
| |||||||
Food & Staples Retailing - 1.7% |
| |||||||
Costco Wholesale Corp. | 56,069 | 5,518,872 | ||||||
CVS Caremark Corp. | 122,100 | 5,665,440 | ||||||
Kroger Co. (The) | 240,777 | 6,072,396 | ||||||
Safeway, Inc.a | 339,886 | 5,543,540 | ||||||
Sysco Corp. | 188,822 | 5,866,699 | ||||||
Wal-Mart Stores, Inc. | 76,934 | 5,771,589 | ||||||
Walgreen Co. | 159,082 | 5,604,459 | ||||||
Whole Foods Market, Inc. | 58,623 | 5,553,357 | ||||||
|
| |||||||
Total Food & Staples Retailing | 45,596,352 | |||||||
|
| |||||||
Food Products - 3.1% |
| |||||||
Archer-Daniels-Midland Co. | 210,776 | 5,657,228 | ||||||
Campbell Soup Co.a | 165,876 | 5,850,446 | ||||||
ConAgra Foods, Inc. | 223,950 | 6,234,768 | ||||||
Dean Foods Co.* | 355,267 | 5,982,696 | ||||||
General Mills, Inc. | 147,363 | 5,906,309 | ||||||
H.J. Heinz Co. | 101,981 | 5,864,927 | ||||||
Hershey Co. (The) | 81,743 | 5,628,006 | ||||||
Hormel Foods Corp. | 197,737 | 5,839,174 | ||||||
J.M. Smucker Co. (The) | 66,564 | 5,700,541 | ||||||
Kellogg Co. | 114,182 | 5,974,002 | ||||||
Kraft Foods Group, Inc.* | 99,967 | 4,546,499 | ||||||
McCormick & Co., Inc. | 91,045 | 5,610,193 | ||||||
Mead Johnson Nutrition Co. | 76,250 | 4,701,575 | ||||||
| SHARES | VALUE | |||||||
Mondelez International, Inc. — Class A | 219,401 | $ | 5,822,903 | |||||
Tyson Foods, Inc. — Class A | 348,164 | 5,852,637 | ||||||
|
| |||||||
Total Food Products | 85,171,904 | |||||||
|
| |||||||
Gas Utilities - 0.4% |
| |||||||
AGL Resources, Inc. | 139,056 | 5,677,656 | ||||||
Oneok, Inc. | 121,689 | 5,755,890 | ||||||
|
| |||||||
Total Gas Utilities | 11,433,546 | |||||||
|
| |||||||
Health Care Equipment & Supplies - 2.8% |
| |||||||
Baxter International, Inc. | 94,753 | 5,934,380 | ||||||
Becton, Dickinson and Co. | 72,404 | 5,479,535 | ||||||
Boston Scientific Corp.* | 984,635 | 5,061,024 | ||||||
C.R. Bard, Inc. | 56,050 | 5,391,449 | ||||||
CareFusion Corp.* | 205,697 | 5,463,312 | ||||||
Covidien PLC | 97,105 | 5,335,920 | ||||||
DENTSPLY International, Inc. | 152,182 | 5,606,385 | ||||||
Edwards Lifesciences Corp.* | 54,527 | 4,734,579 | ||||||
Intuitive Surgical, Inc.* | 11,430 | 6,197,575 | ||||||
Medtronic, Inc. | 133,119 | 5,535,088 | ||||||
St Jude Medical, Inc. | 136,733 | 5,231,404 | ||||||
Stryker Corp. | 102,318 | 5,381,927 | ||||||
Varian Medical Systems, Inc.* | 93,038 | 6,211,217 | ||||||
Zimmer Holdings, Inc. | 85,675 | 5,501,192 | ||||||
|
| |||||||
Total Health Care Equipment & Supplies | 77,064,987 | |||||||
|
| |||||||
Health Care Providers & Services - 3.2% |
| |||||||
Aetna, Inc. | 146,794 | 6,414,898 | ||||||
AmerisourceBergen Corp. | 153,376 | 6,049,149 | ||||||
Cardinal Health, Inc. | 149,338 | 6,142,272 | ||||||
CIGNA Corp. | 119,887 | 6,114,237 | ||||||
Coventry Health Care, Inc. | 137,851 | 6,015,818 | ||||||
DaVita, Inc.* | 58,189 | 6,547,426 | ||||||
Express Scripts Holding Co.* | 91,207 | 5,612,879 | ||||||
Humana, Inc. | 80,577 | 5,984,454 | ||||||
Laboratory Corp. of America Holdings* | 62,979 | 5,336,211 | ||||||
McKesson Corp. | 65,562 | 6,117,590 | ||||||
Patterson Cos., Inc. | 166,647 | 5,566,010 | ||||||
Quest Diagnostics, Inc. | 93,125 | 5,375,175 | ||||||
Tenet Healthcare Corp.* | 248,722 | 5,869,839 | ||||||
UnitedHealth Group, Inc. | 105,643 | 5,916,008 | ||||||
WellPoint, Inc. | 98,223 | 6,019,105 | ||||||
|
| |||||||
Total Health Care Providers & Services | 89,081,071 | |||||||
|
| |||||||
Health Care Technology - 0.2% |
| |||||||
Cerner Corp.* | 79,566 | 6,062,134 | ||||||
|
| |||||||
Total Health Care Technology | 6,062,134 | |||||||
|
| |||||||
Hotels, Restaurants & Leisure - 2.1% |
| |||||||
Carnival Corp. | 150,977 | 5,719,009 | ||||||
Chipotle Mexican Grill, Inc.* | 17,019 | 4,331,846 | ||||||
Darden Restaurants, Inc. | 106,048 | 5,580,246 | ||||||
International Game Technology | 433,492 | 5,566,037 | ||||||
| 10 | GUGGENHEIM ETFS ANNUAL REPORT | See Notes to Financial Statements. |
Table of Contents
| SCHEDULE OF INVESTMENTS (continued) | October 31, 2012 |
GUGGENHEIM S&P 500® EQUAL WEIGHT ETF
| SHARES | VALUE | |||||||
Marriott International, Inc. — Class A | 137,764 | $ | 5,025,631 | |||||
McDonald’s Corp. | 62,488 | 5,423,958 | ||||||
Starbucks Corp. | 113,584 | 5,213,505 | ||||||
Starwood Hotels & Resorts Worldwide, Inc. | 94,416 | 4,895,470 | ||||||
Wyndham Worldwide Corp. | 106,617 | 5,373,497 | ||||||
Wynn Resorts Ltd. | 50,721 | 6,140,284 | ||||||
Yum! Brands, Inc. | 86,099 | 6,036,401 | ||||||
|
| |||||||
Total Hotels, Restaurants & Leisure | 59,305,884 | |||||||
|
| |||||||
Household Durables - 1.5% |
| |||||||
DR Horton, Inc. | 260,600 | 5,462,176 | ||||||
Harman International Industries, Inc. | 116,042 | 4,865,641 | ||||||
Leggett & Platt, Inc. | 229,221 | 6,081,233 | ||||||
Lennar Corp. — Class Aa | 157,135 | 5,887,849 | ||||||
Newell Rubbermaid, Inc. | 290,746 | 6,000,998 | ||||||
PulteGroup, Inc.* | 346,901 | 6,015,263 | ||||||
Whirlpool Corp. | 68,771 | 6,717,551 | ||||||
|
| |||||||
Total Household Durables | 41,030,711 | |||||||
|
| |||||||
Household Products - 0.8% |
| |||||||
Clorox Co. (The) | 81,174 | 5,868,880 | ||||||
Colgate-Palmolive Co. | 55,240 | 5,797,990 | ||||||
Kimberly-Clark Corp. | 69,311 | 5,784,003 | ||||||
Procter & Gamble Co. (The) | 82,861 | 5,737,296 | ||||||
|
| |||||||
Total Household Products | 23,188,169 | |||||||
|
| |||||||
Independent Power Producers & Energy |
| |||||||
AES Corp. (The) | 495,295 | 5,175,833 | ||||||
NRG Energy, Inc. | 259,309 | 5,590,702 | ||||||
|
| |||||||
Total Independent Power Producers & Energy Traders | 10,766,535 | |||||||
|
| |||||||
Industrial Conglomerates - 0.8% |
| |||||||
3M Co. | 60,975 | 5,341,410 | ||||||
Danaher Corp. | 104,641 | 5,413,079 | ||||||
General Electric Co. | 259,193 | 5,458,605 | ||||||
Tyco International Ltd. | 211,142 | 5,673,385 | ||||||
|
| |||||||
Total Industrial Conglomerates | 21,886,479 | |||||||
|
| |||||||
Insurance - 4.5% |
| |||||||
ACE Ltd. | 74,380 | 5,849,987 | ||||||
AFLAC, Inc. | 115,387 | 5,743,965 | ||||||
Allstate Corp. (The) | 143,778 | 5,748,244 | ||||||
American International Group, Inc.* | 163,640 | 5,715,945 | ||||||
Aon PLC | 107,908 | 5,821,637 | ||||||
Assurant, Inc. | 150,167 | 5,677,814 | ||||||
Berkshire Hathaway, Inc. — Class B* | 64,609 | 5,578,987 | ||||||
Chubb Corp. (The) | 75,324 | 5,798,442 | ||||||
Cincinnati Financial Corp. | 143,672 | 5,723,893 | ||||||
Genworth Financial, Inc. — Class A* | 936,382 | 5,580,837 | ||||||
Hartford Financial Services Group, Inc. | 281,744 | 6,116,662 | ||||||
| SHARES | VALUE | |||||||
Lincoln National Corp. | 222,119 | $ | 5,506,330 | |||||
Loews Corp. | 134,237 | 5,675,540 | ||||||
Marsh & McLennan Cos., Inc. | 164,209 | 5,588,032 | ||||||
MetLife, Inc. | 158,079 | 5,610,224 | ||||||
Principal Financial Group, Inc. | 196,532 | 5,412,491 | ||||||
Progressive Corp. (The) | 275,384 | 6,141,063 | ||||||
Prudential Financial, Inc. | 97,731 | 5,575,554 | ||||||
Torchmark Corp. | 108,621 | 5,495,136 | ||||||
Travelers Cos., Inc. (The) | 83,555 | 5,927,392 | ||||||
Unum Group | 273,919 | 5,555,077 | ||||||
XL Group PLC | 232,209 | 5,744,851 | ||||||
|
| |||||||
Total Insurance | 125,588,103 | |||||||
|
| |||||||
Internet & Catalog Retail - 1.0% |
| |||||||
Amazon.com, Inc.* | 21,915 | 5,102,250 | ||||||
Expedia, Inc. | 102,550 | 6,065,832 | ||||||
Netflix, Inc.*a | 94,695 | 7,489,428 | ||||||
priceline.com, Inc.* | 9,001 | 5,164,504 | ||||||
TripAdvisor, Inc.* | 158,908 | 4,813,323 | ||||||
|
| |||||||
Total Internet & Catalog Retail | 28,635,337 | |||||||
|
| |||||||
Internet Software & Services - 1.0% |
| |||||||
Akamai Technologies, Inc.* | 146,823 | 5,577,806 | ||||||
eBay, Inc.* | 114,673 | 5,537,559 | ||||||
Google, Inc. — Class A* | 8,076 | 5,489,822 | ||||||
VeriSign, Inc.* | 119,945 | 4,446,361 | ||||||
Yahoo!, Inc.* | 363,381 | 6,108,435 | ||||||
|
| |||||||
Total Internet Software & Services | 27,159,983 | |||||||
|
| |||||||
IT Services - 2.7% |
| |||||||
Accenture PLC — Class A | 86,966 | 5,862,378 | ||||||
Automatic Data Processing, Inc. | 98,049 | 5,666,252 | ||||||
Cognizant Technology Solutions Corp. — Class A* | 80,712 | 5,379,455 | ||||||
Computer Sciences Corp. | 165,240 | 5,031,558 | ||||||
Fidelity National Information Services, Inc. | 180,775 | 5,942,074 | ||||||
Fiserv, Inc.* | 79,825 | 5,982,085 | ||||||
International Business Machines Corp. | 27,707 | 5,389,843 | ||||||
Mastercard, Inc. — Class A | 12,615 | 5,814,632 | ||||||
Paychex, Inc. | 166,300 | 5,393,109 | ||||||
SAIC, Inc. | 441,491 | 4,851,986 | ||||||
Teradata Corp.* | 76,163 | 5,202,694 | ||||||
Total System Services, Inc. | 240,169 | 5,401,401 | ||||||
Visa, Inc. — Class A | 42,725 | 5,928,521 | ||||||
Western Union Co. (The) | 299,881 | 3,808,489 | ||||||
|
| |||||||
Total IT Services | 75,654,477 | |||||||
|
| |||||||
Leisure Equipment & Products - 0.4% |
| |||||||
Hasbro, Inc.a | 143,412 | 5,161,398 | ||||||
Mattel, Inc. | 158,426 | 5,826,908 | ||||||
|
| |||||||
Total Leisure Equipment & Products | 10,988,306 | |||||||
|
| |||||||
Life Sciences Tools & Services - 1.0% |
| |||||||
Agilent Technologies, Inc. | 144,240 | 5,191,198 | ||||||
| See Notes to Financial Statements. | GUGGENHEIM ETFS ANNUAL REPORT | 11 |
Table of Contents
| SCHEDULE OF INVESTMENTS (continued) | October 31, 2012 |
GUGGENHEIM S&P 500® EQUAL WEIGHT ETF
| SHARES | VALUE | |||||||
Life Technologies Corp.* | 117,102 | $ | 5,727,459 | |||||
PerkinElmer, Inc. | 188,764 | 5,838,470 | ||||||
Thermo Fisher Scientific, Inc. | 94,551 | 5,773,284 | ||||||
Waters Corp.* | 67,393 | 5,513,421 | ||||||
|
| |||||||
Total Life Sciences Tools & Services | 28,043,832 | |||||||
|
| |||||||
Machinery - 3.2% |
| |||||||
Caterpillar, Inc. | 61,514 | 5,217,002 | ||||||
Cummins, Inc. | 55,848 | 5,226,256 | ||||||
Deere & Co. | 69,889 | 5,971,316 | ||||||
Dover Corp. | 92,980 | 5,413,296 | ||||||
Eaton Corp.a | 121,342 | 5,729,769 | ||||||
Flowserve Corp. | 42,519 | 5,760,899 | ||||||
Illinois Tool Works, Inc. | 93,751 | 5,749,749 | ||||||
Ingersoll-Rand PLC | 124,099 | 5,836,376 | ||||||
Joy Global, Inc. | 93,038 | 5,810,223 | ||||||
PACCAR, Inc. | 133,119 | 5,769,378 | ||||||
Pall Corp. | 89,424 | 5,630,135 | ||||||
Parker Hannifin Corp. | 66,333 | 5,217,754 | ||||||
Pentair Ltd. | 128,050 | 5,408,832 | ||||||
Snap-on, Inc. | 78,052 | 6,035,761 | ||||||
Stanley Black & Decker, Inc. | 74,727 | 5,178,581 | ||||||
Xylem, Inc. | 224,123 | 5,437,224 | ||||||
|
| |||||||
Total Machinery | 89,392,551 | |||||||
|
| |||||||
Media - 3.2% |
| |||||||
Cablevision Systems Corp. — Class A | 337,505 | 5,879,337 | ||||||
CBS Corp. — Class B | 154,273 | 4,998,445 | ||||||
Comcast Corp. — Class A | 162,349 | 6,089,711 | ||||||
DIRECTV* | 105,875 | 5,411,271 | ||||||
Discovery Communications, | 97,538 | 5,756,693 | ||||||
Gannett Co., Inc. | 325,989 | 5,509,214 | ||||||
Interpublic Group of Cos., Inc. (The) | 491,884 | 4,968,029 | ||||||
McGraw-Hill Cos., Inc. (The) | 107,108 | 5,920,930 | ||||||
News Corp. — Class A | 232,286 | 5,556,281 | ||||||
Omnicom Group, Inc. | 106,251 | 5,090,486 | ||||||
Scripps Networks Interactive, Inc. — Class A | 91,949 | 5,583,143 | ||||||
Time Warner Cable, Inc. | 62,035 | 6,148,289 | ||||||
Time Warner, Inc. | 128,165 | 5,568,769 | ||||||
Viacom, Inc. — Class B | 109,941 | 5,636,675 | ||||||
Walt Disney Co. (The) | 109,450 | 5,370,712 | ||||||
Washington Post Co. (The) — Class Ba | 15,930 | 5,312,814 | ||||||
|
| |||||||
Total Media | 88,800,799 | |||||||
|
| |||||||
Metals & Mining - 1.5% |
| |||||||
Alcoa, Inc. | 582,378 | 4,990,979 | ||||||
Allegheny Technologies, Inc. | 155,930 | 4,108,756 | ||||||
Cliffs Natural Resources, Inc. | 125,814 | 4,563,274 | ||||||
Freeport-McMoRan Copper & Gold, Inc. | 134,381 | 5,224,733 | ||||||
Newmont Mining Corp. | 100,198 | 5,465,801 | ||||||
| SHARES | VALUE | |||||||
Nucor Corp. | 140,626 | $ | 5,643,321 | |||||
Titanium Metals Corp. | 414,352 | 4,852,062 | ||||||
United States Steel Corp.a | 256,418 | 5,228,363 | ||||||
|
| |||||||
Total Metals & Mining | 40,077,289 | |||||||
|
| |||||||
Multi-Utilities - 3.0% |
| |||||||
Ameren Corp. | 175,417 | 5,767,711 | ||||||
CenterPoint Energy, Inc. | 272,637 | 5,908,044 | ||||||
CMS Energy Corp. | 247,108 | 6,009,667 | ||||||
Consolidated Edison, Inc. | 95,813 | 5,785,189 | ||||||
Dominion Resources, Inc. | 108,476 | 5,725,363 | ||||||
DTE Energy Co. | 97,452 | 6,051,769 | ||||||
Integrys Energy Group, Inc. | 107,166 | 5,791,251 | ||||||
NiSource, Inc. | 223,747 | 5,698,836 | ||||||
PG&E Corp. | 132,493 | 5,633,602 | ||||||
Public Service Enterprise Group, Inc. | 179,860 | 5,762,714 | ||||||
SCANA Corp.a | 118,364 | 5,809,305 | ||||||
Sempra Energy | 87,101 | 6,075,295 | ||||||
TECO Energy, Inc. | 328,225 | 5,865,381 | ||||||
Wisconsin Energy Corp. | 153,347 | 5,899,259 | ||||||
|
| |||||||
Total Multi-Utilities | 81,783,386 | |||||||
|
| |||||||
Multiline Retail - 1.6% |
| |||||||
Big Lots, Inc.* | 180,023 | 5,244,070 | ||||||
Dollar Tree, Inc.* | 121,400 | 4,840,218 | ||||||
Family Dollar Stores, Inc. | 89,250 | 5,886,930 | ||||||
J.C. Penney Co., Inc.a | 198,855 | 4,774,509 | ||||||
Kohl’s Corp. | 107,311 | 5,717,530 | ||||||
Macy’s, Inc. | 146,042 | 5,559,819 | ||||||
Nordstrom, Inc. | 99,572 | 5,652,702 | ||||||
Target Corp. | 88,624 | 5,649,780 | ||||||
|
| |||||||
Total Multiline Retail | 43,325,558 | |||||||
|
| |||||||
Office Electronics - 0.2% |
| |||||||
Xerox Corp. | 729,075 | 4,695,243 | ||||||
|
| |||||||
Total Office Electronics | 4,695,243 | |||||||
|
| |||||||
Oil, Gas & Consumable Fuels - 6.1% |
| |||||||
Anadarko Petroleum Corp. | 75,816 | 5,216,899 | ||||||
Apache Corp. | 61,977 | 5,128,597 | ||||||
Cabot Oil & Gas Corp. | 124,956 | 5,870,433 | ||||||
Chesapeake Energy Corp. | 279,277 | 5,658,152 | ||||||
Chevron Corp. | 48,880 | 5,387,065 | ||||||
ConocoPhillips | 98,454 | 5,695,564 | ||||||
CONSOL Energy, Inc. | 174,610 | 6,139,288 | ||||||
Denbury Resources, Inc.* | 324,668 | 4,977,160 | ||||||
Devon Energy Corp. | 90,252 | 5,253,569 | ||||||
EOG Resources, Inc. | 48,706 | 5,673,762 | ||||||
EQT Corp. | 96,729 | 5,864,679 | ||||||
Exxon Mobil Corp. | 62,093 | 5,661,019 | ||||||
Hess Corp. | 102,232 | 5,342,644 | ||||||
Kinder Morgan, Inc. | 158,166 | 5,489,942 | ||||||
Marathon Oil Corp. | 184,321 | 5,540,689 | ||||||
Marathon Petroleum Corp. | 103,032 | 5,659,548 | ||||||
Murphy Oil Corp. | 101,895 | 6,113,700 | ||||||
Newfield Exploration Co.* | 162,754 | 4,413,889 | ||||||
| 12 | GUGGENHEIM ETFS ANNUAL REPORT | See Notes to Financial Statements. |
Table of Contents
| SCHEDULE OF INVESTMENTS (continued) | October 31, 2012 |
GUGGENHEIM S&P 500® EQUAL WEIGHT ETF
| SHARES | VALUE | |||||||
Noble Energy, Inc. | 59,231 | $ | 5,627,537 | |||||
Occidental Petroleum Corp. | 62,324 | 4,921,103 | ||||||
Peabody Energy Corp. | 223,747 | 6,242,541 | ||||||
Phillips 66 | 122,634 | 5,783,419 | ||||||
Pioneer Natural Resources Co. | 50,634 | 5,349,482 | ||||||
QEP Resources, Inc. | 172,487 | 5,002,123 | ||||||
Range Resources Corp. | 81,743 | 5,342,723 | ||||||
Southwestern Energy Co.* | 160,797 | 5,579,656 | ||||||
Spectra Energy Corp. | 198,970 | 5,744,264 | ||||||
Tesoro Corp. | 140,289 | 5,290,298 | ||||||
Valero Energy Corp. | 169,798 | 4,941,122 | ||||||
Williams Cos., Inc. (The) | 163,264 | 5,712,607 | ||||||
WPX Energy, Inc.* | 327,849 | 5,553,762 | ||||||
|
| |||||||
Total Oil, Gas & Consumable Fuels | 170,177,236 | |||||||
|
| |||||||
Paper & Forest Products - 0.4% |
| |||||||
International Paper Co. | 161,346 | 5,781,027 | ||||||
MeadWestvaco Corp. | 185,989 | 5,522,014 | ||||||
|
| |||||||
Total Paper & Forest Products | 11,303,041 | |||||||
|
| |||||||
Personal Products - 0.4% |
| |||||||
Avon Products, Inc. | 351,778 | 5,449,041 | ||||||
Estee Lauder Cos., Inc. (The) — Class A | 93,577 | 5,766,215 | ||||||
|
| |||||||
Total Personal Products | 11,215,256 | |||||||
|
| |||||||
Pharmaceuticals - 2.5% |
| |||||||
Abbott Laboratories | 83,950 | 5,500,404 | ||||||
Allergan, Inc. | 64,271 | 5,779,248 | ||||||
Bristol-Myers Squibb Co. | 172,410 | 5,732,633 | ||||||
Eli Lilly & Co. | 122,663 | 5,965,102 | ||||||
Forest Laboratories, Inc.* | 164,353 | 5,540,340 | ||||||
Hospira, Inc.* | 165,298 | 5,072,996 | ||||||
Johnson & Johnson | 83,699 | 5,927,563 | ||||||
Merck & Co., Inc. | 131,375 | 5,994,641 | ||||||
Mylan, Inc.* | 235,813 | 5,975,501 | ||||||
Perrigo Co. | 50,971 | 5,862,175 | ||||||
Pfizer, Inc. | 240,777 | 5,988,124 | ||||||
Watson Pharmaceuticals, Inc.* | 69,995 | 6,016,070 | ||||||
|
| |||||||
Total Pharmaceuticals | 69,354,797 | |||||||
|
| |||||||
Professional Services - 0.6% |
| |||||||
Dun & Bradstreet Corp. (The) | 68,077 | 5,516,960 | ||||||
Equifax, Inc. | 121,034 | 6,056,542 | ||||||
Robert Half International, Inc. | 208,771 | 5,613,852 | ||||||
|
| |||||||
Total Professional Services | 17,187,354 | |||||||
|
| |||||||
Real Estate Investment Trusts (REITs) - 3.2% |
| |||||||
American Tower Corp. | 80,317 | 6,047,067 | ||||||
Apartment Investment & Management Co. — Class A | 208,993 | 5,578,023 | ||||||
AvalonBay Communities, Inc. | 40,544 | 5,496,145 | ||||||
Boston Properties, Inc. | 49,372 | 5,248,243 | ||||||
Equity Residential | 95,158 | 5,463,021 | ||||||
HCP, Inc. | 123,433 | 5,468,082 | ||||||
Health Care REIT, Inc. | 97,962 | 5,821,882 | ||||||
Host Hotels & Resorts, Inc. | 332,205 | 4,803,684 | ||||||
| SHARES | VALUE | |||||||
Kimco Realty Corp. | 272,493 | $ | 5,319,063 | |||||
Plum Creek Timber Co., Inc. | 131,201 | 5,759,724 | ||||||
ProLogis, Inc. | 155,362 | 5,327,363 | ||||||
Public Storage | 38,510 | 5,338,641 | ||||||
Simon Property Group, Inc. | 35,214 | 5,359,923 | ||||||
Ventas, Inc. | 88,084 | 5,573,075 | ||||||
Vornado Realty Trust | 67,335 | 5,400,940 | ||||||
Weyerhaeuser Co. | 211,055 | 5,844,113 | ||||||
|
| |||||||
Total Real Estate Investment Trusts (REITs) | 87,848,989 | |||||||
|
| |||||||
Real Estate Management & Development - 0.2% |
| |||||||
CBRE Group, Inc.* | 281,455 | 5,071,819 | ||||||
|
| |||||||
Total Real Estate Management & Development | 5,071,819 | |||||||
|
| |||||||
Road & Rail - 0.8% |
| |||||||
CSX Corp. | 247,445 | 5,065,199 | ||||||
Norfolk Southern Corp. | 76,732 | 4,707,508 | ||||||
Ryder System, Inc. | 133,292 | 6,014,135 | ||||||
Union Pacific Corp. | 44,611 | 5,488,492 | ||||||
|
| |||||||
Total Road & Rail | 21,275,334 | |||||||
|
| |||||||
Semiconductors & Semiconductor |
| |||||||
Advanced Micro Devices, Inc.*a | 1,469,389 | 3,012,247 | ||||||
Altera Corp. | 150,167 | 4,577,090 | ||||||
Analog Devices, Inc. | 137,475 | 5,376,647 | ||||||
Applied Materials, Inc. | 475,588 | 5,041,233 | ||||||
Broadcom Corp. — Class A* | 158,166 | 4,987,765 | ||||||
First Solar, Inc.* | 232,864 | 5,660,924 | ||||||
Intel Corp. | 245,209 | 5,302,645 | ||||||
KLA-Tencor Corp. | 109,199 | 5,079,937 | ||||||
Lam Research Corp.* | 166,820 | 5,905,428 | ||||||
Linear Technology Corp. | 170,203 | 5,320,546 | ||||||
LSI Corp.* | 726,329 | 4,975,354 | ||||||
Microchip Technology, Inc.a | 166,820 | 5,229,807 | ||||||
Micron Technology, Inc.* | 855,323 | 4,640,127 | ||||||
NVIDIA Corp.* | 414,063 | 4,956,334 | ||||||
Teradyne, Inc.*a | 348,790 | 5,099,310 | ||||||
Texas Instruments, Inc. | 193,862 | 5,445,584 | ||||||
Xilinx, Inc. | 162,667 | 5,328,971 | ||||||
|
| |||||||
Total Semiconductors & Semiconductor Equipment | 85,939,949 | |||||||
|
| |||||||
Software 2.3% | ||||||||
Adobe Systems, Inc.* | 171,890 | 5,844,260 | ||||||
Autodesk, Inc.* | 171,234 | 5,452,091 | ||||||
BMC Software, Inc.* | 132,974 | 5,412,042 | ||||||
CA, Inc. | 209,822 | 4,725,191 | ||||||
Citrix Systems, Inc.* | 70,111 | 4,333,561 | ||||||
Electronic Arts, Inc.* | 395,213 | 4,880,881 | ||||||
Intuit, Inc. | 95,071 | 5,649,119 | ||||||
Microsoft Corp. | 183,608 | 5,239,254 | ||||||
Oracle Corp. | 173,923 | 5,400,309 | ||||||
Red Hat, Inc.* | 95,505 | 4,695,981 | ||||||
Salesforce.com, Inc.* | 35,927 | 5,244,623 | ||||||
| See Notes to Financial Statements. | GUGGENHEIM ETFS ANNUAL REPORT | 13 |
Table of Contents
| SCHEDULE OF INVESTMENTS (concluded) | October 31, 2012 |
GUGGENHEIM S&P 500® EQUAL WEIGHT ETF
| SHARES | VALUE | |||||||
Symantec Corp.* | 299,400 | $ | 5,446,086 | |||||
|
| |||||||
Total Software | 62,323,398 | |||||||
|
| |||||||
Specialty Retail 3.6% | ||||||||
Abercrombie & Fitch Co. — Class A | 145,590 | 4,452,142 | ||||||
AutoNation, Inc.*a | 135,904 | 6,034,138 | ||||||
AutoZone, Inc.* | 16,277 | 6,103,875 | ||||||
Bed Bath & Beyond, Inc.* | 80,027 | 4,615,957 | ||||||
Best Buy Co., Inc. | 308,420 | 4,691,068 | ||||||
CarMax, Inc.* | 177,190 | 5,980,162 | ||||||
GameStop Corp. — Class Aa | 247,532 | 5,651,156 | ||||||
Gap, Inc. (The) | 162,811 | 5,815,609 | ||||||
Home Depot, Inc. | 96,392 | 5,916,541 | ||||||
Limited Brands, Inc. | 113,893 | 5,454,336 | ||||||
Lowe’s Cos., Inc. | 194,922 | 6,311,574 | ||||||
O’Reilly Automotive, Inc.* | 71,286 | 6,107,784 | ||||||
PetSmart, Inc. | 82,889 | 5,503,001 | ||||||
Ross Stores, Inc. | 84,210 | 5,132,600 | ||||||
Staples, Inc. | 469,334 | 5,404,381 | ||||||
Tiffany & Co. | 87,361 | 5,522,962 | ||||||
TJX Cos., Inc. | 123,350 | 5,135,061 | ||||||
Urban Outfitters, Inc.* | 144,327 | 5,161,134 | ||||||
|
| |||||||
Total Specialty Retail | 98,993,481 | |||||||
|
| |||||||
Textiles, Apparel & Luxury Goods - 1.0% |
| |||||||
Coach, Inc. | 92,354 | 5,176,442 | ||||||
Fossil, Inc.* | 61,235 | 5,333,568 | ||||||
NIKE, Inc. — Class B | 59,307 | 5,419,474 | ||||||
Ralph Lauren Corp. | 35,185 | 5,407,583 | ||||||
V.F. Corp. | 34,867 | 5,455,988 | ||||||
|
| |||||||
Total Textiles, Apparel & Luxury Goods | 26,793,055 | |||||||
|
| |||||||
Thrifts & Mortgage Finance - 0.4% |
| |||||||
Hudson City Bancorp, Inc. | 721,741 | 6,123,972 | ||||||
People’s United Financial, Inc. | 460,283 | 5,537,205 | ||||||
|
| |||||||
Total Thrifts & Mortgage Finance | 11,661,177 | |||||||
|
| |||||||
Tobacco - 0.8% |
| |||||||
Altria Group, Inc. | 173,981 | 5,532,596 | ||||||
Lorillard, Inc. | 49,738 | 5,770,105 | ||||||
Philip Morris International, Inc. | 64,039 | 5,671,294 | ||||||
Reynolds American, Inc. | 130,372 | 5,428,690 | ||||||
|
| |||||||
Total Tobacco | 22,402,685 | |||||||
|
| |||||||
Trading Companies & Distributors - 0.4% |
| |||||||
Fastenal Co. | 129,486 | 5,788,024 | ||||||
W.W. Grainger, Inc. | 27,823 | 5,603,831 | ||||||
|
| |||||||
Total Trading Companies & Distributors | 11,391,855 | |||||||
|
| |||||||
| SHARES | VALUE | |||||||
Wireless Telecommunication Services - 0.6% |
| |||||||
Crown Castle International Corp.* | 90,252 | $ | 6,024,321 | |||||
MetroPCS Communications, Inc.* | 539,106 | 5,504,272 | ||||||
Sprint Nextel Corp.* | 1,089,479 | 6,035,714 | ||||||
|
| |||||||
Total Wireless Telecommunication Services | 17,564,307 | |||||||
|
| |||||||
Total Common Stocks | 2,760,139,741 | |||||||
|
| |||||||
FACE | ||||||||
REPURCHASE AGREEMENT - 0.4% |
| |||||||
State Street Bank & Trust Co., 0.010%, dated 10/31/12, to be repurchased at $10,136,003 on 11/01/12 collateralized by $10,305,000 FNMA at 0.74% due 06/04/15 with a value of $10,371,826b | $ | 10,136,000 | 10,136,000 | |||||
|
| |||||||
Total Repurchase Agreement |
| 10,136,000 | ||||||
|
| |||||||
SECURITIES LENDING COLLATERAL - 2.3%d |
| |||||||
Joint Repurchase Agreements | ||||||||
Merrill Lynch, Fenner & Smith, Inc. issued 10/31/12 at 0.28% due 11/01/12b | 24,124,108 | 24,124,108 | ||||||
RBS Securities, Inc. issued 10/31/12 at 0.28% due 11/01/12b | 41,017,015 | 41,017,015 | ||||||
|
| |||||||
Total Securities Lending Collateral |
| 65,141,123 | ||||||
|
| |||||||
Total Investments 102.3%c |
| 2,835,416,864 | ||||||
|
| |||||||
Other Assets and Liabilities, |
| (62,976,904 | ) | |||||
|
| |||||||
Net Assets - 100.0% |
| $ | 2,772,439,960 | |||||
|
| |||||||
| * | Non-Income Producing Security. |
| a | All or a portion of this security was on loan as of October 31, 2012. |
| b | Values determined based on Level 2 inputs (Note E). |
| c | Unless otherwise indicated, the values of the Investments are determined based on Level 1 inputs. |
| d | Securities lending collateral (Note H). |
| 14 | GUGGENHEIM ETFS ANNUAL REPORT | See Notes to Financial Statements. |
Table of Contents
| STATEMENT OF ASSETS AND LIABILITIES | October 31, 2012 |
Guggenheim S&P 500® Equal Weight ETF | ||||
| ASSETS: | ||||
Investments, at value*—including $62,708,611 of securities loaned | $ | 2,835,416,864 | ||
Cash | 306 | |||
Receivables: | ||||
Investments sold | 23,272,948 | |||
Dividends and interest | 3,143,125 | |||
Total assets | 2,861,833,243 | |||
| LIABILITIES: | ||||
Payable upon return of securities loaned | 65,141,123 | |||
Payable for: | ||||
Fund shares repurchased | 23,293,937 | |||
Accrued management fees | 958,223 | |||
Total liabilities | 89,393,283 | |||
| NET ASSETS | $ | 2,772,439,960 | ||
| NETASSETSCONSISTOF: | ||||
Paid-in capital | $ | 3,272,191,996 | ||
Undistributed net investment income | 1,012,830 | |||
Accumulated net realized loss on investments | (560,129,277 | ) | ||
Net unrealized appreciation on investments | 59,364,411 | |||
| NETASSETS | $ | 2,772,439,960 | ||
Shares outstanding (unlimited shares authorized), no par value | 53,558,863 | |||
Net asset value, offering price and repurchase price per share | $51.76 | |||
*Total cost of investments | $ | 2,776,052,453 | ||
| See Notes to Financial Statements. | GUGGENHEIM ETFS ANNUAL REPORT | 15 |
Table of Contents
| STATEMENT OF OPERATIONS |
For the Year Ended October 31, 2012
| Guggenheim S&P 500® Equal Weight ETF | ||||
| INVESTMENT INCOME: | ||||
Dividends, net of foreign taxes withheld* | $ | 57,426,486 | ||
Income from securities lending | 98,018 | |||
Interest | 495 | |||
Total investment income | 57,524,999 | |||
| EXPENSES: | ||||
Management fee | 11,437,956 | |||
Total expenses | 11,437,956 | |||
Net investment income | 46,087,043 | |||
| NET REALIZEDAND UNREALIZED GAIN (LOSS): | ||||
Net realized gain (loss) on: | ||||
Investments | (71,611,588 | ) | ||
In-kind redemptions | 139,305,943 | |||
Net realized gain | 67,694,355 | |||
Net change in unrealized appreciation (depreciation) on: | ||||
Investments | 179,598,926 | |||
Net realized and unrealized gain | 247,293,281 | |||
Net increase in net assets resulting from operations | $ | 293,380,324 | ||
* Foreign taxes withheld | $ | (316 | ) | |
| 16 | GUGGENHEIM ETFS ANNUAL REPORT | See Notes to Financial Statements. |
Table of Contents
| STATEMENTS OF CHANGES IN NET ASSETS |
| Guggenheim S&P 500® Equal Weight ETF | ||||||||
| Year Ended October 31, 2012 | Year Ended October 31, 2011 | |||||||
| INCREASE (DECREASE) IN NET ASSETS FROM OPERATIONS: | ||||||||
Net investment income | $ | 46,087,043 | $ | 42,464,646 | ||||
Net realized gain on investments | 67,694,355 | 277,178,204 | ||||||
Net change in unrealized appreciation (depreciation) on investments | 179,598,926 | (197,398,983 | ) | |||||
Net increase in net assets resulting from operations | 293,380,324 | 122,243,867 | ||||||
| DISTRIBUTIONSTO SHAREHOLDERSFROM: | ||||||||
Net investment income | (44,494,825 | ) | (40,649,421 | ) | ||||
| SHAREHOLDERTRANSACTIONS: | ||||||||
Proceeds from shares purchased | 746,295,733 | 2,816,559,505 | ||||||
Value of shares redeemed | (1,286,550,125 | ) | (1,988,604,371 | ) | ||||
Net increase (decrease) in net assets resulting from share transactions | (540,254,392 | ) | 827,955,134 | |||||
Net increase (decrease) in net assets | (291,368,893 | ) | 909,549,580 | |||||
| NETASSETS | ||||||||
Beginning of year | 3,063,808,853 | 2,154,259,273 | ||||||
End of year | $ | 2,772,439,960 | $ | 3,063,808,853 | ||||
Undistributed net investment income at end of year | $ | 1,012,830 | $ | 818,113 | ||||
| CHANGESINSHARESOUTSTANDING: | ||||||||
Shares sold | 15,100,000 | 58,750,000 | ||||||
Shares redeemed | (27,050,000 | ) | (42,350,000 | ) | ||||
Net increase (decrease) in shares | (11,950,000 | ) | 16,400,000 | |||||
| See Notes to Financial Statements. | GUGGENHEIM ETFS ANNUAL REPORT | 17 |
Table of Contents
GUGGENHEIM S&P 500® EQUAL WEIGHT ETF
| Year Ended October 31, 2012 | Year Ended October 31, 2011 | Year Ended October 31, 2010 | Year Ended October 31, 2009 | Year Ended October 31, 2008 | ||||||||||||||||
Per Share Data: | ||||||||||||||||||||
Net asset value, beginning of year | $46.77 | $43.87 | $35.99 | $30.01 | $50.63 | |||||||||||||||
Income from investment operations: | ||||||||||||||||||||
Net investment income* | 0.80 | 0.69 | 0.60 | 0.54 | 0.72 | |||||||||||||||
Net gain (loss) on investments (realized and unrealized) | 4.97 | 2.87 | 7.87 | 5.98 | (20.64 | ) | ||||||||||||||
|
|
|
|
|
|
|
|
|
| |||||||||||
Total from investment operations | 5.77 | 3.56 | 8.47 | 6.52 | (19.92 | ) | ||||||||||||||
Less distributions from: | ||||||||||||||||||||
Net investment income | (0.78 | ) | (0.66 | ) | (0.59 | ) | (0.54 | ) | (0.70 | ) | ||||||||||
Net asset value, end of year | $51.76 | $46.77 | $43.87 | $35.99 | $30.01 | |||||||||||||||
|
|
|
|
|
|
|
|
|
| |||||||||||
Total Return** | 12.42% | 8.12% | 23.67% | 22.21% | (39.75% | ) | ||||||||||||||
Ratios/Supplemental Data: | ||||||||||||||||||||
Net assets, end of year (in thousands) | $2,772,440 | $3,063,809 | $2,154,259 | $1,499,351 | $843,417 | |||||||||||||||
Ratio to average net assets of: | ||||||||||||||||||||
Net investment income | 1.61% | 1.45% | 1.48% | 1.75% | 1.65% | |||||||||||||||
Total expenses | 0.40% | 0.40% | 0.40% | 0.40% | 0.40% | |||||||||||||||
Portfolio turnover rate† | 20% | 21% | 20% | 37% | 32% | |||||||||||||||
| * | Based on average shares outstanding. |
| ** | Total investment return is calculated assuming an initial investment made at the net asset value at the beginning of the period, reinvestment of all dividends and distribution at net asset value during the period, and redemption on the last day of the period. Transaction fees are not reflected in the calculation of total investment return. Total investment return calculated for a period of less than one year is not annualized. |
| † | Portfolio turnover does not include securities received or delivered from processing creations or redemptions. |
| 18 | GUGGENHEIM ETFS ANNUAL REPORT | See Notes to Financial Statements. |
Table of Contents
| NOTES TO FINANCIAL STATEMENTS |
1. Organization
Rydex ETF Trust (the “Trust”) is an open-end, management investment company registered under the Investment Company Act of 1940 (the “1940 Act”). The Trust was organized as a Delaware statutory trust on November 22, 2002. As of October 31, 2012, the Trust offers twenty-six portfolios, each of which represents a separate series of beneficial interest in the Trust. The financial statements herein relate to the Guggenheim S&P 500® Equal Weight ETF (the “Fund”). Guggenheim S&P 500® Equal Weight ETF commenced operations on April 24, 2003.
The Funds investment objective is to replicate as closely as possible, before fees and expenses, the daily performance of an index representing publicly traded equity securities (the “Underlying Index”). The Guggenheim S&P 500® Equal Weight ETF tracks the S&P 500 Equal Weight Total Return Index. The Fund seeks to achieve its objective by investing in common stocks or ETFs, where applicable, that comprise the Underlying Index. The Fund uses a “replication” strategy to track the Underlying Index. “Replication” refers to investing in substantially all of the securities in the Underlying Index in approximately the same proportions as in the Underlying Index.
The Fund operates as index fund and is not actively managed. Adverse performance of a security in the Fund’s portfolio will ordinarily not result in the elimination of the security from the Fund’s portfolio.
The Fund issues and redeems shares on a continuous basis, at Net Asset Value per share (“NAV”), only in aggregation of 50,000 shares called a “Creation Unit”. Creation Units are issued and redeemed principally in-kind for securities included in the Underlying Index.
Guggenheim Investments (“GI”) provides advisory services and Rydex Distributors, LLC (“RDL”) acts as principal underwriter for the Trust. GI and RDL are affiliated entities.
2. Significant Accounting Policies
The following significant accounting policies are in conformity with U.S. generally accepted accounting principles (“U.S. GAAP”) and are consistently followed by the Trust. This requires management to make estimates and assumptions that affect the reported amount of assets and liabilities and disclosure of contingent assets and liabilities at the date of the financial statements and the reported amounts of revenues and expenses during the reporting period. Actual results could differ from these estimates. All time references are based on Eastern Time.
A. Security Valuation
Equity securities listed on an exchange (New York Stock Exchange (“NYSE”) or American Stock Exchange) are valued at the last quoted sales price as of the close of business on the NYSE, usually 4:00 p.m. on the valuation date. Equity securities listed on the NASDAQ market system are valued at the
NASDAQ Official Closing Price on the valuation date. The Fund invests in money market mutual funds, which are valued at their NAV.
Investments for which market quotations are not readily available are fair valued as determined in good faith by GI under the direction of the Board of Trustees using methods established or ratified by the Board of Trustees. These methods include, but are not limited to: (i) using general information as to how these securities and assets trade; and (ii) using other information and considerations, including current values in related markets.
Debt securities with a maturity of greater than 60 days at acquisition are valued at prices that reflect broker/dealer supplied valuations or are obtained from independent pricing services, which may consider the trade activity, treasury yields, yield or price of bonds of comparable quality, coupon, maturity, and type, as well as prices quoted by dealers who make markets in such securities. Short-term debt securities with a maturity of 60 days or less at acquisition and repurchase agreements are valued at amortized cost, which approximates market value.
B. Security Transactions and Income Recognition
Security transactions are recorded on the trade date for financial reporting purposes. Realized gains and losses from securities transactions are recorded using the identified cost basis. Proceeds from lawsuits related to investment holdings are recorded as realized gains in the respective fund. Dividend income is recorded on the ex-dividend date, net of applicable taxes withheld by foreign countries. Taxable non-cash dividends are recorded as dividend income. Interest income, including amortization of premiums and accretion of discounts, is accrued on a daily basis. Distributions received from investments in REITs are recorded as dividend income on the ex-dividend date, subject to reclassification upon notice of the character of such distribution by the issuer.
C. Repurchase Agreements
The Fund may enter into repurchase agreements with financial institutions. In a repurchase agreement, a Fund buys a security and the seller simultaneously agrees to repurchase the security on a specified future date at an agreed-upon price. The repurchase price reflects an agreed-upon interest rate during the time the Fund’s money is invested in the security. Because the security constitutes collateral for the repurchase obligation, a repurchase agreement can be considered a collateralized loan. The Fund follows certain procedures designed to minimize the risks inherent in such agreements. These procedures include effecting repurchase transactions only with large, well-capitalized and well-established financial institutions whose condition will be continually monitored by GI. In addition, the value of the collateral underlying the repurchase agreement will always be at least equal to the repurchase price, including any accrued interest earned on the repurchase agreement. In the event of a default or
| GUGGENHEIM ETFS ANNUAL REPORT | 19 |
Table of Contents
NOTES TO FINANCIAL STATEMENTS (continued)
|
bankruptcy by a selling financial institution, the Fund will seek to liquidate such collateral. However, the exercising of the Fund’s right to liquidate such collateral could involve certain costs or delays and, to the extent that proceeds from any sale upon a default of the obligation to repurchase were less than the repurchase price, the Fund could suffer a loss. It is the current policy of the Fund not to invest in repurchase agreements that do not mature within seven days if any such investment, together with any other illiquid assets held by the Fund, amounts to more than 15% of the Fund’s net assets. The investments of the Fund in repurchase agreements, at times, may be substantial when, in the view of GI, liquidity or other considerations so warrant.
D. Federal Income Taxes
The Fund intends to comply with the provisions of Subchapter M of the Internal Revenue Code applicable to regulated investment companies and will distribute substantially all taxable net investment income and capital gains sufficient to relieve the fund from all, or substantially all, federal income, excise and state income taxes. Therefore, no provision for Federal or state income tax is required.
Tax positions taken or expected to be taken in the course of preparing the Fund’s tax returns are evaluated to determine whether the tax positions are “more-likely-than-not” of being sustained by the applicable tax authority. Tax positions not deemed to meet the more-likely-than-not threshold would be recorded as a tax benefit or expense in the current year. Management has analyzed the Funds tax positions taken on Federal income tax returns for all open tax years (fiscal years 2009-2012), and has concluded that no provision for income tax was required in the Funds financial statements.
Income and capital gain distributions are determined in accordance with Federal income tax regulations, which may differ from U.S. GAAP. These differences are primarily due to differing treatments for in-kind redemptions, income reclassifications from REITs and losses deferred due to wash sales.
The RIC Modernization Act of 2010 was signed into law on December 22, 2010 and sought to simplify some of the tax
provisions applicable to regulated investment companies and the tax reporting to their shareholders, and to improve the tax efficiency of certain fund structures. The changes were generally effective for taxable years beginning after the date of enactment.
One of the more prominent changes addresses capital loss carryforwards. The Fund is permitted to carry forward capital losses incurred in taxable years beginning after December 22, 2010 for an unlimited period. However, any losses incurred during those future taxable years will be required to be utilized prior to the losses incurred in pre-enactment taxable years. Under pre-enactment law, capital losses could be carried forward for eight years, and carried forward as short-term capital, irrespective of the character of the original loss. As a result of this ordering rule, pre-enactment capital loss carryforwards may potentially expire unused. Additionally, post-enactment capital losses that are carried forward will retain their character as either short-term or long-term capital losses rather than being considered all short-term as under previous law.
In order to present paid-in-capital, undistributed net investment income (loss) and accumulated net realized gain (loss) on investments on the statement of assets and liabilities that more closely represent their tax character, certain adjustments have been made to these accounts. These adjustments have no effect on net assets or NAV. The most significant of these adjustments are for net capital gains resulting from in-kind redemptions, because they are non-taxable to the Fund, and therefore are not distributed to existing Fund shareholders, or net capital losses resulting from in-kind redemptions, which are reclassified to paid-in-capital. For the year ended October 31, 2012, the adjustments for the Fund was as follows:
| Paid-In Capital | Undistributed Net Investment Income (Loss) | Accumulated Net Realized Gain (Loss) | ||||||||||
Guggenheim S&P 500® Equal Weight ETF | $ | 136,489,591 | $ | (1,209,918 | ) | $ | (135,279,673 | ) | ||||
| 20 | GUGGENHEIM ETFS ANNUAL REPORT |
Table of Contents
NOTES TO FINANCIAL STATEMENTS (continued)
|
Tax basis capital losses in excess of capital gains are carried forward to offset future net capital gains. For the year ended October 31, 2012, there were no capital loss carryforward amounts used to offset current year net realized capital gains.
The tax character of distributable earnings (accumulated losses) at October 31, 2012 was as follows:
| Undistributed Ordinary Income | Undistributed Long Term Capital Gain | Capital Loss Carryfoward | Unrealized Appreciation | |||||||||||||
Guggenheim S&P 500® Equal Weight ETF | $ | 1,012,830 | $ | — | $ | (558,137,156 | ) | $ | 57,372,290 | |||||||
A summary of the expiration of the capital loss carryforward is as follows:
| Unlimited | ||||||||||||||||||||||||
| 2016 | 2017 | 2018 | 2019 | Short Term | Long Term | |||||||||||||||||||
Guggenheim S&P 500® Equal Weight ETF | $ | 119,981,602 | $ | 313,762,207 | $ | 35,251,288 | $ | 20,782,942 | $ | 12,983,445 | $ | 55,375,672 | ||||||||||||
The tax character of distributions paid during the year ended October 31, 2012 was as follows:
| Ordinary Income | Return of Capital | |||||||
Guggenheim S&P 500® Equal Weight ETF | $ | 44,494,825 | $ | — | ||||
The tax character of distributions paid during the year ended October 31, 2011 was as follows:
| Ordinary Income | Return of Capital | |||||||
Guggenheim S&P 500® Equal Weight ETF | $ | 40,649,421 | $ | — | ||||
At October 31, 2012, the identified cost of investments in securities owned by the Fund for Federal income tax purposes and the gross unrealized appreciation and depreciation were as follows:
| Identified Cost | Gross Unrealized Appreciation | Gross Unrealized Depreciation | Net Unrealized Appreciation | |||||||||||||
Guggenheim S&P 500® Equal Weight ETF | $ | 2,778,044,574 | $ | 261,402,083 | $ | (204,029,793 | ) | $ | 57,372,290 | |||||||
E. Fair Value Measurement
In accordance with U.S. GAAP, fair value is defined as the price that the Fund would receive to sell an investment or pay to transfer a liability in an orderly transaction with an independent buyer in the principal market, or, in the absence of a principal market, the most advantageous market for the investment or liability. A three-tier hierarchy is utilized to distinguish between (1) inputs that reflect the assumptions market participants would use in pricing an asset or liability developed based on market data obtained from sources independent of the reporting entity (observable inputs) and (2) inputs that reflect the reporting entity’s own assumptions about the assumptions market participants would use in pricing an asset or liability developed based on the best information available in the circumstances (unobservable inputs) and to establish classification of fair value measurements for disclosure purposes. Various inputs are used in determining the value of the Fund’s investments. The inputs are summarized in the three broad levels listed below:
| Level 1 — | quoted prices in active markets for identical securities. |
| Level 2 — | other significant observable inputs (including quoted prices for similar securities, interest rates, prepayment speeds, credit risk, etc.). |
| Level 3 — | significant unobservable inputs (including the fund’s own assumptions used to determine the fair value of investments). |
The inputs or methodologies used for valuing securities are not necessarily an indication of the risk associated with investing in those securities.
The following table summarizes the inputs used to value the Fund’s net assets as of October 31, 2012:
| Fund | Level 1 Investments in Securities | Level 2 Investments in Securities | Level 3 Investments in Securities | Total | ||||||||||||
Guggenheim S&P 500® Equal Weight ETF | $ | 2,760,139,741 | $ | 75,277,123 | $ | — | $ | 2,835,416,864 | ||||||||
| GUGGENHEIM ETFS ANNUAL REPORT | 21 |
Table of Contents
NOTES TO FINANCIAL STATEMENTS (continued)
|
For the year ended October 31, 2012, there were no Level 3 investments or transfers between levels.
F. Dividends and Distributions
Distributions of net investment income and net realized gains, if any, in the Fund, are declared and paid at least annually. Distributions are recorded on the ex-dividend date and are determined in accordance with income tax regulations which may differ from U.S. GAAP.
G. Risk and Uncertainties
The Fund invests in various investments which are exposed to risk, such as market risk. Due to the level of risk associated with certain investments it is at least reasonably possible that changes in the values of investment securities will occur in the near term and that such changes could materially affect amounts reported in the financial statements. The Guggenheim S&P 500 Equal Weight ETF is a non-diversified fund, subjecting it to a greater risk than funds that are diversified.
Throughout the normal course of business, the Fund enters into contracts that contain a variety of representations and warranties which provide general indemnifications. The Fund’s maximum exposure under these arrangements is unknown, as this would involve future claims that may be made against the Fund and/or its affiliates that have not yet occurred. However, based on experience the Fund expects the risk of loss to be remote.
H. Portfolio Securities Loaned
The Fund may lend its securities to approved brokers to earn additional income. Security lending income shown on the statement of operations is shown net of rebates paid to the borrowers and earnings on cash collateral investments shared with the lending agent. Within this arrangement, the Fund act as the lender, Credit Suisse acts as the lending agent, and other approved registered broker dealers act as the borrowers. The Fund receives cash collateral, valued at 102% of the value of the securities on loan. Under the terms of the Fund’s securities lending agreement with Credit Suisse, cash collateral is invested in one or more joint repurchase agreements collateralized by obligations of the U.S. Treasury or Government Agencies. The Fund bears the risk of loss on cash collateral investments. Collateral is maintained over the life of the loan in an amount not less than the value of loaned securities, as determined at the close of fund business each day; any additional collateral required due to changes in security values is delivered to the Fund the next business day. Although the collateral mitigates the risk, the Fund could experience a delay in recovering its securities and a possible loss of income or value if the borrower fails to return the securities. The Fund has the right under the securities lending agreement to recover the securities from the borrower on demand.
At October 31, 2012, the Fund participated in securities lending as follows:
| Value of Securities Loaned | Cash Collateral Received | |||||||
Guggenheim S&P 500® Equal Weight ETF | $ | 62,708,611 | $ | 65,141,123 | ||||
The following represents a breakdown of the collateral for the joint repurchase agreements at October 31, 2012:
| Counterparty and Terms of Agreement | Face Value | Repurchase Price | Collateral | Par Value | Fair Value | |||||||||||||
Merrill Lynch, Pierce, Fenner & Smith, Inc. | US Treasury | |||||||||||||||||
0.28% | 0.625% | |||||||||||||||||
Due 11/01/12 | $ | 40,000,000 | $ | 40,000,311 | 04/15/13 | $ | 37,278,800 | $ | 40,788,895 | |||||||||
RBS Securities, Inc. | Fannie Mae Note | |||||||||||||||||
0.28% | 5.375% | |||||||||||||||||
Due 11/01/12 | 68,010,000 | 68,012,041 | 7/15/16 | 58,330,000 | 69,372,283 | |||||||||||||
3. Advisory, Administration and Other Transactions With Affiliates
GI determines the composition of the portfolio of securities that must be delivered in exchange for the issuance of Creation Units and periodically adjusts the composition of the portfolio of the Fund to conform to changes in the composition of the relevant index. For these services, GI receives a management fee at the annual rate shown below as a percentage of the average daily net assets of the Fund.
| Advisory Fee | ||||
Guggenheim S&P 500® Equal Weight ETF | 0.40 | % | ||
GI pays all expenses of the Fund, including the cost of transfer agency, custody, fund administration, legal, audit and other services, except: interest, taxes, distribution fees or expenses and extraordinary expenses.
Under an Administration Agreement, State Street Bank and Trust Company (the “Administrator”) provides various administrative and accounting services for the maintenance and operations of the Fund. Under a Custodian Agreement with the Trust, the Administrator
| 22 | GUGGENHEIM ETFS ANNUAL REPORT |
Table of Contents
| NOTES TO FINANCIAL STATEMENTS (continued) |
maintains cash, securities and other assets of the Fund in a separate account for the Fund, keeps all necessary accounts and records, and provides other services. The Administrator is required, upon the order of the Trust, to deliver securities held by the Custodian and to make payments for securities purchased by the Trust for the Fund. Pursuant to a Transfer Agency and Service Agreement with the Trust, the Administrator acts as a transfer agent for the Trust’s authorized and issued shares of beneficial interest, and as dividend disbursing agent of the Trust. GI compensates the Administrator directly for the foregoing services.
The Fund has adopted a Distribution Plan (the “Plan”) that allows the Fund to pay distribution fees to RDL and other firms that provide distribution services (“Service Providers”). If a Service Provider provides distribution services, the Fund will pay distribution fees to RDL at an annual rate not to exceed 0.25% of average daily net assets, pursuant to Rule 12b-1 of the 1940 Act. RDL will, in turn, pay the Service Provider out of its fees. No such fee is currently charged to the Fund.
4. Capital
At October 31, 2012, there were an unlimited number of no par value shares of beneficial interest authorized. There is a minimum transaction fee per transaction to those persons purchasing or redeeming Creation Units. An additional charge of up to three times the standard transaction fee may be imposed for purchases and redemptions effected outside the National Securities Clearing Corporation usual clearing process or for cash. Such transactions are generally permitted on an in-kind basis, with a balancing cash component to equate the transaction to the NAV of the Fund on the transaction date. Transaction fees are not charged to or paid by the Fund. The minimum transaction fees are:
| Minimum Transaction Fee | ||||
Guggenheim S&P 500® Equal Weight ETF | $ | 2,000 | ||
5. Investment Transactions
For the year ended October 31, 2012, the Fund had investment transactions in-kind associated with subscriptions and redemptions as follows:
| Subscriptions | Redemptions | |||||||
Guggenheim S&P 500® Equal Weight ETF | $ | 693,729,555 | $ | 1,232,701,089 | ||||
Purchases and sales of investment securities (excluding short-term investments, U.S. government and government agency obligations) for the Fund was as follows:
| Purchases | Sales | |||||||
Guggenheim S&P 500® Equal Weight ETF | $ | 580,454,317 | $ | 597,479,858 | ||||
There were no purchases or sales of U.S. government or government agency obligations for the year ended October 31, 2012.
6. Legal Proceedings
Tribune Company
Rydex ETF Trust has been named as a defendant and a putative member of the proposed defendant class of shareholders in the case entitled Official Committee of Unsecured Creditors of Tribune Co. v. FitzSimons (In re Tribune Co.), No. 12-2652 (S.D.N.Y.) (formerly Adv. Pro. No. 10-54010 (Bankr. D. Del.)) (the “FitzSimons action”), as a result of ownership of shares in the Tribune Company (“Tribune”) in 2007 by certain series of the Rydex ETF Trust when Tribune effected a leveraged buyout transaction (“LBO”) by which Tribune converted to a privately-held company. In its complaint, the Unsecured Creditors Committee (the “UCC”) has alleged that, in connection with the LBO, insiders and major shareholders received proceeds for their Tribune stock using financing that the insiders knew would, and ultimately did, leave the Tribune insolvent. The UCC has asserted claims against certain insiders, major shareholders, professional advisers, and others involved in the LBO, and is attempting to obtain from these individuals and entities the proceeds paid out in connection with the LBO.
In June 2011, a group of Tribune creditors, not including the UCC, filed multiple actions involving state law constructive fraudulent conveyance claims against former Tribune shareholders (the “SCLFC actions”). Rydex ETF Trust has been named as a defendant in one or more of these suits. These cases have been consolidated together with the FitzSimons action in a multidistrict litigation proceeding captioned In re Tribune Co. Fraudulent Conveyance Litig., No. 11-2296 (S.D.N.Y.) (the “MDL proceeding”).
On September 7, 2012, the Court issued a Master Case Order in the MDL proceeding. This order designated several law firms to serve as members of executive committees of defense counsel in the FitzSimons action and in the SCLFC actions. The order also established a briefing schedule for motions to dismiss in the SLCFC actions; no schedule has yet been established in the Fitzsimons action. The
| GUGGENHEIM ETFS ANNUAL REPORT | 23 |
Table of Contents
NOTES TO FINANCIAL STATEMENTS (concluded)
|
Court also ordered that the plaintiffs’ deadline to serve summonses and complaints is extended through January 15, 2013. Finally, the Court ordered that merits discovery will be stayed until further order of the Court.
None of these lawsuits allege any wrongdoing on the part of Rydex ETF Trust. The following series of Rydex ETF Trust held shares of Tribune and tendered these shares as part of Tribune’s LBO: Guggenheim S&P 500 Equal Weight ETF (the “Fund”). The value of the proceeds received by the foregoing Fund was $4,766,035. At this stage of the proceedings, Rydex ETF Trust is not able to make a reliable predication as to the outcome of these lawsuits or the effect, if any, on the Fund’s net asset value.
| 24 | GUGGENHEIM ETFS ANNUAL REPORT |
Table of Contents
| REPORT OF INDEPENDENT REGISTERED PUBLIC ACCOUNTING FIRM | ||
The Board of Trustees and Shareholders of Rydex ETF Trust
We have audited the accompanying statement of assets and liabilities, including the schedule of investments, of Guggenheim S&P 500® Equal Weight ETF (one of the series constituting the Guggenheim ETF Trust) (the “Fund”) as of October 31, 2012, and the related statement of operations for the year then ended, the statements of changes in net assets for each of the two years in the period then ended, and the financial highlights for each of the five years in the period then ended. The financial statements and financial highlights are the responsibility of the Fund’s management. Our responsibility is to express an opinion on these financial statements and financial highlights based on our audits.
We conducted our audits in accordance with the standards of the Public Company Accounting Oversight Board (United States). Those standards require that we plan and perform the audit to obtain reasonable assurance about whether the financial statements and financial highlights are free of material misstatement. We were not engaged to perform an audit of the Fund’s internal control over financial reporting. Our audits included consideration of internal control over financial reporting as a basis for designing audit procedures that are appropriate in the circumstances, but not for the purpose of expressing an opinion on the effectiveness of the Fund’s internal control over financial reporting. Accordingly, we express no such opinion. An audit also includes examining, on a test basis, evidence supporting the amounts and disclosures in the financial statements and financial highlights, assessing the accounting principles used and significant estimates made by management, and evaluating the overall financial statement presentation. Our procedures included confirmation of securities owned as of October 31, 2012, by correspondence with the custodian and brokers or by other appropriate auditing procedures where replies from brokers were not received. We believe that our audits provide a reasonable basis for our opinion.
In our opinion, the financial statements and financial highlights referred to above present fairly, in all material respects, the financial position of Guggenheim S&P 500® Equal Weight ETF at October 31, 2012, the results of its operations for the year then ended, the changes in its net assets for each of the two years in the period then ended, and its financial highlights for each of the five years in the period then ended, in conformity with U.S. generally accepted accounting principles.

McLean, Virginia
December 21, 2012
| GUGGENHEIM ETFS ANNUAL REPORT | 25 |
Table of Contents
|
Federal Income Tax Information
For federal income tax purposes, the following information is furnished with respect to the distributions paid by the Fund during the year ended October 31, 2012:
| Dividend Received Deduction | Long Term Capital Gains Distribution | Qualified Income Distribution | ||||||||||
Guggenheim S&P 500® Equal Weight ETF | 100.00% | $ | — | $ | 54,056,135 | |||||||
Proxy Voting Information
A description of the policies and procedures that the Trust uses to determine how to vote proxies relating to securities held in the Funds portfolio is available, without charge and upon request, by calling 1.800.820.0888. This information is also available from the EDGAR database on the SEC’s website at http://www.sec.gov.
Information regarding how the Fund voted proxies relating to portfolio securities, during the most recent 12-month period ended June 30, 2012 is available, without charge, upon request, by calling 1.800.820.0888. The information is also available from the EDGAR database on the SEC’s website at http://www.sec.gov.
Quarterly Portfolio Schedules Information
The Trust files its complete schedule of portfolio holdings with the SEC for the first and third quarters of each fiscal year on Form N-Q; which are available on the SEC’s website at http://www.sec.gov. The Fund’s Form N-Q may be reviewed and copied at the SEC’s Public Reference Room in Washington, DC, and that information on the operation of the Public Reference Room may be obtained by calling 1-800-SEC-0330. Copies of the portfolio holdings are also available to shareholders, without charge and upon request, by calling 1.800.820.0888.
Office Locations
The offices of Guggenheim Investments can be found in the following locations:
40 East 52nd Street
16th Floor
New York, NY 10022
(Headquarters)
Four Irvington Centre
805 King Farm Boulevard
Suite 600
Rockville, MD 20850
9401 Indian Creek Parkway
40 Corporate Woods
Suite 850
Overland Park, KS 66210
Premium/Discount Information
Information about the differences between the daily market price on secondary markets for shares and the NAV of each Fund can be found at guggenheiminvestments.com.
| 26 | GUGGENHEIM ETFS ANNUAL REPORT |
Table of Contents
| INFORMATION ON BOARD OF TRUSTEES AND OFFICERS (Unaudited) |
A Board of Trustees oversees the Trust, as well as other trusts of GI, in which its members have no stated term of service, and continue to serve after election until resignation. The Statement of Additional Information includes further information about Fund Trustees and Officers, and can be obtained without charge by calling 800.820.0888.
All Trustees and Officers may be reached c/o Guggenheim Investments, 805 King Farm Boulevard, Suite 600, Rockville, MD 20850.
TRUSTEE AND OFFICER
Name and | Length of Service (Year Began) | Number of | ||||||
Donald C. Cacciapaglia* | Rydex Series Funds – 2012 | 146 | ||||||
| (1951) | Rydex Variable Trust – 2012 | |||||||
Rydex Dynamic Funds – 2012 | ||||||||
Rydex ETF Trust – 2012 |
Principal Occupations During Past Five Years: Current: Security Investors, LLC: President and CEO from April 2012 to present; Guggenheim Investments: President and Chief Administrative Officer from February 2010 to present; Previous: Channel Capital Group, Inc.: Chairman and CEO from April 2002 to February 2010
Positions held within the Trust: Trustee from 2012 to present; President from 2012 to present
INDEPENDENT TRUSTEES
Name and | Length of Service (Year Began) | Number of | ||||||
Corey A. Colehour | Rydex Series Funds – 1993 | 146 | ||||||
| (1945) | Rydex Variable Trust – 1998 | |||||||
Rydex Dynamic Funds – 1999 | ||||||||
Rydex ETF Trust – 2003 |
Principal Occupations During Past Five Years: Current: Retired; Previous: President and Senior Vice President of Schield Management Company (registered investment adviser) from 2003 to 2006
Positions held within the Trust: Trustee from 1993 to present; Member of the Audit and Governance and Nominating Committees from 1995 to present
J. Kenneth Dalton | Rydex Series Funds – 1995 | 146 | ||||||
| (1941) | Rydex Variable Trust – 1998 | |||||||
Rydex Dynamic Funds – 1999 | ||||||||
Rydex ETF Trust – 2003 |
Principal Occupations During Past Five Years: Current: Retired
Positions held within the Trust: Trustee from 1995 to present; Member and Chairman of the Audit Committee from 1997 to present; Member of the Governance and Nominating Committees from 1995 to present; and Member of the Risk Oversight Committee from 2010 to present
John O. Demaret | Rydex Series Funds – 1997 | 146 | ||||||
| (1940) | Rydex Variable Trust – 1998 | |||||||
Rydex Dynamic Funds – 1999 | ||||||||
Rydex ETF Trust – 2003 |
Principal Occupations During Past Five Years: Current: Retired
Positions held within the Trust: Trustee from 1997 to present; Chairman of the Board from 2006 to present; Member of the Audit Committee from 1997 to present; and Member of the Risk Oversight Committee from 2010 to present
| GUGGENHEIM ETFS ANNUAL REPORT | 27 |
Table of Contents
| INFORMATION ON BOARD OF TRUSTEES AND OFFICERS (Unaudited) (continued) |
INDEPENDENT TRUSTEES - concluded
Name and | Length of Service (Year Began) | Number of | ||||||
Werner E. Keller | Rydex Series Funds – 2005 | 146 | ||||||
| (1940) | Rydex Variable Trust – 2005 | |||||||
Rydex Dynamic Funds – 2005 | ||||||||
Rydex ETF Trust – 2005 |
Principal Occupations During Past Five Years: Current: Founder and President of Keller Partners, LLC (investment research firm) from 2005 to present; Previous: Retired from 2001 to 2005
Positions held within the Trust: Vice Chairman of the Board of Trustees from 2010 to present; Trustee and Member of the Audit and Governance and Nominating Committees from 2005 to present; and Chairman and Member of the Risk Oversight Committee from 2010 to present
Thomas F. Lydon, Jr. | Rydex Series Funds – 2005 | 146 | ||||||
| (1960) | Rydex Variable Trust – 2005 | |||||||
Rydex Dynamic Funds – 2005 | ||||||||
Rydex ETF Trust – 2005 |
Principal Occupations During Past Five Years: Current:
President of Global Trends Investments (registered investment adviser) from 1996 to present
Positions held within the Trust: Trustee and Member of the Audit and Governance and Nominating Committees from 2005 to present
Patrick T. McCarville | Rydex Series Funds – 1997 | 146 | ||||||
| (1942) | Rydex Variable Trust – 1998 | |||||||
Rydex Dynamic Funds – 1999 | ||||||||
Rydex ETF Trust – 2003 |
Principal Occupations During Past Five Years: Current: Retired; Previous: Chief Executive Officer of Par Industries, Inc., d/b/a Par Leasing from 1977 to 2010
Positions held within the Trust: Trustee from 1997 to present; Member of the Audit Committee from 1997 to present; and Chairman of the Governance and Nominating Committees from 1997 to present
Roger Somers | Rydex Series Funds – 1993 | 146 | ||||||
| (1944) | Rydex Variable Trust – 1998 | |||||||
Rydex Dynamic Funds – 1999 | ||||||||
Rydex ETF Trust – 2003 |
Principal Occupations During Past Five Years: Current: Founder and Chief Executive Officer of Arrow Limousine from 1965 to present
Positions held within the Trust: Trustee from 1993 to present; Member of the Audit and Governance and Nominating Committees from 1995 to present
| 28 | GUGGENHEIM ETFS ANNUAL REPORT |
Table of Contents
| INFORMATION ON BOARD OF TRUSTEES AND OFFICERS (Unaudited) (continued) |
EXECUTIVE OFFICERS
Name, Position and Year of Birth | Principal Occupations During Past Five Years | |
Michael P. Byrum* Vice President (1970) | Current: President, Security Benefit Asset Management Holdings, LLC; Senior Vice President, Security Investors, LLC; President & Chief Investment Officer, Rydex Holdings, LLC; Director & Chairman of the Board, Advisor Research Center, Inc.; and Manager, Rydex Specialized Products, LLC
Previous: Rydex Distributors, LLC (f/k/a Rydex Distributors, Inc.), Vice President (2009); Rydex Fund Services, LLC, Director (2009-2010), Secretary (2002-2010), Executive Vice President (2002-2006); Rydex Advisors, LLC (f/k/a PADCO Advisors, Inc.), Director (2008-2010), Chief Investment Officer (2006-2010), President (2004-2010), Secretary (2002-2010); Rydex Advisors II, LLC (f/k/a PADCO Advisors II, Inc.), Director (2008-2010), Chief Investment Officer (2006-2010), President (2004-2010), Secretary (2002-2010); Rydex Capital Partners, LLC, President & Secretary (2003-2007); Rydex Capital Partners II, LLC, (2003-2007); Rydex Holdings, LLC (f/k/a Rydex Holdings, Inc.), Secretary (2005-2008), Executive Vice President (2005-2006); Advisor Research Center, Inc., Secretary (2006-2009), Executive Vice President (2006); and Rydex Specialized Products, LLC, Secretary (2005-2008) | |
Nikolaos Bonos* Vice President and Treasurer (1963) | Current: Senior Vice President, Security Investors, LLC; Chief Executive Officer & Manager, Rydex Specialized Products, LLC; Chief Executive Officer & President, Rydex Fund Services, LLC; Vice President, Rydex Holdings, LLC; Treasurer, SBL Fund; Security Equity Fund; Security Income Fund; Security Large Cap Value Fund & Security Mid Cap Growth Fund; and Vice President, Security Benefit Asset Management Holdings, LLC
Previous: Security Global Investors, LLC, Senior Vice President (2010-2011); Rydex Advisors, LLC (f/k/a PADCO Advisors, Inc.) Senior Vice President (2006-2011); Rydex Fund Services, LLC (f/k/a Rydex Fund Services, Inc.), Director (2009) & Senior Vice President (2003-2006); and Rydex Specialized Products, LLC, Chief Financial Officer (2005-2009) | |
Elisabeth Miller* Chief Compliance Officer (1968) | Current: Chief Compliance Officer, Rydex Series Funds, Rydex Dynamic Funds, Rydex Variable Trust, Rydex ETF Trust, Security Equity Fund, Security Income Fund, Security Large Cap Value Fund, Security Mid Cap Growth Fund, SBL Fund, Security Investors, LLC, and Rydex Distributors, LLC Previous: Senior Manager, Security Investors, LLC and Rydex Distributors, LLC (2004-2009) | |
Amy J. Lee* Vice President and Assistant Secretary (1961) | Current: Senior Vice President & Secretary, Security Investors, LLC; Secretary & Chief Compliance Officer, Security Distributors, Inc.; Vice President, Associate General Counsel & Assistant Secretary, Security Benefit Life Insurance Company and Security Benefit Corporation; Associate General Counsel, First Security Benefit Life Insurance and Annuity of New York; Vice President & Secretary, SBL Fund; Security Equity Fund; Security Income Fund; Security Large Cap Value Fund & Security Mid Cap Growth Fund; Vice President & Secretary, Rydex Holdings, LLC Secretary, Advisor Research Center, Inc., Rydex Specialized Products, LLC, Rydex Distributors, LLC and Rydex Fund Services, LLC; and Assistant Secretary, Security Benefit Clinic and Hospital
Previous: Security Global Investors, LLC, Senior Vice President & Secretary (2007-2011); Rydex Advisors, LLC (f/k/a PADCO Advisors, Inc.) & Rydex Advisors II, LLC (f/k/a PADCO Advisors II, Inc.), Senior Vice President & Secretary (2010-2011); and Brecek & Young Advisors, Inc., Director (2004-2008) | |
Joseph M. Arruda* Assistant Treasurer (1966) | Current: Assistant Treasurer, SBL Fund; Security Equity Fund; Security Income Fund; Security Large Cap Value Fund & Security Mid Cap Growth Fund; Vice President, Security Investors, LLC; and Chief Financial Officer & Manager, Rydex Specialized Products, LLC
Previous: Security Global Investors, LLC, Vice President (2010-2011); and Rydex Advisors, LLC (f/k/a PADCO Advisors, Inc.) & Rydex Advisors II, LLC (f/k/a PADCO Advisors II, Inc.), Vice President (2004-2011) | |
| * | Officers of the Funds are deemed to be “interested persons” of the Trust, within the meaning of Section 2(a)(19) of the 1940 Act, inasmuch as this person is affiliated with Guggenheim Investments. |
| GUGGENHEIM ETFS ANNUAL REPORT | 29 |
Table of Contents
GUGGENHEIM INVESTMENTS PRIVACY POLICIES
|
Rydex Funds, Guggenheim Funds, Rydex Investments, Rydex Distributors, Inc., Security Investors, LLC, Security Distributors, Inc. and Rydex Advisory Services (Collectively “Guggenheim Investments”)
Our Commitment to You
When you become a Guggenheim Investments investor, you entrust us with not only your hard-earned money but also with personal and financial information about you. We recognize that your relationship with us is based on trust and that you expect us to act responsibly and in your best interests. Because we have access to this private information about you, we hold ourselves to the highest standards in its safekeeping and use. This means, most importantly, that we do not sell client information to anyone—whether it is your personal information or if you are a current or former Guggenheim Investments client.
The Information We Collect About You
In the course of doing business with shareholders and investors, we collect nonpublic personal information about you. You typically provide personal information when you complete a Guggenheim Investments account application or when you request a transaction that involves Rydex and Guggenheim Investments funds or one of the Guggenheim Investments affiliated companies. “Nonpublic personal information” is personally identifiable private information about you. For example, it includes information regarding your name and address, Social Security or taxpayer identification number, assets, income, account balance, bank account information and investment activity (e.g., purchase and redemption history).
How We Handle Your Personal Information
As emphasized above, we do not sell information about current or former clients or their accounts to third parties. Nor do we share such information, except when necessary to complete transactions at your request or to make you aware of related investment products and services that we offer. Additional details about how we handle your personal information are provided below. To complete certain transactions or account changes that you direct, it may be necessary to provide identifying information to companies, individuals or groups that are not affiliated with Guggenheim Investments. For example, if you ask to transfer assets from another financial institution to Guggenheim Investments, we will need to provide certain information about you to that company to complete the transaction. To alert you to other Guggenheim Investments investment products and services, we may share your information within the Guggenheim Investments family of affiliated companies. This would include, for example, sharing your information within Guggenheim Investments so we can make you aware of new Rydex and Guggenheim Investments funds or the services offered through another Guggenheim Investments affiliated company. In certain instances, we may contract with nonaffiliated companies to perform services for us. Where necessary, we will disclose information we have about you to these third parties. In all such cases, we provide the third party with only the information necessary to carry out its assigned responsibilities and only for that purpose. And we require these third parties to treat your private information with the same high degree of confidentiality that we do. In certain instances, we may share information with other financial institutions regarding individuals and entities in response to the U.S.A. Patriot Act. Finally, we will release information about you if you direct us to do so, if we are compelled by law to do so or in other circumstances permitted by law.
Opt Out Provisions
We do not sell your personal information to anyone. The law allows you to “opt out” of only certain kinds of information sharing with third parties. The firm does not share personal information about you with any third parties that triggers this opt-out right. This means YOU ARE ALREADY OPTED OUT.
How We Protect Privacy Online
Our concern for the privacy of our shareholders also extends to those who use our web site, guggenheiminvestments.com. Our web site uses some of the most secure forms of online communication available, including encryption technology, Secure Socket Layer (SSL) protocol, firewalls and user names and passwords. These technologies provide a high level of security and privacy when you access your account information or initiate online transactions. The Guggenheim Investments web site offers customized features that require our use of “http cookies”—tiny pieces of information that we ask your browser to store. However, we make very limited use of these cookies. We only use cookies for session management and security features on the Guggenheim Investments web site. We do not use them to pull data from your hard drive, to learn your email address, or to view data in cookies created by other web sites. We will not share the information in our cookies or give others access to it. See the legal information area on our web site for more details about web site security and privacy features.
| 30 | GUGGENHEIM ETFS ANNUAL REPORT |
Table of Contents
| GUGGENHEIM INVESTMENTS PRIVACY POLICIES (concluded) |
How We Safeguard Your Personal Information
We restrict access to nonpublic personal information about shareholders to our employees and in some cases to third parties (for example, the service providers described above) as permitted by law. We maintain strict physical, electronic and procedural safeguards that comply with federal standards to guard your nonpublic personal information.
We’ll Keep You Informed
As required by federal law, we will notify shareholders of our privacy policy annually. We reserve the right to modify this policy at any time, but rest assured that if we do change it, we will tell you promptly. You will also be able to access our privacy policy from our web site at guggenheiminvestments.com. Should you have any questions regarding our privacy policy, contact us at 800.820.0888 or 301.296.5100.
| GUGGENHEIM ETFS ANNUAL REPORT | 31 |
Table of Contents

805 King Farm Boulevard, Suite 600
Rockville, MD 20850
guggenheiminvestments.com
800.820.0888
ETF4-ANN-1012x1013
Table of Contents
Item 2. Code of Ethics.
The registrant’s Board of Trustees has adopted a code of ethics that applies to the registrant’s principal executive officer and principal financial officer. No substantive amendments were approved or waivers were granted to the Code during the period covered by this report. The Code is filed as an exhibit to this Form N-CSR.
Item 3. Audit Committee Financial Expert.
The registrant’s Board of Trustees has determined that Werner Keller, an “independent” Trustee serving on the registrant’s audit committee, is an “audit committee financial expert,” as defined in Item 3 of Form N-CSR. Under applicable securities laws, a person who is determined to be an audit committee financial expert will not be deemed an “expert” for any purpose, including without limitation for the purposes of Section 11 of the Securities Act of 1933, as a result of being designated or identified as an audit committee financial expert. The designation or identification of a person as an audit committee financial expert does not impose on such person any duties, obligations, or liabilities that are greater than the duties, obligations, and liabilities imposed on such person as a member of the audit committee and Board of Trustees in the absence of such designation or identification.
Item 4. Principal Accountant Fees and Services.
(a)-(d) The aggregate Audit Fees billed by the Trust’s principal accountant, for the audit of the annual financial statements in connection with statutory and regulatory filings for the fiscal years ended October 31, 2012 and October 31, 2011 were $264,500 and $322,000, respectively. The aggregate Tax Fees billed by the Trust’s principal accountant for professional services rendered for tax compliance, tax advice, and tax planning, including preparation of tax returns and distribution assistance, for the fiscal years ended October 31, 2012 and October 31, 2011, were $69,400 and $74,250, respectively.
(e) The audit committee has adopted a policy whereby audit and non-audit services performed by the registrant’s principal accountant for the registrant, its investment advisor, and any entity controlling, controlled by, or under common control with the investment advisor that provides ongoing services to the registrant require pre-approval in advance at regularly scheduled audit committee meetings. If such service is required between regularly scheduled audit committee meetings, the chairman of the audit committee, J. Kenneth Dalton, is authorized to pre-approve the service with full committee approval at the next scheduled meeting. There shall be no waivers of the pre-approval process. No services described in (b)-(d) above were approved pursuant to paragraph (c)(7)(i)(C) of Rule 2-01 of Regulation S-X.
Table of Contents
(f) Not applicable.
(g) The aggregate non-audit fees were for Tax Fees billed by the Trust’s principal accountant for professional services rendered for tax compliance, tax advice, and tax planning, including preparation of tax returns and distribution assistance, for the fiscal years ended October 31, 2012 and October 31, 2011, were $69,400 and $74,250, respectively.
(h) All non-audit services rendered in (g) above were pre-approved by the registrant’s audit committee. As such, the audit committee has considered these services in maintaining the principal accountant’s independence.
Item 5. Audit Committee of Listed Registrants.
(a) The Registrant has a separately standing Audit Committee, which includes the following independent members: John O. Demaret, Corey A. Colehour, Roger Somers, J. Kenneth Dalton, Patrick T. McCarville, Thomas F. Lydon, and Werner E. Keller.
(b) Not applicable.
Item 6. Schedule of Investments
Schedule of Investments is included as part of the report to shareholders filed under Item 1 of this form.
Item 7. Disclosure of Proxy Voting Policies and Procedures for Closed-End Management Investment Companies.
Not applicable.
Item 8. Portfolio Managers of Closed-End Management Investment Companies.
Not applicable.
Item 9. Purchases of Equity Securities by Closed-End Management Investment Company and Affiliated Purchasers.
Not applicable.
Item 10. Submission of Matters to a Vote of Security Holders.
Not applicable.
Table of Contents
Item 11. Controls and Procedures.
(a) The registrant’s President (principal executive officer) and Treasurer (principal financial officer) have evaluated the registrant’s disclosure controls and procedures within 90 days of this filing and have concluded that the registrant’s disclosure controls and procedures were effective, as of that date, in ensuring that information required to be disclosed by the registrant in this Form N-CSR was recorded, processed, summarized, and reported timely.
(b) The registrant’s principal executive officer and principal financial officer are aware of no change in the registrant’s internal control over financial reporting that occurred during the registrant’s second fiscal quarter covered by this report that has materially affected, or is reasonably likely to materially affect, the registrant’s internal control over financial reporting.
Item 12. Exhibits.
(a)(1) The registrant’s code of ethics pursuant to Item 2 of Form N-CSR is attached.
(a)(2) Separate certifications by the President (principal executive officer) and Treasurer (principal financial officer) of the registrant as required by Rule 30a-2(a) under the Act (17 CFR 270.30a-2(a)) are attached.
(b) A certification by the registrant’s President (principal executive officer) and Treasurer (principal financial officer) as required by Rule 30a-2(b) under the Act (17 CFR 270.30a-2(b)) is attached.
Table of Contents
SIGNATURES
Pursuant to the requirements of the Securities Exchange Act of 1934 and the Investment Company Act of 1940, the registrant has duly caused this report to be signed on its behalf by the undersigned, thereunto duly authorized.
(Registrant) | Rydex ETF Trust |
By (Signature and Title)* | /s/ Donald C. Cacciapaglia | |
Donald C. Cacciapaglia, President | ||
Date | January 7, 2013 | |
Pursuant to the requirements of the Securities Exchange Act of 1934 and the Investment Company Act of 1940, this report has been signed below by the following persons on behalf of the registrant and in the capacities and on the dates indicated.
By (Signature and Title)* | /s/ Donald C. Cacciapaglia | |
Donald C. Cacciapaglia, President |
Date | January 7, 2013 | |
By (Signature and Title)* | /s/ Nikolaos Bonos | |
Nikolaos Bonos, Vice President and Treasurer |
Date | January 7, 2013 | |
| * | Print the name and title of each signing officer under his or her signature. |