UNITED STATES
SECURITIES AND EXCHANGE COMMISSION
Washington, D.C. 20549
SECURITIES AND EXCHANGE COMMISSION
Washington, D.C. 20549
FORM N-CSR
CERTIFIED SHAREHOLDER REPORT OF REGISTERED
MANAGEMENT INVESTMENT COMPANIES
Investment Company Act file number 811- 21261
Rydex ETF Trust
(Exact name of registrant as specified in charter)
(Exact name of registrant as specified in charter)
805 King Farm Boulevard, Suite 600
Rockville, Maryland 20850
(Address of principal executive offices) (Zip code)
Rockville, Maryland 20850
(Address of principal executive offices) (Zip code)
Donald C. Cacciapaglia
Rydex ETF Trust
805 King Farm Boulevard, Suite 600
Rockville, Maryland 20850
(Name and address of agent for service)
805 King Farm Boulevard, Suite 600
Rockville, Maryland 20850
(Name and address of agent for service)
Registrant's telephone number, including area code: 1-301-296-5100
Date of fiscal year end: October 31
Date of reporting period: October 31, 2014
Form N-CSR is to be used by management investment companies to file reports with the Commission not later than 10 days after the transmission to stockholders of any report that is required to be transmitted to stockholders under Rule 30e-1 under the Investment Company Act of 1940 (17 CFR 270.30e-1). The Commission may use the information provided on Form N-CSR in its regulatory, disclosure review, inspection, and policymaking roles.
A registrant is required to disclose the information specified by Form N-CSR, and the Commission will make this information public. A registrant is not required to respond to the collection of information contained in Form N-CSR unless the Form displays a currently valid Office of Management and Budget ("OMB") control number. Please direct comments concerning the accuracy of the information collection burden estimate and any suggestions for reducing the burden to Secretary, Securities and Exchange Commission, 450 Fifth Street, NW, Washington, DC 20549-0609. The OMB has reviewed this collection of information under the clearance requirements of 44 U.S.C. § 3507.
Item 1. Reports to Stockholders.

10.31.2014
Guggenheim ETFs Annual Report
| EWRM | Guggenheim Russell MidCap® Equal Weight ETF |
| EWRI | Guggenheim Russell 1000® Equal Weight ETF |
| EWRS | Guggenheim Russell 2000® Equal Weight ETF |
| EWEM | Guggenheim MSCI Emerging Markets Equal Weight ETF |
| RCD | Guggenheim S&P 500® Equal Weight Consumer Discretionary ETF |
| RHS | Guggenheim S&P 500® Equal Weight Consumer Staples ETF |
| RYE | Guggenheim S&P 500® Equal Weight Energy ETF |
| RYF | Guggenheim S&P 500® Equal Weight Financials ETF |
| RYH | Guggenheim S&P 500® Equal Weight Health Care ETF |
| RGI | Guggenheim S&P 500® Equal Weight Industrials ETF |
| RTM | Guggenheim S&P 500® Equal Weight Materials ETF |
| RYT | Guggenheim S&P 500® Equal Weight Technology ETF |
| RYU | Guggenheim S&P 500® Equal Weight Utilities ETF |
| ETF1-ANN-1014x1015 | guggenheiminvestments.com |
| TABLE OF CONTENTS |
| DEAR SHAREHOLDER | 2 |
| ECONOMIC AND MARKET OVERVIEW | 3 |
| FEES AND EXPENSES | 5 |
| MANAGER'S ANALYSIS | 7 |
| PORTFOLIO SUMMARY | 8 |
| SCHEDULES OF INVESTMENTS | 33 |
| STATEMENTS OF ASSETS AND LIABILITIES | 97 |
| STATEMENTS OF OPERATIONS | 101 |
| STATEMENTS OF CHANGES IN NET ASSETS | 105 |
| FINANCIAL HIGHLIGHTS | 112 |
| NOTES TO FINANCIAL STATEMENTS | 125 |
| REPORT OF INDEPENDENT REGISTERED PUBLIC ACCOUNTING FIRM | 136 |
| OTHER INFORMATION | 137 |
| INFORMATION ON BOARD OF TRUSTEES AND OFFICERS | 140 |
| GUGGENHEIM INVESTMENTS PRIVACY POLICIES | 143 |
| GUGGENHEIM ETFs ANNUAL REPORT | 1 |
| October 31, 2014 |
Dear Shareholder:
Security Investors, LLC (the "Investment Adviser") is pleased to present the annual shareholder report for a selection of our exchange traded funds ("ETFs").
The Investment Adviser is part of Guggenheim Investments, which represents the investment management businesses of Guggenheim Partners, LLC ("Guggenheim"), a global, diversified financial services firm.
Guggenheim Funds Distributors, LLC, is the distributor of the Funds. Guggenheim Funds Distributors, LLC, is affiliated with Guggenheim and the Investment Adviser.
This report covers performance of the ETFs for the annual period ended October 31, 2014.
We encourage you to read the Economic and Market Overview that follows, which provides additional information regarding the factors that influenced the Funds' performance for the fiscal year, and then the Manager's Analysis for each ETF.
Sincerely,

Donald C. Cacciapaglia
President
November 30, 2014
President
November 30, 2014
Read a prospectus and summary prospectus (if available) carefully before investing. It contains the investment objectives, risks, charges, expenses and other information, which should be considered carefully before investing. Obtain a prospectus and summary prospectus (if available) at guggenheiminvestments.com or call 800.820.0888.
ETFs may not be suitable for all investors. • Investment returns and principal value will fluctuate so that when shares are redeemed, they may be worth more or less than original cost. Most investors will also incur customary brokerage commissions when buying or selling shares of an ETF. • Investments in securities and derivatives, in general, are subject to market risks that may cause their prices to fluctuate over time. • ETF shares may trade below their net asset value per share ("NAV"). The NAV of shares will fluctuate with changes in the market value of an ETF's holdings. In addition, there can be no assurance that an active trading market for shares will develop or be maintained. • Tracking error risk refers to the risk that the Adviser may not be able to cause the ETF's performance to match or correlate to that of the ETF's underlying index, either on a daily or aggregate basis. Tracking error risk may cause the ETF's performance to be less than you expect.
2 | GUGGENHEIM ETFs ANNUAL REPORT |
ECONOMIC AND MARKET OVERVIEW (Unaudited) | October 31, 2014 |
The U.S. economy continued to grow throughout the 12 months ended October 31, 2014, despite some seasonal volatility in September and October that caused spreads in leveraged credit to widen and upward momentum in U.S. stocks to deteriorate. By the end of October, the spread widening had reversed and equities regained their footing, with some key indices shooting to new highs. Markets similarly overcame a weather-related winter soft patch in the first quarter of 2014.
U.S. economic data remains strong, with the third quarter's 3.5% GDP growth signaling that the economy was doing well across the spectrum. Among the highlights: strong net exports, unemployment that had fallen faster than expected and consumer confidence that was at seven year high. The fact that government at the state and local level was contributing to GDP growth suggested that a major headwind for the economy—contracting government spending—has gone away. Lower energy prices are also likely to help boost consumption in the near term.
U.S. is adding close to 230,000 jobs per month on average in 2014, considerably more than 2013's monthly average of 194,000. Employment levels are transitioning from the recovery phase to the expansion phase, which typically coincides with accelerating economic activity. The downward trend in labor force participation has begun to flatten and, as a result, the rapid decline in the nation's unemployment rate should begin to slow. Until unemployment falls below 5.5 percent, it's unlikely that the U.S. economy will experience the kind of meaningful wage pressure that would spur action by the Federal Reserve. An improving labor market, subdued mortgage rates, and tight housing inventory all point to a rebound in the housing market, which accounted for almost half of GDP growth in 2013 and remains critical to the ongoing recovery.
Growth in Japan and Europe continued to stagnate. The slowdown in the euro zone is concentrated at the core rather than the periphery. To combat disinflation and muted credit growth, the European Central Bank (ECB) enacted further monetary easing and instigated its own unique brand of quantitative easing. Japan's major increase in monetary accommodation in late October surprised markets, but could not forestall the Japanese economy tipping into recession after the period ended. The latest Japanese accommodation came just days after the U.S. Federal Reserve ended its own quantitative easing program.
Overseas geopolitical concerns and comparatively attractive yields have pushed global investors to U.S. Treasuries. Such "beggar thy neighbor" policies from Europe and Asia were the main driving force behind the most recent rally in U.S. fixed income, and indicate that U.S. long-term rate should continue to be well supported.
Consensus among investors was that the Fed would begin to hike rates in the second half of 2015. However, the precipitous decline in energy and commodity prices, the strengthening of U.S. dollar and competitive pressures on prices for traded goods will probably push inflation, as measured by the Fed's favored personal consumption expenditures deflator, down toward 1 percent, raising the likelihood that any increase in the policy rate may be pushed into 2016.
For the 12-month period ended October 31, 2014, the return of the Standard & Poor's 500® ("S&P 500") Index* was 17.27%. The Barclays U.S. Aggregate Bond Index* returned 4.14% for the period, while BofA Merrill Lynch 3-Month U.S. Treasury Bill Index* returned 0.05%. The MSCI World Index* returned 8.67%, while the MSCI Emerging Markets Index* returned 0.64%.
The opinions and forecasts expressed may not actually come to pass. This information is subject to change at any time, based on market and other conditions, and should not be construed as a recommendation of any specific security or strategy.
*Index Definitions:
The following indices are referenced throughout this report. Indices are unmanaged and not available for direct investment. Index performance does not reflect transaction costs, fees, or expenses.
BofA Merrill Lynch 3-Month U.S. Treasury Bill Index is an unmanaged market index of U.S. Treasury securities maturing in 90 days that assumes reinvestment of all income.
Barclays U.S. Aggregate Bond Index is a broad-based benchmark that measures the investment grade, U.S. dollar-denominated, fixed-rate taxable bond market, including U.S. Treasuries, government-related and corporate securities, MBS (agency fixed-rate and hybrid ARM pass-throughs), ABS and CMBS.
MSCI Emerging Markets Index is a free float-adjusted market capitalization weighted index that is designed to measure equity market performance in the global emerging markets.
MSCI World Index is a free float-adjusted market capitalization weighted index that is designed to measure the equity market performance of developed markets.
| GUGGENHEIM ETFs ANNUAL REPORT | 3 |
ECONOMIC AND MARKET OVERVIEW (Unaudited)(concluded) | October 31, 2014 |
S&P 500® Index is a capitalization-weighted index of 500 stocks designed to measure the performance of the broad economy, representing all major industries and is considered a representation of the U.S. stock market.
Russell 1000® Equal Weight Index is an unmanaged equal-weighted version of the Russell 1000® Index, which is an unmanaged capitalization-weighted index representing the U.S. large-cap market. The Russell 1000® Equal Weight Index offers sector equal weight exposure by equally weighting the nine sectors within the Index and then equally weighting the securities within each sector. Russell 1000® Index measures the performance of the large-cap segment of the U.S. equity universe. It is a subset of the Russell 3000® Index and includes approximately 1,000 of the largest securities based on a combination of their market cap and current index membership. The Russell 1000® represents approximately 92% of the U.S. market.
Russell Midcap® Equal Weight Index is an unmanaged equal-weighted version of the Russell Midcap® Index, which is an unmanaged capitalization-weighted index representing the U.S. mid-cap market. The Russell Midcap Equal Weight Index offers sector equal weight exposure by equally weighting the nine sectors within the Index and then equally weighting the securities within each sector. Russell Midcap® Index measures the performance of the 800 smallest companies in the Russell 1000® Index, which represent approximately 31% of the total market capitalization of the Russell 1000® Index.
Russell 2000® Equal Weight Index is an unmanaged equal-weighted version of the Russell 2000® Index, which is an unmanaged capitalization-weighted index representing the U.S. small-cap market. The Russell 2000® Equal Weight Index offers sector equal weight exposure by equally weighting the nine sectors within the Index and then equally weighting the securities within each sector. Russell 2000® Index measures the performance of the small-cap value segment of the U.S. equity universe. The Russell 2000® Index measures the performance of the 2,000 smallest companies in the Russell 3000® Index, which represents approximately 10% of the total market capitalization of the Russell 3000® Index. The Russell 3000® Index measures the performance of the largest 3,000 U.S. companies representing approximately 98% of the investable U.S. equity market.
MSCI Emerging Markets Equal Weight Index equally weights the securities in the MSCI Emerging Markets Index (the MSCI Emerging Markets cap-weighted index), which is a free float-adjusted market capitalization index that is designed to measure the equity market performance of emerging markets. In the MSCI Emerging Markets Equal Weighted Index, each security has the same weight, which means that the weight of each security is set to unity of the rebalancing date.
S&P 500® Equal Weight Index Consumer Discretionary is an unmanaged equal weighted version of the S&P 500® Consumer Discretionary Index that consists of the common stocks of the following industries: automobiles and components, consumer durables, apparel, hotels, restaurants, leisure, media and retailing that comprise the Consumer Discretionary sector of the S&P 500® Index.
S&P 500® Equal Weight Index Consumer Staples is an unmanaged equal weighted version of the S&P 500® Consumer Staples Index that consists of the common stocks of the following industries: food and drug retailing, beverages, food products, tobacco, household products and personal products that comprise the Consumer Staples sector of the S&P 500® Index.
S&P 500® Equal Weight Index Energy is an unmanaged equal weighted version of the S&P 500® Energy Index that consists of the common stocks of the following industries: oil and gas exploration, production, marketing, refining and/or transportation and energy equipment and services industries that comprise the Energy sector of the S&P 500® Index.
S&P 500® Equal Weight Index Financials is an unmanaged equal weighted version of the S&P 500® Financials Index that consists of the common stocks of the following industries: banks, diversified financials, brokerage, asset management insurance and real estate, including investment trusts that comprise the Financials sector of the S&P 500® Index.
S&P 500® Equal Weight Index Health Care is an unmanaged equal weighted version of the S&P 500® Health Care Index that consists of the common stocks of the following industries: health care equipment and supplies, health care providers and services, and biotechnology and pharmaceuticals that comprise the Health Care sector of the S&P 500® Index.
S&P 500® Equal Weight Index Industrials is an unmanaged equal weighted version of the S&P 500® Industrials Index that consists of the common stocks of the following industries: aerospace and defense, building products, construction and engineering, electrical equipment, conglomerates, machinery; commercial services and supplies, air freight and logistics, airlines, and marine, road and rail transportation infrastructure that comprise the 52 Industrials sector of the S&P 500® Index.
S&P 500® Equal Weight Index Materials is an unmanaged equal weighted version of the S&P 500® Materials Index that consists of the common stocks of the following industries: chemicals, construction materials, containers and packaging, metals and mining, and paper and forest products that comprise the Materials sector of the S&P 500® Index.
S&P 500® Equal Weight Index Information Technology is an unmanaged equal weighted version of the S&P 500® Information Technology Index that consists of the common stocks of the following industries: internet equipment, computers and peripherals, electronic equipment, office electronics and instruments, semiconductor equipment and products, diversified telecommunication services, and wireless telecommunication services that comprise the Information Technology sector of the S&P 500® Index.
S&P 500® Equal Weight Index Telecommunication Services & Utilities is an unmanaged equal weighted version of the S&P 500® Telecommunication Services Index and S&P 500® Utilities Index that consists of the common stocks of the following industries: electric utilities, gas utilities, multi-utilities and unregulated power and water utilities, telecommunication service companies, including fixed-line, cellular, wireless, high bandwidth and fiber-optic cable networks that comprise the Telecommunications Services and Utilities sectors of the S&P 500® Index.
4 | GUGGENHEIM ETFs ANNUAL REPORT |
FEES AND EXPENSES (Unaudited) |
Shareholder Expense Example
As a shareholder of the Rydex ETF Trust, you incur transaction costs such as creation and redemption fees or brokerage charges, and ongoing costs including advisory fees, trustee fees and, if applicable, distribution fees. All other Trust expenses are paid by the Adviser. This Example is intended to help you understand your ongoing costs (in dollars) of investing in a Fund and to compare these costs with the ongoing costs of investing in other mutual funds.
The example in the table is based on an investment of $1,000 invested on April 30, 2014 and held for the six months ended October 31, 2014.
Actual Expenses
The first table below provides information about actual account values and actual expenses. You may use the information in this table, together with the amount you invested, to estimate the expenses that you incurred over the period. Simply divide your account value by $1,000 (for example, an $8,600 account value divided by $1,000 = 8.6), then multiply the result by the number in the first table under the heading entitled "Expenses Paid During the Six-Month Period" to estimate the expenses attributable to your investment during this period.
Hypothetical Example for Comparison Purposes
The second table below provides information about hypothetical account values and hypothetical expenses based on a Fund's actual expense ratio and an assumed rate of return of 5% per year before expenses, which is not a Fund's actual return. Thus, you should not use the hypothetical account values and expenses to estimate the actual ending account balance or your expenses for the period. Rather, these figures are provided to enable you to compare the ongoing costs of investing in a Fund and other funds. To do so, compare this 5% hypothetical example with the 5% hypothetical examples that appear in the shareholder reports of other funds.
Please note that the expenses shown in the table are meant to highlight your ongoing costs only and do not reflect any transaction costs, such as creation and redemption fees, or brokerage charges. Therefore, the second table is useful in comparing ongoing costs only, and will not help you determine the relative total costs of owning different funds. In addition, if these transaction costs were included, your costs would have been higher.
| GUGGENHEIM ETFs ANNUAL REPORT | 5 |
FEES AND EXPENSES (Unaudited)(concluded) |
Expense Ratio1 | Fund Return | Beginning Account Value April 30, 2014 | Ending Account Value October 31, 2014 | Expenses Paid During Period2 | |
Table 1. Based on actual Fund return3 | |||||
Guggenheim Russell MidCap® Equal Weight ETF | 0.41% | 4.86% | $1,000.00 | $1,048.60 | $2.12 |
Guggenheim Russell 1000® Equal Weight ETF | 0.41% | 5.19% | 1,000.00 | 1,051.90 | 2.12 |
Guggenheim Russell 2000® Equal Weight ETF | 0.41% | 1.33% | 1,000.00 | 1,013.30 | 2.08 |
| Guggenheim MSCI Emerging Markets Equal Weight ETF | 0.60% | 2.47% | 1,000.00 | 1,024.70 | 3.06 |
Guggenheim S&P 500® Equal Weight Consumer Discretionary ETF | 0.40% | 7.67% | 1,000.00 | 1,076.70 | 2.09 |
Guggenheim S&P 500® Equal Weight Consumer Staples ETF | 0.40% | 7.82% | 1,000.00 | 1,078.20 | 2.10 |
Guggenheim S&P 500® Equal Weight Energy ETF | 0.40% | -10.23% | 1,000.00 | 897.70 | 1.91 |
Guggenheim S&P 500® Equal Weight Financials ETF | 0.40% | 8.55% | 1,000.00 | 1,085.50 | 2.10 |
Guggenheim S&P 500® Equal Weight Health Care ETF | 0.40% | 19.11% | 1,000.00 | 1,191.10 | 2.21 |
Guggenheim S&P 500® Equal Weight Industrials ETF | 0.40% | 6.00% | 1,000.00 | 1,060.00 | 2.08 |
Guggenheim S&P 500® Equal Weight Materials ETF | 0.40% | 1.15% | 1,000.00 | 1,011.50 | 2.03 |
Guggenheim S&P 500® Equal Weight Technology ETF | 0.40% | 11.45% | 1,000.00 | 1,114.50 | 2.13 |
Guggenheim S&P 500® Equal Weight Utilities ETF | 0.40% | 8.42% | 1,000.00 | 1,084.20 | 2.10 |
| Table 2. Based on hypothetical 5% return (before expenses) | |||||
Guggenheim Russell MidCap® Equal Weight ETF | 0.41% | 5.00% | 1,000.00 | 1,023.14 | 2.09 |
Guggenheim Russell 1000® Equal Weight ETF | 0.41% | 5.00% | 1,000.00 | 1,023.14 | 2.09 |
Guggenheim Russell 2000® Equal Weight ETF | 0.41% | 5.00% | 1,000.00 | 1,023.14 | 2.09 |
| Guggenheim MSCI Emerging Markets Equal Weight ETF | 0.60% | 5.00% | 1,000.00 | 1,022.18 | 3.06 |
Guggenheim S&P 500® Equal Weight Consumer Discretionary ETF | 0.40% | 5.00% | 1,000.00 | 1,023.19 | 2.04 |
Guggenheim S&P 500® Equal Weight Consumer Staples ETF | 0.40% | 5.00% | 1,000.00 | 1,023.19 | 2.04 |
Guggenheim S&P 500® Equal Weight Energy ETF | 0.40% | 5.00% | 1,000.00 | 1,023.19 | 2.04 |
Guggenheim S&P 500® Equal Weight Financials ETF | 0.40% | 5.00% | 1,000.00 | 1,023.19 | 2.04 |
Guggenheim S&P 500® Equal Weight Health Care ETF | 0.40% | 5.00% | 1,000.00 | 1,023.19 | 2.04 |
Guggenheim S&P 500® Equal Weight Industrials ETF | 0.40% | 5.00% | 1,000.00 | 1,023.19 | 2.04 |
Guggenheim S&P 500® Equal Weight Materials ETF | 0.40% | 5.00% | 1,000.00 | 1,023.19 | 2.04 |
Guggenheim S&P 500® Equal Weight Technology ETF | 0.40% | 5.00% | 1,000.00 | 1,023.19 | 2.04 |
Guggenheim S&P 500® Equal Weight Utilities ETF | 0.40% | 5.00% | 1,000.00 | 1,023.19 | 2.04 |
1 | Annualized and excludes expenses of the underlying funds in which the Funds invest. |
2 | Expenses are equal to the Fund's annualized expense ratio, net of any applicable fee waivers, multiplied by the average account value over the period, multiplied by 184/365 (to reflect the one-half year period). |
3 | Actual cumulative return at net asset value for the period April 30, 2014 to October 31, 2014. |
6 | GUGGENHEIM ETFs ANNUAL REPORT |
MANAGER'S ANALYSIS (Unaudited) | October 31, 2014 |
GUGGENHEIM RUSSELL MIDCAP® EQUAL WEIGHT ETF
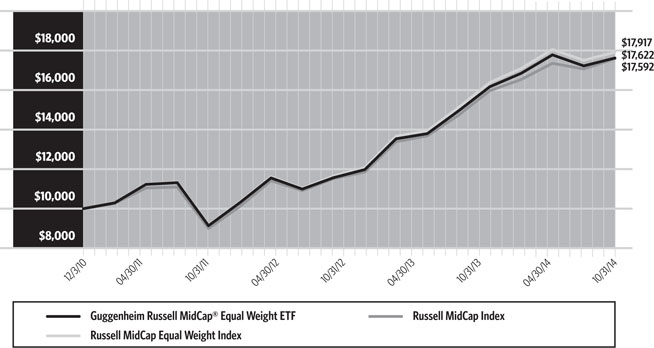
Guggenheim Russell Midcap® Equal Weight ETF returned 13.61% for the one-year period ended October 31, 2014, compared with the 14.13% return of the benchmark, the Russell Midcap® Equal Weight Index. The cap-weighted Russell Midcap® Index returned 15.32%. During the period, EWRM achieved over 99% correlation to its benchmark on a daily basis.
The Health Care, Information Technology and Consumer Staples sectors contributed most to return for the period. Energy was the only sector to detract from return. Sectors contributing least were Telecommunication Services and Consumer Discretionary.
Top contributors to Fund return included Keurig Green Mountain, Inc., Hillshire Brands Co. and WhiteWave Foods Co. Top detractors included Sprouts Farmers Markets, Inc., Whole Foods Market, Inc. and Fresh Market, Inc.
Cumulative Fund Performance: December 3, 2010 – October 31, 2014
| AVERAGE ANNUAL TOTAL RETURNS FOR THE PERIOD ENDED OCTOBER 31, 2014 | |||
| One Year | Three Year | Since Inception (12/03/10) | |
Guggenheim Russell MidCap® Equal Weight ETF | 13.61% | 19.29% | 15.60% |
| Russell MidCap Equal Weight Index | 14.13% | 19.83% | 16.09% |
| Russell MidCap Index | 15.32% | 20.05% | 15.54% |
The returns presented above do not reflect the effect of taxes. Index returns represent total returns. Performance displayed represents past performance, which is no guarantee of future results.
| GUGGENHEIM ETFs ANNUAL REPORT | 7 |
PORTFOLIO SUMMARY (Unaudited) | October 31, 2014 |
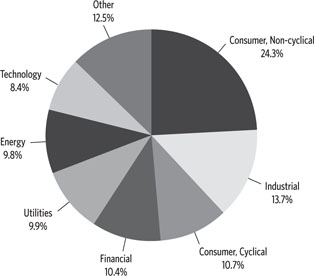
GUGGENHEIM RUSSELL MIDCAP® EQUAL WEIGHT ETF
Holdings Diversification*
"Holdings Diversification (Market Exposure as % of Net Assets)" excludes any temporary cash investments.
* The Fund's Top Ten Holdings are expressed as a percentage of net assets and the Holdings Diversification is expressed as a percentage of the Fund's equity investments market value. These percentages may change over time.
| Ten Largest Holdings* | (% of Total Net Assets) |
| Herbalife Ltd. | 0.4% |
| Keurig Green Mountain, Inc. | 0.4% |
| Monster Beverage Corp. | 0.4% |
| Dr Pepper Snapple Group, Inc. | 0.3% |
| Hormel Foods Corp. | 0.3% |
| Kroger Co. | 0.3% |
| Hain Celestial Group, Inc. | 0.3% |
| Pinnacle Foods, Inc. | 0.3% |
| McCormick & Company, Inc. | 0.3% |
| Tyson Foods, Inc. — Class A | 0.3% |
| Top Ten Total | 3.3% |
| "Ten Largest Holdings" exclude any temporary cash. | |
8 | GUGGENHEIM ETFs ANNUAL REPORT |
MANAGER'S ANALYSIS (Unaudited) | October 31, 2014 |
GUGGENHEIM RUSSELL 1000® EQUAL WEIGHT ETF
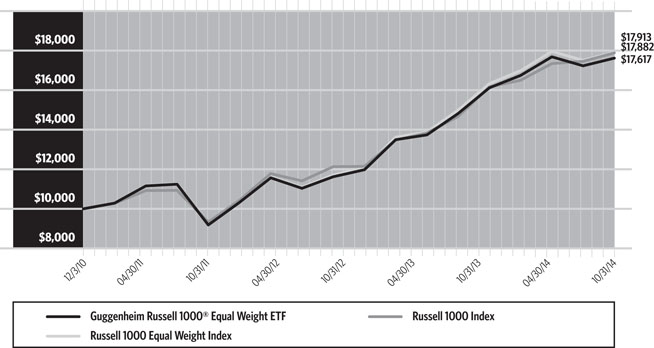
Guggenheim Russell 1000® Equal Weight ETF returned 14.33% for the one-year period ended October 31, 2014, compared with the 14.83% return of the benchmark, the Russell 1000® Equal Weight Index. The cap-weighted Russell 1000® Index returned 16.78%. During the period, EWRI achieved over 99% correlation to its benchmark on a daily basis.
The Health Care, Information Technology and Consumer Staples sectors contributed most to return for the period. Energy was the only sector to detract from return. Sectors contributing least were Telecommunication Services and Consumer Discretionary.
Top contributors to Fund return included Keurig Green Mountain, Inc., Hillshire Brands Co. and WhiteWave Foods Co. Top detractors included Cliffs Natural Resources, Inc., Sprouts Farmers Markets, Inc. and Whole Foods Market, Inc.
Cumulative Fund Performance: December 3, 2010 – October 31, 2014
| AVERAGE ANNUAL TOTAL RETURNS FOR THE PERIOD ENDED OCTOBER 31, 2014 | |||
| One Year | Three Year | Since Inception (12/03/10) | |
Guggenheim Russell 1000® Equal Weight ETF | 14.33% | 19.20% | 15.59% |
| Russell 1000 Equal Weight Index | 14.83% | 19.76% | 16.08% |
| Russell 1000 Index | 16.78% | 19.90% | 16.03% |
The returns presented above do not reflect the effect of taxes. Index returns represent total returns. Performance displayed represents past performance, which is no guarantee of future results.
| GUGGENHEIM ETFs ANNUAL REPORT | 9 |
PORTFOLIO SUMMARY (Unaudited) | October 31, 2014 |
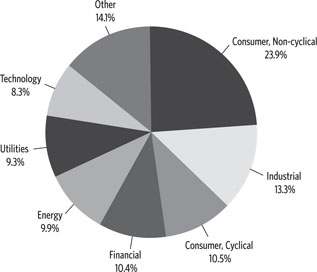
GUGGENHEIM RUSSELL 1000® EQUAL WEIGHT ETF
Holdings Diversification*
"Holdings Diversification (Market Exposure as % of Net Assets)" excludes any temporary cash investments.
* The Fund's Top Ten Holdings are expressed as a percentage of net assets and the Holdings Diversification is expressed as a percentage of the Fund's equity investments market value. These percentages may change over time.
| Ten Largest Holdings* | (% of Total Net Assets) |
| Herbalife Ltd. | 0.3% |
| Keurig Green Mountain, Inc. | 0.3% |
| Monster Beverage Corp. | 0.2% |
| Reynolds American, Inc. | 0.2% |
| Dr Pepper Snapple Group, Inc. | 0.2% |
| Hormel Foods Corp. | 0.2% |
| CVS Health Corp. | 0.2% |
| Kroger Co. | 0.2% |
| Hain Celestial Group, Inc. | 0.2% |
| Altria Group, Inc. | 0.2% |
| Top Ten Total | 2.2% |
| "Ten Largest Holdings" exclude any temporary cash. | |
10 | GUGGENHEIM ETFs ANNUAL REPORT |
MANAGER'S ANALYSIS (Unaudited) | October 31, 2014 |
GUGGENHEIM RUSSELL 2000® EQUAL WEIGHT ETF
Guggenheim Russell 2000® Equal Weight ETF returned 5.58% for the one-year period ended October 31, 2014, compared with the 5.80% return of the benchmark, the Russell 2000® Equal Weight Index. The cap-weighted Russell 2000® Index returned 8.06%. During the period, EWRS achieved over 99% correlation to its benchmark on a daily basis.
The Health Care, Financials and Utilities sectors contributed most to return for the period. The Energy and Consumer Discretionary sectors were the largest detractors from return. The sector contributing least was Materials.
Top contributors to Fund return included Cal-Maine Foods, Inc., Pantry, Inc. and Intercept Pharmaceuticals, Inc. Top detractors included NII Holdings, Inc.—Class B, Fairway Group Holdings Corp.—Class A and Natural Grocers by Vitamin Cottage, Inc.
Cumulative Fund Performance: December 3, 2010 – October 31, 2014
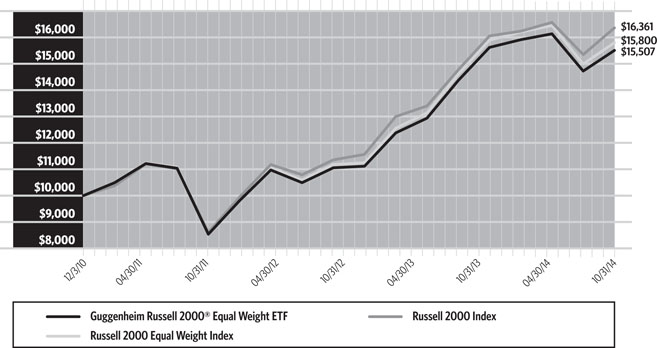
| AVERAGE ANNUAL TOTAL RETURNS FOR THE PERIOD ENDED OCTOBER 31, 2014 | |||
| One Year | Three Year | Since Inception (12/03/10) | |
Guggenheim Russell 2000® Equal Weight ETF | 5.58% | 16.44% | 11.88% |
| Russell 2000 Equal Weight Index | 5.80% | 16.98% | 12.41% |
| Russell 2000 Index | 8.06% | 18.18% | 13.42% |
The returns presented above do not reflect the effect of taxes. Index returns represent total returns. Performance displayed represents past performance, which is no guarantee of future results.
| GUGGENHEIM ETFs ANNUAL REPORT | 11 |
PORTFOLIO SUMMARY (Unaudited) | October 31, 2014 |
GUGGENHEIM RUSSELL 2000® EQUAL WEIGHT ETF
Holdings Diversification*
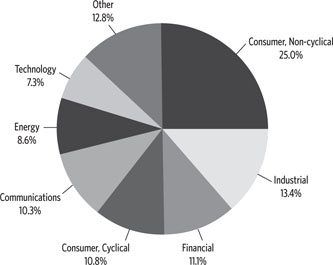
"Holdings Diversification (Market Exposure as % of Net Assets)" excludes any temporary cash investments.
* The Fund's Top Ten Holdings are expressed as a percentage of net assets and the Holdings Diversification is expressed as a percentage of the Fund's equity investments market value. These percentages may change over time.
| Ten Largest Holdings* | (% of Total Net Assets) |
| USANA Health Sciences, Inc. | 0.4% |
| Consolidated Communications Holdings, Inc. | 0.3% |
| National Beverage Corp. | 0.3% |
| Pantry, Inc. | 0.3% |
| Seaboard Corp. | 0.3% |
| Coca-Cola Bottling Company Consolidated | 0.3% |
| Casey's General Stores, Inc. | 0.3% |
| Orchids Paper Products Co. | 0.3% |
| John B Sanfilippo & Son, Inc. | 0.3% |
| SpartanNash Co. | 0.3% |
| Top Ten Total | 3.1% |
| "Ten Largest Holdings" exclude any temporary cash. | |
12 | GUGGENHEIM ETFs ANNUAL REPORT |
MANAGER'S ANALYSIS (Unaudited) | October 31, 2014 |
GUGGENHEIM MSCI EMERGING MARKETS EQUAL WEIGHT ETF
Guggenheim MSCI Emerging Markets Equal Weight ETF returned 0.99% for the one-year period ended October 31, 2014, compared with the 1.91% return of the benchmark, the MSCI Emerging Markets Equal Weight Index. The cap-weighted MSCI Emerging Markets Index returned 0.64%. During the period, EWEM achieved over 99% correlation to its benchmark on a daily basis.
The Financials, Information Technology and Utilities sectors contributed most to return for the period. The sectors detracting most from return were Materials, Energy and Consumer Discretionary.
Top contributors to Fund return included Wisdom Tree India Earnings Fund, Amorepacific Group and Amorepacific Corp. Top detractors included iShares MSCI Brazil Capped ETF, African Bank Investments Ltd. and Biostime International Holdings Ltd.
Cumulative Fund Performance: December 3, 2010 – October 31, 2014
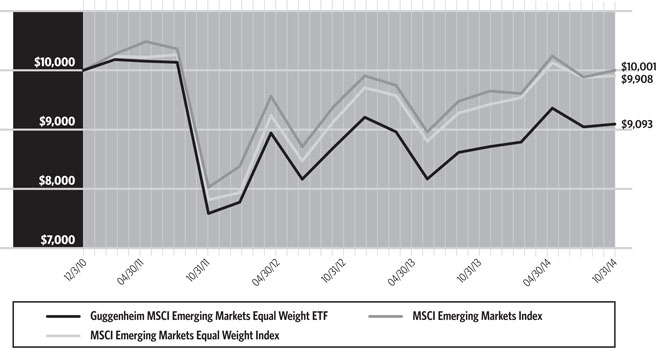
| AVERAGE ANNUAL TOTAL RETURNS FOR THE PERIOD ENDED OCTOBER 31, 2014 | |||
| One Year | Three Year | Since Inception (12/03/10) | |
| Guggenheim MSCI Emerging Markets Equal Weight ETF | 0.99% | 1.92% | -2.40% |
| MSCI Emerging Markets Equal Weight Index | 1.91% | 4.14% | -0.24% |
| MSCI Emerging Markets Index | 0.64% | 3.24% | 0.00% |
The returns presented above do not reflect the effect of taxes. Index returns represent total returns. Performance displayed represents past performance, which is no guarantee of future results.
| GUGGENHEIM ETFs ANNUAL REPORT | 13 |
PORTFOLIO SUMMARY (Unaudited) | October 31, 2014 |
GUGGENHEIM MSCI EMERGING MARKETS EQUAL WEIGHT ETF
Holdings Diversification*
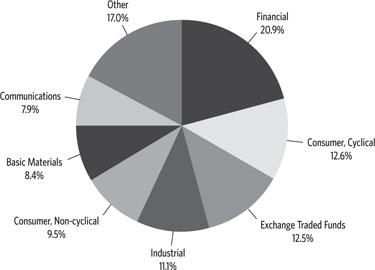
"Holdings Diversification (Market Exposure as % of Net Assets)" excludes any temporary cash investments.
* The Fund's Top Ten Holdings are expressed as a percentage of net assets and the Holdings Diversification is expressed as a percentage of the Fund's equity investments market value. These percentages may change over time.
| Ten Largest Holdings* | (% of Total Net Assets) |
| WisdomTree India Earnings Fund | 8.2% |
| iShares MSCI Brazil Capped ETF | 4.3% |
| Eclat Textile Company Ltd. | 0.3% |
| Megaworld Corp. | 0.3% |
| BDO Unibank, Inc. | 0.3% |
| Telekom Malaysia BHD | 0.3% |
| Ayala Land, Inc. | 0.3% |
| Hanergy Thin Film Power Group Ltd. | 0.3% |
| DMCI Holdings, Inc. | 0.3% |
| Tenaga Nasional BHD | 0.2% |
| Top Ten Total | 14.8% |
| "Ten Largest Holdings" exclude any temporary cash. | |
14 | GUGGENHEIM ETFs ANNUAL REPORT |
MANAGER'S ANALYSIS (Unaudited) | October 31, 2014 |
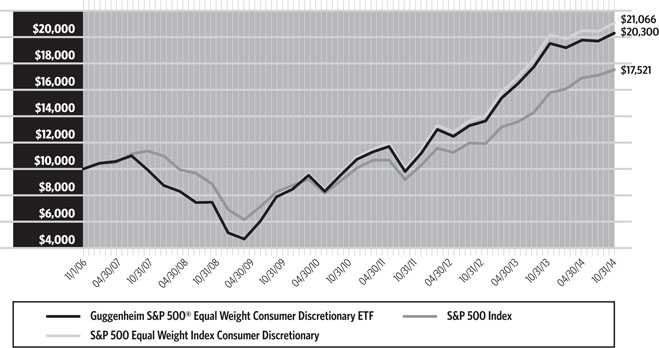
GUGGENHEIM S&P 500® EQUAL WEIGHT CONSUMER DISCRETIONARY ETF
For the one-year period ended October 31, 2014, Guggenheim S&P 500® Equal Weight Consumer Discretionary ETF returned 10.07%, compared to its benchmark, the S&P 500® Equal Weight Index Consumer Discretionary, which returned 10.55%. RCD achieved over 99% correlation to its benchmark on a daily basis.
The return of the cap-weighted Standard & Poor's 500® Index was 17.27%.
The Household Durables; Hotels, Restaurants & Leisure; and Media industries were the largest contributors to return. The Automobiles and Leisure Products industries were the only detractors from return. The Textiles, Apparel & Luxury Goods industry contributed least to return.
Marriott International, Inc.—Class A, Expedia, Inc. and O'Reilly Automotive, Inc. contributed most to return. Coach, Inc., Mattel, Inc. and Urban Outfitters, Inc. detracted most from return.
Cumulative Fund Performance: November 1, 2006 – October 31, 2014
| AVERAGE ANNUAL TOTAL RETURNS FOR THE PERIOD ENDED OCTOBER 31, 2014 | ||||
| One Year | Three Year | Five Year | Since Inception (11/01/06) | |
Guggenheim S&P 500® Equal Weight Consumer Discretionary ETF | 10.07% | 21.71% | 21.77% | 9.26% |
| S&P 500 Equal Weight Index Consumer Discretionary | 10.55% | 22.32% | 22.43% | 9.77% |
| S&P 500 Index | 17.27% | 19.77% | 16.69% | 7.26% |
The returns presented above do not reflect the effect of taxes. Index returns represent total returns. Performance displayed represents past performance, which is no guarantee of future results.
| GUGGENHEIM ETFs ANNUAL REPORT | 15 |
PORTFOLIO SUMMARY (Unaudited) | October 31, 2014 |
GUGGENHEIM S&P 500® EQUAL WEIGHT CONSUMER DISCRETIONARY ETF
Holdings Diversification*
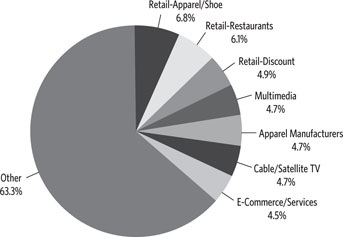
"Holdings Diversification (Market Exposure as % of Net Assets)" excludes any temporary cash investments.
* The Fund's Top Ten Holdings are expressed as a percentage of net assets and the Holdings Diversification is expressed as a percentage of the Fund's equity investments market value. These percentages may change over time.
| Ten Largest Holdings* | (% of Total Net Assets) |
| Tractor Supply Co. | 1.4% |
| O'Reilly Automotive, Inc. | 1.4% |
| NIKE, Inc. — Class B | 1.4% |
| Whirlpool Corp. | 1.4% |
| Leggett & Platt, Inc. | 1.3% |
| L Brands, Inc. | 1.3% |
| Lennar Corp. — Class A | 1.3% |
| Home Depot, Inc. | 1.3% |
| Genuine Parts Co. | 1.3% |
| AutoNation, Inc. | 1.3% |
| Top Ten Total | 13.4% |
| "Ten Largest Holdings" exclude any temporary cash. | |
16 | GUGGENHEIM ETFs ANNUAL REPORT |
MANAGER'S ANALYSIS (Unaudited) | October 31, 2014 |
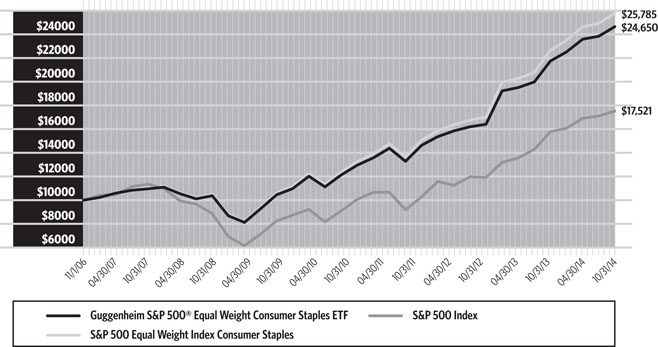
GUGGENHEIM S&P 500® EQUAL WEIGHT CONSUMER STAPLES ETF
For the one-year period ended October 31, 2014, Guggenheim S&P 500® Equal Weight Consumer Staples ETF returned 16.04%. For the same period, its benchmark, the S&P 500® Equal Weight Index Consumer Staples, returned 16.58%. RHS achieved over 99% correlation to its benchmark on a daily basis.
The return of the cap-weighted Standard & Poor's 500® Index was 17.27%.
The Beverages, Food Products and Tobacco industries were the largest contributors to return. The Personal Products industry was the only detractor. The IT Services and Household Products industries contributed least to return.
Monster Beverage Corp., Tyson Foods, Inc.—Class A and Dr. Pepper Snapple Group, Inc. contributed most to return. Avon Products, Inc., Whole Foods Market, Inc. and J.M. Smucker Co. contributed least.
Cumulative Fund Performance: November 1, 2006 – October 31, 2014
| AVERAGE ANNUAL TOTAL RETURNS FOR THE PERIOD ENDED OCTOBER 31, 2014 | ||||
| One Year | Three Year | Five Year | Since Inception (11/01/06) | |
Guggenheim S&P 500® Equal Weight Consumer Staples ETF | 16.04% | 20.67% | 18.21% | 11.94% |
| S&P 500 Equal Weight Index Consumer Staples | 16.58% | 21.34% | 18.91% | 12.57% |
| S&P 500 Index | 17.27% | 19.77% | 16.69% | 7.26% |
The returns presented above do not reflect the effect of taxes. Index returns represent total returns. Performance displayed represents past performance, which is no guarantee of future results.
| GUGGENHEIM ETFs ANNUAL REPORT | 17 |
PORTFOLIO SUMMARY (Unaudited) | October 31, 2014 |
GUGGENHEIM S&P 500® EQUAL WEIGHT CONSUMER STAPLES ETF
Holdings Diversification*
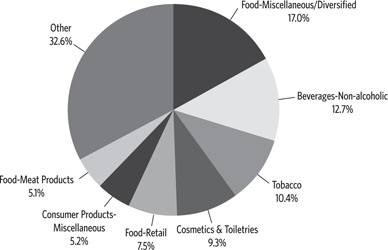
"Holdings Diversification (Market Exposure as % of Net Assets)" excludes any temporary cash investments.
* The Fund's Top Ten Holdings are expressed as a percentage of net assets and the Holdings Diversification is expressed as a percentage of the Fund's equity investments market value. These percentages may change over time.
| Ten Largest Holdings* | (% of Total Net Assets) |
| Keurig Green Mountain, Inc. | 2.8% |
| Monster Beverage Corp. | 2.7% |
| Altria Group, Inc. | 2.7% |
| Dr Pepper Snapple Group, Inc. | 2.7% |
| Clorox Co. | 2.7% |
| Reynolds American, Inc. | 2.6% |
| Hormel Foods Corp. | 2.6% |
| Kroger Co. | 2.6% |
| Constellation Brands, Inc. — Class A | 2.6% |
| CVS Health Corp. | 2.6% |
| Top Ten Total | 26.6% |
| "Ten Largest Holdings" exclude any temporary cash. | |
18 | GUGGENHEIM ETFs ANNUAL REPORT |
MANAGER'S ANALYSIS (Unaudited) | October 31, 2014 |
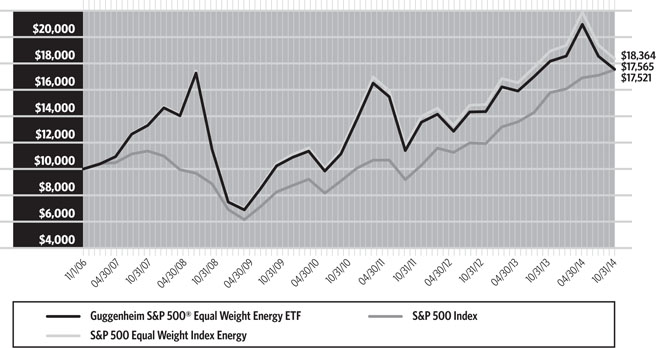
GUGGENHEIM S&P 500® EQUAL WEIGHT ENERGY ETF
For the one-year period ended October 31, 2014, Guggenheim S&P 500® Equal Weight Energy ETF returned -2.02%. For the same period, its benchmark, the S&P 500® Equal Weight Index Energy, returned -1.64%. RYE achieved over 99% correlation to its benchmark on a daily basis.
The return of the cap-weighted Standard & Poor's 500® Index was 17.27%.
The Oil & Gas Refining & Marketing; Oil & Gas Storage & Transportation; and Oil & Gas Equipment & Services industries were the largest contributors to return. The largest detractors from return were the industries for Oil & Gas Exploration & Production; Oil & Gas Drilling; and Coal & Consumable Fuels.
Williams Companies, Inc., Tesoro Corp. and Marathon Petroleum Corp. contributed most to return. Denbury Resources, Inc., Peabody Energy Corp. and Noble Corp. Plc detracted most from return.
Cumulative Fund Performance: November 1, 2006 – October 31, 2014
| AVERAGE ANNUAL TOTAL RETURNS FOR THE PERIOD ENDED OCTOBER 31, 2014 | ||||
| One Year | Three Year | Five Year | Since Inception (11/01/06) | |
Guggenheim S&P 500® Equal Weight Energy ETF | -2.02% | 7.54% | 11.18% | 7.30% |
| S&P 500 Equal Weight Index Energy | -1.64% | 8.05% | 11.76% | 7.90% |
| S&P 500 Index | 17.27% | 19.77% | 16.69% | 7.26% |
The returns presented above do not reflect the effect of taxes. Index returns represent total returns. Performance displayed represents past performance, which is no guarantee of future results.
| GUGGENHEIM ETFs ANNUAL REPORT | 19 |
PORTFOLIO SUMMARY (Unaudited) | October 31, 2014 |
GUGGENHEIM S&P 500® EQUAL WEIGHT ENERGY ETF
Holdings Diversification*
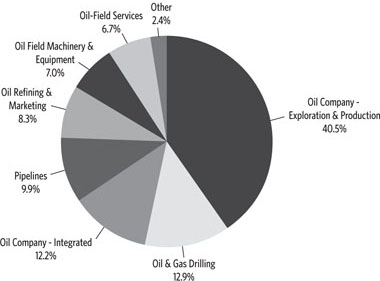
"Holdings Diversification (Market Exposure as % of Net Assets)" excludes any temporary cash investments.
* The Fund's Top Ten Holdings are expressed as a percentage of net assets and the Holdings Diversification is expressed as a percentage of the Fund's equity investments market value. These percentages may change over time.
| Ten Largest Holdings* | (% of Total Net Assets) |
| Tesoro Corp. | 3.0% |
| Marathon Petroleum Corp. | 2.7% |
| Valero Energy Corp. | 2.6% |
| Kinder Morgan, Inc. | 2.6% |
| Exxon Mobil Corp. | 2.6% |
| Equities Corp. | 2.5% |
| FMC Technologies, Inc. | 2.5% |
| Williams Companies, Inc. | 2.5% |
| Spectra Energy Corp. | 2.5% |
| Chevron Corp. | 2.5% |
| Top Ten Total | 26.0% |
| "Ten Largest Holdings" exclude any temporary cash. | |
20 | GUGGENHEIM ETFs ANNUAL REPORT |
MANAGER'S ANALYSIS (Unaudited) | October 31, 2014 |
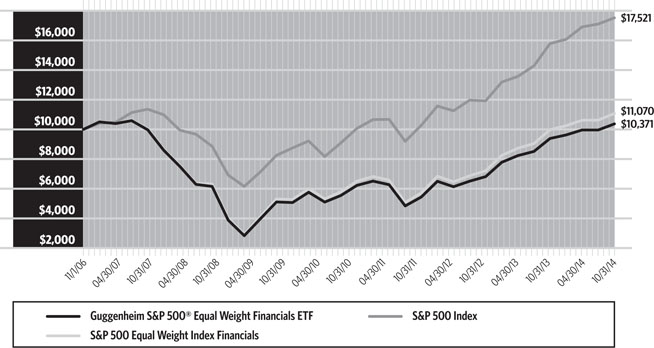
GUGGENHEIM S&P 500® EQUAL WEIGHT FINANCIALS ETF
For the one-year period ended October 31, 2014, Guggenheim S&P 500® Equal Weight Financials ETF returned 16.84%. For the same period, its benchmark, the S&P 500® Equal Weight Index Financials, returned 17.41%. RYF achieved a daily correlation of over 99% to its benchmark on a daily basis.
The return of the cap-weighted Standard & Poor's 500® Index was 17.27%.
The Real Estate Investment Trusts (REITs), Capital Markets and Insurance industries were the largest contributors to return. No industry detracted, but the three industries contributing least to return were Thrifts & Mortgage Finance, Real Estate Management & Development and Consumer Finance.
Moody's Corp., Legg Mason, Inc. and CBRE Group, Inc.—Class A were the largest contributors to return. Luecadia National Corp., Loews Corp. and Aflac, Inc. were the largest detractors from return.
Cumulative Fund Performance: November 1, 2006 – October 31, 2014
| AVERAGE ANNUAL TOTAL RETURNS FOR THE PERIOD ENDED OCTOBER 31, 2014 | ||||
| One Year | Three Year | Five Year | Since Inception (11/01/06) | |
Guggenheim S&P 500® Equal Weight Financials ETF | 16.84% | 23.17% | 16.89% | 0.46% |
| S&P 500 Equal Weight Index Financials | 17.41% | 23.83% | 17.52% | 1.28% |
| S&P 500 Index | 17.27% | 19.77% | 16.69% | 7.26% |
The returns presented above do not reflect the effect of taxes. Index returns represent total returns. Performance displayed represents past performance, which is no guarantee of future results.
| GUGGENHEIM ETFs ANNUAL REPORT | 21 |
PORTFOLIO SUMMARY (Unaudited) | October 31, 2014 |
GUGGENHEIM S&P 500® EQUAL WEIGHT FINANCIALS ETF
Holdings Diversification*
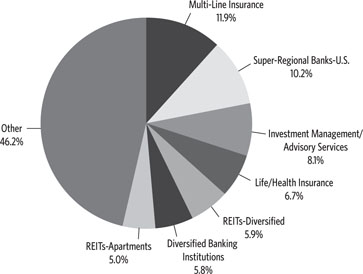
"Holdings Diversification (Market Exposure as % of Net Assets)" excludes any temporary cash investments.
* The Fund's Top Ten Holdings are expressed as a percentage of net assets and the Holdings Diversification is expressed as a percentage of the Fund's equity investments market value. These percentages may change over time.
| Ten Largest Holdings* | (% of Total Net Assets) |
| Health Care REIT, Inc. | 1.3% |
| Navient Corp. | 1.3% |
| Ventas, Inc. | 1.3% |
| Kimco Realty Corp. | 1.3% |
| Equity Residential | 1.3% |
| Public Storage | 1.3% |
| Essex Property Trust, Inc. | 1.3% |
| Macerich Co. | 1.3% |
| Boston Properties, Inc. | 1.3% |
| Chubb Corp. | 1.3% |
| Top Ten Total | 13.0% |
| "Ten Largest Holdings" exclude any temporary cash or derivative investments. | |
22 | GUGGENHEIM ETFs ANNUAL REPORT |
MANAGER'S ANALYSIS (Unaudited) | October 31, 2014 |
GUGGENHEIM S&P 500® EQUAL WEIGHT HEALTH CARE ETF
For the one-year period ended October 31, 2014, Guggenheim S&P 500® Equal Weight Health Care ETF returned 32.20%. For the same period, its benchmark, the S&P 500® Equal Weight Index Health Care, returned 32.86%. RYH achieved over 99% correlation to its benchmark on a daily basis.
The return of the cap-weighted Standard & Poor's 500® Index was 17.27%.
The Pharmaceuticals, Health Care Equipment & Supplies and Health Care Providers & Services industries were the largest contributors to return. No industry detracted, but the industries contributing least to return were Health Care Technology, Life Sciences Tools & Services and Biotechnology.
Forest Laboratories, Inc., Allergan, Inc. and Edwards Lifesciences Corp. were the largest contributors to return. Universal Health Services, Inc.—Class B was the only detractor from return. Stocks contributing least were Pfizer, Inc. and Life Technologies Corp.
Cumulative Fund Performance: November 1, 2006 – October 31, 2014
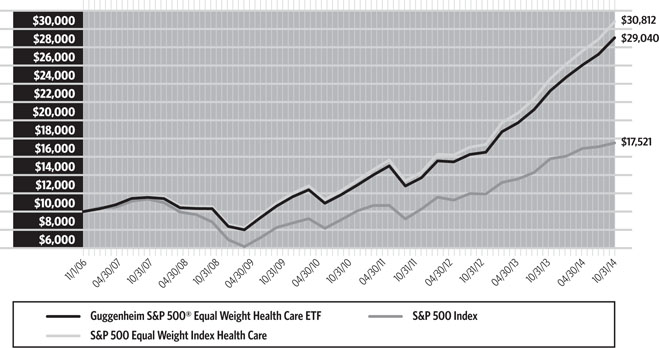
| AVERAGE ANNUAL TOTAL RETURNS FOR THE PERIOD ENDED OCTOBER 31, 2014 | ||||
| One Year | Three Year | Five Year | Since Inception (11/01/06) | |
Guggenheim S&P 500® Equal Weight Health Care ETF | 32.20% | 28.53% | 23.01% | 14.26% |
| S&P 500 Equal Weight Index Health Care | 32.86% | 29.22% | 23.68% | 15.11% |
| S&P 500 Index | 17.27% | 19.77% | 16.69% | 7.26% |
The returns presented above do not reflect the effect of taxes. Index returns represent total returns. Performance displayed represents past performance, which is no guarantee of future results.
| GUGGENHEIM ETFs ANNUAL REPORT | 23 |
PORTFOLIO SUMMARY (Unaudited) | October 31, 2014 |
GUGGENHEIM S&P 500® EQUAL WEIGHT HEALTH CARE ETF
Holdings Diversification*
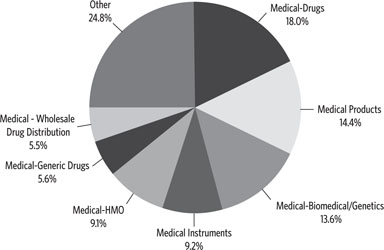
"Holdings Diversification (Market Exposure as % of Net Assets)" excludes any temporary cash investments.
* The Fund's Top Ten Holdings are expressed as a percentage of net assets and the Holdings Diversification is expressed as a percentage of the Fund's equity investments market value. These percentages may change over time.
| Ten Largest Holdings* | (% of Total Net Assets) |
| CareFusion Corp. | 2.1% |
| Edwards Lifesciences Corp. | 2.1% |
| Vertex Pharmaceuticals, Inc. | 2.1% |
| Amgen, Inc. | 2.0% |
| Alexion Pharmaceuticals, Inc. | 2.0% |
| Celgene Corp. | 2.0% |
| Bristol-Myers Squibb Co. | 2.0% |
| Mylan, Inc. | 1.9% |
| Regeneron Pharmaceuticals, Inc. | 1.9% |
| Becton Dickinson and Co. | 1.9% |
| Top Ten Total | 20.0% |
| "Ten Largest Holdings" exclude any temporary cash. | |
24 | GUGGENHEIM ETFs ANNUAL REPORT |
MANAGER'S ANALYSIS (Unaudited) | October 31, 2014 |
GUGGENHEIM S&P 500® EQUAL WEIGHT INDUSTRIALS ETF
For the one-year period ended October 31, 2014, Guggenheim S&P 500® Equal Weight Industrials ETF returned 16.85% compared to its benchmark S&P 500® Equal Weight Index Industrials, which returned 17.34%. RGI achieved over 99% correlation to its benchmark on a daily basis.
The return of the cap-weighted Standard & Poor's 500® Index was 17.27%.
The Aerospace & Defense, Machinery and Road & Rail industries contributed the most to return. The largest detractors were the Trading Companies & Distributors and Construction & Engineering industries.
Southwest Airlines Co., General Dynamics Corp. and Union Pacific Corp. contributed most to return. Jacobs Engineering Group, Inc., ADT Corp. and Precision Castparts Corp. detracted most from return.
Cumulative Fund Performance: November 1, 2006 – October 31, 2014
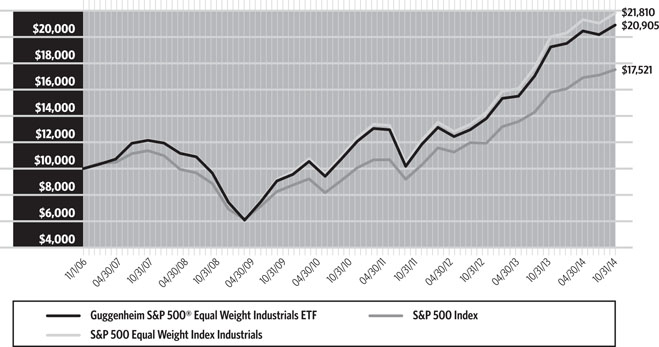
| AVERAGE ANNUAL TOTAL RETURNS FOR THE PERIOD ENDED OCTOBER 31, 2014 | ||||
| One Year | Three Year | Five Year | Since Inception (11/01/06) | |
Guggenheim S&P 500® Equal Weight Industrials ETF | 16.85% | 21.45% | 19.07% | 9.66% |
| S&P 500 Equal Weight Index Industrials | 17.34% | 22.08% | 19.68% | 10.24% |
| S&P 500 Index | 17.27% | 19.77% | 16.69% | 7.26% |
The returns presented above do not reflect the effect of taxes. Index returns represent total returns. Performance displayed represents past performance, which is no guarantee of future results.
| GUGGENHEIM ETFs ANNUAL REPORT | 25 |
PORTFOLIO SUMMARY (Unaudited) | October 31, 2014 |
GUGGENHEIM S&P 500® EQUAL WEIGHT INDUSTRIALS ETF
Holdings Diversification*

"Holdings Diversification (Market Exposure as % of Net Assets)" excludes any temporary cash investments.
* The Fund's Top Ten Holdings are expressed as a percentage of net assets and the Holdings Diversification is expressed as a percentage of the Fund's equity investments market value. These percentages may change over time.
| Ten Largest Holdings* | (% of Total Net Assets) |
| Textron, Inc. | 1.7% |
| CSX Corp. | 1.7% |
| General Dynamics Corp. | 1.7% |
| Cintas Corp. | 1.7% |
| Pall Corp. | 1.7% |
| Rockwell Collins, Inc. | 1.7% |
| Lockheed Martin Corp. | 1.7% |
| FedEx Corp. | 1.7% |
| Union Pacific Corp. | 1.7% |
| PACCAR, Inc. | 1.7% |
| Top Ten Total | 17.0% |
| "Ten Largest Holdings" exclude any temporary cash. | |
26 | GUGGENHEIM ETFs ANNUAL REPORT |
MANAGER'S ANALYSIS (Unaudited) | October 31, 2014 |
GUGGENHEIM S&P 500® EQUAL WEIGHT MATERIALS ETF
For the one-year period ended October 31, 2014, Guggenheim S&P 500® Equal Weight Materials ETF returned 10.68% compared with the 11.18% return of the benchmark, the S&P 500® Equal Weight Index Materials. RTM achieved over 99% correlation to its benchmark on a daily basis.
The return of the cap-weighted Standard & Poor's 500® Index was 17.27%.
The Chemicals, Containers & Packaging and Metals & Mining industries were the largest contributors to return. No industry detracted, but industries contributing least to return were Trading Companies & Distributors, Construction Materials, and Paper & Forest Products.
Alcoa, Inc., Sigma-Aldrich Corp. and Ball Corp. contributed most to return. Newmont Mining Corp., Freeport-McMoRan, Inc. and Cliffs Natural Resources, Inc. detracted most from return.
Cumulative Fund Performance: November 1, 2006 – October 31, 2014
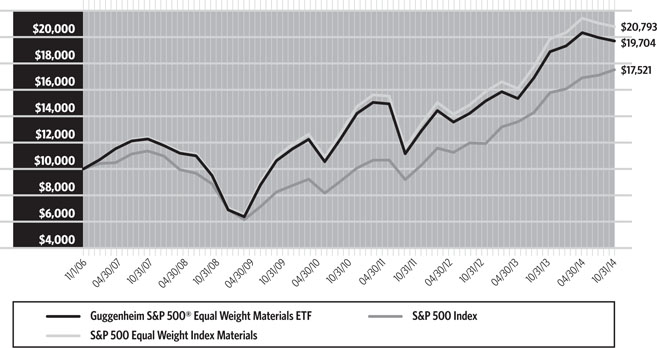
| AVERAGE ANNUAL TOTAL RETURNS FOR THE PERIOD ENDED OCTOBER 31, 2014 | ||||
| One Year | Three Year | Five Year | Since Inception (11/01/06) | |
Guggenheim S&P 500® Equal Weight Materials ETF | 10.68% | 15.16% | 14.54% | 8.85% |
| S&P 500 Equal Weight Index Materials | 11.18% | 15.71% | 15.14% | 9.59% |
| S&P 500 Index | 17.27% | 19.77% | 16.69% | 7.26% |
The returns presented above do not reflect the effect of taxes. Index returns represent total returns. Performance displayed represents past performance, which is no guarantee of future results.
| GUGGENHEIM ETFs ANNUAL REPORT | 27 |
PORTFOLIO SUMMARY (Unaudited) | October 31, 2014 |
GUGGENHEIM S&P 500® EQUAL WEIGHT MATERIALS ETF
Holdings Diversification*
"Holdings Diversification (Market Exposure as % of Net Assets)" excludes any temporary cash investments.
* The Fund's Top Ten Holdings are expressed as a percentage of net assets and the Holdings Diversification is expressed as a percentage of the Fund's equity investments market value. These percentages may change over time.
| Ten Largest Holdings* | (% of Total Net Assets) |
| Sigma-Aldrich Corp. | 4.6% |
| EI du Pont de Nemours & Co. | 3.7% |
| Sherwin-Williams Co. | 3.6% |
| Air Products & Chemicals, Inc. | 3.6% |
| MeadWestvaco Corp. | 3.6% |
| CF Industries Holdings, Inc. | 3.6% |
| Airgas, Inc. | 3.5% |
| PPG Industries, Inc. | 3.5% |
| Monsanto Co. | 3.5% |
| International Paper Co. | 3.5% |
| Top Ten Total | 36.7% |
| "Ten Largest Holdings" exclude any temporary cash. | |
28 | GUGGENHEIM ETFs ANNUAL REPORT |
MANAGER'S ANALYSIS (Unaudited) | October 31, 2014 |
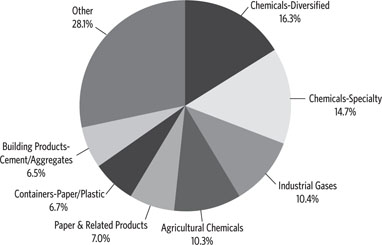
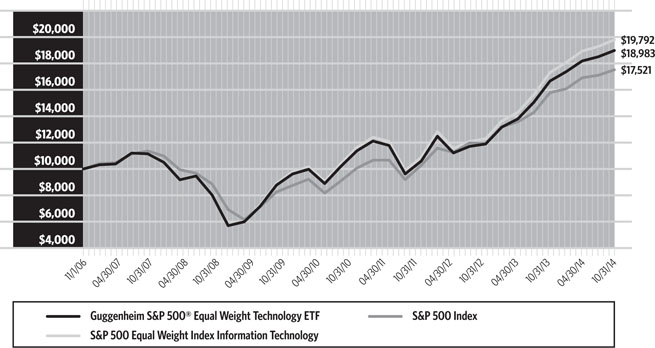
GUGGENHEIM S&P 500® EQUAL WEIGHT TECHNOLOGY ETF
For the one-year period ended October 31, 2014, Guggenheim S&P 500® Equal Weight Technology ETF returned 23.92% compared with its benchmark, the S&P 500® Equal Weight Index Information Technology, which returned 24.47%. RYT achieved over 99% correlation to its benchmark on a daily basis.
The return of the cap-weighted Standard & Poor's 500® Index was 17.27%.
The Semiconductors & Semiconductor Equipment industry was the largest contributor to return, followed by the Software industry and the Technology Hardware Storage & Peripherals industry. No industry detracted from return, but the Electrical Equipment, Diversified Financial Services and Consumer Finance industries contributed least.
Micron Technology, Inc., Electronic Arts, Inc. and Broadcom Corp.—Class A contributed most to return. International Business Machines Corp., Teradata Corp. and CA, Inc. detracted most from return.
Cumulative Fund Performance: November 1, 2006 – October 31, 2014
| AVERAGE ANNUAL TOTAL RETURNS FOR THE PERIOD ENDED OCTOBER 31, 2014 | ||||
| One Year | Three Year | Five Year | Since Inception (11/01/06) | |
Guggenheim S&P 500® Equal Weight Technology ETF | 23.92% | 19.66% | 17.67% | 8.34% |
| S&P 500 Equal Weight Index Information Technology | 24.47% | 20.25% | 18.31% | 8.91% |
| S&P 500 Index | 17.27% | 19.77% | 16.69% | 7.26% |
The returns presented above do not reflect the effect of taxes. Index returns represent total returns. Performance displayed represents past performance, which is no guarantee of future results.
| GUGGENHEIM ETFs ANNUAL REPORT | 29 |
PORTFOLIO SUMMARY (Unaudited) | October 31, 2014 |
GUGGENHEIM S&P 500® EQUAL WEIGHT TECHNOLOGY ETF
Holdings Diversification*
"Holdings Diversification (Market Exposure as % of Net Assets)" excludes any temporary cash investments.
* The Fund's Top Ten Holdings are expressed as a percentage of net assets and the Holdings Diversification is expressed as a percentage of the Fund's equity investments market value. These percentages may change over time.
| Ten Largest Holdings* | (% of Total Net Assets) |
| Visa, Inc. — Class A | 1.7% |
| Paychex, Inc. | 1.7% |
| Automatic Data Processing, Inc. | 1.7% |
| MasterCard, Inc. — Class A | 1.7% |
| Electronic Arts, Inc. | 1.7% |
| Alliance Data Systems Corp. | 1.7% |
| Cognizant Technology Solutions Corp. — Class A | 1.7% |
| Lam Research Corp. | 1.7% |
| salesforce.com, Inc. | 1.6% |
| Yahoo!, Inc. | 1.6% |
| Top Ten Total | 16.8% |
| "Ten Largest Holdings" exclude any temporary cash. | |
30 | GUGGENHEIM ETFs ANNUAL REPORT |
MANAGER'S ANALYSIS (Unaudited) | October 31, 2014 |
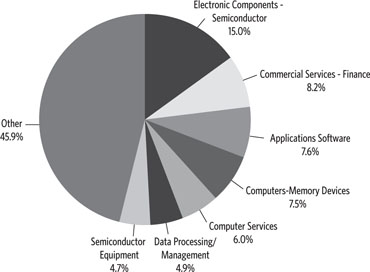
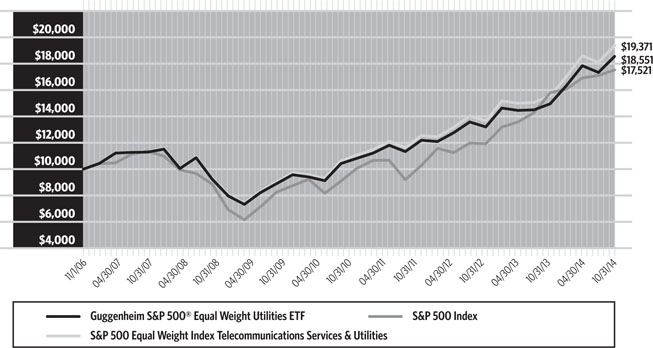
GUGGENHEIM S&P 500® EQUAL WEIGHT UTILITIES ETF
For the one-year period ended October 31, 2014, Guggenheim S&P 500® Equal Weight Utilities ETF returned 22.61% while its benchmark, the S&P 500® Equal Weight Telecommunication Services & Utilities Index, returned 23.18%. RYU had a 99% correlation to its benchmark on a daily basis.
The return of the cap-weighted Standard & Poor's 500® Index was 17.27%.
The Electric Utilities, Multi-Utilities and Diversified Telecommunication Services industries were the largest contributors to return. The Real Estate Investment Trusts (REITs) was the only industry detracting from performance. The Independent Power & Renewable Electricity Producers industry and the Gas Utilities industry contributed least.
Frontier Communications Corp.—Class B, Pepco Holdings, Inc. and Entergy Corp. contributed most to return. Crown Castle International Corp. was the only detractor. AT&T Corp. and AES Corp. contributed least to return.
Cumulative Fund Performance: November 1, 2006 – October 31, 2014
| AVERAGE ANNUAL TOTAL RETURNS FOR THE PERIOD ENDED OCTOBER 31, 2014 | ||||
| One Year | Three Year | Five Year | Since Inception (11/01/06) | |
Guggenheim S&P 500® Equal Weight Utilities ETF | 22.61% | 16.41% | 16.86% | 8.03% |
| S&P 500 Equal Weight Index Telecommunications Services & Utilitities | 23.18% | 17.04% | 17.54% | 8.62% |
| S&P 500 Index | 17.27% | 19.77% | 16.69% | 7.26% |
The returns presented above do not reflect the effect of taxes. Index returns represent total returns. Performance displayed represents past performance, which is no guarantee of future results.
| GUGGENHEIM ETFs ANNUAL REPORT | 31 |
PORTFOLIO SUMMARY (Unaudited) | October 31, 2014 |
GUGGENHEIM S&P 500® EQUAL WEIGHT UTILITIES ETF
Holdings Diversification*
"Holdings Diversification (Market Exposure as % of Net Assets)" excludes any temporary cash investments.
* The Fund's Top Ten Holdings are expressed as a percentage of net assets and the Holdings Diversification is expressed as a percentage of the Fund's equity investments market value. These percentages may change over time.
| Ten Largest Holdings* | (% of Total Net Assets) |
| Wisconsin Energy Corp. | 3.0% |
| Public Service Enterprise Group, Inc. | 3.0% |
| TECO Energy, Inc. | 3.0% |
| Duke Energy Corp. | 3.0% |
| Consolidated Edison, Inc. | 3.0% |
| Exelon Corp. | 3.0% |
| Entergy Corp. | 3.0% |
| American Electric Power Company, Inc. | 3.0% |
| Ameren Corp. | 2.9% |
| Northeast Utilities | 2.9% |
| Top Ten Total | 29.8% |
| "Ten Largest Holdings" exclude any temporary cash. | |
32 | GUGGENHEIM ETFs ANNUAL REPORT |
| SCHEDULE OF INVESTMENTS | October 31, 2014 |
GUGGENHEIM RUSSELL MIDCAP® EQUAL WEIGHT ETF |
| Shares | Value | |||||||
COMMON STOCKS† - 99.7% | ||||||||
| CONSUMER, NON-CYCLICAL - 24.3% | ||||||||
Herbalife Ltd.1 | 10,708 | $ | 561,742 | |||||
| Keurig Green Mountain, Inc. | 3,616 | 548,728 | ||||||
| Monster Beverage Corp.* | 5,205 | 525,080 | ||||||
| Dr Pepper Snapple Group, Inc. | 7,287 | 504,625 | ||||||
| Hormel Foods Corp. | 9,324 | 502,657 | ||||||
| Kroger Co. | 9,015 | 502,226 | ||||||
| Hain Celestial Group, Inc.* | 4,615 | 499,575 | ||||||
| Pinnacle Foods, Inc. | 14,747 | 498,449 | ||||||
| McCormick & Company, Inc. | 7,047 | 498,364 | ||||||
| Tyson Foods, Inc. — Class A | 12,335 | 497,717 | ||||||
| Bunge Ltd. | 5,574 | 494,135 | ||||||
| JM Smucker Co. | 4,744 | 493,376 | ||||||
| Constellation Brands, Inc. — Class A* | 5,371 | 491,661 | ||||||
| WhiteWave Foods Co. — Class A* | 13,194 | 491,213 | ||||||
| Whole Foods Market, Inc. | 12,401 | 487,731 | ||||||
| ConAgra Foods, Inc. | 14,186 | 487,289 | ||||||
| Clorox Co. | 4,897 | 487,252 | ||||||
| Campbell Soup Co. | 10,996 | 485,693 | ||||||
| Mead Johnson Nutrition Co. — Class A | 4,869 | 483,540 | ||||||
| Flowers Foods, Inc. | 25,383 | 482,277 | ||||||
| Church & Dwight Company, Inc. | 6,652 | 481,671 | ||||||
| Hershey Co. | 5,014 | 480,893 | ||||||
| Lorillard, Inc. | 7,801 | 479,762 | ||||||
| Brown-Forman Corp. — Class B | 5,168 | 478,919 | ||||||
| Ingredion, Inc. | 6,149 | 475,010 | ||||||
| Safeway, Inc. | 13,623 | 474,898 | ||||||
| Spectrum Brands Holdings, Inc. | 5,194 | 470,524 | ||||||
| Molson Coors Brewing Co. — Class B | 6,222 | 462,792 | ||||||
| Sprouts Farmers Market, Inc.* | 15,691 | 456,765 | ||||||
| Coca-Cola Enterprises, Inc. | 10,356 | 448,933 | ||||||
| Pilgrim’s Pride Corp.* | 15,462 | 439,275 | ||||||
| Incyte Corp.* | 4,400 | 295,065 | ||||||
| CareFusion Corp.* | 4,696 | 269,409 | ||||||
| IDEXX Laboratories, Inc.* | 1,824 | 258,406 | ||||||
| Alnylam Pharmaceuticals, Inc.* | 2,762 | 256,149 | ||||||
| Alkermes plc* | 5,003 | 252,901 | ||||||
| Edwards Lifesciences Corp.* | 2,086 | 252,240 | ||||||
| Illumina, Inc.* | 1,305 | 251,317 | ||||||
| Mylan, Inc.* | 4,661 | 249,596 | ||||||
| BioMarin Pharmaceutical, Inc.* | 3,002 | 247,665 | ||||||
| VCA, Inc.* | 5,388 | 245,531 | ||||||
| MEDNAX, Inc.* | 3,929 | 245,287 | ||||||
| CR Bard, Inc. | 1,485 | 243,495 | ||||||
| Centene Corp.* | 2,598 | 240,757 | ||||||
| DENTSPLY International, Inc. | 4,717 | 239,482 | ||||||
| Bruker Corp.* | 11,537 | 239,162 | ||||||
| Pharmacyclics, Inc.* | 1,824 | 238,342 | ||||||
| Boston Scientific Corp.* | 17,916 | 237,924 | ||||||
| Catamaran Corp.* | 4,959 | 236,395 | ||||||
| AmerisourceBergen Corp. — Class A | 2,762 | 235,902 | ||||||
| Zimmer Holdings, Inc. | 2,113 | 235,050 | ||||||
| Cubist Pharmaceuticals, Inc.* | 3,243 | 234,436 | ||||||
| Medivation, Inc.* | 2,200 | 232,540 | ||||||
| Cigna Corp. | 2,335 | 232,496 | ||||||
| Intuitive Surgical, Inc.* | 468 | 232,034 | ||||||
| Hologic, Inc.* | 8,843 | 231,598 | ||||||
| Teleflex, Inc. | 2,014 | 229,838 | ||||||
| Omnicare, Inc. | 3,447 | 229,536 | ||||||
| Laboratory Corporation of America Holdings* | 2,099 | 229,400 | ||||||
| Perrigo Company plc | 1,419 | 229,098 | ||||||
| DaVita HealthCare Partners, Inc.* | 2,903 | 226,637 | ||||||
| Humana, Inc. | 1,632 | 226,603 | ||||||
| Jazz Pharmaceuticals plc* | 1,339 | 226,077 | ||||||
| Charles River Laboratories International, Inc.* | 3,571 | 225,544 | ||||||
| Hill-Rom Holdings, Inc. | 5,067 | 225,380 | ||||||
| Cooper Companies, Inc. | 1,375 | 225,363 | ||||||
| St. Jude Medical, Inc. | 3,502 | 224,723 | ||||||
| Quintiles Transnational Holdings, Inc.* | 3,836 | 224,559 | ||||||
| Intercept Pharmaceuticals, Inc.* | 869 | 224,541 | ||||||
ResMed, Inc.1 | 4,298 | 224,442 | ||||||
| Patterson Companies, Inc. | 5,187 | 223,612 | ||||||
| Mallinckrodt plc* | 2,420 | 223,076 | ||||||
| Quest Diagnostics, Inc. | 3,514 | 222,998 | ||||||
| Premier, Inc. — Class A* | 6,680 | 222,978 | ||||||
| Varian Medical Systems, Inc.* | 2,646 | 222,582 | ||||||
Myriad Genetics, Inc.*,1 | 5,631 | 222,368 | ||||||
| Hospira, Inc.* | 4,115 | 220,976 | ||||||
| Health Net, Inc.* | 4,645 | 220,684 | ||||||
| Cardinal Health, Inc. | 2,810 | 220,529 | ||||||
| Brookdale Senior Living, Inc. — Class A* | 6,540 | 220,463 | ||||||
| Henry Schein, Inc.* | 1,834 | 220,135 | ||||||
| Sirona Dental Systems, Inc.* | 2,795 | 219,547 | ||||||
| Zoetis, Inc. | 5,898 | 219,170 | ||||||
| Vertex Pharmaceuticals, Inc.* | 1,940 | 218,522 | ||||||
| Envision Healthcare Holdings, Inc.* | 6,196 | 216,550 | ||||||
| QIAGEN N.V.* | 9,214 | 216,160 | ||||||
| Alere, Inc.* | 5,368 | 214,559 | ||||||
| Align Technology, Inc.* | 4,053 | 213,269 | ||||||
| LifePoint Hospitals, Inc.* | 3,020 | 211,399 | ||||||
| Endo International plc* | 3,132 | 209,593 | ||||||
| HCA Holdings, Inc.* | 2,992 | 209,590 | ||||||
| Community Health Systems, Inc.* | 3,811 | 209,491 | ||||||
| Bio-Rad Laboratories, Inc. — Class A* | 1,856 | 209,394 | ||||||
| Techne Corp. | 2,290 | 208,505 | ||||||
| United Therapeutics Corp.* | 1,587 | 207,849 | ||||||
| Covance, Inc.* | 2,582 | 206,302 | ||||||
| Universal Health Services, Inc. — Class B | 1,917 | 198,812 | ||||||
| Tenet Healthcare Corp.* | 3,462 | 194,045 | ||||||
| Seattle Genetics, Inc.* | 5,232 | 191,857 | ||||||
| Salix Pharmaceuticals Ltd.* | 1,288 | 185,279 | ||||||
| Gartner, Inc.* | 2,198 | 177,400 | ||||||
| Booz Allen Hamilton Holding Corp. | 6,031 | 158,917 | ||||||
| Robert Half International, Inc. | 2,862 | 156,780 | ||||||
| Cintas Corp. | 2,124 | 155,562 | ||||||
| SEE NOTES TO FINANCIAL STATEMENTS. | GUGGENHEIM ETFs ANNUAL REPORT | 33 |
SCHEDULE OF INVESTMENTS (continued) | October 31, 2014 |
GUGGENHEIM RUSSELL MIDCAP® EQUAL WEIGHT ETF |
| Shares | Value | |||||||
| Towers Watson & Co. — Class A | 1,403 | $ | 154,737 | |||||
| Rollins, Inc. | 4,833 | 154,028 | ||||||
| RR Donnelley & Sons Co. | 8,554 | 149,267 | ||||||
| Genpact Ltd.* | 8,380 | 147,069 | ||||||
| CoStar Group, Inc.* | 890 | 143,370 | ||||||
| Verisk Analytics, Inc. — Class A* | 2,288 | 142,657 | ||||||
| Avery Dennison Corp. | 3,038 | 142,330 | ||||||
| ADT Corp. | 3,966 | 142,141 | ||||||
| United Rentals, Inc.* | 1,263 | 139,006 | ||||||
| Quanta Services, Inc.* | 3,871 | 131,924 | ||||||
| Manpowergroup, Inc. | 1,946 | 129,896 | ||||||
| DeVry Education Group, Inc. | 2,407 | 116,523 | ||||||
| Apollo Education Group, Inc. — Class A* | 4,062 | 116,417 | ||||||
| Graham Holdings Co. — Class B | 147 | 115,189 | ||||||
| Live Nation Entertainment, Inc.* | 4,288 | 111,488 | ||||||
| KAR Auction Services, Inc. | 3,578 | 108,628 | ||||||
| Aramark | 3,818 | 106,560 | ||||||
| H&R Block, Inc. | 3,273 | 105,750 | ||||||
| Service Corporation International | 4,807 | 105,129 | ||||||
| Aaron’s, Inc. | 4,083 | 101,095 | ||||||
| ServiceMaster Global Holdings, Inc.* | 4,182 | 100,284 | ||||||
| Coty, Inc. — Class A* | 5,975 | 99,185 | ||||||
| Avis Budget Group, Inc.* | 1,717 | 95,723 | ||||||
| Alliance Data Systems Corp.* | 334 | 94,638 | ||||||
| Global Payments, Inc. | 1,173 | 94,427 | ||||||
| Total System Services, Inc. | 2,625 | 88,699 | ||||||
| FleetCor Technologies, Inc.* | 589 | 88,680 | ||||||
| Moody’s Corp. | 880 | 87,322 | ||||||
| McGraw Hill Financial, Inc. | 965 | 87,313 | ||||||
| SEI Investments Co. | 2,247 | 86,869 | ||||||
| Western Union Co. | 5,005 | 84,885 | ||||||
| Hertz Global Holdings, Inc.* | 3,859 | 84,589 | ||||||
| Equifax, Inc. | 1,094 | 82,860 | ||||||
| Avon Products, Inc. | 7,886 | 82,014 | ||||||
| Morningstar, Inc. | 1,195 | 81,559 | ||||||
| Vantiv, Inc. — Class A* | 2,626 | 81,196 | ||||||
| Vectrus, Inc.* | 436 | 10,656 | ||||||
| Total Consumer, Non-cyclical | 35,520,748 | |||||||
| INDUSTRIAL - 13.7% | ||||||||
| Energizer Holdings, Inc. | 3,789 | 464,721 | ||||||
| Acuity Brands, Inc. | 1,986 | 276,908 | ||||||
| Lennox International, Inc. | 3,077 | 273,607 | ||||||
| Packaging Corporation of America | 3,794 | 273,471 | ||||||
| Ingersoll-Rand plc | 4,231 | 264,945 | ||||||
| Hexcel Corp.* | 6,145 | 257,414 | ||||||
| Crown Holdings, Inc.* | 5,296 | 253,836 | ||||||
| Rock-Tenn Co. — Class A | 4,926 | 251,964 | ||||||
| Sonoco Products Co. | 6,148 | 251,269 | ||||||
| Silgan Holdings, Inc. | 5,090 | 250,224 | ||||||
| Sealed Air Corp. | 6,813 | 246,971 | ||||||
| AptarGroup, Inc. | 3,946 | 245,599 | ||||||
Valmont Industries, Inc.1 | 1,791 | 243,881 | ||||||
| Ball Corp. | 3,781 | 243,610 | ||||||
| Bemis Company, Inc. | 6,314 | 242,900 | ||||||
| Vulcan Materials Co. | 3,913 | 241,472 | ||||||
| Timken Co. | 5,595 | 240,529 | ||||||
| Greif, Inc. — Class A | 5,436 | 239,510 | ||||||
| Owens Corning | 7,372 | 236,346 | ||||||
SunPower Corp. — Class A*,1 | 7,233 | 230,299 | ||||||
| Owens-Illinois, Inc.* | 8,928 | 230,075 | ||||||
| USG Corp.* | 8,552 | 229,707 | ||||||
| Masco Corp. | 10,289 | 227,078 | ||||||
| Martin Marietta Materials, Inc. | 1,837 | 214,782 | ||||||
| PerkinElmer, Inc. | 4,921 | 213,670 | ||||||
| Golar LNG Ltd. | 3,797 | 213,049 | ||||||
| Eagle Materials, Inc. | 2,366 | 206,859 | ||||||
| Armstrong World Industries, Inc.* | 4,251 | 205,833 | ||||||
| TimkenSteel Corp. | 5,011 | 203,346 | ||||||
| AVX Corp. | 12,237 | 176,702 | ||||||
| Avnet, Inc. | 3,842 | 166,167 | ||||||
| SBA Communications Corp. — Class A* | 1,465 | 164,563 | ||||||
| Jabil Circuit, Inc. | 7,848 | 164,416 | ||||||
| Textron, Inc. | 3,946 | 163,877 | ||||||
| AECOM Technology Corp.* | 5,004 | 162,880 | ||||||
| Amphenol Corp. — Class A | 3,183 | 160,996 | ||||||
| Arrow Electronics, Inc.* | 2,811 | 159,834 | ||||||
| Parker-Hannifin Corp. | 1,244 | 158,025 | ||||||
| Carlisle Companies, Inc. | 1,754 | 155,895 | ||||||
| Waters Corp.* | 1,401 | 155,231 | ||||||
| L-3 Communications Holdings, Inc. | 1,278 | 155,226 | ||||||
| Pall Corp. | 1,692 | 154,683 | ||||||
| AO Smith Corp. | 2,896 | 154,501 | ||||||
| Allegion plc | 2,909 | 154,439 | ||||||
| Tech Data Corp.* | 2,578 | 153,958 | ||||||
| Snap-on, Inc. | 1,163 | 153,679 | ||||||
| J.B. Hunt Transport Services, Inc. | 1,925 | 153,557 | ||||||
| Stericycle, Inc.* | 1,216 | 153,216 | ||||||
| Roper Industries, Inc. | 962 | 152,285 | ||||||
| Regal-Beloit Corp. | 2,142 | 152,018 | ||||||
| Wabtec Corp. | 1,754 | 151,369 | ||||||
| Graco, Inc. | 1,927 | 151,270 | ||||||
| Rockwell Collins, Inc. | 1,794 | 150,965 | ||||||
| Vishay Intertechnology, Inc. | 11,114 | 150,150 | ||||||
| Triumph Group, Inc. | 2,145 | 149,357 | ||||||
| FLIR Systems, Inc. | 4,421 | 148,236 | ||||||
| Old Dominion Freight Line, Inc.* | 2,034 | 148,218 | ||||||
| CH Robinson Worldwide, Inc. | 2,139 | 148,041 | ||||||
| GATX Corp. | 2,326 | 147,468 | ||||||
| Expeditors International of Washington, Inc. | 3,444 | 146,921 | ||||||
| Covanta Holding Corp. | 6,641 | 146,567 | ||||||
| Landstar System, Inc. | 1,966 | 145,504 | ||||||
| Stanley Black & Decker, Inc. | 1,552 | 145,329 | ||||||
| Kansas City Southern | 1,179 | 144,769 | ||||||
| AMETEK, Inc. | 2,772 | 144,560 | ||||||
| Lincoln Electric Holdings, Inc. | 1,991 | 144,308 | ||||||
| Spirit AeroSystems Holdings, Inc. — Class A* | 3,664 | 144,142 | ||||||
34 | GUGGENHEIM ETFs ANNUAL REPORT | SEE NOTES TO FINANCIAL STATEMENTS. |
SCHEDULE OF INVESTMENTS (continued) | October 31, 2014 |
GUGGENHEIM RUSSELL MIDCAP® EQUAL WEIGHT ETF |
| Shares | Value | |||||||
| IDEX Corp. | 1,922 | $ | 143,977 | |||||
| Babcock & Wilcox Co. | 5,031 | 143,887 | ||||||
| TransDigm Group, Inc. | 769 | 143,826 | ||||||
| Waste Connections, Inc. | 2,878 | 143,612 | ||||||
| Donaldson Company, Inc. | 3,453 | 143,576 | ||||||
| Teekay Corp. | 2,449 | 143,169 | ||||||
| Zebra Technologies Corp. — Class A* | 1,940 | 143,075 | ||||||
| National Instruments Corp. | 4,508 | 142,813 | ||||||
| Huntington Ingalls Industries, Inc. | 1,348 | 142,645 | ||||||
| Nordson Corp. | 1,854 | 141,924 | ||||||
| Rockwell Automation, Inc. | 1,257 | 141,224 | ||||||
| Middleby Corp.* | 1,595 | 141,158 | ||||||
| Pentair plc | 2,100 | 140,805 | ||||||
| Exelis, Inc. | 7,864 | 140,372 | ||||||
| Mettler-Toledo International, Inc.* | 543 | 140,349 | ||||||
| Genesee & Wyoming, Inc. — Class A* | 1,458 | 140,260 | ||||||
| KBR, Inc. | 7,329 | 139,837 | ||||||
| Xylem, Inc. | 3,842 | 139,695 | ||||||
| Fluor Corp. | 2,102 | 139,447 | ||||||
| SPX Corp. | 1,468 | 139,152 | ||||||
| Ryder System, Inc. | 1,567 | 138,632 | ||||||
| Dover Corp. | 1,738 | 138,067 | ||||||
| ITT Corp. | 3,061 | 137,929 | ||||||
| Republic Services, Inc. — Class A | 3,587 | 137,741 | ||||||
| Foster Wheeler AG | 4,435 | 137,618 | ||||||
| Tyco International Ltd. | 3,203 | 137,505 | ||||||
| AGCO Corp. | 3,086 | 136,741 | ||||||
| Crane Co. | 2,191 | 136,609 | ||||||
| Agilent Technologies, Inc. | 2,463 | 136,155 | ||||||
| Flowserve Corp. | 1,978 | 134,484 | ||||||
| Jacobs Engineering Group, Inc.* | 2,831 | 134,331 | ||||||
| Joy Global, Inc. | 2,519 | 132,575 | ||||||
| Kirby Corp.* | 1,197 | 132,364 | ||||||
| Hubbell, Inc. — Class B | 1,155 | 130,989 | ||||||
| Chicago Bridge & Iron Company N.V. | 2,389 | 130,535 | ||||||
| Kennametal, Inc. | 3,367 | 130,000 | ||||||
| Colfax Corp.* | 2,380 | 129,424 | ||||||
| Tidewater, Inc. | 3,448 | 127,128 | ||||||
| Terex Corp. | 4,375 | 125,869 | ||||||
| Alliant Techsystems, Inc. | 1,073 | 125,498 | ||||||
| Clean Harbors, Inc.* | 2,516 | 124,869 | ||||||
| Trimble Navigation Ltd.* | 4,623 | 124,174 | ||||||
| Con-way, Inc. | 2,860 | 124,038 | ||||||
| B/E Aerospace, Inc.* | 1,656 | 123,289 | ||||||
| Gentex Corp. | 3,673 | 120,254 | ||||||
| Manitowoc Company, Inc. | 5,723 | 119,267 | ||||||
| Knowles Corp.* | 5,954 | 115,865 | ||||||
| Leggett & Platt, Inc. | 2,880 | 113,414 | ||||||
Garmin Ltd.1 | 2,000 | 110,960 | ||||||
| Fortune Brands Home & Security, Inc. | 2,477 | 107,130 | ||||||
| Trinity Industries, Inc. | 2,924 | 104,416 | ||||||
| AMERCO | 381 | 103,297 | ||||||
GoPro, Inc. — Class A*,1 | 1,248 | 96,221 | ||||||
| Total Industrial | 19,999,388 | |||||||
| CONSUMER, CYCLICAL - 10.7% | ||||||||
| GNC Holdings, Inc. — Class A | 11,899 | 494,641 | ||||||
| Rite Aid Corp.* | 91,374 | 479,714 | ||||||
| World Fuel Services Corp. | 6,462 | 266,493 | ||||||
| Scotts Miracle-Gro Co. — Class A | 4,371 | 258,938 | ||||||
| Fastenal Co. | 5,333 | 234,866 | ||||||
| Alaska Air Group, Inc. | 3,208 | 170,761 | ||||||
| Ingram Micro, Inc. — Class A* | 6,132 | 164,583 | ||||||
| Dolby Laboratories, Inc. — Class A | 3,855 | 161,602 | ||||||
| PACCAR, Inc. | 2,429 | 158,662 | ||||||
| United Continental Holdings, Inc.* | 2,981 | 157,427 | ||||||
| Allison Transmission Holdings, Inc. | 4,805 | 156,067 | ||||||
| Copa Holdings S.A. — Class A | 1,323 | 154,685 | ||||||
| Sabre Corp. | 8,746 | 150,431 | ||||||
| Copart, Inc.* | 4,485 | 149,978 | ||||||
| Spirit Airlines, Inc.* | 2,020 | 147,682 | ||||||
| Navistar International Corp.* | 4,130 | 146,078 | ||||||
| Toro Co. | 2,361 | 145,745 | ||||||
| WESCO International, Inc.* | 1,767 | 145,618 | ||||||
| HD Supply Holdings, Inc.* | 4,994 | 144,027 | ||||||
| Southwest Airlines Co. | 4,168 | 143,713 | ||||||
| Oshkosh Corp. | 3,089 | 138,264 | ||||||
Sears Holdings Corp.*,1 | 3,959 | 138,249 | ||||||
| WW Grainger, Inc. | 560 | 138,208 | ||||||
| MSC Industrial Direct Company, Inc. — Class A | 1,618 | 131,009 | ||||||
| Nu Skin Enterprises, Inc. — Class A | 2,344 | 123,834 | ||||||
| Tractor Supply Co. | 1,674 | 122,570 | ||||||
| Six Flags Entertainment Corp. | 3,001 | 120,940 | ||||||
| CarMax, Inc.* | 2,137 | 119,480 | ||||||
| O’Reilly Automotive, Inc.* | 678 | 119,247 | ||||||
| Domino’s Pizza, Inc. | 1,331 | 118,180 | ||||||
| AutoNation, Inc.* | 2,032 | 116,352 | ||||||
| Advance Auto Parts, Inc. | 791 | 116,245 | ||||||
| Whirlpool Corp. | 674 | 115,962 | ||||||
| Madison Square Garden Co. — Class A* | 1,528 | 115,761 | ||||||
| Genuine Parts Co. | 1,162 | 112,807 | ||||||
| Regal Entertainment Group — Class A | 5,088 | 112,699 | ||||||
| AutoZone, Inc.* | 203 | 112,365 | ||||||
| Penske Automotive Group, Inc. | 2,461 | 111,336 | ||||||
| DR Horton, Inc. | 4,882 | 111,261 | ||||||
| Jarden Corp.* | 1,707 | 111,109 | ||||||
| Lennar Corp. — Class A | 2,577 | 111,017 | ||||||
Burger King Worldwide, Inc.1 | 3,395 | 110,949 | ||||||
| Dollar Tree, Inc.* | 1,827 | 110,661 | ||||||
| LKQ Corp.* | 3,867 | 110,480 | ||||||
| Norwegian Cruise Line Holdings Ltd.* | 2,830 | 110,370 | ||||||
| Ross Stores, Inc. | 1,359 | 109,697 | ||||||
| Harley-Davidson, Inc. | 1,665 | 109,391 | ||||||
| Michael Kors Holdings Ltd.* | 1,388 | 109,082 | ||||||
| Marriott International, Inc. — Class A | 1,440 | 109,079 | ||||||
| SEE NOTES TO FINANCIAL STATEMENTS. | GUGGENHEIM ETFs ANNUAL REPORT | 35 |
SCHEDULE OF INVESTMENTS (continued) | October 31, 2014 |
GUGGENHEIM RUSSELL MIDCAP® EQUAL WEIGHT ETF |
| Shares | Value | |||||||
| CST Brands, Inc. | 2,845 | $ | 108,821 | |||||
| Sally Beauty Holdings, Inc.* | 3,703 | 108,535 | ||||||
| Lions Gate Entertainment Corp. | 3,269 | 108,302 | ||||||
| PulteGroup, Inc. | 5,634 | 108,116 | ||||||
| L Brands, Inc. | 1,498 | 108,036 | ||||||
| Nordstrom, Inc. | 1,484 | 107,753 | ||||||
| Brinker International, Inc. | 2,006 | 107,602 | ||||||
| Fossil Group, Inc.* | 1,058 | 107,556 | ||||||
| Signet Jewelers Ltd. | 892 | 107,049 | ||||||
| Hasbro, Inc. | 1,859 | 106,948 | ||||||
| NVR, Inc.* | 87 | 106,799 | ||||||
| Michaels Companies, Inc.* | 5,819 | 106,371 | ||||||
| Goodyear Tire & Rubber Co. | 4,377 | 106,055 | ||||||
| Harman International Industries, Inc. | 988 | 106,052 | ||||||
| WABCO Holdings, Inc.* | 1,089 | 106,047 | ||||||
| Wynn Resorts Ltd. | 557 | 105,836 | ||||||
| Dick’s Sporting Goods, Inc. | 2,332 | 105,803 | ||||||
| Cinemark Holdings, Inc. | 2,993 | 105,713 | ||||||
| Mohawk Industries, Inc.* | 744 | 105,678 | ||||||
| MGM Resorts International* | 4,537 | 105,485 | ||||||
| Panera Bread Co. — Class A* | 650 | 105,066 | ||||||
| VF Corp. | 1,547 | 104,701 | ||||||
| PetSmart, Inc. | 1,447 | 104,690 | ||||||
| Dunkin’ Brands Group, Inc. | 2,301 | 104,649 | ||||||
| Hilton Worldwide Holdings, Inc.* | 4,144 | 104,595 | ||||||
| Chico’s FAS, Inc. | 6,915 | 104,278 | ||||||
| Best Buy Company, Inc. | 3,053 | 104,229 | ||||||
| Choice Hotels International, Inc. | 1,944 | 104,004 | ||||||
| Royal Caribbean Cruises Ltd. | 1,530 | 103,994 | ||||||
| Big Lots, Inc. | 2,278 | 103,991 | ||||||
| Dollar General Corp.* | 1,659 | 103,970 | ||||||
| Bed Bath & Beyond, Inc.* | 1,536 | 103,434 | ||||||
GameStop Corp. — Class A1 | 2,414 | 103,223 | ||||||
| Ulta Salon Cosmetics & Fragrance, Inc.* | 854 | 103,172 | ||||||
| BorgWarner, Inc. | 1,804 | 102,864 | ||||||
| Carter’s, Inc. | 1,314 | 102,663 | ||||||
| Darden Restaurants, Inc. | 1,981 | 102,576 | ||||||
| Family Dollar Stores, Inc. | 1,307 | 102,325 | ||||||
| Staples, Inc. | 8,068 | 102,302 | ||||||
| Toll Brothers, Inc.* | 3,199 | 102,208 | ||||||
| Polaris Industries, Inc. | 677 | 102,132 | ||||||
| DreamWorks Animation SKG, Inc. — Class A* | 4,569 | 101,797 | ||||||
| Bally Technologies, Inc.* | 1,264 | 101,626 | ||||||
| Lear Corp. | 1,098 | 101,565 | ||||||
| Thor Industries, Inc. | 1,920 | 101,549 | ||||||
| Foot Locker, Inc. | 1,813 | 101,546 | ||||||
| Ralph Lauren Corp. — Class A | 615 | 101,377 | ||||||
| TRW Automotive Holdings Corp.* | 999 | 101,249 | ||||||
| Mattel, Inc. | 3,256 | 101,164 | ||||||
| Hanesbrands, Inc. | 955 | 100,858 | ||||||
| Wendy’s Co. | 12,562 | 100,747 | ||||||
| Tiffany & Co. | 1,042 | 100,157 | ||||||
| DSW, Inc. — Class A | 3,372 | 99,980 | ||||||
| Taylor Morrison Home Corp. — Class A* | 5,794 | 99,889 | ||||||
| Macy’s, Inc. | 1,727 | 99,855 | ||||||
| Tesla Motors, Inc.* | 412 | 99,580 | ||||||
| Newell Rubbermaid, Inc. | 2,973 | 99,090 | ||||||
| SeaWorld Entertainment, Inc. | 5,150 | 99,086 | ||||||
| Kate Spade & Co.* | 3,647 | 98,943 | ||||||
| Williams-Sonoma, Inc. | 1,521 | 98,911 | ||||||
| International Game Technology | 6,032 | 98,864 | ||||||
| Hyatt Hotels Corp. — Class A* | 1,666 | 98,660 | ||||||
| Under Armour, Inc. — Class A* | 1,503 | 98,567 | ||||||
| Chipotle Mexican Grill, Inc. — Class A* | 154 | 98,252 | ||||||
| Wyndham Worldwide Corp. | 1,255 | 97,476 | ||||||
| Dillard’s, Inc. — Class A | 914 | 96,665 | ||||||
| Coach, Inc. | 2,801 | 96,298 | ||||||
| PVH Corp. | 831 | 95,025 | ||||||
| Ascena Retail Group, Inc.* | 7,594 | 94,545 | ||||||
| Starwood Hotels & Resorts Worldwide, Inc. | 1,233 | 94,522 | ||||||
| Visteon Corp.* | 996 | 93,524 | ||||||
| Tempur Sealy International, Inc.* | 1,773 | 93,331 | ||||||
| Tupperware Brands Corp. | 1,445 | 92,119 | ||||||
| The Gap, Inc. | 2,404 | 91,088 | ||||||
| Abercrombie & Fitch Co. — Class A | 2,714 | 90,865 | ||||||
| Deckers Outdoor Corp.* | 1,034 | 90,434 | ||||||
| Kohl’s Corp. | 1,654 | 89,680 | ||||||
| Cabela’s, Inc.* | 1,751 | 84,083 | ||||||
| Urban Outfitters, Inc.* | 2,706 | 82,154 | ||||||
| Gaming and Leisure Properties, Inc. | 2,588 | 80,875 | ||||||
JC Penney Company, Inc.*,1 | 10,017 | 76,229 | ||||||
| Total Consumer, Cyclical | 15,584,163 | |||||||
| FINANCIAL - 10.4% | ||||||||
| Air Lease Corp. — Class A | 4,225 | 154,593 | ||||||
| Iron Mountain, Inc. | 3,978 | 143,486 | ||||||
| CBS Outdoor Americas, Inc. | 3,415 | 103,919 | ||||||
| Equity LifeStyle Properties, Inc. | 1,939 | 95,205 | ||||||
| Weingarten Realty Investors | 2,597 | 94,141 | ||||||
| Kilroy Realty Corp. | 1,384 | 93,752 | ||||||
| CoreLogic, Inc.* | 2,985 | 93,639 | ||||||
| Kimco Realty Corp. | 3,747 | 93,488 | ||||||
| Extra Space Storage, Inc. | 1,603 | 93,230 | ||||||
| SL Green Realty Corp. | 801 | 92,676 | ||||||
| Health Care REIT, Inc. | 1,298 | 92,301 | ||||||
| Regency Centers Corp. | 1,519 | 92,203 | ||||||
| Camden Property Trust | 1,197 | 91,774 | ||||||
| Federal Realty Investment Trust | 694 | 91,469 | ||||||
| Apartment Investment & Management Co. — Class A | 2,553 | 91,372 | ||||||
| Realty Income Corp. | 1,985 | 91,369 | ||||||
| Macerich Co. | 1,294 | 91,227 | ||||||
| Omega Healthcare Investors, Inc. | 2,389 | 91,164 | ||||||
| Alexandria Real Estate Equities, Inc. | 1,098 | 91,134 | ||||||
| Erie Indemnity Co. — Class A | 1,073 | 91,066 | ||||||
| Essex Property Trust, Inc. | 451 | 90,994 | ||||||
| Boston Properties, Inc. | 716 | 90,753 | ||||||
36 | GUGGENHEIM ETFs ANNUAL REPORT | SEE NOTES TO FINANCIAL STATEMENTS. |
SCHEDULE OF INVESTMENTS (continued) | October 31, 2014 |
GUGGENHEIM RUSSELL MIDCAP® EQUAL WEIGHT ETF |
| Shares | Value | |||||||
| Digital Realty Trust, Inc. | 1,315 | $ | 90,722 | |||||
| Navient Corp. | 4,583 | 90,651 | ||||||
| Ventas, Inc. | 1,322 | 90,570 | ||||||
| Home Properties, Inc. | 1,407 | 90,484 | ||||||
| Prologis, Inc. | 2,171 | 90,422 | ||||||
| Duke Realty Corp. | 4,767 | 90,382 | ||||||
| UDR, Inc. | 2,988 | 90,327 | ||||||
| DDR Corp. | 4,969 | 90,138 | ||||||
| General Growth Properties, Inc. | 3,477 | 90,089 | ||||||
| HCP, Inc. | 2,047 | 90,007 | ||||||
| Hospitality Properties Trust | 3,038 | 89,955 | ||||||
| National Retail Properties, Inc. | 2,357 | 89,849 | ||||||
| SLM Corp. | 9,407 | 89,837 | ||||||
| AvalonBay Communities, Inc. | 576 | 89,764 | ||||||
| StanCorp Financial Group, Inc. | 1,290 | 89,733 | ||||||
| Healthcare Trust of America, Inc. — Class A | 6,976 | 89,572 | ||||||
| CBOE Holdings, Inc. | 1,519 | 89,530 | ||||||
| Tanger Factory Outlet Centers, Inc. | 2,497 | 89,318 | ||||||
| Mercury General Corp. | 1,680 | 89,241 | ||||||
| Host Hotels & Resorts, Inc. | 3,828 | 89,231 | ||||||
| Vornado Realty Trust | 815 | 89,226 | ||||||
| Post Properties, Inc. | 1,594 | 89,168 | ||||||
| Synchrony Financial* | 3,299 | 89,139 | ||||||
| Markel Corp.* | 129 | 89,125 | ||||||
| American Campus Communities, Inc. | 2,261 | 88,789 | ||||||
| Douglas Emmett, Inc. | 3,155 | 88,750 | ||||||
| Piedmont Office Realty Trust, Inc. — Class A | 4,556 | 88,614 | ||||||
| Hanover Insurance Group, Inc. | 1,322 | 88,495 | ||||||
| Brandywine Realty Trust | 5,734 | 88,476 | ||||||
| Brixmor Property Group, Inc. | 3,631 | 88,451 | ||||||
| East West Bancorp, Inc. | 2,405 | 88,407 | ||||||
| Retail Properties of America, Inc. — Class A | 5,632 | 88,366 | ||||||
| Rayonier, Inc. | 2,630 | 88,026 | ||||||
| Spirit Realty Capital, Inc. | 7,393 | 87,977 | ||||||
| Signature Bank* | 726 | 87,940 | ||||||
| Jones Lang LaSalle, Inc. | 650 | 87,887 | ||||||
| CBL & Associates Properties, Inc. | 4,592 | 87,845 | ||||||
| Mid-America Apartment Communities, Inc. | 1,241 | 87,689 | ||||||
| WR Berkley Corp. | 1,701 | 87,670 | ||||||
| Senior Housing Properties Trust | 3,875 | 87,536 | ||||||
| CBRE Group, Inc. — Class A* | 2,735 | 87,520 | ||||||
| HCC Insurance Holdings, Inc. | 1,675 | 87,418 | ||||||
| Cincinnati Financial Corp. | 1,730 | 87,312 | ||||||
| BioMed Realty Trust, Inc. | 4,011 | 87,119 | ||||||
| Popular, Inc.* | 2,730 | 87,033 | ||||||
| Legg Mason, Inc. | 1,669 | 86,787 | ||||||
| Associated Banc-Corp. | 4,613 | 86,724 | ||||||
| Hartford Financial Services Group, Inc. | 2,191 | 86,720 | ||||||
| Everest Re Group Ltd. | 508 | 86,690 | ||||||
| Realogy Holdings Corp.* | 2,113 | 86,654 | ||||||
| Intercontinental Exchange, Inc. | 416 | 86,649 | ||||||
| Arthur J Gallagher & Co. | 1,816 | 86,623 | ||||||
| Federated Investors, Inc. — Class B | 2,770 | 86,618 | ||||||
| NorthStar Realty Finance Corp. | 4,658 | 86,545 | ||||||
| FNF Group | 2,896 | 86,417 | ||||||
| CIT Group, Inc. | 1,764 | 86,313 | ||||||
| Corrections Corporation of America | 2,346 | 86,286 | ||||||
| Alleghany Corp.* | 194 | 86,190 | ||||||
| Forest City Enterprises, Inc. — Class A* | 4,125 | 86,171 | ||||||
| MFA Financial, Inc. | 10,274 | 86,097 | ||||||
| Weyerhaeuser Co. | 2,542 | 86,072 | ||||||
| Synovus Financial Corp. | 3,393 | 86,046 | ||||||
| First Republic Bank | 1,688 | 85,970 | ||||||
| Columbia Property Trust, Inc. | 3,406 | 85,933 | ||||||
| WP Carey, Inc. | 1,268 | 85,869 | ||||||
| Fulton Financial Corp. | 7,225 | 85,833 | ||||||
| Corporate Office Properties Trust | 3,134 | 85,684 | ||||||
| Taubman Centers, Inc. | 1,126 | 85,632 | ||||||
| Equity Commonwealth* | 3,202 | 85,525 | ||||||
| Assurant, Inc. | 1,253 | 85,480 | ||||||
| PartnerRe Ltd. | 738 | 85,379 | ||||||
| ProAssurance Corp. | 1,824 | 85,327 | ||||||
| Genworth Financial, Inc. — Class A* | 6,096 | 85,283 | ||||||
| Plum Creek Timber Company, Inc. | 2,079 | 85,260 | ||||||
Nationstar Mortgage Holdings, Inc.*,1 | 2,427 | 85,236 | ||||||
| Cullen/Frost Bankers, Inc. | 1,053 | 85,093 | ||||||
| Endurance Specialty Holdings Ltd. | 1,468 | 85,071 | ||||||
| TFS Financial Corp. | 5,691 | 85,024 | ||||||
| MBIA, Inc.* | 8,710 | 85,009 | ||||||
| Progressive Corp. | 3,212 | 84,829 | ||||||
| Santander Consumer USA Holdings, Inc. ADR | 4,581 | 84,749 | ||||||
| T. Rowe Price Group, Inc. | 1,032 | 84,716 | ||||||
| Loews Corp. | 1,943 | 84,715 | ||||||
| Reinsurance Group of America, Inc. — Class A | 1,004 | 84,587 | ||||||
| RenaissanceRe Holdings Ltd. | 818 | 84,524 | ||||||
| Arch Capital Group Ltd.* | 1,500 | 84,480 | ||||||
| Washington Prime Group, Inc. | 4,787 | 84,395 | ||||||
| City National Corp. | 1,072 | 84,377 | ||||||
| Allied World Assurance Company Holdings AG | 2,220 | 84,360 | ||||||
| Interactive Brokers Group, Inc. — Class A | 3,267 | 84,354 | ||||||
| First Horizon National Corp. | 6,548 | 84,207 | ||||||
| American Homes 4 Rent — Class A | 4,796 | 84,074 | ||||||
| Raymond James Financial, Inc. | 1,497 | 84,026 | ||||||
| CNA Financial Corp. | 2,147 | 83,905 | ||||||
| Liberty Property Trust | 2,413 | 83,900 | ||||||
| NASDAQ OMX Group, Inc. | 1,936 | 83,751 | ||||||
| Validus Holdings Ltd. | 2,103 | 83,657 | ||||||
| Old Republic International Corp. | 5,662 | 83,628 | ||||||
| American Financial Group, Inc. | 1,397 | 83,583 | ||||||
| American Capital Agency Corp. | 3,675 | 83,570 | ||||||
| Assured Guaranty Ltd. | 3,620 | 83,550 | ||||||
| PacWest Bancorp | 1,958 | 83,528 | ||||||
| Ameriprise Financial, Inc. | 662 | 83,525 | ||||||
| Aspen Insurance Holdings Ltd. | 1,913 | 83,464 | ||||||
| BOK Financial Corp. | 1,212 | 83,095 | ||||||
| SEE NOTES TO FINANCIAL STATEMENTS. | GUGGENHEIM ETFs ANNUAL REPORT | 37 |
SCHEDULE OF INVESTMENTS (continued) | October 31, 2014 |
GUGGENHEIM RUSSELL MIDCAP® EQUAL WEIGHT ETF |
| Shares | Value | |||||||
| Bank of Hawaii Corp. | 1,418 | $ | 83,024 | |||||
| Invesco Ltd. | 2,050 | 82,964 | ||||||
| Lincoln National Corp. | 1,515 | 82,961 | ||||||
| SunTrust Banks, Inc. | 2,116 | 82,819 | ||||||
| XL Group plc — Class A | 2,440 | 82,667 | ||||||
| American National Insurance Co. | 724 | 82,594 | ||||||
| Voya Financial, Inc. | 2,096 | 82,268 | ||||||
| TD Ameritrade Holding Corp. | 2,437 | 82,224 | ||||||
| Huntington Bancshares, Inc. | 8,292 | 82,174 | ||||||
| SVB Financial Group* | 733 | 82,089 | ||||||
| Annaly Capital Management, Inc. | 7,191 | 82,049 | ||||||
| White Mountains Insurance Group Ltd. | 131 | 81,865 | ||||||
| Torchmark Corp. | 1,545 | 81,823 | ||||||
| Axis Capital Holdings Ltd. | 1,699 | 81,790 | ||||||
| Protective Life Corp. | 1,172 | 81,665 | ||||||
| Commerce Bancshares, Inc. | 1,804 | 81,649 | ||||||
| People’s United Financial, Inc. | 5,574 | 81,492 | ||||||
| Zions Bancorporation | 2,808 | 81,348 | ||||||
| Two Harbors Investment Corp. | 8,028 | 81,324 | ||||||
| New York Community Bancorp, Inc. | 5,088 | 81,154 | ||||||
| Affiliated Managers Group, Inc.* | 406 | 81,115 | ||||||
| Aon plc | 942 | 81,012 | ||||||
| Howard Hughes Corp.* | 547 | 80,617 | ||||||
| Starwood Property Trust, Inc. | 3,571 | 80,562 | ||||||
| Crown Castle International Corp. | 1,029 | 80,385 | ||||||
| Brown & Brown, Inc. | 2,522 | 80,351 | ||||||
| Principal Financial Group, Inc. | 1,533 | 80,283 | ||||||
| Regions Financial Corp. | 8,075 | 80,185 | ||||||
| M&T Bank Corp. | 655 | 80,028 | ||||||
| Fifth Third Bancorp | 4,002 | 80,000 | ||||||
| KeyCorp | 6,058 | 79,966 | ||||||
| TCF Financial Corp. | 5,166 | 79,815 | ||||||
| E*TRADE Financial Corp.* | 3,579 | 79,812 | ||||||
| Chimera Investment Corp. | 25,554 | 79,728 | ||||||
| Eaton Vance Corp. | 2,164 | 79,700 | ||||||
| NorthStar Asset Management Group Incorporated | 4,397 | 79,674 | ||||||
| Hudson City Bancorp, Inc. | 8,256 | 79,670 | ||||||
| Ally Financial, Inc.* | 3,504 | 79,541 | ||||||
| Northern Trust Corp. | 1,192 | 79,030 | ||||||
| Unum Group | 2,348 | 78,564 | ||||||
| BankUnited, Inc. | 2,618 | 78,278 | ||||||
| Lazard Ltd. — Class A | 1,583 | 77,899 | ||||||
| FNFV Group* | 5,774 | 77,603 | ||||||
| Comerica, Inc. | 1,617 | 77,196 | ||||||
| Artisan Partners Asset Management, Inc. — Class A | 1,566 | 75,920 | ||||||
| Waddell & Reed Financial, Inc. — Class A | 1,548 | 73,902 | ||||||
| Ocwen Financial Corp.* | 3,065 | 72,211 | ||||||
| First Niagara Financial Group, Inc. | 9,592 | 71,844 | ||||||
| LPL Financial Holdings, Inc. | 1,725 | 71,398 | ||||||
| American Realty Capital Properties, Inc. | 6,698 | 59,411 | ||||||
| Total Financial | 15,244,157 | |||||||
| UTILITIES - 9.9% | ||||||||
| Wisconsin Energy Corp. | 8,209 | 407,660 | ||||||
| TECO Energy, Inc. | 20,520 | 402,398 | ||||||
| Vectren Corp. | 8,914 | 400,684 | ||||||
| Consolidated Edison, Inc. | 6,272 | 397,395 | ||||||
| Atmos Energy Corp. | 7,451 | 394,903 | ||||||
| Alliant Energy Corp. | 6,378 | 394,862 | ||||||
| Integrys Energy Group, Inc. | 5,426 | 394,362 | ||||||
| UGI Corp. | 10,446 | 393,710 | ||||||
| Aqua America, Inc. | 15,027 | 393,707 | ||||||
| Pinnacle West Capital Corp. | 6,401 | 393,469 | ||||||
| Edison International | 6,284 | 393,253 | ||||||
| ITC Holdings Corp. | 9,922 | 393,010 | ||||||
| Ameren Corp. | 9,274 | 392,661 | ||||||
| Northeast Utilities | 7,955 | 392,579 | ||||||
| SCANA Corp. | 7,143 | 392,079 | ||||||
| Great Plains Energy, Inc. | 14,551 | 391,858 | ||||||
| Westar Energy, Inc. | 10,314 | 389,972 | ||||||
| American Water Works Company, Inc. | 7,299 | 389,548 | ||||||
| Entergy Corp. | 4,633 | 389,265 | ||||||
| CMS Energy Corp. | 11,911 | 389,132 | ||||||
| FirstEnergy Corp. | 10,394 | 388,112 | ||||||
| Xcel Energy, Inc. | 11,558 | 386,846 | ||||||
| Public Service Enterprise Group, Inc. | 9,364 | 386,827 | ||||||
| DTE Energy Co. | 4,670 | 383,687 | ||||||
| NiSource, Inc. | 9,111 | 383,209 | ||||||
| Questar Corp. | 15,826 | 381,565 | ||||||
| PPL Corp. | 10,729 | 375,408 | ||||||
| Sempra Energy | 3,410 | 375,100 | ||||||
Hawaiian Electric Industries, Inc.1 | 13,218 | 372,219 | ||||||
| AGL Resources, Inc. | 6,879 | 370,847 | ||||||
| Calpine Corp.* | 16,128 | 368,041 | ||||||
| CenterPoint Energy, Inc. | 14,708 | 361,081 | ||||||
| MDU Resources Group, Inc. | 12,758 | 359,520 | ||||||
| Pepco Holdings, Inc. | 13,054 | 356,896 | ||||||
| OGE Energy Corp. | 9,561 | 356,530 | ||||||
| NRG Energy, Inc. | 11,828 | 354,603 | ||||||
| AES Corp. | 24,883 | 350,104 | ||||||
| National Fuel Gas Co. | 5,023 | 347,742 | ||||||
| Total Utilities | 14,544,844 | |||||||
| ENERGY - 9.8% | ||||||||
| Athlon Energy, Inc.* | 5,702 | 332,426 | ||||||
| Energen Corp. | 4,880 | 330,376 | ||||||
| Tesoro Corp. | 4,376 | 312,490 | ||||||
| Oceaneering International, Inc. | 4,091 | 287,475 | ||||||
| PBF Energy, Inc. — Class A | 10,818 | 282,025 | ||||||
CVR Energy, Inc.1 | 5,775 | 280,549 | ||||||
Diamond Offshore Drilling, Inc.1 | 7,198 | 271,436 | ||||||
| Equities Corp. | 2,856 | 268,578 | ||||||
| FMC Technologies, Inc.* | 4,781 | 267,928 | ||||||
| HollyFrontier Corp. | 5,841 | 265,065 | ||||||
| Memorial Resource Development Corp.* | 9,779 | 264,912 | ||||||
| Range Resources Corp. | 3,858 | 263,887 | ||||||
38 | GUGGENHEIM ETFs ANNUAL REPORT | SEE NOTES TO FINANCIAL STATEMENTS. |
SCHEDULE OF INVESTMENTS (continued) | October 31, 2014 |
GUGGENHEIM RUSSELL MIDCAP® EQUAL WEIGHT ETF |
| Shares | Value | |||||||
| CONSOL Energy, Inc. | 7,110 | $ | 261,648 | |||||
| Dril-Quip, Inc.* | 2,880 | 259,056 | ||||||
| Dresser-Rand Group, Inc.* | 3,156 | 257,845 | ||||||
| Cabot Oil & Gas Corp. — Class A | 8,264 | 257,010 | ||||||
| Rice Energy, Inc.* | 9,713 | 256,715 | ||||||
Ultra Petroleum Corp.*,1 | 11,230 | 256,044 | ||||||
NOW, Inc.*,1 | 8,467 | 254,518 | ||||||
| Rowan Companies plc — Class A | 10,299 | 249,957 | ||||||
| Oil States International, Inc.* | 4,183 | 249,892 | ||||||
| Antero Resources Corp.* | 4,765 | 249,877 | ||||||
SolarCity Corp.*,1 | 4,193 | 248,142 | ||||||
| Chesapeake Energy Corp. | 11,130 | 246,863 | ||||||
| Murphy Oil Corp. | 4,623 | 246,822 | ||||||
| Targa Resources Corp. | 1,918 | 246,712 | ||||||
| Kosmos Energy Ltd.* | 26,344 | 245,790 | ||||||
| Atwood Oceanics, Inc. | 6,023 | 244,835 | ||||||
| Cheniere Energy, Inc.* | 3,260 | 244,500 | ||||||
| Gulfport Energy Corp.* | 4,835 | 242,620 | ||||||
| Southwestern Energy Co.* | 7,381 | 239,956 | ||||||
| Frank’s International N.V. | 13,714 | 236,292 | ||||||
| Cimarex Energy Co. | 2,056 | 233,706 | ||||||
| ONEOK, Inc. | 3,958 | 233,285 | ||||||
| Helmerich & Payne, Inc. | 2,659 | 230,854 | ||||||
| Laredo Petroleum, Inc.* | 12,161 | 230,573 | ||||||
| Cameron International Corp.* | 3,846 | 229,029 | ||||||
SandRidge Energy, Inc.*,1 | 58,633 | 228,669 | ||||||
| Concho Resources, Inc.* | 2,056 | 224,166 | ||||||
| Newfield Exploration Co.* | 6,861 | 223,737 | ||||||
| EP Energy Corp. — Class A* | 15,298 | 223,351 | ||||||
Seadrill Ltd.1 | 9,632 | 221,536 | ||||||
| Peabody Energy Corp. | 21,135 | 220,438 | ||||||
| Continental Resources, Inc.* | 3,886 | 219,054 | ||||||
| Cobalt International Energy, Inc.* | 18,633 | 218,192 | ||||||
| MRC Global, Inc.* | 10,289 | 216,378 | ||||||
| Noble Energy, Inc. | 3,753 | 216,285 | ||||||
| Unit Corp.* | 4,424 | 214,210 | ||||||
| Denbury Resources, Inc. | 17,077 | 211,755 | ||||||
| QEP Resources, Inc. | 8,395 | 210,463 | ||||||
| WPX Energy, Inc.* | 10,906 | 208,523 | ||||||
| Whiting Petroleum Corp.* | 3,373 | 206,563 | ||||||
| RPC, Inc. | 12,340 | 202,376 | ||||||
| Nabors Industries Ltd. | 11,263 | 201,045 | ||||||
| Superior Energy Services, Inc. | 7,886 | 198,333 | ||||||
| Oasis Petroleum, Inc.* | 6,226 | 186,531 | ||||||
| SM Energy Co. | 3,298 | 185,677 | ||||||
| Patterson-UTI Energy, Inc. | 7,939 | 182,835 | ||||||
| Seventy Seven Energy, Inc.* | 11,167 | 145,953 | ||||||
| Murphy USA, Inc.* | 1,905 | 109,157 | ||||||
| Total Energy | 14,254,915 | |||||||
| TECHNOLOGY - 8.4% | ||||||||
| Cerner Corp.* | 3,661 | 231,888 | ||||||
| First Solar, Inc.* | 3,865 | 227,649 | ||||||
| Veeva Systems, Inc. — Class A* | 7,477 | 222,665 | ||||||
| Allscripts Healthcare Solutions, Inc.* | 15,979 | 219,232 | ||||||
| athenahealth, Inc.* | 1,674 | 205,065 | ||||||
| NetSuite, Inc.* | 1,850 | 201,022 | ||||||
| Rackspace Hosting, Inc.* | 5,006 | 192,030 | ||||||
| ServiceNow, Inc.* | 2,742 | 186,264 | ||||||
| Tableau Software, Inc. — Class A* | 2,255 | 186,240 | ||||||
| Workday, Inc. — Class A* | 1,949 | 186,091 | ||||||
| Electronic Arts, Inc.* | 4,469 | 183,095 | ||||||
| DST Systems, Inc. | 1,887 | 181,812 | ||||||
| SolarWinds, Inc.* | 3,803 | 180,833 | ||||||
| Informatica Corp.* | 5,053 | 180,190 | ||||||
| IPG Photonics Corp.* | 2,392 | 175,597 | ||||||
| Computer Sciences Corp. | 2,826 | 170,690 | ||||||
| Leidos Holdings, Inc. | 4,659 | 170,380 | ||||||
| VeriFone Systems, Inc.* | 4,570 | 170,278 | ||||||
| Autodesk, Inc.* | 2,940 | 169,167 | ||||||
| NVIDIA Corp. | 8,647 | 168,962 | ||||||
| Red Hat, Inc.* | 2,867 | 168,924 | ||||||
| Cadence Design Systems, Inc.* | 9,344 | 167,725 | ||||||
| PTC, Inc.* | 4,381 | 167,135 | ||||||
| Rovi Corp.* | 7,999 | 167,019 | ||||||
| Lam Research Corp. | 2,143 | 166,853 | ||||||
| ANSYS, Inc.* | 2,121 | 166,626 | ||||||
| CA, Inc. | 5,731 | 166,543 | ||||||
| Xilinx, Inc. | 3,740 | 166,355 | ||||||
| Broadcom Corp. — Class A | 3,968 | 166,180 | ||||||
| Intuit, Inc. | 1,885 | 165,899 | ||||||
| Amdocs Ltd. | 3,461 | 164,536 | ||||||
| Applied Materials, Inc. | 7,439 | 164,328 | ||||||
| Synopsys, Inc.* | 4,004 | 164,084 | ||||||
| Western Digital Corp. | 1,663 | 163,590 | ||||||
| Riverbed Technology, Inc.* | 8,599 | 163,295 | ||||||
| Nuance Communications, Inc.* | 10,570 | 163,095 | ||||||
| NetApp, Inc. | 3,794 | 162,383 | ||||||
| Akamai Technologies, Inc.* | 2,691 | 162,267 | ||||||
| Teradata Corp.* | 3,833 | 162,213 | ||||||
| Skyworks Solutions, Inc. | 2,783 | 162,082 | ||||||
| Concur Technologies, Inc.* | 1,263 | 162,068 | ||||||
| SunEdison, Inc.* | 8,242 | 160,801 | ||||||
| Brocade Communications Systems, Inc. | 14,929 | 160,188 | ||||||
| Analog Devices, Inc. | 3,223 | 159,926 | ||||||
| Stratasys Ltd.* | 1,328 | 159,838 | ||||||
| Avago Technologies Ltd. | 1,851 | 159,649 | ||||||
| KLA-Tencor Corp. | 2,012 | 159,250 | ||||||
| Diebold, Inc. | 4,478 | 158,656 | ||||||
| Marvell Technology Group Ltd. | 11,664 | 156,764 | ||||||
| Freescale Semiconductor Ltd.* | 7,868 | 156,495 | ||||||
| SanDisk Corp. | 1,652 | 155,519 | ||||||
| Linear Technology Corp. | 3,621 | 155,124 | ||||||
| Maxim Integrated Products, Inc. | 5,272 | 154,680 | ||||||
| Altera Corp. | 4,489 | 154,287 | ||||||
| Activision Blizzard, Inc. | 7,616 | 151,939 | ||||||
| Teradyne, Inc. | 8,202 | 150,917 | ||||||
| SEE NOTES TO FINANCIAL STATEMENTS. | GUGGENHEIM ETFs ANNUAL REPORT | 39 |
SCHEDULE OF INVESTMENTS (continued) | October 31, 2014 |
GUGGENHEIM RUSSELL MIDCAP® EQUAL WEIGHT ETF |
| Shares | Value | |||||||
| Paychex, Inc. | 3,211 | $ | 150,725 | |||||
| Solera Holdings, Inc. | 2,837 | 147,382 | ||||||
| IMS Health Holdings, Inc.* | 6,061 | 146,979 | ||||||
| Atmel Corp.* | 19,769 | 146,686 | ||||||
| Citrix Systems, Inc.* | 2,283 | 146,637 | ||||||
| IHS, Inc. — Class A* | 1,118 | 146,492 | ||||||
| Microchip Technology, Inc. | 3,381 | 145,755 | ||||||
| ON Semiconductor Corp.* | 17,155 | 142,215 | ||||||
| Lexmark International, Inc. — Class A | 3,277 | 141,435 | ||||||
| Xerox Corp. | 10,573 | 140,409 | ||||||
| Pitney Bowes, Inc. | 5,526 | 136,713 | ||||||
| NCR Corp.* | 4,823 | 133,452 | ||||||
3D Systems Corp.*,1 | 3,347 | 126,517 | ||||||
Advanced Micro Devices, Inc.*,1 | 44,088 | 123,446 | ||||||
| Cree, Inc.* | 3,892 | 122,520 | ||||||
| Fiserv, Inc.* | 1,269 | 88,170 | ||||||
| Jack Henry & Associates, Inc. | 1,465 | 87,636 | ||||||
| Dun & Bradstreet Corp. | 704 | 86,458 | ||||||
| Broadridge Financial Solutions, Inc. | 1,967 | 86,410 | ||||||
| Fidelity National Information Services, Inc. | 1,437 | 83,906 | ||||||
| MSCI, Inc. — Class A | 1,737 | 81,048 | ||||||
| Total Technology | 12,237,374 | |||||||
| COMMUNICATIONS - 6.3% | ||||||||
| Telephone & Data Systems, Inc. | 14,500 | 371,779 | ||||||
| Level 3 Communications, Inc.* | 7,921 | 371,575 | ||||||
| tw telecom, Inc. — Class A* | 8,648 | 369,961 | ||||||
| United States Cellular Corp.* | 9,913 | 361,031 | ||||||
| Frontier Communications Corp. | 54,631 | 357,287 | ||||||
| Windstream Holdings, Inc. | 31,835 | 333,631 | ||||||
| Splunk, Inc.* | 2,961 | 195,663 | ||||||
| TIBCO Software, Inc.* | 8,257 | 192,966 | ||||||
| LinkedIn Corp. — Class A* | 778 | 178,131 | ||||||
| Groupon, Inc. — Class A* | 24,323 | 177,802 | ||||||
| Palo Alto Networks, Inc.* | 1,661 | 175,567 | ||||||
| VeriSign, Inc.* | 2,895 | 173,005 | ||||||
FireEye, Inc.*,1 | 5,048 | 171,582 | ||||||
| JDS Uniphase Corp.* | 12,445 | 167,510 | ||||||
| Symantec Corp. | 6,743 | 167,361 | ||||||
| Fortinet, Inc.* | 6,393 | 166,538 | ||||||
| Motorola Solutions, Inc. | 2,573 | 165,959 | ||||||
| IAC/InterActiveCorp | 2,447 | 165,637 | ||||||
| Harris Corp. | 2,379 | 165,578 | ||||||
| ARRIS Group, Inc.* | 5,498 | 165,050 | ||||||
| F5 Networks, Inc.* | 1,337 | 164,424 | ||||||
| CDW Corp. | 5,275 | 162,681 | ||||||
| Equinix, Inc. | 777 | 162,315 | ||||||
| AOL, Inc.* | 3,726 | 162,193 | ||||||
Arista Networks, Inc.*,1 | 1,898 | 154,213 | ||||||
| EchoStar Corp. — Class A* | 3,257 | 152,200 | ||||||
| Juniper Networks, Inc. | 7,222 | 152,168 | ||||||
| CommScope Holding Company, Inc.* | 6,583 | 141,798 | ||||||
| Zynga, Inc. — Class A* | 54,160 | 138,108 | ||||||
| Yelp, Inc. — Class A* | 2,274 | 136,440 | ||||||
| Twitter, Inc.* | 3,110 | 128,972 | ||||||
| Liberty Ventures* | 3,286 | 115,339 | ||||||
| Clear Channel Outdoor Holdings, Inc. — Class A | 15,070 | 109,409 | ||||||
| Interpublic Group of Companies, Inc. | 5,598 | 108,545 | ||||||
| Lamar Advertising Co. — Class A | 2,082 | 107,535 | ||||||
| HomeAway, Inc.* | 3,072 | 107,213 | ||||||
| Gannett Company, Inc. | 3,388 | 106,722 | ||||||
| Cablevision Systems Corp. — Class A | 5,694 | 106,022 | ||||||
| Omnicom Group, Inc. | 1,472 | 105,778 | ||||||
| AMC Networks, Inc. — Class A* | 1,741 | 105,592 | ||||||
| Charter Communications, Inc. — Class A* | 658 | 104,221 | ||||||
| Liberty Media Corp. — Class A* | 2,170 | 104,203 | ||||||
| Liberty Media Corp. — Class C* | 2,174 | 104,200 | ||||||
| John Wiley & Sons, Inc. — Class A | 1,767 | 103,175 | ||||||
| Expedia, Inc. | 1,199 | 101,879 | ||||||
| DISH Network Corp. — Class A* | 1,599 | 101,776 | ||||||
| Scripps Networks Interactive, Inc. — Class A | 1,304 | 100,721 | ||||||
| Starz — Class A* | 3,257 | 100,641 | ||||||
| Sirius XM Holdings, Inc.* | 29,186 | 100,108 | ||||||
| TripAdvisor, Inc.* | 1,115 | 98,856 | ||||||
| Nielsen N.V. | 2,314 | 98,322 | ||||||
| Discovery Communications, Inc. — Class C* | 2,700 | 94,473 | ||||||
| Discovery Communications, Inc. — Class A* | 2,667 | 94,278 | ||||||
| News Corp. — Class A* | 6,078 | 94,087 | ||||||
| Liberty Interactive Corp. — Class A* | 3,593 | 93,921 | ||||||
zulily, Inc. — Class A*,1 | 2,560 | 93,133 | ||||||
| Netflix, Inc.* | 229 | 89,944 | ||||||
| FactSet Research Systems, Inc. | 671 | 88,196 | ||||||
| Pandora Media, Inc.* | 4,141 | 79,838 | ||||||
| Zillow, Inc. — Class A* | 676 | 73,501 | ||||||
| Total Communications | 9,140,753 | |||||||
| BASIC MATERIALS - 6.1% | ||||||||
| Domtar Corp. | 6,591 | 270,692 | ||||||
| MeadWestvaco Corp. | 5,856 | 258,660 | ||||||
| Carpenter Technology Corp. | 5,155 | 258,008 | ||||||
| Alcoa, Inc. | 15,360 | 257,434 | ||||||
| International Paper Co. | 5,016 | 253,910 | ||||||
| Sherwin-Williams Co. | 1,099 | 252,287 | ||||||
| International Flavors & Fragrances, Inc. | 2,511 | 248,965 | ||||||
| Valspar Corp. | 3,003 | 246,726 | ||||||
| WR Grace & Co.* | 2,602 | 246,149 | ||||||
| Ashland, Inc. | 2,267 | 244,995 | ||||||
| Platform Specialty Products Corp.* | 9,413 | 244,738 | ||||||
| Compass Minerals International, Inc. | 2,823 | 241,875 | ||||||
| Sigma-Aldrich Corp. | 1,771 | 240,697 | ||||||
| Airgas, Inc. | 2,152 | 240,034 | ||||||
| NewMarket Corp. | 614 | 238,238 | ||||||
| Steel Dynamics, Inc. | 10,347 | 238,084 | ||||||
| FMC Corp. | 4,124 | 236,511 | ||||||
| Eastman Chemical Co. | 2,921 | 235,958 | ||||||
Cliffs Natural Resources, Inc.1 | 20,983 | 235,639 | ||||||
| Veritiv Corp.* | 5,223 | 235,610 | ||||||
40 | GUGGENHEIM ETFs ANNUAL REPORT | SEE NOTES TO FINANCIAL STATEMENTS. |
SCHEDULE OF INVESTMENTS (concluded) | October 31, 2014 |
GUGGENHEIM RUSSELL MIDCAP® EQUAL WEIGHT ETF |
| Shares | Value | |||||||
| RPM International, Inc. | 5,193 | $ | 235,243 | |||||
| Nucor Corp. | 4,345 | 234,891 | ||||||
| Rockwood Holdings, Inc. | 3,054 | 234,883 | ||||||
| Cytec Industries, Inc. | 5,030 | 234,549 | ||||||
| Mosaic Co. | 5,284 | 234,134 | ||||||
| Celanese Corp. — Class A | 3,961 | 232,630 | ||||||
| Reliance Steel & Aluminum Co. | 3,442 | 232,266 | ||||||
| Albemarle Corp. | 3,961 | 231,243 | ||||||
| CF Industries Holdings, Inc. | 887 | 230,620 | ||||||
| United States Steel Corp. | 5,748 | 230,150 | ||||||
Rayonier Advanced Materials, Inc.1 | 7,871 | 224,560 | ||||||
| Huntsman Corp. | 9,003 | 219,673 | ||||||
| Cabot Corp. | 4,631 | 215,017 | ||||||
| Royal Gold, Inc. | 3,632 | 207,569 | ||||||
| Allegheny Technologies, Inc. | 6,177 | 202,914 | ||||||
| Tahoe Resources, Inc.* | 11,549 | 200,491 | ||||||
| Newmont Mining Corp. | 10,042 | 188,388 | ||||||
| Westlake Chemical Corp. | 2,664 | 187,945 | ||||||
| Total Basic Materials | 8,902,376 | |||||||
| DIVERSIFIED - 0.1% | ||||||||
| Liberty TripAdvisor Holdings, Inc. — Class A* | 3,023 | 95,467 | ||||||
| Leucadia National Corp. | 3,353 | 79,734 | ||||||
| Total Diversified | 175,201 | |||||||
| Total Common Stocks | ||||||||
| (Cost $123,373,986) | 145,603,919 | |||||||
SHORT TERM INVESTMENTS† - 0.3% | ||||||||
| Federated U.S. Treasury Cash Reserve Fund | 468,760 | 468,760 | ||||||
| Total Short Term Investments | ||||||||
| (Cost $468,760) | 468,760 | |||||||
| Face Amount | ||||||||
SECURITIES LENDING COLLATERAL††, 2 - 3.3% | ||||||||
| Joint Repurchase Agreements | ||||||||
| HSBC Securities, Inc. issued 10/31/14 at 0.08% due 11/03/14 | $ | 3,049,128 | 3,049,128 | |||||
| BNP Paribas Securities Corp. issued 10/31/14 at 0.11% due 11/03/14 | 1,394,669 | 1,394,669 | ||||||
| Barclays Capital, Inc. issued 10/31/14 at 0.07% due 11/03/14 | 399,750 | 399,750 | ||||||
| Total Securities Lending Collateral | ||||||||
| (Cost $4,843,547) | 4,843,547 | |||||||
| Total Investments - 103.3% | ||||||||
| (Cost $128,686,293) | $ | 150,916,226 | ||||||
| Other Assets & Liabilities, net - (3.3)% | (4,791,244 | ) | ||||||
| Total Net Assets - 100.0% | $ | 146,124,982 | ||||||
| * | Non-income producing security. |
| † | Value determined based on Level 1 inputs — See Note 4. |
| †† | Value determined based on Level 2 inputs — See Note 4. |
| 1 | All or portion of this security is on loan at October 31, 2014 — See Note 5. |
| 2 | Securities lending collateral — See Note 5. |
| ADR — American Depositary Receipt | |
| plc — Public Limited Company | |
| REIT — Real Estate Investment Trust |
| SEE NOTES TO FINANCIAL STATEMENTS. | GUGGENHEIM ETFs ANNUAL REPORT | 41 |
| SCHEDULE OF INVESTMENTS | October 31, 2014 |
GUGGENHEIM RUSSELL 1000® EQUAL WEIGHT ETF |
| Shares | Value | |||||||
COMMON STOCKS† - 99.7% | ||||||||
| CONSUMER, NON-CYCLICAL - 23.9% | ||||||||
Herbalife Ltd.1 | 4,637 | $ | 243,257 | |||||
| Keurig Green Mountain, Inc. | 1,573 | 238,703 | ||||||
| Monster Beverage Corp.* | 2,257 | 227,686 | ||||||
| Reynolds American, Inc. | 3,492 | 219,681 | ||||||
| Dr Pepper Snapple Group, Inc. | 3,152 | 218,276 | ||||||
| Hormel Foods Corp. | 4,047 | 218,174 | ||||||
| Kroger Co. | 3,905 | 217,548 | ||||||
| Hain Celestial Group, Inc.* | 2,003 | 216,824 | ||||||
| Altria Group, Inc. | 4,481 | 216,612 | ||||||
| Pinnacle Foods, Inc. | 6,393 | 216,083 | ||||||
| McCormick & Company, Inc. | 3,051 | 215,767 | ||||||
| Tyson Foods, Inc. — Class A | 5,343 | 215,590 | ||||||
| Kimberly-Clark Corp. | 1,884 | 215,285 | ||||||
| Philip Morris International, Inc. | 2,418 | 215,226 | ||||||
| Bunge Ltd. | 2,422 | 214,710 | ||||||
| JM Smucker Co. | 2,052 | 213,408 | ||||||
| Constellation Brands, Inc. — Class A* | 2,329 | 213,197 | ||||||
| WhiteWave Foods Co. — Class A* | 5,717 | 212,844 | ||||||
| Clorox Co. | 2,130 | 211,935 | ||||||
| ConAgra Foods, Inc. | 6,156 | 211,459 | ||||||
| Whole Foods Market, Inc. | 5,368 | 211,123 | ||||||
| Campbell Soup Co. | 4,767 | 210,558 | ||||||
| Mead Johnson Nutrition Co. — Class A | 2,112 | 209,743 | ||||||
| PepsiCo, Inc. | 2,180 | 209,651 | ||||||
| General Mills, Inc. | 4,032 | 209,503 | ||||||
| Kellogg Co. | 3,270 | 209,149 | ||||||
| Flowers Foods, Inc. | 11,000 | 209,000 | ||||||
| Church & Dwight Company, Inc. | 2,885 | 208,903 | ||||||
| Procter & Gamble Co. | 2,393 | 208,836 | ||||||
| Hershey Co. | 2,171 | 208,221 | ||||||
| Sysco Corp. | 5,392 | 207,808 | ||||||
| Lorillard, Inc. | 3,376 | 207,624 | ||||||
| Brown-Forman Corp. — Class B | 2,235 | 207,117 | ||||||
| Ingredion, Inc. | 2,667 | 206,026 | ||||||
| Colgate-Palmolive Co. | 3,078 | 205,857 | ||||||
| Safeway, Inc. | 5,903 | 205,779 | ||||||
| Mondelez International, Inc. — Class A | 5,820 | 205,213 | ||||||
| Spectrum Brands Holdings, Inc. | 2,251 | 203,918 | ||||||
| Kraft Foods Group, Inc. | 3,598 | 202,747 | ||||||
| Coca-Cola Co. | 4,833 | 202,406 | ||||||
| Molson Coors Brewing Co. — Class B | 2,698 | 200,677 | ||||||
| Sprouts Farmers Market, Inc.* | 6,803 | 198,035 | ||||||
| Coca-Cola Enterprises, Inc. | 4,482 | 194,295 | ||||||
| Pilgrim’s Pride Corp.* | 6,708 | 190,574 | ||||||
| Archer-Daniels-Midland Co. | 4,006 | 188,282 | ||||||
| Incyte Corp.* | 2,078 | 139,351 | ||||||
| CareFusion Corp.* | 2,214 | 127,016 | ||||||
| IDEXX Laboratories, Inc.* | 865 | 122,545 | ||||||
| Alnylam Pharmaceuticals, Inc.* | 1,307 | 121,211 | ||||||
| Alkermes plc* | 2,357 | 119,145 | ||||||
| Edwards Lifesciences Corp.* | 979 | 118,380 | ||||||
| Alexion Pharmaceuticals, Inc.* | 616 | 117,878 | ||||||
| Illumina, Inc.* | 612 | 117,859 | ||||||
| Mylan, Inc.* | 2,191 | 117,328 | ||||||
| BioMarin Pharmaceutical, Inc.* | 1,421 | 117,233 | ||||||
| Celgene Corp.* | 1,089 | 116,621 | ||||||
| Amgen, Inc. | 716 | 116,121 | ||||||
| MEDNAX, Inc.* | 1,856 | 115,870 | ||||||
| VCA, Inc.* | 2,539 | 115,702 | ||||||
| CR Bard, Inc. | 701 | 114,943 | ||||||
| Becton Dickinson and Co. | 888 | 114,285 | ||||||
| Bristol-Myers Squibb Co. | 1,956 | 113,820 | ||||||
| Centene Corp.* | 1,228 | 113,799 | ||||||
| DENTSPLY International, Inc. | 2,229 | 113,166 | ||||||
| Pharmacyclics, Inc.* | 864 | 112,899 | ||||||
| Bruker Corp.* | 5,446 | 112,896 | ||||||
| Boston Scientific Corp.* | 8,449 | 112,203 | ||||||
| Catamaran Corp.* | 2,344 | 111,739 | ||||||
| AmerisourceBergen Corp. — Class A | 1,307 | 111,631 | ||||||
| Zimmer Holdings, Inc. | 998 | 111,018 | ||||||
| UnitedHealth Group, Inc. | 1,168 | 110,972 | ||||||
| Cubist Pharmaceuticals, Inc.* | 1,535 | 110,965 | ||||||
| AbbVie, Inc. | 1,743 | 110,611 | ||||||
| Regeneron Pharmaceuticals, Inc.* | 280 | 110,242 | ||||||
| Medivation, Inc.* | 1,039 | 109,822 | ||||||
| Cigna Corp. | 1,099 | 109,427 | ||||||
| Medtronic, Inc. | 1,604 | 109,329 | ||||||
| Hologic, Inc.* | 4,171 | 109,238 | ||||||
| Intuitive Surgical, Inc.* | 220 | 109,076 | ||||||
| Allergan, Inc. | 572 | 108,714 | ||||||
| Perrigo Company plc | 672 | 108,494 | ||||||
| Stryker Corp. | 1,239 | 108,450 | ||||||
| Omnicare, Inc. | 1,627 | 108,342 | ||||||
| Teleflex, Inc. | 947 | 108,072 | ||||||
| Laboratory Corporation of America Holdings* | 987 | 107,869 | ||||||
| Express Scripts Holding Co.* | 1,403 | 107,778 | ||||||
| DaVita HealthCare Partners, Inc.* | 1,370 | 106,956 | ||||||
| Jazz Pharmaceuticals plc* | 633 | 106,876 | ||||||
| Humana, Inc. | 767 | 106,498 | ||||||
| Intercept Pharmaceuticals, Inc.* | 411 | 106,198 | ||||||
| McKesson Corp. | 522 | 106,180 | ||||||
Gilead Sciences, Inc.*,2 | 948 | 106,176 | ||||||
| Charles River Laboratories International, Inc.* | 1,680 | 106,109 | ||||||
| Hill-Rom Holdings, Inc. | 2,385 | 106,085 | ||||||
| Quintiles Transnational Holdings, Inc.* | 1,809 | 105,899 | ||||||
ResMed, Inc.1 | 2,025 | 105,746 | ||||||
| St. Jude Medical, Inc. | 1,647 | 105,688 | ||||||
| Patterson Companies, Inc. | 2,451 | 105,663 | ||||||
| Covidien plc | 1,141 | 105,474 | ||||||
| WellPoint, Inc. | 832 | 105,406 | ||||||
| Cooper Companies, Inc. | 643 | 105,388 | ||||||
| Premier, Inc. — Class A* | 3,154 | 105,281 | ||||||
| Quest Diagnostics, Inc. | 1,656 | 105,090 | ||||||
| Mallinckrodt plc* | 1,140 | 105,085 | ||||||
42 | GUGGENHEIM ETFs ANNUAL REPORT | SEE NOTES TO FINANCIAL STATEMENTS. |
SCHEDULE OF INVESTMENTS (continued) | October 31, 2014 |
GUGGENHEIM RUSSELL 1000® EQUAL WEIGHT ETF |
| Shares | Value | |||||||
| Abbott Laboratories | 2,406 | $ | 104,878 | |||||
| Varian Medical Systems, Inc.* | 1,246 | 104,814 | ||||||
Myriad Genetics, Inc.*,1 | 2,654 | 104,806 | ||||||
| Henry Schein, Inc.* | 872 | 104,666 | ||||||
| Health Net, Inc.* | 2,195 | 104,284 | ||||||
| Cardinal Health, Inc. | 1,325 | 103,986 | ||||||
| Hospira, Inc.* | 1,935 | 103,910 | ||||||
| Brookdale Senior Living, Inc. — Class A* | 3,078 | 103,759 | ||||||
| Zoetis, Inc. | 2,787 | 103,565 | ||||||
| Sirona Dental Systems, Inc.* | 1,313 | 103,136 | ||||||
| Vertex Pharmaceuticals, Inc.* | 913 | 102,840 | ||||||
| Envision Healthcare Holdings, Inc.* | 2,924 | 102,194 | ||||||
| Aetna, Inc. | 1,235 | 101,900 | ||||||
| Eli Lilly & Co. | 1,536 | 101,883 | ||||||
| QIAGEN N.V.* | 4,341 | 101,840 | ||||||
| Pfizer, Inc. | 3,372 | 100,991 | ||||||
| Actavis plc* | 416 | 100,980 | ||||||
| Alere, Inc.* | 2,526 | 100,964 | ||||||
| Johnson & Johnson | 936 | 100,882 | ||||||
| Align Technology, Inc.* | 1,908 | 100,399 | ||||||
| Baxter International, Inc. | 1,422 | 99,739 | ||||||
| LifePoint Hospitals, Inc.* | 1,418 | 99,260 | ||||||
| HCA Holdings, Inc.* | 1,415 | 99,121 | ||||||
| Endo International plc* | 1,477 | 98,841 | ||||||
| Techne Corp. | 1,085 | 98,789 | ||||||
| Community Health Systems, Inc.* | 1,793 | 98,561 | ||||||
| United Therapeutics Corp.* | 752 | 98,489 | ||||||
| Bio-Rad Laboratories, Inc. — Class A* | 871 | 98,266 | ||||||
| Biogen Idec, Inc.* | 306 | 98,250 | ||||||
| Merck & Company, Inc. | 1,691 | 97,977 | ||||||
| Covance, Inc.* | 1,218 | 97,318 | ||||||
| Universal Health Services, Inc. — Class B | 911 | 94,480 | ||||||
| Gartner, Inc.* | 1,159 | 93,544 | ||||||
| Tenet Healthcare Corp.* | 1,636 | 91,698 | ||||||
| Seattle Genetics, Inc.* | 2,465 | 90,392 | ||||||
| Salix Pharmaceuticals Ltd.* | 613 | 88,180 | ||||||
| Booz Allen Hamilton Holding Corp. | 3,120 | 82,212 | ||||||
| Robert Half International, Inc. | 1,484 | 81,293 | ||||||
| Cintas Corp. | 1,098 | 80,417 | ||||||
| Rollins, Inc. | 2,501 | 79,707 | ||||||
| Towers Watson & Co. — Class A | 722 | 79,629 | ||||||
| RR Donnelley & Sons Co. | 4,433 | 77,356 | ||||||
| Genpact Ltd.* | 4,337 | 76,114 | ||||||
| CoStar Group, Inc.* | 467 | 75,229 | ||||||
| Verisk Analytics, Inc. — Class A* | 1,186 | 73,947 | ||||||
| Avery Dennison Corp. | 1,568 | 73,461 | ||||||
| ADT Corp. | 2,049 | 73,436 | ||||||
| Automatic Data Processing, Inc. | 881 | 72,047 | ||||||
| United Rentals, Inc.* | 651 | 71,649 | ||||||
| Quanta Services, Inc.* | 2,010 | 68,501 | ||||||
| Manpowergroup, Inc. | 1,013 | 67,618 | ||||||
| DeVry Education Group, Inc. | 1,314 | 63,610 | ||||||
| Graham Holdings Co. — Class B | 81 | 63,472 | ||||||
| Apollo Education Group, Inc. — Class A* | 2,204 | 63,167 | ||||||
| Live Nation Entertainment, Inc.* | 2,331 | 60,606 | ||||||
| KAR Auction Services, Inc. | 1,940 | 58,898 | ||||||
| Aramark | 2,077 | 57,969 | ||||||
| H&R Block, Inc. | 1,782 | 57,576 | ||||||
| Service Corporation International | 2,608 | 57,037 | ||||||
| Estee Lauder Companies, Inc. — Class A | 748 | 56,235 | ||||||
| Aaron’s, Inc. | 2,220 | 54,967 | ||||||
| ServiceMaster Global Holdings, Inc.* | 2,265 | 54,315 | ||||||
| Coty, Inc. — Class A* | 3,245 | 53,867 | ||||||
| Avis Budget Group, Inc.* | 938 | 52,294 | ||||||
| Global Payments, Inc. | 635 | 51,118 | ||||||
| Alliance Data Systems Corp.* | 179 | 50,720 | ||||||
| MasterCard, Inc. — Class A | 586 | 49,078 | ||||||
| Total System Services, Inc. | 1,423 | 48,083 | ||||||
| McGraw Hill Financial, Inc. | 524 | 47,412 | ||||||
| FleetCor Technologies, Inc.* | 313 | 47,125 | ||||||
| Moody’s Corp. | 474 | 47,035 | ||||||
| SEI Investments Co. | 1,213 | 46,895 | ||||||
| Hertz Global Holdings, Inc.* | 2,095 | 45,922 | ||||||
| Western Union Co. | 2,707 | 45,911 | ||||||
| Equifax, Inc. | 592 | 44,838 | ||||||
| Morningstar, Inc. | 653 | 44,567 | ||||||
| Avon Products, Inc. | 4,285 | 44,564 | ||||||
| Vantiv, Inc. — Class A* | 1,425 | 44,061 | ||||||
| CDK Global, Inc.* | 293 | 9,845 | ||||||
| Vectrus, Inc.* | 228 | 5,572 | ||||||
| Total Consumer, Non-cyclical | 22,230,125 | |||||||
| INDUSTRIAL - 13.3% | ||||||||
| Energizer Holdings, Inc. | 1,648 | 202,127 | ||||||
| Acuity Brands, Inc. | 1,090 | 151,979 | ||||||
| Packaging Corporation of America | 2,076 | 149,639 | ||||||
| Lennox International, Inc. | 1,674 | 148,852 | ||||||
| Ingersoll-Rand plc | 2,305 | 144,339 | ||||||
| Hexcel Corp.* | 3,356 | 140,583 | ||||||
| Crown Holdings, Inc.* | 2,899 | 138,948 | ||||||
| Rock-Tenn Co. — Class A | 2,689 | 137,542 | ||||||
| Sonoco Products Co. | 3,358 | 137,241 | ||||||
| Silgan Holdings, Inc. | 2,785 | 136,911 | ||||||
| Sealed Air Corp. | 3,720 | 134,850 | ||||||
| AptarGroup, Inc. | 2,161 | 134,501 | ||||||
Valmont Industries, Inc.1 | 985 | 134,128 | ||||||
| Ball Corp. | 2,064 | 132,984 | ||||||
| Bemis Company, Inc. | 3,456 | 132,952 | ||||||
| Vulcan Materials Co. | 2,137 | 131,875 | ||||||
| Timken Co. | 3,054 | 131,292 | ||||||
| Greif, Inc. — Class A | 2,976 | 131,123 | ||||||
| Owens Corning | 4,028 | 129,138 | ||||||
| Owens-Illinois, Inc.* | 4,879 | 125,732 | ||||||
| USG Corp.* | 4,666 | 125,329 | ||||||
| Masco Corp. | 5,625 | 124,144 | ||||||
| Precision Castparts Corp. | 552 | 121,826 | ||||||
| Martin Marietta Materials, Inc. | 1,007 | 117,738 | ||||||
| SEE NOTES TO FINANCIAL STATEMENTS. | GUGGENHEIM ETFs ANNUAL REPORT | 43 |
SCHEDULE OF INVESTMENTS (continued) | October 31, 2014 |
GUGGENHEIM RUSSELL 1000® EQUAL WEIGHT ETF |
| Shares | Value | |||||||
| Eagle Materials, Inc. | 1,293 | $ | 113,047 | |||||
| Armstrong World Industries, Inc.* | 2,320 | 112,334 | ||||||
| TimkenSteel Corp. | 2,740 | 111,189 | ||||||
SunPower Corp. — Class A*,1 | 3,428 | 109,148 | ||||||
| Golar LNG Ltd. | 1,798 | 100,886 | ||||||
| PerkinElmer, Inc. | 2,319 | 100,690 | ||||||
| Thermo Fisher Scientific, Inc. | 829 | 97,466 | ||||||
| AVX Corp. | 6,484 | 93,630 | ||||||
| Avnet, Inc. | 2,039 | 88,187 | ||||||
| SBA Communications Corp. — Class A* | 777 | 87,280 | ||||||
| Jabil Circuit, Inc. | 4,158 | 87,110 | ||||||
| Arrow Electronics, Inc.* | 1,497 | 85,119 | ||||||
| Textron, Inc. | 2,049 | 85,095 | ||||||
| Amphenol Corp. — Class A | 1,680 | 84,974 | ||||||
| AECOM Technology Corp.* | 2,593 | 84,402 | ||||||
| Parker-Hannifin Corp. | 650 | 82,570 | ||||||
| Tech Data Corp.* | 1,368 | 81,697 | ||||||
| CSX Corp. | 2,285 | 81,415 | ||||||
| General Dynamics Corp. | 578 | 80,781 | ||||||
| L-3 Communications Holdings, Inc. | 661 | 80,285 | ||||||
| Snap-on, Inc. | 607 | 80,209 | ||||||
| Carlisle Companies, Inc. | 902 | 80,171 | ||||||
| Waters Corp.* | 721 | 79,887 | ||||||
| Allegion plc | 1,504 | 79,847 | ||||||
| AO Smith Corp. | 1,495 | 79,758 | ||||||
| Pall Corp. | 872 | 79,718 | ||||||
| Vishay Intertechnology, Inc. | 5,888 | 79,547 | ||||||
| Union Pacific Corp. | 683 | 79,535 | ||||||
| J.B. Hunt Transport Services, Inc. | 997 | 79,530 | ||||||
| United Parcel Service, Inc. — Class B | 758 | 79,522 | ||||||
| Stericycle, Inc.* | 631 | 79,506 | ||||||
| Cummins, Inc. | 543 | 79,376 | ||||||
| Regal-Beloit Corp. | 1,110 | 78,777 | ||||||
| Rockwell Collins, Inc. | 932 | 78,428 | ||||||
| Graco, Inc. | 998 | 78,342 | ||||||
| Lockheed Martin Corp. | 411 | 78,324 | ||||||
| Northrop Grumman Corp. | 567 | 78,223 | ||||||
| Illinois Tool Works, Inc. | 857 | 78,030 | ||||||
| 3M Co. | 507 | 77,961 | ||||||
| Wabtec Corp. | 903 | 77,929 | ||||||
| Roper Industries, Inc. | 492 | 77,884 | ||||||
| Triumph Group, Inc. | 1,113 | 77,498 | ||||||
| Danaher Corp. | 961 | 77,264 | ||||||
| FLIR Systems, Inc. | 2,290 | 76,783 | ||||||
| CH Robinson Worldwide, Inc. | 1,108 | 76,685 | ||||||
| Eaton Corporation plc | 1,121 | 76,665 | ||||||
| Expeditors International of Washington, Inc. | 1,790 | 76,361 | ||||||
| FedEx Corp. | 456 | 76,334 | ||||||
| Old Dominion Freight Line, Inc.* | 1,047 | 76,295 | ||||||
| GATX Corp. | 1,200 | 76,080 | ||||||
| Covanta Holding Corp. | 3,445 | 76,031 | ||||||
| Honeywell International, Inc. | 790 | 75,935 | ||||||
| Waste Management, Inc. | 1,548 | 75,682 | ||||||
| Stanley Black & Decker, Inc. | 802 | 75,099 | ||||||
| Landstar System, Inc. | 1,013 | 74,972 | ||||||
| Spirit AeroSystems Holdings, Inc. — Class A* | 1,904 | 74,903 | ||||||
| AMETEK, Inc. | 1,435 | 74,836 | ||||||
| Raytheon Co. | 720 | 74,794 | ||||||
| Donaldson Company, Inc. | 1,797 | 74,719 | ||||||
| Waste Connections, Inc. | 1,497 | 74,700 | ||||||
| Lincoln Electric Holdings, Inc. | 1,030 | 74,655 | ||||||
| IDEX Corp. | 995 | 74,535 | ||||||
| Teekay Corp. | 1,273 | 74,420 | ||||||
| Babcock & Wilcox Co. | 2,601 | 74,389 | ||||||
| Deere & Co. | 869 | 74,334 | ||||||
| Zebra Technologies Corp. — Class A* | 1,007 | 74,266 | ||||||
| Emerson Electric Co. | 1,158 | 74,181 | ||||||
| Kansas City Southern | 604 | 74,165 | ||||||
| United Technologies Corp. | 693 | 74,151 | ||||||
| National Instruments Corp. | 2,340 | 74,131 | ||||||
| TransDigm Group, Inc. | 395 | 73,877 | ||||||
| Huntington Ingalls Industries, Inc. | 697 | 73,757 | ||||||
| Caterpillar, Inc. | 727 | 73,725 | ||||||
| Middleby Corp.* | 833 | 73,721 | ||||||
| Nordson Corp. | 961 | 73,565 | ||||||
| General Electric Co. | 2,844 | 73,404 | ||||||
| Pentair plc | 1,094 | 73,353 | ||||||
| Genesee & Wyoming, Inc. — Class A* | 761 | 73,208 | ||||||
| Norfolk Southern Corp. | 661 | 73,133 | ||||||
| Exelis, Inc. | 4,080 | 72,828 | ||||||
| Fluor Corp. | 1,096 | 72,709 | ||||||
| Rockwell Automation, Inc. | 647 | 72,690 | ||||||
| KBR, Inc. | 3,796 | 72,428 | ||||||
| Xylem, Inc. | 1,988 | 72,284 | ||||||
| Boeing Co. | 578 | 72,198 | ||||||
| Dover Corp. | 906 | 71,973 | ||||||
| Ryder System, Inc. | 812 | 71,838 | ||||||
| Republic Services, Inc. — Class A | 1,863 | 71,539 | ||||||
| SPX Corp. | 754 | 71,472 | ||||||
| ITT Corp. | 1,586 | 71,465 | ||||||
| Foster Wheeler AG | 2,302 | 71,431 | ||||||
| Tyco International Ltd. | 1,658 | 71,178 | ||||||
| Mettler-Toledo International, Inc.* | 275 | 71,079 | ||||||
| AGCO Corp. | 1,603 | 71,029 | ||||||
| Crane Co. | 1,132 | 70,580 | ||||||
| Agilent Technologies, Inc. | 1,271 | 70,261 | ||||||
| Jacobs Engineering Group, Inc.* | 1,463 | 69,419 | ||||||
| Flowserve Corp. | 1,021 | 69,418 | ||||||
| Joy Global, Inc. | 1,309 | 68,893 | ||||||
| Kirby Corp.* | 618 | 68,338 | ||||||
| Hubbell, Inc. — Class B | 601 | 68,159 | ||||||
| Kennametal, Inc. | 1,748 | 67,490 | ||||||
| Colfax Corp.* | 1,238 | 67,322 | ||||||
| Chicago Bridge & Iron Company N.V. | 1,231 | 67,262 | ||||||
| Tidewater, Inc. | 1,793 | 66,108 | ||||||
| Terex Corp. | 2,273 | 65,394 | ||||||
44 | GUGGENHEIM ETFs ANNUAL REPORT | SEE NOTES TO FINANCIAL STATEMENTS. |
SCHEDULE OF INVESTMENTS (continued) | October 31, 2014 |
GUGGENHEIM RUSSELL 1000® EQUAL WEIGHT ETF |
Shares | Value | |||||||
| Gentex Corp. | 1,995 | $ | 65,316 | |||||
| Alliant Techsystems, Inc. | 558 | 65,264 | ||||||
| Clean Harbors, Inc.* | 1,307 | 64,866 | ||||||
| Con-way, Inc. | 1,483 | 64,318 | ||||||
| Trimble Navigation Ltd.* | 2,394 | 64,303 | ||||||
| B/E Aerospace, Inc.* | 862 | 64,176 | ||||||
| Manitowoc Company, Inc. | 2,970 | 61,895 | ||||||
| Leggett & Platt, Inc. | 1,570 | 61,827 | ||||||
| Knowles Corp.* | 3,164 | 61,571 | ||||||
| Garmin Ltd. | 1,094 | 60,695 | ||||||
| Fortune Brands Home & Security, Inc. | 1,353 | 58,517 | ||||||
| AMERCO | 203 | 55,037 | ||||||
| Trinity Industries, Inc. | 1,517 | 54,172 | ||||||
| GoPro, Inc. — Class A* | 684 | 52,736 | ||||||
| Total Industrial | 12,401,666 | |||||||
| CONSUMER, CYCLICAL - 10.5% | ||||||||
| CVS Health Corp. | 2,537 | 217,699 | ||||||
| Walgreen Co. | 3,345 | 214,816 | ||||||
| GNC Holdings, Inc. — Class A | 5,153 | 214,210 | ||||||
| Rite Aid Corp.* | 39,611 | 207,958 | ||||||
| Scotts Miracle-Gro Co. — Class A | 2,382 | 141,110 | ||||||
| Fastenal Co. | 2,912 | 128,244 | ||||||
| World Fuel Services Corp. | 3,064 | 126,359 | ||||||
| Alaska Air Group, Inc. | 1,662 | 88,467 | ||||||
| Ingram Micro, Inc. — Class A* | 3,252 | 87,284 | ||||||
| Dolby Laboratories, Inc. — Class A | 2,050 | 85,936 | ||||||
| American Airlines Group, Inc. | 2,062 | 85,264 | ||||||
| PACCAR, Inc. | 1,260 | 82,303 | ||||||
| United Continental Holdings, Inc.* | 1,543 | 81,486 | ||||||
| Allison Transmission Holdings, Inc. | 2,496 | 81,070 | ||||||
| Sabre Corp. | 4,632 | 79,670 | ||||||
| Delta Air Lines, Inc. | 1,977 | 79,535 | ||||||
| Copa Holdings S.A. — Class A | 680 | 79,506 | ||||||
| Copart, Inc.* | 2,322 | 77,647 | ||||||
| Spirit Airlines, Inc.* | 1,052 | 76,912 | ||||||
| Toro Co. | 1,226 | 75,681 | ||||||
| Navistar International Corp.* | 2,139 | 75,656 | ||||||
Sears Holdings Corp.*,1 | 2,154 | 75,218 | ||||||
| WESCO International, Inc.* | 912 | 75,158 | ||||||
| Southwest Airlines Co. | 2,167 | 74,718 | ||||||
| HD Supply Holdings, Inc.* | 2,588 | 74,638 | ||||||
| Oshkosh Corp. | 1,605 | 71,840 | ||||||
| WW Grainger, Inc. | 289 | 71,325 | ||||||
| MSC Industrial Direct Company, Inc. — Class A | 835 | 67,610 | ||||||
| Nu Skin Enterprises, Inc. — Class A | 1,279 | 67,570 | ||||||
| Tractor Supply Co. | 905 | 66,264 | ||||||
| Six Flags Entertainment Corp. | 1,633 | 65,810 | ||||||
| CarMax, Inc.* | 1,168 | 65,303 | ||||||
| NVR, Inc.* | 53 | 65,062 | ||||||
| O’Reilly Automotive, Inc.* | 369 | 64,899 | ||||||
| NIKE, Inc. — Class B | 688 | 63,963 | ||||||
| Domino’s Pizza, Inc. | 717 | 63,663 | ||||||
| Madison Square Garden Co. — Class A* | 836 | 63,335 | ||||||
| AutoNation, Inc.* | 1,103 | 63,158 | ||||||
| Whirlpool Corp. | 366 | 62,970 | ||||||
| Advance Auto Parts, Inc. | 426 | 62,605 | ||||||
| Genuine Parts Co. | 633 | 61,452 | ||||||
| Regal Entertainment Group — Class A | 2,763 | 61,200 | ||||||
| Penske Automotive Group, Inc. | 1,341 | 60,667 | ||||||
| Jarden Corp.* | 928 | 60,404 | ||||||
| DR Horton, Inc. | 2,649 | 60,371 | ||||||
| AutoZone, Inc.* | 109 | 60,334 | ||||||
Burger King Worldwide, Inc.1 | 1,845 | 60,295 | ||||||
| Lennar Corp. — Class A | 1,398 | 60,226 | ||||||
| Dollar Tree, Inc.* | 992 | 60,086 | ||||||
| LKQ Corp.* | 2,100 | 59,997 | ||||||
| Norwegian Cruise Line Holdings Ltd.* | 1,533 | 59,787 | ||||||
| Michael Kors Holdings Ltd.* | 760 | 59,729 | ||||||
| Lowe’s Companies, Inc. | 1,042 | 59,602 | ||||||
| Ross Stores, Inc. | 737 | 59,490 | ||||||
| Marriott International, Inc. — Class A | 785 | 59,464 | ||||||
| Sally Beauty Holdings, Inc.* | 2,019 | 59,177 | ||||||
| TJX Companies, Inc. | 933 | 59,078 | ||||||
| CST Brands, Inc. | 1,544 | 59,058 | ||||||
| Harley-Davidson, Inc. | 898 | 58,999 | ||||||
| Home Depot, Inc. | 604 | 58,902 | ||||||
| Lions Gate Entertainment Corp. | 1,777 | 58,872 | ||||||
| L Brands, Inc. | 815 | 58,777 | ||||||
| Johnson Controls, Inc. | 1,243 | 58,732 | ||||||
| PulteGroup, Inc. | 3,059 | 58,702 | ||||||
| Nordstrom, Inc. | 805 | 58,451 | ||||||
| Costco Wholesale Corp. | 438 | 58,416 | ||||||
| Hasbro, Inc. | 1,015 | 58,393 | ||||||
| Signet Jewelers Ltd. | 485 | 58,204 | ||||||
| Brinker International, Inc. | 1,084 | 58,146 | ||||||
| Wynn Resorts Ltd. | 306 | 58,143 | ||||||
| Goodyear Tire & Rubber Co. | 2,385 | 57,789 | ||||||
| Fossil Group, Inc.* | 568 | 57,743 | ||||||
| Michaels Companies, Inc.* | 3,155 | 57,673 | ||||||
| Dick’s Sporting Goods, Inc. | 1,271 | 57,665 | ||||||
| WABCO Holdings, Inc.* | 592 | 57,649 | ||||||
| Cinemark Holdings, Inc. | 1,627 | 57,466 | ||||||
| Mohawk Industries, Inc.* | 404 | 57,384 | ||||||
| MGM Resorts International* | 2,461 | 57,218 | ||||||
| PetSmart, Inc. | 790 | 57,157 | ||||||
| Royal Caribbean Cruises Ltd. | 838 | 56,959 | ||||||
| Dollar General Corp.* | 908 | 56,904 | ||||||
| Harman International Industries, Inc. | 530 | 56,890 | ||||||
| Hilton Worldwide Holdings, Inc.* | 2,252 | 56,840 | ||||||
| Dunkin’ Brands Group, Inc. | 1,249 | 56,805 | ||||||
| Las Vegas Sands Corp. | 912 | 56,781 | ||||||
| VF Corp. | 838 | 56,716 | ||||||
| Best Buy Company, Inc. | 1,658 | 56,604 | ||||||
| Chico’s FAS, Inc. | 3,753 | 56,595 | ||||||
| Starbucks Corp. | 747 | 56,443 | ||||||
| SEE NOTES TO FINANCIAL STATEMENTS. | GUGGENHEIM ETFs ANNUAL REPORT | 45 |
SCHEDULE OF INVESTMENTS (continued) | October 31, 2014 |
GUGGENHEIM RUSSELL 1000® EQUAL WEIGHT ETF |
| Shares | Value | |||||||
| Choice Hotels International, Inc. | 1,052 | $ | 56,282 | |||||
| Carter’s, Inc. | 719 | 56,175 | ||||||
| Big Lots, Inc. | 1,230 | 56,150 | ||||||
| Chipotle Mexican Grill, Inc. — Class A* | 88 | 56,144 | ||||||
| Panera Bread Co. — Class A* | 346 | 55,927 | ||||||
| Family Dollar Stores, Inc. | 714 | 55,899 | ||||||
| Bed Bath & Beyond, Inc.* | 830 | 55,892 | ||||||
GameStop Corp. — Class A1 | 1,306 | 55,845 | ||||||
| Darden Restaurants, Inc. | 1,078 | 55,819 | ||||||
| Toll Brothers, Inc.* | 1,738 | 55,529 | ||||||
| Staples, Inc. | 4,379 | 55,526 | ||||||
| Polaris Industries, Inc. | 368 | 55,516 | ||||||
| BorgWarner, Inc. | 973 | 55,480 | ||||||
| Lear Corp. | 599 | 55,408 | ||||||
| DreamWorks Animation SKG, Inc. — Class A* | 2,486 | 55,388 | ||||||
| Ulta Salon Cosmetics & Fragrance, Inc.* | 458 | 55,331 | ||||||
| Thor Industries, Inc. | 1,046 | 55,323 | ||||||
| Yum! Brands, Inc. | 770 | 55,309 | ||||||
| Ralph Lauren Corp. — Class A | 335 | 55,221 | ||||||
| Hanesbrands, Inc. | 521 | 55,023 | ||||||
| Wal-Mart Stores, Inc. | 720 | 54,914 | ||||||
| Mattel, Inc. | 1,767 | 54,901 | ||||||
| Foot Locker, Inc. | 980 | 54,890 | ||||||
| Tiffany & Co. | 571 | 54,885 | ||||||
| Bally Technologies, Inc.* | 682 | 54,834 | ||||||
| McDonald’s Corp. | 584 | 54,738 | ||||||
| Carnival Corp. | 1,363 | 54,724 | ||||||
| Wendy’s Co. | 6,823 | 54,720 | ||||||
| Macy’s, Inc. | 944 | 54,582 | ||||||
| TRW Automotive Holdings Corp.* | 538 | 54,526 | ||||||
| Taylor Morrison Home Corp. — Class A* | 3,152 | 54,340 | ||||||
| DSW, Inc. — Class A | 1,826 | 54,141 | ||||||
| Tesla Motors, Inc.* | 224 | 54,141 | ||||||
| Williams-Sonoma, Inc. | 831 | 54,040 | ||||||
| Target Corp. | 874 | 54,031 | ||||||
| SeaWorld Entertainment, Inc. | 2,795 | 53,776 | ||||||
| Under Armour, Inc. — Class A* | 819 | 53,710 | ||||||
| Newell Rubbermaid, Inc. | 1,611 | 53,695 | ||||||
| International Game Technology | 3,273 | 53,644 | ||||||
| Kate Spade & Co.* | 1,977 | 53,636 | ||||||
| Wyndham Worldwide Corp. | 689 | 53,515 | ||||||
| Dillard’s, Inc. — Class A | 504 | 53,303 | ||||||
| Hyatt Hotels Corp. — Class A* | 899 | 53,239 | ||||||
| General Motors Co. | 1,685 | 52,909 | ||||||
| Coach, Inc. | 1,524 | 52,395 | ||||||
| PVH Corp. | 454 | 51,915 | ||||||
| Starwood Hotels & Resorts Worldwide, Inc. | 671 | 51,439 | ||||||
| Ascena Retail Group, Inc.* | 4,122 | 51,319 | ||||||
| Tempur Sealy International, Inc.* | 965 | 50,798 | ||||||
| Visteon Corp.* | 536 | 50,330 | ||||||
| Tupperware Brands Corp. | 789 | 50,299 | ||||||
| The Gap, Inc. | 1,313 | 49,750 | ||||||
| Deckers Outdoor Corp.* | 565 | 49,415 | ||||||
| Abercrombie & Fitch Co. — Class A | 1,474 | �� | 49,350 | |||||
| Kohl’s Corp. | 904 | 49,015 | ||||||
| Ford Motor Co. | 3,410 | 48,047 | ||||||
| Cabela’s, Inc.* | 948 | 45,523 | ||||||
| Urban Outfitters, Inc.* | 1,468 | 44,568 | ||||||
| Gaming and Leisure Properties, Inc. | 1,397 | 43,656 | ||||||
JC Penney Company, Inc.*,1 | 5,448 | 41,459 | ||||||
| Total Consumer, Cyclical | 9,732,656 | |||||||
| FINANCIAL - 10.4% | ||||||||
| Air Lease Corp. — Class A | 2,193 | 80,242 | ||||||
| Iron Mountain, Inc. | 2,059 | 74,268 | ||||||
| CBS Outdoor Americas, Inc. | 1,859 | 56,569 | ||||||
| Equity LifeStyle Properties, Inc. | 1,054 | 51,751 | ||||||
| Kilroy Realty Corp. | 752 | 50,941 | ||||||
| Weingarten Realty Investors | 1,404 | 50,896 | ||||||
| Extra Space Storage, Inc. | 874 | 50,832 | ||||||
| CoreLogic, Inc.* | 1,609 | 50,474 | ||||||
| Kimco Realty Corp. | 2,023 | 50,474 | ||||||
| Public Storage | 272 | 50,140 | ||||||
| Regency Centers Corp. | 823 | 49,956 | ||||||
| Health Care REIT, Inc. | 701 | 49,849 | ||||||
| Boston Properties, Inc. | 393 | 49,814 | ||||||
| Equity Residential | 716 | 49,806 | ||||||
| SL Green Realty Corp. | 430 | 49,751 | ||||||
| Federal Realty Investment Trust | 377 | 49,689 | ||||||
| AvalonBay Communities, Inc. | 318 | 49,557 | ||||||
| Apartment Investment & Management Co. — Class A | 1,384 | 49,533 | ||||||
| Realty Income Corp. | 1,073 | 49,390 | ||||||
| Digital Realty Trust, Inc. | 715 | 49,328 | ||||||
| Ventas, Inc. | 720 | 49,327 | ||||||
| Alexandria Real Estate Equities, Inc. | 594 | 49,302 | ||||||
| Omega Healthcare Investors, Inc. | 1,290 | 49,226 | ||||||
| Macerich Co. | 698 | 49,208 | ||||||
| Camden Property Trust | 641 | 49,145 | ||||||
| Simon Property Group, Inc. | 274 | 49,104 | ||||||
| Visa, Inc. — Class A | 203 | 49,010 | ||||||
| Navient Corp. | 2,477 | 48,995 | ||||||
| Erie Indemnity Co. — Class A | 576 | 48,884 | ||||||
| Hospitality Properties Trust | 1,647 | 48,768 | ||||||
| Duke Realty Corp. | 2,572 | 48,765 | ||||||
| UDR, Inc. | 1,612 | 48,731 | ||||||
| Prologis, Inc. | 1,169 | 48,689 | ||||||
| DDR Corp. | 2,682 | 48,651 | ||||||
| General Growth Properties, Inc. | 1,877 | 48,633 | ||||||
| HCP, Inc. | 1,105 | 48,587 | ||||||
| National Retail Properties, Inc. | 1,273 | 48,527 | ||||||
| CBOE Holdings, Inc. | 823 | 48,507 | ||||||
| Post Properties, Inc. | 867 | 48,500 | ||||||
| Home Properties, Inc. | 754 | 48,490 | ||||||
| SLM Corp. | 5,077 | 48,485 | ||||||
| Healthcare Trust of America, Inc. — Class A | 3,770 | 48,407 | ||||||
| StanCorp Financial Group, Inc. | 695 | 48,343 | ||||||
46 | GUGGENHEIM ETFs ANNUAL REPORT | SEE NOTES TO FINANCIAL STATEMENTS. |
SCHEDULE OF INVESTMENTS (continued) | October 31, 2014 |
GUGGENHEIM RUSSELL 1000® EQUAL WEIGHT ETF |
| Shares | Value | |||||||
| Chubb Corp. | 486 | $ | 48,289 | |||||
| Synchrony Financial* | 1,787 | 48,285 | ||||||
| Essex Property Trust, Inc. | 239 | 48,221 | ||||||
| Host Hotels & Resorts, Inc. | 2,068 | 48,205 | ||||||
| Hanover Insurance Group, Inc. | 719 | 48,130 | ||||||
| Douglas Emmett, Inc. | 1,709 | 48,074 | ||||||
| Vornado Realty Trust | 439 | 48,062 | ||||||
| American Campus Communities, Inc. | 1,223 | 48,027 | ||||||
| Tanger Factory Outlet Centers, Inc. | 1,342 | 48,003 | ||||||
| Everest Re Group Ltd. | 281 | 47,952 | ||||||
| Mercury General Corp. | 902 | 47,914 | ||||||
| East West Bancorp, Inc. | 1,303 | 47,899 | ||||||
| Brixmor Property Group, Inc. | 1,965 | 47,867 | ||||||
| Retail Properties of America, Inc. — Class A | 3,048 | 47,823 | ||||||
| Piedmont Office Realty Trust, Inc. — Class A | 2,458 | 47,808 | ||||||
| Brandywine Realty Trust | 3,098 | 47,802 | ||||||
| Rayonier, Inc. | 1,427 | 47,762 | ||||||
| Spirit Realty Capital, Inc. | 3,998 | 47,576 | ||||||
| CBL & Associates Properties, Inc. | 2,483 | 47,500 | ||||||
| Mid-America Apartment Communities, Inc. | 672 | 47,484 | ||||||
| Cincinnati Financial Corp. | 939 | 47,392 | ||||||
| CBRE Group, Inc. — Class A* | 1,478 | 47,297 | ||||||
| WR Berkley Corp. | 917 | 47,262 | ||||||
| Legg Mason, Inc. | 908 | 47,216 | ||||||
| Senior Housing Properties Trust | 2,090 | 47,213 | ||||||
| Intercontinental Exchange, Inc. | 226 | 47,074 | ||||||
| Allstate Corp. | 725 | 47,016 | ||||||
| Popular, Inc.* | 1,474 | 46,992 | ||||||
| Markel Corp.* | 68 | 46,981 | ||||||
| BioMed Realty Trust, Inc. | 2,163 | 46,980 | ||||||
| HCC Insurance Holdings, Inc. | 899 | 46,919 | ||||||
| Hartford Financial Services Group, Inc. | 1,185 | 46,902 | ||||||
| Corrections Corporation of America | 1,274 | 46,858 | ||||||
| FNF Group | 1,570 | 46,849 | ||||||
| Realogy Holdings Corp.* | 1,142 | 46,833 | ||||||
| NorthStar Realty Finance Corp. | 2,518 | 46,785 | ||||||
| Travelers Companies, Inc. | 464 | 46,771 | ||||||
| Signature Bank* | 386 | 46,755 | ||||||
| Associated Banc-Corp. | 2,487 | 46,755 | ||||||
| Taubman Centers, Inc. | 614 | 46,695 | ||||||
| Forest City Enterprises, Inc. — Class A* | 2,234 | 46,668 | ||||||
| Weyerhaeuser Co. | 1,377 | 46,625 | ||||||
| Federated Investors, Inc. — Class B | 1,491 | 46,623 | ||||||
| MFA Financial, Inc. | 5,556 | 46,559 | ||||||
| Goldman Sachs Group, Inc. | 245 | 46,547 | ||||||
| Assurant, Inc. | 682 | 46,526 | ||||||
| CME Group, Inc. — Class A | 555 | 46,515 | ||||||
| Jones Lang LaSalle, Inc. | 344 | 46,512 | ||||||
| Arthur J Gallagher & Co. | 975 | 46,508 | ||||||
| CIT Group, Inc. | 950 | 46,484 | ||||||
| Columbia Property Trust, Inc. | 1,839 | 46,398 | ||||||
| Cullen/Frost Bankers, Inc. | 574 | 46,385 | ||||||
| Synovus Financial Corp. | 1,829 | 46,383 | ||||||
| Fulton Financial Corp. | 3,901 | 46,344 | ||||||
| Plum Creek Timber Company, Inc. | 1,130 | 46,341 | ||||||
| Endurance Specialty Holdings Ltd. | 799 | 46,302 | ||||||
| First Republic Bank | 908 | 46,244 | ||||||
| Corporate Office Properties Trust | 1,691 | 46,232 | ||||||
| Equity Commonwealth* | 1,728 | 46,155 | ||||||
| Genworth Financial, Inc. — Class A* | 3,297 | 46,125 | ||||||
| Loews Corp. | 1,057 | 46,085 | ||||||
| TFS Financial Corp. | 3,079 | 46,000 | ||||||
| MBIA, Inc.* | 4,712 | 45,989 | ||||||
| WP Carey, Inc. | 679 | 45,982 | ||||||
| Marsh & McLennan Companies, Inc. | 845 | 45,943 | ||||||
| ProAssurance Corp. | 982 | 45,938 | ||||||
| PartnerRe Ltd. | 397 | 45,929 | ||||||
| ACE Ltd. | 420 | 45,906 | ||||||
| T. Rowe Price Group, Inc. | 559 | 45,888 | ||||||
Nationstar Mortgage Holdings, Inc.*,1 | 1,305 | 45,832 | ||||||
| Allied World Assurance Company Holdings AG | 1,206 | 45,828 | ||||||
| Progressive Corp. | 1,735 | 45,821 | ||||||
| Santander Consumer USA Holdings, Inc. ADR | 2,476 | 45,806 | ||||||
| American Tower Corp. — Class A | 468 | 45,630 | ||||||
| Washington Prime Group, Inc. | 2,588 | 45,626 | ||||||
| Arch Capital Group Ltd.* | 810 | 45,619 | ||||||
| Aflac, Inc. | 763 | 45,574 | ||||||
| RenaissanceRe Holdings Ltd. | 441 | 45,569 | ||||||
| CNA Financial Corp. | 1,166 | 45,567 | ||||||
| American Financial Group, Inc. | 761 | 45,531 | ||||||
| Liberty Property Trust | 1,309 | 45,514 | ||||||
| Interactive Brokers Group, Inc. — Class A | 1,762 | 45,495 | ||||||
| American Homes 4 Rent — Class A | 2,595 | 45,490 | ||||||
| First Horizon National Corp. | 3,536 | 45,473 | ||||||
| Wells Fargo & Co. | 856 | 45,446 | ||||||
| NASDAQ OMX Group, Inc. | 1,050 | 45,423 | ||||||
| Raymond James Financial, Inc. | 808 | 45,353 | ||||||
| City National Corp. | 576 | 45,337 | ||||||
| Reinsurance Group of America, Inc. — Class A | 538 | 45,327 | ||||||
| Alleghany Corp.* | 102 | 45,317 | ||||||
| Old Republic International Corp. | 3,058 | 45,167 | ||||||
| American Express Co. | 502 | 45,155 | ||||||
| Citigroup, Inc. | 843 | 45,126 | ||||||
| American Capital Agency Corp. | 1,984 | 45,116 | ||||||
| Aspen Insurance Holdings Ltd. | 1,034 | 45,113 | ||||||
| Assured Guaranty Ltd. | 1,954 | 45,098 | ||||||
| Validus Holdings Ltd. | 1,133 | 45,071 | ||||||
| BlackRock, Inc. — Class A | 132 | 45,027 | ||||||
| State Street Corp. | 596 | 44,974 | ||||||
| PacWest Bancorp | 1,054 | 44,964 | ||||||
| Lincoln National Corp. | 821 | 44,958 | ||||||
| U.S. Bancorp | 1,054 | 44,901 | ||||||
| Invesco Ltd. | 1,107 | 44,800 | ||||||
| SunTrust Banks, Inc. | 1,144 | 44,776 | ||||||
| Morgan Stanley | 1,280 | 44,736 | ||||||
| SEE NOTES TO FINANCIAL STATEMENTS. | GUGGENHEIM ETFs ANNUAL REPORT | 47 |
SCHEDULE OF INVESTMENTS (continued) | October 31, 2014 |
GUGGENHEIM RUSSELL 1000® EQUAL WEIGHT ETF |
| Shares | Value | |||||||
| Franklin Resources, Inc. | 804 | $ | 44,710 | |||||
| BB&T Corp. | 1,180 | 44,698 | ||||||
| BOK Financial Corp. | 651 | 44,633 | ||||||
| Bank of America Corp. | 2,600 | 44,616 | ||||||
| Bank of Hawaii Corp. | 762 | 44,615 | ||||||
| Ameriprise Financial, Inc. | 353 | 44,538 | ||||||
| Capital One Financial Corp. | 538 | 44,530 | ||||||
| XL Group plc — Class A | 1,314 | 44,518 | ||||||
| Huntington Bancshares, Inc. | 4,485 | 44,446 | ||||||
| Annaly Capital Management, Inc. | 3,889 | 44,373 | ||||||
| Commerce Bancshares, Inc. | 980 | 44,355 | ||||||
| PNC Financial Services Group, Inc. | 513 | 44,318 | ||||||
| Berkshire Hathaway, Inc. — Class B* | 316 | 44,291 | ||||||
| Voya Financial, Inc. | 1,128 | 44,274 | ||||||
| TD Ameritrade Holding Corp. | 1,312 | 44,267 | ||||||
| Protective Life Corp. | 635 | 44,247 | ||||||
| American National Insurance Co. | 387 | 44,149 | ||||||
| Axis Capital Holdings Ltd. | 915 | 44,048 | ||||||
| Zions Bancorporation | 1,520 | 44,034 | ||||||
| Two Harbors Investment Corp. | 4,346 | 44,025 | ||||||
| SVB Financial Group* | 393 | 44,012 | ||||||
| MetLife, Inc. | 811 | 43,989 | ||||||
| JPMorgan Chase & Co. | 727 | 43,969 | ||||||
| New York Community Bancorp, Inc. | 2,756 | 43,958 | ||||||
| Torchmark Corp. | 830 | 43,957 | ||||||
| People’s United Financial, Inc. | 3,005 | 43,933 | ||||||
| Bank of New York Mellon Corp. | 1,133 | 43,870 | ||||||
| Prudential Financial, Inc. | 494 | 43,739 | ||||||
| Discover Financial Services | 685 | 43,689 | ||||||
| Starwood Property Trust, Inc. | 1,934 | 43,631 | ||||||
| Principal Financial Group, Inc. | 833 | 43,624 | ||||||
| Affiliated Managers Group, Inc.* | 218 | 43,554 | ||||||
| Aon plc | 506 | 43,516 | ||||||
| Crown Castle International Corp. | 557 | 43,513 | ||||||
| Howard Hughes Corp.* | 295 | 43,477 | ||||||
| Brown & Brown, Inc. | 1,363 | 43,425 | ||||||
| American International Group, Inc. | 810 | 43,392 | ||||||
| Regions Financial Corp. | 4,367 | 43,364 | ||||||
| E*TRADE Financial Corp.* | 1,940 | 43,262 | ||||||
| KeyCorp | 3,270 | 43,164 | ||||||
| Northern Trust Corp. | 651 | 43,161 | ||||||
| NorthStar Asset Management Group Incorporated | 2,381 | 43,144 | ||||||
| White Mountains Insurance Group Ltd. | 69 | 43,119 | ||||||
| Fifth Third Bancorp | 2,156 | 43,098 | ||||||
| Ally Financial, Inc.* | 1,898 | 43,085 | ||||||
| Chimera Investment Corp. | 13,807 | 43,078 | ||||||
| TCF Financial Corp. | 2,786 | 43,044 | ||||||
| Hudson City Bancorp, Inc. | 4,460 | 43,039 | ||||||
| Eaton Vance Corp. | 1,164 | 42,870 | ||||||
| Charles Schwab Corp. | 1,491 | 42,747 | ||||||
| Unum Group | 1,275 | 42,662 | ||||||
| M&T Bank Corp. | 348 | 42,519 | ||||||
| BankUnited, Inc. | 1,418 | 42,398 | ||||||
| Lazard Ltd. — Class A | 857 | 42,173 | ||||||
| FNFV Group* | 3,123 | 41,973 | ||||||
| Comerica, Inc. | 869 | 41,486 | ||||||
| Artisan Partners Asset Management, Inc. — Class A | 845 | 40,966 | ||||||
| Waddell & Reed Financial, Inc. — Class A | 832 | 39,720 | ||||||
| Ocwen Financial Corp.* | 1,654 | 38,968 | ||||||
| First Niagara Financial Group, Inc. | 5,183 | 38,821 | ||||||
| LPL Financial Holdings, Inc. | 936 | 38,741 | ||||||
| American Realty Capital Properties, Inc. | 3,620 | 32,109 | ||||||
| Total Financial | 9,731,112 | |||||||
| ENERGY - 9.9% | ||||||||
| Energen Corp. | 2,462 | 166,678 | ||||||
| Athlon Energy, Inc.* | 2,708 | 157,877 | ||||||
| Tesoro Corp. | 2,078 | 148,390 | ||||||
| Oceaneering International, Inc. | 1,934 | 135,901 | ||||||
| PBF Energy, Inc. — Class A | 5,128 | 133,687 | ||||||
CVR Energy, Inc.1 | 2,741 | 133,158 | ||||||
| Valero Energy Corp. | 2,658 | 133,139 | ||||||
| Marathon Petroleum Corp. | 1,455 | 132,260 | ||||||
Diamond Offshore Drilling, Inc.1 | 3,418 | 128,892 | ||||||
| FMC Technologies, Inc.* | 2,273 | 127,379 | ||||||
| Exxon Mobil Corp. | 1,312 | 126,883 | ||||||
| Equities Corp. | 1,349 | 126,860 | ||||||
Kinder Morgan, Inc.1 | 3,271 | 126,587 | ||||||
| HollyFrontier Corp. | 2,769 | 125,657 | ||||||
| Memorial Resource Development Corp.* | 4,631 | 125,454 | ||||||
| Range Resources Corp. | 1,823 | 124,693 | ||||||
| CONSOL Energy, Inc. | 3,376 | 124,237 | ||||||
| Spectra Energy Corp. | 3,174 | 124,199 | ||||||
| Williams Companies, Inc. | 2,233 | 123,954 | ||||||
| Dril-Quip, Inc.* | 1,366 | 122,872 | ||||||
| Cabot Oil & Gas Corp. — Class A | 3,920 | 121,912 | ||||||
| Chevron Corp. | 1,015 | 121,749 | ||||||
| Dresser-Rand Group, Inc.* | 1,489 | 121,651 | ||||||
| Rice Energy, Inc.* | 4,602 | 121,631 | ||||||
Ultra Petroleum Corp.*,1 | 5,327 | 121,456 | ||||||
NOW, Inc.*,1 | 4,010 | 120,541 | ||||||
| Schlumberger Ltd. | 1,220 | 120,365 | ||||||
| Pioneer Natural Resources Co. | 634 | 119,864 | ||||||
| Rowan Companies plc — Class A | 4,887 | 118,607 | ||||||
| Antero Resources Corp.* | 2,261 | 118,567 | ||||||
| MRC Global, Inc.* | 5,625 | 118,294 | ||||||
| Oil States International, Inc.* | 1,979 | 118,225 | ||||||
| Phillips 66 | 1,504 | 118,064 | ||||||
SolarCity Corp.*,1 | 1,985 | 117,472 | ||||||
| Murphy Oil Corp. | 2,197 | 117,298 | ||||||
| Chesapeake Energy Corp. | 5,275 | 117,000 | ||||||
| EOG Resources, Inc. | 1,230 | 116,912 | ||||||
| Kosmos Energy Ltd.* | 12,494 | 116,569 | ||||||
| Targa Resources Corp. | 904 | 116,282 | ||||||
| Atwood Oceanics, Inc. | 2,860 | 116,259 | ||||||
48 | GUGGENHEIM ETFs ANNUAL REPORT | SEE NOTES TO FINANCIAL STATEMENTS. |
SCHEDULE OF INVESTMENTS (continued) | October 31, 2014 |
GUGGENHEIM RUSSELL 1000® EQUAL WEIGHT ETF |
| Shares | Value | |||||||
| Cheniere Energy, Inc.* | 1,543 | $ | 115,725 | |||||
| Gulfport Energy Corp.* | 2,294 | 115,113 | ||||||
| National Oilwell Varco, Inc. | 1,578 | 114,626 | ||||||
| Marathon Oil Corp. | 3,237 | 114,590 | ||||||
| ConocoPhillips | 1,588 | 114,574 | ||||||
| Occidental Petroleum Corp. | 1,279 | 113,741 | ||||||
| Southwestern Energy Co.* | 3,495 | 113,622 | ||||||
| Frank’s International N.V. | 6,504 | 112,064 | ||||||
| Cimarex Energy Co. | 981 | 111,510 | ||||||
| ONEOK, Inc. | 1,874 | 110,454 | ||||||
| Anadarko Petroleum Corp. | 1,199 | 110,044 | ||||||
| Hess Corp. | 1,295 | 109,829 | ||||||
| Helmerich & Payne, Inc. | 1,263 | 109,654 | ||||||
| Laredo Petroleum, Inc.* | 5,768 | 109,361 | ||||||
| Cameron International Corp.* | 1,828 | 108,857 | ||||||
SandRidge Energy, Inc.*,1 | 27,799 | 108,416 | ||||||
| Devon Energy Corp. | 1,786 | 107,160 | ||||||
| Concho Resources, Inc.* | 982 | 107,067 | ||||||
| Halliburton Co. | 1,940 | 106,972 | ||||||
| Newfield Exploration Co.* | 3,255 | 106,146 | ||||||
| EP Energy Corp. — Class A* | 7,259 | 105,981 | ||||||
Seadrill Ltd.1 | 4,562 | 104,926 | ||||||
| Peabody Energy Corp. | 10,026 | 104,571 | ||||||
| Continental Resources, Inc.* | 1,841 | 103,777 | ||||||
| Cobalt International Energy, Inc.* | 8,838 | 103,493 | ||||||
| Noble Energy, Inc. | 1,782 | 102,697 | ||||||
| Apache Corp. | 1,316 | 101,595 | ||||||
| Unit Corp.* | 2,094 | 101,391 | ||||||
| Denbury Resources, Inc. | 8,101 | 100,452 | ||||||
| QEP Resources, Inc. | 3,978 | 99,728 | ||||||
| Baker Hughes, Inc. | 1,880 | 99,565 | ||||||
| WPX Energy, Inc.* | 5,171 | 98,870 | ||||||
| Whiting Petroleum Corp.* | 1,603 | 98,168 | ||||||
| RPC, Inc. | 5,857 | 96,055 | ||||||
| Nabors Industries Ltd. | 5,336 | 95,248 | ||||||
| Superior Energy Services, Inc. | 3,742 | 94,111 | ||||||
| Oasis Petroleum, Inc.* | 2,952 | 88,442 | ||||||
| SM Energy Co. | 1,569 | 88,335 | ||||||
| Patterson-UTI Energy, Inc. | 3,763 | 86,662 | ||||||
| Seventy Seven Energy, Inc.* | 5,300 | 69,271 | ||||||
| Murphy USA, Inc.* | 1,036 | 59,363 | ||||||
| Total Energy | 9,249,701 | |||||||
| UTILITIES - 9.3% | ||||||||
| Wisconsin Energy Corp. | 4,129 | 205,047 | ||||||
| TECO Energy, Inc. | 10,319 | 202,356 | ||||||
| Vectren Corp. | 4,492 | 201,915 | ||||||
| Consolidated Edison, Inc. | 3,162 | 200,344 | ||||||
| PG&E Corp. | 3,971 | 199,821 | ||||||
| Alliant Energy Corp. | 3,208 | 198,607 | ||||||
| American Electric Power Company, Inc. | 3,403 | 198,531 | ||||||
| Integrys Energy Group, Inc. | 2,730 | 198,416 | ||||||
| Atmos Energy Corp. | 3,743 | 198,379 | ||||||
| UGI Corp. | 5,261 | 198,287 | ||||||
| Pinnacle West Capital Corp. | 3,225 | 198,241 | ||||||
| Aqua America, Inc. | 7,559 | 198,046 | ||||||
| ITC Holdings Corp. | 4,995 | 197,852 | ||||||
| Ameren Corp. | 4,671 | 197,770 | ||||||
| Northeast Utilities | 4,007 | 197,745 | ||||||
| Edison International | 3,158 | 197,628 | ||||||
| SCANA Corp. | 3,598 | 197,494 | ||||||
| Great Plains Energy, Inc. | 7,325 | 197,262 | ||||||
| Duke Energy Corp. | 2,394 | 196,667 | ||||||
| American Water Works Company, Inc. | 3,679 | 196,348 | ||||||
| Entergy Corp. | 2,333 | 196,019 | ||||||
| Westar Energy, Inc. | 5,183 | 195,969 | ||||||
| CMS Energy Corp. | 5,998 | 195,955 | ||||||
| FirstEnergy Corp. | 5,226 | 195,139 | ||||||
| Xcel Energy, Inc. | 5,824 | 194,929 | ||||||
| Public Service Enterprise Group, Inc. | 4,707 | 194,446 | ||||||
| NiSource, Inc. | 4,586 | 192,887 | ||||||
| Exelon Corp. | 5,270 | 192,829 | ||||||
| DTE Energy Co. | 2,346 | 192,747 | ||||||
| Questar Corp. | 7,958 | 191,867 | ||||||
| NextEra Energy, Inc. | 1,895 | 189,917 | ||||||
| Sempra Energy | 1,723 | 189,530 | ||||||
| Southern Co. | 4,085 | 189,381 | ||||||
| PPL Corp. | 5,401 | 188,981 | ||||||
Hawaiian Electric Industries, Inc.1 | 6,652 | 187,320 | ||||||
| Dominion Resources, Inc. | 2,619 | 186,735 | ||||||
| AGL Resources, Inc. | 3,458 | 186,421 | ||||||
| Calpine Corp.* | 8,113 | 185,139 | ||||||
| CenterPoint Energy, Inc. | 7,407 | 181,842 | ||||||
| MDU Resources Group, Inc. | 6,417 | 180,831 | ||||||
| Pepco Holdings, Inc. | 6,568 | 179,569 | ||||||
| OGE Energy Corp. | 4,814 | 179,514 | ||||||
| NRG Energy, Inc. | 5,954 | 178,501 | ||||||
| AES Corp. | 12,522 | 176,185 | ||||||
| National Fuel Gas Co. | 2,534 | 175,429 | ||||||
| Total Utilities | 8,674,838 | |||||||
| TECHNOLOGY - 8.3% | ||||||||
| Cerner Corp.* | 1,723 | 109,135 | ||||||
| First Solar, Inc.* | 1,828 | 107,669 | ||||||
| NetSuite, Inc.* | 975 | 105,944 | ||||||
| Veeva Systems, Inc. — Class A* | 3,533 | 105,213 | ||||||
| Allscripts Healthcare Solutions, Inc.* | 7,538 | 103,421 | ||||||
| Rackspace Hosting, Inc.* | 2,652 | 101,731 | ||||||
| Tableau Software, Inc. — Class A* | 1,201 | 99,191 | ||||||
| ServiceNow, Inc.* | 1,458 | 99,042 | ||||||
| Workday, Inc. — Class A* | 1,034 | 98,725 | ||||||
| athenahealth, Inc.* | 795 | 97,388 | ||||||
| salesforce.com, Inc.* | 1,519 | 97,201 | ||||||
| Electronic Arts, Inc.* | 2,371 | 97,140 | ||||||
| DST Systems, Inc. | 1,003 | 96,640 | ||||||
| SolarWinds, Inc.* | 2,012 | 95,671 | ||||||
| Informatica Corp.* | 2,672 | 95,284 | ||||||
| Apple, Inc. | 874 | 94,392 | ||||||
| SEE NOTES TO FINANCIAL STATEMENTS. | GUGGENHEIM ETFs ANNUAL REPORT | 49 |
SCHEDULE OF INVESTMENTS (continued) | October 31, 2014 |
GUGGENHEIM RUSSELL 1000® EQUAL WEIGHT ETF |
| Shares | Value | |||||||
| Cognizant Technology Solutions Corp. — Class A* | 1,928 | $ | 94,183 | |||||
| IPG Photonics Corp.* | 1,272 | 93,378 | ||||||
| Leidos Holdings, Inc. | 2,470 | 90,328 | ||||||
| Computer Sciences Corp. | 1,493 | 90,177 | ||||||
| VeriFone Systems, Inc.* | 2,418 | 90,095 | ||||||
| Autodesk, Inc.* | 1,562 | 89,877 | ||||||
| NVIDIA Corp. | 4,587 | 89,630 | ||||||
| Red Hat, Inc.* | 1,521 | 89,617 | ||||||
| Cadence Design Systems, Inc.* | 4,956 | 88,960 | ||||||
| ANSYS, Inc.* | 1,132 | 88,930 | ||||||
| Micron Technology, Inc.* | 2,684 | 88,814 | ||||||
| QUALCOMM, Inc. | 1,130 | 88,716 | ||||||
| PTC, Inc.* | 2,323 | 88,622 | ||||||
| Rovi Corp.* | 4,239 | 88,510 | ||||||
| CA, Inc. | 3,043 | 88,430 | ||||||
| Lam Research Corp. | 1,133 | 88,215 | ||||||
| Broadcom Corp. — Class A | 2,105 | 88,157 | ||||||
| Intuit, Inc. | 1,001 | 88,098 | ||||||
| Xilinx, Inc. | 1,980 | 88,070 | ||||||
| Adobe Systems, Inc.* | 1,253 | 87,860 | ||||||
| Texas Instruments, Inc. | 1,759 | 87,352 | ||||||
| Synopsys, Inc.* | 2,129 | 87,246 | ||||||
| Applied Materials, Inc. | 3,943 | 87,101 | ||||||
| Amdocs Ltd. | 1,832 | 87,093 | ||||||
| Riverbed Technology, Inc.* | 4,567 | 86,727 | ||||||
| Western Digital Corp. | 881 | 86,664 | ||||||
| Microsoft Corp. | 1,842 | 86,482 | ||||||
| Nuance Communications, Inc.* | 5,603 | 86,454 | ||||||
| NetApp, Inc. | 2,019 | 86,413 | ||||||
| Hewlett-Packard Co. | 2,408 | 86,399 | ||||||
| Concur Technologies, Inc.* | 672 | 86,231 | ||||||
| Teradata Corp.* | 2,033 | 86,037 | ||||||
| Skyworks Solutions, Inc. | 1,475 | 85,904 | ||||||
| Akamai Technologies, Inc.* | 1,421 | 85,686 | ||||||
| Oracle Corp. | 2,194 | 85,676 | ||||||
| SunEdison, Inc.* | 4,375 | 85,356 | ||||||
| Analog Devices, Inc. | 1,714 | 85,049 | ||||||
| Brocade Communications Systems, Inc. | 7,922 | 85,003 | ||||||
| Stratasys Ltd.* | 705 | 84,854 | ||||||
| Intel Corp. | 2,490 | 84,685 | ||||||
| EMC Corp. | 2,942 | 84,524 | ||||||
| KLA-Tencor Corp. | 1,066 | 84,374 | ||||||
| Diebold, Inc. | 2,378 | 84,252 | ||||||
| Avago Technologies Ltd. | 976 | 84,180 | ||||||
| Marvell Technology Group Ltd. | 6,193 | 83,234 | ||||||
| Freescale Semiconductor Ltd.* | 4,172 | 82,981 | ||||||
| Linear Technology Corp. | 1,921 | 82,296 | ||||||
| Altera Corp. | 2,388 | 82,076 | ||||||
| SanDisk Corp. | 871 | 81,996 | ||||||
| Maxim Integrated Products, Inc. | 2,791 | 81,888 | ||||||
| Activision Blizzard, Inc. | 4,045 | 80,698 | ||||||
| Teradyne, Inc. | 4,347 | 79,985 | ||||||
| Paychex, Inc. | 1,664 | 78,108 | ||||||
| Solera Holdings, Inc. | 1,501 | 77,977 | ||||||
| IMS Health Holdings, Inc.* | 3,215 | 77,964 | ||||||
| Atmel Corp.* | 10,482 | 77,776 | ||||||
| Citrix Systems, Inc.* | 1,206 | 77,461 | ||||||
| Microchip Technology, Inc. | 1,786 | 76,994 | ||||||
| VMware, Inc. — Class A* | 912 | 76,216 | ||||||
| ON Semiconductor Corp.* | 9,101 | 75,447 | ||||||
| IHS, Inc. — Class A* | 574 | 75,211 | ||||||
| Accenture plc — Class A | 919 | 74,549 | ||||||
| International Business Machines Corp. | 451 | 74,144 | ||||||
| Lexmark International, Inc. — Class A | 1,699 | 73,329 | ||||||
| Xerox Corp. | 5,485 | 72,841 | ||||||
| NCR Corp.* | 2,560 | 70,835 | ||||||
| Pitney Bowes, Inc. | 2,856 | 70,657 | ||||||
3D Systems Corp.*,1 | 1,776 | 67,133 | ||||||
Advanced Micro Devices, Inc.*,1 | 23,375 | 65,450 | ||||||
| Cree, Inc.* | 2,062 | 64,912 | ||||||
| Jack Henry & Associates, Inc. | 797 | 47,677 | ||||||
| Dun & Bradstreet Corp. | 385 | 47,282 | ||||||
| Fiserv, Inc.* | 680 | 47,246 | ||||||
| Broadridge Financial Solutions, Inc. | 1,060 | 46,566 | ||||||
| Fidelity National Information Services, Inc. | 777 | 45,369 | ||||||
| MSCI, Inc. — Class A | 945 | 44,094 | ||||||
| Total Technology | 7,712,588 | |||||||
| COMMUNICATIONS - 7.4% | ||||||||
| Telephone & Data Systems, Inc. | 7,292 | 186,967 | ||||||
| Level 3 Communications, Inc.* | 3,985 | 186,936 | ||||||
| tw telecom, Inc. — Class A* | 4,349 | 186,050 | ||||||
| CenturyLink, Inc. | 4,442 | 184,254 | ||||||
| T-Mobile US, Inc.* | 6,225 | 181,708 | ||||||
| United States Cellular Corp.* | 4,989 | 181,699 | ||||||
| Frontier Communications Corp. | 27,497 | 179,830 | ||||||
| Verizon Communications, Inc. | 3,567 | 179,242 | ||||||
| AT&T, Inc. | 5,047 | 175,837 | ||||||
Windstream Holdings, Inc.1 | 16,017 | 167,858 | ||||||
| Sprint Corp.* | 27,725 | 164,409 | ||||||
| Splunk, Inc.* | 1,563 | 103,283 | ||||||
| TIBCO Software, Inc.* | 4,373 | 102,197 | ||||||
| Yahoo!, Inc.* | 2,179 | 100,344 | ||||||
| LinkedIn Corp. — Class A* | 414 | 94,789 | ||||||
| Groupon, Inc. — Class A* | 12,901 | 94,305 | ||||||
| Palo Alto Networks, Inc.* | 879 | 92,910 | ||||||
| VeriSign, Inc.* | 1,529 | 91,373 | ||||||
FireEye, Inc.*,1 | 2,683 | 91,195 | ||||||
| JDS Uniphase Corp.* | 6,595 | 88,769 | ||||||
| Symantec Corp. | 3,574 | 88,707 | ||||||
| Fortinet, Inc.* | 3,386 | 88,205 | ||||||
| Harris Corp. | 1,264 | 87,975 | ||||||
| IAC/InterActiveCorp | 1,299 | 87,929 | ||||||
| Motorola Solutions, Inc. | 1,362 | 87,849 | ||||||
| F5 Networks, Inc.* | 712 | 87,562 | ||||||
| Corning, Inc. | 4,284 | 87,522 | ||||||
50 | GUGGENHEIM ETFs ANNUAL REPORT | SEE NOTES TO FINANCIAL STATEMENTS. |
SCHEDULE OF INVESTMENTS (continued) | October 31, 2014 |
GUGGENHEIM RUSSELL 1000® EQUAL WEIGHT ETF |
| Shares | Value | |||||||
| ARRIS Group, Inc.* | 2,915 | $ | 87,508 | |||||
| AOL, Inc.* | 1,982 | 86,276 | ||||||
| Equinix, Inc. | 413 | 86,276 | ||||||
| CDW Corp. | 2,794 | 86,167 | ||||||
| Cisco Systems, Inc. | 3,453 | 84,495 | ||||||
| Google, Inc. — Class C* | 148 | 82,744 | ||||||
| Facebook, Inc. — Class A* | 1,096 | 82,189 | ||||||
Arista Networks, Inc.*,1 | 1,010 | 82,063 | ||||||
| Google, Inc. — Class A* | 144 | 81,773 | ||||||
| Juniper Networks, Inc. | 3,826 | 80,614 | ||||||
| EchoStar Corp. — Class A* | 1,723 | 80,516 | ||||||
| CommScope Holding Company, Inc.* | 3,484 | 75,045 | ||||||
| Zynga, Inc. — Class A* | 28,716 | 73,226 | ||||||
| Yelp, Inc. — Class A* | 1,200 | 72,000 | ||||||
| Twitter, Inc.* | 1,645 | 68,218 | ||||||
| Liberty Ventures* | 1,788 | 62,759 | ||||||
| Priceline Group, Inc.* | 51 | 61,517 | ||||||
| Clear Channel Outdoor Holdings, Inc. — Class A | 8,184 | 59,415 | ||||||
| Interpublic Group of Companies, Inc. | 3,048 | 59,101 | ||||||
| HomeAway, Inc.* | 1,672 | 58,353 | ||||||
| Lamar Advertising Co. — Class A | 1,127 | 58,210 | ||||||
| Time Warner, Inc. | 730 | 58,013 | ||||||
| Gannett Company, Inc. | 1,839 | 57,929 | ||||||
| Cablevision Systems Corp. — Class A | 3,090 | 57,536 | ||||||
| Walt Disney Co. | 626 | 57,204 | ||||||
| Time Warner Cable, Inc. | 388 | 57,117 | ||||||
| AMC Networks, Inc. — Class A* | 941 | 57,071 | ||||||
| Omnicom Group, Inc. | 794 | 57,057 | ||||||
| Liberty Media Corp. — Class C* | 1,182 | 56,653 | ||||||
| Twenty-First Century Fox, Inc. — Class A | 1,640 | 56,547 | ||||||
| Liberty Media Corp. — Class A* | 1,177 | 56,520 | ||||||
| Comcast Corp. — Class A | 1,019 | 56,402 | ||||||
| John Wiley & Sons, Inc. — Class A | 961 | 56,113 | ||||||
| Charter Communications, Inc. — Class A* | 353 | 55,912 | ||||||
| DIRECTV* | 643 | 55,806 | ||||||
| CBS Corp. — Class B | 1,022 | 55,413 | ||||||
| eBay, Inc.* | 1,053 | 55,283 | ||||||
| Scripps Networks Interactive, Inc. — Class A | 712 | 54,995 | ||||||
| Expedia, Inc. | 647 | 54,976 | ||||||
| DISH Network Corp. — Class A* | 863 | 54,930 | ||||||
| Starz — Class A* | 1,768 | 54,632 | ||||||
| Sirius XM Holdings, Inc.* | 15,856 | 54,386 | ||||||
| TripAdvisor, Inc.* | 611 | 54,171 | ||||||
| Nielsen N.V. | 1,258 | 53,452 | ||||||
| Viacom, Inc. — Class B | 723 | 52,548 | ||||||
| Discovery Communications, Inc. — Class A* | 1,452 | 51,328 | ||||||
| Discovery Communications, Inc. — Class C* | 1,464 | 51,225 | ||||||
| News Corp. — Class A* | 3,309 | 51,223 | ||||||
| Netflix, Inc.* | 130 | 51,060 | ||||||
| Liberty Interactive Corp. — Class A* | 1,950 | 50,973 | ||||||
| Amazon.com, Inc.* | 166 | 50,706 | ||||||
| zulily, Inc. — Class A* | 1,386 | 50,423 | ||||||
| FactSet Research Systems, Inc. | 361 | 47,450 | ||||||
| Thomson Reuters Corp. | 1,213 | 45,148 | ||||||
| Pandora Media, Inc.* | 2,250 | 43,380 | ||||||
| Zillow, Inc. — Class A* | 364 | 39,578 | ||||||
| Total Communications | 6,891,329 | |||||||
| BASIC MATERIALS - 6.6% | ||||||||
| Domtar Corp. | 3,608 | 148,181 | ||||||
| Carpenter Technology Corp. | 2,820 | 141,140 | ||||||
| MeadWestvaco Corp. | 3,194 | 141,079 | ||||||
| Alcoa, Inc. | 8,395 | 140,700 | ||||||
| International Paper Co. | 2,744 | 138,901 | ||||||
| Sherwin-Williams Co. | 604 | 138,653 | ||||||
| International Flavors & Fragrances, Inc. | 1,373 | 136,133 | ||||||
| Valspar Corp. | 1,647 | 135,318 | ||||||
| PPG Industries, Inc. | 664 | 135,250 | ||||||
| WR Grace & Co.* | 1,428 | 135,089 | ||||||
| Platform Specialty Products Corp.* | 5,147 | 133,822 | ||||||
| Monsanto Co. | 1,163 | 133,791 | ||||||
| Ashland, Inc. | 1,232 | 133,142 | ||||||
| Air Products & Chemicals, Inc. | 982 | 132,237 | ||||||
| Sigma-Aldrich Corp. | 971 | 131,969 | ||||||
| Compass Minerals International, Inc. | 1,539 | 131,862 | ||||||
| Airgas, Inc. | 1,173 | 130,836 | ||||||
| NewMarket Corp. | 337 | 130,759 | ||||||
| Steel Dynamics, Inc. | 5,655 | 130,122 | ||||||
| FMC Corp. | 2,253 | 129,210 | ||||||
| Eastman Chemical Co. | 1,598 | 129,086 | ||||||
| Veritiv Corp.* | 2,857 | 128,879 | ||||||
Cliffs Natural Resources, Inc.1 | 11,471 | 128,819 | ||||||
| Rockwood Holdings, Inc. | 1,672 | 128,594 | ||||||
| Nucor Corp. | 2,378 | 128,555 | ||||||
| RPM International, Inc. | 2,835 | 128,426 | ||||||
| Cytec Industries, Inc. | 2,754 | 128,419 | ||||||
| Mosaic Co. | 2,889 | 128,012 | ||||||
| Southern Copper Corp. | 4,421 | 127,236 | ||||||
| EI du Pont de Nemours & Co. | 1,834 | 126,821 | ||||||
| Celanese Corp. — Class A | 2,158 | 126,739 | ||||||
| Reliance Steel & Aluminum Co. | 1,878 | 126,727 | ||||||
| CF Industries Holdings, Inc. | 485 | 126,100 | ||||||
| Albemarle Corp. | 2,157 | 125,926 | ||||||
| United States Steel Corp. | 3,140 | 125,726 | ||||||
| Ecolab, Inc. | 1,130 | 125,690 | ||||||
| Praxair, Inc. | 995 | 125,360 | ||||||
Rayonier Advanced Materials, Inc.1 | 4,306 | 122,850 | ||||||
Dow Chemical Co.2 | 2,466 | 121,820 | ||||||
| Huntsman Corp. | 4,923 | 120,121 | ||||||
| Cabot Corp. | 2,537 | 117,793 | ||||||
| Freeport-McMoRan, Inc. | 4,011 | 114,314 | ||||||
| Royal Gold, Inc. | 1,981 | 113,214 | ||||||
| Allegheny Technologies, Inc. | 3,381 | 111,066 | ||||||
| LyondellBasell Industries N.V. — Class A | 1,195 | 109,498 | ||||||
| Tahoe Resources, Inc.* | 6,306 | 109,472 | ||||||
| Westlake Chemical Corp. | 1,461 | 103,074 | ||||||
| SEE NOTES TO FINANCIAL STATEMENTS. | GUGGENHEIM ETFs ANNUAL REPORT | 51 |
SCHEDULE OF INVESTMENTS (concluded) | October 31, 2014 |
GUGGENHEIM RUSSELL 1000® EQUAL WEIGHT ETF |
| Shares | Value | |||||||
| Newmont Mining Corp. | 5,479 | $ | 102,786 | |||||
| Total Basic Materials | 6,119,317 | |||||||
| DIVERSIFIED - 0.1% | ||||||||
| Liberty TripAdvisor Holdings, Inc. — Class A* | 1,648 | 52,044 | ||||||
| Leucadia National Corp. | 1,813 | 43,113 | ||||||
| Total Diversified | 95,157 | |||||||
| Total Common Stocks | ||||||||
| (Cost $82,732,143) | 92,838,489 | |||||||
SHORT TERM INVESTMENTS† - 0.3% | ||||||||
| Federated U.S. Treasury Cash Reserve Fund | 248,755 | 248,755 | ||||||
| Total Short Term Investments | ||||||||
| (Cost $248,755) | 248,755 | |||||||
| Face Amount | ||||||||
SECURITIES LENDING COLLATERAL††, 2 - 2.7% | ||||||||
| Joint Repurchase Agreements | ||||||||
| HSBC Securities, Inc. issued 10/31/14 at 0.08% due 11/03/14 | $ | 1,602,911 | 1,602,911 | |||||
| BNP Paribas Securities Corp. issued 10/31/14 at 0.11% due 11/03/14 | 733,171 | 733,171 | ||||||
| Barclays Capital, Inc. issued 10/31/14 at 0.07% due 11/03/14 | 210,147 | 210,147 | ||||||
| Total Securities Lending Collateral | ||||||||
| (Cost $2,546,229) | 2,546,229 | |||||||
| Total Investments - 102.7% | ||||||||
| (Cost $85,527,127) | $ | 95,633,473 | ||||||
| Other Assets & Liabilities, net - (2.7)% | (2,496,555 | ) | ||||||
| Total Net Assets - 100.0% | $ | 93,136,918 | ||||||
| * | Non-income producing security. |
| † | Value determined based on Level 1 inputs — See Note 4. |
| †† | Value determined based on Level 2 inputs — See Note 4. |
| 1 | All or portion of this security is on loan at October 31, 2014 — See Note 5. |
| 2 | Securities lending collateral — See Note 5. |
| ADR — American Depositary Receipt | |
| plc — Public Limited Company | |
| REIT — Real Estate Investment Trust |
52 | GUGGENHEIM ETFs ANNUAL REPORT | SEE NOTES TO FINANCIAL STATEMENTS. |
| SCHEDULE OF INVESTMENTS | October 31, 2014 |
GUGGENHEIM RUSSELL 2000® EQUAL WEIGHT ETF |
| Shares | Value | |||||||
COMMON STOCKS† - 99.3% | ||||||||
| CONSUMER, NON-CYCLICAL - 25.0% | ||||||||
| USANA Health Sciences, Inc.* | 1,414 | $ | 161,168 | |||||
| National Beverage Corp.* | 5,162 | 129,670 | ||||||
| Seaboard Corp.* | 39 | 119,842 | ||||||
| Coca-Cola Bottling Company Consolidated | 1,317 | 119,109 | ||||||
| John B Sanfilippo & Son, Inc. | 3,069 | 114,014 | ||||||
| SpartanNash Co. | 5,080 | 113,843 | ||||||
| Omega Protein Corp.* | 7,834 | 113,201 | ||||||
| Boston Beer Company, Inc. — Class A* | 454 | 113,046 | ||||||
| Diamond Foods, Inc.* | 3,735 | 112,610 | ||||||
| Weis Markets, Inc. | 2,511 | 112,092 | ||||||
| Ingles Markets, Inc. — Class A | 4,156 | 111,796 | ||||||
| WD-40 Co. | 1,453 | 111,401 | ||||||
| Post Holdings, Inc.* | 2,970 | 111,375 | ||||||
| Snyder’s-Lance, Inc. | 3,708 | 110,461 | ||||||
| United Natural Foods, Inc.* | 1,617 | 109,988 | ||||||
| Calavo Growers, Inc. | 2,259 | 109,652 | ||||||
| J&J Snack Foods Corp. | 1,061 | 109,315 | ||||||
| Chefs’ Warehouse, Inc.* | 6,114 | 109,257 | ||||||
| TreeHouse Foods, Inc.* | 1,269 | 108,081 | ||||||
| Dean Foods Co. | 7,337 | 107,927 | ||||||
| Limoneira Co. | 4,151 | 106,515 | ||||||
| Lancaster Colony Corp. | 1,163 | 106,403 | ||||||
Fresh Market, Inc.*,1 | 2,896 | 106,312 | ||||||
Tootsie Roll Industries, Inc.1 | 3,585 | 106,295 | ||||||
| B&G Foods, Inc. | 3,578 | 105,408 | ||||||
| Chiquita Brands International, Inc.* | 7,101 | 102,467 | ||||||
| Andersons, Inc. | 1,607 | 102,414 | ||||||
| Cal-Maine Foods, Inc. | 1,146 | 100,607 | ||||||
| Fresh Del Monte Produce, Inc. | 3,103 | 99,637 | ||||||
| Vector Group Ltd. | 4,444 | 99,279 | ||||||
| Inventure Foods, Inc.* | 7,498 | 99,274 | ||||||
| Universal Corp. | 2,218 | 98,701 | ||||||
| Medifast, Inc.* | 3,026 | 96,045 | ||||||
| Sanderson Farms, Inc. | 1,139 | 95,653 | ||||||
| SUPERVALU, Inc.* | 11,022 | 95,120 | ||||||
| Seneca Foods Corp. — Class A* | 3,433 | 92,279 | ||||||
| Pendrell Corp.* | 50,265 | 83,942 | ||||||
| Boulder Brands, Inc.* | 7,381 | 65,543 | ||||||
Regulus Therapeutics, Inc.*,1 | 1,903 | 37,983 | ||||||
ITT Educational Services, Inc.*,1 | 3,301 | 33,373 | ||||||
| Senomyx, Inc.* | 3,954 | 31,316 | ||||||
| Immune Design Corp.* | 938 | 29,068 | ||||||
| Durata Therapeutics, Inc.* | 1,018 | 24,462 | ||||||
| Receptos, Inc.* | 216 | 22,388 | ||||||
Unilife Corp.*,1 | 5,964 | 21,888 | ||||||
| Paylocity Holding Corp.* | 888 | 21,756 | ||||||
| Esperion Therapeutics, Inc.* | 741 | 21,673 | ||||||
| ARC Document Solutions, Inc.* | 2,089 | 21,203 | ||||||
| Ardelyx, Inc.* | 958 | 21,009 | ||||||
| Agios Pharmaceuticals, Inc.* | 250 | 21,008 | ||||||
| Advisory Board Co.* | 386 | 20,717 | ||||||
| Corporate Executive Board Co. | 277 | 20,415 | ||||||
| Kforce, Inc. | 881 | 20,395 | ||||||
| CRA International, Inc.* | 669 | 20,070 | ||||||
| ACCO Brands Corp.* | 2,432 | 20,015 | ||||||
| ServiceSource International, Inc.* | 5,229 | 19,975 | ||||||
| Clovis Oncology, Inc.* | 334 | 19,926 | ||||||
| Hackett Group, Inc. | 2,826 | 19,810 | ||||||
| Ennis, Inc. | 1,334 | 19,783 | ||||||
| TriNet Group, Inc.* | 659 | 19,717 | ||||||
| Insperity, Inc. | 622 | 19,630 | ||||||
| FTI Consulting, Inc.* | 485 | 19,584 | ||||||
| Huron Consulting Group, Inc.* | 280 | 19,491 | ||||||
| CBIZ, Inc.* | 2,111 | 19,485 | ||||||
| SP Plus Corp.* | 888 | 19,376 | ||||||
| CDI Corp. | 1,127 | 19,373 | ||||||
| AMAG Pharmaceuticals, Inc.* | 586 | 19,345 | ||||||
| ICF International, Inc.* | 526 | 19,115 | ||||||
| Alder Biopharmaceuticals, Inc.* | 1,064 | 19,056 | ||||||
| MiMedx Group, Inc.* | 1,871 | 19,047 | ||||||
| Kelly Services, Inc. — Class A | 1,075 | 18,952 | ||||||
| Quad/Graphics, Inc. | 859 | 18,941 | ||||||
| Team, Inc.* | 448 | 18,879 | ||||||
| Navigant Consulting, Inc.* | 1,221 | 18,791 | ||||||
| Electro Rent Corp. | 1,230 | 18,745 | ||||||
| OvaScience, Inc.* | 954 | 18,632 | ||||||
| Korn/Ferry International* | 667 | 18,629 | ||||||
| Kite Pharma, Inc.* | 502 | 18,569 | ||||||
| Resources Connection, Inc. | 1,199 | 18,549 | ||||||
| Deluxe Corp. | 305 | 18,544 | ||||||
| On Assignment, Inc.* | 637 | 18,537 | ||||||
| Vistaprint N.V.* | 277 | 18,520 | ||||||
| Multi-Color Corp. | 375 | 18,488 | ||||||
| Great Lakes Dredge & Dock Corp.* | 2,643 | 18,475 | ||||||
| Civeo Corp. | 1,515 | 18,468 | ||||||
| Forrester Research, Inc. | 458 | 18,448 | ||||||
| Universal Technical Institute, Inc. | 1,539 | 18,329 | ||||||
| NewLink Genetics Corp.* | 557 | 18,187 | ||||||
| Cempra, Inc.* | 1,336 | 18,170 | ||||||
| RadNet, Inc.* | 1,953 | 18,163 | ||||||
| Pacific Biosciences of California, Inc.* | 2,760 | 18,106 | ||||||
| Ascent Capital Group, Inc. — Class A* | 281 | 18,068 | ||||||
| Novavax, Inc.* | 3,219 | 18,026 | ||||||
| Sage Therapeutics, Inc.* | 460 | 17,995 | ||||||
| ABM Industries, Inc. | 648 | 17,911 | ||||||
| Bio-Path Holdings, Inc.* | 6,128 | 17,894 | ||||||
| PHH Corp.* | 755 | 17,886 | ||||||
| McGrath RentCorp | 489 | 17,863 | ||||||
| Viad Corp. | 698 | 17,806 | ||||||
| Strayer Education, Inc.* | 243 | 17,785 | ||||||
| Foundation Medicine, Inc.* | 684 | 17,702 | ||||||
| Healthcare Services Group, Inc. | 593 | 17,660 | ||||||
| Achaogen, Inc.* | 1,662 | 17,650 | ||||||
| ABIOMED, Inc.* | 537 | 17,608 | ||||||
| SEE NOTES TO FINANCIAL STATEMENTS. | GUGGENHEIM ETFs ANNUAL REPORT | 53 |
SCHEDULE OF INVESTMENTS (continued) | October 31, 2014 |
GUGGENHEIM RUSSELL 2000® EQUAL WEIGHT ETF |
| Shares | Value | |||||||
| Performant Financial Corp.* | 2,028 | $ | 17,502 | |||||
| Heidrick & Struggles International, Inc. | 839 | 17,468 | ||||||
| Repligen Corp.* | 691 | 17,427 | ||||||
| Liberty Tax, Inc.* | 458 | 17,354 | ||||||
| Aerie Pharmaceuticals, Inc.* | 688 | 17,351 | ||||||
| Adeptus Health, Inc. — Class A* | 522 | 17,320 | ||||||
| Sucampo Pharmaceuticals, Inc. — Class A* | 2,009 | 17,318 | ||||||
| Stemline Therapeutics, Inc.* | 1,125 | 17,314 | ||||||
| Lannett Company, Inc.* | 305 | 17,300 | ||||||
| Acceleron Pharma, Inc.* | 466 | 17,233 | ||||||
| Omeros Corp.* | 1,039 | 17,216 | ||||||
| GenMark Diagnostics, Inc.* | 1,510 | 17,214 | ||||||
| Collectors Universe, Inc. | 698 | 17,171 | ||||||
| CSS Industries, Inc. | 600 | 17,136 | ||||||
Keryx Biopharmaceuticals, Inc.*,1 | 1,016 | 17,120 | ||||||
| Hill International, Inc.* | 4,407 | 17,099 | ||||||
Exact Sciences Corp.*,1 | 710 | 17,090 | ||||||
| Invacare Corp. | 1,085 | 17,045 | ||||||
| Amedisys, Inc.* | 652 | 17,016 | ||||||
| AngioDynamics, Inc.* | 1,000 | 17,001 | ||||||
| LifeLock, Inc.* | 1,004 | 16,978 | ||||||
| Pernix Therapeutics Holdings, Inc.* | 1,737 | 16,936 | ||||||
| Merit Medical Systems, Inc.* | 1,114 | 16,877 | ||||||
| TrueBlue, Inc.* | 681 | 16,834 | ||||||
| XenoPort, Inc.* | 2,474 | 16,774 | ||||||
| Grand Canyon Education, Inc.* | 350 | 16,765 | ||||||
| Genomic Health, Inc.* | 460 | 16,716 | ||||||
| Capella Education Co. | 236 | 16,695 | ||||||
| RPX Corp.* | 1,186 | 16,663 | ||||||
| OraSure Technologies, Inc.* | 1,853 | 16,584 | ||||||
| Cantel Medical Corp. | 391 | 16,578 | ||||||
| Accelerate Diagnostics, Inc.* | 763 | 16,572 | ||||||
ZIOPHARM Oncology, Inc.*,1 | 4,985 | 16,550 | ||||||
| Career Education Corp.* | 2,850 | 16,530 | ||||||
| Helen of Troy Ltd.* | 267 | 16,514 | ||||||
| Akorn, Inc.* | 369 | 16,439 | ||||||
| Tetraphase Pharmaceuticals, Inc.* | 685 | 16,372 | ||||||
| Darling Ingredients, Inc.* | 928 | 16,333 | ||||||
| Acadia Healthcare Company, Inc.* | 263 | 16,319 | ||||||
Synergy Pharmaceuticals, Inc.*,1 | 4,754 | 16,306 | ||||||
| Vascular Solutions, Inc.* | 554 | 16,293 | ||||||
| American Public Education, Inc.* | 524 | 16,239 | ||||||
| ExamWorks Group, Inc.* | 418 | 16,210 | ||||||
| Carriage Services, Inc. — Class A | 810 | 16,167 | ||||||
| ANI Pharmaceuticals, Inc.* | 476 | 16,165 | ||||||
| AtriCure, Inc.* | 926 | 16,149 | ||||||
| Cross Country Healthcare, Inc.* | 1,670 | 16,149 | ||||||
| Cellular Dynamics International, Inc.* | 2,078 | 16,146 | ||||||
| Sotheby’s | 407 | 16,142 | ||||||
| Intersect ENT, Inc.* | 850 | 16,142 | ||||||
| Anacor Pharmaceuticals, Inc.* | 548 | 16,117 | ||||||
| Masimo Corp.* | 638 | 16,103 | ||||||
| HMS Holdings Corp.* | 693 | 16,098 | ||||||
| ChemoCentryx, Inc.* | 2,861 | 16,079 | ||||||
| Cepheid* | 303 | 16,062 | ||||||
| Cardiovascular Systems, Inc.* | 518 | 16,058 | ||||||
NanoViricides, Inc.*,1 | 4,214 | 16,055 | ||||||
| BioSpecifics Technologies Corp.* | 400 | 16,048 | ||||||
| US Physical Therapy, Inc. | 371 | 16,009 | ||||||
| Corcept Therapeutics, Inc.* | 4,912 | 15,964 | ||||||
| Auspex Pharmaceuticals, Inc.* | 589 | 15,962 | ||||||
| SurModics, Inc.* | 737 | 15,956 | ||||||
| Natus Medical, Inc.* | 469 | 15,946 | ||||||
| Impax Laboratories, Inc.* | 550 | 15,933 | ||||||
| Dyax Corp.* | 1,288 | 15,933 | ||||||
| K2M Group Holdings, Inc.* | 988 | 15,907 | ||||||
| BioTelemetry, Inc.* | 1,895 | 15,899 | ||||||
| National Research Corp. — Class A* | 996 | 15,826 | ||||||
| Bridgepoint Education, Inc.* | 1,252 | 15,825 | ||||||
| Tandem Diabetes Care, Inc.* | 985 | 15,819 | ||||||
| Celldex Therapeutics, Inc.* | 943 | 15,795 | ||||||
| Inogen, Inc.* | 668 | 15,771 | ||||||
| Monro Muffler Brake, Inc. | 295 | 15,765 | ||||||
| Spectranetics Corp.* | 496 | 15,758 | ||||||
| Intrexon Corp.* | 706 | 15,758 | ||||||
| Bluebird Bio, Inc.* | 375 | 15,746 | ||||||
| Phibro Animal Health Corp. — Class A | 607 | 15,734 | ||||||
| NxStage Medical, Inc.* | 1,035 | 15,691 | ||||||
| POZEN, Inc. | 1,728 | 15,673 | ||||||
| Intra-Cellular Therapies, Inc.* | 1,011 | 15,671 | ||||||
| NutriSystem, Inc. | 930 | 15,661 | ||||||
| Select Medical Holdings Corp. | 1,084 | 15,631 | ||||||
| Greatbatch, Inc.* | 311 | 15,609 | ||||||
| Potbelly Corp.* | 1,223 | 15,605 | ||||||
| Synageva BioPharma Corp.* | 206 | 15,602 | ||||||
| Revlon, Inc. — Class A* | 454 | 15,573 | ||||||
Merrimack Pharmaceuticals, Inc.*,1 | 1,698 | 15,571 | ||||||
| Tornier N.V.* | 557 | 15,568 | ||||||
| Utah Medical Products, Inc. | 274 | 15,563 | ||||||
| Cynosure, Inc. — Class A* | 615 | 15,553 | ||||||
| NuVasive, Inc.* | 380 | 15,542 | ||||||
| OncoMed Pharmaceuticals, Inc.* | 747 | 15,515 | ||||||
| Insulet Corp.* | 359 | 15,498 | ||||||
Peregrine Pharmaceuticals, Inc.*,1 | 9,681 | 15,490 | ||||||
| West Pharmaceutical Services, Inc. | 302 | 15,478 | ||||||
| Immunomedics, Inc.* | 3,918 | 15,476 | ||||||
| Gentiva Health Services, Inc.* | 785 | 15,465 | ||||||
| PharMerica Corp.* | 539 | 15,464 | ||||||
| Universal American Corp.* | 1,657 | 15,443 | ||||||
| PRGX Global, Inc.* | 2,918 | 15,436 | ||||||
| Dynavax Technologies Corp.* | 9,408 | 15,429 | ||||||
| Inter Parfums, Inc. | 543 | 15,421 | ||||||
| Bright Horizons Family Solutions, Inc.* | 346 | 15,418 | ||||||
| Central Garden and Pet Co. — Class A* | 1,788 | 15,359 | ||||||
| CONMED Corp. | 365 | 15,326 | ||||||
| Ligand Pharmaceuticals, Inc. — Class B* | 277 | 15,310 | ||||||
54 | GUGGENHEIM ETFs ANNUAL REPORT | SEE NOTES TO FINANCIAL STATEMENTS. |
SCHEDULE OF INVESTMENTS (continued) | October 31, 2014 |
GUGGENHEIM RUSSELL 2000® EQUAL WEIGHT ETF |
| Shares | Value | |||||||
| Surgical Care Affiliates, Inc.* | 499 | $ | 15,309 | |||||
| Triple-S Management Corp. — Class B* | 691 | 15,299 | ||||||
| Isis Pharmaceuticals, Inc.* | 332 | 15,292 | ||||||
| Xencor, Inc.* | 1,414 | 15,257 | ||||||
| Zeltiq Aesthetics, Inc.* | 592 | 15,179 | ||||||
| PDL BioPharma, Inc. | 1,779 | 15,175 | ||||||
| Analogic Corp. | 208 | 15,172 | ||||||
| Neurocrine Biosciences, Inc.* | 817 | 15,131 | ||||||
| STERIS Corp. | 244 | 15,079 | ||||||
| AMN Healthcare Services, Inc.* | 879 | 15,075 | ||||||
| Globus Medical, Inc. — Class A* | 679 | 15,053 | ||||||
| Avanir Pharmaceuticals, Inc. — Class A* | 1,163 | 15,049 | ||||||
| Molina Healthcare, Inc.* | 309 | 15,030 | ||||||
| Ensign Group, Inc. | 388 | 15,023 | ||||||
| HealthEquity, Inc.* | 736 | 15,014 | ||||||
| Insys Therapeutics, Inc.* | 369 | 15,009 | ||||||
Ampio Pharmaceuticals, Inc.*,1 | 3,861 | 14,981 | ||||||
| Hanger, Inc.* | 626 | 14,980 | ||||||
| ICU Medical, Inc.* | 211 | 14,960 | ||||||
| WellCare Health Plans, Inc.* | 220 | 14,931 | ||||||
| Affymetrix, Inc.* | 1,657 | 14,930 | ||||||
| LDR Holding Corp.* | 433 | 14,913 | ||||||
| Kindred Healthcare, Inc. | 685 | 14,899 | ||||||
| IGI Laboratories, Inc.* | 1,518 | 14,891 | ||||||
| Matthews International Corp. — Class A | 323 | 14,884 | ||||||
| Actinium Pharmaceuticals, Inc.* | 2,104 | 14,875 | ||||||
| Flexion Therapeutics, Inc.* | 759 | 14,869 | ||||||
| Vanda Pharmaceuticals, Inc.* | 1,238 | 14,868 | ||||||
CytRx Corp.*,1 | 5,198 | 14,866 | ||||||
| Rent-A-Center, Inc. | 480 | 14,866 | ||||||
Alimera Sciences, Inc.*,1 | 2,604 | 14,843 | ||||||
| Tumi Holdings, Inc.* | 713 | 14,809 | ||||||
| Brink’s Co. | 705 | 14,805 | ||||||
| Five Star Quality Care, Inc.* | 3,582 | 14,793 | ||||||
| DexCom, Inc.* | 329 | 14,789 | ||||||
| Derma Sciences, Inc.* | 1,625 | 14,788 | ||||||
| ARIAD Pharmaceuticals, Inc.* | 2,479 | 14,775 | ||||||
| SciClone Pharmaceuticals, Inc.* | 1,933 | 14,768 | ||||||
| BioCryst Pharmaceuticals, Inc.* | 1,260 | 14,767 | ||||||
| Capital Senior Living Corp.* | 655 | 14,738 | ||||||
| Haemonetics Corp.* | 390 | 14,711 | ||||||
| Cambrex Corp.* | 697 | 14,693 | ||||||
| TESARO, Inc.* | 528 | 14,689 | ||||||
| Medicines Co.* | 579 | 14,660 | ||||||
Exelixis, Inc.*,1 | 8,619 | 14,652 | ||||||
| Magellan Health, Inc.* | 242 | 14,646 | ||||||
| Nektar Therapeutics* | 1,060 | 14,617 | ||||||
| Care.com, Inc.* | 1,760 | 14,608 | ||||||
| HealthSouth Corp. | 362 | 14,599 | ||||||
| MacroGenics, Inc.* | 685 | 14,584 | ||||||
| Amsurg Corp. — Class A* | 270 | 14,583 | ||||||
| Aratana Therapeutics, Inc.* | 1,301 | 14,571 | ||||||
| Ophthotech Corp.* | 349 | 14,560 | ||||||
| Chimerix, Inc.* | 469 | 14,558 | ||||||
| Cara Therapeutics, Inc.* | 1,615 | 14,551 | ||||||
Navidea Biopharmaceuticals, Inc.*,1 | 10,774 | 14,545 | ||||||
| Sangamo BioSciences, Inc.* | 1,198 | 14,544 | ||||||
| Inovio Pharmaceuticals, Inc.* | 1,280 | 14,541 | ||||||
| Atrion Corp. | 44 | 14,520 | ||||||
| Zafgen, Inc.* | 681 | 14,505 | ||||||
| Zogenix, Inc.* | 11,418 | 14,501 | ||||||
| Five Prime Therapeutics, Inc.* | 1,112 | 14,500 | ||||||
BioTime, Inc.*,1 | 4,268 | 14,469 | ||||||
| Franklin Covey Co.* | 737 | 14,453 | ||||||
| Enanta Pharmaceuticals, Inc.* | 336 | 14,448 | ||||||
| Addus HomeCare Corp.* | 727 | 14,445 | ||||||
| Portola Pharmaceuticals, Inc.* | 506 | 14,421 | ||||||
| Karyopharm Therapeutics, Inc.* | 351 | 14,419 | ||||||
| Quidel Corp.* | 505 | 14,418 | ||||||
| National Healthcare Corp. | 239 | 14,414 | ||||||
| Ironwood Pharmaceuticals, Inc. — Class A* | 1,028 | 14,413 | ||||||
| ACADIA Pharmaceuticals, Inc.* | 520 | 14,404 | ||||||
| Achillion Pharmaceuticals, Inc.* | 1,223 | 14,370 | ||||||
| Neogen Corp.* | 327 | 14,355 | ||||||
Galectin Therapeutics, Inc.*,1 | 2,645 | 14,336 | ||||||
| Bio-Reference Laboratories, Inc.* | 477 | 14,329 | ||||||
Cerus Corp.*,1 | 3,443 | 14,323 | ||||||
| Team Health Holdings, Inc.* | 229 | 14,322 | ||||||
| Osiris Therapeutics, Inc.* | 1,050 | 14,312 | ||||||
| Verastem, Inc.* | 1,508 | 14,311 | ||||||
| Anika Therapeutics, Inc.* | 356 | 14,290 | ||||||
Sequenom, Inc.*,1 | 4,366 | 14,277 | ||||||
| KYTHERA Biopharmaceuticals, Inc.* | 404 | 14,241 | ||||||
| Sagent Pharmaceuticals, Inc.* | 450 | 14,238 | ||||||
| Almost Family, Inc.* | 483 | 14,220 | ||||||
Idera Pharmaceuticals, Inc.*,1 | 5,566 | 14,193 | ||||||
| Landauer, Inc. | 396 | 14,173 | ||||||
| Prestige Brands Holdings, Inc.* | 400 | 14,168 | ||||||
| Auxilium Pharmaceuticals, Inc.* | 440 | 14,155 | ||||||
| SFX Entertainment, Inc.* | 2,752 | 14,145 | ||||||
| Otonomy, Inc.* | 536 | 14,124 | ||||||
| Insmed, Inc.* | 995 | 14,119 | ||||||
| Applied Genetic Technologies Corp.* | 702 | 14,110 | ||||||
Arena Pharmaceuticals, Inc.*,1 | 3,235 | 14,105 | ||||||
| Emergent Biosolutions, Inc.* | 623 | 14,092 | ||||||
| Catalent, Inc.* | 541 | 14,082 | ||||||
| BioDelivery Sciences International, Inc.* | 809 | 14,077 | ||||||
| Geron Corp.* | 6,302 | 14,053 | ||||||
| Antares Pharma, Inc.* | 6,781 | 14,037 | ||||||
| Albany Molecular Research, Inc.* | 603 | 14,026 | ||||||
| Elizabeth Arden, Inc.* | 853 | 13,989 | ||||||
| Cyberonics, Inc.* | 266 | 13,965 | ||||||
| Abaxis, Inc. | 265 | 13,955 | ||||||
| Enzo Biochem, Inc.* | 2,661 | 13,890 | ||||||
| Heron Therapeutics, Inc.* | 1,574 | 13,883 | ||||||
| TransEnterix, Inc.* | 3,382 | 13,866 | ||||||
| SEE NOTES TO FINANCIAL STATEMENTS. | GUGGENHEIM ETFs ANNUAL REPORT | 55 |
SCHEDULE OF INVESTMENTS (continued) | October 31, 2014 |
GUGGENHEIM RUSSELL 2000® EQUAL WEIGHT ETF |
| Shares | Value | |||||||
| Oxford Immunotec Global plc* | 897 | $ | 13,850 | |||||
Weight Watchers International, Inc.1 | 531 | 13,833 | ||||||
| LHC Group, Inc.* | 568 | 13,831 | ||||||
| Roka Bioscience, Inc.* | 1,393 | 13,791 | ||||||
| Meridian Bioscience, Inc. | 743 | 13,775 | ||||||
| Agenus, Inc.* | 4,607 | 13,729 | ||||||
Northwest Biotherapeutics, Inc.*,1 | 2,609 | 13,723 | ||||||
| Depomed, Inc.* | 890 | 13,706 | ||||||
| Thoratec Corp.* | 504 | 13,699 | ||||||
Organovo Holdings, Inc.*,1 | 2,091 | 13,675 | ||||||
| Ocular Therapeutix, Inc.* | 894 | 13,652 | ||||||
| Avalanche Biotechnologies, Inc.* | 379 | 13,599 | ||||||
| Integra LifeSciences Holdings Corp.* | 266 | 13,595 | ||||||
| Cytokinetics, Inc.* | 3,701 | 13,583 | ||||||
| ZS Pharma, Inc.* | 361 | 13,581 | ||||||
| Wright Medical Group, Inc.* | 429 | 13,565 | ||||||
| CryoLife, Inc. | 1,321 | 13,553 | ||||||
| TriVascular Technologies, Inc.* | 1,022 | 13,542 | ||||||
| Owens & Minor, Inc. | 406 | 13,528 | ||||||
| Lexicon Pharmaceuticals, Inc.* | 9,277 | 13,452 | ||||||
| Chemed Corp. | 130 | 13,437 | ||||||
| Revance Therapeutics, Inc.* | 665 | 13,406 | ||||||
| XOMA Corp.* | 3,121 | 13,389 | ||||||
| RTI Surgical, Inc.* | 2,630 | 13,387 | ||||||
| NPS Pharmaceuticals, Inc.* | 488 | 13,371 | ||||||
| Symmetry Medical, Inc.* | 1,349 | 13,355 | ||||||
| Halozyme Therapeutics, Inc.* | 1,387 | 13,343 | ||||||
| Infinity Pharmaceuticals, Inc.* | 979 | 13,334 | ||||||
| Epizyme, Inc.* | 502 | 13,318 | ||||||
| Skilled Healthcare Group, Inc. — Class A* | 1,919 | 13,299 | ||||||
| Versartis, Inc.* | 665 | 13,240 | ||||||
| HeartWare International, Inc.* | 171 | 13,188 | ||||||
AcelRx Pharmaceuticals, Inc.*,1 | 1,988 | 13,180 | ||||||
| Luminex Corp.* | 693 | 13,167 | ||||||
| Prothena Corporation plc* | 600 | 13,158 | ||||||
CTI BioPharma Corp.*,1 | 5,387 | 13,144 | ||||||
| CorVel Corp.* | 381 | 13,114 | ||||||
| Acorda Therapeutics, Inc.* | 376 | 13,092 | ||||||
| Pacira Pharmaceuticals, Inc.* | 141 | 13,088 | ||||||
| Relypsa, Inc.* | 636 | 13,083 | ||||||
| TG Therapeutics, Inc.* | 1,190 | 13,078 | ||||||
OPKO Health, Inc.*,1 | 1,566 | 13,076 | ||||||
| Momenta Pharmaceuticals, Inc.* | 1,195 | 13,037 | ||||||
Ohr Pharmaceutical, Inc.*,1 | 1,798 | 13,036 | ||||||
| Puma Biotechnology, Inc.* | 52 | 13,031 | ||||||
| Rigel Pharmaceuticals, Inc.* | 6,581 | 13,030 | ||||||
| Alliance HealthCare Services, Inc.* | 540 | 13,030 | ||||||
| Genocea Biosciences, Inc.* | 1,484 | 13,030 | ||||||
MannKind Corp.*,1 | 2,165 | 13,012 | ||||||
| Orthofix International N.V.* | 443 | 13,002 | ||||||
| Supernus Pharmaceuticals, Inc.* | 1,610 | 12,928 | ||||||
Galena Biopharma, Inc.*,1 | 6,302 | 12,919 | ||||||
| Kindred Biosciences, Inc.* | 1,405 | 12,884 | ||||||
| Healthways, Inc.* | 829 | 12,849 | ||||||
| Hyperion Therapeutics, Inc.* | 524 | 12,733 | ||||||
Rockwell Medical, Inc.*,1 | 1,460 | 12,731 | ||||||
| Providence Service Corp.* | 288 | 12,724 | ||||||
| NeoStem, Inc.* | 2,469 | 12,666 | ||||||
Raptor Pharmaceutical Corp.*,1 | 1,316 | 12,647 | ||||||
| Mirati Therapeutics, Inc.* | 753 | 12,628 | ||||||
| Array BioPharma, Inc.* | 3,516 | 12,622 | ||||||
| Eleven Biotherapeutics, Inc.* | 1,193 | 12,598 | ||||||
| Radius Health, Inc.* | 684 | 12,592 | ||||||
| NanoString Technologies, Inc.* | 1,179 | 12,556 | ||||||
| Progenics Pharmaceuticals, Inc.* | 2,599 | 12,553 | ||||||
| Exactech, Inc.* | 589 | 12,546 | ||||||
| IPC The Hospitalist Company, Inc.* | 301 | 12,540 | ||||||
| TherapeuticsMD, Inc.* | 2,824 | 12,539 | ||||||
| Vital Therapies, Inc.* | 724 | 12,496 | ||||||
| BioScrip, Inc.* | 1,919 | 12,397 | ||||||
| Spectrum Pharmaceuticals, Inc.* | 1,635 | 12,393 | ||||||
| Volcano Corp.* | 1,221 | 12,357 | ||||||
| Cenveo, Inc.* | 5,411 | 12,337 | ||||||
| PTC Therapeutics, Inc.* | 300 | 12,261 | ||||||
| Loxo Oncology, Inc.* | 1,132 | 12,214 | ||||||
| Retrophin, Inc.* | 1,260 | 12,197 | ||||||
| Theravance, Inc. | 753 | 12,063 | ||||||
| Monster Worldwide, Inc.* | 3,109 | 12,001 | ||||||
| T2 Biosystems, Inc.* | 743 | 11,999 | ||||||
| Adamas Pharmaceuticals, Inc.* | 785 | 11,956 | ||||||
Orexigen Therapeutics, Inc.*,1 | 2,936 | 11,920 | ||||||
| Synta Pharmaceuticals Corp.* | 4,000 | 11,840 | ||||||
| Oncothyreon, Inc.* | 6,549 | 11,788 | ||||||
| STAAR Surgical Co.* | 1,220 | 11,675 | ||||||
| PAREXEL International Corp.* | 212 | 11,514 | ||||||
| Endologix, Inc.* | 1,008 | 11,491 | ||||||
| Accuray, Inc.* | 1,813 | 11,476 | ||||||
| ImmunoGen, Inc.* | 1,235 | 11,436 | ||||||
| Air Methods Corp.* | 239 | 11,288 | ||||||
| Amphastar Pharmaceuticals, Inc.* | 1,113 | 11,286 | ||||||
Neuralstem, Inc.*,1 | 4,073 | 11,201 | ||||||
| Ultragenyx Pharmaceutical, Inc.* | 238 | 11,188 | ||||||
| Veracyte, Inc.* | 1,372 | 11,072 | ||||||
| K12, Inc.* | 878 | 10,887 | ||||||
| VIVUS, Inc.* | 3,173 | 10,756 | ||||||
| Endocyte, Inc.* | 1,791 | 10,719 | ||||||
| Tree.com, Inc.* | 286 | 10,579 | ||||||
| Euronet Worldwide, Inc.* | 194 | 10,412 | ||||||
| Threshold Pharmaceuticals, Inc.* | 3,553 | 10,410 | ||||||
| Cardtronics, Inc.* | 265 | 10,173 | ||||||
Cytori Therapeutics, Inc.*,1 | 19,557 | 10,150 | ||||||
| Barrett Business Services, Inc. | 428 | 10,062 | ||||||
| Heartland Payment Systems, Inc. | 194 | 10,020 | ||||||
| Information Services Group, Inc.* | 2,368 | 10,017 | ||||||
| Green Dot Corp. — Class A* | 419 | 10,014 | ||||||
| Theravance Biopharma, Inc.* | 546 | 9,992 | ||||||
56 | GUGGENHEIM ETFs ANNUAL REPORT | SEE NOTES TO FINANCIAL STATEMENTS. |
SCHEDULE OF INVESTMENTS (continued) | October 31, 2014 |
GUGGENHEIM RUSSELL 2000® EQUAL WEIGHT ETF |
| Shares | Value | |||||||
| Tejon Ranch Co.* | 329 | $ | 9,929 | |||||
| Sarepta Therapeutics, Inc.* | 605 | 9,783 | ||||||
| Dicerna Pharmaceuticals, Inc.* | 1,043 | 9,773 | ||||||
| Global Cash Access Holdings, Inc.* | 1,335 | 9,732 | ||||||
| WEX, Inc.* | 85 | 9,653 | ||||||
| Repros Therapeutics, Inc.* | 1,491 | 9,453 | ||||||
| EVERTEC, Inc. | 413 | 9,375 | ||||||
Dendreon Corp.*,1 | 9,088 | 8,902 | ||||||
| Aegerion Pharmaceuticals, Inc.* | 412 | 8,318 | ||||||
| Akebia Therapeutics, Inc.* | 621 | 8,048 | ||||||
| Xoom Corp.* | 423 | 6,387 | ||||||
| Pain Therapeutics, Inc.* | 3,640 | 6,334 | ||||||
| MoneyGram International, Inc.* | 701 | 6,029 | ||||||
| Arrowhead Research Corp.* | 892 | 5,816 | ||||||
| Sunesis Pharmaceuticals, Inc.* | 1,800 | 3,060 | ||||||
| Total Consumer, Non-cyclical | 10,103,677 | |||||||
| INDUSTRIAL - 13.4% | ||||||||
| Handy & Harman Ltd.* | 1,404 | 49,575 | ||||||
| PowerSecure International, Inc.* | 3,900 | 43,563 | ||||||
| Trex Company, Inc.* | 1,009 | 43,386 | ||||||
| Boise Cascade Co.* | 1,177 | 42,443 | ||||||
| Mueller Water Products, Inc. — Class A | 4,282 | 42,263 | ||||||
| LSI Industries, Inc. | 5,783 | 41,406 | ||||||
| LB Foster Co. — Class A | 759 | 41,053 | ||||||
| AEP Industries, Inc.* | 890 | 40,931 | ||||||
| Chase Corp. | 1,141 | 40,928 | ||||||
| Universal Forest Products, Inc. | 818 | 40,875 | ||||||
| Insteel Industries, Inc. | 1,696 | 40,433 | ||||||
| AAON, Inc. | 2,038 | 40,047 | ||||||
| Mueller Industries, Inc. | 1,232 | 39,991 | ||||||
| Comfort Systems USA, Inc. | 2,585 | 39,706 | ||||||
| Simpson Manufacturing Company, Inc. | 1,200 | 39,696 | ||||||
| Nortek, Inc.* | 472 | 39,308 | ||||||
| Era Group, Inc.* | 1,678 | 39,249 | ||||||
| Belden, Inc. | 549 | 39,083 | ||||||
| Polypore International, Inc.* | 884 | 38,825 | ||||||
| Quanex Building Products Corp. | 1,939 | 38,819 | ||||||
| Advanced Drainage Systems, Inc.* | 1,763 | 38,504 | ||||||
| Apogee Enterprises, Inc. | 873 | 38,324 | ||||||
| Ampco-Pittsburgh Corp. | 1,737 | 37,849 | ||||||
| Berry Plastics Group, Inc.* | 1,446 | 37,625 | ||||||
| Patrick Industries, Inc.* | 873 | 37,295 | ||||||
| Rexnord Corp.* | 1,262 | 37,292 | ||||||
| Gibraltar Industries, Inc.* | 2,428 | 37,027 | ||||||
| RBC Bearings, Inc. | 609 | 36,997 | ||||||
| Builders FirstSource, Inc.* | 6,217 | 36,867 | ||||||
| LSB Industries, Inc.* | 980 | 36,779 | ||||||
| Griffon Corp. | 2,989 | 36,735 | ||||||
Capstone Turbine Corp.*,1 | 36,730 | 36,730 | ||||||
| Continental Building Products, Inc.* | 2,490 | 36,703 | ||||||
| Northwest Pipe Co.* | 1,024 | 36,639 | ||||||
| Headwaters, Inc.* | 2,882 | 36,601 | ||||||
| Ply Gem Holdings, Inc.* | 3,209 | 36,422 | ||||||
| Tredegar Corp. | 1,909 | 36,309 | ||||||
| Louisiana-Pacific Corp.* | 2,469 | 36,047 | ||||||
| NCI Building Systems, Inc.* | 1,813 | 36,024 | ||||||
| UFP Technologies, Inc.* | 1,630 | 35,893 | ||||||
| PGT, Inc.* | 3,715 | 34,940 | ||||||
| Graphic Packaging Holding Co.* | 2,871 | 34,825 | ||||||
| Haynes International, Inc. | 747 | 34,728 | ||||||
| NN, Inc. | 1,375 | 34,375 | ||||||
| US Concrete, Inc.* | 1,391 | 34,358 | ||||||
| Masonite International Corp.* | 634 | 34,274 | ||||||
| Dynamic Materials Corp. | 1,875 | 34,144 | ||||||
| Stock Building Supply Holdings, Inc.* | 2,172 | 34,079 | ||||||
| Global Brass & Copper Holdings, Inc. | 2,433 | 34,062 | ||||||
Nordic American Offshore Ltd.1 | 2,114 | 33,823 | ||||||
| Olympic Steel, Inc. | 1,658 | 33,359 | ||||||
| RTI International Metals, Inc.* | 1,416 | 33,347 | ||||||
| Hornbeck Offshore Services, Inc.* | 1,054 | 32,316 | ||||||
| Trinseo S.A.* | 2,104 | 30,403 | ||||||
| Myers Industries, Inc. | 1,984 | 29,641 | ||||||
| Vicor Corp.* | 1,883 | 25,628 | ||||||
| Mesa Laboratories, Inc. | 299 | 22,834 | ||||||
| PAM Transportation Services, Inc.* | 504 | 21,662 | ||||||
| Columbus McKinnon Corp. | 761 | 21,650 | ||||||
| TriMas Corp.* | 683 | 21,624 | ||||||
| Patriot Transportation Holding, Inc.* | 507 | 21,477 | ||||||
| VSE Corp. | 346 | 20,857 | ||||||
Energy Recovery, Inc.*,1 | 4,548 | 20,830 | ||||||
| Heritage-Crystal Clean, Inc.* | 1,148 | 20,825 | ||||||
| SIFCO Industries, Inc. | 604 | 20,547 | ||||||
| GP Strategies Corp.* | 617 | 20,460 | ||||||
Frontline Ltd.*,1 | 14,370 | 20,262 | ||||||
| Sterling Construction Company, Inc.* | 2,292 | 20,216 | ||||||
| Taser International, Inc.* | 1,069 | 20,140 | ||||||
| Swift Transportation Co. — Class A* | 815 | 20,131 | ||||||
| Control4 Corp.* | 1,295 | 20,085 | ||||||
| Casella Waste Systems, Inc. — Class A* | 4,442 | 19,989 | ||||||
| CUI Global, Inc.* | 2,439 | 19,951 | ||||||
| Standex International Corp. | 231 | 19,924 | ||||||
Teekay Tankers Ltd. — Class A1 | 4,698 | 19,920 | ||||||
Lindsay Corp.1 | 227 | 19,908 | ||||||
| Graham Corp. | 594 | 19,899 | ||||||
| Barnes Group, Inc. | 541 | 19,779 | ||||||
| Granite Construction, Inc. | 529 | 19,525 | ||||||
| HEICO Corp. | 359 | 19,472 | ||||||
CHC Group Ltd.*,1 | 2,893 | 19,441 | ||||||
| Universal Truckload Services, Inc. | 736 | 19,372 | ||||||
| CIRCOR International, Inc. | 257 | 19,314 | ||||||
| Badger Meter, Inc. | 339 | 19,296 | ||||||
| Moog, Inc. — Class A* | 252 | 19,288 | ||||||
| US Ecology, Inc. | 383 | 19,257 | ||||||
| Littelfuse, Inc. | 197 | 19,215 | ||||||
| Vishay Precision Group, Inc.* | 1,129 | 19,181 | ||||||
| Exponent, Inc. | 240 | 19,157 | ||||||
| SEE NOTES TO FINANCIAL STATEMENTS. | GUGGENHEIM ETFs ANNUAL REPORT | 57 |
SCHEDULE OF INVESTMENTS (continued) | October 31, 2014 |
GUGGENHEIM RUSSELL 2000® EQUAL WEIGHT ETF |
| Shares | Value | |||||||
| MSA Safety, Inc. | 333 | $ | 19,138 | |||||
| Matson, Inc. | 670 | 19,088 | ||||||
| OSI Systems, Inc.* | 269 | 19,067 | ||||||
| International Shipholding Corp. | 947 | 18,978 | ||||||
| Park-Ohio Holdings Corp. | 357 | 18,960 | ||||||
| Sun Hydraulics Corp. | 476 | 18,950 | ||||||
| Werner Enterprises, Inc. | 687 | 18,920 | ||||||
| Lydall, Inc.* | 610 | 18,867 | ||||||
| Echo Global Logistics, Inc.* | 719 | 18,787 | ||||||
| Teledyne Technologies, Inc.* | 181 | 18,757 | ||||||
| Orion Marine Group, Inc.* | 1,710 | 18,742 | ||||||
| Marten Transport Ltd. | 953 | 18,698 | ||||||
| Knight Transportation, Inc. | 639 | 18,697 | ||||||
| DHT Holdings, Inc. | 2,803 | 18,668 | ||||||
| Tennant Co. | 253 | 18,653 | ||||||
| Air Transport Services Group, Inc.* | 2,280 | 18,650 | ||||||
| Kaman Corp. | 433 | 18,645 | ||||||
| Atlas Air Worldwide Holdings, Inc.* | 505 | 18,645 | ||||||
| ESCO Technologies, Inc. | 489 | 18,592 | ||||||
| Fabrinet* | 1,018 | 18,538 | ||||||
| AZZ, Inc. | 396 | 18,517 | ||||||
| CAI International, Inc.* | 877 | 18,461 | ||||||
| Generac Holdings, Inc.* | 407 | 18,453 | ||||||
| Hyster-Yale Materials Handling, Inc. | 235 | 18,445 | ||||||
| EMCOR Group, Inc. | 417 | 18,402 | ||||||
| Esterline Technologies Corp.* | 157 | 18,386 | ||||||
| Navios Maritime Acquisition Corp. | 5,797 | 18,376 | ||||||
| Briggs & Stratton Corp. | 907 | 18,330 | ||||||
| FARO Technologies, Inc.* | 327 | 18,312 | ||||||
| Tetra Tech, Inc. | 683 | 18,311 | ||||||
| Heartland Express, Inc. | 728 | 18,302 | ||||||
| Albany International Corp. — Class A | 484 | 18,285 | ||||||
| XPO Logistics, Inc.* | 458 | 18,283 | ||||||
| Rogers Corp.* | 266 | 18,186 | ||||||
| Franklin Electric Company, Inc. | 486 | 18,147 | ||||||
| CLARCOR, Inc. | 271 | 18,146 | ||||||
| Xerium Technologies, Inc.* | 1,215 | 18,128 | ||||||
| YRC Worldwide, Inc.* | 844 | 18,095 | ||||||
| Textainer Group Holdings Ltd. | 525 | 18,082 | ||||||
| John Bean Technologies Corp. | 603 | 18,072 | ||||||
| Brady Corp. — Class A | 758 | 18,072 | ||||||
| Advanced Energy Industries, Inc.* | 913 | 18,059 | ||||||
ExOne Co.*,1 | 735 | 18,059 | ||||||
| Cubic Corp. | 374 | 18,042 | ||||||
| Nordic American Tankers Ltd. | 2,135 | 18,041 | ||||||
| Applied Industrial Technologies, Inc. | 369 | 18,011 | ||||||
| AAR Corp. | 679 | 17,994 | ||||||
| Woodward, Inc. | 351 | 17,975 | ||||||
| Gorman-Rupp Co. | 566 | 17,965 | ||||||
| MYR Group, Inc.* | 692 | 17,950 | ||||||
| Altra Industrial Motion Corp. | 569 | 17,935 | ||||||
| Hurco Companies, Inc. | 465 | 17,916 | ||||||
| Federal Signal Corp. | 1,261 | 17,906 | ||||||
| Forward Air Corp. | 374 | 17,903 | ||||||
| Alamo Group, Inc. | 417 | 17,864 | ||||||
| Kadant, Inc. | 432 | 17,859 | ||||||
| CECO Environmental Corp. | 1,247 | 17,857 | ||||||
| Scorpio Tankers, Inc. | 2,045 | 17,853 | ||||||
| UTI Worldwide, Inc.* | 1,632 | 17,838 | ||||||
| EnerSys | 284 | 17,835 | ||||||
| Astronics Corp.* | 344 | 17,823 | ||||||
| General Finance Corp.* | 2,058 | 17,740 | ||||||
| GenCorp, Inc.* | 1,045 | 17,723 | ||||||
| TAL International Group, Inc. | 410 | 17,683 | ||||||
| Astec Industries, Inc. | 465 | 17,628 | ||||||
| EnPro Industries, Inc.* | 273 | 17,617 | ||||||
| Argan, Inc. | 505 | 17,579 | ||||||
| Curtiss-Wright Corp. | 253 | 17,510 | ||||||
| Furmanite Corp.* | 2,339 | 17,496 | ||||||
| ArcBest Corp. | 452 | 17,492 | ||||||
| Tutor Perini Corp.* | 624 | 17,478 | ||||||
| Kratos Defense & Security Solutions, Inc.* | 2,493 | 17,376 | ||||||
| Watts Water Technologies, Inc. — Class A | 286 | 17,340 | ||||||
| LMI Aerospace, Inc.* | 1,311 | 17,279 | ||||||
| Aerovironment, Inc.* | 563 | 17,256 | ||||||
| Advanced Emissions Solutions, Inc.* | 853 | 17,248 | ||||||
| Ship Finance International Ltd. | 1,003 | 17,242 | ||||||
| Itron, Inc.* | 441 | 17,168 | ||||||
| Dycom Industries, Inc.* | 545 | 17,108 | ||||||
| Sanmina Corp.* | 682 | 17,098 | ||||||
| Knightsbridge Tankers Ltd. | 1,945 | 17,077 | ||||||
| Encore Wire Corp. | 450 | 17,073 | ||||||
| Quality Distribution, Inc.* | 1,317 | 17,068 | ||||||
| Navios Maritime Holdings, Inc. | 2,864 | 16,869 | ||||||
| USA Truck, Inc.* | 998 | 16,866 | ||||||
| Blount International, Inc.* | 1,100 | 16,841 | ||||||
| Saia, Inc.* | 343 | 16,814 | ||||||
| Raven Industries, Inc. | 663 | 16,807 | ||||||
| Actuant Corp. — Class A | 530 | 16,796 | ||||||
| Celadon Group, Inc. | 862 | 16,775 | ||||||
| KEMET Corp.* | 3,494 | 16,771 | ||||||
| Intevac, Inc.* | 2,266 | 16,768 | ||||||
| Harsco Corp. | 772 | 16,737 | ||||||
| GSI Group, Inc.* | 1,297 | 16,666 | ||||||
| II-VI, Inc.* | 1,225 | 16,525 | ||||||
| Twin Disc, Inc. | 635 | 16,523 | ||||||
| CTS Corp. | 894 | 16,450 | ||||||
| Bel Fuse, Inc. — Class B | 578 | 16,352 | ||||||
| Manitex International, Inc.* | 1,430 | 16,345 | ||||||
| Ultrapetrol Bahamas Ltd.* | 5,429 | 16,341 | ||||||
Erickson, Inc.*,1 | 1,163 | 16,329 | ||||||
| NVE Corp.* | 226 | 16,200 | ||||||
| Power Solutions International, Inc.* | 247 | 16,179 | ||||||
| FreightCar America, Inc. | 489 | 16,122 | ||||||
| Plexus Corp.* | 389 | 16,085 | ||||||
| Ducommun, Inc.* | 609 | 16,084 | ||||||
58 | GUGGENHEIM ETFs ANNUAL REPORT | SEE NOTES TO FINANCIAL STATEMENTS. |
SCHEDULE OF INVESTMENTS (continued) | October 31, 2014 |
GUGGENHEIM RUSSELL 2000® EQUAL WEIGHT ETF |
| Shares | Value | |||||||
| Drew Industries, Inc. | 331 | $ | 15,908 | |||||
| Sparton Corp.* | 587 | 15,908 | ||||||
| FEI Co. | 188 | 15,845 | ||||||
| Global Power Equipment Group, Inc. | 1,162 | 15,838 | ||||||
| Orbital Sciences Corp.* | 601 | 15,806 | ||||||
| MasTec, Inc.* | 551 | 15,781 | ||||||
| Checkpoint Systems, Inc.* | 1,190 | 15,779 | ||||||
| Stoneridge, Inc.* | 1,209 | 15,705 | ||||||
| Powell Industries, Inc. | 344 | 15,662 | ||||||
| Proto Labs, Inc.* | 239 | 15,623 | ||||||
| Multi-Fineline Electronix, Inc.* | 1,536 | 15,591 | ||||||
| Park Electrochemical Corp. | 604 | 15,583 | ||||||
| Benchmark Electronics, Inc.* | 656 | 15,560 | ||||||
Revolution Lighting Technologies, Inc.*,1 | 8,982 | 15,539 | ||||||
Smith & Wesson Holding Corp.*,1 | 1,528 | 15,524 | ||||||
| Hub Group, Inc. — Class A* | 425 | 15,423 | ||||||
| Fluidigm Corp.* | 530 | 15,370 | ||||||
| GasLog Ltd. | 737 | 15,344 | ||||||
| Coherent, Inc.* | 234 | 15,245 | ||||||
| Baltic Trading Ltd. | 4,062 | 15,233 | ||||||
| Electro Scientific Industries, Inc. | 2,140 | 15,194 | ||||||
| Methode Electronics, Inc. | 385 | 15,161 | ||||||
| Newport Corp.* | 847 | 15,153 | ||||||
| DXP Enterprises, Inc.* | 226 | 14,982 | ||||||
| Ardmore Shipping Corp. | 1,477 | 14,962 | ||||||
| Hillenbrand, Inc. | 449 | 14,947 | ||||||
| American Railcar Industries, Inc. | 226 | 14,873 | ||||||
| Roadrunner Transportation Systems, Inc.* | 721 | 14,860 | ||||||
| Viasystems Group, Inc.* | 930 | 14,759 | ||||||
| TTM Technologies, Inc.* | 2,131 | 14,725 | ||||||
| General Cable Corp. | 1,038 | 14,708 | ||||||
| National Presto Industries, Inc. | 233 | 14,693 | ||||||
| GrafTech International Ltd.* | 3,420 | 14,672 | ||||||
| Globant SA* | 1,129 | 14,609 | ||||||
| Greenbrier Companies, Inc. | 232 | 14,509 | ||||||
| AM Castle & Co.* | 1,968 | 14,465 | ||||||
| Cognex Corp.* | 360 | 14,242 | ||||||
| Rofin-Sinar Technologies, Inc.* | 634 | 14,195 | ||||||
| M/A-COM Technology Solutions Holdings, Inc.* | 641 | 14,096 | ||||||
| Aegion Corp. — Class A* | 766 | 14,033 | ||||||
| Imprivata, Inc.* | 894 | 13,937 | ||||||
| Applied Optoelectronics, Inc.* | 863 | 13,929 | ||||||
| Mistras Group, Inc.* | 842 | 13,885 | ||||||
| Universal Display Corp.* | 441 | 13,794 | ||||||
| ARC Group Worldwide, Inc.* | 1,001 | 13,654 | ||||||
| Scorpio Bulkers, Inc.* | 2,780 | 13,594 | ||||||
| Dorian LPG Ltd.* | 943 | 13,513 | ||||||
| Safe Bulkers, Inc. | 2,511 | 13,409 | ||||||
| American Science & Engineering, Inc. | 236 | 13,051 | ||||||
| Sturm Ruger & Company, Inc. | 304 | 12,671 | ||||||
| Chart Industries, Inc.* | 267 | 12,429 | ||||||
| Layne Christensen Co.* | 1,681 | 12,103 | ||||||
| Turtle Beach Corp.* | 2,086 | 12,057 | ||||||
InvenSense, Inc. — Class A*,1 | 737 | 11,947 | ||||||
| Total Industrial | 5,425,150 | |||||||
| FINANCIAL - 11.1% | ||||||||
| WageWorks, Inc.* | 364 | 20,752 | ||||||
| Marlin Business Services Corp. | 939 | 19,851 | ||||||
| Aircastle Ltd. | 1,027 | 19,595 | ||||||
| Ellie Mae, Inc.* | 437 | 16,772 | ||||||
| Acacia Research Corp. | 923 | 16,614 | ||||||
| Outerwall, Inc.* | 258 | 16,324 | ||||||
| Caesars Acquisition Co. — Class A* | 1,454 | 15,180 | ||||||
| ESB Financial Corp. | 765 | 14,276 | ||||||
| United Insurance Holdings Corp. | 706 | 13,837 | ||||||
| Universal Insurance Holdings, Inc. | 748 | 13,089 | ||||||
| HCI Group, Inc. | 254 | 12,912 | ||||||
| Federated National Holding Co. | 384 | 12,849 | ||||||
| Janus Capital Group, Inc. | 829 | 12,427 | ||||||
| WisdomTree Investments, Inc. | 817 | 12,051 | ||||||
| Gain Capital Holdings, Inc. | 1,400 | 11,984 | ||||||
| Heritage Insurance Holdings, Inc.* | 665 | 11,810 | ||||||
| Aviv REIT, Inc. | 344 | 11,603 | ||||||
| Hudson Valley Holding Corp. | 509 | 11,574 | ||||||
| Walker & Dunlop, Inc.* | 718 | 11,567 | ||||||
| Enterprise Bancorp, Inc. | 484 | 11,389 | ||||||
| Great Southern Bancorp, Inc. | 295 | 11,213 | ||||||
| CommunityOne Bancorp* | 1,039 | 11,055 | ||||||
| Alexander’s, Inc. | 25 | 11,050 | ||||||
| NewStar Financial, Inc.* | 807 | 11,039 | ||||||
| Saul Centers, Inc. | 200 | 10,990 | ||||||
| Stewart Information Services Corp. | 310 | 10,949 | ||||||
| Crawford & Co. — Class B | 1,075 | 10,944 | ||||||
| Westwood Holdings Group, Inc. | 162 | 10,935 | ||||||
| Credit Acceptance Corp.* | 74 | 10,919 | ||||||
| Financial Engines, Inc. | 273 | 10,885 | ||||||
| CubeSmart | 515 | 10,841 | ||||||
| Suffolk Bancorp | 472 | 10,837 | ||||||
| Radian Group, Inc. | 643 | 10,835 | ||||||
| STAG Industrial, Inc. | 444 | 10,834 | ||||||
| Portfolio Recovery Associates, Inc.* | 171 | 10,816 | ||||||
| Universal Health Realty Income Trust | 223 | 10,804 | ||||||
| BGC Partners, Inc. — Class A | 1,274 | 10,804 | ||||||
| First Citizens BancShares, Inc. — Class A | 43 | 10,802 | ||||||
| Preferred Bank/Los Angeles CA | 406 | 10,791 | ||||||
| Palmetto Bancshares, Inc. | 648 | 10,770 | ||||||
| Seacoast Banking Corporation of Florida* | 844 | 10,769 | ||||||
| Cedar Realty Trust, Inc. | 1,564 | 10,760 | ||||||
| Calamos Asset Management, Inc. — Class A | 783 | 10,727 | ||||||
AmTrust Financial Services, Inc.1 | 239 | 10,724 | ||||||
| Camden National Corp. | 262 | 10,718 | ||||||
| Citizens, Inc.* | 1,469 | 10,709 | ||||||
| Guaranty Bancorp | 679 | 10,708 | ||||||
| Trico Bancshares | 407 | 10,704 | ||||||
| Springleaf Holdings, Inc.* | 286 | 10,702 | ||||||
| SEE NOTES TO FINANCIAL STATEMENTS. | GUGGENHEIM ETFs ANNUAL REPORT | 59 |
SCHEDULE OF INVESTMENTS (continued) | October 31, 2014 |
GUGGENHEIM RUSSELL 2000® EQUAL WEIGHT ETF |
| Shares | Value | |||||||
| Safety Insurance Group, Inc. | 171 | $ | 10,667 | |||||
| GAMCO Investors, Inc. — Class A | 129 | 10,658 | ||||||
| DCT Industrial Trust, Inc. | 1,242 | 10,644 | ||||||
| NewBridge Bancorp* | 1,197 | 10,641 | ||||||
| QTS Realty Trust, Inc. — Class A | 302 | 10,636 | ||||||
| West Bancorporation, Inc. | 641 | 10,628 | ||||||
| Ashford Hospitality Prime, Inc. | 613 | 10,623 | ||||||
| S&T Bancorp, Inc. | 385 | 10,622 | ||||||
| American Assets Trust, Inc. | 277 | 10,620 | ||||||
| United Fire Group, Inc. | 326 | 10,588 | ||||||
| Pacific Premier Bancorp, Inc.* | 654 | 10,587 | ||||||
| First Industrial Realty Trust, Inc. | 542 | 10,586 | ||||||
| Hallmark Financial Services, Inc.* | 907 | 10,576 | ||||||
| BankFinancial Corp. | 886 | 10,569 | ||||||
| MidWestOne Financial Group, Inc. | 396 | 10,565 | ||||||
| PennyMac Financial Services, Inc. — Class A* | 634 | 10,562 | ||||||
| First of Long Island Corp. | 401 | 10,562 | ||||||
| DuPont Fabros Technology, Inc. | 341 | 10,560 | ||||||
| Selective Insurance Group, Inc. | 409 | 10,560 | ||||||
| Sovran Self Storage, Inc. | 124 | 10,551 | ||||||
| FelCor Lodging Trust, Inc. | 983 | 10,548 | ||||||
| German American Bancorp, Inc. | 353 | 10,544 | ||||||
| Blackhawk Network Holdings, Inc.* | 305 | 10,541 | ||||||
| Tompkins Financial Corp. | 209 | 10,492 | ||||||
| Global Indemnity plc — Class A* | 362 | 10,491 | ||||||
| Park Sterling Corp. | 1,369 | 10,487 | ||||||
| Acadia Realty Trust | 336 | 10,483 | ||||||
| Washington Trust Bancorp, Inc. | 273 | 10,475 | ||||||
| LaSalle Hotel Properties | 267 | 10,469 | ||||||
| EastGroup Properties, Inc. | 152 | 10,467 | ||||||
| RLI Corp. | 211 | 10,463 | ||||||
| CNB Financial Corp. | 577 | 10,449 | ||||||
| First Defiance Financial Corp. | 341 | 10,444 | ||||||
| Independent Bank Corp. | 256 | 10,445 | ||||||
| ViewPoint Financial Group, Inc. | 383 | 10,444 | ||||||
| Chesapeake Lodging Trust | 316 | 10,441 | ||||||
| International Bancshares Corp. | 368 | 10,440 | ||||||
| CoreSite Realty Corp. | 282 | 10,440 | ||||||
| RLJ Lodging Trust | 324 | 10,439 | ||||||
| Pebblebrook Hotel Trust | 245 | 10,437 | ||||||
| Sun Communities, Inc. | 180 | 10,435 | ||||||
| First Busey Corp. | 1,669 | 10,431 | ||||||
| Kennedy-Wilson Holdings, Inc. | 385 | 10,430 | ||||||
| National Bankshares, Inc. | 333 | 10,426 | ||||||
| First Financial Bankshares, Inc. | 328 | 10,425 | �� | |||||
| Essent Group Ltd.* | 428 | 10,418 | ||||||
| Ameris Bancorp | 420 | 10,416 | ||||||
| Hampton Roads Bankshares, Inc.* | 5,983 | 10,410 | ||||||
| WesBanco, Inc. | 302 | 10,407 | ||||||
| CyrusOne, Inc. | 381 | 10,405 | ||||||
| Penns Woods Bancorp, Inc. | 214 | 10,385 | ||||||
| Banner Corp. | 240 | 10,373 | ||||||
| One Liberty Properties, Inc. | 453 | 10,369 | ||||||
| Infinity Property & Casualty Corp. | 142 | 10,367 | ||||||
| Hersha Hospitality Trust | 1,422 | 10,366 | ||||||
| MGIC Investment Corp.* | 1,162 | 10,365 | ||||||
| Cass Information Systems, Inc. | 218 | 10,364 | ||||||
| BancorpSouth, Inc. | 450 | 10,363 | ||||||
| LTC Properties, Inc. | 247 | 10,359 | ||||||
| PS Business Parks, Inc. | 123 | 10,359 | ||||||
| Ladenburg Thalmann Financial Services, Inc.* | 2,425 | 10,355 | ||||||
| MB Financial, Inc. | 328 | 10,348 | ||||||
| National Health Investors, Inc. | 157 | 10,348 | ||||||
| Eagle Bancorp, Inc.* | 288 | 10,348 | ||||||
| Heritage Oaks Bancorp | 1,314 | 10,341 | ||||||
| Community Bank System, Inc. | 271 | 10,339 | ||||||
| Oppenheimer Holdings, Inc. — Class A | 421 | 10,336 | ||||||
| Investors Real Estate Trust | 1,230 | 10,332 | ||||||
| Associated Estates Realty Corp. | 529 | 10,331 | ||||||
| NBT Bancorp, Inc. | 402 | 10,323 | ||||||
| Univest Corporation of Pennsylvania | 503 | 10,322 | ||||||
| Sandy Spring Bancorp, Inc. | 400 | 10,320 | ||||||
| Equity One, Inc. | 430 | 10,320 | ||||||
| Lakeland Bancorp, Inc. | 939 | 10,320 | ||||||
| DiamondRock Hospitality Co. | 719 | 10,318 | ||||||
| EMC Insurance Group, Inc. | 322 | 10,317 | ||||||
| Centerstate Banks, Inc. | 886 | 10,313 | ||||||
| Pacific Continental Corp. | 715 | 10,310 | ||||||
| Capital City Bank Group, Inc. | 682 | 10,305 | ||||||
| National Western Life Insurance Co. — Class A | 38 | 10,298 | ||||||
| Healthcare Realty Trust, Inc. | 389 | 10,297 | ||||||
| Hudson Pacific Properties, Inc. | 377 | 10,295 | ||||||
| Physicians Realty Trust | 671 | 10,293 | ||||||
| Strategic Hotels & Resorts, Inc.* | 801 | 10,293 | ||||||
| Enterprise Financial Services Corp. | 546 | 10,292 | ||||||
| Cardinal Financial Corp. | 536 | 10,291 | ||||||
| Sunstone Hotel Investors, Inc. | 672 | 10,288 | ||||||
| Western Alliance Bancorporation* | 386 | 10,276 | ||||||
| Monmouth Real Estate Investment Corp. | 917 | 10,271 | ||||||
| United Financial Bancorp, Inc. | 732 | 10,270 | ||||||
| First Financial Northwest, Inc. | 885 | 10,266 | ||||||
| Retail Opportunity Investments Corp. | 628 | 10,262 | ||||||
| Sabra Health Care REIT, Inc. | 359 | 10,257 | ||||||
| Fidelity Southern Corp. | 668 | 10,254 | ||||||
| Evercore Partners, Inc. — Class A | 198 | 10,250 | ||||||
| TrustCo Bank Corp. NY | 1,404 | 10,249 | ||||||
| Chatham Lodging Trust | 400 | 10,248 | ||||||
| First NBC Bank Holding Co.* | 279 | 10,248 | ||||||
| American Equity Investment Life Holding Co. | 397 | 10,247 | ||||||
| Highwoods Properties, Inc. | 239 | 10,246 | ||||||
| Provident Financial Services, Inc. | 562 | 10,245 | ||||||
| First Merchants Corp. | 452 | 10,238 | ||||||
| First Bancorp | 565 | 10,238 | ||||||
| National General Holdings Corp. | 546 | 10,238 | ||||||
| Financial Institutions, Inc. | 407 | 10,232 | ||||||
60 | GUGGENHEIM ETFs ANNUAL REPORT | SEE NOTES TO FINANCIAL STATEMENTS. |
SCHEDULE OF INVESTMENTS (continued) | October 31, 2014 |
GUGGENHEIM RUSSELL 2000® EQUAL WEIGHT ETF |
| Shares | Value | |||||||
| Washington Real Estate Investment Trust | 362 | $ | 10,230 | |||||
| Chambers Street Properties | 1,245 | 10,221 | ||||||
| Heartland Financial USA, Inc. | 384 | 10,214 | ||||||
| Terreno Realty Corp. | 485 | 10,214 | ||||||
| Navigators Group, Inc.* | 150 | 10,214 | ||||||
| FBL Financial Group, Inc. — Class A | 206 | 10,213 | ||||||
| Park National Corp. | 121 | 10,209 | ||||||
| First Financial Bancorp | 582 | 10,208 | ||||||
| Agree Realty Corp. | 333 | 10,194 | ||||||
| Stock Yards Bancorp, Inc. | 306 | 10,184 | ||||||
| First Community Bancshares, Inc. | 622 | 10,182 | ||||||
| Rexford Industrial Realty, Inc. | 659 | 10,182 | ||||||
| Rouse Properties, Inc. | 559 | 10,180 | ||||||
| Education Realty Trust, Inc. | 904 | 10,179 | ||||||
| RE/MAX Holdings, Inc. — Class A | 318 | 10,176 | ||||||
| Ames National Corp. | 410 | 10,168 | ||||||
| Columbia Banking System, Inc. | 366 | 10,167 | ||||||
| Brookline Bancorp, Inc. | 1,060 | 10,165 | ||||||
| First Financial Corp. | 293 | 10,161 | ||||||
| CatchMark Timber Trust, Inc. — Class A | 868 | 10,156 | ||||||
| Old Line Bancshares, Inc. | 635 | 10,147 | ||||||
| Towne Bank/Portsmouth VA | 669 | 10,142 | ||||||
| Old National Bancorp | 697 | 10,141 | ||||||
| Nelnet, Inc. — Class A | 213 | 10,137 | ||||||
| Renasant Corp. | 336 | 10,130 | ||||||
| Alexander & Baldwin, Inc. | 253 | 10,128 | ||||||
| First American Financial Corp. | 334 | 10,127 | ||||||
| Chemical Financial Corp. | 340 | 10,125 | ||||||
| Sterling Bancorp | 720 | 10,123 | ||||||
| Meadowbrook Insurance Group, Inc. | 1,589 | 10,122 | ||||||
| Northrim BanCorp, Inc. | 350 | 10,115 | ||||||
| Cohen & Steers, Inc. | 236 | 10,115 | ||||||
| Southwest Bancorp, Inc. | 561 | 10,115 | ||||||
| Bank of the Ozarks, Inc. | 287 | 10,114 | ||||||
| Hilltop Holdings, Inc.* | 459 | 10,112 | ||||||
| Bridge Bancorp, Inc. | 385 | 10,110 | ||||||
| Redwood Trust, Inc. | 538 | 10,110 | ||||||
| Parkway Properties, Inc. | 504 | 10,105 | ||||||
| Lexington Realty Trust | 922 | 10,105 | ||||||
| Glacier Bancorp, Inc. | 352 | 10,099 | ||||||
| EPR Properties | 180 | 10,098 | ||||||
| Fidelity & Guaranty Life | 425 | 10,094 | ||||||
| Franklin Financial Corp.* | 486 | 10,089 | ||||||
| First BanCorp* | 1,936 | 10,087 | ||||||
| United Community Banks, Inc. | 559 | 10,079 | ||||||
| United Bankshares, Inc. | 294 | 10,078 | ||||||
| Potlatch Corp. | 229 | 10,074 | ||||||
| Consumer Portfolio Services, Inc.* | 1,426 | 10,068 | ||||||
| WSFS Financial Corp. | 128 | 10,067 | ||||||
| Horizon Bancorp | 391 | 10,057 | ||||||
| Heritage Financial Corp. | 573 | 10,056 | ||||||
| Medical Properties Trust, Inc. | 744 | 10,037 | ||||||
| Hancock Holding Co. | 285 | 10,029 | ||||||
| Lakeland Financial Corp. | 242 | 10,028 | ||||||
| Geo Group, Inc. | 251 | 10,025 | ||||||
| New York REIT, Inc. | 893 | 10,020 | ||||||
| State Bank Financial Corp. | 559 | 10,017 | ||||||
| First Commonwealth Financial Corp. | 1,071 | 10,014 | ||||||
| 1st Source Corp. | 320 | 10,013 | ||||||
| Getty Realty Corp. | 538 | 10,012 | ||||||
| Excel Trust, Inc. | 770 | 10,010 | ||||||
| First Interstate BancSystem, Inc. — Class A | 341 | 10,005 | ||||||
| Berkshire Hills Bancorp, Inc. | 388 | 10,003 | ||||||
| Summit Hotel Properties, Inc. | 859 | 9,999 | ||||||
| Simmons First National Corp. — Class A | 238 | 9,994 | ||||||
| Cousins Properties, Inc. | 768 | 9,992 | ||||||
| Flushing Financial Corp. | 496 | 9,989 | ||||||
| American Realty Capital Healthcare Trust, Inc. | 884 | 9,989 | ||||||
| Argo Group International Holdings Ltd. | 179 | 9,988 | ||||||
| Investment Technology Group, Inc.* | 557 | 9,987 | ||||||
| PrivateBancorp, Inc. — Class A | 309 | 9,987 | ||||||
| Dime Community Bancshares, Inc. | 634 | 9,986 | ||||||
| Bank of Marin Bancorp | 200 | 9,984 | ||||||
| Whitestone REIT — Class B | 664 | 9,960 | ||||||
| Sun Bancorp, Inc.* | 493 | 9,959 | ||||||
| CVB Financial Corp. | 631 | 9,957 | ||||||
| Kemper Corp. | 270 | 9,950 | ||||||
| Yadkin Financial Corp.* | 512 | 9,938 | ||||||
| United Community Financial Corp. | 1,940 | 9,933 | ||||||
| Capitol Federal Financial, Inc. | 775 | 9,928 | ||||||
| AMERISAFE, Inc. | 238 | 9,925 | ||||||
| UMH Properties, Inc. | 982 | 9,918 | ||||||
| Pinnacle Financial Partners, Inc. | 253 | 9,918 | ||||||
| CNO Financial Group, Inc. | 547 | 9,917 | ||||||
| CoBiz Financial, Inc. | 825 | 9,917 | ||||||
| Capital Bank Financial Corp. — Class A* | 383 | 9,916 | ||||||
| IBERIABANK Corp. | 144 | 9,916 | ||||||
| Diamond Hill Investment Group, Inc. | 74 | 9,915 | ||||||
| Century Bancorp, Inc. — Class A | 261 | 9,913 | ||||||
| Ramco-Gershenson Properties Trust | 567 | 9,911 | ||||||
| Ashford Hospitality Trust, Inc. | 877 | 9,910 | ||||||
| Baldwin & Lyons, Inc. — Class B | 368 | 9,907 | ||||||
| Urstadt Biddle Properties, Inc. — Class A | 458 | 9,907 | ||||||
| Texas Capital Bancshares, Inc.* | 162 | 9,906 | ||||||
| Meta Financial Group, Inc. | 264 | 9,903 | ||||||
| Wilshire Bancorp, Inc. | 1,000 | 9,900 | ||||||
| Bryn Mawr Bank Corp. | 321 | 9,896 | ||||||
| MarketAxess Holdings, Inc. | 153 | 9,891 | ||||||
| UMB Financial Corp. | 166 | 9,890 | ||||||
| Washington Federal, Inc. | 453 | 9,889 | ||||||
| Arrow Financial Corp. | 361 | 9,888 | ||||||
| First Connecticut Bancorp, Inc. | 632 | 9,884 | ||||||
| EverBank Financial Corp. | 516 | 9,881 | ||||||
| Pennsylvania Real Estate Investment Trust | 461 | 9,879 | ||||||
| Kansas City Life Insurance Co. | 199 | 9,876 | ||||||
| Franklin Street Properties Corp. | 823 | 9,868 | ||||||
| SEE NOTES TO FINANCIAL STATEMENTS. | GUGGENHEIM ETFs ANNUAL REPORT | 61 |
SCHEDULE OF INVESTMENTS (continued) | October 31, 2014 |
GUGGENHEIM RUSSELL 2000® EQUAL WEIGHT ETF |
| Shares | Value | |||||||
| Consolidated-Tomoka Land Co. | 189 | $ | 9,863 | |||||
| CareTrust REIT, Inc. | 635 | 9,862 | ||||||
| Bancorp, Inc.* | 1,042 | 9,857 | ||||||
| AmREIT, Inc. | 400 | 9,856 | ||||||
| Silvercrest Asset Management Group, Inc. — Class A | 660 | 9,854 | ||||||
| City Holding Co. | 219 | 9,853 | ||||||
| Gramercy Property Trust, Inc. | 1,575 | 9,844 | ||||||
| Umpqua Holdings Corp. | 559 | 9,838 | ||||||
| Kite Realty Group Trust | 380 | 9,838 | ||||||
| Inland Real Estate Corp. | 927 | 9,835 | ||||||
| Peoples Financial Services Corp. | 196 | 9,833 | ||||||
| Heritage Commerce Corp. | 1,130 | 9,831 | ||||||
| TriState Capital Holdings, Inc.* | 1,008 | 9,828 | ||||||
| Stonegate Bank | 361 | 9,816 | ||||||
| BNC Bancorp | 577 | 9,815 | ||||||
| Investors Bancorp, Inc. | 912 | 9,804 | ||||||
| Macatawa Bank Corp. | 1,880 | 9,795 | ||||||
| Higher One Holdings, Inc.* | 3,807 | 9,784 | ||||||
| Empire State Realty Trust, Inc. — Class A | 613 | 9,783 | ||||||
| Hanmi Financial Corp. | 456 | 9,781 | ||||||
| Waterstone Financial, Inc. | 799 | 9,780 | ||||||
| Community Trust Bancorp, Inc. | 272 | 9,778 | ||||||
| Independence Holding Co. | 691 | 9,778 | ||||||
| Northwest Bancshares, Inc. | 762 | 9,776 | ||||||
| Montpelier Re Holdings Ltd. | 295 | 9,776 | ||||||
| Gladstone Commercial Corp. | 540 | 9,774 | ||||||
| Atlas Financial Holdings, Inc.* | 659 | 9,773 | ||||||
| Enstar Group Ltd.* | 66 | 9,773 | ||||||
| South State Corp. | 162 | 9,770 | ||||||
| Cowen Group, Inc. — Class A* | 2,418 | 9,769 | ||||||
| Bridge Capital Holdings* | 405 | 9,769 | ||||||
| Square 1 Financial, Inc. — Class A* | 491 | 9,766 | ||||||
| Horace Mann Educators Corp. | 321 | 9,762 | ||||||
| First Business Financial Services, Inc. | 208 | 9,761 | ||||||
| CU Bancorp* | 494 | 9,757 | ||||||
| BBX Capital Corp. — Class A* | 530 | 9,752 | ||||||
| iStar Financial, Inc.* | 687 | 9,749 | ||||||
| Webster Financial Corp. | 311 | 9,747 | ||||||
| Stonegate Mortgage Corp.* | 674 | 9,746 | ||||||
| Phoenix Companies, Inc.* | 164 | 9,735 | ||||||
| Boston Private Financial Holdings, Inc. | 740 | 9,731 | ||||||
| First Bancorp, Inc. | 550 | 9,730 | ||||||
| KCG Holdings, Inc. — Class A* | 912 | 9,722 | ||||||
| FNB Corp. | 760 | 9,720 | ||||||
| Primerica, Inc. | 190 | 9,719 | ||||||
| HomeTrust Bancshares, Inc.* | 629 | 9,718 | ||||||
| Northfield Bancorp, Inc. | 682 | 9,712 | ||||||
| Astoria Financial Corp. | 738 | 9,705 | ||||||
| BofI Holding, Inc.* | 126 | 9,705 | ||||||
| American National Bankshares, Inc. | 401 | 9,704 | ||||||
| National Penn Bancshares, Inc. | 943 | 9,703 | ||||||
| First Potomac Realty Trust | 776 | 9,700 | ||||||
| Kearny Financial Corp.* | 681 | 9,697 | ||||||
| Cathay General Bancorp | 367 | 9,692 | ||||||
| Marcus & Millichap, Inc.* | 312 | 9,691 | ||||||
| Merchants Bancshares, Inc. | 325 | 9,682 | ||||||
| Central Pacific Financial Corp. | 512 | 9,677 | ||||||
| Home BancShares, Inc. | 303 | 9,672 | ||||||
| Westamerica Bancorporation | 196 | 9,671 | ||||||
| FirstMerit Corp. | 527 | 9,670 | ||||||
| AG Mortgage Investment Trust, Inc. | 507 | 9,668 | ||||||
| Customers Bancorp, Inc.* | 506 | 9,665 | ||||||
| SWS Group, Inc.* | 1,307 | 9,659 | ||||||
| CYS Investments, Inc. | 1,081 | 9,653 | ||||||
New York Mortgage Trust, Inc.1 | 1,235 | 9,645 | ||||||
| Employers Holdings, Inc. | 473 | 9,644 | ||||||
| Arlington Asset Investment Corp. — Class A | 352 | 9,638 | ||||||
| Donegal Group, Inc. — Class A | 609 | 9,634 | ||||||
| Resource Capital Corp. | 1,821 | 9,633 | ||||||
| Meridian Bancorp, Inc.* | 849 | 9,628 | ||||||
| Territorial Bancorp, Inc. | 448 | 9,623 | ||||||
| Oritani Financial Corp. | 651 | 9,615 | ||||||
| Prosperity Bancshares, Inc. | 159 | 9,602 | ||||||
| HFF, Inc. — Class A | 305 | 9,601 | ||||||
| Peapack Gladstone Financial Corp. | 526 | 9,600 | ||||||
| Maiden Holdings Ltd. | 803 | 9,596 | ||||||
| Metro Bancorp, Inc.* | 383 | 9,590 | ||||||
| Peoples Bancorp, Inc. | 389 | 9,589 | ||||||
| Trustmark Corp. | 394 | 9,586 | ||||||
| ServisFirst Bancshares, Inc. | 325 | 9,584 | ||||||
| New Residential Investment Corp. | 774 | 9,582 | ||||||
| Apollo Residential Mortgage, Inc. | 574 | 9,574 | ||||||
| Ryman Hospitality Properties, Inc. | 194 | 9,574 | ||||||
| OmniAmerican Bancorp, Inc. | 354 | 9,572 | ||||||
| Clifton Bancorp, Inc. | 735 | 9,570 | ||||||
| MainSource Financial Group, Inc. | 526 | 9,568 | ||||||
| Ambac Financial Group, Inc.* | 418 | 9,564 | ||||||
| Government Properties Income Trust | 419 | 9,562 | ||||||
| Charter Financial Corp. | 843 | 9,560 | ||||||
| Silver Bay Realty Trust Corp. | 564 | 9,549 | ||||||
| 1st United Bancorp, Inc. | 1,078 | 9,540 | ||||||
| Third Point Reinsurance Ltd.* | 623 | 9,532 | ||||||
| World Acceptance Corp.* | 133 | 9,531 | ||||||
| Mercantile Bank Corp. | 483 | 9,530 | ||||||
| Federal Agricultural Mortgage Corp. — Class C | 286 | 9,524 | ||||||
| NMI Holdings, Inc. — Class A* | 1,064 | 9,523 | ||||||
| Hatteras Financial Corp. | 500 | 9,520 | ||||||
| Citizens & Northern Corp. | 478 | 9,512 | ||||||
| Invesco Mortgage Capital, Inc. | 575 | 9,511 | ||||||
| Beneficial Mutual Bancorp, Inc.* | 708 | 9,508 | ||||||
| Anworth Mortgage Asset Corp. | 1,832 | 9,508 | ||||||
| Pzena Investment Management, Inc. — Class A | 946 | 9,507 | ||||||
| Blue Hills Bancorp, Inc.* | 713 | 9,504 | ||||||
62 | GUGGENHEIM ETFs ANNUAL REPORT | SEE NOTES TO FINANCIAL STATEMENTS. |
SCHEDULE OF INVESTMENTS (continued) | October 31, 2014 |
GUGGENHEIM RUSSELL 2000® EQUAL WEIGHT ETF |
| Shares | Value | |||||||
| Virtus Investment Partners, Inc. | 53 | $ | 9,498 | |||||
| OceanFirst Financial Corp. | 573 | 9,495 | ||||||
| Piper Jaffray Cos.* | 168 | 9,485 | ||||||
| Valley National Bancorp | 950 | 9,481 | ||||||
| Dynex Capital, Inc. | 1,126 | 9,481 | ||||||
| Cascade Bancorp* | 1,854 | 9,474 | ||||||
| National Interstate Corp. | 333 | 9,471 | ||||||
| American Residential Properties, Inc.* | 498 | 9,462 | ||||||
| CIFC Corp. | 1,028 | 9,458 | ||||||
| Platinum Underwriters Holdings Ltd. | 151 | 9,457 | ||||||
| eHealth, Inc.* | 379 | 9,456 | ||||||
| First Midwest Bancorp, Inc. | 563 | 9,453 | ||||||
| International. FCStone, Inc.* | 522 | 9,448 | ||||||
| FXCM, Inc. — Class A | 574 | 9,448 | ||||||
| Hannon Armstrong Sustainable Infrastructure Capital, Inc. | 675 | 9,437 | ||||||
| Republic Bancorp, Inc. — Class A | 389 | 9,433 | ||||||
| Armada Hoffler Properties, Inc. | 1,005 | 9,427 | ||||||
| BancFirst Corp. | 145 | 9,425 | ||||||
| OFG Bancorp | 605 | 9,420 | ||||||
| Nicholas Financial, Inc.* | 771 | 9,414 | ||||||
| Wintrust Financial Corp. | 203 | 9,403 | ||||||
| Symetra Financial Corp. | 396 | 9,385 | ||||||
| Encore Capital Group, Inc.* | 206 | 9,375 | ||||||
| Starwood Waypoint Residential Trust | 358 | 9,372 | ||||||
| Southside Bancshares, Inc. | 279 | 9,369 | ||||||
| Bank Mutual Corp. | 1,420 | 9,358 | ||||||
| OneBeacon Insurance Group Ltd. — Class A | 587 | 9,351 | ||||||
| Bank of Kentucky Financial Corp. | 199 | 9,335 | ||||||
| Glimcher Realty Trust | 679 | 9,323 | ||||||
| MidSouth Bancorp, Inc. | 492 | 9,318 | ||||||
| Trade Street Residential, Inc. | 1,349 | 9,308 | ||||||
| CorEnergy Infrastructure Trust, Inc. | 1,235 | 9,275 | ||||||
| Apollo Commercial Real Estate Finance, Inc. | 564 | 9,272 | ||||||
| Ares Commercial Real Estate Corp. | 761 | 9,254 | ||||||
| State Auto Financial Corp. | 442 | 9,251 | ||||||
| GFI Group, Inc. | 1,681 | 9,246 | ||||||
| Select Income REIT | 377 | 9,240 | ||||||
| Banc of California, Inc. | 784 | 9,228 | ||||||
| Moelis & Co. — Class A | 270 | 9,223 | ||||||
| PennyMac Mortgage Investment Trust | 427 | 9,219 | ||||||
| Campus Crest Communities, Inc. | 1,453 | 9,212 | ||||||
| Independent Bank Corp. | 763 | 9,209 | ||||||
| Walter Investment Management Corp.* | 405 | 9,202 | ||||||
| Ladder Capital Corp. — Class A* | 484 | 9,191 | ||||||
| Talmer Bancorp, Inc. — Class A | 657 | 9,185 | ||||||
| Green Bancorp, Inc.* | 537 | 9,177 | ||||||
| Stifel Financial Corp.* | 193 | 9,169 | ||||||
| Sierra Bancorp | 534 | 9,163 | ||||||
| Colony Financial, Inc. | 411 | 9,157 | ||||||
| Greenlight Capital Re Ltd. — Class A* | 282 | 9,151 | ||||||
| RAIT Financial Trust | 1,248 | 9,148 | ||||||
| Republic First Bancorp, Inc.* | 2,303 | 9,143 | ||||||
| Western Asset Mortgage Capital Corp. | 607 | 9,117 | ||||||
| American Capital Mortgage Investment Corp. | 465 | 9,109 | ||||||
| Fox Chase Bancorp, Inc. | 556 | 9,107 | ||||||
| ARMOUR Residential REIT, Inc. | 2,298 | 9,100 | ||||||
| Capstead Mortgage Corp. | 713 | 9,062 | ||||||
| Forestar Group, Inc.* | 519 | 9,057 | ||||||
| HomeStreet, Inc. | 519 | 9,041 | ||||||
| Owens Realty Mortgage, Inc. | 604 | 9,030 | ||||||
| Union Bankshares Corp. | 401 | 9,014 | ||||||
| Altisource Residential Corp. | 388 | 9,009 | ||||||
| Mack-Cali Realty Corp. | 481 | 9,009 | ||||||
| Greenhill & Company, Inc. | 200 | 9,000 | ||||||
| ConnectOne Bancorp, Inc. | 485 | 8,973 | ||||||
| BBCN Bancorp, Inc. | 630 | 8,908 | ||||||
| Susquehanna Bancshares, Inc. | 905 | 8,878 | ||||||
| Flagstar Bancorp, Inc.* | 561 | 8,819 | ||||||
| St. Joe Co.* | 454 | 8,694 | ||||||
| Manning & Napier, Inc. — Class A | 547 | 8,664 | ||||||
| C1 Financial, Inc.* | 500 | 8,635 | ||||||
| JG Wentworth Co.* | 761 | 8,462 | ||||||
| Independent Bank Group, Inc. | 187 | 8,357 | ||||||
| FBR & Co.* | 341 | 8,232 | ||||||
| Home Loan Servicing Solutions Ltd. | 423 | 8,126 | ||||||
| Opus Bank* | 300 | 7,890 | ||||||
| Trupanion, Inc.* | 1,111 | 7,399 | ||||||
| Altisource Asset Management Corp.* | 13 | 7,020 | ||||||
| Altisource Portfolio Solutions S.A.* | 91 | 6,794 | ||||||
| RCS Capital Corp. — Class A | 401 | 6,580 | ||||||
| Regional Management Corp.* | 514 | 5,993 | ||||||
| Total Financial | 4,485,969 | |||||||
| CONSUMER, CYCLICAL - 10.8% | ||||||||
| Pantry, Inc.* | 4,914 | 126,634 | ||||||
| Casey’s General Stores, Inc. | 1,417 | 116,010 | ||||||
| Core-Mark Holding Company, Inc. | 1,913 | 111,010 | ||||||
PetMed Express, Inc.1 | 7,299 | 96,420 | ||||||
| Watsco, Inc. | 415 | 42,172 | ||||||
| Unifi, Inc.* | 1,378 | 38,543 | ||||||
| Beacon Roofing Supply, Inc.* | 1,379 | 38,157 | ||||||
| Installed Building Products, Inc.* | 2,583 | 37,478 | ||||||
| Culp, Inc. | 1,953 | 37,049 | ||||||
| Interface, Inc. — Class A | 2,213 | 35,474 | ||||||
| Dixie Group, Inc.* | 4,256 | 33,537 | ||||||
| SkyWest, Inc. | 2,045 | 23,558 | ||||||
| Einstein Noah Restaurant Group, Inc. | 1,090 | 22,072 | ||||||
| Hawaiian Holdings, Inc.* | 1,261 | 21,866 | ||||||
| HNI Corp. | 465 | 21,692 | ||||||
| Kimball International, Inc. — Class B | 1,157 | 20,803 | ||||||
| Mobile Mini, Inc. | 464 | 20,337 | ||||||
| NACCO Industries, Inc. — Class A | 343 | 20,089 | ||||||
| Accuride Corp.* | 4,150 | 20,004 | ||||||
| Spartan Motors, Inc. | 3,483 | 19,819 | ||||||
| UniFirst Corp. | 177 | 19,746 | ||||||
| G&K Services, Inc. — Class A | 309 | 19,489 | ||||||
| SEE NOTES TO FINANCIAL STATEMENTS. | GUGGENHEIM ETFs ANNUAL REPORT | 63 |
SCHEDULE OF INVESTMENTS (continued) | October 31, 2014 |
GUGGENHEIM RUSSELL 2000® EQUAL WEIGHT ETF |
| Shares | Value | |||||||
| Douglas Dynamics, Inc. | 936 | $ | 19,404 | |||||
| Knoll, Inc. | 967 | 19,234 | ||||||
| Miller Industries, Inc. | 972 | 19,216 | ||||||
| Ruby Tuesday, Inc.* | 2,486 | 19,092 | ||||||
| Houston Wire & Cable Co. | 1,406 | 19,065 | ||||||
| JetBlue Airways Corp.* | 1,644 | 18,972 | ||||||
| DTS, Inc.* | 635 | 18,910 | ||||||
| Rush Enterprises, Inc. — Class A* | 496 | 18,897 | ||||||
| Republic Airways Holdings, Inc.* | 1,496 | 18,730 | ||||||
| United Stationers, Inc. | 448 | 18,713 | ||||||
| Build-A-Bear Workshop, Inc. — Class A* | 1,104 | 18,713 | ||||||
| Allegiant Travel Co. — Class A | 138 | 18,419 | ||||||
| Steelcase, Inc. — Class A | 1,039 | 18,411 | ||||||
| Select Comfort Corp.* | 715 | 18,368 | ||||||
| Strattec Security Corp. | 177 | 18,358 | ||||||
| Big 5 Sporting Goods Corp. | 1,484 | 18,267 | ||||||
| Eros International plc* | 984 | 18,165 | ||||||
| Herman Miller, Inc. | 567 | 18,144 | ||||||
| Monarch Casino & Resort, Inc.* | 1,115 | 18,141 | ||||||
| Commercial Vehicle Group, Inc.* | 2,763 | 18,098 | ||||||
| Empire Resorts, Inc.* | 2,399 | 17,969 | ||||||
| Rentrak Corp.* | 233 | 17,911 | ||||||
Titan Machinery, Inc.*,1 | 1,301 | 17,902 | ||||||
| Systemax, Inc.* | 1,170 | 17,901 | ||||||
| Noodles & Co.* | 784 | 17,899 | ||||||
| BJ’s Restaurants, Inc.* | 404 | 17,784 | ||||||
| Modine Manufacturing Co.* | 1,385 | 17,770 | ||||||
| Weyco Group, Inc. | 565 | 17,599 | ||||||
| Wesco Aircraft Holdings, Inc.* | 991 | 17,590 | ||||||
| Denny’s Corp.* | 2,039 | 17,576 | ||||||
| Zoe’s Kitchen, Inc.* | 480 | 17,501 | ||||||
| Ethan Allen Interiors, Inc. | 612 | 17,320 | ||||||
| Sonic Corp. | 672 | 16,941 | ||||||
| Group 1 Automotive, Inc. | 197 | 16,830 | ||||||
| Papa John’s International, Inc. | 359 | 16,787 | ||||||
| Del Frisco’s Restaurant Group, Inc.* | 722 | 16,765 | ||||||
| Zumiez, Inc.* | 502 | 16,757 | ||||||
| Reading International, Inc. — Class A* | 1,678 | 16,729 | ||||||
| iRobot Corp.* | 467 | 16,681 | ||||||
| Ignite Restaurant Group, Inc.* | 2,419 | 16,667 | ||||||
| America’s Car-Mart, Inc.* | 362 | 16,645 | ||||||
| Popeyes Louisiana Kitchen, Inc.* | 359 | 16,640 | ||||||
| Stein Mart, Inc. | 1,231 | 16,470 | ||||||
| New Home Company, Inc.* | 1,082 | 16,413 | ||||||
| Vince Holding Corp.* | 468 | 16,404 | ||||||
| National CineMedia, Inc. | 1,031 | 16,393 | ||||||
| Nathan’s Famous, Inc.* | 228 | 16,389 | ||||||
| Winmark Corp. | 199 | 16,374 | ||||||
| Speedway Motorsports, Inc. | 835 | 16,341 | ||||||
| Universal Electronics, Inc.* | 287 | 16,327 | ||||||
| Fiesta Restaurant Group, Inc.* | 296 | 16,324 | ||||||
| Speed Commerce, Inc.* | 5,494 | 16,317 | ||||||
| Dorman Products, Inc.* | 351 | 16,272 | ||||||
| Jack in the Box, Inc. | 229 | 16,268 | ||||||
| PC Connection, Inc. | 682 | 16,266 | ||||||
| Cracker Barrel Old Country Store, Inc. | 141 | 16,264 | ||||||
| Gaiam, Inc. — Class A* | 2,148 | 16,260 | ||||||
| Boyd Gaming Corp.* | 1,407 | 16,251 | ||||||
| Penn National Gaming, Inc.* | 1,240 | 16,232 | ||||||
| Johnson Outdoors, Inc. — Class A | 540 | 16,226 | ||||||
| La-Z-Boy, Inc. | 709 | 16,208 | ||||||
| Diamond Resorts International, Inc.* | 624 | 16,199 | ||||||
| DineEquity, Inc. | 182 | 16,191 | ||||||
| Standard Motor Products, Inc. | 408 | 16,124 | ||||||
| American Axle & Manufacturing Holdings, Inc.* | 833 | 16,103 | ||||||
| ScanSource, Inc.* | 420 | 16,036 | ||||||
| Conn’s, Inc.* | 515 | 16,022 | ||||||
| Krispy Kreme Doughnuts, Inc.* | 845 | 15,987 | ||||||
| Steiner Leisure Ltd.* | 379 | 15,986 | ||||||
| Buffalo Wild Wings, Inc.* | 107 | 15,973 | ||||||
| Marriott Vacations Worldwide Corp. | 230 | 15,971 | ||||||
| Brunswick Corp. | 341 | 15,959 | ||||||
| Lifetime Brands, Inc. | 932 | 15,947 | ||||||
| Cooper Tire & Rubber Co. | 493 | 15,880 | ||||||
| Life Time Fitness, Inc.* | 284 | 15,839 | ||||||
| Pool Corp. | 265 | 15,821 | ||||||
| Cavco Industries, Inc.* | 217 | 15,813 | ||||||
| Fred’s, Inc. — Class A | 1,007 | 15,810 | ||||||
| Norcraft Companies, Inc.* | 929 | 15,793 | ||||||
| American Woodmark Corp.* | 386 | 15,791 | ||||||
| H&E Equipment Services, Inc. | 421 | 15,741 | ||||||
| Intrawest Resorts Holdings, Inc.* | 1,479 | 15,737 | ||||||
| AMC Entertainment Holdings, Inc. — Class A | 619 | 15,723 | ||||||
| Barnes & Noble, Inc.* | 719 | 15,689 | ||||||
| MarineMax, Inc.* | 818 | 15,681 | ||||||
| Daktronics, Inc. | 1,178 | 15,679 | ||||||
| MWI Veterinary Supply, Inc.* | 92 | 15,608 | ||||||
| HSN, Inc. | 236 | 15,593 | ||||||
| Carrols Restaurant Group, Inc.* | 2,022 | 15,590 | ||||||
| Fox Factory Holding Corp.* | 920 | 15,585 | ||||||
| Libbey, Inc.* | 541 | 15,554 | ||||||
| Kirkland’s, Inc.* | 873 | 15,540 | ||||||
| Texas Roadhouse, Inc. — Class A | 538 | 15,532 | ||||||
| Superior Industries International, Inc. | 796 | 15,530 | ||||||
| West Marine, Inc.* | 1,575 | 15,498 | ||||||
| Ruth’s Hospitality Group, Inc. | 1,273 | 15,492 | ||||||
| Buckle, Inc. | 314 | 15,490 | ||||||
| Asbury Automotive Group, Inc.* | 221 | 15,479 | ||||||
| Marcus Corp. | 902 | 15,451 | ||||||
| Hibbett Sports, Inc.* | 340 | 15,433 | ||||||
| New York & Company, Inc.* | 4,719 | 15,431 | ||||||
| Skullcandy, Inc.* | 1,850 | 15,429 | ||||||
| Sonic Automotive, Inc. — Class A | 618 | 15,382 | ||||||
| Pier 1 Imports, Inc. | 1,192 | 15,377 | ||||||
| Wolverine World Wide, Inc. | 566 | 15,361 | ||||||
64 | GUGGENHEIM ETFs ANNUAL REPORT | SEE NOTES TO FINANCIAL STATEMENTS. |
SCHEDULE OF INVESTMENTS (continued) | October 31, 2014 |
GUGGENHEIM RUSSELL 2000® EQUAL WEIGHT ETF |
| Shares | Value | |||||||
| Destination XL Group, Inc.* | 2,926 | $ | 15,332 | |||||
| Burlington Stores, Inc.* | 365 | 15,308 | ||||||
| La Quinta Holdings, Inc.* | 750 | 15,308 | ||||||
| Churchill Downs, Inc. | 150 | 15,297 | ||||||
| Interval Leisure Group, Inc. | 727 | 15,296 | ||||||
| Scientific Games Corp. — Class A* | 1,298 | 15,278 | ||||||
| Motorcar Parts of America, Inc.* | 526 | 15,275 | ||||||
| Callaway Golf Co. | 1,948 | 15,272 | ||||||
| Columbia Sportswear Co. | 396 | 15,262 | ||||||
| Marine Products Corp. | 1,808 | 15,260 | ||||||
| Century Communities, Inc.* | 825 | 15,246 | ||||||
| Iconix Brand Group, Inc.* | 381 | 15,244 | ||||||
| Nautilus, Inc.* | 1,139 | 15,240 | ||||||
| Tuesday Morning Corp.* | 747 | 15,231 | ||||||
| M/I Homes, Inc.* | 707 | 15,229 | ||||||
| LGI Homes, Inc.* | 778 | 15,109 | ||||||
| Citi Trends, Inc.* | 666 | 15,085 | ||||||
| Bravo Brio Restaurant Group, Inc.* | 1,081 | 14,993 | ||||||
| Mattress Firm Holding Corp.* | 237 | 14,976 | ||||||
| Movado Group, Inc. | 424 | 14,967 | ||||||
| PriceSmart, Inc. | 168 | 14,957 | ||||||
| Ryland Group, Inc. | 415 | 14,861 | ||||||
| Bob Evans Farms, Inc. | 304 | 14,850 | ||||||
| Beazer Homes USA, Inc.* | 827 | 14,828 | ||||||
| Regis Corp. | 873 | 14,824 | ||||||
| TRI Pointe Homes, Inc.* | 1,081 | 14,799 | ||||||
| Bon-Ton Stores, Inc. | 1,678 | 14,783 | ||||||
| WCI Communities, Inc.* | 788 | 14,783 | ||||||
| Lithia Motors, Inc. — Class A | 190 | 14,748 | ||||||
| Famous Dave’s of America, Inc.* | 565 | 14,730 | ||||||
| William Lyon Homes — Class A* | 622 | 14,717 | ||||||
| Shoe Carnival, Inc. | 799 | 14,702 | ||||||
| Black Diamond, Inc.* | 1,894 | 14,697 | ||||||
| Biglari Holdings, Inc.* | 42 | 14,665 | ||||||
| Vitamin Shoppe, Inc.* | 312 | 14,642 | ||||||
| Pep Boys-Manny Moe & Jack* | 1,536 | 14,638 | ||||||
| ClubCorp Holdings, Inc. | 768 | 14,638 | ||||||
| Bloomin’ Brands, Inc.* | 774 | 14,636 | ||||||
El Pollo Loco Holdings, Inc.*,1 | 410 | 14,617 | ||||||
| Cheesecake Factory, Inc. | 318 | 14,609 | ||||||
| Dana Holding Corp. | 714 | 14,608 | ||||||
| Skechers U.S.A., Inc. — Class A* | 266 | 14,564 | ||||||
| KB Home | 924 | 14,544 | ||||||
| TiVo, Inc.* | 1,114 | 14,538 | ||||||
| Carmike Cinemas, Inc.* | 453 | 14,519 | ||||||
| Genesco, Inc.* | 189 | 14,494 | ||||||
| Vera Bradley, Inc.* | 634 | 14,455 | ||||||
| Fuel Systems Solutions, Inc.* | 1,566 | 14,454 | ||||||
| Children’s Place, Inc. | 293 | 14,430 | ||||||
| Vail Resorts, Inc. | 167 | 14,422 | ||||||
| Meritor, Inc.* | 1,255 | 14,420 | ||||||
| Sequential Brands Group, Inc.* | 1,149 | 14,408 | ||||||
| Morgans Hotel Group Co.* | 1,801 | 14,390 | ||||||
| Restoration Hardware Holdings, Inc.* | 179 | 14,377 | ||||||
| Stage Stores, Inc. | 852 | 14,373 | ||||||
| Meritage Homes Corp.* | 390 | 14,348 | ||||||
| Federal-Mogul Holdings Corp.* | 917 | 14,314 | ||||||
| Cato Corp. — Class A | 400 | 14,268 | ||||||
| Malibu Boats, Inc. — Class A* | 764 | 14,257 | ||||||
| Sportsman’s Warehouse Holdings, Inc.* | 2,039 | 14,253 | ||||||
| Hovnanian Enterprises, Inc. — Class A* | 3,788 | 14,243 | ||||||
| Five Below, Inc.* | 357 | 14,234 | ||||||
| International Speedway Corp. — Class A | 453 | 14,192 | ||||||
| Pinnacle Entertainment, Inc.* | 553 | 14,173 | ||||||
| Office Depot, Inc.* | 2,711 | 14,151 | ||||||
| Oxford Industries, Inc. | 231 | 14,149 | ||||||
| Men’s Wearhouse, Inc. | 300 | 14,109 | ||||||
| Titan International, Inc. | 1,336 | 14,108 | ||||||
| Guess?, Inc. | 636 | 14,100 | ||||||
| Haverty Furniture Companies, Inc. | 639 | 14,064 | ||||||
| Perry Ellis International, Inc.* | 687 | 14,049 | ||||||
| Chuy’s Holdings, Inc.* | 468 | 13,998 | ||||||
| Escalade, Inc. | 1,222 | 13,980 | ||||||
| Sears Hometown and Outlet Stores, Inc.* | 929 | 13,972 | ||||||
| Isle of Capri Casinos, Inc.* | 1,874 | 13,924 | ||||||
| Belmond Ltd. — Class A* | 1,214 | 13,912 | ||||||
| Red Robin Gourmet Burgers, Inc.* | 253 | 13,907 | ||||||
| JAKKS Pacific, Inc.* | 2,178 | 13,896 | ||||||
| Multimedia Games Holding Company, Inc.* | 397 | 13,855 | ||||||
| bebe stores, Inc. | 6,048 | 13,850 | ||||||
| Standard Pacific Corp.* | 1,867 | 13,816 | ||||||
| Lumber Liquidators Holdings, Inc.* | 256 | 13,766 | ||||||
| Arctic Cat, Inc. | 408 | 13,733 | ||||||
| Destination Maternity Corp. | 915 | 13,707 | ||||||
| Steven Madden Ltd.* | 437 | 13,700 | ||||||
| G-III Apparel Group Ltd.* | 172 | 13,648 | ||||||
| Brown Shoe Company, Inc. | 512 | 13,614 | ||||||
| Tilly’s, Inc. — Class A* | 1,909 | 13,592 | ||||||
| Quiksilver, Inc.* | 7,739 | 13,543 | ||||||
| Express, Inc.* | 904 | 13,533 | ||||||
| Flexsteel Industries, Inc. | 394 | 13,518 | ||||||
| Crocs, Inc.* | 1,157 | 13,514 | ||||||
| MDC Holdings, Inc. | 553 | 13,504 | ||||||
| Jamba, Inc.* | 1,008 | 13,457 | ||||||
| Wabash National Corp.* | 1,304 | 13,431 | ||||||
| VOXX International Corp. — Class A* | 1,573 | 13,418 | ||||||
| Tenneco, Inc.* | 256 | 13,404 | ||||||
| ANN, Inc.* | 347 | 13,321 | ||||||
Caesars Entertainment Corp.*,1 | 1,090 | 13,287 | ||||||
| Remy International, Inc. | 709 | 13,102 | ||||||
| Papa Murphy’s Holdings, Inc.* | 1,403 | 13,048 | ||||||
| Finish Line, Inc. — Class A | 489 | 12,944 | ||||||
| Winnebago Industries, Inc.* | 609 | 12,917 | ||||||
| American Eagle Outfitters, Inc. | 1,000 | 12,870 | ||||||
| Aeropostale, Inc.* | 4,271 | 12,856 | ||||||
| Tower International, Inc.* | 523 | 12,709 | ||||||
| SEE NOTES TO FINANCIAL STATEMENTS. | GUGGENHEIM ETFs ANNUAL REPORT | 65 |
SCHEDULE OF INVESTMENTS (continued) | October 31, 2014 |
GUGGENHEIM RUSSELL 2000® EQUAL WEIGHT ETF |
| Shares | Value | |||||||
| Gentherm, Inc.* | 303 | $ | 12,635 | |||||
| LeapFrog Enterprises, Inc. — Class A* | 2,364 | 12,576 | ||||||
| Cooper-Standard Holding, Inc.* | 230 | 12,553 | ||||||
hhgregg, Inc.*,1 | 2,419 | 12,530 | ||||||
| Francesca’s Holdings Corp.* | 1,027 | 12,232 | ||||||
| Pacific Sunwear of California, Inc.* | 7,997 | 12,155 | ||||||
| Tile Shop Holdings, Inc.* | 1,399 | 12,045 | ||||||
| Container Store Group, Inc.* | 621 | 11,451 | ||||||
| UCP, Inc. — Class A* | 774 | 10,596 | ||||||
| EZCORP, Inc. — Class A* | 928 | 10,468 | ||||||
| Cash America International, Inc. | 211 | 10,371 | ||||||
| First Cash Financial Services, Inc.* | 165 | 9,748 | ||||||
| AV Homes, Inc.* | 625 | 9,369 | ||||||
| Christopher & Banks Corp.* | 1,410 | 9,207 | ||||||
| Total Consumer, Cyclical | 4,371,411 | |||||||
| COMMUNICATIONS - 10.3% | ||||||||
Consolidated Communications Holdings, Inc.1 | 5,342 | 138,357 | ||||||
| Inteliquent, Inc. | 5,468 | 92,026 | ||||||
| Atlantic Tele-Network, Inc. | 1,232 | 82,778 | ||||||
| 8x8, Inc.* | 10,456 | 82,185 | ||||||
| Lumos Networks Corp. | 4,742 | 81,562 | ||||||
| Spok Holdings, Inc. | 5,004 | 81,265 | ||||||
| Shenandoah Telecommunications Co. | 2,688 | 79,538 | ||||||
| Intelsat S.A.* | 4,020 | 78,229 | ||||||
| West Corp. | 2,357 | 75,424 | ||||||
| Iridium Communications, Inc.* | 7,764 | 73,758 | ||||||
| j2 Global, Inc. | 1,362 | 73,670 | ||||||
| ORBCOMM, Inc.* | 11,600 | 73,312 | ||||||
| Cincinnati Bell, Inc.* | 19,900 | 73,033 | ||||||
| Vonage Holdings Corp.* | 20,944 | 72,885 | ||||||
| General Communication, Inc. — Class A* | 6,152 | 72,163 | ||||||
| FairPoint Communications, Inc.* | 4,336 | 71,978 | ||||||
| IDT Corp. — Class B | 4,347 | 71,639 | ||||||
| Hawaiian Telcom Holdco, Inc.* | 2,597 | 69,859 | ||||||
| Cogent Communications Holdings, Inc. | 2,045 | 69,407 | ||||||
Gogo, Inc.*,1 | 3,814 | 63,352 | ||||||
magicJack VocalTec Ltd.*,1 | 6,732 | 62,608 | ||||||
| NTELOS Holdings Corp. | 6,048 | 60,963 | ||||||
| Premiere Global Services, Inc.* | 5,599 | 58,622 | ||||||
Globalstar, Inc.*,1 | 17,717 | 41,989 | ||||||
| RigNet, Inc.* | 925 | 40,191 | ||||||
| Move, Inc.* | 1,002 | 20,992 | ||||||
| Gigamon, Inc.* | 1,379 | 20,602 | ||||||
| Dice Holdings, Inc.* | 2,048 | 20,418 | ||||||
| VASCO Data Security International, Inc.* | 803 | 20,331 | ||||||
| TubeMogul, Inc.* | 1,278 | 19,861 | ||||||
| Infinera Corp.* | 1,363 | 19,804 | ||||||
| Overstock.com, Inc.* | 819 | 18,934 | ||||||
| Global Sources Ltd.* | 2,548 | 18,677 | ||||||
| Entravision Communications Corp. — Class A | 3,617 | 18,663 | ||||||
| RetailMeNot, Inc.* | 879 | 18,512 | ||||||
| Oplink Communications, Inc. | 880 | 18,347 | ||||||
| HealthStream, Inc.* | 592 | 18,328 | ||||||
| InterDigital, Inc. | 368 | 18,190 | ||||||
| Sapient Corp.* | 1,046 | 18,116 | ||||||
| Preformed Line Products Co. | 315 | 17,952 | ||||||
| Numerex Corp. — Class A* | 1,371 | 17,878 | ||||||
| Internap Network Services Corp.* | 2,215 | 17,742 | ||||||
| Entercom Communications Corp. — Class A* | 1,724 | 17,723 | ||||||
| Zendesk, Inc.* | 673 | 17,498 | ||||||
| ShoreTel, Inc.* | 2,147 | 17,369 | ||||||
| Calix, Inc.* | 1,600 | 17,296 | ||||||
| Clearfield, Inc.* | 1,166 | 17,117 | ||||||
| Meredith Corp. | 328 | 17,101 | ||||||
| Blue Nile, Inc.* | 479 | 17,005 | ||||||
| Martha Stewart Living Omnimedia, Inc. — Class A* | 3,890 | 16,844 | ||||||
| TechTarget, Inc.* | 1,747 | 16,666 | ||||||
| Stamps.com, Inc.* | 451 | 16,642 | ||||||
| comScore, Inc.* | 394 | 16,603 | ||||||
| ViaSat, Inc.* | 265 | 16,600 | ||||||
| ReachLocal, Inc.* | 3,663 | 16,593 | ||||||
| Hemisphere Media Group, Inc.* | 1,292 | 16,538 | ||||||
| XO Group, Inc.* | 1,283 | 16,333 | ||||||
| 1-800-Flowers.com, Inc. — Class A* | 2,030 | 16,301 | ||||||
| New Media Investment Group, Inc. | 855 | 16,296 | ||||||
| Brightcove, Inc.* | 2,537 | 16,262 | ||||||
ParkerVision, Inc.*,1 | 12,407 | 16,253 | ||||||
| RF Micro Devices, Inc.* | 1,244 | 16,184 | ||||||
| New York Times Co. — Class A | 1,256 | 16,127 | ||||||
| Coupons.com, Inc.* | 1,156 | 16,092 | ||||||
| RingCentral, Inc. — Class A* | 1,223 | 16,070 | ||||||
| Media General, Inc. — Class A* | 1,075 | 16,061 | ||||||
| KVH Industries, Inc.* | 1,243 | 16,060 | ||||||
| Crown Media Holdings, Inc. — Class A* | 4,599 | 16,051 | ||||||
| CalAmp Corp.* | 830 | 16,002 | ||||||
| Gray Television, Inc.* | 1,730 | 15,985 | ||||||
| Sinclair Broadcast Group, Inc. — Class A | 550 | 15,978 | ||||||
| Nexstar Broadcasting Group, Inc. — Class A | 354 | 15,972 | ||||||
| Lands’ End, Inc.* | 336 | 15,950 | ||||||
| ePlus, Inc.* | 261 | 15,939 | ||||||
| Journal Communications, Inc. — Class A* | 1,615 | 15,843 | ||||||
| Perficient, Inc.* | 955 | 15,834 | ||||||
| Blucora, Inc.* | 934 | 15,831 | ||||||
| Telenav, Inc.* | 2,188 | 15,797 | ||||||
| NETGEAR, Inc.* | 464 | 15,795 | ||||||
| Plantronics, Inc. | 304 | 15,768 | ||||||
VirnetX Holding Corp.*,1 | 2,686 | 15,767 | ||||||
| EW Scripps Co. — Class A* | 818 | 15,706 | ||||||
| Q2 Holdings, Inc.* | 1,040 | 15,694 | ||||||
| GTT Communications, Inc.* | 1,208 | 15,680 | ||||||
| Intralinks Holdings, Inc.* | 1,814 | 15,673 | ||||||
| AH Belo Corp. — Class A | 1,359 | 15,642 | ||||||
Millennial Media, Inc.*,1 | 7,625 | 15,631 | ||||||
| Scholastic Corp. | 449 | 15,630 | ||||||
| Tessco Technologies, Inc. | 492 | 15,621 | ||||||
66 | GUGGENHEIM ETFs ANNUAL REPORT | SEE NOTES TO FINANCIAL STATEMENTS. |
SCHEDULE OF INVESTMENTS (continued) | October 31, 2014 |
GUGGENHEIM RUSSELL 2000® EQUAL WEIGHT ETF |
| Shares | Value | |||||||
| ValueVision Media, Inc. — Class A* | 2,757 | $ | 15,605 | |||||
Chegg, Inc.*,1 | 2,344 | 15,588 | ||||||
| NeuStar, Inc. — Class A* | 590 | 15,582 | ||||||
| Lionbridge Technologies, Inc.* | 3,225 | 15,577 | ||||||
| Lee Enterprises, Inc.* | 4,172 | 15,562 | ||||||
| Shutterstock, Inc.* | 200 | 15,552 | ||||||
| Loral Space & Communications, Inc.* | 203 | 15,530 | ||||||
| Liquidity Services, Inc.* | 1,215 | 15,528 | ||||||
| Polycom, Inc.* | 1,183 | 15,474 | ||||||
| Saga Communications, Inc. — Class A | 385 | 15,439 | ||||||
| Wix.com Ltd.* | 908 | 15,427 | ||||||
| NIC, Inc. | 837 | 15,426 | ||||||
| Endurance International Group Holdings, Inc.* | 928 | 15,423 | ||||||
| Harmonic, Inc.* | 2,306 | 15,381 | ||||||
| LogMeIn, Inc.* | 320 | 15,376 | ||||||
| Global Eagle Entertainment, Inc.* | 1,255 | 15,349 | ||||||
| GrubHub, Inc.* | 422 | 15,344 | ||||||
| Ixia* | 1,591 | 15,321 | ||||||
| Central European Media Enterprises Ltd. — Class A* | 6,286 | 15,275 | ||||||
| Limelight Networks, Inc.* | 6,257 | 15,267 | ||||||
| Marketo, Inc.* | 473 | 15,264 | ||||||
Vringo, Inc.*,1 | 14,788 | 15,232 | ||||||
| Marin Software, Inc.* | 1,694 | 15,161 | ||||||
| Bazaarvoice, Inc.* | 2,031 | 15,131 | ||||||
| MDC Partners, Inc. — Class A | 730 | 15,111 | ||||||
| Orbitz Worldwide, Inc.* | 1,827 | 15,109 | ||||||
| Cyan, Inc.* | 4,784 | 15,070 | ||||||
| Angie’s List, Inc.* | 2,161 | 15,062 | ||||||
| TeleCommunication Systems, Inc. — Class A* | 5,229 | 15,060 | ||||||
| Oclaro, Inc.* | 9,569 | 15,023 | ||||||
| Townsquare Media, Inc. — Class A* | 1,190 | 15,006 | ||||||
| Daily Journal Corp.* | 82 | 14,977 | ||||||
Rocket Fuel, Inc.*,1 | 957 | 14,948 | ||||||
| Cinedigm Corp. — Class A* | 9,632 | 14,930 | ||||||
| Conversant, Inc.* | 422 | 14,876 | ||||||
| Web.com Group, Inc.* | 724 | 14,864 | ||||||
| FTD Companies, Inc.* | 421 | 14,811 | ||||||
YuMe, Inc.*,1 | 2,958 | 14,760 | ||||||
| ADTRAN, Inc. | 695 | 14,741 | ||||||
| Comtech Telecommunications Corp. | 387 | 14,733 | ||||||
| Alliance Fiber Optic Products, Inc. | 1,138 | 14,692 | ||||||
| Anixter International, Inc. | 172 | 14,649 | ||||||
| EarthLink Holdings Corp. | 4,090 | 14,642 | ||||||
| Harte-Hanks, Inc. | 2,249 | 14,641 | ||||||
| Houghton Mifflin Harcourt Co.* | 730 | 14,607 | ||||||
| Aruba Networks, Inc.* | 676 | 14,588 | ||||||
| Reis, Inc. | 622 | 14,555 | ||||||
| Salem Communications Corp. — Class A | 1,886 | 14,541 | ||||||
| McClatchy Co. — Class A* | 4,078 | 14,518 | ||||||
| RealNetworks, Inc.* | 2,091 | 14,428 | ||||||
| DigitalGlobe, Inc.* | 504 | 14,409 | ||||||
| Time, Inc. | 637 | 14,390 | ||||||
| Sonus Networks, Inc.* | 4,101 | 14,230 | ||||||
| Ruckus Wireless, Inc.* | 1,094 | 14,200 | ||||||
| Ciena Corp.* | 844 | 14,146 | ||||||
| Finisar Corp.* | 845 | 14,128 | ||||||
| ModusLink Global Solutions, Inc.* | 4,033 | 14,116 | ||||||
| QuinStreet, Inc.* | 3,435 | 13,912 | ||||||
| Black Box Corp. | 631 | 13,876 | ||||||
| Zix Corp.* | 4,195 | 13,844 | ||||||
| Rubicon Project, Inc.* | 1,205 | 13,809 | ||||||
| Comverse, Inc.* | 631 | 13,756 | ||||||
TrueCar, Inc.*,1 | 818 | 13,742 | ||||||
| Bankrate, Inc.* | 1,264 | 13,727 | ||||||
| Cumulus Media, Inc. — Class A* | 3,554 | 13,718 | ||||||
| Textura Corp.* | 511 | 13,613 | ||||||
| Trulia, Inc.* | 291 | 13,575 | ||||||
| Ubiquiti Networks, Inc. | 379 | 13,557 | ||||||
| WebMD Health Corp. — Class A* | 314 | 13,402 | ||||||
| Tremor Video, Inc.* | 5,697 | 13,388 | ||||||
| Rightside Group Ltd.* | 1,381 | 13,078 | ||||||
| ChannelAdvisor Corp.* | 935 | 12,987 | ||||||
World Wrestling Entertainment, Inc. — Class A1 | 1,040 | 12,844 | ||||||
| Marchex, Inc. — Class B | 3,332 | 12,762 | ||||||
| Radio One, Inc. — Class D* | 4,913 | 12,233 | ||||||
| Travelzoo, Inc.* | 931 | 12,187 | ||||||
| Borderfree, Inc.* | 1,107 | 12,133 | ||||||
| Shutterfly, Inc.* | 289 | 12,089 | ||||||
| Unwired Planet, Inc.* | 7,746 | 12,006 | ||||||
Dex Media, Inc.*,1 | 1,531 | 11,926 | ||||||
| Extreme Networks, Inc.* | 3,218 | 11,553 | ||||||
| Procera Networks, Inc.* | 1,525 | 11,422 | ||||||
| Demand Media, Inc.* | 1,620 | 11,405 | ||||||
| Sizmek, Inc.* | 1,824 | 10,452 | ||||||
| Safeguard Scientifics, Inc.* | 495 | 9,875 | ||||||
| Aerohive Networks, Inc.* | 1,924 | 9,620 | ||||||
| Covisint Corp.* | 193 | 558 | ||||||
| Total Communications | 4,148,987 | |||||||
| ENERGY - 8.6% | ||||||||
| Pattern Energy Group, Inc. | 2,212 | 63,661 | ||||||
| Gulf Island Fabrication, Inc. | 2,128 | 44,986 | ||||||
| Helix Energy Solutions Group, Inc.* | 1,647 | 43,875 | ||||||
Walter Energy, Inc.1 | 17,762 | 42,807 | ||||||
| Alon USA Energy, Inc. | 2,633 | 42,232 | ||||||
| Isramco, Inc.* | 322 | 42,181 | ||||||
| Trecora Resources* | 3,145 | 41,357 | ||||||
| Western Refining, Inc. | 905 | 41,259 | ||||||
| Apco Oil and Gas International, Inc.* | 2,866 | 41,069 | ||||||
| SEACOR Holdings, Inc.* | 497 | 40,977 | ||||||
| Natural Gas Services Group, Inc.* | 1,590 | 40,911 | ||||||
| Enphase Energy, Inc.* | 2,706 | 40,644 | ||||||
| Contango Oil & Gas Co.* | 1,093 | 39,971 | ||||||
| Renewable Energy Group, Inc.* | 3,757 | 39,561 | ||||||
| SunCoke Energy, Inc.* | 1,644 | 39,292 | ||||||
| SEE NOTES TO FINANCIAL STATEMENTS. | GUGGENHEIM ETFs ANNUAL REPORT | 67 |
SCHEDULE OF INVESTMENTS (continued) | October 31, 2014 |
GUGGENHEIM RUSSELL 2000® EQUAL WEIGHT ETF |
| Shares | Value | |||||||
| Evolution Petroleum Corp. | 4,135 | $ | 39,117 | |||||
| FutureFuel Corp. | 2,878 | 38,335 | ||||||
| Delek US Holdings, Inc. | 1,130 | 38,296 | ||||||
| Westmoreland Coal Co.* | 1,046 | 38,252 | ||||||
| Matrix Service Co.* | 1,525 | 38,217 | ||||||
| Hallador Energy Co. | 3,163 | 37,956 | ||||||
Solazyme, Inc.*,1 | 4,945 | 37,928 | ||||||
FX Energy, Inc.*,1 | 12,611 | 37,833 | ||||||
Arch Coal, Inc.1 | 17,515 | 37,832 | ||||||
| RSP Permian, Inc.* | 1,545 | 37,806 | ||||||
| Synergy Resources Corp.* | 3,036 | 37,009 | ||||||
| Matador Resources Co.* | 1,515 | 36,769 | ||||||
FuelCell Energy, Inc.*,1 | 18,188 | 36,740 | ||||||
| Cloud Peak Energy, Inc.* | 3,068 | 36,724 | ||||||
| TerraForm Power, Inc. — Class A* | 1,285 | 36,571 | ||||||
| ION Geophysical Corp.* | 13,001 | 36,403 | ||||||
| Carrizo Oil & Gas, Inc.* | 696 | 36,150 | ||||||
| Diamondback Energy, Inc.* | 521 | 35,657 | ||||||
| Tesco Corp. | 1,867 | 35,548 | ||||||
| Pacific Ethanol, Inc.* | 2,514 | 35,473 | ||||||
| REX American Resources Corp.* | 486 | 35,361 | ||||||
| Newpark Resources, Inc.* | 3,091 | 35,330 | ||||||
| Harvest Natural Resources, Inc.* | 9,411 | 35,009 | ||||||
| SemGroup Corp. — Class A | 456 | 34,998 | ||||||
| North Atlantic Drilling Ltd. | 5,647 | 34,955 | ||||||
| Green Plains, Inc. | 1,020 | 34,884 | ||||||
| Exterran Holdings, Inc. | 875 | 34,414 | ||||||
| Mitcham Industries, Inc.* | 3,351 | 34,180 | ||||||
| TransAtlantic Petroleum Ltd.* | 4,090 | 33,743 | ||||||
| Parker Drilling Co.* | 7,521 | 33,393 | ||||||
| Rosetta Resources, Inc.* | 869 | 33,048 | ||||||
| Forum Energy Technologies, Inc.* | 1,204 | 32,869 | ||||||
| Adams Resources & Energy, Inc. | 778 | 32,715 | ||||||
| PetroQuest Energy, Inc.* | 6,954 | 32,684 | ||||||
| VAALCO Energy, Inc.* | 4,394 | 32,603 | ||||||
Clean Energy Fuels Corp.*,1 | 4,451 | 32,537 | ||||||
| TETRA Technologies, Inc.* | 3,369 | 32,107 | ||||||
| Clayton Williams Energy, Inc.* | 383 | 31,843 | ||||||
| Parsley Energy, Inc. — Class A* | 1,862 | 31,598 | ||||||
| Flotek Industries, Inc.* | 1,410 | 31,246 | ||||||
| PDC Energy, Inc.* | 714 | 31,216 | ||||||
| Dawson Geophysical Co. | 1,829 | 31,075 | ||||||
| Bonanza Creek Energy, Inc.* | 677 | 30,627 | ||||||
Alpha Natural Resources, Inc.*,1 | 15,569 | 30,515 | ||||||
| Geospace Technologies Corp.* | 989 | 30,451 | ||||||
| Kodiak Oil & Gas Corp.* | 2,807 | 30,288 | ||||||
EXCO Resources, Inc.1 | 9,930 | 30,287 | ||||||
| W&T Offshore, Inc. | 3,304 | 30,033 | ||||||
| CARBO Ceramics, Inc. | 579 | 29,917 | ||||||
| Eclipse Resources Corp.* | 2,272 | 29,786 | ||||||
Miller Energy Resources, Inc.*,1 | 8,502 | 29,587 | ||||||
| Abraxas Petroleum Corp.* | 7,152 | 29,538 | ||||||
| Stone Energy Corp.* | 1,202 | 29,449 | ||||||
| Magnum Hunter Resources Corp.* | 6,305 | 29,255 | ||||||
Amyris, Inc.*,1 | 9,578 | 28,926 | ||||||
| Northern Oil and Gas, Inc.* | 2,556 | 28,883 | ||||||
Halcon Resources Corp.*,1 | 9,250 | 28,768 | ||||||
| Callon Petroleum Co.* | 4,304 | 28,234 | ||||||
| Hercules Offshore, Inc.* | 16,666 | 27,499 | ||||||
| Triangle Petroleum Corp.* | 3,455 | 26,776 | ||||||
| Penn Virginia Corp.* | 3,068 | 26,293 | ||||||
| Bill Barrett Corp.* | 1,724 | 26,205 | ||||||
| Panhandle Oil and Gas, Inc. — Class A | 1,264 | 25,988 | ||||||
| Vantage Drilling Co.* | 26,831 | 25,959 | ||||||
Swift Energy Co.*,1 | 3,753 | 25,708 | ||||||
| Willbros Group, Inc.* | 4,324 | 25,382 | ||||||
| C&J Energy Services, Inc.* | 1,302 | 25,142 | ||||||
Approach Resources, Inc.*,1 | 2,531 | 25,057 | ||||||
| Forest Oil Corp.* | 30,758 | 24,914 | ||||||
| Pioneer Energy Services Corp.* | 2,708 | 24,859 | ||||||
| Jones Energy, Inc. — Class A* | 2,008 | 24,819 | ||||||
| Independence Contract Drilling, Inc.* | 3,345 | 24,519 | ||||||
| Gastar Exploration, Inc.* | 6,112 | 24,448 | ||||||
| Warren Resources, Inc.* | 6,993 | 24,196 | ||||||
| McDermott International, Inc.* | 6,274 | 24,092 | ||||||
| Energy XXI Bermuda Ltd. | 3,119 | 23,985 | ||||||
| Sanchez Energy Corp.* | 1,399 | 23,881 | ||||||
| BPZ Resources, Inc.* | 19,204 | 23,813 | ||||||
| Comstock Resources, Inc. | 1,970 | 23,325 | ||||||
| Key Energy Services, Inc.* | 7,612 | 23,140 | ||||||
Quicksilver Resources, Inc.*,1 | 42,036 | 22,977 | ||||||
Nuverra Environmental Solutions, Inc.*,1 | 2,397 | 22,700 | ||||||
| Rex Energy Corp.* | 2,879 | 22,571 | ||||||
| Basic Energy Services, Inc.* | 1,708 | 22,033 | ||||||
Goodrich Petroleum Corp.*,1 | 2,548 | 20,996 | ||||||
| Resolute Energy Corp.* | 5,613 | 19,533 | ||||||
Midstates Petroleum Company, Inc.*,1 | 6,358 | 18,883 | ||||||
| Bristow Group, Inc. | 255 | 18,845 | ||||||
Emerald Oil, Inc.*,1 | 5,921 | 18,829 | ||||||
Plug Power, Inc.*,1 | 3,977 | 18,732 | ||||||
| PHI, Inc.* | 403 | 18,030 | ||||||
| Primoris Services Corp. | 618 | 17,749 | ||||||
| Thermon Group Holdings, Inc.* | 692 | 16,864 | ||||||
| Vertex Energy, Inc.* | 2,611 | 16,502 | ||||||
| Gulfmark Offshore, Inc. — Class A | 513 | 15,472 | ||||||
| American Eagle Energy Corp.* | 8,860 | 15,416 | ||||||
| Total Energy | 3,451,883 | |||||||
| TECHNOLOGY - 7.3% | ||||||||
| inContact, Inc.* | 7,872 | 70,060 | ||||||
| Cabot Microelectronics Corp.* | 845 | 40,755 | ||||||
| Digital River, Inc.* | 1,006 | 25,722 | ||||||
| Engility Holdings, Inc.* | 530 | 22,895 | ||||||
| Maxwell Technologies, Inc.* | 1,869 | 21,792 | ||||||
| Imperva, Inc.* | 521 | 21,344 | ||||||
| Digimarc Corp. | 719 | 20,844 | ||||||
| MAXIMUS, Inc. | 425 | 20,595 | ||||||
68 | GUGGENHEIM ETFs ANNUAL REPORT | SEE NOTES TO FINANCIAL STATEMENTS. |
SCHEDULE OF INVESTMENTS (continued) | October 31, 2014 |
GUGGENHEIM RUSSELL 2000® EQUAL WEIGHT ETF |
| Shares | Value | |||||||
| Cray, Inc.* | 575 | $ | 19,930 | |||||
| Convergys Corp. | 957 | 19,302 | ||||||
| Barracuda Networks, Inc.* | 599 | 19,258 | ||||||
| ExlService Holdings, Inc.* | 688 | 19,257 | ||||||
RealPage, Inc.*,1 | 959 | 19,054 | ||||||
| InnerWorkings, Inc.* | 2,096 | 19,033 | ||||||
| QLogic Corp.* | 1,594 | 18,826 | ||||||
| Sykes Enterprises, Inc.* | 865 | 18,632 | ||||||
| Mercury Systems, Inc.* | 1,330 | 18,593 | ||||||
| Tyler Technologies, Inc.* | 165 | 18,466 | ||||||
| Qualys, Inc.* | 569 | 18,253 | ||||||
| Vocera Communications, Inc.* | 1,743 | 18,040 | ||||||
| MicroStrategy, Inc. — Class A* | 112 | 18,019 | ||||||
| TeleTech Holdings, Inc.* | 692 | 17,861 | ||||||
| Constant Contact, Inc.* | 501 | 17,715 | ||||||
| Manhattan Associates, Inc.* | 440 | 17,648 | ||||||
| Electronics for Imaging, Inc.* | 386 | 17,648 | ||||||
| Callidus Software, Inc.* | 1,252 | 17,641 | ||||||
| Actua Corp.* | 930 | 17,484 | ||||||
| Synchronoss Technologies, Inc.* | 338 | 17,464 | ||||||
| FleetMatics Group plc* | 470 | 17,456 | ||||||
| Proofpoint, Inc.* | 394 | 17,352 | ||||||
| Entegris, Inc.* | 1,276 | 17,328 | ||||||
Violin Memory, Inc.*,1 | 3,580 | 17,327 | ||||||
| 2U, Inc.* | 946 | 17,218 | ||||||
| RealD, Inc.* | 1,515 | 17,150 | ||||||
| EPAM Systems, Inc.* | 359 | 17,139 | ||||||
| Interactive Intelligence Group, Inc.* | 355 | 17,132 | ||||||
| Rosetta Stone, Inc.* | 1,790 | 17,130 | ||||||
| CEVA, Inc.* | 1,047 | 17,067 | ||||||
| Blackbaud, Inc. | 383 | 17,043 | ||||||
| Virtusa Corp.* | 415 | 17,007 | ||||||
| Datalink Corp.* | 1,343 | 16,989 | ||||||
| CACI International, Inc. — Class A* | 206 | 16,952 | ||||||
| Super Micro Computer, Inc.* | 528 | 16,875 | ||||||
| Brooks Automation, Inc. | 1,366 | 16,843 | ||||||
| LivePerson, Inc.* | 1,166 | 16,790 | ||||||
| QAD, Inc. — Class A | 780 | 16,778 | ||||||
| Take-Two Interactive Software, Inc.* | 634 | 16,769 | ||||||
| Unisys Corp.* | 651 | 16,692 | ||||||
| Demandware, Inc.* | 278 | 16,666 | ||||||
| SYNNEX Corp. | 240 | 16,603 | ||||||
| Pericom Semiconductor Corp.* | 1,516 | 16,570 | ||||||
| MTS Systems Corp. | 251 | 16,569 | ||||||
| Dot Hill Systems Corp.* | 4,183 | 16,523 | ||||||
| Tessera Technologies, Inc. | 542 | 16,471 | ||||||
| Axcelis Technologies, Inc.* | 7,547 | 16,452 | ||||||
| SPS Commerce, Inc.* | 282 | 16,441 | ||||||
| Pegasystems, Inc. | 756 | 16,382 | ||||||
| Progress Software Corp.* | 632 | 16,369 | ||||||
| PROS Holdings, Inc.* | 585 | 16,368 | ||||||
| Emulex Corp.* | 2,888 | 16,346 | ||||||
| Inphi Corp.* | 1,055 | 16,332 | ||||||
| Guidewire Software, Inc.* | 327 | 16,330 | ||||||
| Merge Healthcare, Inc.* | 5,938 | 16,330 | ||||||
| Silicon Laboratories, Inc.* | 358 | 16,320 | ||||||
| Infoblox, Inc.* | 1,011 | 16,318 | ||||||
| Ambarella, Inc.* | 368 | 16,299 | ||||||
| TriQuint Semiconductor, Inc.* | 753 | 16,288 | ||||||
| Photronics, Inc.* | 1,807 | 16,245 | ||||||
| Tangoe, Inc.* | 1,107 | 16,240 | ||||||
| Digi International, Inc.* | 1,957 | 16,204 | ||||||
| SS&C Technologies Holdings, Inc.* | 334 | 16,139 | ||||||
| DSP Group, Inc.* | 1,664 | 16,124 | ||||||
| American Software, Inc. — Class A | 1,669 | 16,123 | ||||||
| Luxoft Holding, Inc.* | 403 | 16,116 | ||||||
| Nimble Storage, Inc.* | 589 | 16,115 | ||||||
| IXYS Corp. | 1,375 | 16,046 | ||||||
| Acxiom Corp.* | 851 | 16,033 | ||||||
| Quantum Corp.* | 12,513 | 16,017 | ||||||
| MKS Instruments, Inc. | 439 | 15,980 | ||||||
| Science Applications International Corp. | 326 | 15,945 | ||||||
| AVG Technologies N.V.* | 888 | 15,913 | ||||||
| Verint Systems, Inc.* | 276 | 15,867 | ||||||
| Omnicell, Inc.* | 491 | 15,864 | ||||||
| Sapiens International Corporation N.V.* | 2,003 | 15,864 | ||||||
| FormFactor, Inc.* | 1,989 | 15,852 | ||||||
| Kopin Corp.* | 4,159 | 15,804 | ||||||
| Ultimate Software Group, Inc.* | 105 | 15,803 | ||||||
| Actuate Corp.* | 3,679 | 15,783 | ||||||
| Qlik Technologies, Inc.* | 550 | 15,593 | ||||||
| Integrated Device Technology, Inc.* | 946 | 15,524 | ||||||
| Diodes, Inc.* | 601 | 15,524 | ||||||
| Silicon Image, Inc.* | 2,893 | 15,506 | ||||||
| Veeco Instruments, Inc.* | 429 | 15,440 | ||||||
| Exar Corp.* | 1,616 | 15,433 | ||||||
Ebix, Inc.1 | 1,046 | 15,429 | ||||||
| ACI Worldwide, Inc.* | 801 | 15,411 | ||||||
| Microsemi Corp.* | 590 | 15,381 | ||||||
| Jive Software, Inc.* | 2,516 | 15,373 | ||||||
| BroadSoft, Inc.* | 671 | 15,366 | ||||||
| Dealertrack Technologies, Inc.* | 326 | 15,338 | ||||||
| Paycom Software, Inc.* | 862 | 15,301 | ||||||
| Silver Spring Networks, Inc.* | 1,590 | 15,232 | ||||||
| Everyday Health, Inc.* | 1,112 | 15,202 | ||||||
| PMC-Sierra, Inc.* | 1,944 | 15,144 | ||||||
| Cornerstone OnDemand, Inc.* | 417 | 15,125 | ||||||
| Cavium, Inc.* | 293 | 15,034 | ||||||
| Envestnet, Inc.* | 337 | 14,970 | ||||||
| Cascade Microtech, Inc.* | 1,393 | 14,961 | ||||||
| ManTech International Corp. — Class A | 529 | 14,897 | ||||||
| MobileIron, Inc.* | 1,479 | 14,879 | ||||||
| OmniVision Technologies, Inc.* | 555 | 14,863 | ||||||
| iGATE Corp.* | 401 | 14,857 | ||||||
| Carbonite, Inc.* | 1,356 | 14,835 | ||||||
| Model N, Inc.* | 1,520 | 14,820 | ||||||
| SEE NOTES TO FINANCIAL STATEMENTS. | GUGGENHEIM ETFs ANNUAL REPORT | 69 |
SCHEDULE OF INVESTMENTS (continued) | October 31, 2014 |
GUGGENHEIM RUSSELL 2000® EQUAL WEIGHT ETF |
| Shares | Value | |||||||
| International Rectifier Corp.* | 372 | $ | 14,794 | |||||
| OPOWER, Inc.* | 814 | 14,782 | ||||||
| Micrel, Inc. | 1,214 | 14,738 | ||||||
| Aspen Technology, Inc.* | 399 | 14,735 | ||||||
| Mentor Graphics Corp. | 694 | 14,706 | ||||||
| Peregrine Semiconductor Corp.* | 1,183 | 14,705 | ||||||
| Insight Enterprises, Inc.* | 645 | 14,674 | ||||||
| Syntel, Inc.* | 169 | 14,637 | ||||||
| Monolithic Power Systems, Inc. | 330 | 14,583 | ||||||
| Quality Systems, Inc. | 965 | 14,581 | ||||||
| CSG Systems International, Inc. | 550 | 14,581 | ||||||
| Cypress Semiconductor Corp. | 1,467 | 14,538 | ||||||
| Monotype Imaging Holdings, Inc. | 508 | 14,534 | ||||||
| MaxLinear, Inc. — Class A* | 2,048 | 14,520 | ||||||
| Vitesse Semiconductor Corp.* | 4,171 | 14,515 | ||||||
| Computer Programs & Systems, Inc. | 230 | 14,485 | ||||||
| Integrated Silicon Solution, Inc. | 1,066 | 14,476 | ||||||
| Cvent, Inc.* | 558 | 14,475 | ||||||
| Guidance Software, Inc.* | 2,140 | 14,402 | ||||||
| Rubicon Technology, Inc.* | 3,246 | 14,380 | ||||||
| Benefitfocus, Inc.* | 516 | 14,298 | ||||||
| Rudolph Technologies, Inc.* | 1,621 | 14,232 | ||||||
| Ultra Clean Holdings, Inc.* | 1,621 | 14,232 | ||||||
| Alpha & Omega Semiconductor Ltd.* | 1,531 | 14,192 | ||||||
| MedAssets, Inc.* | 655 | 14,187 | ||||||
| Fairchild Semiconductor International, Inc. — Class A* | 923 | 14,168 | ||||||
| SciQuest, Inc.* | 950 | 14,165 | ||||||
| Seachange International, Inc.* | 2,091 | 14,135 | ||||||
| Ciber, Inc.* | 4,319 | 14,123 | ||||||
| Mavenir Systems, Inc.* | 1,146 | 14,050 | ||||||
| Compuware Corp. | 1,379 | 13,997 | ||||||
| Bottomline Technologies de, Inc.* | 557 | 13,975 | ||||||
| Agilysys, Inc.* | 1,230 | 13,899 | ||||||
| Applied Micro Circuits Corp.* | 2,122 | 13,729 | ||||||
| Silicon Graphics International Corp.* | 1,579 | 13,706 | ||||||
| Immersion Corp.* | 1,621 | 13,649 | ||||||
| Power Integrations, Inc. | 270 | 13,597 | ||||||
| Rambus, Inc.* | 1,186 | 13,580 | ||||||
| Medidata Solutions, Inc.* | 300 | 13,533 | ||||||
| Eastman Kodak Co.* | 627 | 13,524 | ||||||
| Semtech Corp.* | 532 | 13,502 | ||||||
| Spansion, Inc. — Class A* | 656 | 13,500 | ||||||
QuickLogic Corp.*,1 | 4,663 | 13,429 | ||||||
| Intersil Corp. — Class A | 1,006 | 13,370 | ||||||
| Synaptics, Inc.* | 195 | 13,344 | ||||||
| Cirrus Logic, Inc.* | 691 | 13,336 | ||||||
| Entropic Communications, Inc.* | 5,324 | 13,310 | ||||||
| Lattice Semiconductor Corp.* | 1,968 | 13,205 | ||||||
| Epiq Systems, Inc. | 816 | 13,089 | ||||||
| Nanometrics, Inc.* | 966 | 13,080 | ||||||
| CommVault Systems, Inc.* | 294 | 13,036 | ||||||
Castlight Health, Inc. — Class B*,1 | 1,039 | 12,998 | ||||||
| Xcerra Corp.* | 1,527 | 12,964 | ||||||
| Rally Software Development Corp.* | 1,268 | 12,959 | ||||||
| Varonis Systems, Inc.* | 656 | 12,779 | ||||||
KEYW Holding Corp.*,1 | 1,240 | 12,586 | ||||||
Park City Group, Inc.*,1 | 1,486 | 12,512 | ||||||
| Cohu, Inc. | 1,222 | 12,464 | ||||||
| Kofax Ltd.* | 1,926 | 12,230 | ||||||
| Ultratech, Inc.* | 638 | 12,205 | ||||||
| NetScout Systems, Inc.* | 328 | 12,090 | ||||||
| Amber Road, Inc.* | 898 | 11,988 | ||||||
| Computer Task Group, Inc. | 1,304 | 11,475 | ||||||
| Amkor Technology, Inc.* | 1,669 | 11,316 | ||||||
| PDF Solutions, Inc.* | 835 | 10,830 | ||||||
| Five9, Inc.* | 2,444 | 10,754 | ||||||
| Fair Isaac Corp. | 167 | 10,404 | ||||||
| Glu Mobile, Inc.* | 2,686 | 10,395 | ||||||
| Advent Software, Inc. | 297 | 10,264 | ||||||
| E2open, Inc.* | 1,452 | 8,480 | ||||||
| Audience, Inc.* | 1,952 | 7,281 | ||||||
| A10 Networks, Inc.* | 1,549 | 6,816 | ||||||
GT Advanced Technologies, Inc.*,1 | 3,393 | 2,053 | ||||||
| Total Technology | 2,951,516 | |||||||
| UTILITIES - 6.8% | ||||||||
| Chesapeake Utilities Corp. | 1,698 | 82,234 | ||||||
| Southwest Gas Corp. | 1,387 | 80,571 | ||||||
| MGE Energy, Inc. | 1,809 | 80,447 | ||||||
| American States Water Co. | 2,248 | 80,434 | ||||||
| SJW Corp. | 2,513 | 80,315 | ||||||
| IDACORP, Inc. | 1,266 | 80,049 | ||||||
| Empire District Electric Co. | 2,809 | 79,888 | ||||||
| ALLETE, Inc. | 1,509 | 78,830 | ||||||
| New Jersey Resources Corp. | 1,345 | 78,656 | ||||||
| Otter Tail Corp. | 2,530 | 78,430 | ||||||
| Avista Corp. | 2,212 | 78,415 | ||||||
| California Water Service Group | 3,007 | 78,272 | ||||||
| NorthWestern Corp. | 1,481 | 78,256 | ||||||
| UIL Holdings Corp. | 1,893 | 77,878 | ||||||
| Connecticut Water Service, Inc. | 2,092 | 77,760 | ||||||
| PNM Resources, Inc. | 2,691 | 77,635 | ||||||
| Portland General Electric Co. | 2,119 | 77,153 | ||||||
| Middlesex Water Co. | 3,415 | 77,008 | ||||||
| Piedmont Natural Gas Company, Inc. | 2,005 | 76,210 | ||||||
| WGL Holdings, Inc. | 1,621 | 76,187 | ||||||
| Unitil Corp. | 2,178 | 75,882 | ||||||
| Black Hills Corp. | 1,386 | 75,856 | ||||||
| South Jersey Industries, Inc. | 1,284 | 75,294 | ||||||
| Northwest Natural Gas Co. | 1,595 | 74,853 | ||||||
| Laclede Group, Inc. | 1,474 | 74,835 | ||||||
| Ormat Technologies, Inc. | 2,571 | 74,431 | ||||||
| York Water Co. | 3,359 | 73,831 | ||||||
| ONE Gas, Inc. | 1,942 | 73,699 | ||||||
| Cleco Corp. | 1,357 | 72,952 | ||||||
| Dynegy, Inc.* | 2,372 | 72,346 | ||||||
70 | GUGGENHEIM ETFs ANNUAL REPORT | SEE NOTES TO FINANCIAL STATEMENTS. |
SCHEDULE OF INVESTMENTS (continued) | October 31, 2014 |
GUGGENHEIM RUSSELL 2000® EQUAL WEIGHT ETF |
| Shares | Value | |||||||
| NRG Yield, Inc. — Class A | 1,421 | $ | 71,007 | |||||
| El Paso Electric Co. | 1,868 | 70,685 | ||||||
| Pike Corp.* | 5,693 | 67,974 | ||||||
| Atlantic Power Corp. | 29,632 | 65,783 | ||||||
| Abengoa Yield plc* | 1,924 | 62,530 | ||||||
| Ameresco, Inc. — Class A* | 5,397 | 44,471 | ||||||
| EnerNOC, Inc.* | 2,205 | 32,568 | ||||||
| PICO Holdings, Inc.* | 462 | 10,210 | ||||||
| Total Utilities | 2,743,835 | |||||||
| BASIC MATERIALS - 5.8% | ||||||||
| Orchids Paper Products Co. | 3,990 | 114,752 | ||||||
| Ring Energy, Inc.* | 2,602 | 44,755 | ||||||
| Materion Corp. | 1,126 | 44,420 | ||||||
| OMNOVA Solutions, Inc.* | 6,239 | 43,861 | ||||||
| United States Lime & Minerals, Inc. | 621 | 43,538 | ||||||
| Minerals Technologies, Inc. | 567 | 43,495 | ||||||
| Century Aluminum Co.* | 1,461 | 42,778 | ||||||
| Wausau Paper Corp. | 4,323 | 42,754 | ||||||
| Aceto Corp. | 1,813 | 41,227 | ||||||
| Oil-Dri Corporation of America | 1,356 | 40,924 | ||||||
| Sensient Technologies Corp. | 685 | 40,538 | ||||||
| Resolute Forest Products, Inc.* | 2,180 | 40,461 | ||||||
| Koppers Holdings, Inc. | 1,018 | 40,191 | ||||||
| Balchem Corp. | 619 | 40,049 | ||||||
| Zep, Inc. | 2,483 | 39,877 | ||||||
| Neenah Paper, Inc. | 651 | 39,718 | ||||||
| HB Fuller Co. | 945 | 39,662 | ||||||
Molycorp, Inc.*,1 | 28,730 | 39,647 | ||||||
| PH Glatfelter Co. | 1,569 | 39,586 | ||||||
| Quaker Chemical Corp. | 481 | 39,480 | ||||||
| Hawkins, Inc. | 1,020 | 39,280 | ||||||
| Axiall Corp. | 969 | 39,051 | ||||||
| Innospec, Inc. | 965 | 38,957 | ||||||
| KMG Chemicals, Inc. | 2,179 | 38,568 | ||||||
| Calgon Carbon Corp.* | 1,814 | 38,148 | ||||||
| Worthington Industries, Inc. | 973 | 37,606 | ||||||
| Clearwater Paper Corp.* | 582 | 37,452 | ||||||
| KapStone Paper and Packaging Corp.* | 1,213 | 37,312 | ||||||
| Deltic Timber Corp. | 570 | 37,101 | ||||||
| Schweitzer-Mauduit International, Inc. | 861 | 37,075 | ||||||
| PolyOne Corp. | 989 | 36,602 | ||||||
| Landec Corp.* | 2,906 | 36,587 | ||||||
| American Vanguard Corp. | 3,142 | 36,259 | ||||||
| Kraton Performance Polymers, Inc.* | 2,012 | 35,995 | ||||||
| Shiloh Industries, Inc.* | 2,098 | 35,750 | ||||||
| Schnitzer Steel Industries, Inc. — Class A | 1,511 | 35,584 | ||||||
| Innophos Holdings, Inc. | 624 | 35,568 | ||||||
| Chemtura Corp.* | 1,527 | 35,564 | ||||||
| Commercial Metals Co. | 2,047 | 35,393 | ||||||
| Taminco Corp.* | 1,362 | 35,262 | ||||||
| Noranda Aluminum Holding Corp. | 7,952 | 35,068 | ||||||
| Stepan Co. | 790 | 34,981 | ||||||
| Globe Specialty Metals, Inc. | 1,854 | 34,874 | ||||||
| A. Schulman, Inc. | 980 | 34,702 | ||||||
| OM Group, Inc. | 1,324 | 34,464 | ||||||
| Ryerson Holding Corp.* | 2,679 | 34,238 | ||||||
| Kronos Worldwide, Inc. | 2,523 | 33,909 | ||||||
| Olin Corp. | 1,388 | 33,645 | ||||||
| Horsehead Holding Corp.* | 2,121 | 33,321 | ||||||
| Universal Stainless & Alloy Products, Inc.* | 1,280 | 32,909 | ||||||
| Tronox Ltd. — Class A | 1,354 | 32,740 | ||||||
| Rentech, Inc.* | 20,357 | 32,367 | ||||||
| Kaiser Aluminum Corp. | 463 | 32,202 | ||||||
| Ferro Corp.* | 2,440 | 32,013 | ||||||
| AK Steel Holding Corp.* | 4,216 | 31,915 | ||||||
Intrepid Potash, Inc.*,1 | 2,319 | 31,191 | ||||||
| Stillwater Mining Co.* | 2,313 | 30,370 | ||||||
| Hecla Mining Co. | 13,195 | 28,765 | ||||||
| Gold Resource Corp. | 6,646 | 25,853 | ||||||
| US Silica Holdings, Inc. | 571 | 25,638 | ||||||
| Coeur Mining, Inc.* | 6,283 | 23,247 | ||||||
Allied Nevada Gold Corp.*,1 | 10,296 | 14,311 | ||||||
| Total Basic Materials | 2,323,550 | |||||||
| DIVERSIFIED - 0.2% | ||||||||
| Horizon Pharma plc* | 1,097 | 14,195 | ||||||
| Tiptree Financial, Inc. — Class A* | 1,233 | 9,963 | ||||||
| Resource America, Inc. — Class A | 999 | 9,530 | ||||||
| National Bank Holdings Corp. — Class A | 483 | 9,461 | ||||||
| FCB Financial Holdings, Inc. — Class A* | 410 | 9,410 | ||||||
| Harbinger Group, Inc.* | 704 | 9,251 | ||||||
| Total Diversified | 61,810 | |||||||
| GOVERNMENT - 0.0% | ||||||||
| Banco Latinoamericano de Comercio Exterior S.A. — Class E | 297 | 9,991 | ||||||
| Total Common Stocks | ||||||||
| (Cost $36,031,681) | 40,077,779 | |||||||
RIGHTS†† - 0.0% | ||||||||
| Leap Wireless International | ||||||||
| Expires 03/17/15 | 3,402 | 8,573 | ||||||
| Total Rights | ||||||||
| (Cost $8,301) | 8,573 | |||||||
SHORT TERM INVESTMENTS† - 0.7% | ||||||||
| Federated U.S. Treasury Cash Reserve Fund | 279,789 | 279,789 | ||||||
| Total Short Term Investments | ||||||||
| (Cost $279,789) | 279,789 | |||||||
| SEE NOTES TO FINANCIAL STATEMENTS. | GUGGENHEIM ETFs ANNUAL REPORT | 71 |
SCHEDULE OF INVESTMENTS (concluded) | October 31, 2014 |
GUGGENHEIM RUSSELL 2000® EQUAL WEIGHT ETF |
| Face Amount | Value | |||||||
SECURITIES LENDING COLLATERAL††,2 - 5.6% | ||||||||
| Joint Repurchase Agreements | ||||||||
| HSBC Securities, Inc. issued 10/31/14 at 0.08% due 11/03/14 | $ | 1,429,969 | $ | 1,429,969 | ||||
| BNP Paribas Securities Corp. issued 10/31/14 at 0.11% due 11/03/14 | 654,066 | 654,066 | ||||||
| Barclays Capital, Inc. issued 10/31/14 at 0.07% due 11/03/14 | 187,473 | 187,473 | ||||||
| Total Securities Lending Collateral | ||||||||
| (Cost $2,271,508) | 2,271,508 | |||||||
| Total Investments - 105.6% | ||||||||
| (Cost $38,591,279) | $ | 42,637,649 | ||||||
| Other Assets & Liabilities, net - (5.6)% | (2,257,172 | ) | ||||||
| Total Net Assets - 100.0% | $ | 40,380,477 | ||||||
| * | Non-income producing security. |
| † | Value determined based on Level 1 inputs — See Note 4. |
| †† | Value determined based on Level 2 inputs — See Note 4. |
| 1 | All or portion of this security is on loan at October 31, 2014 — See Note 5. |
| 2 | Securities lending collateral — See Note 5. |
| plc — Public Limited Company | |
| REIT — Real Estate Investment Trust |
72 | GUGGENHEIM ETFs ANNUAL REPORT | SEE NOTES TO FINANCIAL STATEMENTS. |
| SCHEDULE OF INVESTMENTS | October 31, 2014 |
| GUGGENHEIM MSCI EMERGING MARKETS EQUAL WEIGHT ETF |
| Shares | Value | |||||||
COMMON STOCKS† - 87.2% | ||||||||
| FINANCIAL - 20.9% | ||||||||
| Megaworld Corp. | 344,000 | $ | 38,023 | |||||
| BDO Unibank, Inc. | 17,005 | 37,137 | ||||||
| Ayala Land, Inc. | 46,800 | 34,938 | ||||||
| AMMB Holdings BHD | 15,600 | 32,157 | ||||||
| Ping An Insurance Group Company of China Ltd. — Class H | 3,832 | 31,303 | ||||||
| China Everbright Ltd. | 16,000 | 31,111 | ||||||
| UEM Sunrise BHD | 54,000 | 30,864 | ||||||
| Malayan Banking BHD | 10,400 | 30,671 | ||||||
| PICC Property & Casualty Company Ltd. — Class H | 16,000 | 29,338 | ||||||
| Highwealth Construction Corp. | 16,400 | 28,361 | ||||||
| CIMB Group Holdings BHD | 14,000 | 27,623 | ||||||
| Haitong Securities Company Ltd. — Class H | 16,000 | 27,440 | ||||||
| Bank of Communications Company Ltd. — Class H | 36,444 | 27,303 | ||||||
| Cathay Financial Holding Company Ltd. | 16,486 | 27,100 | ||||||
| Bancolombia S.A. ADR | 476 | 26,927 | ||||||
| New China Life Insurance Company Ltd. — Class H | 7,200 | 26,924 | ||||||
| Commercial International Bank Egypt SAEGDR | 3,936 | 26,765 | ||||||
| Fubon Financial Holding Company Ltd. | 15,788 | 26,680 | ||||||
| China Construction Bank Corp. — Class H | 35,752 | 26,646 | ||||||
| Bank of China Ltd. — Class H | 55,620 | 26,608 | ||||||
| FirstRand Ltd. | 6,193 | 26,461 | ||||||
| China Merchants Bank Company Ltd. — Class H | 14,204 | 26,301 | ||||||
| Kasikornbank PCL | 3,628 | 26,288 | ||||||
| China Minsheng Banking Corporation Ltd. — Class H | 26,175 | 26,225 | ||||||
| Bank Central Asia Tbk PT | 24,284 | 26,223 | ||||||
| Industrial & Commercial Bank of China Ltd. — Class H | 39,600 | 26,195 | ||||||
| Bank Negara Indonesia Persero Tbk PT | 53,200 | 26,193 | ||||||
| CTBC Financial Holding Company Ltd. | 37,403 | 26,192 | ||||||
| Sanlam Ltd. | 4,132 | 26,052 | ||||||
| Shimao Property Holdings Ltd. | 12,108 | 26,042 | ||||||
| Shanghai Industrial Holdings Ltd. | 8,432 | 25,986 | ||||||
| People’s Insurance Company Group of China Ltd. — Class H | 60,000 | 25,918 | ||||||
| Agricultural Bank of China Ltd. — Class H | 55,664 | 25,839 | ||||||
| Chang Hwa Commercial Bank Ltd. | 40,926 | 25,767 | ||||||
| Credicorp Ltd. | 160 | 25,760 | ||||||
| China CITIC Bank Corporation Ltd. — Class H | 39,520 | 25,734 | ||||||
| CITIC Securities Company Ltd. — Class H | 10,232 | 25,517 | ||||||
| China Everbright Bank Company Ltd. — Class H | 52,000 | 25,480 | ||||||
| RMB Holdings Ltd. | 4,576 | 25,355 | ||||||
| Powszechny Zaklad Ubezpieczen S.A. | 168 | 25,230 | ||||||
| Barclays Africa Group Ltd. | 1,592 | 25,098 | ||||||
| E.Sun Financial Holding Company Ltd. | 39,449 | 24,966 | ||||||
| Banco de Chile | 204,260 | 24,887 | ||||||
| Turkiye Garanti Bankasi AS | 6,364 | 24,880 | ||||||
| Lippo Karawaci Tbk PT | 280,800 | 24,862 | ||||||
| Chongqing Rural Commercial Bank Company Ltd. — Class H | 51,592 | 24,814 | ||||||
| First Financial Holding Company Ltd. | 40,327 | 24,793 | ||||||
| Growthpoint Properties Ltd. | 10,198 | 24,694 | ||||||
| Investec Ltd. | 2,708 | 24,685 | ||||||
| Yapi ve Kredi Bankasi AS | 11,236 | 24,646 | ||||||
| Nedbank Group Ltd. | 1,128 | 24,531 | ||||||
| Shin Kong Financial Holding Company Ltd. | 80,478 | 24,421 | ||||||
| China Development Financial Holding Corp. | 76,000 | 24,387 | ||||||
| Central Pattana PCL | 16,400 | 24,295 | ||||||
| Yuanta Financial Holding Company Ltd. | 48,169 | 24,230 | ||||||
| Turkiye Is Bankasi — Class C | 9,664 | 24,201 | ||||||
| Hua Nan Financial Holdings Company Ltd. | 40,793 | 24,141 | ||||||
| Bank Rakyat Indonesia Persero Tbk PT | 26,300 | 24,102 | ||||||
| Bumi Serpong Damai Tbk PT | 180,800 | 24,012 | ||||||
| Akbank TAS | 6,636 | 24,001 | ||||||
| OTP Bank plc | 1,452 | 23,984 | ||||||
| Bank Mandiri Persero Tbk PT | 28,000 | 23,980 | ||||||
| Hanwha Life Insurance Company Ltd. | 3,121 | 23,976 | ||||||
| China Pacific Insurance Group Company Ltd. — Class H | 6,400 | 23,932 | ||||||
| China Life Insurance Company Ltd. — Class H | 8,000 | 23,932 | ||||||
| Standard Bank Group Ltd. | 1,904 | 23,914 | ||||||
| Ruentex Development Company Ltd. | 16,000 | 23,829 | ||||||
| Krung Thai Bank PCL | 33,197 | 23,749 | ||||||
| TMB Bank PCL | 250,800 | 23,717 | ||||||
| Getin Noble Bank S.A.* | 30,644 | 23,694 | ||||||
| Fibra Uno Administracion S.A. de CV | 6,800 | 23,603 | ||||||
| Turkiye Vakiflar Bankasi Tao — Class D | 10,900 | 23,467 | ||||||
| Longfor Properties Company Ltd. | 20,232 | 23,453 | ||||||
| Grupo Financiero Banorte SAB de CV — Class O | 3,632 | 23,272 | ||||||
| Powszechna Kasa Oszczednosci Bank Polski S.A. | 2,088 | 23,255 | ||||||
| Alior Bank S.A.* | 1,044 | 23,223 | ||||||
| China Life Insurance Company Ltd. | 26,642 | 23,212 | ||||||
| China Overseas Land & Investment Ltd. | 8,000 | 23,210 | ||||||
| Mega Financial Holding Company Ltd. | 27,956 | 23,161 | ||||||
| Evergrande Real Estate Group Ltd. | 60,272 | 23,160 | ||||||
| Taishin Financial Holding Company Ltd. | 48,420 | 23,083 | ||||||
| Turkiye Halk Bankasi AS | 3,444 | 23,035 | ||||||
| Banco Santander Chile ADR | 1,080 | 22,885 | ||||||
| Bank Pekao S.A. | 436 | 22,833 | ||||||
| VTB Bank OJSCGDR | 12,076 | 22,812 | ||||||
| Guangzhou R&F Properties Company Ltd. — Class H | 20,932 | 22,807 | ||||||
| China Cinda Asset Management Company Ltd. — Class H* | 48,000 | 22,716 | ||||||
| Bank of Ayudhya PCL | 15,329 | 22,473 | ||||||
| Emlak Konut Gayrimenkul Yatirim Ortakligi AS | 19,856 | 22,358 | ||||||
| SEE NOTES TO FINANCIAL STATEMENTS. | GUGGENHEIM ETFs ANNUAL REPORT | 73 |
SCHEDULE OF INVESTMENTS (continued) | October 31, 2014 |
| GUGGENHEIM MSCI EMERGING MARKETS EQUAL WEIGHT ETF |
| Shares | Value | |||||||
| Komercni Banka AS | 104 | $ | 22,273 | |||||
| Piraeus Bank S.A.* | 15,260 | 22,178 | ||||||
| Bangkok Bank PCL | 3,641 | 22,134 | ||||||
| Country Garden Holdings Company Ltd. | 55,940 | 22,000 | ||||||
| SOHO China Ltd. | 29,924 | 21,955 | ||||||
| Coronation Fund Managers Ltd. | 2,536 | 21,923 | ||||||
| Siam Commercial Bank PCL | 4,022 | 21,919 | ||||||
| Poly Property Group Company Ltd. | 56,120 | 21,709 | ||||||
| Alpha Bank AE — Class B* | 32,348 | 21,075 | ||||||
| Samsung Life Insurance Company Ltd. | 192 | 20,930 | ||||||
| Chailease Holding Company Ltd. | 8,360 | 20,614 | ||||||
National Bank of Greece S.A. ADR*,1 | 8,280 | 20,120 | ||||||
| BS Financial Group, Inc. | 1,290 | 20,097 | ||||||
| Samsung Fire & Marine Insurance Company Ltd. | 72 | 19,369 | ||||||
| Banco Santander Brasil S.A. ADR | 3,520 | 19,290 | ||||||
| China Resources Land Ltd. | 8,000 | 19,022 | ||||||
| Samsung Securities Company Ltd. | 424 | 18,964 | ||||||
| Woori Investment & Securities Company Ltd. | 1,728 | 18,917 | ||||||
| KB Financial Group, Inc. ADR | 488 | 18,886 | ||||||
| Shinhan Financial Group Company Ltd. ADR | 396 | 18,640 | ||||||
| Dongbu Insurance Company Ltd. | 332 | 18,608 | ||||||
| Samsung Card Company Ltd. | 432 | 18,594 | ||||||
| Daewoo Securities Company Ltd. | 1,752 | 18,360 | ||||||
| Agile Property Holdings Ltd. | 32,000 | 18,032 | ||||||
| Hyundai Marine & Fire Insurance Company Ltd. | 656 | 17,340 | ||||||
| Industrial Bank of Korea | 1,164 | 17,045 | ||||||
| Hana Financial Group, Inc. | 484 | 16,779 | ||||||
Woori Finance Holdings Company Ltd.††,4 | 1,444 | 16,079 | ||||||
| Bank of Ayudhya PCL | 5,100 | 7,477 | ||||||
| Kasikornbank PCL | 1,000 | 7,246 | ||||||
| Bangkok Bank PCL | 1,000 | 6,079 | ||||||
African Bank Investments Ltd.†††,4 | 27,393 | — | ||||||
| Total Financial | 2,853,702 | |||||||
| CONSUMER, CYCLICAL - 12.6% | ||||||||
| Eclat Textile Company Ltd. | 4,160 | 39,526 | ||||||
| SM Investments Corp. | 1,921 | 33,540 | ||||||
| Genting BHD | 10,800 | 32,013 | ||||||
| AirAsia BHD | 42,000 | 31,923 | ||||||
| Genting Malaysia BHD | 23,600 | 30,852 | ||||||
| Eva Airways Corp.* | 52,000 | 30,432 | ||||||
| Weichai Power Company Ltd. — Class H | 7,868 | 30,183 | ||||||
| President Chain Store Corp. | 4,000 | 29,984 | ||||||
| China Airlines Ltd.* | 76,400 | 29,890 | ||||||
| Merida Industry Company Ltd. | 4,200 | 28,997 | ||||||
| Cheng Shin Rubber Industry Company Ltd. | 12,199 | 28,476 | ||||||
| Shenzhou International Group Holdings Ltd. | 8,000 | 27,594 | ||||||
| Geely Automobile Holdings Ltd. | 61,328 | 27,442 | ||||||
| Brilliance China Automotive Holdings Ltd. | 15,712 | 27,148 | ||||||
| Mr Price Group Ltd. | 1,288 | 26,601 | ||||||
| Steinhoff International Holdings Ltd. | 5,164 | 26,365 | ||||||
| Tofas Turk Otomobil Fabrikasi AS | 4,168 | 26,188 | ||||||
| Great Wall Motor Company Ltd. — Class H | 5,968 | 26,165 | ||||||
| Far Eastern New Century Corp. | 24,852 | 26,105 | ||||||
| Air China Ltd. — Class H | 40,284 | 26,076 | ||||||
| Turk Hava Yollari* | 7,892 | 25,913 | ||||||
| Belle International Holdings Ltd. | 20,100 | 25,581 | ||||||
| Byd Company Ltd. — Class H | 4,032 | 25,580 | ||||||
| China Motor Corp. | 28,000 | 25,499 | ||||||
| Ruentex Industries Ltd. | 11,872 | 25,331 | ||||||
| Grupo Comercial Chedraui S.A. de CV | 7,200 | 25,296 | ||||||
| Foschini Group Ltd. | 2,224 | 25,093 | ||||||
| Controladora Comercial Mexicana SAB de CV | 6,400 | 25,044 | ||||||
| Dongfeng Motor Group Company Ltd. — Class H | 16,000 | 24,716 | ||||||
| Intime Retail Group Company Ltd. | 28,224 | 24,601 | ||||||
| SACI Falabella | 3,364 | 24,549 | ||||||
| Latam Airlines Group S.A. ADR* | 2,012 | 24,546 | ||||||
| CP ALL PCL | 17,361 | 24,253 | ||||||
| Truworths International Ltd. | 3,536 | 24,167 | ||||||
| Golden Eagle Retail Group Ltd. | 19,724 | 24,161 | ||||||
| Yulon Motor Company Ltd. | 16,000 | 23,566 | ||||||
| Home Product Center PCL | 82,366 | 23,519 | ||||||
| Minor International PCL | 21,600 | 23,046 | ||||||
| ANTA Sports Products Ltd. | 11,656 | 22,845 | ||||||
| Siam Makro PCL | 19,200 | 22,844 | ||||||
| Woolworths Holdings Limited/South Africa | 3,208 | 22,764 | ||||||
| Zhongsheng Group Holdings Ltd. | 22,000 | 22,609 | ||||||
| GOME Electrical Appliances Holding Ltd. | 139,600 | 21,961 | ||||||
| Massmart Holdings Ltd. | 2,036 | 21,956 | ||||||
| Matahari Department Store Tbk PT | 18,000 | 21,783 | ||||||
| SK Networks Company Ltd. | 2,120 | 21,721 | ||||||
| Far Eastern Department Stores Ltd. | 24,065 | 21,718 | ||||||
| Guangzhou Automobile Group Company Ltd. — Class H | 24,408 | 21,716 | ||||||
| Wal-Mart de Mexico SAB de CV | 9,225 | 21,299 | ||||||
| Sun Art Retail Group Ltd. | 19,852 | 21,247 | ||||||
| OPAP S.A. | 1,740 | 21,081 | ||||||
| Haier Electronics Group Company Ltd. | 7,740 | 20,909 | ||||||
| Astra International Tbk PT | 37,100 | 20,799 | ||||||
| Hankook Tire Company Ltd. | 396 | 20,379 | ||||||
| Gol Linhas Aereas Inteligentes S.A. ADR* | 3,896 | 20,142 | ||||||
| Korean Air Lines Company Ltd. | 564 | 20,027 | ||||||
| Samsung C&T Corp. | 280 | 18,942 | ||||||
| Kangwon Land, Inc. | 572 | 18,733 | ||||||
| China Resources Enterprise Ltd. | 7,828 | 18,613 | ||||||
| Hyundai Development Company-Engineering & Construction | 484 | 18,273 | ||||||
| Daewoo International Corp. | 564 | 17,864 | ||||||
| Hanwha Corp. | 684 | 17,536 | ||||||
| Halla Visteon Climate Control Corp. | 380 | 16,978 | ||||||
| LG Corp. | 284 | 16,901 | ||||||
| Kia Motors Corp. | 344 | 16,770 | ||||||
| Lotte Shopping Company Ltd. | 60 | 16,646 | ||||||
| Paradise Company Ltd. | 536 | 16,475 | ||||||
74 | GUGGENHEIM ETFs ANNUAL REPORT | SEE NOTES TO FINANCIAL STATEMENTS. |
SCHEDULE OF INVESTMENTS (continued) | October 31, 2014 |
| GUGGENHEIM MSCI EMERGING MARKETS EQUAL WEIGHT ETF |
| Shares | Value | |||||||
| Shinsegae Company Ltd. | 88 | $ | 16,345 | |||||
| E-Mart Company Ltd. | 88 | 16,303 | ||||||
| Hyundai Department Store Company Ltd. | 128 | 16,229 | ||||||
| Hotel Shilla Company Ltd. | 172 | 16,174 | ||||||
| Hyundai Mobis Company Ltd. | 69 | 16,141 | ||||||
| Hyundai Wia Corp. | 92 | 15,882 | ||||||
| Hyundai Motor Co. | 91 | 14,475 | ||||||
| Total Consumer, Cyclical | 1,723,041 | |||||||
| INDUSTRIAL - 11.1% | ||||||||
| DMCI Holdings, Inc. | 95,250 | 34,386 | ||||||
Zhuzhou CSR Times Electric Company Ltd. — Class H††,4 | 7,920 | 34,058 | ||||||
| Catcher Technology Company Ltd. | 4,000 | 33,666 | ||||||
| Hiwin Technologies Corp. | 4,123 | 32,532 | ||||||
| China Railway Group Ltd. — Class H | 48,408 | 29,837 | ||||||
CSR Corporation Ltd. — Class H††,4 | 28,348 | 28,841 | ||||||
| Larsen & Toubro Ltd.GDR | 1,036 | 28,283 | ||||||
| Shanghai Electric Group Company Ltd. — Class H | 56,000 | 28,017 | ||||||
| China Resources Cement Holdings Ltd. | 40,820 | 27,738 | ||||||
| China Railway Construction Corporation Ltd. — Class H | 26,164 | 27,462 | ||||||
| Phison Electronics Corp. | 3,964 | 26,715 | ||||||
| Grupo Aeroportuario del Sureste SAB de CV ADR | 196 | 26,398 | ||||||
| Asia Cement Corp. | 20,201 | 26,035 | ||||||
| BTS Group Holdings PCL | 81,200 | 25,679 | ||||||
| Yang Ming Marine Transport Corp. | 56,000 | 25,592 | ||||||
| AU Optronics Corp. ADR | 5,272 | 25,252 | ||||||
| China COSCO Holdings Company Ltd. — Class H | 55,804 | 25,041 | ||||||
| Taiwan Cement Corp. | 16,296 | 24,886 | ||||||
| Nampak Ltd. | 6,064 | 24,685 | ||||||
| WPG Holdings Ltd. | 20,208 | 24,582 | ||||||
| Unimicron Technology Corp. | 32,000 | 24,565 | ||||||
| China Communications Construction Company Ltd. — Class H | 32,012 | 24,561 | ||||||
| Embraer S.A. ADR | 635 | 24,537 | ||||||
| BBMG Corp. — Class H | 33,968 | 24,003 | ||||||
| China Shipping Container Lines Company Ltd. — Class H* | 84,228 | 24,002 | ||||||
| AAC Technologies Holdings, Inc. | 4,000 | 23,958 | ||||||
| Evergreen Marine Corporation Taiwan Ltd. | 40,499 | 23,900 | ||||||
| Airports of Thailand PCL | 3,200 | 23,776 | ||||||
| Hon Hai Precision Industry Company Ltd.GDR | 3,753 | 23,698 | ||||||
| Cemex SAB de CV ADR* | 1,892 | 23,272 | ||||||
| Indocement Tunggal Prakarsa Tbk PT | 11,672 | 23,180 | ||||||
| China National Building Material Company Ltd. — Class H | 24,768 | 22,963 | ||||||
| Semen Indonesia Persero Tbk PT | 17,376 | 22,825 | ||||||
| Synnex Technology International Corp. | 16,000 | 22,435 | ||||||
| Zhen Ding Technology Holding Ltd. | 8,163 | 22,356 | ||||||
| China Everbright International Ltd. | 16,000 | 22,076 | ||||||
| Delta Electronics, Inc. | 3,680 | 22,019 | ||||||
| Promotora y Operadora de Infraestructura SAB de CV* | 1,600 | 21,953 | ||||||
| Pegatron Corp. | 12,000 | 21,778 | ||||||
| Korea Aerospace Industries Ltd. | 556 | 21,486 | ||||||
| Simplo Technology Company Ltd. | 4,400 | 21,409 | ||||||
| United Tractors Tbk PT | 13,200 | 20,071 | ||||||
| Anhui Conch Cement Company Ltd. — Class H | 6,060 | 19,848 | ||||||
| Zoomlion Heavy Industry Science and Technology Company Ltd. — Class H | 40,856 | 19,650 | ||||||
| CTCI Corp. | 11,805 | 19,290 | ||||||
| LS Industrial Systems Company Ltd. | 326 | 19,248 | ||||||
| Doosan Corp. | 176 | 18,280 | ||||||
| Coway Company Ltd. | 236 | 18,019 | ||||||
| LG Display Company Ltd. ADR | 1,188 | 17,844 | ||||||
| Samsung Heavy Industries Company Ltd. | 720 | 17,550 | ||||||
| Samsung Electro-Mechanics Company Ltd. | 376 | 17,134 | ||||||
| Orascom Construction Industries SAEGDR* | 534 | 17,088 | ||||||
| Hyundai Glovis Company Ltd. | 68 | 16,925 | ||||||
| LG Electronics, Inc. | 276 | 16,864 | ||||||
| Samsung Engineering Company Ltd. | 292 | 16,830 | ||||||
| Doosan Infracore Company Ltd.* | 1,620 | 16,371 | ||||||
| Doosan Heavy Industries & Construction Company Ltd. | 740 | 16,237 | ||||||
| Hyundai Hysco Company Ltd. | 248 | 16,151 | ||||||
| Daelim Industrial Company Ltd. | 242 | 16,054 | ||||||
| Hyosung Corp. | 260 | 15,448 | ||||||
| Daewoo Engineering & Construction Company Ltd.* | 2,450 | 15,015 | ||||||
| Radiant Opto-Electronics Corp. | 4,301 | 14,989 | ||||||
| Hyundai Engineering & Construction Company Ltd. | 328 | 14,900 | ||||||
| Samsung Techwin Company Ltd. | 484 | 14,854 | ||||||
| GS Engineering & Construction Corp. | 558 | 14,671 | ||||||
| Daewoo Shipbuilding & Marine Engineering Company Ltd. | 856 | 14,657 | ||||||
| Kinsus Interconnect Technology Corp. | 3,628 | 13,598 | ||||||
| Hyundai Heavy Industries Company Ltd. | 144 | 13,366 | ||||||
| LG Innotek Company Ltd.* | 148 | 11,702 | ||||||
| Hyundai Mipo Dockyard Company Ltd. | 160 | 11,363 | ||||||
| Total Industrial | 1,518,454 | |||||||
| CONSUMER, NON-CYCLICAL - 9.5% | ||||||||
| Kuala Lumpur Kepong BHD | 4,800 | 33,564 | ||||||
| Shandong Weigao Group Medical Polymer Company Ltd. — Class H | 32,000 | 32,267 | ||||||
| Sino Biopharmaceutical Ltd. | 32,000 | 32,225 | ||||||
| IOI Corporation BHD | 21,600 | 32,112 | ||||||
| Aspen Pharmacare Holdings Ltd.* | 852 | 30,344 | ||||||
| Magnit PJSCGDR | 440 | 29,480 | ||||||
| CSPC Pharmaceutical Group Ltd. | 32,000 | 29,462 | ||||||
| Dr Reddy’s Laboratories Ltd. ADR | 552 | 28,864 | ||||||
| SEE NOTES TO FINANCIAL STATEMENTS. | GUGGENHEIM ETFs ANNUAL REPORT | 75 |
SCHEDULE OF INVESTMENTS (continued) | October 31, 2014 |
| GUGGENHEIM MSCI EMERGING MARKETS EQUAL WEIGHT ETF |
| Shares | Value | |||||||
| Shanghai Fosun Pharmaceutical Group Company Ltd. — Class H | 8,000 | $ | 28,781 | |||||
| Want Want China Holdings Ltd. | 20,312 | 27,710 | ||||||
| Gruma SAB de CV — Class B* | 2,400 | 26,396 | ||||||
| Uni-President China Holdings Ltd. | 28,400 | 26,256 | ||||||
| Shoprite Holdings Ltd. | 1,808 | 26,150 | ||||||
| Grupo Modelo SAB de CV* | 2,811 | 25,907 | ||||||
| Tiger Brands Ltd. | 856 | 25,696 | ||||||
| Ulker Biskuvi Sanayi AS | 3,436 | 25,381 | ||||||
| Bidvest Group Ltd. | 918 | 25,210 | ||||||
| China Huishan Dairy Holdings Company Ltd. | 112,000 | 25,128 | ||||||
| Sinopharm Group Company Ltd. — Class H | 6,400 | 25,005 | ||||||
| Mediclinic International Ltd. | 2,792 | 24,894 | ||||||
| Gudang Garam Tbk PT | 5,200 | 24,849 | ||||||
| Jasa Marga Persero Tbk PT | 47,181 | 24,791 | ||||||
| Indofood CBP Sukses Makmur Tbk PT | 27,100 | 24,779 | ||||||
| Charoen Pokphand Foods PCL | 25,635 | 24,596 | ||||||
| Coca-Cola Femsa SAB de CV ADR | 232 | 24,546 | ||||||
| Cencosud S.A. | 8,668 | 24,530 | ||||||
| OHL Mexico SAB de CV* | 8,700 | 24,455 | ||||||
| BIM Birlesik Magazalar AS | 1,060 | 24,254 | ||||||
| Fomento Economico Mexicano SAB de CV ADR | 247 | 23,771 | ||||||
| Richter Gedeon Nyrt | 1,552 | 23,669 | ||||||
| ScinoPharm Taiwan Ltd. | 11,569 | 23,392 | ||||||
| LG Household & Health Care Ltd. | 40 | 23,318 | ||||||
| Genomma Lab Internacional SAB de CV — Class B* | 9,200 | 23,193 | ||||||
| Eurocash S.A. | 2,344 | 23,136 | ||||||
| Indofood Sukses Makmur Tbk PT | 40,800 | 23,042 | ||||||
| Grupo Lala SAB de CV | 10,000 | 22,918 | ||||||
| Bumrungrad Hospital PCL | 5,600 | 22,868 | ||||||
| Bangkok Dusit Medical Services PCL — Class F | 40,003 | 22,722 | ||||||
| AMOREPACIFIC Group | 20 | 22,138 | ||||||
| Hite Jinro Company Ltd. | 884 | 21,878 | ||||||
| Life Healthcare Group Holdings Ltd. | 5,795 | 21,875 | ||||||
| Hengan International Group Company Ltd. | 2,000 | 21,083 | ||||||
| COSCO Pacific Ltd. | 16,000 | 21,044 | ||||||
| Cia Brasileira de Distribuicao ADR | 496 | 20,733 | ||||||
| Uni-President Enterprises Corp. | 12,017 | 20,623 | ||||||
| CJ CheilJedang Corp. | 56 | 20,488 | ||||||
| Tingyi Cayman Islands Holding Corp. | 8,000 | 19,889 | ||||||
| Celltrion, Inc. | 500 | 19,626 | ||||||
| KT&G Corp. | 212 | 18,845 | ||||||
| Orion Corporation/Republic of Korea | 24 | 18,527 | ||||||
| China Mengniu Dairy Company Ltd. | 4,000 | 17,666 | ||||||
| Standard Foods Corp. | 7,510 | 17,308 | ||||||
| Amorepacific Corp. | 8 | 17,217 | ||||||
| Biostime International Holdings Ltd. | 6,000 | 13,586 | ||||||
| Total Consumer, Non-cyclical | 1,302,187 | |||||||
| BASIC MATERIALS - 8.4% | ||||||||
| Petronas Chemicals Group BHD | 16,400 | 30,665 | ||||||
Fibria Celulose S.A. ADR*,1 | 2,448 | 29,939 | ||||||
| Jiangxi Copper Company Ltd. — Class H | 16,444 | 29,219 | ||||||
| Formosa Chemicals & Fibre Corp. | 12,180 | 28,351 | ||||||
| Severstal OAOGDR | 2,632 | 27,820 | ||||||
| Eregli Demir ve Celik Fabrikalari TAS | 12,728 | 26,543 | ||||||
| Braskem S.A. ADR | 1,776 | 26,054 | ||||||
Aluminum Corporation of China Ltd. ADR*,1 | 2,260 | 25,131 | ||||||
| Sesa Sterlite Ltd. ADR | 1,492 | 25,126 | ||||||
| Empresas CMPC S.A. | 10,212 | 25,028 | ||||||
| Nan Ya Plastics Corp. | 12,090 | 25,001 | ||||||
| China Steel Corp. | 28,934 | 24,923 | ||||||
| IRPC PCL | 236,026 | 24,784 | ||||||
| Nine Dragons Paper Holdings Ltd. | 31,872 | 24,700 | ||||||
| Uralkali OJSCGDR | 1,380 | 24,660 | ||||||
| Mexichem SAB de CV | 6,000 | 24,516 | ||||||
| Zijin Mining Group Company Ltd. — Class H | 95,248 | 24,440 | ||||||
| MMC Norilsk Nickel OJSC ADR | 1,292 | 24,044 | ||||||
| Sappi Ltd.* | 5,996 | 23,649 | ||||||
| KGHM Polska Miedz S.A. | 612 | 23,642 | ||||||
| PTT Global Chemical PCL | 12,411 | 23,625 | ||||||
| Grupo Mexico SAB de CV | 6,784 | 23,281 | ||||||
| Southern Copper Corp. | 776 | 22,333 | ||||||
| Sociedad Quimica y Minera de Chile S.A. ADR | 920 | 21,832 | ||||||
| Taiwan Fertilizer Company Ltd. | 12,000 | 21,265 | ||||||
| Indorama Ventures PCL | 28,810 | 21,141 | ||||||
| Ultrapar Participacoes S.A. ADR | 974 | 21,136 | ||||||
| Industrias Penoles SAB de CV | 940 | 21,070 | ||||||
| CITIC Ltd. | 12,000 | 21,013 | ||||||
| Kumba Iron Ore Ltd. | 836 | 20,845 | ||||||
| Impala Platinum Holdings Ltd. | 2,860 | 20,786 | ||||||
| CAP S.A. | 2,044 | 19,544 | ||||||
| Gerdau S.A. ADR | 4,304 | 19,497 | ||||||
| Anglo American Platinum Ltd.* | 608 | 19,151 | ||||||
| Formosa Plastics Corp. | 8,240 | 19,018 | ||||||
| Yingde Gases Group Company Ltd. | 23,772 | 18,606 | ||||||
Cia Siderurgica Nacional S.A. ADR1 | 5,648 | 18,525 | ||||||
| Kumho Petrochemical Company Ltd. | 252 | 18,227 | ||||||
| Korea Zinc Company Ltd. | 48 | 18,078 | ||||||
| African Rainbow Minerals Ltd. | 1,468 | 18,059 | ||||||
| POSCO ADR | 248 | 17,747 | ||||||
| KCC Corp. | 32 | 17,726 | ||||||
| TSRC Corp. | 15,695 | 17,647 | ||||||
| Hyundai Steel Co. | 276 | 17,587 | ||||||
| Lotte Chemical Corp. | 128 | 17,366 | ||||||
| Cia de Minas Buenaventura S.A.A. ADR | 1,803 | 16,588 | ||||||
| Gold Fields Ltd. ADR | 5,164 | 16,473 | ||||||
| LG Chem Ltd. | 83 | 15,532 | ||||||
| Koza Altin Isletmeleri AS | 2,400 | 15,512 | ||||||
| Assore Ltd. | 832 | 15,416 | ||||||
| Hanwha Chemical Corp. | 1,288 | 14,643 | ||||||
76 | GUGGENHEIM ETFs ANNUAL REPORT | SEE NOTES TO FINANCIAL STATEMENTS. |
SCHEDULE OF INVESTMENTS (continued) | October 31, 2014 |
| GUGGENHEIM MSCI EMERGING MARKETS EQUAL WEIGHT ETF |
| Shares | Value | |||||||
| Harmony Gold Mining Company Ltd. ADR | 8,424 | $ | 13,647 | |||||
| AngloGold Ashanti Ltd. ADR | 1,484 | 12,273 | ||||||
| OCI Company Ltd. | 140 | 12,052 | ||||||
| Total Basic Materials | 1,145,476 | |||||||
| COMMUNICATIONS - 7.9% | ||||||||
| Telekom Malaysia BHD | 16,400 | 35,900 | ||||||
| DiGi.com BHD | 18,000 | 33,874 | ||||||
| Maxis BHD | 16,000 | 32,786 | ||||||
| Philippine Long Distance Telephone Co. ADR | 460 | 32,260 | ||||||
| Axiata Group BHD | 14,800 | 31,722 | ||||||
| Astro Malaysia Holdings BHD | 29,200 | 29,296 | ||||||
| ZTE Corp. — Class H | 11,240 | 27,248 | ||||||
| Advanced Info Service PCL | 3,648 | 26,769 | ||||||
| Far EasTone Telecommunications Company Ltd. | 12,000 | 26,551 | ||||||
| Tencent Holdings Ltd. | 1,620 | 25,819 | ||||||
| BEC World PCL | 17,230 | 25,525 | ||||||
| China Telecom Corporation Ltd. — Class H | 40,000 | 25,480 | ||||||
| Taiwan Mobile Company Ltd. | 7,816 | 25,363 | ||||||
| True Corporation PCL* | 70,000 | 25,361 | ||||||
| Turkcell Iletisim Hizmetleri AS ADR* | 1,728 | 25,281 | ||||||
| Turk Telekomunikasyon AS | 8,752 | 25,189 | ||||||
| Grupo Televisa SAB ADR | 696 | 25,153 | ||||||
| Telekomunikasi Indonesia Persero Tbk PT ADR | 549 | 24,897 | ||||||
| China Mobile Ltd. ADR | 400 | 24,837 | ||||||
| Chunghwa Telecom Company Ltd. ADR | 816 | 24,757 | ||||||
| Vodacom Group Ltd. | 2,040 | 24,714 | ||||||
| America Movil SAB de CV — Class L ADR | 1,008 | 24,605 | ||||||
| Global Mediacom Tbk PT | 150,800 | 24,457 | ||||||
| Tim Participacoes S.A. ADR | 879 | 24,190 | ||||||
| Naspers Ltd. — Class N | 192 | 23,856 | ||||||
| MTN Group Ltd. | 1,080 | 23,854 | ||||||
| Asia Pacific Telecom Company Ltd. | 40,000 | 23,671 | ||||||
| Media Nusantara Citra Tbk PT | 102,000 | 23,633 | ||||||
| ENTEL Chile S.A. | 2,176 | 23,418 | ||||||
| Telefonica Brasil S.A. ADR | 1,144 | 23,383 | ||||||
| Orange Polska S.A. | 7,408 | 22,251 | ||||||
| Hellenic Telecommunications Organization S.A. | 1,968 | 22,216 | ||||||
| Global Telecom Holding SAEGDR* | 7,044 | 21,153 | ||||||
| China Unicom Hong Kong Ltd. ADR | 1,400 | 20,972 | ||||||
| Oi S.A. ADR* | 39,100 | 20,723 | ||||||
| O2 Czech Republic AS | 1,796 | 20,061 | ||||||
| NAVER Corp. | 28 | 19,754 | ||||||
| Mobile Telesystems OJSC ADR | 1,368 | 19,562 | ||||||
| NCSoft Corp. | 140 | 19,257 | ||||||
| LG Uplus Corp. | 1,812 | 18,650 | ||||||
| KT Corp. ADR | 1,184 | 18,151 | ||||||
| SK Telecom Company Ltd. ADR | 652 | 18,119 | ||||||
| Samsung SDI Company Ltd. | 132 | 15,562 | ||||||
| Cheil Worldwide, Inc.* | 876 | 13,688 | ||||||
| Sistema JSFCGDR | 1,128 | 9,109 | ||||||
| Total Communications | 1,073,077 | |||||||
| ENERGY - 6.1% | ||||||||
| Dialog Group BHD | 61,210 | 30,147 | ||||||
| Yanzhou Coal Mining Company Ltd. — Class H | 31,876 | 26,799 | ||||||
| PTT PCL | 2,367 | 26,745 | ||||||
| China Longyuan Power Group Corporation Ltd. — Class H | 24,000 | 25,624 | ||||||
| Bumi Armada BHD | 52,800 | 25,202 | ||||||
| Polski Koncern Naftowy Orlen S.A. | 2,016 | 25,138 | ||||||
| China Coal Energy Company Ltd. — Class H | 40,216 | 24,632 | ||||||
| GCL-Poly Energy Holdings Ltd.* | 72,156 | 24,377 | ||||||
| Tatneft OAO ADR | 680 | 24,228 | ||||||
| Polskie Gornictwo Naftowe i Gazownictwo S.A. | 16,120 | 24,113 | ||||||
| Surgutneftegas OAO ADR | 3,656 | 24,056 | ||||||
| MOL Hungarian Oil & Gas plc | 504 | 23,962 | ||||||
| Tupras Turkiye Petrol Rafinerileri AS | 1,084 | 23,558 | ||||||
| China Shenhua Energy Company Ltd. — Class H | 8,224 | 23,171 | ||||||
| Ecopetrol S.A. ADR | 864 | 23,155 | ||||||
| Lukoil OAO ADR | 460 | 22,586 | ||||||
| Pacific Rubiales Energy Corp. | 1,492 | 22,410 | ||||||
| Kunlun Energy Company Ltd. | 16,380 | 21,713 | ||||||
| PTT Exploration & Production PCL | 4,822 | 21,689 | ||||||
| NovaTek OAOGDR | 200 | 21,480 | ||||||
| Sinopec Engineering Group Company Ltd. — Class H | 22,000 | 21,276 | ||||||
| CNOOC Ltd. ADR | 133 | 20,797 | ||||||
| Sasol Ltd. ADR | 412 | 20,678 | ||||||
| Banpu PCL | 23,640 | 20,504 | ||||||
| China Petroleum & Chemical Corp. — Class H | 23,654 | 20,497 | ||||||
| Thai Oil PCL | 14,824 | 20,368 | ||||||
| Rosneft OAOGDR | 3,604 | 20,074 | ||||||
| Adaro Energy Tbk PT | 213,400 | 20,042 | ||||||
| PetroChina Company Ltd. — Class H | 16,000 | 20,033 | ||||||
| SK Holdings Company Ltd. | 124 | 19,376 | ||||||
| Gazprom OAO ADR | 2,840 | 18,824 | ||||||
| GS Holdings Corp. | 483 | 18,733 | ||||||
| Formosa Petrochemical Corp. | 7,908 | 18,537 | ||||||
| Exxaro Resources Ltd. | 1,776 | 18,488 | ||||||
| Indo Tambangraya Megah Tbk PT | 10,400 | 18,223 | ||||||
| SK Innovation Company Ltd. | 216 | 17,685 | ||||||
| S-Oil Corp. | 448 | 17,040 | ||||||
| China Oilfield Services Ltd. — Class H | 7,096 | 14,805 | ||||||
| Total Energy | 830,765 | |||||||
| UTILITIES - 4.2% | ||||||||
| Tenaga Nasional BHD | 8,400 | 34,118 | ||||||
| Metro Pacific Investments Corp. | 296,400 | 33,554 | ||||||
| Guangdong Investment Ltd. | 24,452 | 32,160 | ||||||
| China Gas Holdings Ltd. | 16,428 | 29,402 | ||||||
| SEE NOTES TO FINANCIAL STATEMENTS. | GUGGENHEIM ETFs ANNUAL REPORT | 77 |
SCHEDULE OF INVESTMENTS (continued) | October 31, 2014 |
| GUGGENHEIM MSCI EMERGING MARKETS EQUAL WEIGHT ETF |
| Shares | Value | |||||||
| Energa S.A. | 3,904 | $ | 29,060 | |||||
| Huaneng Power International, Inc. — Class H | 23,664 | 29,049 | ||||||
| Beijing Enterprises Water Group Ltd. | 40,000 | 28,626 | ||||||
| Empresa Nacional de Electricidad S.A. ADR | 534 | 24,927 | ||||||
| Perusahaan Gas Negara Persero Tbk PT | 50,448 | 24,838 | ||||||
| Aguas Andinas S.A. — Class A | 40,048 | 24,039 | ||||||
| PGE S.A. | 3,632 | 23,871 | ||||||
| China Resources Power Holdings Company Ltd. | 8,000 | 23,262 | ||||||
| Enersis S.A. ADR | 1,469 | 23,196 | ||||||
| CEZ AS | 820 | 22,677 | ||||||
| RusHydro JSC ADR | 13,604 | 22,664 | ||||||
| Korea Electric Power Corp. ADR | 976 | 21,335 | ||||||
| Cia de Saneamento Basico do Estado de Sao Paulo ADR | 2,652 | 20,580 | ||||||
| Cia Paranaense de Energia ADR | 1,408 | 19,853 | ||||||
| CPFL Energia S.A. ADR | 1,260 | 18,774 | ||||||
| Beijing Enterprises Holdings Ltd. | 2,232 | 18,218 | ||||||
| Cia Energetica de Minas Gerais ADR | 2,980 | 17,224 | ||||||
| Centrais Eletricas Brasileiras S.A. ADR | 6,572 | 16,627 | ||||||
| Korea Gas Corp. | 348 | 16,314 | ||||||
| Public Power Corporation S.A.* | 1,904 | 14,456 | ||||||
| Total Utilities | 568,824 | |||||||
| TECHNOLOGY - 4.1% | ||||||||
| Hanergy Thin Film Power Group Ltd.* | 152,000 | 34,692 | ||||||
| Foxconn Technology Company Ltd. | 12,195 | 32,477 | ||||||
| Wipro Ltd. ADR | 2,268 | 27,669 | ||||||
| Taiwan Semiconductor Manufacturing Company Ltd. ADR | 1,163 | 25,609 | ||||||
| Wistron Corp. | 24,244 | 25,426 | ||||||
| United Microelectronics Corp. ADR* | 11,452 | 25,081 | ||||||
| Realtek Semiconductor Corp. | 7,544 | 24,926 | ||||||
| Inotera Memories, Inc.* | 16,000 | 24,592 | ||||||
| Siliconware Precision Industries Co. ADR | 3,384 | 24,128 | ||||||
| Vanguard International Semiconductor Corp. | 16,000 | 24,013 | ||||||
| Innolux Corp. | 51,820 | 23,596 | ||||||
| Lenovo Group Ltd. | 16,000 | 23,561 | ||||||
| Advanced Semiconductor Engineering, Inc. | 19,700 | 23,543 | ||||||
| Lite-On Technology Corp. | 16,006 | 22,417 | ||||||
| Novatek Microelectronics Corp. | 4,284 | 22,113 | ||||||
| Acer, Inc. | 32,000 | 21,935 | ||||||
| SK C&C Company Ltd. | 96 | 21,783 | ||||||
| Epistar Corp. | 12,000 | 21,659 | ||||||
| SK Hynix, Inc. | 480 | 21,311 | ||||||
| Compal Electronics, Inc. | 28,000 | 20,666 | ||||||
| Powertech Technology, Inc.* | 12,000 | 20,121 | ||||||
| Quanta Computer, Inc. | 8,000 | 20,094 | ||||||
| Kingsoft Corporation Ltd. | 8,000 | 18,878 | ||||||
Samsung Electronics Company Ltd.GDR2 | 32 | 18,400 | ||||||
| Total Technology | 568,690 | |||||||
| DIVERSIFIED - 2.4% | ||||||||
| IJM Corporation BHD | 16,000 | 33,661 | ||||||
| Sime Darby BHD | 10,800 | 31,784 | ||||||
| KOC Holding AS | 4,988 | 25,499 | ||||||
| Remgro Ltd. | 1,112 | 25,465 | ||||||
| Alfa SAB de CV — Class A | 7,969 | 25,362 | ||||||
| Haci Omer Sabanci Holding AS | 5,516 | 25,217 | ||||||
| Empresas COPEC S.A. | 2,020 | 24,427 | ||||||
| Imperial Holdings Ltd. | 1,384 | 23,797 | ||||||
| China Merchants Holdings International Company Ltd. | 7,141 | 22,560 | ||||||
| Siam Cement PCL | 1,600 | 22,106 | ||||||
| Barloworld Ltd. | 2,464 | 21,361 | ||||||
| CJ Corp. | 112 | 18,235 | ||||||
| LS Corp. | 291 | 16,310 | ||||||
| Siam Cement PCL | 500 | 6,908 | ||||||
| Total Diversified | 322,692 | |||||||
| Total Common Stocks | ||||||||
| (Cost $11,784,438) | 11,906,908 | |||||||
PREFERRED STOCKS† - 0.2% | ||||||||
| Embotelladora Andina S.A. | 7,752 | 24,561 | ||||||
| Total Preferred Stocks | ||||||||
| (Cost $36,751) | 24,561 | |||||||
WARRANTS†† - 0.0% | ||||||||
| Indorama Ventures PCL | ||||||||
| $36.00, 08/13/19 | 3,041 | 331 | ||||||
| Indorama Ventures PCL | ||||||||
| $43.00, 08/13/19 | 2,339 | 208 | ||||||
| Minor International PCL | ||||||||
| $40.00, 12/31/17 | 1,080 | — | ||||||
| Total Warrants | ||||||||
| (Cost $–) | 539 | |||||||
RIGHTS†† - 0.0% | ||||||||
| Agile Property Holdings Ltd. | ||||||||
| Expires 12/11/14 | 4,000 | 263 | ||||||
| Total Rights | ||||||||
| (Cost $–) | 263 | |||||||
EXCHANGE TRADED FUNDS† - 12.5% | ||||||||
WisdomTree India Earnings Fund1 | 48,364 | 1,123,012 | ||||||
iShares MSCI Brazil Capped ETF1 | 13,616 | 588,756 | ||||||
| Total Exchange Traded Funds | ||||||||
| (Cost $1,808,549) | 1,711,768 | |||||||
SHORT TERM INVESTMENTS† - 0.2% | ||||||||
| Federated U.S. Treasury Cash Reserve Fund | 21,591 | 21,591 | ||||||
| Total Short Term Investments | ||||||||
| (Cost $21,591) | 21,591 | |||||||
78 | GUGGENHEIM ETFs ANNUAL REPORT | SEE NOTES TO FINANCIAL STATEMENTS. |
SCHEDULE OF INVESTMENTS (continued) | October 31, 2014 |
| GUGGENHEIM MSCI EMERGING MARKETS EQUAL WEIGHT ETF |
| Face Amount | Value | |||||||
SECURITIES LENDING COLLATERAL††,3 - 13.1% | ||||||||
| Joint Repurchase Agreements | ||||||||
| HSBC Securities, Inc. issued 10/31/14 at 0.08% due 11/03/14 | $ | 1,127,821 | $ | 1,127,821 | ||||
| BNP Paribas Securities Corp. issued 10/31/14 at 0.11% due 11/03/14 | 515,864 | 515,864 | ||||||
| Barclays Capital, Inc. issued 10/31/14 at 0.07% due 11/03/14 | 147,861 | 147,861 | ||||||
| Total Securities Lending Collateral | ||||||||
| (Cost $1,791,546) | 1,791,546 | |||||||
| Total Investments - 113.2% | ||||||||
| (Cost $15,442,875) | 15,457,176 | |||||||
| Other Assets & Liabilities, net - (13.2)% | (1,802,981 | ) | ||||||
| Total Net Assets - 100.0% | $ | 13,654,195 | ||||||
| * | Non-income producing security. |
| † | Value determined based on Level 1 inputs — See Note 4. |
| †† | Value determined based on Level 2 inputs — See Note 4. |
| ††† | Value determined based on Level 3 inputs — See Note 4. |
| 1 | All or portion of this security is on loan at October 31, 2014 — See Note 5. |
| 2 | Security is a 144A or Section 4(a)(2) security. The total market value of 144A or Section 4(a)(2) securities is $18,400 (cost $16,095), or 0.1% of total net assets. These securities have been determined to be liquid under guidelines established by the Board of Trustees. |
| 3 | Securities lending collateral — See Note 5. |
| 4 | This security was fair valued by the Valuation Committee at October 31, 2014. |
| ADR — American Depositary Receipt | |
| GDR — Global Depositary Receipt | |
| plc — Public Limited Company |
| SEE NOTES TO FINANCIAL STATEMENTS. | GUGGENHEIM ETFs ANNUAL REPORT | 79 |
SCHEDULE OF INVESTMENTS (concluded) | October 31, 2014 |
| GUGGENHEIM MSCI EMERGING MARKETS EQUAL WEIGHT ETF |
INVESTMENT CONCENTRATION
At October 31, 2014, the investment diversification of the Fund by country was as follows:
| Country | % of Total Investments |
| Taiwan, Province of China | 13.4% |
| United States | 12.8% |
| Republic of Korea | 12.0% |
| China | 10.5% |
| South Africa | 6.5% |
| Cayman Islands | 4.9% |
| Thailand | 4.9% |
| Malaysia | 4.6% |
| Mexico | 3.7% |
| Indonesia | 3.6% |
| Turkey | 3.2% |
| Hong Kong | 2.9% |
| Brazil | 2.6% |
| Chile | 2.4% |
| Russian Federation | 2.3% |
| Poland | 2.1% |
| Bermuda | 1.9% |
| Philippines | 1.8% |
| Greece | 0.9% |
| India | 0.8% |
| Hungary | 0.5% |
| Czech Republic | 0.5% |
| Egypt | 0.5% |
| Colombia | 0.4% |
| Canada | 0.2% |
| Peru | 0.1% |
| Total Investments | 100% |
80 | GUGGENHEIM ETFs ANNUAL REPORT | SEE NOTES TO FINANCIAL STATEMENTS. |
| SCHEDULE OF INVESTMENTS | October 31, 2014 |
GUGGENHEIM S&P 500® EQUAL WEIGHT CONSUMER DISCRETIONARY ETF |
| Shares | Value | |||||||
COMMON STOCKS† - 99.7% | ||||||||
| RETAIL-APPAREL/SHOE - 6.8% | ||||||||
| L Brands, Inc. | 16,016 | $ | 1,155,075 | |||||
| Ross Stores, Inc. | 13,889 | 1,121,120 | ||||||
| Coach, Inc. | 28,245 | 971,063 | ||||||
| PVH Corp. | 8,235 | 941,672 | ||||||
| The Gap, Inc. | 23,571 | 893,105 | ||||||
| Urban Outfitters, Inc.* | 26,894 | 816,502 | ||||||
| Total Retail-Apparel/Shoe | 5,898,537 | |||||||
| RETAIL-RESTAURANTS - 6.1% | ||||||||
Darden Restaurants, Inc.1 | 21,942 | 1,136,157 | ||||||
| McDonald’s Corp. | 11,183 | 1,048,183 | ||||||
| Yum! Brands, Inc. | 14,584 | 1,047,569 | ||||||
| Starbucks Corp. | 13,834 | 1,045,297 | ||||||
| Chipotle Mexican Grill, Inc. — Class A* | 1,570 | 1,001,660 | ||||||
| Total Retail-Restaurants | 5,278,866 | |||||||
| RETAIL-DISCOUNT - 4.9% | ||||||||
| Dollar Tree, Inc.* | 18,669 | 1,130,782 | ||||||
| Family Dollar Stores, Inc. | 13,299 | 1,041,179 | ||||||
| Target Corp. | 16,694 | 1,032,023 | ||||||
| Dollar General Corp.* | 16,332 | 1,023,526 | ||||||
| Total Retail-Discount | 4,227,510 | |||||||
| MULTIMEDIA - 4.7% | ||||||||
| Time Warner, Inc. | 13,589 | 1,079,918 | ||||||
| Walt Disney Co. | 11,640 | 1,063,663 | ||||||
| Twenty-First Century Fox, Inc. — Class A | 29,783 | 1,026,918 | ||||||
| Viacom, Inc. — Class B | 13,127 | 954,070 | ||||||
| Total Multimedia | 4,124,569 | |||||||
| APPAREL MANUFACTURERS - 4.7% | ||||||||
| VF Corp. | 15,854 | 1,072,998 | ||||||
| Michael Kors Holdings Ltd.* | 13,586 | 1,067,724 | ||||||
| Ralph Lauren Corp. — Class A | 6,005 | 989,864 | ||||||
| Under Armour, Inc. — Class A* | 15,075 | 988,619 | ||||||
| Total Apparel Manufacturers | 4,119,205 | |||||||
| CABLE/SATELLITE TV - 4.7% | ||||||||
| DIRECTV* | 12,018 | 1,043,042 | ||||||
Cablevision Systems Corp. — Class A1 | 54,513 | 1,015,032 | ||||||
| Comcast Corp. — Class A | 18,289 | 1,012,296 | ||||||
| Time Warner Cable, Inc. | 6,765 | 995,876 | ||||||
| Total Cable/Satellite TV | 4,066,246 | |||||||
| E-COMMERCE/SERVICES - 4.5% | ||||||||
| Priceline Group, Inc.* | 896 | 1,080,765 | ||||||
| Expedia, Inc. | 12,060 | 1,024,738 | ||||||
| TripAdvisor, Inc.* | 10,509 | 931,728 | ||||||
| Netflix, Inc.* | 2,194 | 861,737 | ||||||
| Total E-Commerce/Services | 3,898,968 | |||||||
| BUILDINGS - RESIDENTIAL/COMMERCIAL - 3.8% | ||||||||
| Lennar Corp. — Class A | 26,724 | 1,151,270 | ||||||
| DR Horton, Inc. | 48,643 | 1,108,574 | ||||||
| PulteGroup, Inc. | 55,588 | 1,066,734 | ||||||
| Total Buildings - Residential/Commercial | 3,326,578 | |||||||
| HOTELS & MOTELS - 3.6% | ||||||||
| Marriott International, Inc. — Class A | 14,782 | 1,119,737 | ||||||
| Wyndham Worldwide Corp. | 12,966 | 1,007,069 | ||||||
| Starwood Hotels & Resorts Worldwide, Inc. | 12,568 | 963,463 | ||||||
| Total Hotels & Motels | 3,090,269 | |||||||
| AUTO/TRUCK PARTS & EQUIPMENTS - ORIGINAL - 3.5% | ||||||||
| Johnson Controls, Inc. | 22,409 | 1,058,825 | ||||||
| Delphi Automotive plc | 14,878 | 1,026,284 | ||||||
| BorgWarner, Inc. | 17,338 | 988,613 | ||||||
| Total Auto/Truck Parts & Equipments - Original | 3,073,722 | |||||||
| RETAIL-AUTO PARTS - 2.6% | ||||||||
| O’Reilly Automotive, Inc.* | 6,769 | 1,190,532 | ||||||
| AutoZone, Inc.* | 1,970 | 1,090,434 | ||||||
| Total Retail-Auto Parts | 2,280,966 | |||||||
| RETAIL-BUILDING PRODUCTS - 2.6% | ||||||||
| Home Depot, Inc. | 11,750 | 1,145,860 | ||||||
| Lowe’s Companies, Inc. | 19,706 | 1,127,183 | ||||||
| Total Retail-Building Products | 2,273,043 | |||||||
| RETAIL-AUTOMOBILE - 2.6% | ||||||||
| AutoNation, Inc.* | 19,936 | 1,141,536 | ||||||
| CarMax, Inc.* | 19,876 | 1,111,267 | ||||||
| Total Retail-Automobile | 2,252,803 | |||||||
| RETAIL - MAJOR DEPARTMENT STORES - 2.5% | ||||||||
| TJX Companies, Inc. | 17,431 | 1,103,730 | ||||||
| Nordstrom, Inc. | 15,114 | 1,097,428 | ||||||
| Total Retail - Major Department Stores | 2,201,158 | |||||||
| DISTRIBUTION/WHOLESALE - 2.5% | ||||||||
| Genuine Parts Co. | 11,781 | 1,143,700 | ||||||
| Fossil Group, Inc.* | 10,134 | 1,030,222 | ||||||
| Total Distribution/Wholesale | 2,173,922 | |||||||
| ADVERTISING AGENCIES - 2.5% | ||||||||
| Interpublic Group of Companies, Inc. | 55,350 | 1,073,237 | ||||||
| Omnicom Group, Inc. | 14,700 | 1,056,342 | ||||||
| Total Advertising Agencies | 2,129,579 | |||||||
| TOYS - 2.4% | ||||||||
| Hasbro, Inc. | 19,453 | 1,119,131 | ||||||
| Mattel, Inc. | 30,399 | 944,497 | ||||||
| Total Toys | 2,063,628 | |||||||
| SEE NOTES TO FINANCIAL STATEMENTS. | GUGGENHEIM ETFs ANNUAL REPORT | 81 |
SCHEDULE OF INVESTMENTS (continued) | October 31, 2014 |
GUGGENHEIM S&P 500® EQUAL WEIGHT CONSUMER DISCRETIONARY ETF |
| Shares | Value | |||||||
| PUBLISHING-NEWSPAPERS - 2.3% | ||||||||
| Gannett Company, Inc. | 32,470 | $ | 1,022,805 | |||||
| News Corp. — Class A* | 60,979 | 943,955 | ||||||
| Total Publishing-Newspapers | 1,966,760 | |||||||
| RETAIL - REGIONAL DEPARTMENT STORES - 2.2% | ||||||||
| Macy’s, Inc. | 17,520 | 1,013,006 | ||||||
| Kohl’s Corp. | 17,291 | 937,518 | ||||||
| Total Retail - Regional Department Stores | 1,950,524 | |||||||
| AUTO-CARS/LIGHT TRUCKS - 2.2% | ||||||||
| General Motors Co. | 31,376 | 985,207 | ||||||
| Ford Motor Co. | 62,927 | 886,641 | ||||||
| Total Auto-Cars/Light Trucks | 1,871,848 | |||||||
| BROADCAST SERVICES/PROGRAM - 1.7% | ||||||||
| Scripps Networks Interactive, Inc. — Class A | 13,326 | 1,029,300 | ||||||
| Discovery Communications, Inc. — Class A* | 13,306 | 470,367 | ||||||
| Total Broadcast Services/Program | 1,499,667 | |||||||
| RETAIL - GARDENING PRODUCTS - 1.4% | ||||||||
| Tractor Supply Co. | 17,101 | 1,252,135 | ||||||
| ATHLETIC FOOTWEAR - 1.4% | ||||||||
| NIKE, Inc. — Class B | 12,755 | 1,185,832 | ||||||
| APPLIANCES - 1.4% | ||||||||
| Whirlpool Corp. | 6,866 | 1,181,295 | ||||||
| DIVERSIFIED MANUFACTURING OPERATIONS - 1.4% | ||||||||
| Leggett & Platt, Inc. | 29,750 | 1,171,555 | ||||||
| CASINO HOTELS - 1.3% | ||||||||
| Wynn Resorts Ltd. | 5,719 | 1,086,667 | ||||||
| ELECTRONIC COMPONENTS-MISCELLANEOUS - 1.2% | ||||||||
Garmin Ltd.1 | 19,500 | 1,081,860 | ||||||
| RETAIL-BEDDING - 1.2% | ||||||||
| Bed Bath & Beyond, Inc.* | 16,035 | 1,079,797 | ||||||
| RETAIL-PET FOOD&SUPPLIES - 1.2% | ||||||||
| PetSmart, Inc. | 14,806 | 1,071,214 | ||||||
| CRUISE LINES - 1.2% | ||||||||
| Carnival Corp. | 26,643 | 1,069,716 | ||||||
| MOTORCYCLE/MOTOR SCOOTER - 1.2% | ||||||||
| Harley-Davidson, Inc. | 16,208 | 1,064,866 | ||||||
| RETAIL- CONSUMER ELECTRONICS - 1.2% | ||||||||
| Best Buy Company, Inc. | 31,051 | 1,060,081 | ||||||
| TEXTILE-HOME FURNISHINGS - 1.2% | ||||||||
| Mohawk Industries, Inc.* | 7,344 | 1,043,142 | ||||||
| COMMERICAL SERVICES-FINANCE - 1.2% | ||||||||
| H&R Block, Inc. | 32,174 | 1,039,542 | ||||||
| RUBBER-TIRES - 1.2% | ||||||||
| Goodyear Tire & Rubber Co. | 42,437 | 1,028,249 | ||||||
| RETAIL-COMPUTER EQUIPMENTS - 1.2% | ||||||||
GameStop Corp. — Class A1 | 23,941 | 1,023,717 | ||||||
| RETAIL-OFFICE SUPPLIES - 1.2% | ||||||||
| Staples, Inc. | 80,641 | 1,022,528 | ||||||
| HOME DECORATION PRODUCTS - 1.2% | ||||||||
| Newell Rubbermaid, Inc. | 30,497 | 1,016,465 | ||||||
| AUDIO/VIDEO PRODUCTS - 1.2% | ||||||||
| Harman International Industries, Inc. | 9,386 | 1,007,493 | ||||||
| RETAIL-JEWELRY - 1.1% | ||||||||
| Tiffany & Co. | 10,318 | 991,766 | ||||||
| TELEVISION - 1.1% | ||||||||
| CBS Corp. — Class B | 18,233 | 988,593 | ||||||
| E-COMMERCE/PRODUCTS - 1.1% | ||||||||
| Amazon.com, Inc.* | 3,155 | 963,726 | ||||||
| BROADCAST SERV/PROGRAM - 0.5% | ||||||||
| Discovery Communications, Inc. — Class C* | 13,306 | 465,577 | ||||||
| Total Common Stocks | ||||||||
| (Cost $81,873,413) | 86,664,184 | |||||||
SHORT TERM INVESTMENTS† - 0.2% | ||||||||
| Federated U.S. Treasury Cash Reserve Fund | 216,689 | 216,689 | ||||||
| Total Short Term Investments | ||||||||
| (Cost $216,689) | 216,689 | |||||||
82 | GUGGENHEIM ETFs ANNUAL REPORT | SEE NOTES TO FINANCIAL STATEMENTS. |
SCHEDULE OF INVESTMENTS (concluded) | October 31, 2014 |
GUGGENHEIM S&P 500® EQUAL WEIGHT CONSUMER DISCRETIONARY ETF |
| Face Amount | Value | |||||||
| SECURITIES LENDING COLLATERAL††, 2 - 4.5% | ||||||||
| Joint Repurchase Agreements | ||||||||
| HSBC Securities, Inc. issued 10/31/14 at 0.08% due 11/03/14 | $ | 2,442,721 | $ | 2,442,721 | ||||
| BNP Paribas Securities Corp. issued 10/31/14 at 0.11% due 11/03/14 | 1,117,298 | 1,117,298 | ||||||
| Barclays Capital, Inc. issued 10/31/14 at 0.07% due 11/03/14 | 320,248 | 320,248 | ||||||
| Total Securities Lending Collateral | ||||||||
| (Cost $3,880,267) | 3,880,267 | |||||||
| Total Investments - 104.4% | ||||||||
| (Cost $85,970,369) | $ | 90,761,140 | ||||||
| Other Assets & Liabilities, net - (4.4)% | (3,863,981 | ) | ||||||
| Total Net Assets - 100.0% | $ | 86,897,159 | ||||||
| * | Non-income producing security. |
| † | Value determined based on Level 1 inputs — See Note 4. |
| †† | Value determined based on Level 2 inputs — See Note 4. |
| 1 | All or portion of this security is on loan at October 31, 2014 — See Note 5. |
| 2 | Securities lending collateral — See Note 5. |
| plc — Public Limited Company |
| SEE NOTES TO FINANCIAL STATEMENTS. | GUGGENHEIM ETFs ANNUAL REPORT | 83 |
| SCHEDULE OF INVESTMENTS | October 31, 2014 |
GUGGENHEIM S&P 500® EQUAL WEIGHT CONSUMER STAPLES ETF |
| Shares | Value | |||||||
COMMON STOCKS† - 99.8% | ||||||||
| FOOD-MISCELLANEOUS/DIVERSIFIED - 17.0% | ||||||||
| ConAgra Foods, Inc. | 138,680 | $ | 4,763,658 | |||||
| McCormick & Company, Inc. | 65,714 | 4,647,294 | ||||||
| Campbell Soup Co. | 103,341 | 4,564,572 | ||||||
| Kellogg Co. | 70,199 | 4,489,928 | ||||||
| Mondelez International, Inc. — Class A | 126,981 | 4,477,350 | ||||||
| General Mills, Inc. | 84,959 | 4,414,470 | ||||||
| Kraft Foods Group, Inc. | 77,702 | 4,378,508 | ||||||
| Total Food-Miscellaneous/Diversified | 31,735,780 | |||||||
| BEVERAGES-NON-ALCOHOLIC - 12.7% | ||||||||
| Monster Beverage Corp.* | 49,894 | 5,033,306 | ||||||
| Dr Pepper Snapple Group, Inc. | 72,475 | 5,018,894 | ||||||
| PepsiCo, Inc. | 49,353 | 4,746,278 | ||||||
| Coca-Cola Co. | 108,173 | 4,530,285 | ||||||
| Coca-Cola Enterprises, Inc. | 99,245 | 4,302,271 | ||||||
| Total Beverages-Non-alcoholic | 23,631,034 | |||||||
| TOBACCO - 10.4% | ||||||||
| Altria Group, Inc. | 103,913 | 5,023,154 | ||||||
| Reynolds American, Inc. | 78,134 | 4,915,410 | ||||||
| Philip Morris International, Inc. | 53,379 | 4,751,265 | ||||||
| Lorillard, Inc. | 75,911 | 4,668,527 | ||||||
| Total Tobacco | 19,358,356 | |||||||
| COSMETICS & TOILETRIES - 9.3% | ||||||||
| Procter & Gamble Co. | 53,865 | 4,700,798 | ||||||
| Colgate-Palmolive Co. | 69,554 | 4,651,772 | ||||||
| Estee Lauder Companies, Inc. — Class A | 60,217 | 4,527,114 | ||||||
| Avon Products, Inc. | 330,019 | 3,432,198 | ||||||
| Total Cosmetics & Toiletries | 17,311,882 | |||||||
| FOOD-RETAIL - 7.5% | ||||||||
| Kroger Co. | 86,530 | 4,820,587 | ||||||
| Whole Foods Market, Inc. | 117,731 | 4,630,360 | ||||||
| Safeway, Inc. | 129,998 | 4,531,730 | ||||||
| Total Food-Retail | 13,982,677 | |||||||
| CONSUMER PRODUCTS-MISCELLANEOUS - 5.2% | ||||||||
| Clorox Co. | 50,406 | 5,015,397 | ||||||
| Kimberly-Clark Corp. | 41,161 | 4,703,467 | ||||||
| Total Consumer Products-Miscellaneous | 9,718,864 | |||||||
| FOOD-MEAT PRODUCTS - 5.1% | ||||||||
| Hormel Foods Corp. | 89,750 | 4,838,422 | ||||||
| Tyson Foods, Inc. — Class A | 117,222 | 4,729,908 | ||||||
| Total Food-Meat Products | 9,568,330 | |||||||
| BEVERAGES-WINE/SPIRITS - 5.0% | ||||||||
| Constellation Brands, Inc. — Class A* | 52,209 | 4,779,212 | ||||||
| Brown-Forman Corp. — Class B | 49,831 | 4,617,839 | ||||||
| Total Beverages-Wine/Spirits | 9,397,051 | |||||||
| RETAIL-DRUG STORE - 5.0% | ||||||||
| CVS Health Corp. | 55,666 | 4,776,700 | ||||||
| Walgreen Co. | 71,393 | 4,584,858 | ||||||
| Total Retail-Drug Store | 9,361,558 | |||||||
| FOOD-CONFECTIONERY - 5.0% | ||||||||
| JM Smucker Co. | 44,983 | 4,678,232 | ||||||
| Hershey Co. | 48,395 | 4,641,564 | ||||||
| Total Food-Confectionery | 9,319,796 | |||||||
| RETAIL-DISCOUNT - 5.0% | ||||||||
| Costco Wholesale Corp. | 35,773 | 4,771,045 | ||||||
| Wal-Mart Stores, Inc. | 59,190 | 4,514,421 | ||||||
| Total Retail-Discount | 9,285,466 | |||||||
| COFFEE - 2.8% | ||||||||
| Keurig Green Mountain, Inc. | 34,209 | 5,191,216 | ||||||
| BREWERY - 2.5% | ||||||||
| Molson Coors Brewing Co. — Class B | 62,466 | 4,646,221 | ||||||
| VITAMINS & NUTRITION PRODUCTS - 2.5% | ||||||||
| Mead Johnson Nutrition Co. — Class A | 46,385 | 4,606,494 | ||||||
| FOOD-WHOLESALE/DISTRIBUTION - 2.5% | ||||||||
| Sysco Corp. | 118,586 | 4,570,304 | ||||||
| AGRICULTURAL OPERATIONS - 2.2% | ||||||||
| Archer-Daniels-Midland Co. | 88,968 | 4,181,496 | ||||||
| CONSUMER PRODUCTS-MISC - 0.1% | ||||||||
| Kimberly-Clark Corp.* | 1,795 | 197,863 | ||||||
| Total Common Stocks | ||||||||
| (Cost $173,704,975) | 186,064,388 | |||||||
SHORT TERM INVESTMENTS† - 0.1% | ||||||||
| Federated U.S. Treasury Cash Reserve Fund | 220,024 | 220,024 | ||||||
| Total Short Term Investments | ||||||||
| (Cost $220,024) | 220,024 | |||||||
| Total Investments - 99.9% | ||||||||
| (Cost $173,924,999) | $ | 186,284,412 | ||||||
| Other Assets & Liabilities, net - 0.1% | 97,558 | |||||||
| Total Net Assets - 100.0% | $ | 186,381,970 | ||||||
| * | Non-income producing security. |
| † | Value determined based on Level 1 inputs — See Note 4. |
84 | GUGGENHEIM ETFs ANNUAL REPORT | SEE NOTES TO FINANCIAL STATEMENTS. |
| SCHEDULE OF INVESTMENTS | October 31, 2014 |
GUGGENHEIM S&P 500® EQUAL WEIGHT ENERGY ETF |
| Shares | Value | |||||||
COMMON STOCKS† - 99.9% | ||||||||
| OIL COMPANY - EXPLORATION & PRODUCTION - 40.5% | ||||||||
| Equities Corp. | 27,170 | $ | 2,555,066 | |||||
| Range Resources Corp. | 35,396 | 2,421,085 | ||||||
| Cabot Oil & Gas Corp. — Class A | 77,702 | 2,416,532 | ||||||
| EOG Resources, Inc. | 25,310 | 2,405,716 | ||||||
| Pioneer Natural Resources Co. | 12,678 | 2,396,903 | ||||||
| ConocoPhillips | 32,687 | 2,358,367 | ||||||
| Occidental Petroleum Corp. | 26,334 | 2,341,883 | ||||||
| Chesapeake Energy Corp. | 102,966 | 2,283,786 | ||||||
| Hess Corp. | 26,437 | 2,242,122 | ||||||
| Anadarko Petroleum Corp. | 24,310 | 2,231,172 | ||||||
| Southwestern Energy Co.* | 68,411 | 2,224,042 | ||||||
| Devon Energy Corp. | 36,655 | 2,199,300 | ||||||
| Newfield Exploration Co.* | 66,921 | 2,182,294 | ||||||
| Cimarex Energy Co. | 19,147 | 2,176,439 | ||||||
| Noble Energy, Inc. | 37,284 | 2,148,677 | ||||||
| Apache Corp. | 26,657 | 2,057,920 | ||||||
| QEP Resources, Inc. | 80,924 | 2,028,765 | ||||||
| Denbury Resources, Inc. | 160,884 | 1,994,962 | ||||||
| Total Oil Company - Exploration & Production | 40,665,031 | |||||||
| OIL & GAS DRILLING - 12.9% | ||||||||
Diamond Offshore Drilling, Inc.1 | 64,380 | 2,427,770 | ||||||
| Ensco plc — Class A | 55,440 | 2,250,310 | ||||||
| Helmerich & Payne, Inc. | 25,431 | 2,207,919 | ||||||
Transocean Ltd.1 | 71,511 | 2,133,173 | ||||||
| Noble Corporation plc | 98,819 | 2,067,293 | ||||||
| Nabors Industries Ltd. | 106,276 | 1,897,027 | ||||||
| Total Oil & Gas Drilling | 12,983,492 | |||||||
| OIL COMPANY - INTEGRATED - 12.2% | ||||||||
| Exxon Mobil Corp. | 26,783 | 2,590,183 | ||||||
| Chevron Corp. | 20,921 | 2,509,474 | ||||||
| Phillips 66 | 30,881 | 2,424,159 | ||||||
| Murphy Oil Corp. | 44,782 | 2,390,911 | ||||||
| Marathon Oil Corp. | 64,799 | 2,293,885 | ||||||
| Total Oil Company - Integrated | 12,208,612 | |||||||
| PIPELINES - 9.9% | ||||||||
Kinder Morgan, Inc.1 | 67,927 | 2,628,775 | ||||||
| Williams Companies, Inc. | 45,629 | 2,532,866 | ||||||
| Spectra Energy Corp. | 64,369 | 2,518,759 | ||||||
| ONEOK, Inc. | 37,935 | 2,235,889 | ||||||
| Total Pipelines | 9,916,289 | |||||||
| OIL REFINING & MARKETING - 8.3% | ||||||||
| Tesoro Corp. | 41,693 | 2,977,297 | ||||||
| Marathon Petroleum Corp. | 29,527 | 2,684,004 | ||||||
| Valero Energy Corp. | 52,965 | 2,653,017 | ||||||
| Total Oil Refining & Marketing | 8,314,318 | |||||||
| OIL FIELD MACHINERY & EQUIPMENT - 7.0% | ||||||||
| FMC Technologies, Inc.* | 45,230 | 2,534,689 | ||||||
| National Oilwell Varco, Inc. | 31,795 | 2,309,589 | ||||||
| Cameron International Corp.* | 36,078 | 2,148,445 | ||||||
| Total Oil Field Machinery & Equipment | 6,992,723 | |||||||
| OIL-FIELD SERVICES - 6.7% | ||||||||
| Schlumberger Ltd. | 25,099 | 2,476,267 | ||||||
| Halliburton Co. | 38,949 | 2,147,648 | ||||||
| Baker Hughes, Inc. | 38,574 | 2,042,879 | ||||||
| Total Oil-Field Services | 6,666,794 | |||||||
| COAL - 2.4% | ||||||||
| CONSOL Energy, Inc. | 65,480 | 2,409,664 | ||||||
| Total Common Stocks | ||||||||
| (Cost $120,148,526) | 100,156,923 | |||||||
SHORT TERM INVESTMENTS† - 0.0% | ||||||||
| Federated U.S. Treasury Cash Reserve Fund | 26,170 | 26,170 | ||||||
| Total Short Term Investments | ||||||||
| (Cost $26,170) | 26,170 | |||||||
| SEE NOTES TO FINANCIAL STATEMENTS. | GUGGENHEIM ETFs ANNUAL REPORT | 85 |
SCHEDULE OF INVESTMENTS (concluded) | October 31, 2014 |
GUGGENHEIM S&P 500® EQUAL WEIGHT ENERGY ETF |
| Face Amount | Value | |||||||
SECURITIES LENDING COLLATERAL††,2 - 7.0% | ||||||||
| Joint Repurchase Agreements | ||||||||
| HSBC Securities, Inc. issued 10/31/14 at 0.08% due 11/03/14 | $ | 4,450,559 | $ | 4,450,559 | ||||
| BNP Paribas Securities Corp. issued 10/31/14 at 0.11% due 11/03/14 | 2,035,682 | 2,035,682 | ||||||
| Barclays Capital, Inc. issued 10/31/14 at 0.07% due 11/03/14 | 583,482 | 583,482 | ||||||
| Total Securities Lending Collateral | ||||||||
| (Cost $7,069,723) | 7,069,723 | |||||||
| Total Investments - 106.9% | ||||||||
| (Cost $127,244,419) | $ | 107,252,816 | ||||||
| Other Assets & Liabilities, net - (6.9)% | (6,945,956 | ) | ||||||
| Total Net Assets - 100.0% | $ | 100,306,860 | ||||||
| * | Non-income producing security. |
| † | Value determined based on Level 1 inputs — See Note 4. |
| †† | Value determined based on Level 2 inputs — See Note 4. |
| 1 | All or portion of this security is on loan at October 31, 2014 — See Note 5. |
| 2 | Securities lending collateral — See Note 5. |
| plc — Public Limited Company |
86 | GUGGENHEIM ETFs ANNUAL REPORT | SEE NOTES TO FINANCIAL STATEMENTS. |
| SCHEDULE OF INVESTMENTS | October 31, 2014 |
GUGGENHEIM S&P 500® EQUAL WEIGHT FINANCIALS ETF |
| Shares | Value | |||||||
COMMON STOCKS† - 99.8% | ||||||||
| MULTI-LINE INSURANCE - 11.9% | ||||||||
| Hartford Financial Services Group, Inc. | 41,986 | $ | 1,661,805 | |||||
| Allstate Corp. | 25,570 | 1,658,215 | ||||||
| Genworth Financial, Inc. — Class A* | 118,433 | 1,656,878 | ||||||
| Assurant, Inc. | 24,114 | 1,645,057 | ||||||
| Cincinnati Financial Corp. | 32,468 | 1,638,660 | ||||||
| ACE Ltd. | 14,870 | 1,625,291 | ||||||
| Loews Corp. | 36,780 | 1,603,608 | ||||||
| XL Group plc — Class A | 46,659 | 1,580,807 | ||||||
| MetLife, Inc. | 28,120 | 1,525,229 | ||||||
| American International Group, Inc. | 28,263 | 1,514,049 | ||||||
| Total Multi-Line Insurance | 16,109,599 | |||||||
| SUPER-REGIONAL BANKS-U.S. - 10.2% | ||||||||
| Wells Fargo & Co. | 30,170 | 1,601,725 | ||||||
| Capital One Financial Corp. | 19,270 | 1,594,978 | ||||||
| U.S. Bancorp | 36,958 | 1,574,411 | ||||||
| PNC Financial Services Group, Inc. | 18,091 | 1,562,881 | ||||||
| SunTrust Banks, Inc. | 39,919 | 1,562,430 | ||||||
| Huntington Bancshares, Inc. | 153,981 | 1,525,952 | ||||||
| Fifth Third Bancorp | 75,554 | 1,510,324 | ||||||
| KeyCorp | 111,975 | 1,478,070 | ||||||
| Comerica, Inc. | 30,442 | 1,453,301 | ||||||
| Total Super-Regional Banks-U.S. | 13,864,072 | |||||||
| INVESTMENT MANAGEMENT/ADVISORY SERVICES - 8.1% | ||||||||
| BlackRock, Inc. — Class A | 4,740 | 1,616,862 | ||||||
| Legg Mason, Inc. | 31,054 | 1,614,809 | ||||||
| T. Rowe Price Group, Inc. | 19,616 | 1,610,277 | ||||||
| Ameriprise Financial, Inc. | 12,494 | 1,576,368 | ||||||
| Franklin Resources, Inc. | 28,130 | 1,564,309 | ||||||
| Invesco Ltd. | 38,232 | 1,547,249 | ||||||
| Affiliated Managers Group, Inc.* | 7,579 | 1,514,208 | ||||||
| Total Investment Management/Advisory Services | 11,044,082 | |||||||
| LIFE/HEALTH INSURANCE - 6.7% | ||||||||
| Aflac, Inc. | 26,089 | 1,558,296 | ||||||
| Lincoln National Corp. | 28,438 | 1,557,265 | ||||||
| Torchmark Corp. | 29,074 | 1,539,759 | ||||||
| Prudential Financial, Inc. | 17,152 | 1,518,638 | ||||||
| Principal Financial Group, Inc. | 28,864 | 1,511,608 | ||||||
| Unum Group | 43,424 | 1,452,967 | ||||||
| Total Life/Health Insurance | 9,138,533 | |||||||
| REITs-DIVERSIFIED - 5.9% | ||||||||
| Vornado Realty Trust | 15,183 | 1,662,234 | ||||||
| Plum Creek Timber Company, Inc. | 39,361 | 1,614,195 | ||||||
| Weyerhaeuser Co. | 47,139 | 1,596,127 | ||||||
| American Tower Corp. — Class A | 16,246 | 1,583,985 | ||||||
| Crown Castle International Corp. | 19,798 | 1,546,620 | ||||||
| Total REITs-Diversified | 8,003,161 | |||||||
| DIVERSIFIED BANKING INSTITUTIONS - 5.8% | ||||||||
| Goldman Sachs Group, Inc. | 8,515 | 1,617,765 | ||||||
| Bank of America Corp. | 92,894 | 1,594,061 | ||||||
| Citigroup, Inc. | 29,777 | 1,593,963 | ||||||
| JPMorgan Chase & Co. | 25,983 | 1,571,452 | ||||||
| Morgan Stanley | 44,553 | 1,557,127 | ||||||
| Total Diversified Banking Institutions | 7,934,368 | |||||||
| REITs-APARTMENTS - 5.0% | ||||||||
| Equity Residential | 24,902 | 1,732,183 | ||||||
| Essex Property Trust, Inc. | 8,515 | 1,717,986 | ||||||
| Apartment Investment & Management Co. — Class A | 47,368 | 1,695,301 | ||||||
| AvalonBay Communities, Inc. | 10,759 | 1,676,683 | ||||||
| Total REITs-Apartments | 6,822,153 | |||||||
| REITs-HEALTH CARE - 3.8% | ||||||||
| Health Care REIT, Inc. | 24,662 | 1,753,715 | ||||||
| Ventas, Inc. | 25,490 | 1,746,320 | ||||||
| HCP, Inc. | 38,466 | 1,691,350 | ||||||
| Total REITs-Health Care | 5,191,385 | |||||||
| REITs-REGIONAL MALLS - 3.7% | ||||||||
| Macerich Co. | 24,330 | 1,715,265 | ||||||
| General Growth Properties, Inc. | 65,590 | 1,699,437 | ||||||
| Simon Property Group, Inc. | 9,426 | 1,689,233 | ||||||
| Total REITs-Regional Malls | 5,103,935 | |||||||
| PROPERTY & CASUALTY INSURANCE - 3.7% | ||||||||
| Chubb Corp. | 17,184 | 1,707,401 | ||||||
| Travelers Companies, Inc. | 16,877 | 1,701,202 | ||||||
| Progressive Corp. | 62,243 | 1,643,838 | ||||||
| Total Property & Casualty Insurance | 5,052,441 | |||||||
| FINANCE-OTHER SERVICES - 3.6% | ||||||||
| Intercontinental Exchange, Inc. | 8,011 | 1,668,611 | ||||||
| CME Group, Inc. — Class A | 19,663 | 1,647,956 | ||||||
| NASDAQ OMX Group, Inc. | 35,566 | 1,538,585 | ||||||
| Total Finance-Other Services | 4,855,152 | |||||||
| FIDUCIARY BANKS - 3.4% | ||||||||
| State Street Corp. | 21,057 | 1,588,961 | ||||||
| Bank of New York Mellon Corp. | 39,093 | 1,513,681 | ||||||
| Northern Trust Corp. | 22,426 | 1,486,844 | ||||||
| Total Fiduciary Banks | 4,589,486 | |||||||
| COMMERCIAL SERVICES - FINANCE - 2.4% | ||||||||
| McGraw Hill Financial, Inc. | 18,154 | 1,642,574 | ||||||
| Moody’s Corp. | 16,417 | 1,629,059 | ||||||
| Total Commercial Services - Finance | 3,271,633 | |||||||
| SEE NOTES TO FINANCIAL STATEMENTS. | GUGGENHEIM ETFs ANNUAL REPORT | 87 |
SCHEDULE OF INVESTMENTS (concluded) | October 31, 2014 |
GUGGENHEIM S&P 500® EQUAL WEIGHT FINANCIALS ETF |
| Shares | Value | |||||||
| FINANCE-CREDIT CARD - 2.3% | ||||||||
| American Express Co. | 17,798 | $ | 1,600,930 | |||||
| Discover Financial Services | 24,986 | 1,593,607 | ||||||
| Total Finance-Credit Card | 3,194,537 | |||||||
| INSURANCE BROKERS - 2.3% | ||||||||
| Marsh & McLennan Companies, Inc. | 29,596 | 1,609,135 | ||||||
| Aon plc | 17,912 | 1,540,432 | ||||||
| Total Insurance Brokers | 3,149,567 | |||||||
| COMMERCIAL BANKS-SOUTHERN U.S. - 2.2% | ||||||||
| BB&T Corp. | 40,875 | 1,548,345 | ||||||
| Regions Financial Corp. | 150,705 | 1,496,501 | ||||||
| Total Commercial Banks-Southern U.S. | 3,044,846 | |||||||
| FINANCE-INVESTMENT BANKERS/BROKERS - 2.2% | ||||||||
| Charles Schwab Corp. | 52,839 | 1,514,894 | ||||||
| E*TRADE Financial Corp.* | 67,405 | 1,503,132 | ||||||
| Total Finance-Investment Bankers/Brokers | 3,018,026 | |||||||
| SAVINGS & LOANS/THRIFTS-EASTERN U.S. - 2.2% | ||||||||
| People’s United Financial, Inc. | 103,841 | 1,518,155 | ||||||
| Hudson City Bancorp, Inc. | 153,977 | 1,485,878 | ||||||
| Total Savings & Loans/Thrifts-Eastern U.S. | 3,004,033 | |||||||
| FINANCE-CONSUMER LOANS - 1.3% | ||||||||
| Navient Corp. | 88,524 | 1,751,005 | ||||||
| REITs-SHOPPING CENTERS - 1.3% | ||||||||
| Kimco Realty Corp. | 69,821 | 1,742,034 | ||||||
| REITs-STORAGE - 1.3% | ||||||||
| Public Storage | 9,391 | 1,731,137 | ||||||
| REITs-OFFICE PROPERTY - 1.3% | ||||||||
| Boston Properties, Inc. | 13,529 | 1,714,801 | ||||||
| REITs-HOTELS - 1.2% | ||||||||
| Host Hotels & Resorts, Inc. | 71,780 | 1,673,192 | ||||||
| REITs-WAREHOUSE/INDUSTRIES - 1.2% | ||||||||
| Prologis, Inc. | 39,944 | 1,663,668 | ||||||
| REAL ESTATE MANAGEMENT/SERVICES - 1.2% | ||||||||
| CBRE Group, Inc. — Class A* | 51,925 | 1,661,600 | ||||||
| REITs-STORAGE - 1.2% | ||||||||
| Iron Mountain, Inc. | 45,704 | 1,648,543 | ||||||
| REINSURANCE - 1.2% | ||||||||
| Berkshire Hathaway, Inc. — Class B* | 11,378 | 1,594,740 | ||||||
| COMMERCIAL BANKS-WESTERN U.S. - 1.1% | ||||||||
| Zions Bancorporation | 52,732 | 1,527,646 | ||||||
| COMMERCIAL BANKS-EASTERN U.S. - 1.1% | ||||||||
| M&T Bank Corp. | 12,385 | 1,513,199 | ||||||
| DIVERSIFIED OPERATIONS - 1.0% | ||||||||
| Leucadia National Corp. | 59,785 | 1,421,687 | ||||||
| Total Common Stocks | ||||||||
| (Cost $127,623,310) | 136,034,261 | |||||||
SHORT TERM INVESTMENTS† - 0.2% | ||||||||
| Federated U.S. Treasury Cash Reserve Fund | 244,904 | 244,904 | ||||||
| Total Short Term Investments | ||||||||
| (Cost $244,904) | 244,904 | |||||||
| Total Investments - 100.0% | ||||||||
| (Cost $127,868,214) | $ | 136,279,165 | ||||||
| Other Assets & Liabilities, net - 0.0% | 36,488 | |||||||
| Total Net Assets - 100.0% | $ | 136,315,653 | ||||||
| * | Non-income producing security. |
| † | Value determined based on Level 1 inputs — See Note 4. |
| plc — Public Limited Company | |
| REIT — Real Estate Investment Trust |
88 | GUGGENHEIM ETFs ANNUAL REPORT | SEE NOTES TO FINANCIAL STATEMENTS. |
| SCHEDULE OF INVESTMENTS | October 31, 2014 |
GUGGENHEIM S&P 500® EQUAL WEIGHT HEALTH CARE ETF |
| Shares | Value | |||||||
COMMON STOCKS† - 100.2% | ||||||||
| MEDICAL-DRUGS - 18.0% | ||||||||
| Bristol-Myers Squibb Co. | 133,190 | $ | 7,750,325 | |||||
| Allergan, Inc. | 39,552 | 7,517,253 | ||||||
| AbbVie, Inc. | 115,656 | 7,339,530 | ||||||
| Mallinckrodt plc* | 77,615 | 7,154,551 | ||||||
| Johnson & Johnson | 64,011 | 6,899,106 | ||||||
| Zoetis, Inc. | 185,024 | 6,875,492 | ||||||
| Abbott Laboratories | 157,326 | 6,857,840 | ||||||
| Pfizer, Inc. | 227,462 | 6,812,487 | ||||||
| Eli Lilly & Co. | 102,561 | 6,802,871 | ||||||
| Merck & Company, Inc. | 112,412 | 6,513,151 | ||||||
| Total Medical-Drugs | 70,522,606 | |||||||
| MEDICAL PRODUCTS - 14.4% | ||||||||
| CareFusion Corp.* | 144,300 | 8,278,490 | ||||||
| Becton Dickinson and Co. | 58,869 | 7,576,439 | ||||||
| Zimmer Holdings, Inc. | 63,791 | 7,096,111 | ||||||
| Stryker Corp. | 80,207 | 7,020,519 | ||||||
| Hospira, Inc.* | 127,194 | 6,830,318 | ||||||
| Covidien plc | 73,829 | 6,824,753 | ||||||
| Varian Medical Systems, Inc.* | 78,450 | 6,599,214 | ||||||
| Baxter International, Inc. | 89,614 | 6,285,526 | ||||||
| Total Medical Products | 56,511,370 | |||||||
| MEDICAL-BIOMEDICAL/GENETICS - 13.6% | ||||||||
| Vertex Pharmaceuticals, Inc.* | 71,988 | 8,108,729 | ||||||
| Amgen, Inc. | 48,547 | 7,873,352 | ||||||
| Alexion Pharmaceuticals, Inc.* | 41,140 | 7,872,550 | ||||||
| Celgene Corp.* | 73,144 | 7,832,991 | ||||||
| Regeneron Pharmaceuticals, Inc.* | 19,344 | 7,616,120 | ||||||
| Gilead Sciences, Inc.* | 64,579 | 7,232,848 | ||||||
| Biogen Idec, Inc.* | 20,701 | 6,646,677 | ||||||
| Total Medical-Biomedical/Genetics | 53,183,267 | |||||||
| MEDICAL INSTRUMENTS - 9.2% | ||||||||
| Edwards Lifesciences Corp.* | 67,157 | 8,120,624 | ||||||
| Boston Scientific Corp.* | 535,535 | 7,111,905 | ||||||
| Medtronic, Inc. | 102,686 | 6,999,078 | ||||||
| Intuitive Surgical, Inc.* | 13,926 | 6,904,511 | ||||||
| St. Jude Medical, Inc. | 106,122 | 6,809,849 | ||||||
| Total Medical Instruments | 35,945,967 | |||||||
| MEDICAL-HMO - 9.1% | ||||||||
| UnitedHealth Group, Inc. | 77,677 | 7,380,092 | ||||||
| Humana, Inc. | 52,192 | 7,246,859 | ||||||
| Cigna Corp. | 72,510 | 7,219,821 | ||||||
| WellPoint, Inc. | 56,432 | 7,149,370 | ||||||
| Aetna, Inc. | 81,438 | 6,719,449 | ||||||
| Total Medical-HMO | 35,715,591 | |||||||
| MEDICAL-GENERIC DRUGS - 5.6% | ||||||||
| Mylan, Inc.* | 142,247 | 7,617,327 | ||||||
| Perrigo Company plc | 46,327 | 7,479,494 | ||||||
| Actavis plc* | 28,562 | 6,933,140 | ||||||
| Total Medical-Generic Drugs | 22,029,961 | |||||||
| MEDICAL - WHOLESALE DRUG DISTRIBUTION - 5.5% | ||||||||
| AmerisourceBergen Corp. — Class A | 86,824 | 7,415,638 | ||||||
| McKesson Corp. | 34,781 | 7,074,803 | ||||||
| Cardinal Health, Inc. | 88,793 | 6,968,475 | ||||||
| Total Medical - Wholesale Drug Distribution | 21,458,916 | |||||||
| INSTRUMENTS-SCIENTIFIC - 5.2% | ||||||||
| Waters Corp.* | 65,772 | 7,287,538 | ||||||
| PerkinElmer, Inc. | 149,858 | 6,506,834 | ||||||
| Thermo Fisher Scientific, Inc. | 54,300 | 6,384,051 | ||||||
| Total Instruments-Scientific | 20,178,423 | |||||||
| DENTAL SUPPLIES & EQUIPMENTS - 3.7% | ||||||||
| DENTSPLY International, Inc. | 143,191 | 7,269,808 | ||||||
| Patterson Companies, Inc. | 165,004 | 7,113,322 | ||||||
| Total Dental Supplies & Equipments | 14,383,130 | |||||||
| MEDICAL LABS & TESTING SERVICES - 3.5% | ||||||||
| Laboratory Corporation of America Holdings* | 62,945 | 6,879,259 | ||||||
| Quest Diagnostics, Inc. | 106,900 | 6,783,874 | ||||||
| Total Medical Labs & Testing Services | 13,663,133 | |||||||
| MEDICAL-HOSPITALS - 3.1% | ||||||||
| Universal Health Services, Inc. — Class B | 59,925 | 6,214,822 | ||||||
| Tenet Healthcare Corp.* | 108,796 | 6,098,016 | ||||||
| Total Medical-Hospitals | 12,312,838 | |||||||
| ELECTRONIC MEASURING INSTRUMENTS - 2.0% | ||||||||
| Agilent Technologies, Inc. | 112,227 | 6,203,908 | ||||||
| Agilent Technologies, Inc.* | 43,265 | 1,738,388 | ||||||
| Total Electronic Measuring Instruments | 7,942,296 | |||||||
| DISPOSABLE MEDICAL PRODUCTS - 1.9% | ||||||||
| CR Bard, Inc. | 45,252 | 7,419,970 | ||||||
| MEDICAL INFORMATION SYSTEM - 1.8% | ||||||||
| Cerner Corp.* | 113,943 | 7,217,150 | ||||||
| DIALYSIS CENTERS - 1.8% | ||||||||
| DaVita HealthCare Partners, Inc.* | 90,376 | 7,055,654 | ||||||
| PHARMACY SERVICES - 1.8% | ||||||||
| Express Scripts Holding Co.* | 90,786 | 6,974,181 | ||||||
| Total Common Stocks | ||||||||
| (Cost $338,912,843) | 392,514,453 | |||||||
| SEE NOTES TO FINANCIAL STATEMENTS. | GUGGENHEIM ETFs ANNUAL REPORT | 89 |
SCHEDULE OF INVESTMENTS (concluded) | October 31, 2014 |
GUGGENHEIM S&P 500® EQUAL WEIGHT HEALTH CARE ETF |
| Shares | Value | |||||||
SHORT TERM INVESTMENTS† - 0.2% | ||||||||
| Federated U.S. Treasury Cash Reserve Fund | 782,674 | $ | 782,674 | |||||
| Total Short Term Investments | ||||||||
| (Cost $782,674) | 782,674 | |||||||
| Total Investments - 100.4% | ||||||||
| (Cost $339,695,517) | $ | 393,297,127 | ||||||
| Other Assets & Liabilities, net - (0.4)% | (1,583,141 | ) | ||||||
| Total Net Assets - 100.0% | $ | 391,713,986 | ||||||
| * | Non-income producing security. |
| † | Value determined based on Level 1 inputs — See Note 4. |
| plc — Public Limited Company |
90 | GUGGENHEIM ETFs ANNUAL REPORT | SEE NOTES TO FINANCIAL STATEMENTS. |
| SCHEDULE OF INVESTMENTS | October 31, 2014 |
GUGGENHEIM S&P 500® EQUAL WEIGHT INDUSTRIALS ETF |
| Shares | Value | |||||||
COMMON STOCKS† - 99.9% | ||||||||
| DIVERSIFIED MANUFACTURING OPERATIONS - 15.9% | ||||||||
| Textron, Inc. | 51,952 | $ | 2,157,567 | |||||
| Parker-Hannifin Corp. | 16,082 | 2,042,896 | ||||||
| 3M Co. | 13,160 | 2,023,613 | ||||||
| Ingersoll-Rand plc | 31,643 | 1,981,485 | ||||||
| Danaher Corp. | 24,638 | 1,980,895 | ||||||
| Illinois Tool Works, Inc. | 21,461 | 1,954,024 | ||||||
| Eaton Corporation plc | 28,234 | 1,930,923 | ||||||
| General Electric Co. | 73,219 | 1,889,782 | ||||||
| Pentair plc | 28,108 | 1,884,641 | ||||||
| Dover Corp. | 22,081 | 1,754,115 | ||||||
| Total Diversified Manufacturing Operations | 19,599,941 | |||||||
| AEROSPACE/DEFENSE - 9.8% | ||||||||
| General Dynamics Corp. | 14,986 | 2,094,444 | ||||||
| Rockwell Collins, Inc. | 24,648 | 2,074,129 | ||||||
| Lockheed Martin Corp. | 10,859 | 2,069,400 | ||||||
| Northrop Grumman Corp. | 14,571 | 2,010,215 | ||||||
| Raytheon Co. | 18,797 | 1,952,632 | ||||||
| Boeing Co. | 14,921 | 1,863,782 | ||||||
| Total Aerospace/Defense | 12,064,602 | |||||||
| TRANSPORT-SERVICES - 7.9% | ||||||||
| FedEx Corp. | 12,318 | 2,062,033 | ||||||
| United Parcel Service, Inc. — Class B | 19,319 | 2,026,756 | ||||||
| CH Robinson Worldwide, Inc. | 28,200 | 1,951,722 | ||||||
| Expeditors International of Washington, Inc. | 44,663 | 1,905,324 | ||||||
| Ryder System, Inc. | 20,433 | 1,807,708 | ||||||
| Total Transport-Services | 9,753,543 | |||||||
| TRANSPORT-RAIL - 6.6% | ||||||||
| CSX Corp. | 60,536 | 2,156,898 | ||||||
| Union Pacific Corp. | 17,702 | 2,061,398 | ||||||
| Kansas City Southern | 16,476 | 2,023,088 | ||||||
| Norfolk Southern Corp. | 17,557 | 1,942,506 | ||||||
| Total Transport-Rail | 8,183,890 | |||||||
| TOOLS-HAND HELD - 3.2% | ||||||||
| Snap-on, Inc. | 15,066 | 1,990,821 | ||||||
| Stanley Black & Decker, Inc. | 20,614 | 1,930,295 | ||||||
| Total Tools-Hand Held | 3,921,116 | |||||||
| COMMERCIAL SERVICES - 3.1% | ||||||||
| Cintas Corp. | 28,553 | 2,091,221 | ||||||
| Quanta Services, Inc.* | 51,838 | 1,766,639 | ||||||
| Total Commercial Services | 3,857,860 | |||||||
| AIRLINES - 3.1% | ||||||||
| Southwest Airlines Co. | 55,925 | 1,928,293 | ||||||
| Delta Air Lines, Inc. | 47,724 | 1,919,937 | ||||||
| Total Airlines | 3,848,230 | |||||||
| NON-HAZARDOUS WASTE DISPOSAL - 3.1% | ||||||||
| Waste Management, Inc. | 40,473 | 1,978,725 | ||||||
| Republic Services, Inc. — Class A | 48,382 | 1,857,869 | ||||||
| Total Non-hazardous Waste Disposal | 3,836,594 | |||||||
| ELECTRONIC SECURITY DEVICES - 3.1% | ||||||||
| Allegion plc | 37,236 | 1,976,859 | ||||||
| Tyco International Ltd. | 42,729 | 1,834,356 | ||||||
| Total Electronic Security Devices | 3,811,215 | |||||||
| ELECTRIC PRODUCTS - MISCELLANEOUS - 3.1% | ||||||||
| AMETEK, Inc. | 36,356 | 1,895,966 | ||||||
| Emerson Electric Co. | 29,371 | 1,881,506 | ||||||
| Total Electric Products - Miscellaneous | 3,777,472 | |||||||
| DISTRIBUTION/WHOLESALE - 3.0% | ||||||||
| WW Grainger, Inc. | 7,624 | 1,881,604 | ||||||
| Fastenal Co. | 41,358 | 1,821,406 | ||||||
| Total Distribution/Wholesale | 3,703,010 | |||||||
| MACHINERY-PUMPS - 2.9% | ||||||||
| Xylem, Inc. | 50,988 | 1,853,924 | ||||||
| Flowserve Corp. | 25,507 | 1,734,221 | ||||||
| Total Machinery-Pumps | 3,588,145 | |||||||
| MACHINERY - CONSTRUCTION & MINING - 2.9% | ||||||||
| Caterpillar, Inc. | 18,036 | 1,829,030 | ||||||
| Joy Global, Inc. | 32,363 | 1,703,265 | ||||||
| Total Machinery - Construction & Mining | 3,532,295 | |||||||
| ENGINEERING/R&D SERVICES - 2.8% | ||||||||
| Fluor Corp. | 27,064 | 1,795,426 | ||||||
| Jacobs Engineering Group, Inc.* | 35,431 | 1,681,201 | ||||||
| Total Engineering/R&D Services | 3,476,627 | |||||||
| FILTRATION/SEPARATE PRODUCTS - 1.7% | ||||||||
| Pall Corp. | 22,712 | 2,076,331 | ||||||
| AUTO-MEDIUM & HEAVY DUTY TRUCKS - 1.7% | ||||||||
| PACCAR, Inc. | 31,496 | 2,057,319 | ||||||
| HUMAN RESOURCES - 1.7% | ||||||||
| Robert Half International, Inc. | 37,464 | 2,052,278 | ||||||
| MACHINERY - GENERAL INDUSTRIES - 1.6% | ||||||||
| Roper Industries, Inc. | 12,874 | 2,037,954 | ||||||
| HAZARDOUS WASTE DISPOSAL - 1.6% | ||||||||
| Stericycle, Inc.* | 16,174 | 2,037,924 | ||||||
| ELECTRONICS-MILITARY - 1.6% | ||||||||
| L-3 Communications Holdings, Inc. | 16,502 | 2,004,333 | ||||||
| ENGINES-INTERNAL COMBUST - 1.6% | ||||||||
| Cummins, Inc. | 13,669 | 1,998,134 | ||||||
| SEE NOTES TO FINANCIAL STATEMENTS. | GUGGENHEIM ETFs ANNUAL REPORT | 91 |
SCHEDULE OF INVESTMENTS (concluded) | October 31, 2014 |
GUGGENHEIM S&P 500® EQUAL WEIGHT INDUSTRIALS ETF |
| Shares | Value | |||||||
| DATA PROCESSING/MANAGEMENT - 1.6% | ||||||||
| Dun & Bradstreet Corp. | 16,199 | $ | 1,989,399 | |||||
| MACHINERY-FARM - 1.6% | ||||||||
| Deere & Co. | 23,114 | 1,977,172 | ||||||
| INSTRUMENTS-CONTROLS - 1.6% | ||||||||
| Honeywell International, Inc. | 20,044 | 1,926,629 | ||||||
| AEROSPACE/DEFENSE - EQUIPMENTS - 1.5% | ||||||||
| United Technologies Corp. | 17,482 | 1,870,574 | ||||||
| INDUSTRIAL AUTOMAT/ROBOT - 1.5% | ||||||||
| Rockwell Automation, Inc. | 16,414 | 1,844,113 | ||||||
| SECURITY SERVICES - 1.5% | ||||||||
| ADT Corp. | 51,374 | 1,841,244 | ||||||
| COMMERCIAL SERVICES - FINANCE - 1.5% | ||||||||
| Equifax, Inc. | 24,266 | 1,837,907 | ||||||
| RENTAL AUTO/EQUIPMENT - 1.5% | ||||||||
| United Rentals, Inc.* | 16,245 | 1,787,925 | ||||||
| PUBLISHING-PERIODICALS - 1.4% | ||||||||
| Nielsen N.V. | 42,046 | 1,786,535 | ||||||
| OFFICE AUTOMATION & EUIPMENTS - 1.4% | ||||||||
| Pitney Bowes, Inc. | 71,397 | 1,766,362 | ||||||
| BUILDING PRODUCTS - WOOD - 1.4% | ||||||||
| Masco Corp. | 79,321 | 1,750,614 | ||||||
| METAL PROCESSORS&FABRICA - 1.4% | ||||||||
| Precision Castparts Corp. | 7,893 | 1,741,985 | ||||||
| Total Common Stocks | ||||||||
| (Cost $114,431,929) | 123,339,272 | |||||||
| Total Investments - 99.9% | ||||||||
| (Cost $114,431,929) | $ | 123,339,272 | ||||||
| Other Assets & Liabilities, net - 0.1% | 108,212 | |||||||
| Total Net Assets - 100.0% | $ | 123,447,484 | ||||||
| * | Non-income producing security. |
| † | Value determined based on Level 1 inputs — See Note 4. |
| plc — Public Limited Company |
92 | GUGGENHEIM ETFs ANNUAL REPORT | SEE NOTES TO FINANCIAL STATEMENTS. |
| SCHEDULE OF INVESTMENTS | October 31, 2014 |
GUGGENHEIM S&P 500® EQUAL WEIGHT MATERIALS ETF |
| Shares | Value | |||||||
COMMON STOCKS† - 100.0% | ||||||||
| CHEMICALS-DIVERSIFIED - 16.3% | ||||||||
| EI du Pont de Nemours & Co. | 39,202 | $ | 2,710,819 | |||||
| PPG Industries, Inc. | 12,718 | 2,590,529 | ||||||
| Dow Chemical Co. | 48,216 | 2,381,870 | ||||||
| FMC Corp. | 40,674 | 2,332,654 | ||||||
| LyondellBasell Industries N.V. — Class A | 22,739 | 2,083,575 | ||||||
| Total Chemicals-Diversified | 12,099,447 | |||||||
| CHEMICALS-SPECIALTY - 14.7% | ||||||||
| Sigma-Aldrich Corp. | 24,888 | 3,382,528 | ||||||
| International Flavors & Fragrances, Inc. | 25,843 | 2,562,333 | ||||||
| Eastman Chemical Co. | 30,575 | 2,469,849 | ||||||
| Ecolab, Inc. | 21,993 | 2,446,281 | ||||||
| Total Chemicals-Specialty | 10,860,991 | |||||||
| INDUSTRIAL GASES - 10.4% | ||||||||
| Air Products & Chemicals, Inc. | 19,806 | 2,667,076 | ||||||
| Airgas, Inc. | 23,345 | 2,603,901 | ||||||
| Praxair, Inc. | 19,293 | 2,430,725 | ||||||
| Total Industrial Gases | 7,701,702 | |||||||
| AGRICULTURAL CHEMICALS - 10.3% | ||||||||
| CF Industries Holdings, Inc. | 10,132 | 2,634,320 | ||||||
| Monsanto Co. | 22,463 | 2,584,144 | ||||||
| Mosaic Co. | 54,862 | 2,430,935 | ||||||
| Total Agricultural Chemicals | 7,649,399 | |||||||
| PAPER & RELATED PRODUCTS - 7.0% | ||||||||
| MeadWestvaco Corp. | 59,767 | 2,639,908 | ||||||
| International Paper Co. | 51,005 | 2,581,873 | ||||||
| Total Paper & Related Products | 5,221,781 | |||||||
| CONTAINERS-PAPER/PLASTIC - 6.7% | ||||||||
| Sealed Air Corp. | 68,710 | 2,490,738 | ||||||
| Bemis Company, Inc. | 64,324 | 2,474,544 | ||||||
| Total Containers-Paper/Plastic | 4,965,282 | |||||||
| BUILDING PRODUCTS-CEMENT/AGGREGATES - 6.5% | ||||||||
| Vulcan Materials Co. | 40,554 | 2,502,587 | ||||||
| Martin Marietta Materials, Inc. | 19,652 | 2,297,712 | ||||||
| Total Building Products-Cement/Aggregates | 4,800,299 | |||||||
| CONTAINERS-METAL/GLASS - 6.2% | ||||||||
| Ball Corp. | 38,647 | 2,490,026 | ||||||
| Owens-Illinois, Inc.* | 80,569 | 2,076,263 | ||||||
| Total Containers-Metal/Glass | 4,566,289 | |||||||
| COATINGS/PAINT - 3.7% | ||||||||
| Sherwin-Williams Co. | 11,782 | 2,704,676 | ||||||
| METAL-ALUMINUM - 3.4% | ||||||||
| Alcoa, Inc. | 151,884 | 2,545,576 | ||||||
| STEEL-PRODUCERS - 3.4% | ||||||||
| Nucor Corp. | 46,206 | 2,497,896 | ||||||
| OFFICE SUPPLIES & FORMS - 3.3% | ||||||||
| Avery Dennison Corp. | 52,622 | 2,465,341 | ||||||
| METAL-COPPER - 2.9% | ||||||||
| Freeport-McMoRan, Inc. | 74,168 | 2,113,788 | ||||||
| STEEL-SPECIALTY - 2.7% | ||||||||
| Allegheny Technologies, Inc. | 60,841 | 1,998,627 | ||||||
| GOLD MINING - 2.5% | ||||||||
| Newmont Mining Corp. | 100,893 | 1,892,753 | ||||||
| Total Common Stocks | ||||||||
| (Cost $74,821,456) | 74,083,847 | |||||||
SHORT TERM INVESTMENTS† - 0.0% | ||||||||
| Federated U.S. Treasury Cash Reserve Fund | 29,545 | 29,545 | ||||||
| Total Short Term Investments | ||||||||
| (Cost $29,545) | 29,545 | |||||||
| Total Investments - 100.0% | ||||||||
| (Cost $74,851,001) | $ | 74,113,392 | ||||||
| Other Assets & Liabilities, net - 0.0% | 25,107 | |||||||
| Total Net Assets - 100.0% | $ | 74,138,499 | ||||||
| * | Non-income producing security. |
| † | Value determined based on Level 1 inputs — See Note 4. |
| SEE NOTES TO FINANCIAL STATEMENTS. | GUGGENHEIM ETFs ANNUAL REPORT | 93 |
| SCHEDULE OF INVESTMENTS | October 31, 2014 |
GUGGENHEIM S&P 500® EQUAL WEIGHT TECHNOLOGY ETF |
| Shares | Value | |||||||
COMMON STOCKS† - 99.8% | ||||||||
| ELECTRONIC COMPONENTS - SEMICONDUCTOR - 15.0% | ||||||||
| Micron Technology, Inc.* | 323,995 | $ | 10,720,996 | |||||
| Xilinx, Inc. | 240,303 | 10,688,677 | ||||||
| Texas Instruments, Inc. | 213,490 | 10,601,913 | ||||||
| Broadcom Corp. — Class A | 253,076 | 10,598,823 | ||||||
| NVIDIA Corp. | 533,978 | 10,433,930 | ||||||
| Avago Technologies Ltd. | 116,582 | 10,055,198 | ||||||
| Intel Corp. | 295,577 | 10,052,574 | ||||||
| Altera Corp. | 287,874 | 9,894,229 | ||||||
Microchip Technology, Inc.1 | 214,158 | 9,232,351 | ||||||
| First Solar, Inc.* | 140,549 | 8,278,336 | ||||||
| Total Electronic Components - Semiconductor | 100,557,027 | |||||||
| COMMERCIAL SERVICES - FINANCE - 8.2% | ||||||||
| Automatic Data Processing, Inc. | 139,307 | 11,392,526 | ||||||
| MasterCard, Inc. — Class A | 135,306 | 11,331,878 | ||||||
| Alliance Data Systems Corp.* | 39,579 | 11,214,710 | ||||||
| Total System Services, Inc. | 321,817 | 10,874,196 | ||||||
Western Union Co.1 | 608,940 | 10,327,622 | ||||||
| Total Commercial Services - Finance | 55,140,932 | |||||||
| APPLICATIONS SOFTWARE - 7.6% | ||||||||
| salesforce.com, Inc.* | 172,556 | 11,041,859 | ||||||
| Intuit, Inc. | 121,689 | 10,709,849 | ||||||
| Microsoft Corp. | 219,071 | 10,285,383 | ||||||
| Red Hat, Inc.* | 169,064 | 9,961,251 | ||||||
| Citrix Systems, Inc.* | 142,130 | 9,129,010 | ||||||
| Total Applications Software | 51,127,352 | |||||||
| COMPUTERS-MEMORY DEVICES - 7.5% | ||||||||
| Seagate Technology plc | 167,605 | 10,530,622 | ||||||
| NetApp, Inc. | 240,868 | 10,309,150 | ||||||
| Western Digital Corp. | 102,345 | 10,067,678 | ||||||
| EMC Corp. | 344,920 | 9,909,552 | ||||||
| SanDisk Corp. | 103,193 | 9,714,589 | ||||||
| Total Computers-Memory Devices | 50,531,591 | |||||||
| COMPUTER SERVICES - 6.0% | ||||||||
| Cognizant Technology Solutions Corp. — Class A* | 228,002 | 11,137,897 | ||||||
| Computer Sciences Corp. | 170,919 | 10,323,508 | ||||||
| Accenture plc — Class A | 126,088 | 10,228,259 | �� | |||||
| International Business Machines Corp. | 53,420 | 8,782,248 | ||||||
| Total Computer Services | 40,471,912 | |||||||
| DATA PROCESSING/MANAGEMENT - 4.9% | ||||||||
| Paychex, Inc. | 243,395 | 11,424,961 | ||||||
| Fiserv, Inc.* | 157,427 | 10,938,028 | ||||||
| Fidelity National Information Services, Inc. | 179,235 | 10,465,532 | ||||||
| Total Data Processing/Management | 32,828,521 | |||||||
| SEMICONDUCTOR EQUIPMENT - 4.7% | ||||||||
| Lam Research Corp. | 142,693 | 11,110,077 | ||||||
| KLA-Tencor Corp. | 130,696 | 10,344,588 | ||||||
| Applied Materials, Inc. | 457,943 | 10,115,961 | ||||||
| Total Semiconductor Equipment | 31,570,626 | |||||||
| SEMICONDUCTOR COMPONENTS - INTEGRATED CIRCUIT - 4.6% | ||||||||
| QUALCOMM, Inc. | 135,491 | 10,637,399 | ||||||
| Analog Devices, Inc. | 207,604 | 10,301,310 | ||||||
| Linear Technology Corp. | 228,702 | 9,797,594 | ||||||
| Total Semiconductor Components - Integrated Circuit | 30,736,303 | |||||||
| INTERNET SECURITY - 3.2% | ||||||||
| VeriSign, Inc.* | 182,117 | 10,883,312 | ||||||
| Symantec Corp. | 417,004 | 10,350,039 | ||||||
| Total Internet Security | 21,233,351 | |||||||
| WEB PORTALS/ISP - 3.1% | ||||||||
| Yahoo!, Inc.* | 238,642 | 10,989,464 | ||||||
| Google, Inc. — Class A* | 8,802 | 4,998,392 | ||||||
| Google, Inc. — Class C* | 8,802 | 4,921,022 | ||||||
| Total Web Portals/ISP | 20,908,878 | |||||||
| COMPUTERS - 3.1% | ||||||||
| Apple, Inc. | 100,605 | 10,865,340 | ||||||
| Hewlett-Packard Co. | 279,475 | 10,027,563 | ||||||
| Total Computers | 20,892,903 | |||||||
| ENTERPRISE SOFTWARE/SERVICES - 3.0% | ||||||||
| CA, Inc. | 358,268 | 10,411,268 | ||||||
| Oracle Corp. | 252,037 | 9,842,045 | ||||||
| Total Enterprise Software/Services | 20,253,313 | |||||||
| ELECTRONIC COMPONENTS-MISCELLANEOUS - 3.0% | ||||||||
| Jabil Circuit, Inc. | 475,515 | 9,962,039 | ||||||
| TE Connectivity Ltd. | 162,151 | 9,912,291 | ||||||
| Total Electronic Components-Miscellaneous | 19,874,330 | |||||||
| TELECOMMUNICATION EQUIPMENTS - 2.9% | ||||||||
| Harris Corp. | 146,224 | 10,177,190 | ||||||
| Juniper Networks, Inc. | 440,629 | 9,284,053 | ||||||
| Total Telecommunication Equipments | 19,461,243 | |||||||
| FINANCE-CREDIT CARD - 1.7% | ||||||||
| Visa, Inc. — Class A | 47,717 | 11,520,315 | ||||||
| ENTERTAINMENT SOFTWARE - 1.7% | ||||||||
| Electronic Arts, Inc.* | 274,970 | 11,265,521 | ||||||
| COMPUTER AIDED DESIGN - 1.6% | ||||||||
| Autodesk, Inc.* | 190,718 | 10,973,914 | ||||||
| WIRELESS EQUIPMENT - 1.6% | ||||||||
| Motorola Solutions, Inc. | 165,784 | 10,693,068 | ||||||
94 | GUGGENHEIM ETFs ANNUAL REPORT | SEE NOTES TO FINANCIAL STATEMENTS. |
SCHEDULE OF INVESTMENTS (concluded) | October 31, 2014 |
GUGGENHEIM S&P 500® EQUAL WEIGHT TECHNOLOGY ETF |
Shares | Value | |||||||
| E-COMMERCE/PRODUCTS - 1.5% | ||||||||
| eBay, Inc.* | 195,837 | $ | 10,281,443 | |||||
| ELECTRONIC MEASURING INSTRUMENTS - 1.5% | ||||||||
| FLIR Systems, Inc. | 305,199 | 10,233,322 | ||||||
| ELECTRONIC FORMS - 1.5% | ||||||||
| Adobe Systems, Inc.* | 143,992 | 10,096,719 | ||||||
| TELECOMMUNICATION EQUIPMENTS FIBER OPTICS - 1.5% | ||||||||
| Corning, Inc. | 492,508 | 10,061,938 | ||||||
| INTERNET INFRASTRUCTURE SOFTWARE - 1.5% | ||||||||
| F5 Networks, Inc.* | 81,763 | 10,055,214 | ||||||
| OFFICE AUTOMATION & EQUIPMENTS - 1.5% | ||||||||
| Xerox Corp. | 754,391 | 10,018,312 | ||||||
| NETWORKING PRODUCTS - 1.5% | ||||||||
| Cisco Systems, Inc. | 405,996 | 9,934,722 | ||||||
| ELECTRONIC CONNECTORS - 1.5% | ||||||||
| Amphenol Corp. — Class A | 196,167 | 9,922,127 | ||||||
| INTERNET CONTENT-ENTERTAINMENT - 1.5% | ||||||||
| Facebook, Inc. — Class A* | 132,136 | 9,908,879 | ||||||
| COMPUTER SOFTWARE - 1.5% | ||||||||
| Akamai Technologies, Inc.* | 163,601 | 9,865,140 | ||||||
| COMPUTERS-INTEGRATED SYSTEMS - 1.4% | ||||||||
| Teradata Corp.* | 227,748 | 9,638,295 | ||||||
| Total Common Stocks | ||||||||
| (Cost $596,845,536) | 670,057,211 | |||||||
SHORT TERM INVESTMENTS† - 0.2% | ||||||||
| Federated U.S. Treasury Cash Reserve Fund | 1,031,079 | 1,031,079 | ||||||
| Total Short Term Investments | ||||||||
| (Cost $1,031,079) | 1,031,079 | |||||||
| Face Amount | ||||||||
SECURITIES LENDING COLLATERAL††,2 - 2.7% | ||||||||
| Joint Repurchase Agreements | ||||||||
| HSBC Securities, Inc. issued 10/31/14 at 0.08% due 11/03/14 | $ | 11,495,948 | 11,495,948 | |||||
| BNP Paribas Securities Corp. issued 10/31/14 at 0.11% due 11/03/14 | 5,258,236 | 5,258,236 | ||||||
| Barclays Capital, Inc. issued 10/31/14 at 0.07% due 11/03/14 | 1,507,155 | 1,507,155 | ||||||
| Total Securities Lending Collateral | ||||||||
| (Cost $18,261,339) | 18,261,339 | |||||||
| Total Investments - 102.7% | ||||||||
| (Cost $616,137,954) | $ | 689,349,629 | ||||||
| Other Assets & Liabilities, net - (2.7)% | (18,128,851 | ) | ||||||
| Total Net Assets - 100.0% | $ | 671,220,778 | ||||||
| * | Non-income producing security. |
| † | Value determined based on Level 1 inputs — See Note 4. |
| †† | Value determined based on Level 2 inputs — See Note 4. |
| 1 | All or portion of this security is on loan at October 31, 2014 — See Note 5. |
| 2 | Securities lending collateral — See Note 5. |
| plc — Public Limited Company |
| SEE NOTES TO FINANCIAL STATEMENTS. | GUGGENHEIM ETFs ANNUAL REPORT | 95 |
| SCHEDULE OF INVESTMENTS | October 31, 2014 |
GUGGENHEIM S&P 500® EQUAL WEIGHT UTILITIES ETF |
| Shares | Value | |||||||
COMMON STOCKS† - 99.7% | ||||||||
| ELECTRIC-INTEGRATED - 69.9% | ||||||||
| Wisconsin Energy Corp. | 85,622 | $ | 4,251,988 | |||||
| Public Service Enterprise Group, Inc. | 102,884 | 4,250,137 | ||||||
| TECO Energy, Inc. | 216,684 | 4,249,173 | ||||||
| Duke Energy Corp. | 51,693 | 4,246,580 | ||||||
| Consolidated Edison, Inc. | 66,928 | 4,240,558 | ||||||
| Exelon Corp. | 114,939 | 4,205,618 | ||||||
| Entergy Corp. | 50,033 | 4,203,773 | ||||||
| American Electric Power Company, Inc. | 71,965 | 4,198,438 | ||||||
| Ameren Corp. | 98,767 | 4,181,795 | ||||||
| Northeast Utilities | 84,737 | 4,181,771 | ||||||
| CMS Energy Corp. | 127,468 | 4,164,380 | ||||||
| SCANA Corp. | 75,716 | 4,156,051 | ||||||
| Edison International | 66,397 | 4,155,124 | ||||||
| FirstEnergy Corp. | 110,499 | 4,126,033 | ||||||
| Integrys Energy Group, Inc. | 56,718 | 4,122,264 | ||||||
| DTE Energy Co. | 49,977 | 4,106,110 | ||||||
| Pinnacle West Capital Corp. | 66,714 | 4,100,910 | ||||||
| PG&E Corp. | 81,432 | 4,097,658 | ||||||
| PPL Corp. | 115,748 | 4,050,023 | ||||||
| Xcel Energy, Inc. | 120,782 | 4,042,574 | ||||||
| Southern Co. | 87,102 | 4,038,049 | ||||||
| NextEra Energy, Inc. | 40,138 | 4,022,630 | ||||||
| Dominion Resources, Inc. | 55,072 | 3,926,634 | ||||||
| Pepco Holdings, Inc. | 139,368 | 3,810,321 | ||||||
| Total Electric-Integrated | 99,128,592 | |||||||
| TELEPHONE-INTEGRATED - 13.5% | ||||||||
| CenturyLink, Inc. | 95,520 | 3,962,170 | ||||||
| Verizon Communications, Inc. | 78,034 | 3,921,209 | ||||||
Frontier Communications Corp.1 | 590,132 | 3,859,463 | ||||||
| AT&T, Inc. | 109,472 | 3,814,004 | ||||||
Windstream Holdings, Inc.1 | 341,177 | 3,575,535 | ||||||
| Total Telephone-Integrated | 19,132,381 | |||||||
| GAS-DISTRIBUTION - 11.1% | ||||||||
| NiSource, Inc. | 96,761 | 4,069,768 | ||||||
| Sempra Energy | 36,454 | 4,009,940 | ||||||
| AGL Resources, Inc. | 71,948 | 3,878,717 | ||||||
| CenterPoint Energy, Inc. | 155,744 | 3,823,515 | ||||||
| Total Gas-Distribution | 15,781,940 | |||||||
| INDEPEND POWER PRODUCER - 2.6% | ||||||||
| NRG Energy, Inc. | 124,732 | 3,739,465 | ||||||
| ELECTRIC-GENERATION - 2.6% | ||||||||
| AES Corp. | 262,098 | 3,687,719 | ||||||
| Total Common Stocks | ||||||||
| (Cost $134,728,889) | 141,470,097 | |||||||
SHORT TERM INVESTMENTS† - 0.2% | ||||||||
| Federated U.S. Treasury Cash Reserve Fund | 215,025 | 215,025 | ||||||
| Total Short Term Investments | ||||||||
| (Cost $215,025) | 215,025 | |||||||
| Face Amount | ||||||||
SECURITIES LENDING COLLATERAL††,2 - 4.0% | ||||||||
| Joint Repurchase Agreements | ||||||||
| HSBC Securities, Inc. issued 10/31/14 at 0.08% due 11/03/14 | $ | 3,584,061 | 3,584,061 | |||||
| BNP Paribas Securities Corp. issued 10/31/14 at 0.11% due 11/03/14 | 1,639,346 | 1,639,346 | ||||||
| Barclays Capital, Inc. issued 10/31/14 at 0.07% due 11/03/14 | 469,882 | 469,882 | ||||||
| Total Securities Lending Collateral | ||||||||
| (Cost $5,693,289) | 5,693,289 | |||||||
| Total Investments - 103.9% | ||||||||
| (Cost $140,637,203) | $ | 147,378,411 | ||||||
| Other Assets & Liabilities, net - (3.9)% | (5,502,927 | ) | ||||||
| Total Net Assets - 100.0% | $ | 141,875,484 | ||||||
| † | Value determined based on Level 1 inputs — See Note 4. |
| †† | Value determined based on Level 2 inputs — See Note 4. |
| 1 | All or portion of this security is on loan at October 31, 2014 — See Note 5. |
| 2 | Securities lending collateral — See Note 5. |
96 | GUGGENHEIM ETFs ANNUAL REPORT | SEE NOTES TO FINANCIAL STATEMENTS. |
| STATEMENTS OF ASSETS AND LIABILITIES | October 31, 2014 |
Guggenheim Russell MidCap® Equal Weight ETF | Guggenheim Russell 1000® Equal Weight ETF | Guggenheim Russell 2000® Equal Weight ETF | Guggenheim MSCI Emerging Markets Equal Weight ETF | |||||||||||||
| Assets: | ||||||||||||||||
| Investments, at value* — including $4,820,550, $2,518,493, $2,141,567 and $1,764,819 of securities loaned, respectively | $ | 146,072,679 | $ | 93,087,244 | $ | 40,366,141 | $ | 13,665,630 | ||||||||
| Repurchase agreements | 4,843,547 | 2,546,229 | 2,271,508 | 1,791,546 | ||||||||||||
| Total Investments | 150,916,226 | 95,633,473 | 42,637,649 | 15,457,176 | ||||||||||||
| Segregated cash with broker | 10 | 5 | 4 | 4 | ||||||||||||
| Foreign currency, at value | — | — | — | 318 | ||||||||||||
| Receivables: | ||||||||||||||||
| Receivable from manager | — | — | — | 1,045 | ||||||||||||
| Securities lending | 16,291 | 9,438 | 11,456 | 697 | ||||||||||||
| Dividends and interest | 83,366 | 76,432 | 15,752 | 6,584 | ||||||||||||
| Capital gains tax reclaims | — | — | — | 659 | ||||||||||||
| Total assets | 151,015,893 | 95,719,348 | 42,664,861 | 15,466,483 | ||||||||||||
| Liabilities: | ||||||||||||||||
| Payable upon return of securities loaned | 4,843,557 | 2,546,235 | 2,271,513 | 1,791,550 | ||||||||||||
| Payable for: | ||||||||||||||||
| Due to custodian | — | — | — | 12,782 | ||||||||||||
| Accrued management fees | 47,354 | 36,195 | 12,871 | 7,956 | ||||||||||||
| Total liabilities | 4,890,911 | 2,582,430 | 2,284,384 | 1,812,288 | ||||||||||||
| Net assets | $ | 146,124,982 | $ | 93,136,918 | $ | 40,380,477 | $ | 13,654,195 | ||||||||
| Net assets consist of: | ||||||||||||||||
| Paid-in capital | $ | 124,771,059 | $ | 83,695,711 | $ | 37,758,046 | $ | 16,652,220 | ||||||||
| Undistributed (distributions in excess of) net investment income | (856 | ) | 19,357 | (8,573 | ) | 16,910 | ||||||||||
| Accumulated net realized gain (loss) on investments and foreign currency | (875,154 | ) | (684,496 | ) | (1,415,366 | ) | (3,029,093 | ) | ||||||||
| Net unrealized appreciation on investments and foreign currency | 22,229,933 | 10,106,346 | 4,046,370 | 14,158 | ||||||||||||
| Net assets | $ | 146,124,982 | $ | 93,136,918 | $ | 40,380,477 | $ | 13,654,195 | ||||||||
| Shares outstanding (unlimited shares authorized), no par value | 2,900,000 | 1,850,000 | 900,000 | 400,000 | ||||||||||||
| Net asset value, offering price and repurchase price per share | $ | 50.39 | $ | 50.34 | $ | 44.87 | $ | 34.14 | ||||||||
| Cost of investments | $ | 123,842,746 | $ | 82,980,898 | $ | 36,319,771 | $ | 13,651,329 | ||||||||
| Cost of repurchase agreements | 4,843,547 | 2,546,229 | 2,271,508 | 1,791,546 | ||||||||||||
| *Total cost of investments | $ | 128,686,293 | $ | 85,527,127 | $ | 38,591,279 | $ | 15,442,875 | ||||||||
| SEE NOTES TO FINANCIAL STATEMENTS. | GUGGENHEIM ETFs ANNUAL REPORT | 97 |
STATEMENTS OF ASSETS AND LIABILITIES (continued) | October 31, 2014 |
Guggenheim S&P 500® Equal Weight Consumer Discretionary ETF | Guggenheim S&P 500® Equal Weight Consumer Staples ETF | Guggenheim S&P 500® Equal Weight Energy ETF | ||||||||||
| Assets: | ||||||||||||
| Investments, at value* — including $3,828,402, $— and $6,877,073 of securities loaned, respectively | $ | 86,880,873 | $ | 186,284,412 | $ | 100,183,093 | ||||||
| Repurchase agreements | 3,880,267 | — | 7,069,723 | |||||||||
| Total Investments | 90,761,140 | 186,284,412 | 107,252,816 | |||||||||
| Segregated cash with broker | 8 | — | 14 | |||||||||
| Receivables: | ||||||||||||
| Fund shares sold | — | 139,121 | — | |||||||||
| Securities lending | 735 | — | 21,037 | |||||||||
| Dividends and interest | 45,321 | 210,895 | 153,325 | |||||||||
| Total assets | 90,807,204 | 186,634,428 | 107,427,192 | |||||||||
| Liabilities: | ||||||||||||
| Payable upon return of securities loaned | 3,880,275 | — | 7,069,736 | |||||||||
| Payable for: | ||||||||||||
| Investments purchased | — | 197,863 | — | |||||||||
| Accrued management fees | 29,770 | 54,595 | 50,596 | |||||||||
| Total liabilities | 3,910,045 | 252,458 | 7,120,332 | |||||||||
| Net assets | $ | 86,897,159 | $ | 186,381,970 | $ | 100,306,860 | ||||||
| Net assets consist of: | ||||||||||||
| Paid-in capital | $ | 85,519,959 | $ | 175,862,469 | $ | 128,359,855 | ||||||
| Undistributed net investment income | 28,390 | 305,571 | 110,631 | |||||||||
| Accumulated net realized gain (loss) on investments | (3,441,961 | ) | (2,145,483 | ) | (8,172,023 | ) | ||||||
| Net unrealized appreciation (depreciation) on investments | 4,790,771 | 12,359,413 | (19,991,603 | ) | ||||||||
| Net assets | $ | 86,897,159 | $ | 186,381,970 | $ | 100,306,860 | ||||||
| Shares outstanding (unlimited shares authorized), no par value | 1,050,000 | 1,850,000 | 1,300,005 | |||||||||
| Net asset value, offering price and repurchase price per share | $ | 82.76 | $ | 100.75 | $ | 77.16 | ||||||
| Cost of investments | $ | 82,090,102 | $ | 173,924,999 | $ | 120,174,696 | ||||||
| Cost of repurchase agreements | 3,880,267 | — | 7,069,723 | |||||||||
| *Total cost of investments | $ | 85,970,369 | $ | 173,924,999 | $ | 127,244,419 | ||||||
98 | GUGGENHEIM ETFs ANNUAL REPORT | SEE NOTES TO FINANCIAL STATEMENTS. |
STATEMENTS OF ASSETS AND LIABILITIES (continued) | October 31, 2014 |
Guggenheim S&P 500® Equal Weight Financials ETF | Guggenheim S&P 500® Equal Weight Health Care ETF | Guggenheim S&P 500® Equal Weight Industrials ETF | Guggenheim S&P 500® Equal Weight Materials ETF | |||||||||||||
| Assets: | ||||||||||||||||
| Investments, at value* | $ | 136,279,165 | $ | 393,297,127 | $ | 123,339,272 | $ | 74,113,392 | ||||||||
| Total Investments | 136,279,165 | 393,297,127 | 123,339,272 | 74,113,392 | ||||||||||||
| Receivables: | ||||||||||||||||
| Fund shares sold | 8,026 | 115,038 | — | — | ||||||||||||
| Securities lending | — | — | 14 | — | ||||||||||||
| Dividends and interest | 77,605 | 153,428 | 264,982 | 59,896 | ||||||||||||
| Total assets | 136,364,796 | 393,565,593 | 123,604,268 | 74,173,288 | ||||||||||||
| Liabilities: | ||||||||||||||||
| Payable for: | ||||||||||||||||
| Investments purchased | — | 1,736,224 | — | — | ||||||||||||
| Due to custodian | 5,720 | — | 106,197 | — | ||||||||||||
| Fund shares redeemed | — | — | 9,926 | 7,234 | ||||||||||||
| Accrued management fees | 43,423 | 115,383 | 40,661 | 27,555 | ||||||||||||
| Total liabilities | 49,143 | 1,851,607 | 156,784 | 34,789 | ||||||||||||
| Net assets | $ | 136,315,653 | $ | 391,713,986 | $ | 123,447,484 | $ | 74,138,499 | ||||||||
| Net assets consist of: | ||||||||||||||||
| Paid-in capital | $ | 134,229,503 | $ | 338,198,315 | $ | 116,089,031 | $ | 77,348,673 | ||||||||
| Undistributed net investment income | — | 232,378 | 276,845 | 71,167 | ||||||||||||
| Accumulated net realized gain (loss) on investments | (6,324,801 | ) | (318,317 | ) | (1,825,735 | ) | (2,543,732 | ) | ||||||||
| Net unrealized appreciation (depreciation) on investments | 8,410,951 | 53,601,610 | 8,907,343 | (737,609 | ) | |||||||||||
| Net assets | $ | 136,315,653 | $ | 391,713,986 | $ | 123,447,484 | $ | 74,138,499 | ||||||||
| Shares outstanding (unlimited shares authorized), no par value | 3,150,000 | 2,850,000 | 1,400,000 | 900,000 | ||||||||||||
| Net asset value, offering price and repurchase price per share | $ | 43.27 | $ | 137.44 | $ | 88.18 | $ | 82.38 | ||||||||
| *Total cost of investments | $ | 127,868,214 | $ | 339,695,517 | $ | 114,431,929 | $ | 74,851,001 | ||||||||
| SEE NOTES TO FINANCIAL STATEMENTS. | GUGGENHEIM ETFs ANNUAL REPORT | 99 |
STATEMENTS OF ASSETS AND LIABILITIES (concluded) | October 31, 2014 |
Guggenheim S&P 500® Equal Weight Technology ETF | Guggenheim S&P 500® Equal Weight Utilities ETF | |||||||
| Assets: | ||||||||
| Investments, at value* — including $18,326,670 and $5,530,514 of securities loaned, respectively | $ | 671,088,290 | $ | 141,685,122 | ||||
| Repurchase agreements | 18,261,339 | 5,693,289 | ||||||
| Total Investments | 689,349,629 | 147,378,411 | ||||||
| Cash | 1,960 | — | ||||||
| Segregated cash with broker | 36 | 11 | ||||||
| Receivables: | ||||||||
| Fund shares sold | 1,686 | 23,164 | ||||||
| Securities lending | 1,701 | 1,672 | ||||||
| Dividends and interest | 332,527 | 202,786 | ||||||
| Total assets | 689,687,539 | 147,606,044 | ||||||
| Liabilities: | ||||||||
| Payable upon return of securities loaned | 18,261,375 | 5,693,300 | ||||||
| Payable for: | ||||||||
| Accrued management fees | 205,386 | 37,260 | ||||||
| Total liabilities | 18,466,761 | 5,730,560 | ||||||
| Net assets | $ | 671,220,778 | $ | 141,875,484 | ||||
| Net assets consist of: | ||||||||
| Paid-in capital | $ | 605,131,191 | $ | 135,498,514 | ||||
| Undistributed net investment income | 117,510 | 199,574 | ||||||
| Accumulated net realized gain (loss) on investments | (7,239,598 | ) | (563,812 | ) | ||||
| Net unrealized appreciation on investments | 73,211,675 | 6,741,208 | ||||||
| Net assets | $ | 671,220,778 | $ | 141,875,484 | ||||
| Shares outstanding (unlimited shares authorized), no par value | 7,700,000 | 1,850,000 | ||||||
| Net asset value, offering price and repurchase price per share | $ | 87.17 | $ | 76.69 | ||||
| Cost of investments | $ | 597,876,615 | $ | 134,943,914 | ||||
| Cost of repurchase agreements | 18,261,339 | 5,693,289 | ||||||
| *Total cost of investments | $ | 616,137,954 | $ | 140,637,203 | ||||
100 | GUGGENHEIM ETFs ANNUAL REPORT | SEE NOTES TO FINANCIAL STATEMENTS. |
| STATEMENTS OF OPERATIONS |
For the Year Ended October 31, 2014
Guggenheim Russell MidCap® Equal Weight ETF | Guggenheim Russell 1000® Equal Weight ETF | Guggenheim Russell 2000® Equal Weight ETF | Guggenheim MSCI Emerging Markets Equal Weight ETF | |||||||||||||
| Investment Income: | ||||||||||||||||
| Dividends, net of foreign taxes withheld* | $ | 1,847,884 | $ | 1,569,338 | $ | 395,929 | $ | 280,395 | ||||||||
| Income from securities lending | 95,511 | 55,076 | 94,220 | 4,698 | ||||||||||||
| Interest | 6 | 3 | 2 | 9 | ||||||||||||
| Total investment income | 1,943,401 | 1,624,417 | 490,151 | 285,102 | ||||||||||||
| Expenses: | ||||||||||||||||
| Management fees | 462,251 | 364,394 | 141,743 | 81,075 | ||||||||||||
| Trustee fees | 9,965 | 4,770 | 7,832 | — | ||||||||||||
| Total expenses | 472,216 | 369,164 | 149,575 | 81,075 | ||||||||||||
| Less: | ||||||||||||||||
| Expenses waived by Adviser | — | — | — | (11,582 | ) | |||||||||||
| Net investment income | 1,471,185 | 1,255,253 | 340,576 | 215,609 | ||||||||||||
| Net Realized and Unrealized Gain (Loss): | ||||||||||||||||
| Net realized gain (loss) on: | ||||||||||||||||
| Investments | (851,662 | ) | (484,225 | ) | (292,017 | ) | (409,237 | ) | ||||||||
| In-kind redemptions | 8,750,080 | 10,767,488 | 1,187,212 | — | ||||||||||||
| Foreign currency transactions | — | — | — | (2,471 | ) | |||||||||||
| Net realized gain (loss) | 7,898,418 | 10,283,263 | 895,195 | (411,708 | ) | |||||||||||
| Net change in unrealized appreciation (depreciation) on: | ||||||||||||||||
| Investments | 4,759,529 | (2,477,145 | ) | 202,910 | 203,909 | |||||||||||
| Foreign currency transactions | — | — | — | (173 | ) | |||||||||||
| Net change in unrealized appreciation (depreciation) | 4,759,529 | (2,477,145 | ) | 202,910 | 203,736 | |||||||||||
| Net realized and unrealized gain (loss) | 12,657,947 | 7,806,118 | 1,098,105 | (207,972 | ) | |||||||||||
| Net increase in net assets resulting from operations | $ | 14,129,132 | $ | 9,061,371 | $ | 1,438,681 | $ | 7,637 | ||||||||
| * Foreign taxes withheld | $ | 977 | $ | 831 | $ | 1,718 | $ | 34,592 | ||||||||
| SEE NOTES TO FINANCIAL STATEMENTS. | GUGGENHEIM ETFs ANNUAL REPORT | 101 |
STATEMENTS OF OPERATIONS (continued) |
For the Year Ended October 31, 2014
Guggenheim S&P 500® Equal Weight Consumer Discretionary ETF | Guggenheim S&P 500® Equal Weight Consumer Staples ETF | Guggenheim S&P 500® Equal Weight Energy ETF | ||||||||||
| Investment Income: | ||||||||||||
| Dividends | $ | 1,725,468 | $ | 3,253,966 | $ | 3,097,438 | ||||||
| Income from securities lending | 15,351 | 252 | 154,426 | |||||||||
| Interest | 4 | 6 | 4 | |||||||||
| Total investment income | 1,740,823 | 3,254,224 | 3,251,868 | |||||||||
| Expenses: | ||||||||||||
| Management fees | 441,959 | 510,427 | 641,629 | |||||||||
| Total expenses | 441,959 | 510,427 | 641,629 | |||||||||
| Net investment income | 1,298,864 | 2,743,797 | 2,610,239 | |||||||||
| Net Realized and Unrealized Gain (Loss): | ||||||||||||
| Net realized gain (loss) on: | ||||||||||||
| Investments | (464,473 | ) | (1,849,622 | ) | (4,235,571 | ) | ||||||
| In-kind redemptions | 19,733,253 | 15,292,738 | 6,123,075 | |||||||||
| Net realized gain | 19,268,780 | 13,443,116 | 1,887,504 | |||||||||
| Net change in unrealized appreciation (depreciation) on: | ||||||||||||
| Investments | (13,526,852 | ) | 2,905,504 | (22,261,676 | ) | |||||||
| Net realized and unrealized gain (loss) | 5,741,928 | 16,348,620 | (20,374,172 | ) | ||||||||
| Net increase (decrease) in net assets resulting from operations | $ | 7,040,792 | $ | 19,092,417 | $ | (17,763,933 | ) | |||||
102 | GUGGENHEIM ETFs ANNUAL REPORT | SEE NOTES TO FINANCIAL STATEMENTS. |
STATEMENTS OF OPERATIONS (continued) |
For the Year Ended October 31, 2014
Guggenheim S&P 500® Equal Weight Financials ETF | Guggenheim S&P 500® Equal Weight Health Care ETF | Guggenheim S&P 500® Equal Weight Industrials ETF | Guggenheim S&P 500® Equal Weight Materials ETF | |||||||||||||
| Investment Income: | ||||||||||||||||
| Dividends, net of foreign taxes withheld* | $ | 1,663,286 | $ | 2,035,825 | $ | 1,790,620 | $ | 1,381,952 | ||||||||
| Income from securities lending | 1,478 | 573 | 1,743 | 22,764 | ||||||||||||
| Interest | 2 | 4 | 3 | 2 | ||||||||||||
| Total investment income | 1,664,766 | 2,036,402 | 1,792,366 | 1,404,718 | ||||||||||||
| Expenses: | ||||||||||||||||
| Management fees | 394,886 | 863,462 | 387,456 | 302,025 | ||||||||||||
| Total expenses | 394,886 | 863,462 | 387,456 | 302,025 | ||||||||||||
| Net investment income | 1,269,880 | 1,172,940 | 1,404,910 | 1,102,693 | ||||||||||||
| Net Realized and Unrealized Gain (Loss): | ||||||||||||||||
| Net realized gain (loss) on: | ||||||||||||||||
| Investments | 465,836 | 3,600,054 | (441,240 | ) | (1,027,428 | ) | ||||||||||
| In-kind redemptions | 8,775,952 | 19,272,374 | 11,943,595 | 16,461,930 | ||||||||||||
| Net realized gain | 9,241,788 | 22,872,428 | 11,502,355 | 15,434,502 | ||||||||||||
| Net change in unrealized appreciation (depreciation) on: | ||||||||||||||||
| Investments | 4,351,272 | 42,079,888 | 2,104,725 | (10,400,723 | ) | |||||||||||
| Net realized and unrealized gain | 13,593,060 | 64,952,316 | 13,607,080 | 5,033,779 | ||||||||||||
| Net increase in net assets resulting from operations | $ | 14,862,940 | $ | 66,125,256 | $ | 15,011,990 | $ | 6,136,472 | ||||||||
| * Foreign taxes withheld | $ | — | $ | — | $ | 4,369 | $ | — | ||||||||
| SEE NOTES TO FINANCIAL STATEMENTS. | GUGGENHEIM ETFs ANNUAL REPORT | 103 |
STATEMENTS OF OPERATIONS (concluded) |
For the Year Ended October 31, 2014
Guggenheim S&P 500® Equal Weight Technology ETF | Guggenheim S&P 500® Equal Weight Utilities ETF | |||||||
| Investment Income: | ||||||||
| Dividends | $ | 6,741,701 | $ | 3,414,806 | ||||
| Income from securities lending | 8,267 | 36,515 | ||||||
| Interest | 19 | 5 | ||||||
| Total investment income | 6,749,987 | 3,451,326 | ||||||
| Expenses: | ||||||||
| Management fees | 1,987,366 | 339,223 | ||||||
| Total expenses | 1,987,366 | 339,223 | ||||||
| Net investment income | 4,762,621 | 3,112,103 | ||||||
| Net Realized and Unrealized Gain (Loss): | ||||||||
| Net realized gain (loss) on: | ||||||||
| Investments | 4,172,526 | (558,245 | ) | |||||
| In-kind redemptions | 30,852,577 | 12,483,032 | ||||||
| Net realized gain | 35,025,103 | 11,924,787 | ||||||
| Net change in unrealized appreciation (depreciation) on: | ||||||||
| Investments | 52,724,598 | 3,851,728 | ||||||
| Net realized and unrealized gain | 87,749,701 | 15,776,515 | ||||||
| Net increase in net assets resulting from operations | $ | 92,512,322 | $ | 18,888,618 | ||||
104 | GUGGENHEIM ETFs ANNUAL REPORT | SEE NOTES TO FINANCIAL STATEMENTS. |
| STATEMENTS OF CHANGES IN NET ASSETS |
Guggenheim Russell MidCap® Equal Weight ETF | ||||||||
Year Ended October 31, 2014 | Year Ended October 31, 2013 | |||||||
| Increase (Decrease) in Net Assets from Operations: | ||||||||
| Net investment income | $ | 1,471,185 | $ | 880,860 | ||||
| Net realized gain on investments | 7,898,418 | 1,667,080 | ||||||
| Net change in unrealized appreciation (depreciation) on investments | 4,759,529 | 15,666,282 | ||||||
| Net increase in net assets resulting from operations | 14,129,132 | 18,214,222 | ||||||
| Distributions to shareholders from: | ||||||||
| Net investment income | (1,462,291 | ) | (872,275 | ) | ||||
| Capital gains | (692,837 | ) | — | |||||
| Total distributions to shareholders | (2,155,128 | ) | (872,275 | ) | ||||
| Shareholder transactions: | ||||||||
| Proceeds from shares purchased | 81,939,005 | 8,621,802 | ||||||
| Value of shares redeemed | (24,692,404 | ) | (1,675,923 | ) | ||||
| Net increase in net assets resulting from share transactions | 57,246,601 | 6,945,879 | ||||||
| Net increase in net assets | 69,220,605 | 24,287,826 | ||||||
| Net assets: | ||||||||
| Beginning of year | 76,904,377 | 52,616,551 | ||||||
| End of year | $ | 146,124,982 | $ | 76,904,377 | ||||
| Undistributed (distributions in excess of) net investment income at end of year | $ | (856 | ) | $ | 32,425 | |||
| Changes in shares outstanding: | ||||||||
| Shares sold | 1,700,000 | 200,000 | ||||||
| Shares redeemed | (500,000 | ) | (50,000 | ) | ||||
| Net increase in shares | 1,200,000 | 150,000 | ||||||
| SEE NOTES TO FINANCIAL STATEMENTS. | GUGGENHEIM ETFs ANNUAL REPORT | 105 |
STATEMENTS OF CHANGES IN NET ASSETS (continued) |
Guggenheim Russell 1000® Equal Weight ETF | Guggenheim Russell 2000® Equal Weight ETF | |||||||||||||||
Year Ended October 31, 2014 | Year Ended October 31, 2013 | Year Ended October 31, 2014 | Year Ended October 31, 2013 | |||||||||||||
| Increase (Decrease) in Net Assets from Operations: | ||||||||||||||||
| Net investment income | $ | 1,255,253 | $ | 850,118 | $ | 340,576 | $ | 239,290 | ||||||||
| Net realized gain on investments | 10,283,263 | 2,559,190 | 895,195 | 361,872 | ||||||||||||
| Net change in unrealized appreciation (depreciation) on investments | (2,477,145 | ) | 11,758,096 | 202,910 | 4,446,385 | |||||||||||
| Net increase in net assets resulting from operations | 9,061,371 | 15,167,404 | 1,438,681 | 5,047,547 | ||||||||||||
| Distributions to shareholders from: | ||||||||||||||||
| Net investment income | (1,246,900 | ) | (825,605 | ) | (344,321 | ) | (245,833 | ) | ||||||||
| Shareholder transactions: | ||||||||||||||||
| Proceeds from shares purchased | 58,765,204 | 19,494,177 | 15,879,739 | 8,272,983 | ||||||||||||
| Value of shares redeemed | (38,162,845 | ) | (8,127,123 | ) | (2,329,715 | ) | (1,656,312 | ) | ||||||||
| Net increase in net assets resulting from share transactions | 20,602,359 | 11,367,054 | 13,550,024 | 6,616,671 | ||||||||||||
| Net increase in net assets | 28,416,830 | 25,708,853 | 14,644,384 | 11,418,385 | ||||||||||||
| Net assets: | ||||||||||||||||
| Beginning of year | 64,720,088 | 39,011,235 | 25,736,093 | 14,317,708 | ||||||||||||
| End of year | $ | 93,136,918 | $ | 64,720,088 | $ | 40,380,477 | $ | 25,736,093 | ||||||||
| Undistributed (distributions in excess of) net investment income at end of year | $ | 19,357 | $ | 21,969 | $ | (8,573 | ) | $ | 1,018 | |||||||
| Changes in shares outstanding: | ||||||||||||||||
| Shares sold | 1,200,000 | 500,000 | 350,000 | 200,000 | ||||||||||||
| Shares redeemed | (800,000 | ) | (200,000 | ) | (50,000 | ) | (50,000 | ) | ||||||||
| Net increase in shares | 400,000 | 300,000 | 300,000 | 150,000 | ||||||||||||
106 | GUGGENHEIM ETFs ANNUAL REPORT | SEE NOTES TO FINANCIAL STATEMENTS. |
STATEMENTS OF CHANGES IN NET ASSETS (continued) |
| Guggenheim MSCI Emerging Markets Equal Weight ETF | Guggenheim S&P 500® Equal Weight Consumer Discretionary ETF | |||||||||||||||
Year Ended October 31, 2014 | Year Ended October 31, 2013 | Year Ended October 31, 2014 | Year Ended October 31, 2013 | |||||||||||||
| Increase (Decrease) in Net Assets from Operations: | ||||||||||||||||
| Net investment income | $ | 215,609 | $ | 168,467 | $ | 1,298,864 | $ | 715,547 | ||||||||
| Net realized gain (loss) on investments and foreign currency | (411,708 | ) | (422,275 | ) | 19,268,780 | 1,266,782 | ||||||||||
| Net change in unrealized appreciation (depreciation) on investments and foreign currency | 203,736 | 925,548 | (13,526,852 | ) | 17,925,619 | |||||||||||
| Net increase in net assets resulting from operations | 7,637 | 671,740 | 7,040,792 | 19,907,948 | ||||||||||||
| Distributions to shareholders from: | ||||||||||||||||
| Net investment income | (231,261 | ) | (142,210 | ) | (1,282,123 | ) | (700,441 | ) | ||||||||
| Shareholder transactions: | ||||||||||||||||
| Proceeds from shares purchased | 3,549,961 | — | 47,523,459 | 68,655,707 | ||||||||||||
| Value of shares redeemed | — | (3,526,747 | ) | (91,882,052 | ) | (3,680,382 | ) | |||||||||
| Net increase (decrease) in net assets resulting from share transactions | 3,549,961 | (3,526,747 | ) | (44,358,593 | ) | 64,975,325 | ||||||||||
| Net increase (decrease) in net assets | 3,326,337 | (2,997,217 | ) | (38,599,924 | ) | 84,182,832 | ||||||||||
| Net assets: | ||||||||||||||||
| Beginning of year | 10,327,858 | 13,325,075 | 125,497,083 | 41,314,251 | ||||||||||||
| End of year | $ | 13,654,195 | $ | 10,327,858 | $ | 86,897,159 | $ | 125,497,083 | ||||||||
| Undistributed net investment income at end of year | $ | 16,910 | $ | 36,977 | $ | 28,390 | $ | 28,888 | ||||||||
| Changes in shares outstanding: | ||||||||||||||||
| Shares sold | 100,000 | — | 600,000 | 950,000 | ||||||||||||
| Shares redeemed | — | (100,000 | ) | (1,200,000 | ) | (50,000 | ) | |||||||||
| Net increase (decrease) in shares | 100,000 | (100,000 | ) | (600,000 | ) | 900,000 | ||||||||||
| SEE NOTES TO FINANCIAL STATEMENTS. | GUGGENHEIM ETFs ANNUAL REPORT | 107 |
STATEMENTS OF CHANGES IN NET ASSETS (continued) |
Guggenheim S&P 500® Equal Weight Consumer Staples ETF | Guggenheim S&P 500® Equal Weight Energy ETF | |||||||||||||||
Year Ended October 31, 2014 | Year Ended October 31, 2013 | Year Ended October 31, 2014 | Year Ended October 31, 2013 | |||||||||||||
| Increase (Decrease) in Net Assets from Operations: | ||||||||||||||||
| Net investment income | $ | 2,743,797 | $ | 1,372,995 | $ | 2,610,239 | $ | 366,278 | ||||||||
| Net realized gain on investments | 13,443,116 | 3,958,959 | 1,887,504 | 1,160,733 | ||||||||||||
| Net change in unrealized appreciation (depreciation) on investments | 2,905,504 | 10,909,808 | (22,261,676 | ) | 6,228,548 | |||||||||||
| Net increase (decrease) in net assets resulting from operations | 19,092,417 | 16,241,762 | (17,763,933 | ) | 7,755,559 | |||||||||||
| Distributions to shareholders from: | ||||||||||||||||
| Net investment income | (2,571,891 | ) | (1,309,633 | ) | (2,499,608 | ) | (380,123 | ) | ||||||||
| Shareholder transactions: | ||||||||||||||||
| Proceeds from shares purchased | 161,078,918 | 52,450,891 | 318,175,018 | 14,930,221 | ||||||||||||
| Value of shares redeemed | (75,271,970 | ) | (24,272,835 | ) | (241,528,311 | ) | (10,385,638 | ) | ||||||||
| Net increase in net assets resulting from share transactions | 85,806,948 | 28,178,056 | 76,646,707 | 4,544,583 | ||||||||||||
| Net increase in net assets | 102,327,474 | 43,110,185 | 56,383,166 | 11,920,019 | ||||||||||||
| Net assets: | ||||||||||||||||
| Beginning of year | 84,054,496 | 40,944,311 | 43,923,694 | 32,003,675 | ||||||||||||
| End of year | $ | 186,381,970 | $ | 84,054,496 | $ | 100,306,860 | $ | 43,923,694 | ||||||||
| Undistributed net investment income at end of year | $ | 305,571 | $ | 130,780 | $ | 110,631 | $ | 7,918 | ||||||||
| Changes in shares outstanding: | ||||||||||||||||
| Shares sold | 1,700,000 | 650,000 | 3,700,000 | 200,000 | ||||||||||||
| Shares redeemed | (800,000 | ) | (300,000 | ) | (2,950,000 | ) | (150,000 | ) | ||||||||
| Net increase in shares | 900,000 | 350,000 | 750,000 | 50,000 | ||||||||||||
108 | GUGGENHEIM ETFs ANNUAL REPORT | SEE NOTES TO FINANCIAL STATEMENTS. |
STATEMENTS OF CHANGES IN NET ASSETS (continued) |
Guggenheim S&P 500® Equal Weight Financials ETF | Guggenheim S&P 500® Equal Weight Health Care ETF | |||||||||||||||
Year Ended October 31, 2014 | Year Ended October 31, 2013 | Year Ended October 31, 2014 | Year Ended October 31, 2013 | |||||||||||||
| Increase (Decrease) in Net Assets from Operations: | ||||||||||||||||
| Net investment income | $ | 1,269,880 | $ | 686,052 | $ | 1,172,940 | $ | 687,160 | ||||||||
| Net realized gain on investments | 9,241,788 | 4,793,753 | 22,872,428 | 21,477,831 | ||||||||||||
| Net change in unrealized appreciation (depreciation) on investments | 4,351,272 | 3,491,840 | 42,079,888 | 13,181,168 | ||||||||||||
| Net increase in net assets resulting from operations | 14,862,940 | 8,971,645 | 66,125,256 | 35,346,159 | ||||||||||||
| Distributions to shareholders from: | ||||||||||||||||
| Net investment income | (1,579,128 | ) | (576,182 | ) | (1,057,835 | ) | (639,369 | ) | ||||||||
| Return of capital | — | (112,188 | ) | — | — | |||||||||||
| Total distribution to shareholders | (1,579,128 | ) | (688,370 | ) | (1,057,835 | ) | (639,369 | ) | ||||||||
| Shareholder transactions: | ||||||||||||||||
| Proceeds from shares purchased | 121,631,679 | 68,279,874 | 275,032,704 | 251,986,793 | ||||||||||||
| Value of shares redeemed | (56,936,567 | ) | (32,564,941 | ) | (79,013,536 | ) | (194,484,887 | ) | ||||||||
| Net increase in net assets resulting from share transactions | 64,695,112 | 35,714,933 | 196,019,168 | 57,501,906 | ||||||||||||
| Net increase in net assets | 77,978,924 | 43,998,208 | 261,086,589 | 92,208,696 | ||||||||||||
| Net assets: | ||||||||||||||||
| Beginning of year | 58,336,729 | 14,338,521 | 130,627,397 | 38,418,701 | ||||||||||||
| End of year | $ | 136,315,653 | $ | 58,336,729 | $ | 391,713,986 | $ | 130,627,397 | ||||||||
| Undistributed net investment income at end of year | $ | — | $ | 10,189 | $ | 232,378 | $ | 115,335 | ||||||||
| Changes in shares outstanding: | ||||||||||||||||
| Shares sold | 3,000,000 | 2,000,000 | 2,250,000 | 2,900,000 | ||||||||||||
| Shares redeemed | (1,400,000 | ) | (950,000 | ) | (650,000 | ) | (2,150,000 | ) | ||||||||
| Net increase in shares | 1,600,000 | 1,050,000 | 1,600,000 | 750,000 | ||||||||||||
| SEE NOTES TO FINANCIAL STATEMENTS. | GUGGENHEIM ETFs ANNUAL REPORT | 109 |
STATEMENTS OF CHANGES IN NET ASSETS (continued) |
Guggenheim S&P 500® Equal Weight Industrials ETF | Guggenheim S&P 500® Equal Weight Materials ETF | |||||||||||||||
Year Ended October 31, 2014 | Year Ended October 31, 2013 | Year Ended October 31, 2014 | Year Ended October 31, 2013 | |||||||||||||
| Increase (Decrease) in Net Assets from Operations: | ||||||||||||||||
| Net investment income | $ | 1,404,910 | $ | 492,791 | $ | 1,102,693 | $ | 666,698 | ||||||||
| Net realized gain on investments | 11,502,355 | 2,419,757 | 15,434,502 | 2,254,290 | ||||||||||||
| Net change in unrealized appreciation (depreciation) on investments | 2,104,725 | 7,465,868 | (10,400,723 | ) | 5,325,478 | |||||||||||
| Net increase in net assets resulting from operations | 15,011,990 | 10,378,416 | 6,136,472 | 8,246,466 | ||||||||||||
| Distributions to shareholders from: | ||||||||||||||||
| Net investment income | (1,179,408 | ) | (482,387 | ) | (1,078,681 | ) | (628,784 | ) | ||||||||
| Shareholder transactions: | ||||||||||||||||
| Proceeds from shares purchased | 102,807,929 | 44,243,724 | 85,250,481 | 17,593,748 | ||||||||||||
| Value of shares redeemed | (50,443,556 | ) | (13,970,905 | ) | (65,238,463 | ) | (9,530,520 | ) | ||||||||
| Net increase in net assets resulting from share transactions | 52,364,373 | 30,272,819 | 20,012,018 | 8,063,228 | ||||||||||||
| Net increase in net assets | 66,196,955 | 40,168,848 | 25,069,809 | 15,680,910 | ||||||||||||
| Net assets: | ||||||||||||||||
| Beginning of year | 57,250,529 | 17,081,681 | 49,068,690 | 33,387,780 | ||||||||||||
| End of year | $ | 123,447,484 | $ | 57,250,529 | $ | 74,138,499 | $ | 49,068,690 | ||||||||
| Undistributed net investment income at end of year | $ | 276,845 | $ | 60,402 | $ | 71,167 | $ | 47,155 | ||||||||
| Changes in shares outstanding: | ||||||||||||||||
| Shares sold | 1,250,000 | 650,000 | 1,050,000 | 250,000 | ||||||||||||
| Shares redeemed | (600,000 | ) | (200,000 | ) | (800,000 | ) | (150,000 | ) | ||||||||
| Net increase in shares | 650,000 | 450,000 | 250,000 | 100,000 | ||||||||||||
110 | GUGGENHEIM ETFs ANNUAL REPORT | SEE NOTES TO FINANCIAL STATEMENTS. |
STATEMENTS OF CHANGES IN NET ASSETS (concluded) |
Guggenheim S&P 500® Equal Weight Technology ETF | Guggenheim S&P 500® Equal Weight Utilities ETF | |||||||||||||||
Year Ended October 31, 2014 | Year Ended October 31, 2013 | Year Ended October 31, 2014 | Year Ended October 31, 2013 | |||||||||||||
| Increase (Decrease) in Net Assets from Operations: | ||||||||||||||||
| Net investment income | $ | 4,762,621 | $ | 1,587,664 | $ | 3,112,103 | $ | 1,795,537 | ||||||||
| Net realized gain on investments | 35,025,103 | 7,221,723 | 11,924,787 | 2,169,158 | ||||||||||||
| Net change in unrealized appreciation (depreciation) on investments | 52,724,598 | 35,548,906 | 3,851,728 | (386,179 | ) | |||||||||||
| Net increase in net assets resulting from operations | 92,512,322 | 44,358,293 | 18,888,618 | 3,578,516 | ||||||||||||
| Distributions to shareholders from: | ||||||||||||||||
| Net investment income | (4,572,706 | ) | (1,498,370 | ) | (3,002,830 | ) | (1,695,499 | ) | ||||||||
| Shareholder transactions: | ||||||||||||||||
| Proceeds from shares purchased | 444,290,459 | 205,002,224 | 218,070,696 | 19,675,002 | ||||||||||||
| Value of shares redeemed | (134,284,608 | ) | (75,066,087 | ) | (143,819,030 | ) | (12,183,568 | ) | ||||||||
| Net increase in net assets resulting from share transactions | 310,005,851 | 129,936,137 | 74,251,666 | 7,491,434 | ||||||||||||
| Net increase in net assets | 397,945,467 | 172,796,060 | 90,137,454 | 9,374,451 | ||||||||||||
| Net assets: | ||||||||||||||||
| Beginning of year | 273,275,311 | 100,479,251 | 51,738,030 | 42,363,579 | ||||||||||||
| End of year | $ | 671,220,778 | $ | 273,275,311 | $ | 141,875,484 | $ | 51,738,030 | ||||||||
| Undistributed net investment income at end of year | $ | 117,510 | $ | 131,943 | $ | 199,574 | $ | 142,246 | ||||||||
| Changes in shares outstanding: | ||||||||||||||||
| Shares sold | 5,550,000 | 3,100,000 | 3,050,000 | 300,000 | ||||||||||||
| Shares redeemed | (1,700,000 | ) | (1,200,000 | ) | (2,000,000 | ) | (200,000 | ) | ||||||||
| Net increase in shares | 3,850,000 | 1,900,000 | 1,050,000 | 100,000 | ||||||||||||
| SEE NOTES TO FINANCIAL STATEMENTS. | GUGGENHEIM ETFs ANNUAL REPORT | 111 |
GUGGENHEIM RUSSELL MIDCAP® EQUAL WEIGHT ETF |
| FINANCIAL HIGHLIGHTS |
This table is presented to show selected data for a share outstanding throughout each period and to assist shareholders in evaluating the Fund's performance for the periods presented.
| Year Ended October 31, 2014 | Year Ended October 31, 2013 | Year Ended October 31, 2012 | Period Ended October 31, 2011a | |||||||||||||
| Per Share Data: | ||||||||||||||||
| Net asset value, beginning of period | $ | 45.24 | $ | 33.95 | $ | 31.15 | $ | 30.21 | ||||||||
| Income from investment operations: | ||||||||||||||||
Net investment income (loss)b | 0.62 | 0.57 | 0.46 | 0.30 | ||||||||||||
| Net gain (loss) on investments (realized and unrealized) | 5.48 | 11.28 | 2.80 | 0.85 | ||||||||||||
| Total from investment operations | 6.10 | 11.85 | 3.26 | 1.15 | ||||||||||||
| Less distributions from: | ||||||||||||||||
| Net investment income | (0.59 | ) | (0.56 | ) | (0.46 | ) | (0.21 | ) | ||||||||
| Capital gains | (0.36 | ) | — | — | — | |||||||||||
| Total distributions to shareholders | (0.95 | ) | (0.56 | ) | (0.46 | ) | (0.21 | ) | ||||||||
| Net asset value, end of period | $ | 50.39 | $ | 45.24 | $ | 33.95 | $ | 31.15 | ||||||||
Total Returnc | 13.61 | % | 35.21 | % | 10.52 | % | 3.80 | % | ||||||||
| Ratios/Supplemental Data: | ||||||||||||||||
| Net assets, end of period (in thousands) | $ | 146,125 | $ | 76,904 | $ | 52,617 | $ | 54,508 | ||||||||
| Ratio to average net assets of: | ||||||||||||||||
| Net investment income (loss) | 1.27 | % | 1.44 | % | 1.39 | % | 1.06 | %d | ||||||||
| Total expenses | 0.41 | % | 0.41 | % | 0.41 | % | 0.41 | %d | ||||||||
Portfolio turnover ratee | 29 | % | 29 | % | 33 | % | 30 | % | ||||||||
a | The Fund commenced operations on December 3, 2010. |
b | Based on average shares outstanding. |
c | Total investment return is calculated assuming an initial investment made at the net asset value at the beginning of the period, reinvestment of all dividends and distribution at net asset value during the period, and redemption on the last day of the period. Transaction fees are not reflected in the calculation of total investment return. |
d | Annualized. |
e | Portfolio turnover does not include securities received or delivered from processing creations or redemptions. |
112 | GUGGENHEIM ETFs ANNUAL REPORT | SEE NOTES TO FINANCIAL STATEMENTS. |
GUGGENHEIM RUSSELL 1000® EQUAL WEIGHT ETF |
| FINANCIAL HIGHLIGHTS |
This table is presented to show selected data for a share outstanding throughout each period and to assist shareholders in evaluating the Fund's performance for the periods presented.
Year Ended October 31, 2014 | Year Ended October 31, 2013 | Year Ended October 31, 2012 | Period Ended October 31, 2011a | |||||||||||||
| Per Share Data: | ||||||||||||||||
| Net asset value, beginning of period | $ | 44.63 | $ | 33.92 | $ | 31.08 | $ | 30.18 | ||||||||
| Income from investment operations: | ||||||||||||||||
Net investment income (loss)b | 0.67 | 0.62 | 0.51 | 0.36 | ||||||||||||
| Net gain (loss) on investments (realized and unrealized) | 5.70 | 10.71 | 2.83 | 0.85 | ||||||||||||
| Total from investment operations | 6.37 | 11.33 | 3.34 | 1.21 | ||||||||||||
| Less distributions from: | ||||||||||||||||
| Net investment income | (0.66 | ) | (0.62 | ) | (0.50 | ) | (0.31 | ) | ||||||||
| Total distributions to shareholders | (0.66 | ) | (0.62 | ) | (0.50 | ) | (0.31 | ) | ||||||||
| Net asset value, end of period | $ | 50.34 | $ | 44.63 | $ | 33.92 | $ | 31.08 | ||||||||
Total Returnc | 14.33 | % | 33.71 | % | 10.83 | % | 4.00 | % | ||||||||
| Ratios/Supplemental Data: | ||||||||||||||||
| Net assets, end of period (in thousands) | $ | 93,137 | $ | 64,720 | $ | 39,011 | $ | 34,183 | ||||||||
| Ratio to average net assets of: | ||||||||||||||||
| Net investment income (loss) | 1.38 | % | 1.57 | % | 1.56 | % | 1.26 | %d | ||||||||
| Total expenses | 0.41 | % | 0.40 | % | 0.41 | % | 0.41 | %d | ||||||||
Portfolio turnover ratee | 27 | % | 27 | % | 27 | % | 25 | % | ||||||||
a | The Fund commenced operations on December 3, 2010. |
b | Based on average shares outstanding. |
c | Total investment return is calculated assuming an initial investment made at the net asset value at the beginning of the period, reinvestment of all dividends and distribution at net asset value during the period, and redemption on the last day of the period. Transaction fees are not reflected in the calculation of total investment return. |
d | Annualized. |
e | Portfolio turnover does not include securities received or delivered from processing creations or redemptions. |
| SEE NOTES TO FINANCIAL STATEMENTS. | GUGGENHEIM ETFs ANNUAL REPORT | 113 |
GUGGENHEIM RUSSELL 2000® EQUAL WEIGHT ETF |
| FINANCIAL HIGHLIGHTS |
This table is presented to show selected data for a share outstanding throughout each period and to assist shareholders in evaluating the Fund's performance for the periods presented.
Year Ended October 31, 2014 | Year Ended October 31, 2013 | Year Ended October 31, 2012 | Period Ended October 31, 2011a | |||||||||||||
| Per Share Data: | ||||||||||||||||
| Net asset value, beginning of period | $ | 42.89 | $ | 31.82 | $ | 29.48 | $ | 30.19 | ||||||||
| Income from investment operations: | ||||||||||||||||
Net investment income (loss)b | 0.43 | 0.54 | 0.34 | 0.22 | ||||||||||||
| Net gain (loss) on investments (realized and unrealized) | 1.97 | 11.12 | 2.33 | (0.75 | ) | |||||||||||
| Total from investment operations | 2.40 | 11.66 | 2.67 | (0.53 | ) | |||||||||||
| Less distributions from: | ||||||||||||||||
| Net investment income | (0.42 | ) | (0.59 | ) | (0.33 | ) | (0.18 | ) | ||||||||
| Total distributions to shareholders | (0.42 | ) | (0.59 | ) | (0.33 | ) | (0.18 | ) | ||||||||
| Net asset value, end of period | $ | 44.87 | $ | 42.89 | $ | 31.82 | $ | 29.48 | ||||||||
Total Returnc | 5.58 | % | 37.07 | % | 9.08 | % | (1.78 | %) | ||||||||
| Ratios/Supplemental Data: | ||||||||||||||||
| Net assets, end of period (in thousands) | $ | 40,380 | $ | 25,736 | $ | 14,318 | $ | 23,584 | ||||||||
| Ratio to average net assets of: | ||||||||||||||||
| Net investment income (loss) | 0.96 | % | 1.46 | % | 1.10 | % | 0.79 | %d | ||||||||
| Total expenses | 0.42 | % | 0.41 | % | 0.41 | % | 0.41 | %d | ||||||||
Portfolio turnover ratee | 43 | % | 42 | % | 43 | % | 38 | % | ||||||||
a | The Fund commenced operations on December 3, 2010. |
b | Based on average shares outstanding. |
c | Total investment return is calculated assuming an initial investment made at the net asset value at the beginning of the period, reinvestment of all dividends and distribution at net asset value during the period, and redemption on the last day of the period. Transaction fees are not reflected in the calculation of total investment return. |
d | Annualized. |
e | Portfolio turnover does not include securities received or delivered from processing creations or redemptions. |
114 | GUGGENHEIM ETFs ANNUAL REPORT | SEE NOTES TO FINANCIAL STATEMENTS. |
| GUGGENHEIM MSCI EMERGING MARKETS EQUAL WEIGHT ETF |
| FINANCIAL HIGHLIGHTS |
This table is presented to show selected data for a share outstanding throughout each period and to assist shareholders in evaluating the Fund's performance for the periods presented.
Year Ended October 31, 2014 | Year Ended October 31, 2013 | Year Ended October 31, 2012 | Period Ended October 31, 2011a | |||||||||||||
| Per Share Data: | ||||||||||||||||
| Net asset value, beginning of period | $ | 34.43 | $ | 33.31 | $ | 33.83 | $ | 40.21 | ||||||||
| Income from investment operations: | ||||||||||||||||
Net investment income (loss)b | 0.64 | 0.50 | 0.55 | 0.69 | ||||||||||||
| Net gain (loss) on investments (realized and unrealized) | (0.31 | ) | 1.06 | (0.53 | ) | (6.35 | ) | |||||||||
| Total from investment operations | 0.33 | 1.56 | 0.02 | (5.66 | ) | |||||||||||
| Less distributions from: | ||||||||||||||||
| Net investment income | (0.62 | ) | (0.44 | ) | (0.48 | ) | (0.36 | ) | ||||||||
| Return of capital | — | — | (0.06 | ) | (0.36 | ) | ||||||||||
| Total distributions to shareholders | (0.62 | ) | (0.44 | ) | (0.54 | ) | (0.72 | ) | ||||||||
| Net asset value, end of period | $ | 34.14 | $ | 34.43 | $ | 33.31 | $ | 33.83 | ||||||||
Total Returnc | 0.99 | % | 4.76 | % | 0.10 | % | (14.13 | %) | ||||||||
| Ratios/Supplemental Data: | ||||||||||||||||
| Net assets, end of period (in thousands) | $ | 13,654 | $ | 10,328 | $ | 13,325 | $ | 16,914 | ||||||||
| Ratio to average net assets of: | ||||||||||||||||
| Net investment income (loss) | 1.86 | % | 1.47 | % | 1.66 | % | 1.99 | % | ||||||||
| Total expenses | 0.70 | % | 0.71 | % | 0.72 | % | 0.71 | %d | ||||||||
Net expensese | 0.60 | % | 0.60 | % | 0.61 | % | 0.63 | %d | ||||||||
Portfolio turnover ratef | 25 | % | 38 | % | 39 | % | 63 | % | ||||||||
a | The Fund commenced operations on December 3, 2010. |
b | Based on average shares outstanding. |
c | Total investment return is calculated assuming an initial investment made at the net asset value at the beginning of the period, reinvestment of all dividends and distribution at net asset value during the period, and redemption on the last day of the period. Transaction fees are not reflected in the calculation of total investment return. |
d | Annualized. |
e | Net expense information reflects the expense ratios after expense waivers. |
f | Portfolio turnover does not include securities received or delivered from processing creations or redemptions. |
| SEE NOTES TO FINANCIAL STATEMENTS. | GUGGENHEIM ETFs ANNUAL REPORT | 115 |
GUGGENHEIM S&P 500® EQUAL WEIGHT CONSUMER DISCRETIONARY ETF |
| FINANCIAL HIGHLIGHTS |
This table is presented to show selected data for a share outstanding throughout each period and to assist shareholders in evaluating the Fund's performance for the periods presented.
Year Ended October 31, 2014 | Year Ended October 31, 2013 | Year Ended October 31, 2012 | Year Ended October 31, 2011 | Year Ended October 31, 2010 | ||||||||||||||||
| Per Share Data: | ||||||||||||||||||||
| Net asset value, beginning of period | $ | 76.06 | $ | 55.09 | $ | 47.70 | $ | 42.37 | $ | 32.78 | ||||||||||
| Income from investment operations: | ||||||||||||||||||||
Net investment income (loss)a | 0.95 | 0.79 | 0.64 | 0.56 | 0.35 | |||||||||||||||
| Net gain (loss) on investments (realized and unrealized) | 6.67 | 21.02 | 7.46 | 5.31 | 9.56 | |||||||||||||||
| Total from investment operations | 7.62 | 21.81 | 8.10 | 5.87 | 9.91 | |||||||||||||||
| Less distributions from: | ||||||||||||||||||||
| Net investment income | (0.92 | ) | (0.84 | ) | (0.71 | ) | (0.54 | ) | (0.32 | ) | ||||||||||
| Total distributions to shareholders | (0.92 | ) | (0.84 | ) | (0.71 | ) | (0.54 | ) | (0.32 | ) | ||||||||||
| Net asset value, end of period | $ | 82.76 | $ | 76.06 | $ | 55.09 | $ | 47.70 | $ | 42.37 | ||||||||||
Total Returnb | 10.07 | % | 39.91 | % | 17.05 | % | 13.91 | % | 30.35 | % | ||||||||||
| Ratios/Supplemental Data: | ||||||||||||||||||||
| Net assets, end of period (in thousands) | $ | 86,897 | $ | 125,497 | $ | 41,314 | $ | 21,467 | $ | 25,425 | ||||||||||
| Ratio to average net assets of: | ||||||||||||||||||||
| Net investment income (loss) | 1.20 | % | 1.19 | % | 1.22 | % | 1.20 | % | 0.89 | % | ||||||||||
| Total expenses | 0.40 | % | 0.50 | % | 0.50 | % | 0.50 | % | 0.50 | % | ||||||||||
Portfolio turnover ratec | 22 | % | 20 | % | 25 | % | 26 | % | 28 | % | ||||||||||
a | Based on average shares outstanding. |
b | Total investment return is calculated assuming an initial investment made at the net asset value at the beginning of the period, reinvestment of all dividends and distribution at net asset value during the period, and redemption on the last day of the period. Transaction fees are not reflected in the calculation of total investment return. |
c | Portfolio turnover does not include securities received or delivered from processing creations or redemptions. |
116 | GUGGENHEIM ETFs ANNUAL REPORT | SEE NOTES TO FINANCIAL STATEMENTS. |
GUGGENHEIM S&P 500® EQUAL WEIGHT CONSUMER STAPLES ETF |
| FINANCIAL HIGHLIGHTS |
This table is presented to show selected data for a share outstanding throughout each period and to assist shareholders in evaluating the Fund's performance for the periods presented.
Year Ended October 31, 2014 | Year Ended October 31, 2013 | Year Ended October 31, 2012 | Year Ended October 31, 2011 | Year Ended October 31, 2010 | ||||||||||||||||
| Per Share Data: | ||||||||||||||||||||
| Net asset value, beginning of period | $ | 88.48 | $ | 68.24 | $ | 61.01 | $ | 55.42 | $ | 48.42 | ||||||||||
| Income from investment operations: | ||||||||||||||||||||
Net investment income (loss)a | 2.04 | 1.73 | 1.41 | 1.31 | 1.14 | |||||||||||||||
| Net gain (loss) on investments (realized and unrealized) | 12.03 | 20.22 | 7.20 | 5.49 | 6.95 | |||||||||||||||
| Total from investment operations | 14.07 | 21.95 | 8.61 | 6.80 | 8.09 | |||||||||||||||
| Less distributions from: | ||||||||||||||||||||
| Net investment income | (1.80 | ) | (1.71 | ) | (1.38 | ) | (1.21 | ) | (1.09 | ) | ||||||||||
| Total distributions to shareholders | (1.80 | ) | (1.71 | ) | (1.38 | ) | (1.21 | ) | (1.09 | ) | ||||||||||
| Net asset value, end of period | $ | 100.75 | $ | 88.48 | $ | 68.24 | $ | 61.01 | $ | 55.42 | ||||||||||
Total Returnb | 16.04 | % | 32.59 | % | 14.19 | % | 12.37 | % | 16.89 | % | ||||||||||
| Ratios/Supplemental Data: | ||||||||||||||||||||
| Net assets, end of period (in thousands) | $ | 186,382 | $ | 84,054 | $ | 40,944 | $ | 30,507 | $ | 13,856 | ||||||||||
| Ratio to average net assets of: | ||||||||||||||||||||
| Net investment income (loss) | 2.18 | % | 2.15 | % | 2.14 | % | 2.20 | % | 2.20 | % | ||||||||||
| Total expenses | 0.40 | % | 0.50 | % | 0.50 | % | 0.50 | % | 0.50 | % | ||||||||||
Portfolio turnover ratec | 20 | % | 17 | % | 18 | % | 15 | % | 18 | % | ||||||||||
a | Based on average shares outstanding. |
b | Total investment return is calculated assuming an initial investment made at the net asset value at the beginning of the period, reinvestment of all dividends and distribution at net asset value during the period, and redemption on the last day of the period. Transaction fees are not reflected in the calculation of total investment return. |
c | Portfolio turnover does not include securities received or delivered from processing creations or redemptions. |
| SEE NOTES TO FINANCIAL STATEMENTS. | GUGGENHEIM ETFs ANNUAL REPORT | 117 |
GUGGENHEIM S&P 500® EQUAL WEIGHT ENERGY ETF |
| FINANCIAL HIGHLIGHTS |
This table is presented to show selected data for a share outstanding throughout each period and to assist shareholders in evaluating the Fund's performance for the periods presented.
Year Ended October 31, 2014 | Year Ended October 31, 2013 | Year Ended October 31, 2012 | Year Ended October 31, 2011 | Year Ended October 31, 2010 | ||||||||||||||||
| Per Share Data: | ||||||||||||||||||||
| Net asset value, beginning of period | $ | 79.86 | $ | 64.01 | $ | 64.16 | $ | 53.74 | $ | 47.69 | ||||||||||
| Income from investment operations: | ||||||||||||||||||||
Net investment income (loss)a | 1.40 | 0.78 | 0.55 | 0.36 | 0.44 | |||||||||||||||
| Net gain (loss) on investments (realized and unrealized) | (2.91 | ) | 15.87 | (0.19 | ) | 10.43 | 6.07 | |||||||||||||
| Total from investment operations | (1.51 | ) | 16.65 | 0.36 | 10.79 | 6.51 | ||||||||||||||
| Less distributions from: | ||||||||||||||||||||
| Net investment income | (1.19 | ) | (0.80 | ) | (0.51 | ) | (0.37 | ) | (0.46 | ) | ||||||||||
| Total distributions to shareholders | (1.19 | ) | (0.80 | ) | (0.51 | ) | (0.37 | ) | (0.46 | ) | ||||||||||
| Net asset value, end of period | $ | 77.16 | $ | 79.86 | $ | 64.01 | $ | 64.16 | $ | 53.74 | ||||||||||
Total Returnb | (2.02 | %) | 26.19 | % | 0.58 | % | 20.09 | % | 13.74 | % | ||||||||||
| Ratios/Supplemental Data: | ||||||||||||||||||||
| Net assets, end of period (in thousands) | $ | 100,307 | $ | 43,924 | $ | 32,004 | $ | 35,287 | $ | 16,122 | ||||||||||
| Ratio to average net assets of: | ||||||||||||||||||||
| Net investment income (loss) | 1.64 | % | 1.09 | % | 0.88 | % | 0.53 | % | 0.87 | % | ||||||||||
| Total expenses | 0.40 | % | 0.50 | % | 0.50 | % | 0.50 | % | 0.50 | % | ||||||||||
Portfolio turnover ratec | 25 | % | 17 | % | 30 | % | 23 | % | 31 | % | ||||||||||
a | Based on average shares outstanding. |
b | Total investment return is calculated assuming an initial investment made at the net asset value at the beginning of the period, reinvestment of all dividends and distribution at net asset value during the period, and redemption on the last day of the period. Transaction fees are not reflected in the calculation of total investment return. |
c | Portfolio turnover does not include securities received or delivered from processing creations or redemptions. |
118 | GUGGENHEIM ETFs ANNUAL REPORT | SEE NOTES TO FINANCIAL STATEMENTS. |
GUGGENHEIM S&P 500® EQUAL WEIGHT FINANCIALS ETF |
| FINANCIAL HIGHLIGHTS |
This table is presented to show selected data for a share outstanding throughout each period and to assist shareholders in evaluating the Fund's performance for the periods presented.
Year Ended October 31, 2014 | Year Ended October 31, 2013 | Year Ended October 31, 2012 | Year Ended October 31, 2011 | Year Ended October 31, 2010 | ||||||||||||||||
| Per Share Data: | ||||||||||||||||||||
| Net asset value, beginning of period | $ | 37.64 | $ | 28.68 | $ | 24.48 | $ | 25.40 | $ | 21.53 | ||||||||||
| Income from investment operations: | ||||||||||||||||||||
Net investment income (loss)a | 0.53 | 0.57 | 0.39 | 0.42 | 0.31 | |||||||||||||||
| Net gain (loss) on investments (realized and unrealized) | 5.76 | 9.08 | 4.32 | (0.96 | ) | 3.87 | ||||||||||||||
| Total from investment operations | 6.29 | 9.65 | 4.71 | (0.54 | ) | 4.18 | ||||||||||||||
| Less distributions from: | ||||||||||||||||||||
| Net investment income | (0.66 | ) | (0.58 | ) | (0.42 | ) | (0.38 | ) | (0.31 | ) | ||||||||||
| Return of capital | — | (0.11 | ) | (0.09 | ) | — | — | |||||||||||||
| Total distributions to shareholders | (0.66 | ) | (0.69 | ) | (0.51 | ) | (0.38 | ) | (0.31 | ) | ||||||||||
| Net asset value, end of period | $ | 43.27 | $ | 37.64 | $ | 28.68 | $ | 24.48 | $ | 25.40 | ||||||||||
Total Returnb | 16.84 | % | 34.05 | % | 19.32 | % | (2.25 | %) | 19.46 | % | ||||||||||
| Ratios/Supplemental Data: | ||||||||||||||||||||
| Net assets, end of period (in thousands) | $ | 136,316 | $ | 58,337 | $ | 14,339 | $ | 17,133 | $ | 16,510 | ||||||||||
| Ratio to average net assets of: | ||||||||||||||||||||
| Net investment income (loss) | 1.30 | % | 1.65 | % | 1.48 | % | 1.59 | % | 1.26 | % | ||||||||||
| Total expenses | 0.40 | % | 0.50 | % | 0.50 | % | 0.50 | % | 0.50 | % | ||||||||||
Portfolio turnover ratec | 19 | % | 14 | % | 17 | % | 18 | % | 19 | % | ||||||||||
a | Based on average shares outstanding. |
b | Total investment return is calculated assuming an initial investment made at the net asset value at the beginning of the period, reinvestment of all dividends and distribution at net asset value during the period, and redemption on the last day of the period. Transaction fees are not reflected in the calculation of total investment return. |
c | Portfolio turnover does not include securities received or delivered from processing creations or redemptions. |
| SEE NOTES TO FINANCIAL STATEMENTS. | GUGGENHEIM ETFs ANNUAL REPORT | 119 |
GUGGENHEIM S&P 500® EQUAL WEIGHT HEALTH CARE ETF |
| FINANCIAL HIGHLIGHTS |
This table is presented to show selected data for a share outstanding throughout each period and to assist shareholders in evaluating the Fund's performance for the periods presented.
Year Ended October 31, 2014 | Year Ended October 31, 2013 | Year Ended October 31, 2012 | Year Ended October 31, 2011 | Year Ended October 31, 2010 | ||||||||||||||||
| Per Share Data: | ||||||||||||||||||||
| Net asset value, beginning of period | $ | 104.50 | $ | 76.84 | $ | 66.49 | $ | 59.74 | $ | 50.56 | ||||||||||
| Income from investment operations: | ||||||||||||||||||||
Net investment income (loss)a | 0.66 | 0.55 | 0.47 | 0.32 | 0.20 | |||||||||||||||
| Net gain (loss) on investments (realized and unrealized) | 32.89 | 27.63 | 11.04 | 6.73 | 9.20 | |||||||||||||||
| Total from investment operations | 33.55 | 28.18 | 11.51 | 7.05 | 9.40 | |||||||||||||||
| Less distributions from: | ||||||||||||||||||||
| Net investment income | (0.61 | ) | (0.52 | ) | (1.16 | ) | (0.30 | ) | (0.22 | ) | ||||||||||
| Total distributions to shareholders | (0.61 | ) | (0.52 | ) | (1.16 | ) | (0.30 | ) | (0.22 | ) | ||||||||||
| Net asset value, end of period | $ | 137.44 | $ | 104.50 | $ | 76.84 | $ | 66.49 | $ | 59.74 | ||||||||||
Total Returnb | 32.20 | % | 36.81 | % | 17.39 | % | 11.80 | % | 18.64 | % | ||||||||||
| Ratios/Supplemental Data: | ||||||||||||||||||||
| Net assets, end of period (in thousands) | $ | 391,714 | $ | 130,627 | $ | 38,419 | $ | 53,196 | $ | 53,770 | ||||||||||
| Ratio to average net assets of: | ||||||||||||||||||||
| Net investment income (loss) | 0.55 | % | 0.60 | % | 0.65 | % | 0.47 | % | 0.35 | % | ||||||||||
| Total expenses | 0.40 | % | 0.50 | % | 0.50 | % | 0.50 | % | 0.50 | % | ||||||||||
Portfolio turnover ratec | 23 | % | 24 | % | 15 | % | 19 | % | 20 | % | ||||||||||
a | Based on average shares outstanding. |
b | Total investment return is calculated assuming an initial investment made at the net asset value at the beginning of the period, reinvestment of all dividends and distribution at net asset value during the period, and redemption on the last day of the period. Transaction fees are not reflected in the calculation of total investment return. |
c | Portfolio turnover does not include securities received or delivered from processing creations or redemptions. |
120 | GUGGENHEIM ETFs ANNUAL REPORT | SEE NOTES TO FINANCIAL STATEMENTS. |
GUGGENHEIM S&P 500® EQUAL WEIGHT INDUSTRIALS ETF |
| FINANCIAL HIGHLIGHTS |
This table is presented to show selected data for a share outstanding throughout each period and to assist shareholders in evaluating the Fund's performance for the periods presented.
Year Ended October 31, 2014 | Year Ended October 31, 2013 | Year Ended October 31, 2012 | Year Ended October 31, 2011 | Year Ended October 31, 2010 | ||||||||||||||||
| Per Share Data: | ||||||||||||||||||||
| Net asset value, beginning of period | $ | 76.33 | $ | 56.94 | $ | 51.50 | $ | 49.54 | $ | 39.76 | ||||||||||
| Income from investment operations: | ||||||||||||||||||||
Net investment income (loss)a | 1.22 | 0.95 | 1.05 | 0.83 | 0.61 | |||||||||||||||
| Net gain (loss) on investments (realized and unrealized) | 11.59 | 19.41 | 5.42 | 2.05 | 9.78 | |||||||||||||||
| Total from investment operations | 12.81 | 20.36 | 6.47 | 2.88 | 10.39 | |||||||||||||||
| Less distributions from: | ||||||||||||||||||||
| Net investment income | (0.96 | ) | (0.97 | ) | (1.03 | ) | (0.92 | ) | (0.61 | ) | ||||||||||
| Total distributions to shareholders | (0.96 | ) | (0.97 | ) | (1.03 | ) | (0.92 | ) | (0.61 | ) | ||||||||||
| Net asset value, end of period | $ | 88.18 | $ | 76.33 | $ | 56.94 | $ | 51.50 | $ | 49.54 | ||||||||||
Total Returnb | 16.85 | % | 36.10 | % | 12.64 | % | 5.80 | % | 26.28 | % | ||||||||||
| Ratios/Supplemental Data: | ||||||||||||||||||||
| Net assets, end of period (in thousands) | $ | 123,447 | $ | 57,251 | $ | 17,082 | $ | 15,450 | $ | 42,105 | ||||||||||
| Ratio to average net assets of: | ||||||||||||||||||||
| Net investment income (loss) | 1.47 | % | 1.41 | % | 1.90 | % | 1.52 | % | 1.34 | % | ||||||||||
| Total expenses | 0.40 | % | 0.50 | % | 0.50 | % | 0.50 | % | 0.50 | % | ||||||||||
Portfolio turnover ratec | 15 | % | 24 | % | 18 | % | 15 | % | 18 | % | ||||||||||
a | Based on average shares outstanding. |
b | Total investment return is calculated assuming an initial investment made at the net asset value at the beginning of the period, reinvestment of all dividends and distribution at net asset value during the period, and redemption on the last day of the period. Transaction fees are not reflected in the calculation of total investment return. |
c | Portfolio turnover does not include securities received or delivered from processing creations or redemptions. |
| SEE NOTES TO FINANCIAL STATEMENTS. | GUGGENHEIM ETFs ANNUAL REPORT | 121 |
GUGGENHEIM S&P 500® EQUAL WEIGHT MATERIALS ETF |
| FINANCIAL HIGHLIGHTS |
This table is presented to show selected data for a share outstanding throughout each period and to assist shareholders in evaluating the Fund's performance for the periods presented.
Year Ended October 31, 2014 | Year Ended October 31, 2013 | Year Ended October 31, 2012 | Year Ended October 31, 2011 | Year Ended October 31, 2010 | ||||||||||||||||
| Per Share Data: | ||||||||||||||||||||
| Net asset value, beginning of period | $ | 75.49 | $ | 60.71 | $ | 56.57 | $ | 57.32 | $ | 45.78 | ||||||||||
| Income from investment operations: | ||||||||||||||||||||
Net investment income (loss)a | 1.21 | 1.25 | 0.92 | 0.82 | 1.52 | |||||||||||||||
| Net gain (loss) on investments (realized and unrealized) | 6.85 | 14.73 | 4.14 | (0.76 | ) | 11.65 | ||||||||||||||
| Total from investment operations | 8.06 | 15.98 | 5.06 | 0.06 | 13.17 | |||||||||||||||
| Less distributions from: | ||||||||||||||||||||
| Net investment income | (1.17 | ) | (1.20 | ) | (0.92 | ) | (0.81 | ) | (1.63 | ) | ||||||||||
| Total distributions to shareholders | (1.17 | ) | (1.20 | ) | (0.92 | ) | (0.81 | ) | (1.63 | ) | ||||||||||
| Net asset value, end of period | $ | 82.38 | $ | 75.49 | $ | 60.71 | $ | 56.57 | $ | 57.32 | ||||||||||
Total Returnb | 10.68 | % | 26.59 | % | 8.99 | % | 0.04 | % | 29.05 | % | ||||||||||
| Ratios/Supplemental Data: | ||||||||||||||||||||
| Net assets, end of period (in thousands) | $ | 74,138 | $ | 49,069 | $ | 33,388 | $ | 36,771 | $ | 34,395 | ||||||||||
| Ratio to average net assets of: | ||||||||||||||||||||
| Net investment income (loss) | 1.48 | % | 1.84 | % | 1.55 | % | 1.33 | % | 2.88 | % | ||||||||||
| Total expenses | 0.40 | % | 0.50 | % | 0.50 | % | 0.50 | % | 0.50 | % | ||||||||||
Portfolio turnover ratec | 22 | % | 18 | % | 20 | % | 21 | % | 27 | % | ||||||||||
a | Based on average shares outstanding. |
b | Total investment return is calculated assuming an initial investment made at the net asset value at the beginning of the period, reinvestment of all dividends and distribution at net asset value during the period, and redemption on the last day of the period. Transaction fees are not reflected in the calculation of total investment return. |
c | Portfolio turnover does not include securities received or delivered from processing creations or redemptions. |
122 | GUGGENHEIM ETFs ANNUAL REPORT | SEE NOTES TO FINANCIAL STATEMENTS. |
GUGGENHEIM S&P 500® EQUAL WEIGHT TECHNOLOGY ETF |
| FINANCIAL HIGHLIGHTS |
This table is presented to show selected data for a share outstanding throughout each period and to assist shareholders in evaluating the Fund's performance for the periods presented.
Year Ended October 31, 2014 | Year Ended October 31, 2013 | Year Ended October 31, 2012 | Year Ended October 31, 2011 | Year Ended October 31, 2010 | ||||||||||||||||
| Per Share Data: | ||||||||||||||||||||
| Net asset value, beginning of period | $ | 70.98 | $ | 51.53 | $ | 52.23 | $ | 50.72 | $ | 39.98 | ||||||||||
| Income from investment operations: | ||||||||||||||||||||
Net investment income (loss)a | 0.78 | 0.68 | 0.41 | 0.29 | 0.12 | |||||||||||||||
| Net gain (loss) on investments (realized and unrealized) | 16.15 | 19.43 | (0.75 | ) | 1.49 | 10.75 | ||||||||||||||
| Total from investment operations | 16.93 | 20.11 | (0.34 | ) | 1.78 | 10.87 | ||||||||||||||
| Less distributions from: | ||||||||||||||||||||
| Net investment income | (0.74 | ) | (0.66 | ) | (0.36 | ) | (0.27 | ) | (0.13 | ) | ||||||||||
| Total distributions to shareholders | (0.74 | ) | (0.66 | ) | (0.36 | ) | (0.27 | ) | (0.13 | ) | ||||||||||
| Net asset value, end of period | $ | 87.17 | $ | 70.98 | $ | 51.53 | $ | 52.23 | $ | 50.72 | ||||||||||
Total Returnb | 23.92 | % | 39.23 | % | 0.71 | % | 3.51 | % | 27.23 | % | ||||||||||
| Ratios/Supplemental Data: | ||||||||||||||||||||
| Net assets, end of period (in thousands) | $ | 671,221 | $ | 273,275 | $ | 100,479 | $ | 109,685 | $ | 88,759 | ||||||||||
| Ratio to average net assets of: | ||||||||||||||||||||
| Net investment income (loss) | 0.97 | % | 1.07 | % | 0.76 | % | 0.54 | % | 0.26 | % | ||||||||||
| Total expenses | 0.40 | % | 0.50 | % | 0.50 | % | 0.50 | % | 0.50 | % | ||||||||||
Portfolio turnover ratec | 22 | % | 24 | % | 25 | % | 29 | % | 25 | % | ||||||||||
a | Based on average shares outstanding. |
b | Total investment return is calculated assuming an initial investment made at the net asset value at the beginning of the period, reinvestment of all dividends and distribution at net asset value during the period, and redemption on the last day of the period. Transaction fees are not reflected in the calculation of total investment return. |
c | Portfolio turnover does not include securities received or delivered from processing creations or redemptions. |
| SEE NOTES TO FINANCIAL STATEMENTS. | GUGGENHEIM ETFs ANNUAL REPORT | 123 |
GUGGENHEIM S&P 500® EQUAL WEIGHT UTILITIES ETF |
| FINANCIAL HIGHLIGHTS |
This table is presented to show selected data for a share outstanding throughout each period and to assist shareholders in evaluating the Fund's performance for the periods presented.
Year Ended October 31, 2014 | Year Ended October 31, 2013 | Year Ended October 31, 2012 | Year Ended October 31, 2011 | Year Ended October 31, 2010 | ||||||||||||||||
| Per Share Data: | ||||||||||||||||||||
| Net asset value, beginning of period | $ | 64.67 | $ | 60.52 | $ | 54.03 | $ | 50.27 | $ | 42.13 | ||||||||||
| Income from investment operations: | ||||||||||||||||||||
Net investment income (loss)a | 2.59 | 2.36 | 2.03 | 1.89 | 1.84 | |||||||||||||||
| Net gain (loss) on investments (realized and unrealized) | 11.75 | 4.11 | 6.45 | 3.71 | 8.13 | |||||||||||||||
| Total from investment operations | 14.34 | 6.47 | 8.48 | 5.60 | 9.97 | |||||||||||||||
| Less distributions from: | ||||||||||||||||||||
| Net investment income | (2.32 | ) | (2.32 | ) | (1.99 | ) | (1.84 | ) | (1.83 | ) | ||||||||||
| Total distributions to shareholders | (2.32 | ) | (2.32 | ) | (1.99 | ) | (1.84 | ) | (1.83 | ) | ||||||||||
| Net asset value, end of period | $ | 76.69 | $ | 64.67 | $ | 60.52 | $ | 54.03 | $ | 50.27 | ||||||||||
Total Returnb | 22.61 | % | 10.95 | % | 15.98 | % | 11.29 | % | 24.10 | % | ||||||||||
| Ratios/Supplemental Data: | ||||||||||||||||||||
| Net assets, end of period (in thousands) | $ | 141,875 | $ | 51,738 | $ | 42,364 | $ | 32,417 | $ | 20,110 | ||||||||||
| Ratio to average net assets of: | ||||||||||||||||||||
| Net investment income (loss) | 3.72 | % | 3.78 | % | 3.60 | % | 3.60 | % | 3.95 | % | ||||||||||
| Total expenses | 0.40 | % | 0.50 | % | 0.50 | % | 0.50 | % | 0.50 | % | ||||||||||
Portfolio turnover ratec | 31 | % | 22 | % | 22 | % | 15 | % | 16 | % | ||||||||||
a | Based on average shares outstanding. |
b | Total investment return is calculated assuming an initial investment made at the net asset value at the beginning of the period, reinvestment of all dividends and distribution at net asset value during the period, and redemption on the last day of the period. Transaction fees are not reflected in the calculation of total investment return. |
c | Portfolio turnover does not include securities received or delivered from processing creations or redemptions. |
124 | GUGGENHEIM ETFs ANNUAL REPORT | SEE NOTES TO FINANCIAL STATEMENTS. |
| NOTES TO FINANCIAL STATEMENTS |
1. Organization and Significant Accounting Policies
Organization
Rydex ETF Trust (the "Trust") is registered with the SEC under the Investment Company Act of 1940 (the "1940 Act") as a non-diversified, open-ended investment company of the series type, and is authorized to issue an unlimited number of no par value shares. Each portfolio represents a separate series of beneficial interest in the Trust (each a "Fund", and collectively, the "Funds"). The Trust was organized as a Delaware statutory trust on November 22, 2002. At October 31, 2014, the Trust consisted of twenty-one Funds.
The financial statements herein relate to the following Funds, whose investment objective is to replicate as closely as possible, before fees and expenses, the daily performance of an index representing publicly traded equity securities (the "Underlying Index") as follows:
| Fund | Underlying Index |
Guggenheim Russell MidCap® Equal Weight ETF | Russell MidCap® Equal Weight Index |
Guggenheim Russell 1000® Equal Weight ETF | Russell 1000® Equal Weight Index |
Guggenheim Russell 2000® Equal Weight ETF | Russell 2000® Equal Weight Index |
| Guggenheim MSCI Emerging Markets Equal Weight ETF | MSCI Emerging Markets Equal Weighted Index |
Guggenheim S&P 500® Equal Weight Consumer Discretionary ETF | S&P 500® Equal Weight Index Consumer Discretionary |
Guggenheim S&P 500® Equal Weight Consumer Staples ETF | S&P 500® Equal Weight Index Consumer Staples |
Guggenheim S&P 500® Equal Weight Energy ETF | S&P 500® Equal Weight Index Energy |
Guggenheim S&P 500® Equal Weight Financials ETF | S&P 500® Equal Weight Index Financials |
Guggenheim S&P 500® Equal Weight Health Care ETF | S&P 500® Equal Weight Index Health Care |
Guggenheim S&P 500® Equal Weight Industrials ETF | S&P 500® Equal Weight Index Industrials |
Guggenheim S&P 500® Equal Weight Materials ETF | S&P 500® Equal Weight Index Materials |
Guggenheim S&P 500® Equal Weight Technology ETF | S&P 500® Equal Weight Index Information Technology |
Guggenheim S&P 500® Equal Weight Utilities ETF | S&P 500® Equal Weight Index Telecommunication Service and Utilities |
The Funds seek to achieve their objective by investing in common stocks or ETFs, where applicable, that comprise the Underlying Index. The Funds use a "replication" strategy to track the Underlying Index. Replication refers to investing in substantially all of the securities in the Underlying Index in approximately the same proportions as in the Underlying Index.
The Funds operate as index funds and are not actively managed. Adverse performance of a security in the Funds' portfolio will ordinarily not result in the elimination of the security from the Funds' portfolio.
The Funds issue and redeem shares on a continuous basis, at net asset value per share ("NAV"), only in aggregation of 50,000 shares (a "Creation Unit"). Creation Units are issued and redeemed principally in-kind for securities included in the Underlying Index.
The Funds invest in various investments which are exposed to risk, such as market risk. Due to the level of risk associated with certain investments it is at least reasonably possible that changes in the values of investment securities will occur in the near term and that such changes could materially affect amounts reported in the financial statements. The Guggenheim S&P 500® Equal Weight Sector ETFs are non-diversified funds, subjecting them to a greater risk than funds that are diversified.
Guggenheim Investments ("GI") provides advisory services and Rydex Fund Services, LLC ("RFS") provides administrative services to the Trust. Guggenheim Funds Distributors, LLC ("GFD") acts as principal underwriter for the Trust. GI, RFS and GFD are affiliated entities.
Significant Accounting Policies
The following significant accounting policies are in conformity with U.S. generally accepted accounting principles ("U.S. GAAP") and are consistently followed by the Trust. This requires management to make estimates and assumptions that affect the reported amount of assets and liabilities and disclosure of contingent assets and liabilities at the date of the financial statements and the reported amounts of revenues and expenses during the reporting period. Actual results could differ from these estimates. All time references are based on Eastern Time.
A. The Board of Trustees of the Funds (the "Board") has adopted policies and procedures for the valuation of the Funds' investments (the "Valuation Procedures"). Pursuant to the Valuation Procedures, the Board has delegated to a valuation committee, consisting of representatives from Guggenheim's investment management, fund administration, legal and compliance departments (the "Valuation Committee"), the day-to-day responsibility for implementing the Valuation Procedures, including, under most circumstances, the responsibility for determining the fair value of the Funds' securities or other assets.
| GUGGENHEIM ETFs ANNUAL REPORT | 125 |
NOTES TO FINANCIAL STATEMENTS (continued) |
Valuations of the Funds' securities are supplied primarily by pricing services appointed pursuant to the processes set forth in the Valuation Procedures. The Valuation Committee convenes monthly, or more frequently as needed and will review the valuation of all assets which have been fair valued for reasonableness. The Funds' officers, through the Valuation Committee and consistent with the monitoring and review responsibilities set forth in the Valuation Procedures, regularly review procedures used by, and valuations provided by, the pricing services.
If the pricing service cannot or does not provide a valuation for a particular investment or such valuation is deemed unreliable, such investment is fair valued by the Valuation Committee.
Equity securities listed on an exchange (New York Stock Exchange ("NYSE") or American Stock Exchange) are valued at the last quoted sales price as of the close of business on the NYSE, usually 4:00 p.m. on the valuation date. Equity securities listed on the NASDAQ market system are valued at the NASDAQ Official Closing Price on the valuation date, which may not necessarily represent the last sale price. If there has been no sale on such exchange or NASDAQ on a given day, the security is valued at the closing bid price on that day. The Funds invest in money market mutual funds, which are valued at their NAV.
Generally, trading in foreign securities markets is substantially completed each day at various times prior to the close of the NYSE. The values of foreign securities are determined as of the close of such foreign markets or the close of the NYSE, if earlier. All investments quoted in foreign currency are valued in U.S. dollars on the basis of the foreign currency exchange rates prevailing at the close of business. Investments in foreign securities may involve risks not present in domestic investments. The Valuation Committee will determine the current value of such foreign securities by taking into consideration certain factors which may include those discussed above, as well as the following factors, among others: the value of the securities traded on other foreign markets, ADR trading, closed-end fund trading, foreign currency exchange activity, and the trading prices of financial products that are tied to foreign securities such as World Equity Benchmark Shares. In addition, the Board of Trustees has authorized the Valuation Committee and GI to use prices and other information supplied by a third party pricing vendor in valuing foreign securities.
Short-term debt securities with a maturity of 60 days or less at acquisition and repurchase agreements are valued at amortized cost, provided that amortized cost approximates fair value.
B. Investment securities and other assets and liabilities denominated in foreign currencies are translated into U.S. dollar amounts at the date of valuation. Purchases and sales of investment securities and income and expense items denominated in foreign currencies are translated into U.S. dollar amounts on the respective dates of such transactions. The Trust does not isolate that portion of the results of operations resulting from changes in foreign exchange rates on investments from the fluctuations arising from changes in market prices of securities held. Such fluctuations are included with the net realized and unrealized gain and loss from investments.
Reported net realized foreign exchange gains or losses arise from sales of foreign currencies and currency gains or losses realized between the trade and settlement dates on investment transactions. Net unrealized exchange gains and losses arise from changes in the fair values of assets and liabilities other than investments insecurities at the fiscal period end, resulting from changes in exchange rates.
C. Security transactions are recorded on the trade date for financial reporting purposes. Realized gains and losses from securities transactions are recorded using the identified cost basis. Proceeds from lawsuits related to investment holdings are recorded as realized gains in the respective Fund. Dividend income is recorded on the ex-dividend date, net of applicable taxes withheld by foreign countries. Taxable non-cash dividends are recorded as dividend income. Interest income, including amortization of premiums and accretion of discounts, is accrued on a daily basis. Dividend income from REITs is recorded based on the income included in the distributions received from the REIT investments using published REIT classifications, including some management estimates when actual amounts are not available. Distributions received in excess of this estimated amount are recorded as a reduction of the cost of investments or reclassified to capital gains. The actual amounts of income, return of capital, and capital gains are only determined by each REIT after its fiscal year-end, and may differ from the estimated amounts.
126 | GUGGENHEIM ETFs ANNUAL REPORT |
NOTES TO FINANCIAL STATEMENTS (continued) |
D. Distributions of net investment income and net realized gains, if any, are declared and paid at least annually. Distributions are recorded on the ex-dividend date and are determined in accordance with income tax regulations which may differ from U.S. GAAP.
E. The Funds may leave cash overnight in their cash account with the custodian. Periodically, a Fund may have cash due to the custodian bank as an overdraft balance. A fee is incurred on this overdraft, calculated by multiplying the overdraft by a rate based on the federal funds rate.
F. The Funds may enter into repurchase agreements with financial institutions. In a repurchase agreement, a Fund buys a security and the seller simultaneously agrees to repurchase the security on a specified future date at an agreed-upon price. The repurchase price reflects an agreed-upon interest rate during the time the Fund's money is invested in the security. Because the security constitutes collateral for the repurchase obligation, a repurchase agreement can be considered a collateralized loan. The Funds follow certain procedures designed to minimize the risks inherent in such agreements. These procedures include effecting repurchase transactions only with large, well-capitalized and well-established financial institutions whose condition will be continually monitored by GI. In addition, the value of the collateral underlying the repurchase agreement will always be at least equal to the repurchase price, including any accrued interest earned on the repurchase agreement. In the event of a default or bankruptcy by a selling financial institution, the Funds will seek to liquidate such collateral. However, the exercising of the Funds right to liquidate such collateral could involve certain costs or delays and, to the extent that proceeds from any sale upon a default of the obligation to repurchase were less than the repurchase price, the Funds could suffer a loss. It is the current policy of the Funds not to invest in repurchase agreements that do not mature within seven days if any such investment, together with any other illiquid assets held by the Funds, amounts to more than 15% of a Funds net assets. The investments of the Funds in repurchase agreements, at times, may be substantial when, in the view of GI, liquidity or other considerations so warrant.
G. Under the Funds' organizational documents, its Trustees and Officers are indemnified against certain liabilities arising out of the performance of their duties to the Trust. In addition, throughout the normal course of business, the Funds enter into contracts that contain a variety of representations and warranties which provide general indemnifications. The Funds' maximum exposure under these arrangements is unknown, as this would involve future claims that may be made against the Funds and/or their affiliates that have not yet occurred. However, based on experience, the Funds expect the risk of loss to be remote.
2. Capital
There is a minimum transaction fee per transaction to those persons purchasing or redeeming Creation Units. An additional charge of up to three times the standard transaction fee may be imposed for purchases and redemptions effected outside the National Securities Clearing Corporation usual clearing process or for cash. Such transactions are generally permitted on an in-kind basis, with a balancing cash component to equate the transaction to the NAV of the Fund on the transaction date. Transaction fees are not charged to or paid by the Funds. The minimum transaction fees are:
| Fund | Minimum Transaction Fee |
Guggenheim Russell MidCap® Equal Weight ETF | $2,000 |
Guggenheim Russell 1000® Equal Weight ETF | 2,500 |
Guggenheim Russell 2000® Equal Weight ETF | 3,000 |
| Guggenheim MSCI Emerging Markets Equal Weight ETF | 6,000 |
Guggenheim S&P 500® Equal Weight Consumer Discretionary ETF | 750 |
Guggenheim S&P 500® Equal Weight Consumer Staples ETF | 500 |
Guggenheim S&P 500® Equal Weight Energy ETF | 500 |
Guggenheim S&P 500® Equal Weight Financials ETF | 750 |
Guggenheim S&P 500® Equal Weight Health Care ETF | 500 |
Guggenheim S&P 500® Equal Weight Industrials ETF | 500 |
Guggenheim S&P 500® Equal Weight Materials ETF | 500 |
Guggenheim S&P 500® Equal Weight Technology ETF | 750 |
Guggenheim S&P 500® Equal Weight Utilities ETF | 500 |
3. Fees and Other Transactions with Affiliates
GI determines the composition of the portfolio of securities that must be delivered in exchange for the issuance of Creation Units and periodically adjusts the composition of the portfolio of the Funds to conform to changes in the composition of the relevant index. For
| GUGGENHEIM ETFs ANNUAL REPORT | 127 |
NOTES TO FINANCIAL STATEMENTS (continued) |
these services, GI receives a management fee at the annual rate shown below as a percentage of the average daily net assets of the Funds.
| Fund | Advisory Fee |
Guggenheim Russell MidCap® Equal Weight ETF | 0.40% |
Guggenheim Russell 1000® Equal Weight ETF | 0.40% |
Guggenheim Russell 2000® Equal Weight ETF | 0.40% |
| Guggenheim MSCI Emerging Markets Equal Weight ETF | 0.70% |
Guggenheim S&P 500® Equal Weight Consumer Discretionary ETF* | 0.40% |
Guggenheim S&P 500® Equal Weight Consumer Staples ETF* | 0.40% |
Guggenheim S&P 500® Equal Weight Energy ETF* | 0.40% |
Guggenheim S&P 500® Equal Weight Financials ETF* | 0.40% |
Guggenheim S&P 500® Equal Weight Health Care ETF* | 0.40% |
Guggenheim S&P 500® Equal Weight Industrials ETF* | 0.40% |
Guggenheim S&P 500® Equal Weight Materials ETF* | 0.40% |
Guggenheim S&P 500® Equal Weight Technology ETF* | 0.40% |
Guggenheim S&P 500® Equal Weight Utilities ETF* | 0.40% |
| * | Effective December 1, 2013, the advisory fee has been reduced to an annual percentage rate of 0.40% of the average daily net assets of the Fund. Prior to December 1, 2013, the annual percentage rate was 0.50% of the average daily net assets of the Fund. |
GI pays all expenses of the Funds, including the cost of transfer agency, custody, fund administration, fund accounting, legal, audit and other services, except: interest, taxes, distribution fees or expenses, trustee fees (where applicable) and extraordinary expenses.
Under a Fund Administration Agreement with the Trust, RFS provides various administrative and financial reporting services for the Funds. GI compensates RFS directly for this service.
Under a Fund Accounting Agreement with the Trust, BNYMellon maintains the books and records of the Funds. Under a Custodian Agreement with the Trust, BNYMellon maintains cash, securities and other assets of the Funds in a separate account for the Funds, keeps all necessary accounts and records, and provides other services. BNYMellon is required, upon the order of the Trust, to deliver securities held by the custodian and to make payments for securities purchased by the Trust for the Funds. Pursuant to a Transfer Agency and Service Agreement with the Trust, BNYMellon acts as a transfer agent for the Trust's authorized and issued shares of beneficial interest, and as dividend disbursing agent of the Trust. GI compensates BNYMellon directly for the foregoing services.
For the Guggenheim MCSI Emerging Markets Equal Weight ETF, the Adviser has contractually agreed to reduce fees and/or reimburse expenses to the extent necessary to keep the Fund's net operating expenses (excluding interest, taxes, brokerage commissions, dividends on securities sold short, distribution fees and expenses, and extraordinary expenses ("Excluded Expenses")) plus Acquired Fund Fees and Expense borne indirectly from exceeding 0.70% of the Fund's average daily net assets until February 28, 2015. This agreement may be terminated only with the approval of the Fund's Board of Trustees. In any event, this undertaking will continue until at least February 28, 2015.
The Funds have adopted a Distribution Plan (the "Plan") that allows the Funds to pay distribution fees to GFD and other firms that provide distribution services ("Service Providers"). If a Service Provider provides distribution services, the Funds will pay distribution fees to GFD at an annual rate not to exceed 0.25% of average daily net assets, pursuant to Rule 12b-1 of the 1940 Act. GFD will, in turn, pay the Service Provider out of its fees. No such fee is currently charged to the Funds.
Certain trustees and officers of the Trust are also officers of GI, RFS and GFD.
4. Fair Value Measurement
In accordance with U.S. GAAP, fair value is defined as the price that the Funds would receive to sell an investment or pay to transfer a liability in an orderly transaction with an independent buyer in the principal market, or in the absence of a principal market, the most advantageous market for the investment or liability. U.S. GAAP establishes a three-tier fair value hierarchy based on the types of inputs used to value assets and liabilities and requires corresponding disclosure. The hierarchy and the corresponding inputs are summarized below:
| Level 1 — | quoted prices in active markets for identical assets or liabilities. |
| Level 2 — | significant other observable inputs (for example quoted prices for securities that are similar based on characteristics such as interest rates, prepayment speeds, credit risk, etc.). |
| Level 3 — | significant unobservable inputs based on the best information available under the circumstances, to the extent observable inputs are not available, which may include assumptions. |
128 | GUGGENHEIM ETFs ANNUAL REPORT |
NOTES TO FINANCIAL STATEMENTS (continued) |
The types of inputs available depend on a variety of factors, such as the type of security and the characteristics of the markets in which it trades, if any. Fair valuation determinations that rely on fewer or no observable inputs require greater judgment. Accordingly, fair value determinations for Level 3 securities require the greatest amount of judgment.
The following table summarizes the inputs used to value the Funds' net assets at October 31, 2014:
| Fund | Level 1 Investments In Securities | Level 2 Investments In Securities | Level 3 Investments In Securities | Total | ||||||||||||
Guggenheim Russell MidCap® Equal Weight ETF | $ | 146,072,679 | $ | 4,843,547 | $ | — | $ | 150,916,226 | ||||||||
Guggenheim Russell 1000® Equal Weight ETF | 93,087,244 | 2,546,229 | — | 95,633,473 | ||||||||||||
Guggenheim Russell 2000® Equal Weight ETF | 40,357,568 | 2,280,081 | — | 42,637,649 | ||||||||||||
| Guggenheim MSCI Emerging Markets Equal Weight ETF | 13,585,850 | 1,871,326 | — | 15,457,176 | ||||||||||||
Guggenheim S&P 500® Equal Weight Consumer Discretionary ETF | 86,880,873 | 3,880,267 | — | 90,761,140 | ||||||||||||
Guggenheim S&P 500® Equal Weight Consumer Staples ETF | 186,284,412 | — | — | 186,284,412 | ||||||||||||
Guggenheim S&P 500® Equal Weight Energy ETF | 100,183,093 | 7,069,723 | — | 107,252,816 | ||||||||||||
Guggenheim S&P 500® Equal Weight Financials ETF | 136,279,165 | — | — | 136,279,165 | ||||||||||||
Guggenheim S&P 500® Equal Weight Health Care ETF | 393,297,127 | — | — | 393,297,127 | ||||||||||||
Guggenheim S&P 500® Equal Weight Industrials ETF | 123,339,272 | — | — | 123,339,272 | ||||||||||||
Guggenheim S&P 500® Equal Weight Materials ETF | 74,113,392 | — | — | 74,113,392 | ||||||||||||
Guggenheim S&P 500® Equal Weight Technology ETF | 671,088,290 | 18,261,339 | — | 689,349,629 | ||||||||||||
Guggenheim S&P 500® Equal Weight Utilities ETF | 141,685,122 | 5,693,289 | — | 147,378,411 | ||||||||||||
For the year ended October 31, 2014, there were no transfers between levels.
5. Portfolio Securities Loaned
The Funds may lend their securities to approved brokers to earn additional income. Security lending income shown on the Statements of Operations is shown net of rebates paid to the borrowers and earnings on cash collateral investments shared with the lending agent. Within this arrangement, the Funds act as the lender, Credit Suisse acts as the lending agent, and other approved registered broker dealers act as the borrowers. The Funds receive cash collateral, valued at 102% of the value of the securities on loan. Under the terms of the Funds' securities lending agreement with Credit Suisse, cash collateral is invested in one or more joint repurchase agreements collateralized by obligations of the U.S. Treasury or Government Agencies and cash. The Funds bear the risk of loss on cash collateral investments. Collateral is maintained over the life of the loan in an amount not less than the value of loaned securities, as determined at the close of fund business each day; any additional collateral required due to changes in security values is delivered to the Funds the next business day. Although the collateral mitigates the risk, the Funds could experience a delay in recovering its securities and a possible loss of income or value if the borrower fails to return the securities. The Funds have the right under the securities lending agreement to recover the securities from the borrower on demand.
At October 31, 2014, the Funds participated in securities lending as follows:
| Fund | Value of Securities Loaned | Cash Collateral Received | ||||||
Guggenheim Russell MidCap® Equal Weight ETF | $ | 4,820,550 | $ | 4,843,557 | ||||
Guggenheim Russell 1000® Equal Weight ETF | 2,518,493 | 2,546,235 | ||||||
Guggenheim Russell 2000® Equal Weight ETF | 2,141,567 | 2,271,513 | ||||||
| Guggenheim MSCI Emerging Markets Equal Weight ETF | 1,764,819 | 1,791,550 | ||||||
Guggenheim S&P 500® Equal Weight Consumer Discretionary ETF | 3,828,402 | 3,880,275 | ||||||
Guggenheim S&P 500® Equal Weight Energy ETF | 6,877,073 | 7,069,736 | ||||||
Guggenheim S&P 500® Equal Weight Technology ETF | 18,326,670 | 18,261,375 | ||||||
Guggenheim S&P 500® Equal Weight Utilities ETF | 5,530,514 | 5,693,300 | ||||||
| GUGGENHEIM ETFs ANNUAL REPORT | 129 |
NOTES TO FINANCIAL STATEMENTS (continued) |
Cash collateral received was invested in the following joint repurchase agreements at October 31, 2014:
Counterparty and Terms of Agreement | Face Value | Repurchase Price | Collateral | Par Value | Fair Value | |
| HSBC Securities, Inc. | Freddie Mac Strips | |||||
| 0.08% | 0.00% | |||||
| Due 11/03/14 | $29,183,118 | $29,183,183 | 01/15/15 - 07/15/32 | $31,080,634 | $19,742,961 | |
| Fannie Mae Strips | ||||||
| 0.00% | ||||||
| 11/15/14 - 01/15/37 | 12,930,695 | 10,032,054 | ||||
| BNP Paribas Securities Corp. | U.S. TIP Bonds | |||||
| 0.11% | 1.38% - 2.50% | |||||
| Due 11/03/14 | 13,348,334 | 13,348,373 | 01/15/29 - 02/15/44 | 7,379,723 | 9,776,641 | |
| U.S. Treasury Note | ||||||
| 2.13% | ||||||
| 01/31/21 | 3,776,125 | 3,842,209 | ||||
| Barclays Capital, Inc. | U.S. Treasury Bill | |||||
| 0.07% | 0.00% | |||||
| Due 11/03/14 | 3,825,998 | 3,826,006 | 01/15/15 - 02/26/15 | 3,903,909 | 3,903,543 |
There was also $92 in segregated cash held as collateral.
In the event of counterparty default, the Funds have the right to collect the collateral to offset losses incurred. There is potential loss to the Funds in the event the Funds are delayed or prevented from exercising their rights to dispose of the collateral securities, including the risk of a possible decline in the value of the underlying securities during the period while the Funds seek to assert their rights. The Funds' investment adviser, acting under the supervision of the Board of Trustees, reviews the value of the collateral and the creditworthiness of those banks and dealers with which the Funds enter into repurchase agreements to evaluate potential risks.
6. Federal Income Tax Information
The Funds intend to comply with the provisions of Subchapter M of the Internal Revenue Code applicable to regulated investment companies and will distribute substantially all taxable net investment income and capital gains sufficient to relieve the Funds from all, or substantially all, federal income, excise and state income taxes. Therefore, no provision for federal or state income tax is required.
Tax positions taken or expected to be taken in the course of preparing the Funds' tax returns are evaluated to determine whether the tax positions are "more-likely-than-not" of being sustained by the applicable tax authority. Tax positions not deemed to meet the more-likely-than-not threshold would be recorded as a tax benefit or expense in the current year. Management has analyzed the Funds' tax positions taken, or to be taken, on Federal income tax returns for all open tax years, and has concluded that no provision for income tax is required in the Funds' financial statements. The Funds' federal tax returns are subject to examination by the Internal Revenue Service for a period of three fiscal years after they are filed.
Income and capital gain distributions are determined in accordance with Federal income tax regulations, which may differ from U.S. GAAP. These differences are primarily due to differing treatments for in-kind redemptions, income reclassifications from REITs and losses deferred due to wash sales.
130 | GUGGENHEIM ETFs ANNUAL REPORT |
NOTES TO FINANCIAL STATEMENTS (continued) |
The tax character of distributions paid during the year ended October 31, 2014 was as follows:
| Fund | Ordinary Income | Return of Capital | Long-Term Capital Gain | Total Distributions | ||||||||||||
Guggenheim Russell MidCap® Equal Weight ETF | $ | 2,091,687 | $ | — | $ | 63,441 | $ | 2,155,128 | ||||||||
Guggenheim Russell 1000® Equal Weight ETF | 1,246,900 | — | — | 1,246,900 | ||||||||||||
Guggenheim Russell 2000® Equal Weight ETF | 344,321 | — | — | 344,321 | ||||||||||||
| Guggenheim MSCI Emerging Markets Equal Weight ETF | 231,261 | — | — | 231,261 | ||||||||||||
Guggenheim S&P 500® Equal Weight Consumer Discretionary ETF | 1,282,123 | — | — | 1,282,123 | ||||||||||||
Guggenheim S&P 500® Equal Weight Consumer Staples ETF | 2,571,891 | — | — | 2,571,891 | ||||||||||||
Guggenheim S&P 500® Equal Weight Energy ETF | 2,499,607 | — | — | 2,499,607 | ||||||||||||
Guggenheim S&P 500® Equal Weight Financials ETF | 1,579,128 | — | — | 1,579,128 | ||||||||||||
Guggenheim S&P 500® Equal Weight Health Care ETF | 1,057,835 | — | — | 1,057,835 | ||||||||||||
Guggenheim S&P 500® Equal Weight Industrials ETF | 1,179,408 | — | — | 1,179,408 | ||||||||||||
Guggenheim S&P 500® Equal Weight Materials ETF | 1,078,681 | — | — | 1,078,681 | ||||||||||||
Guggenheim S&P 500® Equal Weight Technology ETF | 4,572,706 | — | — | 4,572,706 | ||||||||||||
Guggenheim S&P 500® Equal Weight Utilities ETF | 3,002,830 | — | — | 3,002,830 | ||||||||||||
The tax character of distributions paid during the year ended October 31, 2013 was as follows:
| Fund | Ordinary Income | Return of Capital | Long-Term Capital Gain | Total Distributions | ||||||||||||
Guggenheim Russell MidCap® Equal Weight ETF | $ | 872,275 | $ | — | $ | — | $ | 872,275 | ||||||||
Guggenheim Russell 1000® Equal Weight ETF | 825,605 | — | — | 825,605 | ||||||||||||
Guggenheim Russell 2000® Equal Weight ETF | 245,833 | — | — | 245,833 | ||||||||||||
| Guggenheim MSCI Emerging Markets Equal Weight ETF | 142,210 | — | — | 142,210 | ||||||||||||
Guggenheim S&P 500® Equal Weight Consumer Discretionary ETF | 700,441 | — | — | 700,441 | ||||||||||||
Guggenheim S&P 500® Equal Weight Consumer Staples ETF | 1,309,633 | — | — | 1,309,633 | ||||||||||||
Guggenheim S&P 500® Equal Weight Energy ETF | 380,123 | — | — | 380,123 | ||||||||||||
Guggenheim S&P 500® Equal Weight Financials ETF | 576,182 | 112,188 | — | 688,370 | ||||||||||||
Guggenheim S&P 500® Equal Weight Health Care ETF | 639,369 | — | — | 639,369 | ||||||||||||
Guggenheim S&P 500® Equal Weight Industrials ETF | 482,387 | — | — | 482,387 | ||||||||||||
Guggenheim S&P 500® Equal Weight Materials ETF | 628,784 | — | — | 628,784 | ||||||||||||
Guggenheim S&P 500® Equal Weight Technology ETF | 1,498,370 | — | — | 1,498,370 | ||||||||||||
Guggenheim S&P 500® Equal Weight Utilities ETF | 1,695,499 | — | — | 1,695,499 | ||||||||||||
| GUGGENHEIM ETFs ANNUAL REPORT | 131 |
NOTES TO FINANCIAL STATEMENTS (continued) |
The tax character of distributable earnings/(accumulated losses) at October 31, 2014 was as follows:
| Fund | Undistributed Ordinary Income | Undistributed Long-Term Capital Gain | Capital Loss Carryforward | Net Unrealized Appreciation/ (Depreciation) | Total Accumulated Earnings/(Deficit) | |||||||||||||||
Guggenheim Russell MidCap® Equal Weight ETF | $ | — | $ | — | $ | (807,355 | ) | $ | 22,161,278 | $ | 21,353,923 | |||||||||
Guggenheim Russell 1000® Equal Weight ETF | 19,357 | — | (671,540 | ) | 10,093,390 | 9,441,207 | ||||||||||||||
Guggenheim Russell 2000® Equal Weight ETF | — | — | (1,386,582 | ) | 4,009,013 | 2,622,431 | ||||||||||||||
| Guggenheim MSCI Emerging Markets Equal Weight ETF | 38,982 | — | (2,640,760 | ) | (396,247 | ) | (2,998,025 | ) | ||||||||||||
Guggenheim S&P 500® Equal Weight Consumer Discretionary ETF | 28,390 | — | (3,327,596 | ) | 4,676,406 | 1,377,200 | ||||||||||||||
Guggenheim S&P 500® Equal Weight Consumer Staples ETF | 305,571 | — | (2,121,308 | ) | 12,335,238 | 10,519,501 | ||||||||||||||
Guggenheim S&P 500® Equal Weight Energy ETF | 110,631 | — | (8,172,023 | ) | (19,991,603 | ) | (28,052,995 | ) | ||||||||||||
Guggenheim S&P 500® Equal Weight Financials ETF | — | — | (6,160,071 | ) | 8,246,221 | 2,086,150 | ||||||||||||||
Guggenheim S&P 500® Equal Weight Health Care ETF | 232,378 | — | (265,349 | ) | 53,548,642 | 53,515,671 | ||||||||||||||
Guggenheim S&P 500® Equal Weight Industrials ETF | 276,845 | — | (1,769,277 | ) | 8,850,885 | 7,358,453 | ||||||||||||||
Guggenheim S&P 500® Equal Weight Materials ETF | 71,167 | — | (2,499,174 | ) | (782,167 | ) | (3,210,174 | ) | ||||||||||||
Guggenheim S&P 500® Equal Weight Technology ETF | 117,510 | — | (6,798,795 | ) | 72,770,872 | 66,089,587 | ||||||||||||||
Guggenheim S&P 500® Equal Weight Utilities ETF | 199,574 | — | (437,826 | ) | 6,615,222 | 6,376,970 | ||||||||||||||
For Federal income tax purposes, capital loss carryforwards represent realized losses of the Funds that may be carried forward and applied against future capital gains. For taxable years beginning on or before December 22, 2010, such capital losses may be carried forward for a maximum of eight years. Under the RIC Modernization Act of 2010, the Funds are permitted to carry forward capital losses incurred in taxable years beginning after December 22, 2010 for an unlimited period. However, any losses incurred during those taxable years must be utilized prior to the losses incurred in pre-enactment taxable years. As a result of this ordering rule, pre-enactment capital loss carryforwards may be more likely to expire unused. Additionally, post-enactment capital losses that are carried forward will retain their character as either short-term or long-term capital losses rather than being considered all short-term as under previous law. As of October 31, 2014, capital loss carryforwards for the Funds were as follows:
| Expires in | Expires in | Expires in | Expires in | Unlimited | Remaining Capital Loss | |||||||||||||||||||||||
| Fund | 2016 | 2017 | 2018 | 2019 | Short-Term | Long-Term | Carryforward | |||||||||||||||||||||
Guggenheim Russell MidCap® Equal Weight ETF | $ | — | $ | — | $ | — | $ | — | $ | (578,764 | ) | $ | (228,591 | ) | $ | (807,355 | ) | |||||||||||
Guggenheim Russell 1000® Equal Weight ETF | — | — | — | (312 | ) | (130,149 | ) | (541,079 | ) | (671,540 | ) | |||||||||||||||||
Guggenheim Russell 2000® Equal Weight ETF | — | — | — | (259,648 | ) | (499,402 | ) | (627,532 | ) | (1,386,582 | ) | |||||||||||||||||
| Guggenheim MSCI Emerging Markets Equal Weight ETF | — | — | — | (18,800 | ) | (636,750 | ) | (1,985,210 | ) | (2,640,760 | ) | |||||||||||||||||
Guggenheim S&P 500® Equal Weight Consumer Discretionary ETF | (800,018 | ) | (1,981,333 | ) | — | — | — | (546,245 | ) | (3,327,596 | ) | |||||||||||||||||
Guggenheim S&P 500® Equal Weight Consumer Staples ETF | (11,426 | ) | (195,890 | ) | — | (61,000 | ) | (1,467,823 | ) | (385,169 | ) | (2,121,308 | ) | |||||||||||||||
Guggenheim S&P 500® Equal Weight Energy ETF | — | (1,743,348 | ) | (393,314 | ) | (128,371 | ) | (1,570,470 | ) | (4,336,520 | ) | (8,172,023 | ) | |||||||||||||||
Guggenheim S&P 500® Equal Weight Financials ETF | (1,721,145 | ) | (4,062,086 | ) | (376,840 | ) | — | — | — | (6,160,071 | ) | |||||||||||||||||
Guggenheim S&P 500® Equal Weight Health Care ETF | — | (199,319 | ) | — | (66,030 | ) | — | — | (265,349 | ) | ||||||||||||||||||
Guggenheim S&P 500® Equal Weight Industrials ETF | — | (1,121,641 | ) | — | — | (103,243 | ) | (544,393 | ) | (1,769,277 | ) | |||||||||||||||||
Guggenheim S&P 500® Equal Weight Materials ETF | — | (576,552 | ) | — | — | — | (1,922,622 | ) | (2,499,174 | ) | ||||||||||||||||||
Guggenheim S&P 500® Equal Weight Technology ETF | — | (2,331,453 | ) | — | — | — | (4,467,342 | ) | (6,798,795 | ) | ||||||||||||||||||
Guggenheim S&P 500® Equal Weight Utilities ETF | — | — | — | — | (293,413 | ) | (144,413 | ) | (437,826 | ) | ||||||||||||||||||
132 | GUGGENHEIM ETFs ANNUAL REPORT |
NOTES TO FINANCIAL STATEMENTS (continued) |
For the year ended October 31, 2014, the following capital loss carryforward amounts were expired or used:
| Fund | Amount | |||
Guggenheim S&P 500® Equal Weight Financials ETF | $ | (51,334 | ) | |
Guggenheim S&P 500® Equal Weight Health Care ETF | (3,620,001 | ) | ||
Guggenheim S&P 500® Equal Weight Technology ETF | (4,516,742 | ) | ||
In order to present paid-in-capital, undistributed net investment income (loss) and accumulated net realized gain (loss) on investments on the statement of assets and liabilities that more closely represent their tax character, certain adjustments have been made to these accounts. These adjustments have no effect on the net assets or NAV. The most significant of these adjustments are for net capital gains (losses) resulting from in-kind redemptions, equalization debits, passive foreign investment company adjustments, and return of capital on investments. For the year ended October 31, 2014, the adjustments for the Funds were as follows:
| Fund | Paid-In Capital | Undistributed Net Investment Income | Accumulated Net Realized Loss | |||||||||
Guggenheim Russell MidCap® Equal Weight ETF | $ | 8,660,503 | $ | (42,175 | ) | $ | (8,618,328 | ) | ||||
Guggenheim Russell 1000® Equal Weight ETF | 10,739,445 | (10,965 | ) | (10,728,480 | ) | |||||||
Guggenheim Russell 2000® Equal Weight ETF | 1,171,467 | (5,846 | ) | (1,165,621 | ) | |||||||
| Guggenheim MSCI Emerging Markets Equal Weight ETF | — | (4,415 | ) | 4,415 | ||||||||
Guggenheim S&P 500® Equal Weight Consumer Discretionary ETF | 19,567,964 | (17,239 | ) | (19,550,725 | ) | |||||||
Guggenheim S&P 500® Equal Weight Consumer Staples ETF | 15,223,840 | 2,885 | (15,226,725 | ) | ||||||||
Guggenheim S&P 500® Equal Weight Energy ETF | 5,873,131 | (7,918 | ) | (5,865,213 | ) | |||||||
Guggenheim S&P 500® Equal Weight Financials ETF | 8,439,677 | 299,059 | (8,738,736 | ) | ||||||||
Guggenheim S&P 500® Equal Weight Health Care ETF | 19,195,165 | 1,938 | (19,197,103 | ) | ||||||||
Guggenheim S&P 500® Equal Weight Industrials ETF | 11,922,358 | (9,059 | ) | (11,913,299 | ) | |||||||
Guggenheim S&P 500® Equal Weight Materials ETF | 16,235,081 | — | (16,235,081 | ) | ||||||||
Guggenheim S&P 500® Equal Weight Technology ETF | 30,848,069 | (204,348 | ) | (30,643,721 | ) | |||||||
Guggenheim S&P 500® Equal Weight Utilities ETF | 11,790,453 | (51,945 | ) | (11,738,508 | ) | |||||||
At October 31, 2014, the cost of securities for Federal income tax purposes, the aggregate gross unrealized gain for all securities for which there was an excess of value over tax cost and the aggregate gross unrealized loss for all securities for which there was an excess of tax cost over value, were as follows:
| Fund | Tax Cost | Tax Unrealized Gain | Tax Unrealized Loss | Net Unrealized Gain/(Loss) | ||||||||||||
Guggenheim Russell MidCap® Equal Weight ETF | $ | 128,754,948 | $ | 25,999,574 | $ | (3,838,296 | ) | $ | 22,161,279 | |||||||
Guggenheim Russell 1000® Equal Weight ETF | 85,540,083 | 12,762,805 | (2,669,415 | ) | 10,093,390 | |||||||||||
Guggenheim Russell 2000® Equal Weight ETF | 38,628,636 | 7,598,798 | (3,589,785 | ) | 4,009,013 | |||||||||||
| Guggenheim MSCI Emerging Markets Equal Weight ETF | 15,842,072 | 1,396,073 | (1,780,969 | ) | (384,896 | ) | ||||||||||
Guggenheim S&P 500® Equal Weight Consumer Discretionary ETF | 86,084,734 | 7,962,439 | (3,286,033 | ) | 4,676,406 | |||||||||||
Guggenheim S&P 500® Equal Weight Consumer Staples ETF | 173,949,174 | 14,310,102 | (1,974,864 | ) | 12,335,238 | |||||||||||
Guggenheim S&P 500® Equal Weight Energy ETF | 127,244,419 | 985,399 | (20,977,002 | ) | (19,991,603 | ) | ||||||||||
Guggenheim S&P 500® Equal Weight Financials ETF | 128,032,944 | 9,406,892 | (1,160,671 | ) | 8,246,221 | |||||||||||
Guggenheim S&P 500® Equal Weight Health Care ETF | 339,748,484 | 54,979,051 | (1,430,409 | ) | 53,548,642 | |||||||||||
Guggenheim S&P 500® Equal Weight Industrials ETF | 114,488,387 | 10,915,972 | (2,065,087 | ) | 8,850,885 | |||||||||||
Guggenheim S&P 500® Equal Weight Materials ETF | 74,895,559 | 3,746,331 | (4,528,498 | ) | (782,167 | ) | ||||||||||
Guggenheim S&P 500® Equal Weight Technology ETF | 616,578,757 | 81,595,606 | (8,824,734 | ) | 72,770,872 | |||||||||||
Guggenheim S&P 500® Equal Weight Utilities ETF | 140,763,189 | 7,105,197 | (489,975 | ) | 6,615,222 | |||||||||||
| GUGGENHEIM ETFs ANNUAL REPORT | 133 |
NOTES TO FINANCIAL STATEMENTS (continued) |
7. Investment Transactions
For the year ended October 31, 2014, the Funds had investment transactions in-kind associated with subscriptions and redemptions as follows:
| Fund | Subscriptions | Redemptions | ||||||
Guggenheim Russell MidCap® Equal Weight ETF | $ | 81,421,598 | $ | 24,540,979 | ||||
Guggenheim Russell 1000® Equal Weight ETF | 58,491,245 | 37,982,376 | ||||||
Guggenheim Russell 2000® Equal Weight ETF | 15,844,731 | 2,302,773 | ||||||
| Guggenheim MSCI Emerging Markets Equal Weight ETF | 2,444,882 | — | ||||||
Guggenheim S&P 500® Equal Weight Consumer Discretionary ETF | 47,488,811 | 91,854,230 | ||||||
Guggenheim S&P 500® Equal Weight Consumer Staples ETF | 160,565,546 | 74,674,440 | ||||||
Guggenheim S&P 500® Equal Weight Energy ETF | 317,883,475 | 237,197,656 | ||||||
Guggenheim S&P 500® Equal Weight Financials ETF | 121,448,255 | 56,867,921 | ||||||
Guggenheim S&P 500® Equal Weight Health Care ETF | 274,473,880 | 78,729,894 | ||||||
Guggenheim S&P 500® Equal Weight Industrials ETF | 102,572,325 | 50,366,628 | ||||||
Guggenheim S&P 500® Equal Weight Materials ETF | 85,087,100 | 64,561,572 | ||||||
Guggenheim S&P 500® Equal Weight Technology ETF | 443,831,952 | 134,227,650 | ||||||
Guggenheim S&P 500® Equal Weight Utilities ETF | 217,428,211 | 142,707,387 | ||||||
For the year ended October 31, 2014, the cost of purchases and proceeds from sales of investment securities, excluding government securities, short-term investments and in-kind transactions, were as follows:
| Fund | Purchases | Sales | ||||||
Guggenheim Russell MidCap® Equal Weight ETF | $ | 33,133,408 | $ | 33,631,455 | ||||
Guggenheim Russell 1000® Equal Weight ETF | 24,016,289 | 23,994,750 | ||||||
Guggenheim Russell 2000® Equal Weight ETF | 15,013,648 | 15,238,666 | ||||||
| Guggenheim MSCI Emerging Markets Equal Weight ETF | 3,982,272 | 2,885,000 | ||||||
Guggenheim S&P 500® Equal Weight Consumer Discretionary ETF | 23,589,764 | 23,628,769 | ||||||
Guggenheim S&P 500® Equal Weight Consumer Staples ETF | 24,766,554 | 24,819,414 | ||||||
Guggenheim S&P 500® Equal Weight Energy ETF | 37,915,710 | 41,951,863 | ||||||
Guggenheim S&P 500® Equal Weight Financials ETF | 18,175,505 | 18,147,084 | ||||||
Guggenheim S&P 500® Equal Weight Health Care ETF | 51,732,260 | 50,240,248 | ||||||
Guggenheim S&P 500® Equal Weight Industrials ETF | 14,315,386 | 13,969,274 | ||||||
Guggenheim S&P 500® Equal Weight Materials ETF | 15,599,974 | 16,064,276 | ||||||
Guggenheim S&P 500® Equal Weight Technology ETF | 109,898,040 | 110,031,674 | ||||||
Guggenheim S&P 500® Equal Weight Utilities ETF | 26,237,357 | 26,834,820 | ||||||
8. Subsequent Event
At a meeting held on November 13, 2014, the Adviser recommended and the Board of the Trust approved changing the Underlying Index for the Guggenheim MSCI Emerging Markets ETF (the "Fund") from the MSCI Emerging Markets Equal Weighted Index to the MSCI Emerging Markets Equal Country Weighted Index. In connection with the change in the Fund's Underlying Index, the Board also approved changing the Fund's name to Guggenheim MSCI Emerging Markets Equal Country Weight ETF. The changes in index and Fund name will become effective on January 20, 2015, or such later date as deemed appropriate by the officers of the Trust.
9. Legal Proceedings
Tribune Company
Rydex ETF Trust has been named as a defendant and a putative member of the proposed defendant class of shareholders in the case entitled Kirschner v. FitzSimons, No. 12-2652 (S.D.N.Y.) (formerly Official Committee of Unsecured Creditors of Tribune Co. v. FitzSimons, Adv. Pro. No. 10-54010 (Bankr. D. Del.)) (the "FitzSimons action"), as a result of ownership of shares by certain series of the Rydex ETF Trust in the Tribune Company ("Tribune") in 2007, when Tribune effected a leveraged buyout transaction ("LBO") by which Tribune converted to a privately-held company. In his complaint, the plaintiff has alleged that, in connection with the LBO, insiders and shareholders were overpaid for their Tribune stock using
134 | GUGGENHEIM ETFs ANNUAL REPORT |
NOTES TO FINANCIAL STATEMENTS (concluded) |
financing that the insiders knew would, and ultimately did, leave the Tribune Company insolvent. The plaintiff has asserted claims against certain insiders, major shareholders, professional advisers, and others involved in the LBO. The plaintiff is also attempting to obtain from former Tribune shareholders, including Rydex ETF Trust, the proceeds they received in connection with the LBO.
In June 2011, a group of Tribune creditors filed multiple actions against former Tribune shareholders involving state law constructive fraudulent conveyance claims arising out of the 2007 LBO (the "SLCFC actions"). Rydex ETF Trust has been named as a defendant in one or more of these suits. In those actions, the creditors seek to recover from Tribune's former shareholders the proceeds received in connection with the 2007 LBO.
The FitzSimons action and the SLCFC actions have been consolidated with the majority of the other Tribune LBO-related lawsuits in a multidistrict litigation proceeding captioned In re Tribune Company Fraudulent Conveyance Litig., No. 11-md-2696 (S.D.N.Y.) (the "MDL Proceeding").
On September 23, 2013, the District Court granted the defendants' omnibus motion to dismiss the SLCFC actions, on the basis that the creditors lacked standing. On September 30, 2013, the creditors filed a notice of appeal of the September 23 order. On October 28, 2013, the defendants filed a joint notice of cross-appeal of that same order. The SLCFC appeals have been fully briefed, and oral argument took place on November 5, 2014. The Court has not yet issued a decision on the appeals.
On May 23, 2014, the defendants filed motions to dismiss the FitzSimons action, including a global motion to dismiss Count I, which is the claim brought against former Tribune shareholders for intentional fraudulent conveyance under U.S. federal law. The Court has not yet issued a decision on any of these motions.
None of these lawsuits alleges any wrongdoing on the part of Rydex ETF Trust. The following series of Rydex ETF Trust held shares of Tribune and tendered these shares as part of Tribune's LBO: Guggenheim S&P 500 Equal Weight Consumer Discretionary Fund (the "Fund"). The value of the proceeds received by the foregoing Fund was $249,481. At this stage of the proceedings, Rydex ETF Trust is not able to make a reliable prediction as to the outcome of these lawsuits or the effect, if any, on the Fund's net asset value.
| GUGGENHEIM ETFs ANNUAL REPORT | 135 |
| REPORT OF INDEPENDENT REGISTERED PUBLIC ACCOUNTING FIRM |
The Board of Trustees and Shareholders of Rydex ETF Trust
We have audited the accompanying statements of assets and liabilities, including the schedules of investments, of Guggenheim Russell MidCap® Equal Weight ETF, Guggenheim Russell 1000® Equal Weight ETF, Guggenheim Russell 2000® Equal Weight ETF, Guggenheim MSCI Emerging Markets Equal Weight ETF, Guggenheim S&P 500® Equal Weight Consumer Discretionary ETF, Guggenheim S&P 500® Equal Weight Consumer Staples ETF, Guggenheim S&P 500® Equal Weight Energy ETF, Guggenheim S&P 500® Equal Weight Financials ETF, Guggenheim S&P 500® Equal Weight Health Care ETF, Guggenheim S&P 500® Equal Weight Industrials ETF, Guggenheim S&P 500® Equal Weight Materials ETF, Guggenheim S&P 500® Equal Weight Technology ETF and Guggenheim S&P 500® Equal Weight Utilities ETF (thirteen of the series constituting the Rydex ETF Trust) (the "Funds") as of October 31, 2014, and the related statements of operations for the year then ended, the statements of changes in net assets for each of the two years in the period then ended, and the financial highlights for each of the years or periods indicated therein. These financial statements and financial highlights are the responsibility of the Funds' management. Our responsibility is to express an opinion on these financial statements and financial highlights based on our audits.
We conducted our audits in accordance with the standards of the Public Company Accounting Oversight Board (United States). Those standards require that we plan and perform the audit to obtain reasonable assurance about whether the financial statements and financial highlights are free of material misstatement. We were not engaged to perform an audit of the Funds' internal control over financial reporting. Our audits included consideration of internal control over financial reporting as a basis for designing audit procedures that are appropriate in the circumstances, but not for the purpose of expressing an opinion on the effectiveness of the Funds' internal control over financial reporting. Accordingly, we express no such opinion. An audit also includes examining, on a test basis, evidence supporting the amounts and disclosures in the financial statements and financial highlights, assessing the accounting principles used and significant estimates made by management, and evaluating the overall financial statement presentation. Our procedures included confirmation of securities owned as of October 31, 2014, by correspondence with the custodian and brokers. We believe that our audits provide a reasonable basis for our opinion.
In our opinion, the financial statements and financial highlights referred to above present fairly, in all material respects, the financial position of the above listed Funds (thirteen of the series constituting the Rydex ETF Trust) at October 31, 2014, the results of their operations for the year then ended, the changes in their net assets for each of the two years in the period then ended, and their financial highlights for each of the years or periods indicated therein, in conformity with U.S. generally accepted accounting principles.
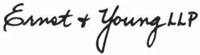
McLean, Virginia
December 19, 2014
December 19, 2014
136 | GUGGENHEIM ETFs ANNUAL REPORT |
OTHER INFORMATION (Unaudited) |
Federal Tax Information
For federal income tax purposes, the following information is furnished with respect to the distributions paid by the funds during the year ended October 31, 2014:
| Fund | Dividends Received Deduction | Long-Term Capital Gains Distribution | Qualified Income Distribution | |||||||||
Guggenheim Russell MidCap® Equal Weight ETF | 100.00 | % | $ | 63,441 | $ | 1,617,876 | ||||||
Guggenheim Russell 1000® Equal Weight ETF | 100.00 | % | — | 1,431,424 | ||||||||
Guggenheim Russell 2000® Equal Weight ETF | 100.00 | % | — | 364,900 | ||||||||
| Guggenheim MSCI Emerging Markets Equal Weight ETF | 14.06 | % | — | 123,986 | ||||||||
Guggenheim S&P 500® Equal Weight Consumer Discretionary ETF | 100.00 | % | — | 1,647,430 | ||||||||
Guggenheim S&P 500® Equal Weight Consumer Staples ETF | 100.00 | % | — | 2,874,418 | ||||||||
Guggenheim S&P 500® Equal Weight Energy ETF | 92.00 | % | — | 2,596,453 | ||||||||
Guggenheim S&P 500® Equal Weight Financials ETF | 100.00 | % | — | 1,472,584 | ||||||||
Guggenheim S&P 500® Equal Weight Health Care ETF | 100.00 | % | — | 1,988,682 | ||||||||
Guggenheim S&P 500® Equal Weight Industrials ETF | 100.00 | % | — | 1,753,824 | ||||||||
Guggenheim S&P 500® Equal Weight Materials ETF | 100.00 | % | — | 1,365,644 | ||||||||
Guggenheim S&P 500® Equal Weight Technology ETF | 100.00 | % | — | 6,570,408 | ||||||||
Guggenheim S&P 500® Equal Weight Utilities ETF | 100.00 | % | — | 3,226,115 | ||||||||
Guggenheim MSCI Emerging Markets Equal Weight ETF designates $34,592 of foreign tax paid and gross foreign sourced income earned of $282,319 for regular Federal income tax purposes.
Proxy Voting Information
A description of the policies and procedures that the Trust uses to determine how to vote proxies relating to securities held in the Funds' portfolios is available, without charge and upon request, by calling 800.820.0888. This information is also available from the EDGAR database on the SEC's website at http://www.sec.gov.
Information regarding how the Funds voted proxies relating to portfolio securities during the most recent 12-month period ended June 30 is available without charge, upon request, by calling 800.820.0888. This information is also available from the EDGAR database on the SEC's website at http://www.sec.gov.
Quarterly Portfolio Schedules Information
The Trust files its complete schedule of portfolio holdings with the SEC for the first and third quarters of each fiscal year on Form N-Q; which are available on the SEC's website at http://www.sec.gov. The Funds' Forms N-Q may be reviewed and copied at the SEC's Public Reference Room in Washington, DC, and that information on the operation of the Public Reference Room may be obtained by calling 800-SEC-0330. Copies of the portfolio holdings are also available to shareholders, without charge and upon request, by calling 800.820.0888.
Distributor Change
Effective March 3, 2014, Guggenheim Distributors, LLC ("GD"), the distributor for shares of the Funds was consolidated into and with Guggenheim Funds Distributors, LLC ("GFD"). Following the consolidation, GFD serves as the Funds' distributor.
GD and GFD are both indirect, wholly-owned subsidiaries of Guggenheim Capital, LLC and, therefore, the consolidation will not result in a change of actual control of the Funds' distributor. The primary goal of the consolidation is to achieve greater operational efficiencies and allow all of the Guggenheim funds, including funds that are not series of the Trusts, to be distributed by a single distributor.
The consolidation is not expected to affect the day-to-day management of the Funds or result in any material changes to the distribution of the Funds, including any changes to the distribution fees paid by the Funds.
| GUGGENHEIM ETFs ANNUAL REPORT | 137 |
OTHER INFORMATION (Unaudited)(continued) |
Board Considerations in Approving the Investment Advisory Agreement
At in-person meetings of the Board of Trustees (the "Board") of Rydex ETF Trust (the "Trust") held on May 15 and June 4, 2014 (each, a "Meeting" and, together, the "Meetings"), called for the purpose of, among other things, consideration of, and voting on, the approval and continuation of the investment advisory agreement applicable to each series of the Trust (each, a "Fund" and, collectively, the "Funds"), the Board, including the Trustees who are not "interested persons," as defined by the Investment Company Act of 1940, of the Trust (the "Independent Trustees"), unanimously approved the continuation of the investment advisory agreement (the "Investment Advisory Agreement") between the Trust and Security Investors, LLC (the "Advisor") with respect to each of the Funds for an additional one-year period, based on the Board's review of qualitative and quantitative information provided by the Advisor.
In reaching the conclusion to approve the continuation of the Investment Advisory Agreement, the Independent Trustees requested and obtained from the Advisor such information as the Independent Trustees deemed reasonably necessary to evaluate the Investment Advisory Agreement. The Advisor provided the Board with a wide variety of information, including comparisons of Fund performance and fees relative to comparable peer funds in advance of the May 15, 2014 Meeting. The Independent Trustees carefully evaluated the information provided as well as information they received throughout the year as part of their regular oversight of the Funds. At the Meetings, independent legal counsel advised the Independent Trustees with respect to their deliberations and their fiduciary responsibilities associated with the Board's consideration of the continuation of the Investment Advisory Agreement. The Board also received a memorandum from Fund counsel regarding the Board's responsibilities when considering the approval of an investment advisory agreement.
During the Meetings, the Board, including the Independent Trustees, evaluated a number of considerations, including among others: (a) the nature, extent and quality of the Advisor's investment advisory and other services; (b) the Advisor's investment management personnel; (c) the Advisor's operations and financial condition; (d) the Advisor's brokerage practices (including any soft dollar arrangements) and investment strategies; (e) a comparison of the Funds' advisory fees to the fees charged to comparable funds or accounts, paying special attention to the absence of breakpoints in these fees and the Advisor's rationale for not including breakpoints; (f) each Fund's overall fees and operating expenses compared with those of peer funds; (g) the Advisor's profitability with respect to its Fund-related operations; (h) the Advisor's compliance systems; (i) the Advisor's policies and compliance procedures applicable to personal securities transactions; (j) the Advisor's reputation, expertise and resources in the financial markets; and (k) Fund performance compared with that of peer funds and/or appropriate benchmarks. In its deliberations, the Board did not identify any particular factor as controlling, noting that each Trustee could attribute different weights to the various factors considered.
Based on the Board's deliberations at the Meetings, the Board, including all of the Independent Trustees, unanimously: (a) concluded that the terms of the Investment Advisory Agreement are fair and reasonable; (b) concluded that the Advisor's fees were reasonable in light of the services that it provides to the Funds; and (c) agreed to approve and continue the Investment Advisory Agreement based upon the following considerations, among others:
| • | Nature, Extent and Quality of Services Provided by the Advisor. At the Meetings, the Board reviewed the scope of services to be provided by the Advisor under the Investment Advisory Agreement and noted that there would be no significant differences between the scope of services required to be provided by the Advisor for the past year and the scope of services required to be provided during the upcoming year. The Board also considered the Advisor's representations to the Board that the Advisor would continue to provide investment and related services that were of materially the same quality and quantity as services provided to the Funds in the past, and that these services are appropriate in scope and extent in light of the Funds' operations, the competitive landscape of the investment company business and investor needs. |
| • | Fund Expenses and Performance of the Funds and the Advisor. At the Meetings, the Board reviewed statistical information provided by the Advisor regarding the expense ratio components and performance of each Fund. The Advisor engaged FUSE Research Network LLC ("FUSE"), an independent, third party research provider, to prepare advisory contract renewal reports to help the Board fulfill its advisory contract renewal responsibilities. The reports compared the Funds' fees, expenses and total return performance to those of comparable funds in the Funds' peer group and the broader peer universe, as determined by FUSE. Statistical information in the FUSE reports related to the expense ratio components was based on a comparison of the Funds' and peer funds' actual advisory fees, waivers/reimbursements, and gross and net total expenses. The Board also considered the Advisor's representation |
138 | GUGGENHEIM ETFs ANNUAL REPORT |
OTHER INFORMATION (Unaudited)(concluded) |
that it found the peer groups compiled by FUSE to be appropriate. The statistical information related to the performance of each Fund included three month and one, three, and five year performance for the Fund compared to its peers and its appropriate benchmark.
| • | Costs of Services Provided to the Funds and Profits Realized by the Advisor and its Affiliates. At the Meetings, the Board reviewed information about the profitability of the Funds to the Advisor based on the advisory fees payable under the current Investment Advisory Agreement for the last calendar year. The Board noted that the Adviser had contractually agreed to pay all operating expenses of the Funds, including the cost of index licensing fees, transfer agency, custody, fund administration, legal, audit and other services, except interest, taxes, brokerage commissions and other expenses connected with the execution of portfolio transactions, distribution fees, and extraordinary expenses. At the Meetings, the Board also analyzed the Funds' expenses, including the investment advisory fees paid to the Advisor, and reviewed reports comparing the expense ratios of the Funds to those of other comparable funds. The Board also reviewed information regarding the direct revenue received by the Advisor and ancillary revenue received by the Advisor and/or its affiliates in connection with the services provided to the Funds by the Advisor and/or its affiliates. The Board also discussed the Advisor's profit margin as reflected in the Advisor's profitability analysis. |
| • | Economies of Scale. In connection with its review of the Funds' profitability analysis at the Meetings, the Board considered the absence of breakpoints in the Advisor's fee schedule and reviewed information regarding the extent to which economies of scale or other efficiencies may result from increases in the Funds' asset levels. The Board noted that the Investment Advisory Agreement did not provide for breakpoints in each Fund's advisory fee rates as assets of a Fund increase. However, the Board further noted the Advisor's assertion that future economies of scale had been taken into consideration by fixing relatively low advisory fees for the Funds, effectively sharing the benefits of lower fees with the Funds from inception. The Board noted that it intends to continue to monitor fees as each Fund grows in size and assess whether fee breakpoints may be warranted. |
| • | Other Benefits to the Advisor and/or its Affiliates. In addition to evaluating the services provided by the Advisor, the Board considered the nature and amount of other benefits received by the Advisor and its affiliates as a result of their relationship with the Funds. In particular, the Board considered the nature, extent and quality of the administrative and distribution services performed by the Advisor's affiliates and the fees paid to the Advisor's affiliates for those services under separate agreements. In light of the costs of providing services pursuant to the separate agreements as well as the Advisor's and its affiliates' commitment to the Funds, the ancillary benefits the Advisor and its affiliates received were considered reasonable. The Board also noted that the Advisor reports portfolio transactions on behalf of the Funds, including the cost of such transactions, placed through an affiliate of the Funds or the Advisor at each quarterly Board meeting. |
On the basis of the information provided to it and its evaluation of that information, the Board, including the Independent Trustees, concluded that the approval of the Investment Advisory Agreement would enable Fund shareholders to continue receiving high quality services at a cost that was appropriate, reasonable, and in the best interests of the Funds and their shareholders. The Board, including the Independent Trustees, unanimously approved the continuation of the existing Investment Advisory Agreement.
| GUGGENHEIM ETFs ANNUAL REPORT | 139 |
INFORMATION ON BOARD OF TRUSTEES AND OFFICERS (Unaudited) |
A Board of Trustees oversees the Trust, as well as other trusts of GI, in which its members have no stated term of service, and continue to serve after election until resignation. The Statement of Additional Information includes further information about Fund Trustees and Officers, and can be obtained without charge by calling 800.820.0888.
| Name, Address* and Year of Birth of Trustee | Position(s) Held with the Trust, Term of Office and Length of Time Served | Principal Occupation(s) During Past 5 Years | Number of Portfolios in Fund Complex Overseen by Trustee*** | Other Directorships Held by Trustee |
| INTERESTED TRUSTEE | ||||
Donald C. Cacciapaglia** (1951) | Trustee from 2012 to present. | Current: President and CEO, certain other funds in the Fund Complex (2012-present); Vice Chairman, Guggenheim Investments (2010-present). Former: Chairman and CEO, Channel Capital Group, Inc. (2002-2010). | 220 | Delaware Life (2013-present); Guggenheim Life and Annuity Company (2011-present); Paragon Life Insurance Company of Indiana (2011-present). |
| INDEPENDENT TRUSTEES | ||||
Corey A. Colehour (1945) | Trustee and Member of the Audit Committee from 2003 to present; and Member of the Governance and Nominating Committees from 2005 to present. | Retired. | 131 | None. |
J. Kenneth Dalton (1941) | Trustee from 2003 to present; Chairman and Member of the Audit Committee from 2003 to present; Member of the Governance and Nominating Committees from 2005 to present; and Member of the Risk Oversight Committee from 2010 to present. | Retired. | 131 | Trustee of Epiphany Funds (4) (2009-present). |
John O. Demaret (1940) | Vice Chairman of the Board of Trustees from 2014 to present; Trustee and Member of the Audit Committee from 2003 to present; Chairman of the Board from 2006 to 2014; and Member of the Risk Oversight Committee from 2010 to present. | Retired. | 131 | None. |
Werner E. Keller (1940) | Chairman of the Board from 2014 to present; Trustee and Member of the Audit, Governance and Nominating Committees from 2005 to present; Vice Chairman of the Board from 2010 to 2014; and Chairman and Member of the Risk Oversight Committee from 2010 to present. | Current: Founder and President, Keller Partners, LLC (investment research firm) (2005-present). | 131 | None. |
140 | GUGGENHEIM ETFs ANNUAL REPORT |
INFORMATION ON BOARD OF TRUSTEES AND OFFICERS (Unaudited)(continued) |
| Name, Address* and Year of Birth of Trustee | Position(s) Held with the Trust, Term of Office and Length of Time Served | Principal Occupation(s) During Past 5 Years | Number of Portfolios in Fund Complex Overseen by Trustee*** | Other Directorships Held by Trustee |
| INDEPENDENT TRUSTEES - concluded | ||||
Thomas F. Lydon, Jr. (1960) | Trustee and Member of the Audit, Governance and Nominating Committees from 2005 to present. | Current: President, Global Trends Investments (registered investment adviser) (1996-present). | 131 | US Global Investors (GROW) (1995-present). |
Patrick T. McCarville (1942) | Trustee and Member of the Audit Committee from 2003 to present; Chairman and Member of the Governance and Nominating Committees from 2005 to present. | Retired. Former: Chief Executive Officer, Par Industries, Inc., d/b/a Par Leasing (1977-2010). | 131 | None. |
Name, Address* and Year of Birth | Position(s) Held with the Trust, Term of Office and Length of Time Served | Principal Occupation(s) During Past 5 Years |
| OFFICERS | ||
Donald C. Cacciapaglia (1951) | President (2012-present). | Current: President and CEO, certain other funds in the Fund Complex (2012-present); Vice Chairman, Guggenheim Investments (2010-present). Former: Chairman and CEO, Channel Capital Group Inc. (2002-2010). |
Michael P. Byrum (1970) | Vice President (1999-present). | Current: Senior Vice President, Security Investors, LLC (2010-present); President and Chief Investment Officer, Rydex Holdings, LLC (2008-present); Director and Chairman, Advisory Research Center, Inc. (2006-present); Manager, Guggenheim Specialized Products, LLC (2005-present). Former: Vice President, Guggenheim Distributors, LLC (2009); Director (2009-2010) and Secretary (2002-2010), Rydex Fund Services, LLC; Director (2008-2010), Chief Investment Officer (2006-2010), President (2004-2010) and Secretary (2002-2010), Rydex Advisors, LLC; Director (2008-2010), Chief Investment Officer (2006-2010), President (2004-2010) and Secretary (2002-2010), Rydex Advisors II, LLC. |
Nikolaos Bonos (1963) | Vice President and Treasurer (2003-present). | Current: Senior Vice President, Security Investors, LLC (2010-present); Chief Executive Officer, Guggenheim Specialized Products, LLC (2009-present); Chief Executive Officer & President, Rydex Fund Services, LLC (2009-present); Vice President, Rydex Holdings, LLC (2008-present). Former: Senior Vice President, Security Global Investors, LLC (2010-2011); and Senior Vice President, Rydex Advisors, LLC and Rydex Advisors II, LLC (2006-2011). |
| GUGGENHEIM ETFs ANNUAL REPORT | 141 |
INFORMATION ON BOARD OF TRUSTEES AND OFFICERS (Unaudited)(concluded) |
Name, Address* and Year of Birth | Position(s) Held with the Trust, Term of Office and Length of Time Served | Principal Occupation(s) During Past 5 Years |
| OFFICERS - concluded | ||
Elisabeth Miller (1968) | Chief Compliance Officer (2012-present). | Current: CCO, certain other funds in the Fund Complex (2012-present); CCO, Security Investors, LLC (2012-present); CCO, Guggenheim Funds Investment Advisors, LLC (2012-present); Vice President, Guggenheim Funds Distributors, LLC (March 2014-present). Former: CCO, Guggenheim Distributors, LLC (2009-March 2014); Senior Manager, Security Investors, LLC (2004-2009); Senior Manager, Guggenheim Distributors, LLC (2004-2009). |
Joseph M. Arruda (1966) | Assistant Treasurer (2006-present). | Current: Assistant Treasurer, certain other funds in the Fund Complex (2006-present); Vice President, Security Investors, LLC (2010-present); CFO and Manager, Guggenheim Specialized Products, LLC (2009-present). Former: Vice President, Security Global Investors, LLC (2010-2011); Vice President, Rydex Advisors, LLC (2010); Vice President, Rydex Advisors II, LLC (2010). |
Paul J. Davio (1972) | Assistant Treasurer (2014-present). | Current: Assistant Treasurer, certain other funds in the Fund Complex (2014-present); Director, Guggenheim Investments (2006-present). Former: Manager, Mutual Fund Administration, Guggenheim Investments (2003-2006) |
Amy J. Lee (1961) | Vice President (2009-present) and Secretary (2012-present). | Current: Chief Legal Officer, certain other funds in the Fund Complex (2012-present); Senior Managing Director, Guggenheim Investments (2012-present). Former: Vice President, Associate General Counsel and Assistant Secretary, Security Benefit Life Insurance Company and Security Benefit Corporation (2004-2012). |
| * | All Trustees and Officers may be reached c/o Guggenheim Investments, 805 King Farm Boulevard, Suite 600, Rockville, MD 20850. |
| ** | Mr. Cacciapaglia is an "interested" person of the Trust, as that term is defined in the 1940 Act by virtue of his affiliation with the Adviser's parent company. |
| *** | The "Fund Complex" includes all closed-end and open-end funds (including all of their portfolios) advised by the Adviser and any funds that have an investment adviser or servicing agent that is an affiliated person of the Adviser. Information provided is as of the date of this report. |
142 | GUGGENHEIM ETFs ANNUAL REPORT |
GUGGENHEIM INVESTMENTS PRIVACY POLICIES (Unaudited) |
Rydex Funds, Guggenheim Funds, Rydex Investments, Guggenheim Distributors, LLC, Security Investors, LLC, Security Distributors, Inc. and Rydex Advisory Services (Collectively "Guggenheim Investments").
Our Commitment to You
When you become a Guggenheim Investments investor, you entrust us with not only your hard-earned money but also with personal and financial information about you. We recognize that your relationship with us is based on trust and that you expect us to act responsibly and in your best interests. Because we have access to this private information about you, we hold ourselves to the highest standards in its safekeeping and use. This means, most importantly, that we do not sell client information to anyone—whether it is your personal information or if you are a current or former Guggenheim Investments client.
The Information We Collect About You
In the course of doing business with shareholders and investors, we collect nonpublic personal information about you. You typically provide personal information when you complete a Guggenheim Investments account application or when you request a transaction that involves Rydex and Guggenheim Investments funds or one of the Guggenheim Investments affiliated companies. "Nonpublic personal information" is personally identifiable private information about you. For example, it includes information regarding your name and address, Social Security or taxpayer identification number, assets, income, account balance, bank account information and investment activity (e.g., purchase and redemption history).
How We Handle Your Personal Information
As emphasized above, we do not sell information about current or former clients or their accounts to third parties. Nor do we share such information, except when necessary to complete transactions at your request or to make you aware of related investment products and services that we offer. Additional details about how we handle your personal information are provided below. To complete certain transactions or account changes that you direct, it may be necessary to provide identifying information to companies, individuals or groups that are not affiliated with Guggenheim Investments. For example, if you ask to transfer assets from another financial institution to Guggenheim Investments, we will need to provide certain information about you to that company to complete the transaction. To alert you to other Guggenheim Investments investment products and services, we may share your information within the Guggenheim Investments family of affiliated companies. This would include, for example, sharing your information within Guggenheim Investments so we can make you aware of new Rydex and Guggenheim Investments funds or the services offered through another Guggenheim Investments affiliated company. In certain instances, we may contract with nonaffiliated companies to perform services for us. Where necessary, we will disclose information we have about you to these third parties. In all such cases, we provide the third party with only the information necessary to carry out its assigned responsibilities and only for that purpose. And we require these third parties to treat your private information with the same high degree of confidentiality that we do. In certain instances, we may share information with other financial institutions regarding individuals and entities in response to the U.S.A. Patriot Act. Finally, we will release information about you if you direct us to do so, if we are compelled by law to do so or in other circumstances permitted by law.
Opt Out Provisions
We do not sell your personal information to anyone. The law allows you to "opt out" of only certain kinds of information sharing with third parties. The firm does not share personal information about you with any third parties that triggers this opt-out right. This means YOU ARE ALREADY OPTED OUT.
| GUGGENHEIM ETFs ANNUAL REPORT | 143 |
GUGGENHEIM INVESTMENTS PRIVACY POLICIES (Unaudited)(concluded) |
How We Protect Privacy Online
Our concern for the privacy of our shareholders also extends to those who use our web site, guggenheiminvestments.com. Our web site uses some of the most secure forms of online communication available, including encryption technology, Secure Socket Layer (SSL) protocol, firewalls and user names and passwords. These technologies provide a high level of security and privacy when you access your account information or initiate online transactions. The Guggenheim Investments web site offers customized features that require our use of "http cookies"—tiny pieces of information that we ask your browser to store. However, we make very limited use of these cookies. We only use cookies for session management and security features on the Guggenheim Investments web site. We do not use them to pull data from your hard drive, to learn your email address, or to view data in cookies created by other web sites. We will not share the information in our cookies or give others access to it. See the legal information area on our web site for more details about web site security and privacy features.
How We Safeguard Your Personal Information
We restrict access to nonpublic personal information about shareholders to our employees and in some cases to third parties (for example, the service providers described above) as permitted by law. We maintain strict physical, electronic and procedural safeguards that comply with federal standards to guard your nonpublic personal information.
We'll Keep You Informed
As required by federal law, we will notify shareholders of our privacy policy annually. We reserve the right to modify this policy at any time, but rest assured that if we do change it, we will tell you promptly. You will also be able to access our privacy policy from our web site at guggenheiminvestments.com. Should you have any questions regarding our privacy policy, contact us at 800.820.0888 or 301.296.5100.
144 | GUGGENHEIM ETFs ANNUAL REPORT |
This page intentionally left blank.
This page intentionally left blank.
This page intentionally left blank.
This page intentionally left blank.
This page intentionally left blank.
10.31.2014
Guggenheim ETFs Annual Report
| XLG | Guggenheim Russell Top 50® Mega Cap ETF |
| RPV | Guggenheim S&P 500® Pure Value ETF |
| RPG | Guggenheim S&P 500® Pure Growth ETF |
| RFV | Guggenheim S&P MidCap 400® Pure Value ETF |
| RFG | Guggenheim S&P MidCap 400® Pure Growth ETF |
| RZV | Guggenheim S&P SmallCap 600® Pure Value ETF |
| RZG | Guggenheim S&P SmallCap 600® Pure Growth ETF |
| ETF2-ANN-1014x1015 | guggenheiminvestments.com |
| TABLE OF CONTENTS |
| DEAR SHAREHOLDER | 2 |
| ECONOMIC AND MARKET OVERVIEW | 3 |
| FEES AND EXPENSES | 5 |
| MANAGER'S ANALYSIS | 7 |
| PORTFOLIO SUMMARY | 8 |
| SCHEDULES OF INVESTMENTS | 21 |
| STATEMENTS OF ASSETS AND LIABILITIES | 34 |
| STATEMENTS OF OPERATIONS | 36 |
| STATEMENTS OF CHANGES IN NET ASSETS | 38 |
| FINANCIAL HIGHLIGHTS | 42 |
| NOTES TO FINANCIAL STATEMENTS | 49 |
| REPORT OF INDEPENDENT REGISTERED PUBLIC ACCOUNTING FIRM | 59 |
| OTHER INFORMATION | 60 |
| INFORMATION ON BOARD OF TRUSTEES AND OFFICERS | 63 |
| GUGGENHEIM INVESTMENTS PRIVACY POLICIES | 66 |
| GUGGENHEIM ETFs ANNUAL REPORT | 1 |
| October 31, 2014 |
Dear Shareholder:
Security Investors, LLC (the "Investment Adviser") is pleased to present the annual shareholder report for a selection of our exchange traded funds ("ETFs").
The Investment Adviser is part of Guggenheim Investments, which represents the investment management businesses of Guggenheim Partners, LLC, a global, diversified financial services firm.
Guggenheim Funds Distributors, LLC, the distributor of the Funds, is affiliated with Guggenheim and the Investment Adviser.
This report covers performance of the ETFs for the annual period ended October 31, 2014.
We encourage you to read the Economic and Market Overview that follows, which provides additional information regarding the factors that influenced the Fund's performance for the fiscal year, and then the Manager's Analysis for each ETF.
Sincerely,
Donald C. Cacciapaglia
President
November 30, 2014
President
November 30, 2014
Read a prospectus and summary prospectus (if available) carefully before investing. It contains the investment objectives, risks, charges, expenses and other information, which should be considered carefully before investing. Obtain a prospectus and summary prospectus (if available) at guggenheiminvestments.com or call 800.820.0888.
The Russell Top 50® ETF may not be suitable for all investors. • The Fund is subject to the risk that unanticipated early closings of securities exchanges and other financial markets may result in the Fund's inability to buy or sell securities or other financial instruments on that day. • In certain circumstances, it may be difficult for the Fund to purchase and sell particular investments within a reasonable time at a fair price. • Investments in securities and derivatives, in general, are subject to market risks that may cause their prices to fluctuate over time. An investment in the Fund may lose money. • Unlike many investment companies, the Fund is not actively "managed." This means that, based on market and economic conditions, the Fund's performance could be lower than other types of mutual funds that may actively shift their portfolio assets to take advantage of market opportunities or to lessen the impact of a market decline. • Tracking error risk refers to the risk that the Advisor may not be able to cause the Fund's performance to match or correlate to that of the Fund's Underlying Index, either on a daily or aggregate basis. Tracking error risk may cause the Fund's performance to be less than you expect. • Shares may trade below their net asset value ("NAV"). The NAV of shares will fluctuate with changes in the market value of the Fund's holdings. In addition, although the Fund's shares are currently listed on NYSE Arca, Inc. (the "Exchange"), there can be no assurance that an active trading market for shares will develop or be maintained. • The Fund is subject to the risk that large-capitalization stocks may underperform other segments of the equity market or the equity market as a whole. See a fund's prospectus for more information on these and additional risks.
Pure style ETFs may not be suitable for all investors. The ETFs are subject to the risk that large, medium and small-capitalization stocks may under-perform other segments of the equity market or the equity market as a whole •Value stocks are subject to the risk that the intrinsic value of the stock may never be realized by the market or that the price goes down. Growth stocks typically invest a high portion of their earnings back into their business and may lack the dividend yield that could cushion their decline in a market downturn. Growth stocks may be more volatile than other stocks because they are more sensitive to investor perceptions regarding the growth potential of the issuing company. • The Funds are subject to the risk that unanticipated early closings of securities exchanges and other financial markets may result in the Fund's inability to buy or sell securities or other financial instruments on that day. • In certain circumstances, it may be difficult for the Funds to purchase and sell particular investments within a reasonable time at a fair price. • Investments in securities, in general, are subject to market risks that may cause their prices to fluctuate over time. An investment in the Funds may lose money. • Unlike many investment companies, the Funds are not actively "managed." This means that based on market and economic conditions, the Fund's' performance could be lower than other types of funds that may actively shift their portfolio assets to take advantage of market opportunities or to lessen the impact of a market decline. • Tracking error risk refers to the risk that the Advisor may not be able to cause the Funds' performance to match or correlate to that of the Funds' Underlying Index, either on a daily or aggregate basis. Tracking error risk may cause the Funds' performance to be less than you expect. • Shares may trade below their net asset value ("NAV"). The NAV of shares will fluctuate with changes in the market value of the Funds' holdings. In addition, although the Funds' shares are currently listed on NYSE Arca, Inc. (the "Exchange"), there can be no assurance that an active trading market for shares will develop or be maintained. • Each Fund is considered nondiversified and can invest a greater portion of its assets in securities of individual issuers than a diversified Fund. As a result, changes in the market value of a single security could cause greater fluctuations in the value of fund shares than would occur in a more diversified Fund. See a fund's prospectus for more information on these and additional risks.
2 | GUGGENHEIM ETFs ANNUAL REPORT |
ECONOMIC AND MARKET OVERVIEW (Unaudited) | October 31, 2014 |
The U.S. economy continued to grow throughout the 12 months ended October 31, 2014, despite some seasonal volatility in September and October that caused spreads in leveraged credit to widen and upward momentum in U.S. stocks to deteriorate. By the end of October, the spread widening had reversed and equities regained their footing, with some key indices shooting to new highs. Markets similarly overcame a weather-related winter soft patch in the first quarter of 2014.
U.S. economic data remains strong, with the third quarter's 3.5% GDP growth signaling that the economy was doing well across the spectrum. Among the highlights: strong net exports, unemployment that had fallen faster than expected and consumer confidence that was at seven year high. The fact that government at the state and local level was contributing to GDP growth suggested that a major headwind for the economy—contracting government spending—has gone away. Lower energy prices are also likely to help boost consumption in the near term.
U.S. is adding close to 230,000 jobs per month on average in 2014, considerably more than 2013's monthly average of 194,000. Employment levels are transitioning from the recovery phase to the expansion phase, which typically coincides with accelerating economic activity. The downward trend in labor force participation has begun to flatten and, as a result, the rapid decline in the nation's unemployment rate should begin to slow. Until unemployment falls below 5.5 percent, it's unlikely that the U.S. economy will experience the kind of meaningful wage pressure that would spur action by the Federal Reserve. An improving labor market, subdued mortgage rates, and tight housing inventory all point to a rebound in the housing market, which accounted for almost half of GDP growth in 2013 and remains critical to the ongoing recovery.
Growth in Japan and Europe continued to stagnate. The slowdown in the euro zone is concentrated at the core rather than the periphery. To combat disinflation and muted credit growth, the European Central Bank (ECB) enacted further monetary easing and instigated its own unique brand of quantitative easing. Japan's major increase in monetary accommodation in late October surprised markets, but could not forestall the Japanese economy tipping into recession after the period ended. The latest Japanese accommodation came just days after the U.S. Federal Reserve ended its own quantitative easing program.
Overseas geopolitical concerns and comparatively attractive yields have pushed global investors to U.S. Treasuries. Such "beggar thy neighbor" policies from Europe and Asia were the main driving force behind the most recent rally in U.S. fixed income, and indicate that U.S. long-term rate should continue to be well supported.
Consensus among investors was that the Fed would begin to hike rates in the second half of 2015. However, the precipitous decline in energy and commodity prices, the strengthening of U.S. dollar and competitive pressures on prices for traded goods will probably push inflation, as measured by the Fed's favored personal consumption expenditures deflator, down toward 1 percent, raising the likelihood that any increase in the policy rate may be pushed into 2016.
For the 12-month period ended October 31, 2014, the return of the Standard & Poor's 500® ("S&P 500") Index* was 17.27%. The Barclays U.S. Aggregate Bond Index* returned 4.14% for the period, while the BofA Merrill Lynch 3-Month U.S. Treasury Bill Index* returned 0.05%. The MSCI World Index* returned 8.67%, while the MSCI Emerging Markets Index* returned 0.64%.
The opinions and forecasts expressed may not actually come to pass. This information is subject to change at any time, based on market and other conditions, and should not be construed as a recommendation of any specific security or strategy.
*Index Definitions:
The following indices are referenced throughout this report. Indices are unmanaged and not available for direct investment. Index performance does not reflect transaction costs, fees, or expenses.
BofA Merrill Lynch 3-Month U.S. Treasury Bill Index is an unmanaged market index of U.S. Treasury securities maturing in 90 days that assumes reinvestment of all income.
Barclays U.S. Aggregate Bond Index is a broad-based benchmark that measures the investment grade, U.S. dollar-denominated, fixed-rate taxable bond market, including U.S. Treasuries, government-related and corporate securities, MBS (agency fixed-rate and hybrid ARM pass-throughs), ABS and CMBS.
MSCI Emerging Markets Index is a free float-adjusted market capitalization weighted index that is designed to measure equity market performance in the global emerging markets.
MSCI World Index is a free float-adjusted market capitalization weighted index that is designed to measure the equity market performance of developed markets.
| GUGGENHEIM ETFs ANNUAL REPORT | 3 |
ECONOMIC AND MARKET OVERVIEW (Unaudited)(concluded) | October 31, 2014 |
S&P 500® Index is a capitalization-weighted index of 500 stocks designed to measure the performance of the broad economy, representing all major industries and is considered a representation of the U.S. stock market.
Russell Top 50® Mega Cap Index measures the performance of the largest companies in the Russell 3000® Index, which measures the performance of the largest 3,000 U.S. companies and represents approximately 98% of the investable U.S. equity market. The Mega Cap Index includes approximately 50 of the largest securities based on a combination of their market cap and current index membership and represents approximately 40% of the total market capitalization of the Russell 3000.
Russell 1000® Index measures the performance of the large-cap segment of the U.S. equity universe. It is a subset of the Russell 3000® Index and includes approximately 1,000 of the largest securities based on a combination of their market cap and current index membership. The Russell 1000 represents approximately 92% of the U.S. market.
Russell 2000® Index measures the performance of the small-cap segment of the U.S. equity universe. The Russell 2000 is a subset of the Russell 3000® Index representing approximately 10% of the total market capitalization of that index. It includes approximately 2,000 of the smallest securities based on a combination of their market cap and current index membership.
Russell 3000® Index measures the performance of the largest 3,000 U.S. companies representing approximately 98% of the investable U.S. equity market.
Russell Midcap® Index measures the performance of the mid-cap segment of the U.S. equity universe. The Russell Midcap is a subset of the Russell 1000® Index. It includes approximately 800 of the smallest securities based on a combination of their market cap and current index membership. The Russell Midcap represents approximately 31% of the total market capitalization of the Russell 1,000 companies.
S&P 500® Pure Value Index is narrow in focus, containing only those stocks from the S&P (Standard & Poor's) 500® Index (S&P 500), as selected by S&P, that exhibit strong value characteristics, and weights them by style score. It is a complement to the S&P 500® Value Index, which consists of all value companies in the S&P 500 and measures value across several risk factors, including book value to price ratio, earnings to price ratio, and sales to price ratio. The S&P 500 itself measures the performance of the large-capitalization sector of the U.S. equity market and includes 500 widely held common stocks chosen for market size, liquidity and industry group representation.
S&P 500® Pure Growth Index is narrow in focus, containing only those stocks from the S&P (Standard & Poor's) 500® Index (S&P 500), as selected by S&P, that exhibit strong growth characteristics, and weights them by style score. It is a complement to the S&P 500® Growth Index, which consists of all growth companies in the S&P 500 and measures growth across several risk factors, including sales growth, earnings change to price and momentum. The S&P 500 itself measures the performance of the large-capitalization sector of the U.S. equity market and includes 500 widely held common stocks chosen for market size, liquidity and industry group representation.
S&P MidCap 400® Index is a capitalization-weighted index that measures the performance of the mid-cap segment of the U.S. equity universe and includes 400 domestic mid-cap stocks chosen for market capitalization, liquidity, and industry group representation.
S&P MidCap 400® Pure Value Index is narrow in focus, containing only those S&P (Standard & Poor's) MidCap 400® Index (S&P 400) companies with strong value characteristics as selected by S&P. It is a complement to the S&P MidCap 400® Value Index, which consists of all value companies in the S&P 400 and measures value across several risk factors, including book value to price ratio, earnings to price ratio, and sales to price ratio. The S&P 400 itself measures the performance of the mid-capitalization sector of the U.S. equity market.
S&P MidCap 400® Pure Growth Index is narrow in focus, containing only those S&P (Standard & Poor's) MidCap 400® Index (S&P 400) companies with strong growth characteristics as selected by S&P. It is a complement to the S&P MidCap 400® Growth Index, which consists of all growth companies in the S&P 400 and measures growth across several risk factors, including sales growth, earnings change to price and momentum. The S&P 400 itself measures the performance of the mid-capitalization sector of the U.S. equity market.
S&P SmallCap 600® Index is a capitalization-weighted index that measures the performance of the small-cap segment of the U.S. equity universe and includes 600 domestic small-cap stocks chosen for market capitalization, liquidity, and industry group representation.
S&P SmallCap 600® Pure Value Index is narrow in focus, containing only those S&P (Standard & Poor's) SmallCap 600® Index (S&P 600) companies with strong value characteristics as selected by S&P. It is a complement to the S&P SmallCap 600® Value Index, which consists of all value companies in the S&P 600 and measures value across several risk factors, including book value to price ratio, earnings to price ratio, and sales to price ratio. The S&P 600 itself measures the performance of the small-capitalization sector of the U.S. equity market.
S&P SmallCap 600® Pure Growth Index is narrow in focus, containing only those S&P (Standard & Poor's) SmallCap 600® Index (S&P 600) companies with strong growth characteristics as selected by S&P. It is a complement to the S&P SmallCap 600® Growth Index, which consists of all growth companies in the S&P 600 and measures growth across several risk factors, including sales growth, earnings change to price and momentum. The S&P 600 itself measures the performance of the mid-capitalization sector of the U.S. equity market.
4 | GUGGENHEIM ETFs ANNUAL REPORT |
FEES AND EXPENSES (Unaudited) |
Shareholder Expense Example
As a shareholder of the Rydex ETF Trust, you incur transaction costs such as creation and redemption fees or brokerage charges, and ongoing costs including advisory fees, trustee fees and, if applicable, distribution fees. All other Trust expenses are paid by the Adviser. This Example is intended to help you understand your ongoing costs (in dollars) of investing in a Fund and to compare these costs with the ongoing costs of investing in other mutual funds.
The example in the table is based on an investment of $1,000 invested on April 30, 2014 and held for the six months ended October 31, 2014.
Actual Expenses
The first table below provides information about actual account values and actual expenses. You may use the information in this table, together with the amount you invested, to estimate the expenses that you incurred over the period. Simply divide your account value by $1,000 (for example, an $8,600 account value divided by $1,000 = 8.6), then multiply the result by the number in the first table under the heading entitled "Expenses Paid During the Six-Month Period" to estimate the expenses attributable to your investment during this period.
Hypothetical Example for Comparison Purposes
The second table below provides information about hypothetical account values and hypothetical expenses based on a Fund's actual expense ratio and an assumed rate of return of 5% per year before expenses, which is not a Fund's actual return. Thus, you should not use the hypothetical account values and expenses to estimate the actual ending account balance or your expenses for the period. Rather, these figures are provided to enable you to compare the ongoing costs of investing in a Fund and other funds. To do so, compare this 5% hypothetical example with the 5% hypothetical examples that appear in the shareholder reports of other funds.
Please note that the expenses shown in the table are meant to highlight your ongoing costs only and do not reflect any transaction costs, such as creation and redemption fees, or brokerage charges. Therefore, the second table is useful in comparing ongoing costs only, and will not help you determine the relative total costs of owning different funds. In addition, if these transaction costs were included, your costs would have been higher.
| GUGGENHEIM ETFs ANNUAL REPORT | 5 |
FEES AND EXPENSES (Unaudited)(concluded) |
Expense Ratio1 | Fund Return | Beginning Account Value April 30, 2014 | Ending Account Value October 31, 2014 | Expenses Paid During Period2 | |
Table 1. Based on actual Fund return3 | |||||
Guggenheim Russell Top 50® Mega Cap ETF | 0.20% | 8.34% | $1,000.00 | $1,083.40 | $1.05 |
Guggenheim S&P 500® Pure Value ETF | 0.35% | 4.50% | 1,000.00 | 1,045.00 | 1.80 |
Guggenheim S&P 500® Pure Growth ETF | 0.35% | 10.38% | 1,000.00 | 1,103.80 | 1.86 |
Guggenheim S&P Midcap 400® Pure Value ETF | 0.35% | 3.87% | 1,000.00 | 1,038.70 | 1.80 |
Guggenheim S&P Midcap 400® Pure Growth ETF | 0.35% | 4.64% | 1,000.00 | 1,046.40 | 1.81 |
Guggenheim S&P SmallCap 600® Pure Value ETF | 0.35% | 2.03% | 1,000.00 | 1,020.30 | 1.78 |
Guggenheim S&P SmallCap 600® Pure Growth ETF | 0.35% | 5.42% | 1,000.00 | 1,054.20 | 1.81 |
| Table 2. Based on hypothetical 5% return (before expenses) | |||||
Guggenheim Russell Top 50® Mega Cap ETF | 0.20% | 5.00% | 1,000.00 | 1,024.20 | 1.02 |
Guggenheim S&P 500® Pure Value ETF | 0.35% | 5.00% | 1,000.00 | 1,023.44 | 1.79 |
Guggenheim S&P 500® Pure Growth ETF | 0.35% | 5.00% | 1,000.00 | 1,023.44 | 1.79 |
Guggenheim S&P Midcap 400® Pure Value ETF | 0.35% | 5.00% | 1,000.00 | 1,023.44 | 1.79 |
Guggenheim S&P Midcap 400® Pure Growth ETF | 0.35% | 5.00% | 1,000.00 | 1,023.44 | 1.79 |
Guggenheim S&P SmallCap 600® Pure Value ETF | 0.35% | 5.00% | 1,000.00 | 1,023.44 | 1.79 |
Guggenheim S&P SmallCap 600® Pure Growth ETF | 0.35% | 5.00% | 1,000.00 | 1,023.44 | 1.79 |
1 | Annualized. |
2 | Expenses are equal to the Fund's annualized expense ratio, net of any applicable fee waivers, multiplied by the average account value over the period, multiplied by 184/365 (to reflect the one-half year period). |
3 | Actual cumulative return at net asset value for the period April 30, 2014 to October 31, 2014. |
6 | GUGGENHEIM ETFs ANNUAL REPORT |
MANAGER'S ANALYSIS (Unaudited) | October 31, 2014 |
GUGGENHEIM RUSSELL TOP 50® MEGA CAP ETF
Guggenheim Russell Top 50® Mega Cap ETF (XLG) returned 16.86% for the one-year period ended October 31, 2014, compared with the Russell Top 50® Mega Cap Index benchmark, which returned 17.15% for the same period. The cap-weighted S&P 100 Index returned 16.93%. During the period, XLG achieved over 99% correlation to its benchmark on a daily basis.
The Information Technology sector was the largest contributor to performance, followed by Financials and Health Care. No sector detracted from performance. The Telecommunications Services sector contributed least to performance, followed by Energy and Consumer Discretionary.
The top contributors to Fund return were Apple, Inc., Microsoft Corp. and Gilead Sciences, Inc. The largest detractors were Amazon.com, Inc., International Business Machines Corp. and Google, Inc.—Class C.
Mega-cap stocks, as represented by the Russell Top 50 Mega Cap Index, outpaced performance of large-cap stocks, mid-cap stocks and small-cap stocks, as represented by returns for the Russell 1000 Index, the Russell Midcap Index and the Russell 2000 Index, whose returns were 16.78%, 15.32% and 8.06%, respectively.
Cumulative Fund Performance: May 4, 2005 – October 31, 2014
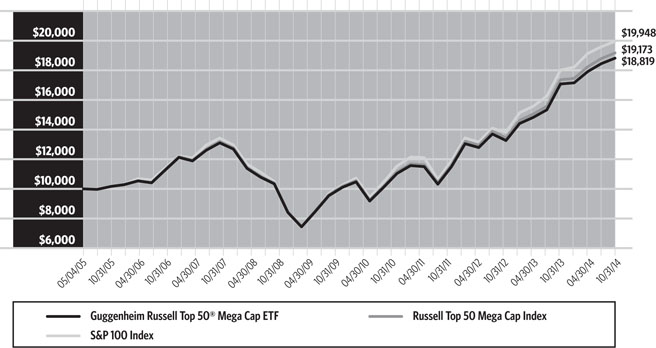
| AVERAGE ANNUAL TOTAL RETURNS FOR THE PERIOD ENDED OCTOBER 31, 2014 | ||||
| One Year | Three Year | Five Year | Since Inception (05/04/05) | |
Guggenheim Russell Top 50® Mega Cap ETF | 16.86% | 18.66% | 14.70% | 6.89% |
| Russell Top 50 Mega Cap Index | 17.15% | 18.97% | 14.98% | 7.10% |
| S&P 100 Index | 16.93% | 19.48% | 15.79% | 7.55% |
The returns presented above do not reflect the effect of taxes. Index returns represent total returns. Performance displayed represents past performance, which is no guarantee of future results.
| GUGGENHEIM ETFs ANNUAL REPORT | 7 |
PORTFOLIO SUMMARY (Unaudited) | October 31, 2014 |
GUGGENHEIM RUSSELL TOP 50® MEGA CAP ETF
Holdings Diversification*
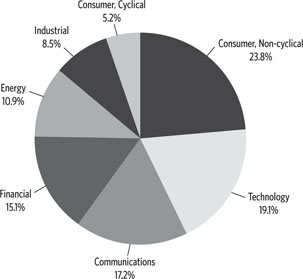
"Holdings Diversification (Market Exposure as % of Net Assets)" excludes any temporary cash investments.
* The Fund's Top Ten Holdings are expressed as a percentage of net assets and the Holdings Diversification is expressed as a percentage of the Fund's equity investments market value. These percentages may change over time.
| Ten Largest Holdings* | (% of Total Net Assets) |
| Apple, Inc. | 7.6% |
| Exxon Mobil Corp. | 4.9% |
| Microsoft Corp. | 4.6% |
| Johnson & Johnson | 3.6% |
| General Electric Co. | 3.0% |
| Berkshire Hathaway, Inc. — Class B | 3.0% |
| Wells Fargo & Co. | 3.0% |
| Procter & Gamble Co. | 2.8% |
| JPMorgan Chase & Co. | 2.7% |
| Chevron Corp. | 2.7% |
| Top Ten Total | 37.9% |
| "Ten Largest Holdings" exclude any temporary cash. | |
8 | GUGGENHEIM ETFs ANNUAL REPORT |
MANAGER'S ANALYSIS (Unaudited) | October 31, 2014 |
GUGGENHEIM S&P 500® PURE VALUE ETF
For the one-year period ended October 31, 2014, Guggenheim S&P 500® Pure Value ETF (RPV) returned 18.13%. Over the year, its benchmark, the S&P 500® Pure Value Index, posted a return of 18.61%.
For comparison, the S&P 500® Value Index returned 14.98% for the year.
For the period, RPV achieved a correlation of over 99% to its benchmark of the daily price movement of the S&P 500® Pure Value Index.
The Financials sector was the largest contributor to performance during the period, followed by Utilities and Health Care. The Consumer Discretionary and Telecommunications Services sectors contributed least to performance. The only sector detracting from performance was Energy.
Stocks contributing the most to return were Alcoa, Inc., WellPoint, Inc. and Humana, Inc. Stocks detracting most from performance were General Motors Co., Staples, Inc. and Transocean Ltd.
Cumulative Fund Performance: March 1, 2006 – October 31, 2014
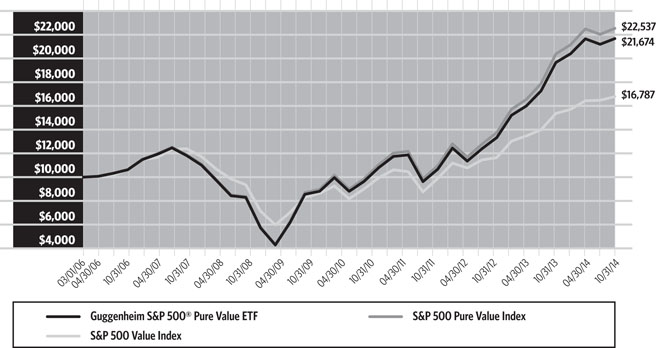
| AVERAGE ANNUAL TOTAL RETURNS FOR THE PERIOD ENDED OCTOBER 31, 2014 | ||||
| One Year | Three Year | Five Year | Since Inception (03/01/06) | |
Guggenheim S&P 500® Pure Value ETF | 18.13% | 25.95% | 22.13% | 9.33% |
| S&P 500 Pure Value Index | 18.61% | 26.51% | 22.67% | 9.82% |
| S&P 500 Value Index | 14.98% | 19.87% | 16.02% | 6.16% |
The returns presented above do not reflect the effect of taxes. Index returns represent total returns. Performance displayed represents past performance, which is no guarantee of future results.
| GUGGENHEIM ETFs ANNUAL REPORT | 9 |
PORTFOLIO SUMMARY (Unaudited) | October 31, 2014 |
GUGGENHEIM S&P 500® PURE VALUE ETF
Holdings Diversification*
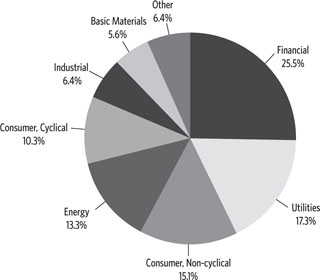
"Holdings Diversification (Market Exposure as % of Net Assets)" excludes any temporary cash investments.
* The Fund's Top Ten Holdings are expressed as a percentage of net assets and the Holdings Diversification is expressed as a percentage of the Fund's equity investments market value. These percentages may change over time.
| Ten Largest Holdings* | (% of Total Net Assets) |
| Alcoa, Inc. | 3.0% |
| WellPoint, Inc. | 2.5% |
| Berkshire Hathaway, Inc. — Class B | 2.4% |
| Humana, Inc. | 1.9% |
| Valero Energy Corp. | 1.7% |
| Assurant, Inc. | 1.6% |
| Archer-Daniels-Midland Co. | 1.6% |
| Tyson Foods, Inc. — Class A | 1.6% |
| Tesoro Corp. | 1.5% |
| Hewlett-Packard Co. | 1.5% |
| Top Ten Total | 19.3% |
| "Ten Largest Holdings" exclude any temporary cash. | |
10 | GUGGENHEIM ETFs ANNUAL REPORT |
MANAGER'S ANALYSIS (Unaudited) | October 31, 2014 |
GUGGENHEIM S&P 500® PURE GROWTH ETF
For the one-year period ended October 31, 2014, Guggenheim S&P 500® Pure Growth ETF (RPG) returned 20.24%. Over the year, its benchmark, the S&P 500® Pure Growth Index, produced a return of 20.65%. For the period, RPG achieved over 99% correlation to its benchmark on a daily basis.
For comparison, the S&P 500® Growth Index returned 19.38% for the year.
The Health Care sector contributed most to performance, followed by Information Technology and Consumer Discretionary. No sector detracted from performance, but Energy, Materials and Financials contributed least.
Stocks contributing the most to return were Southwest Airlines Co., Vertex Pharmaceuticals, Inc. and Actavis Plc. Stocks detracting most from performance were Denbury Resources, Inc., Cabot Oil & Gas Corp. and News Corp.—Class A.
Cumulative Fund Performance: March 1, 2006 – October 31, 2014
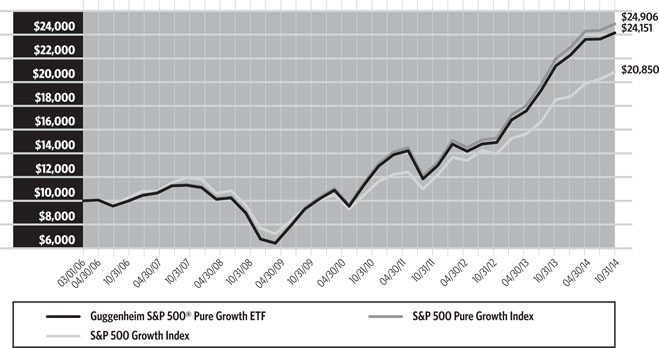
| AVERAGE ANNUAL TOTAL RETURNS FOR THE PERIOD ENDED OCTOBER 31, 2014 | ||||
| One Year | Three Year | Five Year | Since Inception (03/01/06) | |
Guggenheim S&P 500® Pure Growth ETF | 20.24% | 21.78% | 21.41% | 10.71% |
| S&P 500 Pure Growth Index | 20.65% | 22.24% | 21.89% | 11.10% |
| S&P 500 Growth Index | 19.38% | 19.73% | 17.37% | 8.85% |
The returns presented above do not reflect the effect of taxes. Index returns represent total returns. Performance displayed represents past performance, which is no guarantee of future results.
| GUGGENHEIM ETFs ANNUAL REPORT | 11 |
PORTFOLIO SUMMARY (Unaudited) | October 31, 2014 |
GUGGENHEIM S&P 500® PURE GROWTH ETF
Holdings Diversification*
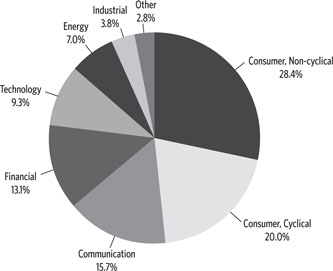
"Holdings Diversification (Market Exposure as % of Net Assets)" excludes any temporary cash investments.
* The Fund's Top Ten Holdings are expressed as a percentage of net assets and the Holdings Diversification is expressed as a percentage of the Fund's equity investments market value. These percentages may change over time.
| Ten Largest Holdings* | (% of Total Net Assets) |
| Keurig Green Mountain, Inc. | 2.4% |
| Southwest Airlines Co. | 2.2% |
| Vertex Pharmaceuticals, Inc. | 2.2% |
| Facebook, Inc. — Class A | 2.0% |
| Celgene Corp. | 2.0% |
| Actavis plc | 2.0% |
| Huntington Bancshares, Inc. | 1.9% |
| Gilead Sciences, Inc. | 1.8% |
| Safeway, Inc. | 1.8% |
| Regeneron Pharmaceuticals, Inc. | 1.8% |
| Top Ten Total | 20.1% |
| "Ten Largest Holdings" exclude any temporary cash. | |
12 | GUGGENHEIM ETFs ANNUAL REPORT |
MANAGER'S ANALYSIS (Unaudited) | October 31, 2014 |
GUGGENHEIM S&P MIDCAP 400® PURE VALUE ETF
For the one-year period ended October 31, 2014, Guggenheim S&P MidCap 400® Pure Value ETF (RFV) returned 10.14%. Over the year, its benchmark, the S&P MidCap 400® Pure Value Index, posted a 10.54% return. RFV achieved over 99% correlation to its benchmark on a daily basis.
For comparison, the S&P MidCap 400® Value Index returned 13.37% for the year.
The Financials and Information Technology sectors were the largest contributors to performance, followed by the Health Care sector. Energy, Consumer Staples and Telecommunications Services were the largest detractors from performance.
Stocks contributing the most to return were JetBlue Airways Corp., Health Net, Inc. and Protective Life Corp. KBR, Inc. AGCO Corp. and Alpha Natural Resources, Inc. detracted most from return.
Cumulative Fund Performance: March 1, 2006 – October 31, 2014
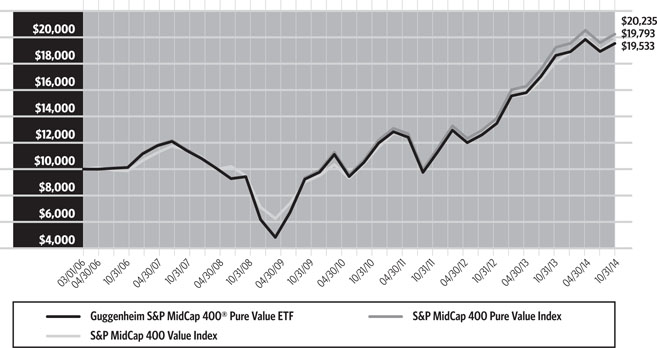
| AVERAGE ANNUAL TOTAL RETURNS FOR THE PERIOD ENDED OCTOBER 31, 2014 | ||||
| One Year | Three Year | Five Year | Since Inception (03/01/06) | |
Guggenheim S&P Midcap 400® Pure Value ETF | 10.14% | 20.92% | 18.36% | 8.03% |
| S&P MidCap 400 Pure Value Index | 10.54% | 21.47% | 18.94% | 8.47% |
| S&P MidCap 400 Value Index | 13.37% | 20.79% | 18.39% | 8.20% |
The returns presented above do not reflect the effect of taxes. Index returns represent total returns. Performance displayed represents past performance, which is no guarantee of future results.
| GUGGENHEIM ETFs ANNUAL REPORT | 13 |
PORTFOLIO SUMMARY (Unaudited) | October 31, 2014 |
GUGGENHEIM S&P MIDCAP 400® PURE VALUE ETF
Holdings Diversification*
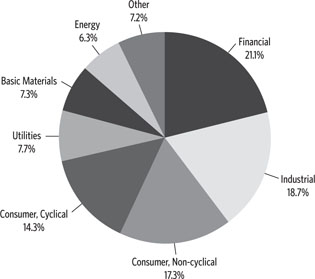
"Holdings Diversification (Market Exposure as % of Net Assets)" excludes any temporary cash investments.
* The Fund's Top Ten Holdings are expressed as a percentage of net assets and the Holdings Diversification is expressed as a percentage of the Fund's equity investments market value. These percentages may change over time.
| Ten Largest Holdings* | (% of Total Net Assets) |
| Tech Data Corp. | 2.7% |
| Health Net, Inc. | 2.7% |
| Ingram Micro, Inc. — Class A | 2.7% |
| Community Health Systems, Inc. | 2.4% |
| Reinsurance Group of America, Inc. — Class A | 2.3% |
| JetBlue Airways Corp. | 2.2% |
| AECOM Technology Corp. | 2.1% |
| Arrow Electronics, Inc. | 2.1% |
| Avnet, Inc. | 2.1% |
| LifePoint Hospitals, Inc. | 1.9% |
| Top Ten Total | 23.2% |
| "Ten Largest Holdings" exclude any temporary cash. | |
14 | GUGGENHEIM ETFs ANNUAL REPORT |
MANAGER'S ANALYSIS (Unaudited) | October 31, 2014 |
GUGGENHEIM S&P MIDCAP 400® PURE GROWTH ETF
For the one-year period ended October 31, 2014, Guggenheim S&P MidCap 400® Pure Growth ETF (RFG) returned 7.53%. Over the year, its benchmark, the S&P MidCap 400® Pure Growth Index, returned 7.74%. RFG achieved over 99% correlation to its benchmark on a daily basis.
For comparison, the S&P MidCap 400® Growth Index returned 10.04% for the year.
The Industrials, Health Care and Consumer Discretionary sectors contributed most to performance. The Energy, Information Technology and Telecommunications Services sectors detracted most from performance.
Stocks contributing the most to return were Salix Pharmaceuticals Ltd., Keurig Green Mountain, Inc. and United Therapeutics Corp. SM Energy Co., Semtech Corp. and Cree, Inc. were the largest detractors.
Cumulative Fund Performance: March 1, 2006 – October 31, 2014
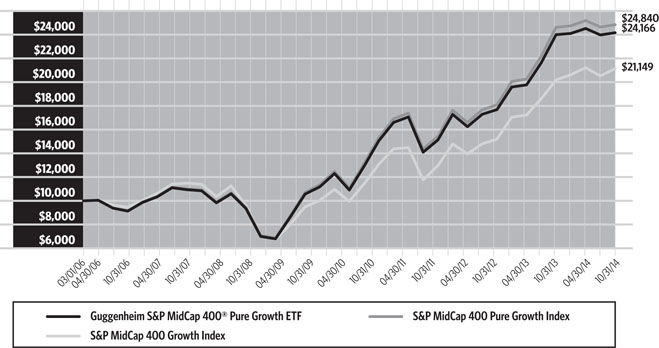
| AVERAGE ANNUAL TOTAL RETURNS FOR THE PERIOD ENDED OCTOBER 31, 2014 | ||||
| One Year | Three Year | Five Year | Since Inception (03/01/06) | |
Guggenheim S&P Midcap 400® Pure Growth ETF | 7.53% | 15.18% | 18.92% | 10.71% |
| S&P MidCap 400 Pure Growth Index | 7.74% | 15.47% | 19.24% | 11.07% |
| S&P MidCap 400 Growth Index | 10.04% | 16.64% | 18.20% | 9.03% |
The returns presented above do not reflect the effect of taxes. Index returns represent total returns. Performance displayed represents past performance, which is no guarantee of future results.
| GUGGENHEIM ETFs ANNUAL REPORT | 15 |
PORTFOLIO SUMMARY(Unaudited) | October 31, 2014 |
GUGGENHEIM S&P MIDCAP 400® PURE GROWTH ETF
Holdings Diversification*
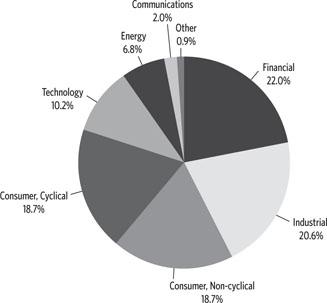
"Holdings Diversification (Market Exposure as % of Net Assets)" excludes any temporary cash investments.
* The Fund's Top Ten Holdings are expressed as a percentage of net assets and the Holdings Diversification is expressed as a percentage of the Fund's equity investments market value. These percentages may change over time.
| Ten Largest Holdings* | (% of Total Net Assets) |
| Salix Pharmaceuticals Ltd. | 3.6% |
| United Therapeutics Corp. | 2.4% |
| Trinity Industries, Inc. | 2.4% |
| Synovus Financial Corp. | 2.4% |
| Umpqua Holdings Corp. | 1.9% |
| AO Smith Corp. | 1.9% |
| Tempur Sealy International, Inc. | 1.9% |
| SVB Financial Group | 1.8% |
| Endo International plc | 1.8% |
| Deckers Outdoor Corp. | 1.8% |
| Top Ten Total | 21.9% |
| "Ten Largest Holdings" exclude any temporary cash. | |
16 | GUGGENHEIM ETFs ANNUAL REPORT |
MANAGER'S ANALYSIS (Unaudited) | October 31, 2014 |
GUGGENHEIM S&P SMALLCAP 600® PURE VALUE ETF
For the one-year period ended October 31, 2014, Guggenheim S&P SmallCap 600® Pure Value ETF (RZV) returned 9.73%. Over the year, its benchmark, the S&P SmallCap 600® Pure Value Index, returned 10.07%. RZV achieved over 99% correlation to its benchmark on a daily basis.
For comparison, the S&P SmallCap 600® Value Index returned 10.50% for the year.
The largest contributors to performance were the Health Care, Information Technology and Financials sectors. Consumer Discretionary was the only sector to detract from performance. Energy and Consumer Staples sectors contributed least.
Century Aluminum Co., Green Plains, Inc. and PharMerica Corp. were the holdings contributing most to return. VOXX International Corp.—Class A, Swift Energy Co. and Titan International, Inc. were the largest detractors.
Cumulative Fund Performance: March 1, 2006 – October 31, 2014
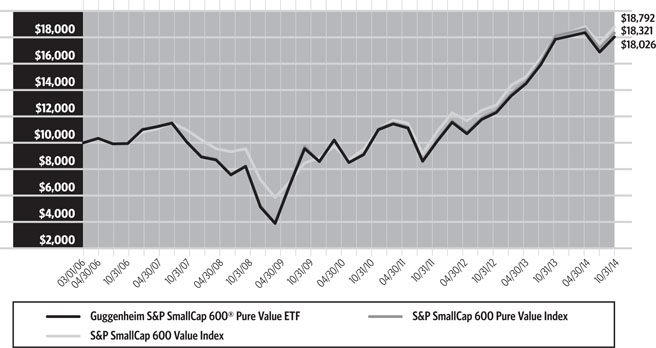
| AVERAGE ANNUAL TOTAL RETURNS FOR THE PERIOD ENDED OCTOBER 31, 2014 | ||||
| One Year | Three Year | Five Year | Since Inception (03/01/06) | |
Guggenheim S&P SmallCap 600® Pure Value ETF | 9.73% | 21.85% | 17.93% | 7.03% |
| S&P SmallCap 600 Pure Value Index | 10.07% | 22.27% | 17.90% | 7.24% |
| S&P SmallCap 600 Value Index | 10.50% | 21.06% | 18.81% | 7.55% |
The returns presented above do not reflect the effect of taxes. Index returns represent total returns. Performance displayed represents past performance, which is no guarantee of future results.
| GUGGENHEIM ETFs ANNUAL REPORT | 17 |
PORTFOLIO SUMMARY (Unaudited) | October 31, 2014 |
GUGGENHEIM S&P SMALLCAP 600® PURE VALUE ETF
Holdings Diversification*
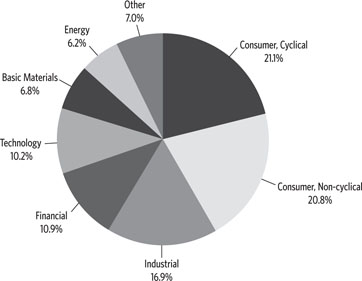
"Holdings Diversification (Market Exposure as % of Net Assets)" excludes any temporary cash investments.
* The Fund's Top Ten Holdings are expressed as a percentage of net assets and the Holdings Diversification is expressed as a percentage of the Fund's equity investments market value. These percentages may change over time.
| Ten Largest Holdings* | (% of Total Net Assets) |
| Green Plains, Inc. | 2.5% |
| Century Aluminum Co. | 2.3% |
| Sanmina Corp. | 1.8% |
| Perry Ellis International, Inc. | 1.8% |
| Central Garden and Pet Co. — Class A | 1.5% |
| Engility Holdings, Inc. | 1.5% |
| Stewart Information Services Corp. | 1.5% |
| Cash America International, Inc. | 1.4% |
| ManTech International Corp. — Class A | 1.4% |
| CDI Corp. | 1.3% |
| Top Ten Total | 17.0% |
| "Ten Largest Holdings" exclude any temporary cash. | |
18 | GUGGENHEIM ETFs ANNUAL REPORT |
MANAGER'S ANALYSIS (Unaudited) | October 31, 2014 |
GUGGENHEIM S&P SMALLCAP 600® PURE GROWTH ETF
For the one-year period ended October 31, 2014, Guggenheim S&P SmallCap 600® Pure Growth ETF (RZG) returned 8.96%. Over the year, its benchmark, the S&P SmallCap 600® Pure Growth Index, returned 9.21%. RZG achieved over 99% correlation to its benchmark on a daily basis.
For comparison, the S&P SmallCap 600® Growth Index returned 8.01% for the year.
The largest contributors to performance were the Health Care, Information Technology and Financials sectors. The Energy, Consumer Discretionary and Telecommunications Services sectors detracted most from performance.
Akorn, Inc., Repligen Corp. and Questor Pharmaceuticals, Inc. were the holdings contributing most to return. DXP Enterprises, Inc., Lumber Liquidators Holdings, Inc. and Winnebago Industries, Inc. were the largest detractors.
Cumulative Fund Performance: March 1, 2006 – October 31, 2014
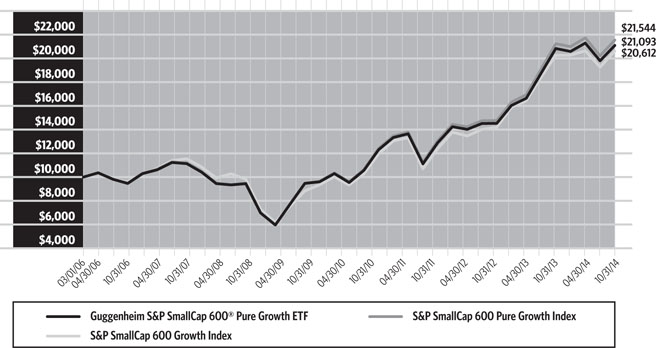
| AVERAGE ANNUAL TOTAL RETURNS FOR THE PERIOD ENDED OCTOBER 31, 2014 | ||||
| One Year | Three Year | Five Year | Since Inception (03/01/06) | |
Guggenheim S&P SmallCap 600® Pure Growth ETF | 8.96% | 18.04% | 19.22% | 8.99% |
| S&P SmallCap 600 Pure Growth Index | 9.21% | 18.39% | 19.66% | 9.26% |
| S&P SmallCap 600 Growth Index | 8.01% | 18.93% | 19.72% | 8.70% |
The returns presented above do not reflect the effect of taxes. Index returns represent total returns. Performance displayed represents past performance, which is no guarantee of future results.
| GUGGENHEIM ETFs ANNUAL REPORT | 19 |
PORTFOLIO SUMMARY (Unaudited) | October 31, 2014 |
GUGGENHEIM S&P SMALLCAP 600® PURE GROWTH ETF
Holdings Diversification*
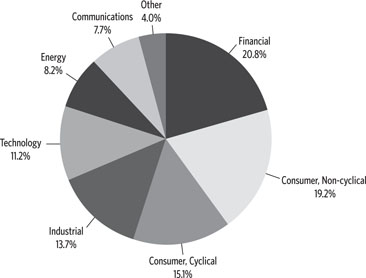
"Holdings Diversification (Market Exposure as % of Net Assets)" excludes any temporary cash investments.
* The Fund's Top Ten Holdings are expressed as a percentage of net assets and the Holdings Diversification is expressed as a percentage of the Fund's equity investments market value. These percentages may change over time.
| Ten Largest Holdings* | (% of Total Net Assets) |
| Akorn, Inc. | 2.5% |
| Repligen Corp. | 2.4% |
| US Silica Holdings, Inc. | 2.2% |
| Saia, Inc. | 1.4% |
| Taser International, Inc. | 1.4% |
| Matrix Service Co. | 1.4% |
| Multimedia Games Holding Company, Inc. | 1.3% |
| Electronics for Imaging, Inc. | 1.3% |
| Lithia Motors, Inc. — Class A | 1.3% |
| HCI Group, Inc. | 1.3% |
| Top Ten Total | 16.5% |
| "Ten Largest Holdings" exclude any temporary cash. | |
20 | GUGGENHEIM ETFs ANNUAL REPORT |
| SCHEDULE OF INVESTMENTS | October 31, 2014 |
GUGGENHEIM RUSSELL TOP 50® MEGA CAP ETF |
| Shares | Value | |||||||
COMMON STOCKS† - 99.8% | ||||||||
| CONSUMER, NON-CYCLICAL - 23.8% | ||||||||
| Johnson & Johnson | 198,868 | $ | 21,433,992 | |||||
| Procter & Gamble Co. | 190,210 | 16,599,627 | ||||||
| Pfizer, Inc. | 448,386 | 13,429,160 | ||||||
| Gilead Sciences, Inc.* | 107,952 | 12,090,624 | ||||||
| Merck & Company, Inc. | 205,424 | 11,902,267 | ||||||
| Coca-Cola Co. | 279,107 | 11,689,001 | ||||||
| PepsiCo, Inc. | 106,566 | 10,248,452 | ||||||
| Philip Morris International, Inc. | 110,560 | 9,840,946 | ||||||
| Amgen, Inc. | 53,215 | 8,630,409 | ||||||
| AbbVie, Inc. | 111,775 | 7,093,242 | ||||||
| Bristol-Myers Squibb Co. | 116,488 | 6,778,437 | ||||||
| Altria Group, Inc. | 139,633 | 6,749,859 | ||||||
| MasterCard, Inc. — Class A | 70,667 | 5,918,361 | ||||||
| Total Consumer, Non-cyclical | 142,404,377 | |||||||
| TECHNOLOGY - 19.1% | ||||||||
| Apple, Inc. | 423,847 | 45,775,476 | ||||||
| Microsoft Corp. | 580,660 | 27,261,987 | ||||||
| Intel Corp. | 349,925 | 11,900,949 | ||||||
| International Business Machines Corp. | 66,494 | 10,931,614 | ||||||
| QUALCOMM, Inc. | 118,645 | 9,314,819 | ||||||
| Oracle Corp. | 230,884 | 9,016,020 | ||||||
| Total Technology | 114,200,865 | |||||||
| COMMUNICATIONS - 17.2% | ||||||||
| Verizon Communications, Inc. | 291,099 | 14,627,724 | ||||||
| AT&T, Inc. | 364,859 | 12,711,688 | ||||||
| Google, Inc. — Class A* | 19,730 | 11,204,075 | ||||||
| Google, Inc. — Class C* | 19,966 | 11,162,591 | ||||||
| Walt Disney Co. | 121,739 | 11,124,510 | ||||||
| Facebook, Inc. — Class A* | 138,792 | 10,408,012 | ||||||
| Comcast Corp. — Class A | 182,088 | 10,078,571 | ||||||
| Cisco Systems, Inc. | 360,093 | 8,811,476 | ||||||
| Amazon.com, Inc.* | 26,412 | 8,067,810 | ||||||
| Twenty-First Century Fox, Inc. — Class A | 133,856 | 4,615,355 | ||||||
| Total Communications | 102,811,812 | |||||||
| FINANCIAL - 15.1% | ||||||||
| Berkshire Hathaway, Inc. — Class B* | 128,651 | 18,031,724 | ||||||
| Wells Fargo & Co. | 335,696 | 17,822,101 | ||||||
| JPMorgan Chase & Co. | 266,041 | 16,090,159 | ||||||
| Bank of America Corp. | 739,193 | 12,684,552 | ||||||
| Citigroup, Inc. | 213,541 | 11,430,850 | ||||||
| Visa, Inc. — Class A | 35,245 | 8,509,200 | ||||||
| American Express Co. | 63,766 | 5,735,752 | ||||||
| Total Financial | 90,304,338 | |||||||
| ENERGY - 10.9% | ||||||||
| Exxon Mobil Corp. | 301,872 | 29,194,041 | ||||||
| Chevron Corp. | 133,816 | 16,051,229 | ||||||
| Schlumberger Ltd. | 91,418 | 9,019,300 | ||||||
| ConocoPhillips | 86,300 | 6,226,545 | ||||||
| Occidental Petroleum Corp. | 55,226 | 4,911,248 | ||||||
| Total Energy | 65,402,363 | |||||||
| INDUSTRIAL - 8.5% | ||||||||
| General Electric Co. | 704,892 | 18,193,262 | ||||||
| Union Pacific Corp. | 63,674 | 7,414,837 | ||||||
| 3M Co. | 45,992 | 7,072,190 | ||||||
| United Technologies Corp. | 64,441 | 6,895,187 | ||||||
| Boeing Co. | 51,261 | 6,403,012 | ||||||
| United Parcel Service, Inc. — Class B | 49,755 | 5,219,797 | ||||||
| Total Industrial | 51,198,285 | |||||||
| CONSUMER, CYCLICAL - 5.2% | ||||||||
| Home Depot, Inc. | 96,137 | 9,375,280 | ||||||
| Wal-Mart Stores, Inc. | 111,992 | 8,541,630 | ||||||
| CVS Health Corp. | 82,192 | 7,052,896 | ||||||
| McDonald’s Corp. | 69,478 | 6,512,173 | ||||||
| Total Consumer, Cyclical | 31,481,979 | |||||||
| Total Common Stocks | ||||||||
| (Cost $488,591,369) | 597,804,019 | |||||||
SHORT TERM INVESTMENTS† - 0.1% | ||||||||
| Federated U.S. Treasury Cash Reserve Fund | 437,260 | 437,260 | ||||||
| Total Short Term Investments | ||||||||
| (Cost $437,260) | 437,260 | |||||||
| Total Investments - 99.9% | ||||||||
| (Cost $489,028,629) | $ | 598,241,279 | ||||||
| Other Assets & Liabilities, net - 0.1% | 555,903 | |||||||
| Total Net Assets - 100.0% | $ | 598,797,182 | ||||||
| * | Non-income producing security. |
| † | Value determined based on Level 1 inputs — See Note 4. |
| SEE NOTES TO FINANCIAL STATEMENTS. | GUGGENHEIM ETFs ANNUAL REPORT | 21 |
| SCHEDULE OF INVESTMENTS | October 31, 2014 |
GUGGENHEIM S&P 500® PURE VALUE ETF |
| Shares | Value | |||||||
COMMON STOCKS† - 99.9% | ||||||||
| FINANCIAL - 25.5% | ||||||||
| Berkshire Hathaway, Inc. — Class B* | 215,915 | $ | 30,262,646 | |||||
| Assurant, Inc. | 302,196 | 20,615,812 | ||||||
| Hartford Financial Services Group, Inc. | 433,242 | 17,147,718 | ||||||
| Allstate Corp. | 250,314 | 16,232,863 | ||||||
| Genworth Financial, Inc. — Class A* | 1,150,933 | 16,101,553 | ||||||
| American International Group, Inc. | 294,155 | 15,757,883 | ||||||
| XL Group plc — Class A | 464,099 | 15,723,674 | ||||||
| Unum Group | 447,798 | 14,983,322 | ||||||
| MetLife, Inc. | 274,973 | 14,914,536 | ||||||
| Capital One Financial Corp. | 146,866 | 12,156,099 | ||||||
| Morgan Stanley | 332,803 | 11,631,465 | ||||||
| SunTrust Banks, Inc. | 280,020 | 10,959,983 | ||||||
| Loews Corp. | 247,945 | 10,810,402 | ||||||
| Bank of America Corp. | 618,990 | 10,621,868 | ||||||
| Goldman Sachs Group, Inc. | 53,561 | 10,176,054 | ||||||
| Travelers Companies, Inc. | 100,571 | 10,137,557 | ||||||
| PNC Financial Services Group, Inc. | 113,296 | 9,787,641 | ||||||
| JPMorgan Chase & Co. | 159,449 | 9,643,476 | ||||||
| ACE Ltd. | 81,326 | 8,888,932 | ||||||
| NASDAQ OMX Group, Inc. | 199,975 | 8,650,919 | ||||||
| Bank of New York Mellon Corp. | 220,682 | 8,544,807 | ||||||
| Hudson City Bancorp, Inc. | 670,961 | 6,474,774 | ||||||
| BB&T Corp. | 164,441 | 6,229,025 | ||||||
| Chubb Corp. | 56,744 | 5,638,084 | ||||||
| Wells Fargo & Co. | 103,465 | 5,492,957 | ||||||
| Cincinnati Financial Corp. | 102,286 | 5,162,374 | ||||||
| Progressive Corp. | 174,342 | 4,604,372 | ||||||
| M&T Bank Corp. | 36,619 | 4,474,109 | ||||||
| Aflac, Inc. | 70,391 | 4,204,454 | ||||||
| Total Financial | 326,029,359 | |||||||
| UTILITIES - 17.3% | ||||||||
| Exelon Corp. | 481,725 | 17,626,317 | ||||||
| NRG Energy, Inc. | 570,351 | 17,099,123 | ||||||
| Entergy Corp. | 196,874 | 16,541,353 | ||||||
| Pepco Holdings, Inc. | 578,503 | 15,816,272 | ||||||
| Integrys Energy Group, Inc. | 206,344 | 14,997,082 | ||||||
| FirstEnergy Corp. | 284,727 | 10,631,706 | ||||||
| Edison International | 169,721 | 10,621,140 | ||||||
| PG&E Corp. | 188,486 | 9,484,616 | ||||||
| Consolidated Edison, Inc. | 144,900 | 9,180,864 | ||||||
| Xcel Energy, Inc. | 258,377 | 8,647,878 | ||||||
| AES Corp. | 612,536 | 8,618,382 | ||||||
| Public Service Enterprise Group, Inc. | 203,738 | 8,416,417 | ||||||
| SCANA Corp. | 153,129 | 8,405,251 | ||||||
| DTE Energy Co. | 100,124 | 8,226,188 | ||||||
| Pinnacle West Capital Corp. | 125,887 | 7,738,274 | ||||||
| PPL Corp. | 217,455 | 7,608,750 | ||||||
| Duke Energy Corp. | 91,000 | 7,475,650 | ||||||
| AGL Resources, Inc. | 138,650 | 7,474,622 | ||||||
| Northeast Utilities | 145,982 | 7,204,212 | ||||||
| American Electric Power Company, Inc. | 117,533 | 6,856,875 | ||||||
| TECO Energy, Inc. | 326,736 | 6,407,293 | ||||||
| CMS Energy Corp. | 173,681 | 5,674,158 | ||||||
| Total Utilities | 220,752,423 | |||||||
| CONSUMER, NON-CYCLICAL - 15.1% | ||||||||
| WellPoint, Inc. | 249,086 | 31,556,704 | ||||||
| Humana, Inc. | 170,747 | 23,708,221 | ||||||
| Archer-Daniels-Midland Co. | 437,030 | 20,540,410 | ||||||
| Tyson Foods, Inc. — Class A | 494,709 | 19,961,508 | ||||||
| Kroger Co. | 279,947 | 15,595,847 | ||||||
| Aetna, Inc. | 188,085 | 15,518,893 | ||||||
| UnitedHealth Group, Inc. | 126,054 | 11,976,391 | ||||||
| Cardinal Health, Inc. | 135,698 | 10,649,579 | ||||||
| Express Scripts Holding Co.* | 138,018 | 10,602,543 | ||||||
| Sysco Corp. | 268,172 | 10,335,349 | ||||||
| Molson Coors Brewing Co. — Class B | 119,949 | 8,921,807 | ||||||
| ConAgra Foods, Inc. | 131,119 | 4,503,938 | ||||||
| Quest Diagnostics, Inc. | 69,146 | 4,388,005 | ||||||
| Avery Dennison Corp. | 82,929 | 3,885,224 | ||||||
| Total Consumer, Non-cyclical | 192,144,419 | |||||||
| ENERGY - 13.3% | ||||||||
| Valero Energy Corp. | 427,325 | 21,404,709 | ||||||
| Tesoro Corp. | 274,817 | 19,624,682 | ||||||
| Phillips 66 | 228,841 | 17,964,019 | ||||||
| Nabors Industries Ltd. | 942,515 | 16,823,893 | ||||||
| Murphy Oil Corp. | 302,866 | 16,170,016 | ||||||
| Hess Corp. | 186,813 | 15,843,611 | ||||||
| Apache Corp. | 99,580 | 7,687,576 | ||||||
| Chevron Corp. | 62,881 | 7,542,576 | ||||||
| Marathon Oil Corp. | 198,536 | 7,028,174 | ||||||
| Baker Hughes, Inc. | 125,292 | 6,635,464 | ||||||
| Ensco plc — Class A | 146,017 | 5,926,830 | ||||||
| Denbury Resources, Inc. | 466,575 | 5,785,530 | ||||||
Transocean Ltd.1 | 193,504 | 5,772,224 | ||||||
| ConocoPhillips | 77,034 | 5,558,003 | ||||||
| Exxon Mobil Corp. | 51,544 | 4,984,820 | ||||||
| Noble Corporation plc | 230,647 | 4,825,135 | ||||||
| Total Energy | 169,577,262 | |||||||
| CONSUMER, CYCLICAL - 10.3% | ||||||||
| AutoNation, Inc.* | 242,941 | 13,910,802 | ||||||
| Staples, Inc. | 1,007,048 | 12,769,369 | ||||||
| General Motors Co. | 391,790 | 12,302,206 | ||||||
| CVS Health Corp. | 121,448 | 10,421,453 | ||||||
| Kohl’s Corp. | 186,306 | 10,101,512 | ||||||
| Ford Motor Co. | 714,170 | 10,062,655 | ||||||
| DR Horton, Inc. | 418,825 | 9,545,022 | ||||||
| Target Corp. | 147,820 | 9,138,233 | ||||||
| Whirlpool Corp. | 49,964 | 8,596,306 | ||||||
| Carnival Corp. | 190,068 | 7,631,230 | ||||||
| PulteGroup, Inc. | 383,134 | 7,352,341 | ||||||
| Wal-Mart Stores, Inc. | 95,445 | 7,279,590 | ||||||
22 | GUGGENHEIM ETFs ANNUAL REPORT | SEE NOTES TO FINANCIAL STATEMENTS. |
SCHEDULE OF INVESTMENTS (concluded) | October 31, 2014 |
GUGGENHEIM S&P 500® PURE VALUE ETF |
| Shares | Value | |||||||
| Costco Wholesale Corp. | 47,966 | $ | 6,397,225 | |||||
| Macy’s, Inc. | 94,820 | 5,482,492 | ||||||
| Total Consumer, Cyclical | 130,990,436 | |||||||
| INDUSTRIAL - 6.4% | ||||||||
| Jabil Circuit, Inc. | 877,924 | 18,392,507 | ||||||
| Ryder System, Inc. | 152,859 | 13,523,436 | ||||||
| L-3 Communications Holdings, Inc. | 109,975 | 13,357,564 | ||||||
| Fluor Corp. | 123,832 | 8,215,015 | ||||||
| Jacobs Engineering Group, Inc.* | 160,507 | 7,616,057 | ||||||
| Joy Global, Inc. | 109,878 | 5,782,879 | ||||||
| Bemis Company, Inc. | 133,557 | 5,137,938 | ||||||
| Stanley Black & Decker, Inc. | 52,538 | 4,919,658 | ||||||
| Deere & Co. | 56,613 | 4,842,676 | ||||||
| Total Industrial | 81,787,730 | |||||||
| BASIC MATERIALS - 5.6% | ||||||||
| Alcoa, Inc. | 2,256,942 | 37,826,348 | ||||||
| Allegheny Technologies, Inc. | 213,370 | 7,009,205 | ||||||
| Dow Chemical Co. | 138,015 | 6,817,941 | ||||||
| International Paper Co. | 119,954 | 6,072,071 | ||||||
| Mosaic Co. | 123,013 | 5,450,706 | ||||||
| Nucor Corp. | 76,673 | 4,144,942 | ||||||
| Freeport-McMoRan, Inc. | 132,589 | 3,778,787 | ||||||
| Total Basic Materials | 71,100,000 | |||||||
| TECHNOLOGY - 4.0% | ||||||||
| Hewlett-Packard Co. | 541,415 | 19,425,970 | ||||||
| Xerox Corp. | 1,451,783 | 19,279,678 | ||||||
| Computer Sciences Corp. | 203,617 | 12,298,467 | ||||||
| Total Technology | 51,004,115 | |||||||
| COMMUNICATIONS - 2.4% | ||||||||
Frontier Communications Corp.1 | 1,802,572 | 11,788,820 | ||||||
| CenturyLink, Inc. | 239,881 | 9,950,264 | ||||||
| Corning, Inc. | 426,506 | 8,713,518 | ||||||
| Total Communications | 30,452,602 | |||||||
| Total Common Stocks | ||||||||
| (Cost $1,205,143,735) | 1,273,838,346 | |||||||
SHORT TERM INVESTMENTS† - 0.1% | ||||||||
| Federated U.S. Treasury Cash Reserve Fund | 747,498 | 747,498 | ||||||
| Total Short Term Investments | ||||||||
| (Cost $747,498) | 747,498 | |||||||
| Face Amount | ||||||||
SECURITIES LENDING COLLATERAL††,2 - 1.3% | ||||||||
| Joint Repurchase Agreements | ||||||||
| HSBC Securities, Inc. | ||||||||
| issued 10/31/14 at 0.08% due 11/03/14 | $ | 10,780,118 | 10,780,118 | |||||
| BNP Paribas Securities Corp. | ||||||||
| issued 10/31/14 at 0.11% due 11/03/14 | 4,930,816 | 4,930,816 | ||||||
| Barclays Capital, Inc. | ||||||||
| issued 10/31/14 at 0.07% due 11/03/14 | 1,413,307 | 1,413,307 | ||||||
| Total Securities Lending Collateral | ||||||||
| (Cost $17,124,241) | 17,124,241 | |||||||
| Total Investments - 101.3% | ||||||||
| (Cost $1,223,015,474) | $ | 1,291,710,085 | ||||||
| Other Assets & Liabilities, net - (1.3)% | (16,647,776 | ) | ||||||
| Total Net Assets - 100.0% | $ | 1,275,062,309 | ||||||
| * | Non-income producing security. |
| † | Value determined based on Level 1 inputs — See Note 4. |
| †† | Value determined based on Level 2 inputs — See Note 4. |
| 1 | All or portion of this security is on loan at October 31, 2014 — See Note 5. |
| 2 | Securities lending collateral — See Note 5. |
| plc — Public Limited Company |
| SEE NOTES TO FINANCIAL STATEMENTS. | GUGGENHEIM ETFs ANNUAL REPORT | 23 |
| SCHEDULE OF INVESTMENTS | October 31, 2014 |
GUGGENHEIM S&P 500® PURE GROWTH ETF |
| Shares | Value | |||||||
COMMON STOCKS† - 100.1% | ||||||||
| CONSUMER, NON-CYCLICAL - 28.4% | ||||||||
| Keurig Green Mountain, Inc. | 282,957 | $ | 42,938,725 | |||||
| Vertex Pharmaceuticals, Inc.* | 345,702 | 38,939,873 | ||||||
| Celgene Corp.* | 335,496 | 35,928,267 | ||||||
| Actavis plc* | 144,119 | 34,983,446 | ||||||
| Gilead Sciences, Inc.* | 290,679 | 32,556,048 | ||||||
| Safeway, Inc. | 929,248 | 32,393,585 | ||||||
| Regeneron Pharmaceuticals, Inc.* | 79,698 | 31,378,697 | ||||||
| Constellation Brands, Inc. — Class A* | 284,497 | 26,042,855 | ||||||
| Biogen Idec, Inc.* | 70,098 | 22,507,066 | ||||||
| Allergan, Inc. | 110,016 | 20,909,641 | ||||||
| Alliance Data Systems Corp.* | 72,989 | 20,681,433 | ||||||
| United Rentals, Inc.* | 176,470 | 19,422,288 | ||||||
| Alexion Pharmaceuticals, Inc.* | 98,481 | 18,845,324 | ||||||
| Universal Health Services, Inc. — Class B | 177,850 | 18,444,824 | ||||||
| Boston Scientific Corp.* | 1,289,857 | 17,129,301 | ||||||
| Moody’s Corp. | 167,346 | 16,605,744 | ||||||
| Cigna Corp. | 150,571 | 14,992,354 | ||||||
| Robert Half International, Inc. | 267,827 | 14,671,563 | ||||||
| MasterCard, Inc. — Class A | 156,308 | 13,090,795 | ||||||
| Monster Beverage Corp.* | 118,462 | 11,950,446 | ||||||
| Perrigo Company plc | 60,647 | 9,791,458 | ||||||
| St. Jude Medical, Inc. | 123,528 | 7,926,792 | ||||||
| Coca-Cola Enterprises, Inc. | 145,414 | 6,303,697 | ||||||
| Total Consumer, Non-cyclical | 508,434,222 | |||||||
| CONSUMER, CYCLICAL - 20.0% | ||||||||
| Southwest Airlines Co. | 1,168,847 | 40,301,844 | ||||||
| Chipotle Mexican Grill, Inc. — Class A* | 48,962 | 31,237,756 | ||||||
| Under Armour, Inc. — Class A* | 422,564 | 27,711,747 | ||||||
| Delta Air Lines, Inc. | 683,593 | 27,500,946 | ||||||
| Michael Kors Holdings Ltd.* | 313,190 | 24,613,602 | ||||||
| Harman International Industries, Inc. | 205,771 | 22,087,459 | ||||||
| Wynn Resorts Ltd. | 110,055 | 20,911,551 | ||||||
| Goodyear Tire & Rubber Co. | 798,344 | 19,343,875 | ||||||
| PACCAR, Inc. | 229,030 | 14,960,240 | ||||||
| Tractor Supply Co. | 190,816 | 13,971,548 | ||||||
| Fossil Group, Inc.* | 134,752 | 13,698,888 | ||||||
| Wyndham Worldwide Corp. | 176,157 | 13,682,114 | ||||||
| NIKE, Inc. — Class B | 124,848 | 11,607,119 | ||||||
| BorgWarner, Inc. | 169,155 | 9,645,218 | ||||||
| Johnson Controls, Inc. | 201,423 | 9,517,237 | ||||||
| VF Corp. | 133,063 | 9,005,704 | ||||||
| O’Reilly Automotive, Inc.* | 48,041 | 8,449,451 | ||||||
| Dollar Tree, Inc.* | 138,002 | 8,358,781 | ||||||
| Starbucks Corp. | 89,760 | 6,782,266 | ||||||
| Harley-Davidson, Inc. | 97,457 | 6,402,925 | ||||||
| Bed Bath & Beyond, Inc.* | 95,042 | 6,400,128 | ||||||
| Mohawk Industries, Inc.* | 44,123 | 6,267,231 | ||||||
| TJX Companies, Inc. | 98,040 | 6,207,893 | ||||||
| Total Consumer, Cyclical | 358,665,523 | |||||||
| COMMUNICATIONS - 15.7% | ||||||||
| Facebook, Inc. — Class A* | 483,536 | 36,260,365 | ||||||
| TripAdvisor, Inc.* | 341,271 | 30,257,086 | ||||||
| Netflix, Inc.* | 75,436 | 29,628,998 | ||||||
| Priceline Group, Inc.* | 19,774 | 23,851,597 | ||||||
| News Corp. — Class A* | 1,383,210 | 21,412,091 | ||||||
VeriSign, Inc.*,1 | 355,827 | 21,264,222 | ||||||
| DIRECTV* | 219,438 | 19,045,023 | ||||||
| Comcast Corp. — Class A | 267,005 | 14,778,727 | ||||||
| Amazon.com, Inc.* | 46,425 | 14,180,981 | ||||||
| Interpublic Group of Companies, Inc. | 581,973 | 11,284,456 | ||||||
| Yahoo!, Inc.* | 201,965 | 9,300,489 | ||||||
| Google, Inc. — Class A* | 15,704 | 8,917,830 | ||||||
| Google, Inc. — Class C* | 15,704 | 8,779,792 | ||||||
| CBS Corp. — Class B | 146,340 | 7,934,555 | ||||||
| Time Warner Cable, Inc. | 49,631 | 7,306,180 | ||||||
| Viacom, Inc. — Class B | 99,161 | 7,207,021 | ||||||
| Discovery Communications, Inc. — Class A* | 130,977 | 4,630,037 | ||||||
| Discovery Communications, Inc. — Class C* | 130,977 | 4,582,885 | ||||||
| Total Communications | 280,622,335 | |||||||
| FINANCIAL - 13.1% | ||||||||
| Huntington Bancshares, Inc. | 3,461,639 | 34,304,842 | ||||||
| KeyCorp | 1,806,961 | 23,851,885 | ||||||
| Comerica, Inc. | 447,957 | 21,385,467 | ||||||
| Prudential Financial, Inc. | 230,185 | 20,380,580 | ||||||
| Fifth Third Bancorp | 1,018,101 | 20,351,839 | ||||||
| Discover Financial Services | 279,032 | 17,796,661 | ||||||
| Ameriprise Financial, Inc. | 139,262 | 17,570,687 | ||||||
| Charles Schwab Corp. | 461,758 | 13,238,602 | ||||||
| Affiliated Managers Group, Inc.* | 60,498 | 12,086,895 | ||||||
| Torchmark Corp. | 164,678 | 8,721,347 | ||||||
| Macerich Co. | 116,483 | 8,212,052 | ||||||
| Visa, Inc. — Class A | 33,607 | 8,113,738 | ||||||
| BlackRock, Inc. — Class A | 23,454 | 8,000,394 | ||||||
| Invesco Ltd. | 196,256 | 7,942,480 | ||||||
| American Express Co. | 81,145 | 7,298,993 | ||||||
| Intercontinental Exchange, Inc. | 27,415 | 5,710,270 | ||||||
| Total Financial | 234,966,732 | |||||||
| TECHNOLOGY - 9.3% | ||||||||
| Seagate Technology plc | 454,781 | 28,573,889 | ||||||
| Western Digital Corp. | 234,089 | 23,027,335 | ||||||
| First Solar, Inc.* | 278,036 | 16,376,320 | ||||||
| Cognizant Technology Solutions Corp. — Class A* | 314,119 | 15,344,713 | ||||||
| Electronic Arts, Inc.* | 352,057 | 14,423,775 | ||||||
| salesforce.com, Inc.* | 182,403 | 11,671,968 | ||||||
| SanDisk Corp. | 117,134 | 11,026,995 | ||||||
| QUALCOMM, Inc. | 130,845 | 10,272,641 | ||||||
| Cerner Corp.* | 160,437 | 10,162,080 | ||||||
| Micron Technology, Inc.* | 283,165 | 9,369,930 | ||||||
24 | GUGGENHEIM ETFs ANNUAL REPORT | SEE NOTES TO FINANCIAL STATEMENTS. |
SCHEDULE OF INVESTMENTS (concluded) | October 31, 2014 |
GUGGENHEIM S&P 500® PURE GROWTH ETF |
| Shares | Value | |||||||
| Fidelity National Information Services, Inc. | 145,417 | $ | 8,490,899 | |||||
| Pitney Bowes, Inc. | 336,736 | 8,330,849 | ||||||
| Total Technology | 167,071,394 | |||||||
| ENERGY - 7.0% | ||||||||
| EOG Resources, Inc. | 188,409 | 17,908,275 | ||||||
| Pioneer Natural Resources Co. | 94,122 | 17,794,705 | ||||||
| Halliburton Co. | 318,692 | 17,572,677 | ||||||
| Helmerich & Payne, Inc. | 195,513 | 16,974,439 | ||||||
| Cabot Oil & Gas Corp. — Class A | 496,355 | 15,436,641 | ||||||
| Range Resources Corp. | 132,985 | 9,096,174 | ||||||
| Schlumberger Ltd. | 80,814 | 7,973,109 | ||||||
| Noble Energy, Inc. | 132,675 | 7,646,060 | ||||||
| Equities Corp. | 78,566 | 7,388,347 | ||||||
Kinder Morgan, Inc.1 | 190,770 | 7,382,799 | ||||||
| Total Energy | 125,173,226 | |||||||
| INDUSTRIAL - 3.8% | ||||||||
| Textron, Inc. | 484,581 | 20,124,649 | ||||||
| Sealed Air Corp. | 401,421 | 14,551,511 | ||||||
| Boeing Co. | 77,675 | 9,702,384 | ||||||
| Thermo Fisher Scientific, Inc. | 78,606 | 9,241,707 | ||||||
| Flowserve Corp. | 105,608 | 7,180,288 | ||||||
| Precision Castparts Corp. | 30,848 | 6,808,154 | ||||||
| Total Industrial | 67,608,693 | |||||||
| BASIC MATERIALS - 2.8% | ||||||||
| LyondellBasell Industries N.V. — Class A | 230,558 | 21,126,030 | ||||||
| Ecolab, Inc. | 111,950 | 12,452,198 | ||||||
| Eastman Chemical Co. | 112,855 | 9,116,427 | ||||||
| PPG Industries, Inc. | 34,372 | 7,001,233 | ||||||
| Total Basic Materials | 49,695,888 | |||||||
| Total Common Stocks | ||||||||
| (Cost $1,607,451,362) | 1,792,238,013 | |||||||
SHORT TERM INVESTMENTS† - 0.0% | ||||||||
| Federated U.S. Treasury Cash Reserve Fund | 543,729 | 543,729 | ||||||
| Total Short Term Investments | ||||||||
| (Cost $543,729) | 543,729 | |||||||
| Face Amount | ||||||||
SECURITIES LENDING COLLATERAL††,2 - 1.2% | ||||||||
| Joint Repurchase Agreements | ||||||||
| HSBC Securities, Inc. | ||||||||
| issued 10/31/14 at 0.08% due 11/03/14 | $ | 13,973,450 | 13,973,450 | |||||
| BNP Paribas Securities Corp. | ||||||||
| issued 10/31/14 at 0.11% due 11/03/14 | 6,391,443 | 6,391,443 | ||||||
| Barclays Capital, Inc. | ||||||||
| issued 10/31/14 at 0.07% due 11/03/14 | 1,831,963 | 1,831,963 | ||||||
| Total Securities Lending Collateral | ||||||||
| (Cost $22,196,856) | 22,196,856 | |||||||
| Total Investments - 101.3% | ||||||||
| (Cost $1,630,191,947) | $ | 1,814,978,598 | ||||||
| Other Assets & Liabilities, net - (1.3)% | (22,462,524 | ) | ||||||
| Total Net Assets - 100.0% | $ | 1,792,516,074 | ||||||
| * | Non-income producing security. |
| † | Value determined based on Level 1 inputs — See Note 4. |
| †† | Value determined based on Level 2 inputs — See Note 4. |
| 1 | All or portion of this security is on loan at October 31, 2014 — See Note 5. |
| 2 | Securities lending collateral — See Note 5. |
| plc — Public Limited Company |
| SEE NOTES TO FINANCIAL STATEMENTS. | GUGGENHEIM ETFs ANNUAL REPORT | 25 |
| SCHEDULE OF INVESTMENTS | October 31, 2014 |
GUGGENHEIM S&P MIDCAP 400® PURE VALUE ETF |
| Shares | Value | |||||||
COMMON STOCKS† - 99.9% | ||||||||
| FINANCIAL - 21.1% | ||||||||
| Reinsurance Group of America, Inc. — Class A | 31,893 | $ | 2,686,986 | |||||
| Protective Life Corp. | 31,235 | 2,176,455 | ||||||
| Hanover Insurance Group, Inc. | 32,174 | 2,153,729 | ||||||
| First American Financial Corp. | 70,260 | 2,130,283 | ||||||
| Aspen Insurance Holdings Ltd. | 37,356 | 1,629,843 | ||||||
| Kemper Corp. | 38,729 | 1,427,164 | ||||||
| WR Berkley Corp. | 27,031 | 1,393,177 | ||||||
| American Financial Group, Inc. | 22,545 | 1,348,867 | ||||||
| Alleghany Corp.* | 2,995 | 1,330,619 | ||||||
| Everest Re Group Ltd. | 7,516 | 1,282,605 | ||||||
| StanCorp Financial Group, Inc. | 16,558 | 1,151,774 | ||||||
| HCC Insurance Holdings, Inc. | 18,673 | 974,544 | ||||||
| Mercury General Corp. | 15,302 | 812,842 | ||||||
| First Niagara Financial Group, Inc. | 97,191 | 727,960 | ||||||
| Astoria Financial Corp. | 52,416 | 689,270 | ||||||
| Janus Capital Group, Inc. | 43,005 | 644,645 | ||||||
| International Bancshares Corp. | 20,432 | 579,656 | ||||||
| Hancock Holding Co. | 15,674 | 551,568 | ||||||
| Fulton Financial Corp. | 40,618 | 482,542 | ||||||
Valley National Bancorp1 | 44,539 | 444,499 | ||||||
| New York Community Bancorp, Inc. | 26,782 | 427,173 | ||||||
| Total Financial | 25,046,201 | |||||||
| INDUSTRIAL - 18.7% | ||||||||
| Tech Data Corp.* | 53,174 | 3,175,551 | ||||||
AECOM Technology Corp.*,1 | 77,527 | 2,523,504 | ||||||
| Arrow Electronics, Inc.* | 43,473 | 2,471,875 | ||||||
| Avnet, Inc. | 56,406 | 2,439,560 | ||||||
Vishay Intertechnology, Inc.1 | 122,739 | 1,658,204 | ||||||
| Granite Construction, Inc. | 35,953 | 1,327,025 | ||||||
| AGCO Corp. | 28,417 | 1,259,157 | ||||||
| Exelis, Inc. | 54,157 | 966,702 | ||||||
| TimkenSteel Corp. | 23,234 | 942,836 | ||||||
| Greif, Inc. — Class A | 21,352 | 940,769 | ||||||
| Esterline Technologies Corp.* | 6,971 | 816,374 | ||||||
| Triumph Group, Inc. | 10,438 | 726,798 | ||||||
| Regal-Beloit Corp. | 9,798 | 695,364 | ||||||
| Tidewater, Inc. | 15,608 | 575,467 | ||||||
| KBR, Inc. | 28,781 | 549,141 | ||||||
| Werner Enterprises, Inc. | 19,877 | 547,413 | ||||||
| Itron, Inc.* | 13,765 | 535,871 | ||||||
| Total Industrial | 22,151,611 | |||||||
| CONSUMER, NON-CYCLICAL - 17.3% | ||||||||
| Health Net, Inc.* | 66,797 | 3,173,525 | ||||||
| Community Health Systems, Inc.* | 50,761 | 2,790,332 | ||||||
| LifePoint Hospitals, Inc.* | 32,304 | 2,261,280 | ||||||
| Centene Corp.* | 17,259 | 1,599,392 | ||||||
| WellCare Health Plans, Inc.* | 21,951 | 1,489,814 | ||||||
| Rent-A-Center, Inc. | 46,998 | 1,455,528 | ||||||
Dean Foods Co.1 | 91,669 | 1,348,451 | ||||||
Owens & Minor, Inc.1 | 37,403 | 1,246,268 | ||||||
| Manpowergroup, Inc. | 16,926 | 1,129,811 | ||||||
| Ingredion, Inc. | 11,058 | 854,231 | ||||||
| Apollo Education Group, Inc. — Class A* | 25,671 | 735,731 | ||||||
| United Natural Foods, Inc.* | 10,616 | 722,100 | ||||||
| DeVry Education Group, Inc. | 14,563 | 704,995 | ||||||
| Aaron’s, Inc. | 24,508 | 606,818 | ||||||
| Post Holdings, Inc.* | 12,650 | 474,375 | ||||||
| Total Consumer, Non-cyclical | 20,592,651 | |||||||
| CONSUMER, CYCLICAL - 14.3% | ||||||||
| Ingram Micro, Inc. — Class A* | 118,015 | 3,167,523 | ||||||
| JetBlue Airways Corp.* | 225,111 | 2,597,781 | ||||||
| Big Lots, Inc. | 47,342 | 2,161,162 | ||||||
| World Fuel Services Corp. | 44,480 | 1,834,355 | ||||||
| CST Brands, Inc. | 35,468 | 1,356,651 | ||||||
| Abercrombie & Fitch Co. — Class A | 36,951 | 1,237,119 | ||||||
| Oshkosh Corp. | 25,785 | 1,154,137 | ||||||
| MDC Holdings, Inc. | 45,012 | 1,099,193 | ||||||
| Foot Locker, Inc. | 14,380 | 805,424 | ||||||
| ANN, Inc.* | 15,131 | 580,879 | ||||||
JC Penney Company, Inc.*,1 | 64,007 | 487,093 | ||||||
| Ascena Retail Group, Inc.* | 37,037 | 461,111 | ||||||
| Total Consumer, Cyclical | 16,942,428 | |||||||
| UTILITIES - 7.7% | ||||||||
| UGI Corp. | 40,397 | 1,522,563 | ||||||
| PNM Resources, Inc. | 44,264 | 1,277,016 | ||||||
| Great Plains Energy, Inc. | 46,998 | 1,265,656 | ||||||
Hawaiian Electric Industries, Inc.1 | 40,898 | 1,151,688 | ||||||
| Westar Energy, Inc. | 24,526 | 927,328 | ||||||
| WGL Holdings, Inc. | 19,668 | 924,396 | ||||||
| Atmos Energy Corp. | 16,849 | 892,997 | ||||||
| IDACORP, Inc. | 10,438 | 659,995 | ||||||
| ONE Gas, Inc. | 13,381 | 507,809 | ||||||
| Total Utilities | 9,129,448 | |||||||
| BASIC MATERIALS - 7.3% | ||||||||
| Domtar Corp. | 39,937 | 1,640,213 | ||||||
| Steel Dynamics, Inc. | 69,750 | 1,604,947 | ||||||
| Commercial Metals Co. | 79,090 | 1,367,466 | ||||||
| Reliance Steel & Aluminum Co. | 17,957 | 1,211,738 | ||||||
| Ashland, Inc. | 10,969 | 1,185,420 | ||||||
| Olin Corp. | 36,079 | 874,555 | ||||||
| Cabot Corp. | 15,814 | 734,244 | ||||||
| Total Basic Materials | 8,618,583 | |||||||
| ENERGY - 6.3% | ||||||||
| HollyFrontier Corp. | 39,571 | 1,795,732 | ||||||
| Superior Energy Services, Inc. | 68,653 | 1,726,623 | ||||||
| Murphy USA, Inc.* | 30,072 | 1,723,126 | ||||||
| Rowan Companies plc — Class A | 42,561 | 1,032,955 | ||||||
26 | GUGGENHEIM ETFs ANNUAL REPORT | SEE NOTES TO FINANCIAL STATEMENTS. |
SCHEDULE OF INVESTMENTS (concluded) | October 31, 2014 |
GUGGENHEIM S&P MIDCAP 400® PURE VALUE ETF |
| Shares | Value | |||||||
| Unit Corp.* | 14,467 | $ | 700,492 | |||||
| WPX Energy, Inc.* | 26,951 | 515,303 | ||||||
| Total Energy | 7,494,231 | |||||||
| TECHNOLOGY - 5.5% | ||||||||
| Science Applications International Corp. | 41,383 | 2,024,042 | ||||||
| Lexmark International, Inc. — Class A | 37,546 | 1,620,485 | ||||||
| Leidos Holdings, Inc. | 40,069 | 1,465,323 | ||||||
| Fairchild Semiconductor International, Inc. — Class A* | 47,836 | 734,283 | ||||||
| Convergys Corp. | 34,333 | 692,497 | ||||||
| Total Technology | 6,536,630 | |||||||
| COMMUNICATIONS - 1.7% | ||||||||
| Telephone & Data Systems, Inc. | 77,155 | 1,978,254 | ||||||
| Total Common Stocks | ||||||||
| (Cost $106,902,035) | 118,490,037 | |||||||
| Face Amount | ||||||||
SECURITIES LENDING COLLATERAL††,2 - 5.7% | ||||||||
| Joint Repurchase Agreements | ||||||||
| HSBC Securities, Inc. | ||||||||
issued 10/31/14 at 0.08% due 11/03/14 | $ | 4,259,230 | 4,259,230 | |||||
| BNP Paribas Securities Corp. | ||||||||
| issued 10/31/14 at 0.11% due 11/03/14 | 1,948,168 | 1,948,168 | ||||||
| Barclays Capital, Inc. | ||||||||
| issued 10/31/14 at 0.07% due 11/03/14 | 558,398 | 558,398 | ||||||
| Total Securities Lending Collateral | ||||||||
| (Cost $6,765,796) | 6,765,796 | |||||||
| Total Investments - 105.6% | ||||||||
| (Cost $113,667,831) | $ | 125,255,833 | ||||||
| Other Assets & Liabilities, net - (5.6)% | (6,624,952 | ) | ||||||
| Total Net Assets - 100.0% | $ | 118,630,881 | ||||||
| * | Non-income producing security. |
| † | Value determined based on Level 1 inputs — See Note 4. |
| †† | Value determined based on Level 2 inputs — See Note 4. |
| 1 | All or portion of this security is on loan at October 31, 2014 — See Note 5. |
| 2 | Securities lending collateral — See Note 5. |
| plc — Public Limited Company |
| SEE NOTES TO FINANCIAL STATEMENTS. | GUGGENHEIM ETFs ANNUAL REPORT | 27 |
| SCHEDULE OF INVESTMENTS | October 31, 2014 |
GUGGENHEIM S&P MIDCAP 400® PURE GROWTH ETF |
| Shares | Value | |||||||
COMMON STOCKS† - 99.9% | ||||||||
| FINANCIAL - 22.0% | ||||||||
| Synovus Financial Corp. | 709,504 | $ | 17,993,021 | |||||
| Umpqua Holdings Corp. | 820,903 | 14,447,893 | ||||||
| SVB Financial Group* | 123,151 | 13,791,680 | ||||||
| BancorpSouth, Inc. | 576,960 | 13,287,389 | ||||||
| Cathay General Bancorp | 491,194 | 12,972,434 | ||||||
| Associated Banc-Corp. | 612,720 | 11,519,136 | ||||||
| Old Republic International Corp. | 738,721 | 10,910,909 | ||||||
| PacWest Bancorp | 240,106 | 10,242,922 | ||||||
| SLM Corp. | 846,060 | 8,079,873 | ||||||
| Signature Bank* | 64,296 | 7,788,174 | ||||||
| CBOE Holdings, Inc. | 127,486 | 7,514,025 | ||||||
| Washington Federal, Inc. | 305,302 | 6,664,743 | ||||||
| Waddell & Reed Financial, Inc. — Class A | 129,637 | 6,188,870 | ||||||
| City National Corp. | 66,924 | 5,267,588 | ||||||
| CoreLogic, Inc.* | 160,352 | 5,030,242 | ||||||
| East West Bancorp, Inc. | 126,564 | 4,652,493 | ||||||
| Omega Healthcare Investors, Inc. | 104,077 | 3,971,578 | ||||||
| Alexander & Baldwin, Inc. | 91,908 | 3,679,077 | ||||||
| Total Financial | 164,002,047 | |||||||
| INDUSTRIAL - 20.6% | ||||||||
| Trinity Industries, Inc. | 505,446 | 18,049,478 | ||||||
| AO Smith Corp. | 269,201 | 14,361,873 | ||||||
| Kirby Corp.* | 116,912 | 12,928,129 | ||||||
| Wabtec Corp. | 130,729 | 11,281,914 | ||||||
| Old Dominion Freight Line, Inc.* | 145,607 | 10,610,382 | ||||||
| B/E Aerospace, Inc.* | 130,987 | 9,751,982 | ||||||
| Packaging Corporation of America | 98,831 | 7,123,738 | ||||||
| Eagle Materials, Inc. | 78,094 | 6,827,758 | ||||||
| Belden, Inc. | 94,788 | 6,747,958 | ||||||
| Graco, Inc. | 84,422 | 6,627,127 | ||||||
| Gentex Corp. | 202,164 | 6,618,849 | ||||||
| Terex Corp. | 212,491 | 6,113,366 | ||||||
| Genesee & Wyoming, Inc. — Class A* | 58,318 | 5,610,192 | ||||||
| Fortune Brands Home & Security, Inc. | 128,817 | 5,571,335 | ||||||
| Lincoln Electric Holdings, Inc. | 70,927 | 5,140,789 | ||||||
| Cognex Corp.* | 125,038 | 4,946,503 | ||||||
| FEI Co. | 51,847 | 4,369,665 | ||||||
| IDEX Corp. | 53,135 | 3,980,343 | ||||||
| J.B. Hunt Transport Services, Inc. | 44,481 | 3,548,249 | ||||||
| Trimble Navigation Ltd.* | 115,292 | 3,096,743 | ||||||
| Total Industrial | 153,306,373 | |||||||
| CONSUMER, NON-CYCLICAL - 18.7% | ||||||||
| Salix Pharmaceuticals Ltd.* | 184,772 | 26,579,452 | ||||||
| United Therapeutics Corp.* | 139,172 | 18,227,356 | ||||||
| Endo International plc* | 202,683 | 13,563,546 | ||||||
| Corporate Executive Board Co. | 156,874 | 11,561,613 | ||||||
| WEX, Inc.* | 78,902 | 8,960,111 | ||||||
| Align Technology, Inc.* | 151,075 | 7,949,567 | ||||||
| Hain Celestial Group, Inc.* | 66,390 | 7,186,718 | ||||||
| Towers Watson & Co. — Class A | 63,113 | 6,960,733 | ||||||
| SUPERVALU, Inc.* | 785,293 | 6,777,079 | ||||||
| Cubist Pharmaceuticals, Inc.* | 84,219 | 6,088,192 | ||||||
| Charles River Laboratories International, Inc.* | 83,765 | 5,290,597 | ||||||
| Global Payments, Inc. | 60,883 | 4,901,082 | ||||||
| Graham Holdings Co. — Class B | 5,879 | 4,606,784 | ||||||
| Deluxe Corp. | 68,725 | 4,178,480 | ||||||
| Covance, Inc.* | 48,814 | 3,900,239 | ||||||
| Sotheby’s | 77,506 | 3,073,888 | ||||||
| Total Consumer, Non-cyclical | 139,805,437 | |||||||
| CONSUMER, CYCLICAL - 18.7% | ||||||||
| Tempur Sealy International, Inc.* | 265,476 | 13,974,657 | ||||||
| Deckers Outdoor Corp.* | 153,838 | 13,454,671 | ||||||
| Wendy’s Co. | 1,426,519 | 11,440,682 | ||||||
| Bally Technologies, Inc.* | 139,777 | 11,238,071 | ||||||
| Polaris Industries, Inc. | 72,771 | 10,978,233 | ||||||
| Toll Brothers, Inc.* | 322,668 | 10,309,243 | ||||||
| Alaska Air Group, Inc. | 191,448 | 10,190,777 | ||||||
| LKQ Corp.* | 288,675 | 8,247,445 | ||||||
| Hanesbrands, Inc. | 77,762 | 8,212,445 | ||||||
| Jarden Corp.* | 124,448 | 8,100,320 | ||||||
| Brinker International, Inc. | 129,416 | 6,941,874 | ||||||
| HNI Corp. | 145,341 | 6,780,158 | ||||||
| Brunswick Corp. | 118,061 | 5,525,255 | ||||||
| Domino’s Pizza, Inc. | 50,678 | 4,499,700 | ||||||
| Copart, Inc.* | 126,726 | 4,237,717 | ||||||
| Carter’s, Inc. | 43,818 | 3,423,500 | ||||||
| DreamWorks Animation SKG, Inc. — Class A* | 95,982 | 2,138,479 | ||||||
| Total Consumer, Cyclical | 139,693,227 | |||||||
| TECHNOLOGY - 10.2% | ||||||||
| Ultimate Software Group, Inc.* | 67,006 | 10,085,072 | ||||||
| PTC, Inc.* | 243,610 | 9,293,722 | ||||||
Concur Technologies, Inc.*,1 | 60,361 | 7,745,524 | ||||||
| Mentor Graphics Corp. | 351,551 | 7,449,366 | ||||||
3D Systems Corp.*,1 | 193,755 | 7,323,939 | ||||||
| ACI Worldwide, Inc.* | 370,151 | 7,121,705 | ||||||
| MSCI, Inc. — Class A | 117,922 | 5,502,241 | ||||||
| Advent Software, Inc. | 138,315 | 4,780,166 | ||||||
| Fair Isaac Corp. | 75,432 | 4,699,414 | ||||||
| Broadridge Financial Solutions, Inc. | 90,529 | 3,976,939 | ||||||
| Cree, Inc.* | 96,918 | 3,050,979 | ||||||
| CommVault Systems, Inc.* | 54,216 | 2,403,937 | ||||||
| Acxiom Corp.* | 120,563 | 2,271,407 | ||||||
| Total Technology | 75,704,411 | |||||||
| ENERGY - 6.8% | ||||||||
| Patterson-UTI Energy, Inc. | 528,739 | 12,176,859 | ||||||
| SM Energy Co. | 145,412 | 8,186,696 | ||||||
| Oil States International, Inc.* | 134,375 | 8,027,562 | ||||||
| Oceaneering International, Inc. | 90,466 | 6,357,046 | ||||||
| Rosetta Resources, Inc.* | 163,780 | 6,228,553 | ||||||
| Dril-Quip, Inc.* | 42,022 | 3,779,879 | ||||||
28 | GUGGENHEIM ETFs ANNUAL REPORT | SEE NOTES TO FINANCIAL STATEMENTS. |
SCHEDULE OF INVESTMENTS (concluded) | October 31, 2014 |
GUGGENHEIM S&P MIDCAP 400® PURE GROWTH ETF |
| Shares | Value | |||||||
| Gulfport Energy Corp.* | 69,318 | $ | 3,478,377 | |||||
CARBO Ceramics, Inc.1 | 47,052 | 2,431,177 | ||||||
| Total Energy | 50,666,149 | |||||||
| COMMUNICATIONS - 2.0% | ||||||||
| Conversant, Inc.* | 223,236 | 7,869,069 | ||||||
| Ciena Corp.* | 219,967 | 3,686,647 | ||||||
NeuStar, Inc. — Class A*,1 | 119,868 | 3,165,714 | ||||||
| Total Communications | 14,721,430 | |||||||
| BASIC MATERIALS - 0.9% | ||||||||
| Worthington Industries, Inc. | 182,326 | 7,046,900 | ||||||
| Total Common Stocks | ||||||||
| (Cost $670,356,834) | 744,945,974 | |||||||
SHORT TERM INVESTMENTS† - 0.1% | ||||||||
| Federated U.S. Treasury Cash Reserve Fund | 868,040 | 868,040 | ||||||
| Total Short Term Investments | ||||||||
| (Cost $868,040) | 868,040 | |||||||
| Face Amount | ||||||||
SECURITIES LENDING COLLATERAL††,2 - 2.7% | ||||||||
| Joint Repurchase Agreements | ||||||||
| HSBC Securities, Inc. | ||||||||
| issued 10/31/14 at 0.08% due 11/03/14 | $ | 12,788,043 | 12,788,043 | |||||
| BNP Paribas Securities Corp. | ||||||||
| issued 10/31/14 at 0.11% due 11/03/14 | 5,849,239 | 5,849,239 | ||||||
| Barclays Capital, Inc. | ||||||||
| issued 10/31/14 at 0.07% due 11/03/14 | 1,676,553 | 1,676,553 | ||||||
| Total Securities Lending Collateral | ||||||||
| (Cost $20,313,835) | 20,313,835 | |||||||
| Total Investments - 102.7% | ||||||||
| (Cost $691,538,709) | $ | 766,127,849 | ||||||
| Other Assets & Liabilities, net - (2.7)% | (20,185,434 | ) | ||||||
| Total Net Assets - 100.0% | $ | 745,942,415 | ||||||
| * | Non-income producing security. |
| † | Value determined based on Level 1 inputs — See Note 4. |
| †† | Value determined based on Level 2 inputs — See Note 4. |
| 1 | All or portion of this security is on loan at October 31, 2014 — See Note 5. |
| 2 | Securities lending collateral — See Note 5. |
| plc — Public Limited Company |
| SEE NOTES TO FINANCIAL STATEMENTS. | GUGGENHEIM ETFs ANNUAL REPORT | 29 |
| SCHEDULE OF INVESTMENTS | October 31, 2014 |
GUGGENHEIM S&P SMALLCAP 600® PURE VALUE ETF |
| Shares | Value | |||||||
COMMON STOCKS† - 99.9% | ||||||||
| CONSUMER, CYCLICAL - 21.1% | ||||||||
| Perry Ellis International, Inc.* | 150,527 | $ | 3,078,277 | |||||
| Cash America International, Inc. | 50,491 | 2,481,632 | ||||||
| EZCORP, Inc. — Class A* | 183,709 | 2,072,238 | ||||||
| Group 1 Automotive, Inc. | 23,856 | 2,038,019 | ||||||
| SkyWest, Inc. | 155,184 | 1,787,720 | ||||||
| Regis Corp. | 93,213 | 1,582,757 | ||||||
| M/I Homes, Inc.* | 73,222 | 1,577,202 | ||||||
| Fred’s, Inc. — Class A | 95,786 | 1,503,840 | ||||||
| Sonic Automotive, Inc. — Class A | 57,105 | 1,421,343 | ||||||
| Ruby Tuesday, Inc.* | 180,865 | 1,389,044 | ||||||
| United Stationers, Inc. | 31,246 | 1,305,146 | ||||||
| Superior Industries International, Inc. | 66,080 | 1,289,220 | ||||||
| ScanSource, Inc.* | 33,640 | 1,284,375 | ||||||
| Brown Shoe Company, Inc. | 45,156 | 1,200,697 | ||||||
| Stage Stores, Inc. | 70,127 | 1,183,042 | ||||||
| Marcus Corp. | 65,614 | 1,123,968 | ||||||
| Titan International, Inc. | 101,367 | 1,070,436 | ||||||
| Pep Boys-Manny Moe & Jack* | 111,354 | 1,061,204 | ||||||
| VOXX International Corp. — Class A* | 124,088 | 1,058,471 | ||||||
| Big 5 Sporting Goods Corp. | 76,459 | 941,210 | ||||||
| Stein Mart, Inc. | 66,993 | 896,366 | ||||||
| Genesco, Inc.* | 10,086 | 773,495 | ||||||
| Biglari Holdings, Inc.* | 2,190 | 764,660 | ||||||
| Christopher & Banks Corp.* | 97,102 | 634,076 | ||||||
| Standard Pacific Corp.* | 83,170 | 615,458 | ||||||
| Children’s Place, Inc. | 11,750 | 578,688 | ||||||
| Meritage Homes Corp.* | 13,741 | 505,531 | ||||||
| Crocs, Inc.* | 40,124 | 468,648 | ||||||
| Finish Line, Inc. — Class A | 15,443 | 408,776 | ||||||
Aeropostale, Inc.*,1 | 44,998 | 135,444 | ||||||
| Total Consumer, Cyclical | 36,230,983 | |||||||
| CONSUMER, NON-CYCLICAL - 20.8% | ||||||||
| Central Garden and Pet Co. — Class A* | 309,056 | 2,654,791 | ||||||
| CDI Corp. | 126,841 | 2,180,398 | ||||||
| Molina Healthcare, Inc.* | 44,702 | 2,174,306 | ||||||
| PharMerica Corp.* | 73,260 | 2,101,829 | ||||||
| Universal Corp. | 46,433 | 2,066,269 | ||||||
| Seneca Foods Corp. — Class A* | 76,799 | 2,064,357 | ||||||
| Kindred Healthcare, Inc. | 76,225 | 1,657,894 | ||||||
| Cross Country Healthcare, Inc.* | 167,156 | 1,616,399 | ||||||
| SpartanNash Co. | 70,976 | 1,590,572 | ||||||
| Magellan Health, Inc.* | 26,024 | 1,574,972 | ||||||
| Kelly Services, Inc. — Class A | 89,261 | 1,573,671 | ||||||
| ABM Industries, Inc. | 53,906 | 1,489,962 | ||||||
| LHC Group, Inc.* | 49,605 | 1,207,882 | ||||||
| Almost Family, Inc.* | 37,616 | 1,107,415 | ||||||
| Viad Corp. | 40,655 | 1,037,109 | ||||||
| Heidrick & Struggles International, Inc. | 46,715 | 972,606 | ||||||
| Career Education Corp.* | 165,413 | 959,395 | ||||||
| Monster Worldwide, Inc.* | 244,863 | 945,171 | ||||||
| Sanderson Farms, Inc. | 11,245 | 944,355 | ||||||
| Insperity, Inc. | 27,579 | 870,393 | ||||||
| Brink’s Co. | 40,830 | 857,430 | ||||||
| Invacare Corp. | 49,470 | 777,174 | ||||||
| AngioDynamics, Inc.* | 39,625 | 673,625 | ||||||
| AMN Healthcare Services, Inc.* | 37,920 | 650,328 | ||||||
| Healthways, Inc.* | 36,324 | 563,022 | ||||||
| Resources Connection, Inc. | 33,351 | 515,940 | ||||||
| Alliance One International, Inc.* | 250,191 | 507,887 | ||||||
| Korn/Ferry International* | 16,601 | 463,666 | ||||||
| Total Consumer, Non-cyclical | 35,798,818 | |||||||
| INDUSTRIAL - 16.9% | ||||||||
| Sanmina Corp.* | 125,547 | 3,147,464 | ||||||
| Atlas Air Worldwide Holdings, Inc.* | 51,280 | 1,893,258 | ||||||
| Benchmark Electronics, Inc.* | 76,396 | 1,812,113 | ||||||
| Griffon Corp. | 138,462 | 1,701,698 | ||||||
| Boise Cascade Co.* | 46,678 | 1,683,208 | ||||||
| EMCOR Group, Inc. | 33,945 | 1,497,993 | ||||||
| Universal Forest Products, Inc. | 28,344 | 1,416,350 | ||||||
| Bel Fuse, Inc. — Class B | 47,415 | 1,341,370 | ||||||
| Olympic Steel, Inc. | 65,096 | 1,309,732 | ||||||
| AAR Corp. | 44,385 | 1,176,203 | ||||||
| Hub Group, Inc. — Class A* | 31,467 | 1,141,938 | ||||||
| Aegion Corp. — Class A* | 56,950 | 1,043,324 | ||||||
| TTM Technologies, Inc.* | 148,893 | 1,028,851 | ||||||
| Plexus Corp.* | 21,633 | 894,525 | ||||||
| Briggs & Stratton Corp. | 37,882 | 765,595 | ||||||
| Kaman Corp. | 17,601 | 757,899 | ||||||
| Astec Industries, Inc. | 19,655 | 745,121 | ||||||
| Gibraltar Industries, Inc.* | 48,460 | 739,015 | ||||||
AM Castle & Co.*,1 | 95,241 | 700,021 | ||||||
| Matson, Inc. | 22,919 | 652,962 | ||||||
| Curtiss-Wright Corp. | 9,135 | 632,233 | ||||||
| Mueller Industries, Inc. | 18,656 | 605,574 | ||||||
| Quanex Building Products Corp. | 26,220 | 524,924 | ||||||
| Rofin-Sinar Technologies, Inc.* | 23,100 | 517,209 | ||||||
| UTI Worldwide, Inc.* | 43,871 | 479,510 | ||||||
National Presto Industries, Inc.1 | 6,457 | 407,178 | ||||||
| Orion Marine Group, Inc.* | 36,889 | 404,303 | ||||||
| Total Industrial | 29,019,571 | |||||||
| FINANCIAL - 10.9% | ||||||||
| Stewart Information Services Corp. | 70,790 | 2,500,303 | ||||||
| Piper Jaffray Cos.* | 31,724 | 1,791,137 | ||||||
| Calamos Asset Management, Inc. — Class A | 113,110 | 1,549,607 | ||||||
| United Fire Group, Inc. | 47,456 | 1,541,371 | ||||||
| Navigators Group, Inc.* | 20,180 | 1,374,056 | ||||||
| Infinity Property & Casualty Corp. | 18,395 | 1,343,019 | ||||||
| Horace Mann Educators Corp. | 34,417 | 1,046,621 | ||||||
| Safety Insurance Group, Inc. | 15,940 | 994,337 | ||||||
| Wintrust Financial Corp. | 18,236 | 844,692 | ||||||
| Selective Insurance Group, Inc. | 32,634 | 842,610 | ||||||
| Meadowbrook Insurance Group, Inc. | 128,309 | 817,328 | ||||||
| Capstead Mortgage Corp. | 60,864 | 773,581 | ||||||
| Susquehanna Bancshares, Inc. | 74,631 | 732,130 | ||||||
30 | GUGGENHEIM ETFs ANNUAL REPORT | SEE NOTES TO FINANCIAL STATEMENTS. |
SCHEDULE OF INVESTMENTS (concluded) | October 31, 2014 |
GUGGENHEIM S&P SMALLCAP 600® PURE VALUE ETF |
| Shares | Value | |||||||
| Brookline Bancorp, Inc. | 72,690 | $ | 697,097 | |||||
| Provident Financial Services, Inc. | 27,678 | 504,570 | ||||||
| SWS Group, Inc.* | 67,747 | 500,650 | ||||||
| ProAssurance Corp. | 10,255 | 479,729 | ||||||
| FNB Corp. | 35,791 | 457,767 | ||||||
| Total Financial | 18,790,605 | |||||||
| TECHNOLOGY - 10.2% | ||||||||
| Engility Holdings, Inc.* | 60,395 | 2,609,065 | ||||||
| ManTech International Corp. — Class A | 87,132 | 2,453,637 | ||||||
| CACI International, Inc. — Class A* | 24,454 | 2,012,320 | ||||||
| Super Micro Computer, Inc.* | 58,577 | 1,872,121 | ||||||
| Insight Enterprises, Inc.* | 72,596 | 1,651,559 | ||||||
| SYNNEX Corp. | 22,900 | 1,584,222 | ||||||
| Ciber, Inc.* | 432,724 | 1,415,007 | ||||||
| Kulicke & Soffa Industries, Inc.* | 42,853 | 617,940 | ||||||
| Brooks Automation, Inc. | 48,975 | 603,862 | ||||||
| Diodes, Inc.* | 22,463 | 580,219 | ||||||
Ebix, Inc.1 | 39,004 | 575,309 | ||||||
| Mercury Systems, Inc.* | 40,585 | 567,378 | ||||||
| Rudolph Technologies, Inc.* | 53,383 | 468,703 | ||||||
| Digi International, Inc.* | 54,111 | 448,039 | ||||||
| Total Technology | 17,459,381 | |||||||
| BASIC MATERIALS - 6.8% | ||||||||
| Century Aluminum Co.* | 132,466 | 3,878,605 | ||||||
| Materion Corp. | 53,189 | 2,098,306 | ||||||
| A. Schulman, Inc. | 32,132 | 1,137,794 | ||||||
| Kaiser Aluminum Corp. | 16,034 | 1,115,165 | ||||||
| Clearwater Paper Corp.* | 11,455 | 737,128 | ||||||
| Neenah Paper, Inc. | 10,050 | 613,151 | ||||||
| PH Glatfelter Co. | 23,677 | 597,371 | ||||||
| Zep, Inc. | 34,246 | 549,991 | ||||||
| Kraton Performance Polymers, Inc.* | 23,931 | 428,126 | ||||||
| OM Group, Inc. | 12,638 | 328,967 | ||||||
| Stepan Co. | 6,330 | 280,292 | ||||||
| Total Basic Materials | 11,764,896 | |||||||
| ENERGY - 6.2% | ||||||||
| Green Plains, Inc. | 124,957 | 4,273,529 | ||||||
| Pioneer Energy Services Corp.* | 189,831 | 1,742,648 | ||||||
| Exterran Holdings, Inc. | 32,547 | 1,280,074 | ||||||
| Cloud Peak Energy, Inc.* | 83,399 | 998,286 | ||||||
| Gulf Island Fabrication, Inc. | 39,571 | 836,531 | ||||||
Swift Energy Co.*,1 | 110,166 | 754,637 | ||||||
| SEACOR Holdings, Inc.* | 4,698 | 387,350 | ||||||
Arch Coal, Inc.1 | 176,542 | 381,331 | ||||||
| Total Energy | 10,654,386 | |||||||
| COMMUNICATIONS - 4.7% | ||||||||
| Black Box Corp. | 83,457 | 1,835,220 | ||||||
| Scholastic Corp. | 50,599 | 1,761,351 | ||||||
| Anixter International, Inc. | 11,464 | 976,389 | ||||||
| Spok Holdings, Inc. | 58,606 | 951,761 | ||||||
| Oplink Communications, Inc. | 41,208 | 859,187 | ||||||
| Atlantic Tele-Network, Inc. | 11,771 | 790,893 | ||||||
| NETGEAR, Inc.* | 21,367 | 727,333 | ||||||
| Sizmek, Inc.* | 40,564 | 232,432 | ||||||
| Total Communications | 8,134,566 | |||||||
| UTILITIES - 2.3% | ||||||||
| New Jersey Resources Corp. | 19,353 | 1,131,764 | ||||||
| Avista Corp. | 31,549 | 1,118,412 | ||||||
| Laclede Group, Inc. | 12,030 | 610,763 | ||||||
| NorthWestern Corp. | 10,516 | 555,665 | ||||||
| UIL Holdings Corp. | 11,443 | 470,765 | ||||||
| Total Utilities | 3,887,369 | |||||||
| Total Common Stocks | ||||||||
| (Cost $155,493,820) | 171,740,575 | |||||||
SHORT TERM INVESTMENTS† - 0.1% | ||||||||
| Federated U.S. Treasury Cash Reserve Fund | 226,515 | 226,515 | ||||||
| Total Short Term Investments | ||||||||
| (Cost $226,515) | 226,515 | |||||||
| Face Amount | ||||||||
SECURITIES LENDING COLLATERAL††,2 - 1.7% | ||||||||
| Joint Repurchase Agreements | ||||||||
| HSBC Securities, Inc. | ||||||||
| issued 10/31/14 at 0.08% due 11/03/14 | $ | 1,826,935 | 1,826,935 | |||||
| BNP Paribas Securities Corp. | ||||||||
| issued 10/31/14 at 0.11% due 11/03/14 | 835,638 | 835,638 | ||||||
| Barclays Capital, Inc. | ||||||||
| issued 10/31/14 at 0.07% due 11/03/14 | 239,517 | 239,517 | ||||||
| Total Securities Lending Collateral | ||||||||
| (Cost $2,902,090) | 2,902,090 | |||||||
| Total Investments - 101.7% | ||||||||
| (Cost $158,622,425) | $ | 174,869,180 | ||||||
| Other Assets & Liabilities, net - (1.7)% | (2,879,300 | ) | ||||||
| Total Net Assets - 100.0% | $ | 171,989,880 | ||||||
| * | Non-income producing security. |
| † | Value determined based on Level 1 inputs — See Note 4. |
| †† | Value determined based on Level 2 inputs — See Note 4. |
| 1 | All or portion of this security is on loan at October 31, 2014 — See Note 5. |
| 2 | Securities lending collateral — See Note 5. |
| SEE NOTES TO FINANCIAL STATEMENTS. | GUGGENHEIM ETFs ANNUAL REPORT | 31 |
| SCHEDULE OF INVESTMENTS | October 31, 2014 |
GUGGENHEIM S&P SMALLCAP 600® PURE GROWTH ETF |
| Shares | Value | |||||||
COMMON STOCKS† - 99.9% | ||||||||
| FINANCIAL - 20.8% | ||||||||
| HCI Group, Inc. | 26,138 | $ | 1,328,856 | |||||
| MB Financial, Inc. | 40,217 | 1,268,847 | ||||||
| United Community Banks, Inc. | 61,069 | 1,101,074 | ||||||
| PrivateBancorp, Inc. — Class A | 32,542 | 1,051,758 | ||||||
| Portfolio Recovery Associates, Inc.* | 15,310 | 968,357 | ||||||
| Pinnacle Financial Partners, Inc. | 24,277 | 951,658 | ||||||
| HFF, Inc. — Class A | 29,293 | 922,144 | ||||||
| CoreSite Realty Corp. | 23,873 | 883,778 | ||||||
| Forestar Group, Inc.* | 50,348 | 878,573 | ||||||
| Virtus Investment Partners, Inc. | 4,810 | 862,000 | ||||||
| BBCN Bancorp, Inc. | 57,892 | 818,593 | ||||||
| Retail Opportunity Investments Corp. | 49,336 | 806,150 | ||||||
| Bank of the Ozarks, Inc. | 21,777 | 767,422 | ||||||
| First Midwest Bancorp, Inc. | 45,367 | 761,712 | ||||||
| Home BancShares, Inc. | 23,673 | 755,642 | ||||||
| Sabra Health Care REIT, Inc. | 26,223 | 749,191 | ||||||
| Encore Capital Group, Inc.* | 16,384 | 745,636 | ||||||
| BofI Holding, Inc.* | 9,106 | 701,344 | ||||||
| MarketAxess Holdings, Inc. | 10,794 | 697,832 | ||||||
| Oritani Financial Corp. | 45,644 | 674,162 | ||||||
| Boston Private Financial Holdings, Inc. | 47,016 | 618,260 | ||||||
| Wilshire Bancorp, Inc. | 59,813 | 592,149 | ||||||
| Employers Holdings, Inc. | 28,273 | 576,486 | ||||||
| Evercore Partners, Inc. — Class A | 9,813 | 508,019 | ||||||
| Glacier Bancorp, Inc. | 17,546 | 503,395 | ||||||
| Texas Capital Bancshares, Inc.* | 7,102 | 434,287 | ||||||
First Financial Bankshares, Inc.1 | 8,409 | 267,238 | ||||||
| Financial Engines, Inc. | 6,085 | 242,609 | ||||||
| eHealth, Inc.* | 8,008 | 199,800 | ||||||
| Total Financial | 21,636,972 | |||||||
| CONSUMER, NON-CYCLICAL - 19.2% | ||||||||
| Akorn, Inc.* | 58,506 | 2,606,443 | ||||||
| Repligen Corp.* | 98,599 | 2,486,667 | ||||||
| Natus Medical, Inc.* | 35,057 | 1,191,938 | ||||||
ABIOMED, Inc.*,1 | 35,322 | 1,158,208 | ||||||
| On Assignment, Inc.* | 36,002 | 1,047,658 | ||||||
| Cambrex Corp.* | 46,901 | 988,673 | ||||||
| Anika Therapeutics, Inc.* | 22,894 | 918,965 | ||||||
| Acorda Therapeutics, Inc.* | 24,457 | 851,593 | ||||||
| Cantel Medical Corp. | 19,959 | 846,262 | ||||||
Boston Beer Company, Inc. — Class A*,1 | 3,278 | 816,222 | ||||||
| Prestige Brands Holdings, Inc.* | 20,134 | 713,146 | ||||||
| Ligand Pharmaceuticals, Inc. — Class B* | 11,644 | 643,564 | ||||||
| Capella Education Co. | 8,401 | 594,287 | ||||||
| CryoLife, Inc. | 57,693 | 591,930 | ||||||
| Lannett Company, Inc.* | 10,096 | 572,645 | ||||||
| Inter Parfums, Inc. | 19,158 | 544,087 | ||||||
| NuVasive, Inc.* | 12,794 | 523,275 | ||||||
| CorVel Corp.* | 12,820 | 441,264 | ||||||
| Cardtronics, Inc.* | 11,238 | 431,427 | ||||||
| Medicines Co.* | 14,741 | 373,242 | ||||||
| SurModics, Inc.* | 16,080 | 348,132 | ||||||
| IPC The Hospitalist Company, Inc.* | 8,288 | 345,278 | ||||||
| Air Methods Corp.* | 6,884 | 325,131 | ||||||
| West Pharmaceutical Services, Inc. | 5,856 | 300,120 | ||||||
| American Public Education, Inc.* | 8,895 | 275,656 | ||||||
| Neogen Corp.* | 4,807 | 211,027 | ||||||
| Total Consumer, Non-cyclical | 20,146,840 | |||||||
| CONSUMER, CYCLICAL - 15.1% | ||||||||
| Multimedia Games Holding Company, Inc.* | 40,327 | 1,407,413 | ||||||
| Lithia Motors, Inc. — Class A | 17,865 | 1,386,681 | ||||||
| MarineMax, Inc.* | 61,358 | 1,176,233 | ||||||
| Universal Electronics, Inc.* | 17,022 | 968,381 | ||||||
| Buffalo Wild Wings, Inc.* | 6,464 | 964,947 | ||||||
| Iconix Brand Group, Inc.* | 18,214 | 728,742 | ||||||
| MWI Veterinary Supply, Inc.* | 3,686 | 625,348 | ||||||
| Winnebago Industries, Inc.* | 27,673 | 586,944 | ||||||
| Daktronics, Inc. | 43,592 | 580,210 | ||||||
| Monarch Casino & Resort, Inc.* | 32,661 | 531,394 | ||||||
| Arctic Cat, Inc. | 15,432 | 519,441 | ||||||
| Ruth’s Hospitality Group, Inc. | 42,405 | 516,069 | ||||||
| Pinnacle Entertainment, Inc.* | 20,063 | 514,215 | ||||||
| Sonic Corp. | 19,147 | 482,696 | ||||||
| Red Robin Gourmet Burgers, Inc.* | 8,348 | 458,890 | ||||||
| Wolverine World Wide, Inc. | 16,900 | 458,666 | ||||||
| Allegiant Travel Co. — Class A | 3,069 | 409,619 | ||||||
| Papa John’s International, Inc. | 8,720 | 407,747 | ||||||
| Scientific Games Corp. — Class A* | 34,621 | 407,489 | ||||||
| Movado Group, Inc. | 11,033 | 389,465 | ||||||
| Lumber Liquidators Holdings, Inc.* | 6,909 | 371,497 | ||||||
| Steven Madden Ltd.* | 11,699 | 366,764 | ||||||
| Texas Roadhouse, Inc. — Class A | 12,459 | 359,691 | ||||||
| La-Z-Boy, Inc. | 15,655 | 357,873 | ||||||
| Kirkland’s, Inc.* | 18,434 | 328,125 | ||||||
| Mobile Mini, Inc. | 6,258 | 274,288 | ||||||
| First Cash Financial Services, Inc.* | 4,322 | 255,344 | ||||||
| Total Consumer, Cyclical | 15,834,172 | |||||||
| INDUSTRIAL - 13.7% | ||||||||
| Saia, Inc.* | 30,756 | 1,507,660 | ||||||
Taser International, Inc.*,1 | 79,531 | 1,498,364 | ||||||
GenCorp, Inc.*,1 | 66,014 | 1,119,597 | ||||||
| Dycom Industries, Inc.* | 33,654 | 1,056,399 | ||||||
| Methode Electronics, Inc. | 24,741 | 974,301 | ||||||
| US Ecology, Inc. | 17,912 | 900,615 | ||||||
| PGT, Inc.* | 94,548 | 889,224 | ||||||
| Federal Signal Corp. | 58,377 | 828,953 | ||||||
| AAON, Inc. | 33,593 | 660,102 | ||||||
| Era Group, Inc.* | 27,428 | 641,541 | ||||||
| DXP Enterprises, Inc.* | 9,341 | 619,215 | ||||||
| CIRCOR International, Inc. | 7,516 | 564,827 | ||||||
| Drew Industries, Inc. | 9,976 | 479,447 | ||||||
| EnerSys | 7,566 | 475,145 | ||||||
32 | GUGGENHEIM ETFs ANNUAL REPORT | SEE NOTES TO FINANCIAL STATEMENTS. |
SCHEDULE OF INVESTMENTS (concluded) | October 31, 2014 |
GUGGENHEIM S&P SMALLCAP 600® PURE GROWTH ETF |
| Shares | Value | |||||||
| Hillenbrand, Inc. | 12,922 | $ | 430,173 | |||||
| Advanced Energy Industries, Inc.* | 20,664 | 408,734 | ||||||
| FARO Technologies, Inc.* | 7,152 | 400,512 | ||||||
| Apogee Enterprises, Inc. | 7,790 | 341,981 | ||||||
| AZZ, Inc. | 6,642 | 310,580 | ||||||
Sturm Ruger & Company, Inc.1 | 6,415 | 267,377 | ||||||
| Total Industrial | 14,374,747 | |||||||
| TECHNOLOGY - 11.2% | ||||||||
| Electronics for Imaging, Inc.* | 30,730 | 1,404,976 | ||||||
| Synchronoss Technologies, Inc.* | 20,693 | 1,069,207 | ||||||
| Virtusa Corp.* | 25,754 | 1,055,398 | ||||||
| iGATE Corp.* | 26,800 | 992,940 | ||||||
| Omnicell, Inc.* | 30,648 | 990,237 | ||||||
| Manhattan Associates, Inc.* | 24,413 | 979,205 | ||||||
| Dealertrack Technologies, Inc.* | 18,879 | 888,257 | ||||||
| Synaptics, Inc.* | 11,093 | 759,094 | ||||||
| Tyler Technologies, Inc.* | 6,582 | 736,657 | ||||||
| Monotype Imaging Holdings, Inc. | 23,173 | 662,980 | ||||||
| Interactive Intelligence Group, Inc.* | 12,746 | 615,122 | ||||||
| Medidata Solutions, Inc.* | 11,399 | 514,209 | ||||||
| Blackbaud, Inc. | 8,820 | 392,490 | ||||||
| MAXIMUS, Inc. | 7,591 | 367,860 | ||||||
| MTS Systems Corp. | 5,058 | 333,879 | ||||||
| Total Technology | 11,762,511 | |||||||
| ENERGY - 8.2% | ||||||||
| Matrix Service Co.* | 59,174 | 1,482,900 | ||||||
| Carrizo Oil & Gas, Inc.* | 25,476 | 1,323,223 | ||||||
| Synergy Resources Corp.* | 100,510 | 1,225,217 | ||||||
| Tesco Corp. | 50,111 | 954,113 | ||||||
| Newpark Resources, Inc.* | 63,685 | 727,920 | ||||||
| C&J Energy Services, Inc.* | 35,708 | 689,521 | ||||||
| Stone Energy Corp.* | 26,039 | 637,956 | ||||||
| Flotek Industries, Inc.* | 27,212 | 603,018 | ||||||
Northern Oil and Gas, Inc.*,1 | 39,800 | 449,740 | ||||||
| Rex Energy Corp.* | 43,165 | 338,414 | ||||||
| Geospace Technologies Corp.* | 3,849 | 118,511 | ||||||
| Total Energy | 8,550,533 | |||||||
| COMMUNICATIONS - 7.7% | ||||||||
| XO Group, Inc.* | 92,132 | 1,172,840 | ||||||
| CalAmp Corp.* | 48,910 | 942,985 | ||||||
| j2 Global, Inc. | 13,902 | 751,959 | ||||||
| Blucora, Inc.* | 39,873 | 675,847 | ||||||
| Harmonic, Inc.* | 100,296 | 668,974 | ||||||
| Perficient, Inc.* | 38,877 | 644,581 | ||||||
| EW Scripps Co. — Class A* | 32,320 | 620,544 | ||||||
| LogMeIn, Inc.* | 11,545 | 554,737 | ||||||
| Stamps.com, Inc.* | 14,094 | 520,069 | ||||||
| NIC, Inc. | 20,458 | 377,041 | ||||||
| 8x8, Inc.* | 44,480 | 349,613 | ||||||
| comScore, Inc.* | 8,190 | 345,127 | ||||||
| Lumos Networks Corp. | 13,050 | 224,460 | ||||||
| HealthStream, Inc.* | 6,946 | 215,048 | ||||||
| Total Communications | 8,063,825 | |||||||
| BASIC MATERIALS - 4.0% | ||||||||
US Silica Holdings, Inc.1 | 51,912 | 2,330,849 | ||||||
| KapStone Paper and Packaging Corp.* | 35,572 | 1,094,195 | ||||||
| HB Fuller Co. | 7,280 | 305,542 | ||||||
| Balchem Corp. | 4,066 | 263,070 | ||||||
| American Vanguard Corp. | 20,232 | 233,477 | ||||||
| Total Basic Materials | 4,227,133 | |||||||
| Total Common Stocks | ||||||||
| (Cost $93,937,959) | 104,596,733 | |||||||
SHORT TERM INVESTMENTS† - 0.1% | ||||||||
| Federated U.S. Treasury Cash Reserve Fund | 141,562 | 141,562 | ||||||
| Total Short Term Investments | ||||||||
| (Cost $141,562) | 141,562 | |||||||
| Face Amount | ||||||||
SECURITIES LENDING COLLATERAL††,2 - 7.0% | ||||||||
| Joint Repurchase Agreements | ||||||||
| HSBC Securities, Inc. | ||||||||
| issued 10/31/14 at 0.08% due 11/03/14 | $ | 4,634,750 | 4,634,750 | |||||
| BNP Paribas Securities Corp. | ||||||||
| issued 10/31/14 at 0.11% due 11/03/14 | 2,119,930 | 2,119,930 | ||||||
| Barclays Capital, Inc. | ||||||||
| issued 10/31/14 at 0.07% due 11/03/14 | 607,630 | 607,630 | ||||||
| Total Securities Lending Collateral | ||||||||
| (Cost $7,362,310) | 7,362,310 | |||||||
| Total Investments - 107.0% | ||||||||
| (Cost $101,441,831) | $ | 112,100,605 | ||||||
| Other Assets & Liabilities, net - (7.0)% | (7,377,189 | ) | ||||||
| Total Net Assets - 100.0% | $ | 104,723,416 | ||||||
| * | Non-income producing security. |
| † | Value determined based on Level 1 inputs — See Note 4. |
| †† | Value determined based on Level 2 inputs — See Note 4. |
| 1 | All or portion of this security is on loan at October 31, 2014 — See Note 5. |
| 2 | Securities lending collateral — See Note 5. |
| REIT — Real Estate Investment Trust |
| SEE NOTES TO FINANCIAL STATEMENTS. | GUGGENHEIM ETFs ANNUAL REPORT | 33 |
| STATEMENTS OF ASSETS AND LIABILITIES | October 31, 2014 |
Guggenheim Russell Top 50® Mega Cap ETF | Guggenheim S&P 500® Pure Value ETF | Guggenheim S&P 500® Pure Growth ETF | Guggenheim S&P Midcap 400® Pure Value ETF | |||||||||||||
| Assets: | ||||||||||||||||
| Investments, at value* — including $—, $16,688,861, $21,991,140 and $6,701,062 of securities loaned, respectively | $ | 598,241,279 | $ | 1,274,585,844 | $ | 1,792,781,742 | $ | 118,490,037 | ||||||||
| Repurchase agreements | — | 17,124,241 | 22,196,856 | 6,765,796 | ||||||||||||
| Total Investments | 598,241,279 | 1,291,710,085 | 1,814,978,598 | 125,255,833 | ||||||||||||
| Cash | 11,730 | 2,738 | — | — | ||||||||||||
| Segregated cash with broker | — | 34 | 44 | 13 | ||||||||||||
| Receivables: | ||||||||||||||||
| Investments sold | — | — | — | 3,667,204 | ||||||||||||
| Securities lending | — | 4,924 | 4,715 | 4,087 | ||||||||||||
| Dividends and interest | 640,161 | 831,846 | 227,936 | 46,726 | ||||||||||||
| Total assets | 598,893,170 | 1,292,549,627 | 1,815,211,293 | 128,973,863 | ||||||||||||
| Liabilities: | ||||||||||||||||
| Payable upon return of securities loaned | — | 17,124,275 | 22,196,900 | 6,765,809 | ||||||||||||
| Payable for: | ||||||||||||||||
| Fund shares redeemed | — | — | 150 | — | ||||||||||||
| Investments purchased | — | — | — | 1,918,221 | ||||||||||||
| Due to custodian | — | — | 220 | 1,625,400 | ||||||||||||
| Accrued management fees | 95,988 | 363,043 | 497,949 | 33,552 | ||||||||||||
| Total liabilities | 95,988 | 17,487,318 | 22,695,219 | 10,342,982 | ||||||||||||
| Net assets | $ | 598,797,182 | $ | 1,275,062,309 | $ | 1,792,516,074 | $ | 118,630,881 | ||||||||
| Net assets consist of: | ||||||||||||||||
| Paid-in capital | $ | 596,214,733 | $ | 1,209,002,092 | $ | 1,613,064,304 | $ | 108,704,808 | ||||||||
| Undistributed net investment income | 982,575 | 952,767 | — | 82,970 | ||||||||||||
| Accumulated net realized gain (loss) on investments | (107,612,776 | ) | (3,587,161 | ) | (5,334,881 | ) | (1,744,899 | ) | ||||||||
| Net unrealized appreciation on investments | 109,212,650 | 68,694,611 | 184,786,651 | 11,588,002 | ||||||||||||
| Net assets | $ | 598,797,182 | $ | 1,275,062,309 | $ | 1,792,516,074 | $ | 118,630,881 | ||||||||
| Shares outstanding (unlimited shares authorized), no par value | 4,250,785 | 23,552,836 | 22,700,299 | 2,250,499 | ||||||||||||
| Net asset value, offering price and repurchase price per share | $ | 140.87 | $ | 54.14 | $ | 78.96 | $ | 52.71 | ||||||||
| Cost of investments | $ | 489,028,629 | $ | 1,205,891,233 | $ | 1,607,995,091 | $ | 106,902,035 | ||||||||
| Cost of repurchase agreements | — | 17,124,241 | 22,196,856 | 6,765,796 | ||||||||||||
| *Total cost of investments | $ | 489,028,629 | $ | 1,223,015,474 | $ | 1,630,191,947 | $ | 113,667,831 | ||||||||
34 | GUGGENHEIM ETFs ANNUAL REPORT | SEE NOTES TO FINANCIAL STATEMENTS. |
STATEMENTS OF ASSETS AND LIABILITIES (concluded) | October 31, 2014 |
Guggenheim S&P Midcap 400® Pure Growth ETF | Guggenheim S&P SmallCap 600® Pure Value ETF | Guggenheim S&P SmallCap 600® Pure Growth ETF | ||||||||||
| Assets: | ||||||||||||
| Investments, at value* — including $20,088,869, $2,857,726 and $7,502,953 of securities loaned, respectively | $ | 745,814,014 | $ | 171,967,090 | $ | 104,738,295 | ||||||
| Repurchase agreements | 20,313,835 | 2,902,090 | 7,362,310 | |||||||||
| Total Investments | 766,127,849 | 174,869,180 | 112,100,605 | |||||||||
| Cash | 4,987 | — | — | |||||||||
| Segregated cash with broker | 40 | 6 | 15 | |||||||||
| Receivables: | ||||||||||||
| Investments sold | — | 2,082,810 | — | |||||||||
| Securities lending | 106,453 | 4,640 | 2,978 | |||||||||
| Dividends and interest | 233,278 | 50,107 | 10,391 | |||||||||
| Capital gains tax reclaims | — | — | 524 | |||||||||
| Total assets | 766,472,607 | 177,006,743 | 112,114,513 | |||||||||
| Liabilities: | ||||||||||||
| Payable upon return of securities loaned | 20,313,875 | 2,902,096 | 7,362,325 | |||||||||
| Payable for: | ||||||||||||
| Investments purchased | — | 2,066,269 | — | |||||||||
| Accrued management fees | 216,317 | 48,498 | 28,772 | |||||||||
| Total liabilities | 20,530,192 | 5,016,863 | 7,391,097 | |||||||||
| Net assets | $ | 745,942,415 | $ | 171,989,880 | $ | 104,723,416 | ||||||
| Net assets consist of: | ||||||||||||
| Paid-in capital | $ | 672,099,193 | $ | 170,366,031 | $ | 94,293,943 | ||||||
| Undistributed net investment income | 150,013 | 39,298 | — | |||||||||
| Accumulated net realized gain (loss) on investments | (895,931 | ) | (14,662,204 | ) | (229,301 | ) | ||||||
| Net unrealized appreciation on investments | 74,589,140 | 16,246,755 | 10,658,774 | |||||||||
| Net assets | $ | 745,942,415 | $ | 171,989,880 | $ | 104,723,416 | ||||||
| Shares outstanding (unlimited shares authorized), no par value | 6,050,021 | 2,750,040 | 1,300,004 | |||||||||
| Net asset value, offering price and repurchase price per share | $ | 123.30 | $ | 62.54 | $ | 80.56 | ||||||
| Cost of investments | $ | 671,224,874 | $ | 155,720,335 | $ | 94,079,521 | ||||||
| Cost of repurchase agreements | 20,313,835 | 2,902,090 | 7,362,310 | |||||||||
| *Total cost of investments | $ | 691,538,709 | $ | 158,622,425 | $ | 101,441,831 | ||||||
| SEE NOTES TO FINANCIAL STATEMENTS. | GUGGENHEIM ETFs ANNUAL REPORT | 35 |
| STATEMENTS OF OPERATIONS |
For the Year Ended October 31, 2014
Guggenheim Russell Top 50® Mega Cap ETF | Guggenheim S&P 500® Pure Value ETF | Guggenheim S&P 500® Pure Growth ETF | Guggenheim S&P Midcap 400® Pure Value ETF | |||||||||||||
| Investment Income: | ||||||||||||||||
| Dividends, net of foreign taxes withheld* | $ | 11,896,635 | $ | 18,019,874 | $ | 14,190,172 | $ | 1,676,576 | ||||||||
| Income from securities lending | — | 64,800 | 28,640 | 23,740 | ||||||||||||
| Interest | 15 | 19 | 17 | 3 | ||||||||||||
| Total investment income | 11,896,650 | 18,084,693 | 14,218,829 | 1,700,319 | ||||||||||||
| Expenses: | ||||||||||||||||
| Management fees | 1,041,673 | 3,024,096 | 4,567,880 | 344,581 | ||||||||||||
| Total expenses | 1,041,673 | 3,024,096 | 4,567,880 | 344,581 | ||||||||||||
| Net investment income | 10,854,977 | 15,060,597 | 9,650,949 | 1,355,738 | ||||||||||||
| Net Realized and Unrealized Gain (Loss): | ||||||||||||||||
| Net realized gain (loss) on: | ||||||||||||||||
| Investments | (1,216,778 | ) | (1,588,262 | ) | 6,625,585 | (487,021 | ) | |||||||||
| In-kind redemptions | 18,626,331 | 95,699,275 | 163,482,221 | 12,296,162 | ||||||||||||
| Net realized gain | 17,409,553 | 94,111,013 | 170,107,806 | 11,809,141 | ||||||||||||
| Net change in unrealized appreciation (depreciation) on: | ||||||||||||||||
| Investments | 53,282,676 | 1,693,099 | 24,829,879 | (3,924,921 | ) | |||||||||||
| Net realized and unrealized gain | 70,692,229 | 95,804,112 | 194,937,685 | 7,884,220 | ||||||||||||
| Net increase in net assets resulting from operations | $ | 81,547,206 | $ | 110,864,709 | $ | 204,588,634 | $ | 9,239,958 | ||||||||
| * Foreign taxes withheld | $ | 10,483 | $ | — | $ | — | $ | — | ||||||||
36 | GUGGENHEIM ETFs ANNUAL REPORT | SEE NOTES TO FINANCIAL STATEMENTS. |
STATEMENTS OF OPERATIONS (concluded) |
For the Year Ended October 31, 2014
Guggenheim S&P Midcap 400® Pure Growth ETF | Guggenheim S&P SmallCap 600® Pure Value ETF | Guggenheim S&P SmallCap 600® Pure Growth ETF | ||||||||||
| Investment Income: | ||||||||||||
| Dividends, net of foreign taxes withheld* | $ | 6,817,635 | $ | 1,739,971 | $ | 731,325 | ||||||
| Income from securities lending | 884,741 | 80,989 | 84,183 | |||||||||
| Interest | 17 | 4 | 2 | |||||||||
| Total investment income | 7,702,393 | 1,820,964 | 815,510 | |||||||||
| Expenses: | ||||||||||||
| Management fees | 2,777,267 | 591,984 | 383,373 | |||||||||
| Total expenses | 2,777,267 | 591,984 | 383,373 | |||||||||
| Net investment income | 4,925,126 | 1,228,980 | 432,137 | |||||||||
| Net Realized and Unrealized Gain (Loss): | ||||||||||||
| Net realized gain (loss) on: | ||||||||||||
| Investments | 33,849,746 | 5,487,809 | 3,028,276 | |||||||||
| In-kind redemptions | 107,456,020 | 14,172,368 | 18,742,755 | |||||||||
| Net realized gain | 141,305,766 | 19,660,177 | 21,771,031 | |||||||||
| Net change in unrealized appreciation (depreciation) on: | ||||||||||||
| Investments | (89,652,357 | ) | (7,910,036 | ) | (12,261,811 | ) | ||||||
| Net realized and unrealized gain | 51,653,409 | 11,750,141 | 9,509,220 | |||||||||
| Net increase in net assets resulting from operations | $ | 56,578,535 | $ | 12,979,121 | $ | 9,941,357 | ||||||
| * Foreign taxes withheld | $ | — | $ | — | $ | 786 | ||||||
| SEE NOTES TO FINANCIAL STATEMENTS. | GUGGENHEIM ETFs ANNUAL REPORT | 37 |
| STATEMENTS OF CHANGES IN NET ASSETS |
Guggenheim Russell Top 50® Mega Cap ETF | Guggenheim S&P 500® Pure Value ETF | |||||||||||||||
Year Ended October 31, 2014 | Year Ended October 31, 2013 | Year Ended October 31, 2014 | Year Ended October 31, 2013 | |||||||||||||
| Increase (Decrease) in Net Assets from Operations: | ||||||||||||||||
| Net investment income | $ | 10,854,977 | $ | 12,754,570 | $ | 15,060,597 | $ | 3,441,893 | ||||||||
| Net realized gain on investments | 17,409,553 | 39,828,718 | 94,111,013 | 7,071,014 | ||||||||||||
| Net change in unrealized appreciation (depreciation) on investments | 53,282,676 | 51,913,053 | 1,693,099 | 64,200,570 | ||||||||||||
| Net increase in net assets resulting from operations | 81,547,206 | 104,496,341 | 110,864,709 | 74,713,477 | ||||||||||||
| Distributions to shareholders from: | ||||||||||||||||
| Net investment income | (10,780,498 | ) | (12,958,628 | ) | (14,264,565 | ) | (3,158,321 | ) | ||||||||
| Shareholder transactions: | ||||||||||||||||
| Proceeds from shares purchased | 81,178,515 | — | 1,190,583,615 | 217,427,100 | ||||||||||||
| Value of shares redeemed | (76,270,708 | ) | (192,882,639 | ) | (386,686,594 | ) | — | |||||||||
| Net increase (decrease) in net assets resulting from share transactions | 4,907,807 | (192,882,639 | ) | 803,897,021 | 217,427,100 | |||||||||||
| Net increase (decrease) in net assets | 75,674,515 | (101,344,926 | ) | 900,497,165 | 288,982,256 | |||||||||||
| Net assets: | ||||||||||||||||
| Beginning of year | 523,122,667 | 624,467,593 | 374,565,144 | 85,582,888 | ||||||||||||
| End of year | $ | 598,797,182 | $ | 523,122,667 | $ | 1,275,062,309 | $ | 374,565,144 | ||||||||
| Undistributed net investment income at end of year | $ | 982,575 | $ | 903,169 | $ | 952,767 | $ | 317,963 | ||||||||
| Changes in shares outstanding: | ||||||||||||||||
| Shares sold | 600,000 | — | 23,250,000 | 5,400,000 | ||||||||||||
| Shares redeemed | (600,000 | ) | (1,750,000 | ) | (7,750,000 | ) | — | |||||||||
| Net increase (decrease) in shares | — | (1,750,000 | ) | 15,500,000 | 5,400,000 | |||||||||||
38 | GUGGENHEIM ETFs ANNUAL REPORT | SEE NOTES TO FINANCIAL STATEMENTS. |
STATEMENTS OF CHANGES IN NET ASSETS (continued) |
Guggenheim S&P 500® Pure Growth ETF | Guggenheim S&P Midcap 400® Pure Value ETF | |||||||||||||||
Year Ended October 31, 2014 | Year Ended October 31, 2013 | Year Ended October 31, 2014 | Year Ended October 31, 2013 | |||||||||||||
| Increase (Decrease) in Net Assets from Operations: | ||||||||||||||||
| Net investment income | $ | 9,650,949 | $ | 3,481,104 | $ | 1,355,738 | $ | 680,061 | ||||||||
| Net realized gain on investments | 170,107,806 | 15,789,608 | 11,809,141 | 2,976,812 | ||||||||||||
| Net change in unrealized appreciation (depreciation) on investments | 24,829,879 | 131,869,558 | (3,924,921 | ) | 13,986,189 | |||||||||||
| Net increase in net assets resulting from operations | 204,588,634 | 151,140,270 | 9,239,958 | 17,643,062 | ||||||||||||
| Distributions to shareholders from: | ||||||||||||||||
| Net investment income | (9,850,742 | ) | (3,301,125 | ) | (1,275,783 | ) | (684,543 | ) | ||||||||
| Return of capital | — | (218,750 | ) | — | — | |||||||||||
| Total distribution to shareholders | (9,850,742 | ) | (3,519,875 | ) | (1,275,783 | ) | (684,543 | ) | ||||||||
| Shareholder transactions: | ||||||||||||||||
| Proceeds from shares purchased | 1,424,145,593 | 298,162,248 | 70,386,738 | 25,529,180 | ||||||||||||
| Value of shares redeemed | (586,763,950 | ) | (17,639,588 | ) | (37,222,874 | ) | — | |||||||||
| Net increase in net assets resulting from share transactions | 837,381,643 | 280,522,660 | 33,163,864 | 25,529,180 | ||||||||||||
| Net increase in net assets | 1,032,119,535 | 428,143,055 | 41,128,039 | 42,487,699 | ||||||||||||
| Net assets: | ||||||||||||||||
| Beginning of year | 760,396,539 | 332,253,484 | 77,502,842 | 35,015,143 | ||||||||||||
| End of year | $ | 1,792,516,074 | $ | 760,396,539 | $ | 118,630,881 | $ | 77,502,842 | ||||||||
| Undistributed net investment income at end of year | $ | — | $ | 128,870 | $ | 82,970 | $ | 3,015 | ||||||||
| Changes in shares outstanding: | ||||||||||||||||
| Shares sold | 19,500,000 | 4,900,000 | 1,400,000 | 600,000 | ||||||||||||
| Shares redeemed | (8,300,000 | ) | (350,000 | ) | (750,000 | ) | — | |||||||||
| Net increase in shares | 11,200,000 | 4,550,000 | 650,000 | 600,000 | ||||||||||||
| SEE NOTES TO FINANCIAL STATEMENTS. | GUGGENHEIM ETFs ANNUAL REPORT | 39 |
STATEMENTS OF CHANGES IN NET ASSETS (continued) |
Guggenheim S&P Midcap 400® Pure Growth ETF | Guggenheim S&P SmallCap 600® Pure Value ETF | |||||||||||||||
Year Ended October 31, 2014 | Year Ended October 31, 2013 | Year Ended October 31, 2014 | Year Ended October 31, 2013 | |||||||||||||
| Increase (Decrease) in Net Assets from Operations: | ||||||||||||||||
| Net investment income | $ | 4,925,126 | $ | 6,099,688 | $ | 1,228,980 | $ | 1,014,247 | ||||||||
| Net realized gain on investments | 141,305,766 | 21,557,612 | 19,660,177 | 5,914,029 | ||||||||||||
| Net change in unrealized appreciation (depreciation) on investments | (89,652,357 | ) | 139,575,253 | (7,910,036 | ) | 25,108,163 | ||||||||||
| Net increase in net assets resulting from operations | 56,578,535 | 167,232,553 | 12,979,121 | 32,036,439 | ||||||||||||
| Distributions to shareholders from: | ||||||||||||||||
| Net investment income | (5,020,350 | ) | (6,220,307 | ) | (1,189,682 | ) | (1,052,024 | ) | ||||||||
| Shareholder transactions: | ||||||||||||||||
| Proceeds from shares purchased | 364,665,781 | 93,820,645 | 75,735,185 | 33,487,133 | ||||||||||||
| Value of shares redeemed | (408,252,769 | ) | (28,742,288 | ) | (38,885,016 | ) | (13,186,886 | ) | ||||||||
| Net increase (decrease) in net assets resulting from share transactions | (43,586,988 | ) | 65,078,357 | 36,850,169 | 20,300,247 | |||||||||||
| Net increase in net assets | 7,971,197 | 226,090,603 | 48,639,608 | 51,284,662 | ||||||||||||
| Net assets: | ||||||||||||||||
| Beginning of year | 737,971,218 | 511,880,615 | 123,350,272 | 72,065,610 | ||||||||||||
| End of year | $ | 745,942,415 | $ | 737,971,218 | $ | 171,989,880 | $ | 123,350,272 | ||||||||
| Undistributed net investment income at end of year | $ | 150,013 | $ | 249,906 | $ | 39,298 | $ | — | ||||||||
| Changes in shares outstanding: | ||||||||||||||||
| Shares sold | 3,050,000 | 900,000 | 1,250,000 | 650,000 | ||||||||||||
| Shares redeemed | (3,400,000 | ) | (300,000 | ) | (650,000 | ) | (300,000 | ) | ||||||||
| Net increase (decrease) in shares | (350,000 | ) | 600,000 | 600,000 | 350,000 | |||||||||||
40 | GUGGENHEIM ETFs ANNUAL REPORT | SEE NOTES TO FINANCIAL STATEMENTS. |
STATEMENTS OF CHANGES IN NET ASSETS (concluded) |
Guggenheim S&P SmallCap 600® Pure Growth ETF | ||||||||
Year Ended October 31, 2014 | Year Ended October 31, 2013 | |||||||
| Increase (Decrease) in Net Assets from Operations: | ||||||||
| Net investment income | $ | 432,137 | $ | 739,246 | ||||
| Net realized gain on investments | 21,771,031 | 3,124,734 | ||||||
| Net change in unrealized appreciation (depreciation) on investments | (12,261,811 | ) | 21,083,554 | |||||
| Net increase in net assets resulting from operations | 9,941,357 | 24,947,534 | ||||||
| Distributions to shareholders from: | ||||||||
| Net investment income | (499,340 | ) | (691,336 | ) | ||||
| Return of capital | — | (33,096 | ) | |||||
| Total distribution to shareholders | (499,340 | ) | (724,432 | ) | ||||
| Shareholder transactions: | ||||||||
| Proceeds from shares purchased | 50,760,931 | 22,140,704 | ||||||
| Value of shares redeemed | (63,109,671 | ) | (12,093,150 | ) | ||||
| Net increase (decrease) in net assets resulting from share transactions | (12,348,740 | ) | 10,047,554 | |||||
| Net increase (decrease) in net assets | (2,906,723 | ) | 34,270,656 | |||||
| Net assets: | ||||||||
| Beginning of year | 107,630,139 | 73,359,483 | ||||||
| End of year | $ | 104,723,416 | $ | 107,630,139 | ||||
| Undistributed net investment income at end of year | $ | — | $ | 26,298 | ||||
| Changes in shares outstanding: | ||||||||
| Shares sold | 650,000 | 300,000 | ||||||
| Shares redeemed | (800,000 | ) | (200,000 | ) | ||||
| Net increase (decrease) in shares | (150,000 | ) | 100,000 | |||||
| SEE NOTES TO FINANCIAL STATEMENTS. | GUGGENHEIM ETFs ANNUAL REPORT | 41 |
GUGGENHEIM RUSSELL TOP 50® MEGA CAP ETF |
| FINANCIAL HIGHLIGHTS |
This table is presented to show selected data for a share outstanding throughout each period and to assist shareholders in evaluating the Fund's performance for the periods presented.
Year Ended October 31, 2014 | Year Ended October 31, 2013 | Year Ended October 31, 2012 | Year Ended October 31, 2011 | Year Ended October 31, 2010 | ||||||||||||||||
| Per Share Data: | ||||||||||||||||||||
| Net asset value, beginning of period | $ | 123.06 | $ | 104.06 | $ | 89.97 | $ | 85.16 | $ | 78.90 | ||||||||||
| Income from investment operations: | ||||||||||||||||||||
Net investment income (loss)a | 2.74 | 2.56 | 2.17 | 1.87 | 1.72 | |||||||||||||||
| Net gain (loss) on investments (realized and unrealized) | 17.82 | �� | 19.05 | 14.02 | 4.74 | 6.26 | ||||||||||||||
| Total from investment operations | 20.56 | 21.61 | 16.19 | 6.61 | 7.98 | |||||||||||||||
| Less distributions from: | ||||||||||||||||||||
| Net investment income | (2.75 | ) | (2.61 | ) | (2.10 | ) | (1.80 | ) | (1.72 | ) | ||||||||||
| Total distributions to shareholders | (2.75 | ) | (2.61 | ) | (2.10 | ) | (1.80 | ) | (1.72 | ) | ||||||||||
| Net asset value, end of period | $ | 140.87 | $ | 123.06 | $ | 104.06 | $ | 89.97 | $ | 85.16 | ||||||||||
Total Returnb | 16.86 | % | 21.07 | % | 18.11 | % | 7.80 | % | 10.22 | % | ||||||||||
| Ratios/Supplemental Data: | ||||||||||||||||||||
| Net assets, end of period (in thousands) | $ | 598,797 | $ | 523,123 | $ | 624,468 | $ | 454,409 | $ | 323,669 | ||||||||||
| Ratio to average net assets of: | ||||||||||||||||||||
| Net investment income (loss) | 2.08 | % | 2.28 | % | 2.19 | % | 2.08 | % | 2.09 | % | ||||||||||
| Total expenses | 0.20 | % | 0.20 | % | 0.20 | % | 0.20 | % | 0.20 | % | ||||||||||
Portfolio turnover ratec | 6 | % | 8 | % | 7 | % | 6 | % | 9 | % | ||||||||||
a | Based on average shares outstanding. |
b | Total investment return is calculated assuming an initial investment made at the net asset value at the beginning of the period, reinvestment of all dividends and distribution at net asset value during the period, and redemption on the last day of the period. Transaction fees are not reflected in the calculation of total investment return. |
c | Portfolio turnover does not include securities received or delivered from processing creations or redemptions. |
42 | GUGGENHEIM ETFs ANNUAL REPORT | SEE NOTES TO FINANCIAL STATEMENTS. |
GUGGENHEIM S&P 500® PURE VALUE ETF |
| FINANCIAL HIGHLIGHTS |
This table is presented to show selected data for a share outstanding throughout each period and to assist shareholders in evaluating the Fund's performance for the periods presented.
Year Ended October 31, 2014 | Year Ended October 31, 2013 | Year Ended October 31, 2012 | Year Ended October 31, 2011 | Year Ended October 31, 2010 | ||||||||||||||||
| Per Share Data: | ||||||||||||||||||||
| Net asset value, beginning of period | $ | 46.51 | $ | 32.26 | $ | 28.38 | $ | 25.95 | $ | 21.46 | ||||||||||
| Income from investment operations: | ||||||||||||||||||||
Net investment income (loss)a | 0.90 | 0.67 | 0.48 | 0.42 | 0.35 | |||||||||||||||
| Net gain (loss) on investments (realized and unrealized) | 7.50 | 14.18 | 3.89 | 2.40 | 4.49 | |||||||||||||||
| Total from investment operations | 8.40 | 14.85 | 4.37 | 2.82 | 4.84 | |||||||||||||||
| Less distributions from: | ||||||||||||||||||||
| Net investment income | (0.77 | ) | (0.60 | ) | (0.49 | ) | (0.39 | ) | (0.35 | ) | ||||||||||
| Total distributions to shareholders | (0.77 | ) | (0.60 | ) | (0.49 | ) | (0.39 | ) | (0.35 | ) | ||||||||||
| Net asset value, end of period | $ | 54.14 | $ | 46.51 | $ | 32.26 | $ | 28.38 | $ | 25.95 | ||||||||||
Total Returnb | 18.13 | % | 46.39 | % | 15.54 | % | 10.84 | % | 22.67 | % | ||||||||||
| Ratios/Supplemental Data: | ||||||||||||||||||||
| Net assets, end of period (in thousands) | $ | 1,275,062 | $ | 374,565 | $ | 85,583 | $ | 79,550 | $ | 55,876 | ||||||||||
| Ratio to average net assets of: | ||||||||||||||||||||
| Net investment income (loss) | 1.74 | % | 1.65 | % | 1.60 | % | 1.44 | % | 1.38 | % | ||||||||||
| Total expenses | 0.35 | % | 0.35 | % | 0.35 | % | 0.35 | % | 0.35 | % | ||||||||||
Portfolio turnover ratec | 25 | % | 24 | % | 37 | % | 23 | % | 27 | % | ||||||||||
a | Based on average shares outstanding. |
b | Total investment return is calculated assuming an initial investment made at the net asset value at the beginning of the period, reinvestment of all dividends and distribution at net asset value during the period, and redemption on the last day of the period. Transaction fees are not reflected in the calculation of total investment return. |
c | Portfolio turnover does not include securities received or delivered from processing creations or redemptions. |
| SEE NOTES TO FINANCIAL STATEMENTS. | GUGGENHEIM ETFs ANNUAL REPORT | 43 |
GUGGENHEIM S&P 500® PURE GROWTH ETF |
| FINANCIAL HIGHLIGHTS |
This table is presented to show selected data for a share outstanding throughout each period and to assist shareholders in evaluating the Fund's performance for the periods presented.
Year Ended October 31, 2014 | Year Ended October 31, 2013 | Year Ended October 31, 2012 | Year Ended October 31, 2011 | Year Ended October 31, 2010 | ||||||||||||||||
| Per Share Data: | ||||||||||||||||||||
| Net asset value, beginning of period | $ | 66.12 | $ | 47.80 | $ | 44.68 | $ | 40.40 | $ | 30.85 | ||||||||||
| Income from investment operations: | ||||||||||||||||||||
Net investment income (loss)a | 0.55 | 0.44 | 0.33 | 0.18 | 0.13 | |||||||||||||||
| Net gain (loss) on investments (realized and unrealized) | 12.81 | 18.33 | 3.11 | 4.28 | 9.57 | |||||||||||||||
| Total from investment operations | 13.36 | 18.77 | 3.44 | 4.46 | 9.70 | |||||||||||||||
| Less distributions from: | ||||||||||||||||||||
| Net investment income | (0.52 | ) | (0.42 | ) | (0.32 | ) | (0.18 | ) | (0.15 | ) | ||||||||||
| Return of capital | — | (0.03 | ) | — | — | — | ||||||||||||||
| Total distributions to shareholders | (0.52 | ) | (0.45 | ) | (0.32 | ) | (0.18 | ) | (0.15 | ) | ||||||||||
| Net asset value, end of period | $ | 78.96 | $ | 66.12 | $ | 47.80 | $ | 44.68 | $ | 40.40 | ||||||||||
Total Returnb | 20.24 | % | 39.45 | % | 7.72 | % | 11.06 | % | 31.51 | % | ||||||||||
| Ratios/Supplemental Data: | ||||||||||||||||||||
| Net assets, end of period (in thousands) | $ | 1,792,516 | $ | 760,397 | $ | 332,253 | $ | 265,889 | $ | 147,470 | ||||||||||
| Ratio to average net assets of: | ||||||||||||||||||||
| Net investment income (loss) | 0.74 | % | 0.76 | % | 0.71 | % | 0.41 | % | 0.37 | % | ||||||||||
| Total expenses | 0.35 | % | 0.35 | % | 0.35 | % | 0.35 | % | 0.35 | % | ||||||||||
Portfolio turnover ratec | 46 | % | 44 | % | 35 | % | 21 | % | 31 | % | ||||||||||
a | Based on average shares outstanding. |
b | Total investment return is calculated assuming an initial investment made at the net asset value at the beginning of the period, reinvestment of all dividends and distribution at net asset value during the period, and redemption on the last day of the period. Transaction fees are not reflected in the calculation of total investment return. |
c | Portfolio turnover does not include securities received or delivered from processing creations or redemptions. |
44 | GUGGENHEIM ETFs ANNUAL REPORT | SEE NOTES TO FINANCIAL STATEMENTS. |
GUGGENHEIM S&P MIDCAP 400® PURE VALUE ETF |
| FINANCIAL HIGHLIGHTS |
This table is presented to show selected data for a share outstanding throughout each period and to assist shareholders in evaluating the Fund's performance for the periods presented.
Year Ended October 31, 2014 | Year Ended October 31, 2013 | Year Ended October 31, 2012 | Year Ended October 31, 2011 | Year Ended October 31, 2010 | ||||||||||||||||
| Per Share Data: | ||||||||||||||||||||
| Net asset value, beginning of period | $ | 48.42 | $ | 35.00 | $ | 31.00 | $ | 30.77 | $ | 24.20 | ||||||||||
| Income from investment operations: | ||||||||||||||||||||
Net investment income (loss)a | 0.71 | 0.52 | 0.46 | 0.41 | 0.36 | |||||||||||||||
| Net gain (loss) on investments (realized and unrealized) | 4.18 | 13.46 | 4.01 | 0.22 | 6.57 | |||||||||||||||
| Total from investment operations | 4.89 | 13.98 | 4.47 | 0.63 | 6.93 | |||||||||||||||
| Less distributions from: | ||||||||||||||||||||
| Net investment income | (0.60 | ) | (0.56 | ) | (0.47 | ) | (0.40 | ) | (0.36 | ) | ||||||||||
| Total distributions to shareholders | (0.60 | ) | (0.56 | ) | (0.47 | ) | (0.40 | ) | (0.36 | ) | ||||||||||
| Net asset value, end of period | $ | 52.71 | $ | 48.42 | $ | 35.00 | $ | 31.00 | $ | 30.77 | ||||||||||
Total Returnb | 10.14 | % | 40.27 | % | 14.46 | % | 2.03 | % | 28.75 | % | ||||||||||
| Ratios/Supplemental Data: | ||||||||||||||||||||
| Net assets, end of period (in thousands) | $ | 118,631 | $ | 77,503 | $ | 35,015 | $ | 35,671 | $ | 43,089 | ||||||||||
| Ratio to average net assets of: | ||||||||||||||||||||
| Net investment income (loss) | 1.38 | % | 1.22 | % | 1.36 | % | 1.22 | % | 1.20 | % | ||||||||||
| Total expenses | 0.35 | % | 0.35 | % | 0.35 | % | 0.35 | % | 0.35 | % | ||||||||||
Portfolio turnover ratec | 40 | % | 28 | % | 47 | % | 49 | % | 35 | % | ||||||||||
a | Based on average shares outstanding. |
b | Total investment return is calculated assuming an initial investment made at the net asset value at the beginning of the period, reinvestment of all dividends and distribution at net asset value during the period, and redemption on the last day of the period. Transaction fees are not reflected in the calculation of total investment return. |
c | Portfolio turnover does not include securities received or delivered from processing creations or redemptions. |
| SEE NOTES TO FINANCIAL STATEMENTS. | GUGGENHEIM ETFs ANNUAL REPORT | 45 |
GUGGENHEIM S&P MIDCAP 400® PURE GROWTH ETF |
| FINANCIAL HIGHLIGHTS |
This table is presented to show selected data for a share outstanding throughout each period and to assist shareholders in evaluating the Fund's performance for the periods presented.
Year Ended October 31, 2014 | Year Ended October 31, 2013 | Year Ended October 31, 2012 | Year Ended October 31, 2011 | Year Ended October 31, 2010 | ||||||||||||||||
| Per Share Data: | ||||||||||||||||||||
| Net asset value, beginning of period | $ | 115.31 | $ | 88.25 | $ | 82.17 | $ | 70.46 | $ | 52.89 | ||||||||||
| Income from investment operations: | ||||||||||||||||||||
Net investment income (loss)a | 0.75 | 1.02 | 0.20 | 0.07 | 0.02 | |||||||||||||||
| Net gain (loss) on investments (realized and unrealized) | 7.93 | 27.10 | 6.04 | 11.72 | 17.59 | |||||||||||||||
| Total from investment operations | 8.68 | 28.12 | 6.24 | 11.79 | 17.61 | |||||||||||||||
| Less distributions from: | ||||||||||||||||||||
| Net investment income | (0.69 | ) | (1.06 | ) | (0.16 | ) | (0.08 | ) | (0.04 | ) | ||||||||||
| Total distributions to shareholders | (0.69 | ) | (1.06 | ) | (0.16 | ) | (0.08 | ) | (0.04 | ) | ||||||||||
| Net asset value, end of period | $ | 123.30 | $ | 115.31 | $ | 88.25 | $ | 82.17 | $ | 70.46 | ||||||||||
Total Returnb | 7.53 | % | 32.07 | % | 7.60 | % | 16.73 | % | 33.32 | % | ||||||||||
| Ratios/Supplemental Data: | ||||||||||||||||||||
| Net assets, end of period (in thousands) | $ | 745,942 | $ | 737,971 | $ | 511,881 | $ | 653,246 | $ | 292,429 | ||||||||||
| Ratio to average net assets of: | ||||||||||||||||||||
| Net investment income (loss) | 0.62 | % | 1.01 | % | 0.23 | % | 0.09 | % | 0.03 | % | ||||||||||
| Total expenses | 0.35 | % | 0.35 | % | 0.35 | % | 0.35 | % | 0.35 | % | ||||||||||
Portfolio turnover ratec | 75 | % | 72 | % | 56 | % | 45 | % | 51 | % | ||||||||||
a | Based on average shares outstanding. |
b | Total investment return is calculated assuming an initial investment made at the net asset value at the beginning of the period, reinvestment of all dividends and distribution at net asset value during the period, and redemption on the last day of the period. Transaction fees are not reflected in the calculation of total investment return. |
c | Portfolio turnover does not include securities received or delivered from processing creations or redemptions. |
46 | GUGGENHEIM ETFs ANNUAL REPORT | SEE NOTES TO FINANCIAL STATEMENTS. |
GUGGENHEIM S&P SMALLCAP 600® PURE VALUE ETF |
| FINANCIAL HIGHLIGHTS |
This table is presented to show selected data for a share outstanding throughout each period and to assist shareholders in evaluating the Fund's performance for the periods presented.
Year Ended October 31, 2014 | Year Ended October 31, 2013 | Year Ended October 31, 2012 | Year Ended October 31, 2011 | Year Ended October 31, 2010 | ||||||||||||||||
| Per Share Data: | ||||||||||||||||||||
| Net asset value, beginning of period | $ | 57.37 | $ | 40.04 | $ | 35.50 | $ | 34.27 | $ | 28.50 | ||||||||||
| Income from investment operations: | ||||||||||||||||||||
Net investment income (loss)a | 0.44 | 0.56 | 0.25 | 0.20 | 0.20 | |||||||||||||||
| Net gain (loss) on investments (realized and unrealized) | 5.14 | 17.40 | 4.56 | 1.23 | 5.78 | |||||||||||||||
| Total from investment operations | 5.58 | 17.96 | 4.81 | 1.43 | 5.98 | |||||||||||||||
| Less distributions from: | ||||||||||||||||||||
| Net investment income | (0.41 | ) | (0.63 | ) | (0.25 | ) | (0.20 | ) | (0.21 | ) | ||||||||||
| Return of capital | — | — | (0.02 | ) | — | — | ||||||||||||||
| Total distributions to shareholders | (0.41 | ) | (0.63 | ) | (0.27 | ) | (0.20 | ) | (0.21 | ) | ||||||||||
| Net asset value, end of period | $ | 62.54 | $ | 57.37 | $ | 40.04 | $ | 35.50 | $ | 34.27 | ||||||||||
Total Returnb | 9.73 | % | 45.20 | % | 13.52 | % | 4.16 | % | 21.07 | % | ||||||||||
| Ratios/Supplemental Data: | ||||||||||||||||||||
| Net assets, end of period (in thousands) | $ | 171,990 | $ | 123,350 | $ | 72,066 | $ | 62,130 | $ | 87,383 | ||||||||||
| Ratio to average net assets of: | ||||||||||||||||||||
| Net investment income (loss) | 0.73 | % | 1.14 | % | 0.65 | % | 0.53 | % | 0.60 | % | ||||||||||
| Total expenses | 0.35 | % | 0.35 | % | 0.35 | % | 0.35 | % | 0.35 | % | ||||||||||
Portfolio turnover ratec | 51 | % | 43 | % | 48 | % | 76 | % | 62 | % | ||||||||||
a | Based on average shares outstanding. |
b | Total investment return is calculated assuming an initial investment made at the net asset value at the beginning of the period, reinvestment of all dividends and distribution at net asset value during the period, and redemption on the last day of the period. Transaction fees are not reflected in the calculation of total investment return. |
c | Portfolio turnover does not include securities received or delivered from processing creations or redemptions. |
| SEE NOTES TO FINANCIAL STATEMENTS. | GUGGENHEIM ETFs ANNUAL REPORT | 47 |
GUGGENHEIM S&P SMALLCAP 600® PURE GROWTH ETF |
| FINANCIAL HIGHLIGHTS |
This table is presented to show selected data for a share outstanding throughout each period and to assist shareholders in evaluating the Fund's performance for the periods presented.
Year Ended October 31, 2014 | Year Ended October 31, 2013 | Year Ended October 31, 2012 | Year Ended October 31, 2011 | Year Ended October 31, 2010 | ||||||||||||||||
| Per Share Data: | ||||||||||||||||||||
| Net asset value, beginning of period | $ | 74.23 | $ | 54.34 | $ | 49.82 | $ | 43.32 | $ | 34.13 | ||||||||||
| Income from investment operations: | ||||||||||||||||||||
Net investment income (loss)a | 0.31 | 0.59 | 0.20 | 0.02 | 0.06 | |||||||||||||||
| Net gain (loss) on investments (realized and unrealized) | 6.33 | 19.87 | 4.50 | 6.57 | 9.18 | |||||||||||||||
| Total from investment operations | 6.64 | 20.46 | 4.70 | 6.59 | 9.24 | |||||||||||||||
| Less distributions from: | ||||||||||||||||||||
| Net investment income | (0.31 | ) | (0.54 | ) | (0.18 | ) | (0.09 | ) | (0.05 | ) | ||||||||||
| Return of capital | — | (0.03 | ) | — | — | — | ||||||||||||||
| Total distributions to shareholders | (0.31 | ) | (0.57 | ) | (0.18 | ) | (0.09 | ) | (0.05 | ) | ||||||||||
| Net asset value, end of period | $ | 80.56 | $ | 74.23 | $ | 54.34 | $ | 49.82 | $ | 43.32 | ||||||||||
Total Returnb | 8.96 | % | 37.94 | % | 9.44 | % | 15.22 | % | 27.11 | % | ||||||||||
| Ratios/Supplemental Data: | ||||||||||||||||||||
| Net assets, end of period (in thousands) | $ | 104,723 | $ | 107,630 | $ | 73,359 | $ | 34,873 | $ | 17,329 | ||||||||||
| Ratio to average net assets of: | ||||||||||||||||||||
| Net investment income (loss) | 0.39 | % | 0.94 | % | 0.38 | % | 0.03 | % | 0.14 | % | ||||||||||
| Total expenses | 0.35 | % | 0.35 | % | 0.35 | % | 0.35 | % | 0.35 | % | ||||||||||
Portfolio turnover ratec | 78 | % | 73 | % | 44 | % | 33 | % | 55 | % | ||||||||||
a | Based on average shares outstanding. |
b | Total investment return is calculated assuming an initial investment made at the net asset value at the beginning of the period, reinvestment of all dividends and distribution at net asset value during the period, and redemption on the last day of the period. Transaction fees are not reflected in the calculation of total investment return. |
c | Portfolio turnover does not include securities received or delivered from processing creations or redemptions. |
48 | GUGGENHEIM ETFs ANNUAL REPORT | SEE NOTES TO FINANCIAL STATEMENTS. |
| NOTES TO FINANCIAL STATEMENTS |
1. Organization and Significant Accounting Policies
Organization
Rydex ETF Trust (the "Trust") is registered with the SEC under the Investment Company Act of 1940 (the "1940 Act") as a non-diversified, open-ended investment company of the series type, and is authorized to issue an unlimited number of no par value shares. Each portfolio represents a separate series of beneficial interest in the Trust (each a "Fund", and collectively, the "Funds"). The Trust was organized as a Delaware statutory trust on November 22, 2002. At October 31, 2014, the Trust consisted of twenty-one Funds.
The financial statements herein relate to the following Funds, whose investment objective is to replicate as closely as possible, before fees and expenses, the daily performance of an index representing publicly traded equity securities (the "Underlying Index") as follows:
| Fund | Underlying Index |
Guggenheim Russell Top 50® Mega Cap ETF | Russell Top 50® Mega Cap Index |
Guggenheim S&P 500® Pure Value ETF | S&P 500® Pure Value Index |
Guggenheim S&P 500® Pure Growth ETF | S&P 500® Pure Growth Index |
Guggenheim S&P MidCap 400® Pure Value ETF | S&P MidCap 400® Pure Value Index |
Guggenheim S&P MidCap 400® Pure Growth ETF | S&P MidCap 400® Pure Growth Index |
Guggenheim S&P SmallCap 600® Pure Value ETF | S&P SmallCap 600® Pure Value Index |
Guggenheim S&P SmallCap 600® Pure Growth ETF | S&P SmallCap 600® Pure Growth Index |
The Funds seek to achieve their objective by investing in common stocks that comprise the Underlying Index. The Funds use a "replication" strategy to track the Underlying Index. Replication refers to investing in substantially all of the securities in the Underlying Index in approximately the same proportions as in the Underlying Index.
The Funds operate as index funds and are not actively managed. Adverse performance of a security in the Funds' portfolio will ordinarily not result in the elimination of the security from the Funds' portfolio.
The Funds issue and redeem shares on a continuous basis, at net asset value per share ("NAV"), only in aggregation of 50,000 shares (a "Creation Unit"). Creation Units are issued and redeemed principally in-kind for securities included in the Underlying Index.
The Funds invest in various investments which are exposed to risk, such as market risk. Due to the level of risk associated with certain investments it is at least reasonably possible that changes in the values of investment securities will occur in the near term and that such changes could materially affect amounts reported in the financial statements. The Guggenheim Russell Top 50® Mega Cap ETF is non-diversified fund, subjecting it to a greater risk than funds that are diversified.
Guggenheim Investments ("GI") provides advisory services and Rydex Fund Services, LLC ("RFS") provides administrative services to the Trust. Guggenheim Funds Distributors, LLC ("GFD") acts as principal underwriter for the Trust. GI, RFS and GFD are affiliated entities.
Significant Accounting Policies
The following significant accounting policies are in conformity with U.S. generally accepted accounting principles ("U.S. GAAP") and are consistently followed by the Trust. This requires management to make estimates and assumptions that affect the reported amount of assets and liabilities and disclosure of contingent assets and liabilities at the date of the financial statements and the reported amounts of revenues and expenses during the reporting period. Actual results could differ from these estimates. All time references are based on Eastern Time.
A. The Board of Trustees of the Funds (the "Board") has adopted policies and procedures for the valuation of the Funds' investments (the "Valuation Procedures"). Pursuant to the Valuation Procedures, the Board has delegated to a valuation committee, consisting of representatives from Guggenheim's investment management, fund administration, legal and compliance departments (the "Valuation Committee"), the day-to-day responsibility for implementing the Valuation Procedures, including, under most circumstances, the responsibility for determining the fair value of the Fund's securities or other assets.
Valuations of the Funds' securities are supplied primarily by pricing services appointed pursuant to the processes set forth in the Valuation Procedures. The Valuation Committee convenes monthly, or more frequently as needed and will review the valuation of all assets which have been fair valued for reasonableness. The Funds' officers, through the Valuation Committee and consistent with the monitoring and review responsibilities set forth in the Valuation Procedures, regularly review procedures used by, and valuations provided by, the pricing services.
| GUGGENHEIM ETFs ANNUAL REPORT | 49 |
NOTES TO FINANCIAL STATEMENTS (continued) |
If the pricing service cannot or does not provide a valuation for a particular investment or such valuation is deemed unreliable, such investment is fair valued by the Valuation Committee.
Equity securities listed on an exchange (New York Stock Exchange ("NYSE") or American Stock Exchange) are valued at the last quoted sales price as of the close of business on the NYSE, usually 4:00 p.m. on the valuation date. Equity securities listed on the NASDAQ market system are valued at the NASDAQ Official Closing Price on the valuation date, which may not necessarily represent the last sale price. If there has been no sale on such exchange or NASDAQ on a given day, the security is valued at the closing bid price on that day. The Fund's invest invest in money market mutual funds, which are valued at their NAV.
Short-term debt securities with a maturity of 60 days or less at acquisition and repurchase agreements are valued at amortized cost, provided that amortized cost approximates fair value.
B. Security transactions are recorded on the trade date for financial reporting purposes. Realized gains and losses from securities transactions are recorded using the identified cost basis. Proceeds from lawsuits related to investment holdings are recorded as realized gains in the respective Fund. Dividend income is recorded on the ex-dividend date, net of applicable taxes withheld by foreign countries. Taxable non-cash dividends are recorded as dividend income. Interest income, including amortization of premiums and accretion of discounts, is accrued on a daily basis. Distributions received from investments in REITs are recorded as dividend income on the ex-dividend date, subject to reclassification upon notice of the character of such distribution by the issuer.
C. Distributions of net investment income and net realized gains, if any, are declared and paid at least annually. Distributions are recorded on the ex-dividend date and are determined in accordance with income tax regulations which may differ from U.S. GAAP.
D. The Funds may leave cash overnight in their cash account with the custodian. Periodically, a Fund may have cash due to the custodian bank as an overdraft balance. A fee is incurred on this overdraft, calculated by multiplying the overdraft by a rate based on the federal funds rate.
E. The Funds may enter into repurchase agreements with financial institutions. In a repurchase agreement, a Fund buys a security and the seller simultaneously agrees to repurchase the security on a specified future date at an agreed-upon price. The repurchase price reflects an agreed-upon interest rate during the time the Fund's money is invested in the security. Because the security constitutes collateral for the repurchase obligation, a repurchase agreement can be considered a collateralized loan. The Funds follow certain procedures designed to minimize the risks inherent in such agreements. These procedures include effecting repurchase transactions only with large, well-capitalized and well-established financial institutions whose condition will be continually monitored by GI. In addition, the value of the collateral underlying the repurchase agreement will always be at least equal to the repurchase price, including any accrued interest earned on the repurchase agreement. In the event of a default or bankruptcy by a selling financial institution, the Funds will seek to liquidate such collateral. However, the exercising of the Funds right to liquidate such collateral could involve certain costs or delays and, to the extent that proceeds from any sale upon a default of the obligation to repurchase were less than the repurchase price, the Funds could suffer a loss. It is the current policy of the Funds not to invest in repurchase agreements that do not mature within seven days if any such investment, together with any other illiquid assets held by the Funds, amounts to more than 15% of a Funds net assets. The investments of the Funds in repurchase agreements, at times, may be substantial when, in the view of GI, liquidity or other considerations so warrant.
F. Under the Funds' organizational documents, its Trustees and Officers are indemnified against certain liabilities arising out of the performance of their duties to the Trust. In addition, throughout the normal course of business, the Funds enter into contracts that contain a variety of representations and warranties which provide general indemnifications. The Funds' maximum exposure under these arrangements is unknown, as this would involve future claims that may be made against the Funds and/or their affiliates that have not yet occurred. However, based on experience, the Funds expect the risk of loss to be remote.
2. Capital
There is a minimum transaction fee per transaction to those persons purchasing or redeeming Creation Units. An additional charge of up to three times the standard transaction fee may be imposed for purchases and redemptions effected outside the National Securities Clearing Corporation usual clearing process or for cash. Such transactions are generally permitted on an in-kind basis, with a balancing cash component to equate the
50 | GUGGENHEIM ETFs ANNUAL REPORT |
NOTES TO FINANCIAL STATEMENTS (continued) |
transaction to the NAV of the Fund on the transaction date. Transaction fees are not charged to or paid by the Funds. The minimum transaction fees are:
| Fund | Minimum Transaction Fee |
Guggenheim Russell Top 50® Mega Cap ETF | $500 |
Guggenheim S&P 500® Pure Value ETF | 1,000 |
Guggenheim S&P 500® Pure Growth ETF | 1,000 |
Guggenheim S&P MidCap 400® Pure Value ETF | 750 |
Guggenheim S&P MidCap 400® Pure Growth ETF | 750 |
Guggenheim S&P SmallCap 600® Pure Value ETF | 1,000 |
Guggenheim S&P SmallCap 600® Pure Growth ETF | 1,000 |
3. Fees and Other Transactions with Affiliates
GI determines the composition of the portfolio of securities that must be delivered in exchange for the issuance of Creation Units and periodically adjusts the composition of the portfolio of the Funds to conform to changes in the composition of the relevant index. For these services, GI receives a management fee at the annual rate shown below as a percentage of the average daily net assets of the Funds.
| Fund | Advisory Fee |
Guggenheim Russell Top 50® Mega Cap ETF | 0.20% |
Guggenheim S&P 500® Pure Value ETF | 0.35% |
Guggenheim S&P 500® Pure Growth ETF | 0.35% |
Guggenheim S&P MidCap 400® Pure Value ETF | 0.35% |
Guggenheim S&P MidCap 400® Pure Growth ETF | 0.35% |
Guggenheim S&P SmallCap 600® Pure Value ETF | 0.35% |
Guggenheim S&P SmallCap 600® Pure Growth ETF | 0.35% |
GI pays all expenses of the Funds, including the cost of transfer agency, custody, fund administration, fund accounting, legal, audit and other services, except: interest, taxes, distribution fees or expenses and extraordinary expenses.
Under a Fund Administration Agreement with the Trust, RFS provides various administrative and financial reporting services for the Funds. GI compensates RFS directly for this service.
Under a Fund Accounting Agreement with the Trust, BNYMellon maintains the books and records of the Funds. Under a Custodian Agreement with the Trust, BNYMellon maintains cash, securities and other assets of the Funds in a separate account for the Funds, keeps all necessary accounts and records, and provides other services. BNYMellon is required, upon the order of the Trust, to deliver securities held by the custodian and to make payments for securities purchased by the Trust for the Funds. Pursuant to a Transfer Agency and Service Agreement with the Trust, BNYMellon acts as a transfer agent for the Trust's authorized and issued shares of beneficial interest, and as dividend disbursing agent of the Trust. GI compensates BNYMellon directly for the foregoing services.
The Funds have adopted a Distribution Plan (the "Plan") that allows the Funds to pay distribution fees to GFD and other firms that provide distribution services ("Service Providers"). If a Service Provider provides distribution services, the Funds will pay distribution fees to GFD at an annual rate not to exceed 0.25% of average daily net assets, pursuant to Rule 12b-1 of the 1940 Act. GFD will, in turn, pay the Service Provider out of its fees. No such fee is currently charged to the Funds.
Certain trustees and officers of the Trust are also officers of GI, RFS and GFD.
4. Fair Value Measurement
In accordance with U.S. GAAP, fair value is defined as the price that the Funds would receive to sell an investment or pay to transfer a liability in an orderly transaction with an independent buyer in the principal market, or in the absence of a principal market, the most advantageous market for the investment or liability. U.S. GAAP establishes a three-tier fair value hierarchy based on the types of inputs used to value assets and liabilities and requires corresponding disclosure. The hierarchy and the corresponding inputs are summarized below:
| Level 1 — | quoted prices in active markets for identical assets or liabilities. |
| Level 2 — | significant other observable inputs (for example quoted prices for securities that are similar based on characteristics such as interest rates, prepayment speeds, credit risk, etc.). |
| Level 3 — | significant unobservable inputs based on the best information available under the circumstances, to the extent observable inputs are not available, which may include assumptions. |
| GUGGENHEIM ETFs ANNUAL REPORT | 51 |
NOTES TO FINANCIAL STATEMENTS (continued) |
The types of inputs available depend on a variety of factors, such as the type of security and the characteristics of the markets in which it trades, if any. Fair valuation determinations that rely on fewer or no observable inputs require greater judgment. Accordingly, fair value determinations for Level 3 securities require the greatest amount of judgment.
The following table summarizes the inputs used to value the Funds' net assets at October 31, 2014:
| Fund | Level 1 Investments In Securities | Level 2 Investments In Securities | Level 3 Investments In Securities | Total | ||||||||||||
Guggenheim Russell Top 50® Mega Cap ETF | $ | 598,241,279 | $ | — | $ | — | $ | 598,241,279 | ||||||||
Guggenheim S&P 500® Pure Value ETF | 1,274,585,844 | 17,124,241 | — | 1,291,710,085 | ||||||||||||
Guggenheim S&P 500® Pure Growth ETF | 1,792,781,742 | 22,196,856 | — | 1,814,978,598 | ||||||||||||
Guggenheim S&P Midcap 400® Pure Value ETF | 118,490,037 | 6,765,796 | — | 125,255,833 | ||||||||||||
Guggenheim S&P Midcap 400® Pure Growth ETF | 745,814,014 | 20,313,835 | — | 766,127,849 | ||||||||||||
Guggenheim S&P SmallCap 600® Pure Value ETF | 171,967,090 | 2,902,090 | — | 174,869,180 | ||||||||||||
Guggenheim S&P SmallCap 600® Pure Growth ETF | 104,738,295 | 7,362,310 | — | 112,100,605 | ||||||||||||
For the year ended October 31, 2014, there were no transfers between levels.
5. Portfolio Securities Loaned
The Funds may lend their securities to approved brokers to earn additional income. Security lending income shown on the Statements of Operations is shown net of rebates paid to the borrowers and earnings on cash collateral investments shared with the lending agent. Within this arrangement, the Funds act as the lender, Credit Suisse acts as the lending agent, and other approved registered broker dealers act as the borrowers. The Funds receive cash collateral, valued at 102% of the value of the securities on loan. Under the terms of the Funds' securities lending agreement with Credit Suisse, cash collateral is invested in one or more joint repurchase agreements collateralized by obligations of the U.S. Treasury or Government Agencies and cash. The Funds bear the risk of loss on cash collateral investments. Collateral is maintained over the life of the loan in an amount not less than the value of loaned securities, as determined at the close of fund business each day; any additional collateral required due to changes in security values is delivered to the Funds the next business day. Although the collateral mitigates the risk, the Funds could experience a delay in recovering its securities and a possible loss of income or value if the borrower fails to return the securities. The Funds have the right under the securities lending agreement to recover the securities from the borrower on demand.
At October 31, 2014, the Funds participated in securities lending as follows:
| Fund | Value of Securities Loaned | Cash Collateral Received | ||||||
Guggenheim S&P 500® Pure Value ETF | $ | 16,688,861 | $ | 17,124,275 | ||||
Guggenheim S&P 500® Pure Growth ETF | 21,991,140 | 22,196,900 | ||||||
Guggenheim S&P Midcap 400® Pure Value ETF | 6,701,062 | 6,765,809 | ||||||
Guggenheim Midcap 400® Pure Growth ETF | 20,088,869 | 20,313,875 | ||||||
Guggenheim S&P SmallCap 600® Pure Value EFT | 2,857,726 | 2,902,096 | ||||||
Guggenheim S&P SmallCap 600® Pure Growth ETF | 7,502,953 | 7,362,325 | * | |||||
| * | Subsequent to October 31, 2014, additional collateral was received. |
52 | GUGGENHEIM ETFs ANNUAL REPORT |
NOTES TO FINANCIAL STATEMENTS (continued) |
Cash collateral received was invested in the following joint repurchase agreements at October 31, 2014:
Counterparty and Terms of Agreement | Face Value | Repurchase Price | Collateral | Par Value | Fair Value | |
| HSBC Securities, Inc. | Freddie Mac Strips | |||||
| 0.08% | 0.00% | |||||
| Due 11/03/14 | $48,262,526 | $48,262,633 | 01/15/15 - 07/15/32 | $51,381,583 | $32,638,479 | |
| Fannie Mae Strips | ||||||
| 0.00% | ||||||
| 11/15/14 - 01/15/37 | 21,376,641 | 16,584,695 | ||||
| BNP Paribas Securities Corp. | U.S. TIP Bonds | |||||
| 0.11% | 1.38% - 2.50% | |||||
| Due 11/03/14 | 22,075,234 | 22,075,302 | 01/15/29 - 02/15/44 | 12,199,940 | 16,162,453 | |
| U.S. Treasury Note | ||||||
| 2.13% | ||||||
| 01/31/21 | 6,242,577 | 6,351,826 | ||||
| Barclays Capital, Inc. | U.S. Treasury Bill | |||||
| 0.07% | 0.00% | |||||
| Due 11/03/14 | 6,327,368 | 6,327,381 | 01/15/15 - 02/26/15 | 6,453,827 | 6,453,222 |
There was also $152 in segregated cash held as collateral.
In the event of counterparty default, the Funds have the right to collect the collateral to offset losses incurred. There is potential loss to the Funds in the event the Funds are delayed or prevented from exercising their rights to dispose of the collateral securities, including the risk of a possible decline in the value of the underlying securities during the period while the Funds seek to assert their rights. The Funds' investment adviser, acting under the supervision of the Board of Trustees, reviews the value of the collateral and the creditworthiness of those banks and dealers with which the Funds enter into repurchase agreements to evaluate potential risks.
6. Federal Income Tax Information
The Funds intend to comply with the provisions of Subchapter M of the Internal Revenue Code applicable to regulated investment companies and will distribute substantially all taxable net investment income and capital gains sufficient to relieve the Funds from all, or substantially all, federal income, excise and state income taxes. Therefore, no provision for federal or state income tax is required.
Tax positions taken or expected to be taken in the course of preparing the Funds' tax returns are evaluated to determine whether the tax positions are "more-likely-than-not" of being sustained by the applicable tax authority. Tax positions not deemed to meet the more-likely-than-not threshold would be recorded as a tax benefit or expense in the current year. Management has analyzed the Funds' tax positions taken, or to be taken, on Federal income tax returns for all open tax years, and has concluded that no provision for income tax is required in the Funds' financial statements. The Funds' federal tax returns are subject to examination by the Internal Revenue Service for a period of three fiscal years after they are filed.
Income and capital gain distributions are determined in accordance with Federal income tax regulations, which may differ from U.S. GAAP. These differences are primarily due to differing treatments for in-kind redemptions, income reclassifications from REITs and losses deferred due to wash sales.
| GUGGENHEIM ETFs ANNUAL REPORT | 53 |
NOTES TO FINANCIAL STATEMENTS (continued) |
The tax character of distributions paid during the year ended October 31, 2014 was as follows:
| Fund | Ordinary Income | Return of Capital | Total Distributions | |||||||||
Guggenheim Russell Top 50® Mega Cap ETF | $ | 10,780,498 | $ | — | $ | 10,780,498 | ||||||
Guggenheim S&P 500® Pure Value ETF | 14,264,565 | — | 14,264,565 | |||||||||
Guggenheim S&P 500® Pure Growth ETF | 9,850,742 | — | 9,850,742 | |||||||||
Guggenheim S&P Midcap 400® Pure Value ETF | 1,275,783 | — | 1,275,783 | |||||||||
Guggenheim S&P Midcap 400® Pure Growth ETF | 5,020,350 | — | 5,020,350 | |||||||||
Guggenheim S&P Smallcap 600® Pure Value ETF | 1,189,682 | — | 1,189,682 | |||||||||
Guggenheim S&P Smallcap 600® Pure Growth ETF | 499,340 | — | 499,340 | |||||||||
The tax character of distributions paid during the year ended October 31, 2013 was as follows:
| Fund | Ordinary Income | Return of Capital | Total Distributions | |||||||||
Guggenheim Russell Top 50® Mega Cap ETF | $ | 12,958,628 | $ | — | $ | 12,958,628 | ||||||
Guggenheim S&P 500® Pure Value ETF | 3,158,321 | — | 3,158,321 | |||||||||
Guggenheim S&P 500® Pure Growth ETF | 3,301,125 | 218,750 | 3,519,875 | |||||||||
Guggenheim S&P Midcap 400® Pure Value ETF | 684,543 | — | 684,543 | |||||||||
Guggenheim S&P Midcap 400® Pure Growth ETF | 6,220,307 | — | 6,220,307 | |||||||||
Guggenheim S&P Smallcap 600® Pure Value ETF | 1,052,024 | — | 1,052,024 | |||||||||
Guggenheim S&P Smallcap 600® Pure Growth ETF | 691,336 | 33,096 | 724,432 | |||||||||
The tax character of distributable earnings/(accumulated losses) at October 31, 2014 was as follows:
| Fund | Undistributed Ordinary Income | Undistributed Long-Term Capital Gain | Capital Loss Carryforward | Net Unrealized Appreciation/ (Depreciation) | Total Accumulated Earnings/(Deficit) | |||||||||||||||
Guggenheim Russell Top 50® Mega Cap ETF | $ | 982,575 | $ | — | $ | (106,092,129 | ) | $ | 107,692,003 | $ | 2,582,449 | |||||||||
Guggenheim S&P 500® Pure Value ETF | 952,767 | — | (3,079,898 | ) | 68,187,348 | 66,060,217 | ||||||||||||||
Guggenheim S&P 500® Pure Growth ETF | — | — | (5,189,336 | ) | 184,641,106 | 179,451,770 | ||||||||||||||
Guggenheim S&P Midcap 400® Pure Value ETF | 82,970 | — | (1,603,171 | ) | 11,446,274 | 9,926,073 | ||||||||||||||
Guggenheim S&P Midcap 400® Pure Growth ETF | 150,013 | — | — | 73,693,209 | 73,843,222 | |||||||||||||||
Guggenheim S&P Smallcap 600® Pure Value ETF | 39,298 | — | (14,096,362 | ) | 15,680,913 | 1,623,849 | ||||||||||||||
Guggenheim S&P Smallcap 600® Pure Growth ETF | — | — | — | 10,429,473 | 10,429,473 | |||||||||||||||
54 | GUGGENHEIM ETFs ANNUAL REPORT |
NOTES TO FINANCIAL STATEMENTS (continued) |
For Federal income tax purposes, capital loss carryforwards represent realized losses of the Funds that may be carried forward and applied against future capital gains. For taxable years beginning on or before December 22, 2010, such capital losses may be carried forward for a maximum of eight years. Under the RIC Modernization Act of 2010, the Funds are permitted to carry forward capital losses incurred in taxable years beginning after December 22, 2010 for an unlimited period. However, any losses incurred during those taxable years must be utilized prior to the losses incurred in pre-enactment taxable years. As a result of this ordering rule, pre-enactment capital loss carryforwards may be more likely to expire unused. Additionally, post-enactment capital losses that are carried forward will retain their character as either short-term or long-term capital losses rather than being considered all short-term as under previous law. As of October 31, 2014, capital loss carryforwards for the Funds were as follows:
| Unlimited | Remaining | |||||||||||||||||||||||||||||||
| Fund | Expires in 2015 | Expires in 2016 | Expires in 2017 | Expires in 2018 | Expires in 2019 | Short- Term | Long- Term | Capital Loss Carryforward | ||||||||||||||||||||||||
Guggenheim Russell Top 50® Mega Cap ETF | $ | (618,363 | ) | $ | (32,651,414 | ) | $ | (51,313,952 | ) | $ | (10,584,384 | ) | $ | (3,619,667 | ) | $ | — | $ | (7,304,349 | ) | $ | (106,092,129 | ) | |||||||||
Guggenheim S&P 500® Pure Value ETF | — | — | (2,158,232 | ) | — | — | (656,177 | ) | (265,489 | ) | (3,079,898 | ) | ||||||||||||||||||||
Guggenheim S&P 500® Pure Growth ETF | — | — | (2,292,413 | ) | (138,571 | ) | — | (2,608,437 | ) | (149,915 | ) | (5,189,336 | ) | |||||||||||||||||||
Guggenheim S&P Midcap 400® Pure Value ETF | — | — | (1,163,866 | ) | — | — | (439,305 | ) | — | (1,603,171 | ) | |||||||||||||||||||||
Guggenheim S&P Midcap 400® Pure Growth ETF | — | — | — | — | — | — | — | — | ||||||||||||||||||||||||
Guggenheim S&P Smallcap 600® Pure Value ETF | — | — | (5,771,118 | ) | (8,325,244 | ) | — | — | — | (14,096,362 | ) | |||||||||||||||||||||
Guggenheim S&P Smallcap 600® Pure Growth ETF | — | — | — | — | — | — | — | — | ||||||||||||||||||||||||
For the year ended October 31, 2014, the following capital loss carryforward amounts were expired or used:
| Fund | Amount | |||
Guggenheim Russell Top 50® Mega Cap ETF | $ | (675,404 | ) | |
Guggenheim S&P 500® Pure Growth ETF | (6,705,083 | ) | ||
Guggenheim S&P Midcap 400® Pure Growth ETF | (26,680,861 | ) | ||
Guggenheim S&P Smallcap 600® Pure Value ETF | (5,805,017 | ) | ||
Guggenheim S&P Smallcap 600® Pure Growth ETF | (1,920,459 | ) | ||
In order to present paid-in-capital, undistributed net investment income (loss) and accumulated net realized gain (loss) on investments on the statement of assets and liabilities that more closely represent their tax character, certain adjustments have been made to these accounts. These adjustments have no effect on the net assets or NAV. The most significant of these adjustments are for net capital gains (losses) resulting from in-kind redemptions, expired capital loss carryforwards, and return of capital on investments. For the year ended October 31, 2014, the adjustments for the Funds were as follows:
| Fund | Paid-In Capital | Undistributed Net Investment Income | Accumulated Net Realized Gain/(Loss) | |||||||||
Guggenheim Russell Top 50® Mega Cap ETF | $ | 17,719,320 | $ | 4,927 | $ | (17,724,247 | ) | |||||
Guggenheim S&P 500® Pure Value ETF | 95,543,913 | (161,228 | ) | (95,382,685 | ) | |||||||
Guggenheim S&P 500® Pure Growth ETF | 163,088,539 | 70,923 | (163,159,462 | ) | ||||||||
Guggenheim S&P Midcap 400® Pure Value ETF | 12,242,529 | — | (12,242,529 | ) | ||||||||
Guggenheim S&P Midcap 400® Pure Growth ETF | 114,389,010 | (4,669 | ) | (114,384,341 | ) | |||||||
Guggenheim S&P Smallcap 600® Pure Value ETF | 13,990,508 | — | (13,990,508 | ) | ||||||||
Guggenheim S&P Smallcap 600® Pure Growth ETF | 19,846,426 | 40,905 | (19,887,331 | ) | ||||||||
| GUGGENHEIM ETFs ANNUAL REPORT | 55 |
NOTES TO FINANCIAL STATEMENTS (continued) |
At October 31, 2014, the cost of securities for Federal income tax purposes, the aggregate gross unrealized gain for all securities for which there was an excess of value over tax cost and the aggregate gross unrealized loss for all securities for which there was an excess of tax cost over value, were as follows:
| Fund | Tax Cost | Tax Unrealized Gain | Tax Unrealized Loss | Net Unrealized Gain/(Loss) | ||||||||||||
Guggenheim Russell Top 50® Mega Cap ETF | $ | 490,549,276 | $ | 130,269,406 | $ | (22,577,403 | ) | $ | 107,692,003 | |||||||
Guggenheim S&P 500® Pure Value ETF | 1,223,522,737 | 107,704,577 | (39,517,229 | ) | 68,187,348 | |||||||||||
Guggenheim S&P 500® Pure Growth ETF | 1,630,337,492 | 226,450,437 | (41,809,331 | ) | 184,641,106 | |||||||||||
Guggenheim S&P Midcap 400® Pure Value ETF | 113,809,559 | 15,391,460 | (3,945,186 | ) | 11,446,274 | |||||||||||
Guggenheim S&P Midcap 400® Pure Growth ETF | 692,434,641 | 113,193,751 | (39,500,542 | ) | 73,693,209 | |||||||||||
Guggenheim S&P Smallcap 600® Pure Value ETF | 159,188,267 | 26,812,480 | (11,131,567 | ) | 15,680,913 | |||||||||||
Guggenheim S&P Smallcap 600® Pure Growth ETF | 101,671,132 | 16,895,770 | (6,466,297 | ) | 10,429,473 | |||||||||||
7. Investment Transactions
For the year ended October 31, 2014, the Funds had investment transactions in-kind associated with subscriptions and redemptions as follows:
| Fund | Subscriptions | Redemptions | ||||||
Guggenheim Russell Top 50® Mega Cap ETF | $ | 81,054,921 | $ | 75,768,106 | ||||
Guggenheim S&P 500® Pure Value ETF | 1,188,129,110 | 386,408,221 | ||||||
Guggenheim S&P 500® Pure Growth ETF | 1,422,817,922 | 585,790,890 | ||||||
Guggenheim S&P Midcap 400® Pure Value ETF | 70,203,919 | 37,231,996 | ||||||
Guggenheim S&P Midcap 400® Pure Growth ETF | 363,983,433 | 407,706,558 | ||||||
Guggenheim S&P SmallCap 600® Pure Value ETF | 75,640,309 | 38,756,898 | ||||||
Guggenheim S&P SmallCap 600® Pure Growth ETF | 50,681,644 | 63,033,184 | ||||||
For the year ended October 31, 2014, the cost of purchases and proceeds from sales of investment securities, excluding government securities, short-term investments and in-kind transactions, were as follows:
| Fund | Purchases | Sales | ||||||
Guggenheim Russell Top 50® Mega Cap ETF | $ | 30,245,275 | $ | 30,305,649 | ||||
Guggenheim S&P 500® Pure Value ETF | 220,576,810 | 218,235,028 | ||||||
Guggenheim S&P 500® Pure Growth ETF | 599,998,561 | 599,591,920 | ||||||
Guggenheim S&P Midcap 400® Pure Value ETF | 39,598,475 | 39,365,048 | ||||||
Guggenheim S&P Midcap 400® Pure Growth ETF | 595,408,358 | 595,029,722 | ||||||
Guggenheim S&P SmallCap 600® Pure Value ETF | 86,479,513 | 86,538,321 | ||||||
Guggenheim S&P SmallCap 600® Pure Growth ETF | 85,073,139 | 85,107,047 | ||||||
8. Legal Proceedings
Lyondell Chemical Company
In December 2011, Rydex ETF Trust was named as a defendant in Weisfelner, as Trustee of the LB Creditor Trust, v. Fund 1 (In re Lyondell Chemical Co.), Adv. Pro. No. 10-4609 (Bankr. S.D.N.Y.) (the "Creditor Trust Action").
Similar to the claims made in the Tribune matter, the Weisfelner complaint seeks to have set aside and recovered as fraudulent transfers from former Lyondell Chemical Company ("Lyondell") shareholders the consideration paid to them pursuant to the cash out merger of Lyondell shareholders in connection with the combination of Lyondell and Basell AF in 2007. Lyondell filed for bankruptcy in 2008.
On January 14, 2014, the Court granted in part and denied in part the defendants' motion to dismiss the Creditor Trust action. In particular, the Court dismissed all defendants who were conduits for the proceeds from the merger transaction, and also ruled that the plaintiff could not bring any claims on behalf of certain entities who had ratified the merger
56 | GUGGENHEIM ETFs ANNUAL REPORT |
NOTES TO FINANCIAL STATEMENTS (continued) |
transaction. The Court also dismissed without prejudice the plaintiff's claims for intentional fraudulent transfer against the remaining defendants, and gave the Credit Trustee leave to replead these claims. Finally, the Court denied the motion to dismiss with respect to the plaintiff's claims for constructive fraudulent transfer against the remaining defendants.
On April 7, 2014, the plaintiff filed a Third Amended Complaint. In the related action entitled Weisfelner, as Trustee of the LB Litigation Trust v. A. Holmes & H. Holmes TTEE (In re Lyondell Co.), Adversary Proceeding No. 10-5525 (Bankr. S.D.N.Y.) (the "Litigation Trust Action"), the plaintiff also filed a Second Amended Complaint that alleges a claim against the former Lyondell shareholders under federal law for intentional fraudulent transfer. The complaint identifies a putative defendant class comprised of all entities who received proceeds from the merger transaction in exchange for their shares.
On May 8, 2014, the plaintiff in the Litigation Trust action filed a motion to certify the defendant class generally comprised of all former Lyondell shareholders that received proceeds in exchange for their shares in the 2007 merger transaction.
On July 2, 2014, the Bankruptcy Court issued a case management order. Under the terms of the order, the defendants were permitted to file an "omnibus" motion to dismiss the complaints in all of the Lyondell actions on July 30, 2014. The omnibus motion was limited to grounds for dismissal that are applicable to all defendants in such action. No potential defense (including, without limitation, lack of personal jurisdiction, insufficiency of service of process, or any other non-omnibus ground for dismissal of the complaint in any or all of the actions) shall be waived by a defendant's failure to assert any such potential defense in an omnibus motion to dismiss.
On July 30, 2014, the defendants filed a motion to dismiss all of the Lyondell lawsuits.
The Court will hold an oral argument on the motions to dismiss and on the motion for class certification on January 14, and, if necessary, January 15, 2015. The Court further ordered that, with certain exceptions, all discovery in the actions shall be stayed until the briefing of the class certification motion has concluded. Discovery may begin promptly after the completion of all briefing on the class certification motion in late December 2014.
This lawsuit does not allege any wrongdoing on the part of Rydex ETF Trust. The following series of Rydex ETF Trust received cash proceeds from the merger in the following amounts: Guggenheim S&P MidCap 400 Pure Value ETF Fund - $572,640. At this stage of the proceedings, Rydex ETF Trust is not able to make a reliable prediction as to the outcome of this lawsuit or the effect, if any, on the Fund's net asset value.
Tribune Company
Rydex ETF Trust has been named as a defendant and a putative member of the proposed defendant class of shareholders in the case entitled Kirschner v. FitzSimons, No. 12-2652 (S.D.N.Y.) (formerly Official Committee of Unsecured Creditors of Tribune Co. v. FitzSimons, Adv. Pro. No. 10-54010 (Bankr. D. Del.)) (the "FitzSimons action"), as a result of ownership of shares by certain series of the Rydex ETF Trust in the Tribune Company ("Tribune") in 2007, when Tribune effected a leveraged buyout transaction ("LBO") by which Tribune converted to a privately-held company. In his complaint, the plaintiff has alleged that, in connection with the LBO, insiders and shareholders were overpaid for their Tribune stock using financing that the insiders knew would, and ultimately did, leave the Tribune Company insolvent. The plaintiff has asserted claims against certain insiders, major shareholders, professional advisers, and others involved in the LBO. The plaintiff is also attempting to obtain from former Tribune shareholders, including Rydex ETF Trust, the proceeds they received in connection with the LBO.
In June 2011, a group of Tribune creditors filed multiple actions against former Tribune shareholders involving state law constructive fraudulent conveyance claims arising out of the 2007 LBO (the "SLCFC actions"). Rydex ETF Trust has been named as a defendant in one or more of these suits. In those actions, the creditors seek to recover from Tribune's former shareholders the proceeds received in connection with the 2007 LBO.
The FitzSimons action and the SLCFC actions have been consolidated with the majority of the other Tribune LBO-related lawsuits in a multidistrict litigation proceeding captioned In re Tribune Company Fraudulent Conveyance Litig., No. 11-md-2696 (S.D.N.Y.) (the "MDL Proceeding").
| GUGGENHEIM ETFs ANNUAL REPORT | 57 |
NOTES TO FINANCIAL STATEMENTS (concluded) |
On September 23, 2013, the District Court granted the defendants' omnibus motion to dismiss the SLCFC actions, on the basis that the creditors lacked standing. On September 30, 2013, the creditors filed a notice of appeal of the September 23 order. On October 28, 2013, the defendants filed a joint notice of cross-appeal of that same order. The SLCFC appeals have been fully briefed, and oral argument took place on November 5, 2014. The Court has not yet issued a decision on the appeals.
On May 23, 2014, the defendants filed motions to dismiss the FitzSimons action, including a global motion to dismiss Count I, which is the claim brought against former Tribune shareholders for intentional fraudulent conveyance under U.S. federal law. The Court has not yet issued a decision on any of these motions.
None of these lawsuits alleges any wrongdoing on the part of Rydex ETF Trust. The following series of Rydex ETF Trust held shares of Tribune and tendered these shares as part of Tribune's LBO: Guggenheim S&P 500 Pure Value ETF (the "Fund"). The value of the proceeds received by the foregoing Fund was $197,050. At this stage of the proceedings, Rydex ETF Trust is not able to make a reliable prediction as to the outcome of these lawsuits or the effect, if any, on the Fund's net asset value.
58 | GUGGENHEIM ETFs ANNUAL REPORT |
| REPORT OF INDEPENDENT REGISTERED PUBLIC ACCOUNTING FIRM |
The Board of Trustees and Shareholders of Rydex ETF Trust
We have audited the accompanying statements of assets and liabilities, including the schedules of investments, of Guggenheim Russell Top 50® Mega Cap ETF, Guggenheim S&P 500® Pure Value ETF, Guggenheim S&P 500® Pure Growth ETF, Guggenheim S&P MidCap 400® Pure Value ETF, Guggenheim S&P MidCap 400® Pure Growth ETF, Guggenheim S&P SmallCap 600® Pure Value ETF and Guggenheim S&P SmallCap 600® Pure Growth ETF (seven of the series constituting the Rydex ETF Trust) (the "Funds") as of October 31, 2014, and the related statements of operations for the year then ended, the statements of changes in net assets for each of the two years in the period then ended, and the financial highlights for each of the five years in the period then ended. These financial statements and financial highlights are the responsibility of the Funds' management. Our responsibility is to express an opinion on these financial statements and financial highlights based on our audits.
We conducted our audits in accordance with the standards of the Public Company Accounting Oversight Board (United States). Those standards require that we plan and perform the audit to obtain reasonable assurance about whether the financial statements and financial highlights are free of material misstatement. We were not engaged to perform an audit of the Funds' internal control over financial reporting. Our audits included consideration of internal control over financial reporting as a basis for designing audit procedures that are appropriate in the circumstances, but not for the purpose of expressing an opinion on the effectiveness of the Funds' internal control over financial reporting. Accordingly, we express no such opinion. An audit also includes examining, on a test basis, evidence supporting the amounts and disclosures in the financial statements and financial highlights, assessing the accounting principles used and significant estimates made by management, and evaluating the overall financial statement presentation. Our procedures included confirmation of securities owned as of October 31, 2014, by correspondence with the custodian and brokers. We believe that our audits provide a reasonable basis for our opinion.
In our opinion, the financial statements and financial highlights referred to above present fairly, in all material respects, the financial position of the above listed Funds (seven of the series constituting the Rydex ETF Trust) at October 31, 2014, the results of their operations for the year then ended, the changes in their net assets for each of the two years in the period then ended, and their financial highlights for each of the five years in the period then ended, in conformity with U.S. generally accepted accounting principles.
McLean, Virginia
December 19, 2014
December 19, 2014
| GUGGENHEIM ETFs ANNUAL REPORT | 59 |
OTHER INFORMATION (Unaudited) |
Federal Tax Information
For federal income tax purposes, the following information is furnished with respect to the distributions paid by the funds during the year ended October 31, 2014:
| Fund | Dividends Received Deduction | Qualified Income Distribution | ||||||
Guggenheim Russell Top 50® Mega Cap ETF | 100.00 | % | $ | 11,649,856 | ||||
Guggenheim S&P 500® Pure Value ETF | 100.00 | % | 16,880,114 | |||||
Guggenheim S&P 500® Pure Growth ETF | 100.00 | % | 11,054,136 | |||||
Guggenheim S&P Midcap 400® Pure Value ETF | 100.00 | % | 1,612,811 | |||||
Guggenheim S&P Midcap 400® Pure Growth ETF | 100.00 | % | 6,411,181 | |||||
Guggenheim S&P Smallcap 600® Pure Value ETF | 100.00 | % | 1,633,807 | |||||
Guggenheim S&P Smallcap 600® Pure Growth ETF | 100.00 | % | 652,819 | |||||
With respect to the taxable year ended October 31, 2014, the Funds hereby designate as capital gain dividends the amounts listed below, or, if subsequently determined to be different, the net capital gain of such year:
| Fund | Guggenheim S&P Midcap 400 Pure Growth ETF | Guggenheim S&P Smallcap 600 Pure Growth ETF | ||||||
| From long-term capital gains, using proceeds from shareholder redemptions: | $ | 8,087,634 | $ | 795,190 | ||||
Proxy Voting Information
A description of the policies and procedures that the Trust uses to determine how to vote proxies relating to securities held in the Funds' portfolios is available, without charge and upon request, by calling 800.820.0888. This information is also available from the EDGAR database on the SEC's website at http://www.sec.gov.
Information regarding how the Funds voted proxies relating to portfolio securities during the most recent 12-month period ended June 30 is available without charge, upon request, by calling 800.820.0888. This information is also available from the EDGAR database on the SEC's website at http://www.sec.gov.
Quarterly Portfolio Schedules Information
The Trust files its complete schedule of portfolio holdings with the SEC for the first and third quarters of each fiscal year on Form N-Q; which are available on the SEC's website at http://www.sec.gov. The Funds' Forms N-Q may be reviewed and copied at the SEC's Public Reference Room in Washington, DC, and that information on the operation of the Public Reference Room may be obtained by calling 800-SEC-0330. Copies of the portfolio holdings are also available to shareholders, without charge and upon request, by calling 800.820.0888.
Distributor Change
Effective March 3, 2014, Guggenheim Distributors, LLC ("GD"), the distributor for shares of the Funds was consolidated into and with Guggenheim Funds Distributors, LLC ("GFD"). Following the consolidation, GFD serves as the Funds' distributor.
GD and GFD are both indirect, wholly-owned subsidiaries of Guggenheim Capital, LLC and, therefore, the consolidation will not result in a change of actual control of the Funds' distributor. The primary goal of the consolidation is to achieve greater operational efficiencies and allow all of the Guggenheim funds, including funds that are not series of the Trusts, to be distributed by a single distributor.
The consolidation is not expected to affect the day-to-day management of the Funds or result in any material changes to the distribution of the Funds, including any changes to the distribution fees paid by the Funds.
60 | GUGGENHEIM ETFs ANNUAL REPORT |
OTHER INFORMATION (Unaudited)(continued) |
Board Considerations in Approving the Investment Advisory Agreement
At in-person meetings of the Board of Trustees (the "Board") of Rydex ETF Trust (the "Trust") held on May 15 and June 4, 2014 (each, a "Meeting" and, together, the "Meetings"), called for the purpose of, among other things, consideration of, and voting on, the approval and continuation of the investment advisory agreement applicable to each series of the Trust (each, a "Fund" and, collectively, the "Funds"), the Board, including the Trustees who are not "interested persons," as defined by the Investment Company Act of 1940, of the Trust (the "Independent Trustees"), unanimously approved the continuation of the investment advisory agreement (the "Investment Advisory Agreement") between the Trust and Security Investors, LLC (the "Advisor") with respect to each of the Funds for an additional one-year period, based on the Board's review of qualitative and quantitative information provided by the Advisor.
In reaching the conclusion to approve the continuation of the Investment Advisory Agreement, the Independent Trustees requested and obtained from the Advisor such information as the Independent Trustees deemed reasonably necessary to evaluate the Investment Advisory Agreement. The Advisor provided the Board with a wide variety of information, including comparisons of Fund performance and fees relative to comparable peer funds in advance of the May 15, 2014 Meeting. The Independent Trustees carefully evaluated the information provided as well as information they received throughout the year as part of their regular oversight of the Funds. At the Meetings, independent legal counsel advised the Independent Trustees with respect to their deliberations and their fiduciary responsibilities associated with the Board's consideration of the continuation of the Investment Advisory Agreement. The Board also received a memorandum from Fund counsel regarding the Board's responsibilities when considering the approval of an investment advisory agreement.
During the Meetings, the Board, including the Independent Trustees, evaluated a number of considerations, including among others: (a) the nature, extent and quality of the Advisor's investment advisory and other services; (b) the Advisor's investment management personnel; (c) the Advisor's operations and financial condition; (d) the Advisor's brokerage practices (including any soft dollar arrangements) and investment strategies; (e) a comparison of the Funds' advisory fees to the fees charged to comparable funds or accounts, paying special attention to the absence of breakpoints in these fees and the Advisor's rationale for not including breakpoints; (f) each Fund's overall fees and operating expenses compared with those of peer funds; (g) the Advisor's profitability with respect to its Fund-related operations; (h) the Advisor's compliance systems; (i) the Advisor's policies and compliance procedures applicable to personal securities transactions; (j) the Advisor's reputation, expertise and resources in the financial markets; and (k) Fund performance compared with that of peer funds and/or appropriate benchmarks. In its deliberations, the Board did not identify any particular factor as controlling, noting that each Trustee could attribute different weights to the various factors considered.
Based on the Board's deliberations at the Meetings, the Board, including all of the Independent Trustees, unanimously: (a) concluded that the terms of the Investment Advisory Agreement are fair and reasonable; (b) concluded that the Advisor's fees were reasonable in light of the services that it provides to the Funds; and (c) agreed to approve and continue the Investment Advisory Agreement based upon the following considerations, among others:
| • | Nature, Extent and Quality of Services Provided by the Advisor. At the Meetings, the Board reviewed the scope of services to be provided by the Advisor under the Investment Advisory Agreement and noted that there would be no significant differences between the scope of services required to be provided by the Advisor for the past year and the scope of services required to be provided during the upcoming year. The Board also considered the Advisor's representations to the Board that the Advisor would continue to provide investment and related services that were of materially the same quality and quantity as services provided to the Funds in the past, and that these services are appropriate in scope and extent in light of the Funds' operations, the competitive landscape of the investment company business and investor needs. |
| • | Fund Expenses and Performance of the Funds and the Advisor. At the Meetings, the Board reviewed statistical information provided by the Advisor regarding the expense ratio components and performance of each Fund. The Advisor engaged FUSE Research Network LLC ("FUSE"), an independent, third party research provider, to prepare advisory contract renewal reports to help the Board fulfill its advisory contract renewal responsibilities. The reports compared the Funds' fees, expenses and total return performance to those of comparable funds in the Funds' peer group and the broader peer universe, as determined by FUSE. Statistical information in the FUSE reports related to the expense ratio components was based on a comparison of the Funds' and peer funds' actual advisory fees, |
| GUGGENHEIM ETFs ANNUAL REPORT | 61 |
OTHER INFORMATION (Unaudited)(concluded) |
waivers/reimbursements, and gross and net total expenses. The Board also considered the Advisor's representation that it found the peer groups compiled by FUSE to be appropriate. The statistical information related to the performance of each Fund included three month and one, three, and five year performance for the Fund compared to its peers and its appropriate benchmark.
| • | Costs of Services Provided to the Funds and Profits Realized by the Advisor and its Affiliates. At the Meetings, the Board reviewed information about the profitability of the Funds to the Advisor based on the advisory fees payable under the current Investment Advisory Agreement for the last calendar year. The Board noted that the Adviser had contractually agreed to pay all operating expenses of the Funds, including the cost of index licensing fees, transfer agency, custody, fund administration, legal, audit and other services, except interest, taxes, brokerage commissions and other expenses connected with the execution of portfolio transactions, distribution fees, and extraordinary expenses. At the Meetings, the Board also analyzed the Funds' expenses, including the investment advisory fees paid to the Advisor, and reviewed reports comparing the expense ratios of the Funds to those of other comparable funds. The Board also reviewed information regarding the direct revenue received by the Advisor and ancillary revenue received by the Advisor and/or its affiliates in connection with the services provided to the Funds by the Advisor and/or its affiliates. The Board also discussed the Advisor's profit margin as reflected in the Advisor's profitability analysis. |
| • | Economies of Scale. In connection with its review of the Funds' profitability analysis at the Meetings, the Board considered the absence of breakpoints in the Advisor's fee schedule and reviewed information regarding the extent to which economies of scale or other efficiencies may result from increases in the Funds' asset levels. The Board noted that the Investment Advisory Agreement did not provide for breakpoints in each Fund's advisory fee rates as assets of a Fund increase. However, the Board further noted the Advisor's assertion that future economies of scale had been taken into consideration by fixing relatively low advisory fees for the Funds, effectively sharing the benefits of lower fees with the Funds from inception. The Board noted that it intends to continue to monitor fees as each Fund grows in size and assess whether fee breakpoints may be warranted. |
| • | Other Benefits to the Advisor and/or its Affiliates. In addition to evaluating the services provided by the Advisor, the Board considered the nature and amount of other benefits received by the Advisor and its affiliates as a result of their relationship with the Funds. In particular, the Board considered the nature, extent and quality of the administrative and distribution services performed by the Advisor's affiliates and the fees paid to the Advisor's affiliates for those services under separate agreements. In light of the costs of providing services pursuant to the separate agreements as well as the Advisor's and its affiliates' commitment to the Funds, the ancillary benefits the Advisor and its affiliates received were considered reasonable. The Board also noted that the Advisor reports portfolio transactions on behalf of the Funds, including the cost of such transactions, placed through an affiliate of the Funds or the Advisor at each quarterly Board meeting. |
On the basis of the information provided to it and its evaluation of that information, the Board, including the Independent Trustees, concluded that the approval of the Investment Advisory Agreement would enable Fund shareholders to continue receiving high quality services at a cost that was appropriate, reasonable, and in the best interests of the Funds and their shareholders. The Board, including the Independent Trustees, unanimously approved the continuation of the existing Investment Advisory Agreement.
62 | GUGGENHEIM ETFs ANNUAL REPORT |
INFORMATION ON BOARD OF TRUSTEES AND OFFICERS (Unaudited) |
A Board of Trustees oversees the Trust, as well as other trusts of GI, in which its members have no stated term of service, and continue to serve after election until resignation. The Statement of Additional Information includes further information about Fund Trustees and Officers, and can be obtained without charge by calling 800.820.0888.
| Name, Address* and Year of Birth of Trustee | Position(s) Held with the Trust, Term of Office and Length of Time Served | Principal Occupation(s) During Past 5 Years | Number of Portfolios in Fund Complex Overseen by Trustee*** | Other Directorships Held by Trustee |
| INTERESTED TRUSTEE | ||||
Donald C. Cacciapaglia** (1951) | Trustee from 2012 to present. | Current: President and CEO, certain other funds in the Fund Complex (2012-present); Vice Chairman, Guggenheim Investments (2010-present). Former: Chairman and CEO, Channel Capital Group, Inc. (2002-2010). | 220 | Delaware Life (2013-present); Guggenheim Life and Annuity Company (2011-present); Paragon Life Insurance Company of Indiana (2011-present). |
| INDEPENDENT TRUSTEES | ||||
Corey A. Colehour (1945) | Trustee and Member of the Audit Committee from 2003 to present; and Member of the Governance and Nominating Committees from 2005 to present. | Retired. | 131 | None. |
J. Kenneth Dalton (1941) | Trustee from 2003 to present; Chairman and Member of the Audit Committee from 2003 to present; Member of the Governance and Nominating Committees from 2005 to present; and Member of the Risk Oversight Committee from 2010 to present. | Retired. | 131 | Trustee of Epiphany Funds (4) (2009-present). |
John O. Demaret (1940) | Vice Chairman of the Board of Trustees from 2014 to present; Trustee and Member of the Audit Committee from 2003 to present; Chairman of the Board from 2006 to 2014; and Member of the Risk Oversight Committee from 2010 to present. | Retired. | 131 | None. |
Werner E. Keller (1940) | Chairman of the Board from 2014 to present; Trustee and Member of the Audit, Governance and Nominating Committees from 2005 to present; Vice Chairman of the Board from 2010 to 2014; and Chairman and Member of the Risk Oversight Committee from 2010 to present. | Current: Founder and President, Keller Partners, LLC (investment research firm) (2005-present). | 131 | None. |
| GUGGENHEIM ETFs ANNUAL REPORT | 63 |
INFORMATION ON BOARD OF TRUSTEES AND OFFICERS (Unaudited)(continued) |
| Name, Address* and Year of Birth of Trustee | Position(s) Held with the Trust, Term of Office and Length of Time Served | Principal Occupation(s) During Past 5 Years | Number of Portfolios in Fund Complex Overseen by Trustee*** | Other Directorships Held by Trustee |
| INDEPENDENT TRUSTEES - concluded | ||||
Thomas F. Lydon, Jr. (1960) | Trustee and Member of the Audit, Governance and Nominating Committees from 2005 to present. | Current: President, Global Trends Investments (registered investment adviser) (1996-present). | 131 | US Global Investors (GROW) (1995-present). |
Patrick T. McCarville (1942) | Trustee and Member of the Audit Committee from 2003 to present; Chairman and Member of the Governance and Nominating Committees from 2005 to present. | Retired. Former: Chief Executive Officer, Par Industries, Inc., d/b/a Par Leasing (1977-2010). | 131 | None. |
Name, Address* and Year of Birth | Position(s) Held with the Trust, Term of Office and Length of Time Served | Principal Occupation(s) During Past 5 Years |
| OFFICERS | ||
Donald C. Cacciapaglia (1951) | President (2012-present). | Current: President and CEO, certain other funds in the Fund Complex (2012-present); Vice Chairman, Guggenheim Investments (2010-present). Former: Chairman and CEO, Channel Capital Group Inc. (2002-2010). |
Michael P. Byrum (1970) | Vice President (1999-present). | Current: Senior Vice President, Security Investors, LLC (2010-present); President and Chief Investment Officer, Rydex Holdings, LLC (2008-present); Director and Chairman, Advisory Research Center, Inc. (2006-present); Manager, Guggenheim Specialized Products, LLC (2005-present). Former: Vice President, Guggenheim Distributors, LLC (2009); Director (2009-2010) and Secretary (2002-2010), Rydex Fund Services, LLC; Director (2008-2010), Chief Investment Officer (2006-2010), President (2004-2010) and Secretary (2002-2010), Rydex Advisors, LLC; Director (2008-2010), Chief Investment Officer (2006-2010), President (2004-2010) and Secretary (2002-2010), Rydex Advisors II, LLC. |
Nikolaos Bonos (1963) | Vice President and Treasurer (2003-present). | Current: Senior Vice President, Security Investors, LLC (2010-present); Chief Executive Officer, Guggenheim Specialized Products, LLC (2009-present); Chief Executive Officer & President, Rydex Fund Services, LLC (2009-present); Vice President, Rydex Holdings, LLC (2008-present). Former: Senior Vice President, Security Global Investors, LLC (2010-2011); and Senior Vice President, Rydex Advisors, LLC and Rydex Advisors II, LLC (2006-2011). |
64 | GUGGENHEIM ETFs ANNUAL REPORT |
INFORMATION ON BOARD OF TRUSTEES AND OFFICERS (Unaudited)(concluded) |
Name, Address* and Year of Birth | Position(s) Held with the Trust, Term of Office and Length of Time Served | Principal Occupation(s) During Past 5 Years |
| OFFICERS - concluded | ||
Elisabeth Miller (1968) | Chief Compliance Officer (2012-present). | Current: CCO, certain other funds in the Fund Complex (2012-present); CCO, Security Investors, LLC (2012-present); CCO, Guggenheim Funds Investment Advisors, LLC (2012-present); Vice President, Guggenheim Funds Distributors, LLC (March 2014-present). Former: CCO, Guggenheim Distributors, LLC (2009-March 2014); Senior Manager, Security Investors, LLC (2004-2009); Senior Manager, Guggenheim Distributors, LLC (2004-2009). |
Joseph M. Arruda (1966) | Assistant Treasurer (2006-present). | Current: Assistant Treasurer, certain other funds in the Fund Complex (2006-present); Vice President, Security Investors, LLC (2010-present); CFO and Manager, Guggenheim Specialized Products, LLC (2009-present). Former: Vice President, Security Global Investors, LLC (2010-2011); Vice President, Rydex Advisors, LLC (2010); Vice President, Rydex Advisors II, LLC (2010). |
Paul J. Davio (1972) | Assistant Treasurer (2014-present). | Current: Assistant Treasurer, certain other funds in the Fund Complex (2014-present); Director, Guggenheim Investments (2006-present). Former: Manager, Mutual Fund Administration, Guggenheim Investments (2003-2006) |
Amy J. Lee (1961) | Vice President (2009-present) and Secretary (2012-present). | Current: Chief Legal Officer, certain other funds in the Fund Complex (2012-present); Senior Managing Director, Guggenheim Investments (2012-present). Former: Vice President, Associate General Counsel and Assistant Secretary, Security Benefit Life Insurance Company and Security Benefit Corporation (2004-2012). |
| * | All Trustees and Officers may be reached c/o Guggenheim Investments, 805 King Farm Boulevard, Suite 600, Rockville, MD 20850. |
| ** | Mr. Cacciapaglia is an "interested" person of the Trust, as that term is defined in the 1940 Act by virtue of his affiliation with the Adviser's parent company. |
| *** | The "Fund Complex" includes all closed-end and open-end funds (including all of their portfolios) advised by the Adviser and any funds that have an investment adviser or servicing agent that is an affiliated person of the Adviser. Information provided is as of the date of this report. |
| GUGGENHEIM ETFs ANNUAL REPORT | 65 |
GUGGENHEIM INVESTMENTS PRIVACY POLICIES (Unaudited) |
Rydex Funds, Guggenheim Funds, Rydex Investments, Guggenheim Distributors, LLC, Security Investors, LLC, Security Distributors, Inc. and Rydex Advisory Services (Collectively "Guggenheim Investments").
Our Commitment to You
When you become a Guggenheim Investments investor, you entrust us with not only your hard-earned money but also with personal and financial information about you. We recognize that your relationship with us is based on trust and that you expect us to act responsibly and in your best interests. Because we have access to this private information about you, we hold ourselves to the highest standards in its safekeeping and use. This means, most importantly, that we do not sell client information to anyone—whether it is your personal information or if you are a current or former Guggenheim Investments client.
The Information We Collect About You
In the course of doing business with shareholders and investors, we collect nonpublic personal information about you. You typically provide personal information when you complete a Guggenheim Investments account application or when you request a transaction that involves Rydex and Guggenheim Investments funds or one of the Guggenheim Investments affiliated companies. "Nonpublic personal information" is personally identifiable private information about you. For example, it includes information regarding your name and address, Social Security or taxpayer identification number, assets, income, account balance, bank account information and investment activity (e.g., purchase and redemption history).
How We Handle Your Personal Information
As emphasized above, we do not sell information about current or former clients or their accounts to third parties. Nor do we share such information, except when necessary to complete transactions at your request or to make you aware of related investment products and services that we offer. Additional details about how we handle your personal information are provided below. To complete certain transactions or account changes that you direct, it may be necessary to provide identifying information to companies, individuals or groups that are not affiliated with Guggenheim Investments. For example, if you ask to transfer assets from another financial institution to Guggenheim Investments, we will need to provide certain information about you to that company to complete the transaction. To alert you to other Guggenheim Investments investment products and services, we may share your information within the Guggenheim Investments family of affiliated companies. This would include, for example, sharing your information within Guggenheim Investments so we can make you aware of new Rydex and Guggenheim Investments funds or the services offered through another Guggenheim Investments affiliated company. In certain instances, we may contract with nonaffiliated companies to perform services for us. Where necessary, we will disclose information we have about you to these third parties. In all such cases, we provide the third party with only the information necessary to carry out its assigned responsibilities and only for that purpose. And we require these third parties to treat your private information with the same high degree of confidentiality that we do. In certain instances, we may share information with other financial institutions regarding individuals and entities in response to the U.S.A. Patriot Act. Finally, we will release information about you if you direct us to do so, if we are compelled by law to do so or in other circumstances permitted by law.
Opt Out Provisions
We do not sell your personal information to anyone. The law allows you to "opt out" of only certain kinds of information sharing with third parties. The firm does not share personal information about you with any third parties that triggers this opt-out right. This means YOU ARE ALREADY OPTED OUT.
66 | GUGGENHEIM ETFs ANNUAL REPORT |
GUGGENHEIM INVESTMENTS PRIVACY POLICIES (Unaudited)(concluded) |
How We Protect Privacy Online
Our concern for the privacy of our shareholders also extends to those who use our web site, guggenheiminvestments.com. Our web site uses some of the most secure forms of online communication available, including encryption technology, Secure Socket Layer (SSL) protocol, firewalls and user names and passwords. These technologies provide a high level of security and privacy when you access your account information or initiate online transactions. The Guggenheim Investments web site offers customized features that require our use of "http cookies"—tiny pieces of information that we ask your browser to store. However, we make very limited use of these cookies. We only use cookies for session management and security features on the Guggenheim Investments web site. We do not use them to pull data from your hard drive, to learn your email address, or to view data in cookies created by other web sites. We will not share the information in our cookies or give others access to it. See the legal information area on our web site for more details about web site security and privacy features.
How We Safeguard Your Personal Information
We restrict access to nonpublic personal information about shareholders to our employees and in some cases to third parties (for example, the service providers described above) as permitted by law. We maintain strict physical, electronic and procedural safeguards that comply with federal standards to guard your nonpublic personal information.
We'll Keep You Informed
As required by federal law, we will notify shareholders of our privacy policy annually. We reserve the right to modify this policy at any time, but rest assured that if we do change it, we will tell you promptly. You will also be able to access our privacy policy from our web site at guggenheiminvestments.com. Should you have any questions regarding our privacy policy, contact us at 800.820.0888 or 301.296.5100.
| GUGGENHEIM ETFs ANNUAL REPORT | 67 |
This page intentionally left blank.
This page intentionally left blank.
10.31.2014
Guggenheim ETFs Annual Report
RSP Guggenheim S&P 500® Equal Weight ETF |
| ETF3-ANN-1014x1015 | guggenheiminvestments.com |
| TABLE OF CONTENTS |
| DEAR SHAREHOLDER | 2 |
| ECONOMIC AND MARKET OVERVIEW | 3 |
| FEES AND EXPENSES | 5 |
| MANAGER'S ANALYSIS | 6 |
| PORTFOLIO SUMMARY | 7 |
| SCHEDULE OF INVESTMENTS | 8 |
| STATEMENT OF ASSETS AND LIABILITIES | 14 |
| STATEMENT OF OPERATIONS | 15 |
| STATEMENTS OF CHANGES IN NET ASSETS | 16 |
| FINANCIAL HIGHLIGHTS | 17 |
| NOTES TO FINANCIAL STATEMENTS | 18 |
| REPORT OF INDEPENDENT REGISTERED PUBLIC ACCOUNTING FIRM | 25 |
| OTHER INFORMATION | 26 |
| INFORMATION ON BOARD OF TRUSTEES AND OFFICERS | 29 |
| GUGGENHEIM INVESTMENTS PRIVACY POLICIES | 32 |
| GUGGENHEIM ETFs ANNUAL REPORT | 1 |
| October 31, 2014 |
Dear Shareholder:
Security Investors, LLC (the "Investment Adviser") is pleased to present the annual shareholder report for Guggenheim S&P 500® Equal Weight Exchange Traded Fund ("ETF"). The ticker symbol for the Fund is RSP.
The Investment Adviser is part of Guggenheim Investments, which represents the investment management businesses of Guggenheim Partners, LLC ("Guggenheim"), a global, diversified financial services firm.
Guggenheim Funds Distributors, LLC, is the distributor of the Funds. Guggenheim Funds Distributors, LLC is affiliated with Guggenheim and the Investment Adviser.
This report covers performance of the ETF for the annual period ended October 31, 2014.
We encourage you to read the Economic and Market Overview that follows, which provides additional information regarding the factors that influenced the Fund's performance for the fiscal year, and then the Manager's Analysis for the ETF.
Sincerely,
Donald C. Cacciapaglia
President
November 30, 2014
President
November 30, 2014
Read a prospectus and summary prospectus (if available) carefully before investing. It contains the investment objectives, risks, charges, expenses and other information, which should be considered carefully before investing. Obtain a prospectus and summary prospectus (if available) at guggenheiminvestments.com or call 800.820.0888.
Guggenheim S&P Equal Weight ETF may not be suitable for all investors. • The Fund is subject to the risk that unanticipated early closings of securities exchanges and other financial markets may result in the Fund's inability to buy or sell securities or other financial instruments on that day. • In certain circumstances, it may be difficult for the Fund to purchase and sell particular investments within a reasonable time at a fair price. • Investments in securities and derivatives, in general, are subject to market risks that may cause their prices to fluctuate over time. An investment in the Fund may lose money. • Unlike many investment companies, the Fund is not actively "managed." This means that, based on market and economic conditions, the Fund's performance could be lower than other types of mutual funds that may actively shift their portfolio assets to take advantage of market opportunities or to lessen the impact of a market decline. • Tracking error risk refers to the risk that the Advisor may not be able to cause the Fund's performance to match or correlate to that of the Fund's Underlying Index, either on a daily or aggregate basis. Tracking error risk may cause the Fund's performance to be less than you expect. • Shares may trade below their net asset value ("NAV"). The NAV of shares will fluctuate with changes in the market value of the Fund's holdings. In addition, although the Fund's shares are currently listed on NYSE Arca, Inc. (the "Exchange"), there can be no assurance that an active trading market for shares will develop or be maintained. • The Fund is subject to the risk that large-capitalization stocks may underperform other segments of the equity market or the equity market as a whole. See a fund's prospectus for more information on these and additional risks.
2 | GUGGENHEIM ETFs ANNUAL REPORT |
ECONOMIC AND MARKET OVERVIEW (Unaudited) | October 31, 2014 |
The U.S. economy continued to grow throughout the 12 months ended October 31, 2014, despite some seasonal volatility in September and October that caused spreads in leveraged credit to widen and upward momentum in U.S. stocks to deteriorate. By the end of October, the spread widening had reversed and equities regained their footing, with some key indices shooting to new highs. Markets similarly overcame a weather-related winter soft patch in the first quarter of 2014.
U.S. economic data remains strong, with the third quarter's 3.5% GDP growth signaling that the economy was doing well across the spectrum. Among the highlights: strong net exports, unemployment that had fallen faster than expected and consumer confidence that was at seven year high. The fact that government at the state and local level was contributing to GDP growth suggested that a major headwind for the economy—contracting government spending—has gone away. Lower energy prices are also likely to help boost consumption in the near term.
U.S. is adding close to 230,000 jobs per month on average in 2014, considerably more than 2013's monthly average of 194,000. Employment levels are transitioning from the recovery phase to the expansion phase, which typically coincides with accelerating economic activity. The downward trend in labor force participation has begun to flatten and, as a result, the rapid decline in the nation's unemployment rate should begin to slow. Until unemployment falls below 5.5 percent, it's unlikely that the U.S. economy will experience the kind of meaningful wage pressure that would spur action by the Federal Reserve. An improving labor market, subdued mortgage rates, and tight housing inventory all point to a rebound in the housing market, which accounted for almost half of GDP growth in 2013 and remains critical to the ongoing recovery.
Growth in Japan and Europe continued to stagnate. The slowdown in the euro zone is concentrated at the core rather than the periphery. To combat disinflation and muted credit growth, the European Central Bank (ECB) enacted further monetary easing and instigated its own unique brand of quantitative easing. Japan's major increase in monetary accommodation in late October surprised markets, but could not forestall the Japanese economy tipping into recession after the period ended. The latest Japanese accommodation came just days after the U.S. Federal Reserve ended its own quantitative easing program.
Overseas geopolitical concerns and comparatively attractive yields have pushed global investors to U.S. Treasuries. Such "beggar thy neighbor" policies from Europe and Asia were the main driving force behind the most recent rally in U.S. fixed income, and indicate that U.S. long-term rate should continue to be well supported.
Consensus among investors was that the Fed would begin to hike rates in the second half of 2015. However, the precipitous decline in energy and commodity prices, the strengthening of U.S. dollar and competitive pressures on prices for traded goods will probably push inflation, as measured by the Fed's favored personal consumption expenditures deflator, down toward 1 percent, raising the likelihood that any increase in the policy rate may be pushed into 2016.
For the 12-month period ended October 31, 2014, the return of the Standard & Poor's 500® ("S&P 500") Index* was 17.27%. The Barclays U.S. Aggregate Bond Index* returned 4.14% for the period, while the BofA Merrill Lynch 3-Month U.S. Treasury Bill Index* returned 0.05%. The MSCI World Index* returned 8.67%, while the MSCI Emerging Markets Index* returned 0.64%.
The opinions and forecasts expressed may not actually come to pass. This information is subject to change at any time, based on market and other conditions, and should not be construed as a recommendation of any specific security or strategy.
| GUGGENHEIM ETFs ANNUAL REPORT | 3 |
ECONOMIC AND MARKET OVERVIEW (Unaudited)(concluded) | October 31, 2014 |
*Index Definitions:
The following indices are referenced throughout this report. Indices are unmanaged and not available for direct investment. Index performance does not reflect transaction costs, fees, or expenses.
BofA Merrill Lynch 3-Month U.S. Treasury Bill Index is an unmanaged market index of U.S. Treasury securities maturing in 90 days that assumes reinvestment of all income.
Barclays U.S. Aggregate Bond Index is a broad-based benchmark that measures the investment grade, U.S. dollar-denominated, fixed-rate taxable bond market, including U.S. Treasuries, government-related and corporate securities, MBS (agency fixed-rate and hybrid ARM pass-throughs), ABS and CMBS.
MSCI Emerging Markets Index is a free float-adjusted market capitalization weighted index that is designed to measure equity market performance in the global emerging markets.
MSCI World Index is a free float-adjusted market capitalization weighted index that is designed to measure the equity market performance of developed markets.
S&P 500® Index is a capitalization-weighted index of 500 stocks designed to measure the performance of the broad economy, representing all major industries and is considered a representation of the U.S. stock market.
S&P 500® Equal Weight Index is an unmanaged equal-weighted version of the S&P 500® Index, which measures the performance of the large-capitalization sector of the U.S. equity market and includes 500 widely held common stocks chosen for market size, liquidity and industry group representation. The S&P 500 Equal Weight Index has the same constituents as the unmanaged capitalization-weighted S&P 500 Index, but each company in the equal-weighted index is allocated a fixed weight, and is rebalanced quarterly.
4 | GUGGENHEIM ETFs ANNUAL REPORT |
FEES AND EXPENSES (Unaudited) |
Shareholder Expense Example
As a shareholder of the Rydex ETF Trust, you incur transaction costs such as creation and redemption fees or brokerage charges, and ongoing costs including advisory fees, trustee fees and, if applicable, distribution fees. All other Trust expenses are paid by the Adviser. This Example is intended to help you understand your ongoing costs (in dollars) of investing in a Fund and to compare these costs with the ongoing costs of investing in other mutual funds.
The example in the table is based on an investment of $1,000 invested on April 30, 2014 and held for the six months ended October 31, 2014.
Actual Expenses
The first table below provides information about actual account values and actual expenses. You may use the information in this table, together with the amount you invested, to estimate the expenses that you incurred over the period. Simply divide your account value by $1,000 (for example, an $8,600 account value divided by $1,000 = 8.6), then multiply the result by the number in the first table under the heading entitled "Expenses Paid During the Six-Month Period" to estimate the expenses attributable to your investment during this period.
Hypothetical Example for Comparison Purposes
The second table below provides information about hypothetical account values and hypothetical expenses based on a Fund's actual expense ratio and an assumed rate of return of 5% per year before expenses, which is not a Fund's actual return. Thus, you should not use the hypothetical account values and expenses to estimate the actual ending account balance or your expenses for the period. Rather, these figures are provided to enable you to compare the ongoing costs of investing in a Fund and other funds. To do so, compare this 5% hypothetical example with the 5% hypothetical examples that appear in the shareholder reports of other funds.
Please note that the expenses shown in the table are meant to highlight your ongoing costs only and do not reflect any transaction costs, such as creation and redemption fees, or brokerage charges. Therefore, the second table is useful in comparing ongoing costs only, and will not help you determine the relative total costs of owning different funds. In addition, if these transaction costs were included, your costs would have been higher.
Expense Ratio1 | Fund Return | Beginning Account Value April 30, 2014 | Ending Account Value October 31, 2014 | Expenses Paid During Period2 | |
Table 1. Based on actual Fund return3 | |||||
Guggenheim S&P 500® Equal Weight ETF | 0.40% | 7.39% | $1,000.00 | $1,073.90 | $2.09 |
| Table 2. Based on hypothetical 5% return (before expenses) | |||||
Guggenheim S&P 500® Equal Weight ETF | 0.40% | 5.00% | 1,000.00 | 1,023.19 | 2.04 |
1 | Annualized. |
2 | Expenses are equal to the Fund's annualized expense ratio, net of any applicable fee waivers, multiplied by the average account value over the period, multiplied by 184/365 (to reflect the one-half year period). |
3 | Actual cumulative return at net asset value for the period April 30, 2014 to October 31, 2014. |
| GUGGENHEIM ETFs ANNUAL REPORT | 5 |
MANAGER'S ANALYSIS (Unaudited) | October 31, 2014 |
GUGGENHEIM S&P 500® EQUAL WEIGHT ETF
Guggenheim S&P 500® Equal Weight ETF returned 16.60% for the one-year period ended October 31, 2014, compared with the benchmark S&P 500® Equal Weight Index, which returned 17.27%. The cap-weighted S&P 500 Total Return Index returned 17.07%. During the period, RSP achieved over 99% correlation to its benchmark on a daily basis.
The Health Care, Information Technology and Financials sectors contributed most to performance. No sector detracted from performance, but the Energy and Telecommunications Services sectors contributed least.
Top contributors to Fund return included Forest Laboratories, Inc., Allergan, Inc. and Southwest Airlines Co. The top detractors were Avon Products, Inc., Whole Foods Market, Inc. and Denbury Resources, Inc.
Cumulative Fund Performance: October 31, 2004 – October 31, 2014
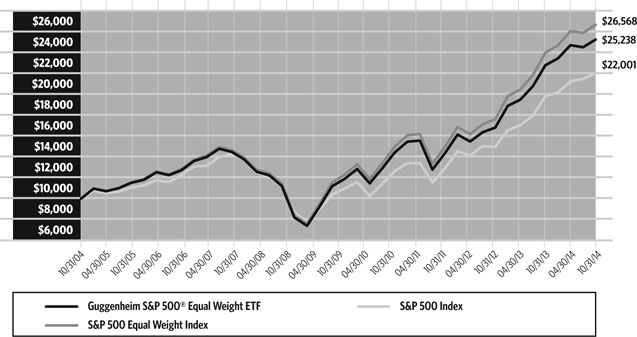
| AVERAGE ANNUAL TOTAL RETURNS FOR THE PERIOD ENDED OCTOBER 31, 2014 | ||||
| One Year | Three Year | Five Year | 10 Year | |
Guggenheim S&P 500® Equal Weight ETF | 16.60% | 20.46% | 18.51% | 9.70% |
| S&P 500 Equal Weight Index | 17.07% | 21.00% | 19.05% | 10.30% |
| S&P 500 Index | 17.27% | 19.77% | 16.69% | 8.20% |
The returns presented above do not reflect the effect of taxes. Index returns represent total returns. Performance displayed represents past performance, which is no guarantee of future results.
6 | GUGGENHEIM ETFs ANNUAL REPORT |
PORTFOLIO SUMMARY (Unaudited) | October 31, 2014 |
GUGGENHEIM S&P 500® EQUAL WEIGHT ETF
Holdings Diversification*
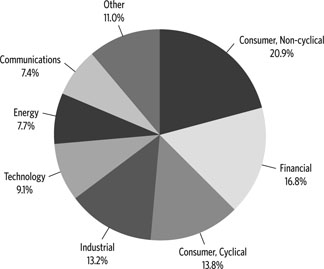
"Holdings Diversification (Market Exposure as % of Net Assets)" excludes any temporary cash investments.
* The Fund's Top Ten Holdings are expressed as a percentage of net assets and the Holdings Diversification is expressed as a percentage of the Fund's equity investments market value. These percentages may change over time.
| Ten Largest Holdings* | (% of Total Net Assets) |
| Sigma-Aldrich Corp. | 0.3% |
| CareFusion Corp. | 0.2% |
| Edwards Lifesciences Corp. | 0.2% |
| Vertex Pharmaceuticals, Inc. | 0.2% |
| Tractor Supply Co. | 0.2% |
| Amgen, Inc. | 0.2% |
| Alexion Pharmaceuticals, Inc. | 0.2% |
| Celgene Corp. | 0.2% |
| Tesoro Corp. | 0.2% |
| Bristol-Myers Squibb Co. | 0.2% |
| Top Ten Total | 2.1% |
| "Ten Largest Holdings" exclude any temporary cash. | |
| GUGGENHEIM ETFs ANNUAL REPORT | 7 |
| SCHEDULE OF INVESTMENTS | October 31, 2014 |
GUGGENHEIM S&P 500® EQUAL WEIGHT ETF |
| Shares | Value | |||||||
COMMON STOCKS† - 99.9% | ||||||||
| CONSUMER, NON-CYCLICAL - 20.9% | ||||||||
| CareFusion Corp.* | 381,609 | $ | 21,892,908 | |||||
| Edwards Lifesciences Corp.* | 177,594 | 21,474,666 | ||||||
| Vertex Pharmaceuticals, Inc.* | 190,375 | 21,443,841 | ||||||
| Amgen, Inc. | 128,386 | 20,821,641 | ||||||
| Alexion Pharmaceuticals, Inc.* | 108,789 | 20,817,863 | ||||||
| Celgene Corp.* | 193,429 | 20,714,312 | ||||||
| Bristol-Myers Squibb Co. | 352,222 | 20,495,799 | ||||||
| Keurig Green Mountain, Inc. | 135,025 | 20,490,044 | ||||||
| Mylan, Inc.* | 376,180 | 20,144,438 | ||||||
| Regeneron Pharmaceuticals, Inc.* | 51,152 | 20,139,565 | ||||||
| Becton Dickinson and Co. | 155,687 | 20,036,917 | ||||||
| Allergan, Inc. | 104,590 | 19,878,375 | ||||||
| Monster Beverage Corp.* | 196,943 | 19,867,610 | ||||||
| Automatic Data Processing, Inc. | 242,900 | 19,864,363 | ||||||
| Altria Group, Inc. | 410,163 | 19,827,280 | ||||||
| Dr Pepper Snapple Group, Inc. | 286,078 | 19,810,902 | ||||||
| Clorox Co. | 198,925 | 19,793,037 | ||||||
| Perrigo Company plc | 122,508 | 19,778,917 | ||||||
| MasterCard, Inc. — Class A | 234,567 | 19,644,986 | ||||||
| CR Bard, Inc. | 119,669 | 19,622,126 | ||||||
| AmerisourceBergen Corp. — Class A | 229,610 | 19,610,991 | ||||||
| Cintas Corp. | 266,849 | 19,544,021 | ||||||
| UnitedHealth Group, Inc. | 205,412 | 19,516,194 | ||||||
| Alliance Data Systems Corp.* | 68,641 | 19,449,427 | ||||||
| AbbVie, Inc. | 305,854 | 19,409,495 | ||||||
| Reynolds American, Inc. | 308,410 | 19,402,073 | ||||||
| DENTSPLY International, Inc. | 378,673 | 19,225,228 | ||||||
| Robert Half International, Inc. | 350,131 | 19,180,176 | ||||||
| Humana, Inc. | 138,022 | 19,164,355 | ||||||
| Gilead Sciences, Inc.* | 170,774 | 19,126,688 | ||||||
| Hormel Foods Corp. | 354,268 | 19,098,588 | ||||||
| Cigna Corp. | 191,749 | 19,092,448 | ||||||
| Kimberly-Clark Corp. | 166,980 | 19,080,805 | ||||||
| Kroger Co. | 341,560 | 19,028,307 | ||||||
| Mallinckrodt plc* | 205,247 | 18,919,668 | ||||||
| WellPoint, Inc. | 149,240 | 18,907,216 | ||||||
| Constellation Brands, Inc. — Class A* | 206,090 | 18,865,478 | ||||||
| Total System Services, Inc. | 557,556 | 18,839,817 | ||||||
| Patterson Companies, Inc. | 436,356 | 18,811,307 | ||||||
| Boston Scientific Corp.* | 1,416,227 | 18,807,495 | ||||||
| ConAgra Foods, Inc. | 547,397 | 18,803,088 | ||||||
| Zimmer Holdings, Inc. | 168,690 | 18,765,076 | ||||||
| Philip Morris International, Inc. | 210,701 | 18,754,496 | ||||||
| PepsiCo, Inc. | 194,818 | 18,735,647 | ||||||
| McKesson Corp. | 91,981 | 18,709,855 | ||||||
| Tyson Foods, Inc. — Class A | 462,695 | 18,669,743 | ||||||
| DaVita HealthCare Partners, Inc.* | 239,001 | 18,658,808 | ||||||
| McGraw Hill Financial, Inc. | 206,042 | 18,642,680 | ||||||
| Stryker Corp. | 212,108 | 18,565,813 | ||||||
| Procter & Gamble Co. | 212,615 | 18,554,910 | ||||||
| Medtronic, Inc. | 271,556 | 18,509,257 | ||||||
| Moody’s Corp. | 186,325 | 18,489,030 | ||||||
| JM Smucker Co. | 177,558 | 18,466,032 | ||||||
| Express Scripts Holding Co.* | 240,082 | 18,443,099 | ||||||
| Cardinal Health, Inc. | 234,815 | 18,428,281 | ||||||
| Lorillard, Inc. | 299,638 | 18,427,737 | ||||||
| Colgate-Palmolive Co. | 274,542 | 18,361,369 | ||||||
| McCormick & Company, Inc. | 259,384 | 18,343,636 | ||||||
| Molson Coors Brewing Co. — Class B | 246,554 | 18,338,687 | ||||||
| Actavis plc* | 75,532 | 18,334,638 | ||||||
| Hershey Co. | 191,029 | 18,321,591 | ||||||
| Whole Foods Market, Inc. | 464,700 | 18,276,651 | ||||||
| Intuitive Surgical, Inc.* | 36,824 | 18,257,339 | ||||||
| Johnson & Johnson | 169,280 | 18,244,998 | ||||||
| Brown-Forman Corp. — Class B | 196,704 | 18,228,560 | ||||||
| Laboratory Corporation of America Holdings* | 166,453 | 18,191,648 | ||||||
| Mead Johnson Nutrition Co. — Class A | 183,092 | 18,182,867 | ||||||
| Zoetis, Inc. | 489,300 | 18,182,388 | ||||||
| Abbott Laboratories | 416,048 | 18,135,532 | ||||||
| Hospira, Inc.* | 336,360 | 18,062,532 | ||||||
| Covidien plc | 195,246 | 18,048,540 | ||||||
| Sysco Corp. | 468,085 | 18,039,996 | ||||||
| Campbell Soup Co. | 407,894 | 18,016,678 | ||||||
| Pfizer, Inc. | 601,527 | 18,015,734 | ||||||
| St. Jude Medical, Inc. | 280,639 | 18,008,605 | ||||||
| Eli Lilly & Co. | 271,225 | 17,990,354 | ||||||
| Quest Diagnostics, Inc. | 282,702 | 17,940,269 | ||||||
Western Union Co.1 | 1,054,997 | 17,892,749 | ||||||
| Safeway, Inc. | 513,123 | 17,887,468 | ||||||
| Coca-Cola Co. | 426,989 | 17,882,299 | ||||||
| Estee Lauder Companies, Inc. — Class A | 237,681 | 17,868,858 | ||||||
| Aetna, Inc. | 215,367 | 17,769,931 | ||||||
| Kellogg Co. | 277,077 | 17,721,845 | ||||||
| Mondelez International, Inc. — Class A | 501,212 | 17,672,735 | ||||||
| H&R Block, Inc. | 545,538 | 17,626,333 | ||||||
| Biogen Idec, Inc.* | 54,743 | 17,576,882 | ||||||
| Varian Medical Systems, Inc.* | 207,460 | 17,451,535 | ||||||
| General Mills, Inc. | 335,345 | 17,424,526 | ||||||
| Kraft Foods Group, Inc. | 306,697 | 17,282,376 | ||||||
| Merck & Company, Inc. | 297,273 | 17,223,998 | ||||||
ADT Corp.1 | 480,143 | 17,208,325 | ||||||
| Avery Dennison Corp. | 366,827 | 17,185,845 | ||||||
| Equifax, Inc. | 226,789 | 17,176,999 | ||||||
| Coca-Cola Enterprises, Inc. | 391,737 | 16,981,799 | ||||||
| United Rentals, Inc.* | 151,824 | 16,709,749 | ||||||
| Baxter International, Inc. | 236,984 | 16,622,058 | ||||||
| Quanta Services, Inc.* | 484,481 | 16,511,112 | ||||||
| Archer-Daniels-Midland Co. | 351,179 | 16,505,413 | ||||||
| Universal Health Services, Inc. — Class B | 158,473 | 16,435,235 | ||||||
| Tenet Healthcare Corp.* | 287,709 | 16,126,089 | ||||||
| Avon Products, Inc. | 1,302,637 | 13,547,425 | ||||||
| Kimberly-Clark Corp.* | 7,283 | 802,805 | ||||||
| Total Consumer, Non-cyclical | 1,879,879,920 | |||||||
8 | GUGGENHEIM ETFs ANNUAL REPORT | SEE NOTES TO FINANCIAL STATEMENTS. |
SCHEDULE OF INVESTMENTS (continued) | October 31, 2014 |
GUGGENHEIM S&P 500® EQUAL WEIGHT ETF |
| Shares | Value | |||||||
| FINANCIAL - 16.8% | ||||||||
| Visa, Inc. — Class A | 82,707 | $ | 19,967,951 | |||||
| Health Care REIT, Inc. | 279,889 | 19,902,906 | ||||||
| Navient Corp. | 1,004,700 | 19,872,966 | ||||||
| Ventas, Inc. | 289,311 | 19,820,697 | ||||||
| Kimco Realty Corp. | 792,432 | 19,771,178 | ||||||
| Equity Residential | 282,612 | 19,658,490 | ||||||
| Public Storage | 106,587 | 19,648,248 | ||||||
| Essex Property Trust, Inc. | 96,651 | 19,500,306 | ||||||
| Macerich Co. | 276,130 | 19,467,166 | ||||||
| Boston Properties, Inc. | 153,539 | 19,461,068 | ||||||
| Chubb Corp. | 195,032 | 19,378,380 | ||||||
| Travelers Companies, Inc. | 191,543 | 19,307,534 | ||||||
| General Growth Properties, Inc. | 744,443 | 19,288,518 | ||||||
| Apartment Investment & Management Co. — Class A | 537,591 | 19,240,382 | ||||||
| HCP, Inc. | 436,570 | 19,195,983 | ||||||
| Simon Property Group, Inc. | 106,959 | 19,168,122 | ||||||
| AvalonBay Communities, Inc. | 122,112 | 19,029,934 | ||||||
| Host Hotels & Resorts, Inc. | 814,668 | 18,989,911 | ||||||
| Intercontinental Exchange, Inc. | 90,938 | 18,941,476 | ||||||
| Prologis, Inc. | 453,335 | 18,881,403 | ||||||
| Vornado Realty Trust | 172,324 | 18,866,032 | ||||||
| Hartford Financial Services Group, Inc. | 476,520 | 18,860,661 | ||||||
| CBRE Group, Inc. — Class A* | 589,304 | 18,857,728 | ||||||
| Allstate Corp. | 290,207 | 18,819,923 | ||||||
| Genworth Financial, Inc. — Class A* | 1,344,182 | 18,805,106 | ||||||
| CME Group, Inc. — Class A | 223,153 | 18,702,453 | ||||||
| Assurant, Inc. | 273,698 | 18,671,678 | ||||||
| Progressive Corp. | 706,414 | 18,656,394 | ||||||
| Cincinnati Financial Corp. | 368,498 | 18,598,094 | ||||||
| ACE Ltd. | 168,769 | 18,446,452 | ||||||
| Goldman Sachs Group, Inc. | 96,893 | 18,408,701 | ||||||
| BlackRock, Inc. — Class A | 53,792 | 18,348,990 | ||||||
| Legg Mason, Inc. | 352,431 | 18,326,412 | ||||||
| Plum Creek Timber Company, Inc. | 446,699 | 18,319,126 | ||||||
| T. Rowe Price Group, Inc. | 222,623 | 18,275,122 | ||||||
| Marsh & McLennan Companies, Inc. | 335,978 | 18,267,124 | ||||||
| Loews Corp. | 417,426 | 18,199,774 | ||||||
| Wells Fargo & Co. | 342,416 | 18,178,864 | ||||||
| American Express Co. | 201,996 | 18,169,540 | ||||||
| Iron Mountain, Inc. | 502,782 | 18,135,347 | ||||||
| Weyerhaeuser Co. | 534,994 | 18,114,897 | ||||||
| Capital One Financial Corp. | 218,714 | 18,102,957 | ||||||
| Berkshire Hathaway, Inc. — Class B* | 129,130 | 18,098,861 | ||||||
| Bank of America Corp. | 1,054,372 | 18,093,024 | ||||||
| Citigroup, Inc. | 337,969 | 18,091,481 | ||||||
| Discover Financial Services | 283,558 | 18,085,329 | ||||||
| State Street Corp. | 238,970 | 18,032,676 | ||||||
| American Tower Corp. — Class A | 184,382 | 17,977,245 | ||||||
| XL Group plc — Class A | 529,546 | 17,941,018 | ||||||
| Ameriprise Financial, Inc. | 141,808 | 17,891,915 | ||||||
| U.S. Bancorp | 419,493 | 17,870,402 | ||||||
| JPMorgan Chase & Co. | 294,896 | 17,835,310 | ||||||
| Franklin Resources, Inc. | 319,259 | 17,753,993 | ||||||
| PNC Financial Services Group, Inc. | 205,317 | 17,737,336 | ||||||
| SunTrust Banks, Inc. | 453,104 | 17,734,491 | ||||||
| Aflac, Inc. | 296,086 | 17,685,217 | ||||||
| Lincoln National Corp. | 322,745 | 17,673,516 | ||||||
| Morgan Stanley | 505,651 | 17,672,502 | ||||||
| BB&T Corp. | 463,913 | 17,573,024 | ||||||
| Invesco Ltd. | 433,896 | 17,559,771 | ||||||
| Crown Castle International Corp. | 224,687 | 17,552,548 | ||||||
| Aon plc | 203,288 | 17,482,768 | ||||||
| Torchmark Corp. | 329,962 | 17,474,788 | ||||||
| NASDAQ OMX Group, Inc. | 403,672 | 17,462,851 | ||||||
| Zions Bancorporation | 598,469 | 17,337,647 | ||||||
| Huntington Bancshares, Inc. | 1,747,563 | 17,318,349 | ||||||
| MetLife, Inc. | 319,144 | 17,310,371 | ||||||
| Prudential Financial, Inc. | 194,669 | 17,235,993 | ||||||
| People’s United Financial, Inc. | 1,178,621 | 17,231,439 | ||||||
| Charles Schwab Corp. | 599,690 | 17,193,113 | ||||||
| Affiliated Managers Group, Inc.* | 86,023 | 17,186,535 | ||||||
| American International Group, Inc. | 320,755 | 17,182,845 | ||||||
| Bank of New York Mellon Corp. | 443,680 | 17,179,290 | ||||||
| M&T Bank Corp. | 140,564 | 17,174,110 | ||||||
| Principal Financial Group, Inc. | 327,582 | 17,155,469 | ||||||
| Fifth Third Bancorp | 857,487 | 17,141,165 | ||||||
| E*TRADE Financial Corp.* | 765,034 | 17,060,258 | ||||||
| Regions Financial Corp. | 1,710,419 | 16,984,461 | ||||||
| Northern Trust Corp. | 254,537 | 16,875,803 | ||||||
| Hudson City Bancorp, Inc. | 1,747,539 | 16,863,751 | ||||||
| KeyCorp | 1,270,845 | 16,775,154 | ||||||
| Comerica, Inc. | 345,486 | 16,493,502 | ||||||
| Unum Group | 492,836 | 16,490,293 | ||||||
| Total Financial | 1,510,093,608 | |||||||
| CONSUMER, CYCLICAL - 13.8% | ||||||||
| Tractor Supply Co. | 289,971 | 21,231,677 | ||||||
| O’Reilly Automotive, Inc.* | 114,782 | 20,187,858 | ||||||
| NIKE, Inc. — Class B | 216,309 | 20,110,248 | ||||||
| Whirlpool Corp. | 116,385 | 20,024,039 | ||||||
| L Brands, Inc. | 271,556 | 19,584,619 | ||||||
| Lennar Corp. — Class A | 453,220 | 19,524,717 | ||||||
| Home Depot, Inc. | 199,270 | 19,432,810 | ||||||
| Genuine Parts Co. | 199,762 | 19,392,895 | ||||||
| AutoNation, Inc.* | 338,097 | 19,359,435 | ||||||
Darden Restaurants, Inc.1 | 372,066 | 19,265,576 | ||||||
| PACCAR, Inc. | 294,360 | 19,227,595 | ||||||
| Dollar Tree, Inc.* | 316,577 | 19,175,068 | ||||||
| Lowe’s Companies, Inc. | 334,200 | 19,116,240 | ||||||
| Ross Stores, Inc. | 235,529 | 19,011,901 | ||||||
| Marriott International, Inc. — Class A | 250,677 | 18,988,783 | ||||||
| Hasbro, Inc. | 329,840 | 18,975,695 | ||||||
| CVS Health Corp. | 219,725 | 18,854,602 | ||||||
| CarMax, Inc.* | 337,008 | 18,842,117 | ||||||
| Costco Wholesale Corp. | 141,199 | 18,831,710 | ||||||
| SEE NOTES TO FINANCIAL STATEMENTS. | GUGGENHEIM ETFs ANNUAL REPORT | 9 |
SCHEDULE OF INVESTMENTS (continued) | October 31, 2014 |
GUGGENHEIM S&P 500® EQUAL WEIGHT ETF |
| Shares | Value | |||||||
| DR Horton, Inc. | 824,925 | $ | 18,800,041 | |||||
| TJX Companies, Inc. | 295,594 | 18,717,012 | ||||||
| Nordstrom, Inc. | 256,260 | 18,607,039 | ||||||
| AutoZone, Inc.* | 33,407 | 18,491,443 | ||||||
| Wynn Resorts Ltd. | 96,983 | 18,427,740 | ||||||
| Bed Bath & Beyond, Inc.* | 271,888 | 18,308,938 | ||||||
| VF Corp. | 268,796 | 18,192,114 | ||||||
| PetSmart, Inc. | 251,101 | 18,167,157 | ||||||
| Carnival Corp. | 451,827 | 18,140,854 | ||||||
| Michael Kors Holdings Ltd.* | 230,442 | 18,110,437 | ||||||
| Walgreen Co. | 281,807 | 18,097,646 | ||||||
| PulteGroup, Inc. | 942,642 | 18,089,300 | ||||||
| Harley-Davidson, Inc. | 274,797 | 18,054,163 | ||||||
| Southwest Airlines Co. | 522,666 | 18,021,524 | ||||||
| Best Buy Company, Inc. | 526,555 | 17,976,588 | ||||||
| Johnson Controls, Inc. | 380,048 | 17,957,269 | ||||||
| Delta Air Lines, Inc. | 446,027 | 17,943,666 | ||||||
| Wal-Mart Stores, Inc. | 233,643 | 17,819,952 | ||||||
| McDonald’s Corp. | 189,653 | 17,776,176 | ||||||
| Yum! Brands, Inc. | 247,320 | 17,764,996 | ||||||
| Starbucks Corp. | 234,567 | 17,723,883 | ||||||
| Mohawk Industries, Inc.* | 124,490 | 17,682,560 | ||||||
Family Dollar Stores, Inc.1 | 225,541 | 17,657,605 | ||||||
| WW Grainger, Inc. | 71,253 | 17,585,240 | ||||||
| Target Corp. | 283,107 | 17,501,675 | ||||||
| Fossil Group, Inc.* | 171,874 | 17,472,711 | ||||||
| Goodyear Tire & Rubber Co. | 719,627 | 17,436,562 | ||||||
| Delphi Automotive plc | 252,288 | 17,402,826 | ||||||
GameStop Corp. — Class A1 | 405,940 | 17,357,994 | ||||||
| Dollar General Corp.* | 276,904 | 17,353,574 | ||||||
| Staples, Inc. | 1,367,544 | 17,340,458 | ||||||
| Newell Rubbermaid, Inc. | 517,173 | 17,237,376 | ||||||
| Macy’s, Inc. | 297,074 | 17,176,819 | ||||||
| Harman International Industries, Inc. | 159,166 | 17,084,878 | ||||||
| Wyndham Worldwide Corp. | 219,888 | 17,078,701 | ||||||
| Fastenal Co. | 386,523 | 17,022,473 | ||||||
| Chipotle Mexican Grill, Inc. — Class A* | 26,632 | 16,991,216 | ||||||
| Tiffany & Co. | 175,014 | 16,822,346 | ||||||
| Ralph Lauren Corp. — Class A | 101,860 | 16,790,602 | ||||||
| BorgWarner, Inc. | 294,067 | 16,767,700 | ||||||
| Under Armour, Inc. — Class A* | 255,671 | 16,766,904 | ||||||
| General Motors Co. | 532,091 | 16,707,657 | ||||||
| Coach, Inc. | 478,968 | 16,466,920 | ||||||
| Starwood Hotels & Resorts Worldwide, Inc. | 213,135 | 16,338,929 | ||||||
| Mattel, Inc. | 515,514 | 16,017,020 | ||||||
| PVH Corp. | 139,649 | 15,968,863 | ||||||
| Kohl’s Corp. | 293,184 | 15,896,436 | ||||||
| The Gap, Inc. | 399,705 | 15,144,822 | ||||||
| Ford Motor Co. | 1,067,077 | 15,035,115 | ||||||
| Urban Outfitters, Inc.* | 456,019 | 13,844,737 | ||||||
| Total Consumer, Cyclical | 1,236,276,242 | |||||||
| INDUSTRIAL - 13.2% | ||||||||
| Textron, Inc. | 485,538 | $ | 20,164,394 | |||||
| CSX Corp. | 565,765 | 20,158,208 | ||||||
| Leggett & Platt, Inc. | 504,492 | 19,866,895 | ||||||
| General Dynamics Corp. | 140,055 | 19,574,088 | ||||||
| Pall Corp. | 212,261 | 19,404,901 | ||||||
| Rockwell Collins, Inc. | 230,353 | 19,384,205 | ||||||
| Lockheed Martin Corp. | 101,488 | 19,340,568 | ||||||
| Waters Corp.* | 173,936 | 19,272,109 | ||||||
| FedEx Corp. | 115,124 | 19,271,758 | ||||||
| Union Pacific Corp. | 165,432 | 19,264,556 | ||||||
| Parker-Hannifin Corp. | 150,299 | 19,092,482 | ||||||
| Stericycle, Inc.* | 151,166 | 19,046,916 | ||||||
| Roper Industries, Inc. | 120,317 | 19,046,181 | ||||||
| United Parcel Service, Inc. — Class B | 180,544 | 18,940,871 | ||||||
| 3M Co. | 122,981 | 18,910,788 | ||||||
| Kansas City Southern | 153,991 | 18,908,555 | ||||||
| Northrop Grumman Corp. | 136,182 | 18,787,669 | ||||||
| L-3 Communications Holdings, Inc. | 154,231 | 18,732,897 | ||||||
| Cummins, Inc. | 127,759 | 18,675,811 | ||||||
| Snap-on, Inc. | 140,798 | 18,605,047 | ||||||
| Ingersoll-Rand plc | 295,741 | 18,519,301 | ||||||
| Danaher Corp. | 230,263 | 18,513,145 | ||||||
| Waste Management, Inc. | 378,259 | 18,493,082 | ||||||
| Deere & Co. | 216,021 | 18,478,436 | ||||||
| Allegion plc | 347,997 | 18,475,161 | ||||||
Garmin Ltd.1 | 330,710 | 18,347,791 | ||||||
| Illinois Tool Works, Inc. | 200,573 | 18,262,172 | ||||||
| Raytheon Co. | 175,671 | 18,248,703 | ||||||
| CH Robinson Worldwide, Inc. | 263,556 | 18,240,711 | ||||||
| Norfolk Southern Corp. | 164,077 | 18,153,479 | ||||||
| Eaton Corporation plc | 263,869 | 18,046,001 | ||||||
| Stanley Black & Decker, Inc. | 192,654 | 18,040,121 | ||||||
| Honeywell International, Inc. | 187,325 | 18,005,679 | ||||||
| Expeditors International of Washington, Inc. | 417,426 | 17,807,393 | ||||||
| FLIR Systems, Inc. | 529,466 | 17,752,995 | ||||||
| AMETEK, Inc. | 339,788 | 17,719,944 | ||||||
| General Electric Co. | 684,304 | 17,661,886 | ||||||
| Pentair plc | 262,688 | 17,613,230 | ||||||
| Emerson Electric Co. | 274,500 | 17,584,470 | ||||||
| United Technologies Corp. | 163,384 | 17,482,088 | ||||||
| Vulcan Materials Co. | 282,702 | 17,445,540 | ||||||
| Boeing Co. | 139,451 | 17,418,824 | ||||||
| Republic Services, Inc. — Class A | 452,182 | 17,363,789 | ||||||
| Sealed Air Corp. | 478,968 | 17,362,590 | ||||||
| Ball Corp. | 269,406 | 17,357,829 | ||||||
| Xylem, Inc. | 476,520 | 17,326,267 | ||||||
| Jabil Circuit, Inc. | 823,386 | 17,249,937 | ||||||
| Bemis Company, Inc. | 448,399 | 17,249,910 | ||||||
| Rockwell Automation, Inc. | 153,407 | 17,235,276 | ||||||
| PerkinElmer, Inc. | 396,297 | 17,207,216 | ||||||
| Amphenol Corp. — Class A | 339,722 | 17,183,139 | ||||||
| TE Connectivity Ltd. | 280,994 | 17,177,163 | ||||||
10 | GUGGENHEIM ETFs ANNUAL REPORT | SEE NOTES TO FINANCIAL STATEMENTS. |
SCHEDULE OF INVESTMENTS (continued) | October 31, 2014 |
GUGGENHEIM S&P 500® EQUAL WEIGHT ETF |
| Shares | Value | |||||||
| Tyco International Ltd. | 399,345 | $ | 17,143,881 | |||||
| Caterpillar, Inc. | 168,562 | 17,093,872 | ||||||
| Ryder System, Inc. | 190,967 | 16,894,850 | ||||||
| Thermo Fisher Scientific, Inc. | 143,593 | 16,882,229 | ||||||
| Fluor Corp. | 252,934 | 16,779,642 | ||||||
| Agilent Technologies, Inc. | 302,090 | 16,699,535 | ||||||
| Dover Corp. | 206,377 | 16,394,589 | ||||||
| Masco Corp. | 741,318 | 16,360,888 | ||||||
| Precision Castparts Corp. | 73,773 | 16,281,701 | ||||||
| Flowserve Corp. | 238,393 | 16,208,340 | ||||||
| Martin Marietta Materials, Inc. | 137,001 | 16,018,157 | ||||||
| Joy Global, Inc. | 302,462 | 15,918,575 | ||||||
| Jacobs Engineering Group, Inc.* | 331,141 | 15,712,640 | ||||||
| Owens-Illinois, Inc.* | 561,634 | 14,473,308 | ||||||
| Agilent Technologies, Inc.* | 116,461 | 4,679,403 | ||||||
| Total Industrial | 1,187,013,777 | |||||||
| TECHNOLOGY - 9.1% | ||||||||
| Paychex, Inc. | 421,791 | 19,798,870 | ||||||
| Electronic Arts, Inc.* | 476,392 | 19,517,780 | ||||||
| Cognizant Technology Solutions Corp. — Class A* | 395,504 | 19,320,371 | ||||||
| Lam Research Corp. | 247,067 | 19,236,637 | ||||||
| salesforce.com, Inc.* | 298,782 | 19,119,060 | ||||||
| Cerner Corp.* | 301,323 | 19,085,799 | ||||||
| Autodesk, Inc.* | 330,649 | 19,025,543 | ||||||
| Fiserv, Inc.* | 272,608 | 18,940,804 | ||||||
| Apple, Inc. | 174,140 | 18,807,120 | ||||||
| Dun & Bradstreet Corp. | 151,398 | 18,593,188 | ||||||
| Micron Technology, Inc.* | 561,546 | 18,581,558 | ||||||
| Intuit, Inc. | 210,776 | 18,550,396 | ||||||
| Xilinx, Inc. | 417,023 | 18,549,183 | ||||||
| QUALCOMM, Inc. | 235,001 | 18,449,929 | ||||||
| Texas Instruments, Inc. | 370,119 | 18,380,110 | ||||||
| Broadcom Corp. — Class A | 438,409 | 18,360,569 | ||||||
| Seagate Technology plc | 290,161 | 18,230,816 | ||||||
| Fidelity National Information Services, Inc. | 310,467 | 18,128,168 | ||||||
| NVIDIA Corp. | 925,884 | 18,091,773 | ||||||
| CA, Inc. | 621,150 | 18,050,619 | ||||||
| Computer Sciences Corp. | 296,480 | 17,907,392 | ||||||
| KLA-Tencor Corp. | 226,143 | 17,899,218 | ||||||
| Analog Devices, Inc. | 360,402 | 17,883,147 | ||||||
| NetApp, Inc. | 416,535 | 17,827,698 | ||||||
| Microsoft Corp. | 379,117 | 17,799,543 | ||||||
| Accenture plc — Class A | 218,633 | 17,735,509 | ||||||
| Applied Materials, Inc. | 793,845 | 17,536,036 | ||||||
| Adobe Systems, Inc.* | 249,400 | 17,487,928 | ||||||
| Western Digital Corp. | 177,222 | 17,433,328 | ||||||
| Intel Corp. | 511,342 | 17,390,741 | ||||||
| Avago Technologies Ltd. | 201,516 | 17,380,755 | ||||||
| Hewlett-Packard Co. | 484,217 | 17,373,706 | ||||||
| Xerox Corp. | 1,306,483 | 17,350,094 | ||||||
| Red Hat, Inc.* | 292,461 | 17,231,802 | ||||||
| EMC Corp. | 597,063 | 17,153,620 | ||||||
| Altera Corp. | 498,742 | 17,141,763 | ||||||
| Akamai Technologies, Inc.* | 283,377 | 17,087,633 | ||||||
| Oracle Corp. | 437,106 | 17,068,989 | ||||||
| Linear Technology Corp. | 396,707 | 16,994,928 | ||||||
| SanDisk Corp. | 178,873 | 16,839,104 | ||||||
| Teradata Corp.* | 394,628 | 16,700,657 | ||||||
| Pitney Bowes, Inc. | 667,273 | 16,508,334 | ||||||
Microchip Technology, Inc.1 | 371,356 | 16,009,157 | ||||||
| Citrix Systems, Inc.* | 245,975 | 15,798,974 | ||||||
| International Business Machines Corp. | 92,546 | 15,214,562 | ||||||
| First Solar, Inc.* | 243,239 | 14,326,777 | ||||||
| Total Technology | 817,899,688 | |||||||
| ENERGY - 7.7% | ||||||||
| Tesoro Corp. | 287,849 | 20,555,297 | ||||||
| Marathon Petroleum Corp. | 203,812 | 18,526,511 | ||||||
| Valero Energy Corp. | 365,609 | 18,313,355 | ||||||
Kinder Morgan, Inc.1 | 468,826 | 18,143,566 | ||||||
| Exxon Mobil Corp. | 184,823 | 17,874,233 | ||||||
| Equities Corp. | 187,514 | 17,633,816 | ||||||
| FMC Technologies, Inc.* | 312,276 | 17,499,947 | ||||||
| Williams Companies, Inc. | 314,996 | 17,485,428 | ||||||
| Spectra Energy Corp. | 444,345 | 17,387,220 | ||||||
| Chevron Corp. | 144,327 | 17,312,024 | ||||||
| Schlumberger Ltd. | 173,179 | 17,085,841 | ||||||
Diamond Offshore Drilling, Inc.1 | 444,456 | 16,760,435 | ||||||
| Phillips 66 | 213,238 | 16,739,183 | ||||||
| Range Resources Corp. | 244,241 | 16,706,084 | ||||||
| Cabot Oil & Gas Corp. — Class A | 536,284 | 16,678,432 | ||||||
| CONSOL Energy, Inc. | 451,953 | 16,631,870 | ||||||
| EOG Resources, Inc. | 174,721 | 16,607,231 | ||||||
| Pioneer Natural Resources Co. | 87,528 | 16,548,044 | ||||||
| Murphy Oil Corp. | 309,106 | 16,503,169 | ||||||
| ConocoPhillips | 225,655 | 16,281,008 | ||||||
| Occidental Petroleum Corp. | 181,753 | 16,163,294 | ||||||
| National Oilwell Varco, Inc. | 219,523 | 15,946,151 | ||||||
| Marathon Oil Corp. | 447,226 | 15,831,800 | ||||||
| Chesapeake Energy Corp. | 710,670 | 15,762,661 | ||||||
| Ensco plc — Class A | 382,758 | 15,536,147 | ||||||
| Hess Corp. | 182,555 | 15,482,490 | ||||||
| ONEOK, Inc. | 261,800 | 15,430,492 | ||||||
| Anadarko Petroleum Corp. | 167,862 | 15,406,374 | ||||||
| Southwestern Energy Co.* | 472,197 | 15,351,124 | ||||||
| Helmerich & Payne, Inc. | 175,584 | 15,244,203 | ||||||
| Devon Energy Corp. | 253,077 | 15,184,620 | ||||||
| Newfield Exploration Co.* | 461,854 | 15,061,059 | ||||||
| Cimarex Energy Co. | 132,095 | 15,015,239 | ||||||
| Cameron International Corp.* | 249,016 | 14,828,903 | ||||||
| Noble Energy, Inc. | 257,309 | 14,828,718 | ||||||
| Halliburton Co. | 268,796 | 14,821,411 | ||||||
Transocean Ltd.1 | 493,668 | 14,726,116 | ||||||
| Noble Corporation plc | 682,193 | 14,271,478 | ||||||
| Apache Corp. | 183,944 | 14,200,477 | ||||||
| Baker Hughes, Inc. | 266,250 | 14,100,600 | ||||||
| SEE NOTES TO FINANCIAL STATEMENTS. | GUGGENHEIM ETFs ANNUAL REPORT | 11 |
SCHEDULE OF INVESTMENTS (continued) | October 31, 2014 |
GUGGENHEIM S&P 500® EQUAL WEIGHT ETF |
| Shares | Value | |||||||
| QEP Resources, Inc. | 558,624 | $ | 14,004,704 | |||||
Denbury Resources, Inc.1 | 1,110,591 | 13,771,328 | ||||||
| Nabors Industries Ltd. | 733,643 | 13,095,528 | ||||||
| Total Energy | 691,337,611 | |||||||
| COMMUNICATIONS - 7.4% | ||||||||
| Yahoo!, Inc.* | 412,850 | 19,011,743 | ||||||
VeriSign, Inc.*,1 | 315,275 | 18,840,834 | ||||||
| CenturyLink, Inc. | 447,722 | 18,571,510 | ||||||
| Motorola Solutions, Inc. | 287,662 | 18,554,199 | ||||||
| Verizon Communications, Inc. | 365,760 | 18,379,440 | ||||||
| Priceline Group, Inc.* | 15,214 | 18,351,280 | ||||||
| Time Warner, Inc. | 230,472 | 18,315,610 | ||||||
| Interpublic Group of Companies, Inc. | 938,641 | 18,200,249 | ||||||
Frontier Communications Corp.1 | 2,766,067 | 18,090,078 | ||||||
| Walt Disney Co. | 197,424 | 18,040,605 | ||||||
| Symantec Corp. | 721,682 | 17,912,147 | ||||||
| Omnicom Group, Inc. | 249,226 | 17,909,380 | ||||||
| AT&T, Inc. | 513,123 | 17,877,205 | ||||||
| eBay, Inc.* | 339,224 | 17,809,260 | ||||||
| DIRECTV* | 203,836 | 17,690,926 | ||||||
| Harris Corp. | 253,727 | 17,659,400 | ||||||
| Scripps Networks Interactive, Inc. — Class A | 225,970 | 17,453,923 | ||||||
| Corning, Inc. | 853,966 | 17,446,525 | ||||||
| Twenty-First Century Fox, Inc. — Class A | 505,077 | 17,415,055 | ||||||
| F5 Networks, Inc.* | 141,537 | 17,406,220 | ||||||
| Expedia, Inc. | 204,539 | 17,379,679 | ||||||
| Gannett Company, Inc. | 550,626 | 17,344,719 | ||||||
| Cisco Systems, Inc. | 703,609 | 17,217,312 | ||||||
Cablevision Systems Corp. — Class A1 | 924,429 | 17,212,868 | ||||||
| Comcast Corp. — Class A | 310,142 | 17,166,360 | ||||||
| Facebook, Inc. — Class A* | 228,478 | 17,133,565 | ||||||
| Time Warner Cable, Inc. | 114,723 | 16,888,373 | ||||||
| CBS Corp. — Class B | 309,160 | 16,762,655 | ||||||
Windstream Holdings, Inc.1 | 1,599,186 | 16,759,469 | ||||||
| Nielsen N.V. | 392,960 | 16,696,870 | ||||||
| Amazon.com, Inc.* | 53,449 | 16,326,532 | ||||||
| Viacom, Inc. — Class B | 222,636 | 16,181,184 | ||||||
| Juniper Networks, Inc. | 764,364 | 16,105,149 | ||||||
| News Corp. — Class A* | 1,034,047 | 16,007,048 | ||||||
| TripAdvisor, Inc.* | 178,234 | 15,802,226 | ||||||
| Netflix, Inc.* | 37,146 | 14,589,834 | ||||||
| Google, Inc. — Class A* | 15,258 | 8,664,560 | ||||||
| Google, Inc. — Class C* | 15,258 | 8,530,443 | ||||||
| Discovery Communications, Inc. — Class A* | 225,626 | 7,975,879 | ||||||
| Discovery Communications, Inc. — Class C* | 225,626 | 7,894,654 | ||||||
| Total Communications | 659,574,968 | |||||||
| UTILITIES - 6.4% | ||||||||
Wisconsin Energy Corp.1 | 401,339 | 19,930,494 | ||||||
| Public Service Enterprise Group, Inc. | 482,237 | 19,921,209 | ||||||
| TECO Energy, Inc. | 1,015,655 | 19,916,995 | ||||||
| Duke Energy Corp. | 242,300 | 19,904,945 | ||||||
| Consolidated Edison, Inc. | 313,707 | 19,876,476 | ||||||
| Exelon Corp. | 538,730 | 19,712,131 | ||||||
| Entergy Corp. | 234,536 | 19,705,715 | ||||||
| American Electric Power Company, Inc. | 337,328 | 19,679,716 | ||||||
| Northeast Utilities | 397,194 | 19,601,524 | ||||||
| Ameren Corp. | 462,935 | 19,600,668 | ||||||
| CMS Energy Corp. | 597,464 | 19,519,149 | ||||||
| SCANA Corp. | 354,904 | 19,480,681 | ||||||
| Edison International | 311,227 | 19,476,586 | ||||||
| FirstEnergy Corp. | 517,926 | 19,339,357 | ||||||
| Integrys Energy Group, Inc. | 265,852 | 19,322,123 | ||||||
| DTE Energy Co. | 234,259 | 19,246,719 | ||||||
| Pinnacle West Capital Corp. | 312,715 | 19,222,591 | ||||||
| PG&E Corp. | 381,691 | 19,206,691 | ||||||
| NiSource, Inc. | 453,567 | 19,077,028 | ||||||
| PPL Corp. | 542,532 | 18,983,195 | ||||||
| Xcel Energy, Inc. | 566,125 | 18,948,204 | ||||||
| Southern Co. | 408,280 | 18,927,861 | ||||||
| NextEra Energy, Inc. | 188,129 | 18,854,288 | ||||||
| Sempra Energy | 170,856 | 18,794,160 | ||||||
| Dominion Resources, Inc. | 258,131 | 18,404,740 | ||||||
| AGL Resources, Inc. | 337,264 | 18,181,902 | ||||||
| CenterPoint Energy, Inc. | 730,038 | 17,922,433 | ||||||
| Pepco Holdings, Inc. | 653,239 | 17,859,554 | ||||||
| NRG Energy, Inc. | 584,634 | 17,527,327 | ||||||
| AES Corp. | 1,228,526 | 17,285,361 | ||||||
| Total Utilities | 573,429,823 | |||||||
| BASIC MATERIALS - 4.4% | ||||||||
| Sigma-Aldrich Corp. | 173,483 | 23,578,074 | ||||||
| EI du Pont de Nemours & Co. | 273,278 | 18,897,174 | ||||||
| Sherwin-Williams Co. | 82,131 | 18,853,992 | ||||||
| Air Products & Chemicals, Inc. | 138,064 | 18,591,698 | ||||||
| MeadWestvaco Corp. | 416,632 | 18,402,636 | ||||||
| CF Industries Holdings, Inc. | 70,633 | 18,364,580 | ||||||
| Airgas, Inc. | 162,742 | 18,152,243 | ||||||
| PPG Industries, Inc. | 88,661 | 18,059,359 | ||||||
| Monsanto Co. | 156,590 | 18,014,114 | ||||||
| International Paper Co. | 355,554 | 17,998,143 | ||||||
| International Flavors & Fragrances, Inc. | 180,140 | 17,860,881 | ||||||
| Alcoa, Inc. | 1,058,787 | 17,745,270 | ||||||
| Nucor Corp. | 322,102 | 17,412,834 | ||||||
| Eastman Chemical Co. | 213,161 | 17,219,146 | ||||||
| Ecolab, Inc. | 153,314 | 17,053,116 | ||||||
| Mosaic Co. | 382,429 | 16,945,429 | ||||||
| Praxair, Inc. | 134,483 | 16,943,513 | ||||||
| Dow Chemical Co. | 336,105 | 16,603,587 | ||||||
| FMC Corp. | 283,558 | 16,262,051 | ||||||
| Freeport-McMoRan, Inc. | 517,023 | 14,735,156 | ||||||
| LyondellBasell Industries N.V. — Class A | 158,515 | 14,524,729 | ||||||
| Allegheny Technologies, Inc. | 424,115 | 13,932,178 | ||||||
| Newmont Mining Corp. | 703,331 | 13,194,490 | ||||||
| Total Basic Materials | 399,344,393 | |||||||
12 | GUGGENHEIM ETFs ANNUAL REPORT | SEE NOTES TO FINANCIAL STATEMENTS. |
SCHEDULE OF INVESTMENTS (concluded) | October 31, 2014 |
GUGGENHEIM S&P 500® EQUAL WEIGHT ETF |
| Shares | Value | |||||||
| DIVERSIFIED - 0.2% | ||||||||
| Leucadia National Corp. | 678,528 | $ | 16,135,396 | |||||
| Total Common Stocks | ||||||||
| (Cost $7,418,044,351) | 8,970,985,426 | |||||||
SHORT TERM INVESTMENTS† - 0.1% | ||||||||
| Federated U.S. Treasury Cash Reserve Fund | 4,710,835 | 4,710,835 | ||||||
| Total Short Term Investments | ||||||||
| (Cost $4,710,835) | 4,710,835 | |||||||
| Face Amount | ||||||||
SECURITIES LENDING COLLATERAL††,2 - 2.6% | ||||||||
| Joint Repurchase Agreements | ||||||||
| HSBC Securities, Inc. issued 10/31/14 at 0.08% due 11/03/14 | $ | 145,544,620 | 145,544,620 | |||||
| BNP Paribas Securities Corp. issued 10/31/14 at 0.11% due 11/03/14 | 66,571,979 | 66,571,979 | ||||||
| Barclays Capital, Inc. issued 10/31/14 at 0.07% due 11/03/14 | 19,081,356 | 19,081,356 | ||||||
| Total Securities Lending Collateral | ||||||||
| (Cost $231,197,955) | 231,197,955 | |||||||
| Total Investments - 102.6% | �� | |||||||
| (Cost $7,653,953,141) | $ | 9,206,894,216 | ||||||
| Other Assets & Liabilities, net - (2.6)% | (230,697,148 | ) | ||||||
| Total Net Assets - 100.0% | $ | 8,976,197,068 | ||||||
| * | Non-income producing security. |
| † | Value determined based on Level 1 inputs — See Note 4. |
| †† | Value determined based on Level 2 inputs — See Note 4. |
| 1 | All or portion of this security is on loan at October 31, 2014 — See Note 5. |
| 2 | Securities lending collateral — See Note 5. |
| plc — Public Limited Company | |
| REIT — Real Estate Investment Trust |
| SEE NOTES TO FINANCIAL STATEMENTS. | GUGGENHEIM ETFs ANNUAL REPORT | 13 |
| STATEMENT OF ASSETS AND LIABILITIES | October 31, 2014 |
Guggenheim S&P 500® Equal Weight ETF | ||||
| Assets: | ||||
| Investments, at value* — including $227,950,606 of securities loaned | $ | 8,975,696,261 | ||
| Repurchase agreements | 231,197,955 | |||
| Total Investments | 9,206,894,216 | |||
| Cash | 74,588 | |||
| Segregated cash with broker | 456 | |||
| Receivables: | ||||
| Securities lending | 131,966 | |||
| Dividends and interest | 8,639,557 | |||
| Total assets | 9,215,740,783 | |||
| Liabilities: | ||||
| Payable upon return of securities loaned | 231,198,411 | |||
| Payable for: | ||||
| Investments purchased | 5,476,385 | |||
| Accrued management fees | 2,868,919 | |||
| Total liabilities | 239,543,715 | |||
| Net assets | $ | 8,976,197,068 | ||
| Net assets consist of: | ||||
| Paid-in capital | $ | 7,934,423,025 | ||
| Undistributed net investment income | 468,285 | |||
| Accumulated net realized loss on investments | (511,635,317 | ) | ||
| Net unrealized appreciation on investments | 1,552,941,075 | |||
| Net assets | $ | 8,976,197,068 | ||
| Shares outstanding (unlimited shares authorized), no par value | 114,958,863 | |||
| Net asset value, offering price and repurchase price per share | $ | 78.08 | ||
| Cost of investments | $ | 7,422,755,186 | ||
| Cost of repurchase agreements | 231,197,955 | |||
| *Total cost of investments | $ | 7,653,953,141 | ||
14 | GUGGENHEIM ETFs ANNUAL REPORT | SEE NOTES TO FINANCIAL STATEMENTS. |
| STATEMENT OF OPERATIONS |
For the Year Ended October 31, 2014
Guggenheim S&P 500® Equal Weight ETF | ||||
| Investment Income: | ||||
| Dividends, net of foreign taxes withheld* | $ | 137,426,184 | ||
| Income from securities lending | 1,183,708 | |||
| Interest | 97 | |||
| Total investment income | 138,609,989 | |||
| Expenses: | ||||
| Management fees | 29,521,640 | |||
| Total expenses | 29,521,640 | |||
| Net investment income | 109,088,349 | |||
| Net Realized and Unrealized Gain (Loss): | ||||
| Net realized gain (loss) on: | ||||
| Investments | 54,110,748 | |||
| In-kind redemptions | 256,096,127 | |||
| Net realized gain | 310,206,875 | |||
| Net change in unrealized appreciation (depreciation) on: | ||||
| Investments | 663,737,970 | |||
| Net realized and unrealized gain | 973,944,845 | |||
| Net increase in net assets resulting from operations | $ | 1,083,033,194 | ||
| * Foreign taxes withheld | $ | 44,324 | ||
| SEE NOTES TO FINANCIAL STATEMENTS. | GUGGENHEIM ETFs ANNUAL REPORT | 15 |
| STATEMENTS OF CHANGES IN NET ASSETS |
Guggenheim S&P 500® Equal Weight ETF | ||||||||
Year Ended October 31, 2014 | Year Ended October 31, 2013 | |||||||
| Increase (Decrease) in Net Assets from Operations: | ||||||||
| Net investment income | $ | 109,088,349 | $ | 67,224,743 | ||||
| Net realized gain on investments | 310,206,875 | 226,159,349 | ||||||
| Net change in unrealized appreciation (depreciation) on investments | 663,737,970 | 829,838,694 | ||||||
| Net increase in net assets resulting from operations | 1,083,033,194 | 1,123,222,786 | ||||||
| Distributions to shareholders from: | ||||||||
| Net investment income | (109,511,409 | ) | (63,950,328 | ) | ||||
| Shareholder transactions: | ||||||||
| Proceeds from shares purchased | 3,153,662,668 | 2,864,811,708 | ||||||
| Value of shares redeemed | (814,758,926 | ) | (1,032,752,585 | ) | ||||
| Net increase in net assets resulting from share transactions | 2,338,903,742 | 1,832,059,123 | ||||||
| Net increase in net assets | 3,312,425,527 | 2,891,331,581 | ||||||
| Net assets: | ||||||||
| Beginning of year | 5,663,771,541 | 2,772,439,960 | ||||||
| End of year | $ | 8,976,197,068 | $ | 5,663,771,541 | ||||
| Undistributed net investment income at end of year | $ | 468,285 | $ | 3,194,160 | ||||
| Changes in shares outstanding: | ||||||||
| Shares sold | 42,950,000 | 47,400,000 | ||||||
| Shares redeemed | (11,350,000 | ) | (17,600,000 | ) | ||||
| Net increase in shares | 31,600,000 | 29,800,000 | ||||||
16 | GUGGENHEIM ETFs ANNUAL REPORT | SEE NOTES TO FINANCIAL STATEMENTS. |
GUGGENHEIM S&P 500® EQUAL WEIGHT ETF |
| FINANCIAL HIGHLIGHTS |
This table is presented to show selected data for a share outstanding throughout each period and to assist shareholders in evaluating the Fund's performance for the periods presented.
Year Ended October 31, 2014 | Year Ended October 31, 2013 | Year Ended October 31, 2012 | Year Ended October 31, 2011 | Year Ended October 31, 2010 | ||||||||||||||||
| Per Share Data: | ||||||||||||||||||||
| Net asset value, beginning of period | $ | 67.94 | $ | 51.76 | $ | 46.77 | $ | 43.87 | $ | 35.99 | ||||||||||
| Income from investment operations: | ||||||||||||||||||||
Net investment income (loss)a | 1.09 | 0.99 | 0.80 | 0.69 | 0.60 | |||||||||||||||
| Net gain (loss) on investments (realized and unrealized) | 10.13 | 16.13 | 4.97 | 2.87 | 7.87 | |||||||||||||||
| Total from investment operations | 11.22 | 17.12 | 5.77 | 3.56 | 8.47 | |||||||||||||||
| Less distributions from: | ||||||||||||||||||||
| Net investment income | (1.08 | ) | (0.94 | ) | (0.78 | ) | (0.66 | ) | (0.59 | ) | ||||||||||
| Total distributions to shareholders | (1.08 | ) | (0.94 | ) | (0.78 | ) | (0.66 | ) | (0.59 | ) | ||||||||||
| Net asset value, end of period | $ | 78.08 | $ | 67.94 | $ | 51.76 | $ | 46.77 | $ | 43.87 | ||||||||||
Total Returnb | 16.60 | % | 33.36 | % | 12.42 | % | 8.12 | % | 23.67 | % | ||||||||||
| Ratios/Supplemental Data: | ||||||||||||||||||||
| Net assets, end of period (in thousands) | $ | 8,976,197 | $ | 5,663,772 | $ | 2,772,440 | $ | 3,063,809 | $ | 2,154,259 | ||||||||||
| Ratio to average net assets of: | ||||||||||||||||||||
| Net investment income (loss) | 1.48 | % | 1.64 | % | 1.61 | % | 1.45 | % | 1.48 | % | ||||||||||
| Total expenses | 0.40 | % | 0.40 | % | 0.40 | % | 0.40 | % | 0.40 | % | ||||||||||
Portfolio turnover ratec | 18 | % | 37 | % | 20 | % | 21 | % | 20 | % | ||||||||||
a | Based on average shares outstanding. |
b | Total investment return is calculated assuming an initial investment made at the net asset value at the beginning of the period, reinvestment of all dividends and distribution at net asset value during the period, and redemption on the last day of the period. Transaction fees are not reflected in the calculation of total investment return. |
c | Portfolio turnover does not include securities received or delivered from processing creations or redemptions. |
| SEE NOTES TO FINANCIAL STATEMENTS. | GUGGENHEIM ETFs ANNUAL REPORT | 17 |
| NOTES TO FINANCIAL STATEMENTS |
1. Organization and Significant Accounting Policies
Organization
Rydex ETF Trust (the "Trust") is registered with the SEC under the Investment Company Act of 1940 (the "1940 Act") as a non-diversified, open-ended investment company of the series type, and is authorized to issue an unlimited number of no par value shares. Each portfolio represents a separate series of beneficial interest in the Trust (each a "Fund", and collectively, the "Funds"). The Trust was organized as a Delaware statutory trust on November 22, 2002. At October 31, 2014, the Trust consisted of twenty-one Funds.
The financial statements herein relate to the following Fund, whose investment objective is to replicate as closely as possible, before fees and expenses, the daily performance of an index representing publicly traded equity securities (the "Underlying Index") as follows:
| Fund | Underlying Index |
Guggenheim S&P 500® Equal Weight ETF | S&P 500® Equal Weight Index |
The Fund seeks to achieve its objective by investing in common stocks that comprise the Underlying Index. The Fund uses a "replication" strategy to track the Underlying Index. Replication refers to investing in substantially all of the securities in the Underlying Index in approximately the same proportions as in the Underlying Index.
The Fund operates as an index fund and is not actively managed. Adverse performance of a security in the Fund's portfolio will ordinarily not result in the elimination of the security from the Fund's portfolio.
The Fund issues and redeems shares on a continuous basis, at net asset value per share ("NAV"), only in aggregation of 50,000 shares (a "Creation Unit"). Creation Units are issued and redeemed principally in-kind for securities included in the Underlying Index.
The Fund invests in various investments which are exposed to risk, such as market risk. Due to the level of risk associated with certain investments it is at least reasonably possible that changes in the values of investment securities will occur in the near term and that such changes could materially affect amounts reported in the financial statements.
Guggenheim Investments ("GI") provides advisory services and Rydex Fund Services, LLC ("RFS") provides administrative services to the Trust. Guggenheim Funds Distributors, LLC ("GFD") acts as principal underwriter for the Trust. GI, RFS and GFD are affiliated entities.
Significant Accounting Policies
The following significant accounting policies are in conformity with U.S. generally accepted accounting principles ("U.S. GAAP") and are consistently followed by the Trust. This requires management to make estimates and assumptions that affect the reported amount of assets and liabilities and disclosure of contingent assets and liabilities at the date of the financial statements and the reported amounts of revenues and expenses during the reporting period. Actual results could differ from these estimates. All time references are based on Eastern Time.
A. The Board of Trustees of the Funds (the "Board") has adopted policies and procedures for the valuation of the Funds' investments (the "Valuation Procedures"). Pursuant to the Valuation Procedures, the Board has delegated to a valuation committee, consisting of representatives from Guggenheim's investment management, fund administration, legal and compliance departments (the "Valuation Committee"), the day-to-day responsibility for implementing the Valuation Procedures, including, under most circumstances, the responsibility for determining the fair value of the Fund's securities or other assets.
Valuations of the Funds' securities are supplied primarily by pricing services appointed pursuant to the processes set forth in the Valuation Procedures. The Valuation Committee convenes monthly, or more frequently as needed and will review the valuation of all assets which have been fair valued for reasonableness. The Funds' officers, through the Valuation Committee and consistent with the monitoring and review responsibilities set forth in the Valuation Procedures, regularly review procedures used by, and valuations provided by, the pricing services.
If the pricing service cannot or does not provide a valuation for a particular investment or such valuation is deemed unreliable, such investment is fair valued by the Valuation Committee.
Equity securities listed on an exchange (New York Stock Exchange ("NYSE") or American Stock Exchange) are valued at the last quoted sales price as of the close of business on the NYSE, usually 4:00 p.m. on the
18 | GUGGENHEIM ETFs ANNUAL REPORT |
NOTES TO FINANCIAL STATEMENTS (continued) |
valuation date. Equity securities listed on the NASDAQ market system are valued at the NASDAQ Official Closing Price on the valuation date, which may not necessarily represent the last sale price. If there has been no sale on such exchange or NASDAQ on a given day, the security is valued at the closing bid price on that day. The Fund invests in money market mutual funds, which are valued at their NAV.
Short-term debt securities with a maturity of 60 days or less at acquisition and repurchase agreements are valued at amortized cost, provided that amortized cost approximates fair value.
B. Security transactions are recorded on the trade date for financial reporting purposes. Realized gains and losses from securities transactions are recorded using the identified cost basis. Proceeds from lawsuits related to investment holdings are recorded as realized gains in the Fund. Dividend income is recorded on the ex-dividend date, net of applicable taxes withheld by foreign countries. Taxable non-cash dividends are recorded as dividend income. Interest income, including amortization of premiums and accretion of discounts, is accrued on a daily basis. Distributions received from investments in REITs are recorded as dividend income on the ex-dividend date, subject to reclassification upon notice of the character of such distribution by the issuer.
C. Distributions of net investment income and net realized gains, if any, are declared and paid at least annually. Distributions are recorded on the ex-dividend date and are determined in accordance with income tax regulations which may differ from U.S. GAAP.
D. The Fund may leave cash overnight in its cash account with the custodian. Periodically, the Fund may have cash due to the custodian bank as an overdraft balance. A fee is incurred on this overdraft, calculated by multiplying the overdraft by a rate based on the federal funds rate.
E. The Fund may enter into repurchase agreements with financial institutions. In a repurchase agreement, a Fund buys a security and the seller simultaneously agrees to repurchase the security on a specified future date at an agreed-upon price. The repurchase price reflects an agreed-upon interest rate during the time the Fund's money is invested in the security. Because the security constitutes collateral for the repurchase obligation, a repurchase agreement can be considered a collateralized loan. The Fund follows certain procedures designed to minimize the risks inherent in such agreements. These procedures include effecting repurchase transactions only with large, well-capitalized and well-established financial institutions whose condition will be continually monitored by GI. In addition, the value of the collateral underlying the repurchase agreement will always be at least equal to the repurchase price, including any accrued interest earned on the repurchase agreement. In the event of a default or bankruptcy by a selling financial institution, the Fund will seek to liquidate such collateral. However, the exercising of the Fund's right to liquidate such collateral could involve certain costs or delays and, to the extent that proceeds from any sale upon a default of the obligation to repurchase were less than the repurchase price, the Fund could suffer a loss. It is the current policy of the Fund not to invest in repurchase agreements that do not mature within seven days if any such investment, together with any other illiquid assets held by the Fund, amounts to more than 15% of Fund's net assets. The investments of the Fund in repurchase agreements, at times, may be substantial when, in the view of GI, liquidity or other considerations so warrant.
F. Under the Fund's organizational documents, its Trustees and Officers are indemnified against certain liabilities arising out of the performance of their duties to the Trust. In addition, throughout the normal course of business, the Fund enters into contracts that contain a variety of representations and warranties which provide general indemnifications. The Fund's maximum exposure under these arrangements is unknown, as this would involve future claims that may be made against the Fund and/or its affiliates that have not yet occurred. However, based on experience, the Fund expects the risk of loss to be remote.
2. Capital
There is a minimum transaction fee per transaction to those persons purchasing or redeeming Creation Units. An additional charge of up to three times the standard transaction fee may be imposed for purchases and redemptions effected outside the National Securities Clearing Corporation usual clearing process or for cash. Such transactions are generally permitted on an in-kind basis, with a balancing cash component to equate the transaction to the NAV of the Fund on the transaction date. Transaction fees are not charged to or paid by the Fund. The minimum transaction fees are:
| Fund | Minimum Transaction Fee |
Guggenheim S&P 500® Equal Weight ETF | $2,000 |
| GUGGENHEIM ETFs ANNUAL REPORT | 19 |
NOTES TO FINANCIAL STATEMENTS (continued) |
3. Fees and Other Transactions with Affiliates
GI determines the composition of the portfolio of securities that must be delivered in exchange for the issuance of Creation Units and periodically adjusts the composition of the portfolio of the Fund to conform to changes in the composition of the relevant index. For these services, GI receives a management fee at the annual rate shown below as a percentage of the average daily net assets of the Fund.
| Fund | Advisory Fee |
Guggenheim S&P 500® Equal Weight ETF | 0.40% |
GI pays all expenses of the Fund, including the cost of transfer agency, custody, fund administration, fund accounting, legal, audit and other services, except: interest, taxes, distribution fees or expenses and extraordinary expenses.
Under a Fund Administration Agreement with the Trust, RFS provides various administrative and financial reporting services for the Fund. GI compensates RFS directly for this service.
Under a Fund Accounting Agreement with the Trust, BNYMellon maintains the books and records of the Fund. Under a Custodian Agreement with the Trust, BNYMellon maintains cash, securities and other assets of the Fund in a separate account for the Fund, keeps all necessary accounts and records, and provides other services. BNYMellon is required, upon the order of the Trust, to deliver securities held by the custodian and to make payments for securities purchased by the Trust for the Fund. Pursuant to a Transfer Agency and Service Agreement with the Trust, BNYMellon acts as a transfer agent for the Trust's authorized and issued shares of beneficial interest, and as dividend disbursing agent of the Trust. GI compensates BNYMellon directly for the foregoing services.
The Fund has adopted a Distribution Plan (the "Plan") that allows the Fund to pay distribution fees to GFD and other firms that provide distribution services ("Service Providers"). If a Service Provider provides distribution services, the Fund will pay distribution fees to GFD at an annual rate not to exceed 0.25% of average daily net assets, pursuant to Rule 12b-1 of the 1940 Act. GFD will, in turn, pay the Service Provider out of its fees. No such fee is currently charged to the Fund.
Certain trustees and officers of the Trust are also officers of GI, RFS and GFD.
4. Fair Value Measurement
In accordance with U.S. GAAP, fair value is defined as the price that the Funds would receive to sell an investment or pay to transfer a liability in an orderly transaction with an independent buyer in the principal market, or in the absence of a principal market, the most advantageous market for the investment or liability. U.S. GAAP establishes a three-tier fair value hierarchy based on the types of inputs used to value assets and liabilities and requires corresponding disclosure. The hierarchy and the corresponding inputs are summarized below:
| Level 1 — | quoted prices in active markets for identical assets or liabilities. |
| Level 2 — | significant other observable inputs (for example quoted prices for securities that are similar based on characteristics such as interest rates, prepayment speeds, credit risk, etc.). |
| Level 3 — | significant unobservable inputs based on the best information available under the circumstances, to the extent observable inputs are not available, which may include assumptions. |
The types of inputs available depend on a variety of factors, such as the type of security and the characteristics of the markets in which it trades, if any. Fair valuation determinations that rely on fewer or no observable inputs require greater judgment. Accordingly, fair value determinations for Level 3 securities require the greatest amount of judgment.
20 | GUGGENHEIM ETFs ANNUAL REPORT |
NOTES TO FINANCIAL STATEMENTS (continued) |
The following table summarizes the inputs used to value the Fund's net assets at October 31, 2014:
| Fund | Level 1 Investments In Securities | Level 2 Investments In Securities | Level 3 Investments In Securities | Total | ||||||||||||
Guggenheim S&P 500® Equal Weight ETF | $ | 8,975,696,261 | $ | 231,197,955 | $ | — | $ | 9,206,894,216 | ||||||||
For the year ended October 31, 2014, there were no transfers between levels.
5. Portfolio Securities Loaned
The Funds may lend their securities to approved brokers to earn additional income. Security lending income shown on the Statement of Operations is shown net of rebates paid to the borrowers and earnings on cash collateral investments shared with the lending agent. Within this arrangement, the Funds act as the lender, Credit Suisse acts as the lending agent, and other approved registered broker dealers act as the borrowers. The Funds receive cash collateral, valued at 102% of the value of the securities on loan. Under the terms of the Funds' securities lending agreement with Credit Suisse, cash collateral is invested in one or more joint repurchase agreements collateralized by obligations of the U.S. Treasury or Government Agencies and cash. The Funds bear the risk of loss on cash collateral investments. Collateral is maintained over the life of the loan in an amount not less than the value of loaned securities, as determined at the close of fund business each day; any additional collateral required due to changes in security values is delivered to the Funds the next business day. Although the collateral mitigates the risk, the Funds could experience a delay in recovering its securities and a possible loss of income or value if the borrower fails to return the securities. The Funds have the right under the securities lending agreement to recover the securities from the borrower on demand.
At October 31, 2014, the Fund participated in securities lending as follows:
| Fund | Value of Securities Loaned | Cash Collateral Received | ||||||
Guggenheim S&P 500® Equal Weight ETF | $ | 227,950,606 | $ | 231,198,411 | ||||
Cash collateral received was invested in the following joint repurchase agreements at October 31, 2014:
| Counterparty and Terms of Agreement | Face Value | Repurchase Price | Collateral | Par Value | Fair Value | |
| HSBC Securities, Inc. | Freddie Mac Strips | |||||
| 0.08% | 0.00% | |||||
| Due 11/03/14 | $145,544,620 | $145,544,943 | 01/15/15 - 07/15/32 | $154,975,783 | $98,443,323 | |
| Fannie Mae Strips | ||||||
| 0.00% | ||||||
| 11/15/14 - 01/15/37 | 64,475,664 | 50,022,322 | ||||
| BNP Paribas Securities Corp. | U.S. TIP Bonds | |||||
| 0.11% | 1.38% - 2.50% | |||||
| Due 11/03/14 | 66,571,979 | 66,572,182 | 01/15/29 - 02/15/44 | 36,797,137 | 48,748,767 | |
| U.S. Treasury Note | ||||||
| 2.13% | ||||||
| 01/31/21 | 18,828,698 | 19,158,209 | ||||
| Barclays Capital, Inc. | U.S. Treasury Bill | |||||
| 0.07% | 0.00% | |||||
| Due 11/03/14 | 19,081,356 | 19,081,391 | 01/15/15 - 02/26/15 | 19,465,864 | 19,464,040 |
There was also $456 in segregated cash held as collateral.
| GUGGENHEIM ETFs ANNUAL REPORT | 21 |
NOTES TO FINANCIAL STATEMENTS (continued) |
In the event of counterparty default, the Funds have the right to collect the collateral to offset losses incurred. There is potential loss to the Funds in the event the Funds are delayed or prevented from exercising their rights to dispose of the collateral securities, including the risk of a possible decline in the value of the underlying securities during the period while the Funds seek to assert their rights. The Funds' investment adviser, acting under the supervision of the Board of Trustees, reviews the value of the collateral and the creditworthiness of those banks and dealers with which the Funds enter into repurchase agreements to evaluate potential risks.
6. Federal Income Tax Information
The Fund intends to comply with the provisions of Subchapter M of the Internal Revenue Code applicable to regulated investment companies and will distribute substantially all taxable net investment income and capital gains sufficient to relieve the Fund from all, or substantially all, federal income, excise and state income taxes. Therefore, no provision for federal or state income tax is required.
Tax positions taken or expected to be taken in the course of preparing the Fund's tax returns are evaluated to determine whether the tax positions are "more-likely-than-not" of being sustained by the applicable tax authority. Tax positions not deemed to meet the more-likely-than-not threshold would be recorded as a tax benefit or expense in the current year. Management has analyzed the Fund's tax positions taken, or to be taken, on Federal income tax returns for all open tax years, and has concluded that no provision for income tax is required in the Fund's financial statements. The Fund's federal tax returns are subject to examination by the Internal Revenue Service for a period of three fiscal years after they are filed.
Income and capital gain distributions are determined in accordance with Federal income tax regulations, which may differ from U.S. GAAP. These differences are primarily due to differing treatments for in-kind redemptions, income reclassifications from REITs and losses deferred due to wash sales.
The tax character of distributions paid during the year ended October 31, 2014 was as follows:
| Fund | Ordinary Income | Long-Term Capital Gain | Total Distributions | |||||||||
Guggenheim S&P 500® Equal Weight ETF | $ | 109,511,409 | $ | — | $ | 109,511,409 | ||||||
The tax character of distributions paid during the year ended October 31, 2013 was as follows:
| Fund | Ordinary Income | Long-Term Capital Gain | Total Distributions | |||||||||
Guggenheim S&P 500® Equal Weight ETF | $ | 63,950,328 | $ | — | $ | 63,950,328 | ||||||
The tax character of distributable earnings/(accumulated losses) at October 31, 2014 was as follows:
| Fund | Undistributed Ordinary Income | Undistributed Long-Term Capital Gain | Capital Loss Carryforward | Net Unrealized Appreciation/ (Depreciation) | Total Accumulated Earnings/(Deficit) | |||||||||||||||
Guggenheim S&P 500® Equal Weight ETF | $ | 468,285 | $ | — | $ | (503,947,317 | ) | $ | 1,545,253,075 | $ | 1,041,774,043 | |||||||||
22 | GUGGENHEIM ETFs ANNUAL REPORT |
NOTES TO FINANCIAL STATEMENTS (continued) |
For Federal income tax purposes, capital loss carryforwards represent realized losses of the Funds that may be carried forward and applied against future capital gains. For taxable years beginning on or before December 22, 2010, such capital losses may be carried forward for a maximum of eight years. Under the RIC Modernization Act of 2010, the Funds are permitted to carry forward capital losses incurred in taxable years beginning after December 22, 2010 for an unlimited period. However, any losses incurred during those taxable years must be utilized prior to the losses incurred in pre-enactment taxable years. As a result of this ordering rule, pre-enactment capital loss carryforwards may be more likely to expire unused. Additionally, post-enactment capital losses that are carried forward will retain their character as either short-term or long-term capital losses rather than being considered all short-term as under previous law. As of October 31, 2014, capital loss carryforwards for the Funds were as follows:
| Expires in | Expires in | Expires in | Expires in | Unlimited | Remaining Capital Loss | |||||||||||||||||||||||
| Fund | 2016 | 2017 | 2018 | 2019 | Short-Term | Long-Term | Carryforward | |||||||||||||||||||||
Guggenheim S&P 500® Equal Weight ETF | $ | (119,981,602 | ) | $ | (313,762,207 | ) | $ | (35,251,288 | ) | $ | (20,782,942 | ) | $ | — | $ | (14,169,278 | ) | $ | (503,947,317 | ) | ||||||||
Prior year capital loss carryforwards of $153,038,990 were utilized in the current year.
In order to present paid-in-capital, undistributed net investment income (loss) and accumulated net realized gain (loss) on investments on the statement of assets and liabilities that more closely represent their tax character, certain adjustments have been made to these accounts. These adjustments have no effect on the net assets or NAV. The most significant of these adjustments are for net capital gains (losses) resulting from in-kind redemptions and return of capital on investments. For the year ended October 31, 2014, the adjustments for the Fund were as follows:
| Fund | Paid-In Capital | Undistributed Net Investment Income | Accumulated Net Realized Gain/(Loss) | |||||||||
Guggenheim S&P 500® Equal Weight ETF | $ | 256,163,273 | $ | (2,302,815 | ) | $ | (253,860,458 | ) | ||||
At October 31, 2014, the cost of securities for Federal income tax purposes, the aggregate gross unrealized gain for all securities for which there was an excess of value over tax cost and the aggregate gross unrealized loss for all securities for which there was an excess of tax cost over value, were as follows:
| Fund | Tax Cost | Tax Unrealized Gain | Tax Unrealized Loss | Net Unrealized Gain/(Loss) | ||||||||||||
Guggenheim S&P 500® Equal Weight ETF | $ | 7,661,641,141 | $ | 1,715,677,607 | $ | (170,424,532 | ) | $ | 1,545,253,075 | |||||||
7. Investment Transactions
For the year ended October 31, 2014, the Fund had investment transactions in-kind associated with subscriptions and redemptions as follows:
| Fund | Subscriptions | Redemptions | ||||||
Guggenheim S&P 500® Equal Weight ETF | $ | 3,145,472,390 | $ | 813,337,169 | ||||
For the year ended October 31, 2014, the cost of purchases and proceeds from sales of investment securities, excluding government securities, short-term investments and in-kind transactions, were as follows:
| Fund | Purchases | Sales | ||||||
Guggenheim S&P 500® Equal Weight ETF | $ | 1,346,208,755 | $ | 1,330,374,193 | ||||
| GUGGENHEIM ETFs ANNUAL REPORT | 23 |
NOTES TO FINANCIAL STATEMENTS (concluded) |
8. Legal Proceedings
Tribune Company
Rydex ETF Trust has been named as a defendant and a putative member of the proposed defendant class of shareholders in the case entitled Kirschner v. FitzSimons, No. 12-2652 (S.D.N.Y.) (formerly Official Committee of Unsecured Creditors of Tribune Co. v. FitzSimons, Adv. Pro. No. 10-54010 (Bankr. D. Del.)) (the "FitzSimons action"), as a result of ownership of shares by certain series of the Rydex ETF Trust in the Tribune Company ("Tribune") in 2007, when Tribune effected a leveraged buyout transaction ("LBO") by which Tribune converted to a privately-held company. In his complaint, the plaintiff has alleged that, in connection with the LBO, insiders and shareholders were overpaid for their Tribune stock using financing that the insiders knew would, and ultimately did, leave the Tribune Company insolvent. The plaintiff has asserted claims against certain insiders, major shareholders, professional advisers, and others involved in the LBO. The plaintiff is also attempting to obtain from former Tribune shareholders, including Rydex ETF Trust, the proceeds they received in connection with the LBO.
In June 2011, a group of Tribune creditors filed multiple actions against former Tribune shareholders involving state law constructive fraudulent conveyance claims arising out of the 2007 LBO (the "SLCFC actions"). Rydex ETF Trust has been named as a defendant in one or more of these suits. In those actions, the creditors seek to recover from Tribune's former shareholders the proceeds received in connection with the 2007 LBO.
The FitzSimons action and the SLCFC actions have been consolidated with the majority of the other Tribune LBO-related lawsuits in a multidistrict litigation proceeding captioned In re Tribune Company Fraudulent Conveyance Litig., No. 11-md-2696 (S.D.N.Y.) (the "MDL Proceeding").
On September 23, 2013, the District Court granted the defendants' omnibus motion to dismiss the SLCFC actions, on the basis that the creditors lacked standing. On September 30, 2013, the creditors filed a notice of appeal of the September 23 order. On October 28, 2013, the defendants filed a joint notice of cross-appeal of that same order. The SLCFC appeals have been fully briefed, and oral argument took place on November 5, 2014. The Court has not yet issued a decision on the appeals.
On May 23, 2014, the defendants filed motions to dismiss the FitzSimons action, including a global motion to dismiss Count I, which is the claim brought against former Tribune shareholders for intentional fraudulent conveyance under U.S. federal law. The Court has not yet issued a decision on any of these motions.
None of these lawsuits alleges any wrongdoing on the part of Rydex ETF Trust. The following series of Rydex ETF Trust held shares of Tribune and tendered these shares as part of Tribune's LBO: Guggenheim S&P 500 Equal Weight ETF (the "Fund"). The value of the proceeds received by the foregoing Fund was $4,766,035. At this stage of the proceedings, Rydex ETF Trust is not able to make a reliable prediction as to the outcome of these lawsuits or the effect, if any, on the Fund's net asset value.
24 | GUGGENHEIM ETFs ANNUAL REPORT |
| REPORT OF INDEPENDENT REGISTERED PUBLIC ACCOUNTING FIRM |
The Board of Trustees and Shareholders of Rydex ETF Trust
We have audited the accompanying statement of assets and liabilities, including the schedule of investments, of Guggenheim S&P 500® Equal Weight ETF (one of the series constituting the Rydex ETF Trust) (the "Fund") as of October 31, 2014, and the related statement of operations for the year then ended, the statements of changes in net assets for each of the two years in the period then ended, and the financial highlights for each of the five years in the period then ended. These financial statements and financial highlights are the responsibility of the Fund's management. Our responsibility is to express an opinion on these financial statements and financial highlights based on our audits.
We conducted our audits in accordance with the standards of the Public Company Accounting Oversight Board (United States). Those standards require that we plan and perform the audit to obtain reasonable assurance about whether the financial statements and financial highlights are free of material misstatement. We were not engaged to perform an audit of the Fund's internal control over financial reporting. Our audits included consideration of internal control over financial reporting as a basis for designing audit procedures that are appropriate in the circumstances, but not for the purpose of expressing an opinion on the effectiveness of the Fund's internal control over financial reporting. Accordingly, we express no such opinion. An audit also includes examining, on a test basis, evidence supporting the amounts and disclosures in the financial statements and financial highlights, assessing the accounting principles used and significant estimates made by management, and evaluating the overall financial statement presentation. Our procedures included confirmation of securities owned as of October 31, 2014, by correspondence with the custodian and brokers. We believe that our audits provide a reasonable basis for our opinion.
In our opinion, the financial statements and financial highlights referred to above present fairly, in all material respects, the financial position of Guggenheim S&P 500® Equal Weight ETF (one of the series constituting the Rydex ETF Trust) at October 31, 2014, the results of its operations for the year then ended, the changes in its net assets for each of the two years in the period then ended, and its financial highlights for each of the five years in the period then ended, in conformity with U.S. generally accepted accounting principles.
McLean, Virginia
December 19, 2014
December 19, 2014
| GUGGENHEIM ETFs ANNUAL REPORT | 25 |
OTHER INFORMATION (Unaudited) |
Federal Income Tax Information
For federal income tax purposes, the following information is furnished with respect to the distributions paid by the funds during the year ended October 31, 2014:
| Fund | Dividend Received Deduction | Long-Term Capital Gains Distribution | Qualified Income Distribution |
Guggenheim S&P 500® Equal Weight ETF | 100.00% | $— | $130,369,563 |
Proxy Voting Information
A description of the policies and procedures that the Trust uses to determine how to vote proxies relating to securities held in the Funds' portfolios is available, without charge and upon request, by calling 800.820.0888. This information is also available from the EDGAR database on the SEC's website at http://www.sec.gov.
Information regarding how the Funds voted proxies relating to portfolio securities during the most recent 12-month period ended June 30 is available without charge, upon request, by calling 800.820.0888. This information is also available from the EDGAR database on the SEC's website at http://www.sec.gov.
Quarterly Portfolio Schedules Information
The Trust files its complete schedule of portfolio holdings with the SEC for the first and third quarters of each fiscal year on Form N-Q; which are available on the SEC's website at http://www.sec.gov. The Funds' Forms N-Q may be reviewed and copied at the SEC's Public Reference Room in Washington, DC, and that information on the operation of the Public Reference Room may be obtained by calling 800-SEC-0330. Copies of the portfolio holdings are also available to shareholders, without charge and upon request, by calling 800.820.0888.
Distributor Change
Effective March 3, 2014, Guggenheim Distributors, LLC ("GD"), the distributor for shares of the Funds was consolidated into and with Guggenheim Funds Distributors, LLC ("GFD"). Following the consolidation, GFD serves as the Funds' distributor.
GD and GFD are both indirect, wholly-owned subsidiaries of Guggenheim Capital, LLC and, therefore, the consolidation will not result in a change of actual control of the Funds' distributor. The primary goal of the consolidation is to achieve greater operational efficiencies and allow all of the Guggenheim funds, including funds that are not series of the Trusts, to be distributed by a single distributor.
The consolidation is not expected to affect the day-to-day management of the Funds or result in any material changes to the distribution of the Funds, including any changes to the distribution fees paid by the Funds.
Board Considerations in Approving the Investment Advisory Agreement
At in-person meetings of the Board of Trustees (the "Board") of Rydex ETF Trust (the "Trust") held on May 15 and June 4, 2014 (each, a "Meeting" and, together, the "Meetings"), called for the purpose of, among other things, consideration of, and voting on, the approval and continuation of the investment advisory agreement applicable to each series of the Trust (each, a "Fund" and, collectively, the "Funds"), the Board, including the Trustees who are not "interested persons," as defined by the Investment Company Act of 1940, of the Trust (the "Independent Trustees"), unanimously approved the continuation of the investment advisory agreement (the "Investment Advisory Agreement") between the Trust and Security Investors, LLC (the "Advisor") with respect to each of the Funds for an additional one-year period, based on the Board's review of qualitative and quantitative information provided by the Advisor.
In reaching the conclusion to approve the continuation of the Investment Advisory Agreement, the Independent Trustees requested and obtained from the Advisor such information as the Independent Trustees deemed reasonably necessary to evaluate the Investment Advisory Agreement. The Advisor provided the Board with a wide variety of information,
26 | GUGGENHEIM ETFs ANNUAL REPORT |
OTHER INFORMATION (Unaudited)(continued) |
including comparisons of Fund performance and fees relative to comparable peer funds in advance of the May 15, 2014 Meeting. The Independent Trustees carefully evaluated the information provided as well as information they received throughout the year as part of their regular oversight of the Funds. At the Meetings, independent legal counsel advised the Independent Trustees with respect to their deliberations and their fiduciary responsibilities associated with the Board's consideration of the continuation of the Investment Advisory Agreement. The Board also received a memorandum from Fund counsel regarding the Board's responsibilities when considering the approval of an investment advisory agreement.
During the Meetings, the Board, including the Independent Trustees, evaluated a number of considerations, including among others: (a) the nature, extent and quality of the Advisor's investment advisory and other services; (b) the Advisor's investment management personnel; (c) the Advisor's operations and financial condition; (d) the Advisor's brokerage practices (including any soft dollar arrangements) and investment strategies; (e) a comparison of the Funds' advisory fees to the fees charged to comparable funds or accounts, paying special attention to the absence of breakpoints in these fees and the Advisor's rationale for not including breakpoints; (f) each Fund's overall fees and operating expenses compared with those of peer funds; (g) the Advisor's profitability with respect to its Fund-related operations; (h) the Advisor's compliance systems; (i) the Advisor's policies and compliance procedures applicable to personal securities transactions; (j) the Advisor's reputation, expertise and resources in the financial markets; and (k) Fund performance compared with that of peer funds and/or appropriate benchmarks. In its deliberations, the Board did not identify any particular factor as controlling, noting that each Trustee could attribute different weights to the various factors considered.
Based on the Board's deliberations at the Meetings, the Board, including all of the Independent Trustees, unanimously: (a) concluded that the terms of the Investment Advisory Agreement are fair and reasonable; (b) concluded that the Advisor's fees were reasonable in light of the services that it provides to the Funds; and (c) agreed to approve and continue the Investment Advisory Agreement based upon the following considerations, among others:
| • | Nature, Extent and Quality of Services Provided by the Advisor. At the Meetings, the Board reviewed the scope of services to be provided by the Advisor under the Investment Advisory Agreement and noted that there would be no significant differences between the scope of services required to be provided by the Advisor for the past year and the scope of services required to be provided during the upcoming year. The Board also considered the Advisor's representations to the Board that the Advisor would continue to provide investment and related services that were of materially the same quality and quantity as services provided to the Funds in the past, and that these services are appropriate in scope and extent in light of the Funds' operations, the competitive landscape of the investment company business and investor needs. |
| • | Fund Expenses and Performance of the Funds and the Advisor. At the Meetings, the Board reviewed statistical information provided by the Advisor regarding the expense ratio components and performance of each Fund. The Advisor engaged FUSE Research Network LLC ("FUSE"), an independent, third party research provider, to prepare advisory contract renewal reports to help the Board fulfill its advisory contract renewal responsibilities. The reports compared the Funds' fees, expenses and total return performance to those of comparable funds in the Funds' peer group and the broader peer universe, as determined by FUSE. Statistical information in the FUSE reports related to the expense ratio components was based on a comparison of the Funds' and peer funds' actual advisory fees, waivers/reimbursements, and gross and net total expenses. The Board also considered the Advisor's representation that it found the peer groups compiled by FUSE to be appropriate. The statistical information related to the performance of each Fund included three month and one, three, and five year performance for the Fund compared to its peers and its appropriate benchmark. |
| • | Costs of Services Provided to the Funds and Profits Realized by the Advisor and its Affiliates. At the Meetings, the Board reviewed information about the profitability of the Funds to the Advisor based on the advisory fees payable under the current Investment Advisory Agreement for the last calendar year. The Board noted that the Adviser had contractually agreed to pay all operating expenses of the Funds, including the cost of index licensing fees, transfer agency, custody, fund administration, legal, audit and other services, except interest, taxes, brokerage commissions and other expenses connected with the execution of portfolio transactions, distribution fees, and extraordinary expenses. At the Meetings, the Board also analyzed the Funds' expenses, including the investment advisory fees paid to the Advisor, and reviewed reports comparing the expense ratios of the Funds to those of other comparable funds. The Board also reviewed information regarding the direct revenue received by the Advisor |
| GUGGENHEIM ETFs ANNUAL REPORT | 27 |
OTHER INFORMATION (Unaudited)(concluded) |
and ancillary revenue received by the Advisor and/or its affiliates in connection with the services provided to the Funds by the Advisor and/or its affiliates. The Board also discussed the Advisor's profit margin as reflected in the Advisor's profitability analysis.
| • | Economies of Scale. In connection with its review of the Funds' profitability analysis at the Meetings, the Board considered the absence of breakpoints in the Advisor's fee schedule and reviewed information regarding the extent to which economies of scale or other efficiencies may result from increases in the Funds' asset levels. The Board noted that the Investment Advisory Agreement did not provide for breakpoints in each Fund's advisory fee rates as assets of a Fund increase. However, the Board further noted the Advisor's assertion that future economies of scale had been taken into consideration by fixing relatively low advisory fees for the Funds, effectively sharing the benefits of lower fees with the Funds from inception. The Board noted that it intends to continue to monitor fees as each Fund grows in size and assess whether fee breakpoints may be warranted. |
| • | Other Benefits to the Advisor and/or its Affiliates. In addition to evaluating the services provided by the Advisor, the Board considered the nature and amount of other benefits received by the Advisor and its affiliates as a result of their relationship with the Funds. In particular, the Board considered the nature, extent and quality of the administrative and distribution services performed by the Advisor's affiliates and the fees paid to the Advisor's affiliates for those services under separate agreements. In light of the costs of providing services pursuant to the separate agreements as well as the Advisor's and its affiliates' commitment to the Funds, the ancillary benefits the Advisor and its affiliates received were considered reasonable. The Board also noted that the Advisor reports portfolio transactions on behalf of the Funds, including the cost of such transactions, placed through an affiliate of the Funds or the Advisor at each quarterly Board meeting. |
On the basis of the information provided to it and its evaluation of that information, the Board, including the Independent Trustees, concluded that the approval of the Investment Advisory Agreement would enable Fund shareholders to continue receiving high quality services at a cost that was appropriate, reasonable, and in the best interests of the Funds and their shareholders. The Board, including the Independent Trustees, unanimously approved the continuation of the existing Investment Advisory Agreement.
28 | GUGGENHEIM ETFs ANNUAL REPORT |
INFORMATION ON BOARD OF TRUSTEES AND OFFICERS (Unaudited) |
A Board of Trustees oversees the Trust, as well as other trusts of GI, in which its members have no stated term of service, and continue to serve after election until resignation. The Statement of Additional Information includes further information about Fund Trustees and Officers, and can be obtained without charge by calling 800.820.0888.
| Name, Address* and Year of Birth of Trustee | Position(s) Held with the Trust, Term of Office and Length of Time Served | Principal Occupation(s) During Past 5 Years | Number of Portfolios in Fund Complex Overseen by Trustee*** | Other Directorships Held by Trustee |
| INTERESTED TRUSTEE | ||||
Donald C. Cacciapaglia** (1951) | Trustee from 2012 to present. | Current: President and CEO, certain other funds in the Fund Complex (2012-present); Vice Chairman, Guggenheim Investments (2010-present). Former: Chairman and CEO, Channel Capital Group, Inc. (2002-2010). | 220 | Delaware Life (2013-present); Guggenheim Life and Annuity Company (2011-present); Paragon Life Insurance Company of Indiana (2011-present). |
| INDEPENDENT TRUSTEES | ||||
Corey A. Colehour (1945) | Trustee and Member of the Audit Committee from 2003 to present; and Member of the Governance and Nominating Committees from 2005 to present. | Retired. | 131 | None. |
J. Kenneth Dalton (1941) | Trustee from 2003 to present; Chairman and Member of the Audit Committee from 2003 to present; Member of the Governance and Nominating Committees from 2005 to present; and Member of the Risk Oversight Committee from 2010 to present. | Retired. | 131 | Trustee of Epiphany Funds (4) (2009-present). |
John O. Demaret (1940) | Vice Chairman of the Board of Trustees from 2014 to present; Trustee and Member of the Audit Committee from 2003 to present; Chairman of the Board from 2006 to 2014; and Member of the Risk Oversight Committee from 2010 to present. | Retired. | 131 | None. |
Werner E. Keller (1940) | Chairman of the Board from 2014 to present; Trustee and Member of the Audit, Governance and Nominating Committees from 2005 to present; Vice Chairman of the Board from 2010 to 2014; and Chairman and Member of the Risk Oversight Committee from 2010 to present. | Current: Founder and President, Keller Partners, LLC (investment research firm) (2005-present). | 131 | None. |
| GUGGENHEIM ETFs ANNUAL REPORT | 29 |
INFORMATION ON BOARD OF TRUSTEES AND OFFICERS (Unaudited)(continued) |
| Name, Address* and Year of Birth of Trustee | Position(s) Held with the Trust, Term of Office and Length of Time Served | Principal Occupation(s) During Past 5 Years | Number of Portfolios in Fund Complex Overseen by Trustee*** | Other Directorships Held by Trustee |
| INDEPENDENT TRUSTEES - concluded | ||||
Thomas F. Lydon, Jr. (1960) | Trustee and Member of the Audit, Governance and Nominating Committees from 2005 to present. | Current: President, Global Trends Investments (registered investment adviser) (1996-present). | 131 | US Global Investors (GROW) (1995-present). |
Patrick T. McCarville (1942) | Trustee and Member of the Audit Committee from 2003 to present; Chairman and Member of the Governance and Nominating Committees from 2005 to present. | Retired. Former: Chief Executive Officer, Par Industries, Inc., d/b/a Par Leasing (1977-2010). | 131 | None. |
Name, Address* and Year of Birth | Position(s) Held with the Trust, Term of Office and Length of Time Served | Principal Occupation(s) During Past 5 Years |
| OFFICERS | ||
Donald C. Cacciapaglia (1951) | President (2012-present). | Current: President and CEO, certain other funds in the Fund Complex (2012-present); Vice Chairman, Guggenheim Investments (2010-present). Former: Chairman and CEO, Channel Capital Group Inc. (2002-2010). |
Michael P. Byrum (1970) | Vice President (1999-present). | Current: Senior Vice President, Security Investors, LLC (2010-present); President and Chief Investment Officer, Rydex Holdings, LLC (2008-present); Director and Chairman, Advisory Research Center, Inc. (2006-present); Manager, Guggenheim Specialized Products, LLC (2005-present). Former: Vice President, Guggenheim Distributors, LLC (2009); Director (2009-2010) and Secretary (2002-2010), Rydex Fund Services, LLC; Director (2008-2010), Chief Investment Officer (2006-2010), President (2004-2010) and Secretary (2002-2010), Rydex Advisors, LLC; Director (2008-2010), Chief Investment Officer (2006-2010), President (2004-2010) and Secretary (2002-2010), Rydex Advisors II, LLC. |
Nikolaos Bonos (1963) | Vice President and Treasurer (2003-present). | Current: Senior Vice President, Security Investors, LLC (2010-present); Chief Executive Officer, Guggenheim Specialized Products, LLC (2009-present); Chief Executive Officer & President, Rydex Fund Services, LLC (2009-present); Vice President, Rydex Holdings, LLC (2008-present). Former: Senior Vice President, Security Global Investors, LLC (2010-2011); and Senior Vice President, Rydex Advisors, LLC and Rydex Advisors II, LLC (2006-2011). |
30 | GUGGENHEIM ETFs ANNUAL REPORT |
INFORMATION ON BOARD OF TRUSTEES AND OFFICERS (Unaudited)(concluded) |
Name, Address* and Year of Birth | Position(s) Held with the Trust, Term of Office and Length of Time Served | Principal Occupation(s) During Past 5 Years |
| OFFICERS - concluded | ||
Elisabeth Miller (1968) | Chief Compliance Officer (2012-present). | Current: CCO, certain other funds in the Fund Complex (2012-present); CCO, Security Investors, LLC (2012-present); CCO, Guggenheim Funds Investment Advisors, LLC (2012-present); Vice President, Guggenheim Funds Distributors, LLC (March 2014-present). Former: CCO, Guggenheim Distributors, LLC (2009-March 2014); Senior Manager, Security Investors, LLC (2004-2009); Senior Manager, Guggenheim Distributors, LLC (2004-2009). |
Joseph M. Arruda (1966) | Assistant Treasurer (2006-present). | Current: Assistant Treasurer, certain other funds in the Fund Complex (2006-present); Vice President, Security Investors, LLC (2010-present); CFO and Manager, Guggenheim Specialized Products, LLC (2009-present). Former: Vice President, Security Global Investors, LLC (2010-2011); Vice President, Rydex Advisors, LLC (2010); Vice President, Rydex Advisors II, LLC (2010). |
Paul J. Davio (1972) | Assistant Treasurer (2014-present). | Current: Assistant Treasurer, certain other funds in the Fund Complex (2014-present); Director, Guggenheim Investments (2006-present). Former: Manager, Mutual Fund Administration, Guggenheim Investments (2003-2006) |
Amy J. Lee (1961) | Vice President (2009-present) and Secretary (2012-present). | Current: Chief Legal Officer, certain other funds in the Fund Complex (2012-present); Senior Managing Director, Guggenheim Investments (2012-present). Former: Vice President, Associate General Counsel and Assistant Secretary, Security Benefit Life Insurance Company and Security Benefit Corporation (2004-2012). |
| * | All Trustees and Officers may be reached c/o Guggenheim Investments, 805 King Farm Boulevard, Suite 600, Rockville, MD 20850. |
| ** | Mr. Cacciapaglia is an "interested" person of the Trust, as that term is defined in the 1940 Act by virtue of his affiliation with the Adviser's parent company. |
| *** | The "Fund Complex" includes all closed-end and open-end funds (including all of their portfolios) advised by the Adviser and any funds that have an investment adviser or servicing agent that is an affiliated person of the Adviser. Information provided is as of the date of this report. |
| GUGGENHEIM ETFs ANNUAL REPORT | 31 |
GUGGENHEIM INVESTMENTS PRIVACY POLICIES (Unaudited) |
Rydex Funds, Guggenheim Funds, Rydex Investments, Guggenheim Distributors, LLC, Security Investors, LLC, Security Distributors, Inc. and Rydex Advisory Services (Collectively "Guggenheim Investments").
Our Commitment to You
When you become a Guggenheim Investments investor, you entrust us with not only your hard-earned money but also with personal and financial information about you. We recognize that your relationship with us is based on trust and that you expect us to act responsibly and in your best interests. Because we have access to this private information about you, we hold ourselves to the highest standards in its safekeeping and use. This means, most importantly, that we do not sell client information to anyone—whether it is your personal information or if you are a current or former Guggenheim Investments client.
The Information We Collect About You
In the course of doing business with shareholders and investors, we collect nonpublic personal information about you. You typically provide personal information when you complete a Guggenheim Investments account application or when you request a transaction that involves Rydex and Guggenheim Investments funds or one of the Guggenheim Investments affiliated companies. "Nonpublic personal information" is personally identifiable private information about you. For example, it includes information regarding your name and address, Social Security or taxpayer identification number, assets, income, account balance, bank account information and investment activity (e.g., purchase and redemption history).
How We Handle Your Personal Information
As emphasized above, we do not sell information about current or former clients or their accounts to third parties. Nor do we share such information, except when necessary to complete transactions at your request or to make you aware of related investment products and services that we offer. Additional details about how we handle your personal information are provided below. To complete certain transactions or account changes that you direct, it may be necessary to provide identifying information to companies, individuals or groups that are not affiliated with Guggenheim Investments. For example, if you ask to transfer assets from another financial institution to Guggenheim Investments, we will need to provide certain information about you to that company to complete the transaction. To alert you to other Guggenheim Investments investment products and services, we may share your information within the Guggenheim Investments family of affiliated companies. This would include, for example, sharing your information within Guggenheim Investments so we can make you aware of new Rydex and Guggenheim Investments funds or the services offered through another Guggenheim Investments affiliated company. In certain instances, we may contract with nonaffiliated companies to perform services for us. Where necessary, we will disclose information we have about you to these third parties. In all such cases, we provide the third party with only the information necessary to carry out its assigned responsibilities and only for that purpose. And we require these third parties to treat your private information with the same high degree of confidentiality that we do. In certain instances, we may share information with other financial institutions regarding individuals and entities in response to the U.S.A. Patriot Act. Finally, we will release information about you if you direct us to do so, if we are compelled by law to do so or in other circumstances permitted by law.
Opt Out Provisions
We do not sell your personal information to anyone. The law allows you to "opt out" of only certain kinds of information sharing with third parties. The firm does not share personal information about you with any third parties that triggers this opt-out right. This means YOU ARE ALREADY OPTED OUT.
32 | GUGGENHEIM ETFs ANNUAL REPORT |
GUGGENHEIM INVESTMENTS PRIVACY POLICIES (Unaudited)(concluded) |
How We Protect Privacy Online
Our concern for the privacy of our shareholders also extends to those who use our web site, guggenheiminvestments.com. Our web site uses some of the most secure forms of online communication available, including encryption technology, Secure Socket Layer (SSL) protocol, firewalls and user names and passwords. These technologies provide a high level of security and privacy when you access your account information or initiate online transactions. The Guggenheim Investments web site offers customized features that require our use of "http cookies"—tiny pieces of information that we ask your browser to store. However, we make very limited use of these cookies. We only use cookies for session management and security features on the Guggenheim Investments web site. We do not use them to pull data from your hard drive, to learn your email address, or to view data in cookies created by other web sites. We will not share the information in our cookies or give others access to it. See the legal information area on our web site for more details about web site security and privacy features.
How We Safeguard Your Personal Information
We restrict access to nonpublic personal information about shareholders to our employees and in some cases to third parties (for example, the service providers described above) as permitted by law. We maintain strict physical, electronic and procedural safeguards that comply with federal standards to guard your nonpublic personal information.
We'll Keep You Informed
As required by federal law, we will notify shareholders of our privacy policy annually. We reserve the right to modify this policy at any time, but rest assured that if we do change it, we will tell you promptly. You will also be able to access our privacy policy from our web site at guggenheiminvestments.com. Should you have any questions regarding our privacy policy, contact us at 800.820.0888 or 301.296.5100.
| GUGGENHEIM ETFs ANNUAL REPORT | 33 |
This page intentionally left blank.
This page intentionally left blank.
This page intentionally left blank.
This page intentionally left blank.
Item 2. Code of Ethics.
The registrant’s Board of Trustees has adopted a code of ethics that applies to the registrant’s principal executive officer and principal financial officer. No substantive amendments were approved or waivers were granted to the Code during the period covered by this report. The Code is filed as an exhibit to this Form N-CSR.
Item 3. Audit Committee Financial Expert.
The registrant's Board of Trustees has determined that Werner Keller, an "independent" Trustee serving on the registrant's audit committee, is an "audit committee financial expert," as defined in Item 3 of Form N-CSR. Under applicable securities laws, a person who is determined to be an audit committee financial expert will not be deemed an "expert" for any purpose, including without limitation for the purposes of Section 11 of the Securities Act of 1933, as a result of being designated or identified as an audit committee financial expert. The designation or identification of a person as an audit committee financial expert does not impose on such person any duties, obligations, or liabilities that are greater than the duties, obligations, and liabilities imposed on such person as a member of the audit committee and Board of Trustees in the absence of such designation or identification.
Item 4. Principal Accountant Fees and Services.
(a) Audit Fees. The aggregate Audit Fees billed by the Trust’s principal accountant, for the audit of the annual financial statements in connection with statutory and regulatory filings for the fiscal years ended October 31, 2014 and October 31, 2013 were $215,828 and $226,550, respectively.
(b) Audit-Related Fees. The aggregate Audit Related Fees billed by the Trust’s principal account for the fiscal years ended October 31, 2014 and October 31, 2013 were $0 and $0, respectively.
(c) Tax Fees. The aggregate Tax Fees billed by the Trust’s principal accountant for professional services rendered for tax compliance, tax advice, and tax planning, including preparation of tax returns and distribution assistance, for the fiscal years ended October 31, 2014 and October 31, 2013, were $120,047 and $117,550, respectively.
(d) All Other Fees. The aggregate All Other Fees billed by the Trust’s principal accountant for products and services provided by the principal accountant, other than the services reported in paragraphs (a) through (c) of this Item, for the fiscal years ended October 31, 2014 and October 31, 2013 were $0 and $0, respectively.
(e) Audit Committee Pre-Approval Policies and Procedures. The audit committee has adopted a policy whereby audit and non-audit services performed by the registrant’s principal accountant for the registrant, its investment advisor, and any entity controlling, controlled by, or under common control with the investment advisor that provides ongoing services to the registrant require pre-approval in advance at regularly scheduled audit committee meetings. If such service is required between regularly scheduled audit committee meetings, the chairman of the audit committee, J. Kenneth Dalton, is authorized to pre-approve the service with full committee approval at the next scheduled meeting. There shall be no waivers of the pre-approval process. No services described in (b)-(d) above were approved pursuant to paragraph (c)(7)(i)(C) of Rule 2-01 of Regulation S-X.
(f) Not applicable.
(g) Non-Audit Fees. The aggregate non-audit fees billed by the registrant’s accountant for the most recent fiscal year and the preceding fiscal year for services rendered to the registrant, the investment advisor, and any entity controlling, controlled by, or under common control with the advisor that provides ongoing services to the registrant were $156,797 and $152,550, respectively. These aggregate fees were less than the aggregate fees billed for the same periods by the registrant’s principal accountant for audit services rendered to the registrant, the investment advisor, and any entity controlling, controlled by, or under common control with the advisor that provides ongoing services to the registrant.
(h) Auditor Independence. All non-audit services rendered in (g) above were pre-approved by the registrant’s audit committee. As such, the audit committee has considered these services in maintaining the principal accountant’s independence.
Item 5. Audit Committee of Listed Registrants.
(a) The Registrant has a separately standing Audit Committee, which includes the following independent members: John O. Demaret, Corey A. Colehour, J. Kenneth Dalton, Patrick T. McCarville, Thomas F. Lydon, and Werner E. Keller.
(b) Not applicable.
Item 6. Schedule of Investments
Schedule of Investments is included as part of the report to shareholders filed under Item 1 of this form.
Item 7. Disclosure of Proxy Voting Policies and Procedures for Closed-End Management Investment Companies.
Not applicable.
Item 8. Portfolio Managers of Closed-End Management Investment Companies.
Not applicable.
Item 9. Purchases of Equity Securities by Closed-End Management Investment Company and Affiliated Purchasers.
Not applicable.
Item 10. Submission of Matters to a Vote of Security Holders.
Not applicable.
Item 11. Controls and Procedures.
(a) The registrant’s President (principal executive officer) and Treasurer (principal financial officer) have evaluated the registrant’s disclosure controls and procedures within 90 days of this filing and have concluded that the registrant’s disclosure controls and procedures were effective, as of that date, in ensuring that information required to be disclosed by the registrant in this Form N-CSR was recorded, processed, summarized, and reported timely.
(b) The registrant’s principal executive officer and principal financial officer are aware of no change in the registrant’s internal control over financial reporting that occurred during the registrant’s second fiscal quarter covered by this report that has materially affected, or is reasonably likely to materially affect, the registrant’s internal control over financial reporting.
Item 12. Exhibits.
(a)(1) The registrant’s code of ethics pursuant to Item 2 of Form N-CSR is attached.
(a)(2) Separate certifications by the President (principal executive officer) and Treasurer (principal financial officer) of the registrant as required by Rule 30a-2(a) under the Act (17 CFR 270.30a-2(a)) are attached.
(b) A certification by the registrant’s President (principal executive officer) and Treasurer (principal financial officer) as required by Rule 30a-2(b) under the Act (17 CFR 270.30a-2(b)) is attached.
SIGNATURES
Pursuant to the requirements of the Securities Exchange Act of 1934 and the Investment Company Act of 1940, the registrant has duly caused this report to be signed on its behalf by the undersigned, thereunto duly authorized.
| (Registrant) | Rydex ETF Trust | ||
By (Signature and Title)* | /s/ Donald C. Cacciapaglia | ||
| Donald C. Cacciapaglia, President | |||
| Date | January 9, 2015 | ||
| Pursuant to the requirements of the Securities Exchange Act of 1934 and the Investment Company Act of 1940, this report has been signed below by the following persons on behalf of the registrant and in the capacities and on the dates indicated. | |||
| By (Signature and Title)* | /s/ Donald C. Cacciapaglia | ||
| Donald C. Cacciapaglia, President | |||
| Date | January 9, 2015 | ||
| By (Signature and Title)* | /s/ Nikolaos Bonos | ||
| Nikolaos Bonos, Vice President and Treasurer | |||
| Date | January 9, 2015 | ||
* Print the name and title of each signing officer under his or her signature.