 |
10.31.2016
Guggenheim ETFs Funds Annual Report
EWEM | Guggenheim MSCI Emerging Markets Equal Country Weight ETF |
EWMC | Guggenheim S&P MidCap 400® Equal Weight ETF |
EWSC | Guggenheim S&P SmallCap 600® Equal Weight ETF |
OEW | Guggenheim S&P 100® Equal Weight ETF |
RCD | Guggenheim S&P 500® Equal Weight Consumer Discretionary ETF |
RHS | Guggenheim S&P 500® Equal Weight Consumer Staples ETF |
RYE | Guggenheim S&P 500® Equal Weight Energy ETF |
RYF | Guggenheim S&P 500® Equal Weight Financials ETF |
RYH | Guggenheim S&P 500® Equal Weight Health Care ETF |
RGI | Guggenheim S&P 500® Equal Weight Industrials ETF |
RTM | Guggenheim S&P 500® Equal Weight Materials ETF |
EWRE | Guggenheim S&P 500® Equal Weight Real Estate ETF |
RYT | Guggenheim S&P 500® Equal Weight Technology ETF |
RYU | Guggenheim S&P 500® Equal Weight Utilities ETF |
GuggenheimInvestments.com | ETF1-ANN-1016x1017 |
TABLE OF CONTENTS |
DEAR SHAREHOLDER | 2 |
ECONOMIC AND MARKET OVERVIEW | 3 |
FEES AND EXPENSES | 5 |
MANAGER'S ANALYSIS | 7 |
PORTFOLIO SUMMARY | 8 |
SCHEDULES OF INVESTMENTS | 37 |
STATEMENTS OF ASSETS AND LIABILITIES | 76 |
STATEMENTS OF OPERATIONS | 80 |
STATEMENTS OF CHANGES IN NET ASSETS | 84 |
FINANCIAL HIGHLIGHTS | 91 |
NOTES TO FINANCIAL STATEMENTS | 105 |
REPORT OF INDEPENDENT REGISTERED PUBLIC ACCOUNTING FIRM | 117 |
OTHER INFORMATION | 118 |
INFORMATION ON BOARD OF TRUSTEES AND OFFICERS | 123 |
GUGGENHEIM INVESTMENTS PRIVACY POLICIES | 127 |
GUGGENHEIM ETFs ANNUAL REPORT | 1 |
October 31, 2016 |
Dear Shareholder:
Security Investors, LLC (the “Investment Adviser”) is pleased to present the annual shareholder report for a selection of our exchange-traded funds (“ETFs”) for the annual fiscal period ended October 31, 2016.
The Investment Adviser is part of Guggenheim Investments, which represents the investment management businesses of Guggenheim Partners, LLC (“Guggenheim”), a global, diversified financial services firm.
Guggenheim Funds Distributors, LLC is the distributor of the Funds. Guggenheim Funds Distributors, LLC is affiliated with Guggenheim and the Investment Adviser.
We encourage you to read the Economic and Market Overview, which follows this letter, followed by the Manager’s Analysis for each ETF.
Sincerely,

Donald C. Cacciapaglia
President and Chief Executive Officer
November 30, 2016
Read a prospectus and summary prospectus (if available) carefully before investing. It contains the investment objectives, risks, charges, expenses, and other information, which should be considered carefully before investing. Obtain a prospectus and summary prospectus (if available) at guggenheiminvestments.com or call 800.820.0888.
ETFs may not be suitable for all investors. ● Investment returns and principal value will fluctuate so that when shares are redeemed, they may be worth more or less than original cost. Most investors will also incur customary brokerage commissions when buying or selling shares of an ETF. ● Investments in securities and derivatives, in general, are subject to market risks that may cause their prices to fluctuate over time. ● ETF shares may trade below their net asset value per share (“NAV”). The NAV of shares will fluctuate with changes in the market value of an ETF’s holdings. In addition, there can be no assurance that an active trading market for shares will develop or be maintained. ● Tracking error risk refers to the risk that the Adviser may not be able to cause the ETF’s performance to match or correlate to that of the ETF’s underlying index, either on a daily or aggregate basis. Tracking error risk may cause the ETF’s performance to be less than you expect. Please review a prospectus carefully for more information of the risks associated with each ETF.
2 | GUGGENHEIM ETFs ANNUAL REPORT |
ECONOMIC AND MARKET OVERVIEW (Unaudited) | October 31, 2016 |
Behind the performance numbers for the past 12 months are a multitude of events that unfolded throughout 2016, including a beginning-of-the-year recession scare, an increase in U.S. corporate default volume, several quarters of negative earnings growth, the British vote to exit the European Union, and stubbornly low inflation across the globe. Some might forget that in the first six weeks of the year U.S. corporate bonds suffered one of the worst selloffs since the financial crisis, or that the S&P 500 was down almost 11%. We continue to believe that the turnaround in market performance was a result of global central bank easing.
The surprise end to the fractious U.S. election season leaves many questions unanswered about the new administration, but as it relates to the economy we are particularly alert to the possible market impact of resurgent fiscal policy. We will learn more as we move through the transition of power, but in the meantime several market positives should support asset performance in the fourth quarter and into 2017. The domestic economy just turned in the highest growth rate in two years, early indications point to a strong Christmas selling season, corporate earnings are turning higher or recovering, and the energy sector is stabilizing with the oil market recovery.
U.S. real gross domestic product (“GDP”) was up 2.9% in the third quarter (revised higher to 3.2% in late November), up from 1.4% in the second quarter. We expect output to rise by around 2% on average in coming quarters, a bit faster than the trend rate over the past year, as drags from past dollar strength and an inventory adjustment cycle fade.
The labor market continues to strengthen, as seen in the impressive growth in the size of the labor force. In the year through October, the labor force participation rate increased by 0.3 percentage point while the unemployment rate declined by just 0.1 percentage point. The cyclical rise in participation has helped to keep the unemployment rate steady and stave off U.S. Federal Reserve (the “Fed”) rate hikes in 2016.
We believe it is highly likely the Fed will raise rates in December, and we expect policymakers to hike twice more in 2017. While this would be a bit faster than markets are now pricing in, it would still leave rates below levels prescribed by standard policy rules. President-elect Trump will have an opportunity to fill two open seats on the Board of Governors, though this should not affect Fed policy in the near term.
Fed Chair Yellen has spoken about temporarily running a “high-pressure economy”—one that enables robust business activity and a tight labor market—to offset persistent shortfalls in aggregate demand. If this is the case, before the expansion ends the Fed will likely allow unemployment to drop below 4%, and inflation to overshoot its 2% goal. This change in perspective, as well as the president-elect’s proposed changes to fiscal policy, accounts for why we are starting to see a backup in long-term interest rates, although global monetary policy intervention will likely continue to support bond prices.
Meanwhile, monetary policy divergence will continue to support the U.S. dollar. We expect the European Central Bank (“ECB”) to extend quantitative easing (“QE”) at the current pace of €80 billion per month in December, which will require adjustments to the program. In our view, the QE programs of the ECB and Bank of Japan (“BoJ”) will continue to buttress global sovereign debt and credit markets.
For the 12 months ended October 31, 2016, the Standard & Poor’s 500® (“S&P 500”) Index* returned 4.51%. The MSCI Europe-Australasia-Far East (“EAFE”) Index* returned -3.23%. The return of the MSCI Emerging Markets Index* was 9.27%.
In the bond market, the Bloomberg Barclays U.S. Aggregate Bond Index* posted a 4.37% return for the period, while the Bloomberg Barclays U.S. Corporate High Yield Index* returned 10.14%. The return of the Bank of America (“BofA”) Merrill Lynch 3-Month U.S. Treasury Bill Index* was 0.31% for the 12-month period.
The opinions and forecasts expressed may not actually come to pass. This information is subject to change at any time, based on market and other conditions, and should not be construed as a recommendation of any specific security or strategy.
*Index Definitions:
The following indices are referenced throughout this report. Indices are unmanaged and not available for direct investment. Index performance does not reflect transaction costs, fees, or expenses.
BofA Merrill Lynch 3-Month U.S. Treasury Bill Index is an unmanaged market Index of U.S. Treasury securities maturing in 90 days that assumes reinvestment of all income.
Bloomberg Barclays U.S. Aggregate Bond Index is a broad-based flagship benchmark that measures the investment grade, U.S. dollar-denominated, fixed-rate taxable bond market, including U.S. Treasuries, government-related and corporate securities, mortgage-backed securities or “MBS” (agency fixed-rate and hybrid adjustable-rate mortgage, or “ARM”, pass-throughs), asset-backed securities (“ABS”), and commercial mortgage-backed securities (“CMBS”) (agency and non-agency).
Bloomberg Barclays U.S. Corporate High Yield Index measures the U.S. dollar-denominated, high yield, fixed-rate corporate bond market. Securities are classified as high yield if the middle rating of Moody’s, Fitch, and S&P is Ba1/BB +/BB + or below.
GUGGENHEIM ETFs ANNUAL REPORT | 3 |
ECONOMIC AND MARKET OVERVIEW (Unaudited)(concluded) | October 31, 2016 |
MSCI EAFE Index is a capitalization-weighted measure of stock markets in Europe, Australasia, and the Far East.
MSCI Emerging Markets Index is a free float-adjusted market capitalization-weighted index that is designed to measure equity market performance in the global emerging markets.
S&P 500® Index is a broad-based index, the performance of which is based on the performance of 500 widely held common stocks chosen for market size, liquidity, and industry group representation.
MSCI Emerging Markets Equal Country Weighted Index captures large and mid-cap representation across 23 Emerging Market countries. The index represents an alternative weighting scheme to its market-cap weighted parent index, the MSCI Emerging Markets Index. The Index includes the same constituents as its parent index but applies an equal country weighting at each semi-annual index review date.
MSCI Emerging Markets Equal Weighted Index equally weights the securities in the MSCI Emerging Markets Index (the MSCI Emerging Markets cap-weighted index), which is a free float-adjusted market capitalization index that is designed to measure the equity market performance of emerging markets. In the MSCI Emerging Markets Equal Weighted Index, each security has the same weight, which means that the weight of each security is set to unity of the rebalancing date.
S&P 100® Equal Weight Index is an unmanaged equal weighted version of the S&P 100® Index, which is an unmanaged capitalization-weighted index composed of a subset of 100 common stocks of the S&P 500® Index representing major blue-chip companies across multiple industry groups.
Russell MidCap® Equal Weight Index is an unmanaged equal-weighted version of the Russell Midcap® Index, which is an unmanaged capitalization-weighted index representing the U.S. mid-cap market. The Russell Midcap Equal Weight Index offers sector equal weight exposure by equally weighting the nine sectors within the Index and then equally weighting the securities within each sector. Russell Midcap® Index measures the performance of the 800 smallest companies in the Russell 1000® Index, which represent approximately 31% of the total market capitalization of the Russell 1000® Index.
Russell 2000® Equal Weight Index is an unmanaged equal-weighted version of the Russell 2000® Index, which is an unmanaged capitalization-weighted index representing the U.S. small-cap market. The Russell 2000® Equal Weight Index offers sector equal weight exposure by equally weighting the nine sectors within the Index and then equally weighting the securities within each sector. Russell 2000® Index measures the performance of the small-cap value segment of the U.S. equity universe. The Russell 2000® Index measures the performance of the 2,000 smallest companies in the Russell 3000® Index, which represents approximately 10% of the total market capitalization of the Russell 3000® Index. The Russell 3000® Index measures the performance of the largest 3,000 U.S. companies representing approximately 98% of the investable U.S. equity market.
S&P MidCap 400® Equal Weight Index is an equal weighted version of the S&P MidCap 400® Index, which measures the performance of 400 mid-sized companies selected by Standard&Poor’s, and covers approximately 7% of the U.S. equities market. The S&P MidCap 400® EWI has the same constituents as the capitalization weighted S&P 400® Index, but each company is allocated to a fixed weight, rebalancing quarterly.
S&P SmallCap 600® Equal Weight Index is an equal weighted version of the S&P SmallCap 600® Index, which measures the performance of 600 small-sized companies selected by Standard&Poor’s, and covers approximately 3% of the U.S. equities market. The S&P SmallCap 600® EWI has the same constituents as the capitalization weighted S&P SmallCap 600® Index, but each company is allocated to a fixed weight, rebalancing quarterly.
S&P 500® Equal Weight Index Consumer Discretionary is an unmanaged equal weighted version of the S&P 500® Consumer Discretionary Index that consists of the common stocks of the following industries: automobiles and components, consumer durables, apparel, hotels, restaurants, leisure, media and retailing that comprise the Consumer Discretionary sector of the S&P 500® Index.
S&P 500® Equal Weight Index Consumer Staples is an unmanaged equal weighted version of the S&P 500® Consumer Staples Index that consists of the common stocks of the following industries: food and drug retailing, beverages, food products, tobacco, household products and personal products that comprise the Consumer Staples sector of the S&P 500® Index.
S&P 500® Equal Weight Index Energy is an unmanaged equal weighted version of the S&P 500® Energy Index that consists of the common stocks of the following industries: oil and gas exploration, production, marketing, refining and/or transportation and energy equipment and services industries that comprise the Energy sector of the S&P 500® Index.
S&P 500® Equal Weight Index Financials is an unmanaged equal weighted version of the S&P 500® Financials Index that consists of the common stocks of the following industries: banks, diversified financials, brokerage, asset management insurance and real estate, including investment trusts that comprise the Financials sector of the S&P 500® Index.
S&P 500® Equal Weight Index Health Care is an unmanaged equal weighted version of the S&P 500® Health Care Index that consists of the common stocks of the following industries: health care equipment and supplies, health care providers and services, and biotechnology and pharmaceuticals that comprise the Health Care sector of the S&P 500® Index.
S&P 500® Equal Weight Index Industrials is an unmanaged equal weighted version of the S&P 500® Industrials Index that consists of the common stocks of the following industries: aerospace and defense, building products, construction and engineering, electrical equipment, conglomerates, machinery; commercial services and supplies, air freight and logistics, airlines, and marine, road and rail transportation infrastructure that comprise the 52 Industrials sector of the S&P 500® Index.
S&P 500® Equal Weight Index Materials is an unmanaged equal weighted version of the S&P 500® Materials Index that consists of the common stocks of the following industries: chemicals, construction materials, containers and packaging, metals and mining, and paper and forest products that comprise the Materials sector of the S&P 500® Index.
S&P 500® Equal Weight Real Estate Index is an unmanaged equal weighted version of the S&P 500® Real Estate Index, which equally weights the index constituents in the S&P 500 that are currently classified in the Global Industry Classification Standard (GICS®) Real Estate Industry Group within the Financial Sector, excluding the mortgage REITs sub-industry. The Real Estate Industry Group will be elevated to the Real Estate Sector after the market close on August 31, 2016, raising the number of GICS Sectors to eleven.
S&P 500® Equal Weight Index Information Technology is an unmanaged equal weighted version of the S&P 500® Information Technology Index that consists of the common stocks of the following industries: Internet equipment, computers and peripherals, electronic equipment, office electronics and instruments, semiconductor equipment and products, diversified telecommunication services, and wireless telecommunication services that comprise the Information Technology sector of the S&P 500® Index.
S&P 500® Equal Weight Index Telecommunication Services & Utilities is an unmanaged equal weighted version of the S&P 500® Telecommunication Services Index and S&P 500® Utilities Index that consists of the common stocks of the following industries: electric utilities, gas utilities, multi-utilities and unregulated power and water utilities, telecommunication service companies, including fixed-line, cellular, wireless, high bandwidth and fiber-optic cable networks that comprise the Telecommunications Services and Utilities sectors of the S&P 500® Index.
4 | GUGGENHEIM ETFs ANNUAL REPORT |
FEES AND EXPENSES (Unaudited) |
|
Shareholder Expense Example
As a shareholder of the Rydex ETF Trust, you incur transaction costs such as creation and redemption fees or brokerage charges, and ongoing costs including advisory fees, trustee fees and, if applicable, distribution fees. All other Trust expenses are paid by the advisor. This example is intended to help you understand your ongoing costs (in dollars) of investing in a Fund and to compare these costs with the ongoing costs of investing in other mutual funds.
The example in the table is based on an investment of $1,000 invested on April 30, 2016 and held for the six months ended October 31, 2016.
Actual Expenses
The first table below provides information about actual account values and actual expenses. You may use the information in this table, together with the amount you invested, to estimate the expenses that you incurred over the period. Simply divide your account value by $1,000 (for example, an $8,600 account value divided by $1,000 = 8.6), then multiply the result by the number in the first table under the heading entitled “Expenses Paid During Period” to estimate the expenses attributable to your investment during this period.
Hypothetical Example for Comparison Purposes
The second table below provides information about hypothetical account values and hypothetical expenses based on a Fund’s actual expense ratio and an assumed rate of return of 5% per year before expenses, which is not a Fund’s actual return. Thus, you should not use the hypothetical account values and expenses to estimate the actual ending account balance or your expenses for the period. Rather, these figures are provided to enable you to compare the ongoing costs of investing in a Fund and other funds. To do so, compare this 5% hypothetical example with the 5% hypothetical examples that appear in the shareholder reports of other funds.
Please note that the expenses shown in the table are meant to highlight your ongoing costs only and do not reflect any transaction costs, such as creation and redemption fees, or brokerage charges. Therefore, the second table is useful in comparing ongoing costs only, and will not help you determine the relative total costs of owning different funds. In addition, if these transaction costs were included, your costs would have been higher.
GUGGENHEIM ETFs ANNUAL REPORT | 5 |
FEES AND EXPENSES (Unaudited)(concluded) |
|
Expense | Fund | Beginning 2016 | Ending 2016 | Expenses | |
Table 1. Based on actual Fund return3 | |||||
Guggenheim MSCI Emerging Markets Equal Country Weight ETF | 0.67% | 3.98% | $ 1,000.00 | $ 1,039.80 | $ 3.44 |
Guggenheim S&P MidCap 400® Equal Weight ETF | 0.41% | 3.71% | 1,000.00 | 1,037.10 | 2.11 |
Guggenheim S&P SmallCap 600® Equal Weight ETF | 0.41% | 3.84% | 1,000.00 | 1,038.40 | 2.11 |
Guggenheim S&P 100® Equal Weight ETF4 | 0.40% | 3.73% | 1,000.00 | 1,037.30 | 1.40 |
Guggenheim S&P 500® Equal Weight Consumer Discretionary ETF | 0.40% | (0.79%) | 1,000.00 | 992.10 | 2.01 |
Guggenheim S&P 500® Equal Weight Consumer Staples ETF | 0.40% | 1.63% | 1,000.00 | 1,016.30 | 2.03 |
Guggenheim S&P 500® Equal Weight Energy ETF | 0.40% | 2.85% | 1,000.00 | 1,028.50 | 2.05 |
Guggenheim S&P 500® Equal Weight Financials ETF | 0.40% | 5.10% | 1,000.00 | 1,051.00 | 2.07 |
Guggenheim S&P 500® Equal Weight Health Care ETF | 0.40% | (2.77%) | 1,000.00 | 972.30 | 1.99 |
Guggenheim S&P 500® Equal Weight Industrials ETF | 0.40% | 3.33% | 1,000.00 | 1,033.30 | 2.05 |
Guggenheim S&P 500® Equal Weight Materials ETF | 0.40% | (0.40%) | 1,000.00 | 996.00 | 2.01 |
Guggenheim S&P 500® Equal Weight Real Estate ETF | 0.36% | (0.54%) | 1,000.00 | 994.60 | 1.81 |
Guggenheim S&P 500® Equal Weight Technology ETF | 0.40% | 16.84% | 1,000.00 | 1,168.40 | 2.19 |
Guggenheim S&P 500® Equal Weight Utilities ETF | 0.40% | 0.89% | 1,000.00 | 1,008.90 | 2.03 |
Table 2. Based on hypothetical 5% return (before expenses) | |||||
Guggenheim MSCI Emerging Markets Equal Country Weight ETF | 0.67% | 5.00% | 1,000.00 | 1,021.83 | 3.41 |
Guggenheim S&P MidCap 400® Equal Weight ETF | 0.41% | 5.00% | 1,000.00 | 1,023.14 | 2.09 |
Guggenheim S&P SmallCap 600® Equal Weight ETF | 0.41% | 5.00% | 1,000.00 | 1,023.14 | 2.09 |
Guggenheim S&P 100® Equal Weight ETF | 0.40% | 5.00% | 1,000.00 | 1,023.19 | 2.04 |
Guggenheim S&P 500® Equal Weight Consumer Discretionary ETF | 0.40% | 5.00% | 1,000.00 | 1,023.19 | 2.04 |
Guggenheim S&P 500® Equal Weight Consumer Staples ETF | 0.40% | 5.00% | 1,000.00 | 1,023.19 | 2.04 |
Guggenheim S&P 500® Equal Weight Energy ETF | 0.40% | 5.00% | 1,000.00 | 1,023.19 | 2.04 |
Guggenheim S&P 500® Equal Weight Financials ETF | 0.40% | 5.00% | 1,000.00 | 1,023.19 | 2.04 |
Guggenheim S&P 500® Equal Weight Health Care ETF | 0.40% | 5.00% | 1,000.00 | 1,023.19 | 2.04 |
Guggenheim S&P 500® Equal Weight Industrials ETF | 0.40% | 5.00% | 1,000.00 | 1,023.19 | 2.04 |
Guggenheim S&P 500® Equal Weight Materials ETF | 0.40% | 5.00% | 1,000.00 | 1,023.19 | 2.04 |
Guggenheim S&P 500® Equal Weight Real Estate ETF | 0.36% | 5.00% | 1,000.00 | 1,023.39 | 1.84 |
Guggenheim S&P 500® Equal Weight Technology ETF | 0.40% | 5.00% | 1,000.00 | 1,023.19 | 2.04 |
Guggenheim S&P 500® Equal Weight Utilities ETF | 0.40% | 5.00% | 1,000.00 | 1,023.19 | 2.04 |
1 | Annualized and excludes expenses of the underlying funds in which the Funds invest. |
2 | Expenses are equal to the Fund’s annualized expense ratio, net of any applicable fee waivers, multiplied by the average account value over the period, multiplied by 184/365 (to reflect the one-half year period). |
3 | Actual cumulative return at net asset value for the period April 30, 2016 to October 31, 2016. |
4 | Since commencement of operations: June 29, 2016. Expenses paid based on actual fund return are calculated using 125 days from the commencement of operations. |
6 | GUGGENHEIM ETFs ANNUAL REPORT |
MANAGER'S ANALYSIS (Unaudited) | October 31, 2016 |
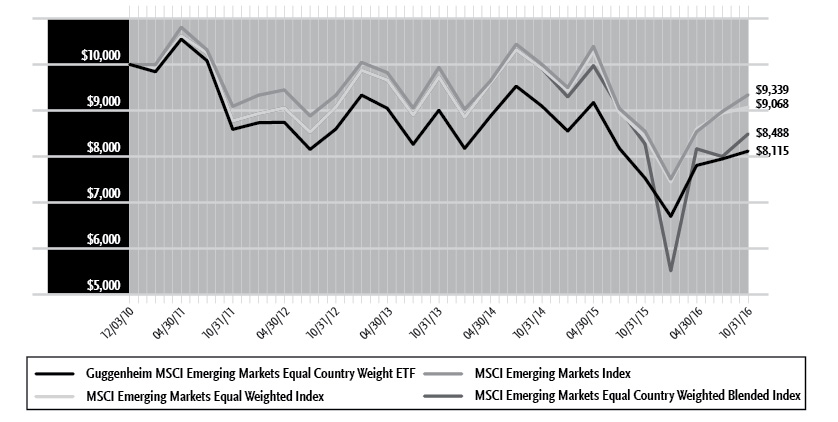
Guggenheim MSCI Emerging Markets Equal Country Weight ETF
Guggenheim MSCI Emerging Markets Equal Country Weight ETF (“EWEM”) returned 7.80% for the one-year period ended October 31, 2016. The MSCI Emerging Markets Equal Country Weighted Index returned 8.86% for the period, and the MSCI Emerging Markets Equal Weighted Index returned 7.56%. Over the period, EWEM achieved over 99% correlation to the MSCI Emerging Markets Equal Country Weighted Index on a daily basis.
The Financials, Energy, and Materials sectors contributed the most to the Fund’s return for the period. The Industrials, Real Estate, and Utilities sectors contributed the least to the Fund’s return for the period. No sector detracted.
Top contributors to the Fund’s return included Credicorp Ltd., OTP Bank plc, and Taiwan Semiconductor Manufacturing Co., Ltd. Top detractors included National Bank of Greece SA, Commercial International Bank (Egypt) SAE, and Global X MSCI Greece ETF.
Cumulative Fund Performance: December 3, 2010 – October 31, 2016
AVERAGE ANNUAL TOTAL RETURNS FOR THE PERIOD ENDED OCTOBER 31, 2016 | ||||
One Year | Three Year | Five Year | Since Inception | |
Guggenheim MSCI Emerging Markets Equal Country Weight ETF | 7.80% | -3.41% | -1.13% | -3.47% |
MSCI Emerging Markets Equal Country Weighted Index | 8.86% | N/A | N/A | N/A |
MSCI Emerging Markets Equal Country Weighted Blended Index | 2.62% | -4.41% | -0.66% | -2.74% |
MSCI Emerging Markets Equal Weighted Index | 7.56% | -2.29% | 0.67% | -1.64% |
MSCI Emerging Markets Index | 9.27% | -2.05% | 0.55% | -1.15% |
The MSCI Emerging Markets Equal Country Weighted Index incepted on 11/10/14. Therefore, the index returns for the times periods listed above are not available.
The returns presented above do not reflect the effect of taxes. Index returns represent total returns. Performance displayed represents past performance, which is no guarantee of future results.
GUGGENHEIM ETFs ANNUAL REPORT | 7 |
PORTFOLIO SUMMARY (Unaudited) | October 31, 2016 |
Guggenheim MSCI Emerging Markets Equal Country Weight ETF
Holdings Diversification (Market Exposure as % of Net Assets)
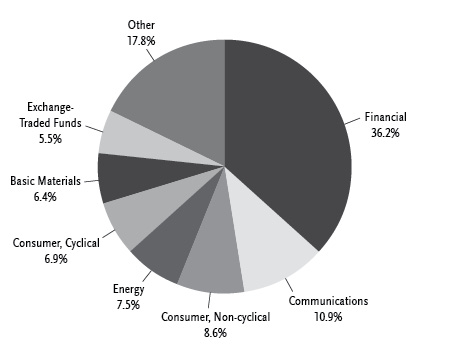
“Holdings Diversification (Market Exposure as % of Net Assets)” excludes any temporary cash investments.
Ten Largest Holdings | (% of Total Net Assets) |
iShares MSCI India ETF | 4.4% |
Commercial International Bank Egypt SAE GDR | 2.8% |
Credicorp Ltd. | 2.6% |
OTP Bank plc | 2.4% |
CEZ AS | 1.6% |
Komercni Banka AS | 1.5% |
Taiwan Semiconductor Manufacturing Company Ltd. ADR | 1.3% |
Qatar National Bank SAQ | 1.2% |
VanEck Vectors Egypt Index ETF | 1.2% |
Richter Gedeon Nyrt | 1.2% |
Top Ten Total | 20.2% |
“Ten Largest Holdings” excludes any temporary cash investments. | |
8 | GUGGENHEIM ETFs ANNUAL REPORT |
MANAGER'S ANALYSIS (Unaudited) | October 31, 2016 |
Guggenheim S&P MidCap 400® Equal Weight ETF
Guggenheim S&P MidCap 400® Equal Weight ETF (“EWMC”) returned 6.08% for the one-year period ended October 31, 2016, compared with the 6.38% return of the benchmark, the S&P MidCap 400® Equal Weight Index. The cap-weighted S&P MidCap 400® Index returned 6.26%. During the period, the Fund achieved over 99% correlation to its benchmark on a daily basis. The Fund’s ticker is EWMC.
Prior to January 27, 2016, the Fund was known as the Guggenheim Russell MidCap® Equal Weight ETF and its benchmark was the Russell MidCap® Equal Weight Index, which returned 5.74% for the one-year period. The Fund’s previous ticker was EWRM.
The Industrials, Utilities, and Materials sectors contributed the most to the Fund’s return for the period. The sectors detracting the most from performance were Energy, Health Care, and Telecommunications Services.
Top contributors to the Fund’s return included United States Steel Corp., Keurig Green Mountain, Inc., and Royal Gold, Inc. Top detractors included SunEdison, Inc., California Resources Corp., and Flowers Foods, Inc.
Cumulative Fund Performance: December 3, 2010 – October 31, 2016
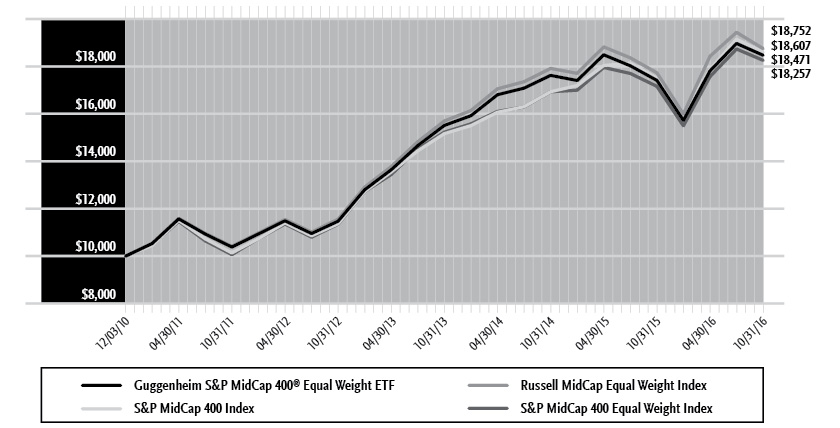
Effective January 27, 2016, the Fund changed its principal investment strategy. As a result of the investment strategy change, the Fund’s new benchmark is the S&P MidCap 400 Equal Weight Index. Prior to January 27, 2016, the Fund’s benchmark was the Russell MidCap Equal Weight Index.
AVERAGE ANNUAL TOTAL RETURNS FOR THE PERIOD ENDED OCTOBER 31, 2016 | ||||
One Year | Three Year | Five Year | Since Inception | |
Guggenheim S&P MidCap 400® Equal Weight ETF | 6.08% | 5.99% | 12.22% | 10.94% |
S&P MidCap 400 Equal Weight Index | 6.38% | 6.24% | 12.66% | 10.72% |
Russell MidCap Equal Weight Index | 5.74% | 6.10% | 12.49% | 11.22% |
S&P MidCap 400 Index | 6.26% | 7.06% | 12.92% | 11.08% |
The returns presented above do not reflect the effect of taxes. Index returns represent total returns. Performance displayed represents past performance, which is no guarantee of future results.
GUGGENHEIM ETFs ANNUAL REPORT | 9 |
PORTFOLIO SUMMARY (Unaudited) | October 31, 2016 |
Guggenheim S&P MidCap 400® Equal Weight ETF
Holdings Diversification (Market Exposure as % of Net Assets)
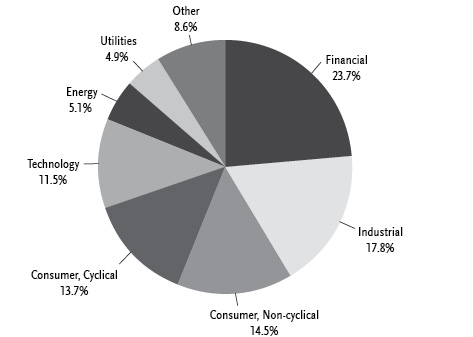
“Holdings Diversification (Market Exposure as % of Net Assets)” excludes any temporary cash investments.
Ten Largest Holdings | (% of Total Net Assets) |
Endurance Specialty Holdings Ltd. | 0.4% |
Cabela's, Inc. | 0.3% |
Mentor Graphics Corp. | 0.3% |
Advanced Micro Devices, Inc. | 0.3% |
Avon Products, Inc. | 0.3% |
B/E Aerospace, Inc. | 0.3% |
Patterson-UTI Energy, Inc. | 0.3% |
Computer Sciences Corp. | 0.3% |
IPG Photonics Corp. | 0.3% |
Nabors Industries Ltd. | 0.3% |
Top Ten Total | 3.1% |
“Ten Largest Holdings” excludes any temporary cash investments. | |
10 | GUGGENHEIM ETFs ANNUAL REPORT |
MANAGER'S ANALYSIS (Unaudited) | October 31, 2016 |
Guggenheim S&P SmallCap 600® Equal Weight ETF
Guggenheim S&P SmallCap 600® Equal Weight ETF (“EWSC”) returned 2.39% for the one-year period ended October 31, 2016, compared with the 6.76% return of the benchmark, the S&P SmallCap 600® Equal Weight Index. The cap-weighted S&P SmallCap 600® Index returned 6.35%. During the period, the Fund achieved over 99% correlation to its benchmark on a daily basis. The Fund’s ticker is EWSC.
Prior to January 27, 2016, the Fund was known as the Guggenheim Russell 2000® Equal Weight ETF and its benchmark was the Russell 2000® Equal Weight Index, which returned 3.92% for the one-year period. The Fund’s previous ticker was EWRS.
The Information Technology, Materials, and Financials sectors contributed the most to the Fund’s return for the period. The only sectors detracting from performance were Energy and Health Care. Telecommunications Services contributed least.
Top contributors to Fund return included SunCoke Energy, Inc., Century Aluminum Co., and Cloud Peak Energy, Inc. Top detractors included Bonanza Creek Energy, Inc., Stone Energy Corp., and Halcon Resources Corp.
Cumulative Fund Performance: December 3, 2010 – October 31, 2016
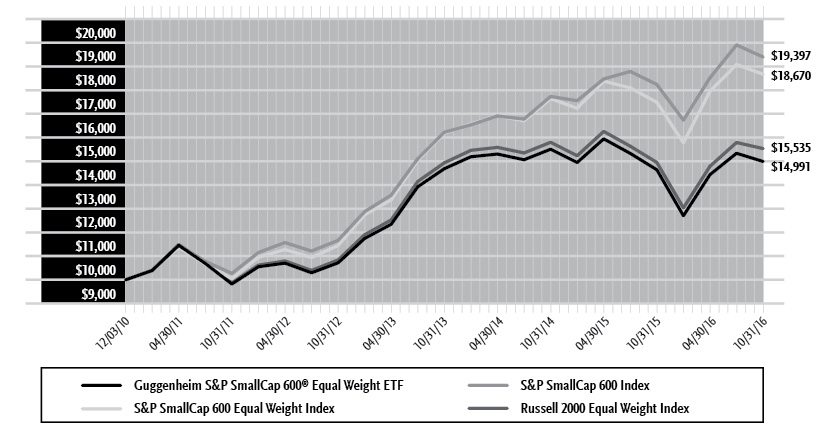
Effective January 27, 2016, the Fund changed its principal investment strategy. As a result of the investment strategy change, the Fund’s new benchmark is the S&P SmallCap 600 Equal Weight Index. Prior to January 27, 2016, the Fund’s benchmark was the Russell 2000 Equal Weight Index.
AVERAGE ANNUAL TOTAL RETURNS FOR THE PERIOD ENDED OCTOBER 31, 2016 | ||||
One Year | Three Year | Five Year | Since Inception | |
Guggenheim S&P SmallCap 600® Equal Weight ETF | 2.39% | 0.68% | 8.82% | 7.09% |
S&P SmallCap 600 Equal Weight Index | 6.76% | 4.88% | 13.18% | 11.14% |
Russell 2000 Equal Weight Index | 3.92% | 1.32% | 9.49% | 7.74% |
S&P SmallCap 600 Index | 6.35% | 6.13% | 13.56% | 11.86% |
The returns presented above do not reflect the effect of taxes. Index returns represent total returns. Performance displayed represents past performance, which is no guarantee of future results.
GUGGENHEIM ETFs ANNUAL REPORT | 11 |
PORTFOLIO SUMMARY (Unaudited) | October 31, 2016 |
Guggenheim S&P SmallCap 600® Equal Weight ETF
Holdings Diversification (Market Exposure as % of Net Assets)
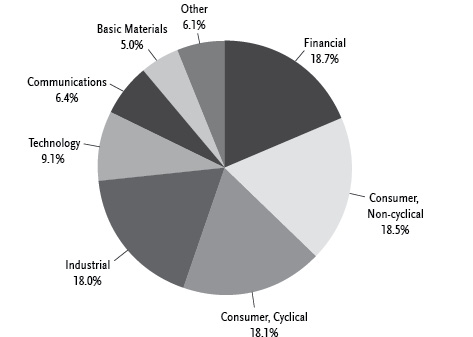
“Holdings Diversification (Market Exposure as % of Net Assets)” excludes any temporary cash investments.
Ten Largest Holdings | (% of Total Net Assets) |
Cloud Peak Energy, Inc. | 0.3% |
SunCoke Energy, Inc. | 0.3% |
Orion Group Holdings, Inc. | 0.2% |
Abercrombie & Fitch Co. — Class A | 0.2% |
iRobot Corp. | 0.2% |
II-VI, Inc. | 0.2% |
DTS, Inc. | 0.2% |
Chemours Co. | 0.2% |
Zumiez, Inc. | 0.2% |
Strayer Education, Inc. | 0.2% |
Top Ten Total | 2.2% |
“Ten Largest Holdings” excludes any temporary cash investments. | |
12 | GUGGENHEIM ETFs ANNUAL REPORT |
MANAGER'S ANALYSIS (Unaudited) | October 31, 2016 |
Guggenheim S&P 100® Equal Weight ETF
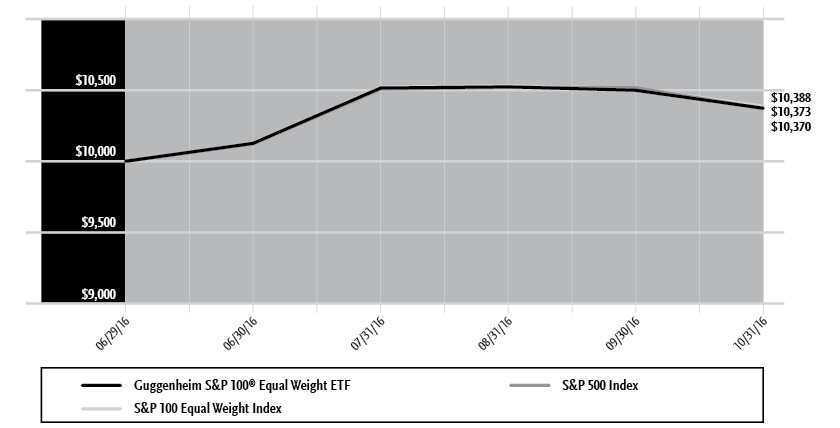
Guggenheim S&P 100® Equal Weight ETF (“OEW”) returned 3.73% for the abbreviated annual fiscal period ended October 31, 2016, compared with the 3.89% return of the benchmark, the S&P 100® Equal Weight Index. The Fund’s inception date was June 29, 2016, and its ticker is OEW.
The Financials, Information Technology, and Industrials sectors contributed the most to the Fund’s return for the abbreviated period. The sectors detracting the most from performance were Health Care, Consumer Staples, and Telecommunications Services.
Top contributors to the Fund’s return included Morgan Stanley, QUALCOMM, Inc., and Bank of America Corp. Top detractors included Bristol-Myers Squibb Co., Lowe’s Companies, Inc., and Simon Property Group, Inc.
Cumulative Fund Performance: June 29, 2016 – October 31, 2016
AVERAGE ANNUAL TOTAL RETURNS FOR THE PERIOD ENDED OCTOBER 31, 2016 | |
Since Inception | |
Guggenheim S&P 100® Equal Weight ETF | 3.73% |
S&P 100 Equal Weight Index | 3.89% |
S&P 100 Index | 3.70% |
The returns presented above do not reflect the effect of taxes. Index returns represent total returns. Performance displayed represents past performance, which is no guarantee of future results.
GUGGENHEIM ETFs ANNUAL REPORT | 13 |
PORTFOLIO SUMMARY (Unaudited) | October 31, 2016 |
Guggenheim S&P 100® Equal Weight ETF
Holdings Diversification (Market Exposure as % of Net Assets)
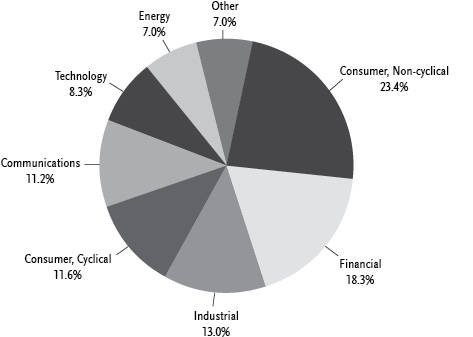
“Holdings Diversification (Market Exposure as % of Net Assets)” excludes any temporary cash investments.
Ten Largest Holdings | (% of Total Net Assets) |
Time Warner, Inc. | 1.2% |
QUALCOMM, Inc. | 1.1% |
Boeing Co. | 1.1% |
Apple, Inc. | 1.1% |
Halliburton Co. | 1.1% |
PayPal Holdings, Inc. | 1.1% |
Mastercard, Inc. — Class A | 1.1% |
FedEx Corp. | 1.1% |
Priceline Group, Inc. | 1.1% |
MetLife, Inc. | 1.1% |
Top Ten Total | 11.1% |
“Ten Largest Holdings” excludes any temporary cash investments. | |
14 | GUGGENHEIM ETFs ANNUAL REPORT |
MANAGER'S ANALYSIS (Unaudited) | October 31, 2016 |
Guggenheim S&P 500® Equal Weight Consumer Discretionary ETF
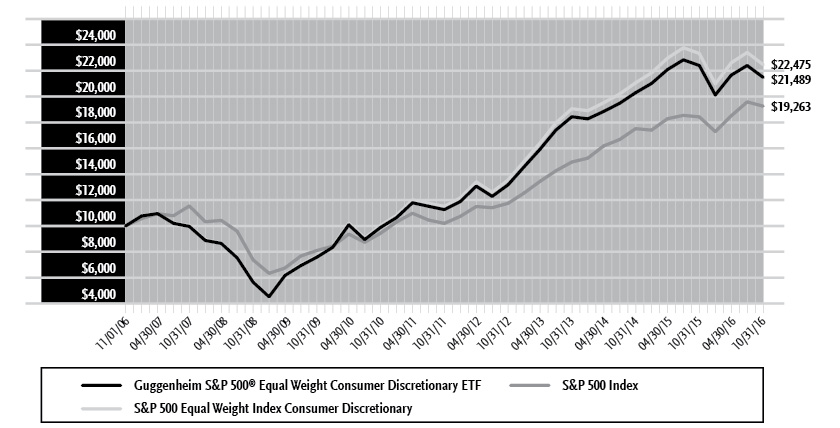
For the one-year period ended October 31, 2016, Guggenheim S&P 500® Equal Weight Consumer Discretionary ETF (“RCD”) returned -4.07%, compared to its benchmark, the S&P 500® Equal Weight Index Consumer Discretionary, which returned -3.57%. RCD achieved over 99% correlation to its benchmark on a daily basis.
The return of the cap-weighted S&P 500® Index was 4.51%.
The Leisure Products, Internet & Direct Marketing Retail, and Multiline Retail industries were the largest contributors to the Fund’s return. The Specialty Retail; Textiles, Apparel & Luxury Goods; and Auto Components industries detracted the most from the Fund’s return.
Wynn Resorts Ltd., Michael Kors Holdings Ltd., and Garmin Ltd. contributed the most to the Fund’s return. Signet Jewelers Ltd., Chipotle Mexican Grill, Inc., and Staples, Inc. detracted the most from the Fund’s return.
Cumulative Fund Performance: November 1, 2006 – October 31, 2016
AVERAGE ANNUAL TOTAL RETURNS FOR THE PERIOD ENDED OCTOBER 31, 2016 | ||||
One Year | Three Year | Five Year | Since Inception (11/01/06) | |
Guggenheim S&P 500® Equal Weight Consumer Discretionary ETF | -4.07% | 5.23% | 13.80% | 7.95% |
S&P 500 Equal Weight Index Consumer Discretionary | -3.57% | 5.71% | 14.31% | 8.44% |
S&P 500 Index | 4.51% | 8.84% | 13.57% | 6.78% |
The returns presented above do not reflect the effect of taxes. Index returns represent total returns. Performance displayed represents past performance, which is no guarantee of future results.
GUGGENHEIM ETFs ANNUAL REPORT | 15 |
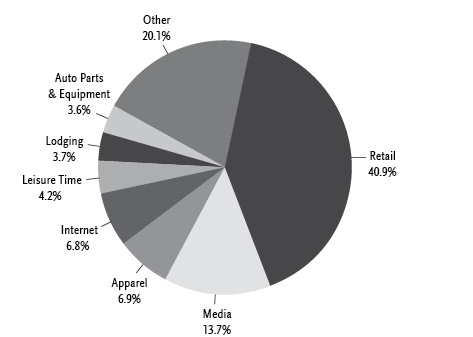
PORTFOLIO SUMMARY (Unaudited) | October 31, 2016 |
Guggenheim S&P 500® Equal Weight Consumer Discretionary ETF
Holdings Diversification (Market Exposure as % of Net Assets)
“Holdings Diversification (Market Exposure as % of Net Assets)” excludes any temporary cash investments.
Ten Largest Holdings | (% of Total Net Assets) |
Netflix, Inc. | 1.6% |
The Gap, Inc. | 1.4% |
Royal Caribbean Cruises Ltd. | 1.4% |
Expedia, Inc. | 1.4% |
Time Warner, Inc. | 1.4% |
Harley-Davidson, Inc. | 1.4% |
Carnival Corp. | 1.4% |
Tiffany & Co. | 1.3% |
CBS Corp. — Class B | 1.3% |
Michael Kors Holdings Ltd. | 1.3% |
Top Ten Total | 13.9% |
“Ten Largest Holdings” excludes any temporary cash investments. | |
16 | GUGGENHEIM ETFs ANNUAL REPORT |
MANAGER'S ANALYSIS (Unaudited) | October 31, 2016 |
Guggenheim S&P 500® Equal Weight Consumer Staples ETF
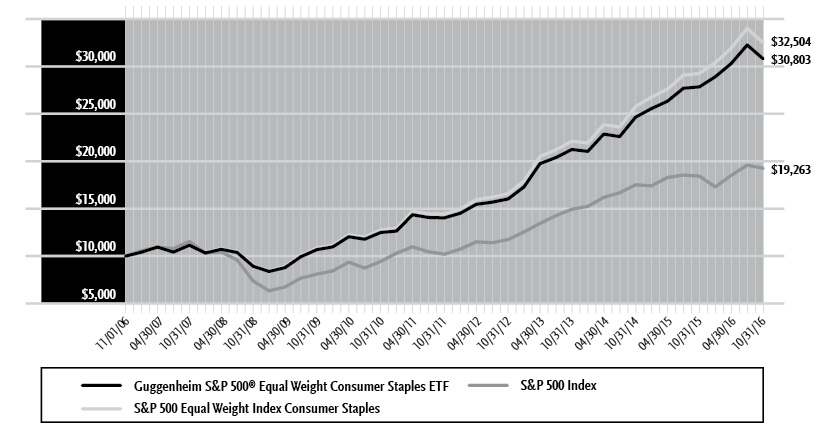
For the one-year period ended October 31, 2016, Guggenheim S&P 500® Equal Weight Consumer Staples ETF (“RHS”) returned 10.63%. For the same period, its benchmark, the S&P 500® Equal Weight Index Consumer Staples, returned 10.85%. RHS achieved over 99% correlation to its benchmark on a daily basis.
The return of the cap-weighted S&P 500® Index was 4.51%.
The Food Products, Beverages, and Tobacco industries were the largest contributors to the Fund’s return. The Food & Staples Retailing, Personal Products, and Household Products industries contributed the least to the Fund’s return. No industry detracted.
Keurig Green Mountain, Inc., Tyson Foods, Inc.—Class A, and Wal-Mart Stores, Inc., contributed the most to the Fund’s return. Kroger Co., CVS Health Corp., and Brown-Forman Corp.—Class B contributed the least.
Cumulative Fund Performance: November 1, 2006 – October 31, 2016
AVERAGE ANNUAL TOTAL RETURNS FOR THE PERIOD ENDED OCTOBER 31, 2016 | ||||
One Year | Three Year | Five Year | Since Inception | |
Guggenheim S&P 500® Equal Weight Consumer Staples ETF | 10.63% | 13.19% | 17.03% | 11.91% |
S&P 500 Equal Weight Index Consumer Staples | 10.85% | 13.77% | 17.59% | 12.53% |
S&P 500 Index | 4.51% | 8.84% | 13.57% | 6.78% |
The returns presented above do not reflect the effect of taxes. Index returns represent total returns. Performance displayed represents past performance, which is no guarantee of future results.
GUGGENHEIM ETFs ANNUAL REPORT | 17 |
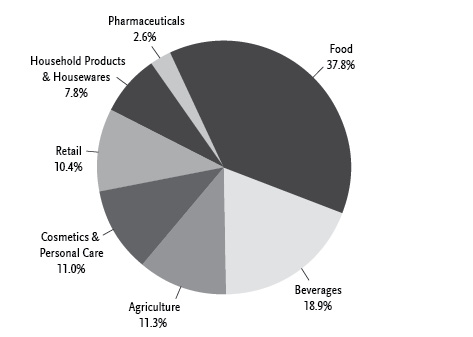
PORTFOLIO SUMMARY (Unaudited) | October 31, 2016 |
Guggenheim S&P 500® Equal Weight Consumer Staples ETF
Holdings Diversification (Market Exposure as % of Net Assets)
“Holdings Diversification (Market Exposure as % of Net Assets)” excludes any temporary cash investments.
Ten Largest Holdings | (% of Total Net Assets) |
Reynolds American, Inc. | 3.1% |
Coty, Inc. — Class A | 3.0% |
ConAgra Foods, Inc. | 3.0% |
Hormel Foods Corp. | 2.9% |
Mondelez International, Inc. — Class A | 2.9% |
Hershey Co. | 2.8% |
Altria Group, Inc. | 2.8% |
Archer-Daniels-Midland Co. | 2.8% |
Kraft Heinz Co. | 2.8% |
PepsiCo, Inc. | 2.8% |
Top Ten Total | 28.9% |
“Ten Largest Holdings” excludes any temporary cash investments. | |
18 | GUGGENHEIM ETFs ANNUAL REPORT |
MANAGER'S ANALYSIS (Unaudited) | October 31, 2016 |
Guggenheim S&P 500® Equal Weight Energy ETF
For the one-year period ended October 31, 2016, Guggenheim S&P 500® Equal Weight Energy ETF (“RYE”) returned 6.50%. For the same period, its benchmark, the S&P 500® Equal Weight Index Energy, returned 6.81%. RYE achieved over 99% correlation to its benchmark on a daily basis.
The return of the cap-weighted S&P 500® Index was 4.51%.
The Oil & Gas Storage & Transportation, Oil & Gas Exploration & Production, and Coal & Consumable Fuels industries contributed the most to the Fund’s return.
The Oil & Gas Equipment & Services industries contributed the least to the Fund’s return.
The largest detractors from the Fund’s return were the Oil & Gas Drilling and Oil & Gas Refining & Marketing industries.
ONEOK, Inc., Spectra Energy Corp., and Southwestern Energy Co. contributed the most to the Fund’s return.
Ensco Plc, Transocean Ltd., and Marathon Oil Corp. detracted the most from the Fund’s return.
Cumulative Fund Performance: November 1, 2006 – October 31, 2016
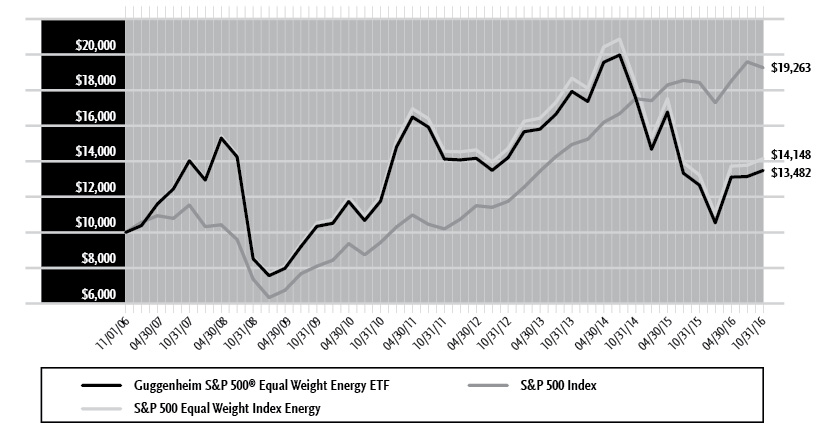
AVERAGE ANNUAL TOTAL RETURNS FOR THE PERIOD ENDED OCTOBER 31, 2016 | ||||
One Year | Three Year | Five Year | Since Inception | |
Guggenheim S&P 500® Equal Weight Energy ETF | 6.50% | -9.06% | -0.92% | 3.03% |
S&P 500 Equal Weight Index Energy | 6.81% | -8.88% | -0.53% | 3.53% |
S&P 500 Index | 4.51% | 8.84% | 13.57% | 6.78% |
The returns presented above do not reflect the effect of taxes. Index returns represent total returns. Performance displayed represents past performance, which is no guarantee of future results.
GUGGENHEIM ETFs ANNUAL REPORT | 19 |
PORTFOLIO SUMMARY (Unaudited) | October 31, 2016 |
Guggenheim S&P 500® Equal Weight Energy ETF
Holdings Diversification (Market Exposure as % of Net Assets)
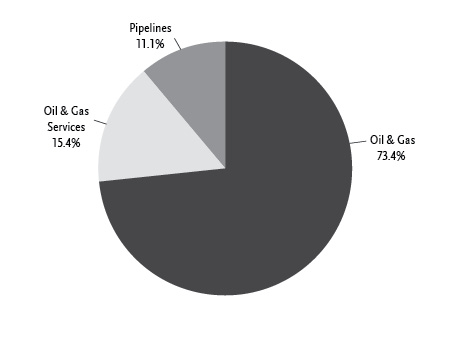
“Holdings Diversification (Market Exposure as % of Net Assets)” excludes any temporary cash investments.
Ten Largest Holdings | (% of Total Net Assets) |
FMC Technologies, Inc. | 3.3% |
Baker Hughes, Inc. | 3.2% |
Halliburton Co. | 3.1% |
Valero Energy Corp. | 3.1% |
Tesoro Corp. | 3.1% |
Helmerich & Payne, Inc. | 3.0% |
Phillips 66 | 3.0% |
Chevron Corp. | 3.0% |
Marathon Petroleum Corp. | 3.0% |
Anadarko Petroleum Corp. | 2.9% |
Top Ten Total | 30.7% |
“Ten Largest Holdings” excludes any temporary cash investments. | |
20 | GUGGENHEIM ETFs ANNUAL REPORT |
MANAGER'S ANALYSIS (Unaudited) | October 31, 2016 |
Guggenheim S&P 500® Equal Weight Financials ETF
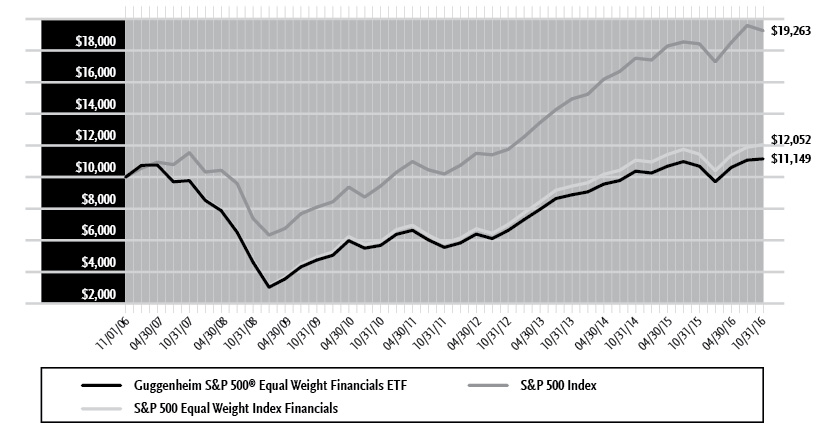
For the one-year period ended October 31, 2016, Guggenheim S&P 500® Equal Weight Financials ETF (“RYF”) returned 4.33%. For the same period, its benchmark, the S&P 500® Equal Weight Index Financials, returned 5.42%. RYF achieved a daily correlation of over 99% to its benchmark on a daily basis.
The return of the cap-weighted S&P 500® Index was 4.51%.
As a reflection of the rising importance of real estate as an asset class, on August 31, 2016, real estate was removed from the Financials sector and elevated from its "industry group" status with the Global Industry Classification Standard (GICS®) Financials sector to its own sector category. As of that date, real estate investment trusts (“REITs”) made up about 20% of the market capitalization of the Financials sector.
After the close of business on September 16, 2016, S&P Dow Jones Indices reconstituted the S&P 500® Equal Weight Index Financials, the underlying index for RYF, by removing the stocks of companies involved in the real estate industry (including REITs, but excluding mortgage REITs). RYF will continue to hold stocks included in the reconstituted S&P 500® Equal Weight Index Financials in accordance with its principal investment strategies. To effect a corresponding change to the RYF portfolio, RYF replaced its real estate stock holdings with shares of Guggenheim S&P 500® Equal Weight Real Estate ETF (“EWRE”) after the market close on September 16, 2016. Shareholders of record of RYF as of September 16, 2016 received 0.50 shares of EWRE for each share of RYF owned, plus a small amount of cash for any fractional shares.
The leading contributors and detractors the period reflect all but two weeks of time in which REITs were part of the Fund.
Equity Real Estate Investment Trusts, Banks, and Insurance were the industries contributing the most to return. Capital Markets, Real Estate Management & Development, and Consumer Finance were the industries detracting the most the return.
Realty Income Corp., Iron Mountain, Inc., and Ventas, Inc. were the largest contributors to the Fund’s return. Legg Mason, Inc., Affiliated Managers Group, Inc., and Ameriprise Financial, Inc., were the largest detractors from the Fund’s return.
Cumulative Fund Performance: November 1, 2006 – October 31, 2016
GUGGENHEIM ETFs ANNUAL REPORT | 21 |
MANAGER'S ANALYSIS (Unaudited)(concluded) | October 31, 2016 |
AVERAGE ANNUAL TOTAL RETURNS FOR THE PERIOD ENDED OCTOBER 31, 2016 | ||||
One Year | Three Year | Five Year | Since Inception | |
Guggenheim S&P 500® Equal Weight Financials ETF | 4.33% | 7.89% | 14.97% | 1.09% |
S&P 500 Equal Weight Index Financials | 5.42% | 8.47% | 15.66% | 1.87% |
S&P 500 Index | 4.51% | 8.84% | 13.57% | 6.78% |
The returns presented above do not reflect the effect of taxes. Index returns represent total returns. Performance displayed represents past performance, which is no guarantee of future results.
22 | GUGGENHEIM ETFs ANNUAL REPORT |
PORTFOLIO SUMMARY (Unaudited) | October 31, 2016 |
Guggenheim S&P 500® Equal Weight Financials ETF
Holdings Diversification (Market Exposure as % of Net Assets)
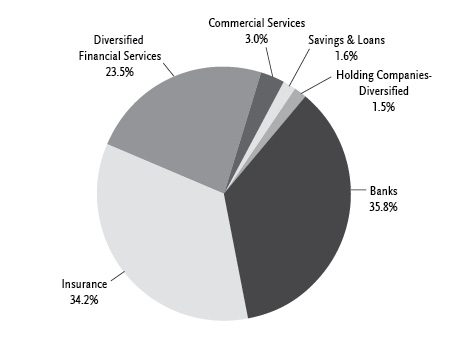
“Holdings Diversification (Market Exposure as % of Net Assets)” excludes any temporary cash investments.
Ten Largest Holdings | (% of Total Net Assets) |
KeyCorp | 1.8% |
Principal Financial Group, Inc. | 1.7% |
Comerica, Inc. | 1.7% |
Fifth Third Bancorp | 1.7% |
Regions Financial Corp. | 1.7% |
Huntington Bancshares, Inc. | 1.7% |
Hartford Financial Services Group, Inc. | 1.7% |
Prudential Financial, Inc. | 1.7% |
MetLife, Inc. | 1.6% |
PNC Financial Services Group, Inc. | 1.6% |
Top Ten Total | 16.9% |
“Ten Largest Holdings” excludes any temporary cash investments. | |
GUGGENHEIM ETFs ANNUAL REPORT | 23 |
MANAGER'S ANALYSIS (Unaudited) | October 31, 2016 |
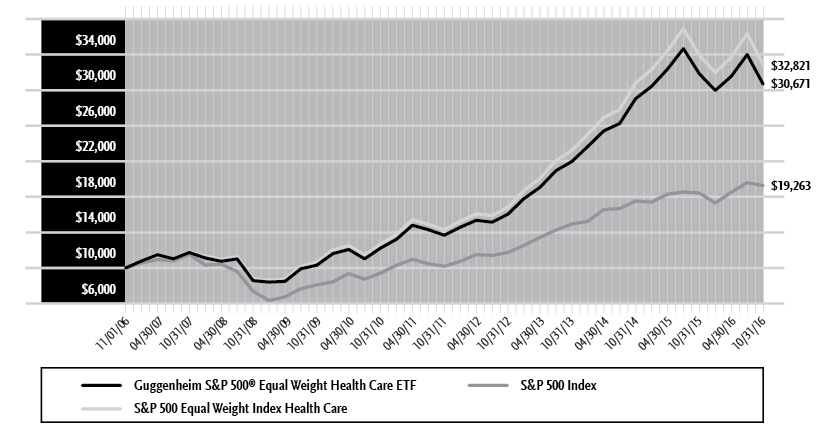
Guggenheim S&P 500® Equal Weight Health Care ETF
For the one-year period ended October 31, 2016, Guggenheim S&P 500® Equal Weight Health Care ETF (“RYH”) returned -3.65%. For the same period, its benchmark, the S&P 500® Equal Weight Index Health Care, returned -3.61%. RYH achieved over 99% correlation to its benchmark on a daily basis.
The return of the cap-weighted S&P 500® Index was 4.51%.
The Health Care Equipment & Supplies, Life Sciences Tools & Services, and Health Care Technology were the largest contributors to the Fund’s return. Pharmaceuticals, Biotechnology, and Health Care Providers & Services were the largest detractors.
Intuitive Surgical, Inc., Baxalta, Inc., and Baxter International, Inc. were the largest contributors to the Fund’s return. Endo International Plc, Perrigo Co. Plc, and Vertex Pharmaceuticals, Inc. were the largest detractors from the Fund’s return.
Cumulative Fund Performance: November 1, 2006 – October 31, 2016
AVERAGE ANNUAL TOTAL RETURNS FOR THE PERIOD ENDED OCTOBER 31, 2016 | ||||
One Year | Three Year | Five Year | Since Inception | |
Guggenheim S&P 500® Equal Weight Health Care ETF | -3.65% | 11.77% | 17.53% | 11.86% |
S&P 500 Equal Weight Index Health Care | -3.61% | 12.30% | 18.09% | 12.63% |
S&P 500 Index | 4.51% | 8.84% | 13.57% | 6.78% |
The returns presented above do not reflect the effect of taxes. Index returns represent total returns. Performance displayed represents past performance, which is no guarantee of future results.
24 | GUGGENHEIM ETFs ANNUAL REPORT |
PORTFOLIO SUMMARY (Unaudited) | October 31, 2016 |
Guggenheim S&P 500® Equal Weight Health Care ETF
Holdings Diversification (Market Exposure as % of Net Assets)
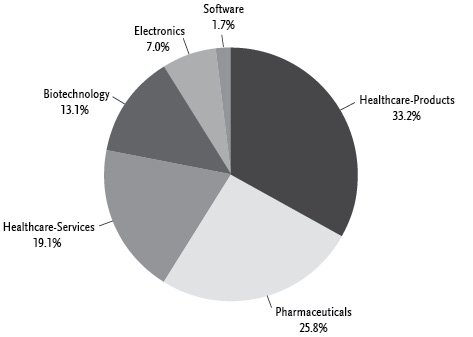
“Holdings Diversification (Market Exposure as % of Net Assets)” excludes any temporary cash investments.
Ten Largest Holdings | (% of Total Net Assets) |
UnitedHealth Group, Inc. | 1.9% |
Baxter International, Inc. | 1.9% |
Alexion Pharmaceuticals, Inc. | 1.9% |
Stryker Corp. | 1.9% |
Mettler-Toledo International, Inc. | 1.9% |
Thermo Fisher Scientific, Inc. | 1.8% |
Danaher Corp. | 1.8% |
CR Bard, Inc. | 1.8% |
HCA Holdings, Inc. | 1.8% |
Quest Diagnostics, Inc. | 1.8% |
Top Ten Total | 18.5% |
“Ten Largest Holdings” excludes any temporary cash investments. | |
GUGGENHEIM ETFs ANNUAL REPORT | 25 |
MANAGER'S ANALYSIS (Unaudited) | October 31, 2016 |
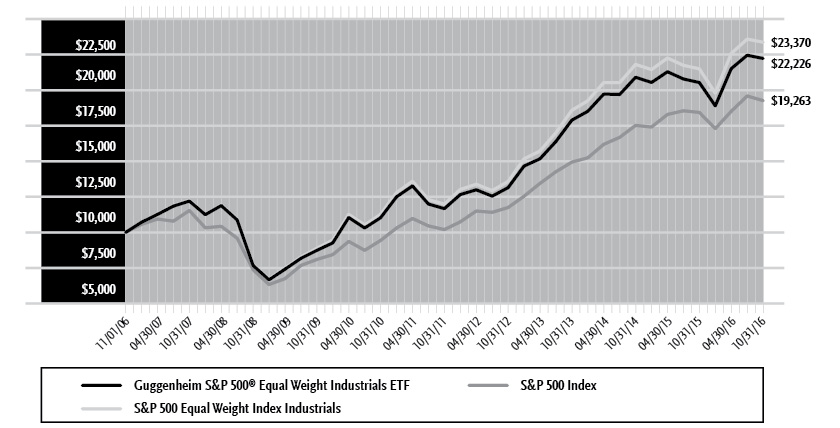
Guggenheim S&P 500® Equal Weight Industrials ETF
For the one-year period ended October 31, 2016, Guggenheim S&P 500® Equal Weight Industrials ETF (“RGI”) returned 8.25% compared to its benchmark S&P 500® Equal Weight Index Industrials, which returned 8.89%. RGI achieved over 99% correlation to its benchmark on a daily basis.
The return of the cap-weighted S&P 500® Index was 4.51%.
The Machinery, Construction & Engineering, and Aerospace & Defense industries contributed the most to the Fund’s return. The only detractors were the Airlines and Chemicals industries.
Quanta Services, Inc., Cummins, Inc., and Xylem, Inc. contributed the most to the Fund’s return. Stericycle, Inc., Robert Half International, Inc., and Ametek, Inc. detracted the most from the Fund’s return.
Cumulative Fund Performance: November 1, 2006 – October 31, 2016
AVERAGE ANNUAL TOTAL RETURNS FOR THE PERIOD ENDED OCTOBER 31, 2016 | ||||
One Year | Three Year | Five Year | Since Inception | |
Guggenheim S&P 500® Equal Weight Industrials ETF | 8.25% | 7.50% | 13.75% | 8.32% |
S&P 500 Equal Weight Index Industrials | 8.89% | 7.99% | 14.30% | 8.87% |
S&P 500 Index | 4.51% | 8.84% | 13.57% | 6.78% |
The returns presented above do not reflect the effect of taxes. Index returns represent total returns. Performance displayed represents past performance, which is no guarantee of future results.
26 | GUGGENHEIM ETFs ANNUAL REPORT |
PORTFOLIO SUMMARY (Unaudited) | October 31, 2016 |
Guggenheim S&P 500® Equal Weight Industrials ETF
Holdings Diversification (Market Exposure as % of Net Assets)
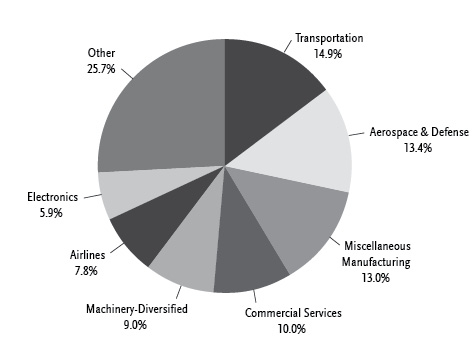
“Holdings Diversification (Market Exposure as % of Net Assets)” excludes any temporary cash investments.
Ten Largest Holdings | (% of Total Net Assets) |
Quanta Services, Inc. | 1.7% |
Boeing Co. | 1.6% |
Delta Air Lines, Inc. | 1.6% |
Northrop Grumman Corp. | 1.6% |
Cummins, Inc. | 1.6% |
CSX Corp. | 1.6% |
FedEx Corp. | 1.6% |
Deere & Co. | 1.6% |
Southwest Airlines Co. | 1.6% |
United Continental Holdings, Inc. | 1.6% |
Top Ten Total | 16.1% |
“Ten Largest Holdings” excludes any temporary cash investments. | |
GUGGENHEIM ETFs ANNUAL REPORT | 27 |
MANAGER'S ANALYSIS (Unaudited) | October 31, 2016 |
Guggenheim S&P 500® Equal Weight Materials ETF
For the one-year period ended October 31, 2016, Guggenheim S&P 500® Equal Weight Materials ETF (“RTM”) returned 7.29% compared with the 7.80% return of the benchmark, the S&P 500® Equal Weight Index Materials. RTM achieved over 99% correlation to its benchmark on a daily basis.
The return of the cap-weighted S&P 500® Index was 4.51%.
The Metals & Mining, Construction Materials, and Containers & Packaging industries were the largest contributors to the Fund’s return. The Chemicals and Semiconductors & Semiconductors Equipment industries was the only detractor from return.
Newmont Mining Corp., Airgas, Inc., and Freeport-McMoRan, Inc., contributed the most to the Fund’s return. CF Industries Holdings, Inc., Mosaic Co., and LyondellBasell Industries NV detracted the most from the Fund’s return.
Cumulative Fund Performance: November 1, 2006 – October 31, 2016
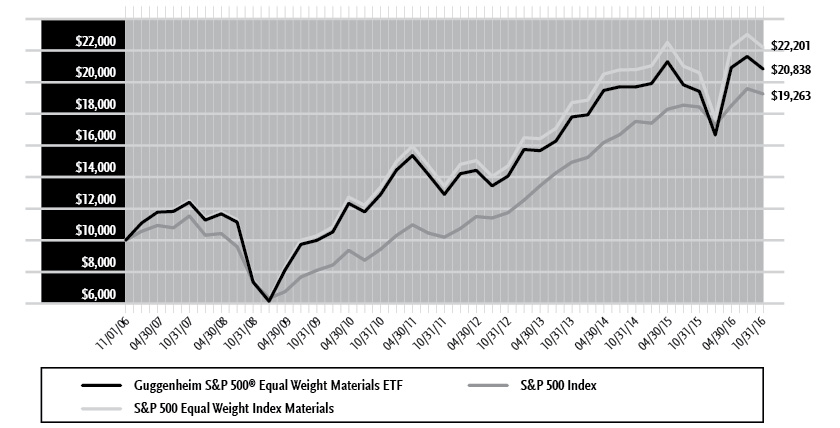
AVERAGE ANNUAL TOTAL RETURNS FOR THE PERIOD ENDED OCTOBER 31, 2016 | ||||
One Year | Three Year | Five Year | Since Inception | |
Guggenheim S&P 500® Equal Weight Materials ETF | 7.29% | 5.39% | 10.06% | 7.62% |
S&P 500 Equal Weight Index Materials | 7.80% | 5.83% | 10.58% | 8.31% |
S&P 500 Index | 4.51% | 8.84% | 13.57% | 6.78% |
The returns presented above do not reflect the effect of taxes. Index returns represent total returns. Performance displayed represents past performance, which is no guarantee of future results.
28 | GUGGENHEIM ETFs ANNUAL REPORT |
PORTFOLIO SUMMARY (Unaudited) | October 31, 2016 |
Guggenheim S&P 500® Equal Weight Materials ETF
Holdings Diversification (Market Exposure as % of Net Assets)
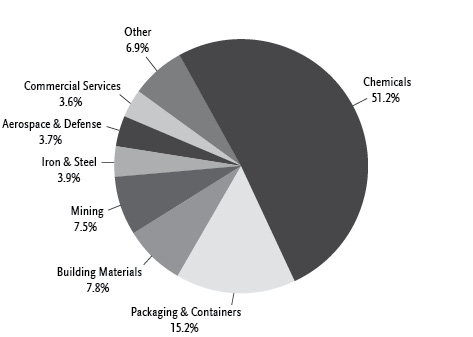
“Holdings Diversification (Market Exposure as % of Net Assets)” excludes any temporary cash investments.
Ten Largest Holdings | (% of Total Net Assets) |
Eastman Chemical Co. | 4.1% |
Owens-Illinois, Inc. | 4.1% |
Freeport-McMoRan, Inc. | 4.0% |
Albemarle Corp. | 4.0% |
Martin Marietta Materials, Inc. | 3.9% |
Vulcan Materials Co. | 3.9% |
FMC Corp. | 3.9% |
LyondellBasell Industries N.V. — Class A | 3.9% |
Nucor Corp. | 3.9% |
Dow Chemical Co. | 3.7% |
Top Ten Total | 39.4% |
“Ten Largest Holdings” excludes any temporary cash investments. | |
GUGGENHEIM ETFs ANNUAL REPORT | 29 |
MANAGER'S ANALYSIS (Unaudited) | October 31, 2016 |
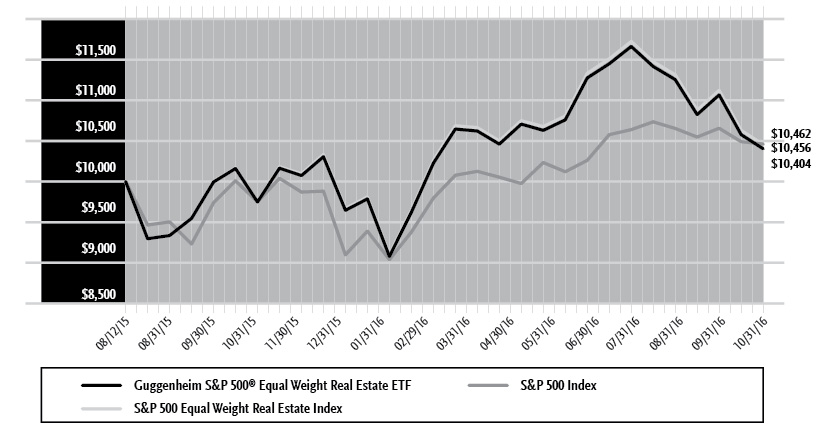
Guggenheim S&P 500® Equal Weight Real Estate ETF
For the one-year period ended October 31, 2016, Guggenheim S&P 500® Equal Weight Real Estate ETF (“EWRE”) returned 2.39%, compared with its benchmark, the S&P 500® Equal Weight Real Estate Index, which returned 2.82%.
The return of the cap-weighted S&P 500® Index was 4.51%.
The Fund was launched on August 12, 2015, shortly after S&P Dow Jones Indices launched the S&P 500 Equal Weight Real Estate Index. As a reflection of the rising importance of real estate as an asset class, on August 31, 2016, real estate was removed from the Financials sector and elevated from its "industry group" status with the Global Industry Classification Standard (GICS®) Financials sector to its own sector category. As of that date, REITs made up about 20% of the market capitalization of the Financials sector.
To reflect the removal of real estate from the Financials sector and subsequent elevation to its own sector status, on September 16, 2016, Guggenheim S&P 500® Equal Weight Financials ETF (“RYF”) replaced its real estate holdings with shares of EWRE. After market close on September 16, RYF made an in-kind distribution of 0.50 shares of EWRE for each share of RYF owned, plus a small amount of cash for fractional shares.
The Specialized REITs, Health Care REITs, and Industrials REITs were the largest contributors to the Fund’s return. Real Estate Services, Office REITs, and Hotel & Resorts REITs were the largest detractors from return.
Ventas, Inc., Realty Income Corp., and Equinix, Inc. contributed the most to the Fund’s return. CBRE Group, Inc.—Class A, SL Green Realty Corp., and Extra Space Storage, Inc. detracted the most from the Fund’s return.
Cumulative Fund Performance: August 12, 2015 – October 31, 2016
30 | GUGGENHEIM ETFs ANNUAL REPORT |
MANAGER'S ANALYSIS (Unaudited)(concluded) | October 31, 2016 |
AVERAGE ANNUAL TOTAL RETURNS FOR THE PERIOD ENDED OCTOBER 31, 2016 | ||
One Year | Since Inception | |
Guggenheim S&P 500® Equal Weight Real Estate ETF | 2.39% | 3.31% |
S&P 500 Equal Weight Real Estate Index | 2.82% | 3.73% |
S&P 500 Index | 4.51% | 3.77% |
The returns presented above do not reflect the effect of taxes. Index returns represent total returns. Performance displayed represents past performance, which is no guarantee of future results.
GUGGENHEIM ETFs ANNUAL REPORT | 31 |
PORTFOLIO SUMMARY (Unaudited) | October 31, 2016 |
Guggenheim S&P 500® Equal Weight Real Estate ETF
Holdings Diversification (Market Exposure as % of Net Assets)
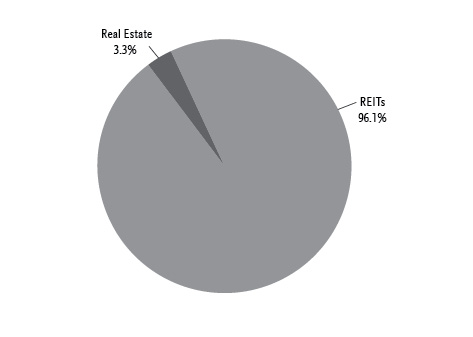
“Holdings Diversification (Market Exposure as % of Net Assets)” excludes any temporary cash investments.
Ten Largest Holdings | (% of Total Net Assets) |
American Tower Corp. — Class A | 4.0% |
Apartment Investment & Management Co. — Class A | 3.9% |
Prologis, Inc. | 3.8% |
Equinix, Inc. | 3.8% |
Ventas, Inc. | 3.7% |
UDR, Inc. | 3.7% |
Weyerhaeuser Co. | 3.7% |
AvalonBay Communities, Inc. | 3.7% |
Crown Castle International Corp. | 3.7% |
Essex Property Trust, Inc. | 3.6% |
Top Ten Total | 37.6% |
“Ten Largest Holdings” excludes any temporary cash investments. | |
32 | GUGGENHEIM ETFs ANNUAL REPORT |
MANAGER'S ANALYSIS (Unaudited) | October 31, 2016 |
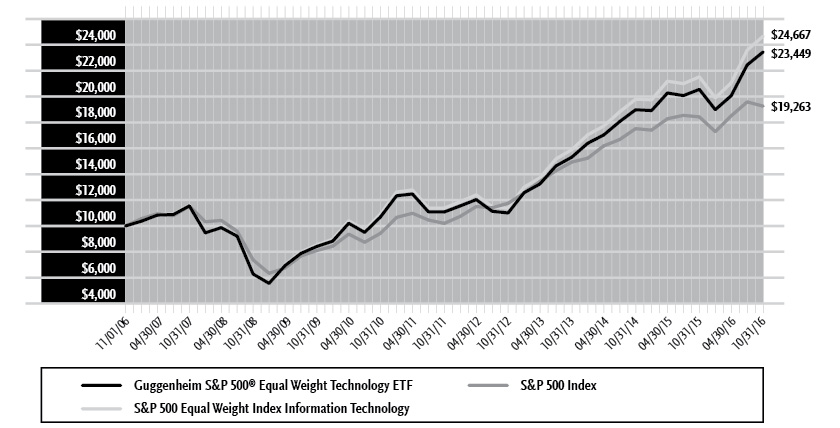
Guggenheim S&P 500® Equal Weight Technology ETF
For the one-year period ended October 31, 2016, Guggenheim S&P 500® Equal Weight Technology ETF (“RYT”) returned 14.06% compared with its benchmark, the S&P 500® Equal Weight Index Information Technology, which returned 14.92%. RYT achieved over 99% correlation to its benchmark on a daily basis.
The return of the cap-weighted S&P 500® Index was 4.51%.
The Semiconductors & Semiconductor Equipment, Software, and Internet Software & Services industries were the largest contributors to the Fund’s return. Electronic Equipment & Instruments was the only detractor from return; Consumer Finance and IT Services industries contributed the least to return.
NVIDIA Corp., Applied Materials, Inc., and Hewlett Packard Enterprise Co. contributed the most to the Fund’s return. Alliance Data Systems Corp., Cognizant Technology Solutions Corp.—Class A, and Juniper Networks, Inc. detracted the most from the Fund’s return.
Cumulative Fund Performance: November 1, 2006 – October 31, 2016
AVERAGE ANNUAL TOTAL RETURNS FOR THE PERIOD ENDED OCTOBER 31, 2016 | ||||
One Year | Three Year | Five Year | Since Inception | |
Guggenheim S&P 500® Equal Weight Technology ETF | 14.06% | 15.25% | 16.18% | 8.90% |
S&P 500 Equal Weight Index Information Technology | 14.92% | 15.79% | 16.75% | 9.45% |
S&P 500 Index | 4.51% | 8.84% | 13.57% | 6.78% |
The returns presented above do not reflect the effect of taxes. Index returns represent total returns. Performance displayed represents past performance, which is no guarantee of future results.
GUGGENHEIM ETFs ANNUAL REPORT | 33 |
PORTFOLIO SUMMARY (Unaudited) | October 31, 2016 |
Guggenheim S&P 500® Equal Weight Technology ETF
Holdings Diversification (Market Exposure as % of Net Assets)
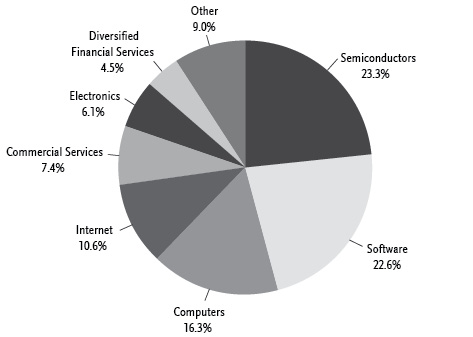
“Holdings Diversification (Market Exposure as % of Net Assets)” excludes any temporary cash investments.
Ten Largest Holdings | (% of Total Net Assets) |
Akamai Technologies, Inc. | 1.9% |
NVIDIA Corp. | 1.7% |
F5 Networks, Inc. | 1.7% |
Skyworks Solutions, Inc. | 1.7% |
Juniper Networks, Inc. | 1.7% |
QUALCOMM, Inc. | 1.7% |
Western Digital Corp. | 1.7% |
VeriSign, Inc. | 1.6% |
Apple, Inc. | 1.6% |
PayPal Holdings, Inc. | 1.6% |
Top Ten Total | 16.9% |
“Ten Largest Holdings” excludes any temporary cash investments. | |
34 | GUGGENHEIM ETFs ANNUAL REPORT |
MANAGER'S ANALYSIS (Unaudited) | October 31, 2016 |
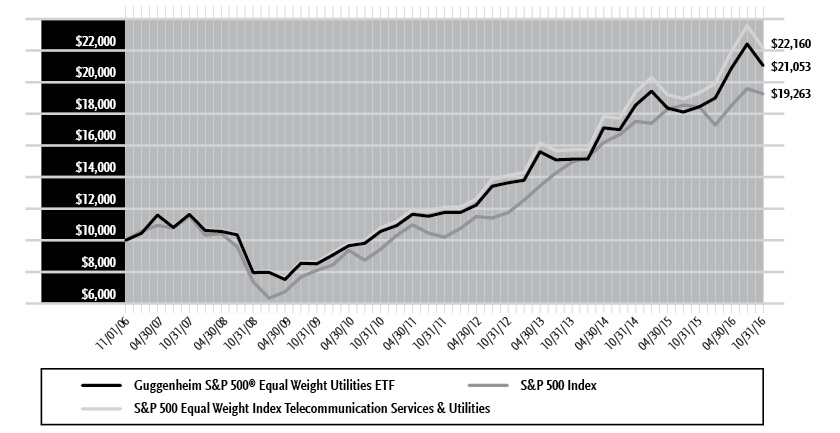
Guggenheim S&P 500® Equal Weight Utilities ETF
For the one-year period ended October 31, 2016, Guggenheim S&P 500® Equal Weight Utilities ETF (“RYU”) returned 14.13% while its benchmark, the S&P 500® Equal Weight Index Telecommunication Services & Utilities, returned 14.61%. RYU had a 96% correlation to its benchmark on a daily basis.
The return of the cap-weighted S&P 500® Index was 4.51%.
The industries for Electric Utilities, Multi-Utilities, and Diversified Telecommunication Services were the largest contributors to the Fund’s return. The Independent Power & Renewable Electricity Producers, Gas Utilities, and Water Utilities industries contributed the least; there were no detractors from return.
NextEra Energy, Inc., Exelon Corp., and CenterPoint Energy, Inc. contributed the most to the Fund’s return. Frontier Communications Corp., NRG Energy, Inc., and Alliant Energy Corp. detracted the most from the Fund’s return.
Cumulative Fund Performance: November 1, 2006 – October 31, 2016
AVERAGE ANNUAL TOTAL RETURNS FOR THE PERIOD ENDED OCTOBER 31, 2016 | ||||
One Year | Three Year | Five Year | Since Inception | |
Guggenheim S&P 500® Equal Weight Utilities ETF | 14.13% | 11.64% | 12.35% | 7.73% |
S&P 500 Equal Weight Index Telecommunication Services & Utilities | 14.61% | 12.11% | 12.90% | 8.28% |
S&P 500 Index | 4.51% | 8.84% | 13.57% | 6.78% |
The returns presented above do not reflect the effect of taxes. Index returns represent total returns. Performance displayed represents past performance, which is no guarantee of future results.
GUGGENHEIM ETFs ANNUAL REPORT | 35 |
PORTFOLIO SUMMARY (Unaudited) | October 31, 2016 |
Guggenheim S&P 500® Equal Weight Utilities ETF
Holdings Diversification (Market Exposure as % of Net Assets)
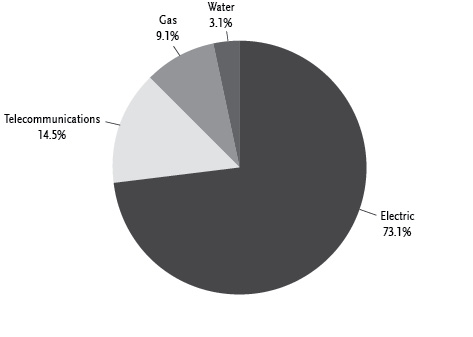
“Holdings Diversification (Market Exposure as % of Net Assets)” excludes any temporary cash investments.
Ten Largest Holdings | (% of Total Net Assets) |
Level 3 Communications, Inc. | 3.5% |
SCANA Corp. | 3.2% |
NextEra Energy, Inc. | 3.2% |
DTE Energy Co. | 3.2% |
FirstEnergy Corp. | 3.1% |
Sempra Energy | 3.1% |
Ameren Corp. | 3.1% |
Dominion Resources, Inc. | 3.1% |
Consolidated Edison, Inc. | 3.1% |
Eversource Energy | 3.1% |
Top Ten Total | 31.7% |
“Ten Largest Holdings” excludes any temporary cash investments. | |
36 | GUGGENHEIM ETFs ANNUAL REPORT |
SCHEDULE OF INVESTMENTS | October 31, 2016 |
Guggenheim MSCI Emerging Markets Equal Country Weight ETF | |
Shares | Value | |||||||
COMMON STOCKS† - 91.7% | ||||||||
Financial - 36.2% | ||||||||
Commercial International Bank Egypt SAE GDR | 74,310 | $ | 328,449 | |||||
Credicorp Ltd. | 2,047 | 304,347 | ||||||
OTP Bank plc | 9,934 | 279,240 | ||||||
Komercni Banka AS | 4,915 | 179,787 | ||||||
Qatar National Bank SAQ | 3,162 | 138,930 | ||||||
Bancolombia S.A. ADR | 2,845 | 108,907 | ||||||
Emaar Properties PJSC | 52,203 | 99,060 | ||||||
Grupo de Inversiones Suramericana S.A. | 5,907 | 76,457 | ||||||
Bank Central Asia Tbk PT | 62,000 | 73,770 | ||||||
Powszechna Kasa Oszczednosci Bank Polski S.A. | 10,356 | 72,305 | ||||||
Bank Rakyat Indonesia Persero Tbk PT | 73,200 | 68,443 | ||||||
Public Bank BHD | 13,600 | 64,385 | ||||||
Masraf Al Rayan QSC | 6,515 | 61,902 | ||||||
Banco Bradesco S.A. ADR | 5,887 | 61,284 | ||||||
Bank Mandiri Persero Tbk PT | 67,200 | 59,099 | ||||||
Ayala Land, Inc. | 77,385 | 57,933 | ||||||
Turkiye Garanti Bankasi AS ADR | 20,793 | 57,285 | ||||||
Siam Commercial Bank PCL | 13,522 | 55,444 | ||||||
Akbank TAS ADR | 10,136 | 54,278 | ||||||
Grupo Financiero Banorte SAB de CV — Class O | 7,818 | 46,270 | ||||||
Banco de Chile ADR1 | 630 | 45,662 | ||||||
Ayala Corp. | 2,640 | 45,525 | ||||||
Bank Pekao S.A. | 1,452 | 44,657 | ||||||
Malayan Banking BHD | 23,600 | 44,443 | ||||||
BDO Unibank, Inc. | 19,040 | 44,354 | ||||||
SM Prime Holdings, Inc. | 79,200 | 43,998 | ||||||
China Construction Bank Corp. ADR | 2,905 | 42,282 | ||||||
Powszechny Zaklad Ubezpieczen S.A. | 6,080 | 42,079 | ||||||
Banco Santander Chile ADR | 1,840 | 42,044 | ||||||
First Gulf Bank PJSC | 13,377 | 41,882 | ||||||
Bank Zachodni WBK S.A. | 514 | 41,398 | ||||||
Abu Dhabi Commercial Bank PJSC | 24,232 | 40,507 | ||||||
Ezdan Holding Group QSC | 9,113 | 39,289 | ||||||
Qatar Islamic Bank SAQ | 1,376 | 38,693 | ||||||
Industrial & Commercial Bank of China Ltd. ADR1 | 3,079 | 36,732 | ||||||
Qatar Insurance Company SAQ | 1,509 | 36,300 | ||||||
Aldar Properties PJSC | 50,027 | 35,956 | ||||||
Alpha Bank AE* | 21,008 | 35,925 | ||||||
Corporation Financiera Colombiana S.A. | 2,752 | 34,243 | ||||||
FirstRand Ltd.1 | 7,996 | 28,657 | ||||||
Bank of China Ltd. ADR1 | 2,544 | 28,442 | ||||||
CIMB Group Holdings BHD | 23,600 | 28,298 | ||||||
Doha Bank QSC | 2,754 | 27,528 | ||||||
VTB Bank PJSC GDR | 13,066 | 27,360 | ||||||
Turkiye Is Bankasi — Class C | 16,780 | 27,203 | ||||||
Standard Bank Group Ltd. ADR | 2,552 | 26,975 | ||||||
Emaar Malls PJSC | 38,108 | 26,663 | ||||||
Banco Bradesco ADR | 2,594 | 25,110 | ||||||
National Bank of Abu Dhabi PJSC | 10,081 | 24,289 | ||||||
Bank Negara Indonesia Persero Tbk PT | 55,600 | 23,756 | ||||||
mBank S.A.* | 264 | 23,731 | ||||||
Central Pattana PCL | 14,714 | 23,439 | ||||||
Turkiye Halk Bankasi AS | 7,534 | 22,870 | ||||||
Emlak Konut Gayrimenkul Yatirim Ortakligi AS | 22,220 | 22,675 | ||||||
Shinhan Financial Group Company Ltd. ADR | 548 | 21,176 | ||||||
Dubai Islamic Bank PJSC | 14,676 | 20,937 | ||||||
Ping An Insurance Group Company of China Ltd. ADR1 | 1,948 | 20,658 | ||||||
Banco do Brasil S.A. ADR | 2,242 | 20,649 | ||||||
Eurobank Ergasias S.A.* | 34,983 | 20,555 | ||||||
Banco de Credito e Inversiones | 393 | 20,196 | ||||||
Banco Santander Brasil S.A. ADR1 | 2,400 | 19,632 | ||||||
BB Seguridade Participacoes S.A. ADR | 1,961 | 19,541 | ||||||
Piraeus Bank S.A.* | 116,015 | 19,204 | ||||||
KB Financial Group, Inc. ADR | 512 | 18,934 | ||||||
China Overseas Land & Investment Ltd. | 6,000 | 18,530 | ||||||
Bangkok Bank PCL | 3,941 | 17,961 | ||||||
Nedbank Group Ltd. | 1,088 | 17,794 | ||||||
Krung Thai Bank PCL | 35,197 | 17,298 | ||||||
RMB Holdings Ltd. | 3,832 | 16,917 | ||||||
Barclays Africa Group Ltd. | 1,386 | 16,074 | ||||||
China Life Insurance Company Ltd. ADR1 | 1,261 | 15,574 | ||||||
Cathay Financial Holding Company Ltd. | 12,000 | 15,572 | ||||||
Redefine Properties Ltd. | 17,860 | 15,340 | ||||||
Hana Financial Group, Inc. | 528 | 15,135 | ||||||
National Bank of Greece S.A. ADR* | 72,530 | 14,919 | ||||||
Growthpoint Properties Ltd. | 7,760 | 14,469 | ||||||
Agricultural Bank of China Ltd. ADR | 1,376 | 14,407 | ||||||
Fibra Uno Administracion S.A. de CV | 7,358 | 14,112 | ||||||
Dubai Financial Market PJSC | 43,720 | 13,688 | ||||||
PICC Property & Casualty Company Ltd. — Class H | 8,000 | 12,957 | ||||||
AMMB Holdings BHD | 12,800 | 12,815 | ||||||
Turkiye Vakiflar Bankasi TAO — Class D | 8,660 | 12,809 | ||||||
Hong Leong Bank BHD | 4,000 | 12,701 | ||||||
CTBC Financial Holding Company Ltd. | 23,349 | 12,578 | ||||||
Sanlam Ltd. ADR | 1,268 | 12,338 | ||||||
Shanghai Industrial Holdings Ltd. | 4,000 | 12,250 | ||||||
Grupo Financiero Santander Mexico SAB de CV — Class B | 6,657 | 12,109 | ||||||
Grupo Financiero Inbursa SAB de CV — Class O | 7,358 | 11,999 | ||||||
Yapi ve Kredi Bankasi AS* | 10,032 | 11,987 | ||||||
Taiwan Cooperative Financial Holding Company Ltd. | 26,964 | 11,834 | ||||||
Taiwan Business Bank | 45,066 | 11,396 | ||||||
Fubon Financial Holding Company Ltd. | 8,000 | 11,357 | ||||||
Mega Financial Holding Company Ltd. | 16,000 | 10,951 | ||||||
E.Sun Financial Holding Company Ltd. | 19,130 | 10,881 | ||||||
Shin Kong Financial Holding Company Ltd.* | 49,959 | 10,844 | ||||||
China Evergrande Group1 | 16,000 | 10,584 | ||||||
Hyundai Marine & Fire Insurance Company Ltd. | 332 | 10,257 | ||||||
SEE NOTES TO FINANCIAL STATEMENTS. | GUGGENHEIM ETFs ANNUAL REPORT | 37 |
SCHEDULE OF INVESTMENTS (continued) | October 31, 2016 |
Guggenheim MSCI Emerging Markets Equal Country Weight ETF | |
Shares | Value | |||||||
Samsung Fire & Marine Insurance Company Ltd. | 40 | $ | 10,190 | |||||
China Merchants Bank Company Ltd. — Class H | 4,000 | 9,759 | ||||||
First Financial Holding Company Ltd. | 17,806 | 9,338 | ||||||
Discovery Ltd. | 1,060 | 9,059 | ||||||
China Life Insurance Company Ltd. | 9,152 | 8,454 | ||||||
Country Garden Holdings Company Ltd.1 | 16,000 | 8,335 | ||||||
Alior Bank S.A.* | 694 | 8,314 | ||||||
China Resources Land Ltd. | 3,283 | 8,188 | ||||||
SinoPac Financial Holdings Company Ltd. | 27,054 | 7,810 | ||||||
Yuanta Financial Holding Company Ltd. | 20,524 | 7,674 | ||||||
China Smarter Energy Group Holdings Ltd.* | 64,777 | 7,267 | ||||||
Hua Nan Financial Holdings Company Ltd. | 13,534 | 6,883 | ||||||
Brait SE* | 1,005 | 6,678 | ||||||
Samsung Securities Company Ltd. | 216 | 6,522 | ||||||
Bank of Communications Company Ltd. — Class H | 8,000 | 6,097 | ||||||
China Development Financial Holding Corp. | 24,000 | 6,016 | ||||||
China Pacific Insurance Group Company Ltd. — Class H | 1,600 | 5,787 | ||||||
CITIC Ltd. | 4,000 | 5,746 | ||||||
NH Investment & Securities Company Ltd. | 636 | 5,614 | ||||||
Longfor Properties Company Ltd. | 4,000 | 5,313 | ||||||
China CITIC Bank Corporation Ltd. — Class H | 8,000 | 5,168 | ||||||
Mirae Asset Daewoo Company Ltd. | 736 | 4,985 | ||||||
Total Financial | 4,221,656 | |||||||
Communications - 10.9% | ||||||||
Emirates Telecommunications Group Company PJSC | 25,818 | 132,496 | ||||||
Naspers Ltd. ADR | 6,760 | 114,244 | ||||||
Telekomunikasi Indonesia Persero Tbk PT | 323,200 | 104,529 | ||||||
Global Telecom Holding SAE GDR* | 47,804 | 97,997 | ||||||
Tencent Holdings Ltd. ADR | 3,219 | 85,400 | ||||||
O2 Czech Republic AS | 8,630 | 79,077 | ||||||
Hellenic Telecommunications Organization S.A. | 8,592 | 78,645 | ||||||
America Movil SAB de CV — Class L ADR1 | 4,401 | 57,829 | ||||||
China Mobile Ltd. ADR | 746 | 42,843 | ||||||
Ooredoo QSC | 1,548 | 41,234 | ||||||
Advanced Info Service PCL | 8,748 | 38,369 | ||||||
Grupo Televisa SAB ADR | 1,430 | 35,078 | ||||||
PLDT, Inc. ADR | 901 | 28,652 | ||||||
Alibaba Group Holding Ltd. ADR*,1 | 259 | 26,338 | ||||||
Turkcell Iletisim Hizmetleri AS ADR* | 3,112 | 24,958 | ||||||
NAVER Corp. | 32 | 23,967 | ||||||
MTN Group Ltd. ADR | 2,711 | 23,369 | ||||||
DiGi.com BHD | 17,600 | 21,103 | ||||||
Chunghwa Telecom Company Ltd. ADR | 564 | 19,261 | ||||||
Telefonica Brasil S.A. ADR | 1,261 | 18,158 | ||||||
Axiata Group BHD | 14,800 | 17,358 | ||||||
Orange Polska S.A. | 10,336 | 14,706 | ||||||
Rostelecom PJSC ADR | 1,981 | 14,600 | ||||||
Baidu, Inc. ADR* | 80 | 14,149 | ||||||
Cyfrowy Polsat S.A.* | 2,289 | 14,086 | ||||||
Maxis BHD | 9,600 | 13,639 | ||||||
Vodacom Group Ltd. ADR | 1,240 | 13,442 | ||||||
True Corporation PCL | 68,614 | 13,234 | ||||||
Telekom Malaysia BHD | 7,200 | 11,225 | ||||||
Sistema PJSC FC GDR | 1,312 | 9,801 | ||||||
China Unicom Hong Kong Ltd. ADR1 | 734 | 8,602 | ||||||
China Telecom Corporation Ltd. ADR | 156 | 8,042 | ||||||
MegaFon OAO GDR | 792 | 7,548 | ||||||
TIM Participacoes S.A. ADR | 484 | 6,703 | ||||||
Samsung SDI Company Ltd. | 68 | 5,604 | ||||||
Total Communications | 1,266,286 | |||||||
Consumer, Non-cyclical - 8.6% | ||||||||
Richter Gedeon Nyrt | 6,302 | 135,549 | ||||||
Ambev S.A. ADR | 10,222 | 60,310 | ||||||
Fomento Economico Mexicano SAB de CV ADR | 573 | 54,819 | ||||||
JG Summit Holdings, Inc. | 31,000 | 48,654 | ||||||
Cencosud S.A. | 14,208 | 46,311 | ||||||
DP World Ltd. | 2,466 | 44,265 | ||||||
Magnit PJSC GDR | 1,096 | 43,500 | ||||||
Universal Robina Corp. | 10,640 | 39,991 | ||||||
Unilever Indonesia Tbk PT | 10,800 | 36,813 | ||||||
BIM Birlesik Magazalar AS | 2,041 | 33,220 | ||||||
Cielo S.A. ADR | 2,498 | 25,455 | ||||||
Shoprite Holdings Ltd. ADR1 | 1,484 | 21,948 | ||||||
Bangkok Dusit Medical Services PCL — Class F | 33,532 | 21,845 | ||||||
BRF S.A. ADR | 1,300 | 21,736 | ||||||
Charoen Pokphand Foods PCL | 23,923 | 21,532 | ||||||
Kalbe Farma Tbk PT | 156,400 | 20,857 | ||||||
IHH Healthcare BHD | 13,200 | 20,138 | ||||||
Anadolu Efes Biracilik Ve Malt Sanayii AS | 3,276 | 20,006 | ||||||
Kroton Educational S.A. ADR | 3,947 | 19,814 | ||||||
Cia Cervecerias Unidas S.A. ADR | 912 | 19,608 | ||||||
Charoen Pokphand Indonesia Tbk PT | 66,000 | 18,716 | ||||||
IOI Corporation BHD | 15,600 | 16,734 | ||||||
Aspen Pharmacare Holdings Ltd. | 756 | 16,470 | ||||||
Tiger Brands Ltd. | 568 | 16,177 | ||||||
Uni-President Enterprises Corp. | 8,320 | 16,109 | ||||||
Grupo Bimbo SAB de CV | 5,518 | 14,937 | ||||||
Gruma SAB de CV — Class B | 1,000 | 13,944 | ||||||
Kuala Lumpur Kepong BHD | 2,400 | 13,708 | ||||||
Netcare Ltd. | 5,220 | 13,408 | ||||||
Arca Continental SAB de CV | 2,100 | 13,133 | ||||||
KT&G Corp. | 132 | 13,036 | ||||||
Coca-Cola Femsa SAB de CV | 1,722 | 13,000 | ||||||
Ulker Biskuvi Sanayi AS | 2,000 | 12,400 | ||||||
Kimberly-Clark de Mexico SAB de CV — Class A | 5,302 | 11,491 | ||||||
Mediclinic International plc | 972 | 10,731 | ||||||
Eurocash S.A. | 1,035 | 10,455 | ||||||
Bidvest Group Ltd. | 724 | 8,990 | ||||||
JBS S.A ADR1 | 1,071 | 6,560 | ||||||
38 | GUGGENHEIM ETFs ANNUAL REPORT | SEE NOTES TO FINANCIAL STATEMENTS. |
SCHEDULE OF INVESTMENTS (continued) | October 31, 2016 |
Guggenheim MSCI Emerging Markets Equal Country Weight ETF | |
Shares | Value | |||||||
Want Want China Holdings Ltd.1 | 8,000 | $ | 4,880 | |||||
Total Consumer, Non-cyclical | 1,001,250 | |||||||
Energy - 7.5% | ||||||||
MOL Hungarian Oil & Gas plc | 1,583 | 101,921 | ||||||
Gazprom PJSC ADR | 20,367 | 87,985 | ||||||
LUKOIL PJSC ADR | 1,790 | 87,263 | ||||||
PTT PCL | 7,967 | 78,765 | ||||||
Polski Koncern Naftowy ORLEN S.A. | 3,408 | 67,366 | ||||||
Ecopetrol S.A. ADR*,1 | 6,161 | 53,539 | ||||||
Novatek OJSC GDR | 412 | 44,043 | ||||||
Petroleo Brasileiro S.A. ADR* | 3,334 | 38,908 | ||||||
Polskie Gornictwo Naftowe i Gazownictwo S.A. | 26,948 | 34,371 | ||||||
Tatneft PJSC ADR | 856 | 28,650 | ||||||
Rosneft PJSC GDR | 5,240 | 28,558 | ||||||
Ultrapar Participacoes S.A. ADR | 1,171 | 26,465 | ||||||
PTT Exploration & Production PCL | 11,122 | 26,456 | ||||||
Tupras Turkiye Petrol Rafinerileri AS | 1,225 | 24,943 | ||||||
Sasol Ltd. ADR | 874 | 24,044 | ||||||
China Petroleum & Chemical Corp. ADR | 323 | 23,392 | ||||||
CNOOC Ltd. ADR1 | 164 | 20,579 | ||||||
Surgutneftegas OJSC ADR | 4,536 | 19,496 | ||||||
Petronas Gas BHD | 3,600 | 18,880 | ||||||
PetroChina Company Ltd. ADR | 193 | 13,072 | ||||||
GS Holdings Corp. | 280 | 12,504 | ||||||
SK Innovation Company Ltd. | 88 | 11,651 | ||||||
Total Energy | 872,851 | |||||||
Consumer, Cyclical - 6.9% | ||||||||
SACI Falabella | 10,416 | 81,775 | ||||||
Astra International Tbk PT | 123,200 | 77,661 | ||||||
OPAP S.A. | 8,204 | 69,877 | ||||||
CP ALL PCL | 38,361 | 66,588 | ||||||
JUMBO S.A. | 3,624 | 51,446 | ||||||
SM Investments Corp. | 3,060 | 42,465 | ||||||
Wal-Mart de Mexico SAB de CV | 16,555 | 35,201 | ||||||
Latam Airlines Group S.A. ADR* | 3,632 | 34,831 | ||||||
FF Group* | 1,216 | 29,086 | ||||||
Steinhoff International Holdings N.V. | 5,092 | 27,491 | ||||||
Jollibee Foods Corp. | 5,480 | 26,935 | ||||||
Hyundai Motor Co. | 168 | 20,555 | ||||||
Arcelik AS | 3,000 | 19,803 | ||||||
Woolworths Holdings Limited/South Africa | 3,378 | 19,570 | ||||||
Genting Malaysia BHD | 17,200 | 19,517 | ||||||
Matahari Department Store Tbk PT | 14,000 | 19,340 | ||||||
Hyundai Mobis Company Ltd. | 80 | 19,157 | ||||||
Genting BHD | 10,000 | 18,689 | ||||||
LPP S.A. | 10 | 14,940 | ||||||
Kia Motors Corp. | 416 | 14,797 | ||||||
Turk Hava Yollari AO* | 7,376 | 12,958 | ||||||
Bid Corporation Ltd. | 724 | 12,767 | ||||||
Mr Price Group Ltd. | 802 | 9,144 | ||||||
Dongfeng Motor Group Company Ltd. — Class H | 8,000 | 8,325 | ||||||
Truworths International Ltd. | 1,563 | 8,283 | ||||||
Cheng Shin Rubber Industry Company Ltd. | 4,000 | 8,150 | ||||||
Samsung C&T Corp. | 56 | 7,904 | ||||||
LG Corp. | 144 | 7,714 | ||||||
Kangwon Land, Inc. | 200 | 6,633 | ||||||
Far Eastern New Century Corp. | 8,160 | 6,322 | ||||||
Great Wall Motor Company Ltd. — Class H | 6,000 | 5,857 | ||||||
Shinsegae, Inc. | 36 | 5,852 | ||||||
Total Consumer, Cyclical | 809,633 | |||||||
Basic Materials - 6.4% | ||||||||
Southern Copper Corp. | 3,929 | 111,544 | ||||||
Cia de Minas Buenaventura S.A.A. ADR* | 6,551 | 87,062 | ||||||
Industries Qatar QSC | 2,401 | 67,252 | ||||||
KGHM Polska Miedz S.A. | 1,974 | 35,650 | ||||||
MMC Norilsk Nickel PJSC ADR | 2,316 | 34,926 | ||||||
Empresas CMPC S.A. | 13,792 | 29,872 | ||||||
Sociedad Quimica y Minera de Chile S.A. ADR | 1,012 | 29,612 | ||||||
Grupo Mexico SAB de CV | 11,956 | 29,605 | ||||||
PTT Global Chemical PCL | 15,511 | 26,592 | ||||||
Vale S.A. ADR1 | 3,688 | 25,521 | ||||||
Braskem S.A. ADR1 | 1,339 | 23,767 | ||||||
Formosa Plastics Corp. | 8,000 | 21,649 | ||||||
Eregli Demir ve Celik Fabrikalari TAS | 15,908 | 21,578 | ||||||
Petronas Chemicals Group BHD | 12,800 | 21,359 | ||||||
Severstal PJSC GDR | 1,456 | 20,530 | ||||||
Industrias Penoles SAB de CV | 800 | 19,498 | ||||||
POSCO ADR | 332 | 17,247 | ||||||
Nan Ya Plastics Corp. | 8,000 | 16,655 | ||||||
Fibria Celulose S.A. ADR | 1,879 | 14,994 | ||||||
AngloGold Ashanti Ltd. ADR* | 1,059 | 14,551 | ||||||
LG Chem Ltd. | 56 | 12,064 | ||||||
Formosa Chemicals & Fibre Corp. | 4,000 | 11,902 | ||||||
China Steel Corp. | 16,000 | 11,560 | ||||||
Gerdau S.A. ADR | 3,022 | 10,365 | ||||||
Mexichem SAB de CV | 3,810 | 9,157 | ||||||
Grupa Azoty S.A. | 538 | 8,543 | ||||||
Hyundai Steel Co. | 188 | 8,116 | ||||||
Korea Zinc Company Ltd. | 16 | 6,362 | ||||||
Total Basic Materials | 747,533 | |||||||
Utilities - 5.1% | ||||||||
CEZ AS | 10,212 | 192,200 | ||||||
Tenaga Nasional BHD | 13,200 | 45,122 | ||||||
Interconexion Electrica S.A. ESP | 11,415 | 38,061 | ||||||
Enersis Americas S.A. ADR | 4,356 | 37,767 | ||||||
PGE Polska Grupa Energetyczna S.A. | 11,480 | 29,955 | ||||||
Empresa Nacional de Electricidad S.A. ADR* | 1,216 | 25,244 | ||||||
Aboitiz Power Corp. | 26,000 | 24,672 | ||||||
Enersis Chile S.A. ADR | 4,356 | 21,649 | ||||||
Aguas Andinas S.A. — Class A | 31,616 | 20,842 | ||||||
Colbun S.A. | 94,312 | 20,544 | ||||||
Centrais Eletricas Brasileiras S.A. ADR* | 2,700 | 19,953 | ||||||
Cia de Saneamento Basico do Estado de Sao Paulo ADR | 1,680 | 17,674 | ||||||
Endesa Americas S.A. ADR | 1,216 | 17,474 | ||||||
Korea Electric Power Corp. ADR | 800 | 17,448 | ||||||
SEE NOTES TO FINANCIAL STATEMENTS. | GUGGENHEIM ETFs ANNUAL REPORT | 39 |
SCHEDULE OF INVESTMENTS (continued) | October 31, 2016 |
Guggenheim MSCI Emerging Markets Equal Country Weight ETF | |
Shares | Value | |||||||
Perusahaan Gas Negara Persero Tbk | 82,400 | $ | 16,167 | |||||
CPFL Energia S.A. ADR1 | 982 | 14,926 | ||||||
RusHydro PJSC ADR | 12,033 | 14,680 | ||||||
Cia Energetica de Minas Gerais ADR | 2,782 | 8,402 | ||||||
Energa S.A. | 3,600 | 7,354 | ||||||
Total Utilities | 590,134 | |||||||
Industrial - 4.2% | ||||||||
Grupo Argos S.A. | 8,347 | 54,327 | ||||||
Cementos Argos S.A. | 12,385 | 49,191 | ||||||
Qatar Gas Transport Company Ltd. | 7,000 | 43,462 | ||||||
Titan Cement Company S.A. | 1,702 | 39,498 | ||||||
Airports of Thailand PCL | 3,600 | 39,191 | ||||||
Hon Hai Precision Industry Company Ltd. | 13,860 | 37,464 | ||||||
Cemex SAB de CV ADR*,1 | 4,078 | 35,397 | ||||||
Delta Electronics, Inc. | 4,000 | 21,104 | ||||||
United Tractors Tbk PT | 12,257 | 20,314 | ||||||
Semen Indonesia Persero Tbk PT | 24,000 | 18,118 | ||||||
BTS Group Holdings PCL | 61,960 | 15,137 | ||||||
Indocement Tunggal Prakarsa Tbk PT | 11,600 | 14,624 | ||||||
Gamuda BHD | 12,400 | 14,513 | ||||||
Grupo Aeroportuario del Sureste SAB de CV — Class B | 727 | 11,621 | ||||||
MISC BHD | 6,400 | 11,473 | ||||||
Embraer S.A. ADR | 471 | 10,075 | ||||||
Taiwan Cement Corp. | 8,000 | 9,595 | ||||||
Promotora y Operadora de Infraestructura SAB de CV | 837 | 9,404 | ||||||
Arabtec Holding PJSC* | 25,444 | 9,213 | ||||||
LG Electronics, Inc. | 184 | 7,686 | ||||||
Grupo Aeroportuario del Pacifico SAB de CV ADR | 75 | 7,247 | ||||||
LG Display Company Ltd. ADR1 | 592 | 7,110 | ||||||
China Everbright International Ltd. | 4,000 | 4,797 | ||||||
China Communications Construction Company Ltd. — Class H | 4,000 | 4,405 | ||||||
Total Industrial | 494,966 | |||||||
Technology - 3.5% | ||||||||
Taiwan Semiconductor Manufacturing Company Ltd. ADR | 4,982 | 154,940 | ||||||
Samsung Electronics Company Ltd. GDR | 191 | 134,750 | ||||||
Advanced Semiconductor Engineering, Inc. ADR | 5,328 | 31,169 | ||||||
MediaTek, Inc. | 4,000 | 30,421 | ||||||
SK Hynix, Inc. | 652 | 23,362 | ||||||
United Microelectronics Corp. ADR | 7,000 | 13,300 | ||||||
SK Holdings Company Ltd. | 62 | 12,110 | ||||||
Quanta Computer, Inc. | 4,000 | 8,112 | ||||||
Total Technology | 408,164 | |||||||
Diversified - 2.4% | ||||||||
Empresas COPEC S.A. | 5,152 | 51,761 | ||||||
Siam Cement PCL | 2,800 | 40,003 | ||||||
Aboitiz Equity Ventures, Inc. | 24,000 | 38,660 | ||||||
Haci Omer Sabanci Holding AS | 10,120 | 30,557 | ||||||
KOC Holding AS ADR | 1,440 | 29,851 | ||||||
Sime Darby BHD | 14,400 | 28,113 | ||||||
Remgro Ltd. | 1,120 | 18,608 | ||||||
Alfa SAB de CV — Class A | 8,737 | 13,314 | ||||||
IJM Corporation BHD | 16,800 | 13,216 | ||||||
Grupo Carso SAB de CV | 3,000 | 13,160 | ||||||
CJ Corp. | 56 | 8,540 | ||||||
Total Diversified | 285,783 | |||||||
Total Common Stocks | ||||||||
(Cost $11,096,579) | 10,698,256 | |||||||
PREFERRED STOCKS† - 2.6% | ||||||||
Itau Unibanco Holding S.A. | 7,686 | 91,694 | ||||||
Petroleo Brasileiro S.A.* | 4,591 | 50,776 | ||||||
Grupo Aval Acciones y Valores S.A. | 104,519 | 43,258 | ||||||
Grupo de Inversiones Suramericana | 3,190 | 40,459 | ||||||
Vale S.A. | 5,109 | 32,902 | ||||||
Samsung Electronics Company, Ltd. | 24 | 27,623 | ||||||
Cia Brasileira de Distribuicao | 492 | 9,373 | ||||||
Hyundai Motor Co. | 52 | 4,567 | ||||||
Total Preferred Stocks | ||||||||
(Cost $290,535) | 300,652 | |||||||
EXCHANGE-TRADED FUNDS† - 5.5% | ||||||||
iShares MSCI India ETF | 17,594 | 510,930 | ||||||
VanEck Vectors Egypt Index ETF1 | 3,657 | 136,516 | ||||||
Total Exchange-Traded Funds | ||||||||
(Cost $746,250) | 647,446 | |||||||
SHORT TERM INVESTMENTS† - 0.1% | ||||||||
Federated U.S. Treasury Cash Reserve Fund Institutional Shares, 0.18%2 | 6,439 | 6,439 | ||||||
Total Short Term Investments | ||||||||
(Cost $6,439) | 6,439 | |||||||
Face | ||||||||
SECURITIES LENDING COLLATERAL††,3 - 3.4% | ||||||||
Joint Repurchase Agreements | ||||||||
Citigroup Global Markets, Inc. | $ | 250,000 | 250,000 | |||||
Merrill Lynch, Pierce, Fenner & Smith, Inc. | 145,137 | 145,137 | ||||||
Total Securities Lending Collateral | ||||||||
(Cost $395,137) | 395,137 | |||||||
Total Investments - 103.3% | ||||||||
(Cost $12,534,940) | $ | 12,047,930 | ||||||
Other Assets & Liabilities, net - (3.3)% | (382,065 | ) | ||||||
Total Net Assets - 100.0% | $ | 11,665,865 | ||||||
40 | GUGGENHEIM ETFs ANNUAL REPORT | SEE NOTES TO FINANCIAL STATEMENTS. |
SCHEDULE OF INVESTMENTS (continued) | October 31, 2016 |
Guggenheim MSCI Emerging Markets Equal Country Weight ETF | |
INVESTMENT CONCENTRATION
At October 31, 2016, the investment diversification of the Fund by country was as follows:
Country | % of Total Investments |
Brazil | 6.1% |
Indonesia | 4.9% |
Egypt | 4.8% |
Taiwan, Province of China | 4.8% |
Chile | 4.7% |
China | 4.7% |
Republic of Korea | 4.5% |
Hungary | 4.4% |
India | 4.4% |
South Africa | 4.4% |
Peru | 4.3% |
Thailand | 4.3% |
Colombia | 4.3% |
Qatar | 4.2% |
United Arab Emirates | 4.2% |
Mexico | 4.1% |
Poland | 4.0% |
Russian Federation | 4.0% |
Malaysia | 4.0% |
Czech Republic | 3.9% |
Philippines | 3.8% |
Turkey | 3.8% |
Greece | 3.1% |
Netherlands | 0.2% |
United States | 0.1% |
Total Investments | 100.0% |
* | Non-income producing security. |
† | Value determined based on Level 1 inputs — See Note 4. |
†† | Value determined based on Level 2 inputs — See Note 4. |
1 | All or portion of this security is on loan at October 31, 2016 — See Note 5. |
2 | Rate indicated is the 7 day yield as of October 31, 2016. |
3 | Securities lending collateral — See Note 5. |
ADR — American Depositary Receipt | |
GDR — Global Depositary Receipt | |
plc — Public Limited Company | |
See Sector Classification in Other Information section. |
SEE NOTES TO FINANCIAL STATEMENTS. | GUGGENHEIM ETFs ANNUAL REPORT | 41 |
SCHEDULE OF INVESTMENTS (concluded) | October 31, 2016 |
Guggenheim MSCI Emerging Markets Equal Country Weight ETF | |
The following table summarizes the inputs used to value the Fund’s investments at October 31, 2016 (See Note 4 in the Notes to Financial Statements):
Investments in Securities | Level 1 | Level 2 | Level 3 | Total | ||||||||||||
Common Stocks | $ | 10,698,256 | $ | — | $ | — | $ | 10,698,256 | ||||||||
Exchange-Traded Funds | 647,446 | — | — | 647,446 | ||||||||||||
Preferred Stocks | 300,652 | — | — | 300,652 | ||||||||||||
Securities Lending Collateral | — | 395,137 | — | 395,137 | ||||||||||||
Short Term Investments | 6,439 | — | — | 6,439 | ||||||||||||
Total | $ | 11,652,793 | $ | 395,137 | $ | — | $ | 12,047,930 | ||||||||
Transfers between investment levels may occur as the markets fluctuate and/or the availability of data used in an investment’s valuation changes. Transfers between valuation levels, if any, are in comparison to the valuation levels at the end of the previous fiscal year, and are effective using the fair value as of the end of the previous fiscal period.
For the year ended October 31, 2016, there were no transfers between levels.
42 | GUGGENHEIM ETFs ANNUAL REPORT | SEE NOTES TO FINANCIAL STATEMENTS. |
SCHEDULE OF INVESTMENTS | October 31, 2016 |
Guggenheim S&P MidCap 400® Equal Weight ETF |
Shares | Value | |||||||
COMMON STOCKS† - 99.8% | ||||||||
Financial - 23.7% | ||||||||
Endurance Specialty Holdings Ltd.1 | 3,486 | $ | 320,537 | |||||
SVB Financial Group* | 2,112 | 258,234 | ||||||
Cousins Properties, Inc. | 32,827 | 255,065 | ||||||
Alexander & Baldwin, Inc. | 5,917 | 247,271 | ||||||
East West Bancorp, Inc. | 6,219 | 245,713 | ||||||
Everest Re Group Ltd. | 1,203 | 244,835 | ||||||
Cullen/Frost Bankers, Inc.1 | 3,221 | 244,764 | ||||||
American Campus Communities, Inc. | 4,688 | 244,291 | ||||||
Aspen Insurance Holdings Ltd. | 4,989 | 240,719 | ||||||
Webster Financial Corp. | 5,957 | 240,664 | ||||||
Lamar Advertising Co. — Class A | 3,779 | 239,777 | ||||||
Bank of Hawaii Corp.1 | 3,184 | 239,278 | ||||||
International Bancshares Corp. | 7,739 | 238,748 | ||||||
Raymond James Financial, Inc. | 3,967 | 238,496 | ||||||
FNB Corp.1 | 18,216 | 238,083 | ||||||
RenaissanceRe Holdings Ltd. | 1,914 | 237,891 | ||||||
Fulton Financial Corp. | 15,956 | 237,744 | ||||||
Kilroy Realty Corp. | 3,291 | 236,392 | ||||||
Washington Federal, Inc. | 8,671 | 236,285 | ||||||
Hancock Holding Co. | 7,041 | 236,226 | ||||||
Associated Banc-Corp. | 11,558 | 234,627 | ||||||
Stifel Financial Corp.* | 5,976 | 233,901 | ||||||
Kemper Corp. | 6,196 | 232,660 | ||||||
First Horizon National Corp.1 | 15,069 | 232,213 | ||||||
Valley National Bancorp1 | 23,547 | 232,173 | ||||||
Rayonier, Inc. | 8,654 | 232,100 | ||||||
Signature Bank* | 1,923 | 231,837 | ||||||
Prosperity Bancshares, Inc.1 | 4,178 | 231,754 | ||||||
PacWest Bancorp | 5,326 | 231,095 | ||||||
Alexandria Real Estate Equities, Inc. | 2,142 | 230,929 | ||||||
Liberty Property Trust | 5,711 | 230,896 | ||||||
Potlatch Corp. | 6,006 | 230,630 | ||||||
Synovus Financial Corp. | 6,972 | 230,564 | ||||||
Hanover Insurance Group, Inc. | 3,020 | 230,094 | ||||||
Post Properties, Inc. | 3,494 | 229,870 | ||||||
SEI Investments Co. | 5,160 | 228,743 | ||||||
American Financial Group, Inc. | 3,067 | 228,492 | ||||||
Reinsurance Group of America, Inc. — Class A | 2,117 | 228,340 | ||||||
Mid-America Apartment Communities, Inc. | 2,461 | 228,258 | ||||||
Mercury General Corp. | 4,189 | 228,175 | ||||||
Commerce Bancshares, Inc. | 4,576 | 227,976 | ||||||
WR Berkley Corp. | 3,992 | 227,943 | ||||||
Brown & Brown, Inc. | 6,182 | 227,869 | ||||||
Alleghany Corp.* | 440 | 227,132 | ||||||
Douglas Emmett, Inc. | 6,201 | 226,337 | ||||||
PrivateBancorp, Inc. — Class A | 4,982 | 225,386 | ||||||
Medical Properties Trust, Inc. | 16,160 | 225,271 | ||||||
DCT Industrial Trust, Inc. | 4,798 | 224,307 | ||||||
TCF Financial Corp. | 15,638 | 223,623 | ||||||
Education Realty Trust, Inc. | 5,249 | 223,555 | ||||||
Umpqua Holdings Corp. | 14,558 | 222,446 | ||||||
Duke Realty Corp. | 8,506 | 222,432 | ||||||
Trustmark Corp.1 | 8,023 | 222,077 | ||||||
Highwoods Properties, Inc. | 4,457 | 221,201 | ||||||
Primerica, Inc.1 | 4,033 | 220,605 | ||||||
Chemical Financial Corp. | 5,126 | 220,162 | ||||||
Senior Housing Properties Trust | 10,270 | 218,443 | ||||||
Corporate Office Properties Trust | 8,179 | 218,298 | ||||||
BancorpSouth, Inc. | 9,282 | 218,127 | ||||||
Cathay General Bancorp | 7,275 | 217,886 | ||||||
CNO Financial Group, Inc. | 14,447 | 217,861 | ||||||
Camden Property Trust | 2,670 | 217,445 | ||||||
SLM Corp.* | 30,728 | 216,632 | ||||||
First Industrial Realty Trust, Inc. | 8,193 | 216,377 | ||||||
Bank of the Ozarks, Inc. | 5,850 | 216,216 | ||||||
EPR Properties | 2,973 | 216,197 | ||||||
Healthcare Realty Trust, Inc. | 6,771 | 215,927 | ||||||
Taubman Centers, Inc. | 2,979 | 215,858 | ||||||
New York Community Bancorp, Inc. | 14,990 | 215,256 | ||||||
LaSalle Hotel Properties | 9,050 | 214,938 | ||||||
First American Financial Corp. | 5,495 | 214,635 | ||||||
Equity One, Inc. | 7,515 | 214,178 | ||||||
National Retail Properties, Inc. | 4,686 | 213,775 | ||||||
Communications Sales & Leasing, Inc. | 7,517 | 213,708 | ||||||
MB Financial, Inc. | 5,871 | 213,646 | ||||||
Hospitality Properties Trust | 7,803 | 213,490 | ||||||
Corrections Corporation of America | 14,697 | 212,372 | ||||||
Regency Centers Corp. | 2,943 | 212,102 | ||||||
Urban Edge Properties | 8,205 | 211,771 | ||||||
CBOE Holdings, Inc.1 | 3,348 | 211,627 | ||||||
Mack-Cali Realty Corp. | 8,211 | 210,858 | ||||||
Weingarten Realty Investors | 5,810 | 210,380 | ||||||
Janus Capital Group, Inc. | 16,206 | 207,761 | ||||||
Eaton Vance Corp. | 5,916 | 207,415 | ||||||
Old Republic International Corp. | 12,222 | 206,063 | ||||||
Omega Healthcare Investors, Inc. | 6,407 | 203,935 | ||||||
Care Capital Properties, Inc. | 7,669 | 203,765 | ||||||
Tanger Factory Outlet Centers, Inc. | 5,825 | 202,710 | ||||||
Life Storage, Inc. | 2,497 | 201,383 | ||||||
Waddell & Reed Financial, Inc. — Class A1 | 12,615 | 198,308 | ||||||
Jones Lang LaSalle, Inc. | 2,031 | 196,702 | ||||||
Federated Investors, Inc. — Class B | 7,203 | 194,481 | ||||||
WisdomTree Investments, Inc.1 | 22,566 | 193,616 | ||||||
Genworth Financial, Inc. — Class A*,1 | 46,659 | 193,168 | ||||||
Washington Prime Group, Inc. | 17,583 | 184,446 | ||||||
Total Financial | 21,308,442 | |||||||
Industrial - 17.8% | ||||||||
B/E Aerospace, Inc. | 4,502 | 267,958 | ||||||
Worthington Industries, Inc. | 5,511 | 259,017 | ||||||
Keysight Technologies, Inc.* | 7,711 | 252,921 | ||||||
Old Dominion Freight Line, Inc.*,1 | 3,380 | 252,419 | ||||||
Tech Data Corp.* | 3,254 | 250,623 | ||||||
Crane Co. | 3,667 | 249,394 | ||||||
AGCO Corp. | 4,857 | 248,096 | ||||||
Knowles Corp.*,1 | 16,535 | 247,032 | ||||||
Eagle Materials, Inc. | 3,050 | 246,959 | ||||||
EMCOR Group, Inc. | 4,084 | 246,918 | ||||||
Cognex Corp. | 4,740 | 244,584 | ||||||
Lincoln Electric Holdings, Inc. | 3,687 | 242,715 | ||||||
SEE NOTES TO FINANCIAL STATEMENTS. | GUGGENHEIM ETFs ANNUAL REPORT | 43 |
SCHEDULE OF INVESTMENTS (continued) | October 31, 2016 |
Guggenheim S&P MidCap 400® Equal Weight ETF |
Shares | Value | |||||||
Kennametal, Inc. | 8,554 | $ | 242,164 | |||||
Trimble, Inc.* | 8,757 | 242,043 | ||||||
MSA Safety, Inc. | 4,144 | 241,595 | ||||||
Landstar System, Inc. | 3,382 | 240,630 | ||||||
Kirby Corp.*,1 | 4,057 | 239,160 | ||||||
Avnet, Inc. | 5,685 | 238,486 | ||||||
Granite Construction, Inc. | 4,851 | 238,475 | ||||||
GATX Corp.1 | 5,442 | 238,196 | ||||||
Packaging Corporation of America | 2,885 | 238,013 | ||||||
Graco, Inc. | 3,174 | 237,733 | ||||||
Nordson Corp. | 2,373 | 237,608 | ||||||
National Instruments Corp. | 8,452 | 237,417 | ||||||
Carlisle Companies, Inc. | 2,255 | 236,437 | ||||||
Werner Enterprises, Inc. | 9,827 | 236,339 | ||||||
Silgan Holdings, Inc.1 | 4,633 | 236,051 | ||||||
Curtiss-Wright Corp. | 2,624 | 235,163 | ||||||
Jabil Circuit, Inc. | 11,005 | 234,847 | ||||||
Vishay Intertechnology, Inc.1 | 16,632 | 234,511 | ||||||
Teledyne Technologies, Inc.* | 2,177 | 234,420 | ||||||
ITT, Inc. | 6,579 | 231,712 | ||||||
Belden, Inc. | 3,572 | 231,501 | ||||||
Energizer Holdings, Inc. | 4,974 | 231,341 | ||||||
Genesee & Wyoming, Inc. — Class A* | 3,403 | 231,200 | ||||||
Wabtec Corp.1 | 2,987 | 230,925 | ||||||
Joy Global, Inc. | 8,295 | 230,850 | ||||||
KBR, Inc. | 15,574 | 230,651 | ||||||
Valmont Industries, Inc. | 1,798 | 230,054 | ||||||
Timken Co. | 6,952 | 229,764 | ||||||
Regal Beloit Corp. | 3,882 | 229,426 | ||||||
Hubbell, Inc. | 2,195 | 229,421 | ||||||
Greif, Inc. — Class A | 4,885 | 228,911 | ||||||
Clean Harbors, Inc.* | 4,808 | 227,515 | ||||||
Donaldson Company, Inc.1 | 6,218 | 227,081 | ||||||
Gentex Corp.1 | 13,425 | 227,017 | ||||||
Zebra Technologies Corp. — Class A* | 3,444 | 226,753 | ||||||
Esterline Technologies Corp.* | 3,087 | 226,740 | ||||||
AO Smith Corp. | 5,000 | 225,850 | ||||||
Huntington Ingalls Industries, Inc. | 1,398 | 225,581 | ||||||
Terex Corp. | 9,444 | 225,523 | ||||||
Orbital ATK, Inc. | 3,030 | 225,311 | ||||||
CLARCOR, Inc. | 3,620 | 225,200 | ||||||
KLX, Inc.* | 6,511 | 224,109 | ||||||
Sonoco Products Co. | 4,456 | 224,092 | ||||||
Oshkosh Corp. | 4,182 | 223,737 | ||||||
Arrow Electronics, Inc.* | 3,654 | 223,332 | ||||||
Woodward, Inc. | 3,772 | 222,473 | ||||||
AECOM* | 7,890 | 219,737 | ||||||
EnerSys | 3,360 | 218,837 | ||||||
Bemis Company, Inc. | 4,485 | 218,509 | ||||||
IDEX Corp. | 2,509 | 216,878 | ||||||
Louisiana-Pacific Corp.* | 11,749 | 215,594 | ||||||
Dycom Industries, Inc.*,1 | 2,789 | 214,558 | ||||||
Lennox International, Inc. | 1,462 | 213,291 | ||||||
Cree, Inc.*,1 | 9,424 | 210,155 | ||||||
AptarGroup, Inc. | 2,939 | 209,962 | ||||||
Trinity Industries, Inc. | 9,551 | 203,914 | ||||||
Triumph Group, Inc. | 7,242 | 171,635 | ||||||
Total Industrial | 15,987,064 | |||||||
Consumer, Non-cyclical - 14.5% | ||||||||
Avon Products, Inc. | 41,856 | 274,157 | ||||||
Dean Foods Co.1 | 14,337 | 261,794 | ||||||
Sprouts Farmers Market, Inc.*,1 | 11,616 | 257,294 | ||||||
ManpowerGroup, Inc. | 3,293 | 252,902 | ||||||
Rollins, Inc. | 7,945 | 244,865 | ||||||
Live Nation Entertainment, Inc.* | 8,839 | 244,575 | ||||||
WEX, Inc.* | 2,236 | 243,948 | ||||||
CoreLogic, Inc.* | 5,689 | 242,124 | ||||||
Flowers Foods, Inc.1 | 15,594 | 242,019 | ||||||
Snyder’s-Lance, Inc. | 6,773 | 240,916 | ||||||
LifePoint Health, Inc.* | 3,909 | 233,953 | ||||||
DeVry Education Group, Inc.1 | 10,252 | 232,720 | ||||||
Hain Celestial Group, Inc.* | 6,364 | 231,459 | ||||||
WellCare Health Plans, Inc.* | 2,022 | 229,518 | ||||||
Lancaster Colony Corp. | 1,750 | 228,638 | ||||||
United Natural Foods, Inc.*,1 | 5,472 | 228,401 | ||||||
Bio-Rad Laboratories, Inc. — Class A* | 1,444 | 228,267 | ||||||
United Therapeutics Corp.* | 1,898 | 227,893 | ||||||
Aaron’s, Inc.1 | 9,207 | 227,505 | ||||||
TreeHouse Foods, Inc.*,1 | 2,563 | 224,211 | ||||||
WhiteWave Foods Co. — Class A* | 4,109 | 223,899 | ||||||
Bio-Techne Corp. | 2,146 | 223,162 | ||||||
Edgewell Personal Care Co.* | 2,957 | 222,958 | ||||||
Service Corporation International | 8,704 | 222,822 | ||||||
IDEXX Laboratories, Inc.* | 2,070 | 221,780 | ||||||
Owens & Minor, Inc. | 6,834 | 221,763 | ||||||
Gartner, Inc.* | 2,568 | 220,951 | ||||||
Prestige Brands Holdings, Inc.* | 4,870 | 220,513 | ||||||
Tootsie Roll Industries, Inc.1 | 6,214 | 220,286 | ||||||
Sotheby’s1 | 6,139 | 220,267 | ||||||
Molina Healthcare, Inc.* | 4,045 | 220,088 | ||||||
Catalent, Inc.* | 9,644 | 219,980 | ||||||
Ingredion, Inc. | 1,673 | 219,447 | ||||||
Charles River Laboratories International, Inc.* | 2,891 | 219,369 | ||||||
Hill-Rom Holdings, Inc. | 3,943 | 218,482 | ||||||
LivaNova plc*,1 | 3,848 | 218,105 | ||||||
Graham Holdings Co. — Class B | 455 | 216,125 | ||||||
West Pharmaceutical Services, Inc. | 2,839 | 215,849 | ||||||
STERIS plc | 3,230 | 215,829 | ||||||
Align Technology, Inc.* | 2,481 | 213,168 | ||||||
Post Holdings, Inc.* | 2,790 | 212,682 | ||||||
MEDNAX, Inc.* | 3,456 | 211,680 | ||||||
Halyard Health, Inc.* | 6,519 | 210,890 | ||||||
Helen of Troy Ltd.* | 2,565 | 209,048 | ||||||
ResMed, Inc. | 3,479 | 207,940 | ||||||
FTI Consulting, Inc.* | 5,314 | 207,033 | ||||||
Deluxe Corp. | 3,372 | 206,366 | ||||||
ABIOMED, Inc.* | 1,957 | 205,465 | ||||||
Avis Budget Group, Inc.* | 6,293 | 203,641 | ||||||
VCA, Inc.* | 3,308 | 203,310 | ||||||
Boston Beer Company, Inc. — Class A* | 1,307 | 202,912 | ||||||
NuVasive, Inc.*,1 | 3,380 | 201,887 | ||||||
44 | GUGGENHEIM ETFs ANNUAL REPORT | SEE NOTES TO FINANCIAL STATEMENTS. |
SCHEDULE OF INVESTMENTS (continued) | October 31, 2016 |
Guggenheim S&P MidCap 400® Equal Weight ETF |
Shares | Value | |||||||
CEB, Inc. | 4,120 | $ | 200,438 | |||||
MarketAxess Holdings, Inc. | 1,329 | 200,360 | ||||||
Amsurg Corp. — Class A*,1 | 3,348 | 200,043 | ||||||
Akorn, Inc.* | 8,350 | 199,983 | ||||||
PAREXEL International Corp.* | 3,422 | 199,366 | ||||||
Tenet Healthcare Corp.* | 9,639 | 189,985 | ||||||
Teleflex, Inc. | 1,261 | 180,487 | ||||||
Total Consumer, Non-cyclical | 13,045,518 | |||||||
Consumer, Cyclical - 13.7% | ||||||||
Cabela’s, Inc.* | 4,719 | 290,738 | ||||||
Domino’s Pizza, Inc. | 1,558 | 263,677 | ||||||
Scotts Miracle-Gro Co. — Class A | 2,871 | 252,906 | ||||||
JetBlue Airways Corp.* | 14,037 | 245,367 | ||||||
Dana, Inc. | 15,834 | 245,110 | ||||||
Cheesecake Factory, Inc. | 4,569 | 243,025 | ||||||
Wendy’s Co. | 22,301 | 241,743 | ||||||
Ingram Micro, Inc. — Class A | 6,491 | 241,466 | ||||||
Copart, Inc.*,1 | 4,553 | 238,896 | ||||||
Cinemark Holdings, Inc. | 5,943 | 236,531 | ||||||
Thor Industries, Inc. | 2,920 | 231,585 | ||||||
Toro Co. | 4,810 | 230,303 | ||||||
Dunkin’ Brands Group, Inc. | 4,757 | 230,049 | ||||||
MSC Industrial Direct Company, Inc. — Class A | 3,157 | 229,830 | ||||||
CST Brands, Inc. | 4,772 | 229,151 | ||||||
Fossil Group, Inc.*,1 | 8,383 | 228,604 | ||||||
International Speedway Corp. — Class A | 6,923 | 227,767 | ||||||
Vista Outdoor, Inc.* | 5,826 | 225,291 | ||||||
KB Home | 15,323 | 222,797 | ||||||
Pool Corp. | 2,397 | 221,914 | ||||||
Jack in the Box, Inc. | 2,354 | 220,640 | ||||||
Brinker International, Inc.1 | 4,478 | 220,497 | ||||||
Watsco, Inc. | 1,603 | 220,076 | ||||||
Brunswick Corp. | 5,026 | 218,631 | ||||||
Texas Roadhouse, Inc. — Class A | 5,342 | 216,458 | ||||||
Polaris Industries, Inc.1 | 2,817 | 215,810 | ||||||
Williams-Sonoma, Inc. | 4,652 | 215,015 | ||||||
Dick’s Sporting Goods, Inc. | 3,863 | 214,976 | ||||||
Casey’s General Stores, Inc. | 1,900 | 214,681 | ||||||
Chico’s FAS, Inc. | 18,392 | 214,634 | ||||||
Cracker Barrel Old Country Store, Inc.1 | 1,550 | 213,900 | ||||||
Tupperware Brands Corp. | 3,584 | 213,320 | ||||||
Toll Brothers, Inc.* | 7,769 | 213,181 | ||||||
American Eagle Outfitters, Inc.1 | 12,504 | 213,068 | ||||||
Churchill Downs, Inc.1 | 1,551 | 210,936 | ||||||
Kate Spade & Co.* | 12,587 | 210,832 | ||||||
HSN, Inc. | 5,582 | 210,441 | ||||||
CalAtlantic Group, Inc.1 | 6,478 | 209,369 | ||||||
Panera Bread Co. — Class A*,1 | 1,095 | 208,882 | ||||||
NVR, Inc.* | 137 | 208,651 | ||||||
Carter’s, Inc. | 2,404 | 207,561 | ||||||
Buffalo Wild Wings, Inc.*,1 | 1,413 | 205,803 | ||||||
Guess?, Inc. | 15,159 | 204,647 | ||||||
Big Lots, Inc.1 | 4,715 | 204,631 | ||||||
Skechers U.S.A., Inc. — Class A*,1 | 9,696 | 203,907 | ||||||
Sally Beauty Holdings, Inc.*,1 | 7,854 | 203,733 | ||||||
Deckers Outdoor Corp.* | 3,901 | 203,593 | ||||||
World Fuel Services Corp. | 5,036 | 202,699 | ||||||
GameStop Corp. — Class A1 | 8,377 | 201,467 | ||||||
J.C. Penney Company, Inc.*,1 | 23,000 | 197,570 | ||||||
Office Depot, Inc. | 62,042 | 195,432 | ||||||
TRI Pointe Group, Inc.* | 17,775 | 192,503 | ||||||
Herman Miller, Inc. | 6,573 | 182,730 | ||||||
Restoration Hardware Holdings, Inc.*,1 | 6,259 | 181,323 | ||||||
HNI Corp. | 4,276 | 173,862 | ||||||
Tempur Sealy International, Inc.*,1 | 2,953 | 159,669 | ||||||
Ascena Retail Group, Inc.*,1 | 30,039 | 146,891 | ||||||
Total Consumer, Cyclical | 12,328,769 | |||||||
Technology - 11.5% | ||||||||
Mentor Graphics Corp. | 9,685 | 279,897 | ||||||
Advanced Micro Devices, Inc.* | 38,592 | 279,020 | ||||||
Computer Sciences Corp. | 4,905 | 267,078 | ||||||
IPG Photonics Corp.* | 2,751 | 266,875 | ||||||
Brocade Communications Systems, Inc. | 24,857 | 263,484 | ||||||
Teradyne, Inc. | 11,228 | 261,500 | ||||||
Intersil Corp. — Class A | 11,761 | 259,682 | ||||||
Lexmark International, Inc. — Class A | 6,316 | 250,682 | ||||||
PTC, Inc.* | 5,269 | 249,961 | ||||||
NCR Corp.* | 7,131 | 249,942 | ||||||
Silicon Laboratories, Inc.* | 4,141 | 248,253 | ||||||
Microsemi Corp.* | 5,837 | 245,913 | ||||||
Monolithic Power Systems, Inc. | 3,101 | 244,390 | ||||||
Integrated Device Technology, Inc.* | 11,534 | 238,869 | ||||||
j2 Global, Inc.1 | 3,347 | 238,139 | ||||||
CommVault Systems, Inc.* | 4,441 | 237,593 | ||||||
Science Applications International Corp. | 3,406 | 234,708 | ||||||
Ultimate Software Group, Inc.* | 1,110 | 234,199 | ||||||
Cadence Design Systems, Inc.* | 9,093 | 232,599 | ||||||
Synopsys, Inc.* | 3,904 | 231,546 | ||||||
Rackspace Hosting, Inc.* | 7,233 | 231,022 | ||||||
Leidos Holdings, Inc. | 5,488 | 228,136 | ||||||
SYNNEX Corp. | 2,223 | 227,946 | ||||||
ANSYS, Inc.* | 2,459 | 224,630 | ||||||
Convergys Corp. | 7,679 | 224,227 | ||||||
ACI Worldwide, Inc.* | 12,354 | 223,854 | ||||||
NetScout Systems, Inc.* | 8,080 | 221,796 | ||||||
Cirrus Logic, Inc.* | 4,095 | 221,048 | ||||||
CDK Global, Inc. | 4,044 | 220,843 | ||||||
Allscripts Healthcare Solutions, Inc.* | 18,143 | 217,897 | ||||||
Tyler Technologies, Inc.* | 1,356 | 217,502 | ||||||
MSCI, Inc. — Class A | 2,687 | 215,471 | ||||||
Jack Henry & Associates, Inc. | 2,642 | 214,055 | ||||||
Fair Isaac Corp. | 1,772 | 213,845 | ||||||
Broadridge Financial Solutions, Inc. | 3,280 | 212,085 | ||||||
VeriFone Systems, Inc.* | 13,609 | 210,667 | ||||||
Acxiom Corp.* | 8,929 | 210,367 | ||||||
3D Systems Corp.*,1 | 15,019 | 208,314 | ||||||
Synaptics, Inc.*,1 | 3,956 | 206,187 | ||||||
MAXIMUS, Inc. | 3,921 | 204,127 | ||||||
Fortinet, Inc.* | 6,367 | 204,126 | ||||||
Manhattan Associates, Inc.* | 3,873 | 196,129 | ||||||
Cypress Semiconductor Corp. | 19,561 | 195,023 | ||||||
SEE NOTES TO FINANCIAL STATEMENTS. | GUGGENHEIM ETFs ANNUAL REPORT | 45 |
SCHEDULE OF INVESTMENTS (continued) | October 31, 2016 |
Guggenheim S&P MidCap 400® Equal Weight ETF |
Shares | Value | |||||||
Diebold, Inc. | 8,880 | $ | 193,584 | |||||
DST Systems, Inc. | 1,884 | 181,165 | ||||||
Total Technology | 10,338,376 | |||||||
Energy - 5.1% | ||||||||
Patterson-UTI Energy, Inc.1 | 11,884 | 267,151 | ||||||
Nabors Industries Ltd. | 22,214 | 264,347 | ||||||
Western Refining, Inc.1 | 8,625 | 248,832 | ||||||
Ensco plc — Class A | 31,317 | 244,899 | ||||||
NOW, Inc.* | 11,261 | 242,787 | ||||||
Rowan Companies plc — Class A | 16,941 | 224,807 | ||||||
Oil States International, Inc.* | 7,648 | 223,704 | ||||||
HollyFrontier Corp. | 8,891 | 221,830 | ||||||
CONSOL Energy, Inc. | 12,792 | 216,824 | ||||||
Diamond Offshore Drilling, Inc.1 | 13,032 | 214,898 | ||||||
Murphy USA, Inc.* | 3,122 | 214,731 | ||||||
Oceaneering International, Inc. | 8,932 | 212,582 | ||||||
SM Energy Co.1 | 6,309 | 212,171 | ||||||
Energen Corp. | 4,053 | 203,177 | ||||||
QEP Resources, Inc. | 12,552 | 201,711 | ||||||
Superior Energy Services, Inc. | 14,186 | 200,874 | ||||||
Dril-Quip, Inc.*,1 | 4,214 | 200,165 | ||||||
Noble Corporation plc1 | 39,254 | 193,915 | ||||||
WPX Energy, Inc.* | 17,803 | 193,341 | ||||||
Gulfport Energy Corp.* | 7,690 | 185,406 | ||||||
Denbury Resources, Inc.*,1 | 73,683 | 176,102 | ||||||
Total Energy | 4,564,254 | |||||||
Utilities - 4.9% | ||||||||
MDU Resources Group, Inc. | 9,840 | 257,906 | ||||||
Black Hills Corp. | 3,946 | 244,060 | ||||||
Great Plains Energy, Inc. | 8,512 | 242,081 | ||||||
Southwest Gas Corp. | 3,297 | 238,901 | ||||||
Westar Energy, Inc. | 4,153 | 238,050 | ||||||
PNM Resources, Inc. | 7,231 | 237,538 | ||||||
Vectren Corp. | 4,714 | 237,161 | ||||||
IDACORP, Inc. | 3,016 | 236,424 | ||||||
Atmos Energy Corp. | 3,168 | 235,668 | ||||||
Aqua America, Inc. | 7,618 | 233,873 | ||||||
WGL Holdings, Inc. | 3,693 | 232,918 | ||||||
UGI Corp. | 5,015 | 232,144 | ||||||
New Jersey Resources Corp. | 6,836 | 232,082 | ||||||
ONE Gas, Inc. | 3,773 | 231,209 | ||||||
Hawaiian Electric Industries, Inc. | 7,784 | 229,628 | ||||||
Talen Energy Corp.*,1 | 16,476 | 229,511 | ||||||
OGE Energy Corp. | 7,298 | 226,530 | ||||||
National Fuel Gas Co. | 4,105 | 215,020 | ||||||
NorthWestern Corp. | 3,729 | 214,604 | ||||||
Total Utilities | 4,445,308 | |||||||
Basic Materials - 4.7% | ||||||||
Steel Dynamics, Inc. | 9,487 | 260,513 | ||||||
United States Steel Corp. | 13,370 | 258,576 | ||||||
Olin Corp. | 11,712 | 256,844 | ||||||
Cabot Corp. | 4,617 | 240,730 | ||||||
Commercial Metals Co. | 15,038 | 236,247 | ||||||
Minerals Technologies, Inc. | 3,494 | 234,797 | ||||||
Domtar Corp. | 6,450 | 231,878 | ||||||
Sensient Technologies Corp. | 3,083 | 229,714 | ||||||
Compass Minerals International, Inc.1 | 3,177 | 228,267 | ||||||
Reliance Steel & Aluminum Co. | 3,237 | 222,641 | ||||||
Ashland Global Holdings, Inc. | 1,955 | 218,432 | ||||||
NewMarket Corp. | 539 | 216,090 | ||||||
Valspar Corp. | 2,157 | 214,837 | ||||||
RPM International, Inc. | 4,400 | 209,176 | ||||||
Royal Gold, Inc. | 2,994 | 206,047 | ||||||
PolyOne Corp. | 6,974 | 203,850 | ||||||
Carpenter Technology Corp. | 6,387 | 201,893 | ||||||
Allegheny Technologies, Inc.1 | 14,090 | 192,188 | ||||||
Versum Materials, Inc.* | 7,415 | 168,321 | ||||||
Total Basic Materials | 4,231,041 | |||||||
Communications - 3.9% | ||||||||
Cable One, Inc. | 420 | 242,231 | ||||||
Plantronics, Inc. | 4,587 | 237,194 | ||||||
ARRIS International plc* | 8,518 | 236,630 | ||||||
John Wiley & Sons, Inc. — Class A | 4,537 | 234,109 | ||||||
InterDigital, Inc. | 3,237 | 228,693 | ||||||
ViaSat, Inc.* | 3,158 | 223,144 | ||||||
comScore, Inc.*,1 | 7,615 | 219,236 | ||||||
Telephone & Data Systems, Inc. | 8,421 | 217,599 | ||||||
WebMD Health Corp. — Class A*,1 | 4,412 | 216,762 | ||||||
AMC Networks, Inc. — Class A* | 4,398 | 215,194 | ||||||
Time, Inc. | 15,789 | 205,257 | ||||||
Ciena Corp.* | 10,512 | 203,723 | ||||||
FactSet Research Systems, Inc. | 1,291 | 199,743 | ||||||
New York Times Co. — Class A1 | 18,289 | 199,350 | ||||||
Meredith Corp. | 4,380 | 198,633 | ||||||
NeuStar, Inc. — Class A*,1 | 8,795 | 197,448 | ||||||
Total Communications | 3,474,946 | |||||||
Total Common Stocks | ||||||||
(Cost $82,673,098) | 89,723,718 | |||||||
SHORT TERM INVESTMENTS† - 0.2% | ||||||||
Federated U.S. Treasury Cash Reserve Fund Institutional Shares, 0.18%2 | 198,762 | 198,762 | ||||||
Total Short Term Investments | ||||||||
(Cost $198,762) | 198,762 | |||||||
Face | ||||||||
SECURITIES LENDING COLLATERAL††,3 - 9.0% | ||||||||
Joint Repurchase Agreements | ||||||||
Citigroup Global Markets, Inc. | $ | 1,880,029 | 1,880,029 | |||||
BNP Paribas Securities Corp. | 1,880,029 | 1,880,029 | ||||||
46 | GUGGENHEIM ETFs ANNUAL REPORT | SEE NOTES TO FINANCIAL STATEMENTS. |
SCHEDULE OF INVESTMENTS (concluded) | October 31, 2016 |
Guggenheim S&P MidCap 400® Equal Weight ETF |
Face | Value | |||||||
Merrill Lynch, Pierce, Fenner & Smith, Inc. | $ | 1,880,029 | $ | 1,880,029 | ||||
HSBC Securities (USA), Inc. | 1,880,029 | 1,880,029 | ||||||
Credit Suisse Securities (USA), LLC | 554,580 | 554,580 | ||||||
Total Securities Lending Collateral | ||||||||
(Cost $8,074,696) | 8,074,696 | |||||||
Total Investments - 109.0% | ||||||||
(Cost $90,946,556) | $ | 97,997,176 | ||||||
Other Assets & Liabilities, net - (9.0)% | (8,053,427 | ) | ||||||
Total Net Assets - 100.0% | $ | 89,943,749 | ||||||
* | Non-income producing security. |
† | Value determined based on Level 1 inputs — See Note 4. |
†† | Value determined based on Level 2 inputs — See Note 4. |
1 | All or portion of this security is on loan at October 31, 2016 — See Note 5. |
2 | Rate indicated is the 7 day yield as of October 31, 2016. |
3 | Securities lending collateral — See Note 5. |
plc — Public Limited Company | |
See Sector Classification in Other Information section. |
The following table summarizes the inputs used to value the Fund’s investments at October 31, 2016 (See Note 4 in the Notes to Financial Statements):
Investments in Securities | Level 1 | Level 2 | Level 3 | Total | ||||||||||||
Common Stocks | $ | 89,723,718 | $ | — | $ | — | $ | 89,723,718 | ||||||||
Securities Lending Collateral | — | 8,074,696 | — | 8,074,696 | ||||||||||||
Short Term Investments | 198,762 | — | — | 198,762 | ||||||||||||
Total | $ | 89,922,480 | $ | 8,074,696 | $ | — | $ | 97,997,176 | ||||||||
Transfers between investment levels may occur as the markets fluctuate and/or the availability of data used in an investment’s valuation changes. Transfers between valuation levels, if any, are in comparison to the valuation levels at the end of the previous fiscal year, and are effective using the fair value as of the end of the previous fiscal period.
For the year ended October 31, 2016, there were no transfers between levels.
SEE NOTES TO FINANCIAL STATEMENTS. | GUGGENHEIM ETFs ANNUAL REPORT | 47 |
SCHEDULE OF INVESTMENTS | October 31, 2016 |
Guggenheim S&P SmallCap 600® Equal Weight ETF |
Shares | Value | |||||||
COMMON STOCKS† - 99.9% | ||||||||
Financial - 18.7% | ||||||||
Piper Jaffray Cos.* | 1,274 | $ | 72,044 | |||||
Virtus Investment Partners, Inc. | 651 | 69,852 | ||||||
Texas Capital Bancshares, Inc.* | 1,099 | 65,170 | ||||||
GEO Group, Inc. | 2,701 | 64,716 | ||||||
S&T Bancorp, Inc. | 2,016 | 63,282 | ||||||
LegacyTexas Financial Group, Inc. | 1,847 | 63,186 | ||||||
First BanCorp* | 12,205 | 62,612 | ||||||
Brookline Bancorp, Inc. | 4,889 | 62,580 | ||||||
Tompkins Financial Corp.1 | 788 | 62,473 | ||||||
Provident Financial Services, Inc. | 2,720 | 61,717 | ||||||
UMB Financial Corp. | 983 | 60,995 | ||||||
Old National Bancorp | 4,138 | 60,829 | ||||||
Enova International, Inc.* | 6,470 | 60,818 | ||||||
ServisFirst Bancshares, Inc.1 | 1,123 | 60,799 | ||||||
City Holding Co. | 1,163 | 60,790 | ||||||
Employers Holdings, Inc. | 1,939 | 60,787 | ||||||
NBT Bancorp, Inc.1 | 1,803 | 60,779 | ||||||
Independent Bank Corp. | 1,102 | 60,775 | ||||||
RE/MAX Holdings, Inc. — Class A | 1,397 | 60,700 | ||||||
Greenhill & Company, Inc. | 2,586 | 60,642 | ||||||
Evercore Partners, Inc. — Class A | 1,125 | 60,469 | ||||||
Boston Private Financial Holdings, Inc. | 4,594 | 60,411 | ||||||
Banner Corp. | 1,337 | 60,352 | ||||||
United Community Banks, Inc. | 2,783 | 60,029 | ||||||
Agree Realty Corp. | 1,232 | 59,567 | ||||||
Northfield Bancorp, Inc. | 3,621 | 59,565 | ||||||
Sterling Bancorp | 3,309 | 59,562 | ||||||
Customers Bancorp, Inc.* | 2,195 | 59,419 | ||||||
Northwest Bancshares, Inc. | 3,759 | 59,167 | ||||||
Safety Insurance Group, Inc. | 873 | 59,101 | ||||||
Horace Mann Educators Corp. | 1,640 | 58,958 | ||||||
Columbia Banking System, Inc. | 1,784 | 58,908 | ||||||
Maiden Holdings Ltd. | 4,314 | 58,886 | ||||||
Ameris Bancorp | 1,621 | 58,842 | ||||||
PS Business Parks, Inc. | 535 | 58,738 | ||||||
Bank Mutual Corp. | 7,520 | 58,656 | ||||||
Central Pacific Financial Corp. | 2,280 | 58,436 | ||||||
Westamerica Bancorporation | 1,179 | 58,431 | ||||||
OFG Bancorp | 5,485 | 58,416 | ||||||
Southside Bancshares, Inc. | 1,790 | 58,390 | ||||||
HFF, Inc. — Class A | 2,192 | 58,373 | ||||||
American Equity Investment Life Holding Co. | 3,255 | 58,362 | ||||||
Great Western Bancorp, Inc. | 1,810 | 58,354 | ||||||
TrustCo Bank Corp. NY | 8,318 | 58,226 | ||||||
Cardinal Financial Corp. | 2,215 | 58,210 | ||||||
ProAssurance Corp. | 1,092 | 58,204 | ||||||
World Acceptance Corp.* | 1,221 | 58,022 | ||||||
Simmons First National Corp. — Class A | 1,175 | 57,986 | ||||||
Navigators Group, Inc. | 622 | 57,970 | ||||||
First Commonwealth Financial Corp. | 5,701 | 57,922 | ||||||
PRA Group, Inc.*,1 | 1,810 | 57,739 | ||||||
First Financial Bankshares, Inc.1 | 1,593 | 57,667 | ||||||
Community Bank System, Inc.1 | 1,222 | 57,568 | ||||||
First Midwest Bancorp, Inc. | 2,967 | 57,293 | ||||||
Stewart Information Services Corp. | 1,274 | 57,266 | ||||||
Lexington Realty Trust | 5,646 | 57,250 | ||||||
LTC Properties, Inc. | 1,141 | 57,176 | ||||||
Oritani Financial Corp. | 3,648 | 57,091 | ||||||
United Bankshares, Inc.1 | 1,513 | 57,040 | ||||||
Four Corners Property Trust, Inc. | 2,833 | 56,887 | ||||||
Summit Hotel Properties, Inc. | 4,376 | 56,845 | ||||||
DiamondRock Hospitality Co. | 6,208 | 56,803 | ||||||
Urstadt Biddle Properties, Inc. — Class A | 2,637 | 56,695 | ||||||
First Financial Bancorp | 2,636 | 56,674 | ||||||
Getty Realty Corp. | 2,493 | 56,666 | ||||||
Infinity Property & Casualty Corp. | 690 | 56,546 | ||||||
Investment Technology Group, Inc. | 3,692 | 56,525 | ||||||
CVB Financial Corp. | 3,363 | 56,431 | ||||||
Capstead Mortgage Corp. | 5,922 | 56,318 | ||||||
Universal Health Realty Income Trust | 957 | 56,176 | ||||||
Wintrust Financial Corp. | 1,041 | 56,162 | ||||||
Glacier Bancorp, Inc. | 1,987 | 56,153 | ||||||
EastGroup Properties, Inc. | 821 | 55,754 | ||||||
United Insurance Holdings Corp.1 | 3,835 | 55,608 | ||||||
Sabra Health Care REIT, Inc. | 2,380 | 55,454 | ||||||
International. FCStone, Inc.* | 1,538 | 55,214 | ||||||
CareTrust REIT, Inc. | 3,912 | 55,081 | ||||||
WageWorks, Inc.* | 934 | 55,059 | ||||||
Astoria Financial Corp. | 3,745 | 54,789 | ||||||
Home BancShares, Inc. | 2,546 | 54,764 | ||||||
Hanmi Financial Corp. | 2,190 | 54,750 | ||||||
United Fire Group, Inc. | 1,381 | 54,577 | ||||||
Saul Centers, Inc. | 902 | 54,553 | ||||||
Franklin Street Properties Corp. | 4,714 | 54,541 | ||||||
Interactive Brokers Group, Inc. — Class A1 | 1,641 | 54,465 | ||||||
Hope Bancorp, Inc. | 3,369 | 54,376 | ||||||
CoreSite Realty Corp. | 735 | 54,199 | ||||||
Acadia Realty Trust | 1,607 | 54,139 | ||||||
Walker & Dunlop, Inc.* | 2,246 | 54,061 | ||||||
Calamos Asset Management, Inc. — Class A | 8,342 | 53,889 | ||||||
Forestar Group, Inc.*,1 | 4,893 | 53,823 | ||||||
American Assets Trust, Inc. | 1,353 | 53,728 | ||||||
Selective Insurance Group, Inc. | 1,453 | 53,688 | ||||||
AMERISAFE, Inc. | 965 | 53,654 | ||||||
Retail Opportunity Investments Corp. | 2,652 | 53,332 | ||||||
Dime Community Bancshares, Inc. | 3,272 | 53,006 | ||||||
Pinnacle Financial Partners, Inc. | 1,026 | 52,942 | ||||||
Financial Engines, Inc.1 | 1,898 | 52,480 | ||||||
Cedar Realty Trust, Inc. | 7,679 | 51,987 | ||||||
Encore Capital Group, Inc.*,1 | 2,617 | 51,947 | ||||||
Chesapeake Lodging Trust | 2,385 | 51,778 | ||||||
Kite Realty Group Trust | 2,074 | 51,705 | ||||||
BofI Holding, Inc.*,1 | 2,715 | 50,580 | ||||||
Universal Insurance Holdings, Inc.1 | 2,363 | 50,332 | ||||||
HCI Group, Inc. | 1,851 | 50,181 | ||||||
Government Properties Income Trust | 2,528 | 48,386 | ||||||
Pennsylvania Real Estate Investment Trust | 2,441 | 47,624 | ||||||
48 | GUGGENHEIM ETFs ANNUAL REPORT | SEE NOTES TO FINANCIAL STATEMENTS. |
SCHEDULE OF INVESTMENTS (continued) | October 31, 2016 |
Guggenheim S&P SmallCap 600® Equal Weight ETF |
Shares | Value | |||||||
RLI Corp. | 847 | $ | 47,212 | |||||
Parkway, Inc.* | 2,382 | 42,924 | ||||||
eHealth, Inc.* | 5,177 | 40,536 | ||||||
Banc of California, Inc.1 | 2,645 | 35,179 | ||||||
Opus Bank | 1,654 | 33,163 | ||||||
First NBC Bank Holding Co.*,1 | 4,835 | 26,109 | ||||||
Total Financial | 6,364,018 | |||||||
Consumer, Non-cyclical - 18.5% | ||||||||
Strayer Education, Inc.* | 1,258 | 73,794 | ||||||
Capella Education Co. | 1,007 | 73,612 | ||||||
Navigant Consulting, Inc.* | 3,017 | 70,598 | ||||||
Cardtronics plc — Class A* | 1,350 | 67,501 | ||||||
Viad Corp. | 1,624 | 67,396 | ||||||
NutriSystem, Inc. | 2,102 | 66,633 | ||||||
AMAG Pharmaceuticals, Inc.*,1 | 2,587 | 66,485 | ||||||
ICU Medical, Inc.* | 475 | 66,168 | ||||||
Insperity, Inc. | 872 | 65,573 | ||||||
Brink’s Co. | 1,658 | 65,574 | ||||||
Medifast, Inc. | 1,593 | 65,409 | ||||||
Career Education Corp.* | 8,975 | 64,530 | ||||||
Almost Family, Inc.* | 1,630 | 63,978 | ||||||
CDI Corp. | 10,261 | 63,105 | ||||||
Select Medical Holdings Corp.* | 4,844 | 62,972 | ||||||
MiMedx Group, Inc.*,1 | 6,993 | 62,307 | ||||||
Andersons, Inc. | 1,622 | 61,717 | ||||||
Enanta Pharmaceuticals, Inc.* | 2,622 | 61,670 | ||||||
Albany Molecular Research, Inc.*,1 | 3,931 | 61,284 | ||||||
J&J Snack Foods Corp. | 492 | 60,098 | ||||||
Chemed Corp. | 422 | 59,679 | ||||||
Healthways, Inc.* | 2,397 | 59,446 | ||||||
Resources Connection, Inc. | 3,993 | 59,296 | ||||||
Amphastar Pharmaceuticals, Inc.* | 3,258 | 59,100 | ||||||
Depomed, Inc.* | 2,641 | 59,053 | ||||||
ABM Industries, Inc. | 1,503 | 58,737 | ||||||
Phibro Animal Health Corp. — Class A | 2,245 | 58,258 | ||||||
Surgical Care Affiliates, Inc.* | 1,361 | 58,237 | ||||||
BioTelemetry, Inc.* | 3,289 | 58,215 | ||||||
Abaxis, Inc. | 1,218 | 58,147 | ||||||
Landauer, Inc. | 1,335 | 58,073 | ||||||
Seneca Foods Corp. — Class A* | 1,975 | 58,065 | ||||||
Inter Parfums, Inc. | 1,781 | 58,061 | ||||||
Kelly Services, Inc. — Class A | 3,096 | 57,988 | ||||||
Emergent BioSolutions, Inc.* | 2,170 | 57,982 | ||||||
Heidrick & Struggles International, Inc. | 3,133 | 57,961 | ||||||
American Public Education, Inc.* | 2,875 | 57,931 | ||||||
HealthEquity, Inc.*,1 | 1,740 | 57,820 | ||||||
Matthews International Corp. — Class A | 962 | 57,624 | ||||||
ANI Pharmaceuticals, Inc.*,1 | 964 | 57,551 | ||||||
Team, Inc.*,1 | 1,871 | 57,533 | ||||||
Monster Worldwide, Inc.*,1 | 16,854 | 57,472 | ||||||
Healthcare Services Group, Inc. | 1,553 | 57,414 | ||||||
Luminex Corp.* | 2,750 | 57,282 | ||||||
CryoLife, Inc. | 3,363 | 57,171 | ||||||
CONMED Corp. | 1,423 | 56,920 | ||||||
Sanderson Farms, Inc.1 | 627 | 56,417 | ||||||
AngioDynamics, Inc.* | 3,535 | 56,348 | ||||||
Momenta Pharmaceuticals, Inc.* | 5,046 | 56,263 | ||||||
HMS Holdings Corp.* | 2,668 | 56,215 | ||||||
Darling Ingredients, Inc.* | 4,124 | 56,086 | ||||||
Anika Therapeutics, Inc.* | 1,263 | 56,027 | ||||||
Green Dot Corp. — Class A* | 2,511 | 55,744 | ||||||
Monro Muffler Brake, Inc.1 | 1,012 | 55,660 | ||||||
Natus Medical, Inc.* | 1,414 | 55,641 | ||||||
LHC Group, Inc.* | 1,621 | 55,552 | ||||||
Masimo Corp.* | 1,007 | 55,385 | ||||||
Magellan Health, Inc.* | 1,073 | 55,206 | ||||||
Vascular Solutions, Inc.* | 1,208 | 55,085 | ||||||
Integra LifeSciences Holdings Corp.* | 689 | 54,782 | ||||||
Universal Corp. | 1,008 | 54,634 | ||||||
B&G Foods, Inc. | 1,286 | 54,527 | ||||||
AMN Healthcare Services, Inc.* | 1,661 | 54,481 | ||||||
Integer Holdings Corp.* | 2,470 | 54,463 | ||||||
Kindred Healthcare, Inc. | 5,505 | 54,225 | ||||||
Neogen Corp.* | 1,029 | 54,218 | ||||||
Analogic Corp.1 | 661 | 54,103 | ||||||
Cantel Medical Corp. | 756 | 53,850 | ||||||
Eagle Pharmaceuticals, Inc.* | 963 | 53,812 | ||||||
On Assignment, Inc.* | 1,562 | 53,748 | ||||||
WD-40 Co. | 504 | 53,739 | ||||||
Inogen, Inc.* | 1,000 | 53,670 | ||||||
Haemonetics Corp.* | 1,602 | 53,523 | ||||||
SpartanNash Co. | 1,911 | 53,508 | ||||||
Forrester Research, Inc. | 1,433 | 53,379 | ||||||
Supernus Pharmaceuticals, Inc.*,1 | 2,671 | 52,886 | ||||||
CorVel Corp.* | 1,530 | 52,862 | ||||||
Cross Country Healthcare, Inc.* | 4,710 | 52,611 | ||||||
SUPERVALU, Inc.* | 12,257 | 52,583 | ||||||
PharMerica Corp.* | 2,208 | 52,550 | ||||||
Merit Medical Systems, Inc.* | 2,394 | 52,548 | ||||||
Ensign Group, Inc. | 2,820 | 52,085 | ||||||
US Physical Therapy, Inc. | 913 | 51,950 | ||||||
Korn/Ferry International | 2,547 | 51,933 | ||||||
Cambrex Corp.* | 1,284 | 51,745 | ||||||
Surmodics, Inc.* | 2,078 | 51,742 | ||||||
Medicines Co.*,1 | 1,567 | 51,633 | ||||||
Amedisys, Inc.* | 1,193 | 51,609 | ||||||
Cynosure, Inc. — Class A* | 1,209 | 51,564 | ||||||
Cal-Maine Foods, Inc.1 | 1,334 | 51,559 | ||||||
Repligen Corp.* | 1,801 | 51,455 | ||||||
SciClone Pharmaceuticals, Inc.* | 5,746 | 51,427 | ||||||
Zeltiq Aesthetics, Inc.*,1 | 1,553 | 51,404 | ||||||
Calavo Growers, Inc. | 857 | 50,692 | ||||||
Ligand Pharmaceuticals, Inc. — Class B*,1 | 523 | 50,067 | ||||||
Meridian Bioscience, Inc. | 3,043 | 50,057 | ||||||
Providence Service Corp.* | 1,224 | 49,529 | ||||||
Air Methods Corp.* | 1,828 | 48,351 | ||||||
Impax Laboratories, Inc.* | 2,388 | 47,999 | ||||||
TrueBlue, Inc.* | 2,709 | 47,408 | ||||||
Rent-A-Center, Inc. | 4,660 | 47,019 | ||||||
Adeptus Health, Inc. — Class A*,1 | 1,557 | 46,897 | ||||||
RR Donnelley & Sons Co. | 2,580 | 45,795 | ||||||
LendingTree, Inc.*,1 | 571 | 45,594 | ||||||
SEE NOTES TO FINANCIAL STATEMENTS. | GUGGENHEIM ETFs ANNUAL REPORT | 49 |
SCHEDULE OF INVESTMENTS (continued) | October 31, 2016 |
Guggenheim S&P SmallCap 600® Equal Weight ETF |
Shares | Value | |||||||
Central Garden & Pet Co. — Class A* | 1,912 | $ | 44,626 | |||||
Invacare Corp. | 4,851 | 44,387 | ||||||
Acorda Therapeutics, Inc.*,1 | 2,441 | 43,206 | ||||||
Diplomat Pharmacy, Inc.*,1 | 1,826 | 42,308 | ||||||
Lannett Company, Inc.*,1 | 1,906 | 41,741 | ||||||
Nektar Therapeutics*,1 | 3,108 | 38,539 | ||||||
Spectrum Pharmaceuticals, Inc.*,1 | 10,776 | 38,147 | ||||||
Quorum Health Corp.* | 8,427 | 34,045 | ||||||
LSC Communications, Inc.* | 1,384 | 33,548 | ||||||
Community Health Systems, Inc.*,1 | 4,924 | 25,999 | ||||||
Central Garden & Pet Co.*,1 | 570 | 13,862 | ||||||
Total Consumer, Non-cyclical | 6,277,673 | |||||||
Consumer, Cyclical - 18.1% | ||||||||
Abercrombie & Fitch Co. — Class A1 | 5,271 | 77,009 | ||||||
iRobot Corp.*,1 | 1,483 | 75,188 | ||||||
DTS, Inc. | 1,759 | 74,493 | ||||||
Zumiez, Inc.*,1 | 3,334 | 74,181 | ||||||
Winnebago Industries, Inc. | 2,562 | 72,377 | ||||||
Scientific Games Corp. — Class A*,1 | 5,741 | 71,188 | ||||||
WCI Communities, Inc.* | 3,017 | 69,843 | ||||||
Belmond Ltd. — Class A* | 5,334 | 69,075 | ||||||
Marcus Corp. | 2,507 | 66,436 | ||||||
Titan International, Inc. | 6,420 | 65,420 | ||||||
American Axle & Manufacturing Holdings, Inc.* | 3,601 | 64,530 | ||||||
Genesco, Inc.* | 1,194 | 64,237 | ||||||
Big 5 Sporting Goods Corp. | 4,111 | 63,721 | ||||||
Anixter International, Inc.* | 967 | 63,580 | ||||||
Veritiv Corp.* | 1,176 | 63,445 | ||||||
Unifi, Inc.* | 2,179 | 62,646 | ||||||
Standard Motor Products, Inc. | 1,280 | 62,592 | ||||||
Bob Evans Farms, Inc.1 | 1,505 | 62,035 | ||||||
MarineMax, Inc.* | 3,099 | 61,825 | ||||||
Arctic Cat, Inc.1 | 4,106 | 61,549 | ||||||
Francesca’s Holdings Corp.* | 3,797 | 61,018 | ||||||
Ruth’s Hospitality Group, Inc. | 3,845 | 60,943 | ||||||
Movado Group, Inc. | 2,756 | 60,770 | ||||||
Sonic Automotive, Inc. — Class A | 3,392 | 60,717 | ||||||
SkyWest, Inc. | 2,012 | 60,662 | ||||||
Fiesta Restaurant Group, Inc.* | 2,296 | 60,614 | ||||||
Dorman Products, Inc.*,1 | 937 | 60,193 | ||||||
Lithia Motors, Inc. — Class A | 696 | 59,703 | ||||||
Tile Shop Holdings, Inc.* | 3,504 | 59,393 | ||||||
Papa John’s International, Inc. | 783 | 59,077 | ||||||
Express, Inc.* | 4,905 | 58,958 | ||||||
Fox Factory Holding Corp.* | 2,715 | 58,916 | ||||||
Monarch Casino & Resort, Inc.* | 2,487 | 58,818 | ||||||
Caleres, Inc. | 2,351 | 58,799 | ||||||
Dave & Buster’s Entertainment, Inc.* | 1,417 | 58,593 | ||||||
Group 1 Automotive, Inc.1 | 971 | 58,522 | ||||||
DineEquity, Inc.1 | 737 | 58,297 | ||||||
ScanSource, Inc.* | 1,662 | 58,170 | ||||||
Hibbett Sports, Inc.*,1 | 1,489 | 57,848 | ||||||
Biglari Holdings, Inc.* | 132 | 57,840 | ||||||
FirstCash, Inc. | 1,225 | 57,820 | ||||||
Popeyes Louisiana Kitchen, Inc.* | 1,079 | 57,597 | ||||||
EZCORP, Inc. — Class A* | 5,886 | 57,389 | ||||||
Lumber Liquidators Holdings, Inc.*,1 | 3,700 | 57,387 | ||||||
PetMed Express, Inc. | 2,884 | 57,305 | ||||||
Steven Madden Ltd.* | 1,714 | 57,248 | ||||||
Core-Mark Holding Company, Inc. | 1,614 | 57,055 | ||||||
G&K Services, Inc. — Class A | 600 | 56,820 | ||||||
Chuy’s Holdings, Inc.* | 1,997 | 56,715 | ||||||
Regis Corp.* | 4,470 | 56,680 | ||||||
Iconix Brand Group, Inc.*,1 | 7,185 | 56,618 | ||||||
ILG, Inc. | 3,438 | 56,314 | ||||||
Allegiant Travel Co. — Class A | 408 | 56,263 | ||||||
Ruby Tuesday, Inc.* | 18,885 | 56,088 | ||||||
Ollie’s Bargain Outlet Holdings, Inc.*,1 | 2,046 | 55,958 | ||||||
Stage Stores, Inc. | 10,981 | 55,893 | ||||||
Ethan Allen Interiors, Inc.1 | 1,815 | 55,720 | ||||||
Universal Electronics, Inc.* | 793 | 55,629 | ||||||
Tailored Brands, Inc. | 3,520 | 55,616 | ||||||
Installed Building Products, Inc.* | 1,680 | 55,524 | ||||||
Hawaiian Holdings, Inc.* | 1,230 | 55,381 | ||||||
Children’s Place, Inc. | 728 | 55,292 | ||||||
Asbury Automotive Group, Inc.* | 1,083 | 55,179 | ||||||
UniFirst Corp. | 450 | 55,125 | ||||||
Perry Ellis International, Inc.* | 2,964 | 55,101 | ||||||
M/I Homes, Inc.*,1 | 2,555 | 54,958 | ||||||
Wolverine World Wide, Inc. | 2,572 | 54,912 | ||||||
Kirkland’s, Inc.* | 4,494 | 54,871 | ||||||
BJ’s Restaurants, Inc.*,1 | 1,518 | 54,800 | ||||||
Shoe Carnival, Inc. | 2,155 | 54,672 | ||||||
Boyd Gaming Corp.* | 3,047 | 54,419 | ||||||
Red Robin Gourmet Burgers, Inc.* | 1,183 | 54,418 | ||||||
Motorcar Parts of America, Inc.* | 2,072 | 54,369 | ||||||
Interface, Inc. — Class A | 3,410 | 54,049 | ||||||
Cooper-Standard Holding, Inc.* | 592 | 54,032 | ||||||
MDC Holdings, Inc. | 2,277 | 53,988 | ||||||
Vitamin Shoppe, Inc.* | 2,139 | 53,582 | ||||||
Cato Corp. — Class A | 1,801 | 53,436 | ||||||
Gentherm, Inc.* | 1,888 | 53,147 | ||||||
American Woodmark Corp.* | 711 | 53,112 | ||||||
La-Z-Boy, Inc. | 2,265 | 53,001 | ||||||
Cavco Industries, Inc.* | 573 | 52,945 | ||||||
Haverty Furniture Companies, Inc. | 2,982 | 52,931 | ||||||
Callaway Golf Co. | 5,167 | 52,755 | ||||||
Five Below, Inc.*,1 | 1,402 | 52,687 | ||||||
Fred’s, Inc. — Class A | 5,758 | 52,571 | ||||||
Oxford Industries, Inc. | 834 | 52,308 | ||||||
Crocs, Inc.* | 6,789 | 52,207 | ||||||
Barnes & Noble, Inc. | 5,037 | 51,881 | ||||||
Meritage Homes Corp.* | 1,670 | 51,687 | ||||||
Sonic Corp. | 2,250 | 51,548 | ||||||
El Pollo Loco Holdings, Inc.*,1 | 4,222 | 51,508 | ||||||
Daktronics, Inc. | 6,148 | 51,336 | ||||||
Barnes & Noble Education, Inc.* | 5,490 | 51,112 | ||||||
Marriott Vacations Worldwide Corp. | 801 | 50,928 | ||||||
G-III Apparel Group Ltd.* | 1,923 | 50,229 | ||||||
Buckle, Inc.1 | 2,399 | 50,019 | ||||||
Wabash National Corp.*,1 | 4,372 | 49,185 | ||||||
50 | GUGGENHEIM ETFs ANNUAL REPORT | SEE NOTES TO FINANCIAL STATEMENTS. |
SCHEDULE OF INVESTMENTS (continued) | October 31, 2016 |
Guggenheim S&P SmallCap 600® Equal Weight ETF |
Shares | Value | |||||||
Mobile Mini, Inc. | 1,934 | $ | 49,027 | |||||
Finish Line, Inc. — Class A | 2,477 | 48,772 | ||||||
Vera Bradley, Inc.* | 3,624 | 48,453 | ||||||
Superior Industries International, Inc. | 1,976 | 48,412 | ||||||
LGI Homes, Inc.*,1 | 1,619 | 48,181 | ||||||
Essendant, Inc. | 3,022 | 46,388 | ||||||
Stein Mart, Inc. | 7,608 | 45,800 | ||||||
Tuesday Morning Corp.* | 9,173 | 45,406 | ||||||
Select Comfort Corp.* | 2,330 | 44,713 | ||||||
Nautilus, Inc.*,1 | 2,465 | 43,384 | ||||||
Total Consumer, Cyclical | 6,153,077 | |||||||
Industrial - 18.0% | ||||||||
Orion Group Holdings, Inc.* | 9,777 | 78,998 | ||||||
II-VI, Inc.* | 2,692 | 74,837 | ||||||
TTM Technologies, Inc.* | 5,575 | 73,311 | ||||||
Olympic Steel, Inc. | 3,048 | 70,378 | ||||||
John Bean Technologies Corp. | 869 | 69,390 | ||||||
Saia, Inc.* | 1,936 | 69,018 | ||||||
Exponent, Inc. | 1,177 | 67,383 | ||||||
AAR Corp. | 2,090 | 67,235 | ||||||
Littelfuse, Inc. | 475 | 66,263 | ||||||
Vicor Corp.* | 5,190 | 66,173 | ||||||
AAON, Inc. | 2,157 | 64,602 | ||||||
Lindsay Corp. | 823 | 64,441 | ||||||
Tetra Tech, Inc. | 1,662 | 63,904 | ||||||
OSI Systems, Inc.* | 904 | 63,399 | ||||||
Gibraltar Industries, Inc.* | 1,617 | 62,900 | ||||||
Atlas Air Worldwide Holdings, Inc.* | 1,503 | 62,901 | ||||||
TimkenSteel Corp.*,1 | 6,122 | 62,751 | ||||||
Applied Industrial Technologies, Inc. | 1,232 | 62,586 | ||||||
Advanced Energy Industries, Inc.* | 1,303 | 62,153 | ||||||
ArcBest Corp. | 3,111 | 61,909 | ||||||
Sturm Ruger & Company, Inc.1 | 1,001 | 61,562 | ||||||
Benchmark Electronics, Inc.* | 2,445 | 61,492 | ||||||
MYR Group, Inc.* | 2,042 | 60,933 | ||||||
Matson, Inc. | 1,518 | 60,629 | ||||||
Knight Transportation, Inc. | 2,071 | 60,577 | ||||||
Harsco Corp. | 6,194 | 60,393 | ||||||
Sanmina Corp.* | 2,178 | 60,222 | ||||||
Moog, Inc. — Class A* | 1,033 | 59,986 | ||||||
Comfort Systems USA, Inc. | 2,073 | 59,806 | ||||||
KapStone Paper and Packaging Corp. | 3,289 | 59,662 | ||||||
Alamo Group, Inc. | 919 | 59,661 | ||||||
US Concrete, Inc.*,1 | 1,184 | 59,081 | ||||||
Bel Fuse, Inc. — Class B | 2,477 | 59,076 | ||||||
Plexus Corp.* | 1,288 | 59,003 | ||||||
Griffon Corp. | 3,533 | 59,001 | ||||||
Aegion Corp. — Class A* | 3,187 | 58,991 | ||||||
Coherent, Inc.* | 565 | 58,828 | ||||||
Rofin-Sinar Technologies, Inc.* | 1,805 | 58,753 | ||||||
Aerovironment, Inc.* | 2,445 | 58,655 | ||||||
Actuant Corp. — Class A | 2,626 | 58,560 | ||||||
Barnes Group, Inc. | 1,466 | 58,405 | ||||||
Lydall, Inc.* | 1,247 | 58,297 | ||||||
FARO Technologies, Inc.* | 1,737 | 58,277 | ||||||
CTS Corp. | 3,195 | 58,149 | ||||||
Tredegar Corp. | 3,142 | 58,127 | ||||||
National Presto Industries, Inc.1 | 666 | 58,109 | ||||||
Itron, Inc.* | 1,077 | 58,050 | ||||||
Astec Industries, Inc. | 1,048 | 58,017 | ||||||
Aerojet Rocketdyne Holdings, Inc.* | 3,292 | 57,939 | ||||||
Tennant Co. | 920 | 57,914 | ||||||
Badger Meter, Inc. | 1,799 | 57,838 | ||||||
Albany International Corp. — Class A | 1,418 | 57,784 | ||||||
Briggs & Stratton Corp. | 3,103 | 57,778 | ||||||
Kaman Corp. | 1,313 | 57,326 | ||||||
ESCO Technologies, Inc. | 1,286 | 57,291 | ||||||
Headwaters, Inc.* | 3,482 | 57,105 | ||||||
SPX Corp.* | 3,003 | 57,087 | ||||||
Franklin Electric Company, Inc. | 1,565 | 57,044 | ||||||
EnPro Industries, Inc. | 1,052 | 56,934 | ||||||
Rogers Corp.* | 1,042 | 56,716 | ||||||
Heartland Express, Inc.1 | 3,061 | 56,322 | ||||||
Simpson Manufacturing Company, Inc. | 1,312 | 56,154 | ||||||
CIRCOR International, Inc. | 1,039 | 55,877 | ||||||
Brady Corp. — Class A | 1,688 | 55,873 | ||||||
Hillenbrand, Inc. | 1,840 | 55,844 | ||||||
Marten Transport Ltd. | 2,712 | 55,596 | ||||||
US Ecology, Inc. | 1,312 | 55,432 | ||||||
Multi-Color Corp. | 853 | 55,381 | ||||||
Fabrinet* | 1,457 | 55,308 | ||||||
Watts Water Technologies, Inc. — Class A | 921 | 55,260 | ||||||
General Cable Corp. | 3,947 | 55,258 | ||||||
Raven Industries, Inc. | 2,562 | 54,955 | ||||||
Federal Signal Corp. | 4,446 | 54,597 | ||||||
Drew Industries, Inc. | 609 | 54,536 | ||||||
Trex Company, Inc.* | 1,010 | 54,348 | ||||||
Park Electrochemical Corp. | 3,512 | 54,190 | ||||||
Powell Industries, Inc. | 1,529 | 54,111 | ||||||
Encore Wire Corp. | 1,579 | 53,923 | ||||||
Electro Scientific Industries, Inc.* | 10,390 | 53,820 | ||||||
Greenbrier Companies, Inc.1 | 1,708 | 53,802 | ||||||
Quanex Building Products Corp. | 3,262 | 53,171 | ||||||
Chart Industries, Inc.* | 1,914 | 53,094 | ||||||
Cubic Corp. | 1,241 | 52,991 | ||||||
Roadrunner Transportation Systems, Inc.* | 6,968 | 52,957 | ||||||
Forward Air Corp. | 1,279 | 52,848 | ||||||
Patrick Industries, Inc.* | 919 | 52,705 | ||||||
Methode Electronics, Inc. | 1,689 | 52,697 | ||||||
TopBuild Corp.* | 1,747 | 52,637 | ||||||
Haynes International, Inc. | 1,634 | 52,566 | ||||||
Mueller Industries, Inc. | 1,735 | 52,553 | ||||||
Myers Industries, Inc. | 4,359 | 52,526 | ||||||
Apogee Enterprises, Inc. | 1,285 | 52,364 | ||||||
Standex International Corp. | 676 | 51,646 | ||||||
TASER International, Inc.*,1 | 2,302 | 51,519 | ||||||
PGT, Inc.* | 5,204 | 50,999 | ||||||
Hub Group, Inc. — Class A* | 1,398 | 50,957 | ||||||
SPX FLOW, Inc.* | 1,992 | 49,979 | ||||||
Echo Global Logistics, Inc.* | 2,339 | 49,587 | ||||||
Proto Labs, Inc.*,1 | 1,097 | 49,036 | ||||||
AZZ, Inc. | 913 | 48,617 | ||||||
SEE NOTES TO FINANCIAL STATEMENTS. | GUGGENHEIM ETFs ANNUAL REPORT | 51 |
SCHEDULE OF INVESTMENTS (continued) | October 31, 2016 |
Guggenheim S&P SmallCap 600® Equal Weight ETF |
Shares | Value | |||||||
Universal Forest Products, Inc. | 565 | $ | 48,584 | |||||
DXP Enterprises, Inc.* | 2,203 | 48,003 | ||||||
Boise Cascade Co.* | 2,336 | 44,968 | ||||||
Celadon Group, Inc. | 6,829 | 44,389 | ||||||
Hornbeck Offshore Services, Inc.*,1 | 10,696 | 42,463 | ||||||
LSB Industries, Inc.*,1 | 5,695 | 30,127 | ||||||
Tidewater, Inc.1 | 17,255 | 29,851 | ||||||
Total Industrial | 6,108,011 | |||||||
Technology - 9.1% | ||||||||
Mercury Systems, Inc.* | 2,583 | 71,756 | ||||||
MicroStrategy, Inc. — Class A* | 340 | 66,235 | ||||||
Super Micro Computer, Inc.* | 2,749 | 65,151 | ||||||
Power Integrations, Inc. | 1,007 | 64,901 | ||||||
Cabot Microelectronics Corp. | 1,174 | 64,875 | ||||||
Tessera Technologies, Inc. | 1,738 | 64,480 | ||||||
Veeco Instruments, Inc.* | 2,954 | 64,102 | ||||||
Quality Systems, Inc. | 4,951 | 63,818 | ||||||
Kulicke & Soffa Industries, Inc.* | 4,796 | 63,499 | ||||||
LivePerson, Inc.*,1 | 7,433 | 63,181 | ||||||
MKS Instruments, Inc. | 1,248 | 62,962 | ||||||
Tangoe, Inc.* | 7,211 | 61,870 | ||||||
Brooks Automation, Inc. | 4,702 | 61,267 | ||||||
Diodes, Inc.* | 2,952 | 61,135 | ||||||
Qualys, Inc.*,1 | 1,639 | 61,053 | ||||||
Computer Programs & Systems, Inc.1 | 2,329 | 60,787 | ||||||
Rudolph Technologies, Inc.* | 3,353 | 60,689 | ||||||
Take-Two Interactive Software, Inc.* | 1,356 | 60,193 | ||||||
Cohu, Inc. | 5,299 | 59,296 | ||||||
Nanometrics, Inc.* | 2,831 | 59,140 | ||||||
Interactive Intelligence Group, Inc.*,1 | 966 | 58,395 | ||||||
TeleTech Holdings, Inc. | 2,072 | 58,222 | ||||||
Exar Corp.* | 6,442 | 58,107 | ||||||
MTS Systems Corp. | 1,216 | 57,821 | ||||||
CEVA, Inc.* | 1,914 | 57,516 | ||||||
Ebix, Inc.1 | 1,026 | 57,456 | ||||||
CACI International, Inc. — Class A* | 586 | 57,340 | ||||||
Kopin Corp.* | 27,219 | 56,888 | ||||||
Insight Enterprises, Inc.* | 1,968 | 56,659 | ||||||
Bottomline Technologies de, Inc.* | 2,496 | 56,634 | ||||||
ManTech International Corp. — Class A | 1,456 | 56,536 | ||||||
DSP Group, Inc.* | 5,121 | 55,819 | ||||||
Engility Holdings, Inc.* | 1,923 | 55,248 | ||||||
Progress Software Corp.* | 2,044 | 55,004 | ||||||
Cray, Inc.* | 2,631 | 54,725 | ||||||
Monotype Imaging Holdings, Inc. | 2,833 | 54,110 | ||||||
Rambus, Inc.* | 4,426 | 53,953 | ||||||
Semtech Corp.* | 2,220 | 53,724 | ||||||
Blackbaud, Inc. | 873 | 53,602 | ||||||
SPS Commerce, Inc.* | 858 | 53,522 | ||||||
Lumentum Holdings, Inc.* | 1,592 | 53,491 | ||||||
Sykes Enterprises, Inc.* | 1,997 | 53,400 | ||||||
Electronics for Imaging, Inc.* | 1,243 | 52,865 | ||||||
Ultratech, Inc.* | 2,458 | 52,331 | ||||||
Medidata Solutions, Inc.*,1 | 1,081 | 51,877 | ||||||
Synchronoss Technologies, Inc.* | 1,410 | 51,761 | ||||||
Agilysys, Inc.* | 5,353 | 51,656 | ||||||
CSG Systems International, Inc. | 1,353 | 51,455 | ||||||
Omnicell, Inc.* | 1,522 | 49,655 | ||||||
ExlService Holdings, Inc.* | 1,121 | 49,358 | ||||||
Ciber, Inc.* | 47,135 | 48,078 | ||||||
Digi International, Inc.* | 5,135 | 46,985 | ||||||
Virtusa Corp.* | 2,258 | 42,767 | ||||||
Donnelley Financial Solutions, Inc.* | 1,904 | 40,841 | ||||||
Total Technology | 3,078,191 | |||||||
Communications - 6.4% | ||||||||
Blucora, Inc.* | 5,423 | 72,126 | ||||||
General Communication, Inc. — Class A* | 4,436 | 70,266 | ||||||
Iridium Communications, Inc.*,1 | 8,354 | 68,085 | ||||||
Spok Holdings, Inc. | 3,505 | 63,265 | ||||||
8x8, Inc.* | 4,402 | 62,729 | ||||||
LogMeIn, Inc. | 651 | 61,845 | ||||||
Harmonic, Inc.*,1 | 12,028 | 61,343 | ||||||
Stamps.com, Inc.*,1 | 627 | 61,164 | ||||||
ATN International, Inc. | 891 | 60,267 | ||||||
Cogent Communications Holdings, Inc. | 1,627 | 60,036 | ||||||
Lumos Networks Corp.* | 4,217 | 59,924 | ||||||
HealthStream, Inc.* | 2,221 | 59,900 | ||||||
Ixia* | 4,981 | 59,523 | ||||||
Inteliquent, Inc. | 3,533 | 59,319 | ||||||
Consolidated Communications Holdings, Inc. | 2,476 | 59,251 | ||||||
NIC, Inc. | 2,557 | 58,683 | ||||||
ePlus, Inc.* | 638 | 58,409 | ||||||
XO Group, Inc.* | 3,139 | 57,758 | ||||||
ADTRAN, Inc. | 3,158 | 57,318 | ||||||
Blue Nile, Inc.1 | 1,640 | 57,285 | ||||||
Cincinnati Bell, Inc.* | 2,898 | 56,946 | ||||||
Scholastic Corp. | 1,488 | 56,916 | ||||||
Shutterstock, Inc.*,1 | 964 | 56,866 | ||||||
Viavi Solutions, Inc.* | 7,699 | 54,817 | ||||||
Perficient, Inc.* | 2,929 | 54,509 | ||||||
TiVo Corp.* | 2,667 | 52,940 | ||||||
Liquidity Services, Inc.* | 5,977 | 52,896 | ||||||
QuinStreet, Inc.* | 18,005 | 52,215 | ||||||
NETGEAR, Inc.* | 1,016 | 51,308 | ||||||
World Wrestling Entertainment, Inc. — Class A | 2,880 | 50,918 | ||||||
FTD Companies, Inc.* | 2,526 | 50,823 | ||||||
Harte-Hanks, Inc. | 36,010 | 50,774 | ||||||
CalAmp Corp.* | 3,850 | 49,742 | ||||||
Black Box Corp. | 4,266 | 49,059 | ||||||
Comtech Telecommunications Corp. | 4,547 | 47,289 | ||||||
EW Scripps Co. — Class A*,1 | 3,559 | 47,192 | ||||||
VASCO Data Security International, Inc.* | 3,205 | 44,069 | ||||||
DHI Group, Inc.* | 7,472 | 42,590 | ||||||
Gannett Company, Inc.1 | 5,072 | 39,409 | ||||||
Total Communications | 2,189,774 | |||||||
Basic Materials - 5.0% | ||||||||
Chemours Co. | 4,525 | 74,346 | ||||||
AK Steel Holding Corp.*,1 | 14,004 | 72,821 | ||||||
Century Aluminum Co.* | 9,876 | 72,193 | ||||||
52 | GUGGENHEIM ETFs ANNUAL REPORT | SEE NOTES TO FINANCIAL STATEMENTS. |
SCHEDULE OF INVESTMENTS (continued) | October 31, 2016 |
Guggenheim S&P SmallCap 600® Equal Weight ETF |
Shares | Value | |||||||
Rayonier Advanced Materials, Inc.1 | 5,408 | $ | 69,925 | |||||
Innophos Holdings, Inc. | 1,455 | 66,697 | ||||||
Balchem Corp. | 872 | 66,185 | ||||||
US Silica Holdings, Inc.1 | 1,424 | 65,775 | ||||||
Quaker Chemical Corp. | 596 | 64,070 | ||||||
Koppers Holdings, Inc.* | 1,918 | 62,815 | ||||||
Stillwater Mining Co.* | 4,679 | 62,324 | ||||||
Calgon Carbon Corp. | 3,894 | 61,525 | ||||||
A. Schulman, Inc. | 2,138 | 61,468 | ||||||
Innospec, Inc. | 1,016 | 61,214 | ||||||
Materion Corp. | 2,003 | 60,691 | ||||||
Neenah Paper, Inc. | 742 | 59,286 | ||||||
Stepan Co. | 834 | 59,239 | ||||||
PH Glatfelter Co. | 2,570 | 57,105 | ||||||
American Vanguard Corp. | 3,721 | 56,559 | ||||||
Schweitzer-Mauduit International, Inc. | 1,523 | 56,214 | ||||||
Aceto Corp. | 3,065 | 56,181 | ||||||
Hawkins, Inc. | 1,378 | 55,602 | ||||||
Ingevity Corp.* | 1,338 | 55,393 | ||||||
HB Fuller Co. | 1,245 | 52,377 | ||||||
Clearwater Paper Corp.* | 955 | 50,711 | ||||||
Kaiser Aluminum Corp. | 691 | 50,091 | ||||||
Deltic Timber Corp. | 829 | 46,573 | ||||||
Intrepid Potash, Inc.* | 43,591 | 45,335 | ||||||
Kraton Corp.* | 1,715 | 43,955 | ||||||
AdvanSix, Inc.* | 2,703 | 43,140 | ||||||
Total Basic Materials | 1,709,810 | |||||||
Energy - 4.7% | ||||||||
Cloud Peak Energy, Inc.* | 14,350 | 88,396 | ||||||
SunCoke Energy, Inc. | 8,589 | 87,694 | ||||||
Helix Energy Solutions Group, Inc.* | 8,258 | 72,010 | ||||||
Exterran Corp.* | 4,068 | 64,315 | ||||||
Gulf Island Fabrication, Inc. | 6,240 | 62,400 | ||||||
Geospace Technologies Corp.*,1 | 3,334 | 61,446 | ||||||
Green Plains, Inc. | 2,333 | 60,658 | ||||||
Archrock, Inc. | 5,144 | 59,670 | ||||||
Era Group, Inc.* | 7,899 | 59,637 | ||||||
FutureFuel Corp. | 5,324 | 58,351 | ||||||
Atwood Oceanics, Inc.1 | 7,599 | 57,980 | ||||||
Synergy Resources Corp.*,1 | 8,464 | 57,893 | ||||||
Unit Corp.* | 3,298 | 56,495 | ||||||
Tesco Corp. | 8,235 | 56,410 | ||||||
REX American Resources Corp.* | 699 | 55,214 | ||||||
Matrix Service Co.* | 3,107 | 54,994 | ||||||
Pioneer Energy Services Corp.* | 15,460 | 54,883 | ||||||
PDC Energy, Inc.* | 872 | 53,480 | ||||||
Newpark Resources, Inc.* | 8,451 | 53,241 | ||||||
TETRA Technologies, Inc.* | 9,536 | 51,971 | ||||||
Carrizo Oil & Gas, Inc.*,1 | 1,534 | 51,895 | ||||||
Bristow Group, Inc.1 | 5,144 | 51,491 | ||||||
SEACOR Holdings, Inc.*,1 | 994 | 49,014 | ||||||
Bill Barrett Corp.*,1 | 8,961 | 46,508 | ||||||
Contango Oil & Gas Co.* | 5,844 | 45,759 | ||||||
Flotek Industries, Inc.*,1 | 3,700 | 43,586 | ||||||
Northern Oil and Gas, Inc.*,1 | 18,405 | 38,651 | ||||||
CARBO Ceramics, Inc.* | 4,725 | 28,823 | ||||||
Total Energy | 1,582,865 | |||||||
Utilities - 1.4% | ||||||||
ALLETE, Inc. | 980 | 60,065 | ||||||
South Jersey Industries, Inc. | 2,019 | 59,863 | ||||||
El Paso Electric Co. | 1,295 | 59,829 | ||||||
American States Water Co.1 | 1,492 | 59,650 | ||||||
Avista Corp. | 1,433 | 59,326 | ||||||
California Water Service Group | 1,897 | 58,807 | ||||||
Northwest Natural Gas Co. | 981 | 57,683 | ||||||
Spire, Inc. | 915 | 57,462 | ||||||
Total Utilities | 472,685 | |||||||
Total Common Stocks | ||||||||
(Cost $31,461,755) | 33,936,104 | |||||||
RIGHT††† - 0.0% | ||||||||
Dyax Corp.2 | 339 | — | ||||||
Total Right | ||||||||
(Cost $—) | — | |||||||
SHORT TERM INVESTMENTS† - 0.1% | ||||||||
Federated U.S. Treasury Cash Reserve Fund Institutional Shares, 0.18%3 | 39,124 | 39,124 | ||||||
Total Short Term Investments | ||||||||
(Cost $39,124) | 39,124 | |||||||
Face | ||||||||
SECURITIES LENDING COLLATERAL††,4 - 9.4% | ||||||||
Joint Repurchase Agreements | ||||||||
Citigroup Global Markets, Inc. | $ | 741,469 | 741,469 | |||||
BNP Paribas Securities Corp. | 741,469 | 741,469 | ||||||
Merrill Lynch, Pierce, Fenner & Smith, Inc. | 741,469 | 741,469 | ||||||
HSBC Securities (USA), Inc. | 741,469 | 741,469 | ||||||
Credit Suisse Securities (USA), LLC | 218,642 | 218,642 | ||||||
Total Securities Lending Collateral | ||||||||
(Cost $3,184,518) | 3,184,518 | |||||||
Total Investments - 109.4% | ||||||||
(Cost $34,685,397) | $ | 37,159,746 | ||||||
Other Assets & Liabilities, net - (9.4)% | (3,181,760 | ) | ||||||
Total Net Assets - 100.0% | $ | 33,977,986 | ||||||
SEE NOTES TO FINANCIAL STATEMENTS. | GUGGENHEIM ETFs ANNUAL REPORT | 53 |
SCHEDULE OF INVESTMENTS (concluded) | October 31, 2016 |
Guggenheim S&P SmallCap 600® Equal Weight ETF |
* | Non-income producing security. |
† | Value determined based on Level 1 inputs — See Note 4. |
†† | Value determined based on Level 2 inputs — See Note 4. |
††† | Value determined based on Level 3 inputs — See Note 4. |
1 | All or portion of this security is on loan at October 31, 2016 — See Note 5. |
2 | This security was fair valued by the Valuation Committee at October 31, 2016. |
3 | Rate indicated is the 7 day yield as of October 31, 2016. |
4 | Securities lending collateral — See Note 5. |
plc — Public Limited Company | |
REIT — Real Estate Investment Trust | |
See Sector Classification in Other Information section. |
The following table summarizes the inputs used to value the Fund’s investments at October 31, 2016 (See Note 4 in the Notes to Financial Statements):
Investments in Securities | Level 1 | Level 2 | Level 3 | Total | ||||||||||||
Common Stocks | $ | 33,936,104 | $ | — | $ | — | $ | 33,936,104 | ||||||||
Right | — | — | — | — | ||||||||||||
Securities Lending Collateral | — | 3,184,518 | — | 3,184,518 | ||||||||||||
Short Term Investments | 39,124 | — | — | 39,124 | ||||||||||||
Total | $ | 33,975,228 | $ | 3,184,518 | $ | — | $ | 37,159,746 | ||||||||
Transfers between investment levels may occur as the markets fluctuate and/or the availability of data used in an investment’s valuation changes. Transfers between valuation levels, if any, are in comparison to the valuation levels at the end of the previous fiscal year, and are effective using the fair value as of the end of the previous fiscal period.
For the year ended October 31, 2016, there were no transfers between levels.
54 | GUGGENHEIM ETFs ANNUAL REPORT | SEE NOTES TO FINANCIAL STATEMENTS. |
SCHEDULE OF INVESTMENTS | October 31, 2016 |
Guggenheim S&P 100® Equal Weight ETF |
Shares | Value | |||||||
COMMON STOCKS† - 99.8% | ||||||||
Consumer, Non-cyclical - 23.4% | ||||||||
PayPal Holdings, Inc.* | 689 | $ | 28,704 | |||||
Mondelez International, Inc. — Class A | 622 | 27,953 | ||||||
Altria Group, Inc. | 421 | 27,836 | ||||||
UnitedHealth Group, Inc. | 196 | 27,701 | ||||||
Kraft Heinz Co. | 305 | 27,130 | ||||||
PepsiCo, Inc. | 252 | 27,014 | ||||||
Danaher Corp. | 340 | 26,707 | ||||||
Procter & Gamble Co. | 304 | 26,387 | ||||||
Colgate-Palmolive Co. | 369 | 26,332 | ||||||
Coca-Cola Co. | 619 | 26,246 | ||||||
Philip Morris International, Inc. | 268 | 25,846 | ||||||
Celgene Corp.* | 251 | 25,647 | ||||||
Johnson & Johnson | 221 | 25,634 | ||||||
Medtronic plc | 308 | 25,262 | ||||||
Abbott Laboratories | 638 | 25,035 | ||||||
Eli Lilly & Co. | 335 | 24,736 | ||||||
Gilead Sciences, Inc. | 335 | 24,666 | ||||||
Biogen, Inc.* | 88 | 24,656 | ||||||
Merck & Company, Inc. | 419 | 24,604 | ||||||
Bristol-Myers Squibb Co. | 481 | 24,488 | ||||||
Pfizer, Inc. | 768 | 24,353 | ||||||
Allergan plc* | 111 | 23,192 | ||||||
AbbVie, Inc. | 413 | 23,037 | ||||||
Amgen, Inc. | 157 | 22,162 | ||||||
Total Consumer, Non-cyclical | 615,328 | |||||||
Financial - 18.3% | ||||||||
Mastercard, Inc. — Class A | 267 | 28,574 | ||||||
MetLife, Inc. | 596 | 27,988 | ||||||
Morgan Stanley | 829 | 27,830 | ||||||
Bank of New York Mellon Corp. | 640 | 27,693 | ||||||
Goldman Sachs Group, Inc. | 155 | 27,627 | ||||||
American International Group, Inc. | 446 | 27,518 | ||||||
Bank of America Corp. | 1,663 | 27,440 | ||||||
Citigroup, Inc. | 555 | 27,278 | ||||||
JPMorgan Chase & Co. | 393 | 27,219 | ||||||
Capital One Financial Corp. | 365 | 27,025 | ||||||
U.S. Bancorp | 603 | 26,990 | ||||||
American Express Co. | 402 | 26,701 | ||||||
Visa, Inc. — Class A | 322 | 26,568 | ||||||
Allstate Corp. | 385 | 26,142 | ||||||
Berkshire Hathaway, Inc. — Class B* | 179 | 25,830 | ||||||
Wells Fargo & Co. | 537 | 24,707 | ||||||
BlackRock, Inc. — Class A | 72 | 24,569 | ||||||
Simon Property Group, Inc. | 125 | 23,245 | ||||||
Total Financial | 480,944 | |||||||
Industrial - 13.0% | ||||||||
Boeing Co. | 204 | 29,055 | ||||||
FedEx Corp. | 163 | 28,414 | ||||||
Lockheed Martin Corp. | 110 | 27,102 | ||||||
Caterpillar, Inc. | 324 | 27,041 | ||||||
General Dynamics Corp. | 175 | 26,380 | ||||||
Raytheon Co. | 192 | 26,229 | ||||||
United Parcel Service, Inc. — Class B | 243 | 26,186 | ||||||
Emerson Electric Co. | 515 | 26,100 | ||||||
United Technologies Corp. | 255 | 26,061 | ||||||
Honeywell International, Inc. | 234 | 25,665 | ||||||
General Electric Co. | 869 | 25,288 | ||||||
Union Pacific Corp. | 282 | 24,867 | ||||||
3M Co. | 149 | 24,630 | ||||||
Total Industrial | 343,018 | |||||||
Consumer, Cyclical - 11.6% | ||||||||
General Motors Co. | 859 | 27,145 | ||||||
Walgreens Boots Alliance, Inc. | 316 | 26,142 | ||||||
Target Corp. | 379 | 26,049 | ||||||
Wal-Mart Stores, Inc. | 372 | 26,047 | ||||||
Costco Wholesale Corp. | 174 | 25,729 | ||||||
McDonald’s Corp. | 228 | 25,666 | ||||||
Starbucks Corp. | 482 | 25,580 | ||||||
Home Depot, Inc. | 205 | 25,013 | ||||||
Lowe’s Companies, Inc. | 373 | 24,860 | ||||||
Ford Motor Co. | 2,115 | 24,830 | ||||||
CVS Health Corp. | 286 | 24,053 | ||||||
NIKE, Inc. — Class B | 473 | 23,735 | ||||||
Total Consumer, Cyclical | 304,849 | |||||||
Communications - 11.2% | ||||||||
Time Warner, Inc. | 340 | 30,257 | ||||||
Priceline Group, Inc.* | 19 | 28,010 | ||||||
Facebook, Inc. — Class A* | 206 | 26,984 | ||||||
Amazon.com, Inc.* | 34 | 26,854 | ||||||
Walt Disney Co. | 283 | 26,231 | ||||||
Cisco Systems, Inc. | 849 | 26,047 | ||||||
Comcast Corp. — Class A | 402 | 24,852 | ||||||
Verizon Communications, Inc. | 505 | 24,290 | ||||||
AT&T, Inc. | 659 | 24,245 | ||||||
Twenty-First Century Fox, Inc. — Class A | 810 | 21,279 | ||||||
Alphabet, Inc. — Class A* | 17 | 13,768 | ||||||
Alphabet, Inc. — Class C* | 17 | 13,337 | ||||||
Twenty-First Century Fox, Inc. — Class B | 312 | 8,234 | ||||||
Total Communications | 294,388 | |||||||
Technology - 8.3% | ||||||||
QUALCOMM, Inc. | 433 | 29,756 | ||||||
Apple, Inc. | 254 | 28,839 | ||||||
Microsoft Corp. | 466 | 27,923 | ||||||
Texas Instruments, Inc. | 393 | 27,843 | ||||||
Accenture plc — Class A | 237 | 27,549 | ||||||
International Business Machines Corp. | 168 | 25,820 | ||||||
Intel Corp. | 739 | 25,769 | ||||||
Oracle Corp. | 654 | 25,127 | ||||||
Total Technology | 218,626 | |||||||
Energy - 7.0% | ||||||||
Halliburton Co. | 624 | 28,704 | ||||||
ConocoPhillips | 634 | 27,547 | ||||||
Chevron Corp. | 259 | 27,130 | ||||||
Schlumberger Ltd. | 338 | 26,442 | ||||||
Exxon Mobil Corp. | 308 | 25,663 | ||||||
SEE NOTES TO FINANCIAL STATEMENTS. | GUGGENHEIM ETFs ANNUAL REPORT | 55 |
SCHEDULE OF INVESTMENTS (concluded) | October 31, 2016 |
Guggenheim S&P 100® Equal Weight ETF |
Shares | Value | |||||||
Occidental Petroleum Corp. | 344 | $ | 25,081 | |||||
Kinder Morgan, Inc. | 1,184 | 24,189 | ||||||
Total Energy | 184,756 | |||||||
Utilities - 4.1% | ||||||||
NextEra Energy, Inc. | 217 | 27,775 | ||||||
Duke Energy Corp. | 344 | 27,527 | ||||||
Exelon Corp. | 784 | 26,711 | ||||||
Southern Co. | 515 | 26,559 | ||||||
Total Utilities | 108,572 | |||||||
Basic Materials - 2.9% | ||||||||
Dow Chemical Co. | 490 | 26,366 | ||||||
EI du Pont de Nemours & Co. | 383 | 26,347 | ||||||
Monsanto Co. | 245 | 24,689 | ||||||
Total Basic Materials | 77,402 | |||||||
Total Common Stocks | ||||||||
(Cost $2,617,661) | 2,627,883 | |||||||
Total Investments - 99.8% | ||||||||
(Cost $2,617,661) | $ | 2,627,883 | ||||||
Other Assets & Liabilities, net - 0.2% | 4,315 | |||||||
Total Net Assets - 100.0% | $ | 2,632,198 | ||||||
* | Non-income producing security. |
† | Value determined based on Level 1 inputs — See Note 4. |
plc -— Public Limited Company | |
See Sector Classification in Other Information section. |
The following table summarizes the inputs used to value the Fund’s investments at October 31, 2016 (See Note 4 in the Notes to Financial Statements):
Investments in Securities | Level 1 | Level 2 | Level 3 | Total | ||||||||||||
Common Stocks | $ | 2,627,883 | $ | — | $ | — | $ | 2,627,883 | ||||||||
Transfers between investment levels may occur as the markets fluctuate and/or the availability of data used in an investment’s valuation changes. Transfers between valuation levels, if any, are in comparison to the valuation levels at the end of the previous fiscal year, and are effective using the fair value as of the end of the previous fiscal period.
For the year ended October 31, 2016, there were no transfers between levels.
56 | GUGGENHEIM ETFs ANNUAL REPORT | SEE NOTES TO FINANCIAL STATEMENTS. |
SCHEDULE OF INVESTMENTS | October 31, 2016 |
Guggenheim S&P 500® Equal Weight Consumer Discretionary ETF | |
Shares | Value | |||||||
COMMON STOCKS† - 99.9% | ||||||||
Retail - 40.9% | ||||||||
The Gap, Inc.1 | 35,788 | $ | 987,392 | |||||
Tiffany & Co.1 | 12,422 | 912,023 | ||||||
Signet Jewelers Ltd.1 | 10,866 | 882,971 | ||||||
Best Buy Company, Inc.1 | 22,664 | 881,856 | ||||||
Darden Restaurants, Inc. | 13,598 | 881,015 | ||||||
Nordstrom, Inc.1 | 16,814 | 874,328 | ||||||
Foot Locker, Inc. | 12,937 | 863,803 | ||||||
Ross Stores, Inc. | 13,748 | 859,800 | ||||||
Macy’s, Inc. | 23,552 | 859,413 | ||||||
AutoZone, Inc.* | 1,157 | 858,679 | ||||||
Kohl’s Corp.1 | 19,483 | 852,381 | ||||||
Ulta Salon Cosmetics & Fragrance, Inc.* | 3,500 | 851,690 | ||||||
L Brands, Inc. | 11,699 | 844,551 | ||||||
PVH Corp. | 7,799 | 834,337 | ||||||
Target Corp. | 12,111 | 832,389 | ||||||
Yum! Brands, Inc. | 9,608 | 828,978 | ||||||
TJX Companies, Inc. | 11,178 | 824,378 | ||||||
McDonald’s Corp. | 7,293 | 820,973 | ||||||
Coach, Inc. | 22,838 | 819,656 | ||||||
Dollar General Corp. | 11,839 | 817,957 | ||||||
Starbucks Corp. | 15,375 | 815,951 | ||||||
Home Depot, Inc. | 6,541 | 798,067 | ||||||
O’Reilly Automotive, Inc.* | 3,003 | 794,113 | ||||||
Genuine Parts Co. | 8,615 | 780,433 | ||||||
AutoNation, Inc.* | 17,719 | 777,333 | ||||||
Bed Bath & Beyond, Inc. | 19,219 | 776,832 | ||||||
Lowe’s Companies, Inc. | 11,643 | 776,006 | ||||||
Urban Outfitters, Inc.* | 23,161 | 774,735 | ||||||
Dollar Tree, Inc.* | 10,237 | 773,405 | ||||||
Advance Auto Parts, Inc. | 5,463 | 765,257 | ||||||
Tractor Supply Co. | 12,213 | 764,900 | ||||||
CarMax, Inc.*,1 | 15,130 | 755,592 | ||||||
Staples, Inc. | 98,079 | 725,785 | ||||||
Chipotle Mexican Grill, Inc. — Class A*,1 | 1,959 | 706,729 | ||||||
Total Retail | 27,973,708 | |||||||
Media - 13.7% | ||||||||
Time Warner, Inc. | 10,851 | 965,631 | ||||||
CBS Corp. — Class B | 16,098 | 911,469 | ||||||
Scripps Networks Interactive, Inc. — Class A1 | 13,515 | 869,825 | ||||||
Viacom, Inc. — Class B | 22,488 | 844,650 | ||||||
Walt Disney Co. | 9,042 | 838,103 | ||||||
Comcast Corp. — Class A | 12,834 | 793,398 | ||||||
Charter Communications, Inc. — Class A* | 3,164 | 790,652 | ||||||
TEGNA, Inc. | 39,566 | 776,285 | ||||||
Twenty-First Century Fox, Inc. — Class A | 25,275 | 663,974 | ||||||
News Corp. — Class A | 48,437 | 587,056 | ||||||
Discovery Communications, Inc. — Class C* | 20,815 | 522,665 | ||||||
Discovery Communications, Inc. — Class A*,1 | 13,969 | 364,731 | ||||||
Twenty-First Century Fox, Inc. — Class B | 9,946 | 262,475 | ||||||
News Corp. — Class B | 13,720 | 170,128 | ||||||
Total Media | 9,361,042 | |||||||
Apparel - 6.9% | ||||||||
Michael Kors Holdings Ltd.* | 17,508 | 889,055 | ||||||
Hanesbrands, Inc. | 32,515 | 835,636 | ||||||
Ralph Lauren Corp. — Class A | 8,295 | 813,740 | ||||||
VF Corp. | 14,301 | 775,257 | ||||||
NIKE, Inc. — Class B | 15,103 | 757,869 | ||||||
Under Armour, Inc. — Class A*,1 | 11,519 | 358,241 | ||||||
Under Armour, Inc. — Class C* | 11,578 | 299,407 | ||||||
Total Apparel | 4,729,205 | |||||||
Internet - 6.8% | ||||||||
Netflix, Inc.* | 8,659 | 1,081,249 | ||||||
Expedia, Inc. | 7,521 | 971,938 | ||||||
TripAdvisor, Inc.* | 13,539 | 872,995 | ||||||
Priceline Group, Inc.* | 591 | 871,270 | ||||||
Amazon.com, Inc.* | 1,099 | 868,012 | ||||||
Total Internet | 4,665,464 | |||||||
Leisure Time - 4.2% | ||||||||
Royal Caribbean Cruises Ltd.1 | 12,665 | 973,559 | ||||||
Harley-Davidson, Inc.1 | 16,524 | 942,198 | ||||||
Carnival Corp. | 18,833 | 924,700 | ||||||
Total Leisure Time | 2,840,457 | |||||||
Lodging - 3.7% | ||||||||
Marriott International, Inc. — Class A | 12,442 | 854,765 | ||||||
Wyndham Worldwide Corp. | 12,495 | 822,671 | ||||||
Wynn Resorts Ltd.1 | 8,491 | 802,824 | ||||||
Total Lodging | 2,480,260 | |||||||
Auto Parts & Equipment - 3.6% | ||||||||
BorgWarner, Inc.1 | 24,477 | 877,256 | ||||||
Goodyear Tire & Rubber Co. | 27,615 | 801,663 | ||||||
Delphi Automotive plc | 12,287 | 799,515 | ||||||
Adient plc* | 1 | 32 | ||||||
Total Auto Parts & Equipment | 2,478,466 | |||||||
Home Furnishings - 3.4% | ||||||||
Harman International Industries, Inc. | 10,325 | 823,006 | ||||||
Leggett & Platt, Inc. | 16,912 | 775,923 | ||||||
Whirlpool Corp. | 5,012 | 750,898 | ||||||
Total Home Furnishings | 2,349,827 | |||||||
Home Builders - 3.4% | ||||||||
DR Horton, Inc. | 27,652 | 797,208 | ||||||
PulteGroup, Inc. | 41,699 | 775,601 | ||||||
Lennar Corp. — Class A | 18,496 | 771,098 | ||||||
Total Home Builders | 2,343,907 | |||||||
Toys, Games & Hobbies - 2.5% | ||||||||
Hasbro, Inc. | 10,454 | 871,968 | ||||||
Mattel, Inc. | 26,336 | 830,374 | ||||||
Total Toys, Games & Hobbies | 1,702,342 | |||||||
SEE NOTES TO FINANCIAL STATEMENTS. | GUGGENHEIM ETFs ANNUAL REPORT | 57 |
SCHEDULE OF INVESTMENTS (concluded) | October 31, 2016 |
Guggenheim S&P 500® Equal Weight Consumer Discretionary ETF | |
Shares | Value | |||||||
Auto Manufacturers - 2.4% | ||||||||
General Motors Co. | 27,416 | $ | 866,346 | |||||
Ford Motor Co. | 67,499 | 792,438 | ||||||
Total Auto Manufacturers | 1,658,784 | |||||||
Advertising - 2.4% | ||||||||
Interpublic Group of Companies, Inc. | 37,339 | 836,020 | ||||||
Omnicom Group, Inc. | 9,978 | 796,444 | ||||||
Total Advertising | 1,632,464 | |||||||
Commercial Services - 1.3% | ||||||||
H&R Block, Inc. | 38,087 | 874,858 | ||||||
Electronics - 1.3% | ||||||||
Garmin Ltd.1 | 17,615 | 851,861 | ||||||
Housewares - 1.2% | ||||||||
Newell Brands, Inc. | 16,580 | 796,172 | ||||||
Distribution & Wholesale - 1.1% | ||||||||
LKQ Corp.* | 23,937 | 772,686 | ||||||
Textiles - 1.1% | ||||||||
Mohawk Industries, Inc.* | 4,106 | 756,736 | ||||||
Total Common Stocks | ||||||||
(Cost $80,260,685) | 68,268,239 | |||||||
SHORT TERM INVESTMENTS† - 0.3% | ||||||||
Federated U.S. Treasury Cash Reserve Fund Institutional Shares, 0.18%2 | 190,489 | 190,489 | ||||||
Total Short Term Investments | ||||||||
(Cost $190,489) | 190,489 | |||||||
Face | ||||||||
SECURITIES LENDING COLLATERAL††,3 - 10.6% | ||||||||
Joint Repurchase Agreements | ||||||||
Citigroup Global Markets, Inc. | $ | 1,685,250 | 1,685,250 | |||||
BNP Paribas Securities Corp. | 1,685,250 | 1,685,250 | ||||||
Merrill Lynch, Pierce, Fenner & Smith, Inc. | 1,685,250 | 1,685,250 | ||||||
HSBC Securities (USA), Inc. | 1,685,250 | 1,685,250 | ||||||
Credit Suisse Securities (USA), LLC | 497,797 | 497,797 | ||||||
Total Securities Lending Collateral | ||||||||
(Cost $7,238,797) | 7,238,797 | |||||||
Total Investments - 110.8% | ||||||||
(Cost $87,689,971) | $ | 75,697,525 | ||||||
Other Assets & Liabilities, net - (10.8)% | (7,374,288 | ) | ||||||
Total Net Assets - 100.0% | $ | 68,323,237 | ||||||
* | Non-income producing security. |
† | Value determined based on Level 1 inputs — See Note 4. |
†† | Value determined based on Level 2 inputs — See Note 4. |
1 | All or portion of this security is on loan at October 31, 2016 — See Note 5. |
2 | Rate indicated is the 7 day yield as of October 31, 2016. |
3 | Securities lending collateral — See Note 5. |
plc — Public Limited Company | |
See Sector Classification in Other Information section. |
The following table summarizes the inputs used to value the Fund’s investments at October 31, 2016 (See Note 4 in the Notes to Financial Statements):
Investments in Securities | Level 1 | Level 2 | Level 3 | Total | ||||||||||||
Common Stocks | $ | 68,268,239 | $ | — | $ | — | $ | 68,268,239 | ||||||||
Securities Lending Collateral | — | 7,238,797 | — | 7,238,797 | ||||||||||||
Short Term Investments | 190,489 | — | — | 190,489 | ||||||||||||
Total | $ | 68,458,728 | $ | 7,238,797 | $ | — | $ | 75,697,525 | ||||||||
Transfers between investment levels may occur as the markets fluctuate and/or the availability of data used in an investment’s valuation changes. Transfers between valuation levels, if any, are in comparison to the valuation levels at the end of the previous fiscal year, and are effective using the fair value as of the end of the previous fiscal period.
For the year ended October 31, 2016, there were no transfers between levels.
58 | GUGGENHEIM ETFs ANNUAL REPORT | SEE NOTES TO FINANCIAL STATEMENTS. |
SCHEDULE OF INVESTMENTS | October 31, 2016 |
Guggenheim S&P 500® Equal Weight Consumer Staples ETF |
Shares | Value | |||||||
COMMON STOCKS† - 99.8% | ||||||||
Food - 37.8% | ||||||||
ConAgra Foods, Inc. | 378,386 | $ | 18,230,637 | |||||
Hormel Foods Corp.1 | 455,191 | 17,524,854 | ||||||
Mondelez International, Inc. — Class A | 389,439 | 17,501,389 | ||||||
Hershey Co. | 170,425 | 17,461,745 | ||||||
Kraft Heinz Co. | 190,656 | 16,958,851 | ||||||
McCormick & Company, Inc. | 170,425 | 16,338,645 | ||||||
Whole Foods Market, Inc.1 | 573,129 | 16,213,820 | ||||||
Campbell Soup Co. | 298,289 | 16,209,024 | ||||||
Kroger Co. | 520,194 | 16,115,610 | ||||||
Tyson Foods, Inc. — Class A | 226,837 | 16,071,401 | ||||||
Kellogg Co. | 212,520 | 15,966,628 | ||||||
Sysco Corp. | 329,145 | 15,838,457 | ||||||
JM Smucker Co. | 120,586 | 15,834,148 | ||||||
General Mills, Inc. | 251,976 | 15,617,472 | ||||||
Total Food | 231,882,681 | |||||||
Beverages - 18.9% | ||||||||
PepsiCo, Inc. | 157,533 | 16,887,538 | ||||||
Constellation Brands, Inc. — Class A | 100,961 | 16,872,602 | ||||||
Molson Coors Brewing Co. — Class B | 161,745 | 16,790,748 | ||||||
Brown-Forman Corp. — Class B1 | 359,617 | 16,603,517 | ||||||
Coca-Cola Co. | 387,772 | 16,441,533 | ||||||
Monster Beverage Corp.* | 111,086 | 16,034,153 | ||||||
Dr Pepper Snapple Group, Inc. | 182,443 | 16,016,671 | ||||||
Total Beverages | 115,646,762 | |||||||
Agriculture - 11.3% | ||||||||
Reynolds American, Inc. | 347,637 | 19,147,846 | ||||||
Altria Group, Inc. | 257,889 | 17,051,621 | ||||||
Archer-Daniels-Midland Co. | 390,089 | 16,996,178 | ||||||
Philip Morris International, Inc. | 168,042 | 16,205,970 | ||||||
Total Agriculture | 69,401,615 | |||||||
Cosmetics & Personal Care - 11.0% | ||||||||
Coty, Inc. — Class A* | 797,809 | 18,341,629 | ||||||
Colgate-Palmolive Co. | 231,316 | 16,506,710 | ||||||
Procter & Gamble Co. | 190,068 | 16,497,902 | ||||||
Estee Lauder Companies, Inc. — Class A | 187,222 | 16,312,653 | ||||||
Total Cosmetics & Personal Care | 67,658,894 | |||||||
Retail - 10.4% | ||||||||
Walgreens Boots Alliance, Inc. | 197,676 | 16,353,736 | ||||||
Wal-Mart Stores, Inc. | 233,162 | 16,326,003 | ||||||
Costco Wholesale Corp. | 108,767 | 16,083,376 | ||||||
CVS Health Corp. | 179,104 | 15,062,646 | ||||||
Total Retail | 63,825,761 | |||||||
Household Products & Housewares - 7.8% | ||||||||
Church & Dwight Company, Inc. | 345,880 | 16,692,169 | ||||||
Clorox Co. | 133,378 | 16,008,027 | ||||||
Kimberly-Clark Corp. | 133,307 | 15,251,654 | ||||||
Total Household Products & Housewares | 47,951,850 | |||||||
Pharmaceuticals - 2.6% | ||||||||
Mead Johnson Nutrition Co. — Class A | 211,280 | 15,797,406 | ||||||
Total Common Stocks | ||||||||
(Cost $609,980,259) | 612,164,969 | |||||||
SHORT TERM INVESTMENTS† - 0.2% | ||||||||
Federated U.S. Treasury Cash Reserve Fund Institutional Shares, 0.18%2 | 1,002,162 | 1,002,162 | ||||||
Total Short Term Investments | ||||||||
(Cost $1,002,162) | 1,002,162 | |||||||
Face | ||||||||
SECURITIES LENDING COLLATERAL††,3 - 0.0% | ||||||||
Joint Repurchase Agreements | ||||||||
Citigroup Global Markets, Inc. | $ | 243,818 | 243,818 | |||||
Total Securities Lending Collateral | ||||||||
(Cost $243,818) | 243,818 | |||||||
Total Investments - 100.0% | ||||||||
(Cost $611,226,239) | $ | 613,410,949 | ||||||
Other Assets & Liabilities, net - 0.0% | 249,655 | |||||||
Total Net Assets - 100.0% | $ | 613,660,604 | ||||||
* | Non-income producing security. |
† | Value determined based on Level 1 inputs — See Note 4. |
†† | Value determined based on Level 2 inputs — See Note 4. |
1 | All or portion of this security is on loan at October 31, 2016 — See Note 5. |
2 | Rate indicated is the 7 day yield as of October 31, 2016. |
3 | Securities lending collateral — See Note 5. |
See Sector Classification in Other Information section. |
SEE NOTES TO FINANCIAL STATEMENTS. | GUGGENHEIM ETFs ANNUAL REPORT | 59 |
SCHEDULE OF INVESTMENTS (concluded) | October 31, 2016 |
Guggenheim S&P 500® Equal Weight Consumer Staples ETF |
The following table summarizes the inputs used to value the Fund’s investments at October 31, 2016 (See Note 4 in the Notes to Financial Statements):
Investments in Securities | Level 1 | Level 2 | Level 3 | Total | ||||||||||||
Common Stocks | $ | 612,164,969 | $ | — | $ | — | $ | 612,164,969 | ||||||||
Securities Lending Collateral | — | 243,818 | — | 243,818 | ||||||||||||
Short Term Investments | 1,002,162 | — | — | 1,002,162 | ||||||||||||
Total | $ | 613,167,131 | $ | 243,818 | $ | — | $ | 613,410,949 | ||||||||
Transfers between investment levels may occur as the markets fluctuate and/or the availability of data used in an investment’s valuation changes. Transfers between valuation levels, if any, are in comparison to the valuation levels at the end of the previous fiscal year, and are effective using the fair value as of the end of the previous fiscal period.
For the year ended October 31, 2016, there were no transfers between levels.
60 | GUGGENHEIM ETFs ANNUAL REPORT | SEE NOTES TO FINANCIAL STATEMENTS. |
SCHEDULE OF INVESTMENTS | October 31, 2016 |
Guggenheim S&P 500® Equal Weight Energy ETF |
Shares | Value | |||||||
COMMON STOCKS† - 99.9% | ||||||||
Oil & Gas - 73.4% | ||||||||
Valero Energy Corp. | 103,958 | $ | 6,158,471 | |||||
Tesoro Corp. | 72,143 | 6,129,991 | ||||||
Helmerich & Payne, Inc. | 95,429 | 6,022,524 | ||||||
Phillips 66 | 73,331 | 5,950,811 | ||||||
Chevron Corp. | 56,379 | 5,905,699 | ||||||
Marathon Petroleum Corp. | 135,168 | 5,891,973 | ||||||
Anadarko Petroleum Corp. | 98,832 | 5,874,573 | ||||||
ConocoPhillips | 135,135 | 5,871,616 | ||||||
Apache Corp. | 96,119 | 5,717,158 | ||||||
Pioneer Natural Resources Co. | 31,613 | 5,659,359 | ||||||
Cimarex Energy Co. | 43,712 | 5,644,531 | ||||||
Transocean Ltd.*,1 | 580,824 | 5,581,719 | ||||||
EOG Resources, Inc. | 61,624 | 5,572,042 | ||||||
Concho Resources, Inc.*,1 | 43,761 | 5,555,021 | ||||||
Hess Corp. | 114,374 | 5,486,521 | ||||||
Exxon Mobil Corp. | 65,746 | 5,477,957 | ||||||
Occidental Petroleum Corp. | 75,015 | 5,469,344 | ||||||
Noble Energy, Inc. | 158,246 | 5,454,740 | ||||||
Murphy Oil Corp.1 | 204,350 | 5,286,535 | ||||||
Newfield Exploration Co.* | 128,217 | 5,204,328 | ||||||
Equities Corp. | 78,707 | 5,194,662 | ||||||
Devon Energy Corp. | 131,676 | 4,989,204 | ||||||
Marathon Oil Corp. | 364,359 | 4,802,252 | ||||||
Cabot Oil & Gas Corp. — Class A | 219,089 | 4,574,578 | ||||||
Range Resources Corp. | 135,168 | 4,567,327 | ||||||
Chesapeake Energy Corp.*,1 | 749,281 | 4,128,538 | ||||||
Southwestern Energy Co.* | 387,875 | 4,030,021 | ||||||
Total Oil & Gas | 146,201,495 | |||||||
Oil & Gas Services - 15.4% | ||||||||
FMC Technologies, Inc.* | 205,303 | 6,625,128 | ||||||
Baker Hughes, Inc. | 116,189 | 6,436,871 | ||||||
Halliburton Co. | 136,101 | 6,260,646 | ||||||
Schlumberger Ltd. | 73,613 | 5,758,745 | ||||||
National Oilwell Varco, Inc. | 172,231 | 5,528,615 | ||||||
Total Oil & Gas Services | 30,610,005 | |||||||
Pipelines - 11.1% | ||||||||
ONEOK, Inc. | 116,974 | 5,665,051 | ||||||
Spectra Energy Corp. | 133,399 | 5,577,412 | ||||||
Williams Companies, Inc. | 190,061 | 5,549,781 | ||||||
Kinder Morgan, Inc. | 258,113 | 5,273,249 | ||||||
Total Pipelines | 22,065,493 | |||||||
Total Common Stocks | ||||||||
(Cost $206,020,697) | 198,876,993 | |||||||
SHORT TERM INVESTMENTS† - 0.1% | ||||||||
Federated U.S. Treasury Cash Reserve Fund Institutional Shares, 0.18%2 | 182,621 | 182,621 | ||||||
Total Short Term Investments | ||||||||
(Cost $182,621) | 182,621 | |||||||
Face | ||||||||
SECURITIES LENDING COLLATERAL††,3 - 5.1% | ||||||||
Joint Repurchase Agreements | ||||||||
Citigroup Global Markets, Inc. | $ | 2,391,907 | 2,391,907 | |||||
BNP Paribas Securities Corp. | 2,391,907 | 2,391,907 | ||||||
Merrill Lynch, Pierce, Fenner & Smith, Inc. | 2,391,907 | 2,391,907 | ||||||
HSBC Securities (USA), Inc. | 2,391,907 | 2,391,907 | ||||||
Credit Suisse Securities (USA), LLC | 704,958 | 704,958 | ||||||
Total Securities Lending Collateral | ||||||||
(Cost $10,272,586) | 10,272,586 | |||||||
Total Investments - 105.1% | ||||||||
(Cost $216,475,904) | $ | 209,332,200 | ||||||
Other Assets & Liabilities, net - (5.1)% | (10,168,542 | ) | ||||||
Total Net Assets - 100.0% | $ | 199,163,658 | ||||||
SEE NOTES TO FINANCIAL STATEMENTS. | GUGGENHEIM ETFs ANNUAL REPORT | 61 |
SCHEDULE OF INVESTMENTS (concluded) | October 31, 2016 |
Guggenheim S&P 500® Equal Weight Energy ETF |
* | Non-income producing security. |
† | Value determined based on Level 1 inputs — See Note 4. |
†† | Value determined based on Level 2 inputs — See Note 4. |
1 | All or portion of this security is on loan at October 31, 2016 — See Note 5. |
2 | Rate indicated is the 7 day yield as of October 31, 2016. |
3 | Securities lending collateral — See Note 5. |
See Sector Classification in Other Information section. |
The following table summarizes the inputs used to value the Fund’s investments at October 31, 2016 (See Note 4 in the Notes to Financial Statements):
Investments in Securities | Level 1 | Level 2 | Level 3 | Total | ||||||||||||
Common Stocks | $ | 198,876,993 | $ | — | $ | — | $ | 198,876,993 | ||||||||
Securities Lending Collateral | — | 10,272,586 | — | 10,272,586 | ||||||||||||
Short Term Investments | 182,621 | — | — | 182,621 | ||||||||||||
Total | $ | 199,059,614 | $ | 10,272,586 | $ | — | $ | 209,332,200 | ||||||||
Transfers between investment levels may occur as the markets fluctuate and/or the availability of data used in an investment’s valuation changes. Transfers between valuation levels, if any, are in comparison to the valuation levels at the end of the previous fiscal year, and are effective using the fair value as of the end of the previous fiscal period.
For the year ended October 31, 2016, there were no transfers between levels.
62 | GUGGENHEIM ETFs ANNUAL REPORT | SEE NOTES TO FINANCIAL STATEMENTS. |
SCHEDULE OF INVESTMENTS | October 31, 2016 |
Guggenheim S&P 500® Equal Weight Financials ETF |
Shares | Value | |||||||
COMMON STOCKS† - 99.6% | ||||||||
Banks - 35.8% | ||||||||
KeyCorp | 144,111 | $ | 2,034,846 | |||||
Comerica, Inc. | 38,242 | 1,992,026 | ||||||
Fifth Third Bancorp | 88,652 | 1,929,068 | ||||||
Regions Financial Corp. | 179,736 | 1,924,973 | ||||||
Huntington Bancshares, Inc. | 179,189 | 1,899,403 | ||||||
PNC Financial Services Group, Inc. | 19,649 | 1,878,444 | ||||||
Morgan Stanley | 55,930 | 1,877,571 | ||||||
Citizens Financial Group, Inc. | 71,212 | 1,875,723 | ||||||
Bank of New York Mellon Corp. | 43,166 | 1,867,793 | ||||||
Goldman Sachs Group, Inc. | 10,479 | 1,867,777 | ||||||
Zions Bancorporation | 57,795 | 1,861,577 | ||||||
Northern Trust Corp. | 25,625 | 1,855,763 | ||||||
Bank of America Corp. | 112,248 | 1,852,092 | ||||||
M&T Bank Corp. | 15,090 | 1,851,996 | ||||||
SunTrust Banks, Inc. | 40,718 | 1,841,675 | ||||||
Citigroup, Inc. | 37,455 | 1,840,913 | ||||||
JPMorgan Chase & Co. | 26,509 | 1,836,013 | ||||||
Capital One Financial Corp. | 24,660 | 1,825,826 | ||||||
U.S. Bancorp | 40,701 | 1,821,777 | ||||||
BB&T Corp. | 46,252 | 1,813,078 | ||||||
State Street Corp. | 25,348 | 1,779,683 | ||||||
Wells Fargo & Co. | 36,262 | 1,668,415 | ||||||
Total Banks | 40,996,432 | |||||||
Insurance - 34.2% | ||||||||
Principal Financial Group, Inc. | 36,527 | 1,994,375 | ||||||
Hartford Financial Services Group, Inc. | 43,039 | 1,898,449 | ||||||
Prudential Financial, Inc. | 22,314 | 1,892,004 | ||||||
MetLife, Inc. | 40,235 | 1,889,436 | ||||||
American International Group, Inc. | 30,115 | 1,858,096 | ||||||
Lincoln National Corp. | 37,615 | 1,846,520 | ||||||
Loews Corp. | 42,872 | 1,844,782 | ||||||
Willis Towers Watson plc | 14,476 | 1,822,529 | ||||||
Chubb Ltd. | 14,216 | 1,805,432 | ||||||
Aon plc | 16,218 | 1,797,441 | ||||||
XL Group Ltd. | 51,525 | 1,787,918 | ||||||
Progressive Corp. | 56,555 | 1,782,048 | ||||||
Unum Group | 50,121 | 1,774,283 | ||||||
Allstate Corp. | 25,998 | 1,765,264 | ||||||
Torchmark Corp. | 27,448 | 1,740,478 | ||||||
Berkshire Hathaway, Inc. — Class B* | 12,050 | 1,738,815 | ||||||
Arthur J Gallagher & Co. | 35,934 | 1,733,097 | ||||||
Marsh & McLennan Companies, Inc. | 26,773 | 1,697,140 | ||||||
Aflac, Inc. | 24,401 | 1,680,497 | ||||||
Travelers Companies, Inc. | 15,439 | 1,670,191 | ||||||
Cincinnati Financial Corp. | 23,401 | 1,656,323 | ||||||
Assurant, Inc. | 19,801 | 1,594,377 | ||||||
Total Insurance | 39,269,495 | |||||||
Diversified Financial Services - 23.5% | ||||||||
Synchrony Financial | 65,607 | 1,875,704 | ||||||
E*TRADE Financial Corp.* | 66,546 | 1,873,935 | ||||||
Charles Schwab Corp. | 57,645 | 1,827,347 | ||||||
American Express Co. | 27,129 | 1,801,908 | ||||||
Discover Financial Services | 30,076 | 1,694,181 | ||||||
Intercontinental Exchange, Inc. | 6,259 | 1,692,370 | ||||||
T. Rowe Price Group, Inc. | 26,180 | 1,675,782 | ||||||
Franklin Resources, Inc. | 49,656 | 1,671,421 | ||||||
CME Group, Inc. — Class A | 16,659 | 1,667,566 | ||||||
BlackRock, Inc. — Class A | 4,877 | 1,664,227 | ||||||
Nasdaq, Inc. | 25,614 | 1,638,528 | ||||||
Affiliated Managers Group, Inc.* | 12,269 | 1,627,606 | ||||||
Invesco Ltd. | 57,399 | 1,612,338 | ||||||
Navient Corp. | 124,161 | 1,586,778 | ||||||
Ameriprise Financial, Inc. | 17,771 | 1,570,779 | ||||||
Legg Mason, Inc. | 51,645 | 1,483,244 | ||||||
Total Diversified Financial Services | 26,963,714 | |||||||
Commercial Services - 3.0% | ||||||||
S&P Global, Inc. | 14,454 | 1,761,220 | ||||||
Moody’s Corp. | 16,571 | 1,665,717 | ||||||
Total Commercial Services | 3,426,937 | |||||||
Savings & Loans - 1.6% | ||||||||
People’s United Financial, Inc. | 109,876 | 1,784,386 | ||||||
Holding Companies-Diversified - 1.5% | ||||||||
Leucadia National Corp. | 93,088 | 1,737,953 | ||||||
Total Common Stocks | ||||||||
(Cost $116,422,522) | 114,178,917 | |||||||
SHORT TERM INVESTMENTS† - 0.4% | ||||||||
Federated U.S. Treasury Cash Reserve Fund Institutional Shares, 0.18%1 | 410,910 | 410,910 | ||||||
Total Short Term Investments | ||||||||
(Cost $410,910) | 410,910 | |||||||
Total Investments - 100.0% | ||||||||
(Cost $116,833,432) | $ | 114,589,827 | ||||||
Other Assets & Liabilities, net - 0.0% | 59,672 | |||||||
Total Net Assets - 100.0% | $ | 114,649,499 | ||||||
* | Non-income producing security. |
† | Value determined based on Level 1 inputs — See Note 4. |
1 | Rate indicated is the 7 day yield as of October 31, 2016. |
plc — Public Limited Company | |
See Sector Classification in Other Information section. |
SEE NOTES TO FINANCIAL STATEMENTS. | GUGGENHEIM ETFs ANNUAL REPORT | 63 |
SCHEDULE OF INVESTMENTS (concluded) | October 31, 2016 |
Guggenheim S&P 500® Equal Weight Financials ETF |
The following table summarizes the inputs used to value the Fund’s investments at October 31, 2016 (See Note 4 in the Notes to Financial Statements):
Investments in Securities | Level 1 | Level 2 | Level 3 | Total | ||||||||||||
Common Stocks | $ | 114,178,917 | $ | — | $ | — | $ | 114,178,917 | ||||||||
Short Term Investments | 410,910 | — | — | 410,910 | ||||||||||||
Total | $ | 114,589,827 | $ | — | $ | — | $ | 114,589,827 | ||||||||
Transfers between investment levels may occur as the markets fluctuate and/or the availability of data used in an investment’s valuation changes. Transfers between valuation levels, if any, are in comparison to the valuation levels at the end of the previous fiscal year, and are effective using the fair value as of the end of the previous fiscal period.
For the year ended October 31, 2016, there were no transfers between levels.
64 | GUGGENHEIM ETFs ANNUAL REPORT | SEE NOTES TO FINANCIAL STATEMENTS. |
SCHEDULE OF INVESTMENTS | October 31, 2016 |
Guggenheim S&P 500® Equal Weight Health Care ETF |
Shares | Value | |||||||
COMMON STOCKS† - 99.9% | ||||||||
Healthcare-Products - 33.2% | ||||||||
Baxter International, Inc. | 188,934 | $ | 8,991,369 | |||||
Stryker Corp. | 77,064 | 8,889,332 | ||||||
Thermo Fisher Scientific, Inc. | 59,289 | 8,717,262 | ||||||
Danaher Corp. | 110,609 | 8,688,337 | ||||||
CR Bard, Inc. | 39,891 | 8,643,582 | ||||||
Cooper Companies, Inc. | 48,470 | 8,532,659 | ||||||
St. Jude Medical, Inc. | 109,160 | 8,497,014 | ||||||
Intuitive Surgical, Inc.* | 12,596 | 8,465,520 | ||||||
Becton Dickinson and Co. | 49,816 | 8,364,605 | ||||||
DENTSPLY SIRONA, Inc. | 144,319 | 8,308,445 | ||||||
Hologic, Inc.* | 229,255 | 8,255,473 | ||||||
Varian Medical Systems, Inc.* | 90,985 | 8,255,069 | ||||||
Medtronic plc | 100,377 | 8,232,922 | ||||||
Abbott Laboratories | 207,731 | 8,151,364 | ||||||
Patterson Companies, Inc.1 | 189,228 | 8,081,928 | ||||||
Henry Schein, Inc.*,1 | 53,624 | 8,000,701 | ||||||
Boston Scientific Corp.* | 362,363 | 7,971,986 | ||||||
Zimmer Biomet Holdings, Inc. | 67,991 | 7,166,251 | ||||||
Edwards Lifesciences Corp.* | 74,338 | 7,078,464 | ||||||
Total Healthcare-Products | 157,292,283 | |||||||
Pharmaceuticals - 25.8% | ||||||||
Johnson & Johnson | 72,055 | 8,357,658 | ||||||
Zoetis, Inc. | 169,063 | 8,081,211 | ||||||
Express Scripts Holding Co.* | 119,767 | 8,072,296 | ||||||
Eli Lilly & Co. | 108,883 | 8,039,921 | ||||||
Merck & Company, Inc. | 136,328 | 8,005,180 | ||||||
Perrigo Company plc | 96,032 | 7,988,902 | ||||||
Endo International plc* | 425,213 | 7,972,744 | ||||||
Pfizer, Inc. | 249,829 | 7,922,078 | ||||||
Mylan N.V.* | 213,563 | 7,795,050 | ||||||
Bristol-Myers Squibb Co. | 153,055 | 7,792,030 | ||||||
Allergan plc* | 36,036 | 7,529,362 | ||||||
AbbVie, Inc. | 134,454 | 7,499,844 | ||||||
Cardinal Health, Inc. | 108,095 | 7,425,046 | ||||||
AmerisourceBergen Corp. — Class A | 99,857 | 7,021,944 | ||||||
Mallinckrodt plc* | 116,589 | 6,909,064 | ||||||
McKesson Corp. | 48,376 | 6,151,976 | ||||||
Total Pharmaceuticals | 122,564,306 | |||||||
Healthcare-Services - 19.1% | ||||||||
UnitedHealth Group, Inc. | 63,753 | 9,010,212 | ||||||
HCA Holdings, Inc.* | 112,180 | 8,585,136 | ||||||
Quest Diagnostics, Inc. | 105,276 | 8,573,677 | ||||||
Universal Health Services, Inc. — Class B | 70,926 | 8,561,477 | ||||||
Humana, Inc. | 48,265 | 8,278,895 | ||||||
Anthem, Inc. | 67,135 | 8,181,071 | ||||||
Centene Corp.* | 127,434 | 7,962,076 | ||||||
Aetna, Inc. | 73,725 | 7,914,379 | ||||||
Laboratory Corporation of America Holdings* | 63,093 | 7,908,077 | ||||||
Cigna Corp. | 66,322 | 7,881,043 | ||||||
DaVita, Inc.* | 133,840 | 7,845,701 | ||||||
Total Healthcare-Services | 90,701,744 | |||||||
Biotechnology - 13.1% | ||||||||
Alexion Pharmaceuticals, Inc.* | 68,196 | 8,899,578 | ||||||
Celgene Corp.* | 81,545 | 8,332,268 | ||||||
Biogen, Inc.* | 28,769 | 8,060,498 | ||||||
Gilead Sciences, Inc. | 109,148 | 8,036,567 | ||||||
Regeneron Pharmaceuticals, Inc.*,1 | 22,158 | 7,644,953 | ||||||
Amgen, Inc. | 51,149 | 7,220,193 | ||||||
Illumina, Inc.* | 51,677 | 7,035,307 | ||||||
Vertex Pharmaceuticals, Inc.* | 90,938 | 6,898,557 | ||||||
Total Biotechnology | 62,127,921 | |||||||
Electronics - 7.0% | ||||||||
Mettler-Toledo International, Inc.* | 21,911 | 8,853,797 | ||||||
Agilent Technologies, Inc. | 189,820 | 8,270,457 | ||||||
PerkinElmer, Inc. | 161,498 | 8,218,634 | ||||||
Waters Corp.* | 56,367 | 7,842,904 | ||||||
Total Electronics | 33,185,792 | |||||||
Software - 1.7% | ||||||||
Cerner Corp.*,1 | 136,920 | 8,020,774 | ||||||
Total Common Stocks | ||||||||
(Cost $511,388,780) | 473,892,820 | |||||||
SHORT TERM INVESTMENTS† - 0.9% | ||||||||
Federated U.S. Treasury Cash Reserve Fund Institutional Shares, 0.18%2 | 4,471,316 | 4,471,316 | ||||||
Total Short Term Investments | ||||||||
(Cost $4,471,316) | 4,471,316 | |||||||
Total Investments - 100.8% | ||||||||
(Cost $515,860,096) | $ | 478,364,136 | ||||||
Other Assets & Liabilities, net - (0.8)% | (3,870,371 | ) | ||||||
Total Net Assets - 100.0% | $ | 474,493,765 | ||||||
* | Non-income producing security. |
† | Value determined based on Level 1 inputs — See Note 4. |
1 | All or portion of this security is on loan at October 31, 2016 — See Note 5. |
2 | Rate indicated is the 7 day yield as of October 31, 2016. |
plc — Public Limited Company | |
See Sector Classification in Other Information section. |
SEE NOTES TO FINANCIAL STATEMENTS. | GUGGENHEIM ETFs ANNUAL REPORT | 65 |
SCHEDULE OF INVESTMENTS (concluded) | October 31, 2016 |
Guggenheim S&P 500® Equal Weight Health Care ETF |
The following table summarizes the inputs used to value the Fund’s investments at October 31, 2016 (See Note 4 in the Notes to Financial Statements):
Investments in Securities | Level 1 | Level 2 | Level 3 | Total | ||||||||||||
Common Stocks | $ | 473,892,820 | $ | — | $ | — | $ | 473,892,820 | ||||||||
Short Term Investments | 4,471,316 | — | — | 4,471,316 | ||||||||||||
Total | $ | 478,364,136 | $ | — | $ | — | $ | 478,364,136 | ||||||||
Transfers between investment levels may occur as the markets fluctuate and/or the availability of data used in an investment’s valuation changes. Transfers between valuation levels, if any, are in comparison to the valuation levels at the end of the previous fiscal year, and are effective using the fair value as of the end of the previous fiscal period.
For the year ended October 31, 2016, there were no transfers between levels.
66 | GUGGENHEIM ETFs ANNUAL REPORT | SEE NOTES TO FINANCIAL STATEMENTS. |
SCHEDULE OF INVESTMENTS | October 31, 2016 |
Guggenheim S&P 500® Equal Weight Industrials ETF |
Shares | Value | |||||||
COMMON STOCKS† - 99.7% | ||||||||
Transportation - 14.9% | ||||||||
CSX Corp. | 66,672 | $ | 2,034,163 | |||||
FedEx Corp. | 11,559 | 2,014,965 | ||||||
Ryder System, Inc.1 | 28,629 | 1,986,566 | ||||||
J.B. Hunt Transport Services, Inc. | 23,885 | 1,949,255 | ||||||
Norfolk Southern Corp. | 20,484 | 1,905,012 | ||||||
Expeditors International of Washington, Inc. | 36,770 | 1,892,552 | ||||||
United Parcel Service, Inc. — Class B | 17,277 | 1,861,770 | ||||||
CH Robinson Worldwide, Inc.1 | 26,987 | 1,838,354 | ||||||
Union Pacific Corp. | 20,054 | 1,768,362 | ||||||
Kansas City Southern | 19,961 | 1,751,777 | ||||||
Total Transportation | 19,002,776 | |||||||
Aerospace & Defense - 13.4% | ||||||||
Boeing Co. | 14,467 | 2,060,536 | ||||||
Northrop Grumman Corp. | 8,886 | 2,034,894 | ||||||
Rockwell Collins, Inc. | 22,857 | 1,927,302 | ||||||
Lockheed Martin Corp. | 7,814 | 1,925,213 | ||||||
General Dynamics Corp. | 12,404 | 1,869,779 | ||||||
Raytheon Co. | 13,664 | 1,866,639 | ||||||
United Technologies Corp. | 18,109 | 1,850,740 | ||||||
TransDigm Group, Inc. | 6,560 | 1,787,338 | ||||||
L-3 Communications Holdings, Inc. | 12,648 | 1,732,017 | ||||||
Total Aerospace & Defense | 17,054,458 | |||||||
Miscellaneous Manufacturing - 13.0% | ||||||||
Ingersoll-Rand plc | 29,467 | 1,982,835 | ||||||
Parker-Hannifin Corp. | 15,395 | 1,889,736 | ||||||
Textron, Inc. | 46,684 | 1,871,095 | ||||||
Eaton Corporation plc | 29,250 | 1,865,273 | ||||||
Illinois Tool Works, Inc. | 16,060 | 1,823,934 | ||||||
Dover Corp. | 26,930 | 1,801,348 | ||||||
General Electric Co. | 61,755 | 1,797,071 | ||||||
3M Co. | 10,587 | 1,750,031 | ||||||
Pentair plc1 | 31,048 | 1,711,676 | ||||||
Total Miscellaneous Manufacturing | 16,492,999 | |||||||
Commercial Services - 10.0% | ||||||||
Quanta Services, Inc.* | 73,438 | 2,111,344 | ||||||
Robert Half International, Inc. | 49,851 | 1,865,424 | ||||||
Verisk Analytics, Inc. — Class A* | 22,687 | 1,850,125 | ||||||
United Rentals, Inc.* | 23,870 | 1,806,004 | ||||||
Equifax, Inc. | 14,184 | 1,758,390 | ||||||
Cintas Corp. | 16,338 | 1,742,774 | ||||||
Nielsen Holdings plc | 35,759 | 1,609,870 | ||||||
Total Commercial Services | 12,743,931 | |||||||
Machinery-Diversified - 9.0% | ||||||||
Cummins, Inc. | 15,918 | 2,034,639 | ||||||
Deere & Co. | 22,613 | 1,996,728 | ||||||
Rockwell Automation, Inc. | 16,528 | 1,978,732 | ||||||
Xylem, Inc. | 38,221 | 1,847,221 | ||||||
Roper Technologies, Inc. | 10,562 | 1,830,500 | ||||||
Flowserve Corp.1 | 40,212 | 1,702,978 | ||||||
Total Machinery-Diversified | 11,390,798 | |||||||
Airlines - 7.8% | ||||||||
Delta Air Lines, Inc. | 49,257 | 2,057,465 | ||||||
Southwest Airlines Co. | 49,797 | 1,994,370 | ||||||
United Continental Holdings, Inc.* | 35,452 | 1,993,466 | ||||||
American Airlines Group, Inc. | 48,309 | 1,961,345 | ||||||
Alaska Air Group, Inc.1 | 27,004 | 1,950,229 | ||||||
Total Airlines | 9,956,875 | |||||||
Electronics - 5.9% | ||||||||
Johnson Controls International plc | 48,573 | 1,958,463 | ||||||
Fortive Corp. | 36,785 | 1,877,874 | ||||||
Honeywell International, Inc. | 16,694 | 1,830,998 | ||||||
Allegion plc | 27,823 | 1,776,220 | ||||||
Total Electronics | 7,443,555 | |||||||
Environmental Control - 4.5% | ||||||||
Republic Services, Inc. — Class A | 37,549 | 1,976,204 | ||||||
Waste Management, Inc. | 29,632 | 1,945,637 | ||||||
Stericycle, Inc.*,1 | 22,658 | 1,814,679 | ||||||
Total Environmental Control | 5,736,520 | |||||||
Electrical Components & Equipment - 4.0% | ||||||||
Emerson Electric Co. | 36,560 | 1,852,860 | ||||||
AMETEK, Inc. | 38,916 | 1,716,196 | ||||||
Acuity Brands, Inc.1 | 7,114 | 1,590,477 | ||||||
Total Electrical Components & Equipment | 5,159,533 | |||||||
Engineering & Construction - 3.0% | ||||||||
Fluor Corp. | 37,641 | 1,956,956 | ||||||
Jacobs Engineering Group, Inc.* | 37,078 | 1,912,483 | ||||||
Total Engineering & Construction | 3,869,439 | |||||||
Hand & Machine Tools - 2.9% | ||||||||
Snap-on, Inc. | 12,604 | 1,942,276 | ||||||
Stanley Black & Decker, Inc. | 15,533 | 1,768,277 | ||||||
Total Hand & Machine Tools | 3,710,553 | |||||||
Distribution & Wholesale - 2.8% | ||||||||
Fastenal Co. | 45,833 | 1,786,570 | ||||||
WW Grainger, Inc.1 | 8,359 | 1,739,675 | ||||||
Total Distribution & Wholesale | 3,526,245 | |||||||
Building Materials - 2.8% | ||||||||
Fortune Brands Home & Security, Inc. | 31,667 | 1,729,968 | ||||||
Masco Corp. | 55,906 | 1,726,377 | ||||||
Total Building Materials | 3,456,345 | |||||||
Machinery-Construction & Mining - 1.5% | ||||||||
Caterpillar, Inc.1 | 23,017 | 1,920,999 | ||||||
Office & Business Equipment - 1.4% | ||||||||
Pitney Bowes, Inc. | 104,582 | 1,865,743 | ||||||
Auto Manufacturers - 1.4% | ||||||||
PACCAR, Inc. | 33,139 | 1,819,994 | ||||||
SEE NOTES TO FINANCIAL STATEMENTS. | GUGGENHEIM ETFs ANNUAL REPORT | 67 |
SCHEDULE OF INVESTMENTS (concluded) | October 31, 2016 |
Guggenheim S&P 500® Equal Weight Industrials ETF |
Shares | Value | |||||||
Software - 1.4% | ||||||||
Dun & Bradstreet Corp. | 13,987 | $ | 1,746,277 | |||||
Total Common Stocks | ||||||||
(Cost $129,420,069) | 126,897,040 | |||||||
SHORT TERM INVESTMENTS† - 0.2% | ||||||||
Federated U.S. Treasury Cash Reserve Fund Institutional Shares, 0.18%2 | 202,090 | 202,090 | ||||||
Total Short Term Investments | ||||||||
(Cost $202,090) | 202,090 | |||||||
Face | ||||||||
SECURITIES LENDING COLLATERAL††,3 - 2.0% | ||||||||
Joint Repurchase Agreements | ||||||||
Citigroup Global Markets, Inc. | $ | 597,654 | 597,654 | |||||
BNP Paribas Securities Corp. | 597,654 | 597,654 | ||||||
Merrill Lynch, Pierce, Fenner & Smith, Inc. | 597,654 | 597,654 | ||||||
HSBC Securities (USA), Inc. | 597,654 | 597,654 | ||||||
Credit Suisse Securities (USA), LLC | 176,231 | 176,231 | ||||||
Total Securities Lending Collateral | ||||||||
(Cost $2,566,847) | 2,566,847 | |||||||
Total Investments - 101.9% | ||||||||
(Cost $132,189,006) | $ | 129,665,977 | ||||||
Other Assets & Liabilities, net - (1.9)% | (2,378,086 | ) | ||||||
Total Net Assets - 100.0% | $ | 127,287,891 |
* | Non-income producing security. |
† | Value determined based on Level 1 inputs — See Note 4. |
†† | Value determined based on Level 2 inputs — See Note 4. |
1 | All or portion of this security is on loan at October 31, 2016 — See Note 5. |
2 | Rate indicated is the 7 day yield as of October 31, 2016. |
3 | Securities lending collateral — See Note 5. |
plc — Public Limited Company | |
See Sector Classification in Other Information section. |
The following table summarizes the inputs used to value the Fund’s investments at October 31, 2016 (See Note 4 in the Notes to Financial Statements):
Investments in Securities | Level 1 | Level 2 | Level 3 | Total | ||||||||||||
Common Stocks | $ | 126,897,040 | $ | — | $ | — | $ | 126,897,040 | ||||||||
Securities Lending Collateral | — | 2,566,847 | — | 2,566,847 | ||||||||||||
Short Term Investments | 202,090 | — | — | 202,090 | ||||||||||||
Total | $ | 127,099,130 | $ | 2,566,847 | $ | — | $ | 129,665,977 | ||||||||
Transfers between investment levels may occur as the markets fluctuate and/or the availability of data used in an investment’s valuation changes. Transfers between valuation levels, if any, are in comparison to the valuation levels at the end of the previous fiscal year, and are effective using the fair value as of the end of the previous fiscal period.
For the year ended October 31, 2016, there were no transfers between levels.
68 | GUGGENHEIM ETFs ANNUAL REPORT | SEE NOTES TO FINANCIAL STATEMENTS. |
SCHEDULE OF INVESTMENTS | October 31, 2016 |
Guggenheim S&P 500® Equal Weight Materials ETF |
Shares | Value | |||||||
COMMON STOCKS† - 99.8% | ||||||||
Chemicals - 51.2% | ||||||||
Eastman Chemical Co. | 48,393 | $ | 3,479,940 | |||||
Albemarle Corp. | 40,751 | 3,404,746 | ||||||
FMC Corp. | 69,790 | 3,272,453 | ||||||
LyondellBasell Industries N.V. — Class A | 41,092 | 3,268,869 | ||||||
Dow Chemical Co. | 58,617 | 3,154,181 | ||||||
EI du Pont de Nemours & Co. | 45,746 | 3,146,867 | ||||||
Praxair, Inc. | 26,665 | 3,121,405 | ||||||
International Flavors & Fragrances, Inc. | 23,234 | 3,038,543 | ||||||
Air Products & Chemicals, Inc. | 22,709 | 3,029,835 | ||||||
CF Industries Holdings, Inc. | 125,226 | 3,006,677 | ||||||
Monsanto Co. | 29,317 | 2,954,274 | ||||||
PPG Industries, Inc. | 31,037 | 2,890,476 | ||||||
Sherwin-Williams Co. | 11,408 | 2,793,363 | ||||||
Mosaic Co.1 | 115,908 | 2,727,315 | ||||||
Total Chemicals | 43,288,944 | |||||||
Packaging & Containers - 15.2% | ||||||||
Owens-Illinois, Inc.* | 179,922 | 3,472,494 | ||||||
Sealed Air Corp. | 68,899 | 3,143,861 | ||||||
WestRock Co. | 67,340 | 3,110,435 | ||||||
Ball Corp.1 | 40,239 | 3,101,220 | ||||||
Total Packaging & Containers | 12,828,010 | |||||||
Building Materials - 7.8% | ||||||||
Martin Marietta Materials, Inc. | 17,888 | 3,316,078 | ||||||
Vulcan Materials Co. | 29,020 | 3,285,064 | ||||||
Total Building Materials | 6,601,142 | |||||||
Mining - 7.5% | ||||||||
Freeport-McMoRan, Inc.*,1 | 304,840 | 3,408,111 | ||||||
Newmont Mining Corp. | 79,661 | 2,950,643 | ||||||
Total Mining | 6,358,754 | |||||||
Iron & Steel - 3.9% | ||||||||
Nucor Corp. | 66,854 | 3,265,818 | ||||||
Aerospace & Defense - 3.7% | ||||||||
Arconic, Inc. | 108,704 | 3,121,979 | ||||||
Commercial Services - 3.6% | ||||||||
Ecolab, Inc. | 26,380 | 3,011,805 | ||||||
Forest Products & Paper - 3.5% | ||||||||
International Paper Co. | 65,616 | 2,954,688 | ||||||
Household Products & Housewares - 3.4% | ||||||||
Avery Dennison Corp. | 41,560 | 2,900,472 | ||||||
Total Common Stocks | ||||||||
(Cost $90,180,818) | 84,331,612 | |||||||
SHORT TERM INVESTMENTS† - 0.1% | ||||||||
Federated U.S. Treasury Cash Reserve Fund Institutional Shares, 0.18%2 | 100,503 | 100,503 | ||||||
Total Short Term Investments | ||||||||
(Cost $100,503) | 100,503 | |||||||
Face | ||||||||
SECURITIES LENDING COLLATERAL††,3 - 3.3% | ||||||||
Joint Repurchase Agreements | ||||||||
Citigroup Global Markets, Inc. | $ | 639,128 | 639,128 | |||||
BNP Paribas Securities Corp. | 639,128 | 639,128 | ||||||
Merrill Lynch, Pierce, Fenner & Smith, Inc. | 639,128 | 639,128 | ||||||
HSBC Securities (USA), Inc. | 639,128 | 639,128 | ||||||
Credit Suisse Securities (USA), LLC | 188,696 | 188,696 | ||||||
Total Securities Lending Collateral | ||||||||
(Cost $2,745,208) | 2,745,208 | |||||||
Total Investments - 103.2% | ||||||||
(Cost $93,026,529) | $ | 87,177,323 | ||||||
Other Assets & Liabilities, net - (3.2)% | (2,713,997 | ) | ||||||
Total Net Assets - 100.0% | $ | 84,463,326 | ||||||
SEE NOTES TO FINANCIAL STATEMENTS. | GUGGENHEIM ETFs ANNUAL REPORT | 69 |
SCHEDULE OF INVESTMENTS (concluded) | October 31, 2016 |
Guggenheim S&P 500® Equal Weight Materials ETF |
* | Non-income producing security. |
† | Value determined based on Level 1 inputs — See Note 4. |
†† | Value determined based on Level 2 inputs — See Note 4. |
1 | All or portion of this security is on loan at October 31, 2016 — See Note 5. |
2 | Rate indicated is the 7 day yield as of October 31, 2016. |
3 | Securities lending collateral — See Note 5. |
See Sector Classification in Other Information section. |
The following table summarizes the inputs used to value the Fund’s investments at October 31, 2016 (See Note 4 in the Notes to Financial Statements):
Investments in Securities | Level 1 | Level 2 | Level 3 | Total | ||||||||||||
Common Stocks | $ | 84,331,612 | $ | — | $ | — | $ | 84,331,612 | ||||||||
Securities Lending Collateral | — | 2,745,208 | — | 2,745,208 | ||||||||||||
Short Term Investments | 100,503 | — | — | 100,503 | ||||||||||||
Total | $ | 84,432,115 | $ | 2,745,208 | $ | — | $ | 87,177,323 | ||||||||
Transfers between investment levels may occur as the markets fluctuate and/or the availability of data used in an investment’s valuation changes. Transfers between valuation levels, if any, are in comparison to the valuation levels at the end of the previous fiscal year, and are effective using the fair value as of the end of the previous fiscal period.
For the year ended October 31, 2016, there were no transfers between levels.
70 | GUGGENHEIM ETFs ANNUAL REPORT | SEE NOTES TO FINANCIAL STATEMENTS. |
SCHEDULE OF INVESTMENTS | October 31, 2016 |
Guggenheim S&P 500® Equal Weight Real Estate ETF |
Shares | Value | |||||||
COMMON STOCKS† - 99.4% | ||||||||
REITs - 96.1% | ||||||||
American Tower Corp. — Class A | 12,412 | $ | 1,454,562 | |||||
Apartment Investment & Management Co. — Class A | 32,258 | 1,421,611 | ||||||
Prologis, Inc. | 26,543 | 1,384,483 | ||||||
Equinix, Inc. | 3,865 | 1,380,887 | ||||||
Ventas, Inc. | 19,993 | 1,354,526 | ||||||
UDR, Inc. | 38,634 | 1,351,031 | ||||||
Weyerhaeuser Co. | 44,978 | 1,346,192 | ||||||
AvalonBay Communities, Inc. | 7,851 | 1,343,934 | ||||||
Crown Castle International Corp. | 14,651 | 1,333,094 | ||||||
Essex Property Trust, Inc. | 6,057 | 1,296,743 | ||||||
Vornado Realty Trust | 13,974 | 1,296,508 | ||||||
Welltower, Inc. | 18,876 | 1,293,572 | ||||||
Digital Realty Trust, Inc.1 | 13,841 | 1,293,165 | ||||||
Equity Residential | 20,827 | 1,286,067 | ||||||
Public Storage | 5,997 | 1,281,679 | ||||||
Realty Income Corp. | 21,560 | 1,277,214 | ||||||
Kimco Realty Corp. | 47,826 | 1,272,649 | ||||||
Host Hotels & Resorts, Inc. | 80,978 | 1,253,539 | ||||||
Federal Realty Investment Trust | 8,624 | 1,252,464 | ||||||
Iron Mountain, Inc.1 | 36,596 | 1,234,383 | ||||||
Macerich Co. | 17,328 | 1,226,475 | ||||||
Extra Space Storage, Inc. | 16,411 | 1,200,465 | ||||||
Boston Properties, Inc. | 9,854 | 1,187,210 | ||||||
Simon Property Group, Inc. | 6,350 | 1,180,846 | ||||||
SL Green Realty Corp. | 12,004 | 1,179,033 | ||||||
HCP, Inc. | 34,295 | 1,174,604 | ||||||
General Growth Properties, Inc. | 46,648 | 1,163,868 | ||||||
Total REITs | 34,720,804 | |||||||
Real Estate - 3.3% | ||||||||
CBRE Group, Inc. — Class A* | 46,909 | 1,208,376 | ||||||
Total Common Stocks | ||||||||
(Cost $37,581,748) | 35,929,180 | |||||||
SHORT TERM INVESTMENTS† - 0.6% | ||||||||
Federated U.S. Treasury Cash Reserve Fund Institutional Shares, 0.18%2 | 200,768 | 200,768 | ||||||
Total Short Term Investments | ||||||||
(Cost $200,768) | 200,768 | |||||||
Total Investments - 100.0% | ||||||||
(Cost $37,782,516) | $ | 36,129,948 | ||||||
Other Assets & Liabilities, net - 0.0% | 5,104 | |||||||
Total Net Assets - 100.0% | $ | 36,135,052 | ||||||
* | Non-income producing security. |
† | Value determined based on Level 1 inputs — See Note 4. |
1 | All or portion of this security is on loan at October 31, 2016 — See Note 5. |
2 | Rate indicated is the 7 day yield as of October 31, 2016. |
REIT – Real Estate Investment Trust | |
See Sector Classification in Other Information section. |
The following table summarizes the inputs used to value the Fund’s investments at October 31, 2016 (See Note 4 in the Notes to Financial Statements):
Investments in Securities | Level 1 | Level 2 | Level 3 | Total | ||||||||||||
Common Stocks | $ | 35,929,180 | $ | — | $ | — | $ | 35,929,180 | ||||||||
Short Term Investments | 200,768 | — | — | 200,768 | ||||||||||||
Total | $ | 36,129,948 | $ | — | $ | — | $ | 36,129,948 | ||||||||
Transfers between investment levels may occur as the markets fluctuate and/or the availability of data used in an investment’s valuation changes. Transfers between valuation levels, if any, are in comparison to the valuation levels at the end of the previous fiscal year, and are effective using the fair value as of the end of the previous fiscal period.
For the year ended October 31, 2016, there were no transfers between levels.
SEE NOTES TO FINANCIAL STATEMENTS. | GUGGENHEIM ETFs ANNUAL REPORT | 71 |
SCHEDULE OF INVESTMENTS | October 31, 2016 |
Guggenheim S&P 500® Equal Weight Technology ETF |
Shares | Value | |||||||
COMMON STOCKS† - 99.8% | ||||||||
Semiconductors - 23.3% | ||||||||
NVIDIA Corp.1 | 225,166 | $ | 16,022,813 | |||||
Skyworks Solutions, Inc. | 200,756 | 15,446,167 | ||||||
QUALCOMM, Inc. | 221,447 | 15,217,837 | ||||||
KLA-Tencor Corp. | 193,008 | 14,496,831 | ||||||
Analog Devices, Inc. | 224,788 | 14,408,911 | ||||||
Texas Instruments, Inc. | 201,017 | 14,242,054 | ||||||
Lam Research Corp. | 146,977 | 14,236,192 | ||||||
Qorvo, Inc.* | 255,376 | 14,211,674 | ||||||
Broadcom Ltd. | 83,342 | 14,191,476 | ||||||
Linear Technology Corp. | 232,278 | 13,950,617 | ||||||
Microchip Technology, Inc. | 229,013 | 13,866,737 | ||||||
Micron Technology, Inc.* | 797,258 | 13,680,947 | ||||||
Applied Materials, Inc. | 464,376 | 13,504,054 | ||||||
Intel Corp. | 378,168 | 13,186,718 | ||||||
Xilinx, Inc. | 257,334 | 13,090,581 | ||||||
Total Semiconductors | 213,753,609 | |||||||
Software - 22.6% | ||||||||
Akamai Technologies, Inc.* | 255,272 | 17,733,746 | ||||||
Adobe Systems, Inc.* | 134,855 | 14,498,261 | ||||||
Autodesk, Inc.* | 200,506 | 14,492,574 | ||||||
Red Hat, Inc.* | 185,504 | 14,367,284 | ||||||
Microsoft Corp. | 238,426 | 14,286,486 | ||||||
Activision Blizzard, Inc. | 316,897 | 13,680,443 | ||||||
Citrix Systems, Inc.* | 161,067 | 13,658,482 | ||||||
salesforce.com, Inc.* | 180,606 | 13,574,347 | ||||||
Intuit, Inc. | 122,665 | 13,338,592 | ||||||
Electronic Arts, Inc.* | 167,809 | 13,176,363 | ||||||
Fiserv, Inc.* | 133,647 | 13,161,556 | ||||||
Oracle Corp. | 334,803 | 12,863,131 | ||||||
Fidelity National Information Services, Inc. | 173,154 | 12,799,544 | ||||||
Paychex, Inc. | 226,038 | 12,477,298 | ||||||
CA, Inc. | 405,262 | 12,457,754 | ||||||
Total Software | 206,565,861 | |||||||
Computers - 16.3% | ||||||||
Western Digital Corp. | 259,781 | 15,181,602 | ||||||
Apple, Inc. | 129,951 | 14,754,637 | ||||||
Hewlett Packard Enterprise Co. | 640,634 | 14,395,047 | ||||||
Accenture plc — Class A | 121,404 | 14,112,001 | ||||||
HP, Inc. | 952,531 | 13,802,174 | ||||||
NetApp, Inc. | 391,059 | 13,272,542 | ||||||
International Business Machines Corp. | 86,080 | 13,229,635 | ||||||
CSRA, Inc. | 511,525 | 12,834,162 | ||||||
Seagate Technology plc1 | 371,358 | 12,741,293 | ||||||
Cognizant Technology Solutions Corp. — Class A* | 242,657 | 12,460,437 | ||||||
Teradata Corp.* | 449,890 | 12,129,034 | ||||||
Total Computers | 148,912,564 | |||||||
Internet - 10.6% | ||||||||
F5 Networks, Inc.* | 113,524 | 15,690,152 | ||||||
VeriSign, Inc.*,1 | 179,018 | 15,041,093 | ||||||
Facebook, Inc. — Class A* | 105,447 | 13,812,503 | ||||||
Symantec Corp. | 547,238 | 13,697,368 | ||||||
Yahoo!, Inc.* | 312,257 | 12,974,278 | ||||||
eBay, Inc.* | 420,248 | 11,981,270 | ||||||
Alphabet, Inc. — Class A* | 8,624 | 6,984,578 | ||||||
Alphabet, Inc. — Class C* | 8,687 | 6,815,299 | ||||||
Total Internet | 96,996,541 | |||||||
Commercial Services - 7.4% | ||||||||
PayPal Holdings, Inc.* | 352,581 | 14,688,524 | ||||||
Total System Services, Inc. | 273,064 | 13,620,432 | ||||||
Automatic Data Processing, Inc. | 154,810 | 13,477,759 | ||||||
Global Payments, Inc. | 182,050 | 13,202,266 | ||||||
Western Union Co. | 645,881 | 12,962,832 | ||||||
Total Commercial Services | 67,951,813 | |||||||
Electronics - 6.1% | ||||||||
Amphenol Corp. — Class A | 218,664 | 14,416,518 | ||||||
FLIR Systems, Inc. | 436,534 | 14,370,699 | ||||||
TE Connectivity Ltd.1 | 219,768 | 13,816,814 | ||||||
Corning, Inc. | 598,841 | 13,599,679 | ||||||
Total Electronics | 56,203,710 | |||||||
Diversified Financial Services - 4.5% | ||||||||
Mastercard, Inc. — Class A | 136,552 | 14,613,796 | ||||||
Visa, Inc. — Class A | 164,787 | 13,596,575 | ||||||
Alliance Data Systems Corp. | 64,220 | 13,131,063 | ||||||
Total Diversified Financial Services | 41,341,434 | |||||||
Telecommunications - 4.5% | ||||||||
Juniper Networks, Inc. | 578,674 | 15,242,273 | ||||||
Cisco Systems, Inc. | 434,411 | 13,327,729 | ||||||
Motorola Solutions, Inc. | 174,830 | 12,689,161 | ||||||
Total Telecommunications | 41,259,163 | |||||||
Energy-Alternate Sources - 1.6% | ||||||||
First Solar, Inc.*,1 | 360,939 | 14,614,420 | ||||||
Office & Business Equipment - 1.5% | ||||||||
Xerox Corp. | 1,397,495 | 13,653,526 | ||||||
Aerospace & Defense - 1.4% | ||||||||
Harris Corp. | 147,494 | 13,157,940 | ||||||
Total Common Stocks | ||||||||
(Cost $867,349,086) | 914,410,581 | |||||||
SHORT TERM INVESTMENTS† - 0.2% | ||||||||
Federated U.S. Treasury Cash Reserve Fund Institutional Shares, 0.18%2 | 1,517,831 | 1,517,831 | ||||||
Total Short Term Investments | ||||||||
(Cost $1,517,831) | 1,517,831 | |||||||
72 | GUGGENHEIM ETFs ANNUAL REPORT | SEE NOTES TO FINANCIAL STATEMENTS. |
SCHEDULE OF INVESTMENTS (concluded) | October 31, 2016 |
Guggenheim S&P 500® Equal Weight Technology ETF |
Face | Value | |||||||
SECURITIES LENDING COLLATERAL††,3 - 3.3% | ||||||||
Joint Repurchase Agreements | ||||||||
Citigroup Global Markets, Inc. | $ | 7,126,616 | $ | 7,126,616 | ||||
BNP Paribas Securities Corp. | 7,126,616 | 7,126,616 | ||||||
Merrill Lynch, Pierce, Fenner & Smith, Inc. | 7,126,616 | 7,126,616 | ||||||
HSBC Securities (USA), Inc. | 7,126,616 | 7,126,616 | ||||||
Credit Suisse Securities (USA), LLC | 2,099,863 | 2,099,863 | ||||||
Total Securities Lending Collateral | ||||||||
(Cost $30,606,327) | 30,606,327 | |||||||
Total Investments - 103.3% | ||||||||
(Cost $899,473,244) | $ | 946,534,739 | ||||||
Other Assets & Liabilities, net - (3.3)% | (30,656,040 | ) | ||||||
Total Net Assets - 100.0% | $ | 915,878,699 | ||||||
* | Non-income producing security. |
† | Value determined based on Level 1 inputs — See Note 4. |
†† | Value determined based on Level 2 inputs — See Note 4. |
1 | All or portion of this security is on loan at October 31, 2016 — See Note 5. |
2 | Rate indicated is the 7 day yield as of October 31, 2016. |
3 | Securities lending collateral — See Note 5. |
plc — Public Limited Company | |
See Sector Classification in Other Information section. |
The following table summarizes the inputs used to value the Fund’s investments at October 31, 2016 (See Note 4 in the Notes to Financial Statements):
Investments in Securities | Level 1 | Level 2 | Level 3 | Total | ||||||||||||
Common Stocks | $ | 914,410,581 | $ | — | $ | — | $ | 914,410,581 | ||||||||
Securities Lending Collateral | — | 30,606,327 | — | 30,606,327 | ||||||||||||
Short Term Investments | 1,517,831 | — | — | 1,517,831 | ||||||||||||
Total | $ | 915,928,412 | $ | 30,606,327 | $ | — | $ | 946,534,739 | ||||||||
Transfers between investment levels may occur as the markets fluctuate and/or the availability of data used in an investment’s valuation changes. Transfers between valuation levels, if any, are in comparison to the valuation levels at the end of the previous fiscal year, and are effective using the fair value as of the end of the previous fiscal period.
For the year ended October 31, 2016, there were no transfers between levels.
SEE NOTES TO FINANCIAL STATEMENTS. | GUGGENHEIM ETFs ANNUAL REPORT | 73 |
SCHEDULE OF INVESTMENTS | October 31, 2016 |
Guggenheim S&P 500® Equal Weight Utilities ETF |
Shares | Value | |||||||
COMMON STOCKS† - 99.8% | ||||||||
Electric - 73.1% | ||||||||
SCANA Corp. | 91,200 | $ | 6,690,431 | |||||
NextEra Energy, Inc. | 52,107 | 6,669,695 | ||||||
DTE Energy Co. | 69,205 | 6,644,372 | ||||||
FirstEnergy Corp. | 192,938 | 6,615,844 | ||||||
Ameren Corp. | 131,034 | 6,545,148 | ||||||
Dominion Resources, Inc. | 86,863 | 6,532,098 | ||||||
Consolidated Edison, Inc. | 86,327 | 6,522,005 | ||||||
Eversource Energy | 118,262 | 6,511,506 | ||||||
Pinnacle West Capital Corp. | 85,158 | 6,483,079 | ||||||
Edison International | 88,200 | 6,480,936 | ||||||
Duke Energy Corp. | 80,787 | 6,464,576 | ||||||
Alliant Energy Corp. | 169,514 | 6,450,008 | ||||||
Public Service Enterprise Group, Inc. | 153,113 | 6,442,995 | ||||||
PG&E Corp. | 103,526 | 6,431,035 | ||||||
PPL Corp. | 187,258 | 6,430,440 | ||||||
CMS Energy Corp. | 152,445 | 6,425,557 | ||||||
Exelon Corp. | 188,549 | 6,423,864 | ||||||
Xcel Energy, Inc. | 154,425 | 6,416,359 | ||||||
American Electric Power Company, Inc. | 98,847 | 6,409,239 | ||||||
Southern Co. | 123,794 | 6,384,057 | ||||||
WEC Energy Group, Inc. | 106,573 | 6,364,540 | ||||||
AES Corp. | 510,750 | 6,011,528 | ||||||
Entergy Corp. | 81,194 | 5,982,374 | ||||||
NRG Energy, Inc. | 542,889 | 5,770,910 | ||||||
Total Electric | 154,102,596 | |||||||
Telecommunications - 14.5% | ||||||||
Level 3 Communications, Inc.* | 130,250 | 7,313,538 | ||||||
CenturyLink, Inc.1 | 226,041 | 6,008,169 | ||||||
Verizon Communications, Inc. | 121,526 | 5,845,401 | ||||||
AT&T, Inc. | 158,589 | 5,834,489 | ||||||
Frontier Communications Corp.1 | 1,381,034 | 5,551,757 | ||||||
Total Telecommunications | 30,553,354 | |||||||
Gas - 9.1% | ||||||||
Sempra Energy | 61,199 | 6,554,413 | ||||||
CenterPoint Energy, Inc. | 278,529 | 6,350,461 | ||||||
NiSource, Inc. | 269,469 | 6,267,849 | ||||||
Total Gas | 19,172,723 | |||||||
Water - 3.1% | ||||||||
American Water Works Company, Inc. | 86,875 | 6,432,225 | ||||||
Total Common Stocks | ||||||||
(Cost $215,781,337) | 210,260,898 | |||||||
SHORT TERM INVESTMENTS† - 0.1% | ||||||||
Federated U.S. Treasury Cash Reserve Fund Institutional Shares, 0.18%2 | 296,202 | 296,202 | ||||||
Total Short Term Investments | ||||||||
(Cost $296,202) | 296,202 | |||||||
Face | ||||||||
SECURITIES LENDING COLLATERAL††,3 - 2.7% | ||||||||
Joint Repurchase Agreements | ||||||||
Citigroup Global Markets, Inc. | $ | 1,328,278 | 1,328,278 | |||||
BNP Paribas Securities Corp. | 1,328,278 | 1,328,278 | ||||||
Merrill Lynch, Pierce, Fenner & Smith, Inc. | 1,328,278 | 1,328,278 | ||||||
HSBC Securities (USA), Inc. | 1,328,278 | 1,328,278 | ||||||
Credit Suisse Securities (USA), LLC | 392,193 | 392,193 | ||||||
Total Securities Lending Collateral | ||||||||
(Cost $5,705,305) | 5,705,305 | |||||||
Total Investments - 102.6% | ||||||||
(Cost $221,782,844) | $ | 216,262,405 | ||||||
Other Assets & Liabilities, net - (2.6)% | (5,397,678 | ) | ||||||
Total Net Assets - 100.0% | $ | 210,864,727 | ||||||
74 | GUGGENHEIM ETFs ANNUAL REPORT | SEE NOTES TO FINANCIAL STATEMENTS. |
SCHEDULE OF INVESTMENTS (concluded) | October 31, 2016 |
Guggenheim S&P 500® Equal Weight Utilities ETF |
* | Non-income producing security. |
† | Value determined based on Level 1 inputs — See Note 4. |
†† | Value determined based on Level 2 inputs — See Note 4. |
1 | All or portion of this security is on loan at October 31, 2016 — See Note 5. |
2 | Rate indicated is the 7 day yield as of October 31, 2016. |
3 | Securities lending collateral — See Note 5. |
See Sector Classification in Other Information section. |
The following table summarizes the inputs used to value the Fund’s investments at October 31, 2016 (See Note 4 in the Notes to Financial Statements):
Investments in Securities | Level 1 | Level 2 | Level 3 | Total | ||||||||||||
Common Stocks | $ | 210,260,898 | $ | — | $ | — | $ | 210,260,898 | ||||||||
Securities Lending Collateral | — | 5,705,305 | — | 5,705,305 | ||||||||||||
Short Term Investments | 296,202 | — | — | 296,202 | ||||||||||||
Total | $ | 210,557,100 | $ | 5,705,305 | $ | — | $ | 216,262,405 | ||||||||
Transfers between investment levels may occur as the markets fluctuate and/or the availability of data used in an investment’s valuation changes. Transfers between valuation levels, if any, are in comparison to the valuation levels at the end of the previous fiscal year, and are effective using the fair value as of the end of the previous fiscal period.
For the year ended October 31, 2016, there were no transfers between levels.
SEE NOTES TO FINANCIAL STATEMENTS. | GUGGENHEIM ETFs ANNUAL REPORT | 75 |
STATEMENTS OF ASSETS AND LIABILITIES | October 31, 2016 |
Guggenheim MSCI Emerging Markets Equal Country Weight ETF | Guggenheim S&P MidCap 400® Equal Weight ETF | Guggenheim S&P SmallCap 600® Equal Weight ETF | Guggenheim S&P 100® Equal Weight ETF | |||||||||||||
Assets: | ||||||||||||||||
Investments, at value — including $528,505, $14,392,815, $4,557,246 and $— of securities loaned, respectively | $ | 11,652,793 | $ | 89,922,480 | $ | 33,975,228 | $ | 2,627,883 | ||||||||
Repurchase agreements, at value | 395,137 | 8,074,696 | 3,184,518 | — | ||||||||||||
Total investments* | 12,047,930 | 97,997,176 | 37,159,746 | 2,627,883 | ||||||||||||
Cash | — | 10 | 16 | 1,512 | ||||||||||||
Receivables: | ||||||||||||||||
Securities lending | 815 | 4,235 | 3,357 | 6 | ||||||||||||
Dividends and interest | 7,738 | 47,976 | 11,534 | 3,692 | ||||||||||||
Tax reclaims | 11,302 | — | — | — | ||||||||||||
Total assets | 12,067,785 | 98,049,397 | 37,174,653 | 2,633,093 | ||||||||||||
Liabilities: | ||||||||||||||||
Payable upon return of securities loaned | 395,137 | 8,074,696 | 3,184,518 | — | ||||||||||||
Payable for: | ||||||||||||||||
Management fees | 6,458 | 30,952 | 12,149 | 895 | ||||||||||||
Foreign tax withheld | 325 | — | — | — | ||||||||||||
Total liabilities | 401,920 | 8,105,648 | 3,196,667 | 895 | ||||||||||||
Commitments and contingent liabilities (Note 8) | — | — | — | — | ||||||||||||
Net assets | $ | 11,665,865 | $ | 89,943,749 | $ | 33,977,986 | $ | 2,632,198 | ||||||||
Net assets consist of: | ||||||||||||||||
Paid-in capital | $ | 16,637,859 | $ | 97,526,268 | $ | 44,732,205 | $ | 2,621,377 | ||||||||
Undistributed net investment income | 12,202 | 152,420 | 21,321 | 6,244 | ||||||||||||
Accumulated net realized loss on investments | (4,496,994 | ) | (14,785,559 | ) | (13,249,889 | ) | (5,645 | ) | ||||||||
Net unrealized appreciation (depreciation) on investments | (487,202 | ) | 7,050,620 | 2,474,349 | 10,222 | |||||||||||
Net assets | $ | 11,665,865 | $ | 89,943,749 | $ | 33,977,986 | $ | 2,632,198 | ||||||||
Shares outstanding (unlimited shares authorized), no par value | 400,000 | 1,750,000 | 800,000 | 100,000 | ||||||||||||
Net asset value, offering price and repurchase price per share | $ | 29.16 | $ | 51.40 | $ | 42.47 | $ | 26.32 | ||||||||
Cost of investments | $ | 12,139,803 | $ | 82,871,860 | $ | 31,500,879 | $ | 2,617,661 | ||||||||
Cost of repurchase agreements | 395,137 | 8,074,696 | 3,184,518 | — | ||||||||||||
*Total cost of investments | $ | 12,534,940 | $ | 90,946,556 | $ | 34,685,397 | $ | 2,617,661 | ||||||||
76 | GUGGENHEIM ETFs ANNUAL REPORT | SEE NOTES TO FINANCIAL STATEMENTS. |
STATEMENTS OF ASSETS AND LIABILITIES (continued) | October 31, 2016 |
Guggenheim S&P 500® Equal Weight Consumer Discretionary ETF | Guggenheim S&P 500® Equal Weight Consumer Staples ETF | Guggenheim S&P 500® Equal Weight Energy ETF | ||||||||||
Assets: | ||||||||||||
Investments, at value — including $12,410,755, $18,121,244 and $16,365,754 of securities loaned, respectively | $ | 68,458,728 | $ | 613,167,131 | $ | 199,059,614 | ||||||
Repurchase agreements, at value | 7,238,797 | 243,818 | 10,272,586 | |||||||||
Total investments* | 75,697,525 | 613,410,949 | 209,332,200 | |||||||||
Cash | — | — | 4,408 | |||||||||
Receivables: | ||||||||||||
Fund shares sold | — | 11,126 | — | |||||||||
Investments sold | 808,845 | — | — | |||||||||
Securities lending | 2,609 | 7,152 | 7,321 | |||||||||
Dividends and interest | 37,597 | 685,000 | 160,728 | |||||||||
Total assets | 76,546,576 | 614,114,227 | 209,504,657 | |||||||||
Liabilities: | ||||||||||||
Payable upon return of securities loaned | 7,238,797 | 243,818 | 10,272,586 | |||||||||
Payable for: | ||||||||||||
Investments purchased | 960,379 | — | — | |||||||||
Management fees | 24,163 | 209,805 | 68,413 | |||||||||
Total liabilities | 8,223,339 | 453,623 | 10,340,999 | |||||||||
Commitments and contingent liabilities (Note 8) | — | — | — | |||||||||
Net assets | $ | 68,323,237 | $ | 613,660,604 | $ | 199,163,658 | ||||||
Net assets consist of: | ||||||||||||
Paid-in capital | $ | 88,401,947 | $ | 617,147,826 | $ | 272,040,985 | ||||||
Undistributed net investment income | 156,494 | 1,123,753 | 100,794 | |||||||||
Accumulated net realized loss on investments | (8,242,758 | ) | (6,795,685 | ) | (65,834,417 | ) | ||||||
Net unrealized appreciation (depreciation) on investments | (11,992,446 | ) | 2,184,710 | (7,143,704 | ) | |||||||
Net assets | $ | 68,323,237 | $ | 613,660,604 | $ | 199,163,658 | ||||||
Shares outstanding (unlimited shares authorized), no par value | 800,000 | 5,050,000 | 3,500,005 | |||||||||
Net asset value, offering price and repurchase price per share | $ | 85.40 | $ | 121.52 | $ | 56.90 | ||||||
Cost of investments | $ | 80,451,174 | $ | 610,982,421 | $ | 206,203,318 | ||||||
Cost of repurchase agreements | 7,238,797 | 243,818 | 10,272,586 | |||||||||
*Total cost of investments | $ | 87,689,971 | $ | 611,226,239 | $ | 216,475,904 | ||||||
SEE NOTES TO FINANCIAL STATEMENTS. | GUGGENHEIM ETFs ANNUAL REPORT | 77 |
STATEMENTS OF ASSETS AND LIABILITIES (continued) | October 31, 2016 |
Guggenheim S&P 500® Equal Weight Financials ETF | Guggenheim S&P 500® Equal Weight Health Care ETF | Guggenheim S&P 500® Equal Weight Industrials ETF | Guggenheim S&P 500® Equal Weight Materials ETF | |||||||||||||
Assets: | ||||||||||||||||
Investments, at value — including $—, $19,376,879, $9,894,534 and $7,998,039 of securities loaned, respectively | $ | 114,589,827 | $ | 478,364,136 | $ | 127,099,130 | $ | 84,432,115 | ||||||||
Repurchase agreements, at value | — | — | 2,566,847 | 2,745,208 | ||||||||||||
Total investments* | 114,589,827 | 478,364,136 | 129,665,977 | 87,177,323 | ||||||||||||
Receivables: | ||||||||||||||||
Fund shares sold | — | — | — | 10,341 | ||||||||||||
Investments sold | — | — | 1,957,385 | — | ||||||||||||
Securities lending | 35 | 1,647 | 682 | 993 | ||||||||||||
Dividends and interest | 101,894 | 210,845 | 255,657 | 50,322 | ||||||||||||
Total assets | 114,691,756 | 478,576,628 | 131,879,701 | 87,238,979 | ||||||||||||
Liabilities: | ||||||||||||||||
Payable upon return of securities loaned | — | — | 2,566,847 | 2,745,208 | ||||||||||||
Payable for: | ||||||||||||||||
Investments purchased | — | — | 1,958,463 | — | ||||||||||||
Fund shares redeemed | — | — | 21,591 | — | ||||||||||||
Management fees | 37,824 | 169,146 | 44,909 | 30,445 | ||||||||||||
Distributions | 4,433 | — | — | — | ||||||||||||
Due to custodian | — | 3,913,717 | — | — | ||||||||||||
Total liabilities | 42,257 | 4,082,863 | 4,591,810 | 2,775,653 | ||||||||||||
Commitments and contingent liabilities (Note 8) | — | — | — | — | ||||||||||||
Net assets | $ | 114,649,499 | $ | 474,493,765 | $ | 127,287,891 | $ | 84,463,326 | ||||||||
Net assets consist of: | ||||||||||||||||
Paid-in capital | $ | 128,567,420 | $ | 531,371,303 | $ | 134,451,813 | $ | 97,588,061 | ||||||||
Undistributed net investment income | — | 292,295 | 235,634 | 94,609 | ||||||||||||
Accumulated net realized loss on investments | (11,674,316 | ) | (19,673,873 | ) | (4,876,527 | ) | (7,370,138 | ) | ||||||||
Net unrealized depreciation on investments | (2,243,605 | ) | (37,495,960 | ) | (2,523,029 | ) | (5,849,206 | ) | ||||||||
Net assets | $ | 114,649,499 | $ | 474,493,765 | $ | 127,287,891 | $ | 84,463,326 | ||||||||
Shares outstanding (unlimited shares authorized), no par value | 3,650,000 | 3,300,000 | 1,400,000 | 1,000,000 | ||||||||||||
Net asset value, offering price and repurchase price per share | $ | 31.41 | $ | 143.79 | $ | 90.92 | $ | 84.46 | ||||||||
Cost of investments | $ | 116,833,432 | $ | 515,860,096 | $ | 129,622,159 | $ | 90,281,321 | ||||||||
Cost of repurchase agreements | — | — | 2,566,847 | 2,745,208 | ||||||||||||
*Total cost of investments | $ | 116,833,432 | $ | 515,860,096 | $ | 132,189,006 | $ | 93,026,529 | ||||||||
78 | GUGGENHEIM ETFs ANNUAL REPORT | SEE NOTES TO FINANCIAL STATEMENTS. |
STATEMENTS OF ASSETS AND LIABILITIES (concluded) | October 31, 2016 |
Guggenheim S&P 500® Equal Weight Real Estate ETF | Guggenheim S&P 500® Equal Weight Technology ETF | Guggenheim S&P 500® Equal Weight Utilities ETF | ||||||||||
Assets: | ||||||||||||
Investments, at value — including $1,722,302, $50,843,814 and $11,213,104 of securities loaned, respectively | $ | 36,129,948 | $ | 915,928,412 | $ | 210,557,100 | ||||||
Repurchase agreements, at value | — | 30,606,327 | 5,705,305 | |||||||||
Total investments* | 36,129,948 | 946,534,739 | 216,262,405 | |||||||||
Cash | — | 1,699 | — | |||||||||
Receivables: | ||||||||||||
Securities lending | 208 | 10,288 | 1,435 | |||||||||
Dividends and interest | 18,319 | 286,174 | 377,257 | |||||||||
Total assets | 36,148,475 | 946,832,900 | 216,641,097 | |||||||||
Liabilities: | ||||||||||||
Payable upon return of securities loaned | — | 30,606,327 | 5,705,305 | |||||||||
Payable for: | ||||||||||||
Fund shares redeemed | — | 35,734 | — | |||||||||
Management fees | 13,423 | 312,140 | 71,065 | |||||||||
Total liabilities | 13,423 | 30,954,201 | 5,776,370 | |||||||||
Commitments and contingent liabilities (Note 8) | — | — | — | |||||||||
Net assets | $ | 36,135,052 | $ | 915,878,699 | $ | 210,864,727 | ||||||
Net assets consist of: | ||||||||||||
Paid-in capital | $ | 37,631,635 | $ | 894,357,374 | $ | 220,474,429 | ||||||
Undistributed net investment income | 193,328 | 634,073 | 528,629 | |||||||||
Accumulated net realized loss on investments | (37,343 | ) | (26,174,243 | ) | (4,617,892 | ) | ||||||
Net unrealized appreciation (depreciation) on investments | (1,652,568 | ) | 47,061,495 | (5,520,439 | ) | |||||||
Net assets | $ | 36,135,052 | $ | 915,878,699 | $ | 210,864,727 | ||||||
Shares outstanding (unlimited shares authorized), no par value | 1,400,000 | 8,750,000 | 2,600,000 | |||||||||
Net asset value, offering price and repurchase price per share | $ | 25.81 | $ | 104.67 | $ | 81.10 | ||||||
Cost of investments | $ | 37,782,516 | $ | 868,866,917 | $ | 216,077,539 | ||||||
Cost of repurchase agreements | — | 30,606,327 | 5,705,305 | |||||||||
*Total cost of investments | $ | 37,782,516 | $ | 899,473,244 | $ | 221,782,844 | ||||||
SEE NOTES TO FINANCIAL STATEMENTS. | GUGGENHEIM ETFs ANNUAL REPORT | 79 |
STATEMENTS OF OPERATIONS |
|
For the Year Ended October 31, 2016
Guggenheim MSCI Emerging Markets Equal Country Weight ETF | Guggenheim S&P MidCap 400® Equal Weight ETF | Guggenheim S&P SmallCap 600® Equal Weight ETF | Guggenheim S&P 100® Equal Weight ETFa | |||||||||||||
Investment Income: | ||||||||||||||||
Dividends, net of foreign taxes withheld* | $ | 292,140 | $ | 1,688,634 | $ | 432,608 | $ | 19,677 | ||||||||
Income from securities lending | 5,221 | 28,402 | 34,913 | 143 | ||||||||||||
Interest | 18 | 232 | 74 | — | ||||||||||||
Total investment income | 297,379 | 1,717,268 | 467,595 | 19,820 | ||||||||||||
Expenses: | ||||||||||||||||
Management fees | 76,140 | 390,282 | 155,057 | 3,612 | ||||||||||||
Trustee fees | 593 | 6,626 | 4,318 | 56 | ||||||||||||
Total expenses | 76,733 | 396,908 | 159,375 | 3,668 | ||||||||||||
Less: | ||||||||||||||||
Expenses waived by Adviser | (4,671 | ) | — | — | — | |||||||||||
Net expenses | 72,062 | — | — | — | ||||||||||||
Net investment income | 225,317 | 1,320,360 | 308,220 | 16,152 | ||||||||||||
Net Realized and Unrealized Gain (Loss): | ||||||||||||||||
Net realized gain (loss) on: | ||||||||||||||||
Investments | (759,381 | ) | (12,670,558 | ) | (8,003,158 | ) | (3,628 | ) | ||||||||
In-kind redemptions | — | 10,954,404 | 5,028,008 | 67,589 | ||||||||||||
Foreign currency transactions | (345 | ) | — | — | — | |||||||||||
Net realized gain (loss) | (759,726 | ) | (1,716,154 | ) | (2,975,150 | ) | 63,961 | |||||||||
Net change in unrealized appreciation (depreciation) on: | ||||||||||||||||
Investments | 1,385,620 | 1,522,297 | 3,224,307 | 10,222 | ||||||||||||
Foreign currency transactions | (155 | ) | — | — | — | |||||||||||
Net change in unrealized appreciation (depreciation) | 1,385,465 | 1,522,297 | 3,224,307 | 10,222 | ||||||||||||
Net realized and unrealized gain (loss) | 625,739 | (193,857 | ) | 249,157 | 74,183 | |||||||||||
Net increase in net assets resulting from operations | $ | 851,056 | $ | 1,126,503 | $ | 557,377 | $ | 90,335 | ||||||||
* Foreign taxes withheld | $ | 40,465 | $ | 871 | $ | 497 | $ | — | ||||||||
a | Since commencement of operations: June 29, 2016. |
80 | GUGGENHEIM ETFs ANNUAL REPORT | SEE NOTES TO FINANCIAL STATEMENTS. |
STATEMENTS OF OPERATIONS (continued) |
|
For the Year Ended October 31, 2016
Guggenheim S&P 500® Equal Weight Consumer Discretionary ETF | Guggenheim S&P 500® Equal Weight Consumer Staples ETF | Guggenheim S&P 500® Equal Weight Energy ETF | ||||||||||
Investment Income: | ||||||||||||
Dividends | $ | 1,944,514 | $ | 14,439,944 | $ | 4,021,383 | ||||||
Income from securities lending | 20,072 | 7,812 | 99,288 | |||||||||
Interest | 270 | 2,057 | 390 | |||||||||
Total investment income | 1,964,856 | 14,449,813 | 4,121,061 | |||||||||
Expenses: | ||||||||||||
Management fees | 414,891 | 2,619,173 | 776,751 | |||||||||
Total expenses | 414,891 | 2,619,173 | 776,751 | |||||||||
Net investment income | 1,549,965 | 11,830,640 | 3,344,310 | |||||||||
Net Realized and Unrealized Gain (Loss): | ||||||||||||
Net realized gain (loss) on: | ||||||||||||
Investments | (6,433,641 | ) | (5,221,541 | ) | (43,861,000 | ) | ||||||
In-kind redemptions | (464,136 | ) | 69,613,688 | 17,247,497 | ||||||||
Net realized gain (loss) | (6,897,777 | ) | 64,392,147 | (26,613,503 | ) | |||||||
Net change in unrealized appreciation (depreciation) on: | ||||||||||||
Investments | (7,038,042 | ) | (19,573,047 | ) | 43,196,210 | |||||||
Net realized and unrealized gain (loss) | (13,935,819 | ) | 44,819,100 | 16,582,707 | ||||||||
Net increase (decrease) in net assets resulting from operations | $ | (12,385,854 | ) | $ | 56,649,740 | $ | 19,927,017 | |||||
SEE NOTES TO FINANCIAL STATEMENTS. | GUGGENHEIM ETFs ANNUAL REPORT | 81 |
STATEMENTS OF OPERATIONS (continued) |
|
For the Year Ended October 31, 2016
Guggenheim S&P 500® Equal Weight Financials ETF | Guggenheim S&P 500® Equal Weight Health Care ETF | Guggenheim S&P 500® Equal Weight Industrials ETF | Guggenheim S&P 500® Equal Weight Materials ETF | |||||||||||||
Investment Income: | ||||||||||||||||
Dividends | $ | 3,716,110 | $ | 4,731,075 | $ | 2,014,058 | $ | 1,449,980 | ||||||||
Income from securities lending | 2,076 | 22,888 | 13,428 | 4,195 | ||||||||||||
Interest | 411 | 3,419 | 203 | 174 | ||||||||||||
Total investment income | 3,718,597 | 4,757,382 | 2,027,689 | 1,454,349 | ||||||||||||
Expenses: | ||||||||||||||||
Management fees | 631,105 | 2,062,556 | 405,833 | 294,786 | ||||||||||||
Total expenses | 631,105 | 2,062,556 | 405,833 | 294,786 | ||||||||||||
Net investment income | 3,087,492 | 2,694,826 | 1,621,856 | 1,159,563 | ||||||||||||
Net Realized and Unrealized Gain (Loss): | ||||||||||||||||
Net realized gain (loss) on: | ||||||||||||||||
Investments | (8,143,321 | ) | (24,513,593 | ) | (2,009,236 | ) | (4,197,566 | ) | ||||||||
In-kind redemptions | 2,015,671 | 19,816,280 | 4,698,657 | 4,485,272 | ||||||||||||
Net realized gain (loss) | (6,127,650 | ) | (4,697,313 | ) | 2,689,421 | 287,706 | ||||||||||
Net change in unrealized appreciation (depreciation) on: | ||||||||||||||||
Investments | 2,466,708 | (20,086,726 | ) | 1,123,759 | 3,034,814 | |||||||||||
Net realized and unrealized gain (loss) | (3,660,942 | ) | (24,784,039 | ) | 3,813,180 | 3,322,520 | ||||||||||
Net increase (decrease) in net assets resulting from operations | $ | (573,450 | ) | $ | (22,089,213 | ) | $ | 5,435,036 | $ | 4,482,083 | ||||||
82 | GUGGENHEIM ETFs ANNUAL REPORT | SEE NOTES TO FINANCIAL STATEMENTS. |
STATEMENTS OF OPERATIONS (concluded) |
|
For the Year Ended October 31, 2016
Guggenheim S&P 500® Equal Weight Real Estate ETF | Guggenheim S&P 500® Equal Weight Technology ETF | Guggenheim S&P 500® Equal Weight Utilities ETF | ||||||||||
Investment Income: | ||||||||||||
Dividends | $ | 217,986 | $ | 14,475,354 | $ | 7,259,762 | ||||||
Income from securities lending | 381 | 52,723 | 9,533 | |||||||||
Interest | 39 | 2,192 | 729 | |||||||||
Total investment income | 218,406 | 14,530,269 | 7,270,024 | |||||||||
Expenses: | ||||||||||||
Management fees | 26,333 | 2,979,196 | 834,044 | |||||||||
Trustee fees | 84 | — | — | |||||||||
Total expenses | 26,417 | 2,979,196 | 834,044 | |||||||||
Net investment income | 191,989 | 11,551,073 | 6,435,980 | |||||||||
Net Realized and Unrealized Gain (Loss): | ||||||||||||
Net realized gain (loss) on: | ||||||||||||
Investments | 1,354 | (16,172,550 | ) | (2,528,687 | ) | |||||||
In-kind redemptions | 266,082 | 61,913,573 | 10,638,306 | |||||||||
Net realized gain | 267,436 | 45,741,023 | 8,109,619 | |||||||||
Net change in unrealized appreciation (depreciation) on: | ||||||||||||
Investments | (1,678,281 | ) | 16,659,550 | 5,981,382 | ||||||||
Net realized and unrealized gain (loss) | (1,410,845 | ) | 62,400,573 | 14,091,001 | ||||||||
Net increase (decrease) in net assets resulting from operations | $ | (1,218,856 | ) | $ | 73,951,646 | $ | 20,526,981 | |||||
SEE NOTES TO FINANCIAL STATEMENTS. | GUGGENHEIM ETFs ANNUAL REPORT | 83 |
STATEMENTS OF CHANGES IN NET ASSETS |
|
Guggenheim MSCI Emerging Markets Equal Country Weight ETF | Guggenheim S&P MidCap 400® Equal Weight ETF | |||||||||||||||
Year Ended | Year Ended | Year Ended | Year Ended | |||||||||||||
Increase (Decrease) in Net Assets from Operations: | ||||||||||||||||
Net investment income | $ | 225,317 | $ | 284,394 | $ | 1,320,360 | $ | 1,851,317 | ||||||||
Net realized gain (loss) on investments | (759,726 | ) | (722,821 | ) | (1,716,154 | ) | 13,243,115 | |||||||||
Net change in unrealized appreciation (depreciation) on investments | 1,385,465 | (1,886,825 | ) | 1,522,297 | (16,701,610 | ) | ||||||||||
Net increase (decrease) in net assets resulting from operations | 851,056 | (2,325,252 | ) | 1,126,503 | (1,607,178 | ) | ||||||||||
Distributions to shareholders from: | ||||||||||||||||
Net investment income | (257,333 | ) | (256,801 | ) | (1,282,647 | ) | (1,988,010 | ) | ||||||||
Return of capital | — | — | — | (121,017 | ) | |||||||||||
Total distributions to shareholders | (257,333 | ) | (256,801 | ) | (1,282,647 | ) | (2,109,027 | ) | ||||||||
Shareholder transactions: | ||||||||||||||||
Proceeds from shares purchased | — | — | 20,399,624 | 29,645,531 | ||||||||||||
Cost of shares redeemed | — | — | (62,831,320 | ) | (39,522,719 | ) | ||||||||||
Net decrease in net assets resulting from share transactions | — | — | (42,431,696 | ) | (9,877,188 | ) | ||||||||||
Net increase (decrease) in net assets | 593,723 | (2,582,053 | ) | (42,587,840 | ) | (13,593,393 | ) | |||||||||
Net assets: | ||||||||||||||||
Beginning of year | 11,072,142 | 13,654,195 | 132,531,589 | 146,124,982 | ||||||||||||
End of year | $ | 11,665,865 | $ | 11,072,142 | $ | 89,943,749 | $ | 132,531,589 | ||||||||
Undistributed (distributions in excess of) net investment income at end of year | $ | 12,202 | $ | 42,626 | $ | 152,420 | $ | (856 | ) | |||||||
Changes in shares outstanding: | ||||||||||||||||
Shares sold | — | — | 450,000 | 600,000 | ||||||||||||
Shares redeemed | — | — | (1,400,000 | ) | (800,000 | ) | ||||||||||
Net decrease in shares | — | — | (950,000 | ) | (200,000 | ) | ||||||||||
84 | GUGGENHEIM ETFs ANNUAL REPORT | SEE NOTES TO FINANCIAL STATEMENTS. |
STATEMENTS OF CHANGES IN NET ASSETS (continued) |
|
Guggenheim S&P SmallCap 600® Equal Weight ETF | Guggenheim S&P 100® Equal Weight ETF | |||||||||||
Year Ended | Year Ended | Period ended | ||||||||||
Increase (Decrease) in Net Assets from Operations: | ||||||||||||
Net investment income | $ | 308,220 | $ | 527,920 | $ | 16,152 | ||||||
Net realized gain (loss) on investments | (2,975,150 | ) | 760,661 | 63,961 | ||||||||
Net change in unrealized appreciation (depreciation) on investments | 3,224,307 | (4,796,328 | ) | 10,222 | ||||||||
Net increase (decrease) in net assets resulting from operations | 557,377 | (3,507,747 | ) | 90,335 | ||||||||
Distributions to shareholders from: | ||||||||||||
Net investment income | (343,398 | ) | (544,593 | ) | (11,925 | ) | ||||||
Return of capital | — | (29,410 | ) | — | ||||||||
Total distributions to shareholders | (343,398 | ) | (574,003 | ) | (11,925 | ) | ||||||
Shareholder transactions: | ||||||||||||
Proceeds from shares purchased | 9,474,203 | 22,948,358 | 3,867,706 | |||||||||
Cost of shares redeemed | (19,640,274 | ) | (15,317,007 | ) | (1,313,918 | ) | ||||||
Net increase (decrease) in net assets resulting from share transactions | (10,166,071 | ) | 7,631,351 | 2,553,788 | ||||||||
Net increase (decrease) in net assets | (9,952,092 | ) | 3,549,601 | 2,632,198 | ||||||||
Net assets: | ||||||||||||
Beginning of period | 43,930,078 | 40,380,477 | — | |||||||||
End of period | $ | 33,977,986 | $ | 43,930,078 | $ | 2,632,198 | ||||||
Undistributed (distributions in excess of) net investment income at end of period | $ | 21,321 | $ | (4,867 | ) | $ | 6,244 | |||||
Changes in shares outstanding: | ||||||||||||
Shares sold | 250,000 | 500,000 | 150,000 | |||||||||
Shares redeemed | (500,000 | ) | (350,000 | ) | (50,000 | ) | ||||||
Net increase (decrease) in shares | (250,000 | ) | 150,000 | 100,000 | ||||||||
a | Since commencement of operations: June 29, 2016. |
SEE NOTES TO FINANCIAL STATEMENTS. | GUGGENHEIM ETFs ANNUAL REPORT | 85 |
STATEMENTS OF CHANGES IN NET ASSETS (continued) |
|
Guggenheim S&P 500® Equal Weight Consumer Discretionary ETF | Guggenheim S&P 500®Equal Weight Consumer Staples ETF | |||||||||||||||
Year Ended | Year Ended | Year Ended | Year Ended | |||||||||||||
Increase (Decrease) in Net Assets from Operations: | ||||||||||||||||
Net investment income | $ | 1,549,965 | $ | 2,188,663 | $ | 11,830,640 | $ | 5,327,763 | ||||||||
Net realized gain (loss) on investments | (6,897,777 | ) | 18,331,181 | 64,392,147 | 14,431,258 | |||||||||||
Net change in unrealized appreciation (depreciation) on investments | (7,038,042 | ) | (9,745,175 | ) | (19,573,047 | ) | 9,398,344 | |||||||||
Net increase (decrease) in net assets resulting from operations | (12,385,854 | ) | 10,774,669 | 56,649,740 | 29,157,365 | |||||||||||
Distributions to shareholders from: | ||||||||||||||||
Net investment income | (1,560,723 | ) | (2,049,799 | ) | (11,421,201 | ) | (4,938,435 | ) | ||||||||
Shareholder transactions: | ||||||||||||||||
Proceeds from shares purchased | 8,720,472 | 185,396,920 | 569,506,862 | 405,174,870 | ||||||||||||
Cost of shares redeemed | (102,451,705 | ) | (105,017,902 | ) | (531,947,193 | ) | (84,903,374 | ) | ||||||||
Net increase (decrease) in net assets resulting from share transactions | (93,731,233 | ) | 80,379,018 | 37,559,669 | 320,271,496 | |||||||||||
Net increase (decrease) in net assets | (107,677,810 | ) | 89,103,888 | 82,788,208 | 344,490,426 | |||||||||||
Net assets: | ||||||||||||||||
Beginning of year | 176,001,047 | 86,897,159 | 530,872,396 | 186,381,970 | ||||||||||||
End of year | $ | 68,323,237 | $ | 176,001,047 | $ | 613,660,604 | $ | 530,872,396 | ||||||||
Undistributed net investment income at end of year | $ | 156,494 | $ | 167,253 | $ | 1,123,753 | $ | 703,192 | ||||||||
Changes in shares outstanding: | ||||||||||||||||
Shares sold | 100,000 | 2,100,000 | 4,800,000 | 3,700,000 | ||||||||||||
Shares redeemed | (1,250,000 | ) | (1,200,000 | ) | (4,500,000 | ) | (800,000 | ) | ||||||||
Net increase (decrease) in shares | (1,150,000 | ) | 900,000 | 300,000 | 2,900,000 | |||||||||||
86 | GUGGENHEIM ETFs ANNUAL REPORT | SEE NOTES TO FINANCIAL STATEMENTS. |
STATEMENTS OF CHANGES IN NET ASSETS (continued) |
|
Guggenheim S&P 500® Equal Weight Energy ETF | Guggenheim S&P 500® Equal Weight Financials ETF | |||||||||||||||
Year Ended | Year Ended | Year Ended | Year Ended | |||||||||||||
Increase (Decrease) in Net Assets from Operations: | ||||||||||||||||
Net investment income | $ | 3,344,310 | $ | 3,139,133 | $ | 3,087,492 | $ | 2,856,761 | ||||||||
Net realized gain (loss) on investments | (26,613,503 | ) | (16,888,985 | ) | (6,127,650 | ) | 9,158,986 | |||||||||
Net change in unrealized appreciation (depreciation) on investments | 43,196,210 | (30,348,311 | ) | 2,466,708 | (13,121,264 | ) | ||||||||||
Net increase (decrease) in net assets resulting from operations | 19,927,017 | (44,098,163 | ) | (573,450 | ) | (1,105,517 | ) | |||||||||
Distributions to shareholders from: | ||||||||||||||||
Net investment income | (3,414,412 | ) | (3,174,568 | ) | (3,197,168 | ) | (3,019,133 | ) | ||||||||
Return of capital | — | — | (44,777,358 | )a | (198,204 | ) | ||||||||||
Total distributions to shareholders | (3,414,412 | ) | (3,174,568 | ) | (47,974,526 | ) | (3,217,337 | ) | ||||||||
Shareholder transactions: | ||||||||||||||||
Proceeds from shares purchased | 82,525,656 | 146,213,054 | 101,995,202 | 172,998,339 | ||||||||||||
Cost of shares redeemed | (76,647,251 | ) | (22,474,535 | ) | (122,418,077 | ) | (121,370,788 | ) | ||||||||
Net increase (decrease) in net assets resulting from share transactions | 5,878,405 | 123,738,519 | (20,422,875 | ) | 51,627,551 | |||||||||||
Net increase (decrease) in net assets | 22,391,010 | 76,465,788 | (68,970,851 | ) | 47,304,697 | |||||||||||
Net assets: | ||||||||||||||||
Beginning of year | 176,772,648 | 100,306,860 | 183,620,350 | 136,315,653 | ||||||||||||
End of year | $ | 199,163,658 | $ | 176,772,648 | $ | 114,649,499 | $ | 183,620,350 | ||||||||
Undistributed net investment income at end of year | $ | 100,794 | $ | 170,896 | $ | — | $ | — | ||||||||
Changes in shares outstanding: | ||||||||||||||||
Shares sold | 1,600,000 | 2,300,000 | 2,400,000 | 3,900,000 | ||||||||||||
Shares redeemed | (1,350,000 | ) | (350,000 | ) | (2,950,000 | ) | (2,850,000 | ) | ||||||||
Net increase (decrease) in shares | 250,000 | 1,950,000 | (550,000 | ) | 1,050,000 | |||||||||||
a | Special Distribution — See Note 10. |
SEE NOTES TO FINANCIAL STATEMENTS. | GUGGENHEIM ETFs ANNUAL REPORT | 87 |
STATEMENTS OF CHANGES IN NET ASSETS (continued) |
|
Guggenheim S&P 500® Equal Weight Health Care ETF | Guggenheim S&P 500® Equal Weight Industrials ETF | |||||||||||||||
Year Ended | Year Ended | Year Ended | Year Ended | |||||||||||||
Increase (Decrease) in Net Assets from Operations: | ||||||||||||||||
Net investment income | $ | 2,694,826 | $ | 3,104,547 | $ | 1,621,856 | $ | 1,589,022 | ||||||||
Net realized gain (loss) on investments | (4,697,313 | ) | 92,266,709 | 2,689,421 | 7,897,507 | |||||||||||
Net change in unrealized appreciation (depreciation) on investments | (20,086,726 | ) | (71,010,844 | ) | 1,123,759 | (12,554,131 | ) | |||||||||
Net increase (decrease) in net assets resulting from operations | (22,089,213 | ) | 24,360,412 | 5,435,036 | (3,067,602 | ) | ||||||||||
Distributions to shareholders from: | ||||||||||||||||
Net investment income | (2,529,726 | ) | (2,938,855 | ) | (1,434,252 | ) | (1,865,867 | ) | ||||||||
Return of capital | — | — | — | (42,175 | ) | |||||||||||
Total distributions to shareholders | (2,529,726 | ) | (2,938,855 | ) | (1,434,252 | ) | (1,908,042 | ) | ||||||||
Shareholder transactions: | ||||||||||||||||
Proceeds from shares purchased | 194,817,565 | 640,046,161 | 98,402,755 | 54,081,202 | ||||||||||||
Cost of shares redeemed | (265,597,969 | ) | (483,288,596 | ) | (68,946,182 | ) | (78,722,508 | ) | ||||||||
Net increase (decrease) in net assets resulting from share transactions | (70,780,404 | ) | 156,757,565 | 29,456,573 | (24,641,306 | ) | ||||||||||
Net increase (decrease) in net assets | (95,399,343 | ) | 178,179,122 | 33,457,357 | (29,616,950 | ) | ||||||||||
Net assets: | ||||||||||||||||
Beginning of year | 569,893,108 | 391,713,986 | 93,830,534 | 123,447,484 | ||||||||||||
End of year | $ | 474,493,765 | $ | 569,893,108 | $ | 127,287,891 | $ | 93,830,534 | ||||||||
Undistributed net investment income at end of year | $ | 292,295 | $ | — | $ | 235,634 | $ | — | ||||||||
Changes in shares outstanding: | ||||||||||||||||
Shares sold | 1,300,000 | 4,200,000 | 1,100,000 | 600,000 | ||||||||||||
Shares redeemed | (1,800,000 | ) | (3,250,000 | ) | (800,000 | ) | (900,000 | ) | ||||||||
Net increase (decrease) in shares | (500,000 | ) | 950,000 | 300,000 | (300,000 | ) | ||||||||||
88 | GUGGENHEIM ETFs ANNUAL REPORT | SEE NOTES TO FINANCIAL STATEMENTS. |
STATEMENTS OF CHANGES IN NET ASSETS (continued) |
|
Guggenheim S&P 500® Equal Weight Materials ETF | Guggenheim S&P 500® Equal Weight Real Estate ETF | |||||||||||||||
Year Ended | Year Ended | Year Ended | Period ended | |||||||||||||
Increase (Decrease) in Net Assets from Operations: | ||||||||||||||||
Net investment income | $ | 1,159,563 | $ | 1,097,662 | $ | 191,989 | $ | 13,371 | ||||||||
Net realized gain on investments | 287,706 | 2,048,544 | 267,436 | 722 | ||||||||||||
Net change in unrealized appreciation (depreciation) on investments | 3,034,814 | (8,146,411 | ) | (1,678,281 | ) | 25,713 | ||||||||||
Net increase (decrease) in net assets resulting from operations | 4,482,083 | (5,000,205 | ) | (1,218,856 | ) | 39,806 | ||||||||||
Distributions to shareholders from: | ||||||||||||||||
Net investment income | (1,136,509 | ) | (1,098,723 | ) | (66,011 | ) | (8,313 | ) | ||||||||
Shareholder transactions: | ||||||||||||||||
Proceeds from shares purchased | 66,623,002 | 49,421,316 | 48,179,615 | 2,531,138 | ||||||||||||
Cost of shares redeemed | (41,487,373 | ) | (61,478,764 | ) | (13,322,327 | ) | — | |||||||||
Net increase (decrease) in net assets resulting from share transactions | 25,135,629 | (12,057,448 | ) | 34,857,288 | 2,531,138 | |||||||||||
Net increase (decrease) in net assets | 28,481,203 | (18,156,376 | ) | 33,572,421 | 2,562,631 | |||||||||||
Net assets: | ||||||||||||||||
Beginning of period | 55,982,123 | 74,138,499 | 2,562,631 | — | ||||||||||||
End of period | $ | 84,463,326 | $ | 55,982,123 | $ | 36,135,052 | $ | 2,562,631 | ||||||||
Undistributed net investment income at end of period | $ | 94,609 | $ | 70,106 | $ | 193,328 | $ | 5,779 | ||||||||
Changes in shares outstanding: | ||||||||||||||||
Shares sold | 800,000 | 550,000 | 1,800,000 | 100,000 | ||||||||||||
Shares redeemed | (500,000 | ) | (750,000 | ) | (500,000 | ) | — | |||||||||
Net increase (decrease) in shares | 300,000 | (200,000 | ) | 1,300,000 | 100,000 | |||||||||||
a | Since commencement of operations: August 12, 2015. |
SEE NOTES TO FINANCIAL STATEMENTS. | GUGGENHEIM ETFs ANNUAL REPORT | 89 |
STATEMENTS OF CHANGES IN NET ASSETS (concluded) |
|
Guggenheim S&P 500® Equal Weight Technology ETF | Guggenheim S&P 500® Equal Weight Utilities ETF | |||||||||||||||
Year Ended | Year Ended | Year Ended | Year Ended | |||||||||||||
Increase (Decrease) in Net Assets from Operations: | ||||||||||||||||
Net investment income | $ | 11,551,073 | $ | 9,912,225 | $ | 6,435,980 | $ | 5,424,195 | ||||||||
Net realized gain on investments | 45,741,023 | 79,925,421 | 8,109,619 | 2,693,007 | ||||||||||||
Net change in unrealized appreciation (depreciation) on investments | 16,659,550 | (42,809,730 | ) | 5,981,382 | (18,243,029 | ) | ||||||||||
Net increase (decrease) in net assets resulting from operations | 73,951,646 | 47,027,916 | 20,526,981 | (10,125,827 | ) | |||||||||||
Distributions to shareholders from: | ||||||||||||||||
Net investment income | (11,574,847 | ) | (10,224,817 | ) | (6,269,737 | ) | (5,791,076 | ) | ||||||||
Return of capital | — | (617,780 | ) | — | — | |||||||||||
Total distributions to shareholders | (11,574,847 | ) | (10,842,597 | ) | (6,269,737 | ) | (5,791,076 | ) | ||||||||
Shareholder transactions: | ||||||||||||||||
Proceeds from shares purchased | 547,497,519 | 470,511,829 | 182,433,708 | 198,571,649 | ||||||||||||
Cost of shares redeemed | (434,624,288 | ) | (437,289,257 | ) | (114,084,544 | ) | (196,271,911 | ) | ||||||||
Net increase in net assets resulting from share transactions | 112,873,231 | 33,222,572 | 68,349,164 | 2,299,738 | ||||||||||||
Net increase (decrease) in net assets | 175,250,030 | 69,407,891 | 82,606,408 | (13,617,165 | ) | |||||||||||
Net assets: | ||||||||||||||||
Beginning of year | 740,628,669 | 671,220,778 | 128,258,319 | 141,875,484 | ||||||||||||
End of year | $ | 915,878,699 | $ | 740,628,669 | $ | 210,864,727 | $ | 128,258,319 | ||||||||
Undistributed net investment income at end of year | $ | 634,073 | $ | — | $ | 528,629 | $ | 20,079 | ||||||||
Changes in shares outstanding: | ||||||||||||||||
Shares sold | 5,550,000 | 5,100,000 | 2,250,000 | 2,550,000 | ||||||||||||
Shares redeemed | (4,750,000 | ) | (4,850,000 | ) | (1,400,000 | ) | (2,650,000 | ) | ||||||||
Net increase (decrease) in shares | 800,000 | 250,000 | 850,000 | (100,000 | ) | |||||||||||
90 | GUGGENHEIM ETFs ANNUAL REPORT | SEE NOTES TO FINANCIAL STATEMENTS. |
Guggenheim MSCI Emerging Markets Equal Country Weight ETF |
FINANCIAL HIGHLIGHTS |
This table is presented to show selected data for a share outstanding throughout each period and to assist shareholders in evaluating the Fund’s performance for the periods presented.
Year Ended | Year Ended | Year Ended | Year Ended | Year Ended | ||||||||||||||||
Per Share Data: | ||||||||||||||||||||
Net asset value, beginning of period | $ | 27.68 | $ | 34.14 | $ | 34.43 | $ | 33.31 | $ | 33.83 | ||||||||||
Income from investment operations: | ||||||||||||||||||||
Net investment income (loss)a | 0.56 | 0.71 | 0.64 | 0.50 | 0.55 | |||||||||||||||
Net gain (loss) on investments (realized and unrealized) | 1.56 | (6.53 | ) | (0.31 | ) | 1.06 | (0.53 | ) | ||||||||||||
Total from investment operations | 2.12 | (5.82 | ) | 0.33 | 1.56 | 0.02 | ||||||||||||||
Less distributions from: | ||||||||||||||||||||
Net investment income | (0.64 | ) | (0.64 | ) | (0.62 | ) | (0.44 | ) | (0.48 | ) | ||||||||||
Return of capital | — | — | — | — | (0.06 | ) | ||||||||||||||
Total distributions to shareholders | (0.64 | ) | (0.64 | ) | (0.62 | ) | (0.44 | ) | (0.54 | ) | ||||||||||
Net asset value, end of period | $ | 29.16 | $ | 27.68 | $ | 34.14 | $ | 34.43 | $ | 33.31 | ||||||||||
Total Returnb | 7.80 | % | (17.21 | %) | 0.99 | % | 4.76 | % | 0.10 | % | ||||||||||
Ratios/Supplemental Data: | ||||||||||||||||||||
Net assets, end of period (in thousands) | $ | 11,666 | $ | 11,072 | $ | 13,654 | $ | 10,328 | $ | 13,325 | ||||||||||
Ratio to average net assets of: | ||||||||||||||||||||
Net investment income (loss) | 2.07 | % | 2.26 | % | 1.86 | % | 1.47 | % | 1.66 | % | ||||||||||
Total expensesc | 0.71 | % | 0.70 | % | 0.70 | % | 0.71 | % | 0.72 | % | ||||||||||
Net expensesd | 0.66 | % | 0.64 | % | 0.60 | % | 0.60 | % | 0.61 | % | ||||||||||
Portfolio turnover ratee | 11 | % | 99 | % | 25 | % | 38 | % | 39 | % | ||||||||||
a | Based on average shares outstanding. |
b | Total investment return is calculated assuming an initial investment made at the net asset value at the beginning of the period, reinvestment of all dividends and distribution at net asset value during the period, and redemption on the last day of the period. Transaction fees are not reflected in the calculation of total investment return. |
c | Excludes expenses of the underlying funds in which the Fund invests. |
d | Net expense information reflects the expense ratios after expense waivers. |
e | Portfolio turnover does not include securities received or delivered from processing creations or redemptions. |
SEE NOTES TO FINANCIAL STATEMENTS. | GUGGENHEIM ETFs ANNUAL REPORT | 91 |
Guggenheim S&P MidCap 400® Equal Weight ETF |
FINANCIAL HIGHLIGHTS |
This table is presented to show selected data for a share outstanding throughout each period and to assist shareholders in evaluating the Fund’s performance for the periods presented.
Year Ended | Year Ended | Year Ended | Year Ended | Year Ended | ||||||||||||||||
Per Share Data: | ||||||||||||||||||||
Net asset value, beginning of period | $ | 49.09 | $ | 50.39 | $ | 45.24 | $ | 33.95 | $ | 31.15 | ||||||||||
Income from investment operations: | ||||||||||||||||||||
Net investment income (loss)a | 0.66 | 0.62 | 0.62 | 0.57 | 0.46 | |||||||||||||||
Net gain (loss) on investments (realized and unrealized) | 2.30 | (1.21 | ) | 5.48 | 11.28 | 2.80 | ||||||||||||||
Total from investment operations | 2.96 | (0.59 | ) | 6.10 | 11.85 | 3.26 | ||||||||||||||
Less distributions from: | ||||||||||||||||||||
Net investment income | (0.65 | ) | (0.67 | ) | (0.59 | ) | (0.56 | ) | (0.46 | ) | ||||||||||
Capital gains | — | — | (0.36 | ) | — | — | ||||||||||||||
Return of capital | — | (0.04 | ) | — | — | — | ||||||||||||||
Total distributions to shareholders | (0.65 | ) | (0.71 | ) | (0.95 | ) | (0.56 | ) | (0.46 | ) | ||||||||||
Net asset value, end of period | $ | 51.40 | $ | 49.09 | $ | 50.39 | $ | 45.24 | $ | 33.95 | ||||||||||
Total Returnb | 6.08 | % | (1.19 | %) | 13.61 | % | 35.21 | % | 10.52 | % | ||||||||||
Ratios/Supplemental Data: | ||||||||||||||||||||
Net assets, end of period (in thousands) | $ | 89,944 | $ | 132,532 | $ | 146,125 | $ | 76,904 | $ | 52,617 | ||||||||||
Ratio to average net assets of: | ||||||||||||||||||||
Net investment income (loss) | 1.35 | % | 1.22 | % | 1.27 | % | 1.44 | % | 1.39 | % | ||||||||||
Total expenses | 0.41 | % | 0.41 | % | 0.41 | % | 0.41 | % | 0.41 | % | ||||||||||
Portfolio turnover ratec | 101 | % | 31 | % | 29 | % | 29 | % | 33 | % | ||||||||||
a | Based on average shares outstanding. |
b | Total investment return is calculated assuming an initial investment made at the net asset value at the beginning of the period, reinvestment of all dividends and distribution at net asset value during the period, and redemption on the last day of the period. Transaction fees are not reflected in the calculation of total investment return. |
c | Portfolio turnover does not include securities received or delivered from processing creations or redemptions. |
92 | GUGGENHEIM ETFs ANNUAL REPORT | SEE NOTES TO FINANCIAL STATEMENTS. |
Guggenheim S&P SmallCap 600® Equal Weight ETF |
FINANCIAL HIGHLIGHTS |
This table is presented to show selected data for a share outstanding throughout each period and to assist shareholders in evaluating the Fund’s performance for the periods presented.
Year Ended | Year Ended | Year Ended | Year Ended | Year Ended | ||||||||||||||||
Per Share Data: | ||||||||||||||||||||
Net asset value, beginning of period | $ | 41.84 | $ | 44.87 | $ | 42.89 | $ | 31.82 | $ | 29.48 | ||||||||||
Income from investment operations: | ||||||||||||||||||||
Net investment income (loss)a | 0.32 | 0.49 | 0.43 | 0.54 | 0.34 | |||||||||||||||
Net gain (loss) on investments (realized and unrealized) | 0.67 | (2.97 | ) | 1.97 | 11.12 | 2.33 | ||||||||||||||
Total from investment operations | 0.99 | (2.48 | ) | 2.40 | 11.66 | 2.67 | ||||||||||||||
Less distributions from: | ||||||||||||||||||||
Net investment income | (0.36 | ) | (0.52 | ) | (0.42 | ) | (0.59 | ) | (0.33 | ) | ||||||||||
Return of capital | — | (0.03 | ) | — | — | — | ||||||||||||||
Total distributions to shareholders | (0.36 | ) | (0.55 | ) | (0.42 | ) | (0.59 | ) | (0.33 | ) | ||||||||||
Net asset value, end of period | $ | 42.47 | $ | 41.84 | $ | 44.87 | $ | 42.89 | $ | 31.82 | ||||||||||
Total Returnb | 2.39 | % | (5.59 | %) | 5.58 | % | 37.07 | % | 9.08 | % | ||||||||||
Ratios/Supplemental Data: | ||||||||||||||||||||
Net assets, end of period (in thousands) | $ | 33,978 | $ | 43,930 | $ | 40,380 | $ | 25,736 | $ | 14,318 | ||||||||||
Ratio to average net assets of: | ||||||||||||||||||||
Net investment income (loss) | 0.80 | % | 1.11 | % | 0.96 | % | 1.46 | % | 1.10 | % | ||||||||||
Total expenses | 0.41 | % | 0.41 | % | 0.42 | % | 0.41 | % | 0.41 | % | ||||||||||
Portfolio turnover ratec | 96 | % | 47 | % | 43 | % | 42 | % | 43 | % | ||||||||||
a | Based on average shares outstanding. |
b | Total investment return is calculated assuming an initial investment made at the net asset value at the beginning of the period, reinvestment of all dividends and distribution at net asset value during the period, and redemption on the last day of the period. Transaction fees are not reflected in the calculation of total investment return. |
c | Portfolio turnover does not include securities received or delivered from processing creations or redemptions. |
SEE NOTES TO FINANCIAL STATEMENTS. | GUGGENHEIM ETFs ANNUAL REPORT | 93 |
Guggenheim S&P 100® Equal Weight ETF |
FINANCIAL HIGHLIGHTS |
This table is presented to show selected data for a share outstanding throughout each period and to assist shareholders in evaluating the Fund’s performance for the periods presented.
Period Ended | ||||
Per Share Data: | ||||
Net asset value, beginning of period | $ | 25.45 | ||
Income from investment operations: | ||||
Net investment income (loss)b | 0.16 | |||
Net gain (loss) on investments (realized and unrealized) | 0.79 | |||
Total from investment operations | 0.95 | |||
Less distributions from: | ||||
Net investment income | (0.08 | ) | ||
Total distributions to shareholders | (0.08 | ) | ||
Net asset value, end of period | $ | 26.32 | ||
Total Returnc | 3.73 | % | ||
Ratios/Supplemental Data: | ||||
Net assets, end of period (in thousands) | $ | 2,632 | ||
Ratio to average net assets of: | ||||
Net investment income (loss) | 1.77 | %d | ||
Total expenses | 0.40 | %d | ||
Portfolio turnover ratee | 3 | % | ||
a | The Fund commenced operations on June 29, 2016. |
b | Based on average shares outstanding. |
c | Total investment return is calculated assuming an initial investment made at the net asset value at the beginning of the period, reinvestment of all dividends and distribution at net asset value during the period, and redemption on the last day of the period. Transaction fees are not reflected in the calculation of total investment return. |
d | Annualized. |
e | Portfolio turnover does not include securities received or delivered from processing creations or redemptions. |
94 | GUGGENHEIM ETFs ANNUAL REPORT | SEE NOTES TO FINANCIAL STATEMENTS. |
Guggenheim S&P 500® Equal Weight Consumer Discretionary ETF |
FINANCIAL HIGHLIGHTS |
This table is presented to show selected data for a share outstanding throughout each period and to assist shareholders in evaluating the Fund’s performance for the periods presented.
Year Ended | Year Ended | Year Ended | Year Ended | Year Ended | ||||||||||||||||
Per Share Data: | ||||||||||||||||||||
Net asset value, beginning of period | $ | 90.26 | $ | 82.76 | $ | 76.06 | $ | 55.09 | $ | 47.70 | ||||||||||
Income from investment operations: | ||||||||||||||||||||
Net investment income (loss)a | 1.29 | 1.15 | 0.95 | 0.79 | 0.64 | |||||||||||||||
Net gain (loss) on investments (realized and unrealized) | (4.96 | ) | 7.39 | 6.67 | 21.02 | 7.46 | ||||||||||||||
Total from investment operations | (3.67 | ) | 8.54 | 7.62 | 21.81 | 8.10 | ||||||||||||||
Less distributions from: | ||||||||||||||||||||
Net investment income | (1.19 | ) | (1.04 | ) | (0.92 | ) | (0.84 | ) | (0.71 | ) | ||||||||||
Total distributions to shareholders | (1.19 | ) | (1.04 | ) | (0.92 | ) | (0.84 | ) | (0.71 | ) | ||||||||||
Net asset value, end of period | $ | 85.40 | $ | 90.26 | $ | 82.76 | $ | 76.06 | $ | 55.09 | ||||||||||
Total Returnb | (4.07 | %) | 10.35 | % | 10.07 | % | 39.91 | % | 17.05 | % | ||||||||||
Ratios/Supplemental Data: | ||||||||||||||||||||
Net assets, end of period (in thousands) | $ | 68,323 | $ | 176,001 | $ | 86,897 | $ | 125,497 | $ | 41,314 | ||||||||||
Ratio to average net assets of: | ||||||||||||||||||||
Net investment income (loss) | 1.49 | % | 1.29 | % | 1.20 | % | 1.19 | % | 1.22 | % | ||||||||||
Total expenses | 0.40 | % | 0.40 | % | 0.40 | % | 0.50 | % | 0.50 | % | ||||||||||
Portfolio turnover ratec | 30 | % | 23 | % | 22 | % | 20 | % | 25 | % | ||||||||||
a | Based on average shares outstanding. |
b | Total investment return is calculated assuming an initial investment made at the net asset value at the beginning of the period, reinvestment of all dividends and distribution at net asset value during the period, and redemption on the last day of the period. Transaction fees are not reflected in the calculation of total investment return. |
c | Portfolio turnover does not include securities received or delivered from processing creations or redemptions. |
SEE NOTES TO FINANCIAL STATEMENTS. | GUGGENHEIM ETFs ANNUAL REPORT | 95 |
Guggenheim S&P 500® Equal Weight Consumer Staples ETF |
FINANCIAL HIGHLIGHTS |
This table is presented to show selected data for a share outstanding throughout each period and to assist shareholders in evaluating the Fund’s performance for the periods presented.
Year Ended | Year Ended | Year Ended | Year Ended | Year Ended | ||||||||||||||||
Per Share Data: | ||||||||||||||||||||
Net asset value, beginning of period | $ | 111.76 | $ | 100.75 | $ | 88.48 | $ | 68.24 | $ | 61.01 | ||||||||||
Income from investment operations: | ||||||||||||||||||||
Net investment income (loss)a | 2.19 | 2.08 | 2.04 | 1.73 | 1.41 | |||||||||||||||
Net gain (loss) on investments (realized and unrealized) | 9.69 | 10.86 | 12.03 | 20.22 | 7.20 | |||||||||||||||
Total from investment operations | 11.88 | 12.94 | 14.07 | 21.95 | 8.61 | |||||||||||||||
Less distributions from: | ||||||||||||||||||||
Net investment income | (2.12 | ) | (1.93 | ) | (1.80 | ) | (1.71 | ) | (1.38 | ) | ||||||||||
Total distributions to shareholders | (2.12 | ) | (1.93 | ) | (1.80 | ) | (1.71 | ) | (1.38 | ) | ||||||||||
Net asset value, end of period | $ | 121.52 | $ | 111.76 | $ | 100.75 | $ | 88.48 | $ | 68.24 | ||||||||||
Total Returnb | 10.63 | % | 12.95 | % | 16.04 | % | 32.59 | % | 14.19 | % | ||||||||||
Ratios/Supplemental Data: | ||||||||||||||||||||
Net assets, end of period (in thousands) | $ | 613,661 | $ | 530,872 | $ | 186,382 | $ | 84,054 | $ | 40,944 | ||||||||||
Ratio to average net assets of: | ||||||||||||||||||||
Net investment income (loss) | 1.81 | % | 1.94 | % | 2.18 | % | 2.15 | % | 2.14 | % | ||||||||||
Total expenses | 0.40 | % | 0.40 | % | 0.40 | % | 0.50 | % | 0.50 | % | ||||||||||
Portfolio turnover ratec | 17 | % | 16 | % | 20 | % | 17 | % | 18 | % | ||||||||||
a | Based on average shares outstanding. |
b | Total investment return is calculated assuming an initial investment made at the net asset value at the beginning of the period, reinvestment of all dividends and distribution at net asset value during the period, and redemption on the last day of the period. Transaction fees are not reflected in the calculation of total investment return. |
c | Portfolio turnover does not include securities received or delivered from processing creations or redemptions. |
96 | GUGGENHEIM ETFs ANNUAL REPORT | SEE NOTES TO FINANCIAL STATEMENTS. |
Guggenheim S&P 500® Equal Weight Energy ETF |
FINANCIAL HIGHLIGHTS |
This table is presented to show selected data for a share outstanding throughout each period and to assist shareholders in evaluating the Fund’s performance for the periods presented.
Year Ended | Year Ended | Year Ended | Year Ended | Year Ended | ||||||||||||||||
Per Share Data: | ||||||||||||||||||||
Net asset value, beginning of period | $ | 54.39 | $ | 77.16 | $ | 79.86 | $ | 64.01 | $ | 64.16 | ||||||||||
Income from investment operations: | ||||||||||||||||||||
Net investment income (loss)a | 0.90 | 1.35 | 1.40 | 0.78 | 0.55 | |||||||||||||||
Net gain (loss) on investments (realized and unrealized) | 2.53 | (22.73 | ) | (2.91 | ) | 15.87 | (0.19 | ) | ||||||||||||
Total from investment operations | 3.43 | (21.38 | ) | (1.51 | ) | 16.65 | 0.36 | |||||||||||||
Less distributions from: | ||||||||||||||||||||
Net investment income | (0.92 | ) | (1.39 | ) | (1.19 | ) | (0.80 | ) | (0.51 | ) | ||||||||||
Total distributions to shareholders | (0.92 | ) | (1.39 | ) | (1.19 | ) | (0.80 | ) | (0.51 | ) | ||||||||||
Net asset value, end of period | $ | 56.90 | $ | 54.39 | $ | 77.16 | $ | 79.86 | $ | 64.01 | ||||||||||
Total Returnb | 6.50 | % | (27.93 | %) | (2.02 | %) | 26.19 | % | 0.58 | % | ||||||||||
Ratios/Supplemental Data: | ||||||||||||||||||||
Net assets, end of period (in thousands) | $ | 199,164 | $ | 176,773 | $ | 100,307 | $ | 43,924 | $ | 32,004 | ||||||||||
Ratio to average net assets of: | ||||||||||||||||||||
Net investment income (loss) | 1.72 | % | 2.16 | % | 1.64 | % | 1.09 | % | 0.88 | % | ||||||||||
Total expenses | 0.40 | % | 0.40 | % | 0.40 | % | 0.50 | % | 0.50 | % | ||||||||||
Portfolio turnover ratec | 41 | % | 34 | % | 25 | % | 17 | % | 30 | % | ||||||||||
a | Based on average shares outstanding. |
b | Total investment return is calculated assuming an initial investment made at the net asset value at the beginning of the period, reinvestment of all dividends and distribution at net asset value during the period, and redemption on the last day of the period. Transaction fees are not reflected in the calculation of total investment return. |
c | Portfolio turnover does not include securities received or delivered from processing creations or redemptions. |
SEE NOTES TO FINANCIAL STATEMENTS. | GUGGENHEIM ETFs ANNUAL REPORT | 97 |
Guggenheim S&P 500® Equal Weight Financials ETF |
FINANCIAL HIGHLIGHTS |
This table is presented to show selected data for a share outstanding throughout each period and to assist shareholders in evaluating the Fund’s performance for the periods presented.
Year Ended | Year Ended | Year Ended | Year Ended | Year Ended | ||||||||||||||||
Per Share Data: | ||||||||||||||||||||
Net asset value, beginning of period | $ | 43.72 | $ | 43.27 | $ | 37.64 | $ | 28.68 | $ | 24.48 | ||||||||||
Income from investment operations: | ||||||||||||||||||||
Net investment income (loss)a | 0.81 | 0.72 | 0.53 | 0.57 | 0.39 | |||||||||||||||
Net gain (loss) on investments (realized and unrealized) | 1.03 | 0.58 | 5.76 | 9.08 | 4.32 | |||||||||||||||
Total from investment operations | 1.84 | 1.30 | 6.29 | 9.65 | 4.71 | |||||||||||||||
Less distributions from: | ||||||||||||||||||||
Net investment income | (0.78 | ) | (0.80 | ) | (0.66 | ) | (0.58 | ) | (0.42 | ) | ||||||||||
Return of capital | (13.37 | )d | (0.05 | ) | — | (0.11 | ) | (0.09 | ) | |||||||||||
Total distributions to shareholders | (14.15 | ) | (0.85 | ) | (0.66 | ) | (0.69 | ) | (0.51 | ) | ||||||||||
Net asset value, end of period | $ | 31.41 | $ | 43.72 | $ | 43.27 | $ | 37.64 | $ | 28.68 | ||||||||||
Total Returnb | 4.33 | % | 3.04 | % | 16.84 | % | 34.05 | % | 19.32 | % | ||||||||||
Ratios/Supplemental Data: | ||||||||||||||||||||
Net assets, end of period (in thousands) | $ | 114,649 | $ | 183,620 | $ | 136,316 | $ | 58,337 | $ | 14,339 | ||||||||||
Ratio to average net assets of: | ||||||||||||||||||||
Net investment income (loss) | 1.96 | % | 1.64 | % | 1.30 | % | 1.65 | % | 1.48 | % | ||||||||||
Total expenses | 0.40 | % | 0.40 | % | 0.40 | % | 0.50 | % | 0.50 | % | ||||||||||
Portfolio turnover ratec | 53 | % | 13 | % | 19 | % | 14 | % | 17 | % | ||||||||||
a | Based on average shares outstanding. |
b | Total investment return is calculated assuming an initial investment made at the net asset value at the beginning of the period, reinvestment of all dividends and distribution at net asset value during the period, and redemption on the last day of the period. Transaction fees are not reflected in the calculation of total investment return. |
c | Portfolio turnover does not include securities received or delivered from processing creations or redemptions. |
d | Special Distribution — See Note 10. |
98 | GUGGENHEIM ETFs ANNUAL REPORT | SEE NOTES TO FINANCIAL STATEMENTS. |
Guggenheim S&P 500® Equal Weight Health Care ETF |
FINANCIAL HIGHLIGHTS |
This table is presented to show selected data for a share outstanding throughout each period and to assist shareholders in evaluating the Fund’s performance for the periods presented.
Year Ended | Year Ended | Year Ended | Year Ended | Year Ended | ||||||||||||||||
Per Share Data: | ||||||||||||||||||||
Net asset value, beginning of period | $ | 149.97 | $ | 137.44 | $ | 104.50 | $ | 76.84 | $ | 66.49 | ||||||||||
Income from investment operations: | ||||||||||||||||||||
Net investment income (loss)a | 0.78 | 0.75 | 0.66 | 0.55 | 0.47 | |||||||||||||||
Net gain (loss) on investments (realized and unrealized) | (6.22 | ) | 12.46 | 32.89 | 27.63 | 11.04 | ||||||||||||||
Total from investment operations | (5.44 | ) | 13.21 | 33.55 | 28.18 | 11.51 | ||||||||||||||
Less distributions from: | ||||||||||||||||||||
Net investment income | (0.74 | ) | (0.68 | ) | (0.61 | ) | (0.52 | ) | (1.16 | ) | ||||||||||
Total distributions to shareholders | (0.74 | ) | (0.68 | ) | (0.61 | ) | (0.52 | ) | (1.16 | ) | ||||||||||
Net asset value, end of period | $ | 143.79 | $ | 149.97 | $ | 137.44 | $ | 104.50 | $ | 76.84 | ||||||||||
Total Returnb | (3.65 | %) | 9.61 | % | 32.20 | % | 36.81 | % | 17.39 | % | ||||||||||
Ratios/Supplemental Data: | ||||||||||||||||||||
Net assets, end of period (in thousands) | $ | 474,494 | $ | 569,893 | $ | 391,714 | $ | 130,627 | $ | 38,419 | ||||||||||
Ratio to average net assets of: | ||||||||||||||||||||
Net investment income (loss) | 0.52 | % | 0.49 | % | 0.55 | % | 0.60 | % | 0.65 | % | ||||||||||
Total expenses | 0.40 | % | 0.40 | % | 0.40 | % | 0.50 | % | 0.50 | % | ||||||||||
Portfolio turnover ratec | 28 | % | 22 | % | 23 | % | 24 | % | 15 | % | ||||||||||
a | Based on average shares outstanding. |
b | Total investment return is calculated assuming an initial investment made at the net asset value at the beginning of the period, reinvestment of all dividends and distribution at net asset value during the period, and redemption on the last day of the period. Transaction fees are not reflected in the calculation of total investment return. |
c | Portfolio turnover does not include securities received or delivered from processing creations or redemptions. |
SEE NOTES TO FINANCIAL STATEMENTS. | GUGGENHEIM ETFs ANNUAL REPORT | 99 |
Guggenheim S&P 500® Equal Weight Industrials ETF |
FINANCIAL HIGHLIGHTS |
This table is presented to show selected data for a share outstanding throughout each period and to assist shareholders in evaluating the Fund’s performance for the periods presented.
Year Ended | Year Ended | Year Ended | Year Ended | Year Ended | ||||||||||||||||
Per Share Data: | ||||||||||||||||||||
Net asset value, beginning of period | $ | 85.30 | $ | 88.18 | $ | 76.33 | $ | 56.94 | $ | 51.50 | ||||||||||
Income from investment operations: | ||||||||||||||||||||
Net investment income (loss)a | 1.40 | 1.13 | 1.22 | 0.95 | 1.05 | |||||||||||||||
Net gain (loss) on investments (realized and unrealized) | 5.57 | (2.69 | ) | 11.59 | 19.41 | 5.42 | ||||||||||||||
Total from investment operations | 6.97 | (1.56 | ) | 12.81 | 20.36 | 6.47 | ||||||||||||||
Less distributions from: | ||||||||||||||||||||
Net investment income | (1.35 | ) | (1.29 | ) | (0.96 | ) | (0.97 | ) | (1.03 | ) | ||||||||||
Return of capital | — | (0.03 | ) | — | — | — | ||||||||||||||
Total distributions to shareholders | (1.35 | ) | (1.32 | ) | (0.96 | ) | (0.97 | ) | (1.03 | ) | ||||||||||
Net asset value, end of period | $ | 90.92 | $ | 85.30 | $ | 88.18 | $ | 76.33 | $ | 56.94 | ||||||||||
Total Returnb | 8.25 | % | (1.78 | %) | 16.85 | % | 36.10 | % | 12.64 | % | ||||||||||
Ratios/Supplemental Data: | ||||||||||||||||||||
Net assets, end of period (in thousands) | $ | 127,288 | $ | 93,831 | $ | 123,447 | $ | 57,251 | $ | 17,082 | ||||||||||
Ratio to average net assets of: | ||||||||||||||||||||
Net investment income (loss) | 1.60 | % | 1.29 | % | 1.47 | % | 1.41 | % | 1.90 | % | ||||||||||
Total expenses | 0.40 | % | 0.40 | % | 0.40 | % | 0.50 | % | 0.50 | % | ||||||||||
Portfolio turnover ratec | 23 | % | 22 | % | 15 | % | 24 | % | 18 | % | ||||||||||
a | Based on average shares outstanding. |
b | Total investment return is calculated assuming an initial investment made at the net asset value at the beginning of the period, reinvestment of all dividends and distribution at net asset value during the period, and redemption on the last day of the period. Transaction fees are not reflected in the calculation of total investment return. |
c | Portfolio turnover does not include securities received or delivered from processing creations or redemptions. |
100 | GUGGENHEIM ETFs ANNUAL REPORT | SEE NOTES TO FINANCIAL STATEMENTS. |
Guggenheim S&P 500® Equal Weight Materials ETF |
FINANCIAL HIGHLIGHTS |
This table is presented to show selected data for a share outstanding throughout each period and to assist shareholders in evaluating the Fund’s performance for the periods presented.
Year Ended | Year Ended | Year Ended | Year Ended | Year Ended | ||||||||||||||||
Per Share Data: | ||||||||||||||||||||
Net asset value, beginning of period | $ | 79.97 | $ | 82.38 | $ | 75.49 | $ | 60.71 | $ | 56.57 | ||||||||||
Income from investment operations: | ||||||||||||||||||||
Net investment income (loss)a | 1.29 | 1.23 | 1.21 | 1.25 | 0.92 | |||||||||||||||
Net gain (loss) on investments (realized and unrealized) | 4.49 | (2.41 | ) | 6.85 | 14.73 | 4.14 | ||||||||||||||
Total from investment operations | 5.78 | (1.18 | ) | 8.06 | 15.98 | 5.06 | ||||||||||||||
Less distributions from: | ||||||||||||||||||||
Net investment income | (1.29 | ) | (1.23 | ) | (1.17 | ) | (1.20 | ) | (0.92 | ) | ||||||||||
Total distributions to shareholders | (1.29 | ) | (1.23 | ) | (1.17 | ) | (1.20 | ) | (0.92 | ) | ||||||||||
Net asset value, end of period | $ | 84.46 | $ | 79.97 | $ | 82.38 | $ | 75.49 | $ | 60.71 | ||||||||||
Total Returnb | 7.29 | % | (1.44 | %) | 10.68 | % | 26.59 | % | 8.99 | % | ||||||||||
Ratios/Supplemental Data: | ||||||||||||||||||||
Net assets, end of period (in thousands) | $ | 84,463 | $ | 55,982 | $ | 74,138 | $ | 49,069 | $ | 33,388 | ||||||||||
Ratio to average net assets of: | ||||||||||||||||||||
Net investment income (loss) | 1.57 | % | 1.46 | % | 1.48 | % | 1.84 | % | 1.55 | % | ||||||||||
Total expenses | 0.40 | % | 0.40 | % | 0.40 | % | 0.50 | % | 0.50 | % | ||||||||||
Portfolio turnover ratec | 25 | % | 27 | % | 22 | % | 18 | % | 20 | % | ||||||||||
a | Based on average shares outstanding. |
b | Total investment return is calculated assuming an initial investment made at the net asset value at the beginning of the period, reinvestment of all dividends and distribution at net asset value during the period, and redemption on the last day of the period. Transaction fees are not reflected in the calculation of total investment return. |
c | Portfolio turnover does not include securities received or delivered from processing creations or redemptions. |
SEE NOTES TO FINANCIAL STATEMENTS. | GUGGENHEIM ETFs ANNUAL REPORT | 101 |
Guggenheim S&P 500® Equal Weight Real Estate ETF |
FINANCIAL HIGHLIGHTS |
This table is presented to show selected data for a share outstanding throughout each period and to assist shareholders in evaluating the Fund’s performance for the periods presented.
Year Ended | Period Ended | |||||||
Per Share Data: | ||||||||
Net asset value, beginning of period | $ | 25.63 | $ | 25.31 | ||||
Income from investment operations: | ||||||||
Net investment income (loss)b | 0.70 | 0.13 | ||||||
Net gain (loss) on investments (realized and unrealized) | (0.08 | ) | 0.27 | |||||
Total from investment operations | 0.62 | 0.40 | ||||||
Less distributions from: | ||||||||
Net investment income | (0.44 | ) | (0.08 | ) | ||||
Total distributions to shareholders | (0.44 | ) | (0.08 | ) | ||||
Net asset value, end of period | $ | 25.81 | $ | 25.63 | ||||
Total Returnc | 2.39 | % | 1.61 | % | ||||
Ratios/Supplemental Data: | ||||||||
Net assets, end of period (in thousands) | $ | 36,135 | $ | 2,563 | ||||
Ratio to average net assets of: | ||||||||
Net investment income (loss) | 2.70 | % | 2.49 | %d | ||||
Total expenses | 0.37 | % | 0.40 | %d | ||||
Portfolio turnover ratee | 10 | % | 5 | % | ||||
a | The Fund commenced operations on August 12, 2015. |
b | Based on average shares outstanding. |
c | Total investment return is calculated assuming an initial investment made at the net asset value at the beginning of the period, reinvestment of all dividends and distribution at net asset value during the period, and redemption on the last day of the period. Transaction fees are not reflected in the calculation of total investment return. |
d | Annualized. |
e | Portfolio turnover does not include securities received or delivered from processing creations or redemptions. |
102 | GUGGENHEIM ETFs ANNUAL REPORT | SEE NOTES TO FINANCIAL STATEMENTS. |
Guggenheim S&P 500® Equal Weight Technology ETF |
FINANCIAL HIGHLIGHTS |
This table is presented to show selected data for a share outstanding throughout each period and to assist shareholders in evaluating the Fund’s performance for the periods presented.
Year Ended | Year Ended | Year Ended | Year Ended | Year Ended | ||||||||||||||||
Per Share Data: | ||||||||||||||||||||
Net asset value, beginning of period | $ | 93.16 | $ | 87.17 | $ | 70.98 | $ | 51.53 | $ | 52.23 | ||||||||||
Income from investment operations: | ||||||||||||||||||||
Net investment income (loss)a | 1.47 | 1.09 | 0.78 | 0.68 | 0.41 | |||||||||||||||
Net gain (loss) on investments (realized and unrealized) | 11.48 | 6.09 | 16.15 | 19.43 | (0.75 | ) | ||||||||||||||
Total from investment operations | 12.95 | 7.18 | 16.93 | 20.11 | (0.34 | ) | ||||||||||||||
Less distributions from: | ||||||||||||||||||||
Net investment income | (1.44 | ) | (1.12 | ) | (0.74 | ) | (0.66 | ) | (0.36 | ) | ||||||||||
Return of capital | — | (0.07 | ) | — | — | — | ||||||||||||||
Total distributions to shareholders | (1.44 | ) | (1.19 | ) | (0.74 | ) | (0.66 | ) | (0.36 | ) | ||||||||||
Net asset value, end of period | $ | 104.67 | $ | 93.16 | $ | 87.17 | $ | 70.98 | $ | 51.53 | ||||||||||
Total Returnb | 14.06 | % | 8.30 | % | 23.92 | % | 39.23 | % | 0.71 | % | ||||||||||
Ratios/Supplemental Data: | ||||||||||||||||||||
Net assets, end of period (in thousands) | $ | 915,879 | $ | 740,629 | $ | 671,221 | $ | 273,275 | $ | 100,479 | ||||||||||
Ratio to average net assets of: | ||||||||||||||||||||
Net investment income (loss) | 1.55 | % | 1.20 | % | 0.97 | % | 1.07 | % | 0.76 | % | ||||||||||
Total expenses | 0.40 | % | 0.40 | % | 0.40 | % | 0.50 | % | 0.50 | % | ||||||||||
Portfolio turnover ratec | 24 | % | 21 | % | 22 | % | 24 | % | 25 | % | ||||||||||
a | Based on average shares outstanding. |
b | Total investment return is calculated assuming an initial investment made at the net asset value at the beginning of the period, reinvestment of all dividends and distribution at net asset value during the period, and redemption on the last day of the period. Transaction fees are not reflected in the calculation of total investment return. |
c | Portfolio turnover does not include securities received or delivered from processing creations or redemptions. |
SEE NOTES TO FINANCIAL STATEMENTS. | GUGGENHEIM ETFs ANNUAL REPORT | 103 |
Guggenheim S&P 500® Equal Weight Utilities ETF |
FINANCIAL HIGHLIGHTS |
This table is presented to show selected data for a share outstanding throughout each period and to assist shareholders in evaluating the Fund’s performance for the periods presented.
Year Ended | Year Ended | Year Ended | Year Ended | Year Ended | ||||||||||||||||
Per Share Data: | ||||||||||||||||||||
Net asset value, beginning of period | $ | 73.29 | $ | 76.69 | $ | 64.67 | $ | 60.52 | $ | 54.03 | ||||||||||
Income from investment operations: | ||||||||||||||||||||
Net investment income (loss)a | 2.49 | 2.48 | 2.59 | 2.36 | 2.03 | |||||||||||||||
Net gain (loss) on investments (realized and unrealized) | 7.81 | (2.97 | ) | 11.75 | 4.11 | 6.45 | ||||||||||||||
Total from investment operations | 10.30 | (0.49 | ) | 14.34 | 6.47 | 8.48 | ||||||||||||||
Less distributions from: | ||||||||||||||||||||
Net investment income | (2.49 | ) | (2.91 | ) | (2.32 | ) | (2.32 | ) | (1.99 | ) | ||||||||||
Total distributions to shareholders | (2.49 | ) | (2.91 | ) | (2.32 | ) | (2.32 | ) | (1.99 | ) | ||||||||||
Net asset value, end of period | $ | 81.10 | $ | 73.29 | $ | 76.69 | $ | 64.67 | $ | 60.52 | ||||||||||
Total Returnb | 14.13 | % | (0.56 | %) | 22.61 | % | 10.95 | % | 15.98 | % | ||||||||||
Ratios/Supplemental Data: | ||||||||||||||||||||
Net assets, end of period (in thousands) | $ | 210,865 | $ | 128,258 | $ | 141,875 | $ | 51,738 | $ | 42,364 | ||||||||||
Ratio to average net assets of: | ||||||||||||||||||||
Net investment income (loss) | 3.09 | % | 3.30 | % | 3.72 | % | 3.78 | % | 3.60 | % | ||||||||||
Total expenses | 0.40 | % | 0.40 | % | 0.40 | % | 0.50 | % | 0.50 | % | ||||||||||
Portfolio turnover ratec | 22 | % | 20 | % | 31 | % | 22 | % | 22 | % | ||||||||||
a | Based on average shares outstanding. |
b | Total investment return is calculated assuming an initial investment made at the net asset value at the beginning of the period, reinvestment of all dividends and distribution at net asset value during the period, and redemption on the last day of the period. Transaction fees are not reflected in the calculation of total investment return. |
c | Portfolio turnover does not include securities received or delivered from processing creations or redemptions. |
104 | GUGGENHEIM ETFs ANNUAL REPORT | SEE NOTES TO FINANCIAL STATEMENTS. |
NOTES TO FINANCIAL STATEMENTS |
1. Organization and Significant Accounting Policies
Organization
Rydex ETF Trust (the “Trust”) is registered with the SEC under the Investment Company Act of 1940 (the “1940 Act”), as an open-ended investment company of the series type, and is authorized to issue an unlimited number of no par value shares. Each portfolio represents a separate series of beneficial interest in the Trust (each a “Fund”, and collectively, the “Funds”), each a non-diversified investment company. The Trust was organized as a Delaware statutory trust on November 22, 2002. At October 31, 2016, the Trust consisted of twenty-two funds (the “Funds”).
The financial statements herein relate to the following Funds, whose investment objective is to replicate as closely as possible, before fees and expenses, the daily performance of an index representing publicly traded equity securities (the “Underlying Index”) as follows:
Fund | Underlying Index |
Guggenheim MSCI Emerging Markets Equal Country Weight ETF | MSCI Emerging Markets Equal Country Weighted Index |
Guggenheim S&P MidCap 400® Equal Weight ETF | S&P MidCap 400® Equal Weight Index |
Guggenheim S&P SmallCap 600® Equal Weight ETF | S&P SmallCap 600® Equal Weight Index |
Guggenheim S&P 100® Equal Weight ETF | S&P 100® Equal Weight Index |
Guggenheim S&P 500® Equal Weight Consumer Discretionary ETF | S&P 500® Equal Weight Index Consumer Discretionary |
Guggenheim S&P 500® Equal Weight Consumer Staples ETF | S&P 500® Equal Weight Index Consumer Staples |
Guggenheim S&P 500® Equal Weight Energy ETF | S&P 500® Equal Weight Index Energy |
Guggenheim S&P 500® Equal Weight Financials ETF | S&P 500® Equal Weight Index Financials |
Guggenheim S&P 500® Equal Weight Health Care ETF | S&P 500® Equal Weight Index Health Care |
Guggenheim S&P 500® Equal Weight Industrials ETF | S&P 500® Equal Weight Index Industrials |
Guggenheim S&P 500® Equal Weight Materials ETF | S&P 500® Equal Weight Index Materials |
Guggenheim S&P 500® Equal Weight Real Estate ETF | S&P 500® Equal Weight Real Estate Index |
Guggenheim S&P 500® Equal Weight Technology ETF | S&P 500® Equal Weight Index Information Technology |
Guggenheim S&P 500® Equal Weight Utilities ETF | S&P 500® Equal Weight Index Telecommunication Services and Utilities |
The Funds seek to achieve their objective by investing in common stocks or exchange-traded funds (“ETFs”), where applicable, that comprise the Underlying Index. The Funds use a “replication” strategy to track the Underlying Index. Replication refers to investing in substantially all of the securities in the Underlying Index in approximately the same proportions as in the Underlying Index.
The Funds operate as index funds and are not actively managed. Adverse performance of a security in the Funds’ portfolio will ordinarily not result in the elimination of the security from the Funds’ portfolio.
The Funds issue and redeem shares on a continuous basis, at net asset value per share (“NAV”), only in aggregation of 50,000 shares (100,000 shares for the Guggenheim MSCI Emerging Markets Equal Country Weight ETF) called a “Creation Unit”. Creation Units are issued and redeemed principally in-kind for securities included in the Underlying Index.
The Funds invest in various investments which are exposed to risk, such as market risk. Due to the level of risk associated with certain investments it is at least reasonably possible that changes in the values of investment securities will occur in the near term and that such changes could materially affect amounts reported in the financial statements.
Guggenheim Investments (“GI”) provides advisory services and Rydex Fund Services, LLC (“RFS”) provides administrative services to the Trust. Guggenheim Funds Distributors, LLC (“GFD”) acts as principal underwriter for the Trust. GI and GFD are affiliated entities; RFS ceased to be an affiliate of GI as of October 4, 2016, when it was acquired by MUFG Investor Services. In connection with its acquisition, RFS changed its name to MUFG Investor Services (US), LLC (“MUIS”). This change has no impact on the financial statements of the Funds.
Significant Accounting Policies
The Funds operate as investment companies and, accordingly, follow the investment company accounting and reporting guidance of the Financial Accounting Standards Board (“FASB”) Accounting Standards Codification Topic 946 Financial Services – Investment Companies.
The following significant accounting policies are in conformity with U.S. generally accepted accounting principles (“U.S. GAAP”) and are consistently followed by the Trust. This requires management to make estimates and assumptions that affect the reported amount of assets and liabilities, contingent assets and liabilities at the date of the financial statements, and the reported amounts of revenues and expenses during the reporting period. Actual results could differ from these estimates. All time references are based on Eastern Time.
The NAV of a fund is calculated by dividing the market value of the fund’s securities and other assets, less all liabilities, by the number of outstanding shares of the fund.
A. The Board of Trustees of the Funds (the “Board”) has adopted policies and procedures for the valuation of the Funds’ investments (the “Valuation Procedures”). Pursuant to the Valuation Procedures, the Board has delegated to a valuation committee, consisting of
GUGGENHEIM ETFs ANNUAL REPORT | 105 |
NOTES TO FINANCIAL STATEMENTS (continued) |
representatives from Guggenheim’s investment management, fund administration, legal and compliance departments (the “Valuation Committee”), the day-to-day responsibility for implementing the Valuation Procedures, including, under most circumstances, the responsibility for determining the fair value of the Funds' securities and/or other assets.
Valuations of the Funds’ securities are supplied primarily by pricing services appointed pursuant to the processes set forth in the Valuation Procedures. The Valuation Committee convenes monthly, or more frequently as needed, to review the valuation of all assets which have been fair valued for reasonableness. The Funds’ officers, through the Valuation Committee and consistent with the monitoring and review responsibilities set forth in the Valuation Procedures, regularly review procedures used and valuations provided by the pricing services.
If the pricing service cannot or does not provide a valuation for a particular investment or such valuation is deemed unreliable, such investment is fair valued by the Valuation Committee.
Equity securities listed on an exchange (New York Stock Exchange (“NYSE”) or American Stock Exchange) are valued at the last quoted sales price as of the close of business on the NYSE, usually 4:00 p.m. on the valuation date. Equity securities listed on the NASDAQ market system are valued at the NASDAQ Official Closing Price on the valuation date, which may not necessarily represent the last sale price. If there has been no sale on such exchange or NASDAQ on a given day, the security is valued at the closing bid price on that day.
Generally, trading in foreign securities markets is substantially completed each day at various times prior to the close of the NYSE. The values of foreign securities are determined as of the close of such foreign markets or the close of the NYSE, if earlier. All investments quoted in foreign currencies are valued in U.S. dollars on the basis of the foreign currency exchange rates prevailing at the close of business. Investments in foreign securities may involve risks not present in domestic investments. The Valuation Committee will determine the current value of such foreign securities by taking into consideration certain factors which may include those discussed above, as well as the following factors, among others: the value of the securities traded on other foreign markets, ADR trading, closed-end fund trading, foreign currency exchange activity, and the trading prices of financial products that are tied to foreign securities. In addition, the Board has authorized the Valuation Committee and GI to use prices and other information supplied by a third party pricing vendor in valuing foreign securities.
The Funds invest in money market mutual funds, which are valued at their NAV.
ETFs are valued at the last quoted sales price.
Investments for which market quotations are not readily available are fair-valued as determined in good faith by GI under the direction of the Board using methods established or ratified by the Board. Valuations in accordance with these methods are intended to reflect each security’s (or asset’s) “fair value.” Each such determination is based on a consideration of all relevant factors, which are likely to vary from one pricing context to another. Examples of such factors may include, but are not limited to market prices; sale prices; broker quotes; and models which derive prices based on inputs such as prices of securities with comparable maturities and characteristics, or based on inputs such as anticipated cash flows or collateral, spread over Treasuries, and other information analysis.
B. Investment securities and other assets and liabilities denominated in foreign currencies are translated into U.S. dollar amounts at the date of valuation. Purchases and sales of investment securities and income and expense items denominated in foreign currencies are translated into U.S. dollar amounts on the respective dates of such transactions. The Trust does not isolate that portion of the results of operations resulting from changes in foreign exchange rates on investments from the fluctuations arising from changes in market prices of securities held. Such fluctuations are included with the net realized and unrealized gain and loss from investments.
Reported net realized foreign exchange gains or losses arise from sales of foreign currencies and currency gains or losses realized between the trade and settlement dates on investment transactions. Net unrealized exchange gains and losses arise from changes in the fair values of assets and liabilities other than investments insecurities at the fiscal period end, resulting from changes in exchange rates.
C. Security transactions are recorded on the trade date for financial reporting purposes. Realized gains and losses from securities transactions are recorded using the identified cost basis. Proceeds from lawsuits related to investment holdings are recorded as realized gains in the respective Fund. Dividend income is recorded on the ex-dividend date, net of applicable taxes withheld by foreign countries. Taxable non-cash dividends are recorded as dividend income. Interest income, including amortization of premiums and accretion of discounts, is accrued on a daily basis. Dividend income from REITs is recorded based on the income included in the distributions received from the REIT investments using published REIT classifications, including some management estimates when actual amounts are not available. Distributions received in excess of this estimated amount are recorded as a reduction of the cost of investments or reclassified to capital gains. The actual amounts of income, return of capital, and capital gains are only determined by each REIT after its fiscal year-end, and may differ from the estimated amounts.
106 | GUGGENHEIM ETFs ANNUAL REPORT |
NOTES TO FINANCIAL STATEMENTS (continued) |
D. Distributions of net investment income and net realized gains, if any, are declared and paid at least annually. Distributions are recorded on the ex-dividend date and are determined in accordance with income tax regulations which may differ from U.S. GAAP.
E. The Funds may leave cash overnight in their cash account with the custodian. Periodically, a Fund may have cash due to the custodian bank as an overdraft balance. A fee is incurred on this overdraft, calculated by multiplying the overdraft by a rate based on the federal funds rate, which was 0.31% at October 31, 2016.
F. The Fund may enter into repurchase agreements with financial institutions. In a repurchase agreement, a Fund buys a security and the seller simultaneously agrees to repurchase the security on a specified future date at an agreed-upon price. The repurchase price reflects an agreed-upon interest rate during the time the Fund’s money is invested in the security. Because the security constitutes collateral for the repurchase obligation, a repurchase agreement can be considered a collateralized loan. The Fund follows certain procedures designed to minimize the risks inherent in such agreements. These procedures include effecting repurchase transactions only with large, well-capitalized and well-established financial institutions whose condition will be continually monitored by GI. In addition, the value of the collateral underlying the repurchase agreement will always be at least equal to the repurchase price, including any accrued interest earned on the repurchase agreement. In the event of a default or bankruptcy by a selling financial institution, the Fund will seek to liquidate such collateral. However, the exercising of the Fund’s right to liquidate such collateral could involve certain costs or delays and, to the extent that proceeds from any sale upon a default of the obligation to repurchase were less than the repurchase price, the Fund could suffer a loss. It is the current policy of the Fund not to invest in repurchase agreements that do not mature within seven days if any such investment, together with any other illiquid assets held by the Fund, amounts to more than 15% of Fund’s net assets. The investments of the Fund in repurchase agreements, at times, may be substantial when, in the view of GI, liquidity or other considerations so warrant.
G. Under the Funds’ organizational documents, the Trustees and Officers are indemnified against certain liabilities arising out of the performance of their duties to the Trust. In addition, throughout the normal course of business, the Funds enter into contracts that contain a variety of representations and warranties which provide general indemnifications. The Funds’ maximum exposure under these arrangements is unknown, as this would involve future claims that may be made against the Funds and/or their affiliates that have not yet occurred. However, based on experience, the Funds expect the risk of loss to be remote.
2. Capital
There is a minimum transaction fee per transaction to those persons purchasing or redeeming Creation Units. An additional charge of up to three times the standard transaction fee may be imposed for purchases and redemptions effected outside the National Securities Clearing Corporation usual clearing process or for cash. Such transactions are generally permitted on an in-kind basis, with a balancing cash component to equate the transaction to the NAV of the Fund on the transaction date. Transaction fees are not charged to or paid by the Funds. The minimum transaction fees are:
Fund | Minimum Transaction | |||
Guggenheim MSCI Emerging Markets Equal Country Weight ETF | $ | 6,000 | ||
Guggenheim S&P MidCap 400® Equal Weight ETF | 2,000 | |||
Guggenheim S&P SmallCap 600® Equal Weight ETF | 3,000 | |||
Guggenheim S&P 100® Equal Weight ETF | 500 | |||
Guggenheim S&P 500® Equal Weight Consumer Discretionary ETF | 750 | |||
Guggenheim S&P 500® Equal Weight Consumer Staples ETF | 500 | |||
Guggenheim S&P 500® Equal Weight Energy ETF | 500 | |||
Guggenheim S&P 500® Equal Weight Financials ETF | 750 | |||
Guggenheim S&P 500® Equal Weight Health Care ETF | 500 | |||
Guggenheim S&P 500® Equal Weight Industrials ETF | 500 | |||
Guggenheim S&P 500® Equal Weight Materials ETF | 500 | |||
Guggenheim S&P 500® Equal Weight Real Estate ETF | 500 | |||
Guggenheim S&P 500® Equal Weight Technology ETF | 750 | |||
Guggenheim S&P 500® Equal Weight Utilities ETF | 500 | |||
3. Fees and Other Transactions with Affiliates
GI determines the composition of the portfolio of securities that must be delivered in exchange for the issuance of Creation Units and periodically adjusts the composition of the portfolio of the Funds to conform to changes in the composition of the relevant index. For these services, GI receives a management fee at the annual rate shown below as a percentage of the average daily net assets of the Funds.
Fund | Advisory | |||
Guggenheim MSCI Emerging Markets Equal Country Weight ETF | 0.70 | % | ||
Guggenheim S&P MidCap 400® Equal Weight ETF | 0.40 | % | ||
Guggenheim S&P SmallCap 600® Equal Weight ETF | 0.40 | % | ||
Guggenheim S&P 100® Equal Weight ETF | 0.40 | % | ||
Guggenheim S&P 500® Equal Weight Consumer Discretionary ETF | 0.40 | % | ||
Guggenheim S&P 500® Equal Weight Consumer Staples ETF | 0.40 | % | ||
Guggenheim S&P 500® Equal Weight Energy ETF | 0.40 | % | ||
Guggenheim S&P 500® Equal Weight Financials ETF | 0.40 | % | ||
Guggenheim S&P 500® Equal Weight Health Care ETF | 0.40 | % | ||
Guggenheim S&P 500® Equal Weight Industrials ETF | 0.40 | % | ||
Guggenheim S&P 500® Equal Weight Materials ETF | 0.40 | % | ||
Guggenheim S&P 500® Equal Weight Real Estate ETF | 0.40 | % | ||
Guggenheim S&P 500® Equal Weight Technology ETF | 0.40 | % | ||
Guggenheim S&P 500® Equal Weight Utilities ETF | 0.40 | % | ||
GUGGENHEIM ETFs ANNUAL REPORT | 107 |
NOTES TO FINANCIAL STATEMENTS (continued) |
GI pays all expenses of the Funds, including the cost of transfer agency, custody, fund administration, fund accounting, legal, audit and other services, except: interest, taxes, distribution fees or expenses, trustee fees (where applicable) and extraordinary expenses.
Under a Fund Administration Agreement with the Trust, MUIS provides various administrative and financial reporting services for the Funds. GI compensates MUIS directly for this service.
Under a Fund Accounting Agreement with the Trust, BNYMellon maintains the books and records of the Funds. Under a Custodian Agreement with the Trust, BNYMellon maintains cash, securities and other assets of the Funds in a separate account for the Funds, keeps all necessary accounts and records, and provides other services. BNYMellon is required, upon the order of the Trust, to deliver securities held by the custodian and to make payments for securities purchased by the Trust for the Funds. Pursuant to a Transfer Agency and Service Agreement with the Trust, BNYMellon acts as a transfer agent for the Trust’s authorized and issued shares of beneficial interest, and as dividend disbursing agent of the Trust. GI compensates BNYMellon directly for the foregoing services.
For the Guggenheim MSCI Emerging Markets Equal Country Weight ETF, GI has contractually agreed to reduce fees and/or reimburse expenses to the extent necessary to keep the Fund’s net operating expenses (excluding interest, taxes, brokerage commissions, dividends on securities sold short, distribution fees and expenses, and extraordinary expenses (“Excluded Expenses”)) plus Acquired Fund Fees and Expense borne indirectly, from exceeding 0.70% of the Fund’s average daily net assets until February 28, 2017. This agreement may be terminated only with the approval of the Fund’s Board. In any event, this undertaking will continue until at least February 28, 2017.
The Funds have adopted a Distribution Plan (the “Plan”) that allows the Funds to pay distribution fees to GFD and other firms that provide distribution services (“Service Providers”). If a Service Provider provides distribution services, the Funds will pay distribution fees to GFD at an annual rate not to exceed 0.25% of average daily net assets, pursuant to Rule 12b-1 of the 1940 Act. GFD will, in turn, pay the Service Provider out of its fees. No such fee is currently charged to the Funds.
Certain trustees and officers of the Trust are also officers of GI and GFD.
4. Fair Value Measurement
In accordance with U.S. GAAP, fair value is defined as the price that the Funds would receive to sell an investment or pay to transfer a liability in an orderly transaction with an independent buyer in the principal market, or in the absence of a principal market, the most advantageous market for the investment or liability. U.S. GAAP establishes a three-tier fair value hierarchy based on the types of inputs used to value assets and liabilities and requires corresponding disclosure. The hierarchy and the corresponding inputs are summarized below:
Level 1 | — quoted prices in active markets for identical securities. |
Level 2 | — other significant observable inputs (including quoted prices for similar securities, interest rates, prepayment speeds, credit risk, etc.). |
Level 3 | — significant unobservable inputs (including the fund’s own assumptions used to determine the fair value of investments). |
The types of inputs available depend on a variety of factors, such as the type of security and the characteristics of the markets in which it trades, if any. Fair valuation determinations that rely on fewer or no observable inputs require greater judgment. Accordingly, fair value determinations for Level 3 securities require the greatest amount of judgment.
The inputs or methodologies used for valuing securities are not necessarily an indication of the risk associated with investing in those securities. The suitability of the techniques and sources employed to determine fair valuation are regularly monitored and subject to change.
5. Portfolio Securities Loaned
Each Fund may lend portfolio securities to certain creditworthy borrowers, including the Funds’ securities lending agent. The loans are collateralized at all times by cash and/or high grade debt obligations in an amount at least equal to 102% of the market value of domestic securities loaned and 105% of foreign securities loaned as determined at the close of business on the preceding business day. The cash collateral received is held in a separately managed account established for each respective Fund and maintained by the lending agent exclusively for the investment of securities lending cash collateral on behalf of each Fund. The separately managed accounts invest in short-term investments valued at amortized cost, which approximates market value. Each Fund receives compensation for lending securities from interest or dividends earned on the cash, cash equivalents or U.S. government securities held as collateral, net of fee rebates paid to the borrower plus reasonable administrative and custody fees paid to the lending agent. Such compensation is accrued daily and payable to the Fund monthly. The dividend and interest income earned on the securities loaned is accounted for in the same manner as other dividend and interest income. The borrower pays to the Funds an amount equal to any dividends or interest received on loaned securities. These payments from the borrower are not eligible for reduced tax rates as “qualified dividend income” under the Jobs and Growth Tax Reconciliation Act of 2003. The Funds retain all or
108 | GUGGENHEIM ETFs ANNUAL REPORT |
NOTES TO FINANCIAL STATEMENTS (continued) |
a portion of the interest received on investment of cash collateral or receives a fee from the borrower. Lending portfolio securities could result in a loss or delay in recovering each Fund’s securities if the borrower defaults. The securities lending income earned by the Funds are disclosed on the Statements of Operations.
At October 31, 2016, the Funds participated in securities lending as follows:
Fund | Value of | Cash | Non-Cash | Total | ||||||||||||
Guggenheim MSCI Emerging Markets Equal Country Weight ETF | $ | 528,505 | $ | 395,137 | $ | 147,094 | $ | 542,231 | ||||||||
Guggenheim S&P MidCap 400® Equal Weight ETF | 14,392,815 | 8,074,696 | 6,745,294 | 14,819,990 | ||||||||||||
Guggenheim S&P SmallCap 600® Equal Weight ETF | 4,557,246 | 3,184,518 | 1,513,387 | 4,697,905 | ||||||||||||
Guggenheim S&P 500® Equal Weight Consumer Discretionary ETF | 12,410,755 | 7,238,797 | 5,366,392 | 12,605,189 | ||||||||||||
Guggenheim S&P 500® Equal Weight Consumer Staples ETF | 18,121,244 | 243,818 | 18,722,859 | 18,966,677 | ||||||||||||
Guggenheim S&P 500® Equal Weight Energy ETF | 16,365,754 | 10,272,586 | 7,283,040 | 17,555,626 | ||||||||||||
Guggenheim S&P 500® Equal Weight Health Care ETF | 19,376,879 | — | 20,000,896 | 20,000,896 | ||||||||||||
Guggenheim S&P 500® Equal Weight Industrials ETF | 9,894,534 | 2,566,847 | 7,555,117 | 10,121,964 | ||||||||||||
Guggenheim S&P 500® Equal Weight Materials ETF | 7,998,039 | 2,745,208 | 5,418,976 | 8,164,184 | ||||||||||||
Guggenheim S&P 500® Equal Weight Real Estate ETF | 1,722,302 | — | 1,741,308 | 1,741,308 | ||||||||||||
Guggenheim S&P 500® Equal Weight Technology ETF | 50,843,814 | 30,606,327 | 21,313,031 | 51,919,358 | ||||||||||||
Guggenheim S&P 500® Equal Weight Utilities ETF | 11,213,104 | 5,705,305 | 6,822,883 | 12,528,188 | ||||||||||||
The following represents a breakdown of the collateral for the joint repurchase agreements at October 31, 2016:
Counterparty and | Face Value | Repurchase Price | Collateral | Par Value | Fair Value | ||||||||||||
Citigroup Global Markets, Inc. | $ | 16,884,149 | $ | 16,884,149 | Various U.S. Government obligations and U.S. Government agency securities | $ | 23,943,491 | $ | 17,223,696 | ||||||||
BNP Paribas | 16,390,331 | 16,390,331 | Various U.S. Government obligations and U.S. Government agency securities | 58,347,880 | 16,718,138 | ||||||||||||
Merrill Lynch, Pierce, Fenner & Smith, Inc. | 16,390,331 | 16,390,331 | Various U.S. Government obligations and U.S. Government agency securities | 23,233,850 | 16,718,138 | ||||||||||||
HSBC Securities | 16,390,331 | 16,390,331 | Various U.S. Government obligations and U.S. Government agency securities | 44,307,013 | 16,718,233 | ||||||||||||
Credit Suisse Securities (USA), LLC | 4,832,960 | 4,832,960 | Various U.S. Government obligations and U.S. Government agency securities | 3,811,525 | 4,954,441 | ||||||||||||
Merrill Lynch, Pierce, Fenner & Smith, Inc. | 145,137 | 145,137 | Various U.S. Government obligations and U.S. Government agency securities | 139,373 | 148,161 | ||||||||||||
GUGGENHEIM ETFs ANNUAL REPORT | 109 |
NOTES TO FINANCIAL STATEMENTS (continued) |
In the event of counterparty default, the Funds have the right to collect the collateral to offset losses incurred. There is potential loss to the Funds in the event the Funds are delayed or prevented from exercising their rights to dispose of the collateral securities, including the risk of a possible decline in the value of the underlying securities during the period while the Funds seek to assert their rights. GI, acting under the supervision of the Board, reviews the value of the collateral and the creditworthiness of those banks and dealers to evaluate potential risks.
6. Federal Income Tax Information
The Funds intend to comply with the provisions of Subchapter M of the Internal Revenue Code applicable to regulated investment companies and will distribute substantially all taxable net investment income and capital gains sufficient to relieve the Funds from all, or substantially all, federal income, excise and state income taxes. Therefore, no provision for federal or state income tax is required.
Tax positions taken or expected to be taken in the course of preparing the Funds' tax returns are evaluated to determine whether the tax positions are “more-likely-than-not” of being sustained by the applicable tax authority. Tax positions not deemed to meet the more-likely-than-not threshold would be recorded as a tax benefit or expense in the current year. Management has analyzed the Funds' tax positions taken, or to be taken, on federal income tax returns for all open tax years, and has concluded that no provision for income tax is required in the Funds' financial statements. The Funds' federal tax returns are subject to examination by the Internal Revenue Service for a period of three years after they are filed.
Tax basis capital losses in excess of capital gains are carried forward to offset future net capital gains. For the year ended October 31, 2016, the following capital loss carryforward amounts were expired or used:
Fund | Expired | Utilized | Total | |||||||||
Guggenheim S&P 500® Equal Weight Consumer Discretionary ETF | $ | 800,018 | $ | — | $ | 800,018 | ||||||
Guggenheim S&P 500® Equal Weight Consumer Staples ETF | 11,426 | 135,768 | 147,194 | |||||||||
Guggenheim S&P 500® Equal Weight Financials ETF | 1,417,769 | — | 1,417,769 | |||||||||
Guggenheim S&P 500® Equal Weight Utilities ETF | — | 315,550 | 315,550 | |||||||||
The tax character of distributions paid during the year ended October 31, 2016 was as follows:
Fund | Ordinary | Return of | Total | |||||||||
Guggenheim MSCI Emerging Markets Equal Country Weight ETF | $ | 257,333 | $ | — | $ | 257,333 | ||||||
Guggenheim S&P MidCap 400® Equal Weight ETF | 1,282,647 | — | 1,282,647 | |||||||||
Guggenheim S&P SmallCap 600® Equal Weight ETF | 343,398 | — | 343,398 | |||||||||
Guggenheim S&P 100® Equal Weight ETF | 11,925 | — | 11,925 | |||||||||
Guggenheim S&P 500® Equal Weight Consumer Discretionary ETF | 1,560,723 | — | 1,560,723 | |||||||||
Guggenheim S&P 500® Equal Weight Consumer Staples ETF | 11,421,201 | — | 11,421,201 | |||||||||
Guggenheim S&P 500® Equal Weight Energy ETF | 3,414,412 | — | 3,414,412 | |||||||||
Guggenheim S&P 500® Equal Weight Financials ETF | 3,197,168 | 44,777,358 | 47,974,526 | |||||||||
Guggenheim S&P 500® Equal Weight Health Care ETF | 2,529,726 | — | 2,529,726 | |||||||||
Guggenheim S&P 500® Equal Weight Industrials ETF | 1,434,252 | — | 1,434,252 | |||||||||
Guggenheim S&P 500® Equal Weight Materials ETF | 1,136,509 | — | 1,136,509 | |||||||||
Guggenheim S&P 500® Equal Weight Real Estate ETF | 66,011 | — | 66,011 | |||||||||
Guggenheim S&P 500® Equal Weight Technology ETF | 11,574,847 | — | 11,574,847 | |||||||||
Guggenheim S&P 500® Equal Weight Utilities ETF | 6,269,737 | — | 6,269,737 | |||||||||
110 | GUGGENHEIM ETFs ANNUAL REPORT |
NOTES TO FINANCIAL STATEMENTS (continued) |
The tax character of distributions paid during the year ended October 31, 2015 was as follows:
Fund | Ordinary | Return of | Long-Term | Total | ||||||||||||
Guggenheim MSCI Emerging Markets Equal Country Weight ETF | $ | 256,801 | $ | — | $ | — | $ | 256,801 | ||||||||
Guggenheim S&P MidCap 400® Equal Weight ETF | 1,988,010 | 121,017 | — | 2,109,027 | ||||||||||||
Guggenheim S&P SmallCap 600® Equal Weight ETF | 544,593 | 29,410 | — | 574,003 | ||||||||||||
Guggenheim S&P 500® Equal Weight Consumer Discretionary ETF | 2,049,799 | — | — | 2,049,799 | ||||||||||||
Guggenheim S&P 500® Equal Weight Consumer Staples ETF | 4,938,435 | — | — | 4,938,435 | ||||||||||||
Guggenheim S&P 500® Equal Weight Energy ETF | 3,174,568 | — | — | 3,174,568 | ||||||||||||
Guggenheim S&P 500® Equal Weight Financials ETF | 3,019,133 | 198,204 | — | 3,217,337 | ||||||||||||
Guggenheim S&P 500® Equal Weight Health Care ETF | 2,938,855 | — | — | 2,938,855 | ||||||||||||
Guggenheim S&P 500® Equal Weight Industrials ETF | 1,865,867 | 42,175 | — | 1,908,042 | ||||||||||||
Guggenheim S&P 500® Equal Weight Materials ETF | 1,098,723 | — | — | 1,098,723 | ||||||||||||
Guggenheim S&P 500® Equal Weight Real Estate ETF | 8,313 | — | — | 8,313 | ||||||||||||
Guggenheim S&P 500® Equal Weight Technology ETF | 10,224,817 | 617,780 | — | 10,842,597 | ||||||||||||
Guggenheim S&P 500® Equal Weight Utilities ETF | 5,791,076 | — | — | 5,791,076 | ||||||||||||
The tax character of distributable earnings/(accumulated losses) at October 31, 2016 was as follows:
Fund | Undistributed | Undistributed | Accumulated | Net Unrealized | Total | |||||||||||||||
Guggenheim MSCI Emerging Markets Equal Country Weight ETF | $ | 12,555 | $ | — | $ | (4,393,319 | ) | $ | (591,230 | ) | $ | (4,971,994 | ) | |||||||
Guggenheim S&P MidCap 400® Equal Weight ETF | 152,420 | — | (14,701,880 | ) | 6,966,941 | (7,582,519 | ) | |||||||||||||
Guggenheim S&P SmallCap 600® Equal Weight ETF | 21,321 | — | (13,241,560 | ) | 2,466,020 | (10,754,219 | ) | |||||||||||||
Guggenheim S&P 100® Equal Weight ETF | 6,244 | — | — | 4,577 | 10,821 | |||||||||||||||
Guggenheim S&P 500® Equal Weight Consumer Discretionary ETF | 156,494 | — | (7,985,555 | ) | (12,249,649 | ) | (20,078,710 | ) | ||||||||||||
Guggenheim S&P 500® Equal Weight Consumer | 1,123,753 | — | (5,500,069 | ) | 889,094 | (3,487,222 | ) | |||||||||||||
Guggenheim S&P 500® Equal Weight Energy ETF | 100,794 | — | (56,512,658 | ) | (16,465,463 | ) | (72,877,327 | ) | ||||||||||||
Guggenheim S&P 500® Equal Weight Financials ETF | — | — | (11,357,861 | ) | (2,560,060 | ) | (13,917,921 | ) | ||||||||||||
Guggenheim S&P 500® Equal Weight Health Care ETF | 292,295 | — | (16,827,217 | ) | (40,342,616 | ) | (56,877,538 | ) | ||||||||||||
Guggenheim S&P 500® Equal Weight Industrials ETF | 235,634 | — | (4,642,263 | ) | (2,757,293 | ) | (7,163,922 | ) | ||||||||||||
Guggenheim S&P 500® Equal Weight Materials ETF | 94,609 | — | (6,855,141 | ) | (6,364,203 | ) | (13,124,735 | ) | ||||||||||||
Guggenheim S&P 500® Equal Weight Real Estate ETF | 193,598 | — | — | (1,690,182 | ) | (1,496,584 | ) | |||||||||||||
Guggenheim S&P 500® Equal Weight Technology ETF | 634,073 | — | (23,767,825 | ) | 44,655,077 | 21,521,325 | ||||||||||||||
Guggenheim S&P 500® Equal Weight Utilities ETF | 528,629 | — | (3,602,616 | ) | (6,535,715 | ) | (9,609,702 | ) | ||||||||||||
GUGGENHEIM ETFs ANNUAL REPORT | 111 |
NOTES TO FINANCIAL STATEMENTS (continued) |
For Federal income tax purposes, capital loss carryforwards represent realized losses of the Funds that may be carried forward and applied against future capital gains. For taxable years beginning on or before December 22, 2010, such capital losses may be carried forward for a maximum of eight years. Under the RIC Modernization Act of 2010, the Funds are permitted to carry forward capital losses incurred in taxable years beginning after December 22, 2010 for an unlimited period. However, any losses incurred during those taxable years must be utilized prior to the losses incurred in pre-enactment taxable years. As a result of this ordering rule, pre-enactment capital loss carryforwards may be more likely to expire unused. Additionally, post-enactment capital losses that are carried forward will retain their character as either short-term or long-term capital losses rather than being considered all short-term as under previous law. As of October 31, 2016, capital loss carryforwards for the Funds were as follows:
Unlimited | ||||||||||||||||||||||||
Fund | Expires in | Expires in | Expires in | Short-Term | Long-Term | Remaining | ||||||||||||||||||
Guggenheim MSCI Emerging Markets Equal | $ | — | $ | — | $ | (18,800 | ) | $ | (1,274,616 | ) | $ | (3,099,903 | ) | $ | (4,393,319 | ) | ||||||||
Guggenheim S&P MidCap 400® Equal | — | — | — | (6,852,211 | ) | (7,849,669 | ) | (14,701,880 | ) | |||||||||||||||
Guggenheim S&P SmallCap 600® Equal | — | — | (259,648 | ) | (7,098,985 | ) | (5,882,927 | ) | (13,241,560 | ) | ||||||||||||||
Guggenheim S&P 100® Equal Weight ETF | — | — | — | — | — | — | ||||||||||||||||||
Guggenheim S&P 500® Equal Weight | (1,981,333 | ) | — | — | (1,619,882 | ) | (4,384,340 | ) | (7,985,555 | ) | ||||||||||||||
Guggenheim S&P 500® Equal Weight | (195,890 | ) | — | (61,000 | ) | (1,853,988 | ) | (3,389,191 | ) | (5,500,069 | ) | |||||||||||||
Guggenheim S&P 500® Equal Weight | (1,743,348 | ) | (393,314 | ) | (128,371 | ) | (14,834,728 | ) | (39,412,897 | ) | (56,512,658 | ) | ||||||||||||
Guggenheim S&P 500® Equal Weight | (4,062,086 | ) | (376,840 | ) | — | (2,268,236 | ) | (4,650,699 | ) | (11,357,861 | ) | |||||||||||||
Guggenheim S&P 500® Equal Weight | — | — | — | (3,687,204 | ) | (13,140,013 | ) | (16,827,217 | ) | |||||||||||||||
Guggenheim S&P 500® Equal Weight | (1,121,641 | ) | — | — | (386,672 | ) | (3,133,950 | ) | (4,642,263 | ) | ||||||||||||||
Guggenheim S&P 500® Equal Weight | (576,552 | ) | — | — | (481,684 | ) | (5,796,905 | ) | (6,855,141 | ) | ||||||||||||||
Guggenheim S&P 500® Equal Weight | — | — | — | — | — | — | ||||||||||||||||||
Guggenheim S&P 500® Equal Weight | (2,331,453 | ) | — | — | (4,656,598 | ) | (16,779,774 | ) | (23,767,825 | ) | ||||||||||||||
Guggenheim S&P 500® Equal Weight | — | — | — | (1,414,857 | ) | (2,187,759 | ) | (3,602,616 | ) | |||||||||||||||
112 | GUGGENHEIM ETFs ANNUAL REPORT |
NOTES TO FINANCIAL STATEMENTS (continued) |
In order to present paid-in-capital, undistributed net investment income (loss) and accumulated net realized gain (loss) on investments on the statement of assets and liabilities that more closely represent their tax character, certain adjustments have been made to these accounts. These adjustments have no effect on the net assets or NAV. The most significant of these adjustments are for net capital gains (losses) resulting from in-kind redemptions, in-kind distributions, equalization debits, passive foreign investment company adjustments, expiring losses, excise tax paid, dividend reclasses, foreign currency reclasses, return of capital investments and adjustments on the disposition of REITs. For the year ended October 31, 2016, the adjustments for the Funds were as follows:
Fund | Paid-In | Undistributed | Accumulated | |||||||||
Guggenheim MSCI Emerging Markets Equal Country Weight ETF | $ | (1,454 | ) | $ | 1,592 | $ | (138 | ) | ||||
Guggenheim S&P MidCap 400® Equal Weight ETF | 10,698,943 | 115,563 | (10,814,506 | ) | ||||||||
Guggenheim S&P SmallCap 600® Equal Weight ETF | 4,965,474 | 61,366 | (5,026,840 | ) | ||||||||
Guggenheim S&P 100® Equal Weight ETF | 67,589 | 2,017 | (69,606 | ) | ||||||||
Guggenheim S&P 500® Equal Weight Consumer Discretionary ETF | (2,194,168 | ) | (1 | ) | 2,194,169 | |||||||
Guggenheim S&P 500® Equal Weight Consumer Staples ETF | 68,275,477 | 11,122 | (68,286,599 | ) | ||||||||
Guggenheim S&P 500® Equal Weight Energy ETF | 14,307,054 | — | (14,307,054 | ) | ||||||||
Guggenheim S&P 500® Equal Weight Financials ETF | (651,855 | ) | 109,676 | 542,179 | ||||||||
Guggenheim S&P 500® Equal Weight Health Care ETF | 14,314,217 | 127,195 | (14,441,412 | ) | ||||||||
Guggenheim S&P 500® Equal Weight Industrials ETF | 4,447,548 | 48,030 | (4,495,578 | ) | ||||||||
Guggenheim S&P 500® Equal Weight Materials ETF | 4,001,112 | 1,449 | (4,002,561 | ) | ||||||||
Guggenheim S&P 500® Equal Weight Real Estate ETF | 243,208 | 61,571 | (304,779 | ) | ||||||||
Guggenheim S&P 500® Equal Weight Technology ETF | 59,446,368 | 657,847 | (60,104,215 | ) | ||||||||
Guggenheim S&P 500® Equal Weight Utilities ETF | 10,261,836 | 342,307 | (10,604,143 | ) | ||||||||
At October 31, 2016, the identified cost of investments in securities owned by each Fund for Federal income tax purposes and the gross unrealized appreciation and depreciation were as follows:
Fund | Tax | Tax | Tax | Net | ||||||||||||
Guggenheim MSCI Emerging Markets Equal Country Weight ETF | $ | 12,638,968 | $ | 1,062,865 | $ | (1,653,903 | ) | $ | (591,038 | ) | ||||||
Guggenheim S&P MidCap 400® Equal Weight ETF | 91,030,235 | 11,878,145 | (4,911,204 | ) | 6,966,941 | |||||||||||
Guggenheim S&P SmallCap 600® Equal Weight ETF | 34,693,726 | 5,104,695 | (2,638,675 | ) | 2,466,020 | |||||||||||
Guggenheim S&P 100® Equal Weight ETF | 2,623,306 | 86,086 | (81,509 | ) | 4,577 | |||||||||||
Guggenheim S&P 500® Equal Weight Consumer Discretionary ETF | 87,947,174 | 2,230,486 | (14,480,135 | ) | (12,249,649 | ) | ||||||||||
Guggenheim S&P 500® Equal Weight Consumer Staples ETF | 612,521,855 | 25,384,641 | (24,495,547 | ) | 889,094 | |||||||||||
Guggenheim S&P 500® Equal Weight Energy ETF | 225,797,663 | 11,974,983 | (28,440,446 | ) | (16,465,463 | ) | ||||||||||
Guggenheim S&P 500® Equal Weight Financials ETF | 117,149,887 | 4,234,082 | (6,794,142 | ) | (2,560,060 | ) | ||||||||||
Guggenheim S&P 500® Equal Weight Health Care ETF | 518,706,751 | 18,545,172 | (58,887,787 | ) | (40,342,615 | ) | ||||||||||
Guggenheim S&P 500® Equal Weight Industrials ETF | 132,423,270 | 5,231,958 | (7,989,251 | ) | (2,757,293 | ) | ||||||||||
Guggenheim S&P 500® Equal Weight Materials ETF | 93,541,526 | 2,910,851 | (9,275,054 | ) | (6,364,203 | ) | ||||||||||
Guggenheim S&P 500® Equal Weight Real Estate ETF | 37,820,129 | 170,085 | (1,860,266 | ) | (1,690,181 | ) | ||||||||||
Guggenheim S&P 500® Equal Weight Technology ETF | 901,879,662 | 82,051,162 | (37,396,085 | ) | 44,655,077 | |||||||||||
Guggenheim S&P 500® Equal Weight Utilities ETF | 222,798,120 | 6,098,564 | (12,634,279 | ) | (6,535,715 | ) | ||||||||||
GUGGENHEIM ETFs ANNUAL REPORT | 113 |
NOTES TO FINANCIAL STATEMENTS (continued) |
7. Investment Transactions
For the year ended October 31, 2016, the Funds had investments transactions in-kind associated with subscriptions and redemptions as follows:
Fund | Subscriptions | Redemptions | ||||||
Guggenheim MSCI Emerging Markets Equal Country Weight ETF | $ | — | $ | — | ||||
Guggenheim S&P MidCap 400® Equal Weight ETF | 20,402,717 | 62,534,969 | ||||||
Guggenheim S&P SmallCap 600® Equal Weight ETF | 9,455,060 | 19,399,858 | ||||||
Guggenheim S&P 100® Equal Weight ETF | 3,762,528 | 1,251,687 | ||||||
Guggenheim S&P 500® Equal Weight Consumer Discretionary ETF | 8,711,592 | 102,357,956 | ||||||
Guggenheim S&P 500® Equal Weight Consumer Staples ETF | 568,423,277 | 531,199,109 | ||||||
Guggenheim S&P 500® Equal Weight Energy ETF | 82,366,769 | 76,532,931 | ||||||
Guggenheim S&P 500® Equal Weight Financials ETF | 101,165,512 | 122,087,144 | ||||||
Guggenheim S&P 500® Equal Weight Health Care ETF | 194,218,398 | 263,858,384 | ||||||
Guggenheim S&P 500® Equal Weight Industrials ETF | 98,200,791 | 68,776,836 | ||||||
Guggenheim S&P 500® Equal Weight Materials ETF | 66,547,749 | 41,220,090 | ||||||
Guggenheim S&P 500® Equal Weight Real Estate ETF | 47,967,642 | 13,272,766 | ||||||
Guggenheim S&P 500® Equal Weight Technology ETF | 545,804,530 | 433,072,990 | ||||||
Guggenheim S&P 500® Equal Weight Utilities ETF | 181,913,141 | 113,384,538 | ||||||
For the year ended October 31, 2016, the cost of purchases and proceeds from sales of investment securities, excluding government securities, short-term investments and in-kind transactions, were as follows:
Fund | Purchases | Sales | ||||||
Guggenheim MSCI Emerging Markets Equal Country Weight ETF | $ | 1,186,163 | $ | 1,394,719 | ||||
Guggenheim S&P MidCap 400® Equal Weight ETF | 99,731,499 | 99,688,247 | ||||||
Guggenheim S&P SmallCap 600® Equal Weight ETF | 37,700,856 | 37,707,941 | ||||||
Guggenheim S&P 100® Equal Weight ETF | 132,533 | 89,662 | ||||||
Guggenheim S&P 500® Equal Weight Consumer Discretionary ETF | 32,071,633 | 31,779,695 | ||||||
Guggenheim S&P 500® Equal Weight Consumer Staples ETF | 112,001,300 | 111,517,586 | ||||||
Guggenheim S&P 500® Equal Weight Energy ETF | 78,812,826 | 78,588,640 | ||||||
Guggenheim S&P 500® Equal Weight Financials ETF | 82,356,901 | 126,119,620 | ||||||
Guggenheim S&P 500® Equal Weight Health Care ETF | 144,664,878 | 145,293,606 | ||||||
Guggenheim S&P 500® Equal Weight Industrials ETF | 23,627,323 | 23,614,870 | ||||||
Guggenheim S&P 500® Equal Weight Materials ETF | 18,379,343 | 18,679,757 | ||||||
Guggenheim S&P 500® Equal Weight Real Estate ETF | 1,048,855 | 835,206 | ||||||
Guggenheim S&P 500® Equal Weight Technology ETF | 176,353,403 | 176,101,117 | ||||||
Guggenheim S&P 500® Equal Weight Utilities ETF | 45,512,036 | 45,504,825 | ||||||
The Funds are permitted to purchase or sell securities from or to certain affiliated funds under specified conditions outlined in procedures adopted by the Board. The procedures have been designed to ensure that any purchase or sale of securities by a Fund from or to another fund or portfolio that is or could be considered an affiliate by virtue of having a common investment adviser (or affiliated investment advisers), common Trustees and/or common officers complies with Rule 17a-7 of the 1940 Act. Further, as defined under these procedures, each transaction is effected at the current market price to save costs, where permissible. For the year ended October 31, 2016, the Funds engaged in purchases and sales of securities, pursuant to Rule 17a-7 of the 1940 Act, as follows:
Fund | Purchases | Sales | Realized | |||||||||
Guggenheim S&P MidCap 400® Equal Weight ETF | $ | — | $ | 201,608 | $ | (10,411 | ) | |||||
Guggenheim S&P 500® Equal Weight Consumer Staples ETF | — | 681,684 | (11,821 | ) | ||||||||
Guggenheim S&P 500® Equal Weight Financials ETF | 267,652 | — | — | |||||||||
Guggenheim S&P 500® Equal Weight Real Estate ETF | 13,904 | — | — | |||||||||
Guggenheim S&P 500® Equal Weight Technology ETF | 1,701,452 | — | — | |||||||||
114 | GUGGENHEIM ETFs ANNUAL REPORT |
NOTES TO FINANCIAL STATEMENTS (continued) |
8. Legal Proceedings
Tribune Company
Rydex ETF Trust has been named as a defendant and a putative member of the proposed defendant class of shareholders in the case entitled Kirschner v. FitzSimons, No. 12-2652 (S.D.N.Y.) (formerly Official Committee of Unsecured Creditors of Tribune Co. v. FitzSimons, Adv. Pro. No. 10-54010 (Bankr. D. Del.)) (the “FitzSimons action”), as a result of ownership by certain series of the Rydex ETF Trust of shares in the Tribune Company (“Tribune”) in 2007, when Tribune effected a leveraged buyout transaction (“LBO”) by which Tribune converted to a privately-held company. In his complaint, the plaintiff has alleged that, in connection with the LBO, Tribune insiders and shareholders were overpaid for their Tribune stock using financing that the insiders knew would, and ultimately did, leave Tribune insolvent. The plaintiff has asserted claims against certain insiders, major shareholders, professional advisers, and others involved in the LBO. The plaintiff is also attempting to obtain from former Tribune shareholders, including Rydex ETF Trust, the proceeds they received in connection with the LBO.
In June 2011, a group of Tribune creditors filed multiple actions against former Tribune shareholders involving state law constructive fraudulent conveyance claims arising out of the 2007 LBO (the “SLCFC actions”). Rydex ETF Trust has been named as a defendant in one of the SLCFC actions: Deutsche Bank Trust Co. Americas v. McGurn, No. 12-0063 (S.D.N.Y.). In the SLCFC actions, the creditors seek to recover from Tribune’s former shareholders the proceeds received in connection with the 2007 LBO.
The FitzSimons action and the SLCFC actions have been consolidated with the majority of the other Tribune LBO-related lawsuits in a multidistrict litigation proceeding captioned In re Tribune Company Fraudulent Conveyance Litig., No. 11-md-2696 (S.D.N.Y.) (the “MDL Proceeding”).
On September 23, 2013, the District Court granted the defendants’ omnibus motion to dismiss the SLCFC actions, on the basis that the creditors lacked standing. On September 30, 2013, the creditors filed a notice of appeal of the September 23 order. On October 28, 2013, the defendants filed a joint notice of cross-appeal of that same order.
On May 23, 2014, the defendants filed motions to dismiss the FitzSimons action, including a global motion to dismiss Count I, which is the claim brought against former Tribune shareholders for intentional fraudulent conveyance under U.S. federal law. The Court has not yet issued a decision on any of these motions.
On March 29, 2016, the U.S. Court of Appeals for the Second Circuit issued its opinion on the appeal of the SLCFC actions. The appeals court affirmed the district court’s dismissal of those lawsuits, but on different grounds than the district court. The appeals court held that while the plaintiffs have standing under the U.S. Bankruptcy Code, their claims were preempted by Section 546(e) of the Bankruptcy Code—the statutory safe harbor for settlement payments. On April 12, 2016, the plaintiffs in the SLCFC actions filed a petition seeking rehearing en banc before the appeals court. On July 22, 2016, the appeals court denied the petition. On September 9, 2016, the plaintiffs filed a petition for writ of certiorari in the U.S. Supreme Court challenging the Second Circuit’s decision that the safe harbor of Section 546(e) applied to their claims. The shareholder defendants, including the Rydex ETF Trust, filed a joint brief in opposition to the petition for writ of certiorari on October 24, 2016. The plaintiffs filed a reply in support of the petition on November 4, 2016. The Supreme Court has not yet granted or denied the petition for certiorari.
None of these lawsuits alleges any wrongdoing on the part of Rydex ETF Trust. The following series of Rydex ETF Trust held shares of Tribune and tendered these shares as part of Tribune’s LBO: Guggenheim S&P 500 Equal Weight Consumer Discretionary Fund (the “Fund”). The value of the proceeds received by the foregoing Fund was $249,481. At this stage of the proceedings, Rydex ETF Trust is not able to make a reliable prediction as to the outcome of these lawsuits or the effect, if any, on the Fund’s net asset value.
GUGGENHEIM ETFs ANNUAL REPORT | 115 |
NOTES TO FINANCIAL STATEMENTS (concluded) |
9. Fund Changes
At a meeting held on October 14, 2015, the Adviser recommended and the Board of the Trust approved the following changes to the following Funds:
A. | The Underlying Index for the Guggenheim Russell MidCap® Equal Weight ETF (ticker EWRM) will change from the Russell MidCap® Equal Weight Index to the S&P MidCap 400® Equal Weight Index. In connection with the change in the Fund’s Underlying Index, the Board also approved changing the Fund’s name and ticker to Guggenheim S&P MidCap 400® Equal Weight ETF (new ticker EWMC). The changes in index, Fund name and Fund ticker became effective on January 27, 2016. |
B. | The Underlying Index for the Guggenheim Russell 2000® Equal Weight ETF (ticker EWRS) will change from the Russell 2000® Equal Weight Index to the S&P SmallCap 600® Equal Weight Index. In connection with the change in the Fund’s Underlying Index, the Board also approved changing the Fund’s name and ticker to Guggenheim S&P SmallCap 600® Equal Weight ETF (new ticker EWSC). The changes in index, Fund name and Fund ticker became effective on January 27, 2016. |
10. Special In-Kind Distribution
After the close of business on September 16, 2016 (the “Rebalance Date”), the S&P Dow Jones Indices reconstituted the S&P 500® Equal Weight Index Financials (the “Index”), the underlying index for the Guggenheim S&P 500® Equal Weight Financials ETF (“RYF”), by eliminating the stocks of companies involved in the real estate industry (including real estate investment trusts (“REITs”) other than mortgage REITs) (“Real Estate Stocks”). To effectuate a corresponding change to RYF’s portfolio, RYF replaced its Real Estate Stock holdings with shares of the Guggenheim S&P 500® Equal Weight Real Estate ETF (“EWRE”) on the Rebalance Date. After market close on the Rebalance Date (and effective at market open on September 19, 2016, ex-dividend date), RYF made an in-kind distribution of its shares of EWRE (0.50 shares of EWRE for each share of RYF owned, with a value of $13.402661 per share of RYF owned), plus a small amount of cash for fractional shares, to shareholders of RYF such that, following the distribution, RYF continued to hold stocks included in the reconstituted Index in accordance with its principal investment strategies.
116 | GUGGENHEIM ETFs ANNUAL REPORT |
REPORT OF INDEPENDENT REGISTERED PUBLIC ACCOUNTING FIRM |
The Board of Trustees and Shareholders of Rydex ETF Trust
We have audited the accompanying statements of assets and liabilities, including the schedules of investments, of Guggenheim MSCI Emerging Markets Equal Country Weight ETF, Guggenheim S&P MidCap 400® Equal Weight ETF, Guggenheim S&P SmallCap 600® Equal Weight ETF, Guggenheim S&P 100® Equal Weight ETF, Guggenheim S&P 500® Equal Weight Consumer Discretionary ETF, Guggenheim S&P 500® Equal Weight Consumer Staples ETF, Guggenheim S&P 500® Equal Weight Energy ETF, Guggenheim S&P 500® Equal Weight Financials ETF, Guggenheim S&P 500® Equal Weight Health Care ETF, Guggenheim S&P 500® Equal Weight Industrials ETF, Guggenheim S&P 500® Equal Weight Materials ETF, Guggenheim S&P 500® Equal Weight Real Estate ETF, Guggenheim S&P 500® Equal Weight Technology ETF, and Guggenheim S&P 500® Equal Weight Utilities ETF (fourteen of the series constituting the Rydex ETF Trust) (the “Funds”) as of October 31, 2016, and the related statements of operations, the statements of changes in net assets, and the financial highlights for each of the years or periods indicated therein. These financial statements and financial highlights are the responsibility of the Funds’ management. Our responsibility is to express an opinion on these financial statements and financial highlights based on our audits.
We conducted our audits in accordance with the standards of the Public Company Accounting Oversight Board (United States). Those standards require that we plan and perform the audit to obtain reasonable assurance about whether the financial statements and financial highlights are free of material misstatement. We were not engaged to perform an audit of the Fund’s internal control over financial reporting. Our audits included consideration of internal control over financial reporting as a basis for designing audit procedures that are appropriate in the circumstances, but not for the purpose of expressing an opinion on the effectiveness of the Funds’ internal control over financial reporting. Accordingly, we express no such opinion. An audit also includes examining, on a test basis, evidence supporting the amounts and disclosures in the financial statements and financial highlights, assessing the accounting principles used and significant estimates made by management, and evaluating the overall financial statement presentation. Our procedures included confirmation of securities owned as of October 31, 2016, by correspondence with the custodian and brokers. We believe that our audits provide a reasonable basis for our opinion.
In our opinion, the financial statements and financial highlights referred to above present fairly, in all material respects, the financial position of the above listed Funds (fourteen of the series constituting the Rydex ETF Trust) at October 31, 2016, the results of their operations, the changes in their net assets, and their financial highlights for each of the years or periods indicated therein, in conformity with U.S. generally accepted accounting principles.

McLean, Virginia
December 22, 2016
GUGGENHEIM ETFs ANNUAL REPORT | 117 |
OTHER INFORMATION (Unaudited) |
Federal Income Tax Information
In January 2017, shareholders will be advised on IRS Form 1099 DIV or substitute 1099 DIV as to the federal tax status of the distributions received by shareholders in the calendar year 2016.
Of the ordinary income distributions paid during the year, the following funds had the corresponding percentages qualify for the dividends received deduction for corporations:
Fund | Dividend |
Guggenheim MSCI Emerging Markets Equal Country Weight ETF | 4.80% |
Guggenheim S&P MidCap 400® Equal Weight ETF | 94.39% |
Guggenheim S&P SmallCap 600® Equal Weight ETF | 100.00% |
Guggenheim S&P 100® Equal Weight ETF | 92.19% |
Guggenheim S&P 500® Equal Weight Consumer Discretionary ETF | 100.00% |
Guggenheim S&P 500® Equal Weight Consumer Staples ETF | 100.00% |
Guggenheim S&P 500® Equal Weight Energy ETF | 99.49% |
Guggenheim S&P 500® Equal Weight Financials ETF | 67.73% |
Guggenheim S&P 500® Equal Weight Health Care ETF | 100.00% |
Guggenheim S&P 500® Equal Weight Industrials ETF | 100.00% |
Guggenheim S&P 500® Equal Weight Materials ETF | 100.00% |
Guggenheim S&P 500® Equal Weight Technology ETF | 93.38% |
Guggenheim S&P 500® Equal Weight Utilities ETF | 100.00% |
Additionally, the following amounts of taxable ordinary income dividends paid during the fiscal year qualified for the lower income tax rate available to individuals under the Jobs and Growth Tax Relief Reconciliation Act of 2003:
Fund | Qualified |
Guggenheim MSCI Emerging Markets Equal Country Weight ETF | 72.89% |
Guggenheim S&P MidCap 400® Equal Weight ETF | 97.26% |
Guggenheim S&P SmallCap 600® Equal Weight ETF | 100.00% |
Guggenheim S&P 100® Equal Weight ETF | 95.63% |
Guggenheim S&P 500® Equal Weight Consumer Discretionary ETF | 100.00% |
Guggenheim S&P 500® Equal Weight Consumer Staples ETF | 100.00% |
Guggenheim S&P 500® Equal Weight Energy ETF | 100.00% |
Guggenheim S&P 500® Equal Weight Financials ETF | 72.84% |
Guggenheim S&P 500® Equal Weight Health Care ETF | 100.00% |
Guggenheim S&P 500® Equal Weight Industrials ETF | 100.00% |
Guggenheim S&P 500® Equal Weight Materials ETF | 100.00% |
Guggenheim S&P 500® Equal Weight Technology ETF | 100.00% |
Guggenheim S&P 500® Equal Weight Utilities ETF | 100.00% |
For the fiscal year ending October 31, 2016, Guggenheim MSCI Emerging Markets Equal Country Weight ETF earned gross income derived from foreign sources totaling $304,092. The Guggenheim MSCI Emerging Markets Equal Country Weight ETF paid foreign taxes totaling $37,341 for the fiscal year and may pass these taxes through to shareholders, who may be able to claim them as a foreign tax credit.
With respect to the taxable year ended October 31, 2016, Guggenheim S&P 500® Equal Weight Real Estate ETF hereby designates as capital gain dividends $27,307 using proceeds from shareholder redemptions, or, if subsequently determined to be different, the net capital gain of such year.
Proxy Voting Information
A description of the policies and procedures that the Trust uses to determine how to vote proxies relating to securities held in the Funds’ portfolios is available, without charge and upon request, by calling 800.820.0888. This information is also available from the EDGAR database on the SEC’s website at https://www.sec.gov.
118 | GUGGENHEIM ETFs ANNUAL REPORT |
OTHER INFORMATION (Unaudited)(continued) |
Information regarding how the Funds voted proxies relating to portfolio securities during the most recent 12-month period ended June 30 is available without charge, upon request, by calling 800.820.0888. This information is also available from the EDGAR database on the SEC’s website at https://www.sec.gov.
Sector Classification
Information in the Schedule of Investments is categorized by sectors using sector-level Classifications defined by the Bloomberg Industry Classification System, a widely recognized industry classification system provider. Each Fund’s registration statement has investment policies relating to concentration in specific sectors/industries. For purposes of these investment policies, the Funds usually classify sectors/industries based on industry-level Classifications used by widely recognized industry classification system providers such as Bloomberg Industry Classification System, Global Industry Classification Standards and Barclays Global Classification Scheme.
Quarterly Portfolio Schedules Information
The Trust files its complete schedule of portfolio holdings with the SEC for the first and third quarters of each fiscal year on Form N-Q, which are available on the SEC’s website at https://www.sec.gov. The Funds’ Forms N-Q may be reviewed and copied at the SEC’s Public Reference Room in Washington, DC, and that information on the operation of the Public Reference Room may be obtained by calling 800-SEC-0330. Copies of the portfolio holdings are also available to shareholders, without charge and upon request, by calling 800.820.0888.
Board Considerations in Approving the Continuation of the Investment Advisory Agreement
The Board of Trustees (the “Board”) of Rydex ETF Trust (the “Trust”), including the Trustees who are not “interested persons,” as defined by the Investment Company Act of 1940, of the Trust (“Independent Trustees”), attended an in-person meeting held on May 19, 2016, called for the purpose of, among other things, the consideration of, and voting on, the approval and continuation of the investment advisory agreement (the “Investment Advisory Agreement”) between the Trust and the Advisor applicable to each series of the Trust except for the Guggenheim S&P 100® Equal Weight ETF (each, a “Fund” and, collectively, the “Funds”). The Board unanimously approved the continuation of the Investment Advisory Agreement for an additional one-year period based on the Board’s review of qualitative and quantitative information provided by the Advisor. The Board had previously considered information pertaining to the renewal of the Investment Advisory Agreement at an in-person meeting held on April 26, 2016 (together, with the May 19 meeting, the “Meetings”).
Prior to reaching the conclusion to approve the continuation of the Investment Advisory Agreement, the Independent Trustees requested and obtained from the Advisor such information as the Independent Trustees deemed reasonably necessary to evaluate the Investment Advisory Agreement. In addition, the Board received a memorandum from Fund counsel regarding the responsibilities of the Board with respect to the approval of investment advisory agreements and participated in question and answer sessions with representatives of the Advisor. The Independent Trustees also carefully considered information that they had received throughout the year as part of their regular oversight of the Funds. At the Meetings, the Board obtained and reviewed a wide variety of information, including certain comparative information regarding the Funds’ fees, expenses, and performance relative to the fees, expenses, and performance of other comparable funds (the “FUSE reports”). The Independent Trustees carefully evaluated this information, met in executive session outside the presence of fund management, and were advised by independent legal counsel with respect to their deliberations.
At the Meetings, the Board, including the Independent Trustees, evaluated a number of factors, including among others: (a) the nature, extent and quality of the Advisor’s investment advisory and other services; (b) the Advisor’s investment management personnel; (c) the Advisor’s operations and financial condition; (d) the Advisor’s brokerage practices (including any soft dollar arrangements) and the variety and complexity of its investment strategies; (e) a comparison of the Funds’ advisory fees to the advisory fees charged to comparable funds or accounts, giving special attention to the existence of economies of scale and the absence of breakpoints in these fees and the Advisor’s rationale for not providing for breakpoints at this point in time; (f) each Fund’s overall fees and operating expenses compared with those of similar funds; (g) the level of the Advisor’s profitability from its Fund-related operations; (h) the Advisor’s compliance processes and systems; (i) the Advisor’s compliance policies and procedures; (j) the Advisor’s reputation, expertise and resources in the financial markets; and (k) Fund performance compared with that of similar funds and/or appropriate benchmarks. In its deliberations, the Trustees did not identify any single piece of information that was all-important or controlling, noting that each Trustee could attribute different weights to the various factors considered.
Based on the Board’s deliberations at the Meetings, the Board, including all of the Independent Trustees, unanimously: (a) concluded that the terms of the Investment Advisory Agreement are fair and reasonable; (b) concluded that the Advisor’s fees are reasonable in light of the services that it provides to the Funds; and (c) agreed to approve and continue the Investment Advisory Agreement based upon the following considerations, among others:
GUGGENHEIM ETFs ANNUAL REPORT | 119 |
OTHER INFORMATION (Unaudited)(continued) |
● | Nature, Extent and Quality of Services Provided by the Advisor. The Board evaluated, among other things, the Advisor’s business, financial resources, quality and quantity of personnel, experience, past performance, the variety and complexity of its investment strategies (including the extent to which the Funds use derivatives), Fund risk management process, brokerage practices, and the adequacy of its compliance systems and processes, proxy voting policies and practices, and cybersecurity programs. The Board reviewed the scope of services to be provided by the Advisor under the Investment Advisory Agreement and noted that there would be no significant differences between the scope of services required to be provided by the Advisor for the past year and the scope of services required to be provided during the upcoming year. The Board also considered the Advisor’s representations to the Board that the Advisor would continue to provide investment and related services that were of materially the same quality and quantity as services provided to the Funds in the past, and whether these services are appropriate in scope and extent in light of the Funds’ operations, the competitive landscape of the investment company business and investor needs. Based on the foregoing, the Trustees determined that the approval of the Investment Advisory Agreement would enable shareholders of the Funds to receive high quality services at a cost that was appropriate and reasonable. |
● | Fund Expenses and Performance of the Funds and the Advisor. The Board reviewed statistical information provided by the Advisor regarding the expense ratio components and performance of each Fund. The Advisor engaged FUSE Research Network LLC (“FUSE”), an independent, third party research provider, to prepare reports to help the Board compare the Funds’ fees, expenses, and total return performance with those of a peer group and peer universe of funds selected by FUSE. In the reports, each Fund’s expense ratio components, including actual advisory fees, waivers/reimbursements, and gross and net total expenses, are compared to those of other funds with shared key characteristics (e.g., asset size, fee structure, sector or industry investment focus) determined by FUSE to comprise a Fund’s applicable peer group. The Board considered the Advisor’s representation that it found the peer groups compiled by FUSE to be appropriate, but also acknowledged the existence of certain differences between the Funds and their peer funds (e.g., specific differences in principal investment strategies) that should be reviewed in context. The statistical information related to the performance of each Fund included three-month and one-, three-, and five-year performance for the Fund compared to that of its peers. The Board also discussed the correlation between a Fund’s assets under management and tracking error, noting that a Fund’s ability to replicate an underlying index rather than employ representative sampling depends, in part, upon the Fund’s size. Based on the foregoing, the Board determined that the proposed advisory fees paid by the Funds are reasonable in relation to the nature and quality of the services provided by the Advisor. |
● | Costs of Services Provided to the Funds and Profits Realized by the Advisor and its Affiliates. The Board reviewed information about the profitability of the Funds to the Advisor based on the advisory fees payable under the current Investment Advisory Agreement for the last calendar year. The Board noted that the Advisor had contractually agreed to pay all operating expenses of the Funds, including the cost of index licensing fees, transfer agency, custody, fund administration, legal, audit and other services, except management fees, interest expense, taxes (expected to be de minimis), brokerage commissions and other expenses connected with the execution of portfolio transactions, extraordinary expenses, distribution fees, and expenses paid by the Trust under any distribution plan adopted pursuant to Rule 12b-1 under the 1940 Act. In addition to those expenses listed above, the Board noted that for the Guggenheim S&P 500® Equal Weight ETF and each Guggenheim S&P 500® Equal Weight Sector ETF (with the exception of the Guggenheim S&P 500® Equal Weight Real Estate ETF), the Advisor also had contractually agreed to pay expenses of the Independent Trustees (including any Trustees’ counsel fees). The Board also analyzed the Funds’ expenses, including the investment advisory fees paid to the Advisor, and reviewed the FUSE reports. The Board also reviewed information regarding the direct revenue received by the Advisor and ancillary revenue, if any, received by the Advisor and/or its affiliates in connection with the services provided to the Funds by the Advisor and/or its affiliates. The Board also discussed the Advisor’s profit margin, including the expense allocation methodology used in the Advisor’s profitability analysis. . Based on the foregoing, the Board determined that the profit to the Advisor on the fees paid by the Funds is not excessive in view of the nature and quality of the services provided by the Advisor. |
● | Economies of Scale. The Board considered the absence of breakpoints in the Advisor’s fee schedule and reviewed information regarding the extent to which economies of scale or other efficiencies may result from increases in the Funds’ asset levels. The Board noted that the Investment Advisory Agreement did not provide for breakpoints in each Fund’s advisory fee rates as assets of a Fund increase. However, the Board further noted the Advisor’s assertion that future economies of scale had been taken into consideration by fixing relatively low advisory fees for the Funds, effectively sharing the benefits of lower fees with the Funds from inception. The Board noted that it intends to continue to monitor fees as each Fund grows in size and assess whether fee breakpoints may be warranted. |
● | Other Benefits to the Advisor and/or its Affiliates. In addition to evaluating the Advisor’s services, the Board considered the nature and amount of other benefits to be received by the Advisor and its affiliates as a result of their relationship with the Fund, including any soft dollar usage by the Advisor and any intangible benefits. In particular, the Board considered the nature, extent, quality, and cost of certain |
120 | GUGGENHEIM ETFs ANNUAL REPORT |
OTHER INFORMATION (Unaudited)(continued) |
distribution services performed by the Advisor’s affiliate under the distribution agreement and the Distribution Plan pursuant to Rule 12b-1 of the 1940 Act. In light of the costs of providing services pursuant to the separate agreements as well as the Advisor’s and its affiliates’ commitment to the Funds, the Board concluded the ancillary benefits the Advisor and its affiliates received were reasonable.
On the basis of the information provided to it and its evaluation of that information, the Board, including the Independent Trustees, concluded that the terms of the Investment Advisory Agreement were reasonable, and that approval of the continuation of the Investment Advisory Agreement was in the best interests of the Funds and their shareholders.
Board Considerations in Approving the Investment Advisory Agreement for the Guggenheim S&P 100® Equal Weight ETF
The Board of the Trust, including the Independent Trustees, attended an in-person meeting held on February 25, 2016 (the “February Meeting”), called for the purpose of, among other things, the consideration of, and voting on, the approval of the investment advisory agreement (the “OEW Investment Advisory Agreement”) between the Trust and Security Investors, LLC (the “Advisor”) applicable to the Guggenheim S&P 100® Equal Weight ETF, a new series of the Trust (the “OEW Fund”). The Board unanimously approved the OEW Investment Advisory Agreement based on the Board’s review of qualitative and quantitative information provided by the Advisor.
Prior to reaching the conclusion to approve the OEW Investment Advisory Agreement, the Independent Trustees requested and obtained from the Advisor such information as the Independent Trustees deemed reasonably necessary to evaluate the OEW Investment Advisory Agreement. In addition, the Board received a memorandum from Fund counsel regarding the responsibilities of the Board with respect to the approval of investment advisory agreements and participated in question and answer sessions with representatives of the Advisor. The Independent Trustees also carefully considered information that they had received about the Advisor throughout the year as part of their regular oversight of the other series of the Trust. At the May Meeting, the Board obtained and reviewed a wide variety of information, including certain comparative information regarding the OEW Fund’s proposed fees and expenses relative to the fees and expenses of other comparable funds (the “FUSE reports”). The Independent Trustees carefully evaluated this information, met in executive session outside the presence of fund management, and were advised by independent legal counsel with respect to their deliberations.
At the February Meeting, the Board, including the Independent Trustees, evaluated a number of factors, including among others: (a) the nature, extent and quality of the investment advisory and other services to be provided by the Advisor; (b) the Advisor’s investment management personnel; (c) the Advisor’s operations and financial condition; (d) the expected benefits (such as soft dollars, if any) derived by the Advisor and its affiliates from their relationship with the OEW Fund; (e) a comparison of the OEW Fund’s projected advisory fees to the advisory fees charged to comparable funds or accounts, giving special attention to the absence of breakpoints in these fees and the Advisor’s rationale for not providing for breakpoints at this point in time; (f) the OEW Fund’s expected overall fees and operating expenses compared with those of similar funds; (g) the Advisor’s compliance processes and systems; (h) the Advisor’s compliance policies and procedures; and (i) the Advisor’s reputation, expertise and resources in the financial markets; and (j) the Advisor’s performance with respect to existing similar Funds. In its deliberations, the Trustees did not identify any single piece of information that was all-important or controlling, noting that each Trustee could attribute different weights to the various factors considered.
Based on the Board’s deliberations at the February Meeting, the Board, including all of the Independent Trustees, unanimously: (a) concluded that the terms of the OEW Investment Advisory Agreement are fair and reasonable; (b) concluded that the Advisor’s fees are reasonable in light of the services that it will provide to the OEW Fund; and (c) agreed to approve the OEW Investment Advisory Agreement based upon the following considerations, among others:
● | Nature, Extent and Quality of Services Provided by the Advisor. The Board reviewed the scope of services to be provided by the Advisor under the OEW Investment Advisory Agreement and determined that the Advisor was capable of providing high quality advisory services to the OEW Fund, as indicated by the nature and quality of services provided by the Advisor in the past, the firm’s management capabilities, the professional qualifications and experience of its portfolio managers, and its investment and management oversight processes. Based on the foregoing, the Trustees determined that the approval of the OEW Investment Advisory Agreement would enable shareholders of the Fund to receive high quality services at a cost that was appropriate and reasonable. |
● | Fund Expenses and Performance of the OEW Fund and the Advisor. As the OEW Fund had not yet commenced operations, the Board was not able to review the OEW Fund’s performance. However, the Board considered the Advisor’s track record of successfully managing funds that seek to track the performance of a benchmark and determined that the Advisor would have the capabilities, resources, and personnel necessary to provide the OEW Fund with a reasonable potential for positive performance. The Board also reviewed statistical information provided by the Advisor regarding the OEW Fund’s proposed expense ratio components. The Advisor engaged FUSE Research Network LLC (“FUSE”), an independent, third party research provider, to prepare a report to help the Board compare the OEW |
GUGGENHEIM ETFs ANNUAL REPORT | 121 |
OTHER INFORMATION (Unaudited)(concluded) |
Fund’s fees and expenses to those of comparable funds in the OEW Fund’s peer group, and the broader peer universe, as determined by FUSE. In the report, the OEW Fund’s proposed expense ratio components, including advisory fees, waivers/reimbursements, and gross and net total expenses, are compared to those of other funds with shared key characteristics (e.g., asset size, fee structure, sector or industry investment focus) determined by FUSE to comprise the OEW Fund’s applicable peer group. The Board considered the Advisor’s representation that it found the peer groups compiled by FUSE to be appropriate, but also acknowledged the existence of certain differences between the OEW Fund and its peer funds (e.g., specific differences in principal investment strategies) that should be reviewed in context. The Board also discussed the correlation between assets under management and tracking error, noting that the OEW Fund’s ability to replicate its underlying index rather than employ representative sampling will depend, in part, upon the OEW Fund’s size. Based on the foregoing, the Board determined that the proposed advisory fee to be paid by the OEW Fund is reasonable in relation to the nature and quality of the services to be provided by the Advisor.
● | Costs of Services Provided to the OEW Fund and Profits Realized by the Advisor and its Affiliates. The Board noted that the Advisor had contractually agreed to pay all operating expenses of the OEW Fund, including the cost of index licensing fees, transfer agency, custody, fund administration, legal, audit and other services, except management fees, interest expense, taxes (expected to be de minimis), brokerage commissions and other expenses connected with the execution of portfolio transactions, extraordinary expenses, distribution fees, and expenses paid by the Trust under any distribution plan adopted pursuant to Rule 12b-1 under the 1940 Act, and expenses of the Independent Trustees (including any Trustees’ counsel fees). With respect to the cost of advisory services provided and the Advisor’s profitability, the Board concluded that it was too early to predict the profitability of the OEW Fund to the Advisor, but noted that they would monitor the Advisor’s profitability with respect to the OEW Fund after the OEW Fund commenced operations. |
● | Economies of Scale. The Board considered the absence of breakpoints in the Advisor’s fee schedule and reviewed information regarding the extent to which economies of scale or other efficiencies may result from increases in the OEW Fund’s asset levels. The Board noted that because the OEW Fund had not yet commenced operations, there were as of now, no economies of scale to share with shareholders. The Board also considered the Advisor’s statements that it would consider the introduction of breakpoints in the future and noted that it intends to continue monitoring the existence of economies of scale as the OEW Fund grows in size. |
● | Other Benefits to the Advisor and/or its Affiliates. In addition to evaluating the Advisor’s services, the Board considered the nature and amount of other benefits to be received by the Advisor and its affiliates as a result of their relationship with the OEW Fund, including any soft dollar usage by the Advisor and any intangible benefits. In particular, the Board considered the nature, extent, quality, and cost of certain distribution services to be performed by the Advisor’s affiliate and the fees to be paid to the Advisor’s affiliates for those services under the distribution agreement and the Distribution Plan pursuant to Rule 12b-1 of the 1940 Act. In light of the costs of providing services pursuant to the separate agreements as well as the Advisor’s and its affiliates’ commitment to the OEW Fund, the Board concluded the ancillary benefits the Advisor and its affiliates received were reasonable. |
On the basis of the information provided to it and its evaluation of that information, the Board, including the Independent Trustees, concluded that the terms of the OEW Investment Advisory Agreement were reasonable, and that approval of the OEW Investment Advisory Agreement was in the best interests of the OEW Fund and its shareholders.
122 | GUGGENHEIM ETFs ANNUAL REPORT |
INFORMATION ON BOARD OF TRUSTEES AND OFFICERS (Unaudited) |
A Board of Trustees oversees the Trust, as well as other trusts of GI, in which its members have no stated term of service, and continue to serve after election until resignation. The Statement of Additional Information includes further information about Fund Trustees and Officers, and can be obtained without charge by visiting guggenheiminvestments.com or by calling 800.820.0888.
Name, Address* and Year of Birth of Trustee | Position(s) Held with the | Principal Occupation(s) | Number of | Other |
INTERESTED TRUSTEE | ||||
Donald C. Cacciapaglia** (1951) | Trustee from 2012 to present. | Current: President and CEO, certain other funds in the Fund Complex (2012-present); Vice Chairman, Guggenheim Investments (2010-present).
Former: Chairman and CEO, Channel Capital Group, Inc. (2002-2010). | 232 | Clear Spring Life Insurance Company (2015-present); Guggenheim Partners Japan, Ltd. (2014-present); Guggenheim Partners Investment Management Holdings, LLC (2014-present); Delaware Life (2013-present); Guggenheim Life and Annuity Company (2011-present); Paragon Life Insurance Company of Indiana (2011-present). |
INDEPENDENT TRUSTEES | ||||
Angela Brock-Kyle***** (1959) | Trustee from August 2016 to present. | Current: Founder and Chief Executive Officer, B.O.A.R.D.S (consulting firm)
Former: Senior Leader, TIAA (financial services firm) (1987-2012). | 135 | Infinity Property & Casualty Corporation (2014-present). |
Corey A. Colehour (1945) | Trustee and Member of the Audit Committee from 2003 to present; Member of the Governance and Nominating Committees from 2005 to present; and Member of the Investment and Performance Committee from 2014 to present. | Retired. | 135 | None. |
J. Kenneth Dalton (1941) | Trustee from 2003 to present; Chairman and Member of the Audit Committee from 2003 to present; Member of the Governance and Nominating Committees from 2005 to present; and Member of the Compliance and Risk Oversight Committee from 2010 to present. | Retired. | 135 | Epiphany Funds (4) (2009-present). |
GUGGENHEIM ETFs ANNUAL REPORT | 123 |
INFORMATION ON BOARD OF TRUSTEES AND OFFICERS (Unaudited)(continued) |
Name, Address* and Year of Birth of Trustee | Position(s) Held with the | Principal Occupation(s) | Number of | Other |
INDEPENDENT TRUSTEES - concluded | ||||
John O. Demaret (1940) | Vice Chairman of the Board of Trustees from 2014 to present; Trustee and Member of the Audit Committee from 2003 to present; Chairman of the Board from 2006 to 2014; Member of the Compliance and Risk Oversight Committee from 2010 to present; Chairman and Member of the Investment and Performance Committee from 2014 to present; and Member of the Nominating Committee from 2014 to present. | Retired. | 135 | None. |
Werner E. Keller (1940) | Chairman of the Board from 2014 to present; Trustee and Member of the Audit, Governance and Nominating Committees from 2005 to present; Chairman and Member of the Compliance and Risk Oversight Committee from 2010 to present; and Member of the Investment and Performance Committee from 2014 to present. | Current: Founder and President, Keller Partners, LLC (investment research firm) (2005-present). | 135 | None. |
Thomas F. Lydon, Jr. (1960) | Trustee and Member of the Audit, Governance and Nominating Committees from 2005 to present. | Current: President, Global Trends Investments (registered investment adviser) (1996-present). | 135 | US Global Investors (GROW) (1995-present). |
Patrick T. McCarville (1942) | Trustee and Member of the Audit Committee from 2003 to present; Chairman and Member of the Governance and Nominating Committees from 2005 to present. | Retired.
Former: Chief Executive Officer, Par Industries, Inc., d/b/a Par Leasing (1977-2010). | 135 | None. |
Sandra G.Sponem***** (1958) | Trustee from August 2016 to present. | Current: Senior Vice President and Chief Financial Officer, M.A. Mortenson Companies, Inc. (general contracting firm) (2007-present). | 135 | None. |
124 | GUGGENHEIM ETFs ANNUAL REPORT |
INFORMATION ON BOARD OF TRUSTEES AND OFFICERS (Unaudited)(continued) |
Name, Address* | Position(s) Held with the | Principal Occupation(s) |
OFFICERS | ||
Michael P. Byrum (1970) | Vice President (1999-present). | Current: Senior Vice President, Security Investors, LLC (2010-present); President and Chief Investment Officer, Rydex Holdings, LLC (2008-present); Director and Chairman, Advisory Research Center, Inc. (2006-present); Manager, Guggenheim Specialized Products, LLC (2005-present).
Former: Vice President, Guggenheim Distributors, LLC (2009); Director (2009-2010) and Secretary (2002-2010), Rydex Fund Services, LLC; Director (2008-2010), Chief Investment Officer (2006-2010), President (2004-2010) and Secretary (2002-2010), Rydex Advisors, LLC; Director (2008-2010), Chief Investment Officer (2006-2010), President (2004-2010) and Secretary (2002-2010), Rydex Advisors II, LLC. |
Joanna M. Catalucci (1966) | AML Officer (2016-present) | Current: Chief Compliance Officer, certain funds in the Fund Complex (2012-present); Senior Managing Director, Guggenheim Investments (2012-present); AML Officer, certain funds in the Fund Complex (2016-present).
Former: Chief Compliance Officer and Secretary, certain other funds in the Fund Complex (2008-2012); Senior Vice President & Chief Compliance Officer, Security Investors, LLC and certain affiliates (2010-2012); Chief Compliance Officer and Senior Vice President, Rydex Advisors, LLC and certain affiliates (2010-2011). |
James M. Howley (1972) | Assistant Treasurer (2016-present) | Current: Director, Guggenheim Investments (2004-present); Assistant Treasurer, certain other funds in the Fund Complex (2006-present).
Former: Manager, Mutual Fund Administration of Van Kampen Investments, Inc. (1996-2004). |
Keith D. Kemp (1960) | Assistant Treasurer (2016-present) | Current: Managing Director of Transparent Value, LLC (2015-present); Managing Director of Guggenheim Investments (2015-present).
Former: Director, Transparent Value, LLC (2010-2015); Director, Guggenheim Investments (2010-2015); Chief Operating Officer, Macquarie Capital Investment Management (2007-2009). |
Amy J. Lee (1961) | Vice President (2009-present) and Secretary (2012-present). | Current: Chief Legal Officer, certain other funds in the Fund Complex (2013-present); Senior Managing Director, Guggenheim Investments (2012-present).
Former: Vice President, Associate General Counsel and Assistant Secretary, Security Benefit Life Insurance Company and Security Benefit Corporation (2004-2012). |
Glenn McWhinnie (1969) | Assistant Treasurer (2016-present) | Current: Vice President, Guggenheim Investments (2009-present).
Former: Tax Compliance Manager, Ernst & Young LLP (1996-2009). |
Elisabeth Miller (1968) | Chief Compliance Officer (2012-present). | Current: CCO, certain other funds in the Fund Complex (2012-present); CCO, Security Investors, LLC (2012-present); CCO, Guggenheim Funds Investment Advisors, LLC (2012-present); Managing Director, Guggenheim Investments (2012-present); Vice President, Guggenheim Funds Distributors, LLC (2014-present).
Former: CCO, Guggenheim Distributors, LLC (2009-2014); Senior Manager, Security Investors, LLC (2004-2009); Senior Manager, Guggenheim Distributors, LLC (2004-2009). |
GUGGENHEIM ETFs ANNUAL REPORT | 125 |
INFORMATION ON BOARD OF TRUSTEES AND OFFICERS (Unaudited)(concluded) |
Name, Address* | Position(s) Held with the | Principal Occupation(s) |
OFFICERS - concluded | ||
Adam J. Nelson (1979) | Assistant Treasurer (2016-present) | Current: Vice President, Guggenheim Investments (2015-present); Assistant Treasurer, certain other funds in the Fund Complex (2015-present).
Former: Assistant Vice President and Fund Administration Director, State Street Corporation (2013-2015); Fund Administration Assistant Director, State Street (2011-2013); Fund Administration Manager, State Street (2009-2011). |
Kimberly J. Scott (1974) | Assistant Treasurer (2016-present) | Current: Vice President, Guggenheim Investments (2012-present); Assistant Treasurer, certain other funds in the Fund Complex (2012-present).
Former: Financial Reporting Manager, Invesco, Ltd. (2010-2011); Vice President/Assistant Treasurer, Mutual Fund Administration for Van Kampen Investments, Inc./Morgan Stanley Investment Management (2009-2010); Manager of Mutual Fund Administration, Van Kampen Investments, Inc./Morgan Stanley Investment Management (2005-2009). |
John L. Sullivan (1955) | Chief Financial Officer and Treasurer (2016-present) | Current: CFO, Chief Accounting Officer and Treasurer, certain other funds in the Fund Complex (2010-present); Senior Managing Director, Guggenheim Investments (2010-present).
Former: Managing Director and CCO, each of the funds in the Van Kampen Investments fund complex (2004-2010); Managing Director and Head of Fund Accounting and Administration, Morgan Stanley Investment Management (2002-2004); CFO and Treasurer, Van Kampen Funds (1996-2004). |
* | All Trustees and Officers may be reached c/o Guggenheim Investments, 227 West Monroe Street, Chicago, Illinois 60606. |
** | Mr. Cacciapaglia is an “interested” person of the Trust, as that term is defined in the 1940 Act by virtue of his affiliation with the Adviser’s parent company. |
*** | The “Fund Complex” includes all closed-end and open-end funds (including all of their portfolios) advised by the Adviser and any funds that have an investment adviser or servicing agent that is an affiliated person of the Adviser. Information provided is as of the date of this report. |
**** | Certain of the Trustees may serve as directors on the boards of companies not required to be disclosed above, including certain non-profit companies and charitable foundations. |
***** | Mses. Brock-Kyle and Sponem commenced serving as independent Trustees effective August 18, 2016. |
126 | GUGGENHEIM ETFs ANNUAL REPORT |
GUGGENHEIM INVESTMENTS PRIVACY POLICIES (Unaudited) |
Guggenheim Investments as used herein refers to Guggenheim Partners, LLC, Guggenheim Funds Investment Advisors, LLC, Guggenheim Partners Investment Management, LLC, Guggenheim Funds Distributors, LLC and Security Investors, LLC as well as the funds in the Guggenheim Funds complex (the “funds”).
Our Commitment to You
When you become a Guggenheim Investments investor, you entrust us with not only your hard-earned money but also with personal and financial information about you. We recognize that your relationship with us is based on trust and that you expect us to act responsibly and in your best interests. Because we have access to personal information about you, we hold ourselves to high standards in its safekeeping and use. This means, most importantly, that we do not sell client or account information to anyone—whether you are a current or former Guggenheim Investments client.
The Information We Collect About You and How We Collect It
In the course of doing business with shareholders and investors, we collect nonpublic personal information about you. You typically provide personal information when you complete a Guggenheim Investments account application or when you request a transaction that involves Rydex and Guggenheim Funds or one of the Guggenheim affiliated companies. “Nonpublic personal information” is personally identifiable information about you. For example it includes your name and address, Social Security or taxpayer identification number, assets, income, account balance, bank account information and investment activity (e.g. purchase and redemption history).
How We Share Your Personal Information
As a matter of policy, we do not disclose your nonpublic personal information to nonaffiliated third parties except as required or permitted by law. As emphasized above, we do not sell information about current or former clients or their accounts to third parties. Nor do we share such information, except when necessary to complete transactions at your request or to make you aware of related investment products and services that we offer. Additional details about how we handle your personal information are provided below.
To complete certain transactions or account changes that you direct, it may be necessary to provide your personal information to companies, individuals or groups that are not affiliated with Guggenheim Investments. For example if you ask to transfer assets from another financial institution to Guggenheim Investments, we will need to provide certain information about you to that company to complete the transaction. In connection with servicing your accounts or to alert you to other Guggenheim Investments investment products and services, we may share your information within the Guggenheim Investments family of affiliated companies. This would include, for example, sharing your information within Guggenheim Investments so we can make you aware of new funds or the services offered through another Guggenheim Investments affiliated company. In certain instances, we may contract with nonaffiliated companies to perform services for us. Where necessary, we will disclose information we have about you to these third parties. In all such cases, we provide the third party with only the information necessary to carry out its assigned responsibilities and only for that purpose. And we require these third parties to treat your personal information with the same high degree of confidentiality that we do. In certain instances, we may share information with other financial institutions regarding individuals and entities in response to the U.S.A. Patriot Act. Finally we will share personal information about you if we are compelled by law to do so, if you direct us to do so with your consent, or in other circumstances as permitted by law.
How We Safeguard Your Personal Information
We maintain physical, electronic and procedural safeguards to protect your personal information. Within Guggenheim Investments, access to such information is limited to those who need it to perform their jobs such as servicing your account, resolving problems or informing you of new products and services.
GUGGENHEIM ETFs ANNUAL REPORT | 127 |
This page intentionally left blank.
This page intentionally left blank.
This page intentionally left blank.
This page intentionally left blank.
This page intentionally left blank.
This page intentionally left blank.
|
10.31.2016
Guggenheim ETFs Funds Annual Report
XLG | Guggenheim S&P 500® Top 50 ETF | ||
RPV | Guggenheim S&P 500® Pure Value ETF | ||
RPG | Guggenheim S&P 500® Pure Growth ETF | ||
RFV | Guggenheim S&P MidCap 400® Pure Value ETF | ||
RFG | Guggenheim S&P MidCap 400® Pure Growth ETF | ||
RZV | Guggenheim S&P SmallCap 600® Pure Value ETF | ||
RZG | Guggenheim S&P SmallCap 600® Pure Growth ETF | ||
GuggenheimInvestments.com | ETF2-ANN-1016x1017 |
TABLE OF CONTENTS |
DEAR SHAREHOLDER | 2 |
ECONOMIC AND MARKET OVERVIEW | 3 |
FEES AND EXPENSES | 5 |
MANAGER'S ANALYSIS | 6 |
PORTFOLIO SUMMARY | 7 |
SCHEDULES OF INVESTMENTS | 21 |
STATEMENTS OF ASSETS AND LIABILITIES | 39 |
STATEMENTS OF OPERATIONS | 41 |
STATEMENTS OF CHANGES IN NET ASSETS | 43 |
FINANCIAL HIGHLIGHTS | 47 |
NOTES TO FINANCIAL STATEMENTS | 54 |
REPORT OF INDEPENDENT REGISTERED PUBLIC ACCOUNTING FIRM | 63 |
OTHER INFORMATION | 64 |
INFORMATION ON BOARD OF TRUSTEES AND OFFICERS | 69 |
GUGGENHEIM INVESTMENTS PRIVACY POLICIES | 73 |
GUGGENHEIM ETFs ANNUAL REPORT | 1 |
October 31, 2016 |
Dear Shareholder:
Security Investors, LLC (the “Investment Adviser”) is pleased to present the annual shareholder report for a selection of our exchange-traded funds (“ETFs”) for the annual fiscal year ended October 31, 2016.
The Investment Adviser is part of Guggenheim Investments, which represents the investment management businesses of Guggenheim Partners, LLC (“Guggenheim”), a global, diversified financial services firm.
Guggenheim Funds Distributors, LLC is the distributor of the Funds. Guggenheim Funds Distributors, LLC is affiliated with Guggenheim and the Investment Adviser.
We encourage you to read the Economic and Market Overview, which follows this letter, followed by the Manager’s Analysis for each ETF.
Sincerely,
Donald C. Cacciapaglia
President and Chief Executive Officer
November 30, 2016
Read a prospectus and summary prospectus (if available) carefully before investing. It contains the investment objectives, risks, charges, expenses, and other information, which should be considered carefully before investing. Obtain a prospectus and summary prospectus (if available) at guggenheiminvestments.com or call 800.820.0888.
Guggenheim S&P 500 Top 50® ETF may not be suitable for all investors. ● The Fund is subject to the risk that unanticipated early closings of securities exchanges and other financial markets may result in the Fund’s inability to buy or sell securities or other financial instruments on that day. ● In certain circumstances, it may be difficult for the Fund to purchase and sell particular investments within a reasonable time at a fair price. ● Investments in securities and derivatives, in general, are subject to market risks that may cause their prices to fluctuate over time. An investment in the Fund may lose money. ● Unlike many investment companies, the Fund is not actively “managed.” This means that, based on market and economic conditions, the Fund’s performance could be lower than other types of mutual funds that may actively shift their portfolio assets to take advantage of market opportunities or to lessen the impact of a market decline. ● Tracking error risk refers to the risk that the Advisor may not be able to cause the Fund’s performance to match or correlate to that of the Fund’s Underlying Index, either on a daily or aggregate basis. Tracking error risk may cause the Fund’s performance to be less than you expect. ● Shares may trade below their net asset value (“NAV”). The NAV of shares will fluctuate with changes in the market value of the Fund’s holdings. In addition, although the Fund’s shares are currently listed on NYSE Arca, Inc. (the “Exchange”), there can be no assurance that an active trading market for shares will develop or be maintained. ● The Fund is subject to the risk that large-capitalization stocks may underperform other segments of the equity market or the equity market as a whole. ● Please read the prospectus for more detailed information regarding these and other risks.
Pure style ETFs may not be suitable for all investors. The Funds are subject to the risk that large-, medium-, and small-capitalization stocks may under-perform other segments of the equity market or the equity market as a whole ● Value stocks are subject to the risk that the intrinsic value of the stock may never be realized by the market or that the price goes down. Growth stocks typically invest a high portion of their earnings back into their business and may lack the dividend yield that could cushion their decline in a market downturn. Growth stocks may be more volatile than other stocks because they are more sensitive to investor perceptions regarding the growth potential of the issuing company. ● The Funds are subject to the risk that unanticipated early closings of securities exchanges and other financial markets may result in the Fund's inability to buy or sell securities or other financial instruments on that day. ● In certain circumstances, it may be difficult for the Funds to purchase and sell particular investments within a reasonable time at a fair price. ● Investments in securities, in general, are subject to market risks that may cause their prices to fluctuate over time. An investment in the Funds may lose money. ● Unlike many investment companies, the Funds are not actively “managed.” This means that based on market and economic conditions, the Funds’ performance could be lower than other types of funds that may actively shift their portfolio assets to take advantage of market opportunities or to lessen the impact of a market decline. ● Tracking error risk refers to the risk that the Advisor may not be able to cause the Funds’ performance to match or correlate to that of the Funds’ Underlying Index, either on a daily or aggregate basis. Tracking error risk may cause the Funds’ performance to be less than you expect. ● Shares may trade below their net asset value (“NAV”). The NAV of shares will fluctuate with changes in the market value of the Funds’ holdings. In addition, although the Funds’ shares are currently listed on NYSE Arca, Inc. (the “Exchange”), there can be no assurance that an active trading market for shares will develop or be maintained. ● Each Fund is considered nondiversified and can invest a greater portion of its assets in securities of individual issuers than a diversified Fund. As a result, changes in the market value of a single security could cause greater fluctuations in the value of fund shares than would occur in a more diversified fund. ● Please read the prospectus for more detailed information regarding these and other risks.
2 | GUGGENHEIM ETFs ANNUAL REPORT |
ECONOMIC AND MARKET OVERVIEW (Unaudited) | October 31, 2016 |
Behind the performance numbers for the past 12 months are a multitude of events that unfolded throughout 2016, including a beginning-of-the-year recession scare, an increase in U.S. corporate default volume, several quarters of negative earnings growth, the British vote to exit the European Union, and stubbornly low inflation across the globe. Some might forget that in the first six weeks of the year U.S. corporate bonds suffered one of the worst selloffs since the financial crisis, or that the S&P 500 was down almost 11%. We continue to believe that the turnaround in market performance was a result of global central bank easing.
The surprise end to the fractious U.S. election season leaves many questions unanswered about the new administration, but as it relates to the economy we are particularly alert to the possible market impact of resurgent fiscal policy. We will learn more as we move through the transition of power, but in the meantime several market positives should support asset performance in the fourth quarter and into 2017. The domestic economy just turned in the highest growth rate in two years, early indications point to a strong Christmas selling season, corporate earnings are turning higher or recovering, and the energy sector is stabilizing with the oil market recovery.
U.S. real gross domestic product (“GDP”) was up 2.9% in the third quarter (revised higher to 3.2% in late November), up from 1.4% in the second quarter. We expect output to rise by around 2% on average in coming quarters, a bit faster than the trend rate over the past year, as drags from past dollar strength and an inventory adjustment cycle fade.
The labor market continues to strengthen, as seen in the impressive growth in the size of the labor force. In the year through October, the labor force participation rate increased by 0.3 percentage point while the unemployment rate declined by just 0.1 percentage point. The cyclical rise in participation has helped to keep the unemployment rate steady and stave off U.S. Federal Reserve (the “Fed”) rate hikes in 2016.
We believe it is highly likely the Fed will raise rates in December, and we expect policymakers to hike twice more in 2017. While this would be a bit faster than markets are now pricing in, it would still leave rates below levels prescribed by standard policy rules. President-elect Trump will have an opportunity to fill two open seats on the Board of Governors, though this should not affect Fed policy in the near term.
Fed Chair Yellen has spoken about temporarily running a “high-pressure economy”—one that enables robust business activity and a tight labor market—to offset persistent shortfalls in aggregate demand. If this is the case, before the expansion ends the Fed will likely allow unemployment to drop below 4%, and inflation to overshoot its 2% goal. This change in perspective, as well as the president-elect’s proposed changes to fiscal policy, accounts for why we are starting to see a backup in long-term interest rates, although global monetary policy intervention will likely continue to support bond prices.
Meanwhile, monetary policy divergence will continue to support the U.S. dollar. We expect the European Central Bank (“ECB”) to extend quantitative easing (“QE”) at the current pace of €80 billion per month in December, which will require adjustments to the program. In our view, the QE programs of the ECB and Bank of Japan (“BOJ”) will continue to buttress global sovereign debt and credit markets.
For the 12 months ended October 31, 2016, the Standard & Poor’s 500® (“S&P 500®”) Index* returned 4.51%. The MSCI Europe-Australasia-Far East (“EAFE”) Index* returned -3.23%. The return of the MSCI Emerging Markets Index* was 9.27%.
In the bond market, the Bloomberg Barclays U.S. Aggregate Bond Index* posted a 4.37% return for the period, while the Bloomberg Barclays U.S. Corporate High Yield Index* returned 10.14%. The return of the Bank of America (“BofA”) Merrill Lynch 3-Month U.S. Treasury Bill Index* was 0.31% for the 12-month period.
The opinions and forecasts expressed may not actually come to pass. This information is subject to change at any time, based on market and other conditions, and should not be construed as a recommendation of any specific security or strategy.
*Index Definitions:
The following indices are referenced throughout this report. Indices are unmanaged and not available for direct investment. Index performance does not reflect transaction costs, fees, or expenses.
BofA Merrill Lynch 3-Month U.S. Treasury Bill Index is an unmanaged market Index of U.S. Treasury securities maturing in 90 days that assumes reinvestment of all income.
Bloomberg Barclays U.S. Aggregate Bond Index is a broad-based flagship benchmark that measures the investment grade, U.S. dollar-denominated, fixed-rate taxable bond market, including U.S. Treasuries, government-related and corporate securities, mortgage-backed securities (“MBS”) (agency fixed-rate and hybrid adjustable-rate mortgage (“ARM”), pass-throughs), asset-backed securities (“ABS”), and commercial mortgage-backed securities (“CMBS”) (agency and non-agency).
GUGGENHEIM ETFs ANNUAL REPORT | 3 |
ECONOMIC AND MARKET OVERVIEW (Unaudited)(concluded) | October 31, 2016 |
Bloomberg Barclays U.S. Corporate High Yield Index measures the U.S. dollar denominated, high yield, fixed-rate corporate bond market. Securities are classified as high yield if the middle rating of Moody’s, Fitch and S&P is Ba1/BB +/BB + or below.
MSCI EAFE Index is a capitalization-weighted measure of stock markets in Europe, Australasia, and the Far East.
MSCI Emerging Markets Index is a free float-adjusted market capitalization-weighted index that is designed to measure equity market performance in the global emerging markets.
Russell Top 50® Mega Cap Index measures the performance of the largest companies in the Russell 3000® Index, which measures the performance of the largest 3,000 U.S. companies and represents approximately 98% of the investable U.S. equity market. The Mega Cap Index includes approximately 50 of the largest securities based on a combination of their market cap and current index membership and represents approximately 40% of the total market capitalization of the Russell 3000.
S&P 500® Index is a broad-based index, the performance of which is based on the performance of 500 widely held common stocks chosen for market size, liquidity, and industry group representation.
S&P 500® Top 50 Index measures the cap-weighted performance of 50 of the largest companies in the S&P 500® Index, reflecting U.S. mega-cap performance. Index constituents are weighted by float-adjusted market capitalization.
S&P 500® Pure Value Index is narrow in focus, containing only those stocks from the S&P 500® Index, that exhibit strong value characteristics, and weights them by style score. It is a complement to the S&P 500® Value Index, which consists of all value companies in the S&P 500 and measures value across several risk factors, including book value to price ratio, earnings to price ratio, and sales to price ratio.
S&P 500® Pure Growth Index is narrow in focus, containing only those stocks from the S&P 500® Index, that exhibit strong growth characteristics, and weights them by style score. It is a complement to the S&P 500® Growth Index, which consists of all growth companies in the S&P 500 and measures growth across several risk factors, including sales growth, earnings change to price and momentum.
S&P MidCap 400® Index is a capitalization-weighted index that measures the performance of the mid-cap segment of the U.S. equity universe and includes 400 domestic mid-cap stocks chosen for market capitalization, liquidity, and industry group representation.
S&P MidCap 400® Pure Value Index is narrow in focus, containing only those S&P MidCap 400® Index companies with strong value characteristics. It is a complement to the S&P MidCap 400® Value Index, which consists of all value companies in the S&P 400 and measures value across several risk factors, including book value to price ratio, earnings to price ratio, and sales to price ratio.
S&P MidCap 400® Pure Growth Index is narrow in focus, containing only those S&P MidCap 400® Index companies with strong growth characteristics. It is a complement to the S&P MidCap 400® Growth Index, which consists of all growth companies in the S&P 400 and measures growth across several risk factors, including sales growth, earnings change to price and momentum.
S&P SmallCap 600® Index is a capitalization-weighted index that measures the performance of the small-cap segment of the U.S. equity universe and includes 600 domestic small-cap stocks chosen for market capitalization, liquidity, and industry group representation.
S&P SmallCap 600® Pure Value Index is narrow in focus, containing only those S&P SmallCap 600® Index companies with strong value characteristics. It is a complement to the S&P SmallCap 600® Value Index, which consists of all value companies in the S&P 600 and measures value across several risk factors, including book value to price ratio, earnings to price ratio, and sales to price ratio.
S&P SmallCap 600® Pure Growth Index is narrow in focus, containing only those S&P SmallCap 600® Index companies with strong growth characteristics. It is a complement to the S&P SmallCap 600® Growth Index, which consists of all growth companies in the S&P 600 and measures growth across several risk factors, including sales growth, earnings change to price and momentum.
4 | GUGGENHEIM ETFs ANNUAL REPORT |
FEES AND EXPENSES (Unaudited) |
|
Shareholder Expense Example
As a shareholder of the Rydex ETF Trust, you incur transaction costs such as creation and redemption fees or brokerage charges, and ongoing costs including advisory fees, trustee fees and, if applicable, distribution fees. All other Trust expenses are paid by the advisor. This example is intended to help you understand your ongoing costs (in dollars) of investing in a Fund and to compare these costs with the ongoing costs of investing in other mutual funds.
The example in the table is based on an investment of $1,000 invested on April 30, 2016 and held for the six months ended October 31, 2016.
Actual Expenses
The first table below provides information about actual account values and actual expenses. You may use the information in this table, together with the amount you invested, to estimate the expenses that you incurred over the period. Simply divide your account value by $1,000 (for example, an $8,600 account value divided by $1,000 = 8.6), then multiply the result by the number in the first table under the heading entitled “Expenses Paid During Period” to estimate the expenses attributable to your investment during this period.
Hypothetical Example for Comparison Purposes
The second table below provides information about hypothetical account values and hypothetical expenses based on a Fund’s actual expense ratio and an assumed rate of return of 5% per year before expenses, which is not a Fund’s actual return. Thus, you should not use the hypothetical account values and expenses to estimate the actual ending account balance or your expenses for the period. Rather, these figures are provided to enable you to compare the ongoing costs of investing in a Fund and other funds. To do so, compare this 5% hypothetical example with the 5% hypothetical examples that appear in the shareholder reports of other funds.
Please note that the expenses shown in the table are meant to highlight your ongoing costs only and do not reflect any transaction costs, such as creation and redemption fees, or brokerage charges. Therefore, the second table is useful in comparing ongoing costs only, and will not help you determine the relative total costs of owning different funds. In addition, if these transaction costs were included, your costs would have been higher.
Expense | Fund | Beginning 2016 | Ending 2016 | Expenses | |
Table 1. Based on actual Fund return3 | |||||
Guggenheim S&P 500® Top 50 ETF | 0.20% | 4.40% | $ 1,000.00 | $ 1,044.00 | $ 1.03 |
Guggenheim S&P 500® Pure Value ETF | 0.35% | 1.73% | 1,000.00 | 1,017.30 | 1.78 |
Guggenheim S&P 500® Pure Growth ETF | 0.35% | 4.31% | 1,000.00 | 1,043.10 | 1.80 |
Guggenheim S&P MidCap 400® Pure Value ETF | 0.35% | 1.98% | 1,000.00 | 1,019.80 | 1.78 |
Guggenheim S&P MidCap 400® Pure Growth ETF | 0.35% | (1.32%) | 1,000.00 | 986.80 | 1.75 |
Guggenheim S&P SmallCap 600® Pure Value ETF | 0.35% | 0.56% | 1,000.00 | 1,005.60 | 1.77 |
Guggenheim S&P SmallCap 600® Pure Growth ETF | 0.35% | 4.70% | 1,000.00 | 1,047.00 | 1.81 |
Table 2. Based on hypothetical 5% return (before expenses) | |||||
Guggenheim S&P 500® Top 50 ETF | 0.20% | 5.00% | 1,000.00 | 1,024.20 | 1.02 |
Guggenheim S&P 500® Pure Value ETF | 0.35% | 5.00% | 1,000.00 | 1,023.44 | 1.79 |
Guggenheim S&P 500® Pure Growth ETF | 0.35% | 5.00% | 1,000.00 | 1,023.44 | 1.79 |
Guggenheim S&P MidCap 400® Pure Value ETF | 0.35% | 5.00% | 1,000.00 | 1,023.44 | 1.79 |
Guggenheim S&P MidCap 400® Pure Growth ETF | 0.35% | 5.00% | 1,000.00 | 1,023.44 | 1.79 |
Guggenheim S&P SmallCap 600® Pure Value ETF | 0.35% | 5.00% | 1,000.00 | 1,023.44 | 1.79 |
Guggenheim S&P SmallCap 600® Pure Growth ETF | 0.35% | 5.00% | 1,000.00 | 1,023.44 | 1.79 |
1 | Annualized. |
2 | Expenses are equal to the Fund’s annualized expense ratio, net of any applicable fee waivers, multiplied by the average account value over the period, multiplied by 184/365 (to reflect the one-half year period). |
3 | Actual cumulative return at net asset value for the period April 30, 2016 to October 31, 2016. |
GUGGENHEIM ETFs ANNUAL REPORT | 5 |
MANAGER'S ANALYSIS (Unaudited) | October 31, 2016 |
GUGGENHEIM S&P 500® TOP 50 ETF
Guggenheim S&P 500® Top 50 ETF (“XLG”) returned 4.99% for the one-year period ended October 31, 2016.
Prior to January 27, 2016, the Fund was known as the Guggenheim Russell Top 50® Mega Cap ETF and its benchmark was the Russell Top 50® Mega Cap Index. On January 27, 2016, the Fund’s benchmark became the S&P 500® Top 50 Index. A blend of the two benchmarks over the one-year period returned 1.11%.
The Information Technology sector was the largest contributor to the Fund’s performance, followed by Consumer Staples and Energy. The Health Care and Financials were the only sectors to detract from the Fund’s performance; the Materials sector contributed the least.
The top contributors to Fund return were Facebook, Inc.—Class A, Microsoft Corp., and Amazon.com. Inc. The largest detractors were Gilead Sciences, Inc., Allergan Plc, and Walt Disney Co.
Mega-cap stocks, as represented by the S&P 500® Top 50 Index, outpaced performance of large-cap stocks, but underperformed mid-cap stocks and small-cap stocks. Returns for the S&P 500®, the S&P MidCap 400®, and the S&P SmallCap 600® were 4.51%, 6.26%, and 6.35%, respectively.
Cumulative Fund Performance: October 31, 2006 – October 31, 2016
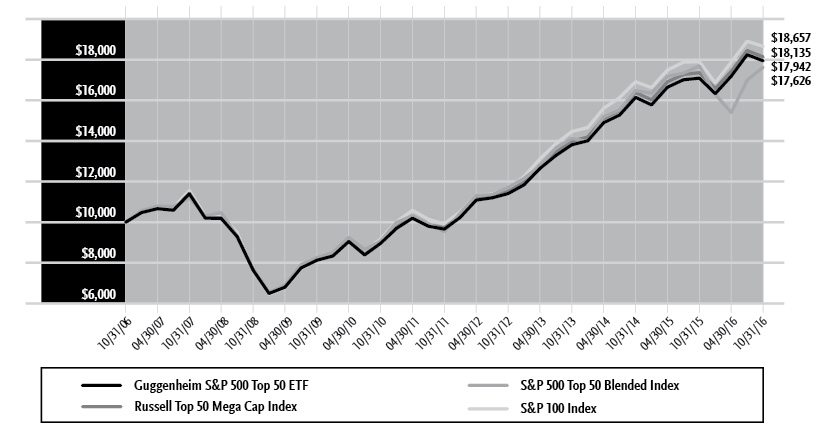
Effective January 27, 2016, the Fund changed its principal investment strategy. As a result of the investment strategy change, the Fund’s new benchmark is the S&P 500 Top 50 Index. The Fund’s performance was previously compared to the Russell Top 50 Mega Cap Index. The S&P 500 Top 50 Blended Index uses performance data for the Russell Top 50 Mega Cap Index from 5/04/05 to 01/26/16 and the S&P 500 Top 50 Index from 01/27/16 to 10/31/16.
6 | GUGGENHEIM ETFs ANNUAL REPORT |
MANAGER'S ANALYSIS (Unaudited)(concluded) | October 31, 2016 |
AVERAGE ANNUAL TOTAL RETURNS FOR THE PERIOD ENDED OCTOBER 31, 2016 | ||||
One Year | Three Year | Five Year | 10 Year | |
Guggenheim S&P 500® Top 50 ETF | 4.99% | 9.11% | 13.18% | 6.02% |
S&P 500 Top 50 Blended Index | -0.34% | 7.70% | 13.08% | 5.83% |
Russell Top 50 Mega Cap Index | 4.48% | 9.05% | 13.26% | 6.13% |
S&P 100 Index | 4.26% | 8.86% | 13.47% | 6.44% |
S&P 500 Top 50 Index | N/A | N/A | N/A | N/A |
The S&P 500 Top 50 Index incepted on 11/30/15. Therefore, the index returns for the time periods listed above are not available.
The returns presented above do not reflect the effect of taxes. Index returns represent total returns. Performance displayed represents past performance, which is no guarantee of future results.
GUGGENHEIM ETFs ANNUAL REPORT | 7 |
PORTFOLIO SUMMARY (Unaudited) | October 31, 2016 |
GUGGENHEIM S&P 500® TOP 50 ETF
Holdings Diversification (Market Exposure as % of Net Assets)
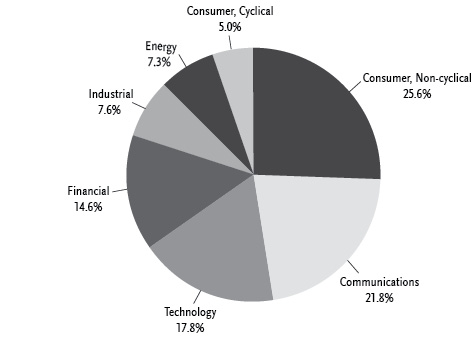
“Holdings Diversification (Market Exposure as % of Net Assets)” excludes any temporary cash investments.
Ten Largest Holdings | (% of Total Net Assets) |
Apple, Inc. | 6.9% |
Microsoft Corp. | 5.2% |
Exxon Mobil Corp. | 3.9% |
Johnson & Johnson | 3.6% |
Amazon.com, Inc. | 3.5% |
Facebook, Inc. — Class A | 3.4% |
Berkshire Hathaway, Inc. — Class B | 3.1% |
General Electric Co. | 2.9% |
JPMorgan Chase & Co. | 2.8% |
Alphabet, Inc. — Class A | 2.7% |
Top Ten Total | 38.0% |
“Ten Largest Holdings” exclude any temporary cash or derivative investments. | |
8 | GUGGENHEIM ETFs ANNUAL REPORT |
MANAGER'S ANALYSIS (Unaudited) | October 31, 2016 |
GUGGENHEIM S&P 500® PURE VALUE ETF
For the one-year period ended October 31, 2016, Guggenheim S&P 500® Pure Value ETF (“RPV”) returned 3.94%. Over the year, its benchmark, the S&P 500® Pure Value Index, posted a return of 4.34%.
For comparison, the S&P 500® Value Index returned 6.42% for the year.
For the period, RPV achieved a correlation of over 99% to its benchmark of the daily price movement of the S&P 500® Pure Value Index.
The Utilities sector was the largest contributor to the Fund’s performance during the period, followed by Industrials and Materials sectors. The Energy, Consumer Discretionary, and Health Care sectors were the largest detractors from the Fund’s performance.
Stocks contributing the most to the Fund’s return were Newmont Mining Corp., Tyson Foods, Inc.—Class A, and HP, Inc. Stocks detracting most from performance were Staples, Inc., GameStop Corp.—Class A, and Newfield Exploration Co.
Cumulative Fund Performance: October 31, 2006 – October 31, 2016
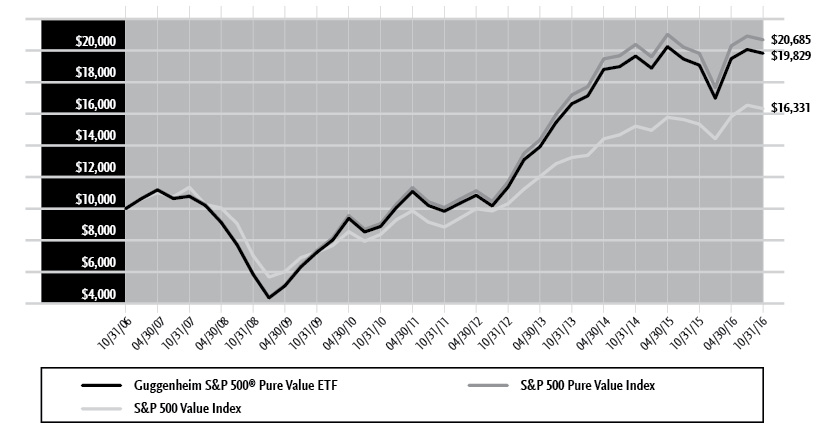
AVERAGE ANNUAL TOTAL RETURNS FOR THE PERIOD ENDED OCTOBER 31, 2016 | ||||
One Year | Three Year | Five Year | 10 Year | |
Guggenheim S&P 500® Pure Value ETF | 3.94% | 6.02% | 15.05% | 7.09% |
S&P 500 Pure Value Index | 4.34% | 6.36% | 15.48% | 7.54% |
S&P 500 Value Index | 6.42% | 7.25% | 13.07% | 5.03% |
The returns presented above do not reflect the effect of taxes. Index returns represent total returns. Performance displayed represents past performance, which is no guarantee of future results.
GUGGENHEIM ETFs ANNUAL REPORT | 9 |
PORTFOLIO SUMMARY (Unaudited) | October 31, 2016 |
GUGGENHEIM S&P 500® PURE VALUE ETF
Holdings Diversification (Market Exposure as % of Net Assets)
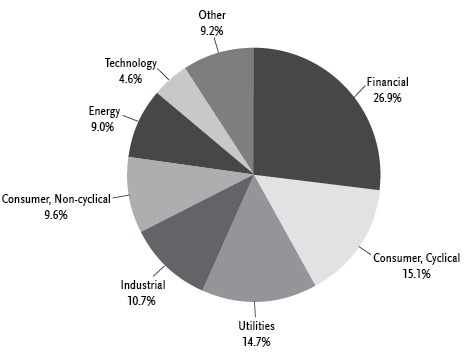
“Holdings Diversification (Market Exposure as % of Net Assets)” excludes any temporary cash investments.
Ten Largest Holdings | (% of Total Net Assets) |
HP, Inc. | 2.8% |
Newmont Mining Corp. | 2.3% |
Archer-Daniels-Midland Co. | 2.3% |
NRG Energy, Inc. | 2.1% |
Leucadia National Corp. | 1.8% |
Quanta Services, Inc. | 1.8% |
Arconic, Inc. | 1.8% |
Jacobs Engineering Group, Inc. | 1.7% |
Best Buy Company, Inc. | 1.7% |
Exelon Corp. | 1.7% |
Top Ten Total | 20.0% |
“Ten Largest Holdings” exclude any temporary cash or derivative investments. | |
10 | GUGGENHEIM ETFs ANNUAL REPORT |
MANAGER'S ANALYSIS (Unaudited) | October 31, 2016 |
GUGGENHEIM S&P 500® PURE GROWTH ETF
For the one-year period ended October 31, 2016, Guggenheim S&P 500® Pure Growth ETF (“RPG”) returned -0.42%. Over the year, its benchmark, the S&P 500® Pure Growth Index, produced a return of -0.09%. For the period, RPG achieved over 99% correlation to its benchmark on a daily basis.
For comparison, the S&P 500® Growth Index returned 2.68% for the year.
The Information Technology, Consumer Staples, and Materials sectors contributed the most to the Fund’s performance. The Consumer Discretionary, Health Care, and Energy sectors were the largest detractors from the Fund’s performance.
Stocks contributing the most to the Fund’s return were NVIDIA Corp., Broadcom Ltd., and Facebook, Inc.—Class A. Stocks detracting most from performance were Regeneron Pharmaceuticals, Inc., Signet Jewelers Ltd., and Advance Auto Parts, Inc.
Cumulative Fund Performance: October 31, 2006 – October 31, 2016
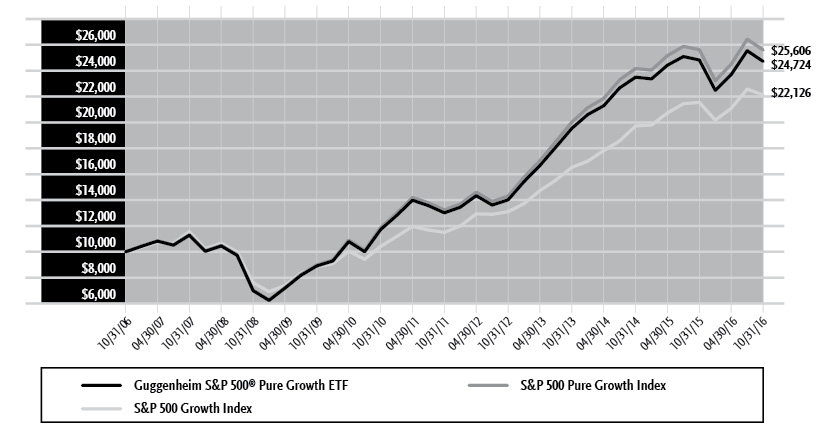
AVERAGE ANNUAL TOTAL RETURNS FOR THE PERIOD ENDED OCTOBER 31, 2016 | ||||
One Year | Three Year | Five Year | 10 Year | |
Guggenheim S&P 500® Pure Growth ETF | -0.42% | 8.15% | 13.70% | 9.47% |
S&P 500 Growth Index | 2.68% | 10.21% | 13.99% | 8.27% |
S&P 500 Pure Growth Index | -0.09% | 8.53% | 14.11% | 9.86% |
The returns presented above do not reflect the effect of taxes. Index returns represent total returns. Performance displayed represents past performance, which is no guarantee of future results.
GUGGENHEIM ETFs ANNUAL REPORT | 11 |
PORTFOLIO SUMMARY (Unaudited) | October 31, 2016 |
GUGGENHEIM S&P 500® PURE GROWTH ETF
Holdings Diversification (Market Exposure as % of Net Assets)
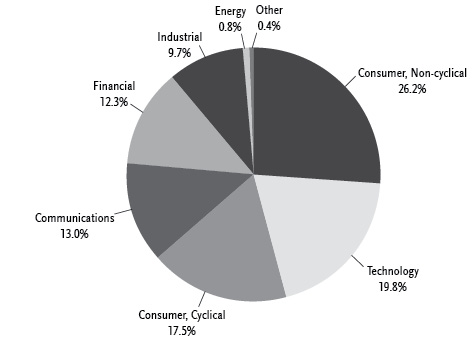
“Holdings Diversification (Market Exposure as % of Net Assets)” excludes any temporary cash investments.
Ten Largest Holdings | (% of Total Net Assets) |
Facebook, Inc. — Class A | 2.1% |
NVIDIA Corp. | 2.1% |
Constellation Brands, Inc. — Class A | 1.9% |
Broadcom Ltd. | 1.8% |
Centene Corp. | 1.8% |
Electronic Arts, Inc. | 1.8% |
Amazon.com, Inc. | 1.7% |
Activision Blizzard, Inc. | 1.6% |
Ulta Salon Cosmetics & Fragrance, Inc. | 1.6% |
Expedia, Inc. | 1.5% |
Top Ten Total | 17.9% |
“Ten Largest Holdings” exclude any temporary cash or derivative investments. | |
12 | GUGGENHEIM ETFs ANNUAL REPORT |
MANAGER'S ANALYSIS (Unaudited) | October 31, 2016 |
GUGGENHEIM S&P MIDCAP 400® PURE VALUE ETF
For the one-year period ended October 31, 2016, Guggenheim S&P MidCap 400® Pure Value ETF (“RFV”) returned 6.65%. Over the year, its benchmark, the S&P MidCap 400® Pure Value Index, posted a 7.09% return. RFV achieved over 99% correlation to its benchmark on a daily basis.
For comparison, the S&P MidCap 400® Value Index returned 8.64% for the year.
The Materials, Utilities, and Industrials sectors were the largest contributors to the Fund’s performance. The Energy, Health Care, and Consumer Discretionary sectors were the largest detractors from the Fund’s performance.
Stocks contributing the most to the Fund’s return were Joy Global, Inc., Talen Energy Corp., and United States Steel Corp. SunEdison, Inc., Community Health Systems, Inc., and Ascena Retail Group, Inc. detracted the most from the Fund’s return.
Cumulative Fund Performance: October 31, 2006 – October 31, 2016
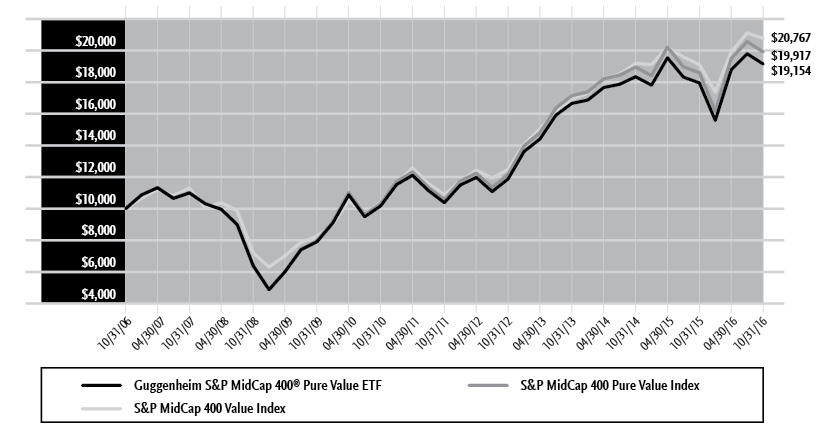
AVERAGE ANNUAL TOTAL RETURNS FOR THE PERIOD ENDED OCTOBER 31, 2016 | ||||
One Year | Three Year | Five Year | 10 Year | |
Guggenheim S&P MidCap 400® Pure Value ETF | 6.65% | 4.76% | 13.04% | 6.71% |
S&P MidCap 400 Pure Value Index | 7.09% | 5.11% | 13.50% | 7.13% |
S&P MidCap 400 Value Index | 8.64% | 7.04% | 13.78% | 7.58% |
The returns presented above do not reflect the effect of taxes. Index returns represent total returns. Performance displayed represents past performance, which is no guarantee of future results.
GUGGENHEIM ETFs ANNUAL REPORT | 13 |
PORTFOLIO SUMMARY (Unaudited) | October 31, 2016 |
GUGGENHEIM S&P MIDCAP 400® PURE VALUE ETF
Holdings Diversification (Market Exposure as % of Net Assets)
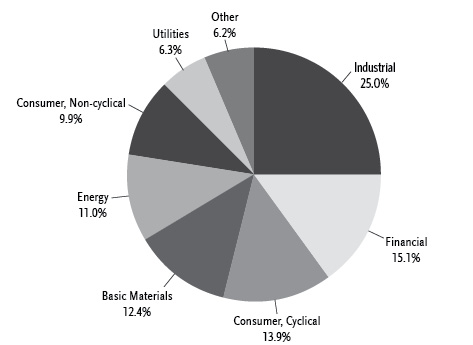
“Holdings Diversification (Market Exposure as % of Net Assets)” excludes any temporary cash investments.
Ten Largest Holdings | (% of Total Net Assets) |
Joy Global, Inc. | 4.3% |
Talen Energy Corp. | 3.1% |
United States Steel Corp. | 2.9% |
Terex Corp. | 2.1% |
Computer Sciences Corp. | 2.1% |
KB Home | 2.1% |
Tech Data Corp. | 2.0% |
WPX Energy, Inc. | 1.9% |
Ingram Micro, Inc. — Class A | 1.9% |
Reliance Steel & Aluminum Co. | 1.8% |
Top Ten Total | 24.2% |
“Ten Largest Holdings” exclude any temporary cash or derivative investments. | |
14 | GUGGENHEIM ETFs ANNUAL REPORT |
MANAGER'S ANALYSIS (Unaudited) | October 31, 2016 |
GUGGENHEIM S&P MIDCAP 400® PURE GROWTH ETF
For the one-year period ended October 31, 2016, Guggenheim S&P MidCap 400® Pure Growth ETF (“RFG”) returned -6.65%. Over the year, its benchmark, the S&P MidCap 400® Pure Growth Index, returned -6.36%. RFG achieved over 99% correlation to its benchmark on a daily basis.
For comparison, the S&P MidCap 400® Growth Index returned 3.68% for the year.
The Real Estate, Consumer Staples, and Materials sectors contributed the most to the Fund’s performance. The Consumer Discretionary, Information Technology, and Financials sectors detracted the most from the Fund’s performance.
Stocks contributing the most to return were MarketAxess Holdings, Inc., Post Holdings, Inc., and Convergys Corp. Stocks detracting the most from return were WisdomTree Investments, Inc., Synaptics, Inc., and Skechers U.S.A., Inc.—Class A.
Cumulative Fund Performance: October 31, 2006 – October 31, 2016
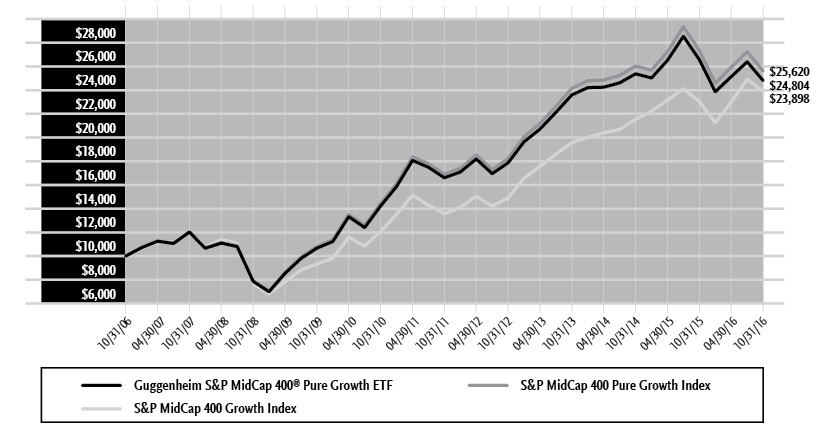
AVERAGE ANNUAL TOTAL RETURNS FOR THE PERIOD ENDED OCTOBER 31, 2016 | ||||
One Year | Three Year | Five Year | 10 Year | |
Guggenheim S&P MidCap 400® Pure Growth ETF | -6.65% | 1.68% | 8.36% | 9.51% |
S&P MidCap 400 Growth Index | 3.68% | 6.89% | 11.99% | 9.10% |
S&P MidCap 400 Pure Growth Index | -6.36% | 1.97% | 8.67% | 9.87% |
The returns presented above do not reflect the effect of taxes. Index returns represent total returns. Performance displayed represents past performance, which is no guarantee of future results.
GUGGENHEIM ETFs ANNUAL REPORT | 15 |
PORTFOLIO SUMMARY (Unaudited) | October 31, 2016 |
GUGGENHEIM S&P MIDCAP 400® PURE GROWTH ETF
Holdings Diversification (Market Exposure as % of Net Assets)
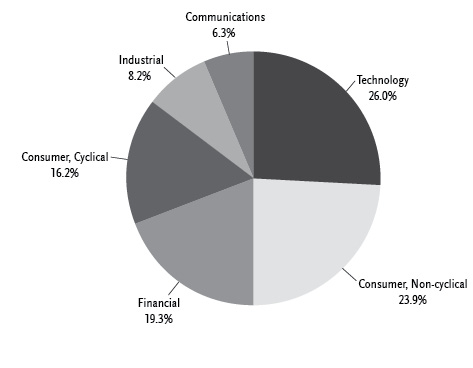
“Holdings Diversification (Market Exposure as % of Net Assets)” excludes any temporary cash investments.
Ten Largest Holdings | (% of Total Net Assets) |
Convergys Corp. | 2.4% |
ABIOMED, Inc. | 2.4% |
Alexander & Baldwin, Inc. | 2.3% |
MarketAxess Holdings, Inc. | 2.1% |
WebMD Health Corp. — Class A | 2.0% |
Post Holdings, Inc. | 2.0% |
ARRIS International plc | 1.9% |
Cirrus Logic, Inc. | 1.8% |
Skechers U.S.A., Inc. — Class A | 1.8% |
Ultimate Software Group, Inc. | 1.8% |
Top Ten Total | 20.5% |
“Ten Largest Holdings” exclude any temporary cash or derivative investments. | |
16 | GUGGENHEIM ETFs ANNUAL REPORT |
MANAGER'S ANALYSIS (Unaudited) | October 31, 2016 |
GUGGENHEIM S&P SMALLCAP 600® PURE VALUE ETF
For the one-year period ended October 31, 2016, Guggenheim S&P SmallCap 600® Pure Value ETF (“RZV”) returned 5.50%. Over the year, its benchmark, the S&P SmallCap 600® Pure Value Index, returned 5.88%. RZV achieved over 99% correlation to its benchmark on a daily basis.
For comparison, the S&P SmallCap 600® Value Index returned 9.38% for the year.
The largest contributors to the Fund’s performance were the Materials, Industrials, and Information Technology sectors. The Consumer Discretionary, Health Care, and Energy sectors detracted the most from the Fund’s performance.
Century Aluminum Co., Chemours Co., and SPX Corp. contributed the most to the Fund’s return. Republic Airways Holdings, Inc., CIBER, Inc., and Hanger, Inc. were the largest detractors from the Fund’s return.
Cumulative Fund Performance: October 31, 2006 – October 31, 2016

AVERAGE ANNUAL TOTAL RETURNS FOR THE PERIOD ENDED OCTOBER 31, 2016 | ||||
One Year | Three Year | Five Year | 10 Year | |
Guggenheim S&P SmallCap 600® Pure Value ETF | 5.50% | 2.64% | 12.26% | 5.38% |
S&P SmallCap 600 Pure Value Index | 5.88% | 2.98% | 12.64% | 5.60% |
S&P SmallCap 600 Value Index | 9.38% | 6.07% | 13.89% | 6.79% |
The returns presented above do not reflect the effect of taxes. Index returns represent total returns. Performance displayed represents past performance, which is no guarantee of future results.
GUGGENHEIM ETFs ANNUAL REPORT | 17 |
PORTFOLIO SUMMARY (Unaudited) | October 31, 2016 |
GUGGENHEIM S&P SMALLCAP 600® PURE VALUE ETF
Holdings Diversification (Market Exposure as % of Net Assets)
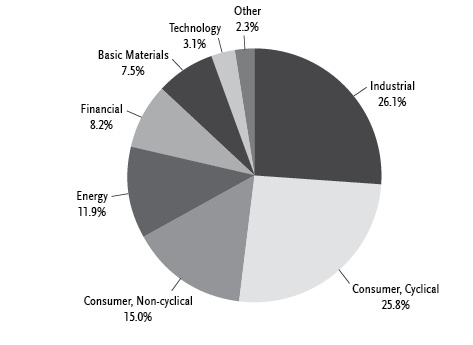
“Holdings Diversification (Market Exposure as % of Net Assets)” excludes any temporary cash investments.
Ten Largest Holdings | (% of Total Net Assets) |
Century Aluminum Co. | 2.6% |
Orion Group Holdings, Inc. | 1.9% |
EZCORP, Inc. — Class A | 1.9% |
SPX Corp. | 1.9% |
SkyWest, Inc. | 1.7% |
Big 5 Sporting Goods Corp. | 1.6% |
Chemours Co. | 1.6% |
TTM Technologies, Inc. | 1.6% |
Archrock, Inc. | 1.4% |
Kelly Services, Inc. — Class A | 1.4% |
Top Ten Total | 17.6% |
“Ten Largest Holdings” exclude any temporary cash or derivative investments. | |
18 | GUGGENHEIM ETFs ANNUAL REPORT |
MANAGER'S ANALYSIS (Unaudited) | October 31, 2016 |
GUGGENHEIM S&P SMALLCAP 600® PURE GROWTH ETF
For the one-year period ended October 31, 2016, Guggenheim S&P SmallCap 600® Pure Growth ETF (“RZG”) returned -2.20%. Over the year, its benchmark, the S&P SmallCap 600® Pure Growth Index, returned -2.01%. RZG achieved over 99% correlation to its benchmark on a daily basis.
For comparison, the S&P SmallCap 600® Growth Index returned 3.66% for the year.
The largest contributors to the Fund’s performance were the Information Technology, Health Care, and Real Estate sectors. The Financials, Industrials, and Energy sectors were the largest detractors from the Fund’s performance.
Cirrus Logic, Inc., Fabrinet, and Ebix, Inc. were the holdings contributing the most to the Fund’s return. Universal Insurance Holdings, Inc., LendingTree, Inc., and Lannett Company, Inc. were the largest detractors.
Cumulative Fund Performance: October 31, 2006 – October 31, 2016
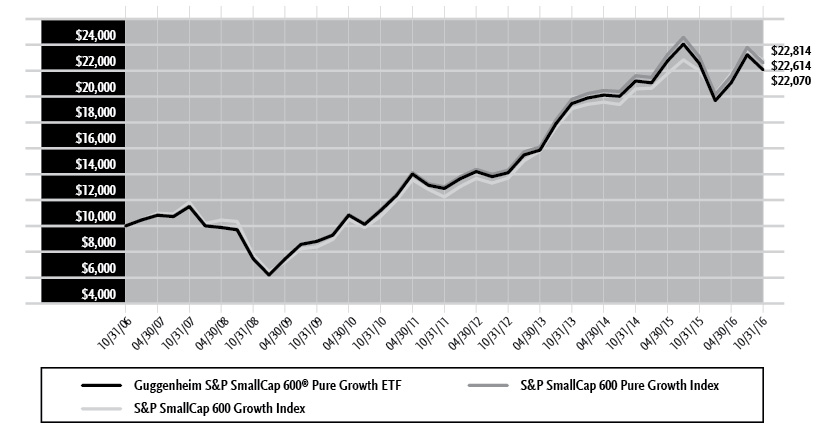
AVERAGE ANNUAL TOTAL RETURNS FOR THE PERIOD ENDED OCTOBER 31, 2016 | ||||
One Year | Three Year | Five Year | 10 Year | |
Guggenheim S&P SmallCap 600® Pure Growth ETF | -2.20% | 4.28% | 11.35% | 8.24% |
S&P SmallCap 600 Growth Index | 3.66% | 6.16% | 13.25% | 8.60% |
S&P SmallCap 600 Pure Growth Index | -2.01% | 4.55% | 11.67% | 8.50% |
The returns presented above do not reflect the effect of taxes. Index returns represent total returns. Performance displayed represents past performance, which is no guarantee of future results.
GUGGENHEIM ETFs ANNUAL REPORT | 19 |
PORTFOLIO SUMMARY (Unaudited) | October 31, 2016 |
GUGGENHEIM S&P SMALLCAP 600® PURE GROWTH ETF
Holdings Diversification (Market Exposure as % of Net Assets)
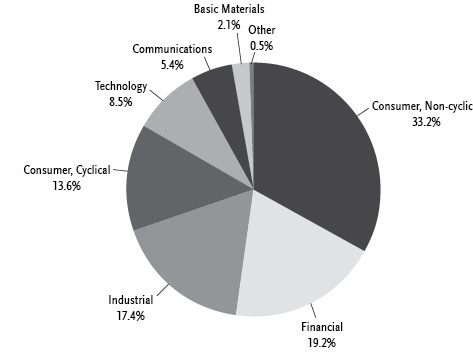
“Holdings Diversification (Market Exposure as % of Net Assets)” excludes any temporary cash investments.
Ten Largest Holdings | (% of Total Net Assets) |
Supernus Pharmaceuticals, Inc. | 1.7% |
LogMeIn, Inc. | 1.6% |
LGI Homes, Inc. | 1.5% |
Fabrinet | 1.5% |
Ligand Pharmaceuticals, Inc. — Class B | 1.5% |
Depomed, Inc. | 1.4% |
First Midwest Bancorp, Inc. | 1.3% |
Dave & Buster's Entertainment, Inc. | 1.3% |
II-VI, Inc. | 1.2% |
PGT, Inc. | 1.2% |
Top Ten Total | 14.2% |
“Ten Largest Holdings” exclude any temporary cash or derivative investments. | |
20 | GUGGENHEIM ETFs ANNUAL REPORT |
SCHEDULE OF INVESTMENTS | October 31, 2016 |
GUGGENHEIM S&P 500® TOP 50 ETF |
Shares | Value | |||||||
COMMON STOCKS† - 99.7% | ||||||||
Consumer, Non-cyclical - 25.6% | ||||||||
Johnson & Johnson | 176,962 | $ | 20,525,822 | |||||
Procter & Gamble Co. | 172,621 | 14,983,503 | ||||||
Pfizer, Inc. | 392,340 | 12,441,101 | ||||||
Coca-Cola Co. | 251,253 | 10,653,128 | ||||||
Merck & Company, Inc. | 178,860 | 10,502,659 | ||||||
PepsiCo, Inc. | 93,087 | 9,978,926 | ||||||
Philip Morris International, Inc. | 100,343 | 9,677,079 | ||||||
UnitedHealth Group, Inc. | 61,602 | 8,706,211 | ||||||
Altria Group, Inc. | 126,380 | 8,356,246 | ||||||
Medtronic plc | 89,386 | 7,331,440 | ||||||
Amgen, Inc. | 48,406 | 6,832,991 | ||||||
Gilead Sciences, Inc. | 85,359 | 6,284,983 | ||||||
AbbVie, Inc. | 105,337 | 5,875,698 | ||||||
Bristol-Myers Squibb Co. | 108,076 | 5,502,149 | ||||||
Allergan plc* | 25,611 | 5,351,162 | ||||||
Celgene Corp.* | 50,137 | 5,122,999 | ||||||
Total Consumer, Non-cyclical | 148,126,097 | |||||||
Communications - 21.8% | ||||||||
Amazon.com, Inc.* | 25,451 | 20,101,709 | ||||||
Facebook, Inc. — Class A* | 150,254 | 19,681,771 | ||||||
Alphabet, Inc. — Class A* | 19,071 | 15,445,603 | ||||||
Alphabet, Inc. — Class C* | 19,114 | 14,995,698 | ||||||
AT&T, Inc. | 397,925 | 14,639,661 | ||||||
Verizon Communications, Inc. | 263,663 | 12,682,190 | ||||||
Cisco Systems, Inc. | 325,332 | 9,981,186 | ||||||
Comcast Corp. — Class A | 155,391 | 9,606,272 | ||||||
Walt Disney Co. | 95,634 | 8,864,315 | ||||||
Total Communications | 125,998,405 | |||||||
Technology - 17.8% | ||||||||
Apple, Inc. | 348,536 | 39,572,777 | ||||||
Microsoft Corp. | 504,037 | 30,201,897 | ||||||
Intel Corp. | 306,011 | 10,670,604 | ||||||
International Business Machines Corp. | 56,262 | 8,646,907 | ||||||
Oracle Corp. | 194,667 | 7,479,106 | ||||||
QUALCOMM, Inc. | 95,318 | 6,550,253 | ||||||
Total Technology | 103,121,544 | |||||||
Financial - 14.6% | ||||||||
Berkshire Hathaway, Inc. — Class B* | 122,809 | 17,721,339 | ||||||
JPMorgan Chase & Co. | 233,631 | 16,181,282 | ||||||
Wells Fargo & Co. | 293,721 | 13,514,103 | ||||||
Bank of America Corp. | 660,067 | 10,891,106 | ||||||
Visa, Inc. — Class A | 122,018 | 10,067,705 | ||||||
Citigroup, Inc. | 187,926 | 9,236,563 | ||||||
Mastercard, Inc. — Class A | 62,832 | 6,724,281 | ||||||
Total Financial | 84,336,379 | |||||||
Industrial - 7.6% | ||||||||
General Electric Co. | 579,632 | 16,867,291 | ||||||
3M Co. | 39,094 | 6,462,238 | ||||||
Honeywell International, Inc. | 49,216 | 5,398,011 | ||||||
Boeing Co. | 37,526 | 5,344,828 | ||||||
United Technologies Corp. | 50,345 | 5,145,259 | ||||||
Union Pacific Corp. | 53,875 | 4,750,698 | ||||||
Total Industrial | 43,968,325 | |||||||
Energy - 7.3% | ||||||||
Exxon Mobil Corp. | 268,215 | 22,347,674 | ||||||
Chevron Corp. | 122,024 | 12,782,014 | ||||||
Schlumberger Ltd. | 89,953 | 7,037,023 | ||||||
Total Energy | 42,166,711 | |||||||
Consumer, Cyclical - 5.0% | ||||||||
Home Depot, Inc. | 79,919 | 9,750,916 | ||||||
Wal-Mart Stores, Inc. | 98,038 | 6,864,621 | ||||||
McDonald’s Corp. | 55,198 | 6,213,639 | ||||||
CVS Health Corp. | 68,965 | 5,799,957 | ||||||
Total Consumer, Cyclical | 28,629,133 | |||||||
Total Common Stocks | ||||||||
(Cost $510,204,999) | 576,346,594 | |||||||
SHORT TERM INVESTMENTS† - 0.2% | ||||||||
Federated U.S. Treasury Cash Reserve Fund Institutional Shares, 0.18%1 | 942,693 | 942,693 | ||||||
Total Short Term Investments | ||||||||
(Cost $942,693) | 942,693 | |||||||
Total Investments - 99.9% | ||||||||
(Cost $511,147,692) | $ | 577,289,287 | ||||||
Other Assets & Liabilities, net - 0.1% | 512,850 | |||||||
Total Net Assets - 100.0% | $ | 577,802,137 | ||||||
* | Non-income producing security. |
† | Value determined based on Level 1 inputs — See Note 4. |
1 | Rate indicated is the 7 day yield as of October 31, 2016. |
plc — Public Limited Company | |
See Sector Classification in Other Information section. |
SEE NOTES TO FINANCIAL STATEMENTS. | GUGGENHEIM ETFs ANNUAL REPORT | 21 |
SCHEDULE OF INVESTMENTS (concluded) | October 31, 2016 |
GUGGENHEIM S&P 500® TOP 50 ETF |
The following table summarizes the inputs used to value the Fund’s investments at October 31, 2016 (See Note 4 in the Notes to Financial Statements):
Investments in Securities | Level 1 | Level 2 | Level 3 | Total | ||||||||||||
Common Stocks | $ | 576,346,594 | $ | — | $ | — | $ | 576,346,594 | ||||||||
Short Term Investments | 942,693 | — | — | 942,693 | ||||||||||||
Total | $ | 577,289,287 | $ | — | $ | — | $ | 577,289,287 | ||||||||
Transfers between investment levels may occur as the markets fluctuate and/or the availability of data used in an investment’s valuation changes. Transfers between valuation levels, if any, are in comparison to the valuation levels at the end of the previous fiscal year, and are effective using the fair value as of the end of the previous fiscal period.
For the year ended October 31, 2016, there were no transfers between levels.
22 | GUGGENHEIM ETFs ANNUAL REPORT | SEE NOTES TO FINANCIAL STATEMENTS. |
SCHEDULE OF INVESTMENTS | October 31, 2016 |
GUGGENHEIM S&P 500® PURE VALUE ETF |
Shares | Value | |||||||
COMMON STOCKS† - 99.8% | ||||||||
Financial - 26.9% | ||||||||
Prudential Financial, Inc. | 137,899 | $ | 11,692,455 | |||||
MetLife, Inc. | 228,931 | 10,750,599 | ||||||
Loews Corp. | 248,273 | 10,683,187 | ||||||
Regions Financial Corp. | 790,107 | 8,462,046 | ||||||
Lincoln National Corp. | 171,229 | 8,405,632 | ||||||
Allstate Corp. | 122,885 | 8,343,892 | ||||||
American International Group, Inc. | 134,368 | 8,290,506 | ||||||
Hartford Financial Services Group, Inc. | 176,208 | 7,772,535 | ||||||
Bank of America Corp. | 469,272 | 7,742,988 | ||||||
Unum Group | 217,280 | 7,691,712 | ||||||
Citigroup, Inc. | 150,726 | 7,408,183 | ||||||
Capital One Financial Corp. | 97,804 | 7,241,407 | ||||||
Zions Bancorporation | 198,551 | 6,395,328 | ||||||
SunTrust Banks, Inc. | 139,583 | 6,313,339 | ||||||
Navient Corp. | 479,436 | 6,127,192 | ||||||
KeyCorp | 431,382 | 6,091,114 | ||||||
Comerica, Inc. | 112,387 | 5,854,239 | ||||||
Fifth Third Bancorp | 243,501 | 5,298,582 | ||||||
JPMorgan Chase & Co. | 76,247 | 5,280,867 | ||||||
Goldman Sachs Group, Inc. | 29,343 | 5,230,096 | ||||||
Principal Financial Group, Inc. | 90,766 | 4,955,824 | ||||||
Chubb Ltd. | 37,389 | 4,748,403 | ||||||
Berkshire Hathaway, Inc. — Class B* | 32,384 | 4,673,011 | ||||||
Travelers Companies, Inc. | 41,043 | 4,440,032 | ||||||
PNC Financial Services Group, Inc. | 46,376 | 4,433,546 | ||||||
Aflac, Inc. | 63,671 | 4,385,022 | ||||||
People’s United Financial, Inc. | 256,283 | 4,162,036 | ||||||
BB&T Corp. | 103,816 | 4,069,587 | ||||||
Legg Mason, Inc. | 136,873 | 3,930,993 | ||||||
Bank of New York Mellon Corp. | 64,073 | 2,772,439 | ||||||
Total Financial | 193,646,792 | |||||||
Consumer, Cyclical - 15.1% | ||||||||
Best Buy Company, Inc.1 | 320,449 | 12,468,671 | ||||||
Wal-Mart Stores, Inc. | 151,735 | 10,624,484 | ||||||
General Motors Co. | 305,957 | 9,668,241 | ||||||
Kohl’s Corp.1 | 187,517 | 8,203,869 | ||||||
Ford Motor Co. | 691,827 | 8,122,049 | ||||||
Staples, Inc. | 1,050,287 | 7,772,124 | ||||||
PVH Corp. | 58,343 | 6,241,534 | ||||||
Macy’s, Inc. | 166,974 | 6,092,881 | ||||||
United Continental Holdings, Inc.* | 105,160 | 5,913,147 | ||||||
AutoNation, Inc.* | 134,696 | 5,909,114 | ||||||
Urban Outfitters, Inc.* | 175,296 | 5,863,651 | ||||||
Whirlpool Corp. | 30,993 | 4,643,371 | ||||||
PulteGroup, Inc.1 | 245,134 | 4,559,492 | ||||||
Target Corp. | 52,450 | 3,604,889 | ||||||
PACCAR, Inc. | 65,283 | 3,585,342 | ||||||
The Gap, Inc.1 | 118,571 | 3,271,374 | ||||||
Bed Bath & Beyond, Inc.1 | 54,583 | 2,206,245 | ||||||
Total Consumer, Cyclical | 108,750,478 | |||||||
Utilities - 14.7% | ||||||||
NRG Energy, Inc. | 1,403,648 | 14,920,778 | ||||||
Exelon Corp. | 361,592 | 12,319,439 | ||||||
AES Corp. | 957,671 | 11,271,788 | ||||||
FirstEnergy Corp. | 225,345 | 7,727,080 | ||||||
NiSource, Inc. | 253,743 | 5,902,062 | ||||||
Duke Energy Corp. | 63,626 | 5,091,353 | ||||||
Consolidated Edison, Inc.1 | 65,316 | 4,934,624 | ||||||
SCANA Corp. | 57,682 | 4,231,552 | ||||||
DTE Energy Co. | 43,983 | 4,222,808 | ||||||
Entergy Corp. | 57,010 | 4,200,497 | ||||||
Edison International | 53,348 | 3,920,011 | ||||||
Public Service Enterprise Group, Inc. | 92,196 | 3,879,608 | ||||||
American Electric Power Company, Inc. | 58,793 | 3,812,138 | ||||||
CenterPoint Energy, Inc. | 159,634 | 3,639,655 | ||||||
Ameren Corp. | 70,022 | 3,497,599 | ||||||
Pinnacle West Capital Corp. | 44,111 | 3,358,170 | ||||||
PG&E Corp. | 51,043 | 3,170,791 | ||||||
Xcel Energy, Inc. | 69,719 | 2,896,824 | ||||||
Eversource Energy | 50,601 | 2,786,091 | ||||||
Total Utilities | 105,782,868 | |||||||
Industrial - 10.7% | ||||||||
Arconic, Inc. | 442,276 | 12,702,167 | ||||||
Jacobs Engineering Group, Inc.* | 242,290 | 12,497,317 | ||||||
Fluor Corp. | 212,750 | 11,060,873 | ||||||
Ryder System, Inc. | 128,026 | 8,883,724 | ||||||
WestRock Co. | 169,842 | 7,845,002 | ||||||
Corning, Inc. | 239,084 | 5,429,598 | ||||||
Cummins, Inc. | 39,318 | 5,025,627 | ||||||
Eaton Corporation plc | 66,198 | 4,221,447 | ||||||
Caterpillar, Inc. | 44,270 | 3,694,774 | ||||||
Textron, Inc. | 70,003 | 2,805,720 | ||||||
Owens-Illinois, Inc.* | 143,027 | 2,760,421 | ||||||
Total Industrial | 76,926,670 | |||||||
Consumer, Non-cyclical - 9.6% | ||||||||
Archer-Daniels-Midland Co. | 379,147 | 16,519,434 | ||||||
Quanta Services, Inc.* | 446,432 | 12,834,920 | ||||||
Tyson Foods, Inc. — Class A | 134,229 | 9,510,125 | ||||||
Anthem, Inc. | 77,522 | 9,446,831 | ||||||
Cardinal Health, Inc. | 82,373 | 5,658,202 | ||||||
McKesson Corp. | 37,414 | 4,757,938 | ||||||
Sysco Corp. | 88,776 | 4,271,901 | ||||||
Whole Foods Market, Inc.1 | 119,934 | 3,392,933 | ||||||
Express Scripts Holding Co.* | 40,190 | 2,708,806 | ||||||
Total Consumer, Non-cyclical | 69,101,090 | |||||||
Energy - 9.0% | ||||||||
National Oilwell Varco, Inc.1 | 321,115 | 10,307,792 | ||||||
Valero Energy Corp. | 160,083 | 9,483,316 | ||||||
Chevron Corp. | 68,059 | 7,129,180 | ||||||
Phillips 66 | 84,097 | 6,824,472 | ||||||
Marathon Petroleum Corp. | 145,340 | 6,335,371 | ||||||
Transocean Ltd.*,1 | 550,335 | 5,288,719 | ||||||
Helmerich & Payne, Inc. | 80,027 | 5,050,504 | ||||||
First Solar, Inc.*,1 | 110,791 | 4,485,928 | ||||||
SEE NOTES TO FINANCIAL STATEMENTS. | GUGGENHEIM ETFs ANNUAL REPORT | 23 |
SCHEDULE OF INVESTMENTS (continued) | October 31, 2016 |
GUGGENHEIM S&P 500® PURE VALUE ETF |
Shares | Value | |||||||
Hess Corp. | 81,960 | $ | 3,931,621 | |||||
Baker Hughes, Inc. | 54,929 | 3,043,067 | ||||||
Marathon Oil Corp. | 228,213 | 3,007,847 | ||||||
Total Energy | 64,887,817 | |||||||
Technology - 4.6% | ||||||||
HP, Inc. | 1,397,682 | 20,252,412 | ||||||
Xerox Corp. | 847,448 | 8,279,567 | ||||||
Western Digital Corp.1 | 80,157 | 4,684,375 | ||||||
Total Technology | 33,216,354 | |||||||
Basic Materials - 4.6% | ||||||||
Newmont Mining Corp. | 446,997 | 16,556,769 | ||||||
Nucor Corp. | 126,615 | 6,185,143 | ||||||
Freeport-McMoRan, Inc.*,1 | 487,714 | 5,452,643 | ||||||
Mosaic Co. | 205,631 | 4,838,497 | ||||||
Total Basic Materials | 33,033,052 | |||||||
Communications - 2.8% | ||||||||
CenturyLink, Inc.1 | 297,908 | 7,918,394 | ||||||
News Corp. — Class A | 453,690 | 5,498,723 | ||||||
Frontier Communications Corp.1 | 1,194,452 | 4,801,697 | ||||||
News Corp. — Class B | 128,167 | 1,589,271 | ||||||
Total Communications | 19,808,085 | |||||||
Diversified - 1.8% | ||||||||
Leucadia National Corp. | 692,421 | 12,927,500 | ||||||
Total Common Stocks | ||||||||
(Cost $743,091,957) | 718,080,706 | |||||||
SHORT TERM INVESTMENTS† - 0.2% | ||||||||
Federated U.S. Treasury Cash Reserve Fund Institutional Shares, 0.18%2 | 1,213,912 | 1,213,912 | ||||||
Total Short Term Investments | ||||||||
(Cost $1,213,912) | 1,213,912 | |||||||
Face | ||||||||
SECURITIES LENDING COLLATERAL††,3 - 2.9% | ||||||||
Joint Repurchase Agreements | ||||||||
Citigroup Global Markets, Inc. | $ | 4,777,134 | 4,777,134 | |||||
BNP Paribas Securities Corp. | 4,777,134 | 4,777,134 | ||||||
Merrill Lynch, Pierce, Fenner & Smith, Inc. | 4,777,134 | 4,777,134 | ||||||
HSBC Securities (USA), Inc. | 4,777,134 | 4,777,134 | ||||||
Credit Suisse Securities (USA), LLC | 1,409,320 | 1,409,320 | ||||||
Total Securities Lending Collateral | ||||||||
(Cost $20,517,856) | 20,517,856 | |||||||
Total Investments - 102.8% | ||||||||
(Cost $764,823,725) | $ | 739,812,474 | ||||||
Other Assets & Liabilities, net - (2.8)% | (20,149,272 | ) | ||||||
Total Net Assets - 100.0% | $ | 719,663,202 | ||||||
* | Non-income producing security. |
† | Value determined based on Level 1 inputs — See Note 4. |
†† | Value determined based on Level 2 inputs — See Note 4. |
1 | All or portion of this security is on loan at October 31, 2016 — See Note 5. |
2 | Rate indicated is the 7 day yield as of October 31, 2016. |
3 | Securities lending collateral — See Note 5. |
plc — Public Limited Company | |
See Sector Classification in Other Information section. |
24 | GUGGENHEIM ETFs ANNUAL REPORT | SEE NOTES TO FINANCIAL STATEMENTS. |
SCHEDULE OF INVESTMENTS (concluded) | October 31, 2016 |
GUGGENHEIM S&P 500® PURE VALUE ETF |
The following table summarizes the inputs used to value the Fund’s investments at October 31, 2016 (See Note 4 in the Notes to Financial Statements):
Investments in Securities | Level 1 | Level 2 | Level 3 | Total | ||||||||||||
Common Stocks | $ | 718,080,706 | $ | — | $ | — | $ | 718,080,706 | ||||||||
Securities Lending Collateral | — | 20,517,856 | — | 20,517,856 | ||||||||||||
Short Term Investments | 1,213,912 | — | — | 1,213,912 | ||||||||||||
Total | $ | 719,294,618 | $ | 20,517,856 | $ | — | $ | 739,812,474 | ||||||||
Transfers between investment levels may occur as the markets fluctuate and/or the availability of data used in an investment’s valuation changes. Transfers between valuation levels, if any, are in comparison to the valuation levels at the end of the previous fiscal year, and are effective using the fair value as of the end of the previous fiscal period.
For the year ended October 31, 2016, there were no transfers between levels.
SEE NOTES TO FINANCIAL STATEMENTS. | GUGGENHEIM ETFs ANNUAL REPORT | 25 |
SCHEDULE OF INVESTMENTS | October 31, 2016 |
GUGGENHEIM S&P 500® PURE GROWTH ETF |
Shares | Value | |||||||
COMMON STOCKS† - 99.7% | ||||||||
Consumer, Non-cyclical - 26.2% | ||||||||
Constellation Brands, Inc. — Class A | 198,981 | $ | 33,253,705 | |||||
Centene Corp.* | 501,932 | 31,360,712 | ||||||
S&P Global, Inc. | 166,057 | 20,234,045 | ||||||
Mondelez International, Inc. — Class A | 408,927 | 18,377,179 | ||||||
Hologic, Inc.* | 505,593 | 18,206,404 | ||||||
Global Payments, Inc. | 250,886 | 18,194,253 | ||||||
Total System Services, Inc. | 364,626 | 18,187,545 | ||||||
Aetna, Inc. | 167,175 | 17,946,236 | ||||||
Equifax, Inc. | 136,934 | 16,975,708 | ||||||
Edwards Lifesciences Corp.* | 173,881 | 16,556,949 | ||||||
Reynolds American, Inc. | 286,624 | 15,787,250 | ||||||
Boston Scientific Corp.* | 714,106 | 15,710,332 | ||||||
Regeneron Pharmaceuticals, Inc.* | 44,830 | 15,467,246 | ||||||
Cigna Corp. | 130,122 | 15,462,397 | ||||||
Gilead Sciences, Inc. | 199,674 | 14,701,997 | ||||||
Monster Beverage Corp.* | 96,704 | 13,958,256 | ||||||
Biogen, Inc.* | 48,846 | 13,685,672 | ||||||
Avery Dennison Corp. | 184,321 | 12,863,763 | ||||||
Celgene Corp.* | 123,169 | 12,585,408 | ||||||
Coty, Inc. — Class A* | 547,304 | 12,582,519 | ||||||
AmerisourceBergen Corp. — Class A | 170,918 | 12,018,954 | ||||||
Verisk Analytics, Inc. — Class A* | 146,131 | 11,916,983 | ||||||
Hormel Foods Corp. | 302,618 | 11,650,793 | ||||||
Laboratory Corporation of America Holdings* | 86,004 | 10,779,741 | ||||||
Cintas Corp. | 100,759 | 10,747,963 | ||||||
Moody’s Corp. | 93,354 | 9,383,944 | ||||||
Alexion Pharmaceuticals, Inc.* | 71,347 | 9,310,784 | ||||||
Illumina, Inc.* | 67,046 | 9,127,642 | ||||||
CR Bard, Inc. | 36,662 | 7,943,922 | ||||||
Becton Dickinson and Co. | 43,002 | 7,220,466 | ||||||
Dr Pepper Snapple Group, Inc. | 71,712 | 6,295,596 | ||||||
Allergan plc* | 21,267 | 4,443,527 | ||||||
Total Consumer, Non-cyclical | 462,937,891 | |||||||
Technology - 19.8% | ||||||||
NVIDIA Corp. | 513,690 | 36,554,180 | ||||||
Broadcom Ltd. | 188,858 | 32,158,740 | ||||||
Electronic Arts, Inc.*,1 | 396,280 | 31,115,906 | ||||||
Activision Blizzard, Inc. | 652,261 | 28,158,107 | ||||||
salesforce.com, Inc.* | 320,623 | 24,098,025 | ||||||
Skyworks Solutions, Inc.1 | 285,290 | 21,950,213 | ||||||
Lam Research Corp. | 201,867 | 19,552,838 | ||||||
Red Hat, Inc.* | 236,449 | 18,312,975 | ||||||
Fiserv, Inc.* | 159,661 | 15,723,415 | ||||||
Cognizant Technology Solutions Corp. — Class A* | 297,633 | 15,283,454 | ||||||
Applied Materials, Inc. | 503,324 | 14,636,662 | ||||||
Citrix Systems, Inc.* | 166,734 | 14,139,043 | ||||||
Microchip Technology, Inc. | 216,610 | 13,115,736 | ||||||
Apple, Inc. | 107,931 | 12,254,486 | ||||||
Qorvo, Inc.* | 203,774 | 11,340,023 | ||||||
Akamai Technologies, Inc.* | 158,758 | 11,028,918 | ||||||
Cerner Corp.*,1 | 146,726 | 8,595,209 | ||||||
Microsoft Corp. | 130,547 | 7,822,376 | ||||||
Accenture plc — Class A | 64,083 | 7,449,008 | ||||||
Paychex, Inc. | 121,905 | 6,729,156 | ||||||
Total Technology | 350,018,470 | |||||||
Consumer, Cyclical - 17.5% | ||||||||
Ulta Salon Cosmetics & Fragrance, Inc.* | 115,585 | 28,126,454 | ||||||
O’Reilly Automotive, Inc.* | 84,760 | 22,413,935 | ||||||
DR Horton, Inc. | 711,173 | 20,503,118 | ||||||
Dollar Tree, Inc.* | 230,811 | 17,437,771 | ||||||
Starbucks Corp. | 323,432 | 17,164,536 | ||||||
AutoZone, Inc.* | 21,845 | 16,212,485 | ||||||
Alaska Air Group, Inc. | 217,248 | 15,689,650 | ||||||
Lennar Corp. — Class A | 364,822 | 15,209,429 | ||||||
Home Depot, Inc. | 122,210 | 14,910,842 | ||||||
LKQ Corp.* | 435,791 | 14,067,333 | ||||||
Advance Auto Parts, Inc. | 87,105 | 12,201,668 | ||||||
Lowe’s Companies, Inc. | 169,724 | 11,312,105 | ||||||
NIKE, Inc. — Class B | 224,217 | 11,251,209 | ||||||
Mohawk Industries, Inc.* | 59,107 | 10,893,420 | ||||||
Ross Stores, Inc. | 172,618 | 10,795,530 | ||||||
Signet Jewelers Ltd.1 | 117,278 | 9,530,010 | ||||||
Southwest Airlines Co. | 228,478 | 9,150,544 | ||||||
Under Armour, Inc. — Class A*,1 | 249,709 | 7,765,950 | ||||||
Tractor Supply Co. | 121,021 | 7,579,545 | ||||||
Chipotle Mexican Grill, Inc. — Class A*,1 | 18,806 | 6,784,453 | ||||||
TJX Companies, Inc. | 90,177 | 6,650,554 | ||||||
Newell Brands, Inc. | 137,635 | 6,609,233 | ||||||
Under Armour, Inc. — Class C*,1 | 251,479 | 6,503,247 | ||||||
Hanesbrands, Inc. | 218,723 | 5,621,181 | ||||||
Delphi Automotive plc | 85,158 | 5,541,231 | ||||||
Total Consumer, Cyclical | 309,925,433 | |||||||
Communications - 13.0% | ||||||||
Facebook, Inc. — Class A* | 285,263 | 37,366,600 | ||||||
Amazon.com, Inc.* | 37,571 | 29,674,328 | ||||||
Expedia, Inc. | 202,661 | 26,189,882 | ||||||
Netflix, Inc.* | 195,629 | 24,428,193 | ||||||
VeriSign, Inc.*,1 | 264,771 | 22,246,059 | ||||||
Priceline Group, Inc.* | 11,856 | 17,478,471 | ||||||
TripAdvisor, Inc.* | 231,432 | 14,922,735 | ||||||
eBay, Inc.* | 474,215 | 13,519,870 | ||||||
Alphabet, Inc. — Class A* | 11,966 | 9,691,263 | ||||||
Alphabet, Inc. — Class C* | 12,205 | 9,575,311 | ||||||
Walt Disney Co. | 95,231 | 8,826,961 | ||||||
Juniper Networks, Inc. | 331,477 | 8,731,104 | ||||||
Discovery Communications, Inc. — Class C* | 194,172 | 4,875,659 | ||||||
Discovery Communications, Inc. — Class A*,1 | 112,483 | 2,936,931 | ||||||
Total Communications | 230,463,367 | |||||||
Financial - 12.3% | ||||||||
XL Group Ltd. | 582,219 | 20,202,999 | ||||||
Extra Space Storage, Inc. | 220,707 | 16,144,717 | ||||||
Visa, Inc. — Class A | 194,682 | 16,063,211 | ||||||
Prologis, Inc. | 299,667 | 15,630,631 | ||||||
26 | GUGGENHEIM ETFs ANNUAL REPORT | SEE NOTES TO FINANCIAL STATEMENTS. |
SCHEDULE OF INVESTMENTS (continued) | October 31, 2016 |
GUGGENHEIM S&P 500® PURE GROWTH ETF |
Shares | Value | |||||||
Intercontinental Exchange, Inc. | 54,663 | $ | 14,780,329 | |||||
Equity Residential | 236,715 | 14,617,152 | ||||||
Mastercard, Inc. — Class A | 117,134 | 12,535,681 | ||||||
Equinix, Inc. | 34,440 | 12,304,723 | ||||||
E*TRADE Financial Corp.* | 431,830 | 12,160,333 | ||||||
Kimco Realty Corp. | 428,268 | 11,396,211 | ||||||
CBRE Group, Inc. — Class A* | 420,323 | 10,827,520 | ||||||
Public Storage | 47,561 | 10,164,737 | ||||||
UDR, Inc. | 282,200 | 9,868,534 | ||||||
American Tower Corp. — Class A | 82,768 | 9,699,582 | ||||||
Charles Schwab Corp. | 279,854 | 8,871,372 | ||||||
AvalonBay Communities, Inc. | 50,641 | 8,668,726 | ||||||
Crown Castle International Corp. | 93,929 | 8,546,600 | ||||||
Alliance Data Systems Corp. | 22,612 | 4,623,476 | ||||||
Total Financial | 217,106,534 | |||||||
Industrial - 9.7% | ||||||||
PerkinElmer, Inc. | 385,459 | 19,616,009 | ||||||
Vulcan Materials Co. | 170,523 | 19,303,203 | ||||||
Masco Corp. | 554,466 | 17,121,910 | ||||||
Fortune Brands Home & Security, Inc. | 297,132 | 16,232,321 | ||||||
Martin Marietta Materials, Inc. | 85,339 | 15,820,144 | ||||||
TransDigm Group, Inc. | 53,803 | 14,659,166 | ||||||
Acuity Brands, Inc. | 63,721 | 14,246,104 | ||||||
Northrop Grumman Corp. | 60,977 | 13,963,733 | ||||||
Stanley Black & Decker, Inc. | 83,828 | 9,542,979 | ||||||
Amphenol Corp. — Class A | 141,638 | 9,338,193 | ||||||
Snap-on, Inc. | 51,025 | 7,862,953 | ||||||
Roper Technologies, Inc. | 40,904 | 7,089,072 | ||||||
Boeing Co. | 45,282 | 6,449,515 | ||||||
Total Industrial | 171,245,302 | |||||||
Energy - 0.8% | ||||||||
Pioneer Natural Resources Co. | 84,125 | 15,060,058 | ||||||
Basic Materials - 0.4% | ||||||||
Sherwin-Williams Co. | 29,047 | 7,112,449 | ||||||
Total Common Stocks | ||||||||
(Cost $1,607,065,748) | 1,763,869,504 | |||||||
SHORT TERM INVESTMENTS† - 0.3% | ||||||||
Federated U.S. Treasury Cash Reserve Fund Institutional Shares, 0.18%2 | 4,537,039 | 4,537,039 | ||||||
Total Short Term Investments | ||||||||
(Cost $4,537,039) | 4,537,039 | |||||||
Face | ||||||||
SECURITIES LENDING COLLATERAL††,3 - 2.2% | ||||||||
Joint Repurchase Agreements | ||||||||
Citigroup Global Markets, Inc. | $ | 9,284,461 | 9,284,461 | |||||
BNP Paribas Securities Corp. | 9,284,461 | 9,284,461 | ||||||
Merrill Lynch, Pierce, Fenner & Smith, Inc. | 9,284,461 | 9,284,461 | ||||||
HSBC Securities (USA), Inc. | 9,284,461 | 9,284,461 | ||||||
Credit Suisse Securities (USA), LLC | 2,733,281 | 2,733,281 | ||||||
Total Securities Lending Collateral | ||||||||
(Cost $39,871,125) | 39,871,125 | |||||||
Total Investments - 102.2% | ||||||||
(Cost $1,651,473,912) | $ | 1,808,277,668 | ||||||
Other Assets & Liabilities, net - (2.2)% | (38,692,187 | ) | ||||||
Total Net Assets - 100.0% | $ | 1,769,585,481 | ||||||
* | Non-income producing security. |
† | Value determined based on Level 1 inputs — See Note 4. |
†† | Value determined based on Level 2 inputs — See Note 4. |
1 | All or portion of this security is on loan at October 31, 2016 — See Note 5. |
2 | Rate indicated is the 7 day yield as of October 31, 2016. |
3 | Securities lending collateral — See Note 5. |
plc — Public Limited Company | |
See Sector Classification in Other Information section. |
SEE NOTES TO FINANCIAL STATEMENTS. | GUGGENHEIM ETFs ANNUAL REPORT | 27 |
SCHEDULE OF INVESTMENTS (concluded) | October 31, 2016 |
GUGGENHEIM S&P 500® PURE GROWTH ETF |
The following table summarizes the inputs used to value the Fund’s investments at October 31, 2016 (See Note 4 in the Notes to Financial Statements):
Investments in Securities | Level 1 | Level 2 | Level 3 | Total | ||||||||||||
Common Stocks | $ | 1,763,869,504 | $ | — | $ | — | $ | 1,763,869,504 | ||||||||
Securities Lending Collateral | — | 39,871,125 | — | 39,871,125 | ||||||||||||
Short Term Investments | 4,537,039 | — | — | 4,537,039 | ||||||||||||
Total | $ | 1,768,406,543 | $ | 39,871,125 | $ | — | $ | 1,808,277,668 | ||||||||
Transfers between investment levels may occur as the markets fluctuate and/or the availability of data used in an investment’s valuation changes. Transfers between valuation levels, if any, are in comparison to the valuation levels at the end of the previous fiscal year, and are effective using the fair value as of the end of the previous fiscal period.
For the year ended October 31, 2016, there were no transfers between levels.
28 | GUGGENHEIM ETFs ANNUAL REPORT | SEE NOTES TO FINANCIAL STATEMENTS. |
SCHEDULE OF INVESTMENTS | October 31, 2016 |
GUGGENHEIM S&P MIDCAP 400® PURE VALUE ETF |
Shares | Value | |||||||
COMMON STOCKS† - 99.8% | ||||||||
Industrial - 25.0% | ||||||||
Joy Global, Inc. | 258,076 | $ | 7,182,254 | |||||
Terex Corp. | 148,981 | 3,557,666 | ||||||
Tech Data Corp.* | 42,634 | 3,283,671 | ||||||
Arrow Electronics, Inc.* | 49,493 | 3,025,013 | ||||||
Avnet, Inc. | 61,712 | 2,588,818 | ||||||
Greif, Inc. — Class A | 53,171 | 2,491,593 | ||||||
KLX, Inc.* | 60,921 | 2,096,901 | ||||||
Vishay Intertechnology, Inc.1 | 145,407 | 2,050,239 | ||||||
Oshkosh Corp. | 33,754 | 1,805,839 | ||||||
Triumph Group, Inc. | 75,846 | 1,797,550 | ||||||
AECOM* | 64,250 | 1,789,362 | ||||||
Jabil Circuit, Inc. | 81,007 | 1,728,689 | ||||||
Trinity Industries, Inc. | 76,246 | 1,627,852 | ||||||
AGCO Corp. | 31,319 | 1,599,775 | ||||||
EMCOR Group, Inc. | 24,365 | 1,473,108 | ||||||
Worthington Industries, Inc. | 22,635 | 1,063,845 | ||||||
Granite Construction, Inc. | 18,094 | 889,501 | ||||||
Regal Beloit Corp. | 13,835 | 817,649 | ||||||
GATX Corp.1 | 16,045 | 702,290 | ||||||
Total Industrial | 41,571,615 | |||||||
Financial - 15.1% | ||||||||
Reinsurance Group of America, Inc. — Class A | 25,916 | 2,795,300 | ||||||
Endurance Specialty Holdings Ltd.1 | 23,672 | 2,176,640 | ||||||
Aspen Insurance Holdings Ltd. | 33,880 | 1,634,710 | ||||||
Hancock Holding Co. | 47,451 | 1,591,981 | ||||||
Genworth Financial, Inc. — Class A*,1 | 368,058 | 1,523,760 | ||||||
Kemper Corp.1 | 38,074 | 1,429,679 | ||||||
Hanover Insurance Group, Inc. | 18,581 | 1,415,687 | ||||||
Everest Re Group Ltd. | 6,946 | 1,413,650 | ||||||
Senior Housing Properties Trust | 64,742 | 1,377,062 | ||||||
CNO Financial Group, Inc. | 88,125 | 1,328,925 | ||||||
Alleghany Corp.* | 2,245 | 1,158,891 | ||||||
First American Financial Corp. | 26,046 | 1,017,357 | ||||||
WR Berkley Corp. | 17,330 | 989,543 | ||||||
Associated Banc-Corp. | 42,223 | 857,127 | ||||||
Trustmark Corp.1 | 30,749 | 851,132 | ||||||
Umpqua Holdings Corp. | 49,570 | 757,430 | ||||||
Stifel Financial Corp.* | 19,266 | 754,071 | ||||||
Prosperity Bancshares, Inc.1 | 13,586 | 753,615 | ||||||
International Bancshares Corp. | 20,870 | 643,840 | ||||||
TCF Financial Corp. | 40,390 | 577,577 | ||||||
Total Financial | 25,047,977 | |||||||
Consumer, Cyclical - 13.9% | ||||||||
KB Home | 240,051 | 3,490,341 | ||||||
Ingram Micro, Inc. — Class A | 84,969 | 3,160,846 | ||||||
World Fuel Services Corp. | 56,434 | 2,271,469 | ||||||
CST Brands, Inc. | 46,554 | 2,235,523 | ||||||
GameStop Corp. — Class A1 | 74,422 | 1,789,849 | ||||||
Dana, Inc. | 102,918 | 1,593,171 | ||||||
Dick’s Sporting Goods, Inc. | 23,315 | 1,297,480 | ||||||
Big Lots, Inc.1 | 29,490 | 1,279,866 | ||||||
Fossil Group, Inc.*,1 | 40,590 | 1,106,889 | ||||||
Cabela’s, Inc.*,1 | 15,357 | 946,145 | ||||||
J.C. Penney Company, Inc.*,1 | 106,225 | 912,473 | ||||||
Deckers Outdoor Corp.* | 16,006 | 835,353 | ||||||
Office Depot, Inc. | 252,850 | 796,478 | ||||||
Ascena Retail Group, Inc.*,1 | 144,085 | 704,575 | ||||||
Guess?, Inc. | 50,425 | 680,738 | ||||||
Total Consumer, Cyclical | 23,101,196 | |||||||
Basic Materials - 12.4% | ||||||||
United States Steel Corp.1 | 252,629 | 4,885,844 | ||||||
Reliance Steel & Aluminum Co. | 44,518 | 3,061,948 | ||||||
Commercial Metals Co. | 190,511 | 2,992,928 | ||||||
Allegheny Technologies, Inc.1 | 216,354 | 2,951,069 | ||||||
Steel Dynamics, Inc. | 94,587 | 2,597,359 | ||||||
Domtar Corp. | 64,230 | 2,309,069 | ||||||
Olin Corp.1 | 41,694 | 914,349 | ||||||
Carpenter Technology Corp. | 27,272 | 862,068 | ||||||
Total Basic Materials | 20,574,634 | |||||||
Energy - 11.0% | ||||||||
WPX Energy, Inc.* | 292,336 | 3,174,768 | ||||||
SM Energy Co. | 76,231 | 2,563,649 | ||||||
CONSOL Energy, Inc.1 | 130,126 | 2,205,636 | ||||||
Diamond Offshore Drilling, Inc.1 | 118,508 | 1,954,197 | ||||||
Murphy USA, Inc.* | 26,469 | 1,820,539 | ||||||
Patterson-UTI Energy, Inc.1 | 71,036 | 1,596,889 | ||||||
Western Refining, Inc.1 | 36,378 | 1,049,505 | ||||||
NOW, Inc.*,1 | 46,474 | 1,001,979 | ||||||
Oil States International, Inc.* | 31,164 | 911,547 | ||||||
Noble Corporation plc1 | 144,075 | 711,731 | ||||||
HollyFrontier Corp. | 28,092 | 700,895 | ||||||
Rowan Companies plc — Class A | 36,579 | 485,403 | ||||||
Total Energy | 18,176,738 | |||||||
Consumer, Non-cyclical - 9.9% | ||||||||
United Natural Foods, Inc.*,1 | 60,242 | 2,514,501 | ||||||
Aaron’s, Inc.1 | 80,456 | 1,988,067 | ||||||
DeVry Education Group, Inc.1 | 80,917 | 1,836,817 | ||||||
ManpowerGroup, Inc. | 21,435 | 1,646,208 | ||||||
Owens & Minor, Inc. | 46,961 | 1,523,884 | ||||||
Graham Holdings Co. — Class B | 2,791 | 1,325,725 | ||||||
Dean Foods Co.1 | 71,643 | 1,308,201 | ||||||
LifePoint Health, Inc.* | 20,329 | 1,216,691 | ||||||
FTI Consulting, Inc.* | 29,876 | 1,163,969 | ||||||
Tenet Healthcare Corp.* | 49,641 | 978,424 | ||||||
Avis Budget Group, Inc.* | 28,057 | 907,925 | ||||||
Total Consumer, Non-cyclical | 16,410,412 | |||||||
Utilities - 6.3% | ||||||||
Talen Energy Corp.*,1 | 373,433 | 5,201,921 | ||||||
MDU Resources Group, Inc. | 80,419 | 2,107,782 | ||||||
Great Plains Energy, Inc. | 33,709 | 958,684 | ||||||
PNM Resources, Inc. | 24,112 | 792,079 | ||||||
ONE Gas, Inc. | 11,485 | 703,801 | ||||||
Hawaiian Electric Industries, Inc. | 22,285 | 657,408 | ||||||
Total Utilities | 10,421,675 | |||||||
SEE NOTES TO FINANCIAL STATEMENTS. | GUGGENHEIM ETFs ANNUAL REPORT | 29 |
SCHEDULE OF INVESTMENTS (concluded) | October 31, 2016 |
GUGGENHEIM S&P MIDCAP 400® PURE VALUE ETF |
Shares | Value | |||||||
Technology - 4.7% | ||||||||
Computer Sciences Corp. | 64,367 | $ | 3,504,783 | |||||
SYNNEX Corp. | 18,754 | 1,923,035 | ||||||
3D Systems Corp.*,1 | 103,993 | 1,442,383 | ||||||
Lexmark International, Inc. — Class A | 21,698 | 861,194 | ||||||
Total Technology | 7,731,395 | |||||||
Communications - 1.5% | ||||||||
Telephone & Data Systems, Inc. | 94,762 | 2,448,650 | ||||||
Total Common Stocks | ||||||||
(Cost $156,339,787) | 165,484,292 | |||||||
SHORT TERM INVESTMENTS† - 0.2% | ||||||||
Federated U.S. Treasury Cash Reserve Fund Institutional Shares, 0.18%2 | 256,688 | 256,688 | ||||||
Total Short Term Investments | ||||||||
(Cost $256,688) | 256,688 | |||||||
Face | ||||||||
SECURITIES LENDING COLLATERAL††,3 – 13.5% | ||||||||
Joint Repurchase Agreements | ||||||||
Citigroup Global Markets, Inc. | $ | 5,219,666 | 5,219,666 | |||||
BNP Paribas Securities Corp. | 5,219,666 | 5,219,666 | ||||||
Merrill Lynch, Pierce, Fenner & Smith, Inc. | 5,219,666 | 5,219,666 | ||||||
HSBC Securities (USA), Inc. | 5,219,666 | 5,219,666 | ||||||
Credit Suisse Securities (USA), LLC | 1,540,367 | 1,540,367 | ||||||
Total Securities Lending Collateral | ||||||||
(Cost $22,419,031) | 22,419,031 | |||||||
Total Investments - 113.5% | ||||||||
(Cost $179,015,506) | $ | 188,160,011 | ||||||
Other Assets & Liabilities, net - (13.5)% | (22,406,630 | ) | ||||||
Total Net Assets - 100.0% | $ | 165,753,381 | ||||||
* | Non-income producing security. |
† | Value determined based on Level 1 inputs — See Note 4. |
†† | Value determined based on Level 2 inputs — See Note 4. |
1 | All or portion of this security is on loan at October 31, 2016 — See Note 5. |
2 | Rate indicated is the 7 day yield as of October 31, 2016. |
3 | Securities lending collateral — See Note 5. |
plc — Public Limited Company | |
See Sector Classification in Other Information section. |
The following table summarizes the inputs used to value the Fund’s investments at October 31, 2016 (See Note 4 in the Notes to Financial Statements):
Investments in Securities | Level 1 | Level 2 | Level 3 | Total | ||||||||||||
Common Stocks | $ | 165,484,292 | $ | — | $ | — | $ | 165,484,292 | ||||||||
Securities Lending Collateral | — | 22,419,031 | — | 22,419,031 | ||||||||||||
Short Term Investments | 256,688 | — | — | 256,688 | ||||||||||||
Total | $ | 165,740,980 | $ | 22,419,031 | $ | — | $ | 188,160,011 | ||||||||
Transfers between investment levels may occur as the markets fluctuate and/or the availability of data used in an investment’s valuation changes. Transfers between valuation levels, if any, are in comparison to the valuation levels at the end of the previous fiscal year, and are effective using the fair value as of the end of the previous fiscal period.
For the year ended October 31, 2016, there were no transfers between levels.
30 | GUGGENHEIM ETFs ANNUAL REPORT | SEE NOTES TO FINANCIAL STATEMENTS. |
SCHEDULE OF INVESTMENTS | October 31, 2016 |
GUGGENHEIM S&P MIDCAP 400® PURE GROWTH ETF |
Shares | Value | |||||||
COMMON STOCKS† - 99.9% | ||||||||
Technology - 26.0% | ||||||||
Convergys Corp. | 429,639 | $ | 12,545,458 | |||||
Cirrus Logic, Inc.* | 173,504 | 9,365,746 | ||||||
Ultimate Software Group, Inc.* | 43,312 | 9,138,399 | ||||||
j2 Global, Inc.1 | 122,606 | 8,723,417 | ||||||
ACI Worldwide, Inc.* | 394,993 | 7,157,273 | ||||||
Fortinet, Inc.* | 221,900 | 7,114,114 | ||||||
Fair Isaac Corp. | 57,261 | 6,910,258 | ||||||
Synaptics, Inc.*,1 | 127,595 | 6,650,251 | ||||||
Microsemi Corp.* | 156,363 | 6,587,573 | ||||||
IPG Photonics Corp.* | 65,853 | 6,388,400 | ||||||
Integrated Device Technology, Inc.* | 303,102 | 6,277,242 | ||||||
Tyler Technologies, Inc.* | 38,458 | 6,168,664 | ||||||
MAXIMUS, Inc. | 118,326 | 6,160,051 | ||||||
Monolithic Power Systems, Inc. | 77,013 | 6,069,395 | ||||||
MSCI, Inc. — Class A | 71,280 | 5,715,943 | ||||||
Manhattan Associates, Inc.* | 109,757 | 5,558,094 | ||||||
Jack Henry & Associates, Inc. | 54,201 | 4,391,365 | ||||||
Broadridge Financial Solutions, Inc. | 60,692 | 3,924,345 | ||||||
Cadence Design Systems, Inc.* | 143,331 | 3,666,407 | ||||||
CDK Global, Inc. | 66,562 | 3,634,951 | ||||||
DST Systems, Inc. | 34,519 | 3,319,347 | ||||||
Total Technology | 135,466,693 | |||||||
Consumer, Non-cyclical - 23.9% | ||||||||
ABIOMED, Inc.* | 117,228 | 12,307,768 | ||||||
MarketAxess Holdings, Inc. | 71,170 | 10,729,589 | ||||||
Post Holdings, Inc.* | 133,874 | 10,205,215 | ||||||
WhiteWave Foods Co. — Class A* | 132,925 | 7,243,083 | ||||||
Sprouts Farmers Market, Inc.*,1 | 316,196 | 7,003,741 | ||||||
NuVasive, Inc.* | 117,200 | 7,000,357 | ||||||
Amsurg Corp. — Class A*,1 | 109,845 | 6,563,239 | ||||||
Align Technology, Inc.* | 71,719 | 6,162,096 | ||||||
United Therapeutics Corp.*,1 | 46,951 | 5,637,407 | ||||||
Prestige Brands Holdings, Inc.* | 112,998 | 5,116,550 | ||||||
Helen of Troy Ltd.* | 57,465 | 4,683,398 | ||||||
Service Corporation International | 167,467 | 4,287,155 | ||||||
PAREXEL International Corp.* | 72,055 | 4,197,924 | ||||||
VCA, Inc.* | 61,921 | 3,805,665 | ||||||
MEDNAX, Inc.* | 61,717 | 3,780,166 | ||||||
CEB, Inc. | 70,637 | 3,436,490 | ||||||
Rollins, Inc. | 110,913 | 3,418,339 | ||||||
Gartner, Inc.* | 39,061 | 3,360,808 | ||||||
STERIS plc | 40,154 | 2,683,090 | ||||||
Bio-Techne Corp. | 24,757 | 2,574,480 | ||||||
Akorn, Inc.* | 102,694 | 2,459,521 | ||||||
Charles River Laboratories International, Inc.* | 32,133 | 2,438,252 | ||||||
LivaNova plc*,1 | 41,537 | 2,354,317 | ||||||
Flowers Foods, Inc.1 | 149,307 | 2,317,245 | ||||||
Total Consumer, Non-cyclical | 123,765,895 | |||||||
Financial - 19.3% | ||||||||
Alexander & Baldwin, Inc. | 291,543 | 12,183,582 | ||||||
PrivateBancorp, Inc. — Class A | 162,123 | 7,334,445 | ||||||
WisdomTree Investments, Inc.1 | 834,592 | 7,160,799 | ||||||
Old Republic International Corp. | 422,659 | 7,126,031 | ||||||
Lamar Advertising Co. — Class A | 105,255 | 6,678,429 | ||||||
Equity One, Inc. | 224,007 | 6,384,200 | ||||||
Bank of the Ozarks, Inc. | 158,129 | 5,844,447 | ||||||
SEI Investments Co. | 125,149 | 5,547,855 | ||||||
Signature Bank* | 45,830 | 5,525,265 | ||||||
Education Realty Trust, Inc. | 129,709 | 5,524,306 | ||||||
First Horizon National Corp. | 323,665 | 4,987,678 | ||||||
Weingarten Realty Investors | 135,873 | 4,919,961 | ||||||
SVB Financial Group* | 39,341 | 4,810,224 | ||||||
Communications Sales & Leasing, Inc. | 143,964 | 4,092,897 | ||||||
CBOE Holdings, Inc. | 58,415 | 3,692,412 | ||||||
Healthcare Realty Trust, Inc. | 101,758 | 3,245,063 | ||||||
Jones Lang LaSalle, Inc. | 25,767 | 2,495,534 | ||||||
Life Storage, Inc. | 30,787 | 2,482,972 | ||||||
Total Financial | 100,036,100 | |||||||
Consumer, Cyclical - 16.2% | ||||||||
Skechers U.S.A., Inc. — Class A*,1 | 435,040 | 9,148,891 | ||||||
NVR, Inc.* | 5,448 | 8,297,304 | ||||||
Churchill Downs, Inc.1 | 55,879 | 7,599,544 | ||||||
Vista Outdoor, Inc.* | 176,045 | 6,807,660 | ||||||
Tempur Sealy International, Inc.*,1 | 124,973 | 6,757,290 | ||||||
Pool Corp. | 64,114 | 5,935,674 | ||||||
Wendy’s Co.1 | 514,856 | 5,581,040 | ||||||
Toll Brothers, Inc.* | 173,845 | 4,770,307 | ||||||
Domino’s Pizza, Inc. | 27,456 | 4,646,653 | ||||||
JetBlue Airways Corp.* | 246,607 | 4,310,690 | ||||||
Toro Co. | 81,458 | 3,900,209 | ||||||
Buffalo Wild Wings, Inc.*,1 | 26,496 | 3,859,142 | ||||||
Restoration Hardware Holdings, Inc.*,1 | 121,372 | 3,516,147 | ||||||
Panera Bread Co. — Class A*,1 | 16,610 | 3,168,524 | ||||||
Carter’s, Inc. | 33,654 | 2,905,686 | ||||||
Dunkin’ Brands Group, Inc.1 | 53,736 | 2,598,673 | ||||||
Total Consumer, Cyclical | 83,803,434 | |||||||
Industrial - 8.2% | ||||||||
Dycom Industries, Inc.*,1 | 110,890 | 8,530,768 | ||||||
AO Smith Corp. | 160,219 | 7,237,092 | ||||||
Packaging Corporation of America | 78,043 | 6,438,548 | ||||||
Lennox International, Inc. | 42,953 | 6,266,413 | ||||||
Eagle Materials, Inc. | 67,188 | 5,440,212 | ||||||
Zebra Technologies Corp. — Class A* | 76,844 | 5,059,409 | ||||||
Cognex Corp. | 68,735 | 3,546,726 | ||||||
Total Industrial | 42,519,168 | |||||||
Communications - 6.3% | ||||||||
WebMD Health Corp. — Class A*,1 | 208,373 | 10,237,366 | ||||||
ARRIS International plc* | 358,148 | 9,949,352 | ||||||
AMC Networks, Inc. — Class A* | 102,352 | 5,008,083 | ||||||
Ciena Corp.* | 200,859 | 3,892,647 | ||||||
SEE NOTES TO FINANCIAL STATEMENTS. | GUGGENHEIM ETFs ANNUAL REPORT | 31 |
SCHEDULE OF INVESTMENTS (concluded) | October 31, 2016 |
GUGGENHEIM S&P MIDCAP 400® PURE GROWTH ETF |
Shares | Value | |||||||
FactSet Research Systems, Inc. | 21,970 | $ | 3,399,198 | |||||
Total Communications | 32,486,646 | |||||||
Total Common Stocks | ||||||||
(Cost $527,258,377) | 518,077,936 | |||||||
SHORT TERM INVESTMENTS† - 0.1% | ||||||||
Federated U.S. Treasury Cash Reserve Fund Institutional Shares, 0.18%2 | 571,867 | 571,867 | ||||||
Total Short Term Investments | ||||||||
(Cost $571,867) | 571,867 | |||||||
Face | ||||||||
SECURITIES LENDING COLLATERAL††,3 – 10.1% | ||||||||
Joint Repurchase Agreements | ||||||||
Citigroup Global Markets, Inc. | $ | 12,235,034 | 12,235,034 | |||||
BNP Paribas Securities Corp. | 12,235,034 | 12,235,034 | ||||||
Merrill Lynch, Pierce, Fenner & Smith, Inc. | 12,235,034 | 12,235,034 | ||||||
HSBC Securities (USA), Inc. | 12,235,034 | 12,235,034 | ||||||
Credit Suisse Securities (USA), LLC | 3,610,524 | 3,610,524 | ||||||
Total Securities Lending Collateral | ||||||||
(Cost $52,550,660) | 52,550,660 | |||||||
Total Investments - 110.1% | ||||||||
(Cost $580,380,904) | $ | 571,200,463 | ||||||
Other Assets & Liabilities, net - (10.1)% | (52,580,768 | ) | ||||||
Total Net Assets - 100.0% | $ | 518,619,695 | ||||||
* | Non-income producing security. |
† | Value determined based on Level 1 inputs — See Note 4. |
†† | Value determined based on Level 2 inputs — See Note 4. |
1 | All or portion of this security is on loan at October 31, 2016 — See Note 5. |
2 | Rate indicated is the 7 day yield as of October 31, 2016. |
3 | Securities lending collateral — See Note 5. |
plc — Public Limited Company | |
See Sector Classification in Other Information section. |
The following table summarizes the inputs used to value the Fund’s investments at October 31, 2016 (See Note 4 in the Notes to Financial Statements):
Investments in Securities | Level 1 | Level 2 | Level 3 | Total | ||||||||||||
Common Stocks | $ | 518,077,936 | $ | — | $ | — | $ | 518,077,936 | ||||||||
Securities Lending Collateral | — | 52,550,660 | — | 52,550,660 | ||||||||||||
Short Term Investments | 571,867 | — | — | 571,867 | ||||||||||||
Total | $ | 518,649,803 | $ | 52,550,660 | $ | — | $ | 571,200,463 | ||||||||
Transfers between investment levels may occur as the markets fluctuate and/or the availability of data used in an investment’s valuation changes. Transfers between valuation levels, if any, are in comparison to the valuation levels at the end of the previous fiscal year, and are effective using the fair value as of the end of the previous fiscal period.
For the year ended October 31, 2016, there were no transfers between levels.
32 | GUGGENHEIM ETFs ANNUAL REPORT | SEE NOTES TO FINANCIAL STATEMENTS. |
SCHEDULE OF INVESTMENTS | October 31, 2016 |
GUGGENHEIM S&P SMALLCAP 600® PURE VALUE ETF |
Shares | Value | |||||||
COMMON STOCKS† - 99.9% | ||||||||
Industrial - 26.1% | ||||||||
Orion Group Holdings, Inc.* | 466,942 | $ | 3,772,890 | |||||
SPX Corp.* | 188,606 | 3,585,400 | ||||||
TTM Technologies, Inc.* | 228,634 | 3,006,537 | ||||||
Chart Industries, Inc.* | 90,361 | 2,506,614 | ||||||
Sanmina Corp.* | 87,747 | 2,426,204 | ||||||
Benchmark Electronics, Inc.* | 95,790 | 2,409,119 | ||||||
MYR Group, Inc.* | 80,598 | 2,405,044 | ||||||
Bel Fuse, Inc. — Class B | 95,277 | 2,272,356 | ||||||
TimkenSteel Corp.* | 201,154 | 2,061,829 | ||||||
Saia, Inc.* | 53,358 | 1,902,212 | ||||||
Atlas Air Worldwide Holdings, Inc.* | 43,669 | 1,827,548 | ||||||
ArcBest Corp. | 89,508 | 1,781,209 | ||||||
Roadrunner Transportation Systems, Inc.* | 228,271 | 1,734,860 | ||||||
Greenbrier Companies, Inc. | 54,805 | 1,726,358 | ||||||
Olympic Steel, Inc. | 65,643 | 1,515,697 | ||||||
Plexus Corp.* | 32,611 | 1,493,910 | ||||||
Celadon Group, Inc. | 181,360 | 1,178,840 | ||||||
AAR Corp. | 36,214 | 1,165,004 | ||||||
Briggs & Stratton Corp. | 61,536 | 1,145,800 | ||||||
Powell Industries, Inc. | 32,271 | 1,142,071 | ||||||
LSB Industries, Inc.*,1 | 204,441 | 1,081,493 | ||||||
SPX FLOW, Inc.* | 42,271 | 1,060,579 | ||||||
Hub Group, Inc. — Class A* | 28,067 | 1,023,043 | ||||||
Echo Global Logistics, Inc.* | 42,002 | 890,442 | ||||||
Boise Cascade Co.* | 41,133 | 791,810 | ||||||
Kaman Corp. | 15,735 | 686,990 | ||||||
Aegion Corp. — Class A* | 35,901 | 664,528 | ||||||
Marten Transport Ltd. | 30,503 | 625,312 | ||||||
Hornbeck Offshore Services, Inc.*,1 | 144,369 | 573,145 | ||||||
Astec Industries, Inc. | 9,775 | 541,144 | ||||||
Applied Industrial Technologies, Inc. | 10,517 | 534,264 | ||||||
Tredegar Corp. | 26,572 | 491,582 | ||||||
Haynes International, Inc. | 13,822 | 444,654 | ||||||
Tidewater, Inc.1 | 91,193 | 157,764 | ||||||
Total Industrial | 50,626,252 | |||||||
Consumer, Cyclical - 25.8% | ||||||||
EZCORP, Inc. — Class A* | 381,030 | 3,715,043 | ||||||
SkyWest, Inc. | 106,889 | 3,222,703 | ||||||
Big 5 Sporting Goods Corp. | 204,877 | 3,175,594 | ||||||
Veritiv Corp.* | 39,255 | 2,117,807 | ||||||
Barnes & Noble Education, Inc.* | 204,150 | 1,900,637 | ||||||
Shoe Carnival, Inc. | 73,884 | 1,874,436 | ||||||
Finish Line, Inc. — Class A | 94,671 | 1,864,072 | ||||||
Zumiez, Inc.*,1 | 78,129 | 1,738,370 | ||||||
Titan International, Inc. | 169,557 | 1,727,786 | ||||||
Iconix Brand Group, Inc.*,1 | 217,600 | 1,714,688 | ||||||
Tailored Brands, Inc.1 | 102,387 | 1,617,715 | ||||||
ScanSource, Inc.* | 42,858 | 1,500,030 | ||||||
Anixter International, Inc.* | 21,358 | 1,404,289 | ||||||
Stage Stores, Inc.1 | 275,346 | 1,401,511 | ||||||
Genesco, Inc.* | 25,629 | 1,378,840 | ||||||
Perry Ellis International, Inc.* | 67,084 | 1,247,092 | ||||||
Barnes & Noble, Inc. | 114,167 | 1,175,920 | ||||||
Tuesday Morning Corp.* | 235,976 | 1,168,082 | ||||||
Abercrombie & Fitch Co. — Class A | 79,070 | 1,155,213 | ||||||
Ruby Tuesday, Inc.* | 351,373 | 1,043,578 | ||||||
Sonic Automotive, Inc. — Class A | 57,769 | 1,034,065 | ||||||
Group 1 Automotive, Inc. | 16,478 | 993,129 | ||||||
Superior Industries International, Inc. | 40,330 | 988,085 | ||||||
Lumber Liquidators Holdings, Inc.*,1 | 63,532 | 985,381 | ||||||
Children’s Place, Inc. | 12,126 | 920,970 | ||||||
Biglari Holdings, Inc.* | 1,928 | 844,811 | ||||||
Caleres, Inc. | 32,075 | 802,196 | ||||||
Kirkland’s, Inc.* | 61,068 | 745,640 | ||||||
Stein Mart, Inc. | 123,464 | 743,253 | ||||||
Wolverine World Wide, Inc. | 33,028 | 705,148 | ||||||
Fred’s, Inc. — Class A | 75,503 | 689,342 | ||||||
Arctic Cat, Inc.1 | 43,156 | 646,908 | ||||||
Essendant, Inc. | 41,617 | 638,821 | ||||||
Regis Corp.* | 44,039 | 558,415 | ||||||
Vitamin Shoppe, Inc.* | 19,921 | 499,021 | ||||||
Unifi, Inc.* | 16,095 | 462,731 | ||||||
Movado Group, Inc. | 20,038 | 441,838 | ||||||
Vera Bradley, Inc.* | 32,081 | 428,923 | ||||||
Daktronics, Inc. | 51,337 | 428,664 | ||||||
Express, Inc.* | 29,760 | 357,715 | ||||||
Total Consumer, Cyclical | 50,058,462 | |||||||
Consumer, Non-cyclical - 15.0% | ||||||||
Kelly Services, Inc. — Class A | 140,479 | 2,631,171 | ||||||
SpartanNash Co. | 90,283 | 2,527,924 | ||||||
Seneca Foods Corp. — Class A* | 81,573 | 2,398,246 | ||||||
Andersons, Inc. | 50,919 | 1,937,468 | ||||||
Rent-A-Center, Inc. | 186,349 | 1,880,261 | ||||||
Darling Ingredients, Inc.* | 134,746 | 1,832,546 | ||||||
ABM Industries, Inc. | 43,607 | 1,704,162 | ||||||
Magellan Health, Inc.* | 28,366 | 1,459,431 | ||||||
Community Health Systems, Inc.* | 250,404 | 1,322,133 | ||||||
Universal Corp. | 22,817 | 1,236,681 | ||||||
Central Garden & Pet Co. — Class A* | 48,717 | 1,137,054 | ||||||
Kindred Healthcare, Inc. | 111,555 | 1,098,817 | ||||||
Select Medical Holdings Corp.* | 84,203 | 1,094,639 | ||||||
AngioDynamics, Inc.* | 64,184 | 1,023,093 | ||||||
CDI Corp. | 165,858 | 1,020,027 | ||||||
Sanderson Farms, Inc.1 | 11,166 | 1,004,717 | ||||||
Healthways, Inc.* | 34,388 | 852,822 | ||||||
Viad Corp. | 18,030 | 748,245 | ||||||
Green Dot Corp. — Class A* | 28,021 | 622,066 | ||||||
PharMerica Corp.* | 17,427 | 414,763 | ||||||
Central Garden & Pet Co.* | 14,733 | 358,307 | ||||||
RR Donnelley & Sons Co. | 19,572 | 347,403 | ||||||
Invacare Corp. | 34,514 | 315,803 | ||||||
LSC Communications, Inc. | 7,342 | 177,970 | ||||||
Total Consumer, Non-cyclical | 29,145,749 | |||||||
Energy - 11.9% | ||||||||
Archrock, Inc. | 230,166 | 2,669,925 | ||||||
Cloud Peak Energy, Inc.* | 399,306 | 2,459,725 | ||||||
Exterran Corp.* | 150,585 | 2,380,749 | ||||||
SEE NOTES TO FINANCIAL STATEMENTS. | GUGGENHEIM ETFs ANNUAL REPORT | 33 |
SCHEDULE OF INVESTMENTS (continued) | October 31, 2016 |
GUGGENHEIM S&P SMALLCAP 600® PURE VALUE ETF |
Shares | Value | |||||||
SunCoke Energy, Inc.* | 212,094 | $ | 2,165,480 | |||||
Green Plains, Inc. | 82,456 | 2,143,856 | ||||||
Helix Energy Solutions Group, Inc.* | 227,138 | 1,980,643 | ||||||
Gulf Island Fabrication, Inc. | 177,033 | 1,770,330 | ||||||
Atwood Oceanics, Inc.1 | 223,522 | 1,705,473 | ||||||
Newpark Resources, Inc.* | 232,238 | 1,463,099 | ||||||
SEACOR Holdings, Inc.*,1 | 20,366 | 1,004,247 | ||||||
Pioneer Energy Services Corp.* | 280,016 | 994,057 | ||||||
Era Group, Inc.* | 124,794 | 942,195 | ||||||
REX American Resources Corp.* | 11,233 | 887,295 | ||||||
Bristow Group, Inc.1 | 43,568 | 436,116 | ||||||
Total Energy | 23,003,190 | |||||||
Financial - 8.2% | ||||||||
Enova International, Inc.* | 244,605 | 2,299,286 | ||||||
Piper Jaffray Cos.* | 30,979 | 1,751,861 | ||||||
First BanCorp* | 325,126 | 1,667,896 | ||||||
World Acceptance Corp.* | 31,175 | 1,481,436 | ||||||
International. FCStone, Inc.* | 38,855 | 1,394,895 | ||||||
OFG Bancorp | 124,228 | 1,323,028 | ||||||
Calamos Asset Management, Inc. — Class A | 146,923 | 949,123 | ||||||
Stewart Information Services Corp. | 18,268 | 821,147 | ||||||
Infinity Property & Casualty Corp. | 9,862 | 808,191 | ||||||
Capstead Mortgage Corp. | 82,868 | 788,075 | ||||||
Horace Mann Educators Corp. | 19,587 | 704,153 | ||||||
Navigators Group, Inc. | 7,400 | 689,680 | ||||||
American Equity Investment Life Holding Co. | 32,658 | 585,558 | ||||||
Encore Capital Group, Inc.*,1 | 26,376 | 523,564 | ||||||
Total Financial | 15,787,893 | |||||||
Basic Materials - 7.5% | ||||||||
Century Aluminum Co.* | 695,873 | 5,086,831 | ||||||
Chemours Co. | 191,636 | 3,148,579 | ||||||
PH Glatfelter Co. | 83,072 | 1,845,860 | ||||||
Materion Corp. | 42,473 | 1,286,932 | ||||||
Innophos Holdings, Inc. | 17,826 | 817,144 | ||||||
A. Schulman, Inc. | 25,473 | 732,349 | ||||||
Clearwater Paper Corp.* | 13,081 | 694,601 | ||||||
Stepan Co. | 9,138 | 649,072 | ||||||
Intrepid Potash, Inc.* | 303,668 | 315,815 | ||||||
Total Basic Materials | 14,577,183 | |||||||
Technology - 3.1% | ||||||||
Insight Enterprises, Inc.* | 59,987 | 1,727,026 | ||||||
ManTech International Corp. — Class A | 27,510 | 1,068,213 | ||||||
Engility Holdings, Inc.* | 25,206 | 724,168 | ||||||
Kulicke & Soffa Industries, Inc.* | 47,706 | 631,627 | ||||||
Ciber, Inc.* | 582,484 | 594,134 | ||||||
CACI International, Inc. — Class A* | 5,644 | 552,265 | ||||||
Brooks Automation, Inc. | 35,618 | 464,103 | ||||||
Donnelley Financial Solutions, Inc.* | 7,342 | 157,486 | ||||||
Total Technology | 5,919,022 | |||||||
Communications - 2.3% | ||||||||
Iridium Communications, Inc.*,1 | 122,309 | 996,818 | ||||||
Black Box Corp. | 65,290 | 750,835 | ||||||
Blucora, Inc.* | 55,467 | 737,711 | ||||||
FTD Companies, Inc.* | 30,855 | 620,803 | ||||||
Scholastic Corp. | 13,365 | 511,211 | ||||||
Comtech Telecommunications Corp. | 48,640 | 505,856 | ||||||
Gannett Company, Inc. | 37,697 | 292,906 | ||||||
Total Communications | 4,416,140 | |||||||
Total Common Stocks | ||||||||
(Cost $186,538,953) | 193,533,891 | |||||||
SHORT TERM INVESTMENTS† - 0.1% | ||||||||
Federated U.S. Treasury Cash Reserve Fund Institutional Shares, 0.18%2 | 114,757 | 114,757 | ||||||
Total Short Term Investments | ||||||||
(Cost $114,757) | 114,757 | |||||||
Face | ||||||||
SECURITIES LENDING COLLATERAL††,3 – 6.5% | ||||||||
Joint Repurchase Agreements | ||||||||
Citigroup Global Markets, Inc. | $ | 2,927,698 | 2,927,698 | |||||
BNP Paribas Securities Corp. | 2,927,698 | 2,927,698 | ||||||
Merrill Lynch, Pierce, Fenner & Smith, Inc. | 2,927,698 | 2,927,698 | ||||||
HSBC Securities (USA), Inc. | 2,927,698 | 2,927,698 | ||||||
Credit Suisse Securities (USA), LLC | 863,366 | 863,366 | ||||||
Total Securities Lending Collateral | ||||||||
(Cost $12,574,158) | 12,574,158 | |||||||
Total Investments - 106.5% | ||||||||
(Cost $199,227,868) | $ | 206,222,806 | ||||||
Other Assets & Liabilities, net - (6.5)% | (12,557,865 | ) | ||||||
Total Net Assets - 100.0% | $ | 193,664,941 | ||||||
34 | GUGGENHEIM ETFs ANNUAL REPORT | SEE NOTES TO FINANCIAL STATEMENTS. |
SCHEDULE OF INVESTMENTS (concluded) | October 31, 2016 |
GUGGENHEIM S&P SMALLCAP 600® PURE VALUE ETF |
* | Non-income producing security. |
† | Value determined based on Level 1 inputs — See Note 4. |
†† | Value determined based on Level 2 inputs — See Note 4. |
1 | All or portion of this security is on loan at October 31, 2016 — See Note 5. |
2 | Rate indicated is the 7 day yield as of October 31, 2016. |
3 | Securities lending collateral — See Note 5. |
See Sector Classification in Other Information section. |
The following table summarizes the inputs used to value the Fund’s investments at October 31, 2016 (See Note 4 in the Notes to Financial Statements):
Investments in Securities | Level 1 | Level 2 | Level 3 | Total | ||||||||||||
Common Stocks | $ | 193,533,891 | $ | — | $ | — | $ | 193,533,891 | ||||||||
Securities Lending Collateral | — | 12,574,158 | — | 12,574,158 | ||||||||||||
Short Term Investments | 114,757 | — | — | 114,757 | ||||||||||||
Total | $ | 193,648,648 | $ | 12,574,158 | $ | — | $ | 206,222,806 | ||||||||
Transfers between investment levels may occur as the markets fluctuate and/or the availability of data used in an investment’s valuation changes. Transfers between valuation levels, if any, are in comparison to the valuation levels at the end of the previous fiscal year, and are effective using the fair value as of the end of the previous fiscal period.
For the year ended October 31, 2016, there were no transfers between levels.
SEE NOTES TO FINANCIAL STATEMENTS. | GUGGENHEIM ETFs ANNUAL REPORT | 35 |
SCHEDULE OF INVESTMENTS | October 31, 2016 |
GUGGENHEIM S&P SMALLCAP 600® PURE GROWTH ETF |
Shares | Value | |||||||
COMMON STOCKS† - 99.9% | ||||||||
Consumer, Non-cyclical - 33.2% | ||||||||
Supernus Pharmaceuticals, Inc.*,1 | 130,092 | $ | 2,575,821 | |||||
Ligand Pharmaceuticals, Inc. — Class B*,1 | 24,329 | 2,329,015 | ||||||
Depomed, Inc.*,1 | 92,700 | 2,072,772 | ||||||
NutriSystem, Inc. | 55,995 | 1,775,042 | ||||||
Eagle Pharmaceuticals, Inc.*,1 | 31,383 | 1,753,682 | ||||||
Zeltiq Aesthetics, Inc.*,1 | 50,761 | 1,680,189 | ||||||
MiMedx Group, Inc.*,1 | 183,508 | 1,635,056 | ||||||
Masimo Corp.* | 29,193 | 1,605,615 | ||||||
AMN Healthcare Services, Inc.* | 47,536 | 1,559,181 | ||||||
LendingTree, Inc.*,1 | 19,072 | 1,522,899 | ||||||
BioTelemetry, Inc.* | 79,327 | 1,404,088 | ||||||
Vascular Solutions, Inc.* | 29,684 | 1,353,591 | ||||||
On Assignment, Inc.* | 35,692 | 1,228,162 | ||||||
Almost Family, Inc.* | 30,284 | 1,188,647 | ||||||
Repligen Corp.* | 41,107 | 1,174,427 | ||||||
Cantel Medical Corp. | 16,456 | 1,172,161 | ||||||
Cross Country Healthcare, Inc.* | 103,298 | 1,153,839 | ||||||
Cynosure, Inc. — Class A* | 25,583 | 1,091,115 | ||||||
Emergent BioSolutions, Inc.* | 38,386 | 1,025,674 | ||||||
Surgical Care Affiliates, Inc.* | 23,381 | 1,000,473 | ||||||
Cal-Maine Foods, Inc.1 | 25,380 | 980,937 | ||||||
Albany Molecular Research, Inc.*,1 | 62,499 | 974,359 | ||||||
Merit Medical Systems, Inc.* | 43,679 | 958,754 | ||||||
Cambrex Corp.* | 23,298 | 938,909 | ||||||
TrueBlue, Inc.* | 53,367 | 933,923 | ||||||
Neogen Corp.* | 17,303 | 911,696 | ||||||
Calavo Growers, Inc. | 15,311 | 905,646 | ||||||
US Physical Therapy, Inc. | 15,501 | 882,007 | ||||||
Natus Medical, Inc.* | 22,138 | 871,130 | ||||||
Amphastar Pharmaceuticals, Inc.*,1 | 47,262 | 857,333 | ||||||
Surmodics, Inc.* | 34,021 | 847,123 | ||||||
Lannett Company, Inc.*,1 | 38,344 | 839,734 | ||||||
Matthews International Corp. — Class A | 13,919 | 833,748 | ||||||
Heidrick & Struggles International, Inc. | 43,492 | 804,602 | ||||||
B&G Foods, Inc. | 18,965 | 804,116 | ||||||
Nektar Therapeutics*,1 | 61,770 | 765,948 | ||||||
Chemed Corp. | 5,245 | 741,748 | ||||||
LHC Group, Inc.* | 20,672 | 708,429 | ||||||
Luminex Corp.* | 33,146 | 690,431 | ||||||
Monro Muffler Brake, Inc.1 | 11,734 | 645,370 | ||||||
Integra LifeSciences Holdings Corp.* | 7,949 | 632,025 | ||||||
Healthcare Services Group, Inc. | 16,355 | 604,644 | ||||||
WD-40 Co. | 5,498 | 586,224 | ||||||
Korn/Ferry International | 27,064 | 551,835 | ||||||
CorVel Corp.* | 12,921 | 446,421 | ||||||
Phibro Animal Health Corp. — Class A | 12,091 | 313,761 | ||||||
Impax Laboratories, Inc.* | 13,734 | 276,053 | ||||||
Acorda Therapeutics, Inc.* | 13,379 | 236,808 | ||||||
Total Consumer, Non-cyclical | 50,845,163 | |||||||
Financial - 19.2% | ||||||||
First Midwest Bancorp, Inc. | 101,337 | 1,956,817 | ||||||
CoreSite Realty Corp. | 24,156 | 1,781,263 | ||||||
Ameris Bancorp | 46,486 | 1,687,443 | ||||||
Home BancShares, Inc. | 72,152 | 1,551,990 | ||||||
Universal Insurance Holdings, Inc.1 | 72,693 | 1,548,361 | ||||||
Employers Holdings, Inc. | 42,969 | 1,347,078 | ||||||
Walker & Dunlop, Inc.* | 55,061 | 1,325,318 | ||||||
Hanmi Financial Corp. | 48,055 | 1,201,375 | ||||||
BofI Holding, Inc.*,1 | 62,809 | 1,170,132 | ||||||
Pinnacle Financial Partners, Inc. | 22,504 | 1,161,206 | ||||||
Simmons First National Corp. — Class A | 23,121 | 1,141,021 | ||||||
Acadia Realty Trust | 30,723 | 1,035,058 | ||||||
Opus Bank | 51,456 | 1,031,693 | ||||||
Evercore Partners, Inc. — Class A | 19,130 | 1,028,238 | ||||||
Four Corners Property Trust, Inc. | 50,503 | 1,014,100 | ||||||
LegacyTexas Financial Group, Inc. | 29,508 | 1,009,469 | ||||||
Northfield Bancorp, Inc.1 | 61,131 | 1,005,605 | ||||||
ServisFirst Bancshares, Inc.1 | 18,091 | 979,447 | ||||||
Bank Mutual Corp. | 124,849 | 973,822 | ||||||
AMERISAFE, Inc. | 14,485 | 805,366 | ||||||
Hope Bancorp, Inc. | 45,808 | 739,341 | ||||||
HFF, Inc. — Class A | 27,140 | 722,738 | ||||||
Banner Corp. | 14,796 | 667,891 | ||||||
First Financial Bankshares, Inc.1 | 18,353 | 664,379 | ||||||
Financial Engines, Inc.1 | 23,942 | 661,996 | ||||||
RLI Corp. | 10,646 | 593,408 | ||||||
Retail Opportunity Investments Corp. | 27,991 | 562,899 | ||||||
Total Financial | 29,367,454 | |||||||
Industrial - 17.4% | ||||||||
Fabrinet* | 61,370 | 2,329,606 | ||||||
II-VI, Inc.* | 66,504 | 1,848,811 | ||||||
PGT, Inc.* | 188,449 | 1,846,800 | ||||||
TASER International, Inc.*,1 | 79,998 | 1,790,355 | ||||||
Headwaters, Inc.* | 91,950 | 1,507,980 | ||||||
Lydall, Inc.* | 32,176 | 1,504,228 | ||||||
Drew Industries, Inc. | 16,543 | 1,481,426 | ||||||
Universal Forest Products, Inc. | 16,169 | 1,390,372 | ||||||
John Bean Technologies Corp. | 16,891 | 1,348,746 | ||||||
US Concrete, Inc.*,1 | 25,695 | 1,282,181 | ||||||
Griffon Corp. | 72,467 | 1,210,199 | ||||||
AZZ, Inc. | 19,448 | 1,035,606 | ||||||
US Ecology, Inc. | 22,443 | 948,217 | ||||||
Trex Company, Inc.* | 16,415 | 883,291 | ||||||
Comfort Systems USA, Inc. | 30,451 | 878,511 | ||||||
Methode Electronics, Inc. | 24,810 | 774,072 | ||||||
AAON, Inc. | 25,674 | 768,936 | ||||||
Exponent, Inc. | 12,896 | 738,296 | ||||||
Sturm Ruger & Company, Inc.1 | 11,919 | 733,019 | ||||||
Matson, Inc. | 17,680 | 706,139 | ||||||
Apogee Enterprises, Inc. | 15,113 | 615,855 | ||||||
Proto Labs, Inc.*,1 | 10,769 | 481,374 | ||||||
OSI Systems, Inc.* | 6,664 | 467,346 | ||||||
Total Industrial | 26,571,366 | |||||||
Consumer, Cyclical - 13.6% | ||||||||
LGI Homes, Inc.*,1 | 78,942 | 2,349,313 | ||||||
Dave & Buster’s Entertainment, Inc.* | 46,464 | 1,921,286 | ||||||
Installed Building Products, Inc.*,1 | 55,530 | 1,835,266 | ||||||
36 | GUGGENHEIM ETFs ANNUAL REPORT | SEE NOTES TO FINANCIAL STATEMENTS. |
SCHEDULE OF INVESTMENTS (continued) | October 31, 2016 |
GUGGENHEIM S&P SMALLCAP 600® PURE GROWTH ETF |
Shares | Value | |||||||
Nautilus, Inc.*,1 | 93,833 | $ | 1,651,461 | |||||
Meritage Homes Corp.* | 52,949 | 1,638,772 | ||||||
Lithia Motors, Inc. — Class A | 13,981 | 1,199,290 | ||||||
American Woodmark Corp.* | 14,763 | 1,102,796 | ||||||
Fox Factory Holding Corp.* | 47,978 | 1,041,123 | ||||||
Monarch Casino & Resort, Inc.* | 41,085 | 971,660 | ||||||
Hawaiian Holdings, Inc.* | 21,517 | 968,803 | ||||||
Papa John’s International, Inc. | 12,388 | 934,675 | ||||||
Allegiant Travel Co. — Class A | 5,960 | 821,884 | ||||||
Ruth’s Hospitality Group, Inc. | 46,403 | 735,488 | ||||||
Francesca’s Holdings Corp.* | 45,455 | 730,462 | ||||||
Interface, Inc. — Class A | 44,755 | 709,367 | ||||||
Popeyes Louisiana Kitchen, Inc.* | 12,748 | 680,488 | ||||||
Boyd Gaming Corp.* | 37,392 | 667,821 | ||||||
Gentherm, Inc.* | 19,119 | 538,200 | ||||||
Sonic Corp. | 12,731 | 291,667 | ||||||
Total Consumer, Cyclical | 20,789,822 | |||||||
Technology - 8.5% | ||||||||
Ebix, Inc.1 | 32,170 | 1,801,520 | ||||||
Take-Two Interactive Software, Inc.* | 33,811 | 1,500,870 | ||||||
Blackbaud, Inc. | 18,385 | 1,128,839 | ||||||
Tessera Technologies, Inc. | 29,028 | 1,076,939 | ||||||
SPS Commerce, Inc.* | 16,635 | 1,037,691 | ||||||
ExlService Holdings, Inc.* | 21,841 | 961,660 | ||||||
Kopin Corp.* | 456,968 | 955,063 | ||||||
Medidata Solutions, Inc.* | 18,688 | 896,837 | ||||||
Synchronoss Technologies, Inc.* | 21,804 | 800,425 | ||||||
CEVA, Inc.* | 25,115 | 754,706 | ||||||
Rambus, Inc.* | 52,516 | 640,170 | ||||||
Omnicell, Inc.* | 18,176 | 592,992 | ||||||
Cray, Inc.* | 22,573 | 469,518 | ||||||
Virtusa Corp.* | 19,676 | 372,663 | ||||||
Total Technology | 12,989,893 | |||||||
Communications - 5.4% | ||||||||
LogMeIn, Inc.1 | 25,619 | 2,433,805 | ||||||
Stamps.com, Inc.*,1 | 13,454 | 1,312,438 | ||||||
8x8, Inc.* | 81,112 | 1,155,846 | ||||||
World Wrestling Entertainment, Inc. — Class A1 | 51,894 | 917,486 | ||||||
NIC, Inc. | 36,737 | 843,114 | ||||||
HealthStream, Inc.* | 26,390 | 711,738 | ||||||
Blue Nile, Inc.1 | 16,859 | 588,885 | ||||||
General Communication, Inc. — Class A* | 19,462 | 308,278 | ||||||
Total Communications | 8,271,590 | |||||||
Basic Materials - 2.1% | ||||||||
Balchem Corp. | 15,890 | 1,206,051 | ||||||
Innospec, Inc. | 16,404 | 988,341 | ||||||
Deltic Timber Corp. | 9,551 | 536,575 | ||||||
Aceto Corp. | 25,102 | 460,120 | ||||||
Total Basic Materials | 3,191,087 | |||||||
Energy - 0.5% | ||||||||
Synergy Resources Corp.*,1 | 109,441 | 748,576 | ||||||
Total Common Stocks | ||||||||
(Cost $154,116,779) | 152,774,951 | |||||||
SHORT TERM INVESTMENTS† - 0.1% | ||||||||
Federated U.S. Treasury Cash Reserve Fund Institutional Shares, 0.18%2 | 137,746 | 137,746 | ||||||
Total Short Term Investments | ||||||||
(Cost $137,746) | 137,746 | |||||||
Face | ||||||||
SECURITIES LENDING COLLATERAL††,3 – 15.3% | ||||||||
Joint Repurchase Agreements | ||||||||
Citigroup Global Markets, Inc. | $ | 5,452,271 | 5,452,271 | |||||
BNP Paribas Securities Corp. | 5,452,271 | 5,452,271 | ||||||
Merrill Lynch, Pierce, Fenner & Smith, Inc. | 5,452,271 | 5,452,271 | ||||||
HSBC Securities (USA), Inc. | 5,452,271 | 5,452,271 | ||||||
Credit Suisse Securities (USA), LLC | 1,607,443 | 1,607,443 | ||||||
Total Securities Lending Collateral | ||||||||
(Cost $23,416,527) | 23,416,527 | |||||||
Total Investments - 115.3% | ||||||||
(Cost $177,671,052) | $ | 176,329,224 | ||||||
Other Assets & Liabilities, net - (15.3)% | (23,419,412 | ) | ||||||
Total Net Assets - 100.0% | $ | 152,909,812 | ||||||
* | Non-income producing security. |
† | Value determined based on Level 1 inputs — See Note 4. |
†† | Value determined based on Level 2 inputs — See Note 4. |
1 | All or portion of this security is on loan at October 31, 2016 — See Note 5. |
2 | Rate indicated is the 7 day yield as of October 31, 2016. |
3 | Securities lending collateral — See Note 5. |
See Sector Classification in Other Information section. |
SEE NOTES TO FINANCIAL STATEMENTS. | GUGGENHEIM ETFs ANNUAL REPORT | 37 |
SCHEDULE OF INVESTMENTS (concluded) | October 31, 2016 |
GUGGENHEIM S&P SMALLCAP 600® PURE GROWTH ETF |
The following table summarizes the inputs used to value the Fund’s investments at October 31, 2016 (See Note 4 in the Notes to Financial Statements):
Investments in Securities | Level 1 | Level 2 | Level 3 | Total | ||||||||||||
Common Stocks | $ | 152,774,951 | $ | — | $ | — | $ | 152,774,951 | ||||||||
Securities Lending Collateral | — | 23,416,527 | — | 23,416,527 | ||||||||||||
Short Term Investments | 137,746 | — | — | 137,746 | ||||||||||||
Total | $ | 152,912,697 | $ | 23,416,527 | $ | — | $ | 176,329,224 | ||||||||
Transfers between investment levels may occur as the markets fluctuate and/or the availability of data used in an investment’s valuation changes. Transfers between valuation levels, if any, are in comparison to the valuation levels at the end of the previous fiscal year, and are effective using the fair value as of the end of the previous fiscal period.
For the year ended October 31, 2016, there were no transfers between levels.
38 | GUGGENHEIM ETFs ANNUAL REPORT | SEE NOTES TO FINANCIAL STATEMENTS. |
STATEMENTS OF ASSETS AND LIABILITIES | October 31, 2016 |
Guggenheim | Guggenheim | Guggenheim | Guggenheim | |||||||||||||
Assets: | ||||||||||||||||
Investments, at value — including $—, $57,980,569, $79,278,590 and $33,075,017 of securities loaned, respectively | $ | 577,289,287 | $ | 719,294,618 | $ | 1,768,406,543 | $ | 165,740,980 | ||||||||
Repurchase agreements, at value | — | 20,517,856 | 39,871,125 | 22,419,031 | ||||||||||||
Total investments* | 577,289,287 | 739,812,474 | 1,808,277,668 | 188,160,011 | ||||||||||||
Receivables: | ||||||||||||||||
Securities lending | 5,192 | 11,028 | 24,715 | 8,482 | ||||||||||||
Dividends and interest | 607,198 | 570,519 | 1,685,171 | 45,768 | ||||||||||||
Total assets | 577,901,677 | 740,394,021 | 1,809,987,554 | 188,214,261 | ||||||||||||
Liabilities: | ||||||||||||||||
Payable upon return of securities loaned | — | 20,517,856 | 39,871,125 | 22,419,031 | ||||||||||||
Payable for: | ||||||||||||||||
Management fees | 99,540 | 212,963 | 530,948 | 41,849 | ||||||||||||
Total liabilities | 99,540 | 20,730,819 | 40,402,073 | 22,460,880 | ||||||||||||
Commitments and contingent liabilities (Note 8) | — | — | — | — | ||||||||||||
Net assets | $ | 577,802,137 | $ | 719,663,202 | $ | 1,769,585,481 | $ | 165,753,381 | ||||||||
Net assets consist of: | ||||||||||||||||
Paid-in capital | $ | 584,971,957 | $ | 845,474,944 | $ | 1,777,119,320 | $ | 175,607,210 | ||||||||
Undistributed net investment income | 1,017,450 | 915,703 | 1,926,363 | 62,225 | ||||||||||||
Accumulated net realized loss on investments | (74,328,865 | ) | (101,716,194 | ) | (166,263,958 | ) | (19,060,559 | ) | ||||||||
Net unrealized appreciation (depreciation) on investments | 66,141,595 | (25,011,251 | ) | 156,803,756 | 9,144,505 | |||||||||||
Net assets | $ | 577,802,137 | $ | 719,663,202 | $ | 1,769,585,481 | $ | 165,753,381 | ||||||||
Shares outstanding (unlimited shares authorized), no par value | 3,850,785 | 13,752,836 | 21,550,299 | 3,100,499 | ||||||||||||
Net asset value, offering price and repurchase price per share | $ | 150.05 | $ | 52.33 | $ | 82.11 | $ | 53.46 | ||||||||
Cost of investments | $ | 511,147,692 | $ | 744,305,869 | $ | 1,611,602,787 | $ | 156,596,475 | ||||||||
Cost of repurchase agreements | — | 20,517,856 | 39,871,125 | 22,419,031 | ||||||||||||
*Total cost of investments | $ | 511,147,692 | $ | 764,823,725 | $ | 1,651,473,912 | $ | 179,015,506 | ||||||||
SEE NOTES TO FINANCIAL STATEMENTS. | GUGGENHEIM ETFs ANNUAL REPORT | 39 |
STATEMENTS OF ASSETS AND LIABILITIES (concluded) | October 31, 2016 |
Guggenheim | Guggenheim | Guggenheim | ||||||||||
Assets: | ||||||||||||
Investments, at value — including $84,139,894, $17,500,053 and $30,189,103 of securities loaned, respectively | $ | 518,649,803 | $ | 193,648,648 | $ | 152,912,697 | ||||||
Repurchase agreements, at value | 52,550,660 | 12,574,158 | 23,416,527 | |||||||||
Total investments* | 571,200,463 | 206,222,806 | 176,329,224 | |||||||||
Receivables: | ||||||||||||
Fund shares sold | — | 3,202 | — | |||||||||
Securities lending | 23,780 | 9,668 | 30,268 | |||||||||
Dividends and interest | 104,968 | 54,609 | 15,271 | |||||||||
Tax reclaims | — | 1,306 | — | |||||||||
Total assets | 571,329,211 | 206,291,591 | 176,374,763 | |||||||||
Liabilities: | ||||||||||||
Payable upon return of securities loaned | 52,550,660 | 12,574,158 | 23,416,527 | |||||||||
Payable for: | ||||||||||||
Management fees | 158,856 | 52,492 | 48,424 | |||||||||
Total liabilities | 52,709,516 | 12,626,650 | 23,464,951 | |||||||||
Commitments and contingent liabilities (Note 8) | — | — | — | |||||||||
Net assets | $ | 518,619,695 | $ | 193,664,941 | $ | 152,909,812 | ||||||
Net assets consist of: | ||||||||||||
Paid-in capital | $ | 572,721,075 | $ | 231,496,282 | $ | 181,134,259 | ||||||
Undistributed net investment income | 40,670 | 43,617 | 61,092 | |||||||||
Accumulated net realized loss on investments | (44,961,609 | ) | (44,869,896 | ) | (26,943,711 | ) | ||||||
Net unrealized appreciation (depreciation) on investments | (9,180,441 | ) | 6,994,938 | (1,341,828 | ) | |||||||
Net assets | $ | 518,619,695 | $ | 193,664,941 | $ | 152,909,812 | ||||||
Shares outstanding (unlimited shares authorized), no par value | 4,350,021 | 3,200,040 | 1,850,004 | |||||||||
Net asset value, offering price and repurchase price per share | $ | 119.22 | $ | 60.52 | $ | 82.65 | ||||||
Cost of investments | $ | 527,830,244 | $ | 186,653,710 | $ | 154,254,525 | ||||||
Cost of repurchase agreements | 52,550,660 | 12,574,158 | 23,416,527 | |||||||||
*Total cost of investments | $ | 580,380,904 | $ | 199,227,868 | $ | 177,671,052 | ||||||
40 | GUGGENHEIM ETFs ANNUAL REPORT | SEE NOTES TO FINANCIAL STATEMENTS. |
STATEMENTS OF OPERATIONS |
|
For the Year Ended October 31, 2016
Guggenheim | Guggenheim | Guggenheim | Guggenheim | |||||||||||||
Investment Income: | ||||||||||||||||
Dividends | $ | 13,618,574 | $ | 19,945,331 | $ | 21,186,503 | $ | 1,836,075 | ||||||||
Income from securities lending | 5,192 | 100,169 | 111,728 | 66,459 | ||||||||||||
Interest | 1,257 | 1,437 | 3,172 | 233 | ||||||||||||
Total investment income | 13,625,023 | 20,046,937 | 21,301,403 | 1,902,767 | ||||||||||||
Expenses: | ||||||||||||||||
Management fees | 1,167,416 | 2,627,444 | 6,856,409 | 389,175 | ||||||||||||
Total expenses | 1,167,416 | 2,627,444 | 6,856,409 | 389,175 | ||||||||||||
Net investment income | 12,457,607 | 17,419,493 | 14,444,994 | 1,513,592 | ||||||||||||
Net Realized and Unrealized Gain (Loss): | ||||||||||||||||
Net realized gain (loss) on: | ||||||||||||||||
Investments | (4,323,755 | ) | (79,387,544 | ) | (165,052,045 | ) | (15,001,016 | ) | ||||||||
In-kind redemptions | 30,606,722 | 33,820,506 | 145,626,105 | 7,059,921 | ||||||||||||
Net realized gain (loss) | 26,282,967 | (45,567,038 | ) | (19,425,940 | ) | (7,941,095 | ) | |||||||||
Net change in unrealized appreciation (depreciation) on: | ||||||||||||||||
Investments | (9,569,287 | ) | 30,087,617 | (48,938,900 | ) | 10,946,947 | ||||||||||
Net realized and unrealized gain (loss) | 16,713,680 | (15,479,421 | ) | (68,364,840 | ) | 3,005,852 | ||||||||||
Net increase (decrease) in net assets resulting from operations | $ | 29,171,287 | $ | 1,940,072 | $ | (53,919,846 | ) | $ | 4,519,444 | |||||||
SEE NOTES TO FINANCIAL STATEMENTS. | GUGGENHEIM ETFs ANNUAL REPORT | 41 |
STATEMENTS OF OPERATIONS (concluded) |
|
For the Year Ended October 31, 2016
Guggenheim | Guggenheim | Guggenheim | ||||||||||
Investment Income: | ||||||||||||
Dividends, net of foreign taxes withheld* | $ | 5,150,036 | $ | 1,741,385 | $ | 2,205,016 | ||||||
Income from securities lending | 101,136 | 83,171 | 270,603 | |||||||||
Interest | 410 | 215 | 175 | |||||||||
Total investment income | 5,251,582 | 1,824,771 | 2,475,794 | |||||||||
Expenses: | ||||||||||||
Management fees | 2,204,814 | 558,930 | 658,400 | |||||||||
Total expenses | 2,204,814 | 558,930 | 658,400 | |||||||||
Net investment income | 3,046,768 | 1,265,841 | 1,817,394 | |||||||||
Net Realized and Unrealized Gain (Loss): | ||||||||||||
Net realized gain (loss) on: | ||||||||||||
Investments | (37,993,542 | ) | (24,157,514 | ) | (27,011,806 | ) | ||||||
In-kind redemptions | 50,971,014 | 21,057,316 | 10,861,818 | |||||||||
Net realized gain (loss) | 12,977,472 | (3,100,198 | ) | (16,149,988 | ) | |||||||
Net change in unrealized appreciation (depreciation) on: | ||||||||||||
Investments | (70,464,100 | ) | 11,888,389 | 1,528,718 | ||||||||
Net realized and unrealized gain (loss) | (57,486,628 | ) | 8,788,191 | (14,621,270 | ) | |||||||
Net increase (decrease) in net assets resulting from operations | $ | (54,439,860 | ) | $ | 10,054,032 | $ | (12,803,876 | ) | ||||
* Foreign taxes withheld | $ | — | $ | 3,087 | $ | 105 | ||||||
42 | GUGGENHEIM ETFs ANNUAL REPORT | SEE NOTES TO FINANCIAL STATEMENTS. |
STATEMENTS OF CHANGES IN NET ASSETS |
|
Guggenheim S&P 500® | Guggenheim S&P 500® | |||||||||||||||
Year Ended | Year Ended | Year Ended | Year Ended | |||||||||||||
Increase (Decrease) in Net Assets from Operations: | ||||||||||||||||
Net investment income | $ | 12,457,607 | $ | 11,229,034 | $ | 17,419,493 | $ | 21,342,768 | ||||||||
Net realized gain (loss) on investments | 26,282,967 | 52,721,047 | (45,567,038 | ) | 85,264,523 | |||||||||||
Net change in unrealized appreciation (depreciation) on investments | (9,569,287 | ) | (33,501,768 | ) | 30,087,617 | (123,793,479 | ) | |||||||||
Net increase (decrease) in net assets resulting from operations | 29,171,287 | 30,448,313 | 1,940,072 | (17,186,188 | ) | |||||||||||
Distributions to shareholders from: | ||||||||||||||||
Net investment income | (12,305,640 | ) | (11,355,966 | ) | (16,846,207 | ) | (22,046,039 | ) | ||||||||
Shareholder transactions: | ||||||||||||||||
Proceeds from shares purchased | 173,560,668 | 49,329,473 | 396,931,870 | 437,829,978 | ||||||||||||
Cost of shares redeemed | (108,888,149 | ) | (170,955,031 | ) | (475,391,756 | ) | (860,630,837 | ) | ||||||||
Net increase (decrease) in net assets resulting from share transactions | 64,672,519 | (121,625,558 | ) | (78,459,886 | ) | (422,800,859 | ) | |||||||||
Net increase (decrease) in net assets | 81,538,166 | (102,533,211 | ) | (93,366,021 | ) | (462,033,086 | ) | |||||||||
Net assets: | ||||||||||||||||
Beginning of year | 496,263,971 | 598,797,182 | 813,029,223 | 1,275,062,309 | ||||||||||||
End of year | $ | 577,802,137 | $ | 496,263,971 | $ | 719,663,202 | $ | 813,029,223 | ||||||||
Undistributed net investment income at end of year | $ | 1,017,450 | $ | 861,244 | $ | 915,703 | $ | 249,496 | ||||||||
Changes in shares outstanding: | ||||||||||||||||
Shares sold | 1,200,000 | 350,000 | 8,050,000 | 8,200,000 | ||||||||||||
Shares redeemed | (750,000 | ) | (1,200,000 | ) | (10,100,000 | ) | (15,950,000 | ) | ||||||||
Net increase (decrease) in shares | 450,000 | (850,000 | ) | (2,050,000 | ) | (7,750,000 | ) | |||||||||
SEE NOTES TO FINANCIAL STATEMENTS. | GUGGENHEIM ETFs ANNUAL REPORT | 43 |
STATEMENTS OF CHANGES IN NET ASSETS (continued) |
|
Guggenheim S&P 500® | Guggenheim S&P MidCap 400® | |||||||||||||||
Year Ended | Year Ended | Year Ended | Year Ended | |||||||||||||
Increase (Decrease) in Net Assets from Operations: | ||||||||||||||||
Net investment income | $ | 14,444,994 | $ | 13,162,229 | $ | 1,513,592 | $ | 1,892,083 | ||||||||
Net realized gain (loss) on investments | (19,425,940 | ) | 79,728,627 | (7,941,095 | ) | 9,487,503 | ||||||||||
Net change in unrealized appreciation (depreciation) on investments | (48,938,900 | ) | 20,956,005 | 10,946,947 | (13,390,444 | ) | ||||||||||
Net increase (decrease) in net assets resulting from operations | (53,919,846 | ) | 113,846,861 | 4,519,444 | (2,010,858 | ) | ||||||||||
Distributions to shareholders from: | ||||||||||||||||
Net investment income | (12,804,542 | ) | (12,287,095 | ) | (1,503,674 | ) | (1,909,844 | ) | ||||||||
Shareholder transactions: | ||||||||||||||||
Proceeds from shares purchased | 427,793,413 | 752,877,885 | 94,638,501 | 42,976,874 | ||||||||||||
Cost of shares redeemed | (930,069,089 | ) | (308,368,180 | ) | (36,043,334 | ) | (53,544,609 | ) | ||||||||
Net increase (decrease) in net assets resulting from share transactions | (502,275,676 | ) | 444,509,705 | 58,595,167 | (10,567,735 | ) | ||||||||||
Net increase (decrease) in net assets | (569,000,064 | ) | 546,069,471 | 61,610,937 | (14,488,437 | ) | ||||||||||
Net assets: | ||||||||||||||||
Beginning of year | 2,338,585,545 | 1,792,516,074 | 104,142,444 | 118,630,881 | ||||||||||||
End of year | $ | 1,769,585,481 | $ | 2,338,585,545 | $ | 165,753,381 | $ | 104,142,444 | ||||||||
Undistributed net investment income at end of year | $ | 1,926,363 | $ | — | $ | 62,225 | $ | 65,209 | ||||||||
Changes in shares outstanding: | ||||||||||||||||
Shares sold | 5,250,000 | 9,350,000 | 1,800,000 | 800,000 | ||||||||||||
Shares redeemed | (11,900,000 | ) | (3,850,000 | ) | (750,000 | ) | (1,000,000 | ) | ||||||||
Net increase (decrease) in shares | (6,650,000 | ) | 5,500,000 | 1,050,000 | (200,000 | ) | ||||||||||
44 | GUGGENHEIM ETFs ANNUAL REPORT | SEE NOTES TO FINANCIAL STATEMENTS. |
STATEMENTS OF CHANGES IN NET ASSETS (continued) |
|
Guggenheim S&P MidCap 400® | Guggenheim S&P SmallCap 600® | |||||||||||||||
Year Ended | Year Ended | Year Ended | Year Ended | |||||||||||||
Increase (Decrease) in Net Assets from Operations: | ||||||||||||||||
Net investment income | $ | 3,046,768 | $ | 4,023,714 | $ | 1,265,841 | $ | 1,951,573 | ||||||||
Net realized gain (loss) on investments | 12,977,472 | 38,311,360 | (3,100,198 | ) | 7,972,396 | |||||||||||
Net change in unrealized appreciation (depreciation) on investments | (70,464,100 | ) | (13,305,481 | ) | 11,888,389 | (21,140,206 | ) | |||||||||
Net increase (decrease) in net assets resulting from operations | (54,439,860 | ) | 29,029,593 | 10,054,032 | (11,216,237 | ) | ||||||||||
Distributions to shareholders from: | ||||||||||||||||
Net investment income | (3,174,670 | ) | (4,173,726 | ) | (1,222,224 | ) | (1,976,663 | ) | ||||||||
Return of capital | — | (467,016 | ) | — | — | |||||||||||
Total distributions to shareholders | (3,174,670 | ) | (4,640,742 | ) | (1,222,224 | ) | (1,976,663 | ) | ||||||||
Shareholder transactions: | ||||||||||||||||
Proceeds from shares purchased | 134,585,419 | 206,271,851 | 114,670,713 | 50,291,876 | ||||||||||||
Cost of shares redeemed | (328,223,276 | ) | (206,731,035 | ) | (80,027,741 | ) | (58,898,695 | ) | ||||||||
Net increase (decrease) in net assets resulting from share transactions | (193,637,857 | ) | (459,184 | ) | 34,642,972 | (8,606,819 | ) | |||||||||
Net increase (decrease) in net assets | (251,252,387 | ) | 23,929,667 | 43,474,780 | (21,799,719 | ) | ||||||||||
Net assets: | ||||||||||||||||
Beginning of year | 769,872,082 | 745,942,415 | 150,190,161 | 171,989,880 | ||||||||||||
End of year | $ | 518,619,695 | $ | 769,872,082 | $ | 193,664,941 | $ | 150,190,161 | ||||||||
Undistributed net investment income at end of year | $ | 40,670 | $ | — | $ | 43,617 | $ | 14,208 | ||||||||
Changes in shares outstanding: | ||||||||||||||||
Shares sold | 1,100,000 | 1,600,000 | 2,050,000 | 800,000 | ||||||||||||
Shares redeemed | (2,750,000 | ) | (1,650,000 | ) | (1,450,000 | ) | (950,000 | ) | ||||||||
Net increase (decrease) in shares | (1,650,000 | ) | (50,000 | ) | 600,000 | (150,000 | ) | |||||||||
SEE NOTES TO FINANCIAL STATEMENTS. | GUGGENHEIM ETFs ANNUAL REPORT | 45 |
STATEMENTS OF CHANGES IN NET ASSETS (concluded) |
|
Guggenheim S&P SmallCap 600® | ||||||||
Year Ended | Year Ended | |||||||
Increase (Decrease) in Net Assets from Operations: | ||||||||
Net investment income | $ | 1,817,394 | $ | 849,033 | ||||
Net realized gain (loss) on investments | (16,149,988 | ) | 12,944,793 | |||||
Net change in unrealized appreciation (depreciation) on investments | 1,528,718 | (13,529,320 | ) | |||||
Net increase (decrease) in net assets resulting from operations | (12,803,876 | ) | 264,506 | |||||
Distributions to shareholders from: | ||||||||
Net investment income | (1,779,427 | ) | (849,033 | ) | ||||
Return of capital | — | (5,968 | ) | |||||
Total distributions to shareholders | (1,779,427 | ) | (855,001 | ) | ||||
Shareholder transactions: | ||||||||
Proceeds from shares purchased | 54,819,343 | 188,816,454 | ||||||
Cost of shares redeemed | (113,259,262 | ) | (67,016,341 | ) | ||||
Net increase (decrease) in net assets resulting from share transactions | (58,439,919 | ) | 121,800,113 | |||||
Net increase (decrease) in net assets | (73,023,222 | ) | 121,209,618 | |||||
Net assets: | ||||||||
Beginning of year | 225,933,034 | 104,723,416 | ||||||
End of year | $ | 152,909,812 | $ | 225,933,034 | ||||
Undistributed net investment income at end of year | $ | 61,092 | $ | — | ||||
Changes in shares outstanding: | ||||||||
Shares sold | 650,000 | 2,150,000 | ||||||
Shares redeemed | (1,450,000 | ) | (800,000 | ) | ||||
Net increase (decrease) in shares | (800,000 | ) | 1,350,000 | |||||
46 | GUGGENHEIM ETFs ANNUAL REPORT | SEE NOTES TO FINANCIAL STATEMENTS. |
GUGGENHEIM S&P 500® TOP 50 ETF |
FINANCIAL HIGHLIGHTS |
This table is presented to show selected data for a share outstanding throughout each period and to assist shareholders in evaluating the Fund’s performance for the periods presented.
Year Ended | Year Ended | Year Ended | Year Ended | Year Ended | ||||||||||||||||
Per Share Data: | ||||||||||||||||||||
Net asset value, beginning of period | $ | 145.93 | $ | 140.87 | $ | 123.06 | $ | 104.06 | $ | 89.97 | ||||||||||
Income from investment operations: | ||||||||||||||||||||
Net investment income(loss)a | 3.12 | 3.00 | 2.74 | 2.56 | 2.17 | |||||||||||||||
Net gain on investments (realized and unrealized) | 4.09 | 5.09 | 17.82 | 19.05 | 14.02 | |||||||||||||||
Total from investment operations | 7.21 | 8.09 | 20.56 | 21.61 | 16.19 | |||||||||||||||
Less distributions from: | ||||||||||||||||||||
Net investment income | (3.09 | ) | (3.03 | ) | (2.75 | ) | (2.61 | ) | (2.10 | ) | ||||||||||
Total distributions to shareholders | (3.09 | ) | (3.03 | ) | (2.75 | ) | (2.61 | ) | (2.10 | ) | ||||||||||
Net asset value, end of period | $ | 150.05 | $ | 145.93 | $ | 140.87 | $ | 123.06 | $ | 104.06 | ||||||||||
Total Returnb | 4.99 | % | 5.87 | % | 16.86 | % | 21.07 | % | 18.11 | % | ||||||||||
Ratios/Supplemental Data: | ||||||||||||||||||||
Net assets, end of period (in thousands) | $ | 577,802 | $ | 496,264 | $ | 598,797 | $ | 523,123 | $ | 624,468 | ||||||||||
Ratio to average net assets of: | ||||||||||||||||||||
Net investment income(loss) | 2.13 | % | 2.11 | % | 2.08 | % | 2.28 | % | 2.19 | % | ||||||||||
Total expenses | 0.20 | % | 0.20 | % | 0.20 | % | 0.20 | % | 0.20 | % | ||||||||||
Portfolio turnover ratec | 7 | % | 8 | % | 6 | % | 8 | % | 7 | % | ||||||||||
a | Based on average shares outstanding. |
b | Total investment return is calculated assuming an initial investment made at the net asset value at the beginning of the period, reinvestment of all dividends and distribution at net asset value during the period, and redemption on the last day of the period. Transaction fees are not reflected in the calculation of total investment return. |
c | Portfolio turnover does not include securities received or delivered from processing creations or redemptions. |
SEE NOTES TO FINANCIAL STATEMENTS. | GUGGENHEIM ETFs ANNUAL REPORT | 47 |
GUGGENHEIM S&P 500® PURE VALUE ETF |
FINANCIAL HIGHLIGHTS |
This table is presented to show selected data for a share outstanding throughout each period and to assist shareholders in evaluating the Fund’s performance for the periods presented.
Year Ended | Year Ended | Year Ended | Year Ended | Year Ended | ||||||||||||||||
Per Share Data: | ||||||||||||||||||||
Net asset value, beginning of period | $ | 51.45 | $ | 54.14 | $ | 46.51 | $ | 32.26 | $ | 28.38 | ||||||||||
Income from investment operations: | ||||||||||||||||||||
Net investment income(loss)a | 1.17 | 1.12 | 0.90 | 0.67 | 0.48 | |||||||||||||||
Net gain (loss) on investments (realized and unrealized) | 0.81 | (2.70 | ) | 7.50 | 14.18 | 3.89 | ||||||||||||||
Total from investment operations | 1.98 | (1.58 | ) | 8.40 | 14.85 | 4.37 | ||||||||||||||
Less distributions from: | ||||||||||||||||||||
Net investment income | (1.10 | ) | (1.11 | ) | (0.77 | ) | (0.60 | ) | (0.49 | ) | ||||||||||
Total distributions to shareholders | (1.10 | ) | (1.11 | ) | (0.77 | ) | (0.60 | ) | (0.49 | ) | ||||||||||
Net asset value, end of period | $ | 52.33 | $ | 51.45 | $ | 54.14 | $ | 46.51 | $ | 32.26 | ||||||||||
Total Returnb | 3.94 | % | (2.94 | %) | 18.13 | % | 46.39 | % | 15.54 | % | ||||||||||
Ratios/Supplemental Data: | ||||||||||||||||||||
Net assets, end of period (in thousands) | $ | 719,663 | $ | 813,029 | $ | 1,275,062 | $ | 374,565 | $ | 85,583 | ||||||||||
Ratio to average net assets of: | ||||||||||||||||||||
Net investment income(loss) | 2.32 | % | 2.09 | % | 1.74 | % | 1.65 | % | 1.60 | % | ||||||||||
Total expenses | 0.35 | % | 0.35 | % | 0.35 | % | 0.35 | % | 0.35 | % | ||||||||||
Portfolio turnover ratec | 44 | % | 54 | % | 25 | % | 24 | % | 37 | % | ||||||||||
a | Based on average shares outstanding. |
b | Total investment return is calculated assuming an initial investment made at the net asset value at the beginning of the period, reinvestment of all dividends and distribution at net asset value during the period, and redemption on the last day of the period. Transaction fees are not reflected in the calculation of total investment return. |
c | Portfolio turnover does not include securities received or delivered from processing creations or redemptions. |
48 | GUGGENHEIM ETFs ANNUAL REPORT | SEE NOTES TO FINANCIAL STATEMENTS. |
GUGGENHEIM S&P 500® PURE GROWTH ETF |
FINANCIAL HIGHLIGHTS |
This table is presented to show selected data for a share outstanding throughout each period and to assist shareholders in evaluating the Fund’s performance for the periods presented.
Year Ended | Year Ended | Year Ended | Year Ended | Year Ended | ||||||||||||||||
Per Share Data: | ||||||||||||||||||||
Net asset value, beginning of period | $ | 82.93 | $ | 78.96 | $ | 66.12 | $ | 47.80 | $ | 44.68 | ||||||||||
Income from investment operations: | ||||||||||||||||||||
Net investment income(loss)a | 0.59 | 0.52 | 0.55 | 0.44 | 0.33 | |||||||||||||||
Net (loss) gain on investments (realized and unrealized) | (0.95 | ) | 3.93 | 12.81 | 18.33 | 3.11 | ||||||||||||||
Total from investment operations | (0.36 | ) | 4.45 | 13.36 | 18.77 | 3.44 | ||||||||||||||
Less distributions from: | ||||||||||||||||||||
Net investment income | (0.46 | ) | (0.48 | ) | (0.52 | ) | (0.42 | ) | (0.32 | ) | ||||||||||
Return of capital | — | — | — | (0.03 | ) | — | ||||||||||||||
Total distributions to shareholders | (0.46 | ) | (0.48 | ) | (0.52 | ) | (0.45 | ) | (0.32 | ) | ||||||||||
Net asset value, end of period | $ | 82.11 | $ | 82.93 | $ | 78.96 | $ | 66.12 | $ | 47.80 | ||||||||||
Total Returnb | (0.42 | %) | 5.65 | % | 20.24 | % | 39.45 | % | 7.72 | % | ||||||||||
Ratios/Supplemental Data: | ||||||||||||||||||||
Net assets, end of period (in thousands) | $ | 1,769,585 | $ | 2,338,586 | $ | 1,792,516 | $ | 760,397 | $ | 332,253 | ||||||||||
Ratio to average net assets of: | ||||||||||||||||||||
Net investment income(loss) | 0.74 | % | 0.64 | % | 0.74 | % | 0.76 | % | 0.71 | % | ||||||||||
Total expenses | 0.35 | % | 0.35 | % | 0.35 | % | 0.35 | % | 0.35 | % | ||||||||||
Portfolio turnover ratec | 67 | % | 62 | % | 46 | % | 44 | % | 35 | % | ||||||||||
a | Based on average shares outstanding. |
b | Total investment return is calculated assuming an initial investment made at the net asset value at the beginning of the period, reinvestment of all dividends and distribution at net asset value during the period, and redemption on the last day of the period. Transaction fees are not reflected in the calculation of total investment return. |
c | Portfolio turnover does not include securities received or delivered from processing creations or redemptions. |
SEE NOTES TO FINANCIAL STATEMENTS. | GUGGENHEIM ETFs ANNUAL REPORT | 49 |
GUGGENHEIM S&P MIDCAP 400® PURE VALUE ETF |
FINANCIAL HIGHLIGHTS |
This table is presented to show selected data for a share outstanding throughout each period and to assist shareholders in evaluating the Fund’s performance for the periods presented.
Year Ended | Year Ended | Year Ended | Year Ended | Year Ended | ||||||||||||||||
Per Share Data: | ||||||||||||||||||||
Net asset value, beginning of period | $ | 50.79 | $ | 52.71 | $ | 48.42 | $ | 35.00 | $ | 31.00 | ||||||||||
Income from investment operations: | ||||||||||||||||||||
Net investment income(loss)a | 0.69 | 0.86 | 0.71 | 0.52 | 0.46 | |||||||||||||||
Net gain (loss) on investments (realized and unrealized) | 2.65 | (1.96 | ) | 4.18 | 13.46 | 4.01 | ||||||||||||||
Total from investment operations | 3.34 | (1.10 | ) | 4.89 | 13.98 | 4.47 | ||||||||||||||
Less distributions from: | ||||||||||||||||||||
Net investment income | (0.67 | ) | (0.82 | ) | (0.60 | ) | (0.56 | ) | (0.47 | ) | ||||||||||
Total distributions to shareholders | (0.67 | ) | (0.82 | ) | (0.60 | ) | (0.56 | ) | (0.47 | ) | ||||||||||
Net asset value, end of period | $ | 53.46 | $ | 50.79 | $ | 52.71 | $ | 48.42 | $ | 35.00 | ||||||||||
Total Returnb | 6.65 | % | (2.12 | %) | 10.14 | % | 40.27 | % | 14.46 | % | ||||||||||
Ratios/Supplemental Data: | ||||||||||||||||||||
Net assets, end of period (in thousands) | $ | 165,753 | $ | 104,142 | $ | 118,631 | $ | 77,503 | $ | 35,015 | ||||||||||
Ratio to average net assets of: | ||||||||||||||||||||
Net investment income(loss) | 1.36 | % | 1.62 | % | 1.38 | % | 1.22 | % | 1.36 | % | ||||||||||
Total expenses | 0.35 | % | 0.35 | % | 0.35 | % | 0.35 | % | 0.35 | % | ||||||||||
Portfolio turnover ratec | 47 | % | 59 | % | 40 | % | 28 | % | 47 | % | ||||||||||
a | Based on average shares outstanding. |
b | Total investment return is calculated assuming an initial investment made at the net asset value at the beginning of the period, reinvestment of all dividends and distribution at net asset value during the period, and redemption on the last day of the period. Transaction fees are not reflected in the calculation of total investment return. |
c | Portfolio turnover does not include securities received or delivered from processing creations or redemptions. |
50 | GUGGENHEIM ETFs ANNUAL REPORT | SEE NOTES TO FINANCIAL STATEMENTS. |
GUGGENHEIM S&P MIDCAP 400® PURE GROWTH ETF |
FINANCIAL HIGHLIGHTS |
This table is presented to show selected data for a share outstanding throughout each period and to assist shareholders in evaluating the Fund’s performance for the periods presented.
Year Ended | Year Ended | Year Ended | Year Ended | Year Ended | ||||||||||||||||
Per Share Data: | ||||||||||||||||||||
Net asset value, beginning of period | $ | 128.31 | $ | 123.30 | $ | 115.31 | $ | 88.25 | $ | 82.17 | ||||||||||
Income from investment operations: | ||||||||||||||||||||
Net investment income(loss)a | 0.59 | 0.70 | 0.75 | 1.02 | 0.20 | |||||||||||||||
Net (loss) gain on investments (realized and unrealized) | (9.10 | ) | 5.10 | 7.93 | 27.10 | 6.04 | ||||||||||||||
Total from investment operations | (8.51 | ) | 5.80 | 8.68 | 28.12 | 6.24 | ||||||||||||||
Less distributions from: | ||||||||||||||||||||
Net investment income | (0.58 | ) | (0.71 | ) | (0.69 | ) | (1.06 | ) | (0.16 | ) | ||||||||||
Return of capital | — | (0.08 | ) | — | — | — | ||||||||||||||
Total distributions to shareholders | (0.58 | ) | (0.79 | ) | (0.69 | ) | (1.06 | ) | (0.16 | ) | ||||||||||
Net asset value, end of period | $ | 119.22 | $ | 128.31 | $ | 123.30 | $ | 115.31 | $ | 88.25 | ||||||||||
Total Returnb | (6.65 | %) | 4.71 | % | 7.53 | % | 32.07 | % | 7.60 | % | ||||||||||
Ratios/Supplemental Data: | ||||||||||||||||||||
Net assets, end of period (in thousands) | $ | 518,620 | $ | 769,872 | $ | 745,942 | $ | 737,971 | $ | 511,881 | ||||||||||
Ratio to average net assets of: | ||||||||||||||||||||
Net investment income(loss) | 0.48 | % | 0.54 | % | 0.62 | % | 1.01 | % | 0.23 | % | ||||||||||
Total expenses | 0.35 | % | 0.35 | % | 0.35 | % | 0.35 | % | 0.35 | % | ||||||||||
Portfolio turnover ratec | 78 | % | 102 | % | 75 | % | 72 | % | 56 | % | ||||||||||
a | Based on average shares outstanding. |
b | Total investment return is calculated assuming an initial investment made at the net asset value at the beginning of the period, reinvestment of all dividends and distribution at net asset value during the period, and redemption on the last day of the period. Transaction fees are not reflected in the calculation of total investment return. |
c | Portfolio turnover does not include securities received or delivered from processing creations or redemptions. |
SEE NOTES TO FINANCIAL STATEMENTS. | GUGGENHEIM ETFs ANNUAL REPORT | 51 |
GUGGENHEIM S&P SMALLCAP 600® PURE VALUE ETF |
FINANCIAL HIGHLIGHTS |
This table is presented to show selected data for a share outstanding throughout each period and to assist shareholders in evaluating the Fund’s performance for the periods presented.
Year Ended | Year Ended | Year Ended | Year Ended | Year Ended | ||||||||||||||||
Per Share Data: | ||||||||||||||||||||
Net asset value, beginning of period | $ | 57.76 | $ | 62.54 | $ | 57.37 | $ | 40.04 | $ | 35.50 | ||||||||||
Income from investment operations: | ||||||||||||||||||||
Net investment income(loss)a | 0.47 | 0.71 | 0.44 | 0.56 | 0.25 | |||||||||||||||
Net gain (loss) on investments (realized and unrealized) | 2.69 | (4.79 | ) | 5.14 | 17.40 | 4.56 | ||||||||||||||
Total from investment operations | 3.16 | (4.08 | ) | 5.58 | 17.96 | 4.81 | ||||||||||||||
Less distributions from: | ||||||||||||||||||||
Net investment income | (0.40 | ) | (0.70 | ) | (0.41 | ) | (0.63 | ) | (0.25 | ) | ||||||||||
Return of capital | — | — | — | — | (0.02 | ) | ||||||||||||||
Total distributions to shareholders | (0.40 | ) | (0.70 | ) | (0.41 | ) | (0.63 | ) | (0.27 | ) | ||||||||||
Net asset value, end of period | $ | 60.52 | $ | 57.76 | $ | 62.54 | $ | 57.37 | $ | 40.04 | ||||||||||
Total Returnb | 5.50 | % | (6.60 | %) | 9.73 | % | 45.20 | % | 13.52 | % | ||||||||||
Ratios/Supplemental Data: | ||||||||||||||||||||
Net assets, end of period (in thousands) | $ | 193,665 | $ | 150,190 | $ | 171,990 | $ | 123,350 | $ | 72,066 | ||||||||||
Ratio to average net assets of: | ||||||||||||||||||||
Net investment income(loss) | 0.83 | % | 1.15 | % | 0.73 | % | 1.14 | % | 0.65 | % | ||||||||||
Total expenses | 0.35 | % | 0.35 | % | 0.35 | % | 0.35 | % | 0.35 | % | ||||||||||
Portfolio turnover ratec | 51 | % | 52 | % | 51 | % | 43 | % | 48 | % | ||||||||||
a | Based on average shares outstanding. |
b | Total investment return is calculated assuming an initial investment made at the net asset value at the beginning of the period, reinvestment of all dividends and distribution at net asset value during the period, and redemption on the last day of the period. Transaction fees are not reflected in the calculation of total investment return. |
c | Portfolio turnover does not include securities received or delivered from processing creations or redemptions. |
52 | GUGGENHEIM ETFs ANNUAL REPORT | SEE NOTES TO FINANCIAL STATEMENTS. |
GUGGENHEIM S&P SMALLCAP 600® PURE GROWTH ETF |
FINANCIAL HIGHLIGHTS |
This table is presented to show selected data for a share outstanding throughout each period and to assist shareholders in evaluating the Fund’s performance for the periods presented.
Year Ended | Year Ended | Year Ended | Year Ended | Year Ended | ||||||||||||||||
Per Share Data: | ||||||||||||||||||||
Net asset value, beginning of period | $ | 85.26 | $ | 80.56 | $ | 74.23 | $ | 54.34 | $ | 49.82 | ||||||||||
Income from investment operations: | ||||||||||||||||||||
Net investment income(loss)a | 0.79 | 0.47 | 0.31 | 0.59 | 0.20 | |||||||||||||||
Net gain (loss) on investments (realized and unrealized) | (2.69 | ) | 4.70 | 6.33 | 19.87 | 4.50 | ||||||||||||||
Total from investment operations | (1.90 | ) | 5.17 | 6.64 | 20.46 | 4.70 | ||||||||||||||
Less distributions from: | ||||||||||||||||||||
Net investment income | (0.71 | ) | (0.47 | ) | (0.31 | ) | (0.54 | ) | (0.18 | ) | ||||||||||
Return of capital | — | (— | )d | — | (0.03 | ) | — | |||||||||||||
Total distributions to shareholders | (0.71 | ) | (0.47 | ) | (0.31 | ) | (0.57 | ) | (0.18 | ) | ||||||||||
Net asset value, end of period | $ | 82.65 | $ | 85.26 | $ | 80.56 | $ | 74.23 | $ | 54.34 | ||||||||||
Total Returnb | (2.20 | %) | 6.42 | % | 8.96 | % | 37.94 | % | 9.44 | % | ||||||||||
Ratios/Supplemental Data: | ||||||||||||||||||||
Net assets, end of period (in thousands) | $ | 152,910 | $ | 225,933 | $ | 104,723 | $ | 107,630 | $ | 73,359 | ||||||||||
Ratio to average net assets of: | ||||||||||||||||||||
Net investment income(loss) | 0.97 | % | 0.55 | % | 0.39 | % | 0.94 | % | 0.38 | % | ||||||||||
Total expenses | 0.35 | % | 0.35 | % | 0.35 | % | 0.35 | % | 0.35 | % | ||||||||||
Portfolio turnover ratec | 92 | % | 62 | % | 78 | % | 73 | % | 44 | % | ||||||||||
a | Based on average shares outstanding. |
b | Total investment return is calculated assuming an initial investment made at the net asset value at the beginning of the period, reinvestment of all dividends and distribution at net asset value during the period, and redemption on the last day of the period. Transaction fees are not reflected in the calculation of total investment return. |
c | Portfolio turnover does not include securities received or delivered from processing creations or redemptions. |
d | Less than $0.01 per share. |
SEE NOTES TO FINANCIAL STATEMENTS. | GUGGENHEIM ETFs ANNUAL REPORT | 53 |
NOTES TO FINANCIAL STATEMENTS |
1. Organization and Significant Accounting Policies
Organization
Rydex ETF Trust (the “Trust”) is registered with the SEC under the Investment Company Act of 1940 (the “1940 Act”), as an open-ended investment company of the series type, and is authorized to issue an unlimited number of no par value shares. Each portfolio represents a separate series of beneficial interest in the Trust (each a “Fund”, and collectively, the “Funds”), each a non-diversified investment company. The Trust was organized as a Delaware statutory trust on November 22, 2002. At October 31, 2016, the Trust consisted of twenty-two funds.
The financial statements herein relate to the following Funds, whose investment objective is to replicate as closely as possible, before fees and expenses, the daily performance of an index representing publicly traded equity securities (the “Underlying Index”) as follows:
Fund | Underlying Index |
Guggenheim S&P 500® Top 50 ETF | S&P 500® Top 50 Index |
Guggenheim S&P 500® Pure Value ETF | S&P 500® Pure Value Index |
Guggenheim S&P 500® Pure Growth ETF | S&P 500® Pure Growth Index |
Guggenheim S&P MidCap 400® Pure Value ETF | S&P MidCap 400® Pure Value Index |
Guggenheim S&P MidCap 400® Pure Growth ETF | S&P MidCap 400® Pure Growth Index |
Guggenheim S&P SmallCap 600® Pure Value ETF | S&P SmallCap 600® Pure Value Index |
Guggenheim S&P SmallCap 600® Pure Growth ETF | S&P SmallCap 600® Pure Growth Index |
The Funds seek to achieve their objective by investing in common stocks that comprise the Underlying Index. The Funds use a “replication” strategy to track the Underlying Index. Replication refers to investing in substantially all of the securities in the Underlying Index in approximately the same proportions as in the Underlying Index.
The Funds operate as index funds and are not actively managed. Adverse performance of a security in the Funds’ portfolio will ordinarily not result in the elimination of the security from the Funds’ portfolio.
The Funds issue and redeem shares on a continuous basis, at net asset value per share (“NAV”), only in aggregation of 50,000 shares (a “Creation Unit”). Creation Units are issued and redeemed principally in-kind for securities included in the Underlying Index.
The Funds invest in various investments which are exposed to risk, such as market risk. Due to the level of risk associated with certain investments it is at least reasonably possible that changes in the values of investment securities will occur in the near term and that such changes could materially affect amounts reported in the financial statements.
Guggenheim Investments (“GI”) provides advisory services and Rydex Fund Services, LLC (“RFS”) provides administrative services to the Trust. Guggenheim Funds Distributors, LLC (“GFD”) acts as principal underwriter for the Trust. GI and GFD are affiliated entities; RFS ceased to be an affiliate of GI as of October 4, 2016, when it was acquired by MUFG Investor Services. In connection with its acquisition, RFS changed its name to MUFG Investor Services (US), LLC (“MUIS”). This change has no impact on the financial statements of the Funds.
Significant Accounting Policies
The Funds operate as investment companies and, accordingly, follow the investment company accounting and reporting guidance of the Financial Accounting Standards Board (“FASB”) Accounting Standards Codification Topic 946 Financial Services – Investment Companies.
The following significant accounting policies are in conformity with U.S. generally accepted accounting principles (“U.S. GAAP”) and are consistently followed by the Trust. This requires management to make estimates and assumptions that affect the reported amount of assets and liabilities, contingent assets and liabilities at the date of the financial statements, and the reported amounts of revenues and expenses during the reporting period. Actual results could differ from these estimates. All time references are based on Eastern Time.
The NAV of a fund is calculated by dividing the market value of the fund’s securities and other assets, less all liabilities, by the number of outstanding shares of the fund.
A. The Board of Trustees of the Funds (the “Board”) has adopted policies and procedures for the valuation of the Funds’ investments (the “Valuation Procedures”). Pursuant to the Valuation Procedures, the Board has delegated to a valuation committee, consisting of representatives from Guggenheim’s investment management, fund administration, legal and compliance departments (the “Valuation Committee”), the day-to-day responsibility for implementing the Valuation Procedures, including, under most circumstances, the responsibility for determining the fair value of the Funds' securities and/or other assets.
Valuations of the Funds’ securities are supplied primarily by pricing services appointed pursuant to the processes set forth in the Valuation Procedures. The Valuation Committee convenes monthly, or more frequently as needed, to review the valuation of all assets which have been fair valued for reasonableness. The Funds’ officers, through the Valuation Committee and consistent with the
54 | GUGGENHEIM ETFs ANNUAL REPORT |
NOTES TO FINANCIAL STATEMENTS (continued) |
monitoring and review responsibilities set forth in the Valuation Procedures, regularly review procedures used and valuations provided by the pricing services.
If the pricing service cannot or does not provide a valuation for a particular investment or such valuation is deemed unreliable, such investment is fair valued by the Valuation Committee.
Equity securities listed on an exchange (New York Stock Exchange (“NYSE”) or American Stock Exchange) are valued at the last quoted sales price as of the close of business on the NYSE, usually 4:00 p.m. on the valuation date. Equity securities listed on the NASDAQ market system are valued at the NASDAQ Official Closing Price on the valuation date, which may not necessarily represent the last sale price. If there has been no sale on such exchange or NASDAQ on a given day, the security is valued at the closing bid price on that day.
The Funds invest in money market mutual funds, which are valued at their NAV.
Investments for which market quotations are not readily available are fair-valued as determined in good faith by GI under the direction of the Board using methods established or ratified by the Board. Valuations in accordance with these methods are intended to reflect each security’s (or asset’s) “fair value.” Each such determination is based on a consideration of all relevant factors, which are likely to vary from one pricing context to another. Examples of such factors may include, but are not limited to market prices; sale prices; broker quotes; and models which derive prices based on inputs such as prices of securities with comparable maturities and characteristics, or based on inputs such as anticipated cash flows or collateral, spread over Treasuries, and other information analysis.
B. Security transactions are recorded on the trade date for financial reporting purposes. Realized gains and losses from securities transactions are recorded using the identified cost basis. Proceeds from lawsuits related to investment holdings are recorded as realized gains in the respective Fund. Dividend income is recorded on the ex-dividend date, net of applicable taxes withheld by foreign countries. Taxable non-cash dividends are recorded as dividend income. Interest income, including amortization of premiums and accretion of discounts, is accrued on a daily basis. Dividend income from REITs is recorded based on the income included in the distributions received from the REIT investments using published REIT classifications, including some management estimates when actual amounts are not available. Distributions received in excess of this estimated amount are recorded as a reduction of the cost of investments or reclassified to capital gains. The actual amounts of income, return of capital, and capital gains are only determined by each REIT after its fiscal year-end, and may differ from the estimated amounts.
C. Distributions of net investment income and net realized gains, if any, are declared and paid at least annually. Distributions are recorded on the ex-dividend date and are determined in accordance with income tax regulations which may differ from U.S. GAAP.
D. The Funds may leave cash overnight in their cash account with the custodian. Periodically, a Fund may have cash due to the custodian bank as an overdraft balance. A fee is incurred on this overdraft, calculated by multiplying the overdraft by a rate based on the federal funds rate.
E. The Funds may enter into repurchase agreements with financial institutions. In a repurchase agreement, a Fund buys a security and the seller simultaneously agrees to repurchase the security on a specified future date at an agreed-upon price. The repurchase price reflects an agreed-upon interest rate during the time the Fund’s money is invested in the security. Because the security constitutes collateral for the repurchase obligation, a repurchase agreement can be considered a collateralized loan. The Funds follow certain procedures designed to minimize the risks inherent in such agreements. These procedures include effecting repurchase transactions only with large, well capitalized and well-established financial institutions whose condition will be continually monitored by GI. In addition, the value of the collateral underlying the repurchase agreement will always be at least equal to the repurchase price, including any accrued interest earned on the repurchase agreement. In the event of a default or bankruptcy by a selling financial institution, the Funds will seek to liquidate such collateral. However, the exercising of the Funds right to liquidate such collateral could involve certain costs or delays and, to the extent that proceeds from any sale upon a default of the obligation to repurchase were less than the repurchase price, the Funds could suffer a loss. It is the current policy of the Funds not to invest in repurchase agreements that do not mature within seven days if any such investment, together with any other illiquid assets held by the Funds, amounts to more than 15% of a Fund’s net assets. The investments of the Funds in repurchase agreements, at times, may be substantial when, in the view of GI, liquidity or other considerations so warrant.
F. Under the Funds’ organizational documents, the Trustees and Officers are indemnified against certain liabilities arising out of the performance of their duties to the Trust. In addition, throughout the normal course of business, the Funds enter into contracts that contain a variety of representations and warranties which provide general indemnifications. The Funds’ maximum exposure under these arrangements is unknown, as this would involve future claims that may be made against the Funds and/or their affiliates that have not yet occurred. However, based on experience, the Funds expect the risk of loss to be remote.
GUGGENHEIM ETFs ANNUAL REPORT | 55 |
NOTES TO FINANCIAL STATEMENTS (continued) |
2. Capital
There is a minimum transaction fee per transaction to those persons purchasing or redeeming Creation Units. An additional charge of up to three times the standard transaction fee may be imposed for purchases and redemptions effected outside the National Securities Clearing Corporation usual clearing process or for cash. Such transactions are generally permitted on an in-kind basis, with a balancing cash component to equate the transaction to the NAV of the Fund on the transaction date. Transaction fees are not charged to or paid by the Funds. The minimum transaction fees are:
Fund | Minimum Transaction Fee | |||
Guggenheim S&P 500® Top 50 ETF | $ | 500 | ||
Guggenheim S&P 500® Pure Value ETF | 1,000 | |||
Guggenheim S&P 500® Pure Growth ETF | 1,000 | |||
Guggenheim S&P MidCap 400® Pure Value ETF | 750 | |||
Guggenheim S&P MidCap 400® Pure Growth ETF | 750 | |||
Guggenheim S&P SmallCap 600® Pure Value ETF | 1,000 | |||
Guggenheim S&P SmallCap 600® Pure Growth ETF | 1,000 | |||
3. Fees and Other Transactions with Affiliates
GI determines the composition of the portfolio of securities that must be delivered in exchange for the issuance of Creation Units and periodically adjusts the composition of the portfolio of the Funds to conform to changes in the composition of the relevant index. For these services, GI receives a management fee at the annual rate shown below as a percentage of the average daily net assets of the Funds.
Fund | Advisory Fee | |||
Guggenheim S&P 500® Top 50 ETF | 0.20 | % | ||
Guggenheim S&P 500® Pure Value ETF | 0.35 | % | ||
Guggenheim S&P 500® Pure Growth ETF | 0.35 | % | ||
Guggenheim S&P MidCap 400® Pure Value ETF | 0.35 | % | ||
Guggenheim S&P MidCap 400® Pure Growth ETF | 0.35 | % | ||
Guggenheim S&P SmallCap 600® Pure Value ETF | 0.35 | % | ||
Guggenheim S&P SmallCap 600® Pure Growth ETF | 0.35 | % | ||
GI pays all expenses of the Funds, including the cost of transfer agency, custody, fund administration, fund accounting, legal, audit and other services, except: interest, taxes, distribution fees or expenses and extraordinary expenses.
Under a Fund Administration Agreement with the Trust, MUIS provides various administrative and financial reporting services for the Funds. GI compensates MUIS directly for this service.
Under a Fund Accounting Agreement with the Trust, BNYMellon maintains the books and records of the Funds. Under a Custodian Agreement with the Trust, BNYMellon maintains cash, securities and other assets of the Funds in a separate account for the Funds, keeps all necessary accounts and records, and provides other services. BNYMellon is required, upon the order of the Trust, to deliver securities held by the custodian and to make payments for securities purchased by the Trust for the Funds. Pursuant to a Transfer Agency and Service Agreement with the Trust, BNYMellon acts as a transfer agent for the Trust’s authorized and issued shares of beneficial interest, and as dividend disbursing agent of the Trust. GI compensates BNYMellon directly for the foregoing services.
The Funds have adopted a Distribution Plan (the “Plan”) that allows the Funds to pay distribution fees to GFD and other firms that provide distribution services (“Service Providers”). If a Service Provider provides distribution services, the Funds will pay distribution fees to GFD at an annual rate not to exceed 0.25% of average daily net assets, pursuant to Rule 12b-1 of the 1940 Act. GFD will, in turn, pay the Service Provider out of its fees. No such fee is currently charged to the Funds.
Certain trustees and officers of the Trust are also officers of GI and GFD.
4. Fair Value Measurement
In accordance with U.S. GAAP, fair value is defined as the price that the Funds would receive to sell an investment or pay to transfer a liability in an orderly transaction with an independent buyer in the principal market, or in the absence of a principal market, the most advantageous market for the investment or liability. U.S. GAAP establishes a three-tier fair value hierarchy based on the types of inputs used to value assets and liabilities and requires corresponding disclosure. The hierarchy and the corresponding inputs are summarized below:
Level 1 | — quoted prices in active markets for identical securities. |
Level 2 | — other significant observable inputs (including quoted prices for similar securities, interest rates, prepayment speeds, credit risk, etc.). |
Level 3 | — significant unobservable inputs (including the fund’s own assumptions used to determine the fair value of investments). |
The types of inputs available depend on a variety of factors, such as the type of security and the characteristics of the markets in which it trades, if any. Fair valuation determinations that rely on fewer or no observable inputs require greater judgment. Accordingly, fair value determinations for Level 3 securities require the greatest amount of judgment.
The inputs or methodologies used for valuing securities are not necessarily an indication of the risk associated with investing in those securities. The suitability of the techniques and sources employed to determine fair valuation are regularly monitored and subject to change.
56 | GUGGENHEIM ETFs ANNUAL REPORT |
NOTES TO FINANCIAL STATEMENTS (continued) |
5. Portfolio Securities Loaned
Each Fund may lend portfolio securities to certain creditworthy borrowers, including the Funds’ securities lending agent. The loans are collateralized at all times by cash and/or high grade debt obligations in an amount at least equal to 102% of the market value of domestic securities loaned and 105% of foreign securities loaned as determined at the close of business on the preceding business day. The cash collateral received is held in a separately managed account established for each respective Fund and maintained by the lending agent exclusively for the investment of securities lending cash collateral on behalf of each Fund. The separately managed accounts invest in short-term investments valued at amortized cost, which approximates market value. Each Fund receives compensation for lending securities from interest or dividends earned on the cash, cash equivalents or U.S. government securities held as collateral, net of fee rebates paid to the borrower plus reasonable administrative and custody fees paid to the lending agent. Such compensation is accrued daily and payable to the Fund monthly. The dividend and interest income earned on the securities loaned is accounted for in the same manner as other dividend and interest income. The borrower pays to the Funds an amount equal to any dividends or interest received on loaned securities. These payments from the borrower are not eligible for reduced tax rates as “qualified dividend income” under the Jobs and Growth Tax Reconciliation Act of 2003. The Funds retain all or a portion of the interest received on investment of cash collateral or receives a fee from the borrower. Lending portfolio securities could result in a loss or delay in recovering each Fund’s securities if the borrower defaults. The securities lending income earned by the Funds are disclosed on the Statements of Operations.
At October 31, 2016, the Funds participated in securities lending as follows:
Fund | Value of | Cash | Non-Cash | Total | ||||||||||||
Guggenheim S&P 500® Pure Value ETF | $ | 57,980,569 | $ | 20,517,856 | $ | 40,242,806 | $ | 60,760,662 | ||||||||
Guggenheim S&P 500® Pure Growth ETF | 79,278,590 | 39,871,125 | 42,205,298 | 82,076,423 | ||||||||||||
Guggenheim S&P MidCap 400® Pure Value ETF | 33,075,017 | 22,419,031 | 11,708,326 | 34,127,357 | ||||||||||||
Guggenheim S&P MidCap 400® Pure Growth ETF | 84,139,894 | 52,550,660 | 34,156,417 | 86,707,077 | ||||||||||||
Guggenheim S&P SmallCap 600® Pure Value ETF | 17,500,053 | 12,574,158 | 5,776,554 | 18,350,712 | ||||||||||||
Guggenheim S&P SmallCap 600® Pure Growth ETF | 30,189,103 | 23,416,527 | 7,319,755 | 30,736,282 | ||||||||||||
The following represents a breakdown of the collateral for the joint repurchase agreements at October 31, 2016:
Counterparty and | Face Value | Repurchase Price | Collateral | Par Value | Fair Value | ||||||||||||
Citigroup Global | Various U.S. Government obligations and | ||||||||||||||||
0.34% | U.S. Government | ||||||||||||||||
Due 11/01/16 | $ | 39,896,264 | $ | 39,896,264 | agency securities | $ | 56,571,791 | $ | 40,694,669 | ||||||||
BNP Paribas | Various U.S. Government obligations and | ||||||||||||||||
0.34% | U.S. Government | ||||||||||||||||
Due 11/01/16 | 39,896,264 | 39,896,264 | agency securities | 142,026,569 | 40,694,189 | ||||||||||||
Merrill Lynch, Pierce, | Various U.S. Government obligations and | ||||||||||||||||
0.33% | U.S. Government | ||||||||||||||||
Due 11/01/16 | 39,896,264 | 39,896,264 | agency securities | 56,554,325 | 40,694,189 | ||||||||||||
HSBC Securities | Various U.S. Government obligations and | ||||||||||||||||
0.30% | U.S. Government | ||||||||||||||||
Due 11/01/16 | 39,896,264 | 39,896,264 | agency securities | 107,849,219 | 40,694,421 | ||||||||||||
Credit Suisse Securities | Various U.S. Government obligations and | ||||||||||||||||
0.31% | U.S. Government | ||||||||||||||||
Due 11/01/16 | 11,764,301 | 11,764,301 | agency securities | 9,278,002 | 12,060,074 | ||||||||||||
GUGGENHEIM ETFs ANNUAL REPORT | 57 |
NOTES TO FINANCIAL STATEMENTS (continued) |
In the event of counterparty default, the Funds have the right to collect the collateral to offset losses incurred. There is potential loss to the Funds in the event the Funds are delayed or prevented from exercising their rights to dispose of the collateral securities, including the risk of a possible decline in the value of the underlying securities during the period while the Funds seek to assert their rights. GI, acting under the supervision of the Board, reviews the value of the collateral and the creditworthiness of those banks and dealers to evaluate potential risks.
6. Federal Income Tax Information
The Funds intend to comply with the provisions of Subchapter M of the Internal Revenue Code applicable to regulated investment companies and will distribute substantially all taxable net investment income and capital gains sufficient to relieve the Funds from all, or substantially all, federal income, excise and state income taxes. Therefore, no provision for federal or state income tax is required.
Tax positions taken or expected to be taken in the course of preparing the Funds' tax returns are evaluated to determine whether the tax positions are “more-likely-than-not” of being sustained by the applicable tax authority. Tax positions not deemed to meet the more-likely-than-not threshold would be recorded as a tax benefit or expense in the current year. Management has analyzed the Funds' tax positions taken, or to be taken, on federal income tax returns for all open tax years, and has concluded that no provision for income tax is required in the Funds' financial statements. The Funds' federal tax returns are subject to examination by the Internal Revenue Service for a period of three years after they are filed.
Tax basis capital losses in excess of capital gains are carried forward to offset future net capital gains. For the year ended October 31, 2016, the following capital loss carryforward amounts were expired:
Fund | Amount | |||
Guggenheim S&P 500® Top 50 ETF | $ | 32,651,414 | ||
The tax character of distributions paid during the year ended October 31, 2016 was as follows:
Fund | Ordinary | Return of | Total | |||||||||
Guggenheim S&P 500® Top 50 ETF | $ | 12,305,640 | $ | — | $ | 12,305,640 | ||||||
Guggenheim S&P 500® Pure Value ETF | 16,846,207 | — | 16,846,207 | |||||||||
Guggenheim S&P 500® Pure Growth ETF | 12,804,542 | — | 12,804,542 | |||||||||
Guggenheim S&P MidCap 400® Pure Value ETF | 1,503,674 | — | 1,503,674 | |||||||||
Guggenheim S&P MidCap 400® Pure Growth ETF | 3,174,670 | — | 3,174,670 | |||||||||
Guggenheim S&P SmallCap 600® Pure Value ETF | 1,222,224 | — | 1,222,224 | |||||||||
Guggenheim S&P SmallCap 600® Pure Growth ETF | 1,779,427 | — | 1,779,427 | |||||||||
The tax character of distributions paid during the year ended October 31, 2015 was as follows:
Fund | Ordinary | Return of | Total | |||||||||
Guggenheim S&P 500® Top 50 ETF | $ | 11,355,966 | $ | — | $ | 11,355,966 | ||||||
Guggenheim S&P 500® Pure Value ETF | 22,046,039 | — | 22,046,039 | |||||||||
Guggenheim S&P 500® Pure Growth ETF | 12,287,095 | — | 12,287,095 | |||||||||
Guggenheim S&P MidCap 400® Pure Value ETF | 1,909,844 | — | 1,909,844 | |||||||||
Guggenheim S&P MidCap 400® Pure Growth ETF | 4,173,726 | 467,016 | 4,640,742 | |||||||||
Guggenheim S&P SmallCap 600® Pure Value ETF | 1,976,663 | — | 1,976,663 | |||||||||
Guggenheim S&P SmallCap 600® Pure Growth ETF | 849,033 | 5,968 | 855,001 | |||||||||
58 | GUGGENHEIM ETFs ANNUAL REPORT |
NOTES TO FINANCIAL STATEMENTS (continued) |
The tax character of distributable earnings/(accumulated losses) at October 31, 2016 was as follows:
Fund | Undistributed | Undistributed | Accumulated | Net Unrealized | Total | |||||||||||||||
Guggenheim S&P 500® Top 50 ETF | $ | 1,017,450 | $ | — | $ | (73,579,215 | ) | $ | 65,391,945 | $ | (7,169,820 | ) | ||||||||
Guggenheim S&P 500® Pure Value ETF | 915,703 | — | (101,049,974 | ) | (25,677,471 | ) | (125,811,742 | ) | ||||||||||||
Guggenheim S&P 500® Pure Growth ETF | 1,926,363 | — | (164,432,898 | ) | 154,972,696 | (7,533,839 | ) | |||||||||||||
Guggenheim S&P MidCap 400® Pure Value ETF | 62,225 | — | (18,181,742 | ) | 8,265,688 | (9,853,829 | ) | |||||||||||||
Guggenheim S&P MidCap 400® Pure Growth ETF | 40,670 | — | (44,468,541 | ) | (9,673,509 | ) | (54,101,380 | ) | ||||||||||||
Guggenheim S&P SmallCap 600® Pure Value ETF | 43,617 | — | (43,334,388 | ) | 5,459,430 | (37,831,341 | ) | |||||||||||||
Guggenheim S&P SmallCap 600® Pure Growth ETF | 61,092 | — | (26,051,301 | ) | (2,234,238 | ) | (28,224,447 | ) | ||||||||||||
For Federal income tax purposes, capital loss carryforwards represent realized losses of the Funds that may be carried forward and applied against future capital gains. For taxable years beginning on or before December 22, 2010, such capital losses may be carried forward for a maximum of eight years. Under the RIC Modernization Act of 2010, the Funds are permitted to carry forward capital losses incurred in taxable years beginning after December 22, 2010 for an unlimited period. However, any losses incurred during those taxable years must be utilized prior to the losses incurred in pre-enactment taxable years. As a result of this ordering rule, pre-enactment capital loss carryforwards may be more likely to expire unused. Additionally, post-enactment capital losses that are carried forward will retain their character as either short-term or long-term capital losses rather than being considered all short-term as under previous law. As of October 31, 2016, capital loss carryforwards for the Funds were as follows:
Unlimited | ||||||||||||||||||||||||
Fund | Expires in | Expires in | Expires in | Short-Term | Long-Term | Capital Loss | ||||||||||||||||||
Guggenheim S&P 500® Top 50 ETF | $ | (51,313,952 | ) | $ | (10,584,384 | ) | $ | (3,619,667 | ) | $ | (3,487,327 | ) | $ | (4,573,885 | ) | $ | (73,579,215 | ) | ||||||
Guggenheim S&P 500® Pure Value ETF | (2,158,232 | ) | — | — | (38,037,579 | ) | (60,854,163 | ) | (101,049,974 | ) | ||||||||||||||
Guggenheim S&P 500® Pure Growth ETF | — | — | — | (116,066,054 | ) | (48,366,844 | ) | (164,432,898 | ) | |||||||||||||||
Guggenheim S&P MidCap 400® Pure | (1,163,866 | ) | — | — | (11,291,550 | ) | (5,726,326 | ) | (18,181,742 | ) | ||||||||||||||
Guggenheim S&P MidCap 400® Pure | — | — | — | (42,215,668 | ) | (2,252,873 | ) | (44,468,541 | ) | |||||||||||||||
Guggenheim S&P SmallCap 600® Pure | (5,771,118 | ) | (8,325,244 | ) | — | (19,000,516 | ) | (10,237,510 | ) | (43,334,388 | ) | |||||||||||||
Guggenheim S&P SmallCap 600® Pure | — | — | — | (24,196,920 | ) | (1,854,381 | ) | (26,051,301 | ) | |||||||||||||||
In order to present paid-in-capital, undistributed net investment income and accumulated net realized gain (loss) on investments on the statement of assets and liabilities that more closely represent their tax character, certain adjustments have been made to these accounts. These adjustments have no effect on the net assets or NAV. The most significant of these adjustments are for net capital gains (losses) resulting from in-kind redemptions, return of capital on investments, excise tax paid, expiring losses and adjustments on the disposition of REITs. For the year ended October 31, 2016, the adjustments for the Funds were as follows:
Fund | Paid-In | Undistributed | Accumulated | |||||||||
Guggenheim S&P 500® Top 50 ETF | $ | (2,423,782 | ) | $ | 4,239 | $ | 2,419,543 | |||||
Guggenheim S&P 500® Pure Value ETF | 33,106,579 | 92,921 | (33,199,500 | ) | ||||||||
Guggenheim S&P 500® Pure Growth ETF | 144,743,182 | 285,911 | (145,029,093 | ) | ||||||||
Guggenheim S&P MidCap 400® Pure Value ETF | 6,234,381 | (12,902 | ) | (6,221,479 | ) | |||||||
Guggenheim S&P MidCap 400® Pure Growth ETF | 49,925,738 | 168,573 | (50,094,311 | ) | ||||||||
Guggenheim S&P SmallCap 600® Pure Value ETF | 20,037,180 | (14,208 | ) | (20,022,972 | ) | |||||||
Guggenheim S&P SmallCap 600® Pure Growth ETF | 9,448,026 | 23,125 | (9,471,151 | ) | ||||||||
GUGGENHEIM ETFs ANNUAL REPORT | 59 |
NOTES TO FINANCIAL STATEMENTS (continued) |
At October 31, 2016, the identified cost of investments in securities owned by each Fund for Federal income tax purposes and the gross unrealized appreciation and depreciation were as follows:
Fund | Tax | Tax | Tax | Net | ||||||||||||
Guggenheim S&P 500® Top 50 ETF | $ | 511,897,342 | $ | 94,129,702 | $ | (28,737,757 | ) | $ | 65,391,945 | |||||||
Guggenheim S&P 500® Pure Value ETF | 765,489,945 | 53,036,525 | (78,713,996 | ) | (25,677,471 | ) | ||||||||||
Guggenheim S&P 500® Pure Growth ETF | 1,653,304,972 | 232,011,915 | (77,039,219 | ) | 154,972,696 | |||||||||||
Guggenheim S&P MidCap 400® Pure Value ETF | 179,894,323 | 19,107,094 | (10,841,406 | ) | 8,265,688 | |||||||||||
Guggenheim S&P MidCap 400® Pure Growth ETF | 580,873,972 | 49,040,579 | (58,714,088 | ) | (9,673,509 | ) | ||||||||||
Guggenheim S&P SmallCap 600® Pure Value ETF | 200,763,376 | 30,583,386 | (25,123,956 | ) | 5,459,430 | |||||||||||
Guggenheim S&P SmallCap 600® Pure Growth ETF | 178,563,462 | 13,805,584 | (16,039,822 | ) | (2,234,238 | ) | ||||||||||
7. Investment Transactions
For the year ended October 31, 2016, the Funds had investments transactions in-kind associated with subscriptions and redemptions as follows:
Fund | Subscriptions | Redemptions | ||||||
Guggenheim S&P 500® Top 50 ETF | $ | 173,117,416 | $ | 108,407,985 | ||||
Guggenheim S&P 500® Pure Value ETF | 395,777,330 | 475,054,478 | ||||||
Guggenheim S&P 500® Pure Growth ETF | 422,080,559 | 927,821,515 | ||||||
Guggenheim S&P MidCap 400® Pure Value ETF | 94,458,594 | 36,111,706 | ||||||
Guggenheim S&P MidCap 400® Pure Growth ETF | 134,425,774 | 326,652,649 | ||||||
Guggenheim S&P SmallCap 600® Pure Value ETF | 113,427,386 | 79,654,637 | ||||||
Guggenheim S&P SmallCap 600® Pure Growth ETF | 54,744,158 | 112,670,185 | ||||||
For the year ended October 31, 2016, the cost of purchases and proceeds from sales of investment securities, excluding government securities, short-term investments and in-kind transactions, were as follows:
Fund | Purchases | Sales | ||||||
Guggenheim S&P 500® Top 50 ETF | $ | 37,883,920 | $ | 38,830,928 | ||||
Guggenheim S&P 500® Pure Value ETF | 335,497,732 | 334,276,502 | ||||||
Guggenheim S&P 500® Pure Growth ETF | 1,321,499,392 | 1,316,240,004 | ||||||
Guggenheim S&P MidCap 400® Pure Value ETF | 54,087,998 | 53,727,261 | ||||||
Guggenheim S&P MidCap 400® Pure Growth ETF | 497,347,930 | 498,080,128 | ||||||
Guggenheim S&P SmallCap 600® Pure Value ETF | 84,200,650 | 83,299,096 | ||||||
Guggenheim S&P SmallCap 600® Pure Growth ETF | 173,475,753 | 173,754,323 | ||||||
The Funds are permitted to purchase or sell securities from or to certain affiliated funds under specified conditions outlined in procedures adopted by the Board. The procedures have been designed to ensure that any purchase or sale of securities by a Fund from or to another fund or portfolio that is or could be considered an affiliate by virtue of having a common investment adviser (or affiliated investment advisers), common Trustees and/or common officers complies with Rule 17a-7 of the 1940 Act. Further, as defined under these procedures, each transaction is effected at the current market price to save costs, where permissible. For the year ended October 31, 2016, the Funds engaged in purchases and sales of securities, pursuant to Rule 17a-7 of the 1940 Act, as follows:
Fund | Purchases | Sales | Realized Gain (Loss) | |||||||||
Guggenheim S&P 500® Pure Value ETF | $ | 34,468,652 | $ | 30,793,235 | $ | (17,414,358 | ) | |||||
Guggenheim S&P 500® Pure Growth ETF | 90,859,689 | 98,749,388 | (30,503,468 | ) | ||||||||
Guggenheim S&P MidCap 400® Pure Value ETF | 1,719,483 | 494,182 | (11,357 | ) | ||||||||
Guggenheim S&P MidCap 400® Pure Growth ETF | 494,182 | 6,436,415 | 95,261 | |||||||||
Guggenheim S&P SmallCap 600® Pure Value ETF | 5,936,624 | 7,188,016 | 513,590 | |||||||||
Guggenheim S&P SmallCap 600® Pure Growth ETF | 7,188,016 | 5,936,624 | (5,396,953 | ) | ||||||||
60 | GUGGENHEIM ETFs ANNUAL REPORT |
NOTES TO FINANCIAL STATEMENTS (continued) |
8. Legal Proceedings
Lyondell Chemical Company
In December 2011, Rydex ETF Trust was named as a defendant in Weisfelner, as Trustee of the LB Creditor Trust, v. Fund 1 (In re Lyondell Chemical Co.), Adv. Pro. No. 10-4609 (Bankr. S.D.N.Y.) (the “Creditor Trust Action”). Its funds may also be putative members of the proposed defendant classes in Weisfelner, as Trustee of the LB Litigation Trust v. A. Holmes & H. Holmes TTEE (In re Lyondell Co.), Adv. Pro. No. 10-5525 (Bankr. S.D.N.Y.) (the “Litigation Trust Action”) and Weisfelner, as Trustee of the LB Creditor Trust, v. Reichman (In re Lyondell Chemical Co.), Adv. Pro. No. 12-1570 (Bankr. S.D.N.Y.) (the “Reichman Action”).
Similar to the claims made in the Tribune matter, the complaints seek to have set aside and recovered as fraudulent transfers from former Lyondell Chemical Company (“Lyondell”) shareholders the consideration paid to them pursuant to the cash out merger of Lyondell shareholders in connection with the combination of Lyondell and Basell AF in 2007. Lyondell filed for bankruptcy in 2008. The Creditor Trust and Reichman Actions allege claims against the former Lyondell shareholders under state law for both constructive fraudulent transfer and intentional fraudulent transfer. The Litigation Trust Action alleges a claim against the former Lyondell shareholders under federal law for intentional fraudulent transfer.
On April 7, 2014, the plaintiff filed a Third Amended Complaint in the Creditor Trust Action, a Second Amended Complaint in the Litigation Trust Action and an Amended Complaint in the Reichman Action.
On May 8, 2014, the plaintiff in the Litigation Trust Action filed a motion to certify a defendant class generally comprised of all former Lyondell shareholders that received proceeds in exchange for their shares in the 2007 merger transaction.
On July 30, 2014, the defendants filed a motion to dismiss these lawsuits. The Bankruptcy Court held oral argument on the motions to dismiss and on the motion for class certification on January 14 and January 15, 2015. On September 15, 2015, the Bankruptcy Court denied the motion for class certification without prejudice to the plaintiff’s right to file a renewed motion.
On November 18, 2015, the Bankruptcy Court granted the defendants’ motion to dismiss the Litigation Trust Action and denied their motion to dismiss the Creditor Trust and Reichman Actions. The Bankruptcy Court entered final judgment dismissing the Litigation Trust Action, but the plaintiff appealed the dismissal to the U.S. District Court for the Southern District of New York. On July 27, 2016, the District Court reversed the Bankruptcy Court and reinstated the federal law intentional fraudulent transfer claim in the Litigation Trust Action and remanded to the Bankruptcy Court for further proceedings. On August 11, 2016, the shareholder defendants filed a motion for reconsideration and/or to certify an interlocutory appeal of the District Court’s opinion. On October 5, 2016, the District Court denied the motion for reconsideration and/or to certify an interlocutory appeal. In light of this ruling, the federal intentional fraudulent conveyance claim will move forward before the Bankruptcy Court, but a schedule for that case has not yet been set.
On May 4, 2016, the defendants filed a motion to dismiss, or in the alternative, for a stay of, the Creditor Trust and Reichman Actions in light of the U.S. Court of Appeals for the Second Circuit’s opinion affirming the dismissal of lawsuits filed against former Tribune shareholders involving state law constructive fraudulent conveyance claims arising out of the 2007 leveraged buyout of the Tribune Company. On July 20, 2016, the Bankruptcy Court issued a report and recommendation granting the defendants’ motion to dismiss. The U.S. District Court for the Southern District of New York has not yet accepted the Bankruptcy Court’s recommendation or entered a final judgment.
This lawsuit does not allege any wrongdoing on the part of Rydex ETF Trust. The following series of Rydex ETF Trust received cash proceeds from the merger in the following amounts: Guggenheim S&P Midcap 400® Pure Value ETF Fund - $572,640. At this stage of the proceedings, Rydex ETF Trust is not able to make a reliable prediction as to the outcome of this lawsuit or the effect, if any, on the fund’s net asset value.
Tribune Company
Rydex ETF Trust has been named as a defendant and a putative member of the proposed defendant class of shareholders in the case entitled Kirschner v. FitzSimons, No. 12-2652 (S.D.N.Y.) (formerly Official Committee of Unsecured Creditors of Tribune Co. v. FitzSimons, Adv. Pro. No. 10-54010 (Bankr. D. Del.)) (the “FitzSimons action”), as a result of ownership by certain series of the Rydex ETF Trust of shares in the Tribune Company (“Tribune”) in 2007, when Tribune effected a leveraged buyout transaction (“LBO”) by which Tribune converted to a privately-held company. In his complaint, the plaintiff has alleged that, in connection with the LBO, Tribune insiders and shareholders were overpaid for their Tribune stock using financing that the insiders knew would, and ultimately did, leave Tribune insolvent. The plaintiff has asserted claims against certain insiders, major shareholders, professional advisers, and others involved in the LBO. The plaintiff is also attempting to obtain from former Tribune shareholders, including Rydex ETF Trust, the proceeds they received in connection with the LBO.
GUGGENHEIM ETFs ANNUAL REPORT | 61 |
NOTES TO FINANCIAL STATEMENTS (concluded) |
In June 2011, a group of Tribune creditors filed multiple actions against former Tribune shareholders involving state law constructive fraudulent conveyance claims arising out of the 2007 LBO (the “SLCFC actions”). Rydex ETF Trust has been named as a defendant in one of the SLCFC actions: Deutsche Bank Trust Co. Americas v. McGurn, No. 12-0063 (S.D.N.Y.). In the SLCFC actions, the creditors seek to recover from Tribune’s former shareholders the proceeds received in connection with the 2007 LBO.
The FitzSimons action and the SLCFC actions have been consolidated with the majority of the other Tribune LBO-related lawsuits in a multidistrict litigation proceeding captioned In re Tribune Company Fraudulent Conveyance Litig., No. 11-md-2696 (S.D.N.Y.) (the “MDL Proceeding”).
On September 23, 2013, the District Court granted the defendants’ omnibus motion to dismiss the SLCFC actions, on the basis that the creditors lacked standing. On September 30, 2013, the creditors filed a notice of appeal of the September 23 order. On October 28, 2013, the defendants filed a joint notice of cross-appeal of that same order.
On May 23, 2014, the defendants filed motions to dismiss the FitzSimons action, including a global motion to dismiss Count I, which is the claim brought against former Tribune shareholders for intentional fraudulent conveyance under U.S. federal law. The Court has not yet issued a decision on any of these motions.
On March 29, 2016, the U.S. Court of Appeals for the Second Circuit issued its opinion on the appeal of the SLCFC actions. The appeals court affirmed the district court’s dismissal of those lawsuits, but on different grounds than the district court. The appeals court held that while the plaintiffs have standing under the U.S. Bankruptcy Code, their claims were preempted by Section 546(e) of the Bankruptcy Code—the statutory safe harbor for settlement payments. On April 12, 2016, the plaintiffs in the SLCFC actions filed a petition seeking rehearing en banc before the appeals court. On July 22, 2016, the appeals court denied the petition. On September 9, 2016, the plaintiffs filed a petition for writ of certiorari in the U.S. Supreme Court challenging the Second Circuit’s decision that the safe harbor of Section 546(e) applied to their claims. The shareholder defendants, including the Rydex ETF Trust, filed a joint brief in opposition to the petition for writ of certiorari on October 24, 2016. The plaintiffs filed a reply in support of the petition on November 4, 2016. The Supreme Court has not yet granted or denied the petition for certiorari.
None of these lawsuits alleges any wrongdoing on the part of Rydex ETF Trust. The following series of Rydex ETF Trust held shares of Tribune and tendered these shares as part of Tribune’s LBO: Guggenheim S&P 500® Pure Value ETF (the “Fund”). The value of the proceeds received by the foregoing Fund was $197,050. At this stage of the proceedings, Rydex ETF Trust is not able to make a reliable prediction as to the outcome of these lawsuits or the effect, if any, on the Fund’s net asset value.
9. Fund Changes
At a meeting held on October 14, 2015, the Adviser recommended and the Board of the Trust approved changing the Underlying Index for the Guggenheim Russell Top 50® Mega Cap ETF from the Russell Top 50® Mega Cap Index to the S&P 500® Top 50 Index. In connection with the change in the Fund’s Underlying Index, the Board also approved changing the Fund’s name to Guggenheim S&P 500® Top 50 ETF. The changes in index and Fund name became effective on January 27, 2016.
62 | GUGGENHEIM ETFs ANNUAL REPORT |
REPORT OF INDEPENDENT REGISTERED PUBLIC ACCOUNTING FIRM |
The Board of Trustees and Shareholders of Rydex ETF Trust
We have audited the accompanying statements of assets and liabilities, including the schedules of investments, of Guggenheim S&P 500® Top 50 ETF, Guggenheim S&P 500® Pure Value ETF, Guggenheim S&P 500® Pure Growth ETF, Guggenheim S&P MidCap 400® Pure Value ETF, Guggenheim S&P MidCap 400® Pure Growth ETF, Guggenheim S&P SmallCap 600® Pure Value ETF, and Guggenheim S&P SmallCap 600® Pure Growth ETF (seven of the series constituting the Rydex ETF Trust) (the “Funds”) as of October 31, 2016, and the related statements of operations for the year then ended, and the statements of changes in net assets for each of the two years in the period then ended, and the financial highlights for each of the five years in the period then ended. These financial statements and financial highlights are the responsibility of the Funds’ management. Our responsibility is to express an opinion on these financial statements and financial highlights based on our audits.
We conducted our audits in accordance with the standards of the Public Company Accounting Oversight Board (United States). Those standards require that we plan and perform the audit to obtain reasonable assurance about whether the financial statements and financial highlights are free of material misstatement. We were not engaged to perform an audit of the Fund’s internal control over financial reporting. Our audits included consideration of internal control over financial reporting as a basis for designing audit procedures that are appropriate in the circumstances, but not for the purpose of expressing an opinion on the effectiveness of the Funds’ internal control over financial reporting. Accordingly, we express no such opinion. An audit also includes examining, on a test basis, evidence supporting the amounts and disclosures in the financial statements and financial highlights, assessing the accounting principles used and significant estimates made by management, and evaluating the overall financial statement presentation. Our procedures included confirmation of securities owned as of October 31, 2016, by correspondence with the custodian and brokers. We believe that our audits provide a reasonable basis for our opinion.
In our opinion, the financial statements and financial highlights referred to above present fairly, in all material respects, the financial position of the above listed Funds (seven of the series constituting the Rydex ETF Trust) at October 31, 2016, the results of their operations for the year then ended, the changes in their net assets for each of the two years in the period then ended, and the financial highlights for each of the five years in the period then ended, in conformity with U.S. generally accepted accounting principles.
McLean, Virginia
December 22, 2016
GUGGENHEIM ETFs ANNUAL REPORT | 63 |
OTHER INFORMATION (Unaudited) |
Federal Income Tax Information
In January 2017, shareholders will be advised on IRS Form 1099 DIV or substitute 1099 DIV as to the federal tax status of the distributions received by shareholders in the calendar year 2016.
Of the ordinary income distributions paid during the year, the following funds had the corresponding percentages qualify for the dividends received deduction for corporations:
Fund | Dividend |
Guggenheim S&P 500® Top 50 ETF | 100.00% |
Guggenheim S&P 500® Pure Value ETF | 100.00% |
Guggenheim S&P 500® Pure Growth ETF | 93.42% |
Guggenheim S&P MidCap 400® Pure Value ETF | 100.00% |
Guggenheim S&P MidCap 400® Pure Growth ETF | 100.00% |
Guggenheim S&P SmallCap 600® Pure Value ETF | 100.00% |
Guggenheim S&P SmallCap 600® Pure Growth ETF | 67.37% |
Additionally, the following amounts of taxable ordinary income dividends paid during the fiscal year qualified for the lower income tax rate available to individuals under the Jobs and Growth Tax Relief Reconciliation Act of 2003:
Fund | Qualified |
Guggenheim S&P 500® Top 50 ETF | 100.00% |
Guggenheim S&P 500® Pure Value ETF | 100.00% |
Guggenheim S&P 500® Pure Growth ETF | 100.00% |
Guggenheim S&P MidCap 400® Pure Value ETF | 100.00% |
Guggenheim S&P MidCap 400® Pure Growth ETF | 100.00% |
Guggenheim S&P SmallCap 600® Pure Value ETF | 100.00% |
Guggenheim S&P SmallCap 600® Pure Growth ETF | 66.67% |
Proxy Voting Information
A description of the policies and procedures that the Trust uses to determine how to vote proxies relating to securities held in the Funds’ portfolios is available, without charge and upon request, by calling 800.820.0888. This information is also available from the EDGAR database on the SEC’s website at https://www.sec.gov.
Information regarding how the Funds voted proxies relating to portfolio securities during the most recent 12-month period ended June 30 is available without charge, upon request, by calling 800.820.0888. This information is also available from the EDGAR database on the SEC’s website at https://www.sec.gov.
Sector Classification
Information in the Schedule of Investments is categorized by sectors using sector-level Classifications defined by the Bloomberg Industry Classification System, a widely recognized industry classification system provider. Each Fund’s registration statement has investment policies relating to concentration in specific sectors/industries. For purposes of these investment policies, the Funds usually classify sectors/industries based on industry-level Classifications used by widely recognized industry classification system providers such as Bloomberg Industry Classification System, Global Industry Classification Standards and Barclays Global Classification Scheme.
Quarterly Portfolio Schedules Information
The Trust files its complete schedule of portfolio holdings with the SEC for the first and third quarters of each fiscal year on Form N-Q, which are available on the SEC’s website at https://www.sec.gov. The Funds’ Forms N-Q may be reviewed and copied at the SEC’s Public Reference Room in Washington, DC, and that information on the operation of the Public Reference Room may be obtained by calling 800-SEC-0330. Copies of the portfolio holdings are also available to shareholders, without charge and upon request, by calling 800.820.0888.
64 | GUGGENHEIM ETFs ANNUAL REPORT |
OTHER INFORMATION (Unaudited)(continued) |
Board Considerations in Approving the Continuation of the Investment Advisory Agreement
The Board of Trustees (the “Board”) of Rydex ETF Trust (the “Trust”), including the Trustees who are not “interested persons,” as defined by the Investment Company Act of 1940, of the Trust (“Independent Trustees”), attended an in-person meeting held on May 19, 2016, called for the purpose of, among other things, the consideration of, and voting on, the approval and continuation of the investment advisory agreement (the “Investment Advisory Agreement”) between the Trust and the Advisor applicable to each series of the Trust except for the Guggenheim S&P 100® Equal Weight ETF (each, a “Fund” and, collectively, the “Funds”). The Board unanimously approved the continuation of the Investment Advisory Agreement for an additional one-year period based on the Board’s review of qualitative and quantitative information provided by the Advisor. The Board had previously considered information pertaining to the renewal of the Investment Advisory Agreement at an in-person meeting held on April 26, 2016 (together, with the May 19 meeting, the “Meetings”).
Prior to reaching the conclusion to approve the continuation of the Investment Advisory Agreement, the Independent Trustees requested and obtained from the Advisor such information as the Independent Trustees deemed reasonably necessary to evaluate the Investment Advisory Agreement. In addition, the Board received a memorandum from Fund counsel regarding the responsibilities of the Board with respect to the approval of investment advisory agreements and participated in question and answer sessions with representatives of the Advisor. The Independent Trustees also carefully considered information that they had received throughout the year as part of their regular oversight of the Funds. At the Meetings, the Board obtained and reviewed a wide variety of information, including certain comparative information regarding the Funds’ fees, expenses, and performance relative to the fees, expenses, and performance of other comparable funds (the “FUSE reports”). The Independent Trustees carefully evaluated this information, met in executive session outside the presence of fund management, and were advised by independent legal counsel with respect to their deliberations.
At the Meetings, the Board, including the Independent Trustees, evaluated a number of factors, including among others: (a) the nature, extent and quality of the Advisor’s investment advisory and other services; (b) the Advisor’s investment management personnel; (c) the Advisor’s operations and financial condition; (d) the Advisor’s brokerage practices (including any soft dollar arrangements) and the variety and complexity of its investment strategies; (e) a comparison of the Funds’ advisory fees to the advisory fees charged to comparable funds or accounts, giving special attention to the existence of economies of scale and the absence of breakpoints in these fees and the Advisor’s rationale for not providing for breakpoints at this point in time; (f) each Fund’s overall fees and operating expenses compared with those of similar funds; (g) the level of the Advisor’s profitability from its Fund-related operations; (h) the Advisor’s compliance processes and systems; (i) the Advisor’s compliance policies and procedures; (j) the Advisor’s reputation, expertise and resources in the financial markets; and (k) Fund performance compared with that of similar funds and/or appropriate benchmarks. In its deliberations, the Trustees did not identify any single piece of information that was all-important or controlling, noting that each Trustee could attribute different weights to the various factors considered.
Based on the Board’s deliberations at the Meetings, the Board, including all of the Independent Trustees, unanimously: (a) concluded that the terms of the Investment Advisory Agreement are fair and reasonable; (b) concluded that the Advisor’s fees are reasonable in light of the services that it provides to the Funds; and (c) agreed to approve and continue the Investment Advisory Agreement based upon the following considerations, among others:
● | Nature, Extent and Quality of Services Provided by the Advisor. The Board evaluated, among other things, the Advisor’s business, financial resources, quality and quantity of personnel, experience, past performance, the variety and complexity of its investment strategies (including the extent to which the Funds use derivatives), Fund risk management process, brokerage practices, and the adequacy of its compliance systems and processes, proxy voting policies and practices, and cybersecurity programs. The Board reviewed the scope of services to be provided by the Advisor under the Investment Advisory Agreement and noted that there would be no significant differences between the scope of services required to be provided by the Advisor for the past year and the scope of services required to be provided during the upcoming year. The Board also considered the Advisor’s representations to the Board that the Advisor would continue to provide investment and related services that were of materially the same quality and quantity as services provided to the Funds in the past, and whether these services are appropriate in scope and extent in light of the Funds’ operations, the competitive landscape of the investment company business and investor needs. Based on the foregoing, the Trustees determined that the approval of the Investment Advisory Agreement would enable shareholders of the Funds to receive high quality services at a cost that was appropriate and reasonable. |
● | Fund Expenses and Performance of the Funds and the Advisor. The Board reviewed statistical information provided by the Advisor regarding the expense ratio components and performance of each Fund. The Advisor engaged FUSE Research Network LLC (“FUSE”), an independent, third party research provider, to prepare reports to help the Board compare the Funds’ fees, expenses, and total return performance with those of a peer group and peer universe of funds selected by FUSE. In the reports, each Fund’s expense ratio components, including actual advisory fees, waivers/reimbursements, and gross and net total expenses, are compared to those of |
GUGGENHEIM ETFs ANNUAL REPORT | 65 |
OTHER INFORMATION (Unaudited)(continued) |
other funds with shared key characteristics (e.g., asset size, fee structure, sector or industry investment focus) determined by FUSE to comprise a Fund’s applicable peer group. The Board considered the Advisor’s representation that it found the peer groups compiled by FUSE to be appropriate, but also acknowledged the existence of certain differences between the Funds and their peer funds (e.g., specific differences in principal investment strategies) that should be reviewed in context. The statistical information related to the performance of each Fund included three-month and one-, three-, and five-year performance for the Fund compared to that of its peers. The Board also discussed the correlation between a Fund’s assets under management and tracking error, noting that a Fund’s ability to replicate an underlying index rather than employ representative sampling depends, in part, upon the Fund’s size. Based on the foregoing, the Board determined that the proposed advisory fees paid by the Funds are reasonable in relation to the nature and quality of the services provided by the Advisor.
● | Costs of Services Provided to the Funds and Profits Realized by the Advisor and its Affiliates. The Board reviewed information about the profitability of the Funds to the Advisor based on the advisory fees payable under the current Investment Advisory Agreement for the last calendar year. The Board noted that the Advisor had contractually agreed to pay all operating expenses of the Funds, including the cost of index licensing fees, transfer agency, custody, fund administration, legal, audit and other services, except management fees, interest expense, taxes (expected to be de minimis), brokerage commissions and other expenses connected with the execution of portfolio transactions, extraordinary expenses, distribution fees, and expenses paid by the Trust under any distribution plan adopted pursuant to Rule 12b-1 under the 1940 Act. In addition to those expenses listed above, the Board noted that for the Guggenheim S&P 500® Equal Weight ETF and each Guggenheim S&P 500® Equal Weight Sector ETF (with the exception of the Guggenheim S&P 500® Equal Weight Real Estate ETF), the Advisor also had contractually agreed to pay expenses of the Independent Trustees (including any Trustees’ counsel fees). The Board also analyzed the Funds’ expenses, including the investment advisory fees paid to the Advisor, and reviewed the FUSE reports. The Board also reviewed information regarding the direct revenue received by the Advisor and ancillary revenue, if any, received by the Advisor and/or its affiliates in connection with the services provided to the Funds by the Advisor and/or its affiliates. The Board also discussed the Advisor’s profit margin, including the expense allocation methodology used in the Advisor’s profitability analysis. . Based on the foregoing, the Board determined that the profit to the Advisor on the fees paid by the Funds is not excessive in view of the nature and quality of the services provided by the Advisor. |
● | Economies of Scale. The Board considered the absence of breakpoints in the Advisor’s fee schedule and reviewed information regarding the extent to which economies of scale or other efficiencies may result from increases in the Funds’ asset levels. The Board noted that the Investment Advisory Agreement did not provide for breakpoints in each Fund’s advisory fee rates as assets of a Fund increase. However, the Board further noted the Advisor’s assertion that future economies of scale had been taken into consideration by fixing relatively low advisory fees for the Funds, effectively sharing the benefits of lower fees with the Funds from inception. The Board noted that it intends to continue to monitor fees as each Fund grows in size and assess whether fee breakpoints may be warranted. |
● | Other Benefits to the Advisor and/or its Affiliates. In addition to evaluating the Advisor’s services, the Board considered the nature and amount of other benefits to be received by the Advisor and its affiliates as a result of their relationship with the Fund, including any soft dollar usage by the Advisor and any intangible benefits. In particular, the Board considered the nature, extent, quality, and cost of certain distribution services performed by the Advisor’s affiliate under the distribution agreement and the Distribution Plan pursuant to Rule 12b-1 of the 1940 Act. In light of the costs of providing services pursuant to the separate agreements as well as the Advisor’s and its affiliates’ commitment to the Funds, the Board concluded the ancillary benefits the Advisor and its affiliates received were reasonable. |
On the basis of the information provided to it and its evaluation of that information, the Board, including the Independent Trustees, concluded that the terms of the Investment Advisory Agreement were reasonable, and that approval of the continuation of the Investment Advisory Agreement was in the best interests of the Funds and their shareholders.
Board Considerations in Approving the Investment Advisory Agreement for the Guggenheim S&P 100® Equal Weight ETF
The Board of the Trust, including the Independent Trustees, attended an in-person meeting held on February 25, 2016 (the “February Meeting”), called for the purpose of, among other things, the consideration of, and voting on, the approval of the investment advisory agreement (the “OEW Investment Advisory Agreement”) between the Trust and Security Investors, LLC (the “Advisor”) applicable to the Guggenheim S&P 100® Equal Weight ETF, a new series of the Trust (the “OEW Fund”). The Board unanimously approved the OEW Investment Advisory Agreement based on the Board’s review of qualitative and quantitative information provided by the Advisor.
66 | GUGGENHEIM ETFs ANNUAL REPORT |
OTHER INFORMATION (Unaudited)(continued) |
Prior to reaching the conclusion to approve the OEW Investment Advisory Agreement, the Independent Trustees requested and obtained from the Advisor such information as the Independent Trustees deemed reasonably necessary to evaluate the OEW Investment Advisory Agreement. In addition, the Board received a memorandum from Fund counsel regarding the responsibilities of the Board with respect to the approval of investment advisory agreements and participated in question and answer sessions with representatives of the Advisor. The Independent Trustees also carefully considered information that they had received about the Advisor throughout the year as part of their regular oversight of the other series of the Trust. At the May Meeting, the Board obtained and reviewed a wide variety of information, including certain comparative information regarding the OEW Fund’s proposed fees and expenses relative to the fees and expenses of other comparable funds (the “FUSE reports”). The Independent Trustees carefully evaluated this information, met in executive session outside the presence of fund management, and were advised by independent legal counsel with respect to their deliberations.
At the February Meeting, the Board, including the Independent Trustees, evaluated a number of factors, including among others: (a) the nature, extent and quality of the investment advisory and other services to be provided by the Advisor; (b) the Advisor’s investment management personnel; (c) the Advisor’s operations and financial condition; (d) the expected benefits (such as soft dollars, if any) derived by the Advisor and its affiliates from their relationship with the OEW Fund; (e) a comparison of the OEW Fund’s projected advisory fees to the advisory fees charged to comparable funds or accounts, giving special attention to the absence of breakpoints in these fees and the Advisor’s rationale for not providing for breakpoints at this point in time; (f) the OEW Fund’s expected overall fees and operating expenses compared with those of similar funds; (g) the Advisor’s compliance processes and systems; (h) the Advisor’s compliance policies and procedures; and (i) the Advisor’s reputation, expertise and resources in the financial markets; and (j) the Advisor’s performance with respect to existing similar Funds. In its deliberations, the Trustees did not identify any single piece of information that was all-important or controlling, noting that each Trustee could attribute different weights to the various factors considered.
Based on the Board’s deliberations at the February Meeting, the Board, including all of the Independent Trustees, unanimously: (a) concluded that the terms of the OEW Investment Advisory Agreement are fair and reasonable; (b) concluded that the Advisor’s fees are reasonable in light of the services that it will provide to the OEW Fund; and (c) agreed to approve the OEW Investment Advisory Agreement based upon the following considerations, among others:
● | Nature, Extent and Quality of Services Provided by the Advisor. The Board reviewed the scope of services to be provided by the Advisor under the OEW Investment Advisory Agreement and determined that the Advisor was capable of providing high quality advisory services to the OEW Fund, as indicated by the nature and quality of services provided by the Advisor in the past, the firm’s management capabilities, the professional qualifications and experience of its portfolio managers, and its investment and management oversight processes. Based on the foregoing, the Trustees determined that the approval of the OEW Investment Advisory Agreement would enable shareholders of the Fund to receive high quality services at a cost that was appropriate and reasonable. |
● | Fund Expenses and Performance of the OEW Fund and the Advisor. As the OEW Fund had not yet commenced operations, the Board was not able to review the OEW Fund’s performance. However, the Board considered the Advisor’s track record of successfully managing funds that seek to track the performance of a benchmark and determined that the Advisor would have the capabilities, resources, and personnel necessary to provide the OEW Fund with a reasonable potential for positive performance. The Board also reviewed statistical information provided by the Advisor regarding the OEW Fund’s proposed expense ratio components. The Advisor engaged FUSE Research Network LLC (“FUSE”), an independent, third party research provider, to prepare a report to help the Board compare the OEW Fund’s fees and expenses to those of comparable funds in the OEW Fund’s peer group, and the broader peer universe, as determined by FUSE. In the report, the OEW Fund’s proposed expense ratio components, including advisory fees, waivers/reimbursements, and gross and net total expenses, are compared to those of other funds with shared key characteristics (e.g., asset size, fee structure, sector or industry investment focus) determined by FUSE to comprise the OEW Fund’s applicable peer group. The Board considered the Advisor’s representation that it found the peer groups compiled by FUSE to be appropriate, but also acknowledged the existence of certain differences between the OEW Fund and its peer funds (e.g., specific differences in principal investment strategies) that should be reviewed in context. The Board also discussed the correlation between assets under management and tracking error, noting that the OEW Fund’s ability to replicate its underlying index rather than employ representative sampling will depend, in part, upon the OEW Fund’s size. Based on the foregoing, the Board determined that the proposed advisory fee to be paid by the OEW Fund is reasonable in relation to the nature and quality of the services to be provided by the Advisor. |
● | Costs of Services Provided to the OEW Fund and Profits Realized by the Advisor and its Affiliates. The Board noted that the Advisor had contractually agreed to pay all operating expenses of the OEW Fund, including the cost of index licensing fees, transfer agency, custody, fund administration, legal, audit and other services, except management fees, interest expense, taxes (expected to be de minimis), brokerage commissions and other expenses connected with the execution of portfolio transactions, extraordinary expenses, distribution |
GUGGENHEIM ETFs ANNUAL REPORT | 67 |
OTHER INFORMATION (Unaudited)(concluded) |
fees, and expenses paid by the Trust under any distribution plan adopted pursuant to Rule 12b-1 under the 1940 Act, and expenses of the Independent Trustees (including any Trustees’ counsel fees). With respect to the cost of advisory services provided and the Advisor’s profitability, the Board concluded that it was too early to predict the profitability of the OEW Fund to the Advisor, but noted that they would monitor the Advisor’s profitability with respect to the OEW Fund after the OEW Fund commenced operations.
● | Economies of Scale. The Board considered the absence of breakpoints in the Advisor’s fee schedule and reviewed information regarding the extent to which economies of scale or other efficiencies may result from increases in the OEW Fund’s asset levels. The Board noted that because the OEW Fund had not yet commenced operations, there were as of now, no economies of scale to share with shareholders. The Board also considered the Advisor’s statements that it would consider the introduction of breakpoints in the future and noted that it intends to continue monitoring the existence of economies of scale as the OEW Fund grows in size. |
● | Other Benefits to the Advisor and/or its Affiliates. In addition to evaluating the Advisor’s services, the Board considered the nature and amount of other benefits to be received by the Advisor and its affiliates as a result of their relationship with the OEW Fund, including any soft dollar usage by the Advisor and any intangible benefits. In particular, the Board considered the nature, extent, quality, and cost of certain distribution services to be performed by the Advisor’s affiliate and the fees to be paid to the Advisor’s affiliates for those services under the distribution agreement and the Distribution Plan pursuant to Rule 12b-1 of the 1940 Act. In light of the costs of providing services pursuant to the separate agreements as well as the Advisor’s and its affiliates’ commitment to the OEW Fund, the Board concluded the ancillary benefits the Advisor and its affiliates received were reasonable. |
On the basis of the information provided to it and its evaluation of that information, the Board, including the Independent Trustees, concluded that the terms of the OEW Investment Advisory Agreement were reasonable, and that approval of the OEW Investment Advisory Agreement was in the best interests of the OEW Fund and its shareholders.
68 | GUGGENHEIM ETFs ANNUAL REPORT |
INFORMATION ON BOARD OF TRUSTEES AND OFFICERS (Unaudited) |
A Board of Trustees oversees the Trust, as well as other trusts of GI, in which its members have no stated term of service, and continue to serve after election until resignation. The Statement of Additional Information includes further information about Fund Trustees and Officers, and can be obtained without charge by visiting guggenheiminvestments.com or by calling 800.820.0888.
Name, Address* and | Position(s) Held with the | Principal Occupation(s) | Number of | Other |
INTERESTED TRUSTEE | ||||
Donald C. Cacciapaglia** (1951) | Trustee from 2012 to present. | Current: President and CEO, certain other funds in the Fund Complex (2012-present); Vice Chairman, Guggenheim Investments (2010-present).
Former: Chairman and CEO, Channel Capital Group, Inc. (2002-2010). | 232 | Clear Spring Life Insurance Company (2015-present); Guggenheim Partners Japan, Ltd. (2014-present); Guggenheim Partners Investment Management Holdings, LLC (2014-present); Delaware Life (2013-present); Guggenheim Life and Annuity Company (2011-present); Paragon Life Insurance Company of Indiana (2011-present). |
INDEPENDENT TRUSTEES | ||||
Angela Brock-Kyle***** (1959) | Trustee from August 2016 to present. | Current: Founder and Chief Executive Officer, B.O.A.R.D.S (consulting firm)
Former: Senior Leader, TIAA (financial services firm) (1987-2012). | 135 | Infinity Property & Casualty Corporation (2014-present). |
Corey A. Colehour (1945) | Trustee and Member of the Audit Committee from 2003 to present; Member of the Governance and Nominating Committees from 2005 to present; and Member of the Investment and Performance Committee from 2014 to present. | Retired. | 135 | None. |
J. Kenneth Dalton (1941) | Trustee from 2003 to present; Chairman and Member of the Audit Committee from 2003 to present; Member of the Governance and Nominating Committees from 2005 to present; and Member of the Compliance and Risk Oversight Committee from 2010 to present. | Retired. | 135 | Epiphany Funds (4) (2009-present). |
GUGGENHEIM ETFs ANNUAL REPORT | 69 |
INFORMATION ON BOARD OF TRUSTEES AND OFFICERS (Unaudited)(continued) |
Name, Address* and | Position(s) Held with the | Principal Occupation(s) | Number of | Other |
INDEPENDENT TRUSTEES - concluded | ||||
John O. Demaret (1940) | Vice Chairman of the Board of Trustees from 2014 to present; Trustee and Member of the Audit Committee from 2003 to present; Chairman of the Board from 2006 to 2014; Member of the Compliance and Risk Oversight Committee from 2010 to present; Chairman and Member of the Investment and Performance Committee from 2014 to present; and Member of the Nominating Committee from 2014 to present. | Retired. | 135 | None. |
Werner E. Keller (1940) | Chairman of the Board from 2014 to present; Trustee and Member of the Audit, Governance and Nominating Committees from 2005 to present; Chairman and Member of the Compliance and Risk Oversight Committee from 2010 to present; and Member of the Investment and Performance Committee from 2014 to present. | Current: Founder and President, Keller Partners, LLC (investment research firm) (2005-present). | 135 | None. |
Thomas F. Lydon, Jr. (1960) | Trustee and Member of the Audit, Governance and Nominating Committees from 2005 to present. | Current: President, Global Trends Investments (registered investment adviser) (1996-present). | 135 | US Global Investors (GROW) (1995-present). |
Patrick T. McCarville (1942) | Trustee and Member of the Audit Committee from 2003 to present; Chairman and Member of the Governance and Nominating Committees from 2005 to present. | Retired.
Former: Chief Executive Officer, Par Industries, Inc., d/b/a Par Leasing (1977-2010). | 135 | None. |
Sandra G.Sponem***** (1958) | Trustee from August 2016 to present. | Current: Senior Vice President and Chief Financial Officer, M.A. Mortenson Companies, Inc. (general contracting firm) (2007-present). | 135 | None. |
70 | GUGGENHEIM ETFs ANNUAL REPORT |
INFORMATION ON BOARD OF TRUSTEES AND OFFICERS (Unaudited)(continued) |
Name, Address* | Position(s) Held withthe | Principal Occupation(s) |
OFFICERS | ||
Michael P. Byrum (1970) | Vice President (1999-present). | Current: Senior Vice President, Security Investors, LLC (2010-present); President and Chief Investment Officer, Rydex Holdings, LLC (2008-present); Director and Chairman, Advisory Research Center, Inc. (2006-present); Manager, Guggenheim Specialized Products, LLC (2005-present).
Former: Vice President, Guggenheim Distributors, LLC (2009); Director (2009-2010) and Secretary (2002-2010), Rydex Fund Services, LLC; Director (2008-2010), Chief Investment Officer (2006-2010), President (2004-2010) and Secretary (2002-2010), Rydex Advisors, LLC; Director (2008-2010), Chief Investment Officer (2006-2010), President (2004-2010) and Secretary (2002-2010), Rydex Advisors II, LLC. |
Joanna M. Catalucci | AML Officer (2016-present) | Current: Chief Compliance Officer, certain funds in the Fund Complex (2012-present); Senior Managing Director, Guggenheim Investments (2012-present); AML Officer, certain funds in the Fund Complex (2016-present).
Former: Chief Compliance Officer and Secretary, certain other funds in the Fund Complex (2008-2012); Senior Vice President & Chief Compliance Officer, Security Investors, LLC and certain affiliates (2010-2012); Chief Compliance Officer and Senior Vice President, Rydex Advisors, LLC and certain affiliates (2010-2011). |
James M. Howley (1972) | Assistant Treasurer (2016-present) | Current: Director, Guggenheim Investments (2004-present); Assistant Treasurer, certain other funds in the Fund Complex (2006-present).
Former: Manager, Mutual Fund Administration of Van Kampen Investments, Inc. (1996-2004). |
Keith D. Kemp (1960) | Assistant Treasurer (2016-present) | Current: Managing Director of Transparent Value, LLC (2015-present); Managing Director of Guggenheim Investments (2015-present).
Former: Director, Transparent Value, LLC (2010-2015); Director, Guggenheim Investments (2010-2015); Chief Operating Officer, Macquarie Capital Investment Management (2007-2009). |
Amy J. Lee (1961) | Vice President (2009-present) and Secretary (2012-present). | Current: Chief Legal Officer, certain other funds in the Fund Complex (2013-present); Senior Managing Director, Guggenheim Investments (2012-present).
Former: Vice President, Associate General Counsel and Assistant Secretary, Security Benefit Life Insurance Company and Security Benefit Corporation (2004-2012). |
Glenn McWhinnie (1969) | Assistant Treasurer (2016-present) | Current: Vice President, Guggenheim Investments (2009-present).
Former: Tax Compliance Manager, Ernst & Young LLP (1996-2009). |
Elisabeth Miller (1968) | Chief Compliance Officer (2012-present). | Current: CCO, certain other funds in the Fund Complex (2012-present); CCO, Security Investors, LLC (2012-present); CCO, Guggenheim Funds Investment Advisors, LLC (2012-present); Managing Director, Guggenheim Investments (2012-present); Vice President, Guggenheim Funds Distributors, LLC (2014-present).
Former: CCO, Guggenheim Distributors, LLC (2009-2014); Senior Manager, Security Investors, LLC (2004-2009); Senior Manager, Guggenheim Distributors, LLC (2004-2009). |
GUGGENHEIM ETFs ANNUAL REPORT | 71 |
INFORMATION ON BOARD OF TRUSTEES AND OFFICERS (Unaudited)(concluded) |
Name, Address* | Position(s) Held withthe | Principal Occupation(s) |
OFFICERS - concluded | ||
Adam J. Nelson (1979) | Assistant Treasurer (2016-present) | Current: Vice President, Guggenheim Investments (2015-present); Assistant Treasurer, certain other funds in the Fund Complex (2015-present).
Former: Assistant Vice President and Fund Administration Director, State Street Corporation (2013-2015); Fund Administration Assistant Director, State Street (2011-2013); Fund Administration Manager, State Street (2009-2011). |
Kimberly J. Scott (1974) | Assistant Treasurer (2016-present) | Current: Vice President, Guggenheim Investments (2012-present); Assistant Treasurer, certain other funds in the Fund Complex (2012-present).
Former: Financial Reporting Manager, Invesco, Ltd. (2010-2011); Vice President/Assistant Treasurer, Mutual Fund Administration for Van Kampen Investments, Inc./Morgan Stanley Investment Management (2009-2010); Manager of Mutual Fund Administration, Van Kampen Investments, Inc./Morgan Stanley Investment Management (2005-2009). |
John L. Sullivan (1955) | Chief Financial Officer and Treasurer (2016-present) | Current: CFO, Chief Accounting Officer and Treasurer, certain other funds in the Fund Complex (2010-present); Senior Managing Director, Guggenheim Investments (2010-present).
Former: Managing Director and CCO, each of the funds in the Van Kampen Investments fund complex (2004-2010); Managing Director and Head of Fund Accounting and Administration, Morgan Stanley Investment Management (2002-2004); CFO and Treasurer, Van Kampen Funds (1996-2004). |
* | All Trustees and Officers may be reached c/o Guggenheim Investments, 227 West Monroe Street, Chicago, Illinois 60606. |
** | Mr. Cacciapaglia is an “interested” person of the Trust, as that term is defined in the 1940 Act by virtue of his affiliation with the Adviser’s parent company. |
*** | The “Fund Complex” includes all closed-end and open-end funds (including all of their portfolios) advised by the Adviser and any funds that have an investment adviser or servicing agent that is an affiliated person of the Adviser. Information provided is as of the date of this report. |
**** | Some of the Trustees may serve as directors on the boards of companies not required to be disclosed above, including certain non-profit companies and charitable foundations. |
***** | Mses. Brock-Kyle and Sponem commenced serving as independent Trustees effective August 18, 2016. |
72 | GUGGENHEIM ETFs ANNUAL REPORT |
GUGGENHEIM INVESTMENTS PRIVACY POLICIES (Unaudited) |
GUGGENHEIM ETFs ANNUAL REPORT | 73 |
GUGGENHEIM INVESTMENTS PRIVACY POLICIES (Unaudited)(concluded) |
74 | GUGGENHEIM ETFs ANNUAL REPORT |
This page intentionally left blank.
This page intentionally left blank.
This page intentionally left blank.
|
10.31.2016
Guggenheim ETFs Funds Annual Report
RSP | Guggenheim S&P 500® Equal Weight ETF | ||
GuggenheimInvestments.com | ETF3-ANN-1016x1017 |
TABLE OF CONTENTS |
DEAR SHAREHOLDER | 2 |
ECONOMIC AND MARKET OVERVIEW | 3 |
FEES AND EXPENSES | 5 |
MANAGER’S ANALYSIS | 6 |
PORTFOLIO SUMMARY | 7 |
SCHEDULE OF INVESTMENTS | 8 |
STATEMENT OF ASSETS AND LIABILITIES | 14 |
STATEMENT OF OPERATIONS | 15 |
STATEMENTS OF CHANGES IN NET ASSETS | 16 |
FINANCIAL HIGHLIGHTS | 17 |
NOTES TO FINANCIAL STATEMENTS | 18 |
REPORT OF INDEPENDENT REGISTERED PUBLIC ACCOUNTING FIRM | 25 |
OTHER INFORMATION | 26 |
INFORMATION ON BOARD OF TRUSTEES AND OFFICERS | 30 |
GUGGENHEIM INVESTMENTS PRIVACY POLICIES | 34 |
GUGGENHEIM ETFs ANNUAL REPORT | 1 |
October 31, 2016 |
Dear Shareholder:
Security Investors, LLC (the “Investment Adviser”) is pleased to present the annual shareholder report for Guggenheim S&P 500® Equal Weight Exchange-Traded Fund (“ETF”) for the annual fiscal period ended October 31, 2016.
The Investment Adviser is part of Guggenheim Investments, which represents the investment management businesses of Guggenheim Partners, LLC (“Guggenheim”), a global, diversified financial services firm.
Guggenheim Funds Distributors, LLC is the distributor of the Fund. Guggenheim Funds Distributors, LLC is affiliated with Guggenheim and the Investment Adviser.
We encourage you to read the Economic and Market Overview, which follows this letter, followed by the Manager’s Analysis for the ETF.
Sincerely,
Donald C. Cacciapaglia
President and Chief Executive Officer
November 30, 2016
Read a prospectus and summary prospectus (if available) carefully before investing. It contains the investment objectives, risks, charges, expenses, and other information, which should be considered carefully before investing. Obtain a prospectus and summary prospectus (if available) at guggenheiminvestments.com or call 800.820.0888.
2 | GUGGENHEIM ETFs ANNUAL REPORT |
ECONOMIC AND MARKET OVERVIEW (Unaudited) | October 31, 2016 |
Behind the performance numbers for the past 12 months are a multitude of events that unfolded throughout 2016, including a beginning-of-the-year recession scare, an increase in U.S. corporate default volume, several quarters of negative earnings growth, the British vote to exit the European Union, and stubbornly low inflation across the globe. Some might forget that in the first six weeks of the year U.S. corporate bonds suffered one of the worst selloffs since the financial crisis, or that the S&P 500 was down almost 11%. We continue to believe that the turnaround in market performance was a result of global central bank easing.
The surprise end to the fractious U.S. election season leaves many questions unanswered about the new administration, but as it relates to the economy we are particularly alert to the possible market impact of resurgent fiscal policy. We will learn more as we move through the transition of power, but in the meantime several market positives should support asset performance in the fourth quarter and into 2017. The domestic economy just turned in the highest growth rate in two years, early indications point to a strong Christmas selling season, corporate earnings are turning higher or recovering, and the energy sector is stabilizing with the oil market recovery.
U.S. real gross domestic product (“GDP”) was up 2.9% in the third quarter (revised higher to 3.2% in late November), up from 1.4% in the second quarter. We expect output to rise by around 2% on average in coming quarters, a bit faster than the trend rate over the past year, as drags from past dollar strength and an inventory adjustment cycle fade.
The labor market continues to strengthen, as seen in the impressive growth in the size of the labor force. In the year through October, the labor force participation rate increased by 0.3 percentage point while the unemployment rate declined by just 0.1 percentage point. The cyclical rise in participation has helped to keep the unemployment rate steady and stave off U.S. Federal Reserve (the “Fed”) rate hikes in 2016.
We believe it is highly likely the Fed will raise rates in December, and we expect policymakers to hike twice more in 2017. While this would be a bit faster than markets are now pricing in, it would still leave rates below levels prescribed by standard policy rules. President-elect Trump will have an opportunity to fill two open seats on the Board of Governors, though this should not affect Fed policy in the near term.
Fed Chair Yellen has spoken about temporarily running a “high-pressure economy”—one that enables robust business activity and a tight labor market—to offset persistent shortfalls in aggregate demand. If this is the case, before the expansion ends the Fed will likely allow unemployment to drop below 4%, and inflation to overshoot its 2% goal. This change in perspective, as well as the president-elect’s proposed changes to fiscal policy, accounts for why we are starting to see a backup in long-term interest rates, although global monetary policy intervention will likely continue to support bond prices.
Meanwhile, monetary policy divergence will continue to support the U.S. dollar. We expect the European Central Bank (“ECB”) to extend quantitative easing (“QE”) at the current pace of €80 billion per month in December, which will require adjustments to the program. In our view, the QE programs of the ECB and Bank of Japan (“BoJ”) will continue to buttress global sovereign debt and credit markets.
For the 12 months ended October 31, 2016, the Standard & Poor’s 500® (“S&P 500”) Index* returned 4.51%. The MSCI Europe-Australasia-Far East (“EAFE”) Index* returned -3.23%. The return of the MSCI Emerging Markets Index* was 9.27%.
In the bond market, the Bloomberg Barclays U.S. Aggregate Bond Index* posted a 4.37% return for the period, while the Bloomberg Barclays U.S. Corporate High Yield Index* returned 10.14%. The return of the Bank of America (“BofA”) Merrill Lynch 3-Month U.S. Treasury Bill Index* was 0.31% for the 12-month period.
The opinions and forecasts expressed may not actually come to pass. This information is subject to change at any time, based on market and other conditions, and should not be construed as a recommendation of any specific security or strategy.
GUGGENHEIM ETFs ANNUAL REPORT | 3 |
ECONOMIC AND MARKET OVERVIEW (Unaudited)(concluded) | October 31, 2016 |
*Index Definitions:
The following indices are referenced throughout this report. Indices are unmanaged and not available for direct investment. Index performance does not reflect transaction costs, fees, or expenses.
BofA Merrill Lynch 3-Month U.S. Treasury Bill Index is an unmanaged market Index of U.S. Treasury securities maturing in 90 days that assumes reinvestment of all income.
Bloomberg Barclays U.S. Aggregate Bond Index is a broad-based flagship benchmark that measures the investment grade, U.S. dollar-denominated, fixed-rate taxable bond market, including U.S. Treasuries, government-related and corporate securities, mortgage-backed securities or “MBS” (agency fixed-rate and hybrid adjustable-rate mortgage, or “ARM”, pass-throughs), asset-backed securities (“ABS”), and commercial mortgage-backed securities (“CMBS”) (agency and non-agency).
Bloomberg Barclays U.S. Corporate High Yield Index measures the U.S. dollar-denominated, high yield, fixed-rate corporate bond market. Securities are classified as high yield if the middle rating of Moody’s, Fitch, and S&P is Ba1/BB +/BB + or below.
MSCI EAFE Index is a capitalization-weighted measure of stock markets in Europe, Australasia, and the Far East.
MSCI Emerging Markets Index is a free float-adjusted market capitalization-weighted index that is designed to measure equity market performance in the global emerging markets.
S&P 500® Index is a broad-based index, the performance of which is based on the performance of 500 widely held common stocks chosen for market size, liquidity, and industry group representation.
S&P 500® Equal Weight Index is the equal weighted version of the widely regarded S&P 500® Index, which measures 500 leading companies in leading U.S. industries. It has the same constituents as the capitalization-weighted S&P 500® Index, but each company in the equal weight index is allocated a fixed weight, rebalancing quarterly.
4 | GUGGENHEIM ETFs ANNUAL REPORT |
FEES AND EXPENSES (Unaudited) |
|
Shareholder Expense Example
As a shareholder of the Rydex ETF Trust, you incur transaction costs such as creation and redemption fees or brokerage charges, and ongoing costs including advisory fees, trustee fees and, if applicable, distribution fees. All other Trust expenses are paid by the advisor. This example is intended to help you understand your ongoing costs (in dollars) of investing in a Fund and to compare these costs with the ongoing costs of investing in other mutual funds.
The example in the table is based on an investment of $1,000 invested on April 30, 2016 and held for the six months ended October 31, 2016.
Actual Expenses
The first table below provides information about actual account values and actual expenses. You may use the information in this table, together with the amount you invested, to estimate the expenses that you incurred over the period. Simply divide your account value by $1,000 (for example, an $8,600 account value divided by $1,000 = 8.6), then multiply the result by the number in the first table under the heading entitled “Expenses Paid During Period” to estimate the expenses attributable to your investment during this period.
Hypothetical Example for Comparison Purposes
The second table below provides information about hypothetical account values and hypothetical expenses based on a Fund’s actual expense ratio and an assumed rate of return of 5% per year before expenses, which is not a Fund’s actual return. Thus, you should not use the hypothetical account values and expenses to estimate the actual ending account balance or your expenses for the period. Rather, these figures are provided to enable you to compare the ongoing costs of investing in a Fund and other funds. To do so, compare this 5% hypothetical example with the 5% hypothetical examples that appear in the shareholder reports of other funds.
Please note that the expenses shown in the table are meant to highlight your ongoing costs only and do not reflect any transaction costs, such as creation and redemption fees, or brokerage charges. Therefore, the second table is useful in comparing ongoing costs only, and will not help you determine the relative total costs of owning different funds. In addition, if these transaction costs were included, your costs would have been higher.
Expense | Fund | Beginning 2016 | Ending 2016 | Expenses | |
Table 1. Based on actual Fund return3 | |||||
Guggenheim S&P 500® Equal Weight ETF | 0.40% | 3.25% | $ 1,000.00 | $ 1,032.50 | $ 2.05 |
Table 2. Based on hypothetical 5% return (before expenses) | |||||
Guggenheim S&P 500® Equal Weight ETF | 0.40% | 5.00% | 1,000.00 | 1,023.19 | 2.04 |
1 | Annualized. |
2 | Expenses are equal to the Fund’s annualized expense ratio, net of any applicable fee waivers, multiplied by the average account value over the period, multiplied by 184/365 (to reflect the one-half year period). |
3 | Actual cumulative return at net asset value for the period April 30, 2016 to October 31, 2016. |
GUGGENHEIM ETFs ANNUAL REPORT | 5 |
MANAGER’S ANALYSIS (Unaudited) | October 31, 2016 |
GUGGENHEIM S&P 500® EQUAL WEIGHT ETF
Guggenheim S&P 500® Equal Weight ETF (“RSP”) returned 5.24% for the one-year period ended October 31, 2016, compared with the benchmark S&P 500® Equal Weight Index, which returned 5.66%. The cap-weighted S&P 500 Index returned 4.51%. During the period, RSP achieved over 99% correlation to its benchmark on a daily basis.
On January 26, 2016, Guggenheim Russell 1000® Equal Weight ETF was merged into RSP.
The Information Technology, Utilities, and Industrials sectors contributed the most to the Fund’s performance. The only detractors to return were Consumer Discretionary and Health Care. The Telecommunications Services sector contributed the least.
Top contributors to the Fund’s return included NVIDIA Corp., Newmont Mining Corp., and ONEOK, Inc. The top detractors were Endo International Plc, CF Industries Holdings, Inc., and Signet Jewelers Ltd.
The returns presented above do not reflect the effect of taxes. Index returns represent total returns. Performance displayed represents past performance, which is no guarantee of future results.
Cumulative Fund Performance: October 31, 2006 – October 31, 2016
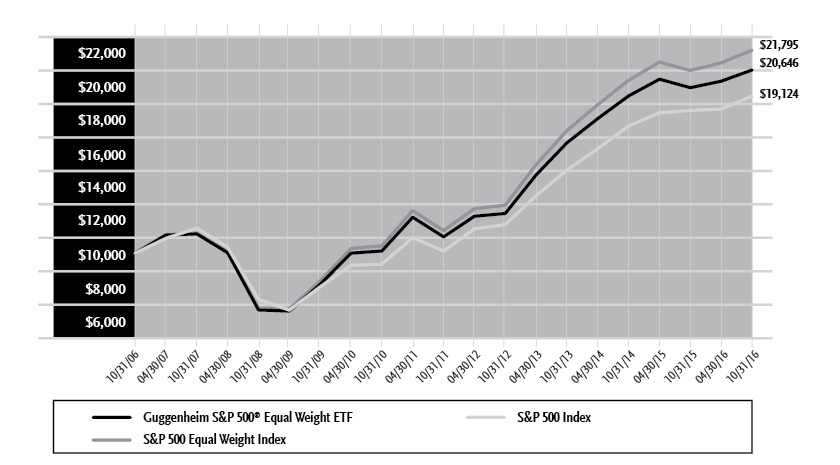
AVERAGE ANNUAL TOTAL RETURNS FOR THE PERIOD ENDED OCTOBER 31, 2016 | ||||
One Year | Three Year | Five Year | 10 Year | |
Guggenheim S&P 500® Equal Weight ETF | 5.24% | 7.94% | 13.52% | 7.52% |
S&P 500 Equal Weight Index | 5.66% | 8.30% | 14.03% | 8.11% |
S&P 500 Index | 4.51% | 8.84% | 13.57% | 6.70% |
The returns presented above do not reflect the effect of taxes. Index returns represent total returns. Performance displayed represents past performance, which is no guarantee of future results.
6 | GUGGENHEIM ETFs ANNUAL REPORT |
PORTFOLIO SUMMARY (Unaudited) | October 31, 2016 |
GUGGENHEIM S&P 500® EQUAL WEIGHT ETF
Holdings Diversification (Market Exposure as % of Net Assets)
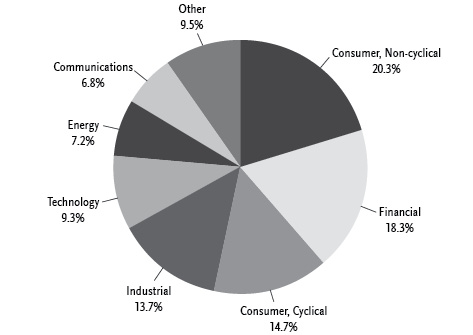
“Holdings Diversification (Market Exposure as % of Net Assets)” excludes any temporary cash investments.
Ten Largest Holdings | (% of Total Net Assets) |
Akamai Technologies, Inc. | 0.3% |
Netflix, Inc. | 0.3% |
NVIDIA Corp. | 0.2% |
The Gap, Inc. | 0.2% |
F5 Networks, Inc. | 0.2% |
Reynolds American, Inc. | 0.2% |
Royal Caribbean Cruises Ltd. | 0.2% |
Expedia, Inc. | 0.2% |
Level 3 Communications, Inc. | 0.2% |
FMC Technologies, Inc. | 0.2% |
Top Ten Total | 2.2% |
“Ten Largest Holdings” excludes any temporary cash or derivative investments. | |
GUGGENHEIM ETFs ANNUAL REPORT | 7 |
SCHEDULE OF INVESTMENTS | October 31, 2016 |
GUGGENHEIM S&P 500® EQUAL WEIGHT ETF |
Shares | Value | |||||||
COMMON STOCKS† - 99.8% | ||||||||
Consumer, Non-cyclical - 20.3% | ||||||||
Reynolds American, Inc. | 423,823 | $ | 23,344,170 | |||||
Quanta Services, Inc.* | 789,265 | 22,691,368 | ||||||
ConAgra Foods, Inc. | 461,328 | 22,226,783 | ||||||
Coty, Inc. — Class A* | 962,577 | 22,129,645 | ||||||
PayPal Holdings, Inc.* | 525,754 | 21,902,912 | ||||||
Hormel Foods Corp. | 554,963 | 21,366,075 | ||||||
Mondelez International, Inc. — Class A | 474,788 | 21,336,973 | ||||||
Hershey Co. | 207,777 | 21,288,831 | ||||||
UnitedHealth Group, Inc. | 149,546 | 21,135,335 | ||||||
Baxter International, Inc. | 443,190 | 21,091,413 | ||||||
H&R Block, Inc. | 910,831 | 20,921,789 | ||||||
Alexion Pharmaceuticals, Inc.* | 159,958 | 20,874,520 | ||||||
Stryker Corp. | 180,780 | 20,852,974 | ||||||
Altria Group, Inc. | 314,389 | 20,787,401 | ||||||
Archer-Daniels-Midland Co. | 475,565 | 20,720,367 | ||||||
Kraft Heinz Co. | 232,444 | 20,675,894 | ||||||
PepsiCo, Inc. | 192,038 | 20,586,474 | ||||||
Constellation Brands, Inc. — Class A | 123,080 | 20,569,129 | ||||||
Molson Coors Brewing Co. — Class B | 197,208 | 20,472,162 | ||||||
Thermo Fisher Scientific, Inc. | 139,085 | 20,449,667 | ||||||
Danaher Corp. | 259,461 | 20,380,662 | ||||||
Church & Dwight Company, Inc. | 421,670 | 20,349,794 | ||||||
Total System Services, Inc. | 407,149 | 20,308,592 | ||||||
CR Bard, Inc. | 93,566 | 20,273,881 | ||||||
Brown-Forman Corp. — Class B | 438,422 | 20,241,944 | ||||||
HCA Holdings, Inc.* | 263,167 | 20,140,170 | ||||||
Colgate-Palmolive Co. | 282,005 | 20,123,877 | ||||||
Procter & Gamble Co. | 231,736 | 20,114,685 | ||||||
Quest Diagnostics, Inc. | 246,955 | 20,112,015 | ||||||
Automatic Data Processing, Inc. | 230,822 | 20,095,363 | ||||||
Universal Health Services, Inc. — Class B | 166,377 | 20,083,368 | ||||||
Robert Half International, Inc. | 535,763 | 20,048,251 | ||||||
Coca-Cola Co. | 472,753 | 20,044,727 | ||||||
Cooper Companies, Inc. | 113,681 | 20,012,403 | ||||||
St. Jude Medical, Inc. | 256,078 | 19,933,112 | ||||||
S&P Global, Inc. | 163,506 | 19,923,206 | ||||||
McCormick & Company, Inc. | 207,777 | 19,919,581 | ||||||
Estee Lauder Companies, Inc. — Class A | 228,246 | 19,887,074 | ||||||
Verisk Analytics, Inc. — Class A*,1 | 243,838 | 19,884,989 | ||||||
Intuitive Surgical, Inc.* | 29,543 | 19,855,259 | ||||||
Whole Foods Market, Inc.1 | 698,757 | 19,767,836 | ||||||
Campbell Soup Co. | 363,683 | 19,762,534 | ||||||
Philip Morris International, Inc. | 204,886 | 19,759,206 | ||||||
Global Payments, Inc. | 271,445 | 19,685,191 | ||||||
Kroger Co. | 634,195 | 19,647,361 | ||||||
Becton Dickinson and Co. | 116,866 | 19,622,970 | ||||||
Johnson & Johnson | 169,022 | 19,604,862 | ||||||
Tyson Foods, Inc. — Class A | 276,548 | 19,593,426 | ||||||
Monster Beverage Corp.* | 135,418 | 19,546,234 | ||||||
Celgene Corp.* | 191,280 | 19,544,991 | ||||||
Dr Pepper Snapple Group, Inc. | 222,436 | 19,527,656 | ||||||
Clorox Co. | 162,592 | 19,514,291 | ||||||
Dentsply Sirona, Inc. | 338,525 | 19,488,884 | ||||||
Kellogg Co. | 259,097 | 19,465,958 | ||||||
Humana, Inc. | 113,209 | 19,418,740 | ||||||
United Rentals, Inc.* | 256,531 | 19,409,135 | ||||||
Hologic, Inc.* | 537,788 | 19,365,746 | ||||||
Varian Medical Systems, Inc.*,1 | 213,421 | 19,363,687 | ||||||
Western Union Co.1 | 963,094 | 19,329,297 | ||||||
Medtronic plc | 235,453 | 19,311,855 | ||||||
Sysco Corp. | 401,279 | 19,309,545 | ||||||
JM Smucker Co.1 | 147,009 | 19,303,752 | ||||||
Mead Johnson Nutrition Co. — Class A | 257,573 | 19,258,733 | ||||||
Ecolab, Inc. | 168,392 | 19,225,315 | ||||||
Anthem, Inc. | 157,470 | 19,189,294 | ||||||
Abbott Laboratories | 487,284 | 19,121,024 | ||||||
General Mills, Inc. | 307,221 | 19,041,558 | ||||||
Patterson Companies, Inc. | 443,869 | 18,957,645 | ||||||
Zoetis, Inc. | 396,580 | 18,956,524 | ||||||
Express Scripts Holding Co.* | 280,952 | 18,936,165 | ||||||
Biogen, Inc.* | 67,502 | 18,912,710 | ||||||
Equifax, Inc. | 152,427 | 18,896,375 | ||||||
Eli Lilly & Co. | 255,401 | 18,858,810 | ||||||
Gilead Sciences, Inc. | 256,049 | 18,852,888 | ||||||
Moody’s Corp. | 187,445 | 18,841,971 | ||||||
Merck & Company, Inc. | 319,806 | 18,779,008 | ||||||
Henry Schein, Inc.* | 125,774 | 18,765,481 | ||||||
Perrigo Company plc | 225,267 | 18,739,961 | ||||||
Cintas Corp. | 175,598 | 18,731,039 | ||||||
Endo International plc* | 997,465 | 18,702,469 | ||||||
Boston Scientific Corp.* | 850,005 | 18,700,110 | ||||||
Centene Corp.* | 298,924 | 18,676,772 | ||||||
Kimberly-Clark Corp. | 162,504 | 18,592,083 | ||||||
Pfizer, Inc. | 586,025 | 18,582,853 | ||||||
Aetna, Inc. | 172,954 | 18,566,612 | ||||||
Laboratory Corporation of America Holdings* | 147,983 | 18,548,189 | ||||||
Avery Dennison Corp. | 265,262 | 18,512,635 | ||||||
Cigna Corp. | 155,591 | 18,488,879 | ||||||
DaVita, Inc.* | 313,947 | 18,403,573 | ||||||
Mylan N.V.* | 500,979 | 18,285,734 | ||||||
Bristol-Myers Squibb Co. | 359,043 | 18,278,879 | ||||||
Regeneron Pharmaceuticals, Inc.*,1 | 51,969 | 17,930,344 | ||||||
Allergan plc* | 84,550 | 17,665,877 | ||||||
AbbVie, Inc. | 315,401 | 17,593,068 | ||||||
Cardinal Health, Inc. | 253,581 | 17,418,479 | ||||||
Nielsen Holdings plc | 384,300 | 17,301,186 | ||||||
Amgen, Inc. | 119,983 | 16,936,800 | ||||||
Zimmer Biomet Holdings, Inc. | 159,485 | 16,809,719 | ||||||
Edwards Lifesciences Corp.* | 174,370 | 16,603,511 | ||||||
Illumina, Inc.* | 121,240 | 16,505,614 | ||||||
AmerisourceBergen Corp. — Class A | 234,253 | 16,472,671 | ||||||
Mallinckrodt plc* | 273,500 | 16,207,610 | ||||||
Vertex Pharmaceuticals, Inc.* | 213,312 | 16,181,848 | ||||||
McKesson Corp. | 113,465 | 14,429,344 | ||||||
Total Consumer, Non-cyclical | 2,018,959,352 | |||||||
8 | GUGGENHEIM ETFs ANNUAL REPORT | SEE NOTES TO FINANCIAL STATEMENTS. |
SCHEDULE OF INVESTMENTS (continued) | October 31, 2016 |
GUGGENHEIM S&P 500® EQUAL WEIGHT ETF |
Shares | Value | |||||||
Financial - 18.3% | ||||||||
KeyCorp | 1,630,009 | $ | 23,015,728 | |||||
Principal Financial Group, Inc. | 413,145 | 22,557,716 | ||||||
Comerica, Inc. | 432,562 | 22,532,156 | ||||||
Fifth Third Bancorp | 1,002,715 | 21,819,078 | ||||||
Mastercard, Inc. — Class A | 203,589 | 21,788,095 | ||||||
Regions Financial Corp. | 2,032,958 | 21,772,980 | ||||||
Huntington Bancshares, Inc. | 2,026,755 | 21,483,603 | ||||||
Hartford Financial Services Group, Inc. | 486,822 | 21,473,719 | ||||||
Prudential Financial, Inc. | 252,372 | 21,398,622 | ||||||
MetLife, Inc. | 455,106 | 21,371,779 | ||||||
American Tower Corp. — Class A | 181,350 | 21,252,407 | ||||||
PNC Financial Services Group, Inc. | 222,239 | 21,246,048 | ||||||
Morgan Stanley | 632,621 | 21,237,087 | ||||||
Citizens Financial Group, Inc. | 805,468 | 21,216,027 | ||||||
Synchrony Financial | 742,056 | 21,215,381 | ||||||
E*TRADE Financial Corp.* | 752,702 | 21,196,088 | ||||||
Bank of New York Mellon Corp. | 488,257 | 21,126,880 | ||||||
Goldman Sachs Group, Inc. | 118,528 | 21,126,431 | ||||||
Zions Bancorporation | 653,700 | 21,055,677 | ||||||
American International Group, Inc. | 340,600 | 21,015,020 | ||||||
Northern Trust Corp. | 289,811 | 20,988,113 | ||||||
Bank of America Corp. | 1,269,628 | 20,948,862 | ||||||
M&T Bank Corp. | 170,673 | 20,946,697 | ||||||
Lincoln National Corp. | 425,464 | 20,886,028 | ||||||
Loews Corp. | 484,915 | 20,865,892 | ||||||
SunTrust Banks, Inc. | 460,553 | 20,830,812 | ||||||
Citigroup, Inc. | 423,645 | 20,822,152 | ||||||
JPMorgan Chase & Co. | 299,848 | 20,767,472 | ||||||
Charles Schwab Corp. | 651,980 | 20,667,766 | ||||||
Capital One Financial Corp. | 278,907 | 20,650,274 | ||||||
Willis Towers Watson plc1 | 163,752 | 20,616,377 | ||||||
U.S. Bancorp | 460,346 | 20,605,087 | ||||||
BB&T Corp. | 523,149 | 20,507,441 | ||||||
Chubb Ltd. | 160,802 | 20,421,854 | ||||||
American Express Co. | 306,859 | 20,381,575 | ||||||
Aon plc | 183,454 | 20,332,207 | ||||||
Visa, Inc. — Class A | 245,697 | 20,272,459 | ||||||
UDR, Inc. | 579,414 | 20,262,107 | ||||||
Prologis, Inc. | 388,124 | 20,244,548 | ||||||
XL Group Ltd. | 582,787 | 20,222,709 | ||||||
People’s United Financial, Inc.1 | 1,242,788 | 20,182,877 | ||||||
AvalonBay Communities, Inc. | 117,761 | 20,158,328 | ||||||
Progressive Corp. | 639,671 | 20,156,033 | ||||||
State Street Corp. | 286,704 | 20,129,488 | ||||||
Apartment Investment & Management Co. — Class A | 455,922 | 20,092,483 | ||||||
Unum Group | 566,928 | 20,069,251 | ||||||
Allstate Corp. | 294,048 | 19,965,859 | ||||||
Weyerhaeuser Co. | 659,295 | 19,732,699 | ||||||
Torchmark Corp. | 310,456 | 19,686,015 | ||||||
Equinix, Inc. | 55,095 | 19,684,342 | ||||||
Berkshire Hathaway, Inc. — Class B* | 136,302 | 19,668,379 | ||||||
Ventas, Inc.1 | 290,223 | 19,662,608 | ||||||
Equity Residential | 318,213 | 19,649,653 | ||||||
Arthur J Gallagher & Co. | 406,421 | 19,601,685 | ||||||
Alliance Data Systems Corp. | 95,758 | 19,579,638 | ||||||
Public Storage | 91,403 | 19,534,650 | ||||||
Crown Castle International Corp. | 214,177 | 19,487,965 | ||||||
Essex Property Trust, Inc. | 90,842 | 19,448,364 | ||||||
Digital Realty Trust, Inc.1 | 207,580 | 19,394,199 | ||||||
Marsh & McLennan Companies, Inc. | 302,837 | 19,196,837 | ||||||
Discover Financial Services | 340,206 | 19,163,804 | ||||||
Intercontinental Exchange, Inc. | 70,796 | 19,142,530 | ||||||
Host Hotels & Resorts, Inc. | 1,233,567 | 19,095,617 | ||||||
Aflac, Inc. | 276,026 | 19,009,911 | ||||||
T. Rowe Price Group, Inc.1 | 296,142 | 18,956,050 | ||||||
Franklin Resources, Inc. | 561,678 | 18,906,081 | ||||||
Travelers Companies, Inc. | 174,606 | 18,888,877 | ||||||
Wells Fargo & Co. | 410,186 | 18,872,658 | ||||||
CME Group, Inc. — Class A | 188,439 | 18,862,744 | ||||||
BlackRock, Inc. — Class A | 55,193 | 18,834,059 | ||||||
Federal Realty Investment Trust | 129,362 | 18,787,243 | ||||||
Cincinnati Financial Corp. | 264,681 | 18,734,121 | ||||||
Vornado Realty Trust | 200,935 | 18,642,749 | ||||||
Welltower, Inc. | 270,973 | 18,569,780 | ||||||
Nasdaq, Inc. | 289,683 | 18,531,022 | ||||||
Iron Mountain, Inc. | 548,839 | 18,512,339 | ||||||
CBRE Group, Inc. — Class A* | 717,034 | 18,470,796 | ||||||
Realty Income Corp. | 310,977 | 18,422,277 | ||||||
Affiliated Managers Group, Inc.* | 138,770 | 18,409,228 | ||||||
Kimco Realty Corp. | 690,047 | 18,362,151 | ||||||
Extra Space Storage, Inc. | 250,043 | 18,290,645 | ||||||
Invesco Ltd. | 649,237 | 18,237,067 | ||||||
Assurant, Inc. | 223,969 | 18,033,984 | ||||||
HCP, Inc.1 | 524,093 | 17,950,185 | ||||||
Navient Corp. | 1,404,358 | 17,947,695 | ||||||
Boston Properties, Inc. | 147,767 | 17,802,969 | ||||||
Ameriprise Financial, Inc. | 201,013 | 17,767,539 | ||||||
General Growth Properties, Inc. | 710,938 | 17,737,903 | ||||||
Simon Property Group, Inc. | 95,207 | 17,704,694 | ||||||
SL Green Realty Corp. | 180,052 | 17,684,707 | ||||||
Macerich Co. | 249,698 | 17,673,624 | ||||||
Legg Mason, Inc. | 584,162 | 16,777,133 | ||||||
Total Financial | 1,827,004,489 | |||||||
Consumer, Cyclical - 14.7% | ||||||||
The Gap, Inc.1 | 855,853 | 23,612,985 | ||||||
Royal Caribbean Cruises Ltd. | 302,886 | 23,282,847 | ||||||
Harley-Davidson, Inc. | 395,161 | 22,532,080 | ||||||
Carnival Corp. | 450,387 | 22,114,002 | ||||||
Delta Air Lines, Inc. | 529,363 | 22,111,492 | ||||||
Tiffany & Co.1 | 297,047 | 21,809,191 | ||||||
Southwest Airlines Co. | 535,192 | 21,434,440 | ||||||
United Continental Holdings, Inc.* | 381,016 | 21,424,530 | ||||||
Michael Kors Holdings Ltd.* | 418,681 | 21,260,620 | ||||||
Signet Jewelers Ltd.1 | 259,854 | 21,115,736 | ||||||
Best Buy Company, Inc.1 | 542,002 | 21,089,298 | ||||||
American Airlines Group, Inc. | 519,187 | 21,078,992 | ||||||
Darden Restaurants, Inc. | 325,203 | 21,069,903 | ||||||
BorgWarner, Inc. | 585,343 | 20,978,693 | ||||||
Alaska Air Group, Inc.1 | 290,223 | 20,959,905 | ||||||
Nordstrom, Inc.1 | 402,076 | 20,907,952 | ||||||
SEE NOTES TO FINANCIAL STATEMENTS. | GUGGENHEIM ETFs ANNUAL REPORT | 9 |
SCHEDULE OF INVESTMENTS (continued) | October 31, 2016 |
GUGGENHEIM S&P 500® EQUAL WEIGHT ETF |
Shares | Value | |||||||
Hasbro, Inc. | 250,003 | $ | 20,852,750 | |||||
General Motors Co. | 655,637 | 20,718,129 | ||||||
Foot Locker, Inc. | 309,375 | 20,656,970 | ||||||
Ross Stores, Inc. | 328,773 | 20,561,463 | ||||||
Macy’s, Inc. | 563,232 | 20,552,336 | ||||||
AutoZone, Inc.* | 27,646 | 20,517,756 | ||||||
Marriott International, Inc. — Class A | 297,567 | 20,442,853 | ||||||
Kohl’s Corp.1 | 465,911 | 20,383,606 | ||||||
Ulta Salon Cosmetics & Fragrance, Inc.* | 83,695 | 20,366,341 | ||||||
L Brands, Inc.1 | 279,753 | 20,195,369 | ||||||
Hanesbrands, Inc. | 777,595 | 19,984,192 | ||||||
PVH Corp. | 186,492 | 19,950,914 | ||||||
Walgreens Boots Alliance, Inc. | 240,978 | 19,936,110 | ||||||
Target Corp.1 | 289,604 | 19,904,483 | ||||||
Wal-Mart Stores, Inc. | 284,256 | 19,903,605 | ||||||
Mattel, Inc. | 629,791 | 19,857,310 | ||||||
Yum! Brands, Inc. | 229,780 | 19,825,418 | ||||||
TJX Companies, Inc. | 267,297 | 19,713,154 | ||||||
Harman International Industries, Inc. | 246,926 | 19,682,471 | ||||||
Wyndham Worldwide Corp.1 | 298,796 | 19,672,729 | ||||||
McDonald’s Corp. | 174,400 | 19,632,208 | ||||||
Costco Wholesale Corp. | 132,596 | 19,606,971 | ||||||
Coach, Inc. | 546,145 | 19,601,144 | ||||||
Dollar General Corp. | 283,144 | 19,562,419 | ||||||
PACCAR, Inc. | 356,172 | 19,560,966 | ||||||
Starbucks Corp. | 367,675 | 19,512,512 | ||||||
Ralph Lauren Corp. — Class A | 198,368 | 19,459,901 | ||||||
Fastenal Co. | 492,564 | 19,200,145 | ||||||
Wynn Resorts Ltd.1 | 203,068 | 19,200,079 | ||||||
Goodyear Tire & Rubber Co. | 660,405 | 19,171,557 | ||||||
Delphi Automotive plc | 293,831 | 19,119,583 | ||||||
Home Depot, Inc. | 156,437 | 19,086,879 | ||||||
DR Horton, Inc. | 661,271 | 19,064,443 | ||||||
Newell Brands, Inc. | 396,501 | 19,039,978 | ||||||
O’Reilly Automotive, Inc.* | 71,809 | 18,989,172 | ||||||
Ford Motor Co. | 1,614,219 | 18,950,931 | ||||||
WW Grainger, Inc. | 89,839 | 18,697,293 | ||||||
Genuine Parts Co. | 206,027 | 18,663,986 | ||||||
AutoNation, Inc.* | 423,734 | 18,589,210 | ||||||
Bed Bath & Beyond, Inc.1 | 459,618 | 18,577,760 | ||||||
Lowe’s Companies, Inc. | 278,445 | 18,558,359 | ||||||
Leggett & Platt, Inc. | 404,435 | 18,555,478 | ||||||
PulteGroup, Inc. | 997,210 | 18,548,106 | ||||||
VF Corp. | 342,015 | 18,540,633 | ||||||
Urban Outfitters, Inc.* | 553,863 | 18,526,717 | ||||||
Dollar Tree, Inc.* | 244,802 | 18,494,791 | ||||||
LKQ Corp.* | 572,444 | 18,478,492 | ||||||
Lennar Corp. — Class A | 442,325 | 18,440,529 | ||||||
CVS Health Corp. | 218,346 | 18,362,899 | ||||||
Advance Auto Parts, Inc. | 130,630 | 18,298,650 | ||||||
Tractor Supply Co. | 292,062 | 18,291,843 | ||||||
NIKE, Inc. — Class B | 361,186 | 18,124,313 | ||||||
Mohawk Industries, Inc.* | 98,177 | 18,094,021 | ||||||
CarMax, Inc.*,1 | 361,835 | 18,070,040 | ||||||
Whirlpool Corp. | 119,865 | 17,958,174 | ||||||
Staples, Inc. | 2,345,537 | 17,356,974 | ||||||
Chipotle Mexican Grill, Inc. — Class A*,1 | 46,837 | 16,896,916 | ||||||
Under Armour, Inc. — Class A*,1 | 275,485 | 8,567,584 | ||||||
Under Armour, Inc. — Class C* | 276,872 | 7,159,910 | ||||||
Adient plc* | 1 | 36 | ||||||
Total Consumer, Cyclical | 1,459,072,227 | |||||||
Industrial - 13.7% | ||||||||
Owens-Illinois, Inc.* | 1,148,486 | 22,165,780 | ||||||
Boeing Co. | 155,493 | 22,146,868 | ||||||
Northrop Grumman Corp. | 95,502 | 21,869,958 | ||||||
Cummins, Inc. | 171,076 | 21,866,934 | ||||||
CSX Corp. | 716,533 | 21,861,422 | ||||||
FedEx Corp. | 124,239 | 21,657,342 | ||||||
Amphenol Corp. — Class A | 326,039 | 21,495,751 | ||||||
Deere & Co.1 | 243,013 | 21,458,048 | ||||||
FLIR Systems, Inc. | 650,938 | 21,428,879 | ||||||
Ryder System, Inc. | 307,683 | 21,350,123 | ||||||
Ingersoll-Rand plc | 316,680 | 21,309,398 | ||||||
Rockwell Automation, Inc. | 177,643 | 21,267,420 | ||||||
Republic Services, Inc. — Class A | 403,550 | 21,238,836 | ||||||
Martin Marietta Materials, Inc.1 | 114,201 | 21,170,581 | ||||||
Fluor Corp. | 404,514 | 21,030,683 | ||||||
Vulcan Materials Co. | 185,263 | 20,971,772 | ||||||
J.B. Hunt Transport Services, Inc. | 256,698 | 20,949,124 | ||||||
Waste Management, Inc. | 318,459 | 20,910,018 | ||||||
Snap-on, Inc. | 135,448 | 20,872,536 | ||||||
Mettler-Toledo International, Inc.* | 51,399 | 20,769,307 | ||||||
Rockwell Collins, Inc. | 245,638 | 20,712,196 | ||||||
Lockheed Martin Corp. | 83,970 | 20,688,529 | ||||||
Caterpillar, Inc. | 247,349 | 20,643,748 | ||||||
TE Connectivity Ltd. | 327,710 | 20,603,128 | ||||||
Jacobs Engineering Group, Inc.* | 398,487 | 20,553,959 | ||||||
Norfolk Southern Corp. | 220,135 | 20,472,555 | ||||||
Garmin Ltd.1 | 421,237 | 20,371,021 | ||||||
Expeditors International of Washington, Inc. | 395,155 | 20,338,628 | ||||||
Parker-Hannifin Corp. | 165,472 | 20,311,688 | ||||||
Corning, Inc. | 892,938 | 20,278,622 | ||||||
Fortive Corp. | 395,340 | 20,182,107 | ||||||
Textron, Inc. | 501,726 | 20,109,178 | ||||||
General Dynamics Corp. | 133,285 | 20,091,381 | ||||||
Sealed Air Corp. | 439,798 | 20,067,983 | ||||||
Raytheon Co. | 146,852 | 20,061,452 | ||||||
Eaton Corporation plc | 314,340 | 20,045,462 | ||||||
United Parcel Service, Inc. — Class B | 185,676 | 20,008,446 | ||||||
Arconic, Inc. | 693,891 | 19,928,550 | ||||||
Emerson Electric Co. | 392,931 | 19,913,743 | ||||||
United Technologies Corp. | 194,632 | 19,891,390 | ||||||
WestRock Co. | 429,868 | 19,855,603 | ||||||
Xylem, Inc. | 410,766 | 19,852,321 | ||||||
Ball Corp. | 256,855 | 19,795,815 | ||||||
CH Robinson Worldwide, Inc. | 290,055 | 19,758,547 | ||||||
Honeywell International, Inc. | 179,342 | 19,670,231 | ||||||
Roper Technologies, Inc. | 113,484 | 19,667,912 | ||||||
Johnson Controls International plc | 486,685 | 19,623,139 | ||||||
Harris Corp. | 219,938 | 19,620,669 | ||||||
10 | GUGGENHEIM ETFs ANNUAL REPORT | SEE NOTES TO FINANCIAL STATEMENTS. |
SCHEDULE OF INVESTMENTS (continued) | October 31, 2016 |
GUGGENHEIM S&P 500® EQUAL WEIGHT ETF |
Shares | Value | |||||||
Illinois Tool Works, Inc. | 172,619 | $ | 19,604,340 | |||||
Stericycle, Inc.*,1 | 243,514 | 19,503,036 | ||||||
Agilent Technologies, Inc. | 445,274 | 19,400,588 | ||||||
Dover Corp. | 289,398 | 19,357,832 | ||||||
General Electric Co. | 663,689 | 19,313,350 | ||||||
PerkinElmer, Inc. | 378,843 | 19,279,320 | ||||||
TransDigm Group, Inc. | 70,511 | 19,211,427 | ||||||
Allegion plc | 299,013 | 19,088,990 | ||||||
Union Pacific Corp. | 215,524 | 19,004,906 | ||||||
Stanley Black & Decker, Inc. | 166,928 | 19,003,084 | ||||||
Kansas City Southern | 214,521 | 18,826,363 | ||||||
3M Co. | 113,788 | 18,809,156 | ||||||
L-3 Communications Holdings, Inc. | 135,948 | 18,616,719 | ||||||
Fortune Brands Home & Security, Inc. | 340,314 | 18,591,354 | ||||||
Masco Corp. | 600,856 | 18,554,433 | ||||||
AMETEK, Inc. | 418,248 | 18,444,737 | ||||||
Waters Corp.* | 132,223 | 18,397,508 | ||||||
Pentair plc | 333,659 | 18,394,621 | ||||||
Flowserve Corp. | 432,188 | 18,303,162 | ||||||
Acuity Brands, Inc. | 76,440 | 17,089,691 | ||||||
Total Industrial | 1,367,703,400 | |||||||
Technology - 9.3% | ||||||||
Akamai Technologies, Inc.* | 380,662 | 26,444,589 | ||||||
NVIDIA Corp.1 | 335,743 | 23,891,472 | ||||||
Skyworks Solutions, Inc. | 299,328 | 23,030,296 | ||||||
QUALCOMM, Inc. | 330,198 | 22,691,206 | ||||||
Western Digital Corp. | 387,348 | 22,636,617 | ||||||
Apple, Inc. | 193,758 | 21,999,284 | ||||||
KLA-Tencor Corp. | 287,834 | 21,619,211 | ||||||
Adobe Systems, Inc.* | 201,072 | 21,617,251 | ||||||
Autodesk, Inc.* | 298,973 | 21,609,768 | ||||||
Analog Devices, Inc. | 335,182 | 21,485,166 | ||||||
Hewlett Packard Enterprise Co. | 955,240 | 21,464,242 | ||||||
Red Hat, Inc.* | 276,626 | 21,424,683 | ||||||
Microsoft Corp. | 355,504 | 21,301,800 | ||||||
Texas Instruments, Inc. | 299,720 | 21,235,162 | ||||||
Lam Research Corp. | 219,181 | 21,229,872 | ||||||
Qorvo, Inc.*,1 | 380,799 | 21,191,465 | ||||||
Broadcom Ltd. | 124,298 | 21,165,463 | ||||||
Accenture plc — Class A | 181,026 | 21,042,462 | ||||||
Linear Technology Corp. | 346,360 | 20,802,382 | ||||||
Microchip Technology, Inc. | 341,503 | 20,678,007 | ||||||
HP, Inc. | 1,420,305 | 20,580,219 | ||||||
Micron Technology, Inc.* | 1,188,814 | 20,400,048 | ||||||
Activision Blizzard, Inc. | 472,537 | 20,399,423 | ||||||
Citrix Systems, Inc.* | 240,152 | 20,364,890 | ||||||
Xerox Corp. | 2,083,850 | 20,359,215 | ||||||
salesforce.com, Inc.* | 269,322 | 20,242,242 | ||||||
Applied Materials, Inc. | 692,446 | 20,136,330 | ||||||
Pitney Bowes, Inc. | 1,123,937 | 20,051,036 | ||||||
Intuit, Inc. | 182,923 | 19,891,047 | ||||||
NetApp, Inc. | 583,121 | 19,791,127 | ||||||
International Business Machines Corp. | 128,340 | 19,724,575 | ||||||
Intel Corp. | 563,861 | 19,661,833 | ||||||
Electronic Arts, Inc.*,1 | 250,220 | 19,647,274 | ||||||
Fiserv, Inc.*,1 | 199,264 | 19,623,519 | ||||||
Xilinx, Inc. | 383,720 | 19,519,836 | ||||||
Oracle Corp. | 499,219 | 19,179,994 | ||||||
CSRA, Inc. | 762,750 | 19,137,398 | ||||||
Fidelity National Information Services, Inc. | 258,202 | 19,086,292 | ||||||
Seagate Technology plc1 | 553,715 | 18,997,962 | ||||||
Cerner Corp.*,1 | 321,173 | 18,814,314 | ||||||
Dun & Bradstreet Corp. | 150,313 | 18,766,578 | ||||||
Paychex, Inc. | 337,060 | 18,605,712 | ||||||
Cognizant Technology Solutions Corp. — Class A* | 361,835 | 18,580,227 | ||||||
CA, Inc. | 604,288 | 18,575,813 | ||||||
Teradata Corp.* | 670,817 | 18,085,226 | ||||||
Total Technology | 926,782,528 | |||||||
Energy - 7.2% | ||||||||
FMC Technologies, Inc.* | 718,597 | 23,189,125 | ||||||
Baker Hughes, Inc. | 406,667 | 22,529,351 | ||||||
Halliburton Co. | 476,381 | 21,913,526 | ||||||
First Solar, Inc.*,1 | 538,211 | 21,792,163 | ||||||
Valero Energy Corp. | 363,880 | 21,556,252 | ||||||
Tesoro Corp. | 252,500 | 21,454,925 | ||||||
Helmerich & Payne, Inc. | 334,024 | 21,080,255 | ||||||
Phillips 661 | 256,668 | 20,828,608 | ||||||
Chevron Corp. | 197,345 | 20,671,889 | ||||||
Marathon Petroleum Corp. | 473,088 | 20,621,906 | ||||||
Anadarko Petroleum Corp. | 345,909 | 20,560,831 | ||||||
ConocoPhillips | 472,980 | 20,550,981 | ||||||
Schlumberger Ltd. | 257,642 | 20,155,334 | ||||||
Apache Corp. | 336,412 | 20,009,786 | ||||||
ONEOK, Inc. | 409,410 | 19,827,726 | ||||||
Pioneer Natural Resources Co. | 110,643 | 19,807,310 | ||||||
Cimarex Energy Co. | 153,015 | 19,758,827 | ||||||
Transocean Ltd.*,1 | 2,032,958 | 19,536,726 | ||||||
Spectra Energy Corp. | 466,913 | 19,521,633 | ||||||
EOG Resources, Inc. | 215,682 | 19,501,966 | ||||||
Concho Resources, Inc.*,1 | 153,183 | 19,445,050 | ||||||
Williams Companies, Inc. | 665,242 | 19,425,066 | ||||||
National Oilwell Varco, Inc. | 602,813 | 19,350,297 | ||||||
Hess Corp. | 400,334 | 19,204,022 | ||||||
Exxon Mobil Corp. | 230,114 | 19,173,098 | ||||||
Occidental Petroleum Corp. | 262,548 | 19,142,375 | ||||||
Noble Energy, Inc. | 553,863 | 19,091,658 | ||||||
Murphy Oil Corp.1 | 715,226 | 18,502,897 | ||||||
Kinder Morgan, Inc. | 903,418 | 18,456,830 | ||||||
Newfield Exploration Co.* | 448,755 | 18,214,965 | ||||||
Equities Corp. | 275,495 | 18,182,670 | ||||||
Devon Energy Corp. | 460,867 | 17,462,251 | ||||||
Marathon Oil Corp. | 1,275,291 | 16,808,335 | ||||||
Cabot Oil & Gas Corp. — Class A | 766,821 | 16,011,222 | ||||||
Range Resources Corp. | 473,088 | 15,985,644 | ||||||
Chesapeake Energy Corp.*,1 | 2,622,577 | 14,450,399 | ||||||
Southwestern Energy Co.*,1 | 1,357,609 | 14,105,558 | ||||||
Total Energy | 717,881,457 | |||||||
SEE NOTES TO FINANCIAL STATEMENTS. | GUGGENHEIM ETFs ANNUAL REPORT | 11 |
SCHEDULE OF INVESTMENTS (continued) | October 31, 2016 |
GUGGENHEIM S&P 500® EQUAL WEIGHT ETF |
Shares | Value | |||||||
Communications - 6.8% | ||||||||
Netflix, Inc.* | 207,098 | $ | 25,860,327 | |||||
F5 Networks, Inc.* | 169,268 | 23,394,530 | ||||||
Expedia, Inc. | 179,885 | 23,246,538 | ||||||
Level 3 Communications, Inc.* | 413,322 | 23,208,030 | ||||||
Time Warner, Inc. | 259,490 | 23,092,016 | ||||||
Juniper Networks, Inc. | 862,873 | 22,728,075 | ||||||
VeriSign, Inc.*,1 | 266,943 | 22,428,551 | ||||||
CBS Corp. — Class B | 384,959 | 21,796,378 | ||||||
TripAdvisor, Inc.*,1 | 323,768 | 20,876,561 | ||||||
Priceline Group, Inc.* | 14,137 | 20,841,190 | ||||||
Scripps Networks Interactive, Inc. — Class A | 323,198 | 20,801,023 | ||||||
Amazon.com, Inc.* | 26,299 | 20,771,477 | ||||||
Facebook, Inc. — Class A* | 157,214 | 20,593,462 | ||||||
Symantec Corp. | 815,978 | 20,423,929 | ||||||
Viacom, Inc. — Class B | 537,788 | 20,199,318 | ||||||
Walt Disney Co. | 216,213 | 20,040,783 | ||||||
Interpublic Group of Companies, Inc. | 892,938 | 19,992,882 | ||||||
Cisco Systems, Inc. | 647,781 | 19,873,921 | ||||||
Yahoo!, Inc.* | 465,596 | 19,345,513 | ||||||
CenturyLink, Inc.1 | 717,290 | 19,065,568 | ||||||
Omnicom Group, Inc. | 238,627 | 19,047,207 | ||||||
Comcast Corp. — Class A | 306,908 | 18,973,053 | ||||||
Motorola Solutions, Inc. | 260,728 | 18,923,638 | ||||||
Charter Communications, Inc. — Class A* | 75,662 | 18,907,177 | ||||||
TEGNA, Inc. | 946,214 | 18,564,719 | ||||||
Verizon Communications, Inc. | 385,656 | 18,550,054 | ||||||
AT&T, Inc. | 503,260 | 18,514,935 | ||||||
eBay, Inc.* | 626,644 | 17,865,620 | ||||||
Frontier Communications Corp.1 | 4,382,475 | 17,617,550 | ||||||
Twenty-First Century Fox, Inc. — Class A | 604,435 | 15,878,507 | ||||||
News Corp. — Class A | 1,158,337 | 14,039,044 | ||||||
Discovery Communications, Inc. — Class C* | 497,765 | 12,498,879 | ||||||
Alphabet, Inc. — Class A* | 12,860 | 10,415,314 | ||||||
Alphabet, Inc. — Class C* | 12,929 | 10,143,318 | ||||||
Discovery Communications, Inc. — Class A*,1 | 334,081 | 8,722,855 | ||||||
Twenty-First Century Fox, Inc. — Class B | 237,852 | 6,276,914 | ||||||
News Corp. — Class B | 328,104 | 4,068,490 | ||||||
Total Communications | 677,587,346 | |||||||
Utilities - 5.7% | ||||||||
SCANA Corp. | 289,398 | 21,230,237 | ||||||
NextEra Energy, Inc. | 165,364 | 21,166,592 | ||||||
DTE Energy Co. | 219,614 | 21,085,140 | ||||||
FirstEnergy Corp. | 612,242 | 20,993,778 | ||||||
Sempra Energy | 194,190 | 20,797,749 | ||||||
Ameren Corp.1 | 415,810 | 20,769,710 | ||||||
Dominion Resources, Inc. | 275,653 | 20,729,106 | ||||||
Consolidated Edison, Inc.1 | 273,942 | 20,696,318 | ||||||
Eversource Energy | 375,265 | 20,662,091 | ||||||
Pinnacle West Capital Corp. | 270,217 | 20,571,620 | ||||||
Edison International | 279,871 | 20,564,921 | ||||||
Duke Energy Corp. | 256,373 | 20,514,967 | ||||||
Alliant Energy Corp. | 537,925 | 20,468,046 | ||||||
Public Service Enterprise Group, Inc. | 485,887 | 20,446,125 | ||||||
American Water Works Company, Inc. | 275,692 | 20,412,236 | ||||||
PG&E Corp. | 328,507 | 20,406,855 | ||||||
PPL Corp. | 594,230 | 20,405,858 | ||||||
CMS Energy Corp. | 483,764 | 20,390,653 | ||||||
Exelon Corp. | 598,344 | 20,385,580 | ||||||
Xcel Energy, Inc. | 490,027 | 20,360,622 | ||||||
American Electric Power Company, Inc. | 313,662 | 20,337,844 | ||||||
Southern Co. | 392,853 | 20,259,429 | ||||||
WEC Energy Group, Inc. | 338,181 | 20,196,169 | ||||||
CenterPoint Energy, Inc. | 883,844 | 20,151,643 | ||||||
NiSource, Inc. | 855,087 | 19,889,324 | ||||||
AES Corp. | 1,620,748 | 19,076,204 | ||||||
Entergy Corp. | 257,642 | 18,983,063 | ||||||
NRG Energy, Inc. | 1,722,748 | 18,312,811 | ||||||
Total Utilities | 570,264,691 | |||||||
Basic Materials - 3.6% | ||||||||
Eastman Chemical Co. | 308,903 | 22,213,216 | ||||||
Freeport-McMoRan, Inc.*,1 | 1,945,843 | 21,754,525 | ||||||
Albemarle Corp. | 260,120 | 21,733,026 | ||||||
FMC Corp. | 445,471 | 20,888,135 | ||||||
LyondellBasell Industries N.V. — Class A | 262,283 | 20,864,613 | ||||||
Nucor Corp. | 426,713 | 20,844,930 | ||||||
Dow Chemical Co. | 374,164 | 20,133,765 | ||||||
EI du Pont de Nemours & Co. | 292,013 | 20,087,574 | ||||||
Praxair, Inc. | 170,220 | 19,925,953 | ||||||
International Flavors & Fragrances, Inc. | 148,316 | 19,396,766 | ||||||
CF Industries Holdings, Inc. | 799,362 | 19,192,681 | ||||||
Air Products & Chemicals, Inc. | 142,474 | 19,008,881 | ||||||
International Paper Co. | 418,848 | 18,860,725 | ||||||
Monsanto Co. | 187,132 | 18,857,292 | ||||||
Newmont Mining Corp. | 508,500 | 18,834,840 | ||||||
PPG Industries, Inc. | 198,132 | 18,452,033 | ||||||
Sherwin-Williams Co. | 72,831 | 17,833,399 | ||||||
Mosaic Co. | 739,853 | 17,408,741 | ||||||
AdvanSix, Inc.* | 1 | 16 | ||||||
Total Basic Materials | 356,291,111 | |||||||
Diversified - 0.2% | ||||||||
Leucadia National Corp. | 1,052,885 | 19,657,363 | ||||||
Total Common Stocks | ||||||||
(Cost $9,152,368,039) | 9,941,203,964 | |||||||
SHORT TERM INVESTMENTS† - 0.2% | ||||||||
Federated U.S. Treasury Cash Reserve Fund Institutional Shares, 0.18%2 | 20,959,466 | 20,959,466 | ||||||
Total Short Term Investments | ||||||||
(Cost $20,959,466) | 20,959,466 | |||||||
12 | GUGGENHEIM ETFs ANNUAL REPORT | SEE NOTES TO FINANCIAL STATEMENTS. |
SCHEDULE OF INVESTMENTS (concluded) | October 31, 2016 |
GUGGENHEIM S&P 500® EQUAL WEIGHT ETF |
Face | Value | |||||||
SECURITIES LENDING COLLATERAL††,3 - 2.1% | ||||||||
Joint Repurchase Agreements | ||||||||
Citigroup Global Markets, Inc. | ||||||||
issued 10/31/16 at 0.34% | $ | 47,679,164 | $ | 47,679,164 | ||||
BNP Paribas Securities Corp. | ||||||||
issued 10/31/16 at 0.34% | 47,679,164 | 47,679,164 | ||||||
Merrill Lynch, Pierce, Fenner & Smith, Inc. | ||||||||
issued 10/31/16 at 0.33% | 47,679,164 | 47,679,164 | ||||||
HSBC Securities (USA), Inc. | ||||||||
issued 10/31/16 at 0.30% | 47,679,164 | 47,679,164 | ||||||
Credit Suisse Securities (USA), LLC | ||||||||
issued 10/31/16 at 0.31% | 14,058,593 | 14,058,593 | ||||||
Total Securities Lending Collateral | ||||||||
(Cost $204,775,249) | 204,775,249 | |||||||
Total Investments - 102.1% | ||||||||
(Cost $9,378,102,754) | $ | 10,166,938,679 | ||||||
Other Assets & Liabilities, net - (2.1)% | (207,268,061 | ) | ||||||
Total Net Assets - 100.0% | $ | 9,959,670,618 | ||||||
* | Non-income producing security. |
† | Value determined based on Level 1 inputs — See Note 4. |
†† | Value determined based on Level 2 inputs — See Note 4. |
1 | All or portion of this security is on loan at October 31, 2016 — See Note 5. |
2 | Rate indicated is the 7 day yield as of October 31, 2016. |
3 | Securities lending collateral — See Note 5. |
plc — Public Limited Company | |
See Sector Classification in Other Information section. |
The following table summarizes the inputs used to value the Fund’s investments at October 31, 2016 (See Note 4 in the Notes to Financial Statements):
Investments in Securities | Level 1 | Level 2 | Level 3 | Total | ||||||||||||
Common Stocks | $ | 9,941,203,964 | $ | — | $ | — | $ | 9,941,203,964 | ||||||||
Securities Lending Collateral | — | 204,775,249 | — | 204,775,249 | ||||||||||||
Short Term Investments | 20,959,466 | — | — | 20,959,466 | ||||||||||||
Total | $ | 9,962,163,430 | $ | 204,775,249 | $ | — | $ | 10,166,938,679 | ||||||||
Transfers between investment levels may occur as the markets fluctuate and/or the availability of data used in an investment’s valuation changes. Transfers between valuation levels, if any, are in comparison to the valuation levels at the end of the previous fiscal year, and are effective using the fair value as of the end of the previous fiscal period.
For the year ended October 31, 2016, there were no transfers between levels.
SEE NOTES TO FINANCIAL STATEMENTS. | GUGGENHEIM ETFs ANNUAL REPORT | 13 |
STATEMENT OF ASSETS AND LIABILITIES | October 31, 2016 |
Guggenheim S&P 500® Equal Weight ETF | ||||
Assets: | ||||
Investments, at value — including $485,687,206 of securities loaned | $ | 9,962,163,430 | ||
Repurchase agreements, at value | 204,775,249 | |||
Total investments* | 10,166,938,679 | |||
Cash | 43 | |||
Receivables: | ||||
Investments sold | 1,990,149 | |||
Securities lending | 125,956 | |||
Dividends and interest | 8,624,414 | |||
Total assets | 10,177,679,241 | |||
Liabilities: | ||||
Payable upon return of securities loaned | 204,775,249 | |||
Payable for: | ||||
Investments purchased | 1,991,687 | |||
Due to custodian | 7,848,450 | |||
Management fees | 3,393,237 | |||
Total liabilities | 218,008,623 | |||
Commitments and contingent liabilities (Note 8) | — | |||
Net assets | $ | 9,959,670,618 | ||
Net assets consist of: | ||||
Paid-in capital | $ | 9,852,850,985 | ||
Undistributed net investment income | 14,490,211 | |||
Accumulated net realized loss on investments | (696,506,503 | ) | ||
Net unrealized appreciation on investments | 788,835,925 | |||
Net assets | $ | 9,959,670,618 | ||
Shares outstanding (unlimited shares authorized), no par value | 122,102,663 | |||
Net asset value, offering price and repurchase price per share | $ | 81.57 | ||
Cost of investments | $ | 9,173,327,505 | ||
Cost of repurchase agreements | 204,775,249 | |||
*Total cost of investments | $ | 9,378,102,754 | ||
14 | GUGGENHEIM ETFs ANNUAL REPORT | SEE NOTES TO FINANCIAL STATEMENTS. |
STATEMENT OF OPERATIONS |
|
For the Year Ended October 31, 2016
Guggenheim S&P 500® Equal Weight ETF | ||||
Investment Income: | ||||
Dividends | $ | 192,843,895 | ||
Income from securities lending | 1,085,761 | |||
Interest | 17,485 | |||
Total investment income | 193,947,141 | |||
Expenses: | ||||
Management fees | 37,688,647 | |||
Total expenses | 37,688,647 | |||
Net investment income | 156,258,494 | |||
Net Realized and Unrealized Gain (Loss): | ||||
Net realized gain (loss) on: | ||||
Investments | (311,151,582 | ) | ||
In-kind redemptions | 482,589,003 | |||
Net realized gain | 171,437,421 | |||
Net change in unrealized appreciation (depreciation) on: | ||||
Investments | 52,138,821 | |||
Net realized and unrealized gain | 223,576,242 | |||
Net increase in net assets resulting from operations | $ | 379,834,736 | ||
SEE NOTES TO FINANCIAL STATEMENTS. | GUGGENHEIM ETFs ANNUAL REPORT | 15 |
STATEMENTS OF CHANGES IN NET ASSETS |
|
Guggenheim S&P 500® | ||||||||
Year Ended | Year Ended | |||||||
Increase (Decrease) in Net Assets from Operations: | ||||||||
Net investment income | $ | 156,258,494 | $ | 161,196,685 | ||||
Net realized gain on investments | 171,437,421 | 815,507,564 | ||||||
Net change in unrealized appreciation (depreciation) on investments | 52,138,821 | (816,243,971 | ) | |||||
Net increase in net assets resulting from operations | 379,834,736 | 160,460,278 | ||||||
Distributions to shareholders from: | ||||||||
Net investment income | (147,336,657 | ) | (171,350,548 | ) | ||||
Shareholder transactions: | ||||||||
Proceeds from shares purchased | 1,891,999,471 | 3,306,916,862 | ||||||
Cost of shares redeemed | (1,964,368,770 | ) | (2,472,681,822 | ) | ||||
Net increase (decrease) in net assets resulting from share transactions | (72,369,299 | ) | 834,235,040 | |||||
Net increase in net assets | 160,128,780 | 823,344,770 | ||||||
Net assets: | ||||||||
Beginning of year | 9,799,541,838 | 8,976,197,068 | ||||||
End of year | $ | 9,959,670,618 | $ | 9,799,541,838 | ||||
Undistributed net investment income at end of year | $ | 14,490,211 | $ | — | ||||
Changes in shares outstanding: | ||||||||
Shares sold | 23,893,800 | 41,400,000 | ||||||
Shares redeemed | (26,300,000 | ) | (31,850,000 | ) | ||||
Net increase (decrease) in shares | (2,406,200 | ) | 9,550,000 | |||||
16 | GUGGENHEIM ETFs ANNUAL REPORT | SEE NOTES TO FINANCIAL STATEMENTS. |
GUGGENHEIM S&P 500® EQUAL WEIGHT ETF |
FINANCIAL HIGHLIGHTS |
This table is presented to show selected data for a share outstanding throughout each period and to assist shareholders in evaluating the Fund’s performance for the periods presented.
Year Ended | Year Ended | Year Ended | Year Ended | Year Ended | ||||||||||||||||
Per Share Data: | ||||||||||||||||||||
Net asset value, beginning of period | $ | 78.71 | $ | 78.08 | $ | 67.94 | $ | 51.76 | $ | 46.77 | ||||||||||
Income from investment operations: | ||||||||||||||||||||
Net investment income (loss)a | 1.31 | 1.22 | 1.09 | 0.99 | 0.80 | |||||||||||||||
Net gain (loss) on investments (realized and unrealized) | 2.78 | 0.71 | 10.13 | 16.13 | 4.97 | |||||||||||||||
Total from investment operations | 4.09 | 1.93 | 11.22 | 17.12 | 5.77 | |||||||||||||||
Less distributions from: | ||||||||||||||||||||
Net investment income | (1.23 | ) | (1.30 | ) | (1.08 | ) | (0.94 | ) | (0.78 | ) | ||||||||||
Total distributions to shareholders | (1.23 | ) | (1.30 | ) | (1.08 | ) | (0.94 | ) | (0.78 | ) | ||||||||||
Net asset value, end of period | $ | 81.57 | $ | 78.71 | $ | 78.08 | $ | 67.94 | $ | 51.76 | ||||||||||
Total Returnb | 5.24 | % | 2.49 | % | 16.60 | % | 33.36 | % | 12.42 | % | ||||||||||
Ratios/Supplemental Data: | ||||||||||||||||||||
Net assets, end of period (in thousands) | $ | 9,959,671 | $ | 9,799,542 | $ | 8,976,197 | $ | 5,663,772 | $ | 2,772,440 | ||||||||||
Ratio to average net assets of: | ||||||||||||||||||||
Net investment income (loss) | 1.66 | % | 1.53 | % | 1.48 | % | 1.64 | % | 1.61 | % | ||||||||||
Total expenses | 0.40 | % | 0.40 | % | 0.40 | % | 0.40 | % | 0.40 | % | ||||||||||
Portfolio turnover ratec | 22 | % | 22 | % | 18 | % | 37 | % | 20 | % | ||||||||||
a | Based on average shares outstanding. |
b | Total investment return is calculated assuming an initial investment made at the net asset value at the beginning of the period, reinvestment of all dividends and distribution at net asset value during the period, and redemption on the last day of the period. Transaction fees are not reflected in the calculation of total investment return. |
c | Portfolio turnover does not include securities received or delivered from processing creations or redemptions. |
SEE NOTES TO FINANCIAL STATEMENTS. | GUGGENHEIM ETFs ANNUAL REPORT | 17 |
NOTES TO FINANCIAL STATEMENTS |
1. Organization and Significant Accounting Policies
Organization
Rydex ETF Trust (the “Trust”) is registered with the SEC under the Investment Company Act of 1940 (the “1940 Act”), as an open-ended investment company of the series type, and is authorized to issue an unlimited number of no par value shares. Each portfolio represents a separate series of beneficial interest in the Trust (each a “Fund”, and collectively, the “Funds”), each a non-diversified investment company. The Trust was organized as a Delaware statutory trust on November 22, 2002. At October 31, 2016, the Trust consisted of twenty-two funds.
The financial statements herein relate to the following Fund, whose investment objective is to replicate as closely as possible, before fees and expenses, the daily performance of an index representing publicly traded equity securities (the “Underlying Index”) as follows:
Fund | Underlying Index |
Guggenheim S&P 500® Equal Weight ETF | S&P 500® Equal Weight Index |
The Fund seeks to achieve its objective by investing in common stocks that comprise the Underlying Index. The Fund uses a “replication” strategy to track the Underlying Index. Replication refers to investing in substantially all of the securities in the Underlying Index in approximately the same proportions as in the Underlying Index.
The Fund operates as an index fund and is not actively managed. Adverse performance of a security in the Fund’s portfolio will ordinarily not result in the elimination of the security from the Fund’s portfolio.
The Fund issues and redeems shares on a continuous basis, at net asset value per share (“NAV”), only in aggregation of 50,000 shares (a “Creation Unit”). Creation Units are issued and redeemed principally in-kind for securities included in the Underlying Index.
The Fund invests in various investments which are exposed to risk, such as market risk. Due to the level of risk associated with certain investments it is at least reasonably possible that changes in the values of investment securities will occur in the near term and that such changes could materially affect amounts reported in the financial statements.
Guggenheim Investments (“GI”) provides advisory services and Rydex Fund Services, LLC (“RFS”) provides administrative services to the Trust. Guggenheim Funds Distributors, LLC (“GFD”) acts as principal underwriter for the Trust. GI and GFD are affiliated entities; RFS ceased to be an affiliate of GI as of October 4, 2016, when it was acquired by MUFG Investor Services. In connection with its acquisition, RFS changed its name to MUFG Investor Services (US), LLC (“MUIS”). This change has no impact on the financial statements of the Funds.
Significant Accounting Policies
The Fund operates as an investment company and, accordingly, follows the investment company accounting and reporting guidance of the Financial Accounting Standards Board (“FASB”) Accounting Standards Codification Topic 946 Financial Services – Investment Companies.
The following significant accounting policies are in conformity with U.S. generally accepted accounting principles (“U.S. GAAP”) and are consistently followed by the Trust. This requires management to make estimates and assumptions that affect the reported amount of assets and liabilities, contingent assets and liabilities at the date of the financial statements, and the reported amounts of revenues and expenses during the reporting period. Actual results could differ from these estimates. All time references are based on Eastern Time.
The NAV of a fund is calculated by dividing the market value of the fund’s securities and other assets, less all liabilities, by the number of outstanding shares of the fund.
A. The Board of Trustees of the Fund (the “Board”) has adopted policies and procedures for the valuation of the Fund’s investments (the “Valuation Procedures”). Pursuant to the Valuation Procedures, the Board has delegated to a valuation committee, consisting of representatives from Guggenheim’s investment management, fund administration, legal and compliance departments (the “Valuation Committee”), the day-to-day responsibility for implementing the Valuation Procedures, including, under most circumstances, the responsibility for determining the fair value of the Fund’s securities and/or other assets.
Valuations of the Fund’s securities are supplied primarily by pricing services appointed pursuant to the processes set forth in the Valuation Procedures. The Valuation Committee convenes monthly, or more frequently as needed, to review the valuation of all assets which have been fair valued for reasonableness. The Fund’s officers, through the Valuation Committee and consistent with the monitoring and review responsibilities set forth in the Valuation Procedures, regularly review procedures used and valuations provided by the pricing services.
If the pricing service cannot or does not provide a valuation for a particular investment or such valuation is deemed unreliable, such investment is fair valued by the Valuation Committee.
Equity securities listed on an exchange (New York Stock Exchange (“NYSE”) or American Stock Exchange) are valued at the last quoted sales price as of the close of business on the NYSE,
18 | GUGGENHEIM ETFs ANNUAL REPORT |
NOTES TO FINANCIAL STATEMENTS (continued) |
usually 4:00 p.m. on the valuation date. Equity securities listed on the NASDAQ market system are valued at the NASDAQ Official Closing Price on the valuation date, which may not necessarily represent the last sale price. If there has been no sale on such exchange or NASDAQ on a given day, the security is valued at the closing bid price on that day.
The Fund invests in money market mutual funds, which are valued at their NAV.
Investments for which market quotations are not readily available are fair-valued as determined in good faith by GI under the direction of the Board using methods established or ratified by the Board. Valuations in accordance with these methods are intended to reflect each security’s (or asset’s) “fair value.” Each such determination is based on a consideration of all relevant factors, which are likely to vary from one pricing context to another. Examples of such factors may include, but are not limited to market prices; sale prices; broker quotes; and models which derive prices based on inputs such as prices of securities with comparable maturities and characteristics, or based on inputs such as anticipated cash flows or collateral, spread over Treasuries, and other information analysis.
B. Security transactions are recorded on the trade date for financial reporting purposes. Realized gains and losses from securities transactions are recorded using the identified cost basis. Proceeds from lawsuits related to investment holdings are recorded as realized gains in the Fund. Dividend income is recorded on the ex-dividend date, net of applicable taxes withheld by foreign countries. Taxable non-cash dividends are recorded as dividend income. Interest income, including amortization of premiums and accretion of discounts, is accrued on a daily basis. Dividend income from REITs is recorded based on the income included in the distributions received from the REIT investments using published REIT classifications, including some management estimates when actual amounts are not available. Distributions received in excess of this estimated amount are recorded as a reduction of the cost of investments or reclassified to capital gains. The actual amounts of income, return of capital, and capital gains are only determined by each REIT after its fiscal year-end, and may differ from the estimated amounts.
C. Distributions of net investment income and net realized gains, if any, are declared and paid at least annually. Distributions are recorded on the ex-dividend date and are determined in accordance with income tax regulations which may differ from U.S. GAAP.
D. The Fund may leave cash overnight in its cash account with the custodian. Periodically, the Fund may have cash due to the custodian bank as an overdraft balance. A fee is incurred on this overdraft, calculated by multiplying the overdraft by a rate based on the federal funds rate, which was 0.31% at October 31, 2016.
E. The Fund may enter into repurchase agreements with financial institutions. In a repurchase agreement, a Fund buys a security and the seller simultaneously agrees to repurchase the security on a specified future date at an agreed-upon price. The repurchase price reflects an agreed-upon interest rate during the time the Fund’s money is invested in the security. Because the security constitutes collateral for the repurchase obligation, a repurchase agreement can be considered a collateralized loan. The Fund follows certain procedures designed to minimize the risks inherent in such agreements. These procedures include effecting repurchase transactions only with large, well-capitalized and well-established financial institutions whose condition will be continually monitored by GI. In addition, the value of the collateral underlying the repurchase agreement will always be at least equal to the repurchase price, including any accrued interest earned on the repurchase agreement. In the event of a default or bankruptcy by a selling financial institution, the Fund will seek to liquidate such collateral. However, the exercising of the Fund’s right to liquidate such collateral could involve certain costs or delays and, to the extent that proceeds from any sale upon a default of the obligation to repurchase were less than the repurchase price, the Fund could suffer a loss. It is the current policy of the Fund not to invest in repurchase agreements that do not mature within seven days if any such investment, together with any other illiquid assets held by the Fund, amounts to more than 15% of Fund’s net assets. The investments of the Fund in repurchase agreements, at times, may be substantial when, in the view of GI, liquidity or other considerations so warrant.
F. Under the Fund’s organizational documents, its Trustees and Officers are indemnified against certain liabilities arising out of the performance of their duties to the Trust. In addition, throughout the normal course of business, the Fund enters into contracts that contain a variety of representations and warranties which provide general indemnifications. The Fund’s maximum exposure under these arrangements is unknown, as this would involve future claims that may be made against the Fund and/or its affiliates that have not yet occurred. However, based on experience, the Fund expects the risk of loss to be remote.
2. Capital
There is a minimum transaction fee per transaction to those persons purchasing or redeeming Creation Units. An additional charge of up to three times the standard transaction fee may be imposed for purchases and redemptions effected outside the National Securities Clearing Corporation usual clearing process or for cash. Such transactions are generally permitted on an in-kind basis, with a balancing cash component to equate the transaction
GUGGENHEIM ETFs ANNUAL REPORT | 19 |
NOTES TO FINANCIAL STATEMENTS (continued) |
to the NAV of the Fund on the transaction date. Transaction fees are not charged to or paid by the Fund. The minimum transaction fees are:
Fund | Minimum Transaction Fee | |||
Guggenheim S&P 500® Equal Weight ETF | $ | 2,000 | ||
3. Fees and Other Transactions with Affiliates
GI determines the composition of the portfolio of securities that must be delivered in exchange for the issuance of Creation Units and periodically adjusts the composition of the portfolio of the Fund to conform to changes in the composition of the relevant index. For these services, GI receives a management fee at the annual rate shown below as a percentage of the average daily net assets of the Fund.
Fund | Advisory Fee | |||
Guggenheim S&P 500® Equal Weight ETF | 0.40 | % | ||
GI pays all expenses of the Fund, including the cost of transfer agency, custody, fund administration, fund accounting, legal, audit and other services, except: interest, taxes, distribution fees or expenses and extraordinary expenses.
Under a Fund Administration Agreement with the Trust, MUIS provides various administrative and financial reporting services for the Fund. GI compensates MUIS directly for this service.
Under a Fund Accounting Agreement with the Trust, BNYMellon maintains the books and records of the Fund. Under a Custodian Agreement with the Trust, BNYMellon maintains cash, securities and other assets of the Fund in a separate account for the Fund, keeps all necessary accounts and records, and provides other services. BNYMellon is required, upon the order of the Trust, to deliver securities held by the custodian and to make payments for securities purchased by the Trust for the Fund. Pursuant to a Transfer Agency and Service Agreement with the Trust, BNYMellon acts as a transfer agent for the Trust’s authorized and issued shares of beneficial interest, and as dividend disbursing agent of the Trust. GI compensates BNYMellon directly for the foregoing services.
The Fund has adopted a Distribution Plan (the “Plan”) that allows the Fund to pay distribution fees to GFD and other firms that provide distribution services (“Service Providers”). If a Service Provider provides distribution services, the Fund will pay distribution fees to GFD at an annual rate not to exceed 0.25% of average daily net assets, pursuant to Rule 12b-1 of the 1940 Act. GFD will, in turn, pay the Service Provider out of its fees. No such fee is currently charged to the Fund.
Certain trustees and officers of the Trust are also officers of GI and GFD.
4. Fair Value Measurement
In accordance with U.S. GAAP, fair value is defined as the price that the Funds would receive to sell an investment or pay to transfer a liability in an orderly transaction with an independent buyer in the principal market, or in the absence of a principal market, the most advantageous market for the investment or liability. U.S. GAAP establishes a three-tier fair value hierarchy based on the types of inputs used to value assets and liabilities and requires corresponding disclosure. The hierarchy and the corresponding inputs are summarized below:
Level 1 | — quoted prices in active markets for identical securities. |
Level 2 | — other significant observable inputs (including quoted prices for similar securities, interest rates, prepayment speeds, credit risk, etc.). |
Level 3 | — significant unobservable inputs (including the fund’s own assumptions used to determine the fair value of investments). |
The types of inputs available depend on a variety of factors, such as the type of security and the characteristics of the markets in which it trades, if any. Fair valuation determinations that rely on fewer or no observable inputs require greater judgment. Accordingly, fair value determinations for Level 3 securities require the greatest amount of judgment.
The inputs or methodologies used for valuing securities are not necessarily an indication of the risk associated with investing in those securities. The suitability of the techniques and sources employed to determine fair valuation are regularly monitored and subject to change.
5. Portfolio Securities Loaned
The Fund may lend portfolio securities to certain creditworthy borrowers, including the Fund’s securities lending agent. The loans are collateralized at all times by cash and/or high grade debt obligations in an amount at least equal to 102% of the market value of domestic securities loaned and 105% of foreign securities loaned as determined at the close of business on the preceding business day. The cash collateral received is held in a separately managed account established for the Fund and maintained by the lending agent exclusively for the investment of securities lending cash collateral on behalf of the Fund. The separately managed accounts invest in short-term investments valued at amortized cost, which approximates market value. The Fund receives compensation for lending securities from interest or dividends earned on the cash, cash equivalents or U.S. government securities held as collateral, net of fee rebates paid to the borrower plus reasonable administrative
20 | GUGGENHEIM ETFs ANNUAL REPORT |
NOTES TO FINANCIAL STATEMENTS (continued) |
and custody fees paid to the lending agent. Such compensation is accrued daily and payable to the Fund monthly. The dividend and interest income earned on the securities loaned is accounted for in the same manner as other dividend and interest income. The borrower pays to the Fund an amount equal to any dividends or interest received on loaned securities. These payments from the borrower are not eligible for reduced tax rates as “qualified dividend income” under the Jobs and Growth Tax Reconciliation Act of 2003. The Fund retains all or a portion of the interest received on investment of cash collateral or receives a fee from the borrower. Lending portfolio securities could result in a loss or delay in recovering the Fund’s securities if the borrower defaults. The securities lending income earned by the Fund is disclosed on the Statement of Operations.
At October 31, 2016, the Fund participated in securities lending as follows:
Fund | Value of | Cash | Non-Cash | Total | ||||||||||||
Guggenheim S&P 500® Equal Weight ETF | $ | 485,687,206 | $ | 204,775,249 | $ | 295,112,066 | $ | 499,887,315 | ||||||||
The following represents a breakdown of the collateral for the joint repurchase agreements at October 31, 2016:
Counterparty and | Face Value | Repurchase Price | Collateral | Par Value | Fair Value | ||||||||||||
Citigroup Global | Various U.S. Government obligations and | ||||||||||||||||
0.34% | U.S. Government | ||||||||||||||||
Due 11/01/16 | $ | 47,679,164 | $ | 47,679,164 | agency securities | $ | 67,606,856 | $ | 48,632,747 | ||||||||
BNP Paribas | Various U.S. Government obligations and | ||||||||||||||||
0.34% | U.S. Government | ||||||||||||||||
Due 11/01/16 | 47,679,164 | 47,679,164 | agency securities | 169,732,911 | 48,632,747 | ||||||||||||
Merrill Lynch, Pierce, | Various U.S. Government obligations and | ||||||||||||||||
0.33% | U.S. Government | ||||||||||||||||
Due 11/01/16 | 47,679,164 | 47,679,164 | agency securities | 67,586,849 | 48,632,747 | ||||||||||||
HSBC Securities | Various U.S. Government obligations and | ||||||||||||||||
0.30% | U.S. Government | ||||||||||||||||
Due 11/01/16 | 47,679,164 | 47,679,164 | agency securities | 128,888,273 | 48,633,024 | ||||||||||||
Credit Suisse Securities | Various U.S. Government obligations and | ||||||||||||||||
0.31% | U.S. Government | ||||||||||||||||
Due 11/01/16 | 14,058,593 | 14,058,593 | agency securities | 11,087,738 | 14,412,474 | ||||||||||||
In the event of counterparty default, the Fund has the right to collect the collateral to offset losses incurred. There is potential loss to the Fund in the event the Fund is delayed or prevented from exercising its right to dispose of the collateral securities, including the risk of a possible decline in the value of the underlying securities during the period while the Fund seeks to assert its rights. GI, acting under the supervision of the Board, reviews the value of the collateral and the creditworthiness of those banks and dealers to evaluate potential risks.
6. Federal Income Tax Information
The Fund intends to comply with the provisions of Subchapter M of the Internal Revenue Code applicable to regulated investment companies and will distribute substantially all taxable net investment income and capital gains sufficient to relieve the Fund from all, or substantially all, federal income, excise and state income taxes. Therefore, no provision for federal or state income tax is required.
Tax positions taken or expected to be taken in the course of preparing the Fund’s tax returns are evaluated to determine whether the tax positions are “more-likely-than-not” of being sustained by the applicable tax authority. Tax positions not deemed to meet the more-likely-than-not threshold would be recorded as a tax benefit or expense in the current year. Management has analyzed the Fund’s tax positions taken, or to be
GUGGENHEIM ETFs ANNUAL REPORT | 21 |
NOTES TO FINANCIAL STATEMENTS (continued) |
taken, on federal income tax returns for all open tax years, and has concluded that no provision for income tax is required in the Fund’s financial statements. The Fund’s federal tax returns are subject to examination by the Internal Revenue Service for a period of three years after they are filed.
Tax basis capital losses in excess of capital gains are carried forward to offset future net capital gains. For the year ended October 31, 2016, the following capital loss carryforward amounts were expired:
Fund | Amount | |||
Guggenheim S&P 500® Equal Weight ETF | $ | 105,390,715 | ||
The tax character of distributions paid during the year ended October 31, 2016 was as follows:
Fund | Ordinary | Long-Term | Total | |||||||||
Guggenheim S&P 500® Equal Weight ETF | $ | 147,336,657 | $ | — | $ | 147,336,657 | ||||||
The tax character of distributions paid during the year ended October 31, 2015 was as follows:
Fund | Ordinary | Long-Term | Total | |||||||||
Guggenheim S&P 500® Equal Weight ETF | $ | 171,350,548 | $ | — | $ | 171,350,548 | ||||||
The tax character of distributable earnings/(accumulated losses) at October 31, 2016 was as follows:
Fund | Undistributed | Undistributed | Accumulated | Net Unrealized | Total | |||||||||||||||
Guggenheim S&P 500® Equal Weight ETF | $ | 14,508,459 | $ | — | $ | (673,697,804 | ) | $ | 766,008,978 | $ | 106,819,633 | |||||||||
For Federal income tax purposes, capital loss carryforwards represent realized losses of the Funds that may be carried forward and applied against future capital gains. For taxable years beginning on or before December 22, 2010, such capital losses may be carried forward for a maximum of eight years. Under the RIC Modernization Act of 2010, the Funds are permitted to carry forward capital losses incurred in taxable years beginning after December 22, 2010 for an unlimited period. However, any losses incurred during those taxable years must be utilized prior to the losses incurred in pre-enactment taxable years. As a result of this ordering rule, pre-enactment capital loss carryforwards may be more likely to expire unused. Additionally, post-enactment capital losses that are carried forward will retain their character as either short-term or long-term capital losses rather than being considered all short-term as under previous law. As of October 31, 2016, capital loss carryforwards for the Fund were as follows:
Unlimited | ||||||||||||||||||||||||
Fund | Expires in | Expires in | Expires in | Short-Term | Long-Term | Remaining | ||||||||||||||||||
Guggenheim S&P 500® Equal Weight ETF | $ | (313,762,207 | ) | $ | (35,251,288 | ) | $ | (20,783,254 | ) | $ | (12,276,510 | ) | $ | (291,624,545 | ) | $ | (673,697,804 | ) | ||||||
In order to present paid-in-capital, distributions in excess of net investment income and accumulated net realized gain on investments on the statement of assets and liabilities that more closely represent their tax character, certain adjustments have been made to these accounts. These adjustments have no effect on the net assets or NAV. The most significant of these adjustments are for net capital gains (losses) resulting from in-kind redemptions, adjustments due to merger, expiring losses, and adjustments on the disposition of REITs. For the year ended October 31, 2016, the adjustments for the Fund were as follows:
Fund | Paid-In | Undistributed | Accumulated | |||||||||
Guggenheim S&P 500® Equal Weight ETF | $ | 375,296,024 | $ | 5,568,374 | $ | (380,864,398 | ) | |||||
22 | GUGGENHEIM ETFs ANNUAL REPORT |
NOTES TO FINANCIAL STATEMENTS (continued) |
At October 31, 2016, the identified cost of investments in securities owned by the Fund for Federal income tax purposes and the gross unrealized appreciation and depreciation were as follows:
Fund | Tax | Tax | Tax | Net | ||||||||||||
Guggenheim S&P 500® Equal Weight ETF | $ | 9,400,929,701 | $ | 1,344,403,692 | $ | (578,394,714 | ) | $ | 766,008,978 | |||||||
7. Investment Transactions
For the year ended October 31, 2016, the Fund had investments transactions in-kind associated with subscriptions and redemptions as follows:
Fund | Subscriptions | Redemptions | ||||||
Guggenheim S&P 500® Equal Weight ETF | $ | 1,820,296,974 | $ | 1,941,019,166 | ||||
For the year ended October 31, 2016, the cost of purchases and proceeds from sales of investment securities, excluding government securities, short-term investments and in-kind transactions, were as follows:
Fund | Purchases | Sales | ||||||
Guggenheim S&P 500® Equal Weight ETF | $ | 2,180,218,678 | $ | 2,112,857,143 | ||||
The Fund is permitted to purchase or sell securities from or to certain affiliated funds under specified conditions outlined in procedures adopted by the Board. The procedures have been designed to ensure that any purchase or sale of securities by a Fund from or to another fund or portfolio that is or could be considered an affiliate by virtue of having a common investment adviser (or affiliated investment advisers), common Trustees and/or common officers complies with Rule 17a-7 of the 1940 Act. Further, as defined under these procedures, each transaction is effected at the current market price to save costs, where permissible. For the year ended October 31, 2016, the Fund engaged in purchases and sales of securities, pursuant to Rule 17a-7 of the 1940 Act, as follows:
Fund | Purchases | Sales | Realized | |||||||||
Guggenheim S&P 500® Equal Weight ETF | $ | 170,809,633 | $ | 97,904,618 | $ | (8,146,738 | ) | |||||
8. Legal Proceedings
Tribune Company
Rydex ETF Trust has been named as a defendant and a putative member of the proposed defendant class of shareholders in the case entitled Kirschner v. FitzSimons, No. 12-2652 (S.D.N.Y.) (formerly Official Committee of Unsecured Creditors of Tribune Co. v. FitzSimons, Adv. Pro. No. 10-54010 (Bankr. D. Del.)) (the “FitzSimons action”), as a result of ownership by certain series of the Rydex ETF Trust of shares in the Tribune Company (“Tribune”) in 2007, when Tribune effected a leveraged buyout transaction (“LBO”) by which Tribune converted to a privately-held company. In his complaint, the plaintiff has alleged that, in connection with the LBO, Tribune insiders and shareholders were overpaid for their Tribune stock using financing that the insiders knew would, and ultimately did, leave Tribune insolvent. The plaintiff has asserted claims against certain insiders, major shareholders, professional advisers, and others involved in the LBO. The plaintiff is also attempting to obtain from former Tribune shareholders, including Rydex ETF Trust, the proceeds they received in connection with the LBO.
In June 2011, a group of Tribune creditors filed multiple actions against former Tribune shareholders involving state law constructive fraudulent conveyance claims arising out of the 2007 LBO (the “SLCFC actions”). Rydex ETF Trust has been named as a defendant in one of the SLCFC actions: Deutsche Bank Trust Co. Americas v. McGurn, No. 12-0063 (S.D.N.Y.). In the SLCFC actions, the creditors seek to recover from Tribune’s former shareholders the proceeds received in connection with the 2007 LBO.
The FitzSimons action and the SLCFC actions have been consolidated with the majority of the other Tribune LBO-related lawsuits in a multidistrict litigation proceeding captioned In re Tribune Company Fraudulent Conveyance Litig., No. 11-md-2696 (S.D.N.Y.) (the “MDL Proceeding”).
GUGGENHEIM ETFs ANNUAL REPORT | 23 |
NOTES TO FINANCIAL STATEMENTS (concluded) |
On September 23, 2013, the District Court granted the defendants’ omnibus motion to dismiss the SLCFC actions, on the basis that the creditors lacked standing. On September 30, 2013, the creditors filed a notice of appeal of the September 23 order. On October 28, 2013, the defendants filed a joint notice of cross-appeal of that same order.
On May 23, 2014, the defendants filed motions to dismiss the FitzSimons action, including a global motion to dismiss Count I, which is the claim brought against former Tribune shareholders for intentional fraudulent conveyance under U.S. federal law. The Court has not yet issued a decision on any of these motions.
On March 29, 2016, the U.S. Court of Appeals for the Second Circuit issued its opinion on the appeal of the SLCFC actions. The appeals court affirmed the district court’s dismissal of those lawsuits, but on different grounds than the district court. The appeals court held that while the plaintiffs have standing under the U.S. Bankruptcy Code, their claims were preempted by Section 546(e) of the Bankruptcy Code—the statutory safe harbor for settlement payments. On April 12, 2016, the plaintiffs in the SLCFC actions filed a petition seeking rehearing en banc before the appeals court. On July 22, 2016, the appeals court denied the petition. On September 9, 2016, the plaintiffs filed a petition for writ of certiorari in the U.S. Supreme Court challenging the Second Circuit’s decision that the safe harbor of Section 546(e) applied to their claims. The shareholder defendants, including the Rydex ETF Trust, filed a joint brief in opposition to the petition for writ of certiorari on October 24, 2016. The plaintiffs filed a reply in support of the petition on November 4, 2016. The Supreme Court has not yet granted or denied the petition for certiorari.
None of these lawsuits alleges any wrongdoing on the part of Rydex ETF Trust. The following series of Rydex ETF Trust held shares of Tribune and tendered these shares as part of Tribune’s LBO: Guggenheim S&P 500 Equal Weight ETF (the “Fund”). The value of the proceeds received by the foregoing Fund was $4,766,035. At this stage of the proceedings, Rydex ETF Trust is not able to make a reliable prediction as to the outcome of these lawsuits or the effect, if any, on the Fund’s net asset value.
9. Fund Merger
At a meeting held on October 14, 2015, the Adviser recommended and the Board approved the following changes to the following Funds:
An Agreement and Plan of Reorganization (the “Agreement”) was unanimously approved by the Board providing for the reorganization of the Guggenheim Russell 1000® Equal Weight ETF (the “Acquired Fund”) with and into the Guggenheim S&P 500® Equal Weight ETF (the “Surviving Fund”), each a separate series of the Trust. The Agreement provides for: (a) the transfer of the assets and stated liabilities of the Acquired Fund in exchange for shares of the Surviving Fund and cash in lieu of fractional shares of the Surviving Fund, and (b) the pro rata distribution of shares of the Surviving Fund and cash in lieu of fractional shares of the Surviving Fund by the Acquired Fund to its shareholders, in complete liquidation of the Acquired Fund (the “Reorganization”).
The Reorganization was a tax-free transaction. Security Investors, LLC, the investment adviser to both the Acquired Fund and the Surviving Fund, agreed to bear the costs (except for brokerage expenses incurred by the Acquired Fund prior to the Reorganization) directly related to the Reorganization.
The Reorganization occurred at close of business January 26, 2016, and was effective at market open on January 27, 2016.
24 | GUGGENHEIM ETFs ANNUAL REPORT |
REPORT OF INDEPENDENT REGISTERED PUBLIC ACCOUNTING FIRM |
The Board of Trustees and Shareholders of Rydex ETF Trust
We have audited the accompanying statements of assets and liabilities, including the schedules of investments, of Guggenheim S&P 500® Equal Weight ETF (one of the series constituting the Rydex ETF Trust) (the “Fund”) as of October 31, 2016, and the related statements of operations for the year then ended, the statements of changes in net assets for each of the two years in the period then ended, and the financial highlights for each of the five years in the period then ended. These financial statements and financial highlights are the responsibility of the Funds’ management. Our responsibility is to express an opinion on these financial statements and financial highlights based on our audits.
We conducted our audits in accordance with the standards of the Public Company Accounting Oversight Board (United States). Those standards require that we plan and perform the audit to obtain reasonable assurance about whether the financial statements and financial highlights are free of material misstatement. We were not engaged to perform an audit of the Fund’s internal control over financial reporting. Our audits included consideration of internal control over financial reporting as a basis for designing audit procedures that are appropriate in the circumstances, but not for the purpose of expressing an opinion on the effectiveness of the Funds’ internal control over financial reporting. Accordingly, we express no such opinion. An audit also includes examining, on a test basis, evidence supporting the amounts and disclosures in the financial statements and financial highlights, assessing the accounting principles used and significant estimates made by management, and evaluating the overall financial statement presentation. Our procedures included confirmation of securities owned as of October 31, 2016, by correspondence with the custodian and brokers. We believe that our audits provide a reasonable basis for our opinion.
In our opinion, the financial statements and financial highlights referred to above present fairly, in all material respects, the financial position of Guggenheim S&P 500® Equal Weight ETF (one of the series constituting the Rydex ETF Trust) at October 31, 2016, the results of their operations for the year then ended, the changes in their net assets for each of the two years in the period then ended, and their financial highlights for each of the five years in the period then ended, in conformity with U.S. generally accepted accounting principles.
McLean, Virginia
December 22, 2016
GUGGENHEIM ETFs ANNUAL REPORT | 25 |
OTHER INFORMATION (Unaudited) |
Federal Income Tax Information
In January 2017, shareholders will be advised on IRS Form 1099 DIV or substitute 1099 DIV as to the federal tax status of the distributions received by shareholders in the calendar year 2016.
Of the ordinary income distributions paid during the year, 100% qualifies for the dividends received deduction for corporations.
Additionally, of the ordinary income distributions paid during the year, 100% qualifies for the lower income tax rate available to individuals under the Jobs and Growth Tax Relief Reconciliation Act of 2003.
Proxy Voting Information
A description of the policies and procedures that the Trust uses to determine how to vote proxies relating to securities held in the Funds’ portfolios is available, without charge and upon request, by calling 800.820.0888. This information is also available from the EDGAR database on the SEC’s website at https://www.sec.gov.
Information regarding how the Funds voted proxies relating to portfolio securities during the most recent 12-month period ended June 30 is available without charge, upon request, by calling 800.820.0888. This information is also available from the EDGAR database on the SEC’s website at https://www.sec.gov.
Sector Classification
Information in the Schedule of Investments is categorized by sectors using sector-level Classifications defined by the Bloomberg Industry Classification System, a widely recognized industry classification system provider. Each Fund’s registration statement has investment policies relating to concentration in specific sectors/industries. For purposes of these investment policies, the Funds usually classify sectors/industries based on industry-level Classifications used by widely recognized industry classification system providers such as Bloomberg Industry Classification System, Global Industry Classification Standards and Barclays Global Classification Scheme.
Quarterly Portfolio Schedules Information
The Trust files its complete schedule of portfolio holdings with the SEC for the first and third quarters of each fiscal year on Form N-Q, which are available on the SEC’s website at https://www.sec.gov. The Funds’ Forms N-Q may be reviewed and copied at the SEC’s Public Reference Room in Washington, DC, and that information on the operation of the Public Reference Room may be obtained by calling 800-SEC-0330. Copies of the portfolio holdings are also available to shareholders, without charge and upon request, by calling 800.820.0888.
Board Considerations in Approving the Continuation of the Investment Advisory Agreement
The Board of Trustees (the “Board”) of Rydex ETF Trust (the “Trust”), including the Trustees who are not “interested persons,” as defined by the Investment Company Act of 1940, of the Trust (“Independent Trustees”), attended an in-person meeting held on May 19, 2016, called for the purpose of, among other things, the consideration of, and voting on, the approval and continuation of the investment advisory agreement (the “Investment Advisory Agreement”) between the Trust and the Advisor applicable to each series of the Trust except for the Guggenheim S&P 100® Equal Weight ETF (each, a “Fund” and, collectively, the “Funds”). The Board unanimously approved the continuation of the Investment Advisory Agreement for an additional one-year period based on the Board’s review of qualitative and quantitative information provided by the Advisor. The Board had previously considered information pertaining to the renewal of the Investment Advisory Agreement at an in-person meeting held on April 26, 2016 (together, with the May 19 meeting, the “Meetings”).
Prior to reaching the conclusion to approve the continuation of the Investment Advisory Agreement, the Independent Trustees requested and obtained from the Advisor such information as the Independent Trustees deemed reasonably necessary to evaluate the Investment Advisory Agreement. In addition, the Board received a memorandum from Fund counsel regarding the responsibilities of the Board with respect to the approval of investment advisory agreements and participated in question and answer sessions with representatives of the Advisor. The Independent Trustees also carefully considered information that they had received throughout the year as part of their regular oversight of the Funds. At the Meetings, the Board obtained and reviewed a wide variety of information, including certain comparative information regarding the Funds’ fees, expenses, and performance relative to the fees, expenses, and performance of other comparable funds (the “FUSE reports”). The Independent Trustees carefully evaluated this information, met in executive session outside the presence of fund management, and were advised by independent legal counsel with respect to their deliberations.
26 | GUGGENHEIM ETFs ANNUAL REPORT |
OTHER INFORMATION (Unaudited)(continued) |
At the Meetings, the Board, including the Independent Trustees, evaluated a number of factors, including among others: (a) the nature, extent and quality of the Advisor’s investment advisory and other services; (b) the Advisor’s investment management personnel; (c) the Advisor’s operations and financial condition; (d) the Advisor’s brokerage practices (including any soft dollar arrangements) and the variety and complexity of its investment strategies; (e) a comparison of the Funds’ advisory fees to the advisory fees charged to comparable funds or accounts, giving special attention to the existence of economies of scale and the absence of breakpoints in these fees and the Advisor’s rationale for not providing for breakpoints at this point in time; (f) each Fund’s overall fees and operating expenses compared with those of similar funds; (g) the level of the Advisor’s profitability from its Fund-related operations; (h) the Advisor’s compliance processes and systems; (i) the Advisor’s compliance policies and procedures; (j) the Advisor’s reputation, expertise and resources in the financial markets; and (k) Fund performance compared with that of similar funds and/or appropriate benchmarks. In its deliberations, the Trustees did not identify any single piece of information that was all-important or controlling, noting that each Trustee could attribute different weights to the various factors considered.
Based on the Board’s deliberations at the Meetings, the Board, including all of the Independent Trustees, unanimously: (a) concluded that the terms of the Investment Advisory Agreement are fair and reasonable; (b) concluded that the Advisor’s fees are reasonable in light of the services that it provides to the Funds; and (c) agreed to approve and continue the Investment Advisory Agreement based upon the following considerations, among others:
● | Nature, Extent and Quality of Services Provided by the Advisor. The Board evaluated, among other things, the Advisor’s business, financial resources, quality and quantity of personnel, experience, past performance, the variety and complexity of its investment strategies (including the extent to which the Funds use derivatives), Fund risk management process, brokerage practices, and the adequacy of its compliance systems and processes, proxy voting policies and practices, and cybersecurity programs. The Board reviewed the scope of services to be provided by the Advisor under the Investment Advisory Agreement and noted that there would be no significant differences between the scope of services required to be provided by the Advisor for the past year and the scope of services required to be provided during the upcoming year. The Board also considered the Advisor’s representations to the Board that the Advisor would continue to provide investment and related services that were of materially the same quality and quantity as services provided to the Funds in the past, and whether these services are appropriate in scope and extent in light of the Funds’ operations, the competitive landscape of the investment company business and investor needs. Based on the foregoing, the Trustees determined that the approval of the Investment Advisory Agreement would enable shareholders of the Funds to receive high quality services at a cost that was appropriate and reasonable. |
● | Fund Expenses and Performance of the Funds and the Advisor. The Board reviewed statistical information provided by the Advisor regarding the expense ratio components and performance of each Fund. The Advisor engaged FUSE Research Network LLC (“FUSE”), an independent, third party research provider, to prepare reports to help the Board compare the Funds’ fees, expenses, and total return performance with those of a peer group and peer universe of funds selected by FUSE. In the reports, each Fund’s expense ratio components, including actual advisory fees, waivers/reimbursements, and gross and net total expenses, are compared to those of other funds with shared key characteristics (e.g., asset size, fee structure, sector or industry investment focus) determined by FUSE to comprise a Fund’s applicable peer group. The Board considered the Advisor’s representation that it found the peer groups compiled by FUSE to be appropriate, but also acknowledged the existence of certain differences between the Funds and their peer funds (e.g., specific differences in principal investment strategies) that should be reviewed in context. The statistical information related to the performance of each Fund included three-month and one-, three-, and five-year performance for the Fund compared to that of its peers. The Board also discussed the correlation between a Fund’s assets under management and tracking error, noting that a Fund’s ability to replicate an underlying index rather than employ representative sampling depends, in part, upon the Fund’s size. Based on the foregoing, the Board determined that the proposed advisory fees paid by the Funds are reasonable in relation to the nature and quality of the services provided by the Advisor. |
● | Costs of Services Provided to the Funds and Profits Realized by the Advisor and its Affiliates. The Board reviewed information about the profitability of the Funds to the Advisor based on the advisory fees payable under the current Investment Advisory Agreement for the last calendar year. The Board noted that the Advisor had contractually agreed to pay all operating expenses of the Funds, including the cost of index licensing fees, transfer agency, custody, fund administration, legal, audit and other services, except management fees, interest expense, taxes (expected to be de minimis), brokerage commissions and other expenses connected with the execution of portfolio transactions, extraordinary expenses, distribution fees, and expenses paid by the Trust under any distribution plan adopted pursuant to Rule 12b-1 under the 1940 Act. In addition to those expenses listed above, the Board noted that for the Guggenheim S&P 500® Equal Weight ETF and each Guggenheim S&P 500® Equal Weight Sector ETF (with the exception of the Guggenheim S&P 500® Equal Weight Real Estate ETF), the Advisor also had contractually agreed to pay expenses of the Independent Trustees (including any Trustees’ counsel fees). The Board also analyzed the Funds’ expenses, including the investment advisory fees paid to the Advisor, and reviewed the FUSE |
GUGGENHEIM ETFs ANNUAL REPORT | 27 |
OTHER INFORMATION (Unaudited)(continued) |
reports. The Board also reviewed information regarding the direct revenue received by the Advisor and ancillary revenue, if any, received by the Advisor and/or its affiliates in connection with the services provided to the Funds by the Advisor and/or its affiliates. The Board also discussed the Advisor’s profit margin, including the expense allocation methodology used in the Advisor’s profitability analysis. . Based on the foregoing, the Board determined that the profit to the Advisor on the fees paid by the Funds is not excessive in view of the nature and quality of the services provided by the Advisor.
● | Economies of Scale. The Board considered the absence of breakpoints in the Advisor’s fee schedule and reviewed information regarding the extent to which economies of scale or other efficiencies may result from increases in the Funds’ asset levels. The Board noted that the Investment Advisory Agreement did not provide for breakpoints in each Fund’s advisory fee rates as assets of a Fund increase. However, the Board further noted the Advisor’s assertion that future economies of scale had been taken into consideration by fixing relatively low advisory fees for the Funds, effectively sharing the benefits of lower fees with the Funds from inception. The Board noted that it intends to continue to monitor fees as each Fund grows in size and assess whether fee breakpoints may be warranted. |
● | Other Benefits to the Advisor and/or its Affiliates. In addition to evaluating the Advisor’s services, the Board considered the nature and amount of other benefits to be received by the Advisor and its affiliates as a result of their relationship with the Fund, including any soft dollar usage by the Advisor and any intangible benefits. In particular, the Board considered the nature, extent, quality, and cost of certain distribution services performed by the Advisor’s affiliate under the distribution agreement and the Distribution Plan pursuant to Rule 12b-1 of the 1940 Act. In light of the costs of providing services pursuant to the separate agreements as well as the Advisor’s and its affiliates’ commitment to the Funds, the Board concluded the ancillary benefits the Advisor and its affiliates received were reasonable. |
On the basis of the information provided to it and its evaluation of that information, the Board, including the Independent Trustees, concluded that the terms of the Investment Advisory Agreement were reasonable, and that approval of the continuation of the Investment Advisory Agreement was in the best interests of the Funds and their shareholders.
Board Considerations in Approving the Investment Advisory Agreement for the Guggenheim S&P 100® Equal Weight ETF
The Board of the Trust, including the Independent Trustees, attended an in-person meeting held on February 25, 2016 (the “February Meeting”), called for the purpose of, among other things, the consideration of, and voting on, the approval of the investment advisory agreement (the “OEW Investment Advisory Agreement”) between the Trust and Security Investors, LLC (the “Advisor”) applicable to the Guggenheim S&P 100® Equal Weight ETF, a new series of the Trust (the “OEW Fund”). The Board unanimously approved the OEW Investment Advisory Agreement based on the Board’s review of qualitative and quantitative information provided by the Advisor.
Prior to reaching the conclusion to approve the OEW Investment Advisory Agreement, the Independent Trustees requested and obtained from the Advisor such information as the Independent Trustees deemed reasonably necessary to evaluate the OEW Investment Advisory Agreement. In addition, the Board received a memorandum from Fund counsel regarding the responsibilities of the Board with respect to the approval of investment advisory agreements and participated in question and answer sessions with representatives of the Advisor. The Independent Trustees also carefully considered information that they had received about the Advisor throughout the year as part of their regular oversight of the other series of the Trust. At the May Meeting, the Board obtained and reviewed a wide variety of information, including certain comparative information regarding the OEW Fund’s proposed fees and expenses relative to the fees and expenses of other comparable funds (the “FUSE reports”). The Independent Trustees carefully evaluated this information, met in executive session outside the presence of fund management, and were advised by independent legal counsel with respect to their deliberations.
At the February Meeting, the Board, including the Independent Trustees, evaluated a number of factors, including among others: (a) the nature, extent and quality of the investment advisory and other services to be provided by the Advisor; (b) the Advisor’s investment management personnel; (c) the Advisor’s operations and financial condition; (d) the expected benefits (such as soft dollars, if any) derived by the Advisor and its affiliates from their relationship with the OEW Fund; (e) a comparison of the OEW Fund’s projected advisory fees to the advisory fees charged to comparable funds or accounts, giving special attention to the absence of breakpoints in these fees and the Advisor’s rationale for not providing for breakpoints at this point in time; (f) the OEW Fund’s expected overall fees and operating expenses compared with those of similar funds; (g) the Advisor’s compliance processes and systems; (h) the Advisor’s compliance policies and procedures; and (i) the Advisor’s reputation, expertise and resources in the financial markets; and (j) the Advisor’s performance with respect to existing similar Funds. In its deliberations, the Trustees did not identify any single piece of information that was all-important or controlling, noting that each Trustee could attribute different weights to the various factors considered.
28 | GUGGENHEIM ETFs ANNUAL REPORT |
OTHER INFORMATION (Unaudited)(concluded) |
Based on the Board’s deliberations at the February Meeting, the Board, including all of the Independent Trustees, unanimously: (a) concluded that the terms of the OEW Investment Advisory Agreement are fair and reasonable; (b) concluded that the Advisor’s fees are reasonable in light of the services that it will provide to the OEW Fund; and (c) agreed to approve the OEW Investment Advisory Agreement based upon the following considerations, among others:
● | Nature, Extent and Quality of Services Provided by the Advisor. The Board reviewed the scope of services to be provided by the Advisor under the OEW Investment Advisory Agreement and determined that the Advisor was capable of providing high quality advisory services to the OEW Fund, as indicated by the nature and quality of services provided by the Advisor in the past, the firm’s management capabilities, the professional qualifications and experience of its portfolio managers, and its investment and management oversight processes. Based on the foregoing, the Trustees determined that the approval of the OEW Investment Advisory Agreement would enable shareholders of the Fund to receive high quality services at a cost that was appropriate and reasonable. |
● | Fund Expenses and Performance of the OEW Fund and the Advisor. As the OEW Fund had not yet commenced operations, the Board was not able to review the OEW Fund’s performance. However, the Board considered the Advisor’s track record of successfully managing funds that seek to track the performance of a benchmark and determined that the Advisor would have the capabilities, resources, and personnel necessary to provide the OEW Fund with a reasonable potential for positive performance. The Board also reviewed statistical information provided by the Advisor regarding the OEW Fund’s proposed expense ratio components. The Advisor engaged FUSE Research Network LLC (“FUSE”), an independent, third party research provider, to prepare a report to help the Board compare the OEW Fund’s fees and expenses to those of comparable funds in the OEW Fund’s peer group, and the broader peer universe, as determined by FUSE. In the report, the OEW Fund’s proposed expense ratio components, including advisory fees, waivers/reimbursements, and gross and net total expenses, are compared to those of other funds with shared key characteristics (e.g., asset size, fee structure, sector or industry investment focus) determined by FUSE to comprise the OEW Fund’s applicable peer group. The Board considered the Advisor’s representation that it found the peer groups compiled by FUSE to be appropriate, but also acknowledged the existence of certain differences between the OEW Fund and its peer funds (e.g., specific differences in principal investment strategies) that should be reviewed in context. The Board also discussed the correlation between assets under management and tracking error, noting that the OEW Fund’s ability to replicate its underlying index rather than employ representative sampling will depend, in part, upon the OEW Fund’s size. Based on the foregoing, the Board determined that the proposed advisory fee to be paid by the OEW Fund is reasonable in relation to the nature and quality of the services to be provided by the Advisor. |
● | Costs of Services Provided to the OEW Fund and Profits Realized by the Advisor and its Affiliates. The Board noted that the Advisor had contractually agreed to pay all operating expenses of the OEW Fund, including the cost of index licensing fees, transfer agency, custody, fund administration, legal, audit and other services, except management fees, interest expense, taxes (expected to be de minimis), brokerage commissions and other expenses connected with the execution of portfolio transactions, extraordinary expenses, distribution fees, and expenses paid by the Trust under any distribution plan adopted pursuant to Rule 12b-1 under the 1940 Act, and expenses of the Independent Trustees (including any Trustees’ counsel fees). With respect to the cost of advisory services provided and the Advisor’s profitability, the Board concluded that it was too early to predict the profitability of the OEW Fund to the Advisor, but noted that they would monitor the Advisor’s profitability with respect to the OEW Fund after the OEW Fund commenced operations. |
● | Economies of Scale. The Board considered the absence of breakpoints in the Advisor’s fee schedule and reviewed information regarding the extent to which economies of scale or other efficiencies may result from increases in the OEW Fund’s asset levels. The Board noted that because the OEW Fund had not yet commenced operations, there were as of now, no economies of scale to share with shareholders. The Board also considered the Advisor’s statements that it would consider the introduction of breakpoints in the future and noted that it intends to continue monitoring the existence of economies of scale as the OEW Fund grows in size. |
● | Other Benefits to the Advisor and/or its Affiliates. In addition to evaluating the Advisor’s services, the Board considered the nature and amount of other benefits to be received by the Advisor and its affiliates as a result of their relationship with the OEW Fund, including any soft dollar usage by the Advisor and any intangible benefits. In particular, the Board considered the nature, extent, quality, and cost of certain distribution services to be performed by the Advisor’s affiliate and the fees to be paid to the Advisor’s affiliates for those services under the distribution agreement and the Distribution Plan pursuant to Rule 12b-1 of the 1940 Act. In light of the costs of providing services pursuant to the separate agreements as well as the Advisor’s and its affiliates’ commitment to the OEW Fund, the Board concluded the ancillary benefits the Advisor and its affiliates received were reasonable. |
On the basis of the information provided to it and its evaluation of that information, the Board, including the Independent Trustees, concluded that the terms of the OEW Investment Advisory Agreement were reasonable, and that approval of the OEW Investment Advisory Agreement was in the best interests of the OEW Fund and its shareholders.
GUGGENHEIM ETFs ANNUAL REPORT | 29 |
INFORMATION ON BOARD OF TRUSTEES AND OFFICERS (Unaudited) |
A Board of Trustees oversees the Trust, as well as other trusts of GI, in which its members have no stated term of service, and continue to serve after election until resignation. The Statement of Additional Information includes further information about Fund Trustees and Officers, and can be obtained without charge by visiting guggenheiminvestments.com or by calling 800.820.0888.
Name, Address* and Year of Birth of Trustee | Position(s) Held with the | Principal Occupation(s) | Number of | Other |
INTERESTED TRUSTEE | ||||
Donald C. Cacciapaglia** (1951) | Trustee from 2012 to present. | Current: President and CEO, certain other funds in the Fund Complex (2012-present); Vice Chairman, Guggenheim Investments (2010-present).
Former: Chairman and CEO, Channel Capital Group, Inc. (2002-2010). | 232 | Clear Spring Life Insurance Company (2015-present); Guggenheim Partners Japan, Ltd. (2014-present); Guggenheim Partners Investment Management Holdings, LLC (2014-present); Delaware Life (2013-present); Guggenheim Life and Annuity Company (2011-present); Paragon Life Insurance Company of Indiana (2011-present). |
INDEPENDENT TRUSTEES | ||||
Angela Brock-Kyle***** | Trustee from August 2016 to present. | Current: Founder and Chief Executive Officer, B.O.A.R.D.S (consulting firm)
Former: Senior Leader, TIAA (financial services firm) (1987-2012). | 135 | Infinity Property & Casualty Corporation (2014-present). |
Corey A. Colehour (1945) | Trustee and Member of the Audit Committee from 2003 to present; Member of the Governance and Nominating Committees from 2005 to present; and Member of the Investment and Performance Committee from 2014 to present. | Retired. | 135 | None. |
J. Kenneth Dalton (1941) | Trustee from 2003 to present; Chairman and Member of the Audit Committee from 2003 to present; Member of the Governance and Nominating Committees from 2005 to present; and Member of the Compliance and Risk Oversight Committee from 2010 to present. | Retired. | 135 | Epiphany Funds (4) (2009-present). |
30 | GUGGENHEIM ETFs ANNUAL REPORT |
INFORMATION ON BOARD OF TRUSTEES AND OFFICERS (Unaudited)(continued) |
Name, Address* and Year of Birth of Trustee | Position(s) Held with the | Principal Occupation(s) | Number of | Other |
INDEPENDENT TRUSTEES - concluded | ||||
John O. Demaret (1940) | Vice Chairman of the Board of Trustees from 2014 to present; Trustee and Member of the Audit Committee from 2003 to present; Chairman of the Board from 2006 to 2014; Member of the Compliance and Risk Oversight Committee from 2010 to present; Chairman and Member of the Investment and Performance Committee from 2014 to present; and Member of the Nominating Committee from 2014 to present. | Retired. | 135 | None. |
Werner E. Keller (1940) | Chairman of the Board from 2014 to present; Trustee and Member of the Audit, Governance and Nominating Committees from 2005 to present; Chairman and Member of the Compliance and Risk Oversight Committee from 2010 to present; and Member of the Investment and Performance Committee from 2014 to present. | Current: Founder and President, Keller Partners, LLC (investment research firm) (2005-present). | 135 | None. |
Thomas F. Lydon, Jr. (1960) | Trustee and Member of the Audit, Governance and Nominating Committees from 2005 to present. | Current: President, Global Trends Investments (registered investment adviser) (1996-present). | 135 | US Global Investors (GROW) (1995-present). |
Patrick T. McCarville (1942) | Trustee and Member of the Audit Committee from 2003 to present; Chairman and Member of the Governance and Nominating Committees from 2005 to present. | Retired.
Former: Chief Executive Officer, Par Industries, Inc., d/b/a Par Leasing (1977-2010). | 135 | None. |
Sandra G.Sponem***** (1958) | Trustee from August 2016 to present. | Current: Senior Vice President and Chief Financial Officer, M.A. Mortenson Companies, Inc. (general contracting firm) (2007-present). | 135 | None. |
GUGGENHEIM ETFs ANNUAL REPORT | 31 |
INFORMATION ON BOARD OF TRUSTEES AND OFFICERS (Unaudited)(continued) |
Name, Address* | Position(s) Held with the | Principal Occupation(s) |
OFFICERS | ||
Michael P. Byrum (1970) | Vice President (1999-present). | Current: Senior Vice President, Security Investors, LLC (2010-present); President and Chief Investment Officer, Rydex Holdings, LLC (2008-present); Director and Chairman, Advisory Research Center, Inc. (2006-present); Manager, Guggenheim Specialized Products, LLC (2005-present).
Former: Vice President, Guggenheim Distributors, LLC (2009); Director (2009-2010) and Secretary (2002-2010), Rydex Fund Services, LLC; Director (2008-2010), Chief Investment Officer (2006-2010), President (2004-2010) and Secretary (2002-2010), Rydex Advisors, LLC; Director (2008-2010), Chief Investment Officer (2006-2010), President (2004-2010) and Secretary (2002-2010), Rydex Advisors II, LLC. |
Joanna M. Catalucci (1966) | AML Officer (Since 2016) | Current: Chief Compliance Officer, certain funds in the Fund Complex (2012-present); Senior Managing Director, Guggenheim Investments (2012-present); AML Officer, certain funds in the Fund Complex (2016-present).
Former: Chief Compliance Officer and Secretary, certain other funds in the Fund Complex (2008-2012); Senior Vice President & Chief Compliance Officer, Security Investors, LLC and certain affiliates (2010-2012); Chief Compliance Officer and Senior Vice President, Rydex Advisors, LLC and certain affiliates (2010-2011). |
James M. Howley (1972) | Assistant Treasurer (2016-present). | Current: Director, Guggenheim Investments (2004-present); Assistant Treasurer, certain other funds in the Fund Complex (2006-present).
Former: Manager, Mutual Fund Administration of Van Kampen Investments, Inc. (1996-2004). |
Keith D. Kemp (1960) | Assistant Treasurer (2016-present). | Current: Managing Director of Transparent Value, LLC (2015-present); Managing Director of Guggenheim Investments (2015-present).
Former: Director, Transparent Value, LLC (2010-2015); Director, Guggenheim Investments (2010-2015); Chief Operating Officer, Macquarie Capital Investment Management (2007-2009). |
Amy J. Lee (1961) | Vice President (2009-present) and Secretary (2012-present). | Current: Chief Legal Officer, certain other funds in the Fund Complex (2013-present); Senior Managing Director, Guggenheim Investments (2012-present).
Former: Vice President, Associate General Counsel and Assistant Secretary, Security Benefit Life Insurance Company and Security Benefit Corporation (2004-2012). |
Glenn McWhinnie (1969) | Assistant Treasurer (2016-present). | Current: Vice President, Guggenheim Investments (2009-present).
Former: Tax Compliance Manager, Ernst & Young LLP (1996-2009). |
Elisabeth Miller (1968) | Chief Compliance Officer (2012-present). | Current: CCO, certain other funds in the Fund Complex (2012-present); CCO, Security Investors, LLC (2012-present); CCO, Guggenheim Funds Investment Advisors, LLC (2012-present); Managing Director, Guggenheim Investments (2012-present); Vice President, Guggenheim Funds Distributors, LLC (2014-present).
Former: CCO, Guggenheim Distributors, LLC (2009-2014); Senior Manager, Security Investors, LLC (2004-2009); Senior Manager, Guggenheim Distributors, LLC (2004-2009). |
32 | GUGGENHEIM ETFs ANNUAL REPORT |
INFORMATION ON BOARD OF TRUSTEES AND OFFICERS (Unaudited)(concluded) |
Name, Address* | Position(s) Held with the | Principal Occupation(s) |
OFFICERS - concluded | ||
Adam J. Nelson (1979) | Assistant Treasurer (2016-present). | Current: Vice President, Guggenheim Investments (2015-present); Assistant Treasurer, certain other funds in the Fund Complex (2015-present).
Former: Assistant Vice President and Fund Administration Director, State Street Corporation (2013-2015); Fund Administration Assistant Director, State Street (2011-2013); Fund Administration Manager, State Street (2009-2011). |
Kimberly J. Scott (1974) | Assistant Treasurer (2016-present). | Current: Vice President, Guggenheim Investments (2012-present); Assistant Treasurer, certain other funds in the Fund Complex (2012-present).
Former: Financial Reporting Manager, Invesco, Ltd. (2010-2011); Vice President/Assistant Treasurer, Mutual Fund Administration for Van Kampen Investments, Inc./Morgan Stanley Investment Management (2009-2010); Manager of Mutual Fund Administration, Van Kampen Investments, Inc./Morgan Stanley Investment Management (2005-2009). |
John L. Sullivan (1955) | Chief Financial Officer and Treasurer (2016-present). | Current: CFO, Chief Accounting Officer and Treasurer, certain other funds in the Fund Complex (2010-present); Senior Managing Director, Guggenheim Investments (2010-present).
Former: Managing Director and CCO, each of the funds in the Van Kampen Investments fund complex (2004-2010); Managing Director and Head of Fund Accounting and Administration, Morgan Stanley Investment Management (2002-2004); CFO and Treasurer, Van Kampen Funds (1996-2004). |
* | All Trustees and Officers may be reached c/o Guggenheim Investments, 227 West Monroe Street, Chicago, Illinois 60606. |
** | Mr. Cacciapaglia is an “interested” person of the Trust, as that term is defined in the 1940 Act by virtue of his affiliation with the Adviser’s parent company. |
*** | The “Fund Complex” includes all closed-end and open-end funds (including all of their portfolios) advised by the Adviser and any funds that have an investment adviser or servicing agent that is an affiliated person of the Adviser. Information provided is as of the date of this report. |
**** | Certain of the Trustees may serve as directors on the boards of companies not required to be disclosed above, including certain non-profit companies and charitable foundations. |
***** | Mses. Brock-Kyle and Sponem commenced serving as independent Trustees effective August 18, 2016. |
GUGGENHEIM ETFs ANNUAL REPORT | 33 |
GUGGENHEIM INVESTMENTS PRIVACY POLICIES (Unaudited) |
Guggenheim Investments as used herein refers to Guggenheim Partners, LLC, Guggenheim Funds Investment Advisors, LLC, Guggenheim Partners Investment Management, LLC, Guggenheim Funds Distributors, LLC and Security Investors, LLC as well as the funds in the Guggenheim Funds complex (the “funds”).
Our Commitment to You
When you become a Guggenheim Investments investor, you entrust us with not only your hard-earned money but also with personal and financial information about you. We recognize that your relationship with us is based on trust and that you expect us to act responsibly and in your best interests. Because we have access to personal information about you, we hold ourselves to high standards in its safekeeping and use. This means, most importantly, that we do not sell client or account information to anyone—whether you are a current or former Guggenheim Investments client.
The Information We Collect About You and How We Collect It
In the course of doing business with shareholders and investors, we collect nonpublic personal information about you. You typically provide personal information when you complete a Guggenheim Investments account application or when you request a transaction that involves Rydex and Guggenheim Funds or one of the Guggenheim affiliated companies. “Nonpublic personal information” is personally identifiable information about you. For example it includes your name and address, Social Security or taxpayer identification number, assets, income, account balance, bank account information and investment activity (e.g. purchase and redemption history).
How We Share Your Personal Information
As a matter of policy, we do not disclose your nonpublic personal information to nonaffiliated third parties except as required or permitted by law. As emphasized above, we do not sell information about current or former clients or their accounts to third parties. Nor do we share such information, except when necessary to complete transactions at your request or to make you aware of related investment products and services that we offer. Additional details about how we handle your personal information are provided below.
To complete certain transactions or account changes that you direct, it may be necessary to provide your personal information to companies, individuals or groups that are not affiliated with Guggenheim Investments. For example if you ask to transfer assets from another financial institution to Guggenheim Investments, we will need to provide certain information about you to that company to complete the transaction. In connection with servicing your accounts or to alert you to other Guggenheim Investments investment products and services, we may share your information within the Guggenheim Investments family of affiliated companies. This would include, for example, sharing your information within Guggenheim Investments so we can make you aware of new funds or the services offered through another Guggenheim Investments affiliated company. In certain instances, we may contract with nonaffiliated companies to perform services for us. Where necessary, we will disclose information we have about you to these third parties. In all such cases, we provide the third party with only the information necessary to carry out its assigned responsibilities and only for that purpose. And we require these third parties to treat your personal information with the same high degree of confidentiality that we do. In certain instances, we may share information with other financial institutions regarding individuals and entities in response to the U.S.A. Patriot Act. Finally we will share personal information about you if we are compelled by law to do so, if you direct us to do so with your consent, or in other circumstances as permitted by law.
How We Safeguard Your Personal Information
We maintain physical, electronic and procedural safeguards to protect your personal information. Within Guggenheim Investments, access to such information is limited to those who need it to perform their jobs such as servicing your account, resolving problems or informing you of new products and services.
34 | GUGGENHEIM ETFs ANNUAL REPORT |
This page intentionally left blank.
This page intentionally left blank.
This page intentionally left blank.
| (Registrant) | Rydex ETF Trust | ||
By (Signature and Title)* | /s/ Donald C. Cacciapaglia | ||
| Donald C. Cacciapaglia, President | |||
| Date | January 6, 2017 | ||
| Pursuant to the requirements of the Securities Exchange Act of 1934 and the Investment Company Act of 1940, this report has been signed below by the following persons on behalf of the registrant and in the capacities and on the dates indicated. | |||
| By (Signature and Title)* | /s/ Donald C. Cacciapaglia | ||
| Donald C. Cacciapaglia, President | |||
| Date | January 6, 2017 | ||
| By (Signature and Title)* | /s/ John L. Sullivan | ||
| John L. Sullivan, Chief Financial Officer and Treasurer | |||
| Date | January 6, 2017 | ||