SECURITIES AND EXCHANGE COMMISSION
Washington, D.C. 20549
Rockville, Maryland 20850
(Address of principal executive offices) (Zip code)
805 King Farm Boulevard, Suite 600
Rockville, Maryland 20850
(Name and address of agent for service)
10.31.2015
Guggenheim ETFs Annual Report
| |
EWRM | Guggenheim Russell MidCap® Equal Weight ETF |
EWRI | Guggenheim Russell 1000® Equal Weight ETF |
EWRS | Guggenheim Russell 2000® Equal Weight ETF |
EWEM | Guggenheim MSCI Emerging Markets Equal Country Weight ETF |
RCD | Guggenheim S&P 500® Equal Weight Consumer Discretionary ETF |
RHS | Guggenheim S&P 500® Equal Weight Consumer Staples ETF |
RYE | Guggenheim S&P 500® Equal Weight Energy ETF |
RYF | Guggenheim S&P 500® Equal Weight Financials ETF |
RYH | Guggenheim S&P 500® Equal Weight Health Care ETF |
RGI | Guggenheim S&P 500® Equal Weight Industrials ETF |
RTM | Guggenheim S&P 500® Equal Weight Materials ETF |
EWRE | Guggenheim S&P 500® Equal Weight Real Estate ETF |
RYT | Guggenheim S&P 500® Equal Weight Technology ETF |
RYU | Guggenheim S&P 500® Equal Weight Utilities ETF |
ETF1-ANN-1015x1016 | guggenheiminvestments.com |
TABLE OF CONTENTS |
DEAR SHAREHOLDER | 2 |
ECONOMIC AND MARKET OVERVIEW | 3 |
FEES AND EXPENSES | 5 |
MANAGER'S ANALYSIS | 7 |
PORTFOLIO SUMMARY | 8 |
SCHEDULES OF INVESTMENTS | 36 |
STATEMENTS OF ASSETS AND LIABILITIES | 95 |
STATEMENTS OF OPERATIONS | 99 |
STATEMENTS OF CHANGES IN NET ASSETS | 103 |
FINANCIAL HIGHLIGHTS | 110 |
NOTES TO FINANCIAL STATEMENTS | 124 |
REPORT OF INDEPENDENT REGISTERED PUBLIC ACCOUNTING FIRM | 135 |
OTHER INFORMATION | 136 |
INFORMATION ON BOARD OF TRUSTEES AND OFFICERS | 141 |
GUGGENHEIM INVESTMENTS PRIVACY POLICIES | 144 |
GUGGENHEIM ETFs ANNUAL REPORT | 1 |
October 31, 2015 |
Dear Shareholder:
Security Investors, LLC (the “Investment Adviser”) is pleased to present the annual shareholder report for a selection of our exchange-traded funds (“ETFs”) for the 12-month period ended October 31, 2015.
The Investment Adviser is part of Guggenheim Investments, which represents the investment management businesses of Guggenheim Partners, LLC (“Guggenheim”), a global, diversified financial services firm.
Guggenheim Funds Distributors, LLC is the distributor of the Funds. Guggenheim Funds Distributors, LLC is affiliated with Guggenheim and the Investment Adviser.
We encourage you to read the Economic and Market Overview, which follows this letter, followed by the Manager’s Analysis for each ETF.
Sincerely,

Donald C. Cacciapaglia
President
November 30, 2015
Read a prospectus and summary prospectus (if available) carefully before investing. It contains the investment objectives, risks, charges, expenses, and other information, which should be considered carefully before investing. Obtain a prospectus and summary prospectus (if available) at guggenheiminvestments.com or call 800.820.0888.
ETFs may not be suitable for all investors. ● Investment returns and principal value will fluctuate so that when shares are redeemed, they may be worth more or less than original cost. Most investors will also incur customary brokerage commissions when buying or selling shares of an ETF. ● Investments in securities and derivatives, in general, are subject to market risks that may cause their prices to fluctuate over time. ● ETF shares may trade below their net asset value per share (“NAV”). The NAV of shares will fluctuate with changes in the market value of an ETF’s holdings. In addition, there can be no assurance that an active trading market for shares will develop or be maintained. ● Tracking error risk refers to the risk that the Adviser may not be able to cause the ETF’s performance to match or correlate to that of the ETF’s underlying index, either on a daily or aggregate basis. Tracking error risk may cause the ETF’s performance to be less than you expect. Please review a prospectus carefully for more information of the risks associated with each ETF.
2 | GUGGENHEIM ETFs ANNUAL REPORT |
ECONOMIC AND MARKET OVERVIEW (Unaudited) | October 31, 2015 |
At the end of the period, the U.S. economic expansion was continuing to mature, but remained strong. Central banks’ aversion to any downturn should support the rebound in risk assets that began after the market correction in the third quarter.
The U.S. Federal Open Market Committee’s resolution to remain on hold at its September meeting, due to volatility emanating from China, confirmed that global macroeconomic issues and market volatility can play a significant role in determining when policy tightening finally commences. Any bad news or setback in the global economy is likely to be met with a policy decision that will be supportive for credit and equity markets.
In Europe, European Central Bank (ECB) President Mario Draghi hinted strongly that additional monetary policy easing is on the way, as inflation remains well below the ECB’s 2% target and the growth outlook remains uncertain. In Japan, the central bank revised down inflation and growth forecasts, and signaled a willingness to expand its quantitative easing program further.
In the U.S., a decision to raise rates will be data dependent. Given the October employment report, December liftoff appears likely, unless there is some catastrophic event before then. A December hike should be taken as a sign that the U.S. Federal Reserve is sufficiently comfortable with the strength of the economy and the near-term outlook, which should be good news for investors.
As for the fundamentals of the U.S. economy, the data look encouraging. Underlying real GDP growth was actually stronger than the 1.5% preliminary estimate for the third quarter would suggest. This is because the U.S. was due for an inventory correction, and declining inventory investment shaved 1.4 percentage points off the headline growth figure. Consumer spending, which accounts for about two-thirds of U.S. demand, rose by 3.2%, indicating that consumer spending is strong heading into the holiday shopping season. Robust equity returns in October—the largest monthly gains in four years—also bode well for Christmas sales.
It would be premature to pop the champagne just yet. Slowing emerging market growth continues to weigh upon economic growth around the world, particularly in Europe. Meanwhile, the measure of New York Stock Exchange market breadth has failed to make new highs, or at least return to old highs, which would confirm sustainability of the equity market rally occurring at period end. This is okay for the moment, because equities have yet to quite reach their old highs either—at period end, the market remained a stone’s throw away from its peak in May—but breadth often leads the market, and over the coming months investors should keep a close eye on it.
For the 12-month period ended October 31, 2015, the return of the Standard & Poor’s 500® Index* (“S&P 500”) was 5.20%. The Barclays U.S. Aggregate Bond Index* returned 1.96% for the period, while the Bank of America Merrill Lynch 3-Month U.S. Treasury Bill Index* returned 0.02%. The MSCI World Index* returned 1.77%, while the MSCI Emerging Markets Index* returned -14.53%.
The opinions and forecasts expressed may not actually come to pass. This information is subject to change at any time, based on market and other conditions, and should not be construed as a recommendation of any specific security or strategy.
*Index Definitions:
The following indices are referenced throughout this report. Indices are unmanaged and not available for direct investment. Index performance does not reflect transaction costs, fees, or expenses.
Bank of America (“BofA”) Merrill Lynch 3-Month U.S. Treasury Bill Index is an unmanaged market index of U.S. Treasury securities maturing in 90 days that assumes reinvestment of all income.
Barclays U.S. Aggregate Bond Index is a broad-based benchmark that measures the investment grade, U.S. dollar-denominated, fixed-rate taxable bond market, including U.S. Treasuries, government-related and corporate securities, MBS (agency fixed-rate and hybrid ARM pass-throughs), ABS and CMBS.
MSCI Emerging Markets Index is a free float-adjusted market capitalization weighted index that is designed to measure equity market performance in the global emerging markets.
MSCI World Index is a free float-adjusted market capitalization weighted index that is designed to measure the equity market performance of developed markets.
GUGGENHEIM ETFs ANNUAL REPORT | 3 |
ECONOMIC AND MARKET OVERVIEW (Unaudited)(concluded) | October 31, 2015 |
S&P 500® Index is a capitalization-weighted index of 500 stocks designed to measure the performance of the broad economy, representing all major industries and is considered a representation of the U.S. stock market.
Russell 1000® Equal Weight Index is an unmanaged equal-weighted version of the Russell 1000® Index, which is an unmanaged capitalization-weighted index representing the U.S. large-cap market. The Russell 1000® Equal Weight Index offers sector equal weight exposure by equally weighting the nine sectors within the Index and then equally weighting the securities within each sector. Russell 1000® Index measures the performance of the large-cap segment of the U.S. equity universe. It is a subset of the Russell 3000® Index and includes approximately 1,000 of the largest securities based on a combination of their market cap and current index membership. The Russell 1000® represents approximately 92% of the U.S. market.
Russell MidCap® Equal Weight Index is an unmanaged equal-weighted version of the Russell Midcap® Index, which is an unmanaged capitalization-weighted index representing the U.S. mid-cap market. The Russell Midcap Equal Weight Index offers sector equal weight exposure by equally weighting the nine sectors within the Index and then equally weighting the securities within each sector. Russell Midcap® Index measures the performance of the 800 smallest companies in the Russell 1000® Index, which represent approximately 31% of the total market capitalization of the Russell 1000® Index.
Russell 2000® Equal Weight Index is an unmanaged equal-weighted version of the Russell 2000® Index, which is an unmanaged capitalization-weighted index representing the U.S. small-cap market. The Russell 2000® Equal Weight Index offers sector equal weight exposure by equally weighting the nine sectors within the Index and then equally weighting the securities within each sector. Russell 2000® Index measures the performance of the small-cap value segment of the U.S. equity universe. The Russell 2000® Index measures the performance of the 2,000 smallest companies in the Russell 3000® Index, which represents approximately 10% of the total market capitalization of the Russell 3000® Index. The Russell 3000® Index measures the performance of the largest 3,000 U.S. companies representing approximately 98% of the investable U.S. equity market.
MSCI Emerging Markets Equal Country Weighted Index captures large and mid-cap representation across 23 Emerging Market countries. The index represents an alternative weighting scheme to its market-cap weighted parent index, the MSCI Emerging Markets Index. The Index includes the same constituents as its parent index but applies an equal country weighting at each semi-annual index review date.
MSCI Emerging Markets Equal Weighted Index equally weights the securities in the MSCI Emerging Markets Index (the MSCI Emerging Markets cap-weighted index), which is a free float-adjusted market capitalization index that is designed to measure the equity market performance of emerging markets. In the MSCI Emerging Markets Equal Weighted Index, each security has the same weight, which means that the weight of each security is set to unity of the rebalancing date.
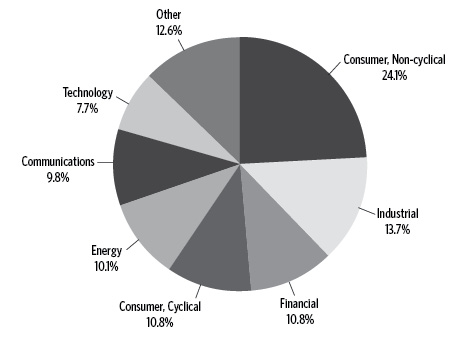
S&P 500® Equal Weight Index Consumer Discretionary is an unmanaged equal weighted version of the S&P 500® Consumer Discretionary Index that consists of the common stocks of the following industries: automobiles and components, consumer durables, apparel, hotels, restaurants, leisure, media and retailing that comprise the Consumer Discretionary sector of the S&P 500® Index.
S&P 500® Equal Weight Index Consumer Staples is an unmanaged equal weighted version of the S&P 500® Consumer Staples Index that consists of the common stocks of the following industries: food and drug retailing, beverages, food products, tobacco, household products and personal products that comprise the Consumer Staples sector of the S&P 500® Index.
S&P 500® Equal Weight Index Energy is an unmanaged equal weighted version of the S&P 500® Energy Index that consists of the common stocks of the following industries: oil and gas exploration, production, marketing, refining and/or transportation and energy equipment and services industries that comprise the Energy sector of the S&P 500® Index.
S&P 500® Equal Weight Index Financials is an unmanaged equal weighted version of the S&P 500® Financials Index that consists of the common stocks of the following industries: banks, diversified financials, brokerage, asset management insurance and real estate, including investment trusts that comprise the Financials sector of the S&P 500® Index.
S&P 500® Equal Weight Index Health Care is an unmanaged equal weighted version of the S&P 500® Health Care Index that consists of the common stocks of the following industries: health care equipment and supplies, health care providers and services, and biotechnology and pharmaceuticals that comprise the Health Care sector of the S&P 500® Index.
S&P 500® Equal Weight Index Industrials is an unmanaged equal weighted version of the S&P 500® Industrials Index that consists of the common stocks of the following industries: aerospace and defense, building products, construction and engineering, electrical equipment, conglomerates, machinery; commercial services and supplies, air freight and logistics, airlines, and marine, road and rail transportation infrastructure that comprise the 52 Industrials sector of the S&P 500® Index.
S&P 500® Equal Weight Index Materials is an unmanaged equal weighted version of the S&P 500® Materials Index that consists of the common stocks of the following industries: chemicals, construction materials, containers and packaging, metals and mining, and paper and forest products that comprise the Materials sector of the S&P 500® Index.
S&P 500® Equal Weight Real Estate Index is an unmanaged equal weighted version of the S&P 500® Real Estate Index, which equally weights the index constituents in the S&P 500 that are currently classified in the Global Industry Classification Standard (GICS®) Real Estate Industry Group within the Financial Sector, excluding the mortgage REITs sub-industry. The Real Estate Industry Group will be elevated to the Real Estate Sector after the market close on August 31, 2016, raising the number of GICS Sectors to eleven.
S&P 500® Equal Weight Index Information Technology is an unmanaged equal weighted version of the S&P 500® Information Technology Index that consists of the common stocks of the following industries: Internet equipment, computers and peripherals, electronic equipment, office electronics and instruments, and semiconductor equipment and products that comprise the Information Technology sector of the S&P 500® Index.
S&P 500® Equal Weight Index Telecommunication Services & Utilities is an unmanaged equal weighted version of the S&P 500® Telecommunication Services Index and S&P 500® Utilities Index that consists of the common stocks of the following industries: electric utilities, gas utilities, multi-utilities and unregulated power and water utilities, telecommunication service companies, including fixed-line, cellular, wireless, high bandwidth and fiber-optic cable networks that comprise the Telecommunications Services and Utilities sectors of the S&P 500® Index.
4 | GUGGENHEIM ETFs ANNUAL REPORT |
FEES AND EXPENSES (Unaudited) |
Shareholder Expense Example
As a shareholder of the Rydex ETF Trust, you incur transaction costs such as creation and redemption fees or brokerage charges, and ongoing costs including advisory fees, trustee fees and, if applicable, distribution fees. All other Trust expenses are paid by the advisor. This Example is intended to help you understand your ongoing costs (in dollars) of investing in a Fund and to compare these costs with the ongoing costs of investing in other mutual funds.
The example in the table is based on an investment of $1,000 invested on April 30, 2015 and held for the six months ended October 31, 2015.
Actual Expenses
The first table below provides information about actual account values and actual expenses. You may use the information in this table, together with the amount you invested, to estimate the expenses that you incurred over the period. Simply divide your account value by $1,000 (for example, an $8,600 account value divided by $1,000 = 8.6), then multiply the result by the number in the first table under the heading entitled “Expenses Paid During the Six-Month Period” to estimate the expenses attributable to your investment during this period.
Hypothetical Example for Comparison Purposes
The second table below provides information about hypothetical account values and hypothetical expenses based on a Fund’s actual expense ratio and an assumed rate of return of 5% per year before expenses, which is not a Fund’s actual return. Thus, you should not use the hypothetical account values and expenses to estimate the actual ending account balance or your expenses for the period. Rather, these figures are provided to enable you to compare the ongoing costs of investing in a Fund and other funds. To do so, compare this 5% hypothetical example with the 5% hypothetical examples that appear in the shareholder reports of other funds.
Please note that the expenses shown in the table are meant to highlight your ongoing costs only and do not reflect any transaction costs, such as creation and redemption fees, or brokerage charges. Therefore, the second table is useful in comparing ongoing costs only, and will not help you determine the relative total costs of owning different funds. In addition, if these transaction costs were included, your costs would have been higher.
GUGGENHEIM ETFs ANNUAL REPORT | 5 |
FEES AND EXPENSES (Unaudited)(concluded) |
Expense | Fund | Beginning 2015 | Ending | Expenses | |
Table 1. Based on actual Fund return3 | |||||
Guggenheim Russell MidCap® Equal Weight ETF | 0.41% | (5.82%) | $ 1,000.00 | $ 941.80 | $ 2.01 |
Guggenheim Russell 1000® Equal Weight ETF | 0.41% | (4.86%) | 1,000.00 | 951.40 | 2.02 |
Guggenheim Russell 2000® Equal Weight ETF | 0.41% | (8.17%) | 1,000.00 | 918.30 | 1.98 |
Guggenheim MSCI Emerging Markets Equal Country Weight ETF | 0.66% | (17.93%) | 1,000.00 | 820.70 | 3.03 |
Guggenheim S&P 500® Equal Weight Consumer Discretionary ETF | 0.40% | 1.41% | 1,000.00 | 1,014.10 | 2.03 |
Guggenheim S&P 500® Equal Weight Consumer Staples ETF | 0.40% | 5.75% | 1,000.00 | 1,057.50 | 2.07 |
Guggenheim S&P 500® Equal Weight Energy ETF | 0.40% | (24.49%) | 1,000.00 | 755.10 | 1.77 |
Guggenheim S&P 500® Equal Weight Financials ETF | 0.40% | 0.00% | 1,000.00 | 1,000.00 | 2.02 |
Guggenheim S&P 500® Equal Weight Health Care ETF | 0.40% | (1.64%) | 1,000.00 | 983.60 | 2.00 |
Guggenheim S&P 500® Equal Weight Industrials ETF | 0.40% | (3.56%) | 1,000.00 | 964.40 | 1.98 |
Guggenheim S&P 500® Equal Weight Materials ETF | 0.40% | (8.83%) | 1,000.00 | 911.70 | 1.93 |
Guggenheim S&P 500® Equal Weight Real Estate ETF4 | 0.40% | 1.61% | 1,000.00 | 1,016.10 | 0.89 |
Guggenheim S&P 500® Equal Weight Technology ETF | 0.40% | 1.38% | 1,000.00 | 1,013.80 | 2.03 |
Guggenheim S&P 500® Equal Weight Utilities ETF | 0.40% | 0.45% | 1,000.00 | 1,004.50 | 2.02 |
Table 2. Based on hypothetical 5% return (before expenses) | |||||
Guggenheim Russell MidCap® Equal Weight ETF | 0.41% | 5.00% | 1,000.00 | 1,023.14 | 2.09 |
Guggenheim Russell 1000® Equal Weight ETF | 0.41% | 5.00% | 1,000.00 | 1,023.14 | 2.09 |
Guggenheim Russell 2000® Equal Weight ETF | 0.41% | 5.00% | 1,000.00 | 1,023.14 | 2.09 |
Guggenheim MSCI Emerging Markets Equal Country Weight ETF | 0.66% | 5.00% | 1,000.00 | 1,021.88 | 3.36 |
Guggenheim S&P 500® Equal Weight Consumer Discretionary ETF | 0.40% | 5.00% | 1,000.00 | 1,023.19 | 2.04 |
Guggenheim S&P 500® Equal Weight Consumer Staples ETF | 0.40% | 5.00% | 1,000.00 | 1,023.19 | 2.04 |
Guggenheim S&P 500® Equal Weight Energy ETF | 0.40% | 5.00% | 1,000.00 | 1,023.19 | 2.04 |
Guggenheim S&P 500® Equal Weight Financials ETF | 0.40% | 5.00% | 1,000.00 | 1,023.19 | 2.04 |
Guggenheim S&P 500® Equal Weight Health Care ETF | 0.40% | 5.00% | 1,000.00 | 1,023.19 | 2.04 |
Guggenheim S&P 500® Equal Weight Industrials ETF | 0.40% | 5.00% | 1,000.00 | 1,023.19 | 2.04 |
Guggenheim S&P 500® Equal Weight Materials ETF | 0.40% | 5.00% | 1,000.00 | 1,023.19 | 2.04 |
Guggenheim S&P 500® Equal Weight Real Estate ETF | 0.40% | 5.00% | 1,000.00 | 1,023.19 | 2.04 |
Guggenheim S&P 500® Equal Weight Technology ETF | 0.40% | 5.00% | 1,000.00 | 1,023.19 | 2.04 |
Guggenheim S&P 500® Equal Weight Utilities ETF | 0.40% | 5.00% | 1,000.00 | 1,023.19 | 2.04 |
1 | Annualized and excludes expenses of the underlying funds in which the Funds invest. |
2 | Expenses are equal to the Fund’s annualized expense ratio, net of any applicable fee waivers, multiplied by the average account value over the period, multiplied by 184/365 (to reflect the one-half year period). |
3 | Actual cumulative return at net asset value for the period April 30, 2015 to October 31, 2015. |
4 | Since commencement of operations: August 12, 2015. Expenses paid based on actual fund return are calculated using 81 days from the commencement of operations. |
6 | GUGGENHEIM ETFs ANNUAL REPORT |
MANAGER'S ANALYSIS (Unaudited) | October 31, 2015 |
GUGGENHEIM RUSSELL MIDCAP® EQUAL WEIGHT ETF
Guggenheim Russell MidCap® Equal Weight ETF (EWRM) returned -1.19% for the one-year period ended October 31, 2015, compared with the -1.02% return of the benchmark, the Russell Midcap® Equal Weight Index. The cap-weighted Russell Midcap® Index returned 2.77%. During the period, EWRM achieved over 99% correlation to its benchmark on a daily basis.
The Consumer Staples, Health Care, and Information Technology sectors contributed the most to the Fund’s return for the period. The sectors detracting the most from performance were Energy, Materials, and Industrials.
Top contributors to the Fund’s return included Rite Aid Corp., Flowers Foods, Inc., and Constellation Brands, Inc.—Class A. Top detractors included Keurig Green Mountain, Inc., Consol Energy, Inc., and Peabody Energy Corp.
Cumulative Fund Performance: December 3, 2010 – October 31, 2015
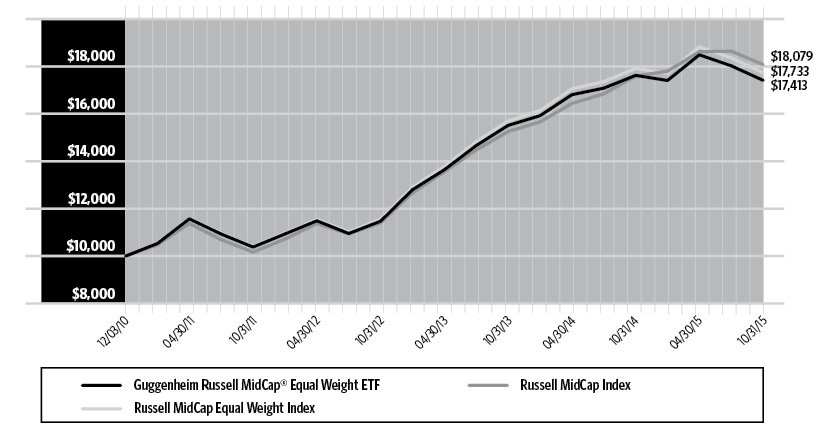
AVERAGE ANNUAL TOTAL RETURNS FOR THE PERIOD ENDED OCTOBER 31, 2015 | |||
One Year | Three Year | Since Inception | |
Guggenheim Russell MidCap® Equal Weight ETF | -1.19% | 14.92% | 11.96% |
Russell MidCap Equal Weight Index | -1.02% | 15.35% | 12.38% |
Russell MidCap Index | 2.77% | 16.61% | 12.82% |
The returns presented above do not reflect the effect of taxes. Index returns represent total returns. Performance displayed represents past performance, which is no guarantee of future results.
GUGGENHEIM ETFs ANNUAL REPORT | 7 |
PORTFOLIO SUMMARY (Unaudited) | October 31, 2015 |
GUGGENHEIM RUSSELL MIDCAP® EQUAL WEIGHT ETF
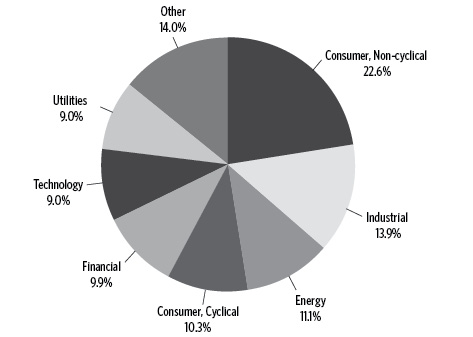
Holdings Diversification (Market Exposure as % of Net Assets)

“Holdings Diversification (Market Exposure as % of Net Assets)” excludes any temporary cash investments.
Ten Largest Holdings | (% of Total Net Assets) |
Rite Aid Corp. | 0.3% |
Mead Johnson Nutrition Co. — Class A | 0.3% |
Dr Pepper Snapple Group, Inc. | 0.3% |
Ingredion, Inc. | 0.3% |
Hormel Foods Corp. | 0.3% |
Molson Coors Brewing Co. — Class B | 0.3% |
Brown-Forman Corp. — Class B | 0.3% |
Energizer Holdings, Inc. | 0.3% |
Flowers Foods, Inc. | 0.3% |
Coca-Cola Enterprises, Inc. | 0.3% |
Top Ten Total | 3.0% |
“Ten Largest Holdings” exclude any temporary cash. | |
8 | GUGGENHEIM ETFs ANNUAL REPORT |
MANAGER'S ANALYSIS (Unaudited) | October 31, 2015 |
GUGGENHEIM RUSSELL 1000® EQUAL WEIGHT ETF
Guggenheim Russell 1000® Equal Weight ETF (EWRI) returned -0.07% for the one-year period ended October 31, 2015, compared with the 0.14% return of the benchmark, the Russell 1000® Equal Weight Index. The cap-weighted Russell 1000® Index returned 4.86%. During the period, EWRI achieved over 99% correlation to its benchmark on a daily basis.
The Consumer Staples, Health Care, and Information Technology sectors contributed the most to the Fund’s return for the period. The sectors detracting the most from performance were Energy, Materials, and Industrials.
Top contributors to the Fund’s return included Kraft Heinz Co., Reynolds American, Inc., and Teco Energy, Inc. The leading detractors from performance were Keurig Green Mountain, Inc., Consol Energy, Inc., and U.S. Steel Corp.
Cumulative Fund Performance: December 3, 2010 – October 31, 2015
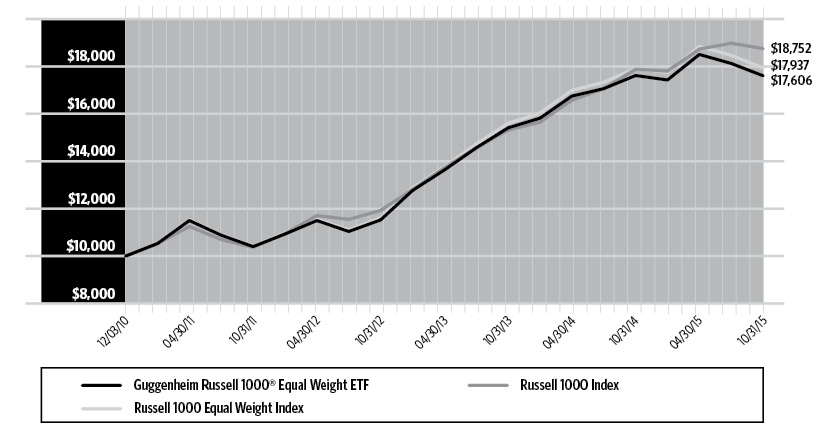
AVERAGE ANNUAL TOTAL RETURNS FOR THE PERIOD ENDED OCTOBER 31, 2015 | |||
One Year | Three Year | Since Inception | |
Guggenheim Russell 1000® Equal Weight ETF | -0.07% | 15.17% | 12.21% |
Russell 1000 Equal Weight Index | 0.14% | 15.60% | 12.64% |
Russell 1000 Index | 4.86% | 16.28% | 13.66% |
The returns presented above do not reflect the effect of taxes. Index returns represent total returns. Performance displayed represents past performance, which is no guarantee of future results.
GUGGENHEIM ETFs ANNUAL REPORT | 9 |
PORTFOLIO SUMMARY (Unaudited) | October 31, 2015 |
GUGGENHEIM RUSSELL 1000® EQUAL WEIGHT ETF
Holdings Diversification (Market Exposure as % of Net Assets)
“Holdings Diversification (Market Exposure as % of Net Assets)” excludes any temporary cash investments.
Ten Largest Holdings | (% of Total |
Rite Aid Corp. | 0.2% |
Mead Johnson Nutrition Co. — Class A | 0.2% |
Dr Pepper Snapple Group, Inc. | 0.2% |
Reynolds American, Inc. | 0.2% |
Level 3 Communications, Inc. | 0.2% |
Altria Group, Inc. | 0.2% |
Kimberly-Clark Corp. | 0.2% |
Philip Morris International, Inc. | 0.2% |
United States Cellular Corp. | 0.2% |
PepsiCo, Inc. | 0.2% |
Top Ten Total | 2.0% |
“Ten Largest Holdings” exclude any temporary cash. | |
10 | GUGGENHEIM ETFs ANNUAL REPORT |
MANAGER'S ANALYSIS (Unaudited) | October 31, 2015 |
GUGGENHEIM RUSSELL 2000® EQUAL WEIGHT ETF
Guggenheim Russell 2000® Equal Weight ETF (EWRS) returned -5.59% for the one-year period ended October 31, 2015, compared with the -5.39% return of the benchmark, the Russell 2000® Equal Weight Index. The cap-weighted Russell 2000® Index returned 0.34%. During the period, EWRS achieved over 99% correlation to its benchmark on a daily basis.
The Consumer Staples, Health Care, and Information Technology sectors contributed the most to the Fund’s return for the period. The sectors detracting the most from performance were Energy, Industrials, and Materials.
Top contributors to Fund return included Coca-Cola Bottling Co. Consolidated, Ingles Markets, Inc.—Class A, and John B. Sanfilippo & Son, Inc. Top detractors included Magnum Hunter Resources, Inc., Intelsat S.A., and ION Geophysical Corp.
Cumulative Fund Performance: December 3, 2010 – October 31, 2015
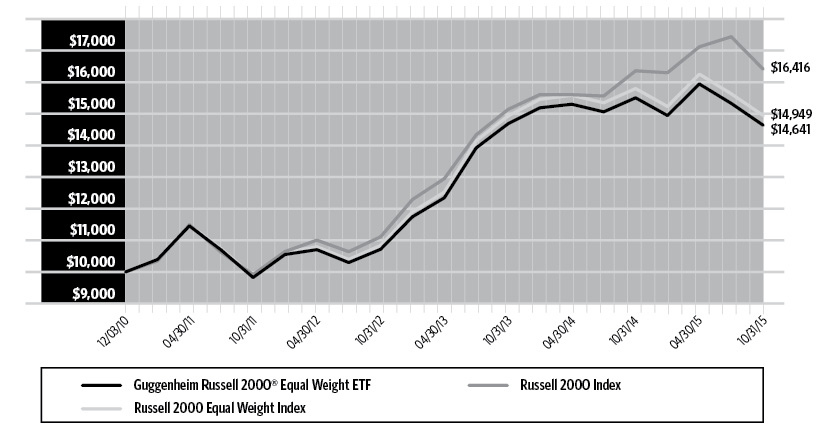
AVERAGE ANNUAL TOTAL RETURNS FOR THE PERIOD ENDED OCTOBER 31, 2015 | |||
One Year | Three Year | Since Inception | |
Guggenheim Russell 2000® Equal Weight ETF | -5.59% | 10.97% | 8.07% |
Russell 2000 Equal Weight Index | -5.39% | 11.32% | 8.53% |
Russell 2000 Index | 0.34% | 13.90% | 10.62% |
The returns presented above do not reflect the effect of taxes. Index returns represent total returns. Performance displayed represents past performance, which is no guarantee of future results.
GUGGENHEIM ETFs ANNUAL REPORT | 11 |
PORTFOLIO SUMMARY (Unaudited) | October 31, 2015 |
GUGGENHEIM RUSSELL 2000® EQUAL WEIGHT ETF
Holdings Diversification (Market Exposure as % of Net Assets)
“Holdings Diversification (Market Exposure as % of Net Assets)” excludes any temporary cash investments.
Ten Largest Holdings | (% of Total |
Natural Health Trends Corp. | 0.4% |
National Beverage Corp. | 0.3% |
Core-Mark Holding Company, Inc. | 0.3% |
John B Sanfilippo & Son, Inc. | 0.3% |
Diamond Foods, Inc. | 0.3% |
Lancaster Colony Corp. | 0.3% |
Seaboard Corp. | 0.3% |
Fresh Del Monte Produce, Inc. | 0.3% |
Ingles Markets, Inc. — Class A | 0.3% |
Chefs' Warehouse, Inc. | 0.3% |
Top Ten Total | 3.1% |
“Ten Largest Holdings” exclude any temporary cash. | |
12 | GUGGENHEIM ETFs ANNUAL REPORT |
MANAGER'S ANALYSIS (Unaudited) | October 31, 2015 |
GUGGENHEIM MSCI EMERGING MARKETS EQUAL COUNTRY WEIGHT ETF
Guggenheim MSCI Emerging Markets Equal Country Weight ETF (EWEM) returned -17.21% for the one-year period ended October 31, 2015. The primary benchmark for the Fund changed January 20, 2015, to the MSCI Emerging Markets Equal Country Weighted Index, from the MSCI Emerging Markets Equal Weighted Index.
The MSCI Emerging Markets Equal Country Weighted Blended Index returned -16.56% for the period, and the MSCI Emerging Markets Equal Weighted Index returned -14.91%. The MSCI Emerging Markets Index returned -14.53% for the period. Over the period, EWEM achieved over 99% correlation to the MSCI Emerging Markets Equal Country Weighted Index on a daily basis.
The Energy sector was the only sector that contributed to the Fund’s return for the period. The Health Care and Information Technology sectors detracted the least from the Fund’s return for the period. The sectors detracting the most from the Fund’s return were Financials, Telecommunication Services, and Materials.
Top contributors to the Fund’s return included ConocoPhillips, OTP Bank Nyrt, and Hanergy Thin Film Power Group Ltd. Top detractors included Credicorp Ltd., iShares MSCI Inda ETF, and Alpha Bank AE.
Cumulative Fund Performance: December 3, 2010 – October 31, 2015

Effective January 20, 2015, the Fund changed its principal investment strategy. As a result of the investment strategy change, the Fund’s new benchmark is the MSCI Emerging Markets Equal Country Weighted Index. The Fund’s performance was previously compared to the MSCI Emerging Markets Equal Weighted Index. The MSCI Emerging Markets Equal Country Weighted Blended Index uses performance data for the MSCI Emerging Markets Equal Weighted Index from 12/03/10 to 01/19/15 and the MSCI Emerging Markets Equal Country Weighted Index from 01/20/15 to 10/31/15.
GUGGENHEIM ETFs ANNUAL REPORT | 13 |
MANAGER'S ANALYSIS (Unaudited)(concluded) | October 31, 2015 |
AVERAGE ANNUAL TOTAL RETURNS FOR THE PERIOD ENDED OCTOBER 31, 2015 | |||
One Year | Three Year | Since Inception | |
Guggenheim MSCI Emerging Markets Equal Country Weight ETF | -17.21% | -4.32% | -5.62% |
MSCI Emerging Markets Equal Country Weighted Blended Index | -16.56% | -3.02% | -3.80% |
MSCI Emerging Markets Equal Country Weighted Index | N/A | N/A | N/A |
MSCI Emerging Markets Equal Weighted Index | -14.91% | -2.41% | -3.42% |
MSCI Emerging Markets Index | -14.53% | -2.87% | -3.15% |
The MSCI Emerging Markets Equal Country Weighted Index incepted on 11/10/14. Therefore, the index returns for the time periods listed above are not available.
The returns presented above do not reflect the effect of taxes. Index returns represent total returns. Performance displayed represents past performance, which is no guarantee of future results.
14 | GUGGENHEIM ETFs ANNUAL REPORT |
PORTFOLIO SUMMARY (Unaudited) | October 31, 2015 |
GUGGENHEIM MSCI EMERGING MARKETS EQUAL COUNTRY WEIGHT ETF
Holdings Diversification (Market Exposure as % of Net Assets)
“Holdings Diversification (Market Exposure as % of Net Assets)” excludes any temporary cash investments.
Ten Largest Holdings | (% of Total |
iShares MSCI India ETF | 4.3% |
Commercial International Bank Egypt SAE GDR | 3.0% |
Credicorp Ltd. | 2.9% |
OTP Bank plc | 2.1% |
CEZ AS | 1.9% |
Komercni Banka AS | 1.8% |
Samsung Electronics Company Ltd. GDR | 1.2% |
Southern Copper Corp. | 1.2% |
Qatar National Bank SAQ | 1.2% |
Richter Gedeon Nyrt | 1.2% |
Top Ten Total | 20.8% |
“Ten Largest Holdings” exclude any temporary cash. | |
GUGGENHEIM ETFs ANNUAL REPORT | 15 |
MANAGER'S ANALYSIS (Unaudited) | October 31, 2015 |
GUGGENHEIM S&P 500® EQUAL WEIGHT CONSUMER DISCRETIONARY ETF
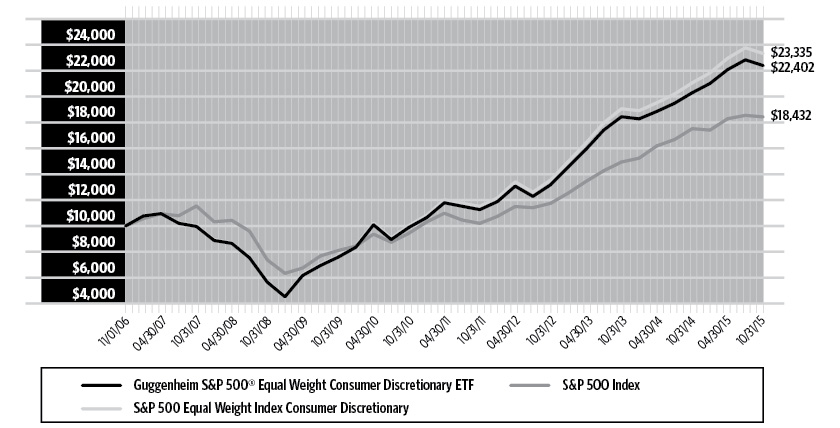
For the one-year period ended October 31, 2015, Guggenheim S&P 500® Equal Weight Consumer Discretionary ETF (RCD) returned 10.35%, compared to its benchmark, the S&P 500® Equal Weight Index Consumer Discretionary, which returned 10.76%. RCD achieved over 99% correlation to its benchmark on a daily basis.
The return of the cap-weighted Standard & Poor’s 500® Index was 5.20%.
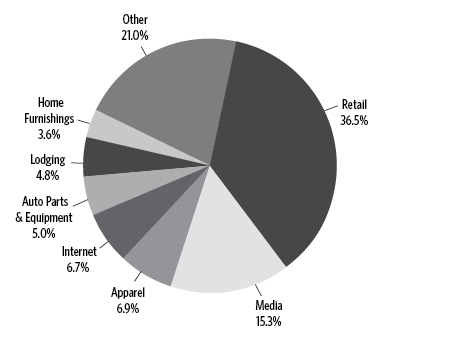
The Specialty Retail, Internet & Catalog Retail, and Media industries were the largest contributors to the Fund’s return. The Automobiles industry contributed the least to the Fund’s return. The industries for Textiles and for Apparel & Luxury Goods detracted the most from the Fund’s return, followed by the Distributors industry.
Netflix, Inc., Amazon.com. Inc., and Cablevision Systems Corp.—Class A contributed the most to the Fund’s return. Wynn Resorts Ltd., Michael Kors Holdings Ltd., and Fossil Group, Inc. detracted the most from the Fund’s return.
Cumulative Fund Performance: November 1, 2006 – October 31, 2015
AVERAGE ANNUAL TOTAL RETURNS FOR THE PERIOD ENDED OCTOBER 31, 2015 | ||||
One Year | Three Year | Five Year | Since Inception | |
Guggenheim S&P 500® Equal Weight Consumer Discretionary ETF | 10.35% | 19.34% | 17.78% | 9.38% |
S&P 500 Equal Weight Index Consumer Discretionary | 10.76% | 19.88% | 18.39% | 9.88% |
S&P 500 Index | 5.20% | 16.20% | 14.33% | 7.03% |
The returns presented above do not reflect the effect of taxes. Index returns represent total returns. Performance displayed represents past performance, which is no guarantee of future results.
16 | GUGGENHEIM ETFs ANNUAL REPORT |
PORTFOLIO SUMMARY (Unaudited) | October 31, 2015 |
GUGGENHEIM S&P 500® EQUAL WEIGHT CONSUMER DISCRETIONARY ETF
Holdings Diversification (Market Exposure as % of Net Assets)
“Holdings Diversification (Market Exposure as % of Net Assets)” excludes any temporary cash investments.
Ten Largest Holdings | (% of Total |
TripAdvisor, Inc. | 1.4% |
Amazon.com, Inc. | 1.3% |
TEGNA, Inc. | 1.3% |
NIKE, Inc. — Class B | 1.3% |
Cablevision Systems Corp. — Class A | 1.3% |
Interpublic Group of Companies, Inc. | 1.3% |
Expedia, Inc. | 1.3% |
General Motors Co. | 1.3% |
McDonald's Corp. | 1.3% |
Scripps Networks Interactive, Inc. — Class A | 1.3% |
Top Ten Total | 13.1% |
“Ten Largest Holdings” exclude any temporary cash. | |
GUGGENHEIM ETFs ANNUAL REPORT | 17 |
MANAGER'S ANALYSIS (Unaudited) | October 31, 2015 |
GUGGENHEIM S&P 500® EQUAL WEIGHT CONSUMER STAPLES ETF
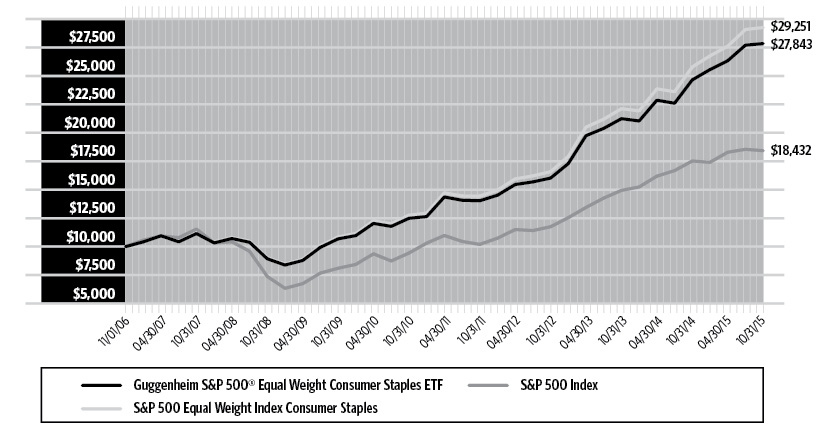
For the one-year period ended October 31, 2015, Guggenheim S&P 500® Equal Weight Consumer Staples ETF (RHS) returned 12.95%. For the same period, its benchmark, the S&P 500® Equal Weight Index Consumer Staples, returned 13.43%. RHS achieved over 99% correlation to its benchmark on a daily basis.
The return of the cap-weighted Standard & Poor’s 500® Index was 5.20%.
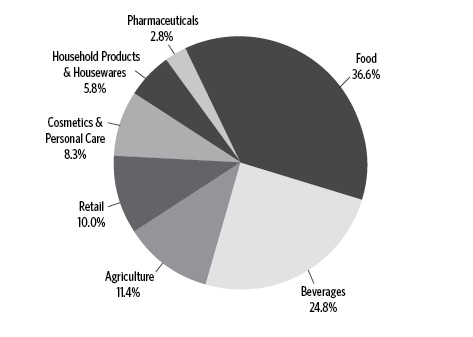
The Beverages, Food Products, and Tobacco industries were the largest contributors to the Fund’s return. The Personal Products industry was the only detractor. The Household Products and Food & Staples Retailing industries contributed the least to the Fund’s return.
Kraft Heinz Co., Reynolds American, Inc., and Constellation Brands, Inc.—Class A contributed the most to the Fund’s return. Keurig Green Mountain, Inc., Wal-Mart Stores, Inc., and Avon Products, Inc. contributed the least.
Cumulative Fund Performance: November 1, 2006 – October 31, 2015
AVERAGE ANNUAL TOTAL RETURNS FOR THE PERIOD ENDED OCTOBER 31, 2015 | ||||
One Year | Three Year | Five Year | Since Inception | |
Guggenheim S&P 500® Equal Weight Consumer Staples ETF | 12.95% | 20.23% | 17.40% | 12.05% |
S&P 500 Equal Weight Index Consumer Staples | 13.43% | 20.82% | 18.05% | 12.67% |
S&P 500 Index | 5.20% | 16.20% | 14.33% | 7.03% |
The returns presented above do not reflect the effect of taxes. Index returns represent total returns. Performance displayed represents past performance, which is no guarantee of future results.
18 | GUGGENHEIM ETFs ANNUAL REPORT |
PORTFOLIO SUMMARY (Unaudited) | October 31, 2015 |
GUGGENHEIM S&P 500® EQUAL WEIGHT CONSUMER STAPLES ETF
Holdings Diversification (Market Exposure as % of Net Assets)
“Holdings Diversification (Market Exposure as % of Net Assets)” excludes any temporary cash investments.
Ten Largest Holdings | (% of Total |
Molson Coors Brewing Co. — Class B | 3.2% |
Dr Pepper Snapple Group, Inc. | 3.0% |
Kimberly-Clark Corp. | 2.9% |
Altria Group, Inc. | 2.9% |
Reynolds American, Inc. | 2.9% |
Costco Wholesale Corp. | 2.9% |
Procter & Gamble Co. | 2.9% |
PepsiCo, Inc. | 2.8% |
Philip Morris International, Inc. | 2.8% |
Coca-Cola Co. | 2.8% |
Top Ten Total | 29.1% |
“Ten Largest Holdings” exclude any temporary cash. | |
GUGGENHEIM ETFs ANNUAL REPORT | 19 |
MANAGER'S ANALYSIS (Unaudited) | October 31, 2015 |
GUGGENHEIM S&P 500® EQUAL WEIGHT ENERGY ETF
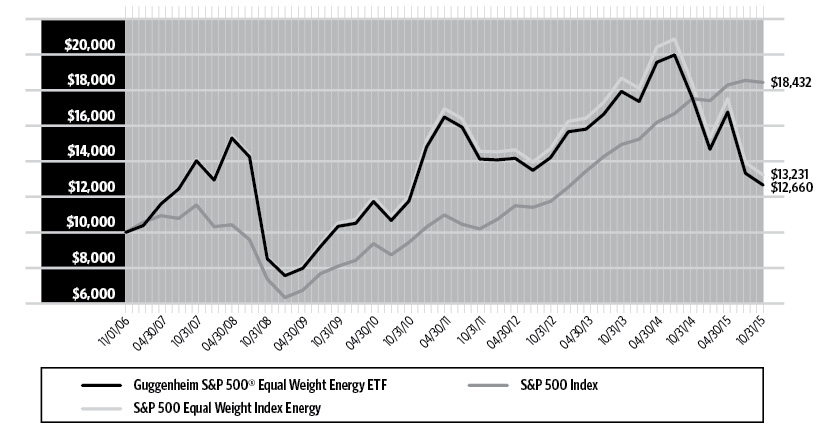
For the one-year period ended October 31, 2015, Guggenheim S&P 500® Equal Weight Energy ETF (RYE) returned -27.93%. For the same period, its benchmark, the S&P 500® Equal Weight Index Energy, returned -27.95%. RYE achieved over 99% correlation to its benchmark on a daily basis.
The return of the cap-weighted Standard & Poor’s 500® Index was 5.20%.
The Oil & Gas Refining & Marketing industry was the only contributor to the Fund’s return. The Integrated Oil & Gas; and Oil & Gas Equipment & Services industries detracted the least from the Fund’s return. The largest detractors from the Fund’s return were the industries for Oil & Gas Exploration & Production; Oil & Gas Drilling; and Oil & Gas Storage & Transportation.
Tesoro Corp., Newfield Exploration Co., and Valero Energy Corp. contributed the most to the Fund’s return. Consol Energy, Inc., Southwestern Energy Co., and Chesapeake Energy Corp. detracted the most from the Fund’s return.
Cumulative Fund Performance: November 1, 2006 – October 31, 2015
AVERAGE ANNUAL TOTAL RETURNS FOR THE PERIOD ENDED OCTOBER 31, 2015 | ||||
One Year | Three Year | Five Year | Since Inception | |
Guggenheim S&P 500® Equal Weight Energy ETF | -27.93% | -3.77% | 1.48% | 2.66% |
S&P 500 Equal Weight Index Energy | -27.95% | -3.49% | 1.88% | 3.16% |
S&P 500 Index | 5.20% | 16.20% | 14.33% | 7.03% |
The returns presented above do not reflect the effect of taxes. Index returns represent total returns. Performance displayed represents past performance, which is no guarantee of future results.
20 | GUGGENHEIM ETFs ANNUAL REPORT |
PORTFOLIO SUMMARY (Unaudited) | October 31, 2015 |
GUGGENHEIM S&P 500® EQUAL WEIGHT ENERGY ETF
Holdings Diversification (Market Exposure as % of Net Assets)

“Holdings Diversification (Market Exposure as % of Net Assets)” excludes any temporary cash investments.
Ten Largest Holdings | (% of Total |
Marathon Oil Corp. | 2.9% |
Chevron Corp. | 2.9% |
Newfield Exploration Co. | 2.8% |
Apache Corp. | 2.8% |
Pioneer Natural Resources Co. | 2.8% |
Noble Energy, Inc. | 2.8% |
Helmerich & Payne, Inc. | 2.8% |
Exxon Mobil Corp. | 2.8% |
ConocoPhillips | 2.7% |
Tesoro Corp. | 2.7% |
Top Ten Total | 28.0% |
“Ten Largest Holdings” exclude any temporary cash. | |
GUGGENHEIM ETFs ANNUAL REPORT | 21 |
MANAGER'S ANALYSIS (Unaudited) | October 31, 2015 |
GUGGENHEIM S&P 500® EQUAL WEIGHT FINANCIALS ETF
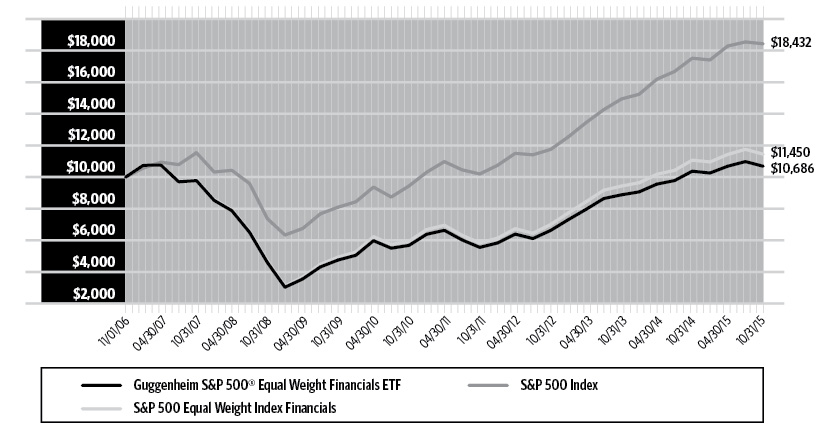
For the one-year period ended October 31, 2015, Guggenheim S&P 500® Equal Weight Financials ETF (RYF) returned 3.04%. For the same period, its benchmark, the S&P 500® Equal Weight Index Financials, returned 3.41%. RYF achieved a daily correlation of over 99% to its benchmark on a daily basis.
The return of the cap-weighted Standard & Poor’s 500® Index was 5.20%.
The Real Estate Investment Trusts (REITs), Insurance, and Diversified Financial Services industries were the largest contributors to the Fund’s return. The Thrifts & Mortgage Finance contributed the least to the Fund’s return. The industries detracting the most from return were Consumer Finance and Capital Markets.
Nasdaq, Inc., Chubb Corp., and E*Trade Financial Corp. were the largest contributors to the Fund’s return. Genworth Financial, Inc.—Class A, Franklin Resources, Inc., and Navient Corp. were the largest detractors from the Fund’s return.
Cumulative Fund Performance: November 1, 2006 – October 31, 2015
AVERAGE ANNUAL TOTAL RETURNS FOR THE PERIOD ENDED OCTOBER 31, 2015 | ||||
One Year | Three Year | Five Year | Since Inception | |
Guggenheim S&P 500® Equal Weight Financials ETF | 3.04% | 17.30% | 13.49% | 0.74% |
S&P 500 Equal Weight Index Financials | 3.41% | 17.84% | 14.06% | 1.51% |
S&P 500 Index | 5.20% | 16.20% | 14.33% | 7.03% |
The returns presented above do not reflect the effect of taxes. Index returns represent total returns. Performance displayed represents past performance, which is no guarantee of future results.
22 | GUGGENHEIM ETFs ANNUAL REPORT |
PORTFOLIO SUMMARY (Unaudited) | October 31, 2015 |
GUGGENHEIM S&P 500® EQUAL WEIGHT FINANCIALS ETF
Holdings Diversification (Market Exposure as % of Net Assets)
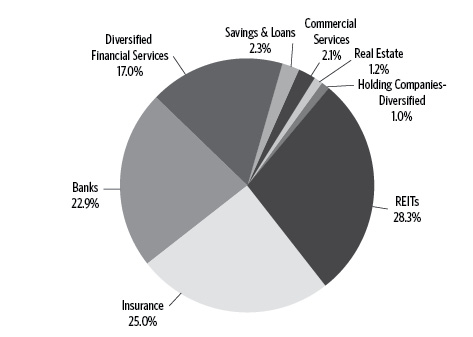
“Holdings Diversification (Market Exposure as % of Net Assets)” excludes any temporary cash investments.
Ten Largest Holdings | (% of Total |
BlackRock, Inc. — Class A | 1.3% |
Kimco Realty Corp. | 1.3% |
General Growth Properties, Inc. | 1.3% |
Prologis, Inc. | 1.2% |
American Tower Corp. — Class A | 1.2% |
Macerich Co. | 1.2% |
CBRE Group, Inc. — Class A | 1.2% |
Travelers Companies, Inc. | 1.2% |
Vornado Realty Trust | 1.2% |
Public Storage | 1.2% |
Top Ten Total | 12.3% |
“Ten Largest Holdings” exclude any temporary cash or derivative investments. | |
GUGGENHEIM ETFs ANNUAL REPORT | 23 |
MANAGER'S ANALYSIS (Unaudited) | October 31, 2015 |
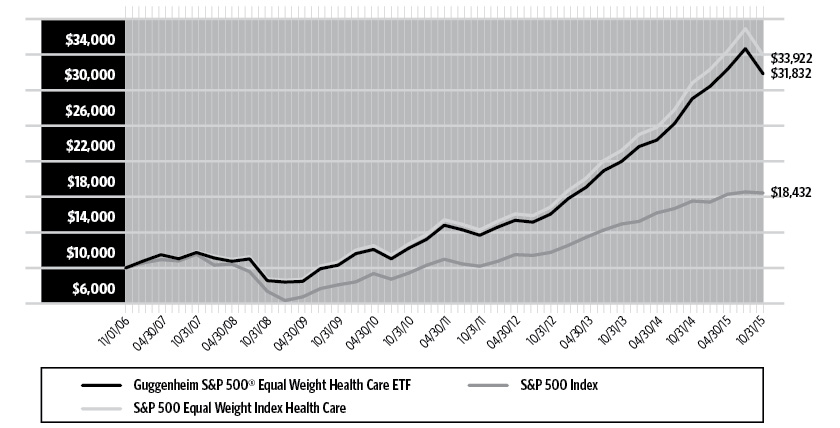
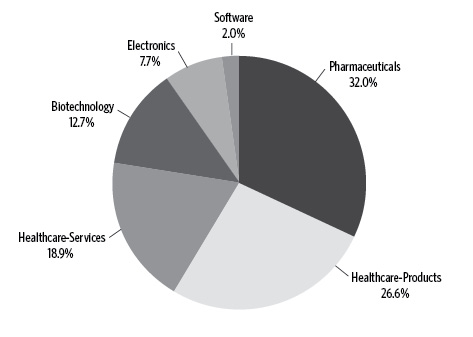
GUGGENHEIM S&P 500® EQUAL WEIGHT HEALTH CARE ETF
For the one-year period ended October 31, 2015, Guggenheim S&P 500® Equal Weight Health Care ETF (RYH) returned 9.61%. For the same period, its benchmark, the S&P 500® Equal Weight Index Health Care, returned 10.10%. RYH achieved over 99% correlation to its benchmark on a daily basis.
The return of the cap-weighted Standard & Poor’s 500® Index was 5.20%.
The Health Care Equipment & Supplies; Health Care Providers & Services; and Pharmaceuticals industries were the largest contributors to the Fund’s return. No industry detracted, but the industries contributing the least to the Fund’s return were Health Care Technology, Life Sciences Tools & Services, and Biotechnology.
Hospira, Inc., Boston Scientific Corp., and Aetna, Inc., were the largest contributors to the Fund’s return. Tenet Healthcare Corp., Endo International Plc, and Mallinckrodt Plc were the largest detractors from the Fund’s return.
Cumulative Fund Performance: November 1, 2006 – October 31, 2015
AVERAGE ANNUAL TOTAL RETURNS FOR THE PERIOD ENDED OCTOBER 31, 2015 | ||||
One Year | Three Year | Five Year | Since Inception | |
Guggenheim S&P 500® Equal Weight Health Care ETF | 9.61% | 25.62% | 21.08% | 13.73% |
S&P 500 Equal Weight Index Health Care | 10.10% | 26.26% | 21.70% | 14.54% |
S&P 500 Index | 5.20% | 16.20% | 14.33% | 7.03% |
The returns presented above do not reflect the effect of taxes. Index returns represent total returns. Performance displayed represents past performance, which is no guarantee of future results.
24 | GUGGENHEIM ETFs ANNUAL REPORT |
PORTFOLIO SUMMARY (Unaudited) | October 31, 2015 |
GUGGENHEIM S&P 500® EQUAL WEIGHT HEALTH CARE ETF
Holdings Diversification (Market Exposure as % of Net Assets)
“Holdings Diversification (Market Exposure as % of Net Assets)” excludes any temporary cash investments.
Ten Largest Holdings | (% of Total |
DENTSPLY International, Inc. | 2.1% |
Edwards Lifesciences Corp. | 2.1% |
Henry Schein, Inc. | 2.1% |
Bristol-Myers Squibb Co. | 2.0% |
Johnson & Johnson | 2.0% |
Boston Scientific Corp. | 2.0% |
PerkinElmer, Inc. | 2.0% |
Thermo Fisher Scientific, Inc. | 1.9% |
Cerner Corp. | 1.9% |
Medtronic plc | 1.9% |
Top Ten Total | 20.0% |
“Ten Largest Holdings” exclude any temporary cash. | |
GUGGENHEIM ETFs ANNUAL REPORT | 25 |
MANAGER'S ANALYSIS (Unaudited) | October 31, 2015 |
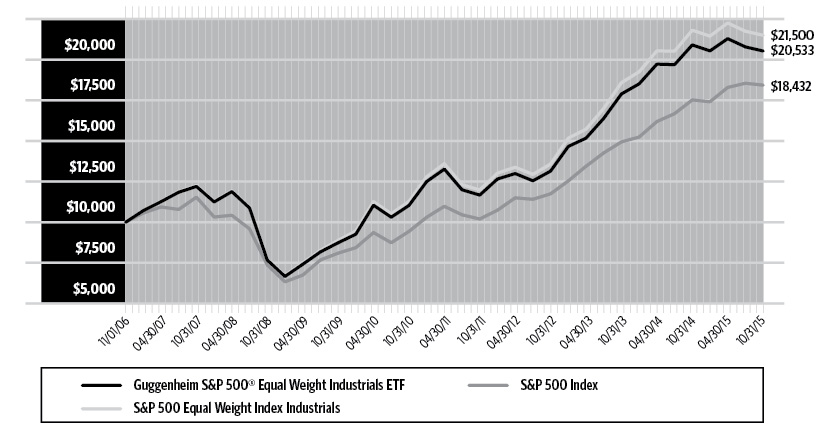
GUGGENHEIM S&P 500® EQUAL WEIGHT INDUSTRIALS ETF
For the one-year period ended October 31, 2015, Guggenheim S&P 500® Equal Weight Industrials ETF (RGI) returned -1.78% compared to its benchmark S&P 500® Equal Weight Index Industrials, which returned -1.44%. RGI achieved over 99% correlation to its benchmark on a daily basis.
The return of the cap-weighted Standard & Poor’s 500® Index was 5.20%.
The Aerospace & Defense, Airlines, and Building Products industries contributed the most to the Fund’s return. The largest detractors were the Machinery, Road & Rail, and Construction & Engineering industries.
Masco Corp., Southwest Airlines Co., and Pall Corp. contributed the most to the Fund’s return. Joy Global, Inc., Quanta Services, Inc., and Kansas City Southern detracted the most from the Fund’s return.
Cumulative Fund Performance: November 1, 2006 – October 31, 2015
AVERAGE ANNUAL TOTAL RETURNS FOR THE PERIOD ENDED OCTOBER 31, 2015 | ||||
One Year | Three Year | Five Year | Since Inception | |
Guggenheim S&P 500® Equal Weight Industrials ETF | -1.78% | 16.03% | 13.23% | 8.32% |
S&P 500 Equal Weight Index Industrials | -1.44% | 16.55% | 13.79% | 8.88% |
S&P 500 Index | 5.20% | 16.20% | 14.33% | 7.03% |
The returns presented above do not reflect the effect of taxes. Index returns represent total returns. Performance displayed represents past performance, which is no guarantee of future results.
26 | GUGGENHEIM ETFs ANNUAL REPORT |
PORTFOLIO SUMMARY (Unaudited) | October 31, 2015 |
GUGGENHEIM S&P 500® EQUAL WEIGHT INDUSTRIALS ETF
Holdings Diversification (Market Exposure as % of Net Assets)

“Holdings Diversification (Market Exposure as % of Net Assets)” excludes any temporary cash investments.
Ten Largest Holdings | (% of Total |
Southwest Airlines Co. | 1.8% |
L-3 Communications Holdings, Inc. | 1.7% |
Roper Technologies, Inc. | 1.7% |
General Electric Co. | 1.7% |
Xylem, Inc. | 1.6% |
Northrop Grumman Corp. | 1.6% |
3M Co. | 1.6% |
Raytheon Co. | 1.6% |
Illinois Tool Works, Inc. | 1.6% |
Boeing Co. | 1.6% |
Top Ten Total | 16.5% |
“Ten Largest Holdings” exclude any temporary cash. | |
GUGGENHEIM ETFs ANNUAL REPORT | 27 |
MANAGER'S ANALYSIS (Unaudited) | October 31, 2015 |
GUGGENHEIM S&P 500® EQUAL WEIGHT MATERIALS ETF
For the one-year period ended October 31, 2015, Guggenheim S&P 500® Equal Weight Materials ETF (RTM) returned -1.44% compared with the -0.94% return of the benchmark, the S&P 500® Equal Weight Index Materials. RTM achieved over 99% correlation to its benchmark on a daily basis.
The return of the cap-weighted Standard & Poor’s 500® Index was 5.20%.
The Construction Materials and Containers & Packaging industries were the only contributors to the Fund’s return. The Chemicals industry was the smallest detractor from the Fund’s return. The industries detracting the most from return were Metals & Mining, Paper & Forest Products, and Chemicals.
Vulcan Materials Co., Avery Dennison Corp., and Martin Marietta Materials, Inc., contributed the most to the Fund’s return. Freeport-McMoRan, Inc., Alcoa, Inc., and Allegheny Technologies, Inc. detracted the most from the Fund’s return.
Cumulative Fund Performance: November 1, 2006 – October 31, 2015
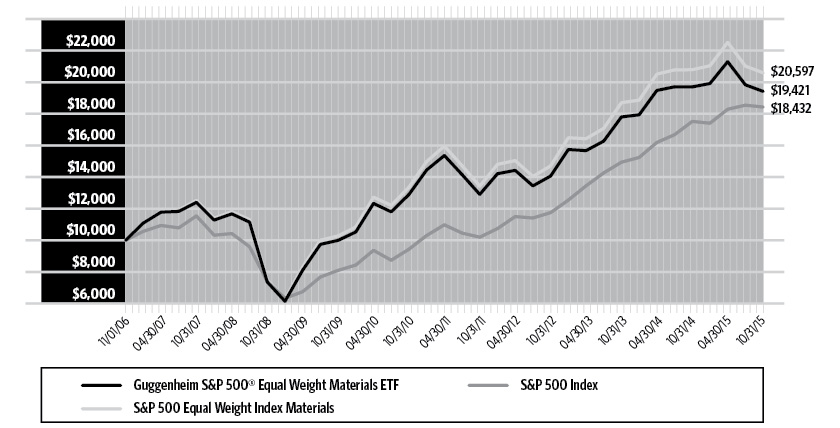
AVERAGE ANNUAL TOTAL RETURNS FOR THE PERIOD ENDED OCTOBER 31, 2015 | ||||
One Year | Three Year | Five Year | Since Inception | |
Guggenheim S&P 500® Equal Weight Materials ETF | -1.44% | 11.36% | 8.53% | 7.66% |
S&P 500 Equal Weight Index Materials | -0.94% | 11.89% | 9.05% | 8.36% |
S&P 500 Index | 5.20% | 16.20% | 14.33% | 7.03% |
The returns presented above do not reflect the effect of taxes. Index returns represent total returns. Performance displayed represents past performance, which is no guarantee of future results.
28 | GUGGENHEIM ETFs ANNUAL REPORT |
PORTFOLIO SUMMARY (Unaudited) | October 31, 2015 |
GUGGENHEIM S&P 500® EQUAL WEIGHT MATERIALS ETF
Holdings Diversification (Market Exposure as % of Net Assets)

“Holdings Diversification (Market Exposure as % of Net Assets)” excludes any temporary cash investments.
Ten Largest Holdings | (% of Total |
EI du Pont de Nemours & Co. | 4.5% |
Newmont Mining Corp. | 4.1% |
Dow Chemical Co. | 4.1% |
LyondellBasell Industries N.V. — Class A | 3.8% |
Avery Dennison Corp. | 3.8% |
Ecolab, Inc. | 3.8% |
International Flavors & Fragrances, Inc. | 3.7% |
PPG Industries, Inc. | 3.7% |
Owens-Illinois, Inc. | 3.7% |
Praxair, Inc. | 3.7% |
Top Ten Total | 38.9% |
“Ten Largest Holdings” exclude any temporary cash. | |
GUGGENHEIM ETFs ANNUAL REPORT | 29 |
MANAGER'S ANALYSIS (Unaudited) | October 31, 2015 |
GUGGENHEIM S&P 500® EQUAL WEIGHT REAL ESTATE ETF
For the abbreviated period ended October 31, 2015, Guggenheim S&P 500® Equal Weight Real Estate ETF (EWRE) returned 1.61%, compared with its benchmark, the S&P 500® Equal Weight Real Estate Index, which returned 1.69%. The Fund’s inception date was August 12, 2015.
The return of the cap-weighted Standard & Poor’s 500® Index for the period from inception through October 31, 2015, was 0.10%.
The Retail REITs (Real Estate Investment Trusts), Specialized REITS, and Office REITs were the largest contributors to the Fund’s return. Health Care REITs detracted the most from the Fund’s return, followed by Hotel & Resorts REITs and the Real Estate Services segment.
Equinix, Inc., Public Storage, and Kimco Realty Corp. contributed the most to the Fund’s return. Ventas, Inc., Host Hotels & Resorts, Inc., and HCP, Inc. detracted the most from the Fund’s return.
Cumulative Fund Performance: August 12, 2015 – October 31, 2015
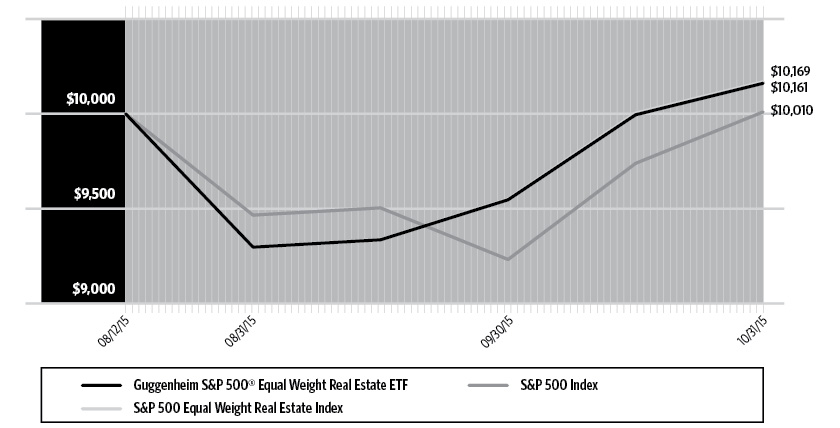
AVERAGE ANNUAL TOTAL RETURNS FOR THE PERIOD ENDED OCTOBER 31, 2015 | |
Since Inception | |
Guggenheim S&P 500® Equal Weight Real Estate ETF | 1.61% |
S&P 500 Equal Weight Real Estate Index | 1.69% |
S&P 500 Index | 0.10% |
The returns presented above do not reflect the effect of taxes. Index returns represent total returns. Performance displayed represents past performance, which is no guarantee of future results.
30 | GUGGENHEIM ETFs ANNUAL REPORT |
PORTFOLIO SUMMARY (Unaudited) | October 31, 2015 |
GUGGENHEIM S&P 500® EQUAL WEIGHT REAL ESTATE ETF
Holdings Diversification (Market Exposure as % of Net Assets)
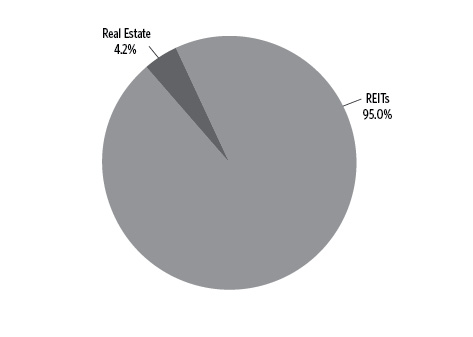
“Holdings Diversification (Market Exposure as % of Net Assets)” excludes any temporary cash investments.
Ten Largest Holdings | (% of Total |
Kimco Realty Corp. | 4.3% |
General Growth Properties, Inc. | 4.3% |
Prologis, Inc. | 4.3% |
American Tower Corp. — Class A | 4.3% |
Macerich Co. | 4.3% |
CBRE Group, Inc. — Class A | 4.2% |
Public Storage | 4.2% |
Vornado Realty Trust | 4.2% |
SL Green Realty Corp. | 4.2% |
Simon Property Group, Inc. | 4.2% |
Top Ten Total | 42.5% |
“Ten Largest Holdings” exclude any temporary cash. | |
GUGGENHEIM ETFs ANNUAL REPORT | 31 |
MANAGER'S ANALYSIS (Unaudited) | October 31, 2015 |
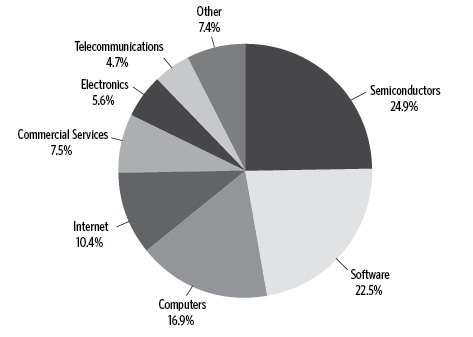
GUGGENHEIM S&P 500® EQUAL WEIGHT TECHNOLOGY ETF
For the one-year period ended October 31, 2015, Guggenheim S&P 500® Equal Weight Technology ETF (RYT) returned 8.30% compared with its benchmark, the S&P 500® Equal Weight Index Information Technology, which returned 8.72%. RYT achieved over 99% correlation to its benchmark on a daily basis.
The return of the cap-weighted Standard & Poor’s 500® Index was 5.20%.
The Software, IT Services, and Semiconductors & Semiconductor Equipment industries were the largest contributors to the Fund’s return. Real Estate Investment Trusts industry contributed the least. Technology Hardware Storage & Peripherals industry detracted the most from the Fund’s return, followed by the Electronic Equipment Instruments & Components industry.
Electronic Arts, Inc., Altera Corp., and Total System Services, Inc., contributed the most to the Fund’s return. Micron Technology, Inc., Qorvo, Inc., and Seagate Technology Plc detracted the most from the Fund’s return.
Cumulative Fund Performance: November 1, 2006 – October 31, 2015
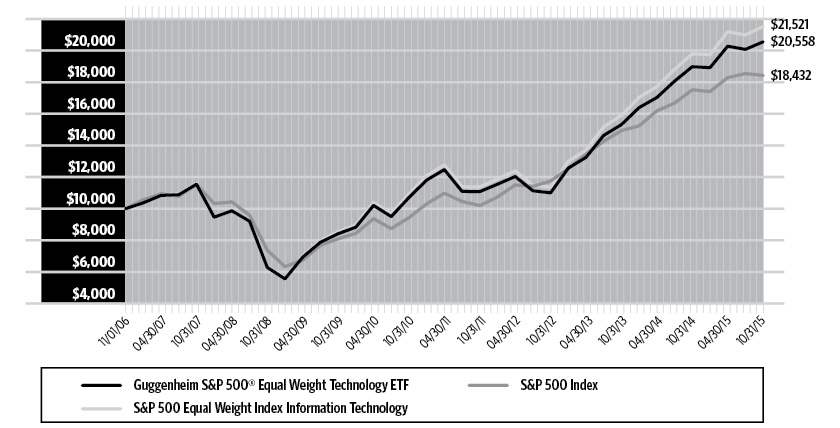
AVERAGE ANNUAL TOTAL RETURNS FOR THE PERIOD ENDED OCTOBER 31, 2015 | ||||
One Year | Three Year | Five Year | Since Inception | |
Guggenheim S&P 500® Equal Weight Technology ETF | 8.30% | 23.17% | 13.94% | 8.34% |
S&P 500 Equal Weight Index Information Technology | 8.72% | 23.73% | 14.50% | 8.89% |
S&P 500 Index | 5.20% | 16.20% | 14.33% | 7.03% |
The returns presented above do not reflect the effect of taxes. Index returns represent total returns. Performance displayed represents past performance, which is no guarantee of future results.
32 | GUGGENHEIM ETFs ANNUAL REPORT |
PORTFOLIO SUMMARY (Unaudited) | October 31, 2015 |
GUGGENHEIM S&P 500® EQUAL WEIGHT TECHNOLOGY ETF
Holdings Diversification (Market Exposure as % of Net Assets)
“Holdings Diversification (Market Exposure as % of Net Assets)” excludes any temporary cash investments.
Ten Largest Holdings | (% of Total |
SanDisk Corp. | 1.9% |
KLA-Tencor Corp. | 1.8% |
NVIDIA Corp. | 1.7% |
Juniper Networks, Inc. | 1.7% |
Microsoft Corp. | 1.7% |
Texas Instruments, Inc. | 1.6% |
Autodesk, Inc. | 1.6% |
Activision Blizzard, Inc. | 1.6% |
Alliance Data Systems Corp. | 1.6% |
First Solar, Inc. | 1.6% |
Top Ten Total | 16.8% |
“Ten Largest Holdings” exclude any temporary cash. | |
GUGGENHEIM ETFs ANNUAL REPORT | 33 |
MANAGER'S ANALYSIS (Unaudited) | October 31, 2015 |
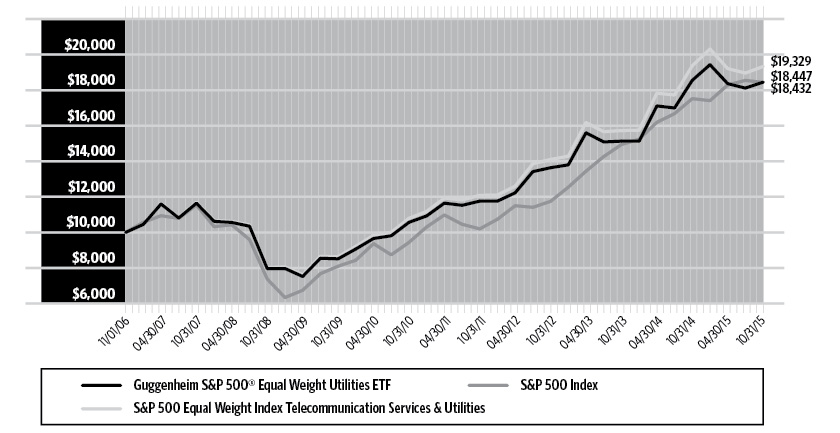
GUGGENHEIM S&P 500® EQUAL WEIGHT UTILITIES ETF
For the one-year period ended October 31, 2015, Guggenheim S&P 500® Equal Weight Utilities ETF (RYU) returned -0.56% while its benchmark, the S&P 500® Equal Weight Telecommunication Services & Utilities Index, returned -0.22%. RYU had a 96% correlation to its benchmark on a daily basis.
The return of the cap-weighted Standard & Poor’s 500® Index was 5.20%.
The industries for Multi-Utilities and Gas Utilities were the only contributors to the Fund’s return. The Independent Power & Renewable Electricity Producers industry was the largest detractor from the Fund’s return, followed by the Diversified Telecommunication Services industry and the Electric Utilities industry.
Teco Energy, Inc., AGL Resources, Inc., and NiSource, Inc. contributed the most to the Fund’s return. NRG Energy, Inc., CenturyLink, Inc., and Exelon Corp. detracted the most from the Fund’s return.
Cumulative Fund Performance: November 1, 2006 – October 31, 2015
AVERAGE ANNUAL TOTAL RETURNS FOR THE PERIOD ENDED OCTOBER 31, 2015 | ||||
One Year | Three Year | Five Year | Since Inception | |
Guggenheim S&P 500® Equal Weight Utilities ETF | -0.56% | 10.59% | 11.79% | 7.04% |
S&P 500 Equal Weight Index Telecommunication Services & Utilitities | -0.22% | 11.08% | 12.36% | 7.60% |
S&P 500 Index | 5.20% | 16.20% | 14.33% | 7.03% |
The returns presented above do not reflect the effect of taxes. Index returns represent total returns. Performance displayed represents past performance, which is no guarantee of future results.
34 | GUGGENHEIM ETFs ANNUAL REPORT |
PORTFOLIO SUMMARY (Unaudited) | October 31, 2015 |
GUGGENHEIM S&P 500® EQUAL WEIGHT UTILITIES ETF
Holdings Diversification (Market Exposure as % of Net Assets)

“Holdings Diversification (Market Exposure as % of Net Assets)” excludes any temporary cash investments.
Ten Largest Holdings | (% of Total |
PPL Corp. | 3.2% |
Pepco Holdings, Inc. | 3.2% |
NiSource, Inc. | 3.2% |
SCANA Corp. | 3.2% |
Sempra Energy | 3.2% |
Level 3 Communications, Inc. | 3.1% |
Ameren Corp. | 3.1% |
Eversource Energy | 3.1% |
CMS Energy Corp. | 3.1% |
PG&E Corp. | 3.1% |
Top Ten Total | 31.5% |
“Ten Largest Holdings” exclude any temporary cash. | |
GUGGENHEIM ETFs ANNUAL REPORT | 35 |
SCHEDULE OF INVESTMENTS | October 31, 2015 |
GUGGENHEIM RUSSELL MIDCAP® EQUAL WEIGHT ETF |
Shares | Value | |||||||
COMMON STOCKS† - 99.8% | ||||||||
Consumer, Non-cyclical - 22.6% | ||||||||
Mead Johnson Nutrition Co. — Class A | 5,472 | $ | 448,704 | |||||
Dr Pepper Snapple Group, Inc. | 5,004 | 447,208 | ||||||
Ingredion, Inc. | 4,486 | 426,439 | ||||||
Hormel Foods Corp. | 6,293 | 425,092 | ||||||
Molson Coors Brewing Co. — Class B | 4,756 | 419,004 | ||||||
Brown-Forman Corp. — Class B | 3,930 | 417,287 | ||||||
Flowers Foods, Inc. | 15,409 | 416,043 | ||||||
Coca-Cola Enterprises, Inc. | 8,047 | 413,133 | ||||||
Clorox Co. | 3,368 | 410,694 | ||||||
Herbalife Ltd.* | 7,310 | 409,652 | ||||||
Edgewell Personal Care Co. | 4,800 | 406,608 | ||||||
Constellation Brands, Inc. — Class A | 3,015 | 406,422 | ||||||
Sysco Corp. | 9,851 | 406,354 | ||||||
Kellogg Co. | 5,738 | 404,644 | ||||||
Spectrum Brands Holdings, Inc. | 4,206 | 403,145 | ||||||
JM Smucker Co. | 3,423 | 401,826 | ||||||
Bunge Ltd. | 5,501 | 401,353 | ||||||
Tyson Foods, Inc. — Class A | 9,032 | 400,660 | ||||||
McCormick & Company, Inc. | 4,691 | 393,950 | ||||||
Church & Dwight Company, Inc. | 4,571 | 393,517 | ||||||
Monster Beverage Corp.* | 2,873 | 391,647 | ||||||
Pinnacle Foods, Inc. | 8,796 | 387,728 | ||||||
Campbell Soup Co. | 7,576 | 384,785 | ||||||
ConAgra Foods, Inc. | 9,424 | 382,143 | ||||||
Whole Foods Market, Inc. | 12,541 | 375,728 | ||||||
Hershey Co. | 4,229 | 375,070 | ||||||
Blue Buffalo Pet Products, Inc.* | 20,622 | 369,959 | ||||||
Sprouts Farmers Market, Inc.* | 18,112 | 369,123 | ||||||
Hain Celestial Group, Inc.* | 7,289 | 363,357 | ||||||
WhiteWave Foods Co. — Class A* | 8,820 | 361,444 | ||||||
Keurig Green Mountain, Inc. | 7,050 | 357,788 | ||||||
Pilgrim’s Pride Corp. | 18,612 | 353,442 | ||||||
Juno Therapeutics, Inc.* | 5,047 | 261,232 | ||||||
DENTSPLY International, Inc. | 3,877 | 235,915 | ||||||
Alkermes plc* | 3,267 | 234,963 | ||||||
Henry Schein, Inc.* | 1,536 | 233,028 | ||||||
Align Technology, Inc.* | 3,553 | 232,579 | ||||||
Edwards Lifesciences Corp.* | 1,466 | 230,382 | ||||||
ResMed, Inc. | 3,984 | 229,518 | ||||||
Boston Scientific Corp.* | 12,342 | 225,612 | ||||||
Sirona Dental Systems, Inc.* | 2,056 | 224,371 | ||||||
Zimmer Biomet Holdings, Inc. | 2,132 | 222,943 | ||||||
Incyte Corp.* | 1,888 | 221,897 | ||||||
Isis Pharmaceuticals, Inc.* | 4,577 | 220,383 | ||||||
Laboratory Corporation of America Holdings* | 1,782 | 218,722 | ||||||
BioMarin Pharmaceutical, Inc.* | 1,852 | 216,758 | ||||||
Bruker Corp.* | 11,799 | 216,748 | ||||||
DaVita HealthCare Partners, Inc.* | 2,785 | 215,865 | ||||||
VWR Corp.* | 7,839 | 215,651 | ||||||
Patterson Companies, Inc. | 4,544 | 215,386 | ||||||
United Therapeutics Corp.* | 1,465 | 214,813 | ||||||
Quest Diagnostics, Inc. | 3,125 | 212,344 | ||||||
Seattle Genetics, Inc.* | 5,117 | 212,304 | ||||||
Intuitive Surgical, Inc.* | 423 | 210,062 | ||||||
Varian Medical Systems, Inc.* | 2,674 | 209,989 | ||||||
OPKO Health, Inc.* | 22,169 | 209,497 | ||||||
Bio-Rad Laboratories, Inc. — Class A* | 1,491 | 207,965 | ||||||
Alnylam Pharmaceuticals, Inc.* | 2,404 | 206,624 | ||||||
Teleflex, Inc. | 1,549 | 206,017 | ||||||
Health Net, Inc.* | 3,196 | 205,375 | ||||||
Jazz Pharmaceuticals plc* | 1,493 | 204,959 | ||||||
Cooper Companies, Inc. | 1,343 | 204,619 | ||||||
Centene Corp.* | 3,434 | 204,254 | ||||||
Zoetis, Inc. | 4,735 | 203,652 | ||||||
Medivation, Inc.* | 4,834 | 203,318 | ||||||
VCA, Inc.* | 3,706 | 202,978 | ||||||
Puma Biotechnology, Inc.* | 2,455 | 202,341 | ||||||
Charles River Laboratories International, Inc.* | 3,081 | 201,004 | ||||||
St. Jude Medical, Inc. | 3,104 | 198,066 | ||||||
Perrigo Company plc | 1,251 | 197,333 | ||||||
Premier, Inc. — Class A* | 5,818 | 196,707 | ||||||
Hologic, Inc.* | 5,033 | 195,582 | ||||||
Bio-Techne Corp. | 2,216 | 195,451 | ||||||
AmerisourceBergen Corp. — Class A | 2,017 | 194,661 | ||||||
CR Bard, Inc. | 1,042 | 194,177 | ||||||
Mallinckrodt plc* | 2,941 | 193,135 | ||||||
Hill-Rom Holdings, Inc. | 3,658 | 192,740 | ||||||
LifePoint Health, Inc.* | 2,760 | 190,108 | ||||||
Alere, Inc.* | 4,108 | 189,461 | ||||||
Universal Health Services, Inc. — Class B | 1,548 | 188,995 | ||||||
QIAGEN N.V.* | 7,802 | 188,574 | ||||||
Intercept Pharmaceuticals, Inc.* | 1,185 | 186,282 | ||||||
IDEXX Laboratories, Inc.* | 2,701 | 185,343 | ||||||
DexCom, Inc.* | 2,186 | 182,138 | ||||||
Agios Pharmaceuticals, Inc.* | 2,492 | 181,567 | ||||||
Acadia Healthcare Company, Inc.* | 2,860 | 175,633 | ||||||
Endo International plc* | 2,924 | 175,411 | ||||||
Quintiles Transnational Holdings, Inc.* | 2,744 | 174,656 | ||||||
MEDNAX, Inc.* | 2,468 | 173,920 | ||||||
Brookdale Senior Living, Inc. — Class A* | 8,250 | 172,508 | ||||||
Intrexon Corp.* | 5,117 | 171,931 | ||||||
Akorn, Inc.* | 6,279 | 167,900 | ||||||
Gartner, Inc.* | 1,737 | 157,494 | ||||||
Sabre Corp. | 5,366 | 157,331 | ||||||
Tenet Healthcare Corp.* | 4,967 | 155,815 | ||||||
Bluebird Bio, Inc.* | 2,009 | 154,954 | ||||||
United Rentals, Inc.* | 2,040 | 152,714 | ||||||
CoStar Group, Inc.* | 748 | 151,896 | ||||||
RR Donnelley & Sons Co. | 8,720 | 147,106 | ||||||
Avery Dennison Corp. | 2,258 | 146,702 | ||||||
Envision Healthcare Holdings, Inc.* | 5,139 | 144,920 | ||||||
ManpowerGroup, Inc. | 1,542 | 141,525 | ||||||
Booz Allen Hamilton Holding Corp. | 4,715 | 138,904 | ||||||
ADT Corp. | 4,173 | 137,876 | ||||||
36 | GUGGENHEIM ETFs ANNUAL REPORT | SEE NOTES TO FINANCIAL STATEMENTS. |
SCHEDULE OF INVESTMENTS (continued) | October 31, 2015 |
GUGGENHEIM RUSSELL MIDCAP® EQUAL WEIGHT ETF |
Shares | Value | |||||||
Robert Half International, Inc. | 2,531 | $ | 133,282 | |||||
Macquarie Infrastructure Corp. | 1,670 | 132,849 | ||||||
Cintas Corp. | 1,426 | 132,746 | ||||||
Towers Watson & Co. — Class A | 1,068 | 131,962 | ||||||
Community Health Systems, Inc.* | 4,523 | 126,825 | ||||||
Rollins, Inc. | 4,648 | 124,659 | ||||||
Verisk Analytics, Inc. — Class A* | 1,709 | 122,381 | ||||||
Avon Products, Inc. | 28,562 | 115,105 | ||||||
Live Nation Entertainment, Inc.* | 4,085 | 111,439 | ||||||
Avis Budget Group, Inc.* | 2,190 | 109,369 | ||||||
Hertz Global Holdings, Inc.* | 5,542 | 108,069 | ||||||
Coty, Inc. — Class A | 3,667 | 106,160 | ||||||
Quanta Services, Inc.* | 5,214 | 104,854 | ||||||
ServiceMaster Global Holdings, Inc.* | 2,937 | 104,704 | ||||||
KAR Auction Services, Inc. | 2,722 | 104,525 | ||||||
Service Corporation International | 3,576 | 101,058 | ||||||
H&R Block, Inc. | 2,686 | 100,080 | ||||||
Aramark | 3,164 | 96,027 | ||||||
Graham Holdings Co. — Class B | 171 | 94,472 | ||||||
Global Payments, Inc. | 585 | 79,800 | ||||||
Total System Services, Inc. | 1,460 | 76,577 | ||||||
SEI Investments Co. | 1,435 | 74,362 | ||||||
Vantiv, Inc. — Class A* | 1,477 | 74,072 | ||||||
Equifax, Inc. | 695 | 74,066 | ||||||
Western Union Co. | 3,793 | 73,015 | ||||||
McGraw Hill Financial, Inc. | 775 | 71,796 | ||||||
TransUnion* | 2,702 | 69,468 | ||||||
WEX, Inc.* | 769 | 69,141 | ||||||
Morningstar, Inc. | 833 | 68,398 | ||||||
FleetCor Technologies, Inc.* | 458 | 66,346 | ||||||
Moody’s Corp. | 688 | 66,158 | ||||||
Aaron’s, Inc. | 2,587 | 63,821 | ||||||
Total Consumer, Non-cyclical | 29,855,119 | |||||||
Industrial - 14.5% | ||||||||
Energizer Holdings, Inc. | 9,725 | 416,522 | ||||||
Acuity Brands, Inc. | 1,312 | 286,803 | ||||||
SunPower Corp. — Class A* | 10,676 | 286,544 | ||||||
Timken Co. | 8,524 | 269,358 | ||||||
Bemis Company, Inc. | 5,833 | 267,035 | ||||||
Crown Holdings, Inc.* | 4,979 | 264,086 | ||||||
Sonoco Products Co. | 6,126 | 261,519 | ||||||
Ingersoll-Rand plc | 4,399 | 260,684 | ||||||
Lennox International, Inc. | 1,954 | 259,511 | ||||||
AptarGroup, Inc. | 3,525 | 259,299 | ||||||
Packaging Corporation of America | 3,768 | 257,920 | ||||||
Valmont Industries, Inc. | 2,371 | 257,111 | ||||||
Masco Corp. | 8,821 | 255,809 | ||||||
Ball Corp. | 3,669 | 251,327 | ||||||
Graphic Packaging Holding Co. | 17,226 | 243,920 | ||||||
Vulcan Materials Co. | 2,510 | 242,416 | ||||||
Sealed Air Corp. | 4,926 | 241,965 | ||||||
WestRock Co. | 4,447 | 239,071 | ||||||
Hexcel Corp. | 5,128 | 237,529 | ||||||
Owens Corning | 5,189 | 236,255 | ||||||
Owens-Illinois, Inc.* | 10,937 | 235,692 | ||||||
Silgan Holdings, Inc. | 4,517 | 229,780 | ||||||
PerkinElmer, Inc. | 4,399 | 227,165 | ||||||
Armstrong World Industries, Inc.* | 4,556 | 226,069 | ||||||
Martin Marietta Materials, Inc. | 1,449 | 224,812 | ||||||
Agilent Technologies, Inc. | 5,810 | 219,386 | ||||||
Golar LNG Ltd. | 7,323 | 212,440 | ||||||
Eagle Materials, Inc. | 3,167 | 209,117 | ||||||
USG Corp.* | 8,306 | 195,772 | ||||||
Trimble Navigation Ltd.* | 7,917 | 180,112 | ||||||
SBA Communications Corp. — Class A* | 1,419 | 168,890 | ||||||
Cognex Corp. | 4,414 | 165,967 | ||||||
Avnet, Inc. | 3,624 | 164,638 | ||||||
Harris Corp. | 2,076 | 164,274 | ||||||
Amphenol Corp. — Class A | 2,961 | 160,545 | ||||||
Jabil Circuit, Inc. | 6,851 | 157,436 | ||||||
L-3 Communications Holdings, Inc. | 1,228 | 155,219 | ||||||
Arrow Electronics, Inc.* | 2,820 | 155,072 | ||||||
Roper Technologies, Inc. | 831 | 154,857 | ||||||
ITT Corp. | 3,800 | 150,404 | ||||||
Terex Corp. | 7,465 | 149,748 | ||||||
Orbital ATK, Inc. | 1,748 | 149,664 | ||||||
Nordson Corp. | 2,056 | 146,469 | ||||||
Hubbell, Inc. — Class B | 1,506 | 145,856 | ||||||
Oshkosh Corp. | 3,544 | 145,623 | ||||||
Flowserve Corp. | 3,141 | 145,617 | ||||||
Huntington Ingalls Industries, Inc. | 1,212 | 145,367 | ||||||
Fluor Corp. | 3,040 | 145,342 | ||||||
Kennametal, Inc. | 5,163 | 145,184 | ||||||
KBR, Inc. | 7,858 | 144,901 | ||||||
AO Smith Corp. | 1,886 | 144,883 | ||||||
Joy Global, Inc. | 8,389 | 144,123 | ||||||
Trinity Industries, Inc. | 5,317 | 143,931 | ||||||
Crane Co. | 2,733 | 143,865 | ||||||
National Instruments Corp. | 4,720 | 143,818 | ||||||
Waste Connections, Inc. | 2,637 | 143,664 | ||||||
Xylem, Inc. | 3,945 | 143,637 | ||||||
Lincoln Electric Holdings, Inc. | 2,399 | 143,484 | ||||||
AECOM* | 4,848 | 142,871 | ||||||
Mettler-Toledo International, Inc.* | 459 | 142,744 | ||||||
Genesee & Wyoming, Inc. — Class A* | 2,121 | 142,319 | ||||||
BWX Technologies, Inc. | 5,026 | 142,235 | ||||||
Graco, Inc. | 1,927 | 141,442 | ||||||
IDEX Corp. | 1,842 | 141,392 | ||||||
Textron, Inc. | 3,347 | 141,143 | ||||||
Chicago Bridge & Iron Company N.V. | 3,137 | 140,757 | ||||||
Regal Beloit Corp. | 2,205 | 140,657 | ||||||
Allegion plc | 2,156 | 140,507 | ||||||
Dover Corp. | 2,171 | 139,878 | ||||||
Waters Corp.* | 1,094 | 139,813 | ||||||
Rockwell Automation, Inc. | 1,277 | 139,397 | ||||||
Parker-Hannifin Corp. | 1,326 | 138,832 | ||||||
SEE NOTES TO FINANCIAL STATEMENTS. | GUGGENHEIM ETFs ANNUAL REPORT | 37 |
SCHEDULE OF INVESTMENTS (continued) | October 31, 2015 |
GUGGENHEIM RUSSELL MIDCAP® EQUAL WEIGHT ETF |
Shares | Value | |||||||
Middleby Corp.* | 1,186 | $ | 138,691 | |||||
Triumph Group, Inc. | 2,971 | 138,389 | ||||||
Snap-on, Inc. | 834 | 138,352 | ||||||
Stanley Black & Decker, Inc. | 1,303 | 138,092 | ||||||
Rockwell Collins, Inc. | 1,591 | 137,971 | ||||||
Pentair plc | 2,464 | 137,787 | ||||||
Jacobs Engineering Group, Inc.* | 3,428 | 137,600 | ||||||
Keysight Technologies, Inc.* | 4,130 | 136,620 | ||||||
Donaldson Company, Inc. | 4,513 | 136,293 | ||||||
Expeditors International of Washington, Inc. | 2,736 | 136,226 | ||||||
Kirby Corp.* | 2,082 | 135,934 | ||||||
Spirit AeroSystems Holdings, Inc. — Class A* | 2,571 | 135,595 | ||||||
Tyco International plc | 3,716 | 135,411 | ||||||
AGCO Corp. | 2,791 | 135,056 | ||||||
AMETEK, Inc. | 2,462 | 134,967 | ||||||
Republic Services, Inc. — Class A | 3,080 | 134,719 | ||||||
B/E Aerospace, Inc. | 2,859 | 134,230 | ||||||
Clean Harbors, Inc.* | 2,856 | 132,775 | ||||||
J.B. Hunt Transport Services, Inc. | 1,737 | 132,655 | ||||||
Teekay Corp. | 4,118 | 132,311 | ||||||
CH Robinson Worldwide, Inc. | 1,869 | 129,671 | ||||||
Manitowoc Company, Inc. | 8,449 | 129,270 | ||||||
Old Dominion Freight Line, Inc.* | 2,084 | 129,083 | ||||||
GATX Corp. | 2,742 | 128,052 | ||||||
Zebra Technologies Corp. — Class A* | 1,641 | 126,193 | ||||||
Babcock & Wilcox Enterprises, Inc.* | 7,426 | 126,093 | ||||||
TransDigm Group, Inc.* | 572 | 125,754 | ||||||
FLIR Systems, Inc. | 4,645 | 123,882 | ||||||
Ryder System, Inc. | 1,690 | 121,308 | ||||||
Landstar System, Inc. | 1,901 | 119,839 | ||||||
Wabtec Corp. | 1,439 | 119,250 | ||||||
Covanta Holding Corp. | 7,070 | 118,493 | ||||||
SPX FLOW, Inc.* | 3,463 | 117,396 | ||||||
Carlisle Companies, Inc. | 1,345 | 117,015 | ||||||
Kansas City Southern | 1,407 | 116,443 | ||||||
Colfax Corp.* | 4,210 | 113,502 | ||||||
TopBuild Corp.* | 3,979 | 111,929 | ||||||
Stericycle, Inc.* | 915 | 111,054 | ||||||
Gentex Corp. | 6,573 | 107,731 | ||||||
Fitbit, Inc. — Class A* | 2,620 | 106,215 | ||||||
Fortune Brands Home & Security, Inc. | 1,963 | 102,724 | ||||||
AMERCO | 243 | 98,733 | ||||||
Garmin Ltd. | 2,780 | 98,607 | ||||||
GoPro, Inc. — Class A* | 3,049 | 76,225 | ||||||
SPX Corp. | 2,591 | 31,740 | ||||||
Total Industrial | 19,167,370 | |||||||
Energy - 11.1% | ||||||||
California Resources Corp. | 80,745 | 326,209 | ||||||
Denbury Resources, Inc. | 83,457 | 295,438 | ||||||
First Solar, Inc.* | 5,166 | 294,823 | ||||||
QEP Resources, Inc. | 18,288 | 282,732 | ||||||
Kosmos Energy Ltd.* | 40,593 | 276,844 | ||||||
Noble Corporation plc | 20,463 | 275,636 | ||||||
Rowan Companies plc — Class A | 13,798 | 271,544 | ||||||
Newfield Exploration Co.* | 6,717 | 269,956 | ||||||
PBF Energy, Inc. — Class A | 7,920 | 269,280 | ||||||
Helmerich & Payne, Inc. | 4,750 | 267,283 | ||||||
Weatherford International plc* | 25,709 | 263,260 | ||||||
Laredo Petroleum, Inc.* | 22,916 | 263,076 | ||||||
Continental Resources, Inc.* | 7,740 | 262,463 | ||||||
Marathon Oil Corp. | 14,201 | 261,014 | ||||||
Energen Corp. | 4,470 | 259,931 | ||||||
Cimarex Energy Co. | 2,195 | 259,142 | ||||||
Murphy Oil Corp. | 9,037 | 256,922 | ||||||
Concho Resources, Inc.* | 2,215 | 256,741 | ||||||
Ensco plc — Class A | 15,436 | 256,701 | ||||||
Noble Energy, Inc. | 7,076 | 253,604 | ||||||
RPC, Inc. | 22,776 | 251,219 | ||||||
Pioneer Natural Resources Co. | 1,828 | 250,692 | ||||||
Hess Corp. | 4,450 | 250,135 | ||||||
TerraForm Power, Inc. — Class A | 13,672 | 249,514 | ||||||
Diamondback Energy, Inc.* | 3,360 | 248,102 | ||||||
Antero Resources Corp.* | 10,393 | 244,963 | ||||||
Columbia Pipeline Group, Inc. | 11,778 | 244,629 | ||||||
Diamond Offshore Drilling, Inc. | 12,195 | 242,437 | ||||||
Cobalt International Energy, Inc.* | 31,547 | 241,965 | ||||||
CVR Energy, Inc. | 5,431 | 241,462 | ||||||
Frank’s International N.V. | 13,929 | 239,022 | ||||||
Whiting Petroleum Corp.* | 13,857 | 238,756 | ||||||
Patterson-UTI Energy, Inc. | 16,010 | 238,389 | ||||||
Cameron International Corp.* | 3,490 | 237,355 | ||||||
Targa Resources Corp. | 4,142 | 236,715 | ||||||
Oceaneering International, Inc. | 5,607 | 235,606 | ||||||
Tesoro Corp. | 2,203 | 235,567 | ||||||
NOW, Inc.* | 14,210 | 234,607 | ||||||
SM Energy Co. | 7,023 | 234,217 | ||||||
Seadrill Ltd.* | 36,192 | 234,162 | ||||||
EP Energy Corp. — Class A* | 42,361 | 233,409 | ||||||
Superior Energy Services, Inc. | 16,422 | 232,536 | ||||||
FMC Technologies, Inc.* | 6,813 | 230,484 | ||||||
Cheniere Energy, Inc.* | 4,612 | 228,386 | ||||||
WPX Energy, Inc.* | 33,234 | 227,985 | ||||||
National Oilwell Varco, Inc. | 5,972 | 224,786 | ||||||
Nabors Industries Ltd. | 22,367 | 224,565 | ||||||
Dril-Quip, Inc.* | 3,640 | 224,078 | ||||||
HollyFrontier Corp. | 4,495 | 220,120 | ||||||
Memorial Resource Development Corp.* | 12,433 | 219,940 | ||||||
Gulfport Energy Corp.* | 7,212 | 219,750 | ||||||
Chesapeake Energy Corp. | 30,266 | 215,797 | ||||||
ONEOK, Inc. | 6,356 | 215,596 | ||||||
Equities Corp. | 3,212 | 212,217 | ||||||
Cabot Oil & Gas Corp. — Class A | 9,390 | 203,857 | ||||||
Range Resources Corp. | 6,393 | 194,603 | ||||||
Rice Energy, Inc.* | 12,558 | 191,635 | ||||||
Southwestern Energy Co.* | 17,218 | 190,087 | ||||||
SolarCity Corp.* | 5,412 | 160,466 | ||||||
38 | GUGGENHEIM ETFs ANNUAL REPORT | SEE NOTES TO FINANCIAL STATEMENTS. |
SCHEDULE OF INVESTMENTS (continued) | October 31, 2015 |
GUGGENHEIM RUSSELL MIDCAP® EQUAL WEIGHT ETF |
Shares | Value | |||||||
CONSOL Energy, Inc. | 21,424 | $ | 142,684 | |||||
SunEdison, Inc.* | 17,635 | 128,736 | ||||||
Murphy USA, Inc.* | 1,763 | 108,195 | ||||||
Total Energy | 14,702,025 | |||||||
Consumer, Cyclical - 10.7% | ||||||||
Rite Aid Corp.* | 57,561 | 453,581 | ||||||
Nu Skin Enterprises, Inc. — Class A | 9,498 | 362,919 | ||||||
GNC Holdings, Inc. — Class A | 9,353 | 278,252 | ||||||
World Fuel Services Corp. | 6,170 | 274,318 | ||||||
Scotts Miracle-Gro Co. — Class A | 3,868 | 255,907 | ||||||
Fastenal Co. | 6,292 | 246,394 | ||||||
Watsco, Inc. | 1,867 | 229,697 | ||||||
Ingram Micro, Inc. — Class A | 5,599 | 166,738 | ||||||
Dolby Laboratories, Inc. — Class A | 4,774 | 165,514 | ||||||
Copa Holdings S.A. — Class A | 3,161 | 159,695 | ||||||
Southwest Airlines Co. | 3,363 | 155,673 | ||||||
Allison Transmission Holdings, Inc. | 4,889 | 140,314 | ||||||
United Continental Holdings, Inc.* | 2,311 | 139,376 | ||||||
Copart, Inc.* | 3,746 | 135,643 | ||||||
Toro Co. | 1,797 | 135,260 | ||||||
MSC Industrial Direct Company, Inc. — Class A | 2,060 | 129,306 | ||||||
PACCAR, Inc. | 2,425 | 127,676 | ||||||
WESCO International, Inc.* | 2,590 | 126,729 | ||||||
WW Grainger, Inc. | 599 | 125,790 | ||||||
HD Supply Holdings, Inc.* | 4,183 | 124,612 | ||||||
JetBlue Airways Corp.* | 4,805 | 119,356 | ||||||
Alaska Air Group, Inc. | 1,563 | 119,179 | ||||||
Wynn Resorts Ltd. | 1,693 | 118,425 | ||||||
Tupperware Brands Corp. | 1,969 | 115,915 | ||||||
Lear Corp. | 925 | 115,680 | ||||||
MGM Resorts International* | 4,987 | 115,649 | ||||||
Starwood Hotels & Resorts Worldwide, Inc. | 1,439 | 114,932 | ||||||
Harman International Industries, Inc. | 1,042 | 114,578 | ||||||
Extended Stay America, Inc. | 5,855 | 112,416 | ||||||
Delphi Automotive plc | 1,336 | 111,142 | ||||||
GameStop Corp. — Class A | 2,403 | 110,706 | ||||||
Six Flags Entertainment Corp. | 2,126 | 110,637 | ||||||
Marriott International, Inc. — Class A | 1,438 | 110,410 | ||||||
Brunswick Corp. | 2,047 | 110,149 | ||||||
Mattel, Inc. | 4,445 | 109,259 | ||||||
Wyndham Worldwide Corp. | 1,340 | 109,009 | ||||||
Advance Auto Parts, Inc. | 549 | 108,938 | ||||||
Goodyear Tire & Rubber Co. | 3,315 | 108,865 | ||||||
Leggett & Platt, Inc. | 2,409 | 108,477 | ||||||
Tractor Supply Co. | 1,173 | 108,373 | ||||||
Coach, Inc. | 3,460 | 107,951 | ||||||
Office Depot, Inc.* | 14,158 | 107,884 | ||||||
Cinemark Holdings, Inc. | 3,036 | 107,595 | ||||||
Regal Entertainment Group — Class A | 5,549 | 107,540 | ||||||
Hanesbrands, Inc. | 3,358 | 107,254 | ||||||
Choice Hotels International, Inc. | 2,050 | 107,236 | ||||||
WABCO Holdings, Inc.* | 955 | 107,180 | ||||||
Visteon Corp.* | 978 | 106,670 | ||||||
Genuine Parts Co. | 1,173 | 106,461 | ||||||
O’Reilly Automotive, Inc.* | 384 | 106,084 | ||||||
Hilton Worldwide Holdings, Inc. | 4,237 | 105,883 | ||||||
BorgWarner, Inc. | 2,463 | 105,466 | ||||||
AutoNation, Inc.* | 1,659 | 104,832 | ||||||
Signet Jewelers Ltd. | 693 | 104,602 | ||||||
Royal Caribbean Cruises Ltd. | 1,062 | 104,448 | ||||||
Tiffany & Co. | 1,264 | 104,204 | ||||||
CST Brands, Inc. | 2,883 | 103,586 | ||||||
Staples, Inc. | 7,965 | 103,465 | ||||||
Thor Industries, Inc. | 1,909 | 103,239 | ||||||
Hyatt Hotels Corp. — Class A* | 2,045 | 103,068 | ||||||
L Brands, Inc. | 1,073 | 102,986 | ||||||
Whirlpool Corp. | 642 | 102,810 | ||||||
AutoZone, Inc.* | 131 | 102,758 | ||||||
Norwegian Cruise Line Holdings Ltd.* | 1,597 | 101,601 | ||||||
Ross Stores, Inc. | 2,008 | 101,565 | ||||||
NVR, Inc.* | 62 | 101,541 | ||||||
Wendy’s Co. | 11,072 | 101,419 | ||||||
Newell Rubbermaid, Inc. | 2,383 | 101,111 | ||||||
Hasbro, Inc. | 1,315 | 101,031 | ||||||
Liberty Interactive Corporation QVC Group — Class A* | 3,687 | 100,913 | ||||||
Ralph Lauren Corp. — Class A | 910 | 100,801 | ||||||
LKQ Corp.* | 3,382 | 100,141 | ||||||
Ulta Salon Cosmetics & Fragrance, Inc.* | 573 | 99,679 | ||||||
Tempur Sealy International, Inc.* | 1,273 | 99,090 | ||||||
Lions Gate Entertainment Corp. | 2,540 | 98,984 | ||||||
Mohawk Industries, Inc.* | 505 | 98,728 | ||||||
Toll Brothers, Inc.* | 2,733 | 98,306 | ||||||
Bed Bath & Beyond, Inc.* | 1,648 | 98,270 | ||||||
Lennar Corp. — Class A | 1,953 | 97,787 | ||||||
Vista Outdoor, Inc.* | 2,185 | 97,713 | ||||||
Penske Automotive Group, Inc. | 2,000 | 97,680 | ||||||
Spirit Airlines, Inc.* | 2,629 | 97,588 | ||||||
Michaels Companies, Inc.* | 4,165 | 97,378 | ||||||
CarMax, Inc.* | 1,649 | 97,307 | ||||||
Dillard’s, Inc. — Class A | 1,086 | 97,176 | ||||||
International Game Technology plc | 5,925 | 96,104 | ||||||
Macy’s, Inc. | 1,876 | 95,638 | ||||||
Sally Beauty Holdings, Inc.* | 4,065 | 95,568 | ||||||
Carter’s, Inc. | 1,051 | 95,515 | ||||||
Kohl’s Corp. | 2,066 | 95,284 | ||||||
Urban Outfitters, Inc.* | 3,324 | 95,066 | ||||||
JC Penney Company, Inc.* | 10,276 | 94,230 | ||||||
Fossil Group, Inc.* | 1,730 | 94,129 | ||||||
Sears Holdings Corp.* | 3,994 | 93,340 | ||||||
Williams-Sonoma, Inc. | 1,265 | 93,294 | ||||||
DR Horton, Inc. | 3,161 | 93,060 | ||||||
Dollar General Corp. | 1,373 | 93,048 | ||||||
Best Buy Company, Inc. | 2,651 | 92,865 | ||||||
lululemon athletica, Inc.* | 1,874 | 92,145 | ||||||
SEE NOTES TO FINANCIAL STATEMENTS. | GUGGENHEIM ETFs ANNUAL REPORT | 39 |
SCHEDULE OF INVESTMENTS (continued) | October 31, 2015 |
GUGGENHEIM RUSSELL MIDCAP® EQUAL WEIGHT ETF |
Shares | Value | |||||||
Dollar Tree, Inc.* | 1,406 | $ | 92,079 | |||||
Domino’s Pizza, Inc. | 859 | 91,630 | ||||||
DSW, Inc. — Class A | 3,671 | 91,555 | ||||||
Kate Spade & Co.* | 5,090 | 91,467 | ||||||
PulteGroup, Inc. | 4,937 | 90,495 | ||||||
Harley-Davidson, Inc. | 1,829 | 90,444 | ||||||
Panera Bread Co. — Class A* | 507 | 89,927 | ||||||
Michael Kors Holdings Ltd.* | 2,324 | 89,799 | ||||||
Dick’s Sporting Goods, Inc. | 2,003 | 89,234 | ||||||
Under Armour, Inc. — Class A* | 934 | 88,805 | ||||||
Polaris Industries, Inc. | 785 | 88,187 | ||||||
Nordstrom, Inc. | 1,350 | 88,034 | ||||||
Foot Locker, Inc. | 1,277 | 86,517 | ||||||
Chipotle Mexican Grill, Inc. — Class A* | 135 | 86,431 | ||||||
Darden Restaurants, Inc. | 1,392 | 86,151 | ||||||
The Gap, Inc. | 3,163 | 86,097 | ||||||
Jarden Corp.* | 1,921 | 86,061 | ||||||
PVH Corp. | 940 | 85,493 | ||||||
Brinker International, Inc. | 1,871 | 85,149 | ||||||
Madison Square Garden Co. — Class A* | 466 | 83,181 | ||||||
Dunkin’ Brands Group, Inc. | 1,989 | 82,364 | ||||||
Cabela’s, Inc.* | 2,087 | 81,748 | ||||||
Gaming and Leisure Properties, Inc. | 2,262 | 65,983 | ||||||
Skechers U.S.A., Inc. — Class A* | 2,085 | 65,052 | ||||||
Total Consumer, Cyclical | 14,175,669 | |||||||
Financial - 9.9% | ||||||||
Air Lease Corp. — Class A | 3,890 | 131,132 | ||||||
Outfront Media, Inc. | 4,530 | 106,954 | ||||||
Lamar Advertising Co. — Class A | 1,859 | 104,904 | ||||||
Digital Realty Trust, Inc. | 1,080 | 79,877 | ||||||
CBRE Group, Inc. — Class A* | 2,122 | 79,108 | ||||||
Alliance Data Systems Corp.* | 266 | 79,084 | ||||||
Old Republic International Corp. | 4,372 | 78,871 | ||||||
General Growth Properties, Inc. | 2,718 | 78,686 | ||||||
Jones Lang LaSalle, Inc. | 466 | 77,687 | ||||||
BioMed Realty Trust, Inc. | 3,305 | 77,371 | ||||||
Taubman Centers, Inc. | 1,001 | 77,057 | ||||||
Lincoln National Corp. | 1,439 | 77,001 | ||||||
American Campus Communities, Inc. | 1,895 | 76,880 | ||||||
Kimco Realty Corp. | 2,864 | 76,670 | ||||||
Regency Centers Corp. | 1,128 | 76,659 | ||||||
Brandywine Realty Trust | 5,662 | 76,437 | ||||||
Cincinnati Financial Corp. | 1,269 | 76,432 | ||||||
Prologis, Inc. | 1,787 | 76,359 | ||||||
Spirit Realty Capital, Inc. | 7,491 | 76,259 | ||||||
Vornado Realty Trust | 758 | 76,217 | ||||||
Raymond James Financial, Inc. | 1,382 | 76,162 | ||||||
AmTrust Financial Services, Inc. | 1,113 | 75,928 | ||||||
Macerich Co. | 896 | 75,927 | ||||||
Piedmont Office Realty Trust, Inc. — Class A | 3,915 | 75,873 | ||||||
Brixmor Property Group, Inc. | 2,953 | 75,656 | ||||||
T. Rowe Price Group, Inc. | 999 | 75,544 | ||||||
Forest City Enterprises, Inc. — Class A* | 3,415 | 75,471 | ||||||
Weingarten Realty Investors | 2,109 | 75,418 | ||||||
DDR Corp. | 4,488 | 75,398 | ||||||
Ameriprise Financial, Inc. | 653 | 75,330 | ||||||
Liberty Property Trust | 2,207 | 75,082 | ||||||
Corporate Office Properties Trust | 3,259 | 74,957 | ||||||
Crown Castle International Corp. | 877 | 74,948 | ||||||
Unum Group | 2,158 | 74,775 | ||||||
Duke Realty Corp. | 3,609 | 74,706 | ||||||
Boston Properties, Inc. | 593 | 74,629 | ||||||
SL Green Realty Corp. | 629 | 74,612 | ||||||
Healthcare Trust of America, Inc. — Class A | 2,835 | 74,589 | ||||||
Federated Investors, Inc. — Class B | 2,426 | 74,550 | ||||||
Weyerhaeuser Co. | 2,539 | 74,469 | ||||||
Columbia Property Trust, Inc. | 2,997 | 74,445 | ||||||
E*TRADE Financial Corp.* | 2,610 | 74,411 | ||||||
SunTrust Banks, Inc. | 1,792 | 74,405 | ||||||
WP Carey, Inc. | 1,173 | 74,333 | ||||||
Signature Bank* | 499 | 74,311 | ||||||
Erie Indemnity Co. — Class A | 848 | 74,166 | ||||||
Apartment Investment & Management Co. — Class A | 1,892 | 74,147 | ||||||
Eaton Vance Corp. | 2,053 | 74,134 | ||||||
Retail Properties of America, Inc. — Class A | 4,934 | 73,862 | ||||||
Associated Banc-Corp. | 3,816 | 73,801 | ||||||
Markel Corp.* | 85 | 73,780 | ||||||
Waddell & Reed Financial, Inc. — Class A | 1,993 | 73,621 | ||||||
Federal Realty Investment Trust | 513 | 73,610 | ||||||
Nasdaq, Inc. | 1,271 | 73,578 | ||||||
Assured Guaranty Ltd. | 2,680 | 73,539 | ||||||
Synovus Financial Corp. | 2,324 | 73,509 | ||||||
Intercontinental Exchange, Inc. | 291 | 73,448 | ||||||
TD Ameritrade Holding Corp. | 2,130 | 73,421 | ||||||
Cullen/Frost Bankers, Inc. | 1,072 | 73,368 | ||||||
BOK Financial Corp. | 1,092 | 73,361 | ||||||
Progressive Corp. | 2,214 | 73,350 | ||||||
Equity Commonwealth* | 2,554 | 73,325 | ||||||
Paramount Group, Inc. | 4,122 | 73,248 | ||||||
Navient Corp. | 5,552 | 73,231 | ||||||
Citizens Financial Group, Inc. | 3,007 | 73,070 | ||||||
Tanger Factory Outlet Centers, Inc. | 2,089 | 73,011 | ||||||
Affiliated Managers Group, Inc.* | 405 | 73,005 | ||||||
Alleghany Corp.* | 147 | 72,952 | ||||||
Mercury General Corp. | 1,350 | 72,914 | ||||||
Artisan Partners Asset Management, Inc. — Class A | 1,902 | 72,752 | ||||||
Empire State Realty Trust, Inc. — Class A | 4,079 | 72,688 | ||||||
LendingClub Corp.* | 5,111 | 72,474 | ||||||
Hanover Insurance Group, Inc. | 860 | 72,455 | ||||||
National Retail Properties, Inc. | 1,906 | 72,428 | ||||||
ProAssurance Corp. | 1,366 | 72,343 | ||||||
CNA Financial Corp. | 1,978 | 72,316 | ||||||
Host Hotels & Resorts, Inc. | 4,172 | 72,301 | ||||||
CIT Group, Inc. | 1,681 | 72,283 | ||||||
40 | GUGGENHEIM ETFs ANNUAL REPORT | SEE NOTES TO FINANCIAL STATEMENTS. |
SCHEDULE OF INVESTMENTS (continued) | October 31, 2015 |
GUGGENHEIM RUSSELL MIDCAP® EQUAL WEIGHT ETF |
Shares | Value | |||||||
Huntington Bancshares, Inc. | 6,585 | $ | 72,237 | |||||
Apple Hospitality REIT, Inc. | 3,658 | 72,136 | ||||||
Equinix, Inc. | 243 | 72,093 | ||||||
Principal Financial Group, Inc. | 1,437 | 72,080 | ||||||
East West Bancorp, Inc. | 1,784 | 72,055 | ||||||
Douglas Emmett, Inc. | 2,356 | 71,976 | ||||||
Bank of Hawaii Corp. | 1,099 | 71,963 | ||||||
Arthur J Gallagher & Co. | 1,645 | 71,936 | ||||||
First Republic Bank | 1,101 | 71,906 | ||||||
PacWest Bancorp | 1,596 | 71,884 | ||||||
VEREIT, Inc. | 8,700 | 71,862 | ||||||
Aspen Insurance Holdings Ltd. | 1,477 | 71,796 | ||||||
Hudson City Bancorp, Inc. | 7,092 | 71,771 | ||||||
Invesco Ltd. | 2,163 | 71,747 | ||||||
American National Insurance Co. | 694 | 71,676 | ||||||
Aon plc | 768 | 71,662 | ||||||
Hospitality Properties Trust | 2,668 | 71,609 | ||||||
LPL Financial Holdings, Inc. | 1,680 | 71,568 | ||||||
Mid-America Apartment Communities, Inc. | 840 | 71,560 | ||||||
Howard Hughes Corp.* | 579 | 71,553 | ||||||
Legg Mason, Inc. | 1,598 | 71,511 | ||||||
CoreLogic, Inc.* | 1,833 | 71,450 | ||||||
Realty Income Corp. | 1,444 | 71,420 | ||||||
Voya Financial, Inc. | 1,760 | 71,403 | ||||||
Brown & Brown, Inc. | 2,208 | 71,252 | ||||||
Realogy Holdings Corp.* | 1,821 | 71,201 | ||||||
Regions Financial Corp. | 7,607 | 71,125 | ||||||
Equity LifeStyle Properties, Inc. | 1,175 | 71,064 | ||||||
City National Corp. | 793 | 71,053 | ||||||
Assurant, Inc. | 870 | 70,931 | ||||||
RenaissanceRe Holdings Ltd. | 647 | 70,931 | ||||||
Plum Creek Timber Company, Inc. | 1,741 | 70,928 | ||||||
American Homes 4 Rent — Class A | 4,298 | 70,917 | ||||||
Everest Re Group Ltd. | 398 | 70,832 | ||||||
Endurance Specialty Holdings Ltd. | 1,122 | 70,832 | ||||||
Springleaf Holdings, Inc.* | 1,508 | 70,740 | ||||||
American Financial Group, Inc. | 979 | 70,674 | ||||||
Extra Space Storage, Inc. | 891 | 70,603 | ||||||
Zions Bancorporation | 2,451 | 70,515 | ||||||
Alexandria Real Estate Equities, Inc. | 785 | 70,446 | ||||||
Northern Trust Corp. | 1,000 | 70,390 | ||||||
XL Group plc — Class A | 1,848 | 70,372 | ||||||
Camden Property Trust | 953 | 70,322 | ||||||
Arch Capital Group Ltd.* | 939 | 70,322 | ||||||
White Mountains Insurance Group Ltd. | 89 | 70,310 | ||||||
People’s United Financial, Inc. | 4,405 | 70,260 | ||||||
Rayonier, Inc. | 3,098 | 70,170 | ||||||
Loews Corp. | 1,920 | 70,003 | ||||||
Interactive Brokers Group, Inc. — Class A | 1,701 | 69,979 | ||||||
Comerica, Inc. | 1,611 | 69,917 | ||||||
Torchmark Corp. | 1,204 | 69,844 | ||||||
AvalonBay Communities, Inc. | 399 | 69,757 | ||||||
TCF Financial Corp. | 4,529 | 69,701 | ||||||
BankUnited, Inc. | 1,874 | 69,675 | ||||||
Essex Property Trust, Inc. | 316 | 69,659 | ||||||
WR Berkley Corp. | 1,246 | 69,564 | ||||||
SVB Financial Group* | 569 | 69,458 | ||||||
Commerce Bancshares, Inc. | 1,522 | 69,327 | ||||||
Iron Mountain, Inc. | 2,261 | 69,277 | ||||||
UDR, Inc. | 2,010 | 69,265 | ||||||
Post Properties, Inc. | 1,159 | 69,239 | ||||||
Hartford Financial Services Group, Inc. | 1,495 | 69,159 | ||||||
Communications Sales & Leasing, Inc. | 3,438 | 69,069 | ||||||
Kilroy Realty Corp. | 1,047 | 68,934 | ||||||
First Horizon National Corp. | 4,861 | 68,929 | ||||||
TFS Financial Corp. | 3,916 | 68,765 | ||||||
CBOE Holdings, Inc. | 1,022 | 68,515 | ||||||
Reinsurance Group of America, Inc. — Class A | 759 | 68,492 | ||||||
Synchrony Financial* | 2,226 | 68,472 | ||||||
CBL & Associates Properties, Inc. | 4,692 | 68,409 | ||||||
Fifth Third Bancorp | 3,587 | 68,332 | ||||||
StanCorp Financial Group, Inc. | 595 | 68,258 | ||||||
PartnerRe Ltd. | 491 | 68,249 | ||||||
M&T Bank Corp. | 569 | 68,195 | ||||||
Care Capital Properties, Inc. | 2,069 | 68,174 | ||||||
MFA Financial, Inc. | 9,825 | 67,990 | ||||||
First Niagara Financial Group, Inc. | 6,555 | 67,844 | ||||||
Lazard Ltd. — Class A | 1,463 | 67,766 | ||||||
Popular, Inc. | 2,286 | 67,597 | ||||||
Chimera Investment Corp. | 4,793 | 67,485 | ||||||
Omega Healthcare Investors, Inc. | 1,944 | 67,107 | ||||||
HCP, Inc. | 1,799 | 66,923 | ||||||
Axis Capital Holdings Ltd. | 1,235 | 66,690 | ||||||
WP GLIMCHER, Inc. | 5,728 | 66,559 | ||||||
Validus Holdings Ltd. | 1,502 | 66,539 | ||||||
Welltower, Inc. | 1,021 | 66,232 | ||||||
Ally Financial, Inc.* | 3,324 | 66,214 | ||||||
Annaly Capital Management, Inc. | 6,629 | 65,959 | ||||||
FNF Group | 1,860 | 65,621 | ||||||
Allied World Assurance Company Holdings AG | 1,803 | 65,557 | ||||||
Genworth Financial, Inc. — Class A* | 13,954 | 65,305 | ||||||
Ventas, Inc. | 1,214 | 65,216 | ||||||
KeyCorp | 5,233 | 64,994 | ||||||
Starwood Property Trust, Inc. | 3,226 | 64,810 | ||||||
Senior Housing Properties Trust | 4,248 | 64,527 | ||||||
Corrections Corporation of America | 2,250 | 64,125 | ||||||
NorthStar Asset Management Group, Inc. | 4,375 | 64,006 | ||||||
American Capital Agency Corp. | 3,562 | 63,510 | ||||||
SLM Corp.* | 8,983 | 63,420 | ||||||
Credit Acceptance Corp.* | 335 | 63,345 | ||||||
New York Community Bancorp, Inc. | 3,745 | 61,867 | ||||||
Two Harbors Investment Corp. | 7,278 | 61,572 | ||||||
NorthStar Realty Finance Corp. | 5,096 | 61,203 | ||||||
Santander Consumer USA Holdings, Inc.* | 3,192 | 57,488 | ||||||
Total Financial | 13,122,197 | |||||||
SEE NOTES TO FINANCIAL STATEMENTS. | GUGGENHEIM ETFs ANNUAL REPORT | 41 |
SCHEDULE OF INVESTMENTS (continued) | October 31, 2015 |
GUGGENHEIM RUSSELL MIDCAP® EQUAL WEIGHT ETF |
Shares | Value | |||||||
Utilities - 9.3% | ||||||||
MDU Resources Group, Inc. | 19,269 | $ | 363,414 | |||||
Pepco Holdings, Inc. | 13,513 | 359,852 | ||||||
Vectren Corp. | 7,834 | 356,211 | ||||||
AES Corp. | 32,153 | 352,076 | ||||||
SCANA Corp. | 5,920 | 350,582 | ||||||
Atmos Energy Corp. | 5,554 | 349,901 | ||||||
Sempra Energy | 3,409 | 349,116 | ||||||
Aqua America, Inc. | 12,149 | 347,462 | ||||||
Questar Corp. | 16,723 | 345,330 | ||||||
Calpine Corp.* | 22,239 | 344,926 | ||||||
PPL Corp. | 10,017 | 344,585 | ||||||
UGI Corp. | 9,328 | 342,058 | ||||||
NiSource, Inc. | 17,841 | 341,834 | ||||||
Ameren Corp. | 7,742 | 338,171 | ||||||
Entergy Corp. | 4,958 | 337,937 | ||||||
National Fuel Gas Co. | 6,432 | 337,873 | ||||||
OGE Energy Corp. | 11,830 | 337,273 | ||||||
Great Plains Energy, Inc. | 12,200 | 335,500 | ||||||
American Water Works Company, Inc. | 5,834 | 334,638 | ||||||
CMS Energy Corp. | 9,261 | 334,044 | ||||||
Westar Energy, Inc. | 8,410 | 333,877 | ||||||
Eversource Energy | 6,551 | 333,708 | ||||||
CenterPoint Energy, Inc. | 17,901 | 332,064 | ||||||
Hawaiian Electric Industries, Inc. | 11,336 | 331,691 | ||||||
DTE Energy Co. | 4,040 | 329,624 | ||||||
AGL Resources, Inc. | 5,261 | 328,813 | ||||||
Xcel Energy, Inc. | 9,173 | 326,834 | ||||||
TECO Energy, Inc. | 12,089 | 326,403 | ||||||
Alliant Energy Corp. | 5,524 | 326,026 | ||||||
WEC Energy Group, Inc. | 6,278 | 323,694 | ||||||
Public Service Enterprise Group, Inc. | 7,832 | 323,383 | ||||||
FirstEnergy Corp. | 10,317 | 321,890 | ||||||
Pinnacle West Capital Corp. | 5,042 | 320,217 | ||||||
Consolidated Edison, Inc. | 4,833 | 317,770 | ||||||
ITC Holdings Corp. | 9,534 | 311,952 | ||||||
Edison International | 5,138 | 310,952 | ||||||
NRG Energy, Inc. | 21,250 | 273,913 | ||||||
Total Utilities | 12,375,594 | |||||||
Technology - 9.1% | ||||||||
athenahealth, Inc.* | 1,489 | 226,999 | ||||||
SanDisk Corp. | 2,947 | 226,919 | ||||||
Cerner Corp.* | 3,291 | 218,160 | ||||||
SolarWinds, Inc.* | 3,751 | 217,671 | ||||||
Allscripts Healthcare Solutions, Inc.* | 15,472 | 217,536 | ||||||
Veeva Systems, Inc. — Class A* | 8,325 | 211,206 | ||||||
KLA-Tencor Corp. | 3,084 | 206,998 | ||||||
Maxim Integrated Products, Inc. | 4,611 | 188,959 | ||||||
Leidos Holdings, Inc. | 3,553 | 186,781 | ||||||
Lam Research Corp. | 2,376 | 181,978 | ||||||
Cypress Semiconductor Corp.* | 17,112 | 180,360 | ||||||
NVIDIA Corp. | 6,349 | 180,120 | ||||||
ON Semiconductor Corp.* | 16,066 | 176,726 | ||||||
Autodesk, Inc.* | 3,192 | 176,166 | ||||||
Microchip Technology, Inc. | 3,607 | 174,182 | ||||||
Linear Technology Corp. | 3,890 | 172,794 | ||||||
VeriFone Systems, Inc.* | 5,721 | 172,432 | ||||||
NetApp, Inc. | 5,069 | 172,346 | ||||||
Applied Materials, Inc. | 10,268 | 172,194 | ||||||
DST Systems, Inc. | 1,406 | 171,743 | ||||||
NCR Corp.* | 6,442 | 171,357 | ||||||
Citrix Systems, Inc.* | 2,084 | 171,095 | ||||||
Xilinx, Inc. | 3,575 | 170,242 | ||||||
Teradyne, Inc. | 8,655 | 168,946 | ||||||
ServiceNow, Inc.* | 2,058 | 168,035 | ||||||
Black Knight Financial Services, Inc. — Class A* | 4,648 | 167,468 | ||||||
King Digital Entertainment plc | 11,187 | 167,358 | ||||||
Ultimate Software Group, Inc.* | 817 | 166,954 | ||||||
Intuit, Inc. | 1,705 | 166,118 | ||||||
Analog Devices, Inc. | 2,754 | 165,570 | ||||||
Inovalon Holdings, Inc. — Class A* | 7,142 | 164,623 | ||||||
IPG Photonics Corp.* | 1,982 | 163,753 | ||||||
PTC, Inc.* | 4,611 | 163,414 | ||||||
Workday, Inc. — Class A* | 2,066 | 163,152 | ||||||
Computer Sciences Corp. | 2,445 | 162,813 | ||||||
Red Hat, Inc.* | 2,056 | 162,650 | ||||||
Activision Blizzard, Inc. | 4,675 | 162,503 | ||||||
Synopsys, Inc.* | 3,203 | 160,086 | ||||||
Cadence Design Systems, Inc.* | 7,153 | 158,940 | ||||||
ANSYS, Inc.* | 1,667 | 158,882 | ||||||
Cree, Inc.* | 6,259 | 157,664 | ||||||
SS&C Technologies Holdings, Inc. | 2,121 | 157,271 | ||||||
Altera Corp. | 2,982 | 156,704 | ||||||
Amdocs Ltd. | 2,614 | 155,716 | ||||||
Electronic Arts, Inc.* | 2,157 | 155,455 | ||||||
Nuance Communications, Inc.* | 9,003 | 152,781 | ||||||
Zynga, Inc. — Class A* | 64,061 | 151,825 | ||||||
CA, Inc. | 5,478 | 151,795 | ||||||
Tableau Software, Inc. — Class A* | 1,807 | 151,716 | ||||||
CDK Global, Inc. | 2,994 | 149,071 | ||||||
Solera Holdings, Inc. | 2,711 | 148,183 | ||||||
Brocade Communications Systems, Inc. | 14,150 | 147,443 | ||||||
NetSuite, Inc.* | 1,727 | 146,916 | ||||||
Teradata Corp.* | 5,198 | 146,116 | ||||||
Lexmark International, Inc. — Class A | 4,489 | 145,848 | ||||||
Western Digital Corp. | 2,128 | 142,193 | ||||||
Atmel Corp. | 18,691 | 142,052 | ||||||
Rackspace Hosting, Inc.* | 5,482 | 141,710 | ||||||
Paychex, Inc. | 2,743 | 141,484 | ||||||
Qorvo, Inc.* | 3,144 | 138,116 | ||||||
Genpact Ltd.* | 5,562 | 137,826 | ||||||
Freescale Semiconductor Ltd.* | 4,113 | 137,744 | ||||||
IHS, Inc. — Class A* | 1,147 | 137,112 | ||||||
IMS Health Holdings, Inc.* | 4,895 | 133,242 | ||||||
Skyworks Solutions, Inc. | 1,708 | 131,926 | ||||||
42 | GUGGENHEIM ETFs ANNUAL REPORT | SEE NOTES TO FINANCIAL STATEMENTS. |
SCHEDULE OF INVESTMENTS (continued) | October 31, 2015 |
GUGGENHEIM RUSSELL MIDCAP® EQUAL WEIGHT ETF |
Shares | Value | |||||||
Marvell Technology Group Ltd. | 16,066 | $ | 131,902 | |||||
Pitney Bowes, Inc. | 6,367 | 131,479 | ||||||
Akamai Technologies, Inc.* | 2,125 | 129,243 | ||||||
Lumentum Holdings, Inc.* | 8,828 | 126,594 | ||||||
3D Systems Corp.* | 12,318 | 123,919 | ||||||
Xerox Corp. | 12,709 | 119,338 | ||||||
Fortinet, Inc.* | 3,323 | 114,178 | ||||||
MSCI, Inc. — Class A | 1,126 | 75,442 | ||||||
Jack Henry & Associates, Inc. | 972 | 75,174 | ||||||
Dun & Bradstreet Corp. | 659 | 75,040 | ||||||
Fiserv, Inc.* | 772 | 74,506 | ||||||
Broadridge Financial Solutions, Inc. | 1,226 | 73,045 | ||||||
Fidelity National Information Services, Inc. | 995 | 72,555 | ||||||
Total Technology | 12,116,553 | |||||||
Basic Materials - 6.3% | ||||||||
Freeport-McMoRan, Inc. | 23,571 | 277,431 | ||||||
Albemarle Corp. | 5,118 | 273,915 | ||||||
FMC Corp. | 6,704 | 272,920 | ||||||
Celanese Corp. — Class A | 3,821 | 271,482 | ||||||
Newmont Mining Corp. | 13,924 | 270,961 | ||||||
Sherwin-Williams Co. | 1,015 | 270,832 | ||||||
Westlake Chemical Corp. | 4,361 | 262,837 | ||||||
Domtar Corp. | 6,267 | 258,451 | ||||||
Cabot Corp. | 7,183 | 258,157 | ||||||
Valspar Corp. | 3,170 | 256,612 | ||||||
International Paper Co. | 5,969 | 254,817 | ||||||
Nucor Corp. | 5,998 | 253,715 | ||||||
International Flavors & Fragrances, Inc. | 2,185 | 253,591 | ||||||
CF Industries Holdings, Inc. | 4,982 | 252,936 | ||||||
Reliance Steel & Aluminum Co. | 4,206 | 252,192 | ||||||
Eastman Chemical Co. | 3,469 | 250,358 | ||||||
United States Steel Corp. | 21,408 | 250,045 | ||||||
Steel Dynamics, Inc. | 13,391 | 247,332 | ||||||
RPM International, Inc. | 5,383 | 246,057 | ||||||
NewMarket Corp. | 624 | 245,694 | ||||||
Airgas, Inc. | 2,545 | 244,727 | ||||||
Axalta Coating Systems Ltd.* | 8,840 | 244,249 | ||||||
Mosaic Co. | 7,187 | 242,849 | ||||||
WR Grace & Co.* | 2,410 | 241,723 | ||||||
Compass Minerals International, Inc. | 2,917 | 236,977 | ||||||
Ashland, Inc. | 2,153 | 236,227 | ||||||
Cytec Industries, Inc. | 3,133 | 233,158 | ||||||
Tahoe Resources, Inc. | 27,865 | 232,673 | ||||||
Royal Gold, Inc. | 4,841 | 231,593 | ||||||
Sigma-Aldrich Corp. | 1,655 | 231,237 | ||||||
Alcoa, Inc. | 25,468 | 227,429 | ||||||
Allegheny Technologies, Inc. | 15,217 | 223,690 | ||||||
Huntsman Corp. | 16,606 | 218,701 | ||||||
Platform Specialty Products Corp.* | 16,465 | 171,895 | ||||||
Total Basic Materials | 8,397,463 | |||||||
Communications - 6.2% | ||||||||
Level 3 Communications, Inc.* | 7,357 | 374,839 | ||||||
United States Cellular Corp.* | 9,113 | 371,264 | ||||||
Telephone & Data Systems, Inc. | 12,476 | 357,313 | ||||||
CenturyLink, Inc. | 12,628 | 356,236 | ||||||
Sprint Corp.* | 74,476 | 352,271 | ||||||
Frontier Communications Corp. | 64,049 | 329,212 | ||||||
Zayo Group Holdings, Inc.* | 12,289 | 326,027 | ||||||
LinkedIn Corp. — Class A* | 773 | 186,192 | ||||||
Juniper Networks, Inc. | 5,930 | 186,143 | ||||||
VeriSign, Inc.* | 2,163 | 174,338 | ||||||
Twitter, Inc.* | 5,927 | 168,682 | ||||||
CDW Corp. | 3,676 | 164,280 | ||||||
Viavi Solutions, Inc.* | 27,156 | 161,578 | ||||||
CommScope Holding Company, Inc.* | 4,960 | 160,853 | ||||||
ARRIS Group, Inc.* | 5,674 | 160,347 | ||||||
GoDaddy, Inc. — Class A* | 5,828 | 160,153 | ||||||
EchoStar Corp. — Class A* | 3,482 | 156,098 | ||||||
Groupon, Inc. — Class A* | 41,755 | 154,912 | ||||||
Symantec Corp. | 7,468 | 153,841 | ||||||
Arista Networks, Inc.* | 2,360 | 152,244 | ||||||
Motorola Solutions, Inc. | 2,166 | 151,555 | ||||||
Yelp, Inc. — Class A* | 6,762 | 150,455 | ||||||
IAC/InterActiveCorp | 2,240 | 150,102 | ||||||
Splunk, Inc.* | 2,620 | 147,139 | ||||||
F5 Networks, Inc.* | 1,306 | 143,921 | ||||||
Palo Alto Networks, Inc.* | 829 | 133,469 | ||||||
TripAdvisor, Inc.* | 1,519 | 127,262 | ||||||
FireEye, Inc.* | 4,594 | 120,133 | ||||||
Scripps Networks Interactive, Inc. — Class A | 1,987 | 119,379 | ||||||
News Corp. — Class A | 7,729 | 119,027 | ||||||
Interpublic Group of Companies, Inc. | 5,105 | 117,058 | ||||||
TEGNA, Inc. | 4,322 | 116,867 | ||||||
HomeAway, Inc.* | 3,664 | 115,636 | ||||||
Omnicom Group, Inc. | 1,499 | 112,305 | ||||||
Tribune Media Co. — Class A | 2,735 | 110,303 | ||||||
Liberty Media Corp. — Class C* | 2,814 | 110,168 | ||||||
Expedia, Inc. | 805 | 109,722 | ||||||
Sirius XM Holdings, Inc.* | 25,931 | 105,798 | ||||||
Liberty Ventures* | 2,406 | 104,829 | ||||||
Discovery Communications, Inc. — Class A* | 3,500 | 103,040 | ||||||
John Wiley & Sons, Inc. — Class A | 1,968 | 102,985 | ||||||
Charter Communications, Inc. — Class A* | 537 | 102,534 | ||||||
Nielsen Holdings plc | 2,108 | 100,151 | ||||||
Cable One, Inc. | 231 | 100,125 | ||||||
Liberty Broadband Corp. — Class C* | 1,854 | 99,690 | ||||||
AMC Networks, Inc. — Class A* | 1,326 | 97,978 | ||||||
Clear Channel Outdoor Holdings, Inc. — Class A* | 12,864 | 96,223 | ||||||
Cablevision Systems Corp. — Class A | 2,928 | 95,424 | ||||||
Starz — Class A* | 2,536 | 84,981 | ||||||
Zillow Group, Inc. — Class A* | 2,430 | 74,868 | ||||||
FactSet Research Systems, Inc. | 423 | 74,076 | ||||||
SEE NOTES TO FINANCIAL STATEMENTS. | GUGGENHEIM ETFs ANNUAL REPORT | 43 |
SCHEDULE OF INVESTMENTS (concluded) | October 31, 2015 |
GUGGENHEIM RUSSELL MIDCAP® EQUAL WEIGHT ETF |
Shares | Value | |||||||
Zillow Group, Inc. — Class C* | 2,476 | $ | 68,560 | |||||
Pandora Media, Inc.* | 4,723 | 54,362 | ||||||
MSG Networks, Inc. — Class A* | 1,399 | 28,707 | ||||||
Total Communications | 8,255,655 | |||||||
Diversified - 0.1% | ||||||||
Leucadia National Corp. | 3,472 | 69,475 | ||||||
Total Common Stocks | ||||||||
(Cost $126,708,797) | 132,237,120 | |||||||
SHORT TERM INVESTMENTS† - 0.2% | ||||||||
Federated U.S. Treasury Cash Reserve Fund 0.00%1 | 262,059 | 262,059 | ||||||
Total Short Term Investments | ||||||||
(Cost $262,059) | 262,059 | |||||||
Total Investments - 100.0% | ||||||||
(Cost $126,970,856) | $ | 132,499,179 | ||||||
Other Assets & Liabilities, net - 0.0% | 32,410 | |||||||
Total Net Assets - 100.0% | $ | 132,531,589 | ||||||
* | Non-income producing security. |
† | Value determined based on Level 1 inputs — See Note 4. |
1 | Rate indicated is the 7 day yield as of October 31, 2015. |
plc — Public Limited Company | |
REIT — Real Estate Investment Trust | |
See Sector Classification in Other Information section. |
The following table summarizes the inputs used to value the Fund's net assets at October 31, 2015 (See Note 4 in the Notes to Financial Statements):
Investments in Securities | Level 1 | Level 2 | Level 3 | Total | ||||||||||||
Common Stocks | $ | 132,237,120 | $ | — | $ | — | $ | 132,237,120 | ||||||||
Short Term Investments | 262,059 | — | — | 262,059 | ||||||||||||
Total | $ | 132,499,179 | $ | — | $ | — | $ | 132,499,179 | ||||||||
For the year ended October 31, 2015, there were no transfers between levels.
44 | GUGGENHEIM ETFs ANNUAL REPORT | SEE NOTES TO FINANCIAL STATEMENTS. |
SCHEDULE OF INVESTMENTS | October 31, 2015 |
GUGGENHEIM RUSSELL 1000® EQUAL WEIGHT ETF |
Shares | Value | |||||||
COMMON STOCKS† - 99.8% | ||||||||
Consumer, Non-cyclical - 22.6% | ||||||||
Mead Johnson Nutrition Co. — Class A | 2,080 | $ | 170,560 | |||||
Dr Pepper Snapple Group, Inc. | 1,902 | 169,983 | ||||||
Reynolds American, Inc. | 3,461 | 167,236 | ||||||
Altria Group, Inc. | 2,715 | 164,176 | ||||||
Kimberly-Clark Corp. | 1,369 | 163,883 | ||||||
Philip Morris International, Inc. | 1,846 | 163,186 | ||||||
PepsiCo, Inc. | 1,592 | 162,686 | ||||||
Ingredion, Inc. | 1,705 | 162,076 | ||||||
Hormel Foods Corp. | 2,392 | 161,579 | ||||||
Mondelez International, Inc. — Class A | 3,477 | 160,498 | ||||||
Archer-Daniels-Midland Co. | 3,515 | 160,495 | ||||||
Molson Coors Brewing Co. — Class B | 1,809 | 159,373 | ||||||
Coca-Cola Co. | 3,755 | 159,024 | ||||||
Brown-Forman Corp. — Class B | 1,494 | 158,633 | ||||||
Kraft Heinz Co. | 2,029 | 158,201 | ||||||
Flowers Foods, Inc. | 5,859 | 158,193 | ||||||
Coca-Cola Enterprises, Inc. | 3,059 | 157,049 | ||||||
Colgate-Palmolive Co. | 2,357 | 156,388 | ||||||
Procter & Gamble Co. | 2,047 | 156,350 | ||||||
Clorox Co. | 1,281 | 156,205 | ||||||
Kroger Co. | 4,121 | 155,774 | ||||||
Herbalife Ltd.* | 2,779 | 155,735 | ||||||
Edgewell Personal Care Co. | 1,825 | 154,596 | ||||||
Sysco Corp. | 3,746 | 154,523 | ||||||
Constellation Brands, Inc. — Class A | 1,145 | 154,346 | ||||||
Kellogg Co. | 2,182 | 153,875 | ||||||
Spectrum Brands Holdings, Inc. | 1,599 | 153,264 | ||||||
JM Smucker Co. | 1,301 | 152,724 | ||||||
Bunge Ltd. | 2,092 | 152,632 | ||||||
Tyson Foods, Inc. — Class A | 3,433 | 152,288 | ||||||
General Mills, Inc. | 2,592 | 150,621 | ||||||
McCormick & Company, Inc. | 1,783 | 149,736 | ||||||
Church & Dwight Company, Inc. | 1,738 | 149,624 | ||||||
Monster Beverage Corp.* | 1,092 | 148,861 | ||||||
Pinnacle Foods, Inc. | 3,345 | 147,448 | ||||||
Campbell Soup Co. | 2,881 | 146,326 | ||||||
ConAgra Foods, Inc. | 3,582 | 145,250 | ||||||
Whole Foods Market, Inc. | 4,785 | 143,359 | ||||||
Hershey Co. | 1,608 | 142,614 | ||||||
Blue Buffalo Pet Products, Inc.* | 7,839 | 140,632 | ||||||
Sprouts Farmers Market, Inc.* | 6,885 | 140,316 | ||||||
Hain Celestial Group, Inc.* | 2,770 | 138,085 | ||||||
WhiteWave Foods Co. — Class A* | 3,352 | 137,365 | ||||||
Keurig Green Mountain, Inc. | 2,679 | 135,959 | ||||||
Pilgrim’s Pride Corp. | 7,098 | 134,791 | ||||||
Juno Therapeutics, Inc.* | 1,866 | 96,585 | ||||||
Vertex Pharmaceuticals, Inc.* | 720 | 89,814 | ||||||
Alexion Pharmaceuticals, Inc.* | 499 | 87,824 | ||||||
DENTSPLY International, Inc. | 1,434 | 87,259 | ||||||
Alkermes plc* | 1,207 | 86,806 | ||||||
Henry Schein, Inc.* | 567 | 86,019 | ||||||
Align Technology, Inc.* | 1,314 | 86,014 | ||||||
Edwards Lifesciences Corp.* | 541 | 85,018 | ||||||
Amgen, Inc. | 536 | 84,784 | ||||||
Regeneron Pharmaceuticals, Inc.* | 152 | 84,723 | ||||||
ResMed, Inc. | 1,467 | 84,514 | ||||||
Celgene Corp.* | 686 | 84,179 | ||||||
Boston Scientific Corp.* | 4,562 | 83,393 | ||||||
Sirona Dental Systems, Inc.* | 760 | 82,939 | ||||||
Allergan plc* | 268 | 82,670 | ||||||
Medtronic plc | 1,118 | 82,643 | ||||||
Johnson & Johnson | 818 | 82,643 | ||||||
Zimmer Biomet Holdings, Inc. | 788 | 82,401 | ||||||
Incyte Corp.* | 698 | 82,036 | ||||||
Merck & Company, Inc. | 1,500 | 81,990 | ||||||
Bristol-Myers Squibb Co. | 1,240 | 81,778 | ||||||
Abbott Laboratories | 1,821 | 81,581 | ||||||
Isis Pharmaceuticals, Inc.* | 1,693 | 81,518 | ||||||
Laboratory Corporation of America Holdings* | 658 | 80,763 | ||||||
Baxter International, Inc. | 2,159 | 80,725 | ||||||
Gilead Sciences, Inc. | 742 | 80,232 | ||||||
Bruker Corp.* | 4,360 | 80,093 | ||||||
BioMarin Pharmaceutical, Inc.* | 684 | 80,055 | ||||||
VWR Corp.* | 2,897 | 79,697 | ||||||
Patterson Companies, Inc. | 1,679 | 79,585 | ||||||
AbbVie, Inc. | 1,335 | 79,499 | ||||||
Express Scripts Holding Co.* | 920 | 79,470 | ||||||
United Therapeutics Corp.* | 541 | 79,327 | ||||||
DaVita HealthCare Partners, Inc.* | 1,021 | 79,138 | ||||||
Pfizer, Inc. | 2,332 | 78,868 | ||||||
Quest Diagnostics, Inc. | 1,160 | 78,822 | ||||||
Seattle Genetics, Inc.* | 1,892 | 78,499 | ||||||
Intuitive Surgical, Inc.* | 157 | 77,966 | ||||||
Becton Dickinson and Co. | 546 | 77,816 | ||||||
Baxalta, Inc. | 2,257 | 77,776 | ||||||
Varian Medical Systems, Inc.* | 989 | 77,666 | ||||||
OPKO Health, Inc.* | 8,194 | 77,433 | ||||||
Cardinal Health, Inc. | 935 | 76,858 | ||||||
Bio-Rad Laboratories, Inc. — Class A* | 551 | 76,853 | ||||||
Alnylam Pharmaceuticals, Inc.* | 888 | 76,324 | ||||||
Aetna, Inc. | 664 | 76,213 | ||||||
Teleflex, Inc. | 572 | 76,076 | ||||||
Health Net, Inc.* | 1,181 | 75,891 | ||||||
Biogen, Inc.* | 261 | 75,823 | ||||||
Jazz Pharmaceuticals plc* | 552 | 75,779 | ||||||
Cooper Companies, Inc. | 497 | 75,723 | ||||||
Centene Corp.* | 1,269 | 75,480 | ||||||
UnitedHealth Group, Inc. | 640 | 75,379 | ||||||
Zoetis, Inc. | 1,751 | 75,311 | ||||||
Mylan N.V.* | 1,706 | 75,217 | ||||||
Medivation, Inc.* | 1,786 | 75,119 | ||||||
VCA, Inc.* | 1,371 | 75,090 | ||||||
Charles River Laboratories International, Inc.* | 1,149 | 74,961 | ||||||
SEE NOTES TO FINANCIAL STATEMENTS. | GUGGENHEIM ETFs ANNUAL REPORT | 45 |
SCHEDULE OF INVESTMENTS (continued) | October 31, 2015 |
GUGGENHEIM RUSSELL 1000® EQUAL WEIGHT ETF |
Shares | Value | |||||||
Puma Biotechnology, Inc.* | 908 | $ | 74,837 | |||||
Humana, Inc. | 411 | 73,417 | ||||||
Stryker Corp. | 767 | 73,341 | ||||||
St. Jude Medical, Inc. | 1,147 | 73,190 | ||||||
Anthem, Inc. | 524 | 72,915 | ||||||
Perrigo Company plc | 462 | 72,876 | ||||||
Premier, Inc. — Class A* | 2,151 | 72,725 | ||||||
Bio-Techne Corp. | 824 | 72,677 | ||||||
Cigna Corp. | 541 | 72,516 | ||||||
Hologic, Inc.* | 1,861 | 72,318 | ||||||
AmerisourceBergen Corp. — Class A | 748 | 72,189 | ||||||
Eli Lilly & Co. | 884 | 72,108 | ||||||
CR Bard, Inc. | 386 | 71,931 | ||||||
Mallinckrodt plc* | 1,086 | 71,318 | ||||||
Hill-Rom Holdings, Inc. | 1,352 | 71,237 | ||||||
LifePoint Health, Inc.* | 1,021 | 70,327 | ||||||
Alere, Inc.* | 1,519 | 70,057 | ||||||
Universal Health Services, Inc. — Class B | 572 | 69,836 | ||||||
QIAGEN N.V.* | 2,883 | 69,682 | ||||||
McKesson Corp. | 388 | 69,374 | ||||||
Gartner, Inc.* | 765 | 69,362 | ||||||
Sabre Corp. | 2,361 | 69,225 | ||||||
Intercept Pharmaceuticals, Inc.* | 438 | 68,854 | ||||||
IDEXX Laboratories, Inc.* | 999 | 68,551 | ||||||
DexCom, Inc.* | 808 | 67,323 | ||||||
Agios Pharmaceuticals, Inc.* | 921 | 67,104 | ||||||
United Rentals, Inc.* | 888 | 66,475 | ||||||
CoStar Group, Inc.* | 326 | 66,200 | ||||||
Acadia Healthcare Company, Inc.* | 1,057 | 64,910 | ||||||
Endo International plc* | 1,081 | 64,849 | ||||||
Quintiles Transnational Holdings, Inc.* | 1,014 | 64,541 | ||||||
HCA Holdings, Inc.* | 937 | 64,456 | ||||||
MEDNAX, Inc.* | 912 | 64,268 | ||||||
RR Donnelley & Sons Co. | 3,799 | 64,089 | ||||||
Avery Dennison Corp. | 984 | 63,930 | ||||||
Brookdale Senior Living, Inc. — Class A* | 3,050 | 63,776 | ||||||
Intrexon Corp.* | 1,892 | 63,571 | ||||||
Akorn, Inc.* | 2,321 | 62,064 | ||||||
ManpowerGroup, Inc. | 672 | 61,676 | ||||||
Danaher Corp. | 653 | 60,931 | ||||||
Illumina, Inc.* | 423 | 60,607 | ||||||
Booz Allen Hamilton Holding Corp. | 2,054 | 60,511 | ||||||
Automatic Data Processing, Inc. | 695 | 60,459 | ||||||
ADT Corp. | 1,817 | 60,034 | ||||||
Cintas Corp. | 631 | 58,740 | ||||||
Robert Half International, Inc. | 1,103 | 58,084 | ||||||
Macquarie Infrastructure Corp. | 728 | 57,912 | ||||||
Tenet Healthcare Corp.* | 1,836 | 57,595 | ||||||
Towers Watson & Co. — Class A | 464 | 57,332 | ||||||
Bluebird Bio, Inc.* | 742 | 57,230 | ||||||
Rollins, Inc. | 2,025 | 54,311 | ||||||
Verisk Analytics, Inc. — Class A* | 757 | 54,209 | ||||||
Envision Healthcare Holdings, Inc.* | 1,899 | 53,552 | ||||||
Avon Products, Inc. | 12,715 | 51,241 | ||||||
Live Nation Entertainment, Inc.* | 1,800 | 49,104 | ||||||
Avis Budget Group, Inc.* | 975 | 48,692 | ||||||
Hertz Global Holdings, Inc.* | 2,432 | 47,424 | ||||||
Coty, Inc. — Class A | 1,633 | 47,275 | ||||||
Community Health Systems, Inc.* | 1,671 | 46,855 | ||||||
ServiceMaster Global Holdings, Inc.* | 1,307 | 46,595 | ||||||
KAR Auction Services, Inc. | 1,211 | 46,502 | ||||||
Quanta Services, Inc.* | 2,289 | 46,032 | ||||||
H&R Block, Inc. | 1,217 | 45,345 | ||||||
Service Corporation International | 1,592 | 44,990 | ||||||
Estee Lauder Companies, Inc. — Class A | 550 | 44,253 | ||||||
Aramark | 1,408 | 42,733 | ||||||
Graham Holdings Co. — Class B | 75 | 41,435 | ||||||
Global Payments, Inc. | 270 | 36,831 | ||||||
Total System Services, Inc. | 670 | 35,142 | ||||||
Equifax, Inc. | 325 | 34,635 | ||||||
MasterCard, Inc. — Class A | 346 | 34,251 | ||||||
SEI Investments Co. | 656 | 33,994 | ||||||
Vantiv, Inc. — Class A* | 676 | 33,901 | ||||||
PayPal Holdings, Inc.* | 937 | 33,741 | ||||||
Western Union Co. | 1,732 | 33,341 | ||||||
McGraw Hill Financial, Inc. | 354 | 32,795 | ||||||
Morningstar, Inc. | 388 | 31,859 | ||||||
TransUnion* | 1,237 | 31,803 | ||||||
WEX, Inc.* | 352 | 31,648 | ||||||
FleetCor Technologies, Inc.* | 211 | 30,565 | ||||||
Moody’s Corp. | 315 | 30,290 | ||||||
Aaron’s, Inc. | 1,173 | 28,938 | ||||||
Total Consumer, Non-cyclical | 16,218,988 | |||||||
Industrial - 13.9% | ||||||||
Energizer Holdings, Inc. | 3,696 | 158,300 | ||||||
Acuity Brands, Inc. | 598 | 130,723 | ||||||
Timken Co. | 3,890 | 122,924 | ||||||
SunPower Corp. — Class A* | 4,529 | 121,558 | ||||||
Bemis Company, Inc. | 2,639 | 120,813 | ||||||
Crown Holdings, Inc.* | 2,274 | 120,613 | ||||||
Ingersoll-Rand plc | 2,008 | 118,994 | ||||||
Sonoco Products Co. | 2,783 | 118,806 | ||||||
Lennox International, Inc. | 891 | 118,334 | ||||||
AptarGroup, Inc. | 1,608 | 118,284 | ||||||
Packaging Corporation of America | 1,720 | 117,734 | ||||||
Valmont Industries, Inc. | 1,082 | 117,332 | ||||||
Masco Corp. | 4,024 | 116,696 | ||||||
Ball Corp. | 1,680 | 115,080 | ||||||
Graphic Packaging Holding Co. | 7,861 | 111,312 | ||||||
Vulcan Materials Co. | 1,145 | 110,585 | ||||||
Sealed Air Corp. | 2,247 | 110,373 | ||||||
WestRock Co. | 2,029 | 109,079 | ||||||
Hexcel Corp. | 2,339 | 108,342 | ||||||
Owens Corning | 2,367 | 107,771 | ||||||
Owens-Illinois, Inc.* | 4,991 | 107,556 | ||||||
46 | GUGGENHEIM ETFs ANNUAL REPORT | SEE NOTES TO FINANCIAL STATEMENTS. |
SCHEDULE OF INVESTMENTS (continued) | October 31, 2015 |
GUGGENHEIM RUSSELL 1000® EQUAL WEIGHT ETF |
Shares | Value | |||||||
Precision Castparts Corp. | 460 | $ | 106,173 | |||||
Silgan Holdings, Inc. | 2,061 | 104,843 | ||||||
Armstrong World Industries, Inc.* | 2,078 | 103,110 | ||||||
Martin Marietta Materials, Inc. | 661 | 102,554 | ||||||
Eagle Materials, Inc. | 1,445 | 95,413 | ||||||
Golar LNG Ltd. | 3,107 | 90,135 | ||||||
USG Corp.* | 3,790 | 89,330 | ||||||
PerkinElmer, Inc. | 1,627 | 84,018 | ||||||
Agilent Technologies, Inc. | 2,159 | 81,524 | ||||||
Thermo Fisher Scientific, Inc. | 606 | 79,253 | ||||||
Trimble Navigation Ltd.* | 3,449 | 78,465 | ||||||
SBA Communications Corp. — Class A* | 623 | 74,150 | ||||||
Corning, Inc. | 3,983 | 74,084 | ||||||
Cognex Corp. | 1,943 | 73,057 | ||||||
Avnet, Inc. | 1,596 | 72,506 | ||||||
Harris Corp. | 913 | 72,246 | ||||||
Amphenol Corp. — Class A | 1,304 | 70,703 | ||||||
Jabil Circuit, Inc. | 3,016 | 69,308 | ||||||
Arrow Electronics, Inc.* | 1,241 | 68,243 | ||||||
L-3 Communications Holdings, Inc. | 536 | 67,750 | ||||||
Roper Technologies, Inc. | 362 | 67,459 | ||||||
ITT Corp. | 1,656 | 65,545 | ||||||
Orbital ATK, Inc. | 762 | 65,242 | ||||||
Terex Corp. | 3,252 | 65,235 | ||||||
General Electric Co. | 2,240 | 64,781 | ||||||
Nordson Corp. | 895 | 63,760 | ||||||
Oshkosh Corp. | 1,545 | 63,484 | ||||||
Flowserve Corp. | 1,369 | 63,467 | ||||||
Hubbell, Inc. — Class B | 655 | 63,437 | ||||||
Huntington Ingalls Industries, Inc. | 528 | 63,328 | ||||||
Fluor Corp. | 1,324 | 63,300 | ||||||
Kennametal, Inc. | 2,248 | 63,214 | ||||||
AO Smith Corp. | 822 | 63,146 | ||||||
KBR, Inc. | 3,424 | 63,138 | ||||||
Northrop Grumman Corp. | 336 | 63,084 | ||||||
Boeing Co. | 425 | 62,930 | ||||||
United Technologies Corp. | 639 | 62,884 | ||||||
Joy Global, Inc. | 3,655 | 62,793 | ||||||
3M Co. | 399 | 62,727 | ||||||
Crane Co. | 1,191 | 62,694 | ||||||
Trinity Industries, Inc. | 2,316 | 62,694 | ||||||
National Instruments Corp. | 2,056 | 62,647 | ||||||
Caterpillar, Inc. | 858 | 62,625 | ||||||
Xylem, Inc. | 1,719 | 62,589 | ||||||
Waste Connections, Inc. | 1,148 | 62,543 | ||||||
Lincoln Electric Holdings, Inc. | 1,045 | 62,501 | ||||||
Illinois Tool Works, Inc. | 678 | 62,335 | ||||||
AECOM* | 2,112 | 62,241 | ||||||
Genesee & Wyoming, Inc. — Class A* | 924 | 62,001 | ||||||
BWX Technologies, Inc. | 2,188 | 61,920 | ||||||
Dover Corp. | 961 | 61,917 | ||||||
Raytheon Co. | 527 | 61,870 | ||||||
Graco, Inc. | 840 | 61,656 | ||||||
Mettler-Toledo International, Inc.* | 198 | 61,576 | ||||||
IDEX Corp. | 802 | 61,562 | ||||||
Honeywell International, Inc. | 596 | 61,555 | ||||||
Textron, Inc. | 1,459 | 61,526 | ||||||
Chicago Bridge & Iron Company N.V. | 1,367 | 61,337 | ||||||
Regal Beloit Corp. | 961 | 61,302 | ||||||
Allegion plc | 936 | 60,999 | ||||||
Waters Corp.* | 477 | 60,961 | ||||||
Rockwell Automation, Inc. | 557 | 60,802 | ||||||
Lockheed Martin Corp. | 275 | 60,453 | ||||||
Parker-Hannifin Corp. | 577 | 60,412 | ||||||
FedEx Corp. | 387 | 60,391 | ||||||
Middleby Corp.* | 516 | 60,341 | ||||||
Triumph Group, Inc. | 1,293 | 60,228 | ||||||
Emerson Electric Co. | 1,275 | 60,218 | ||||||
Eaton Corporation plc | 1,075 | 60,103 | ||||||
Stanley Black & Decker, Inc. | 567 | 60,091 | ||||||
Pentair plc | 1,074 | 60,058 | ||||||
Snap-on, Inc. | 362 | 60,052 | ||||||
General Dynamics Corp. | 404 | 60,026 | ||||||
Jacobs Engineering Group, Inc.* | 1,492 | 59,889 | ||||||
Waste Management, Inc. | 1,108 | 59,566 | ||||||
Keysight Technologies, Inc.* | 1,800 | 59,544 | ||||||
Rockwell Collins, Inc. | 686 | 59,490 | ||||||
Donaldson Company, Inc. | 1,966 | 59,373 | ||||||
Expeditors International of Washington, Inc. | 1,192 | 59,350 | ||||||
Kirby Corp.* | 908 | 59,283 | ||||||
Norfolk Southern Corp. | 739 | 59,142 | ||||||
Spirit AeroSystems Holdings, Inc. — Class A* | 1,120 | 59,069 | ||||||
Tyco International plc | 1,619 | 58,996 | ||||||
AGCO Corp. | 1,216 | 58,842 | ||||||
AMETEK, Inc. | 1,073 | 58,822 | ||||||
Republic Services, Inc. — Class A | 1,342 | 58,699 | ||||||
B/E Aerospace, Inc. | 1,246 | 58,500 | ||||||
United Parcel Service, Inc. — Class B | 564 | 58,103 | ||||||
Union Pacific Corp. | 646 | 57,720 | ||||||
Teekay Corp. | 1,794 | 57,641 | ||||||
Deere & Co. | 737 | 57,486 | ||||||
Clean Harbors, Inc.* | 1,231 | 57,229 | ||||||
J.B. Hunt Transport Services, Inc. | 749 | 57,202 | ||||||
CSX Corp. | 2,103 | 56,760 | ||||||
GATX Corp. | 1,212 | 56,600 | ||||||
CH Robinson Worldwide, Inc. | 815 | 56,545 | ||||||
Manitowoc Company, Inc. | 3,681 | 56,319 | ||||||
Old Dominion Freight Line, Inc.* | 909 | 56,303 | ||||||
Babcock & Wilcox Enterprises, Inc.* | 3,234 | 54,913 | ||||||
Zebra Technologies Corp. — Class A* | 714 | 54,907 | ||||||
TransDigm Group, Inc.* | 248 | 54,523 | ||||||
FLIR Systems, Inc. | 2,023 | 53,953 | ||||||
Ryder System, Inc. | 742 | 53,261 | ||||||
Cummins, Inc. | 506 | 52,376 | ||||||
Landstar System, Inc. | 827 | 52,134 | ||||||
Wabtec Corp. | 626 | 51,877 | ||||||
SEE NOTES TO FINANCIAL STATEMENTS. | GUGGENHEIM ETFs ANNUAL REPORT | 47 |
SCHEDULE OF INVESTMENTS (continued) | October 31, 2015 |
GUGGENHEIM RUSSELL 1000® EQUAL WEIGHT ETF |
Shares | Value | |||||||
Covanta Holding Corp. | 3,053 | $ | 51,168 | |||||
SPX FLOW, Inc.* | 1,509 | 51,155 | ||||||
Carlisle Companies, Inc. | 586 | 50,982 | ||||||
Kansas City Southern | 613 | 50,732 | ||||||
Colfax Corp.* | 1,834 | 49,445 | ||||||
TopBuild Corp.* | 1,733 | 48,749 | ||||||
Stericycle, Inc.* | 398 | 48,305 | ||||||
Gentex Corp. | 2,898 | 47,498 | ||||||
Fitbit, Inc. — Class A* | 1,167 | 47,310 | ||||||
Fortune Brands Home & Security, Inc. | 889 | 46,521 | ||||||
Garmin Ltd. | 1,237 | 43,876 | ||||||
AMERCO | 106 | 43,069 | ||||||
GoPro, Inc. — Class A* | 1,357 | 33,925 | ||||||
SPX Corp. | 1,129 | 13,830 | ||||||
Total Industrial | 9,948,236 | |||||||
Energy - 11.1% | ||||||||
California Resources Corp. | 34,246 | 138,353 | ||||||
Denbury Resources, Inc. | 35,396 | 125,302 | ||||||
First Solar, Inc.* | 2,191 | 125,041 | ||||||
QEP Resources, Inc. | 7,756 | 119,908 | ||||||
Kosmos Energy Ltd.* | 17,216 | 117,413 | ||||||
Apache Corp. | 2,483 | 117,024 | ||||||
Noble Corporation plc | 8,678 | 116,893 | ||||||
Rowan Companies plc — Class A | 5,852 | 115,167 | ||||||
Newfield Exploration Co.* | 2,849 | 114,501 | ||||||
PBF Energy, Inc. — Class A | 3,359 | 114,205 | ||||||
Helmerich & Payne, Inc. | 2,014 | 113,328 | ||||||
EOG Resources, Inc. | 1,303 | 111,863 | ||||||
Weatherford International plc* | 10,904 | 111,658 | ||||||
Laredo Petroleum, Inc.* | 9,719 | 111,574 | ||||||
Continental Resources, Inc.* | 3,283 | 111,327 | ||||||
Chevron Corp. | 1,221 | 110,965 | ||||||
Marathon Oil Corp. | 6,023 | 110,703 | ||||||
Energen Corp. | 1,897 | 110,311 | ||||||
Cimarex Energy Co. | 932 | 110,032 | ||||||
Concho Resources, Inc.* | 941 | 109,071 | ||||||
Murphy Oil Corp. | 3,833 | 108,972 | ||||||
Ensco plc — Class A | 6,547 | 108,877 | ||||||
Phillips 66 | 1,217 | 108,374 | ||||||
Noble Energy, Inc. | 3,000 | 107,520 | ||||||
ConocoPhillips | 2,011 | 107,287 | ||||||
Exxon Mobil Corp. | 1,295 | 107,148 | ||||||
Occidental Petroleum Corp. | 1,434 | 106,890 | ||||||
RPC, Inc. | 9,660 | 106,550 | ||||||
Pioneer Natural Resources Co. | 775 | 106,284 | ||||||
Hess Corp. | 1,887 | 106,068 | ||||||
Diamondback Energy, Inc.* | 1,436 | 106,034 | ||||||
TerraForm Power, Inc. — Class A | 5,799 | 105,832 | ||||||
Antero Resources Corp.* | 4,409 | 103,920 | ||||||
Marathon Petroleum Corp. | 2,005 | 103,859 | ||||||
Columbia Pipeline Group, Inc. | 4,995 | 103,746 | ||||||
Devon Energy Corp. | 2,466 | 103,399 | ||||||
Valero Energy Corp. | 1,560 | 102,835 | ||||||
Diamond Offshore Drilling, Inc. | 5,172 | 102,819 | ||||||
Cobalt International Energy, Inc.* | 13,380 | 102,625 | ||||||
CVR Energy, Inc. | 2,303 | 102,391 | ||||||
Frank’s International N.V. | 5,944 | 101,999 | ||||||
Schlumberger Ltd. | 1,301 | 101,686 | ||||||
Whiting Petroleum Corp.* | 5,877 | 101,261 | ||||||
Anadarko Petroleum Corp. | 1,514 | 101,256 | ||||||
Patterson-UTI Energy, Inc. | 6,790 | 101,103 | ||||||
Cameron International Corp.* | 1,481 | 100,722 | ||||||
Targa Resources Corp. | 1,756 | 100,355 | ||||||
Tesoro Corp. | 935 | 99,980 | ||||||
Oceaneering International, Inc. | 2,378 | 99,924 | ||||||
NOW, Inc.* | 6,027 | 99,506 | ||||||
SM Energy Co. | 2,978 | 99,316 | ||||||
Seadrill Ltd.* | 15,350 | 99,315 | ||||||
Halliburton Co. | 2,585 | 99,212 | ||||||
EP Energy Corp. — Class A* | 17,967 | 98,998 | ||||||
Superior Energy Services, Inc. | 6,965 | 98,624 | ||||||
FMC Technologies, Inc.* | 2,889 | 97,735 | ||||||
Spectra Energy Corp. | 3,417 | 97,624 | ||||||
Cheniere Energy, Inc.* | 1,955 | 96,812 | ||||||
WPX Energy, Inc.* | 14,095 | 96,692 | ||||||
National Oilwell Varco, Inc. | 2,534 | 95,380 | ||||||
Baker Hughes, Inc. | 1,808 | 95,245 | ||||||
Nabors Industries Ltd. | 9,486 | 95,239 | ||||||
Dril-Quip, Inc.* | 1,544 | 95,049 | ||||||
HollyFrontier Corp. | 1,906 | 93,337 | ||||||
Memorial Resource Development Corp.* | 5,273 | 93,279 | ||||||
Gulfport Energy Corp.* | 3,058 | 93,177 | ||||||
Chesapeake Energy Corp. | 12,837 | 91,528 | ||||||
ONEOK, Inc. | 2,691 | 91,279 | ||||||
Williams Companies, Inc. | 2,280 | 89,923 | ||||||
Equities Corp. | 1,355 | 89,525 | ||||||
Kinder Morgan, Inc. | 3,225 | 88,204 | ||||||
Cabot Oil & Gas Corp. — Class A | 3,982 | 86,449 | ||||||
Range Resources Corp. | 2,710 | 82,492 | ||||||
Rice Energy, Inc.* | 5,326 | 81,275 | ||||||
Southwestern Energy Co.* | 7,303 | 80,625 | ||||||
SolarCity Corp.* | 2,296 | 68,076 | ||||||
CONSOL Energy, Inc. | 9,086 | 60,513 | ||||||
SunEdison, Inc.* | 7,764 | 56,677 | ||||||
Murphy USA, Inc.* | 785 | 48,175 | ||||||
Total Energy | 7,993,636 | |||||||
Consumer, Cyclical - 10.3% | ||||||||
Rite Aid Corp.* | 21,883 | 172,438 | ||||||
CVS Health Corp. | 1,509 | 149,059 | ||||||
Walgreens Boots Alliance, Inc. | 1,745 | 147,767 | ||||||
Nu Skin Enterprises, Inc. — Class A | 3,610 | 137,938 | ||||||
Scotts Miracle-Gro Co. — Class A | 1,765 | 116,773 | ||||||
World Fuel Services Corp. | 2,618 | 116,396 | ||||||
Fastenal Co. | 2,872 | 112,468 | ||||||
48 | GUGGENHEIM ETFs ANNUAL REPORT | SEE NOTES TO FINANCIAL STATEMENTS. |
SCHEDULE OF INVESTMENTS (continued) | October 31, 2015 |
GUGGENHEIM RUSSELL 1000® EQUAL WEIGHT ETF |
Shares | Value | |||||||
GNC Holdings, Inc. — Class A | 3,555 | $ | 105,761 | |||||
Watsco, Inc. | 853 | 104,945 | ||||||
Ingram Micro, Inc. — Class A | 2,465 | 73,408 | ||||||
Dolby Laboratories, Inc. — Class A | 2,101 | 72,841 | ||||||
Copa Holdings S.A. — Class A | 1,376 | 69,515 | ||||||
Southwest Airlines Co. | 1,464 | 67,769 | ||||||
American Airlines Group, Inc. | 1,386 | 64,061 | ||||||
Delta Air Lines, Inc. | 1,212 | 61,618 | ||||||
Allison Transmission Holdings, Inc. | 2,129 | 61,102 | ||||||
United Continental Holdings, Inc.* | 1,006 | 60,672 | ||||||
Copart, Inc.* | 1,632 | 59,095 | ||||||
Toro Co. | 783 | 58,936 | ||||||
MSC Industrial Direct Company, Inc. — Class A | 897 | 56,304 | ||||||
PACCAR, Inc. | 1,050 | 55,283 | ||||||
WESCO International, Inc.* | 1,128 | 55,193 | ||||||
HD Supply Holdings, Inc.* | 1,846 | 54,992 | ||||||
WW Grainger, Inc. | 261 | 54,810 | ||||||
Alaska Air Group, Inc. | 691 | 52,689 | ||||||
Wynn Resorts Ltd. | 753 | 52,672 | ||||||
Las Vegas Sands Corp. | 1,054 | 52,184 | ||||||
General Motors Co. | 1,492 | 52,086 | ||||||
JetBlue Airways Corp.* | 2,094 | 52,015 | ||||||
Tupperware Brands Corp. | 877 | 51,629 | ||||||
Lear Corp. | 412 | 51,524 | ||||||
MGM Resorts International* | 2,219 | 51,459 | ||||||
Starwood Hotels & Resorts Worldwide, Inc. | 642 | 51,276 | ||||||
Harman International Industries, Inc. | 464 | 51,021 | ||||||
McDonald’s Corp. | 449 | 50,399 | ||||||
Extended Stay America, Inc. | 2,606 | 50,035 | ||||||
Marriott International, Inc. — Class A | 650 | 49,907 | ||||||
Delphi Automotive plc | 598 | 49,748 | ||||||
Johnson Controls, Inc. | 1,098 | 49,608 | ||||||
GameStop Corp. — Class A | 1,070 | 49,295 | ||||||
Six Flags Entertainment Corp. | 946 | 49,230 | ||||||
Brunswick Corp. | 912 | 49,075 | ||||||
Advance Auto Parts, Inc. | 247 | 49,012 | ||||||
Wyndham Worldwide Corp. | 602 | 48,973 | ||||||
Goodyear Tire & Rubber Co. | 1,475 | 48,439 | ||||||
Tractor Supply Co. | 522 | 48,228 | ||||||
Coach, Inc. | 1,541 | 48,078 | ||||||
O’Reilly Automotive, Inc.* | 174 | 48,069 | ||||||
Office Depot, Inc.* | 6,302 | 48,021 | ||||||
Ford Motor Co. | 3,242 | 48,014 | ||||||
Cinemark Holdings, Inc. | 1,351 | 47,880 | ||||||
Costco Wholesale Corp. | 302 | 47,752 | ||||||
Hanesbrands, Inc. | 1,494 | 47,719 | ||||||
Choice Hotels International, Inc. | 912 | 47,707 | ||||||
WABCO Holdings, Inc.* | 425 | 47,698 | ||||||
Mattel, Inc. | 1,938 | 47,636 | ||||||
Genuine Parts Co. | 523 | 47,467 | ||||||
Hilton Worldwide Holdings, Inc. | 1,899 | 47,456 | ||||||
Visteon Corp.* | 435 | 47,445 | ||||||
Leggett & Platt, Inc. | 1,053 | 47,417 | ||||||
Regal Entertainment Group — Class A | 2,445 | 47,384 | ||||||
Royal Caribbean Cruises Ltd. | 481 | 47,307 | ||||||
Signet Jewelers Ltd. | 313 | 47,244 | ||||||
Lowe’s Companies, Inc. | 639 | 47,177 | ||||||
BorgWarner, Inc. | 1,096 | 46,931 | ||||||
Carnival Corp. | 865 | 46,779 | ||||||
Tiffany & Co. | 566 | 46,661 | ||||||
AutoNation, Inc.* | 738 | 46,634 | ||||||
Starbucks Corp. | 745 | 46,614 | ||||||
Home Depot, Inc. | 376 | 46,489 | ||||||
Staples, Inc. | 3,547 | 46,076 | ||||||
Thor Industries, Inc. | 850 | 45,968 | ||||||
Hyatt Hotels Corp. — Class A* | 909 | 45,814 | ||||||
L Brands, Inc. | 477 | 45,782 | ||||||
Newell Rubbermaid, Inc. | 1,079 | 45,782 | ||||||
CST Brands, Inc. | 1,271 | 45,667 | ||||||
AutoZone, Inc.* | 58 | 45,496 | ||||||
NIKE, Inc. — Class B | 346 | 45,336 | ||||||
Whirlpool Corp. | 283 | 45,320 | ||||||
TJX Companies, Inc. | 619 | 45,305 | ||||||
Norwegian Cruise Line Holdings Ltd.* | 712 | 45,297 | ||||||
Ross Stores, Inc. | 894 | 45,219 | ||||||
Wendy’s Co. | 4,929 | 45,150 | ||||||
Hasbro, Inc. | 586 | 45,022 | ||||||
Liberty Interactive Corporation QVC Group — Class A* | 1,640 | 44,887 | ||||||
Ralph Lauren Corp. — Class A | 405 | 44,862 | ||||||
Lions Gate Entertainment Corp. | 1,150 | 44,816 | ||||||
Mohawk Industries, Inc.* | 229 | 44,770 | ||||||
LKQ Corp.* | 1,506 | 44,593 | ||||||
Ulta Salon Cosmetics & Fragrance, Inc.* | 255 | 44,360 | ||||||
NVR, Inc.* | 27 | 44,220 | ||||||
Tempur Sealy International, Inc.* | 568 | 44,213 | ||||||
Toll Brothers, Inc.* | 1,217 | 43,775 | ||||||
Bed Bath & Beyond, Inc.* | 734 | 43,768 | ||||||
Michaels Companies, Inc.* | 1,872 | 43,767 | ||||||
Dillard’s, Inc. — Class A | 489 | 43,756 | ||||||
Lennar Corp. — Class A | 869 | 43,512 | ||||||
Vista Outdoor, Inc.* | 972 | 43,468 | ||||||
Penske Automotive Group, Inc. | 890 | 43,468 | ||||||
CarMax, Inc.* | 733 | 43,254 | ||||||
Target Corp. | 555 | 42,835 | ||||||
International Game Technology plc | 2,638 | 42,788 | ||||||
Urban Outfitters, Inc.* | 1,492 | 42,671 | ||||||
JC Penney Company, Inc.* | 4,651 | 42,650 | ||||||
Sally Beauty Holdings, Inc.* | 1,811 | 42,577 | ||||||
Macy’s, Inc. | 835 | 42,568 | ||||||
Spirit Airlines, Inc.* | 1,144 | 42,465 | ||||||
Kohl’s Corp. | 919 | 42,384 | ||||||
VF Corp. | 625 | 42,200 | ||||||
Carter’s, Inc. | 464 | 42,168 | ||||||
Best Buy Company, Inc. | 1,202 | 42,106 | ||||||
SEE NOTES TO FINANCIAL STATEMENTS. | GUGGENHEIM ETFs ANNUAL REPORT | 49 |
SCHEDULE OF INVESTMENTS (continued) | October 31, 2015 |
GUGGENHEIM RUSSELL 1000® EQUAL WEIGHT ETF |
Shares | Value | |||||||
Fossil Group, Inc.* | 769 | $ | 41,841 | |||||
Williams-Sonoma, Inc. | 564 | 41,595 | ||||||
Sears Holdings Corp.* | 1,779 | 41,575 | ||||||
DR Horton, Inc. | 1,410 | 41,510 | ||||||
Domino’s Pizza, Inc. | 389 | 41,495 | ||||||
Dollar General Corp. | 611 | 41,407 | ||||||
lululemon athletica, Inc.* | 834 | 41,008 | ||||||
Dollar Tree, Inc.* | 625 | 40,931 | ||||||
Panera Bread Co. — Class A* | 230 | 40,795 | ||||||
DSW, Inc. — Class A | 1,635 | 40,777 | ||||||
Kate Spade & Co.* | 2,266 | 40,720 | ||||||
PulteGroup, Inc. | 2,198 | 40,289 | ||||||
Harley-Davidson, Inc. | 814 | 40,252 | ||||||
Polaris Industries, Inc. | 357 | 40,105 | ||||||
Michael Kors Holdings Ltd.* | 1,034 | 39,954 | ||||||
Wal-Mart Stores, Inc. | 694 | 39,725 | ||||||
Dick’s Sporting Goods, Inc. | 891 | 39,694 | ||||||
Yum! Brands, Inc. | 559 | 39,639 | ||||||
Under Armour, Inc. — Class A* | 416 | 39,553 | ||||||
Nordstrom, Inc. | 601 | 39,191 | ||||||
Foot Locker, Inc. | 570 | 38,618 | ||||||
Darden Restaurants, Inc. | 621 | 38,434 | ||||||
Chipotle Mexican Grill, Inc. — Class A* | 60 | 38,414 | ||||||
The Gap, Inc. | 1,408 | 38,326 | ||||||
Jarden Corp.* | 855 | 38,304 | ||||||
PVH Corp. | 419 | 38,108 | ||||||
Brinker International, Inc. | 833 | 37,910 | ||||||
Madison Square Garden Co. — Class A* | 206 | 36,771 | ||||||
Dunkin’ Brands Group, Inc. | 885 | 36,648 | ||||||
Cabela’s, Inc.* | 929 | 36,389 | ||||||
Tesla Motors, Inc.* | 171 | 35,385 | ||||||
Gaming and Leisure Properties, Inc. | 1,038 | 30,278 | ||||||
Skechers U.S.A., Inc. — Class A* | 930 | 29,016 | ||||||
Total Consumer, Cyclical | 7,432,019 | |||||||
Financial - 9.9% | ||||||||
Air Lease Corp. — Class A | 1,695 | 57,138 | ||||||
Outfront Media, Inc. | 1,989 | 46,961 | ||||||
Lamar Advertising Co. — Class A | 827 | 46,669 | ||||||
BlackRock, Inc. — Class A | 105 | 36,957 | ||||||
Alliance Data Systems Corp.* | 123 | 36,569 | ||||||
Digital Realty Trust, Inc. | 494 | 36,536 | ||||||
American Tower Corp. — Class A | 357 | 36,496 | ||||||
CBRE Group, Inc. — Class A* | 970 | 36,161 | ||||||
Old Republic International Corp. | 2,002 | 36,116 | ||||||
General Growth Properties, Inc. | 1,244 | 36,013 | ||||||
Jones Lang LaSalle, Inc. | 214 | 35,676 | ||||||
Travelers Companies, Inc. | 316 | 35,673 | ||||||
Cincinnati Financial Corp. | 592 | 35,656 | ||||||
BioMed Realty Trust, Inc. | 1,513 | 35,419 | ||||||
Taubman Centers, Inc. | 458 | 35,257 | ||||||
Lincoln National Corp. | 658 | 35,209 | ||||||
American Campus Communities, Inc. | 867 | 35,173 | ||||||
Kimco Realty Corp. | 1,312 | 35,123 | ||||||
Raymond James Financial, Inc. | 637 | 35,105 | ||||||
Regency Centers Corp. | 516 | 35,067 | ||||||
Brandywine Realty Trust | 2,592 | 34,992 | ||||||
Prologis, Inc. | 818 | 34,953 | ||||||
Spirit Realty Capital, Inc. | 3,430 | 34,918 | ||||||
Vornado Realty Trust | 347 | 34,891 | ||||||
Aflac, Inc. | 547 | 34,871 | ||||||
Simon Property Group, Inc. | 173 | 34,853 | ||||||
SunTrust Banks, Inc. | 839 | 34,835 | ||||||
Macerich Co. | 411 | 34,828 | ||||||
Visa, Inc. — Class A | 448 | 34,756 | ||||||
Piedmont Office Realty Trust, Inc. — Class A | 1,792 | 34,729 | ||||||
AmTrust Financial Services, Inc. | 509 | 34,724 | ||||||
Markel Corp.* | 40 | 34,720 | ||||||
Unum Group | 1,001 | 34,685 | ||||||
ACE Ltd. | 305 | 34,630 | ||||||
American International Group, Inc. | 549 | 34,620 | ||||||
Brixmor Property Group, Inc. | 1,351 | 34,613 | ||||||
T. Rowe Price Group, Inc. | 457 | 34,558 | ||||||
Weingarten Realty Investors | 966 | 34,544 | ||||||
Forest City Enterprises, Inc. — Class A* | 1,563 | 34,542 | ||||||
DDR Corp. | 2,055 | 34,524 | ||||||
Franklin Resources, Inc. | 847 | 34,524 | ||||||
Cullen/Frost Bankers, Inc. | 504 | 34,495 | ||||||
Liberty Property Trust | 1,010 | 34,360 | ||||||
Nasdaq, Inc. | 592 | 34,270 | ||||||
Crown Castle International Corp. | 401 | 34,269 | ||||||
Boston Properties, Inc. | 272 | 34,231 | ||||||
Duke Realty Corp. | 1,652 | 34,196 | ||||||
Public Storage | 149 | 34,190 | ||||||
Corporate Office Properties Trust | 1,486 | 34,178 | ||||||
SL Green Realty Corp. | 288 | 34,163 | ||||||
Healthcare Trust of America, Inc. — Class A | 1,298 | 34,150 | ||||||
Discover Financial Services | 607 | 34,126 | ||||||
Columbia Property Trust, Inc. | 1,373 | 34,105 | ||||||
E*TRADE Financial Corp.* | 1,194 | 34,041 | ||||||
Erie Indemnity Co. — Class A | 389 | 34,022 | ||||||
White Mountains Insurance Group Ltd. | 43 | 33,970 | ||||||
WP Carey, Inc. | 536 | 33,966 | ||||||
Signature Bank* | 228 | 33,954 | ||||||
Apartment Investment & Management Co. — Class A | 866 | 33,939 | ||||||
Charles Schwab Corp. | 1,111 | 33,908 | ||||||
Intercontinental Exchange, Inc. | 134 | 33,822 | ||||||
LendingClub Corp.* | 2,385 | 33,819 | ||||||
Retail Properties of America, Inc. — Class A | 2,259 | 33,817 | ||||||
Associated Banc-Corp. | 1,748 | 33,806 | ||||||
Ameriprise Financial, Inc. | 293 | 33,800 | ||||||
MetLife, Inc. | 670 | 33,755 | ||||||
Alleghany Corp.* | 68 | 33,746 | ||||||
ProAssurance Corp. | 637 | 33,736 | ||||||
Host Hotels & Resorts, Inc. | 1,946 | 33,725 | ||||||
50 | GUGGENHEIM ETFs ANNUAL REPORT | SEE NOTES TO FINANCIAL STATEMENTS. |
SCHEDULE OF INVESTMENTS (continued) | October 31, 2015 |
GUGGENHEIM RUSSELL 1000® EQUAL WEIGHT ETF |
Shares | Value | |||||||
Federal Realty Investment Trust | 235 | $ | 33,720 | |||||
Weyerhaeuser Co. | 1,149 | 33,700 | ||||||
Hanover Insurance Group, Inc. | 400 | 33,700 | ||||||
Assured Guaranty Ltd. | 1,228 | 33,696 | ||||||
Capital One Financial Corp. | 427 | 33,690 | ||||||
Waddell & Reed Financial, Inc. — Class A | 912 | 33,689 | ||||||
TD Ameritrade Holding Corp. | 977 | 33,677 | ||||||
Synovus Financial Corp. | 1,063 | 33,623 | ||||||
Progressive Corp. | 1,014 | 33,594 | ||||||
Equity Commonwealth* | 1,170 | 33,591 | ||||||
BOK Financial Corp. | 500 | 33,590 | ||||||
Legg Mason, Inc. | 750 | 33,563 | ||||||
Equity Residential | 434 | 33,557 | ||||||
Paramount Group, Inc. | 1,887 | 33,532 | ||||||
Affiliated Managers Group, Inc.* | 186 | 33,528 | ||||||
Navient Corp. | 2,541 | 33,516 | ||||||
Aon plc | 359 | 33,498 | ||||||
CIT Group, Inc. | 779 | 33,497 | ||||||
Tanger Factory Outlet Centers, Inc. | 957 | 33,447 | ||||||
Marsh & McLennan Companies, Inc. | 600 | 33,444 | ||||||
Mercury General Corp. | 619 | 33,432 | ||||||
Prudential Financial, Inc. | 405 | 33,413 | ||||||
Eaton Vance Corp. | 925 | 33,402 | ||||||
Bank of America Corp. | 1,989 | 33,375 | ||||||
LPL Financial Holdings, Inc. | 783 | 33,356 | ||||||
Berkshire Hathaway, Inc. — Class B* | 245 | 33,324 | ||||||
Artisan Partners Asset Management, Inc. — Class A | 871 | 33,316 | ||||||
Mid-America Apartment Communities, Inc. | 391 | 33,309 | ||||||
Wells Fargo & Co. | 615 | 33,296 | ||||||
Empire State Realty Trust, Inc. — Class A | 1,868 | 33,288 | ||||||
BB&T Corp. | 896 | 33,286 | ||||||
Realty Income Corp. | 672 | 33,237 | ||||||
Bank of New York Mellon Corp. | 798 | 33,236 | ||||||
Citigroup, Inc. | 625 | 33,231 | ||||||
National Retail Properties, Inc. | 873 | 33,174 | ||||||
CNA Financial Corp. | 906 | 33,123 | ||||||
Allstate Corp. | 535 | 33,106 | ||||||
Equity LifeStyle Properties, Inc. | 547 | 33,083 | ||||||
Huntington Bancshares, Inc. | 3,015 | 33,075 | ||||||
Arthur J Gallagher & Co. | 756 | 33,060 | ||||||
JPMorgan Chase & Co. | 514 | 33,025 | ||||||
Apple Hospitality REIT, Inc. | 1,674 | 33,011 | ||||||
Principal Financial Group, Inc. | 658 | 33,005 | ||||||
Bank of Hawaii Corp. | 504 | 33,001 | ||||||
Goldman Sachs Group, Inc. | 176 | 33,000 | ||||||
First Republic Bank | 505 | 32,982 | ||||||
Douglas Emmett, Inc. | 1,079 | 32,963 | ||||||
Equinix, Inc. | 111 | 32,931 | ||||||
PacWest Bancorp | 731 | 32,924 | ||||||
Comerica, Inc. | 758 | 32,897 | ||||||
VEREIT, Inc. | 3,982 | 32,891 | ||||||
Aspen Insurance Holdings Ltd. | 676 | 32,860 | ||||||
Hudson City Bancorp, Inc. | 3,247 | 32,860 | ||||||
Chubb Corp. | 254 | 32,855 | ||||||
American National Insurance Co. | 318 | 32,843 | ||||||
Hospitality Properties Trust | 1,222 | 32,798 | ||||||
East West Bancorp, Inc. | 812 | 32,797 | ||||||
American Financial Group, Inc. | 454 | 32,774 | ||||||
Invesco Ltd. | 988 | 32,772 | ||||||
XL Group plc — Class A | 860 | 32,749 | ||||||
CoreLogic, Inc.* | 839 | 32,704 | ||||||
Federated Investors, Inc. — Class B | 1,063 | 32,666 | ||||||
Brown & Brown, Inc. | 1,011 | 32,625 | ||||||
RenaissanceRe Holdings Ltd. | 297 | 32,560 | ||||||
Assurant, Inc. | 399 | 32,530 | ||||||
AvalonBay Communities, Inc. | 186 | 32,518 | ||||||
Howard Hughes Corp.* | 263 | 32,502 | ||||||
American Homes 4 Rent — Class A | 1,968 | 32,472 | ||||||
BankUnited, Inc. | 873 | 32,458 | ||||||
WR Berkley Corp. | 581 | 32,437 | ||||||
City National Corp. | 362 | 32,435 | ||||||
Plum Creek Timber Company, Inc. | 796 | 32,429 | ||||||
Extra Space Storage, Inc. | 409 | 32,409 | ||||||
Alexandria Real Estate Equities, Inc. | 361 | 32,396 | ||||||
Everest Re Group Ltd. | 182 | 32,391 | ||||||
Rayonier, Inc. | 1,430 | 32,390 | ||||||
Endurance Specialty Holdings Ltd. | 513 | 32,386 | ||||||
Morgan Stanley | 982 | 32,377 | ||||||
Springleaf Holdings, Inc.* | 690 | 32,368 | ||||||
SVB Financial Group* | 265 | 32,349 | ||||||
CME Group, Inc. — Class A | 342 | 32,309 | ||||||
Voya Financial, Inc. | 796 | 32,294 | ||||||
Regions Financial Corp. | 3,452 | 32,276 | ||||||
Post Properties, Inc. | 540 | 32,260 | ||||||
UDR, Inc. | 936 | 32,255 | ||||||
Zions Bancorporation | 1,121 | 32,251 | ||||||
Camden Property Trust | 437 | 32,246 | ||||||
Hartford Financial Services Group, Inc. | 697 | 32,243 | ||||||
Northern Trust Corp. | 458 | 32,239 | ||||||
Arch Capital Group Ltd.* | 430 | 32,203 | ||||||
People’s United Financial, Inc. | 2,016 | 32,155 | ||||||
Loews Corp. | 880 | 32,085 | ||||||
PNC Financial Services Group, Inc. | 355 | 32,042 | ||||||
TFS Financial Corp. | 1,824 | 32,029 | ||||||
State Street Corp. | 464 | 32,016 | ||||||
U.S. Bancorp | 759 | 32,015 | ||||||
Interactive Brokers Group, Inc. — Class A | 778 | 32,007 | ||||||
CBOE Holdings, Inc. | 477 | 31,978 | ||||||
Essex Property Trust, Inc. | 145 | 31,964 | ||||||
Torchmark Corp. | 551 | 31,964 | ||||||
Lazard Ltd. — Class A | 690 | 31,961 | ||||||
Citizens Financial Group, Inc. | 1,315 | 31,955 | ||||||
TCF Financial Corp. | 2,073 | 31,903 | ||||||
Commerce Bancshares, Inc. | 697 | 31,748 | ||||||
Iron Mountain, Inc. | 1,035 | 31,712 | ||||||
SEE NOTES TO FINANCIAL STATEMENTS. | GUGGENHEIM ETFs ANNUAL REPORT | 51 |
SCHEDULE OF INVESTMENTS (continued) | October 31, 2015 |
GUGGENHEIM RUSSELL 1000® EQUAL WEIGHT ETF |
Shares | Value | |||||||
Communications Sales & Leasing, Inc. | 1,575 | $ | 31,642 | |||||
First Niagara Financial Group, Inc. | 3,051 | 31,578 | ||||||
First Horizon National Corp. | 2,225 | 31,551 | ||||||
Kilroy Realty Corp. | 478 | 31,472 | ||||||
PartnerRe Ltd. | 226 | 31,414 | ||||||
Reinsurance Group of America, Inc. — Class A | 348 | 31,404 | ||||||
Synchrony Financial* | 1,019 | 31,344 | ||||||
CBL & Associates Properties, Inc. | 2,148 | 31,318 | ||||||
M&T Bank Corp. | 261 | 31,281 | ||||||
Fifth Third Bancorp | 1,641 | 31,261 | ||||||
StanCorp Financial Group, Inc. | 272 | 31,204 | ||||||
Realogy Holdings Corp.* | 798 | 31,202 | ||||||
Care Capital Properties, Inc. | 946 | 31,171 | ||||||
MFA Financial, Inc. | 4,499 | 31,132 | ||||||
Axis Capital Holdings Ltd. | 575 | 31,050 | ||||||
Validus Holdings Ltd. | 700 | 31,010 | ||||||
Popular, Inc. | 1,047 | 30,960 | ||||||
Chimera Investment Corp. | 2,194 | 30,892 | ||||||
American Express Co. | 420 | 30,769 | ||||||
Omega Healthcare Investors, Inc. | 889 | 30,688 | ||||||
HCP, Inc. | 824 | 30,653 | ||||||
FNF Group | 865 | 30,517 | ||||||
WP GLIMCHER, Inc. | 2,621 | 30,456 | ||||||
Welltower, Inc. | 468 | 30,359 | ||||||
Ally Financial, Inc.* | 1,521 | 30,298 | ||||||
Annaly Capital Management, Inc. | 3,034 | 30,188 | ||||||
Allied World Assurance Company Holdings AG | 825 | 29,997 | ||||||
Genworth Financial, Inc. — Class A* | 6,387 | 29,891 | ||||||
Ventas, Inc. | 556 | 29,868 | ||||||
Starwood Property Trust, Inc. | 1,477 | 29,673 | ||||||
Senior Housing Properties Trust | 1,945 | 29,545 | ||||||
KeyCorp | 2,373 | 29,473 | ||||||
Corrections Corporation of America | 1,029 | 29,327 | ||||||
NorthStar Asset Management Group, Inc. | 2,003 | 29,304 | ||||||
Credit Acceptance Corp.* | 154 | 29,120 | ||||||
American Capital Agency Corp. | 1,631 | 29,081 | ||||||
SLM Corp.* | 4,112 | 29,031 | ||||||
New York Community Bancorp, Inc. | 1,745 | 28,827 | ||||||
NorthStar Realty Finance Corp. | 2,383 | 28,620 | ||||||
Two Harbors Investment Corp. | 3,332 | 28,189 | ||||||
Santander Consumer USA Holdings, Inc.* | 1,483 | 26,709 | ||||||
Total Financial | 7,130,736 | |||||||
Technology - 9.0% | ||||||||
SanDisk Corp. | 1,297 | 99,870 | ||||||
SolarWinds, Inc.* | 1,655 | 96,040 | ||||||
KLA-Tencor Corp. | 1,357 | 91,082 | ||||||
athenahealth, Inc.* | 551 | 84,000 | ||||||
Maxim Integrated Products, Inc. | 2,030 | 83,190 | ||||||
Leidos Holdings, Inc. | 1,564 | 82,220 | ||||||
Cerner Corp.* | 1,226 | 81,272 | ||||||
Allscripts Healthcare Solutions, Inc.* | 5,720 | 80,423 | ||||||
Lam Research Corp. | 1,046 | 80,113 | ||||||
Cypress Semiconductor Corp.* | 7,533 | 79,398 | ||||||
NVIDIA Corp. | 2,795 | 79,293 | ||||||
Microsoft Corp. | 1,502 | 79,065 | ||||||
Texas Instruments, Inc. | 1,391 | 78,897 | ||||||
Veeva Systems, Inc. — Class A* | 3,077 | 78,063 | ||||||
ON Semiconductor Corp.* | 7,073 | 77,803 | ||||||
Autodesk, Inc.* | 1,406 | 77,597 | ||||||
Intel Corp. | 2,291 | 77,573 | ||||||
Microchip Technology, Inc. | 1,595 | 77,023 | ||||||
VeriFone Systems, Inc.* | 2,519 | 75,923 | ||||||
NetApp, Inc. | 2,232 | 75,888 | ||||||
Applied Materials, Inc. | 4,520 | 75,800 | ||||||
DST Systems, Inc. | 620 | 75,733 | ||||||
NCR Corp.* | 2,836 | 75,438 | ||||||
Citrix Systems, Inc.* | 917 | 75,286 | ||||||
Linear Technology Corp. | 1,692 | 75,159 | ||||||
Xilinx, Inc. | 1,575 | 75,002 | ||||||
Teradyne, Inc. | 3,809 | 74,352 | ||||||
ServiceNow, Inc.* | 906 | 73,975 | ||||||
Black Knight Financial Services, Inc. — Class A* | 2,046 | 73,717 | ||||||
QUALCOMM, Inc. | 1,240 | 73,681 | ||||||
King Digital Entertainment plc | 4,925 | 73,678 | ||||||
Ultimate Software Group, Inc.* | 360 | 73,566 | ||||||
Cognizant Technology Solutions Corp. — Class A* | 1,077 | 73,354 | ||||||
Micron Technology, Inc.* | 4,426 | 73,295 | ||||||
Intuit, Inc. | 751 | 73,170 | ||||||
Analog Devices, Inc. | 1,212 | 72,865 | ||||||
EMC Corp. | 2,778 | 72,839 | ||||||
Inovalon Holdings, Inc. — Class A* | 3,143 | 72,446 | ||||||
IPG Photonics Corp.* | 873 | 72,127 | ||||||
PTC, Inc.* | 2,030 | 71,943 | ||||||
Workday, Inc. — Class A* | 910 | 71,863 | ||||||
Computer Sciences Corp. | 1,077 | 71,717 | ||||||
Red Hat, Inc.* | 905 | 71,595 | ||||||
Activision Blizzard, Inc. | 2,059 | 71,571 | ||||||
HP, Inc. | 2,639 | 71,147 | ||||||
Oracle Corp. | 1,826 | 70,922 | ||||||
salesforce.com, Inc.* | 912 | 70,872 | ||||||
Adobe Systems, Inc.* | 795 | 70,485 | ||||||
Synopsys, Inc.* | 1,409 | 70,422 | ||||||
Cadence Design Systems, Inc.* | 3,149 | 69,971 | ||||||
ANSYS, Inc.* | 734 | 69,958 | ||||||
Cree, Inc.* | 2,756 | 69,424 | ||||||
SS&C Technologies Holdings, Inc. | 934 | 69,256 | ||||||
Altera Corp. | 1,313 | 68,998 | ||||||
Apple, Inc. | 575 | 68,713 | ||||||
Amdocs Ltd. | 1,150 | 68,506 | ||||||
Electronic Arts, Inc.* | 949 | 68,394 | ||||||
Nuance Communications, Inc.* | 3,963 | 67,252 | ||||||
CA, Inc. | 2,413 | 66,864 | ||||||
52 | GUGGENHEIM ETFs ANNUAL REPORT | SEE NOTES TO FINANCIAL STATEMENTS. |
SCHEDULE OF INVESTMENTS (continued) | October 31, 2015 |
GUGGENHEIM RUSSELL 1000® EQUAL WEIGHT ETF |
Shares | Value | |||||||
Zynga, Inc. — Class A* | 28,202 | $ | 66,839 | |||||
Tableau Software, Inc. — Class A* | 796 | 66,832 | ||||||
CDK Global, Inc. | 1,318 | 65,623 | ||||||
Brocade Communications Systems, Inc. | 6,291 | 65,552 | ||||||
Solera Holdings, Inc. | 1,194 | 65,264 | ||||||
Broadcom Corp. — Class A | 1,265 | 65,021 | ||||||
NetSuite, Inc.* | 761 | 64,738 | ||||||
Teradata Corp.* | 2,288 | 64,316 | ||||||
Avago Technologies Ltd. | 521 | 64,151 | ||||||
Lexmark International, Inc. — Class A | 1,955 | 63,518 | ||||||
International Business Machines Corp. | 453 | 63,456 | ||||||
Western Digital Corp. | 937 | 62,610 | ||||||
Atmel Corp. | 8,229 | 62,540 | ||||||
Rackspace Hosting, Inc.* | 2,414 | 62,402 | ||||||
Paychex, Inc. | 1,196 | 61,690 | ||||||
Accenture plc — Class A | 575 | 61,640 | ||||||
Freescale Semiconductor Ltd.* | 1,822 | 61,019 | ||||||
Qorvo, Inc.* | 1,384 | 60,799 | ||||||
Genpact Ltd.* | 2,422 | 60,017 | ||||||
IHS, Inc. — Class A* | 495 | 59,172 | ||||||
IMS Health Holdings, Inc.* | 2,156 | 58,686 | ||||||
Skyworks Solutions, Inc. | 752 | 58,084 | ||||||
Marvell Technology Group Ltd. | 7,073 | 58,069 | ||||||
Pitney Bowes, Inc. | 2,773 | 57,262 | ||||||
Akamai Technologies, Inc.* | 936 | 56,928 | ||||||
Lumentum Holdings, Inc.* | 3,887 | 55,740 | ||||||
3D Systems Corp.* | 5,423 | 54,555 | ||||||
Xerox Corp. | 5,536 | 51,983 | ||||||
VMware, Inc. — Class A* | 842 | 50,646 | ||||||
Fortinet, Inc.* | 1,462 | 50,234 | ||||||
Jack Henry & Associates, Inc. | 451 | 34,880 | ||||||
Fiserv, Inc.* | 361 | 34,840 | ||||||
MSCI, Inc. — Class A | 515 | 34,505 | ||||||
Dun & Bradstreet Corp. | 300 | 34,161 | ||||||
Fidelity National Information Services, Inc. | 464 | 33,835 | ||||||
Broadridge Financial Solutions, Inc. | 561 | 33,424 | ||||||
Total Technology | 6,465,120 | |||||||
Utilities - 9.0% | ||||||||
MDU Resources Group, Inc. | 8,456 | 159,479 | ||||||
Pepco Holdings, Inc. | 5,929 | 157,888 | ||||||
Vectren Corp. | 3,437 | 156,280 | ||||||
AES Corp. | 14,111 | 154,515 | ||||||
SCANA Corp. | 2,598 | 153,854 | ||||||
Atmos Energy Corp. | 2,438 | 153,594 | ||||||
Sempra Energy | 1,495 | 153,103 | ||||||
Aqua America, Inc. | 5,332 | 152,495 | ||||||
Questar Corp. | 7,340 | 151,571 | ||||||
Calpine Corp.* | 9,759 | 151,362 | ||||||
PPL Corp. | 4,395 | 151,188 | ||||||
UGI Corp. | 4,094 | 150,127 | ||||||
NiSource, Inc. | 7,830 | 150,023 | ||||||
Ameren Corp. | 3,398 | 148,425 | ||||||
National Fuel Gas Co. | 2,824 | 148,345 | ||||||
Entergy Corp. | 2,176 | 148,316 | ||||||
OGE Energy Corp. | 5,192 | 148,024 | ||||||
Great Plains Energy, Inc. | 5,353 | 147,208 | ||||||
American Water Works Company, Inc. | 2,561 | 146,899 | ||||||
CMS Energy Corp. | 4,065 | 146,625 | ||||||
Westar Energy, Inc. | 3,691 | 146,533 | ||||||
Eversource Energy | 2,875 | 146,453 | ||||||
NextEra Energy, Inc. | 1,426 | 146,393 | ||||||
CenterPoint Energy, Inc. | 7,856 | 145,729 | ||||||
Hawaiian Electric Industries, Inc. | 4,974 | 145,539 | ||||||
DTE Energy Co. | 1,773 | 144,659 | ||||||
AGL Resources, Inc. | 2,308 | 144,250 | ||||||
Southern Co. | 3,185 | 143,644 | ||||||
Xcel Energy, Inc. | 4,026 | 143,446 | ||||||
Dominion Resources, Inc. | 2,006 | 143,289 | ||||||
TECO Energy, Inc. | 5,306 | 143,262 | ||||||
Alliant Energy Corp. | 2,423 | 143,005 | ||||||
American Electric Power Company, Inc. | 2,509 | 142,135 | ||||||
WEC Energy Group, Inc. | 2,755 | 142,048 | ||||||
Duke Energy Corp. | 1,987 | 142,011 | ||||||
Public Service Enterprise Group, Inc. | 3,436 | 141,872 | ||||||
PG&E Corp. | 2,655 | 141,777 | ||||||
FirstEnergy Corp. | 4,528 | 141,274 | ||||||
Pinnacle West Capital Corp. | 2,213 | 140,548 | ||||||
Consolidated Edison, Inc. | 2,121 | 139,456 | ||||||
ITC Holdings Corp. | 4,185 | 136,933 | ||||||
Edison International | 2,254 | 136,412 | ||||||
Exelon Corp. | 4,764 | 133,011 | ||||||
NRG Energy, Inc. | 9,326 | 120,212 | ||||||
Total Utilities | 6,423,212 | |||||||
Basic Materials - 7.0% | ||||||||
EI du Pont de Nemours & Co. | 2,171 | 137,641 | ||||||
Dow Chemical Co. | 2,491 | 128,710 | ||||||
Freeport-McMoRan, Inc. | 10,756 | 126,598 | ||||||
Albemarle Corp. | 2,335 | 124,970 | ||||||
FMC Corp. | 3,058 | 124,491 | ||||||
PPG Industries, Inc. | 1,194 | 124,486 | ||||||
Celanese Corp. — Class A | 1,752 | 124,480 | ||||||
Newmont Mining Corp. | 6,354 | 123,649 | ||||||
Sherwin-Williams Co. | 463 | 123,542 | ||||||
Westlake Chemical Corp. | 1,989 | 119,877 | ||||||
Domtar Corp. | 2,859 | 117,905 | ||||||
Cabot Corp. | 3,278 | 117,811 | ||||||
Valspar Corp. | 1,446 | 117,054 | ||||||
International Paper Co. | 2,724 | 116,288 | ||||||
Monsanto Co. | 1,247 | 116,246 | ||||||
Praxair, Inc. | 1,045 | 116,088 | ||||||
LyondellBasell Industries N.V. — Class A | 1,247 | 115,859 | ||||||
Nucor Corp. | 2,737 | 115,775 | ||||||
International Flavors & Fragrances, Inc. | 997 | 115,712 | ||||||
CF Industries Holdings, Inc. | 2,274 | 115,451 | ||||||
SEE NOTES TO FINANCIAL STATEMENTS. | GUGGENHEIM ETFs ANNUAL REPORT | 53 |
SCHEDULE OF INVESTMENTS (continued) | October 31, 2015 |
GUGGENHEIM RUSSELL 1000® EQUAL WEIGHT ETF |
Shares | Value | |||||||
Reliance Steel & Aluminum Co. | 1,920 | $ | 115,123 | |||||
Ecolab, Inc. | 954 | 114,814 | ||||||
Air Products & Chemicals, Inc. | 825 | 114,659 | ||||||
Eastman Chemical Co. | 1,582 | 114,173 | ||||||
United States Steel Corp. | 9,769 | 114,102 | ||||||
Steel Dynamics, Inc. | 6,110 | 112,852 | ||||||
Airgas, Inc. | 1,166 | 112,123 | ||||||
RPM International, Inc. | 2,450 | 111,990 | ||||||
NewMarket Corp. | 284 | 111,822 | ||||||
Axalta Coating Systems Ltd.* | 4,034 | 111,459 | ||||||
Mosaic Co. | 3,280 | 110,831 | ||||||
WR Grace & Co.* | 1,100 | 110,330 | ||||||
Southern Copper Corp. | 3,953 | 109,735 | ||||||
Compass Minerals International, Inc. | 1,331 | 108,130 | ||||||
Ashland, Inc. | 983 | 107,855 | ||||||
Cytec Industries, Inc. | 1,430 | 106,421 | ||||||
Tahoe Resources, Inc. | 12,714 | 106,162 | ||||||
Royal Gold, Inc. | 2,210 | 105,726 | ||||||
Sigma-Aldrich Corp. | 756 | 105,628 | ||||||
Alcoa, Inc. | 11,622 | 103,784 | ||||||
Chemours Co. | 14,930 | 103,465 | ||||||
Allegheny Technologies, Inc. | 6,943 | 102,062 | ||||||
Huntsman Corp. | 7,577 | 99,789 | ||||||
Platform Specialty Products Corp.* | 7,513 | 78,436 | ||||||
Total Basic Materials | 5,014,104 | |||||||
Communications - 7.0% | ||||||||
Level 3 Communications, Inc.* | 3,229 | 164,518 | ||||||
United States Cellular Corp.* | 4,000 | 162,960 | ||||||
Telephone & Data Systems, Inc. | 5,475 | 156,805 | ||||||
CenturyLink, Inc. | 5,542 | 156,340 | ||||||
Sprint Corp.* | 32,683 | 154,591 | ||||||
Verizon Communications, Inc. | 3,178 | 148,985 | ||||||
AT&T, Inc. | 4,347 | 145,668 | ||||||
Frontier Communications Corp. | 28,107 | 144,470 | ||||||
Zayo Group Holdings, Inc.* | 5,393 | 143,076 | ||||||
T-Mobile US, Inc.* | 3,288 | 124,582 | ||||||
Juniper Networks, Inc. | 2,611 | 81,960 | ||||||
LinkedIn Corp. — Class A* | 340 | 81,896 | ||||||
Yahoo!, Inc.* | 2,266 | 80,715 | ||||||
VeriSign, Inc.* | 952 | 76,732 | ||||||
Alphabet, Inc. — Class C* | 107 | 76,057 | ||||||
Twitter, Inc.* | 2,610 | 74,280 | ||||||
Cisco Systems, Inc. | 2,535 | 73,135 | ||||||
Facebook, Inc. — Class A* | 710 | 72,399 | ||||||
CDW Corp. | 1,618 | 72,308 | ||||||
Viavi Solutions, Inc.* | 11,954 | 71,126 | ||||||
CommScope Holding Company, Inc.* | 2,184 | 70,827 | ||||||
ARRIS Group, Inc.* | 2,498 | 70,593 | ||||||
GoDaddy, Inc. — Class A* | 2,565 | 70,486 | ||||||
EchoStar Corp. — Class A* | 1,533 | 68,724 | ||||||
Groupon, Inc. — Class A* | 18,381 | 68,194 | ||||||
Symantec Corp. | 3,310 | 68,186 | ||||||
Arista Networks, Inc.* | 1,039 | 67,026 | ||||||
Motorola Solutions, Inc. | 953 | 66,681 | ||||||
Yelp, Inc. — Class A* | 2,976 | 66,216 | ||||||
IAC/InterActiveCorp | 987 | 66,139 | ||||||
Splunk, Inc.* | 1,153 | 64,752 | ||||||
F5 Networks, Inc.* | 575 | 63,365 | ||||||
Palo Alto Networks, Inc.* | 364 | 58,604 | ||||||
TripAdvisor, Inc.* | 677 | 56,719 | ||||||
Scripps Networks Interactive, Inc. — Class A | 884 | 53,111 | ||||||
News Corp. — Class A | 3,440 | 52,976 | ||||||
FireEye, Inc.* | 2,022 | 52,875 | ||||||
Twenty-First Century Fox, Inc. — Class A | 1,705 | 52,327 | ||||||
Interpublic Group of Companies, Inc. | 2,274 | 52,142 | ||||||
TEGNA, Inc. | 1,925 | 52,051 | ||||||
HomeAway, Inc.* | 1,632 | 51,506 | ||||||
Amazon.com, Inc.* | 82 | 51,324 | ||||||
Priceline Group, Inc.* | 35 | 50,898 | ||||||
Walt Disney Co. | 441 | 50,159 | ||||||
CBS Corp. — Class B | 1,076 | 50,056 | ||||||
Omnicom Group, Inc. | 667 | 49,972 | ||||||
Viacom, Inc. — Class B | 1,008 | 49,704 | ||||||
Tribune Media Co. — Class A | 1,218 | 49,122 | ||||||
Liberty Media Corp. — Class C* | 1,253 | 49,055 | ||||||
Expedia, Inc. | 359 | 48,932 | ||||||
Time Warner, Inc. | 647 | 48,745 | ||||||
Comcast Corp. — Class A | 775 | 48,530 | ||||||
eBay, Inc.* | 1,731 | 48,295 | ||||||
Sirius XM Holdings, Inc.* | 11,543 | 47,095 | ||||||
Liberty Ventures* | 1,071 | 46,663 | ||||||
DISH Network Corp. — Class A* | 741 | 46,661 | ||||||
Netflix, Inc.* | 429 | 46,495 | ||||||
Discovery Communications, Inc. — Class A* | 1,576 | 46,397 | ||||||
John Wiley & Sons, Inc. — Class A | 876 | 45,841 | ||||||
Charter Communications, Inc. — Class A* | 240 | 45,826 | ||||||
Time Warner Cable, Inc. | 239 | 45,267 | ||||||
Nielsen Holdings plc | 939 | 44,612 | ||||||
Liberty Broadband Corp. — Class C* | 826 | 44,414 | ||||||
Cable One, Inc. | 102 | 44,211 | ||||||
AMC Networks, Inc. — Class A* | 591 | 43,669 | ||||||
Clear Channel Outdoor Holdings, Inc. — Class A* | 5,726 | 42,830 | ||||||
Cablevision Systems Corp. — Class A | 1,304 | 42,497 | ||||||
Starz — Class A* | 1,129 | 37,833 | ||||||
FactSet Research Systems, Inc. | 197 | 34,499 | ||||||
Zillow Group, Inc. — Class A* | 1,113 | 34,292 | ||||||
Thomson Reuters Corp. | 794 | 32,570 | ||||||
Zillow Group, Inc. — Class C* | 1,134 | 31,400 | ||||||
Pandora Media, Inc.* | 2,102 | 24,194 | ||||||
MSG Networks, Inc. — Class A* | 620 | 12,722 | ||||||
Total Communications | 4,990,883 | |||||||
54 | GUGGENHEIM ETFs ANNUAL REPORT | SEE NOTES TO FINANCIAL STATEMENTS. |
SCHEDULE OF INVESTMENTS (concluded) | October 31, 2015 |
GUGGENHEIM RUSSELL 1000® EQUAL WEIGHT ETF |
Shares | Value | |||||||
Diversified - 0.0% | ||||||||
Leucadia National Corp. | 1,561 | $ | 31,236 | |||||
Total Common Stocks | ||||||||
(Cost $72,459,176) | 71,648,170 | |||||||
SHORT TERM INVESTMENTS† - 0.2% | ||||||||
Federated U.S. Treasury Cash Reserve Fund 0.00%1 | 121,656 | 121,656 | ||||||
Total Short Term Investments | ||||||||
(Cost $121,656) | 121,656 | |||||||
Total Investments - 100.0% | ||||||||
(Cost $72,580,832) | $ | 71,769,826 | ||||||
Other Assets & Liabilities, net - 0.0% | 27,965 | |||||||
Total Net Assets - 100.0% | $ | 71,797,791 | ||||||
* | Non-income producing security. |
† | Value determined based on Level 1 inputs — See Note 4. |
1 | Rate indicated is the 7 day yield as of October 31, 2015. |
plc — Public Limited Company | |
REIT — Real Estate Investment Trust | |
See Sector Classification in Other Information section. |
The following table summarizes the inputs used to value the Fund's net assets at October 31, 2015 (See Note 4 in the Notes to Financial Statements):
Investments in Securities | Level 1 | Level 2 | Level 3 | Total | ||||||||||||
Common Stocks | $ | 71,648,170 | $ | — | $ | — | $ | 71,648,170 | ||||||||
Short Term Investments | 121,656 | — | — | 121,656 | ||||||||||||
Total | $ | 71,769,826 | $ | — | $ | — | $ | 71,769,826 | ||||||||
For the year ended October 31, 2015, there were no transfers between levels.
SEE NOTES TO FINANCIAL STATEMENTS. | GUGGENHEIM ETFs ANNUAL REPORT | 55 |
SCHEDULE OF INVESTMENTS | October 31, 2015 |
GUGGENHEIM RUSSELL 2000® EQUAL WEIGHT ETF |
Shares | Value | |||||||
COMMON STOCKS† - 99.6% | ||||||||
Consumer, Non-cyclical - 24.1% | ||||||||
Natural Health Trends Corp. | 3,361 | $ | 165,563 | |||||
National Beverage Corp.* | 3,692 | 138,967 | ||||||
John B Sanfilippo & Son, Inc. | 1,925 | 124,587 | ||||||
Diamond Foods, Inc.* | 3,056 | 121,079 | ||||||
Lancaster Colony Corp. | 1,045 | 118,837 | ||||||
Seaboard Corp.* | 35 | 117,880 | ||||||
Fresh Del Monte Produce, Inc. | 2,581 | 117,771 | ||||||
Ingles Markets, Inc. — Class A | 2,350 | 117,358 | ||||||
Chefs’ Warehouse, Inc.* | 7,745 | 117,337 | ||||||
Omega Protein Corp.* | 6,431 | 117,044 | ||||||
Coca-Cola Bottling Company Consolidated | 551 | 116,377 | ||||||
Calavo Growers, Inc. | 2,240 | 115,158 | ||||||
Seneca Foods Corp. — Class A* | 3,896 | 113,685 | ||||||
Universal Corp. | 2,069 | 111,747 | ||||||
SpartanNash Co. | 3,985 | 111,182 | ||||||
Fresh Market, Inc.* | 4,454 | 110,994 | ||||||
Vector Group Ltd. | 4,557 | 110,507 | ||||||
Farmer Bros Co.* | 3,887 | 110,313 | ||||||
WD-40 Co. | 1,153 | 110,204 | ||||||
Nutraceutical International Corp.* | 4,471 | 109,540 | ||||||
Natural Grocers by Vitamin Cottage, Inc.* | 4,561 | 109,236 | ||||||
J&J Snack Foods Corp. | 884 | 108,546 | ||||||
TreeHouse Foods, Inc.* | 1,264 | 108,249 | ||||||
Boulder Brands, Inc.* | 12,156 | 107,702 | ||||||
Dean Foods Co. | 5,909 | 107,012 | ||||||
Tootsie Roll Industries, Inc. | 3,340 | 106,012 | ||||||
Andersons, Inc. | 2,988 | 105,775 | ||||||
Medifast, Inc.* | 3,779 | 105,698 | ||||||
Boston Beer Company, Inc. — Class A* | 479 | 105,184 | ||||||
Sanderson Farms, Inc. | 1,502 | 104,404 | ||||||
United Natural Foods, Inc.* | 2,063 | 104,078 | ||||||
Snyder’s-Lance, Inc. | 2,913 | 103,528 | ||||||
Weis Markets, Inc. | 2,512 | 103,344 | ||||||
B&G Foods, Inc. | 2,795 | 101,431 | ||||||
Smart & Final Stores, Inc.* | 6,743 | 99,392 | ||||||
Post Holdings, Inc.* | 1,544 | 99,233 | ||||||
USANA Health Sciences, Inc.* | 767 | 98,636 | ||||||
Cal-Maine Foods, Inc. | 1,807 | 96,602 | ||||||
Diplomat Pharmacy, Inc.* | 3,200 | 89,951 | ||||||
SUPERVALU, Inc.* | 13,618 | 89,470 | ||||||
Civeo Corp.* | 36,782 | 68,415 | ||||||
Wausau Paper Corp. | 6,201 | 63,312 | ||||||
Senomyx, Inc.* | 8,963 | 44,367 | ||||||
Weight Watchers International, Inc.* | 2,434 | 37,435 | ||||||
Heidrick & Struggles International, Inc. | 979 | 26,001 | ||||||
LifeLock, Inc.* | 1,811 | 25,372 | ||||||
Barrett Business Services, Inc. | 506 | 24,784 | ||||||
TrueBlue, Inc.* | 837 | 24,248 | ||||||
Five Prime Therapeutics, Inc.* | 748 | 24,049 | ||||||
Pacific Biosciences of California, Inc.* | 3,265 | 23,183 | ||||||
Vital Therapies, Inc.* | 2,968 | 23,060 | ||||||
Immunomedics, Inc.* | 7,680 | 22,963 | ||||||
On Assignment, Inc.* | 504 | 22,735 | ||||||
Resources Connection, Inc. | 1,264 | 22,689 | ||||||
NV5 Holdings, Inc.* | 958 | 22,301 | ||||||
Ennis, Inc. | 1,113 | 22,292 | ||||||
Brink’s Co. | 719 | 22,275 | ||||||
McGrath RentCorp | 735 | 22,087 | ||||||
Multi-Color Corp. | 283 | 22,029 | ||||||
ACCO Brands Corp.* | 2,709 | 21,862 | ||||||
Vectrus, Inc.* | 879 | 21,861 | ||||||
PFSweb, Inc.* | 1,360 | 21,788 | ||||||
Wright Medical Group NV* | 1,124 | 21,726 | ||||||
Kelly Services, Inc. — Class A | 1,372 | 21,678 | ||||||
Paylocity Holding Corp.* | 643 | 21,586 | ||||||
TriNet Group, Inc.* | 1,130 | 21,447 | ||||||
SP Plus Corp.* | 835 | 21,293 | ||||||
Healthcare Services Group, Inc. | 570 | 21,238 | ||||||
Deluxe Corp. | 356 | 21,200 | ||||||
Navigant Consulting, Inc.* | 1,231 | 21,173 | ||||||
CBIZ, Inc.* | 1,961 | 21,080 | ||||||
Kforce, Inc. | 749 | 21,054 | ||||||
Neff Corp. — Class A* | 3,568 | 20,908 | ||||||
Hackett Group, Inc. | 1,396 | 20,772 | ||||||
CEB, Inc. | 276 | 20,634 | ||||||
Insperity, Inc. | 443 | 20,582 | ||||||
XenoPort, Inc.* | 3,357 | 20,510 | ||||||
CRA International, Inc.* | 874 | 20,452 | ||||||
Korn/Ferry International | 554 | 20,149 | ||||||
RPX Corp.* | 1,414 | 20,135 | ||||||
ServiceSource International, Inc.* | 4,639 | 19,809 | ||||||
XOMA Corp.* | 16,101 | 19,642 | ||||||
Quad/Graphics, Inc. | 1,513 | 19,518 | ||||||
Forrester Research, Inc. | 604 | 19,491 | ||||||
ABM Industries, Inc. | 683 | 19,397 | ||||||
Electro Rent Corp. | 1,845 | 19,151 | ||||||
Orexigen Therapeutics, Inc.* | 6,277 | 19,082 | ||||||
ARC Document Solutions, Inc.* | 3,050 | 18,971 | ||||||
ICF International, Inc.* | 618 | 18,954 | ||||||
Volt Information Sciences, Inc.* | 2,186 | 18,843 | ||||||
Monster Worldwide, Inc.* | 2,999 | 18,804 | ||||||
Care.com, Inc.* | 3,107 | 18,673 | ||||||
Advisory Board Co.* | 426 | 18,672 | ||||||
Revance Therapeutics, Inc.* | 473 | 18,527 | ||||||
Calithera Biosciences, Inc.* | 2,166 | 18,497 | ||||||
Elizabeth Arden, Inc.* | 1,467 | 18,396 | ||||||
Universal Technical Institute, Inc. | 4,305 | 18,297 | ||||||
Matthews International Corp. — Class A | 316 | 18,242 | ||||||
CDI Corp. | 2,255 | 18,040 | ||||||
Collectors Universe, Inc. | 1,033 | 17,861 | ||||||
Dyax Corp.* | 642 | 17,674 | ||||||
OncoMed Pharmaceuticals, Inc.* | 882 | 17,649 | ||||||
Alimera Sciences, Inc.* | 5,855 | 17,624 | ||||||
Rockwell Medical, Inc.* | 1,511 | 17,496 | ||||||
56 | GUGGENHEIM ETFs ANNUAL REPORT | SEE NOTES TO FINANCIAL STATEMENTS. |
SCHEDULE OF INVESTMENTS (continued) | October 31, 2015 |
GUGGENHEIM RUSSELL 2000® EQUAL WEIGHT ETF |
Shares | Value | |||||||
Inter Parfums, Inc. | 632 | $ | 17,456 | |||||
Alarm.com Holdings, Inc.* | 1,366 | 17,280 | ||||||
Aduro Biotech, Inc.* | 639 | 17,259 | ||||||
National Research Corp. — Class A | 1,120 | 17,170 | ||||||
Monro Muffler Brake, Inc. | 231 | 17,133 | ||||||
CSS Industries, Inc. | 623 | 17,008 | ||||||
Grand Canyon Education, Inc.* | 408 | 16,956 | ||||||
MacroGenics, Inc.* | 544 | 16,902 | ||||||
Helen of Troy Ltd.* | 170 | 16,866 | ||||||
Cimpress N.V.* | 213 | 16,806 | ||||||
Acorda Therapeutics, Inc.* | 465 | 16,759 | ||||||
Franklin Covey Co.* | 972 | 16,650 | ||||||
Cytokinetics, Inc.* | 1,932 | 16,635 | ||||||
Ophthotech Corp.* | 333 | 16,627 | ||||||
Team, Inc.* | 472 | 16,520 | ||||||
Darling Ingredients, Inc.* | 1,612 | 16,313 | ||||||
Carriage Services, Inc. — Class A | 754 | 16,219 | ||||||
Sotheby’s | 466 | 16,147 | ||||||
Viad Corp. | 536 | 16,139 | ||||||
Infinity Pharmaceuticals, Inc.* | 1,558 | 16,125 | ||||||
Keryx Biopharmaceuticals, Inc.* | 3,597 | 16,115 | ||||||
Revlon, Inc. — Class A* | 511 | 16,030 | ||||||
Coherus Biosciences, Inc.* | 575 | 16,014 | ||||||
Travelport Worldwide Ltd. | 1,162 | 15,745 | ||||||
Patriot National, Inc.* | 1,239 | 15,735 | ||||||
Central Garden & Pet Co. — Class A* | 931 | 15,715 | ||||||
Theravance Biopharma, Inc.* | 1,051 | 15,712 | ||||||
Neurocrine Biosciences, Inc.* | 320 | 15,709 | ||||||
Liberty Tax, Inc. | 680 | 15,701 | ||||||
Cambium Learning Group, Inc.* | 3,262 | 15,690 | ||||||
FTI Consulting, Inc.* | 460 | 15,645 | ||||||
Bridgepoint Education, Inc.* | 2,014 | 15,609 | ||||||
BioSpecifics Technologies Corp.* | 267 | 15,595 | ||||||
Kite Pharma, Inc.* | 229 | 15,583 | ||||||
Concert Pharmaceuticals, Inc.* | 685 | 15,556 | ||||||
Cynosure, Inc. — Class A* | 413 | 15,545 | ||||||
Cellular Biomedicine Group, Inc.* | 738 | 15,498 | ||||||
Anika Therapeutics, Inc.* | 399 | 15,369 | ||||||
Accuray, Inc.* | 2,288 | 15,330 | ||||||
Bright Horizons Family Solutions, Inc.* | 239 | 15,301 | ||||||
Progenics Pharmaceuticals, Inc.* | 2,079 | 15,260 | ||||||
Spark Therapeutics, Inc.* | 283 | 15,254 | ||||||
HMS Holdings Corp.* | 1,446 | 15,226 | ||||||
ChemoCentryx, Inc.* | 2,166 | 15,140 | ||||||
RadNet, Inc.* | 2,289 | 15,130 | ||||||
Intra-Cellular Therapies, Inc.* | 316 | 15,121 | ||||||
Chemed Corp. | 96 | 15,100 | ||||||
Great Lakes Dredge & Dock Corp.* | 3,769 | 15,076 | ||||||
NeoGenomics, Inc.* | 2,137 | 15,066 | ||||||
Cantel Medical Corp. | 253 | 14,998 | ||||||
ConforMIS, Inc.* | 766 | 14,991 | ||||||
Five Star Quality Care, Inc.* | 4,566 | 14,931 | ||||||
Theravance, Inc. | 1,700 | 14,926 | ||||||
Acceleron Pharma, Inc.* | 478 | 14,918 | ||||||
STAAR Surgical Co.* | 1,829 | 14,906 | ||||||
vTv Therapeutics, Inc. — Class A* | 2,028 | 14,886 | ||||||
Agile Therapeutics, Inc.* | 1,874 | 14,880 | ||||||
Geron Corp.* | 4,281 | 14,855 | ||||||
US Physical Therapy, Inc. | 301 | 14,767 | ||||||
Foundation Medicine, Inc.* | 658 | 14,752 | ||||||
Utah Medical Products, Inc. | 250 | 14,743 | ||||||
TG Therapeutics, Inc.* | 1,186 | 14,671 | ||||||
ImmunoGen, Inc.* | 1,251 | 14,637 | ||||||
Peregrine Pharmaceuticals, Inc.* | 13,058 | 14,625 | ||||||
Providence Service Corp.* | 283 | 14,617 | ||||||
Air Methods Corp.* | 357 | 14,612 | ||||||
Invacare Corp. | 845 | 14,602 | ||||||
Huron Consulting Group, Inc.* | 302 | 14,587 | ||||||
Ascent Capital Group, Inc. — Class A* | 668 | 14,549 | ||||||
SciClone Pharmaceuticals, Inc.* | 1,909 | 14,547 | ||||||
Ocata Therapeutics, Inc.* | 3,306 | 14,546 | ||||||
STERIS Corp. | 194 | 14,540 | ||||||
Natus Medical, Inc.* | 319 | 14,524 | ||||||
Meridian Bioscience, Inc. | 764 | 14,524 | ||||||
CytRx Corp.* | 5,223 | 14,520 | ||||||
Strayer Education, Inc.* | 273 | 14,447 | ||||||
Pfenex, Inc.* | 799 | 14,446 | ||||||
Neogen Corp.* | 267 | 14,432 | ||||||
Sangamo BioSciences, Inc.* | 2,047 | 14,431 | ||||||
Loxo Oncology, Inc.* | 616 | 14,402 | ||||||
Mirati Therapeutics, Inc.* | 407 | 14,400 | ||||||
American Public Education, Inc.* | 662 | 14,385 | ||||||
Ironwood Pharmaceuticals, Inc. — Class A* | 1,265 | 14,370 | ||||||
HealthEquity, Inc.* | 438 | 14,328 | ||||||
Triple-S Management Corp. — Class B* | 695 | 14,310 | ||||||
Insulet Corp.* | 478 | 14,292 | ||||||
Career Education Corp.* | 3,956 | 14,281 | ||||||
Emergent BioSolutions, Inc.* | 444 | 14,275 | ||||||
T2 Biosystems, Inc.* | 1,281 | 14,245 | ||||||
Owens & Minor, Inc. | 397 | 14,232 | ||||||
Aerie Pharmaceuticals, Inc.* | 622 | 14,188 | ||||||
Portola Pharmaceuticals, Inc.* | 298 | 14,188 | ||||||
Synergy Pharmaceuticals, Inc.* | 2,208 | 14,153 | ||||||
West Pharmaceutical Services, Inc. | 235 | 14,102 | ||||||
BioTime, Inc.* | 3,731 | 14,066 | ||||||
Abaxis, Inc. | 280 | 14,059 | ||||||
Tumi Holdings, Inc.* | 875 | 14,026 | ||||||
Clovis Oncology, Inc.* | 140 | 13,987 | ||||||
CryoLife, Inc. | 1,326 | 13,976 | ||||||
Landauer, Inc. | 353 | 13,940 | ||||||
Achillion Pharmaceuticals, Inc.* | 1,779 | 13,912 | ||||||
Omeros Corp.* | 1,107 | 13,871 | ||||||
Karyopharm Therapeutics, Inc.* | 1,036 | 13,831 | ||||||
Prestige Brands Holdings, Inc.* | 282 | 13,821 | ||||||
Ultragenyx Pharmaceutical, Inc.* | 139 | 13,810 | ||||||
Sage Therapeutics, Inc.* | 274 | 13,763 | ||||||
SEE NOTES TO FINANCIAL STATEMENTS. | GUGGENHEIM ETFs ANNUAL REPORT | 57 |
SCHEDULE OF INVESTMENTS (continued) | October 31, 2015 |
GUGGENHEIM RUSSELL 2000® EQUAL WEIGHT ETF |
Shares | Value | |||||||
Capital Senior Living Corp.* | 607 | $ | 13,730 | |||||
National Healthcare Corp. | 210 | 13,708 | ||||||
CorMedix, Inc.* | 5,396 | 13,706 | ||||||
Lion Biotechnologies, Inc.* | 2,116 | 13,691 | ||||||
Pacira Pharmaceuticals, Inc.* | 274 | 13,686 | ||||||
Myriad Genetics, Inc.* | 339 | 13,685 | ||||||
Capella Education Co. | 303 | 13,680 | ||||||
Endocyte, Inc.* | 2,649 | 13,616 | ||||||
NutriSystem, Inc. | 587 | 13,577 | ||||||
Merrimack Pharmaceuticals, Inc.* | 1,453 | 13,571 | ||||||
Global Blood Therapeutics, Inc.* | 291 | 13,569 | ||||||
ZIOPHARM Oncology, Inc.* | 1,191 | 13,565 | ||||||
Array BioPharma, Inc.* | 2,649 | 13,563 | ||||||
Amphastar Pharmaceuticals, Inc.* | 1,145 | 13,557 | ||||||
Luminex Corp.* | 744 | 13,541 | ||||||
Cambrex Corp.* | 294 | 13,515 | ||||||
Universal American Corp. | 1,811 | 13,510 | ||||||
Affymetrix, Inc.* | 1,467 | 13,497 | ||||||
Phibro Animal Health Corp. — Class A | 404 | 13,477 | ||||||
Dicerna Pharmaceuticals, Inc.* | 1,345 | 13,477 | ||||||
OraSure Technologies, Inc.* | 2,591 | 13,473 | ||||||
Dermira, Inc.* | 498 | 13,441 | ||||||
Catalent, Inc.* | 505 | 13,423 | ||||||
Analogic Corp. | 153 | 13,405 | ||||||
MannKind Corp.* | 4,030 | 13,339 | ||||||
Exelixis, Inc.* | 2,210 | 13,304 | ||||||
iRadimed Corp.* | 502 | 13,303 | ||||||
Healthways, Inc.* | 1,130 | 13,300 | ||||||
Galena Biopharma, Inc.* | 7,914 | 13,296 | ||||||
BioTelemetry, Inc.* | 1,020 | 13,280 | ||||||
ARIAD Pharmaceuticals, Inc.* | 1,937 | 13,249 | ||||||
Cutera, Inc.* | 975 | 13,231 | ||||||
Repligen Corp.* | 398 | 13,230 | ||||||
DeVry Education Group, Inc. | 561 | 13,217 | ||||||
Globus Medical, Inc. — Class A* | 591 | 13,209 | ||||||
Halyard Health, Inc.* | 445 | 13,208 | ||||||
Civitas Solutions, Inc.* | 512 | 13,174 | ||||||
Cidara Therapeutics, Inc.* | 967 | 13,171 | ||||||
Chiasma, Inc.* | 579 | 13,166 | ||||||
ACADIA Pharmaceuticals, Inc.* | 378 | 13,162 | ||||||
Tetraphase Pharmaceuticals, Inc.* | 1,457 | 13,157 | ||||||
Sagent Pharmaceuticals, Inc.* | 782 | 13,145 | ||||||
Otonomy, Inc.* | 607 | 13,135 | ||||||
Prothena Corporation plc* | 255 | 13,135 | ||||||
Proteon Therapeutics, Inc.* | 958 | 13,125 | ||||||
Immune Design Corp.* | 1,008 | 13,104 | ||||||
Insmed, Inc.* | 659 | 13,075 | ||||||
Incorporated Research Holdings, Inc. — Class A* | 313 | 13,056 | ||||||
LeMaitre Vascular, Inc. | 977 | 13,014 | ||||||
Orthofix International N.V.* | 382 | 13,007 | ||||||
Supernus Pharmaceuticals, Inc.* | 788 | 13,002 | ||||||
ICU Medical, Inc.* | 118 | 12,976 | ||||||
Nektar Therapeutics* | 1,093 | 12,974 | ||||||
Haemonetics Corp.* | 384 | 12,972 | ||||||
IPC Healthcare, Inc.* | 165 | 12,953 | ||||||
ZS Pharma, Inc.* | 199 | 12,937 | ||||||
WellCare Health Plans, Inc.* | 146 | 12,936 | ||||||
Celldex Therapeutics, Inc.* | 1,072 | 12,928 | ||||||
Livanova plc* | 195 | 12,925 | ||||||
Atrion Corp. | 35 | 12,915 | ||||||
Masimo Corp.* | 325 | 12,896 | ||||||
Hanger, Inc.* | 894 | 12,891 | ||||||
Team Health Holdings, Inc.* | 216 | 12,889 | ||||||
Asterias Biotherapeutics, Inc.* | 2,814 | 12,888 | ||||||
Tokai Pharmaceuticals, Inc.* | 1,166 | 12,884 | ||||||
ExamWorks Group, Inc.* | 456 | 12,877 | ||||||
CorVel Corp.* | 387 | 12,848 | ||||||
Select Medical Holdings Corp. | 1,137 | 12,848 | ||||||
Albany Molecular Research, Inc.* | 712 | 12,844 | ||||||
NxStage Medical, Inc.* | 768 | 12,833 | ||||||
Ligand Pharmaceuticals, Inc. — Class B* | 142 | 12,830 | ||||||
Teligent, Inc.* | 1,762 | 12,810 | ||||||
TransEnterix, Inc.* | 5,141 | 12,801 | ||||||
Halozyme Therapeutics, Inc.* | 815 | 12,755 | ||||||
Oxford Immunotec Global plc* | 1,017 | 12,753 | ||||||
Spectranetics Corp.* | 1,043 | 12,745 | ||||||
K2M Group Holdings, Inc.* | 698 | 12,739 | ||||||
Momenta Pharmaceuticals, Inc.* | 775 | 12,718 | ||||||
Quidel Corp.* | 661 | 12,704 | ||||||
PAREXEL International Corp.* | 201 | 12,687 | ||||||
Zeltiq Aesthetics, Inc.* | 376 | 12,686 | ||||||
Accelerate Diagnostics, Inc.* | 756 | 12,678 | ||||||
ANI Pharmaceuticals, Inc.* | 302 | 12,636 | ||||||
Amedisys, Inc.* | 318 | 12,586 | ||||||
Inovio Pharmaceuticals, Inc.* | 1,988 | 12,584 | ||||||
Durect Corp.* | 6,131 | 12,507 | ||||||
Heska Corp.* | 405 | 12,458 | ||||||
Almost Family, Inc.* | 301 | 12,455 | ||||||
Radius Health, Inc.* | 193 | 12,396 | ||||||
LendingTree, Inc.* | 102 | 12,379 | ||||||
Aegerion Pharmaceuticals, Inc.* | 843 | 12,375 | ||||||
Invuity, Inc.* | 921 | 12,369 | ||||||
LHC Group, Inc.* | 274 | 12,348 | ||||||
Alder Biopharmaceuticals, Inc.* | 386 | 12,344 | ||||||
Stemline Therapeutics, Inc.* | 1,388 | 12,339 | ||||||
FibroGen, Inc.* | 529 | 12,331 | ||||||
Osiris Therapeutics, Inc. | 724 | 12,330 | ||||||
AtriCure, Inc.* | 664 | 12,301 | ||||||
aTyr Pharma, Inc.* | 984 | 12,261 | ||||||
Anacor Pharmaceuticals, Inc.* | 109 | 12,253 | ||||||
Greatbatch, Inc.* | 229 | 12,240 | ||||||
Cerus Corp.* | 2,565 | 12,235 | ||||||
Blueprint Medicines Corp.* | 609 | 12,235 | ||||||
Oncothyreon, Inc.* | 4,133 | 12,234 | ||||||
TESARO, Inc.* | 269 | 12,231 | ||||||
58 | GUGGENHEIM ETFs ANNUAL REPORT | SEE NOTES TO FINANCIAL STATEMENTS. |
SCHEDULE OF INVESTMENTS (continued) | October 31, 2015 |
GUGGENHEIM RUSSELL 2000® EQUAL WEIGHT ETF |
Shares | Value | |||||||
SurModics, Inc.* | 573 | $ | 12,222 | |||||
Assembly Biosciences, Inc.* | 1,273 | 12,221 | ||||||
Integra LifeSciences Holdings Corp.* | 204 | 12,152 | ||||||
Sorrento Therapeutics, Inc.* | 1,406 | 12,148 | ||||||
Sucampo Pharmaceuticals, Inc. — Class A* | 626 | 12,119 | ||||||
Veracyte, Inc.* | 1,858 | 12,096 | ||||||
HealthSouth Corp. | 347 | 12,086 | ||||||
Avalanche Biotechnologies, Inc.* | 1,430 | 12,055 | ||||||
Applied Genetic Technologies Corp.* | 1,004 | 12,048 | ||||||
Vascular Solutions, Inc.* | 375 | 12,045 | ||||||
Magellan Health, Inc.* | 225 | 12,015 | ||||||
Raptor Pharmaceutical Corp.* | 2,202 | 12,001 | ||||||
Curis, Inc.* | 5,882 | 11,999 | ||||||
Chimerix, Inc.* | 306 | 11,989 | ||||||
Rigel Pharmaceuticals, Inc.* | 4,719 | 11,986 | ||||||
Genomic Health, Inc.* | 572 | 11,966 | ||||||
AMAG Pharmaceuticals, Inc.* | 299 | 11,960 | ||||||
Exactech, Inc.* | 702 | 11,955 | ||||||
PharMerica Corp.* | 418 | 11,942 | ||||||
Invitae Corp.* | 1,566 | 11,933 | ||||||
Intersect ENT, Inc.* | 622 | 11,918 | ||||||
Affimed N.V.* | 1,879 | 11,913 | ||||||
TherapeuticsMD, Inc.* | 2,029 | 11,910 | ||||||
AAC Holdings, Inc.* | 513 | 11,902 | ||||||
NanoString Technologies, Inc.* | 820 | 11,898 | ||||||
Corcept Therapeutics, Inc.* | 3,224 | 11,897 | ||||||
NuVasive, Inc.* | 252 | 11,884 | ||||||
Sequenom, Inc.* | 6,766 | 11,841 | ||||||
Navidea Biopharmaceuticals, Inc.* | 5,856 | 11,829 | ||||||
Agenus, Inc.* | 2,591 | 11,815 | ||||||
Organovo Holdings, Inc.* | 3,921 | 11,802 | ||||||
Regulus Therapeutics, Inc.* | 1,767 | 11,751 | ||||||
Heron Therapeutics, Inc.* | 428 | 11,736 | ||||||
Versartis, Inc.* | 1,135 | 11,725 | ||||||
Heartland Payment Systems, Inc. | 158 | 11,692 | ||||||
Lannett Company, Inc.* | 261 | 11,685 | ||||||
MoneyGram International, Inc.* | 1,150 | 11,627 | ||||||
AngioDynamics, Inc.* | 924 | 11,624 | ||||||
Tandem Diabetes Care, Inc.* | 1,279 | 11,601 | ||||||
BioDelivery Sciences International, Inc.* | 2,155 | 11,594 | ||||||
SeaSpine Holdings Corp.* | 768 | 11,581 | ||||||
Insys Therapeutics, Inc.* | 449 | 11,566 | ||||||
Ensign Group, Inc. | 274 | 11,552 | ||||||
Catabasis Pharmaceuticals, Inc.* | 1,653 | 11,538 | ||||||
K12, Inc.* | 1,187 | 11,526 | ||||||
Teladoc, Inc.* | 584 | 11,487 | ||||||
Euronet Worldwide, Inc.* | 143 | 11,474 | ||||||
Cara Therapeutics, Inc.* | 809 | 11,464 | ||||||
Retrophin, Inc.* | 599 | 11,459 | ||||||
Rent-A-Center, Inc. | 623 | 11,457 | ||||||
Cross Country Healthcare, Inc.* | 845 | 11,408 | ||||||
Threshold Pharmaceuticals, Inc.* | 2,988 | 11,384 | ||||||
Foamix Pharmaceuticals Ltd.* | 1,591 | 11,344 | ||||||
Flexion Therapeutics, Inc.* | 687 | 11,322 | ||||||
BioScrip, Inc.* | 5,740 | 11,308 | ||||||
Molina Healthcare, Inc.* | 182 | 11,284 | ||||||
Collegium Pharmaceutical, Inc.* | 614 | 11,279 | ||||||
Abeona Therapeutics, Inc.* | 2,851 | 11,261 | ||||||
Vanda Pharmaceuticals, Inc.* | 1,045 | 11,223 | ||||||
CTI BioPharma Corp.* | 8,425 | 11,205 | ||||||
Impax Laboratories, Inc.* | 323 | 11,185 | ||||||
Dynavax Technologies Corp.* | 492 | 11,173 | ||||||
PDL BioPharma, Inc. | 2,439 | 11,171 | ||||||
Inogen, Inc.* | 260 | 11,112 | ||||||
Lexicon Pharmaceuticals, Inc.* | 1,168 | 11,108 | ||||||
PTC Therapeutics, Inc.* | 446 | 11,092 | ||||||
Trevena, Inc.* | 1,152 | 11,082 | ||||||
Amsurg Corp. — Class A* | 158 | 11,074 | ||||||
Pernix Therapeutics Holdings, Inc.* | 3,933 | 11,052 | ||||||
Entellus Medical, Inc.* | 650 | 11,044 | ||||||
PRA Health Sciences, Inc.* | 315 | 11,038 | ||||||
Medicines Co.* | 322 | 11,025 | ||||||
Arena Pharmaceuticals, Inc.* | 5,830 | 11,019 | ||||||
Akebia Therapeutics, Inc.* | 1,234 | 11,007 | ||||||
Alliance HealthCare Services, Inc.* | 1,298 | 10,981 | ||||||
XBiotech, Inc.* | 772 | 10,947 | ||||||
Catalyst Pharmaceuticals, Inc.* | 3,464 | 10,946 | ||||||
Unilife Corp.* | 14,488 | 10,918 | ||||||
Adamas Pharmaceuticals, Inc.* | 736 | 10,863 | ||||||
Carbylan Therapeutics, Inc.* | 3,016 | 10,858 | ||||||
Nevro Corp.* | 266 | 10,845 | ||||||
Axovant Sciences Ltd.* | 889 | 10,837 | ||||||
CONMED Corp. | 267 | 10,830 | ||||||
Vitae Pharmaceuticals, Inc.* | 911 | 10,823 | ||||||
James River Group Holdings Ltd. | 367 | 10,801 | ||||||
La Jolla Pharmaceutical Co.* | 430 | 10,746 | ||||||
Zogenix, Inc.* | 908 | 10,705 | ||||||
Eagle Pharmaceuticals, Inc.* | 168 | 10,703 | ||||||
Ardelyx, Inc.* | 650 | 10,647 | ||||||
Glaukos Corp.* | 528 | 10,581 | ||||||
Genesis Healthcare, Inc.* | 2,127 | 10,550 | ||||||
VIVUS, Inc.* | 8,371 | 10,547 | ||||||
Advaxis, Inc.* | 947 | 10,502 | ||||||
BioCryst Pharmaceuticals, Inc.* | 1,168 | 10,500 | ||||||
Surgical Care Affiliates, Inc.* | 354 | 10,482 | ||||||
EndoChoice Holdings, Inc.* | 1,005 | 10,372 | ||||||
NewLink Genetics Corp.* | 271 | 10,371 | ||||||
AMN Healthcare Services, Inc.* | 364 | 10,327 | ||||||
Cardtronics, Inc.* | 299 | 10,316 | ||||||
Corium International, Inc.* | 1,484 | 10,299 | ||||||
Tejon Ranch Co.* | 457 | 10,296 | ||||||
Spectrum Pharmaceuticals, Inc.* | 1,976 | 10,295 | ||||||
OvaScience, Inc.* | 793 | 10,285 | ||||||
HeartWare International, Inc.* | 238 | 10,279 | ||||||
Relypsa, Inc.* | 640 | 10,234 | ||||||
Zynerba Pharmaceuticals, Inc.* | 812 | 10,223 | ||||||
SEE NOTES TO FINANCIAL STATEMENTS. | GUGGENHEIM ETFs ANNUAL REPORT | 59 |
SCHEDULE OF INVESTMENTS (continued) | October 31, 2015 |
GUGGENHEIM RUSSELL 2000® EQUAL WEIGHT ETF |
Shares | Value | |||||||
Enanta Pharmaceuticals, Inc.* | 363 | $ | 10,197 | |||||
EVERTEC, Inc. | 557 | 10,160 | ||||||
Idera Pharmaceuticals, Inc.* | 3,678 | 10,151 | ||||||
Medgenics, Inc.* | 1,547 | 10,133 | ||||||
Seres Therapeutics, Inc.* | 341 | 10,107 | ||||||
ABIOMED, Inc.* | 137 | 10,091 | ||||||
Fibrocell Science, Inc.* | 2,638 | 10,077 | ||||||
Xoom Corp.* | 403 | 10,051 | ||||||
Depomed, Inc.* | 574 | 10,045 | ||||||
Green Dot Corp. — Class A* | 541 | 10,030 | ||||||
Merit Medical Systems, Inc.* | 541 | 10,030 | ||||||
Ignyta, Inc.* | 979 | 10,025 | ||||||
Apollo Education Group, Inc. — Class A* | 1,379 | 10,012 | ||||||
POZEN, Inc.* | 1,707 | 9,986 | ||||||
Cardiovascular Systems, Inc.* | 728 | 9,974 | ||||||
Anthera Pharmaceuticals, Inc.* | 1,725 | 9,953 | ||||||
Paratek Pharmaceuticals, Inc.* | 573 | 9,947 | ||||||
Kindred Healthcare, Inc. | 742 | 9,943 | ||||||
Addus HomeCare Corp.* | 398 | 9,942 | ||||||
RTI Surgical, Inc.* | 2,353 | 9,894 | ||||||
GenMark Diagnostics, Inc.* | 1,555 | 9,890 | ||||||
Bellicum Pharmaceuticals, Inc.* | 788 | 9,858 | ||||||
Novavax, Inc.* | 1,457 | 9,835 | ||||||
InVivo Therapeutics Holdings Corp.* | 1,337 | 9,707 | ||||||
LDR Holding Corp.* | 383 | 9,690 | ||||||
NantKwest, Inc.* | 811 | 9,651 | ||||||
Neos Therapeutics, Inc.* | 680 | 9,629 | ||||||
Harvard Bioscience, Inc.* | 3,265 | 9,599 | ||||||
Antares Pharma, Inc.* | 6,950 | 9,591 | ||||||
Epizyme, Inc.* | 730 | 9,556 | ||||||
Xencor, Inc.* | 882 | 9,552 | ||||||
Northwest Biotherapeutics, Inc.* | 1,952 | 9,526 | ||||||
Endologix, Inc.* | 1,115 | 9,522 | ||||||
MiMedx Group, Inc.* | 1,306 | 9,508 | ||||||
Trovagene, Inc.* | 2,198 | 9,473 | ||||||
Second Sight Medical Products, Inc.* | 1,585 | 9,320 | ||||||
Arrowhead Research Corp.* | 1,799 | 9,265 | ||||||
Cepheid* | 269 | 8,985 | ||||||
Everi Holdings, Inc.* | 1,887 | 8,831 | ||||||
Adeptus Health, Inc. — Class A* | 136 | 8,825 | ||||||
Cempra, Inc.* | 395 | 8,769 | ||||||
Sarepta Therapeutics, Inc.* | 360 | 8,662 | ||||||
Aratana Therapeutics, Inc.* | 1,224 | 8,556 | ||||||
Atara Biotherapeutics, Inc.* | 326 | 8,401 | ||||||
Natera, Inc.* | 1,009 | 8,324 | ||||||
Aimmune Therapeutics, Inc.* | 534 | 8,037 | ||||||
Esperion Therapeutics, Inc.* | 332 | 7,968 | ||||||
Nivalis Therapeutics, Inc.* | 955 | 7,659 | ||||||
Nobilis Health Corp.* | 2,649 | 7,470 | ||||||
Ocular Therapeutix, Inc.* | 846 | 7,301 | ||||||
Genocea Biosciences, Inc.* | 1,498 | 7,175 | ||||||
Amicus Therapeutics, Inc.* | 919 | 6,893 | ||||||
Lantheus Holdings, Inc.* | 2,271 | 6,813 | ||||||
Exact Sciences Corp.* | 691 | 5,756 | ||||||
Sientra, Inc.* | 1,294 | 4,865 | ||||||
Synta Pharmaceuticals Corp.* | 7,097 | 4,755 | ||||||
Verastem, Inc.* | 2,303 | 4,238 | ||||||
Zafgen, Inc.* | 356 | 3,428 | ||||||
OPKO Health, Inc.* | 1 | 9 | ||||||
Total Consumer, Non-cyclical | 10,568,250 | |||||||
Industrial - 13.7% | ||||||||
PowerSecure International, Inc.* | 5,551 | 69,166 | ||||||
Hornbeck Offshore Services, Inc.* | 4,638 | 62,660 | ||||||
Gibraltar Industries, Inc.* | 2,455 | 62,160 | ||||||
Insteel Industries, Inc. | 2,830 | 60,533 | ||||||
Belden, Inc. | 891 | 57,051 | ||||||
AEP Industries, Inc.* | 707 | 56,560 | ||||||
Era Group, Inc.* | 4,009 | 55,766 | ||||||
Trinseo S.A.* | 1,652 | 53,607 | ||||||
KapStone Paper and Packaging Corp. | 2,388 | 51,939 | ||||||
LSI Industries, Inc. | 4,773 | 51,262 | ||||||
Universal Forest Products, Inc. | 704 | 51,132 | ||||||
Omega Flex, Inc. | 1,223 | 50,558 | ||||||
US Concrete, Inc.* | 906 | 50,247 | ||||||
Comfort Systems USA, Inc. | 1,562 | 49,874 | ||||||
Chase Corp. | 1,116 | 49,561 | ||||||
RBC Bearings, Inc.* | 716 | 48,967 | ||||||
Lawson Products, Inc.* | 1,866 | 48,534 | ||||||
Louisiana-Pacific Corp.* | 2,743 | 48,441 | ||||||
LB Foster Co. — Class A | 3,285 | 48,388 | ||||||
Myers Industries, Inc. | 3,096 | 48,329 | ||||||
Mueller Water Products, Inc. — Class A | 5,380 | 47,344 | ||||||
Boise Cascade Co.* | 1,574 | 47,110 | ||||||
Core Molding Technologies, Inc.* | 2,350 | 47,094 | ||||||
Global Brass & Copper Holdings, Inc. | 2,082 | 46,824 | ||||||
Trex Company, Inc.* | 1,198 | 46,806 | ||||||
Tredegar Corp. | 3,255 | 46,415 | ||||||
Simpson Manufacturing Company, Inc. | 1,222 | 46,412 | ||||||
Berry Plastics Group, Inc.* | 1,382 | 46,297 | ||||||
Haynes International, Inc. | 1,155 | 45,565 | ||||||
Griffon Corp. | 2,636 | 45,287 | ||||||
Headwaters, Inc.* | 2,177 | 44,737 | ||||||
Apogee Enterprises, Inc. | 902 | 44,676 | ||||||
Mueller Industries, Inc. | 1,400 | 44,128 | ||||||
AAON, Inc. | 2,131 | 43,622 | ||||||
Rexnord Corp.* | 2,358 | 43,576 | ||||||
Northwest Pipe Co.* | 3,252 | 42,959 | ||||||
Patrick Industries, Inc.* | 1,053 | 42,731 | ||||||
Advanced Drainage Systems, Inc. | 1,354 | 42,543 | ||||||
Summit Materials, Inc. — Class A* | 2,006 | 42,246 | ||||||
Greif, Inc. — Class A | 1,280 | 41,958 | ||||||
Quanex Building Products Corp. | 2,198 | 41,476 | ||||||
TimkenSteel Corp. | 3,872 | 41,198 | ||||||
NCI Building Systems, Inc.* | 3,908 | 40,878 | ||||||
Stock Building Supply Holdings, Inc.* | 2,350 | 40,608 | ||||||
60 | GUGGENHEIM ETFs ANNUAL REPORT | SEE NOTES TO FINANCIAL STATEMENTS. |
SCHEDULE OF INVESTMENTS (continued) | October 31, 2015 |
GUGGENHEIM RUSSELL 2000® EQUAL WEIGHT ETF |
Shares | Value | |||||||
Nortek, Inc.* | 646 | $ | 39,632 | |||||
PGT, Inc.* | 3,283 | 39,593 | ||||||
Masonite International Corp.* | 659 | 39,454 | ||||||
Ply Gem Holdings, Inc.* | 3,270 | 38,651 | ||||||
LSB Industries, Inc.* | 2,301 | 36,011 | ||||||
Builders FirstSource, Inc.* | 3,005 | 35,519 | ||||||
Continental Building Products, Inc.* | 1,990 | 34,964 | ||||||
American Railcar Industries, Inc. | 539 | 31,110 | ||||||
NN, Inc. | 2,155 | 29,739 | ||||||
UTI Worldwide, Inc.* | 4,011 | 28,598 | ||||||
Mistras Group, Inc.* | 1,446 | 27,358 | ||||||
VSE Corp. | 475 | 27,294 | ||||||
Encore Wire Corp. | 608 | 26,004 | ||||||
YRC Worldwide, Inc.* | 1,400 | 25,563 | ||||||
Albany International Corp. — Class A | 663 | 24,908 | ||||||
Actuant Corp. — Class A | 1,074 | 24,487 | ||||||
General Cable Corp. | 1,579 | 24,301 | ||||||
Matson, Inc. | 519 | 23,786 | ||||||
Gorman-Rupp Co. | 830 | 23,730 | ||||||
Frontline Ltd.* | 7,479 | 23,634 | ||||||
Park-Ohio Holdings Corp. | 685 | 23,633 | ||||||
TriMas Corp.* | 1,172 | 23,452 | ||||||
EnPro Industries, Inc. | 476 | 23,376 | ||||||
AAR Corp. | 1,024 | 23,235 | ||||||
Standex International Corp. | 258 | 23,148 | ||||||
Textainer Group Holdings Ltd. | 1,183 | 23,140 | ||||||
Franklin Electric Company, Inc. | 702 | 23,138 | ||||||
John Bean Technologies Corp. | 515 | 23,103 | ||||||
EnerSys | 375 | 22,871 | ||||||
Lydall, Inc.* | 668 | 22,866 | ||||||
XPO Logistics, Inc.* | 822 | 22,819 | ||||||
TAL International Group, Inc.* | 1,338 | 22,692 | ||||||
Atlas Air Worldwide Holdings, Inc.* | 550 | 22,682 | ||||||
Echo Global Logistics, Inc.* | 953 | 22,672 | ||||||
Greenbrier Companies, Inc. | 596 | 22,672 | ||||||
Hillenbrand, Inc. | 761 | 22,579 | ||||||
Harsco Corp. | 2,097 | 22,501 | ||||||
Altra Industrial Motion Corp. | 849 | 22,465 | ||||||
Ardmore Shipping Corp. | 1,563 | 22,429 | ||||||
Exponent, Inc. | 436 | 22,415 | ||||||
Aegion Corp. — Class A* | 1,161 | 22,396 | ||||||
CAI International, Inc.* | 1,912 | 22,217 | ||||||
Primoris Services Corp. | 1,112 | 22,151 | ||||||
Brady Corp. — Class A | 970 | 22,067 | ||||||
Itron, Inc.* | 600 | 22,037 | ||||||
Federal Signal Corp. | 1,459 | 21,973 | ||||||
Raven Industries, Inc. | 1,206 | 21,961 | ||||||
Teekay Tankers Ltd. — Class A | 2,866 | 21,896 | ||||||
Furmanite Corp.* | 3,150 | 21,893 | ||||||
Generac Holdings, Inc.* | 693 | 21,871 | ||||||
Woodward, Inc. | 480 | 21,840 | ||||||
Advanced Energy Industries, Inc.* | 772 | 21,832 | ||||||
GasLog Ltd. | 1,886 | 21,821 | ||||||
CIRCOR International, Inc. | 475 | 21,812 | ||||||
Powell Industries, Inc. | 651 | 21,691 | ||||||
Littelfuse, Inc. | 217 | 21,685 | ||||||
Kratos Defense & Security Solutions, Inc.* | 4,334 | 21,627 | ||||||
NVE Corp. | 362 | 21,464 | ||||||
Heritage-Crystal Clean, Inc.* | 1,797 | 21,421 | ||||||
Air Transport Services Group, Inc.* | 2,187 | 21,411 | ||||||
OSI Systems, Inc.* | 248 | 21,373 | ||||||
Ducommun, Inc.* | 984 | 21,294 | ||||||
Aerovironment, Inc.* | 923 | 21,294 | ||||||
Hub Group, Inc. — Class A* | 532 | 21,269 | ||||||
GP Strategies Corp.* | 847 | 21,251 | ||||||
AZZ, Inc. | 384 | 21,247 | ||||||
Moog, Inc. — Class A* | 344 | 21,245 | ||||||
Allied Motion Technologies, Inc. | 1,093 | 21,084 | ||||||
Curtiss-Wright Corp. | 303 | 21,077 | ||||||
KLX, Inc.* | 538 | 21,041 | ||||||
Xerium Technologies, Inc.* | 1,557 | 21,020 | ||||||
Granite Construction, Inc. | 637 | 20,919 | ||||||
Tetra Tech, Inc. | 777 | 20,901 | ||||||
Ship Finance International Ltd. | 1,222 | 20,884 | ||||||
Kaman Corp. | 536 | 20,845 | ||||||
EMCOR Group, Inc. | 429 | 20,712 | ||||||
Columbus McKinnon Corp. | 1,108 | 20,709 | ||||||
DXP Enterprises, Inc.* | 684 | 20,698 | ||||||
Sun Hydraulics Corp. | 706 | 20,679 | ||||||
Cubic Corp. | 461 | 20,676 | ||||||
Dorian LPG Ltd.* | 1,755 | 20,674 | ||||||
Blount International, Inc.* | 3,405 | 20,668 | ||||||
DHT Holdings, Inc. | 2,628 | 20,656 | ||||||
Forward Air Corp. | 454 | 20,592 | ||||||
Mesa Laboratories, Inc. | 184 | 20,580 | ||||||
CECO Environmental Corp. | 2,306 | 20,570 | ||||||
HEICO Corp. | 406 | 20,479 | ||||||
Applied Industrial Technologies, Inc. | 495 | 20,448 | ||||||
Kadant, Inc. | 497 | 20,437 | ||||||
Safe Bulkers, Inc. | 6,634 | 20,433 | ||||||
Esterline Technologies Corp.* | 265 | 20,418 | ||||||
Argan, Inc. | 552 | 20,396 | ||||||
Rofin-Sinar Technologies, Inc.* | 701 | 20,300 | ||||||
CLARCOR, Inc. | 407 | 20,293 | ||||||
Tennant Co. | 346 | 20,040 | ||||||
Barnes Group, Inc. | 532 | 19,998 | ||||||
Hurco Companies, Inc. | 744 | 19,991 | ||||||
MSA Safety, Inc. | 459 | 19,957 | ||||||
Badger Meter, Inc. | 329 | 19,931 | ||||||
Applied Optoelectronics, Inc.* | 966 | 19,919 | ||||||
Navios Maritime Acquisition Corp. | 5,535 | 19,815 | ||||||
TTM Technologies, Inc.* | 2,710 | 19,783 | ||||||
Werner Enterprises, Inc. | 747 | 19,766 | ||||||
Alamo Group, Inc. | 421 | 19,753 | ||||||
PAM Transportation Services, Inc.* | 552 | 19,712 | ||||||
ArcBest Corp. | 760 | 19,684 | ||||||
SEE NOTES TO FINANCIAL STATEMENTS. | GUGGENHEIM ETFs ANNUAL REPORT | 61 |
SCHEDULE OF INVESTMENTS (continued) | October 31, 2015 |
GUGGENHEIM RUSSELL 2000® EQUAL WEIGHT ETF |
Shares | Value | |||||||
Hyster-Yale Materials Handling, Inc. | 336 | $ | 19,662 | |||||
ESCO Technologies, Inc. | 530 | 19,658 | ||||||
FreightCar America, Inc. | 1,081 | 19,653 | ||||||
Aerojet Rocketdyne Holdings, Inc.* | 1,160 | 19,650 | ||||||
Graham Corp. | 1,155 | 19,600 | ||||||
Watts Water Technologies, Inc. — Class A | 360 | 19,598 | ||||||
Vishay Precision Group, Inc.* | 1,670 | 19,589 | ||||||
II-VI, Inc.* | 1,081 | 19,588 | ||||||
Tutor Perini Corp.* | 1,167 | 19,582 | ||||||
Casella Waste Systems, Inc. — Class A* | 3,223 | 19,564 | ||||||
Covenant Transportation Group, Inc. — Class A* | 1,005 | 19,397 | ||||||
Fabrinet* | 894 | 19,373 | ||||||
USA Truck, Inc.* | 1,065 | 19,362 | ||||||
Vicor Corp.* | 1,997 | 19,291 | ||||||
Dycom Industries, Inc.* | 253 | 19,251 | ||||||
TASER International, Inc.* | 822 | 19,243 | ||||||
Knight Transportation, Inc. | 757 | 19,243 | ||||||
FARO Technologies, Inc.* | 569 | 19,227 | ||||||
Hill International, Inc.* | 5,681 | 19,202 | ||||||
Teledyne Technologies, Inc.* | 215 | 19,184 | ||||||
Nordic American Tankers Ltd. | 1,254 | 19,161 | ||||||
ZAGG, Inc.* | 2,258 | 19,148 | ||||||
Swift Transportation Co. — Class A* | 1,224 | 19,131 | ||||||
Lindsay Corp. | 282 | 19,114 | ||||||
Marten Transport Ltd. | 1,163 | 19,062 | ||||||
Vishay Intertechnology, Inc. | 1,791 | 18,985 | ||||||
Scorpio Tankers, Inc. | 2,076 | 18,933 | ||||||
Newport Corp.* | 1,251 | 18,903 | ||||||
MasTec, Inc.* | 1,126 | 18,883 | ||||||
Twin Disc, Inc. | 1,597 | 18,813 | ||||||
Multi-Fineline Electronix, Inc.* | 1,010 | 18,766 | ||||||
GSI Group, Inc.* | 1,385 | 18,711 | ||||||
IMAX Corp.* | 482 | 18,504 | ||||||
Tech Data Corp.* | 253 | 18,416 | ||||||
Stoneridge, Inc.* | 1,447 | 18,362 | ||||||
Eagle Bulk Shipping, Inc.* | 3,003 | 18,318 | ||||||
Astec Industries, Inc. | 563 | 18,298 | ||||||
AVX Corp. | 1,338 | 18,063 | ||||||
Proto Labs, Inc.* | 276 | 17,896 | ||||||
Heartland Express, Inc. | 950 | 17,889 | ||||||
Briggs & Stratton Corp. | 998 | 17,735 | ||||||
Methode Electronics, Inc. | 530 | 17,665 | ||||||
Drew Industries, Inc. | 294 | 17,590 | ||||||
Sparton Corp.* | 744 | 17,506 | ||||||
Scorpio Bulkers, Inc.* | 12,498 | 17,497 | ||||||
American Science & Engineering, Inc. | 465 | 17,428 | ||||||
Knowles Corp.* | 1,041 | 17,343 | ||||||
Astronics Corp.* | 456 | 17,241 | ||||||
Gener8 Maritime, Inc.* | 1,656 | 17,222 | ||||||
Checkpoint Systems, Inc. | 2,285 | 17,092 | ||||||
Milacron Holdings Corp.* | 996 | 17,002 | ||||||
Celadon Group, Inc. | 1,173 | 16,985 | ||||||
Sanmina Corp.* | 821 | 16,970 | ||||||
TRC Companies, Inc.* | 1,638 | 16,921 | ||||||
MYR Group, Inc.* | 752 | 16,920 | ||||||
CTS Corp. | 924 | 16,798 | ||||||
Chart Industries, Inc.* | 976 | 16,777 | ||||||
FEI Co. | 232 | 16,748 | ||||||
US Ecology, Inc. | 426 | 16,703 | ||||||
Kimball Electronics, Inc.* | 1,457 | 16,595 | ||||||
Tidewater, Inc. | 1,339 | 16,537 | ||||||
Universal Display Corp.* | 481 | 16,503 | ||||||
Fenix Parts, Inc.* | 2,095 | 16,488 | ||||||
Coherent, Inc.* | 303 | 16,423 | ||||||
Radiant Logistics, Inc.* | 4,122 | 16,364 | ||||||
Park Electrochemical Corp. | 998 | 16,307 | ||||||
Bel Fuse, Inc. — Class B | 898 | 16,191 | ||||||
Universal Truckload Services, Inc. | 1,003 | 16,028 | ||||||
Benchmark Electronics, Inc.* | 808 | 15,982 | ||||||
Smith & Wesson Holding Corp.* | 890 | 15,896 | ||||||
Plexus Corp.* | 456 | 15,787 | ||||||
National Presto Industries, Inc. | 178 | 15,673 | ||||||
Navios Maritime Holdings, Inc. | 7,338 | 15,483 | ||||||
Fluidigm Corp.* | 1,418 | 15,329 | ||||||
Rogers Corp.* | 327 | 15,212 | ||||||
Control4 Corp.* | 2,292 | 14,990 | ||||||
Sturm Ruger & Company, Inc. | 262 | 14,918 | ||||||
Power Solutions International, Inc.* | 804 | 14,504 | ||||||
Saia, Inc.* | 611 | 14,426 | ||||||
Golden Ocean Group Ltd.* | 7,283 | 14,348 | ||||||
Orion Marine Group, Inc.* | 3,423 | 13,384 | ||||||
Roadrunner Transportation Systems, Inc.* | 1,028 | 10,938 | ||||||
Imprivata, Inc.* | 739 | 7,974 | ||||||
Astronics Corp. — Class B* | 68 | 2,533 | ||||||
Total Industrial | 6,035,255 | |||||||
Financial - 10.8% | ||||||||
Marlin Business Services Corp. | 1,257 | 22,199 | ||||||
Aircastle Ltd. | 949 | 21,504 | ||||||
WageWorks, Inc.* | 414 | 19,881 | ||||||
PHH Corp.* | 1,309 | 19,241 | ||||||
Ellie Mae, Inc.* | 245 | 17,880 | ||||||
Federated National Holding Co. | 458 | 14,101 | ||||||
World Acceptance Corp.* | 366 | 13,957 | ||||||
NewBridge Bancorp | 1,181 | 13,358 | ||||||
United Insurance Holdings Corp. | 787 | 13,001 | ||||||
Impac Mortgage Holdings, Inc.* | 581 | 12,985 | ||||||
International. FCStone, Inc.* | 405 | 12,957 | ||||||
Bear State Financial, Inc.* | 1,142 | 12,506 | ||||||
Campus Crest Communities, Inc. | 1,876 | 12,438 | ||||||
NewStar Financial, Inc.* | 1,166 | 12,301 | ||||||
DuPont Fabros Technology, Inc. | 377 | 12,097 | ||||||
Enova International, Inc.* | 929 | 12,077 | ||||||
Bar Harbor Bankshares | 339 | 11,983 | ||||||
Heritage Insurance Holdings, Inc.* | 539 | 11,923 | ||||||
62 | GUGGENHEIM ETFs ANNUAL REPORT | SEE NOTES TO FINANCIAL STATEMENTS. |
SCHEDULE OF INVESTMENTS (continued) | October 31, 2015 |
GUGGENHEIM RUSSELL 2000® EQUAL WEIGHT ETF |
Shares | Value | |||||||
Franklin Financial Network, Inc.* | 444 | $ | 11,904 | |||||
Employers Holdings, Inc. | 448 | 11,859 | ||||||
CommunityOne Bancorp* | 913 | 11,814 | ||||||
MBIA, Inc.* | 1,569 | 11,783 | ||||||
Great Southern Bancorp, Inc. | 243 | 11,743 | ||||||
BBX Capital Corp. — Class A* | 636 | 11,670 | ||||||
Pennsylvania Real Estate Investment Trust | 519 | 11,667 | ||||||
Investment Technology Group, Inc. | 726 | 11,623 | ||||||
Acacia Research Corp. | 1,745 | 11,621 | ||||||
National Western Life Group, Inc. — Class A | 45 | 11,609 | ||||||
Gladstone Commercial Corp. | 725 | 11,608 | ||||||
Pzena Investment Management, Inc. — Class A | 1,217 | 11,599 | ||||||
Maiden Holdings Ltd. | 745 | 11,585 | ||||||
Fulton Financial Corp. | 862 | 11,568 | ||||||
Selective Insurance Group, Inc. | 317 | 11,567 | ||||||
Ladenburg Thalmann Financial Services, Inc.* | 4,542 | 11,537 | ||||||
Hallmark Financial Services, Inc.* | 888 | 11,535 | ||||||
First Citizens BancShares, Inc. — Class A | 45 | 11,526 | ||||||
Peoples Financial Services Corp. | 283 | 11,523 | ||||||
Enterprise Financial Services Corp. | 405 | 11,485 | ||||||
Virtus Investment Partners, Inc. | 98 | 11,470 | ||||||
Bank of the Ozarks, Inc. | 229 | 11,455 | ||||||
Western Alliance Bancorporation* | 319 | 11,405 | ||||||
STAG Industrial, Inc. | 553 | 11,347 | ||||||
WisdomTree Investments, Inc. | 590 | 11,346 | ||||||
C1 Financial, Inc.* | 548 | 11,338 | ||||||
Citizens, Inc.* | 1,349 | 11,332 | ||||||
Universal Insurance Holdings, Inc. | 359 | 11,326 | ||||||
First Bancorp, Inc. | 536 | 11,325 | ||||||
Penns Woods Bancorp, Inc. | 254 | 11,315 | ||||||
Education Realty Trust, Inc. | 315 | 11,312 | ||||||
Highwoods Properties, Inc. | 260 | 11,297 | ||||||
Rouse Properties, Inc. | 642 | 11,293 | ||||||
WSFS Financial Corp. | 355 | 11,279 | ||||||
Westwood Holdings Group, Inc. | 194 | 11,271 | ||||||
Terreno Realty Corp. | 502 | 11,235 | ||||||
ZAIS Group Holdings, Inc.* | 1,081 | 11,232 | ||||||
TowneBank | 523 | 11,224 | ||||||
RLI Corp. | 184 | 11,196 | ||||||
Cedar Realty Trust, Inc. | 1,601 | 11,190 | ||||||
Great Western Bancorp, Inc. | 396 | 11,192 | ||||||
Fidelity & Guaranty Life | 419 | 11,187 | ||||||
Urban Edge Properties | 471 | 11,181 | ||||||
Mack-Cali Realty Corp. | 513 | 11,163 | ||||||
Ameris Bancorp | 354 | 11,151 | ||||||
KCG Holdings, Inc. — Class A* | 892 | 11,141 | ||||||
Janus Capital Group, Inc. | 717 | 11,135 | ||||||
Merchants Bancshares, Inc. | 353 | 11,127 | ||||||
New York REIT, Inc. | 976 | 11,126 | ||||||
Ramco-Gershenson Properties Trust | 662 | 11,122 | ||||||
BBCN Bancorp, Inc. | 662 | 11,115 | ||||||
Ames National Corp. | 444 | 11,100 | ||||||
Enterprise Bancorp, Inc. | 478 | 11,099 | ||||||
Community Bank System, Inc. | 272 | 11,087 | ||||||
Equity One, Inc. | 417 | 11,084 | ||||||
Customers Bancorp, Inc.* | 403 | 11,083 | ||||||
HCI Group, Inc. | 254 | 11,077 | ||||||
Yadkin Financial Corp. | 470 | 11,069 | ||||||
Argo Group International Holdings Ltd. | 177 | 11,066 | ||||||
DCT Industrial Trust, Inc. | 298 | 11,062 | ||||||
Bank of Marin Bancorp | 208 | 11,061 | ||||||
St. Joe Co.* | 558 | 11,060 | ||||||
Rexford Industrial Realty, Inc. | 730 | 11,060 | ||||||
Walker & Dunlop, Inc.* | 381 | 11,053 | ||||||
Lakeland Bancorp, Inc. | 950 | 11,049 | ||||||
Washington Federal, Inc. | 443 | 11,047 | ||||||
Kite Realty Group Trust | 418 | 11,039 | ||||||
Brookline Bancorp, Inc. | 970 | 11,010 | ||||||
Summit Hotel Properties, Inc. | 841 | 11,001 | ||||||
FRP Holdings, Inc.* | 333 | 10,989 | ||||||
American National Bankshares, Inc. | 436 | 10,987 | ||||||
Mercantile Bank Corp. | 498 | 10,986 | ||||||
Pacific Continental Corp. | 766 | 10,984 | ||||||
United Community Financial Corp. | 2,004 | 10,981 | ||||||
PS Business Parks, Inc. | 128 | 10,981 | ||||||
Simmons First National Corp. — Class A | 213 | 10,978 | ||||||
Easterly Government Properties, Inc. | 628 | 10,977 | ||||||
CyrusOne, Inc. | 311 | 10,972 | ||||||
First NBC Bank Holding Co.* | 295 | 10,971 | ||||||
Hingham Institution for Savings | 86 | 10,957 | ||||||
Cousins Properties, Inc. | 1,091 | 10,954 | ||||||
Monmouth Real Estate Investment Corp. | 1,052 | 10,951 | ||||||
AMERISAFE, Inc. | 200 | 10,946 | ||||||
First Community Bancshares, Inc. | 569 | 10,942 | ||||||
Century Bancorp, Inc. — Class A | 246 | 10,935 | ||||||
First Bancorp | 590 | 10,933 | ||||||
FelCor Lodging Trust, Inc. | 1,357 | 10,924 | ||||||
PrivateBancorp, Inc. — Class A | 261 | 10,917 | ||||||
FCB Financial Holdings, Inc. — Class A* | 307 | 10,917 | ||||||
National Interstate Corp. | 380 | 10,906 | ||||||
Retail Opportunity Investments Corp. | 601 | 10,896 | ||||||
CorEnergy Infrastructure Trust, Inc. | 2,131 | 10,889 | ||||||
Acadia Realty Trust | 331 | 10,887 | ||||||
Old Second Bancorp, Inc.* | 1,622 | 10,868 | ||||||
Primerica, Inc. | 228 | 10,860 | ||||||
National Storage Affiliates Trust | 722 | 10,859 | ||||||
Altisource Portfolio Solutions S.A.* | 405 | 10,858 | ||||||
Heritage Oaks Bancorp | 1,232 | 10,854 | ||||||
EPR Properties | 191 | 10,851 | ||||||
West Bancorporation, Inc. | 549 | 10,848 | ||||||
Valley National Bancorp | 1,033 | 10,847 | ||||||
Sunstone Hotel Investors, Inc. | 750 | 10,845 | ||||||
FNB Corp. | 805 | 10,843 | ||||||
Atlas Financial Holdings, Inc.* | 570 | 10,841 | ||||||
Investors Real Estate Trust | 1,335 | 10,840 | ||||||
SEE NOTES TO FINANCIAL STATEMENTS. | GUGGENHEIM ETFs ANNUAL REPORT | 63 |
SCHEDULE OF INVESTMENTS (continued) | October 31, 2015 |
GUGGENHEIM RUSSELL 2000® EQUAL WEIGHT ETF |
Shares | Value | |||||||
One Liberty Properties, Inc. | 460 | $ | 10,838 | |||||
Getty Realty Corp. | 642 | 10,837 | ||||||
Banc of California, Inc. | 831 | 10,836 | ||||||
TriCo Bancshares | 411 | 10,834 | ||||||
International Bancshares Corp. | 402 | 10,834 | ||||||
Washington Real Estate Investment Trust | 401 | 10,831 | ||||||
EMC Insurance Group, Inc. | 433 | 10,825 | ||||||
CYS Investments, Inc. | 1,402 | 10,822 | ||||||
Saul Centers, Inc. | 193 | 10,822 | ||||||
Farmers Capital Bank Corp.* | 399 | 10,821 | ||||||
Moelis & Co. — Class A | 367 | 10,819 | ||||||
American Equity Investment Life Holding Co. | 421 | 10,811 | ||||||
First Connecticut Bancorp, Inc. | 622 | 10,810 | ||||||
German American Bancorp, Inc. | 345 | 10,809 | ||||||
Peapack Gladstone Financial Corp. | 478 | 10,808 | ||||||
Diamond Hill Investment Group, Inc. | 54 | 10,803 | ||||||
Cohen & Steers, Inc. | 353 | 10,798 | ||||||
First Busey Corp. | 517 | 10,790 | ||||||
Territorial Bancorp, Inc. | 387 | 10,790 | ||||||
Ambac Financial Group, Inc.* | 668 | 10,788 | ||||||
OceanFirst Financial Corp. | 584 | 10,781 | ||||||
Federal Agricultural Mortgage Corp. — Class C | 367 | 10,775 | ||||||
Armada Hoffler Properties, Inc. | 1,003 | 10,772 | ||||||
CoreSite Realty Corp. | 196 | 10,770 | ||||||
Flagstar Bancorp, Inc.* | 484 | 10,764 | ||||||
Navigators Group, Inc.* | 126 | 10,754 | ||||||
Agree Realty Corp. | 332 | 10,750 | ||||||
STORE Capital Corp. | 474 | 10,746 | ||||||
First Potomac Realty Trust | 911 | 10,741 | ||||||
Renasant Corp. | 310 | 10,735 | ||||||
Pinnacle Financial Partners, Inc. | 204 | 10,734 | ||||||
National Commerce Corp.* | 427 | 10,722 | ||||||
Webster Financial Corp. | 289 | 10,722 | ||||||
Pacific Premier Bancorp, Inc.* | 502 | 10,718 | ||||||
Potlatch Corp. | 343 | 10,715 | ||||||
Lexington Realty Trust | 1,212 | 10,714 | ||||||
Central Pacific Financial Corp. | 479 | 10,710 | ||||||
Bridge Bancorp, Inc. | 373 | 10,709 | ||||||
Select Income REIT | 530 | 10,706 | ||||||
Suffolk Bancorp | 358 | 10,701 | ||||||
Cass Information Systems, Inc. | 205 | 10,693 | ||||||
Home BancShares, Inc. | 249 | 10,687 | ||||||
Sovran Self Storage, Inc. | 107 | 10,686 | ||||||
Hersha Hospitality Trust | 445 | 10,684 | ||||||
Capitol Federal Financial, Inc. | 823 | 10,683 | ||||||
Parkway Properties, Inc. | 638 | 10,674 | ||||||
Green Bancorp, Inc.* | 871 | 10,670 | ||||||
Charter Financial Corp. | 814 | 10,663 | ||||||
Columbia Banking System, Inc. | 320 | 10,662 | ||||||
Alexander’s, Inc. | 27 | 10,662 | ||||||
Gramercy Property Trust, Inc. | 470 | 10,660 | ||||||
First Financial Corp. | 311 | 10,658 | ||||||
Global Indemnity plc — Class A* | 375 | 10,654 | ||||||
Southwest Bancorp, Inc. | 630 | 10,653 | ||||||
Urstadt Biddle Properties, Inc. — Class A | 530 | 10,653 | ||||||
Regional Management Corp.* | 653 | 10,650 | ||||||
Healthcare Realty Trust, Inc. | 404 | 10,649 | ||||||
Chatham Lodging Trust | 465 | 10,644 | ||||||
CatchMark Timber Trust, Inc. — Class A | 972 | 10,643 | ||||||
United Bankshares, Inc. | 269 | 10,639 | ||||||
Cascade Bancorp* | 1,894 | 10,625 | ||||||
Park Sterling Corp. | 1,465 | 10,621 | ||||||
GEO Group, Inc. | 329 | 10,617 | ||||||
CU Bancorp* | 440 | 10,613 | ||||||
First Financial Bankshares, Inc. | 319 | 10,609 | ||||||
Alexander & Baldwin, Inc. | 281 | 10,605 | ||||||
Financial Institutions, Inc. | 406 | 10,605 | ||||||
First Business Financial Services, Inc. | 430 | 10,600 | ||||||
Metro Bancorp, Inc. | 342 | 10,595 | ||||||
Capital Bank Financial Corp. — Class A | 328 | 10,594 | ||||||
Baldwin & Lyons, Inc. — Class B | 456 | 10,593 | ||||||
Monogram Residential Trust, Inc. | 1,074 | 10,590 | ||||||
Sandy Spring Bancorp, Inc. | 385 | 10,588 | ||||||
Republic Bancorp, Inc. — Class A | 416 | 10,579 | ||||||
National Bankshares, Inc. | 324 | 10,579 | ||||||
BSB Bancorp, Inc.* | 481 | 10,577 | ||||||
Inland Real Estate Corp. | 1,195 | 10,576 | ||||||
Enstar Group Ltd.* | 67 | 10,573 | ||||||
Forestar Group, Inc.* | 747 | 10,570 | ||||||
Beneficial Bancorp, Inc.* | 762 | 10,569 | ||||||
Whitestone REIT — Class B | 855 | 10,568 | ||||||
Eagle Bancorp, Inc.* | 222 | 10,567 | ||||||
FBL Financial Group, Inc. — Class A | 168 | 10,567 | ||||||
Sun Bancorp, Inc.* | 528 | 10,565 | ||||||
UMH Properties, Inc. | 1,068 | 10,563 | ||||||
Flushing Financial Corp. | 502 | 10,562 | ||||||
United Fire Group, Inc. | 284 | 10,562 | ||||||
Chemical Financial Corp. | 311 | 10,552 | ||||||
Banner Corp. | 215 | 10,550 | ||||||
IBERIABANK Corp. | 174 | 10,550 | ||||||
Safety Insurance Group, Inc. | 182 | 10,547 | ||||||
Seacoast Banking Corporation of Florida* | 681 | 10,542 | ||||||
Glacier Bancorp, Inc. | 385 | 10,534 | ||||||
First Defiance Financial Corp. | 275 | 10,533 | ||||||
First of Long Island Corp. | 379 | 10,525 | ||||||
BancorpSouth, Inc. | 422 | 10,520 | ||||||
Ryman Hospitality Properties, Inc. | 200 | 10,520 | ||||||
First Industrial Realty Trust, Inc. | 485 | 10,515 | ||||||
NBT Bancorp, Inc. | 374 | 10,513 | ||||||
First BanCorp* | 2,773 | 10,510 | ||||||
Physicians Realty Trust | 657 | 10,499 | ||||||
Sterling Bancorp | 682 | 10,496 | ||||||
Kennedy-Wilson Holdings, Inc. | 428 | 10,495 | ||||||
Meridian Bancorp, Inc. | 747 | 10,488 | ||||||
Hilltop Holdings, Inc.* | 500 | 10,485 | ||||||
64 | GUGGENHEIM ETFs ANNUAL REPORT | SEE NOTES TO FINANCIAL STATEMENTS. |
SCHEDULE OF INVESTMENTS (continued) | October 31, 2015 |
GUGGENHEIM RUSSELL 2000® EQUAL WEIGHT ETF |
Shares | Value | |||||||
QCR Holdings, Inc. | 460 | $ | 10,479 | |||||
Trustmark Corp. | 436 | 10,477 | ||||||
Stock Yards Bancorp, Inc. | 278 | 10,475 | ||||||
MainSource Financial Group, Inc. | 484 | 10,474 | ||||||
Union Bankshares Corp. | 418 | 10,471 | ||||||
Lakeland Financial Corp. | 233 | 10,469 | ||||||
Capital City Bank Group, Inc. | 678 | 10,468 | ||||||
Horizon Bancorp | 401 | 10,466 | ||||||
Arrow Financial Corp. | 379 | 10,460 | ||||||
Real Industry, Inc.* | 1,101 | 10,460 | ||||||
Independence Holding Co. | 771 | 10,455 | ||||||
PacWest Bancorp | 232 | 10,449 | ||||||
1st Source Corp. | 329 | 10,449 | ||||||
State National Companies, Inc. | 1,157 | 10,448 | ||||||
Kansas City Life Insurance Co. | 213 | 10,443 | ||||||
Universal Health Realty Income Trust | 210 | 10,435 | ||||||
Third Point Reinsurance Ltd.* | 763 | 10,430 | ||||||
Access National Corp. | 504 | 10,428 | ||||||
Provident Financial Services, Inc. | 513 | 10,424 | ||||||
WesBanco, Inc. | 319 | 10,415 | ||||||
American Assets Trust, Inc. | 247 | 10,414 | ||||||
State Bank Financial Corp. | 486 | 10,400 | ||||||
RE/MAX Holdings, Inc. — Class A | 276 | 10,396 | ||||||
Univest Corporation of Pennsylvania | 528 | 10,396 | ||||||
Northwest Bancshares, Inc. | 772 | 10,391 | ||||||
MidWestOne Financial Group, Inc. | 339 | 10,387 | ||||||
GAMCO Investors, Inc. — Class A | 180 | 10,382 | ||||||
Virtu Financial, Inc. — Class A | 429 | 10,382 | ||||||
Medley Management, Inc. — Class A | 1,414 | 10,379 | ||||||
Texas Capital Bancshares, Inc.* | 188 | 10,378 | ||||||
CubeSmart | 373 | 10,377 | ||||||
Kearny Financial Corp. | 868 | 10,373 | ||||||
Talmer Bancorp, Inc. — Class A | 616 | 10,361 | ||||||
Umpqua Holdings Corp. | 620 | 10,354 | ||||||
Berkshire Hills Bancorp, Inc. | 362 | 10,353 | ||||||
Heartland Financial USA, Inc. | 281 | 10,352 | ||||||
Clifton Bancorp, Inc. | 710 | 10,352 | ||||||
ServisFirst Bancshares, Inc. | 244 | 10,341 | ||||||
Encore Capital Group, Inc.* | 254 | 10,338 | ||||||
EastGroup Properties, Inc. | 184 | 10,333 | ||||||
CNB Financial Corp. | 556 | 10,330 | ||||||
CVB Financial Corp. | 592 | 10,330 | ||||||
Cathay General Bancorp | 330 | 10,329 | ||||||
HomeTrust Bancshares, Inc.* | 545 | 10,322 | ||||||
Hannon Armstrong Sustainable Infrastructure Capital, Inc. | 573 | 10,320 | ||||||
First Financial Bancorp | 535 | 10,315 | ||||||
OneBeacon Insurance Group Ltd. — Class A | 716 | 10,303 | ||||||
Chesapeake Lodging Trust | 374 | 10,300 | ||||||
Houlihan Lokey, Inc. | 470 | 10,298 | ||||||
Preferred Bank/Los Angeles CA | 311 | 10,297 | ||||||
OM Asset Management plc | 678 | 10,292 | ||||||
DiamondRock Hospitality Co. | 881 | 10,290 | ||||||
FirstMerit Corp. | 547 | 10,278 | ||||||
Ashford Hospitality Prime, Inc. | 699 | 10,275 | ||||||
Ashford Hospitality Trust, Inc. | 1,492 | 10,265 | ||||||
Citizens & Northern Corp. | 518 | 10,262 | ||||||
JG Wentworth Co. — Class A* | 2,004 | 10,260 | ||||||
Fox Chase Bancorp, Inc. | 585 | 10,243 | ||||||
National Penn Bancshares, Inc. | 850 | 10,234 | ||||||
MarketAxess Holdings, Inc. | 101 | 10,232 | ||||||
South State Corp. | 132 | 10,230 | ||||||
Financial Engines, Inc. | 318 | 10,227 | ||||||
Prosperity Bancshares, Inc. | 199 | 10,225 | ||||||
CNO Financial Group, Inc. | 532 | 10,220 | ||||||
Preferred Apartment Communities, Inc. — Class A | 933 | 10,216 | ||||||
Donegal Group, Inc. — Class A | 722 | 10,216 | ||||||
Ashford, Inc.* | 159 | 10,216 | ||||||
Meta Financial Group, Inc. | 237 | 10,210 | ||||||
Strategic Hotels & Resorts, Inc.* | 724 | 10,208 | ||||||
Stewart Information Services Corp. | 254 | 10,203 | ||||||
Investors Bancorp, Inc. | 815 | 10,196 | ||||||
TrustCo Bank Corp. NY | 1,636 | 10,192 | ||||||
Dime Community Bancshares, Inc. | 587 | 10,184 | ||||||
Independence Realty Trust, Inc. | 1,299 | 10,184 | ||||||
First Interstate BancSystem, Inc. — Class A | 359 | 10,181 | ||||||
Oritani Financial Corp. | 639 | 10,173 | ||||||
Washington Trust Bancorp, Inc. | 262 | 10,166 | ||||||
CIFC Corp. | 1,469 | 10,165 | ||||||
First Commonwealth Financial Corp. | 1,106 | 10,164 | ||||||
Park National Corp. | 112 | 10,161 | ||||||
Evercore Partners, Inc. — Class A | 188 | 10,152 | ||||||
On Deck Capital, Inc.* | 1,066 | 10,149 | ||||||
Consolidated-Tomoka Land Co. | 198 | 10,148 | ||||||
LaSalle Hotel Properties | 345 | 10,146 | ||||||
Independent Bank Corp. | 217 | 10,143 | ||||||
Ocwen Financial Corp.* | 1,451 | 10,142 | ||||||
Crawford & Co. — Class B | 1,690 | 10,140 | ||||||
First Midwest Bancorp, Inc. | 569 | 10,140 | ||||||
Guaranty Bancorp | 615 | 10,135 | ||||||
BNC Bancorp | 451 | 10,125 | ||||||
First Merchants Corp. | 386 | 10,125 | ||||||
Old National Bancorp | 723 | 10,122 | ||||||
Symetra Financial Corp. | 319 | 10,122 | ||||||
BGC Partners, Inc. — Class A | 1,169 | 10,112 | ||||||
Northfield Bancorp, Inc. | 660 | 10,111 | ||||||
Chambers Street Properties | 1,428 | 10,110 | ||||||
QTS Realty Trust, Inc. — Class A | 235 | 10,107 | ||||||
CenterState Banks, Inc. | 693 | 10,104 | ||||||
BankFinancial Corp. | 819 | 10,098 | ||||||
Triumph Bancorp, Inc.* | 605 | 10,097 | ||||||
Blackhawk Network Holdings, Inc.* | 237 | 10,091 | ||||||
Great Ajax Corp. | 780 | 10,085 | ||||||
OFG Bancorp | 1,095 | 10,085 | ||||||
PRA Group, Inc.* | 184 | 10,083 | ||||||
SEE NOTES TO FINANCIAL STATEMENTS. | GUGGENHEIM ETFs ANNUAL REPORT | 65 |
SCHEDULE OF INVESTMENTS (continued) | October 31, 2015 |
GUGGENHEIM RUSSELL 2000® EQUAL WEIGHT ETF |
Shares | Value | |||||||
Kemper Corp. | 282 | $ | 10,073 | |||||
PennyMac Financial Services, Inc. — Class A* | 609 | 10,073 | ||||||
Hanmi Financial Corp. | 394 | 10,047 | ||||||
National Health Investors, Inc. | 171 | 10,045 | ||||||
Bluerock Residential Growth REIT, Inc. | 857 | 10,044 | ||||||
Tompkins Financial Corp. | 185 | 10,042 | ||||||
Stifel Financial Corp.* | 226 | 10,041 | ||||||
GAIN Capital Holdings, Inc. | 1,347 | 10,035 | ||||||
Ares Commercial Real Estate Corp. | 813 | 10,032 | ||||||
National General Holdings Corp. | 509 | 10,032 | ||||||
LTC Properties, Inc. | 234 | 10,027 | ||||||
TriState Capital Holdings, Inc.* | 802 | 10,017 | ||||||
Anchor BanCorp Wisconsin, Inc.* | 244 | 10,009 | ||||||
Apollo Commercial Real Estate Finance, Inc. | 602 | 9,999 | ||||||
State Auto Financial Corp. | 419 | 9,993 | ||||||
Westamerica Bancorporation | 226 | 9,991 | ||||||
Sun Communities, Inc. | 149 | 9,986 | ||||||
BancFirst Corp. | 162 | 9,984 | ||||||
People’s Utah Bancorp | 606 | 9,975 | ||||||
Horace Mann Educators Corp. | 291 | 9,964 | ||||||
Waterstone Financial, Inc. | 748 | 9,963 | ||||||
Blue Hills Bancorp, Inc. | 702 | 9,961 | ||||||
United Financial Bancorp, Inc. | 767 | 9,956 | ||||||
iStar, Inc.* | 769 | 9,951 | ||||||
Independent Bank Corp. | 687 | 9,948 | ||||||
United Community Banks, Inc. | 493 | 9,939 | ||||||
Starwood Waypoint Residential Trust | 404 | 9,938 | ||||||
Cardinal Financial Corp. | 437 | 9,933 | ||||||
Independent Bank Group, Inc. | 255 | 9,932 | ||||||
ARMOUR Residential REIT, Inc. | 484 | 9,932 | ||||||
Sierra Bancorp | 612 | 9,921 | ||||||
Hudson Pacific Properties, Inc. | 347 | 9,914 | ||||||
Opus Bank | 266 | 9,909 | ||||||
Infinity Property & Casualty Corp. | 123 | 9,904 | ||||||
Southside Bancshares, Inc. | 368 | 9,899 | ||||||
Silver Bay Realty Trust Corp. | 611 | 9,898 | ||||||
MB Financial, Inc. | 307 | 9,898 | ||||||
Community Trust Bancorp, Inc. | 287 | 9,893 | ||||||
Nelnet, Inc. — Class A | 276 | 9,875 | ||||||
Medical Properties Trust, Inc. | 872 | 9,854 | ||||||
Camden National Corp. | 252 | 9,851 | ||||||
Stonegate Bank | 315 | 9,831 | ||||||
Hancock Holding Co. | 356 | 9,826 | ||||||
Fidelity Southern Corp. | 469 | 9,826 | ||||||
Hampton Roads Bankshares, Inc.* | 5,311 | 9,825 | ||||||
Boston Private Financial Holdings, Inc. | 857 | 9,821 | ||||||
UMB Financial Corp. | 200 | 9,816 | ||||||
Wilshire Bancorp, Inc. | 917 | 9,803 | ||||||
Dynex Capital, Inc. | 1,478 | 9,799 | ||||||
S&T Bancorp, Inc. | 307 | 9,787 | ||||||
City Holding Co. | 204 | 9,757 | ||||||
NexPoint Residential Trust, Inc. | 740 | 9,753 | ||||||
AG Mortgage Investment Trust, Inc. | 641 | 9,750 | ||||||
Colony Capital, Inc. — Class A | 479 | 9,743 | ||||||
Government Properties Income Trust | 598 | 9,735 | ||||||
American Residential Properties, Inc. | 587 | 9,727 | ||||||
First American Financial Corp. | 255 | 9,723 | ||||||
Franklin Street Properties Corp. | 933 | 9,722 | ||||||
Calamos Asset Management, Inc. — Class A | 1,031 | 9,681 | ||||||
MGIC Investment Corp.* | 1,029 | 9,673 | ||||||
InfraREIT, Inc. | 405 | 9,671 | ||||||
HFF, Inc. — Class A | 280 | 9,666 | ||||||
American Capital Mortgage Investment Corp. | 665 | 9,649 | ||||||
RLJ Lodging Trust | 384 | 9,635 | ||||||
United Development Funding IV | 560 | 9,632 | ||||||
CoBiz Financial, Inc. | 772 | 9,619 | ||||||
Greenlight Capital Re Ltd. — Class A* | 438 | 9,618 | ||||||
Resource Capital Corp. | 749 | 9,617 | ||||||
Wintrust Financial Corp. | 190 | 9,593 | ||||||
NMI Holdings, Inc. — Class A* | 1,274 | 9,580 | ||||||
Heritage Financial Corp. | 520 | 9,578 | ||||||
Xenia Hotels & Resorts, Inc. | 552 | 9,572 | ||||||
ConnectOne Bancorp, Inc. | 536 | 9,568 | ||||||
Bank Mutual Corp. | 1,319 | 9,550 | ||||||
Capstead Mortgage Corp. | 989 | 9,544 | ||||||
Piper Jaffray Cos.* | 268 | 9,533 | ||||||
Pebblebrook Hotel Trust | 278 | 9,502 | ||||||
LegacyTexas Financial Group, Inc. | 331 | 9,500 | ||||||
Astoria Financial Corp. | 595 | 9,496 | ||||||
CareTrust REIT, Inc. | 837 | 9,475 | ||||||
Ladder Capital Corp. — Class A | 663 | 9,454 | ||||||
Hatteras Financial Corp. | 660 | 9,445 | ||||||
Bryn Mawr Bank Corp. | 324 | 9,438 | ||||||
Apollo Residential Mortgage, Inc. | 732 | 9,421 | ||||||
Sabra Health Care REIT, Inc. | 415 | 9,412 | ||||||
Essent Group Ltd.* | 390 | 9,399 | ||||||
Marcus & Millichap, Inc.* | 215 | 9,368 | ||||||
Orchid Island Capital, Inc. | 1,050 | 9,324 | ||||||
Anworth Mortgage Asset Corp. | 1,953 | 9,316 | ||||||
Invesco Mortgage Capital, Inc. | 773 | 9,315 | ||||||
Redwood Trust, Inc. | 697 | 9,256 | ||||||
PennyMac Mortgage Investment Trust | 627 | 9,167 | ||||||
Nationstar Mortgage Holdings, Inc.* | 689 | 9,143 | ||||||
Altisource Residential Corp. | 634 | 9,123 | ||||||
New York Mortgage Trust, Inc. | 1,601 | 9,094 | ||||||
Cowen Group, Inc. — Class A* | 2,154 | 9,068 | ||||||
HomeStreet, Inc.* | 432 | 9,042 | ||||||
Peoples Bancorp, Inc. | 469 | 8,986 | ||||||
Heritage Commerce Corp. | 849 | 8,982 | ||||||
New Senior Investment Group, Inc. | 896 | 8,978 | ||||||
Radian Group, Inc. | 620 | 8,971 | ||||||
Oppenheimer Holdings, Inc. — Class A | 487 | 8,936 | ||||||
eHealth, Inc.* | 741 | 8,855 | ||||||
Arlington Asset Investment Corp. — Class A | 636 | 8,809 | ||||||
New Residential Investment Corp. | 726 | 8,806 | ||||||
EverBank Financial Corp. | 509 | 8,785 | ||||||
66 | GUGGENHEIM ETFs ANNUAL REPORT | SEE NOTES TO FINANCIAL STATEMENTS. |
SCHEDULE OF INVESTMENTS (continued) | October 31, 2015 |
GUGGENHEIM RUSSELL 2000® EQUAL WEIGHT ETF |
Shares | Value | |||||||
RAIT Financial Trust | 1,796 | $ | 8,711 | |||||
Western Asset Mortgage Capital Corp. | 755 | 8,622 | ||||||
FNFV Group* | 757 | 8,509 | ||||||
Greenhill & Company, Inc. | 326 | 8,417 | ||||||
Bancorp, Inc.* | 1,112 | 8,006 | ||||||
Trupanion, Inc.* | 1,217 | 7,996 | ||||||
Fifth Street Asset Management, Inc. | 1,324 | 7,759 | ||||||
Stonegate Mortgage Corp.* | 1,353 | 7,753 | ||||||
Live Oak Bancshares, Inc. | 507 | 7,270 | ||||||
Walter Investment Management Corp.* | 559 | 6,686 | ||||||
RCS Capital Corp. — Class A* | 8,804 | 6,674 | ||||||
BofI Holding, Inc.* | 80 | 6,401 | ||||||
6D Global Technologies, Inc.*,†††,2 | 2,961 | — | ||||||
Total Financial | 4,745,331 | |||||||
Consumer, Cyclical - 10.8% | ||||||||
Core-Mark Holding Company, Inc. | 1,574 | 127,949 | ||||||
PetMed Express, Inc. | 6,276 | 105,562 | ||||||
Casey’s General Stores, Inc. | 979 | 103,989 | ||||||
Freshpet, Inc.* | 9,978 | 97,286 | ||||||
Green Brick Partners, Inc.* | 6,079 | 64,134 | ||||||
Veritiv Corp.* | 1,081 | 45,402 | ||||||
Unifi, Inc.* | 1,426 | 43,622 | ||||||
Beacon Roofing Supply, Inc.* | 1,225 | 43,353 | ||||||
Republic Airways Holdings, Inc.* | 6,656 | 38,338 | ||||||
Culp, Inc. | 1,272 | 38,173 | ||||||
Interface, Inc. — Class A | 1,831 | 35,796 | ||||||
Installed Building Products, Inc.* | 1,595 | 35,328 | ||||||
CalAtlantic Group, Inc. | 732 | 27,882 | ||||||
Hawaiian Holdings, Inc.* | 794 | 27,552 | ||||||
Flexsteel Industries, Inc. | 516 | 22,440 | ||||||
Wabash National Corp.* | 1,854 | 22,192 | ||||||
Herman Miller, Inc. | 696 | 22,084 | ||||||
H&E Equipment Services, Inc. | 1,142 | 22,052 | ||||||
SkyWest, Inc. | 1,157 | 22,029 | ||||||
Cavco Industries, Inc.* | 223 | 21,988 | ||||||
Miller Industries, Inc. | 958 | 21,728 | ||||||
Kimball International, Inc. — Class B | 1,951 | 21,305 | ||||||
Mobile Mini, Inc. | 621 | 21,263 | ||||||
Douglas Dynamics, Inc. | 965 | 21,171 | ||||||
Liberty TripAdvisor Holdings, Inc. — Class A* | 666 | 20,773 | ||||||
Titan Machinery, Inc.* | 1,696 | 20,742 | ||||||
Steelcase, Inc. — Class A | 1,065 | 20,672 | ||||||
Modine Manufacturing Co.* | 2,455 | 20,549 | ||||||
Essendant, Inc. | 594 | 20,535 | ||||||
Blue Bird Corp.* | 1,890 | 20,450 | ||||||
Tenneco, Inc.* | 360 | 20,372 | ||||||
Regis Corp.* | 1,223 | 20,204 | ||||||
Commercial Vehicle Group, Inc.* | 4,855 | 20,197 | ||||||
Titan International, Inc. | 2,812 | 19,966 | ||||||
Knoll, Inc. | 858 | 19,940 | ||||||
Standard Motor Products, Inc. | 448 | 19,824 | ||||||
PC Connection, Inc. | 851 | 19,777 | ||||||
Carmike Cinemas, Inc.* | 762 | 19,515 | ||||||
Virgin America, Inc.* | 547 | 19,479 | ||||||
Accuride Corp.* | 6,894 | 19,441 | ||||||
Systemax, Inc.* | 2,086 | 19,337 | ||||||
HNI Corp. | 449 | 19,280 | ||||||
Wesco Aircraft Holdings, Inc.* | 1,542 | 19,213 | ||||||
Boyd Gaming Corp.* | 960 | 19,191 | ||||||
Reading International, Inc. — Class A* | 1,237 | 19,174 | ||||||
Pep Boys-Manny Moe & Jack* | 1,273 | 19,146 | ||||||
UniFirst Corp. | 181 | 19,018 | ||||||
Daktronics, Inc. | 1,959 | 19,002 | ||||||
Tower International, Inc. | 686 | 18,844 | ||||||
DTS, Inc.* | 633 | 18,838 | ||||||
G&K Services, Inc. — Class A | 284 | 18,693 | ||||||
Rentrak Corp.* | 338 | 18,651 | ||||||
Vince Holding Corp.* | 4,090 | 18,610 | ||||||
Diamond Resorts International, Inc.* | 654 | 18,600 | ||||||
Monarch Casino & Resort, Inc.* | 847 | 18,583 | ||||||
Cherokee, Inc.* | 1,023 | 18,567 | ||||||
Rush Enterprises, Inc. — Class A* | 759 | 18,504 | ||||||
DreamWorks Animation SKG, Inc. — Class A* | 911 | 18,439 | ||||||
Fox Factory Holding Corp.* | 1,037 | 18,407 | ||||||
American Axle & Manufacturing Holdings, Inc.* | 824 | 18,260 | ||||||
Sonic Automotive, Inc. — Class A | 732 | 18,256 | ||||||
Christopher & Banks Corp.* | 12,499 | 18,249 | ||||||
Nautilus, Inc.* | 1,070 | 18,233 | ||||||
Sonic Corp. | 637 | 18,179 | ||||||
Cooper-Standard Holding, Inc.* | 279 | 18,146 | ||||||
Tile Shop Holdings, Inc.* | 1,250 | 18,138 | ||||||
Callaway Golf Co. | 1,809 | 18,000 | ||||||
Francesca’s Holdings Corp.* | 1,257 | 17,862 | ||||||
Citi Trends, Inc. | 665 | 17,669 | ||||||
Navistar International Corp.* | 1,436 | 17,663 | ||||||
Fred’s, Inc. — Class A | 1,277 | 17,661 | ||||||
iRobot Corp.* | 585 | 17,556 | ||||||
Caesars Entertainment Corp.* | 2,179 | 17,541 | ||||||
Pool Corp. | 215 | 17,531 | ||||||
Gentherm, Inc.* | 356 | 17,501 | ||||||
Zumiez, Inc.* | 997 | 17,428 | ||||||
Allegiant Travel Co. — Class A | 88 | 17,376 | ||||||
West Marine, Inc.* | 1,702 | 17,326 | ||||||
MarineMax, Inc.* | 1,094 | 17,285 | ||||||
Barnes & Noble Education, Inc.* | 1,169 | 17,243 | ||||||
SeaWorld Entertainment, Inc. | 865 | 17,239 | ||||||
Winnebago Industries, Inc. | 819 | 17,191 | ||||||
Churchill Downs, Inc. | 117 | 17,179 | ||||||
Weyco Group, Inc. | 605 | 17,176 | ||||||
NACCO Industries, Inc. — Class A | 382 | 17,125 | ||||||
Cato Corp. — Class A | 453 | 17,105 | ||||||
Bassett Furniture Industries, Inc. | 535 | 17,099 | ||||||
Eldorado Resorts, Inc.* | 1,727 | 17,097 | ||||||
American Woodmark Corp.* | 235 | 17,085 | ||||||
Iconix Brand Group, Inc.* | 1,114 | 17,066 | ||||||
SEE NOTES TO FINANCIAL STATEMENTS. | GUGGENHEIM ETFs ANNUAL REPORT | 67 |
SCHEDULE OF INVESTMENTS (continued) | October 31, 2015 |
GUGGENHEIM RUSSELL 2000® EQUAL WEIGHT ETF |
Shares | Value | |||||||
Metaldyne Performance Group, Inc. | 781 | $ | 17,041 | |||||
International Speedway Corp. — Class A | 491 | 17,033 | ||||||
PriceSmart, Inc. | 198 | 17,024 | ||||||
Federal-Mogul Holdings Corp.* | 2,192 | 16,988 | ||||||
MCBC Holdings, Inc.* | 1,284 | 16,910 | ||||||
Lithia Motors, Inc. — Class A | 144 | 16,904 | ||||||
Caesars Acquisition Co. — Class A* | 2,308 | 16,895 | ||||||
Habit Restaurants, Inc. — Class A* | 707 | 16,883 | ||||||
Motorcar Parts of America, Inc.* | 498 | 16,763 | ||||||
AMC Entertainment Holdings, Inc. — Class A | 612 | 16,750 | ||||||
Universal Electronics, Inc.* | 352 | 16,745 | ||||||
Lifetime Brands, Inc. | 1,089 | 16,738 | ||||||
Marine Products Corp. | 2,364 | 16,714 | ||||||
National CineMedia, Inc. | 1,177 | 16,713 | ||||||
Marcus Corp. | 807 | 16,697 | ||||||
Express, Inc.* | 864 | 16,675 | ||||||
New Home Company, Inc.* | 1,163 | 16,643 | ||||||
Dana Holding Corp. | 990 | 16,632 | ||||||
Restoration Hardware Holdings, Inc.* | 161 | 16,598 | ||||||
Hovnanian Enterprises, Inc. — Class A* | 8,055 | 16,593 | ||||||
Vail Resorts, Inc. | 145 | 16,555 | ||||||
Biglari Holdings, Inc.* | 43 | 16,518 | ||||||
Libbey, Inc. | 491 | 16,517 | ||||||
Cooper Tire & Rubber Co. | 395 | 16,507 | ||||||
Empire Resorts, Inc.* | 3,557 | 16,504 | ||||||
Penn National Gaming, Inc.* | 922 | 16,467 | ||||||
Superior Industries International, Inc. | 836 | 16,452 | ||||||
Genesco, Inc.* | 262 | 16,414 | ||||||
ScanSource, Inc.* | 475 | 16,392 | ||||||
Potbelly Corp.* | 1,463 | 16,386 | ||||||
America’s Car-Mart, Inc.* | 478 | 16,367 | ||||||
Speedway Motorsports, Inc. | 885 | 16,346 | ||||||
La-Z-Boy, Inc. | 572 | 16,331 | ||||||
Kirkland’s, Inc. | 710 | 16,323 | ||||||
El Pollo Loco Holdings, Inc.* | 1,408 | 16,164 | ||||||
Isle of Capri Casinos, Inc.* | 844 | 16,146 | ||||||
Belmond Ltd. — Class A* | 1,498 | 16,089 | ||||||
HSN, Inc. | 260 | 16,081 | ||||||
Johnson Outdoors, Inc. — Class A | 749 | 16,051 | ||||||
Noodles & Co.* | 1,081 | 15,966 | ||||||
Intrawest Resorts Holdings, Inc.* | 1,776 | 15,913 | ||||||
Outerwall, Inc. | 265 | 15,900 | ||||||
Barnes & Noble, Inc. | 1,222 | 15,874 | ||||||
WCI Communities, Inc.* | 664 | 15,863 | ||||||
Five Below, Inc.* | 460 | 15,796 | ||||||
Papa John’s International, Inc. | 225 | 15,788 | ||||||
TiVo, Inc.* | 1,735 | 15,754 | ||||||
Remy International, Inc. | 534 | 15,748 | ||||||
Group 1 Automotive, Inc. | 181 | 15,738 | ||||||
Winmark Corp. | 156 | 15,717 | ||||||
Bravo Brio Restaurant Group, Inc.* | 1,338 | 15,708 | ||||||
Destination XL Group, Inc.* | 2,685 | 15,680 | ||||||
Tilly’s, Inc. — Class A* | 2,149 | 15,666 | ||||||
Popeyes Louisiana Kitchen, Inc.* | 277 | 15,634 | ||||||
Hooker Furniture Corp. | 628 | 15,587 | ||||||
Steiner Leisure Ltd.* | 246 | 15,587 | ||||||
Malibu Boats, Inc. — Class A* | 1,095 | 15,560 | ||||||
BJ’s Restaurants, Inc.* | 362 | 15,541 | ||||||
Mattress Firm Holding Corp.* | 364 | 15,495 | ||||||
Vera Bradley, Inc.* | 1,238 | 15,487 | ||||||
Meritor, Inc.* | 1,423 | 15,468 | ||||||
Morgans Hotel Group Co.* | 4,305 | 15,455 | ||||||
Ascena Retail Group, Inc.* | 1,160 | 15,451 | ||||||
Lumber Liquidators Holdings, Inc.* | 1,115 | 15,409 | ||||||
Pinnacle Entertainment, Inc.* | 440 | 15,404 | ||||||
Superior Uniform Group, Inc. | 904 | 15,404 | ||||||
Chuy’s Holdings, Inc.* | 564 | 15,346 | ||||||
Oxford Industries, Inc. | 210 | 15,292 | ||||||
LGI Homes, Inc.* | 544 | 15,248 | ||||||
Del Frisco’s Restaurant Group, Inc.* | 1,132 | 15,248 | ||||||
Pier 1 Imports, Inc. | 2,053 | 15,233 | ||||||
Ethan Allen Interiors, Inc. | 559 | 15,210 | ||||||
Strattec Security Corp. | 254 | 15,194 | ||||||
Stage Stores, Inc. | 1,561 | 15,189 | ||||||
Select Comfort Corp.* | 715 | 15,158 | ||||||
Ollie’s Bargain Outlet Holdings, Inc.* | 956 | 15,153 | ||||||
Movado Group, Inc. | 588 | 15,135 | ||||||
Red Robin Gourmet Burgers, Inc.* | 202 | 15,128 | ||||||
Shoe Carnival, Inc. | 672 | 15,100 | ||||||
Haverty Furniture Companies, Inc. | 644 | 15,076 | ||||||
Abercrombie & Fitch Co. — Class A | 711 | 15,066 | ||||||
Caleres, Inc. | 493 | 15,066 | ||||||
Bob Evans Farms, Inc. | 348 | 15,058 | ||||||
Guess?, Inc. | 715 | 15,051 | ||||||
Asbury Automotive Group, Inc.* | 190 | 15,048 | ||||||
Denny’s Corp.* | 1,372 | 15,037 | ||||||
Ruth’s Hospitality Group, Inc. | 966 | 14,983 | ||||||
American Eagle Outfitters, Inc. | 977 | 14,929 | ||||||
Taylor Morrison Home Corp. — Class A* | 810 | 14,928 | ||||||
Party City Holdco, Inc.* | 943 | 14,928 | ||||||
Deckers Outdoor Corp.* | 268 | 14,917 | ||||||
Skullcandy, Inc.* | 2,662 | 14,907 | ||||||
Perry Ellis International, Inc.* | 692 | 14,857 | ||||||
Dave & Buster’s Entertainment, Inc.* | 385 | 14,853 | ||||||
Marriott Vacations Worldwide Corp. | 230 | 14,812 | ||||||
Bojangles’, Inc.* | 890 | 14,801 | ||||||
Buckle, Inc. | 417 | 14,778 | ||||||
Cracker Barrel Old Country Store, Inc. | 107 | 14,708 | ||||||
Big Lots, Inc. | 319 | 14,706 | ||||||
La Quinta Holdings, Inc.* | 970 | 14,696 | ||||||
Children’s Place, Inc. | 273 | 14,652 | ||||||
Finish Line, Inc. — Class A | 785 | 14,625 | ||||||
Burlington Stores, Inc.* | 304 | 14,616 | ||||||
Jack in the Box, Inc. | 196 | 14,608 | ||||||
MDC Holdings, Inc. | 562 | 14,606 | ||||||
William Lyon Homes — Class A* | 684 | 14,597 | ||||||
68 | GUGGENHEIM ETFs ANNUAL REPORT | SEE NOTES TO FINANCIAL STATEMENTS. |
SCHEDULE OF INVESTMENTS (continued) | October 31, 2015 |
GUGGENHEIM RUSSELL 2000® EQUAL WEIGHT ETF |
Shares | Value | |||||||
Carrols Restaurant Group, Inc.* | 1,241 | $ | 14,594 | |||||
Beazer Homes USA, Inc.* | 1,023 | 14,568 | ||||||
Horizon Global Corp.* | 1,657 | 14,565 | ||||||
Dorman Products, Inc.* | 312 | 14,564 | ||||||
TRI Pointe Group, Inc.* | 1,115 | 14,473 | ||||||
Fogo De Chao, Inc.* | 958 | 14,466 | ||||||
Hibbett Sports, Inc.* | 423 | 14,450 | ||||||
Scientific Games Corp. — Class A* | 1,302 | 14,439 | ||||||
Men’s Wearhouse, Inc. | 361 | 14,433 | ||||||
Zoe’s Kitchen, Inc.* | 419 | 14,426 | ||||||
Shake Shack, Inc. — Class A* | 316 | 14,400 | ||||||
ClubCorp Holdings, Inc. | 704 | 14,390 | ||||||
Interval Leisure Group, Inc. | 813 | 14,349 | ||||||
Meritage Homes Corp.* | 406 | 14,316 | ||||||
Columbia Sportswear Co. | 260 | 14,261 | ||||||
Century Communities, Inc.* | 745 | 14,215 | ||||||
Wingstop, Inc.* | 614 | 14,202 | ||||||
Steven Madden Ltd.* | 406 | 14,149 | ||||||
Krispy Kreme Doughnuts, Inc.* | 1,033 | 14,142 | ||||||
Jamba, Inc.* | 1,065 | 14,111 | ||||||
Planet Fitness, Inc. — Class A* | 863 | 14,101 | ||||||
KB Home | 1,076 | 14,096 | ||||||
M/I Homes, Inc.* | 614 | 14,091 | ||||||
Texas Roadhouse, Inc. — Class A | 410 | 14,084 | ||||||
DineEquity, Inc. | 168 | 14,020 | ||||||
Sportsman’s Warehouse Holdings, Inc.* | 1,298 | 13,966 | ||||||
Bloomin’ Brands, Inc. | 819 | 13,898 | ||||||
Cheesecake Factory, Inc. | 287 | 13,833 | ||||||
Escalade, Inc. | 929 | 13,777 | ||||||
Stein Mart, Inc. | 1,547 | 13,706 | ||||||
JAKKS Pacific, Inc.* | 1,729 | 13,694 | ||||||
Vitamin Shoppe, Inc.* | 476 | 13,656 | ||||||
Arctic Cat, Inc. | 652 | 13,392 | ||||||
Black Diamond, Inc.* | 2,404 | 13,318 | ||||||
Big 5 Sporting Goods Corp. | 1,455 | 13,313 | ||||||
Chico’s FAS, Inc. | 960 | 13,267 | ||||||
Sequential Brands Group, Inc.* | 1,060 | 13,261 | ||||||
Boot Barn Holdings, Inc.* | 882 | 13,230 | ||||||
Papa Murphy’s Holdings, Inc.* | 953 | 13,161 | ||||||
G-III Apparel Group Ltd.* | 237 | 13,056 | ||||||
J Alexander’s Holdings, Inc.* | 1,347 | 12,985 | ||||||
Ruby Tuesday, Inc.* | 2,469 | 12,913 | ||||||
Build-A-Bear Workshop, Inc. — Class A* | 827 | 12,868 | ||||||
Performance Sports Group Ltd.* | 1,119 | 12,846 | ||||||
Wolverine World Wide, Inc. | 691 | 12,832 | ||||||
Tuesday Morning Corp.* | 2,281 | 12,340 | ||||||
Buffalo Wild Wings, Inc.* | 79 | 12,187 | ||||||
Cash America International, Inc. | 352 | 12,155 | ||||||
Kona Grill, Inc.* | 882 | 12,128 | ||||||
Flex Pharma, Inc.* | 1,065 | 12,066 | ||||||
Fiesta Restaurant Group, Inc.* | 337 | 11,916 | ||||||
Conn’s, Inc.* | 627 | 11,894 | ||||||
Container Store Group, Inc.* | 1,025 | 11,695 | ||||||
Crocs, Inc.* | 1,082 | 11,686 | ||||||
VOXX International Corp. — Class A* | 2,161 | 11,151 | ||||||
EZCORP, Inc. — Class A* | 1,552 | 10,336 | ||||||
AV Homes, Inc.* | 731 | 9,678 | ||||||
First Cash Financial Services, Inc.* | 246 | 9,385 | ||||||
Eros International plc* | 570 | 6,367 | ||||||
Total Consumer, Cyclical | 4,725,162 | |||||||
Energy - 10.1% | ||||||||
Bill Barrett Corp.* | 22,295 | 108,577 | ||||||
Clayton Williams Energy, Inc.* | 1,552 | 92,453 | ||||||
EXCO Resources, Inc.* | 81,380 | 91,146 | ||||||
RSP Permian, Inc.* | 3,220 | 88,292 | ||||||
Solazyme, Inc.* | 26,574 | 87,163 | ||||||
Pattern Energy Group, Inc. | 3,646 | 85,280 | ||||||
Bonanza Creek Energy, Inc.* | 14,862 | 84,565 | ||||||
Oasis Petroleum, Inc.* | 7,162 | 83,294 | ||||||
Matador Resources Co.* | 3,133 | 80,549 | ||||||
C&J Energy Services Ltd.* | 15,956 | 79,621 | ||||||
Parsley Energy, Inc. — Class A* | 4,447 | 78,845 | ||||||
Callon Petroleum Co.* | 9,031 | 78,389 | ||||||
Carrizo Oil & Gas, Inc.* | 2,074 | 78,045 | ||||||
Archrock, Inc. | 3,541 | 76,981 | ||||||
Trecora Resources* | 5,372 | 76,497 | ||||||
Clean Energy Fuels Corp.* | 13,507 | 76,315 | ||||||
Evolution Petroleum Corp. | 11,054 | 76,273 | ||||||
Northern Oil and Gas, Inc.* | 15,071 | 75,958 | ||||||
Helix Energy Solutions Group, Inc.* | 12,994 | 75,105 | ||||||
Cloud Peak Energy, Inc.* | 25,136 | 74,655 | ||||||
PDC Energy, Inc.* | 1,225 | 73,917 | ||||||
Natural Gas Services Group, Inc.* | 3,233 | 72,807 | ||||||
Par Pacific Holdings, Inc.* | 3,193 | 72,800 | ||||||
Sanchez Energy Corp.* | 12,215 | 72,679 | ||||||
Panhandle Oil and Gas, Inc. — Class A | 3,937 | 72,362 | ||||||
Synergy Resources Corp.* | 6,434 | 71,996 | ||||||
Unit Corp.* | 5,666 | 71,448 | ||||||
Tesco Corp. | 8,882 | 71,056 | ||||||
REX American Resources Corp.* | 1,292 | 70,944 | ||||||
Oil States International, Inc.* | 2,351 | 70,554 | ||||||
Green Plains, Inc. | 3,421 | 70,165 | ||||||
Atwood Oceanics, Inc. | 4,214 | 69,742 | ||||||
TETRA Technologies, Inc.* | 10,319 | 69,550 | ||||||
Geospace Technologies Corp.* | 4,478 | 68,782 | ||||||
Parker Drilling Co.* | 24,025 | 68,712 | ||||||
Jones Energy, Inc. — Class A* | 13,073 | 67,195 | ||||||
Flotek Industries, Inc.* | 3,702 | 67,006 | ||||||
Pioneer Energy Services Corp.* | 28,934 | 66,838 | ||||||
Stone Energy Corp.* | 11,945 | 66,773 | ||||||
Newpark Resources, Inc.* | 11,647 | 65,922 | ||||||
Vivint Solar, Inc.* | 5,551 | 65,668 | ||||||
McDermott International, Inc.* | 14,184 | 65,388 | ||||||
Forum Energy Technologies, Inc.* | 4,933 | 65,362 | ||||||
Matrix Service Co.* | 2,821 | 64,037 | ||||||
FutureFuel Corp. | 4,132 | 63,674 | ||||||
SEE NOTES TO FINANCIAL STATEMENTS. | GUGGENHEIM ETFs ANNUAL REPORT | 69 |
SCHEDULE OF INVESTMENTS (continued) | October 31, 2015 |
GUGGENHEIM RUSSELL 2000® EQUAL WEIGHT ETF |
Shares | Value | |||||||
TerraForm Global, Inc. — Class A* | 8,188 | $ | 62,474 | |||||
SEACOR Holdings, Inc.* | 1,061 | 61,984 | ||||||
SemGroup Corp. — Class A | 1,359 | 61,902 | ||||||
Delek US Holdings, Inc. | 2,237 | 60,846 | ||||||
Contango Oil & Gas Co.* | 7,930 | 60,665 | ||||||
Alon USA Energy, Inc. | 3,613 | 60,518 | ||||||
Fairmount Santrol Holdings, Inc.* | 22,605 | 60,355 | ||||||
Western Refining, Inc. | 1,450 | 60,349 | ||||||
Basic Energy Services, Inc.* | 16,154 | 59,931 | ||||||
Renewable Energy Group, Inc.* | 7,588 | 59,869 | ||||||
Ultra Petroleum Corp.* | 10,586 | 58,011 | ||||||
Pacific Ethanol, Inc.* | 9,617 | 57,798 | ||||||
CARBO Ceramics, Inc. | 3,120 | 54,662 | ||||||
Peabody Energy Corp.* | 3,557 | 45,494 | ||||||
Sunrun, Inc.* | 5,849 | 43,341 | ||||||
MRC Global, Inc.* | 3,482 | 41,436 | ||||||
SunCoke Energy, Inc. | 7,988 | 39,620 | ||||||
Westmoreland Coal Co.* | 4,715 | 33,759 | ||||||
Bristow Group, Inc. | 702 | 24,380 | ||||||
Plug Power, Inc.* | 10,037 | 24,189 | ||||||
Thermon Group Holdings, Inc.* | 926 | 18,622 | ||||||
Gulfmark Offshore, Inc. — Class A | 2,849 | 17,778 | ||||||
PHI, Inc.* | 915 | 17,422 | ||||||
Total Energy | 4,458,785 | |||||||
Communications - 9.8% | ||||||||
Iridium Communications, Inc.* | 11,608 | 95,302 | ||||||
8x8, Inc.* | 8,775 | 93,541 | ||||||
Cogent Communications Holdings, Inc. | 2,825 | 86,784 | ||||||
General Communication, Inc. — Class A* | 4,218 | 85,900 | ||||||
Globalstar, Inc.* | 47,094 | 84,768 | ||||||
Cincinnati Bell, Inc.* | 22,279 | 83,992 | ||||||
Consolidated Communications Holdings, Inc. | 3,711 | 82,013 | ||||||
Hawaiian Telcom Holdco, Inc.* | 3,560 | 81,240 | ||||||
Shenandoah Telecommunications Co. | 1,732 | 81,040 | ||||||
j2 Global, Inc. | 1,042 | 80,807 | ||||||
Lumos Networks Corp. | 6,119 | 79,302 | ||||||
West Corp. | 3,300 | 78,573 | ||||||
ORBCOMM, Inc.* | 13,217 | 78,509 | ||||||
Atlantic Tele-Network, Inc. | 1,007 | 76,955 | ||||||
FairPoint Communications, Inc.* | 4,779 | 76,655 | ||||||
Spok Holdings, Inc. | 4,242 | 76,483 | ||||||
RigNet, Inc.* | 2,549 | 76,470 | ||||||
Premiere Global Services, Inc.* | 5,484 | 75,021 | ||||||
Vonage Holdings Corp.* | 12,300 | 74,661 | ||||||
Gogo, Inc.* | 5,083 | 71,824 | ||||||
Windstream Holdings, Inc. | 10,707 | 69,703 | ||||||
Boingo Wireless, Inc.* | 8,859 | 68,480 | ||||||
Inteliquent, Inc. | 3,301 | 68,397 | ||||||
IDT Corp. — Class B | 5,031 | 65,151 | ||||||
Intelsat S.A.* | 9,714 | 64,307 | ||||||
Straight Path Communications, Inc. — Class B* | 1,780 | 55,180 | ||||||
Journal Media Group, Inc. | 2,152 | 26,340 | ||||||
Angie’s List, Inc.* | 3,132 | 24,211 | ||||||
NETGEAR, Inc.* | 582 | 24,095 | ||||||
DHI Group, Inc.* | 2,618 | 23,693 | ||||||
Polycom, Inc.* | 1,699 | 23,412 | ||||||
Preformed Line Products Co. | 537 | 22,822 | ||||||
ShoreTel, Inc.* | 2,319 | 21,891 | ||||||
NeoPhotonics Corp.* | 2,623 | 21,692 | ||||||
Oclaro, Inc.* | 7,254 | 21,255 | ||||||
Liquidity Services, Inc.* | 2,573 | 21,074 | ||||||
EW Scripps Co. — Class A | 945 | 20,846 | ||||||
Media General, Inc.* | 1,401 | 20,819 | ||||||
Wix.com Ltd.* | 940 | 20,793 | ||||||
TeleCommunication Systems, Inc. — Class A* | 5,074 | 20,753 | ||||||
Zix Corp.* | 3,983 | 20,632 | ||||||
Entravision Communications Corp. — Class A | 2,350 | 20,586 | ||||||
A10 Networks, Inc.* | 2,866 | 20,578 | ||||||
TrueCar, Inc.* | 3,343 | 20,526 | ||||||
Gigamon, Inc.* | 774 | 20,302 | ||||||
Aerohive Networks, Inc.* | 2,970 | 20,018 | ||||||
Saga Communications, Inc. — Class A | 465 | 20,005 | ||||||
Global Eagle Entertainment, Inc.* | 1,501 | 19,993 | ||||||
Ciena Corp.* | 824 | 19,891 | ||||||
CalAmp Corp.* | 1,046 | 19,832 | ||||||
Anixter International, Inc.* | 288 | 19,751 | ||||||
Bankrate, Inc.* | 1,658 | 19,680 | ||||||
Gray Television, Inc.* | 1,237 | 19,656 | ||||||
Textura Corp.* | 665 | 19,524 | ||||||
HC2 Holdings, Inc.* | 2,569 | 19,422 | ||||||
United Online, Inc.* | 1,647 | 19,237 | ||||||
Sonus Networks, Inc.* | 2,870 | 18,971 | ||||||
Web.com Group, Inc.* | 803 | 18,846 | ||||||
EarthLink Holdings Corp. | 2,191 | 18,733 | ||||||
Extreme Networks, Inc.* | 5,213 | 18,715 | ||||||
Nexstar Broadcasting Group, Inc. — Class A | 351 | 18,683 | ||||||
Harte-Hanks, Inc. | 4,377 | 18,602 | ||||||
Sinclair Broadcast Group, Inc. — Class A | 618 | 18,546 | ||||||
Travelzoo, Inc.* | 2,064 | 18,452 | ||||||
Wayfair, Inc. — Class A* | 434 | 18,345 | ||||||
NIC, Inc. | 967 | 18,344 | ||||||
Lionbridge Technologies, Inc.* | 3,403 | 18,342 | ||||||
Perficient, Inc.* | 1,094 | 18,292 | ||||||
Rubicon Project, Inc.* | 1,203 | 18,237 | ||||||
ePlus, Inc.* | 216 | 18,235 | ||||||
ModusLink Global Solutions, Inc.* | 6,267 | 18,111 | ||||||
Tribune Publishing Co. | 1,917 | 18,097 | ||||||
InterDigital, Inc. | 356 | 18,063 | ||||||
Reis, Inc. | 739 | 17,987 | ||||||
RetailMeNot, Inc.* | 2,046 | 17,984 | ||||||
ADTRAN, Inc. | 1,158 | 17,984 | ||||||
VASCO Data Security International, Inc.* | 944 | 17,945 | ||||||
TechTarget, Inc.* | 1,922 | 17,932 | ||||||
Shutterfly, Inc.* | 429 | 17,894 | ||||||
Plantronics, Inc. | 333 | 17,855 | ||||||
70 | GUGGENHEIM ETFs ANNUAL REPORT | SEE NOTES TO FINANCIAL STATEMENTS. |
SCHEDULE OF INVESTMENTS (continued) | October 31, 2015 |
GUGGENHEIM RUSSELL 2000® EQUAL WEIGHT ETF |
Shares | Value | |||||||
New York Times Co. — Class A | 1,341 | $ | 17,808 | |||||
VirnetX Holding Corp.* | 4,686 | 17,807 | ||||||
Clearfield, Inc.* | 1,268 | 17,790 | ||||||
Endurance International Group Holdings, Inc.* | 1,332 | 17,756 | ||||||
Townsquare Media, Inc. — Class A* | 1,616 | 17,711 | ||||||
KVH Industries, Inc.* | 1,806 | 17,699 | ||||||
Yodlee, Inc.* | 1,054 | 17,686 | ||||||
Limelight Networks, Inc.* | 8,652 | 17,650 | ||||||
Q2 Holdings, Inc.* | 715 | 17,625 | ||||||
Crown Media Holdings, Inc. — Class A* | 3,040 | 17,602 | ||||||
Marin Software, Inc.* | 4,913 | 17,589 | ||||||
1-800-Flowers.com, Inc. — Class A* | 1,770 | 17,576 | ||||||
ViaSat, Inc.* | 265 | 17,479 | ||||||
Entercom Communications Corp. — Class A* | 1,581 | 17,454 | ||||||
MDC Partners, Inc. — Class A | 837 | 17,393 | ||||||
LogMeIn, Inc.* | 258 | 17,379 | ||||||
XO Group, Inc.* | 1,143 | 17,294 | ||||||
Finisar Corp.* | 1,510 | 17,169 | ||||||
RingCentral, Inc. — Class A* | 923 | 17,076 | ||||||
Intralinks Holdings, Inc.* | 1,950 | 17,063 | ||||||
Marketo, Inc.* | 579 | 17,040 | ||||||
Internap Corp.* | 2,518 | 17,022 | ||||||
NeuStar, Inc. — Class A* | 626 | 17,021 | ||||||
New Media Investment Group, Inc. | 1,042 | 16,776 | ||||||
Infinera Corp.* | 848 | 16,756 | ||||||
Infoblox, Inc.* | 1,026 | 16,734 | ||||||
Harmonic, Inc.* | 2,894 | 16,669 | ||||||
Rocket Fuel, Inc.* | 3,619 | 16,647 | ||||||
Box, Inc. — Class A* | 1,332 | 16,623 | ||||||
Daily Journal Corp.* | 81 | 16,581 | ||||||
Zendesk, Inc.* | 824 | 16,579 | ||||||
Ixia* | 1,149 | 16,557 | ||||||
Marchex, Inc. — Class B | 3,821 | 16,507 | ||||||
GrubHub, Inc.* | 685 | 16,426 | ||||||
EVINE Live, Inc.* | 6,352 | 16,388 | ||||||
Ruckus Wireless, Inc.* | 1,446 | 16,311 | ||||||
World Wrestling Entertainment, Inc. — Class A | 912 | 16,261 | ||||||
comScore, Inc.* | 379 | 16,214 | ||||||
Calix, Inc.* | 2,316 | 16,189 | ||||||
Bazaarvoice, Inc.* | 3,643 | 16,138 | ||||||
HealthStream, Inc.* | 676 | 16,096 | ||||||
Central European Media Enterprises Ltd. — Class A* | 7,441 | 16,073 | ||||||
Meredith Corp. | 340 | 15,987 | ||||||
Martha Stewart Living Omnimedia, Inc. — Class A* | 2,644 | 15,970 | ||||||
Comtech Telecommunications Corp. | 660 | 15,946 | ||||||
Blue Nile, Inc.* | 464 | 15,822 | ||||||
Time, Inc. | 847 | 15,737 | ||||||
Novatel Wireless, Inc.* | 7,316 | 15,729 | ||||||
Hemisphere Media Group, Inc.* | 1,158 | 15,668 | ||||||
Ubiquiti Networks, Inc.* | 536 | 15,640 | ||||||
RealNetworks, Inc.* | 4,011 | 15,563 | ||||||
Scholastic Corp. | 378 | 15,449 | ||||||
Stamps.com, Inc.* | 202 | 15,273 | ||||||
Telenav, Inc.* | 2,120 | 15,264 | ||||||
FTD Companies, Inc.* | 537 | 15,208 | ||||||
Pacific DataVision, Inc.* | 542 | 15,187 | ||||||
Loral Space & Communications, Inc.* | 339 | 15,157 | ||||||
ChannelAdvisor Corp.* | 1,703 | 14,850 | ||||||
Shutterstock, Inc.* | 517 | 14,724 | ||||||
QuinStreet, Inc.* | 2,653 | 14,724 | ||||||
Sizmek, Inc.* | 2,457 | 14,570 | ||||||
Chegg, Inc.* | 2,103 | 14,511 | ||||||
Houghton Mifflin Harcourt Co.* | 737 | 14,438 | ||||||
Rapid7, Inc.* | 701 | 14,413 | ||||||
Black Box Corp. | 1,172 | 14,310 | ||||||
Lands’ End, Inc.* | 579 | 14,290 | ||||||
DigitalGlobe, Inc.* | 934 | 13,945 | ||||||
WebMD Health Corp. — Class A* | 337 | 13,702 | ||||||
GTT Communications, Inc.* | 729 | 13,647 | ||||||
Alliance Fiber Optic Products, Inc. | 989 | 13,460 | ||||||
Overstock.com, Inc.* | 858 | 13,436 | ||||||
Corindus Vascular Robotics, Inc.* | 3,841 | 12,291 | ||||||
Blucora, Inc.* | 1,238 | 12,132 | ||||||
Etsy, Inc.* | 1,107 | 12,066 | ||||||
Safeguard Scientifics, Inc.* | 594 | 10,544 | ||||||
Quotient Technology, Inc.* | 1,776 | 9,839 | ||||||
Cumulus Media, Inc. — Class A* | 20,031 | 9,196 | ||||||
Total Communications | 4,296,484 | |||||||
Technology - 7.7% | ||||||||
inContact, Inc.* | 9,817 | 87,371 | ||||||
Cabot Microelectronics Corp.* | 1,021 | 43,055 | ||||||
PMC-Sierra, Inc.* | 2,676 | 31,899 | ||||||
ExOne Co.* | 2,763 | 29,564 | ||||||
Cray, Inc.* | 883 | 26,164 | ||||||
Amkor Technology, Inc.* | 3,874 | 24,097 | ||||||
Engility Holdings, Inc. | 739 | 23,788 | ||||||
InnerWorkings, Inc.* | 3,055 | 22,850 | ||||||
MTS Systems Corp. | 342 | 22,582 | ||||||
Sigma Designs, Inc.* | 2,563 | 22,579 | ||||||
InvenSense, Inc. — Class A* | 1,892 | 22,553 | ||||||
Cohu, Inc. | 1,772 | 22,309 | ||||||
Sykes Enterprises, Inc.* | 760 | 22,039 | ||||||
Integrated Device Technology, Inc.* | 863 | 22,007 | ||||||
CEVA, Inc.* | 940 | 21,968 | ||||||
Synaptics, Inc.* | 258 | 21,953 | ||||||
Convergys Corp. | 850 | 21,819 | ||||||
FormFactor, Inc.* | 2,627 | 21,646 | ||||||
QLogic Corp.* | 1,741 | 21,588 | ||||||
ExlService Holdings, Inc.* | 487 | 21,555 | ||||||
MAXIMUS, Inc. | 316 | 21,551 | ||||||
Monotype Imaging Holdings, Inc. | 788 | 21,544 | ||||||
CACI International, Inc. — Class A* | 221 | 21,446 | ||||||
Inphi Corp.* | 720 | 21,434 | ||||||
SEE NOTES TO FINANCIAL STATEMENTS. | GUGGENHEIM ETFs ANNUAL REPORT | 71 |
SCHEDULE OF INVESTMENTS (continued) | October 31, 2015 |
GUGGENHEIM RUSSELL 2000® EQUAL WEIGHT ETF |
Shares | Value | |||||||
Fairchild Semiconductor International, Inc. — Class A* | 1,278 | $ | 21,317 | |||||
Diebold, Inc. | 575 | 21,200 | ||||||
Advanced Micro Devices, Inc.* | 9,969 | 21,134 | ||||||
Nanometrics, Inc.* | 1,383 | 21,132 | ||||||
Monolithic Power Systems, Inc. | 338 | 21,098 | ||||||
Silicon Laboratories, Inc.* | 422 | 21,087 | ||||||
Brightcove, Inc.* | 3,389 | 21,012 | ||||||
Datalink Corp.* | 2,855 | 20,842 | ||||||
Power Integrations, Inc. | 410 | 20,750 | ||||||
Xura, Inc.* | 801 | 20,729 | ||||||
Applied Micro Circuits Corp.* | 3,192 | 20,684 | ||||||
Electronics for Imaging, Inc.* | 445 | 20,666 | ||||||
MobileIron, Inc.* | 5,344 | 20,627 | ||||||
Qualys, Inc.* | 573 | 20,238 | ||||||
TeleTech Holdings, Inc. | 694 | 20,195 | ||||||
Intersil Corp. — Class A | 1,477 | 20,013 | ||||||
CommVault Systems, Inc.* | 493 | 19,976 | ||||||
Alpha & Omega Semiconductor Ltd.* | 2,245 | 19,936 | ||||||
Semtech Corp.* | 1,131 | 19,793 | ||||||
M/A-COM Technology Solutions Holdings, Inc.* | 586 | 19,772 | ||||||
Xcerra Corp.* | 2,836 | 19,682 | ||||||
Proofpoint, Inc.* | 279 | 19,652 | ||||||
SciQuest, Inc.* | 1,655 | 19,628 | ||||||
Lattice Semiconductor Corp.* | 4,262 | 19,520 | ||||||
Cavium, Inc.* | 275 | 19,511 | ||||||
Immersion Corp.* | 1,503 | 19,509 | ||||||
Manhattan Associates, Inc.* | 266 | 19,378 | ||||||
Pegasystems, Inc. | 694 | 19,355 | ||||||
ManTech International Corp. — Class A | 669 | 19,334 | ||||||
Axcelis Technologies, Inc.* | 6,902 | 19,326 | ||||||
IXYS Corp. | 1,551 | 19,325 | ||||||
Tyler Technologies, Inc.* | 113 | 19,251 | ||||||
Cascade Microtech, Inc.* | 1,253 | 19,196 | ||||||
Five9, Inc.* | 4,428 | 19,173 | ||||||
Xactly Corp.* | 2,059 | 19,149 | ||||||
Science Applications International Corp. | 417 | 19,124 | ||||||
Acxiom Corp.* | 864 | 19,112 | ||||||
Guidewire Software, Inc.* | 328 | 19,099 | ||||||
Verint Systems, Inc.* | 401 | 19,080 | ||||||
Microsemi Corp.* | 529 | 19,049 | ||||||
American Software, Inc. — Class A | 1,861 | 19,038 | ||||||
Ciber, Inc.* | 5,329 | 19,025 | ||||||
FleetMatics Group plc* | 341 | 18,980 | ||||||
Blackbaud, Inc. | 302 | 18,933 | ||||||
Mentor Graphics Corp. | 696 | 18,931 | ||||||
Actua Corp.* | 1,366 | 18,919 | ||||||
KEYW Holding Corp.* | 2,651 | 18,902 | ||||||
ACI Worldwide, Inc.* | 789 | 18,897 | ||||||
Paycom Software, Inc.* | 497 | 18,891 | ||||||
MaxLinear, Inc. — Class A* | 1,452 | 18,876 | ||||||
OmniVision Technologies, Inc.* | 653 | 18,852 | ||||||
Tangoe, Inc.* | 2,276 | 18,845 | ||||||
Take-Two Interactive Software, Inc.* | 567 | 18,824 | ||||||
DSP Group, Inc.* | 1,857 | 18,756 | ||||||
Park City Group, Inc.* | 1,608 | 18,733 | ||||||
Bottomline Technologies de, Inc.* | 676 | 18,712 | ||||||
CSG Systems International, Inc. | 557 | 18,671 | ||||||
Virtusa Corp.* | 324 | 18,607 | ||||||
Digi International, Inc.* | 1,442 | 18,602 | ||||||
TubeMogul, Inc.* | 1,556 | 18,594 | ||||||
Violin Memory, Inc.* | 11,517 | 18,542 | ||||||
Demandware, Inc.* | 327 | 18,541 | ||||||
Globant S.A.* | 536 | 18,530 | ||||||
Aspen Technology, Inc.* | 447 | 18,501 | ||||||
Photronics, Inc.* | 1,928 | 18,490 | ||||||
Mercury Systems, Inc.* | 1,076 | 18,464 | ||||||
Rudolph Technologies, Inc.* | 1,443 | 18,456 | ||||||
Workiva, Inc.* | 1,111 | 18,420 | ||||||
Seachange International, Inc.* | 2,846 | 18,414 | ||||||
Quantum Corp.* | 21,853 | 18,357 | ||||||
EPAM Systems, Inc.* | 237 | 18,332 | ||||||
Luxoft Holding, Inc.* | 275 | 18,326 | ||||||
Epiq Systems, Inc. | 1,325 | 18,285 | ||||||
OPOWER, Inc.* | 1,894 | 18,277 | ||||||
HubSpot, Inc.* | 352 | 18,262 | ||||||
Silicon Graphics International Corp.* | 4,178 | 18,258 | ||||||
Diodes, Inc.* | 794 | 18,183 | ||||||
MKS Instruments, Inc. | 515 | 18,149 | ||||||
Mattson Technology, Inc.* | 7,749 | 18,133 | ||||||
BroadSoft, Inc.* | 567 | 18,127 | ||||||
Interactive Intelligence Group, Inc.* | 559 | 18,078 | ||||||
Syntel, Inc.* | 383 | 18,016 | ||||||
AVG Technologies N.V.* | 756 | 17,917 | ||||||
SPS Commerce, Inc.* | 249 | 17,883 | ||||||
Integrated Silicon Solution, Inc. | 795 | 17,872 | ||||||
SYNNEX Corp. | 202 | 17,865 | ||||||
PROS Holdings, Inc.* | 743 | 17,847 | ||||||
Tessera Technologies, Inc. | 510 | 17,835 | ||||||
Avid Technology, Inc.* | 2,105 | 17,787 | ||||||
Benefitfocus, Inc.* | 556 | 17,770 | ||||||
Sapiens International Corporation N.V. | 1,497 | 17,680 | ||||||
PDF Solutions, Inc.* | 1,666 | 17,593 | ||||||
Brooks Automation, Inc. | 1,587 | 17,520 | ||||||
Insight Enterprises, Inc.* | 689 | 17,501 | ||||||
Ebix, Inc. | 631 | 17,498 | ||||||
Everyday Health, Inc.* | 1,857 | 17,457 | ||||||
Imperva, Inc.* | 247 | 17,443 | ||||||
Unisys Corp.* | 1,300 | 17,420 | ||||||
Jive Software, Inc.* | 3,572 | 17,396 | ||||||
Synchronoss Technologies, Inc.* | 493 | 17,344 | ||||||
New Relic, Inc.* | 437 | 17,327 | ||||||
Silver Spring Networks, Inc.* | 1,320 | 17,305 | ||||||
EMCORE Corp.* | 2,522 | 17,250 | ||||||
Pericom Semiconductor Corp. | 987 | 17,223 | ||||||
72 | GUGGENHEIM ETFs ANNUAL REPORT | SEE NOTES TO FINANCIAL STATEMENTS. |
SCHEDULE OF INVESTMENTS (continued) | October 31, 2015 |
GUGGENHEIM RUSSELL 2000® EQUAL WEIGHT ETF |
Shares | Value | |||||||
Model N, Inc.* | 1,705 | $ | 17,221 | |||||
Vocera Communications, Inc.* | 1,463 | 17,220 | ||||||
Cirrus Logic, Inc.* | 558 | 17,203 | ||||||
Callidus Software, Inc.* | 988 | 17,162 | ||||||
Appfolio, Inc. — Class A* | 974 | 17,055 | ||||||
Super Micro Computer, Inc.* | 604 | 17,039 | ||||||
Entegris, Inc.* | 1,318 | 16,910 | ||||||
NetScout Systems, Inc.* | 471 | 16,895 | ||||||
RealD, Inc.* | 1,657 | 16,852 | ||||||
Agilysys, Inc.* | 1,482 | 16,850 | ||||||
RealPage, Inc.* | 995 | 16,816 | ||||||
QAD, Inc. — Class A | 652 | 16,652 | ||||||
LivePerson, Inc.* | 2,134 | 16,645 | ||||||
Ultratech, Inc.* | 1,060 | 16,568 | ||||||
Cvent, Inc.* | 513 | 16,216 | ||||||
Constant Contact, Inc.* | 620 | 16,182 | ||||||
Digital Turbine, Inc.* | 9,630 | 15,986 | ||||||
Nimble Storage, Inc.* | 707 | 15,978 | ||||||
Exar Corp.* | 2,808 | 15,978 | ||||||
Varonis Systems, Inc.* | 997 | 15,922 | ||||||
MINDBODY, Inc. — Class A* | 1,017 | 15,906 | ||||||
Apigee Corp.* | 1,645 | 15,874 | ||||||
Progress Software Corp.* | 651 | 15,806 | ||||||
Rovi Corp.* | 1,727 | 15,802 | ||||||
Rambus, Inc.* | 1,515 | 15,635 | ||||||
Envestnet, Inc.* | 522 | 15,587 | ||||||
MedAssets, Inc.* | 646 | 15,297 | ||||||
Cornerstone OnDemand, Inc.* | 485 | 15,278 | ||||||
Guidance Software, Inc.* | 2,702 | 15,239 | ||||||
Carbonite, Inc.* | 1,499 | 15,170 | ||||||
Glu Mobile, Inc.* | 3,666 | 15,104 | ||||||
Amber Road, Inc.* | 3,755 | 15,095 | ||||||
Stratasys Ltd.* | 591 | 15,071 | ||||||
Veeco Instruments, Inc.* | 835 | 15,047 | ||||||
Imation Corp.* | 7,443 | 15,035 | ||||||
Ultra Clean Holdings, Inc.* | 3,017 | 14,723 | ||||||
Hortonworks, Inc.* | 742 | 14,439 | ||||||
Ambarella, Inc.* | 292 | 14,436 | ||||||
Quality Systems, Inc. | 1,027 | 14,429 | ||||||
Castlight Health, Inc. — Class B* | 2,839 | 14,365 | ||||||
MicroStrategy, Inc. — Class A* | 83 | 14,282 | ||||||
Kopin Corp.* | 5,294 | 14,135 | ||||||
Qlik Technologies, Inc.* | 436 | 13,677 | ||||||
Press Ganey Holdings, Inc.* | 422 | 13,225 | ||||||
Evolent Health, Inc. — Class A* | 1,003 | 12,889 | ||||||
Barracuda Networks, Inc.* | 671 | 12,870 | ||||||
Eastman Kodak Co.* | 1,023 | 12,808 | ||||||
Medidata Solutions, Inc.* | 296 | 12,728 | ||||||
Fair Isaac Corp. | 126 | 11,639 | ||||||
Digimarc Corp.* | 514 | 11,544 | ||||||
Omnicell, Inc.* | 419 | 11,397 | ||||||
Computer Programs & Systems, Inc. | 296 | 11,251 | ||||||
2U, Inc.* | 444 | 9,315 | ||||||
Total Technology | 3,402,925 | |||||||
Utilities - 6.8% | ||||||||
Piedmont Natural Gas Company, Inc. | 1,894 | 108,546 | ||||||
Black Hills Corp. | 1,880 | 86,065 | ||||||
WGL Holdings, Inc. | 1,334 | 83,015 | ||||||
NRG Yield, Inc. — Class A | 6,030 | 82,792 | ||||||
ONE Gas, Inc. | 1,685 | 82,295 | ||||||
New Jersey Resources Corp. | 2,584 | 81,861 | ||||||
South Jersey Industries, Inc. | 3,063 | 81,200 | ||||||
Laclede Group, Inc. | 1,385 | 81,119 | ||||||
Ormat Technologies, Inc. | 2,130 | 80,344 | ||||||
Abengoa Yield plc | 4,331 | 80,253 | ||||||
Southwest Gas Corp. | 1,299 | 79,837 | ||||||
El Paso Electric Co. | 2,051 | 79,311 | ||||||
Middlesex Water Co. | 3,067 | 79,037 | ||||||
York Water Co. | 3,382 | 78,395 | ||||||
Northwest Natural Gas Co. | 1,640 | 78,343 | ||||||
IDACORP, Inc. | 1,169 | 78,148 | ||||||
SJW Corp. | 2,462 | 78,119 | ||||||
Otter Tail Corp. | 2,843 | 78,012 | ||||||
PNM Resources, Inc. | 2,764 | 77,724 | ||||||
Avista Corp. | 2,296 | 77,720 | ||||||
Chesapeake Utilities Corp. | 1,477 | 77,114 | ||||||
Artesian Resources Corp. — Class A | 3,154 | 76,831 | ||||||
Connecticut Water Service, Inc. | 2,078 | 76,491 | ||||||
Empire District Electric Co. | 3,376 | 76,129 | ||||||
NorthWestern Corp. | 1,404 | 76,083 | ||||||
UIL Holdings Corp. | 1,487 | 75,822 | ||||||
California Water Service Group | 3,387 | 75,733 | ||||||
Portland General Electric Co. | 2,038 | 75,569 | ||||||
Atlantic Power Corp. | 37,019 | 75,519 | ||||||
MGE Energy, Inc. | 1,804 | 74,451 | ||||||
ALLETE, Inc. | 1,482 | 74,411 | ||||||
Cleco Corp. | 1,402 | 74,306 | ||||||
American States Water Co. | 1,814 | 73,921 | ||||||
Consolidated Water Company Ltd. | 6,568 | 72,708 | ||||||
Unitil Corp. | 2,047 | 72,607 | ||||||
Ameresco, Inc. — Class A* | 11,016 | 71,384 | ||||||
Dynegy, Inc.* | 3,600 | 69,948 | ||||||
EnerNOC, Inc.* | 7,770 | 60,917 | ||||||
PICO Holdings, Inc.* | 968 | 9,351 | ||||||
Total Utilities | 2,971,431 | |||||||
Basic Materials - 5.7% | ||||||||
Orchids Paper Products Co. | 3,952 | 115,833 | ||||||
Ring Energy, Inc.* | 6,782 | 70,464 | ||||||
Rayonier Advanced Materials, Inc. | 6,429 | 59,275 | ||||||
Oil-Dri Corporation of America | 1,810 | 56,797 | ||||||
OMNOVA Solutions, Inc.* | 7,809 | 56,069 | ||||||
Schnitzer Steel Industries, Inc. — Class A | 3,235 | 54,542 | ||||||
Kronos Worldwide, Inc. | 6,772 | 53,499 | ||||||
SEE NOTES TO FINANCIAL STATEMENTS. | GUGGENHEIM ETFs ANNUAL REPORT | 73 |
SCHEDULE OF INVESTMENTS (concluded) | October 31, 2015 |
GUGGENHEIM RUSSELL 2000® EQUAL WEIGHT ETF |
Shares | Value | |||||||
AK Steel Holding Corp.* | 18,276 | $ | 52,818 | |||||
Stepan Co. | 996 | 52,718 | ||||||
Worthington Industries, Inc. | 1,654 | 50,778 | ||||||
Neenah Paper, Inc. | 748 | 50,423 | ||||||
US Silica Holdings, Inc. | 2,725 | 49,214 | ||||||
Tronox Ltd. — Class A | 7,897 | 49,040 | ||||||
Minerals Technologies, Inc. | 832 | 49,038 | ||||||
Innospec, Inc. | 885 | 48,888 | ||||||
American Vanguard Corp. | 3,643 | 48,853 | ||||||
Chemtura Corp.* | 1,516 | 48,421 | ||||||
Olin Corp. | 2,497 | 47,893 | ||||||
HB Fuller Co. | 1,253 | 47,601 | ||||||
Schweitzer-Mauduit International, Inc. | 1,220 | 47,360 | ||||||
A. Schulman, Inc. | 1,313 | 47,123 | ||||||
PH Glatfelter Co. | 2,417 | 46,890 | ||||||
Carpenter Technology Corp. | 1,404 | 46,767 | ||||||
Balchem Corp. | 684 | 46,717 | ||||||
Kraton Performance Polymers, Inc.* | 2,281 | 46,510 | ||||||
Ferro Corp.* | 3,688 | 46,063 | ||||||
PolyOne Corp. | 1,365 | 45,646 | ||||||
Calgon Carbon Corp. | 2,644 | 45,477 | ||||||
Hawkins, Inc. | 1,093 | 45,294 | ||||||
Commercial Metals Co. | 3,094 | 44,461 | ||||||
Axiall Corp. | 2,193 | 44,408 | ||||||
Aceto Corp. | 1,469 | 44,305 | ||||||
Uranium Energy Corp.* | 39,485 | 44,223 | ||||||
Sensient Technologies Corp. | 676 | 44,123 | ||||||
Clearwater Paper Corp.* | 872 | 43,975 | ||||||
Cliffs Natural Resources, Inc. | 15,914 | 43,923 | ||||||
Innophos Holdings, Inc. | 1,021 | 43,382 | ||||||
Quaker Chemical Corp. | 543 | 43,103 | ||||||
Globe Specialty Metals, Inc. | 3,376 | 42,605 | ||||||
Materion Corp. | 1,412 | 42,572 | ||||||
KMG Chemicals, Inc. | 2,013 | 42,354 | ||||||
Hecla Mining Co. | 20,318 | 42,058 | ||||||
Deltic Timber Corp. | 675 | 41,823 | ||||||
Landec Corp.* | 3,389 | 41,685 | ||||||
Kaiser Aluminum Corp. | 510 | 41,457 | ||||||
Rentech, Inc.* | 6,783 | 39,681 | ||||||
Coeur Mining, Inc.* | 14,188 | 38,308 | ||||||
Stillwater Mining Co.* | 4,088 | 38,182 | ||||||
Koppers Holdings, Inc. | 1,947 | 36,915 | ||||||
Univar, Inc.* | 2,045 | 36,115 | ||||||
Century Aluminum Co.* | 8,559 | 30,984 | ||||||
Horsehead Holding Corp.* | 10,842 | 30,791 | ||||||
Intrepid Potash, Inc.* | 7,034 | 27,151 | ||||||
Total Basic Materials | 2,494,595 | |||||||
Diversified - 0.1% | ||||||||
HRG Group, Inc.* | 836 | 11,244 | ||||||
Resource America, Inc. — Class A | 1,442 | 11,089 | ||||||
National Bank Holdings Corp. — Class A | 497 | 10,964 | ||||||
Tiptree Financial, Inc. — Class A | 1,478 | 10,006 | ||||||
Total Diversified | 43,303 | |||||||
Government - 0.0% | ||||||||
Banco Latinoamericano de Comercio Exterior S.A. — Class E | 424 | 11,461 | ||||||
Total Common Stocks | ||||||||
(Cost $44,502,940) | 43,752,982 | |||||||
SHORT TERM INVESTMENTS† - 0.3% | ||||||||
Federated U.S. Treasury Cash Reserve Fund 0.00%1 | 136,518 | 136,518 | ||||||
Total Short Term Investments | ||||||||
(Cost $136,518) | 136,518 | |||||||
Total Investments - 99.9% | ||||||||
(Cost $44,639,458) | $ | 43,889,500 | ||||||
Other Assets & Liabilities, net - 0.1% | 40,578 | |||||||
Total Net Assets - 100.0% | $ | 43,930,078 | ||||||
* | Non-income producing security. |
† | Value determined based on Level 1 inputs, unless otherwise noted — See Note 4. |
††† | Value determined based on Level 3 inputs — See Note 4. |
1 | Rate indicated is the 7 day yield as of October 31, 2015. |
2 | This security was fair valued by the Valuation Committee at October 31, 2015. |
plc — Public Limited Company | |
REIT — Real Estate Investment Trust | |
See Sector Classification in Other Information section. |
The following table summarizes the inputs used to value the Fund's net assets at October 31, 2015 (See Note 4 in the Notes to Financial Statements):
Investments in Securities | Level 1 | Level 2 | Level 3 | Total | ||||||||||||
Common Stocks | $ | 43,752,982 | $ | — | $ | — | $ | 43,752,982 | ||||||||
Short Term Investments | 136,518 | — | — | 136,518 | ||||||||||||
Total | $ | 43,889,500 | $ | — | $ | — | $ | 43,889,500 | ||||||||
For the year ended October 31, 2015, there were no transfers between levels.
74 | GUGGENHEIM ETFs ANNUAL REPORT | SEE NOTES TO FINANCIAL STATEMENTS. |
SCHEDULE OF INVESTMENTS | October 31, 2015 |
GUGGENHEIM MSCI EMERGING MARKETS EQUAL COUNTRY WEIGHT ETF | |
Shares | Value | |||||||
COMMON STOCKS† - 94.0% | ||||||||
Financial - 39.9% | ||||||||
Commercial International Bank Egypt SAE GDR | 56,248 | $ | 329,051 | |||||
Credicorp Ltd. | 2,876 | 325,505 | ||||||
OTP Bank plc | 12,134 | 236,047 | ||||||
Komercni Banka AS | 983 | 204,394 | ||||||
Qatar National Bank SAQ | 2,635 | 132,103 | ||||||
Emaar Properties PJSC | 65,359 | 114,777 | ||||||
Bancolombia S.A. ADR | 3,118 | 107,945 | ||||||
Grupo de Inversiones Suramericana S.A. | 6,907 | 87,857 | ||||||
Bank Central Asia Tbk PT | 84,000 | 79,167 | ||||||
Masraf Al Rayan QSC | 6,515 | 77,316 | ||||||
Powszechna Kasa Oszczednosci Bank Polski S.A.* | 10,356 | 76,995 | ||||||
Turkiye Garanti Bankasi AS ADR | 25,864 | 66,858 | ||||||
Powszechny Zaklad Ubezpieczen S.A. | 608 | 59,306 | ||||||
Ayala Land, Inc. | 77,385 | 59,254 | ||||||
Public Bank BHD | 13,600 | 57,237 | ||||||
Bank Pekao S.A. | 1,452 | 56,634 | ||||||
Bank Rakyat Indonesia Persero Tbk PT | 73,200 | 56,287 | ||||||
First Gulf Bank PJSC | 16,527 | 55,571 | ||||||
Itau Unibanco Holding S.A. ADR | 8,000 | 54,800 | ||||||
Akbank TAS ADR | 10,136 | 52,099 | ||||||
Siam Commercial Bank PCL | 13,522 | 50,754 | ||||||
National Bank of Greece S.A. ADR* | 65,400 | 50,495 | ||||||
Abu Dhabi Commercial Bank PJSC | 24,232 | 49,481 | ||||||
Ezdan Holding Group QSC | 9,113 | 48,816 | ||||||
Malayan Banking BHD | 23,600 | 45,376 | ||||||
Qatar Islamic Bank SAQ | 1,376 | 44,679 | ||||||
Ayala Corp. | 2,640 | 43,981 | ||||||
Aldar Properties PJSC | 69,004 | 42,835 | ||||||
Bank Mandiri Persero Tbk PT | 67,200 | 42,713 | ||||||
Grupo Financiero Banorte SAB de CV — Class O | 7,818 | 42,073 | ||||||
BDO Unibank, Inc. | 19,040 | 41,358 | ||||||
Banco de Chile ADR | 617 | 39,136 | ||||||
Doha Bank QSC | 2,754 | 37,449 | ||||||
Dubai Islamic Bank PJSC | 21,072 | 37,119 | ||||||
SM Prime Holdings, Inc. | 79,200 | 36,537 | ||||||
China Construction Bank Corp. | 2,496 | 36,142 | ||||||
National Bank of Abu Dhabi PJSC | 14,948 | 35,407 | ||||||
Corporation Financiera Colombiana S.A. | 2,683 | 35,111 | ||||||
Qatar Insurance Company SAQ | 1,372 | 35,051 | ||||||
Banco Santander Chile ADR | 1,840 | 34,942 | ||||||
Banco Bradesco S.A. ADR | 6,401 | 34,821 | ||||||
Industrial & Commercial Bank of China Ltd. ADR | 2,656 | 33,598 | ||||||
Bank Zachodni WBK S.A.* | 404 | 32,690 | ||||||
Emaar Malls Group PJSC* | 38,108 | 32,475 | ||||||
FirstRand Ltd. | 7,996 | 29,415 | ||||||
Kasikornbank PCL ADR | 1,500 | 28,875 | ||||||
VTB Bank PJSC GDR | 13,135 | 28,871 | ||||||
Turkiye Is Bankasi — Class C | 16,780 | 28,701 | ||||||
Turkiye Halk Bankasi AS | 7,468 | 28,086 | ||||||
Standard Bank Group Ltd. ADR | 2,552 | 26,286 | ||||||
China Overseas Land & Investment Ltd. | 8,000 | 26,013 | ||||||
Bank of China Ltd. ADR | 2,180 | 25,702 | ||||||
CIMB Group Holdings BHD | 23,600 | 25,325 | ||||||
GT Capital Holdings, Inc. | 840 | 23,575 | ||||||
Bank of the Philippine Islands | 12,560 | 22,695 | ||||||
Emlak Konut Gayrimenkul Yatirim Ortakligi AS | 22,220 | 21,597 | ||||||
Shinhan Financial Group Company Ltd. ADR | 548 | 21,016 | ||||||
Alpha Bank AE — Class B* | 160,432 | 20,380 | ||||||
Sanlam Ltd. ADR | 2,128 | 19,364 | ||||||
Bank Negara Indonesia Persero Tbk PT | 55,600 | 19,315 | ||||||
mBank S.A.* | 204 | 19,224 | ||||||
Central Pattana PCL | 14,714 | 19,030 | ||||||
Ping An Insurance Group Company of China Ltd. ADR | 1,672 | 18,777 | ||||||
Bangkok Bank PCL | 3,941 | 18,560 | ||||||
PICC Property & Casualty Company Ltd. — Class H | 8,000 | 18,271 | ||||||
Yapi ve Kredi Bankasi AS | 14,600 | 17,801 | ||||||
China Life Insurance Company Ltd. ADR | 971 | 17,536 | ||||||
Turkiye Vakiflar Bankasi TAO — Class D | 12,044 | 17,208 | ||||||
Cathay Financial Holding Company Ltd. | 12,000 | 17,152 | ||||||
Dubai Financial Market PJSC | 43,720 | 17,022 | ||||||
Krung Thai Bank PCL | 35,197 | 16,922 | ||||||
Fibra Uno Administracion S.A. de CV | 7,358 | 16,151 | ||||||
KB Financial Group, Inc. ADR | 512 | 16,143 | ||||||
Banco de Credito e Inversiones | 387 | 15,796 | ||||||
Corpbanca S.A. ADR | 1,128 | 15,454 | ||||||
Grupo Financiero Inbursa SAB de CV — Class O | 7,358 | 14,784 | ||||||
Banco Bradesco ADR* | 2,359 | 14,366 | ||||||
AMMB Holdings BHD | 12,800 | 14,242 | ||||||
BB Seguridade Participacoes S.A. ADR | 1,961 | 13,472 | ||||||
Hong Leong Bank BHD | 4,000 | 13,017 | ||||||
Fubon Financial Holding Company Ltd. | 8,000 | 12,987 | ||||||
Hana Financial Group, Inc. | 528 | 12,875 | ||||||
RMB Holdings Ltd. | 2,632 | 12,864 | ||||||
Nedbank Group Ltd. | 748 | 12,487 | ||||||
Evergrande Real Estate Group Ltd. | 16,000 | 12,304 | ||||||
Barclays Africa Group Ltd. | 956 | 12,297 | ||||||
Grupo Financiero Santander Mexico SAB de CV — Class B | 6,657 | 12,224 | ||||||
Lippo Karawaci Tbk PT | 138,201 | 12,015 | ||||||
Shin Kong Financial Holding Company Ltd. | 49,959 | 11,988 | ||||||
CTBC Financial Holding Company Ltd. | 21,620 | 11,888 | ||||||
Eurobank Ergasias S.A.* | 342,388 | 11,725 | ||||||
Mega Financial Holding Company Ltd. | 16,000 | 11,681 | ||||||
Taiwan Cooperative Financial Holding Company Ltd. | 25,200 | 11,295 | ||||||
Samsung Fire & Marine Insurance Company Ltd. | 40 | 11,210 | ||||||
Taiwan Business Bank* | 42,920 | 11,040 | ||||||
Agricultural Bank of China Ltd. ADR | 1,056 | 10,750 | ||||||
SEE NOTES TO FINANCIAL STATEMENTS. | GUGGENHEIM ETFs ANNUAL REPORT | 75 |
SCHEDULE OF INVESTMENTS (continued) | October 31, 2015 |
GUGGENHEIM MSCI EMERGING MARKETS EQUAL COUNTRY WEIGHT ETF | |
Shares | Value | |||||||
Shanghai Industrial Holdings Ltd. | 4,000 | $ | 10,581 | |||||
Grupo Financiero Santander Mexico SAB de CV ADR | 1,150 | 10,523 | ||||||
China Merchants Bank Company Ltd. — Class H | 4,000 | 10,503 | ||||||
E.Sun Financial Holding Company Ltd. | 17,391 | 10,473 | ||||||
Redefine Properties Ltd. | 12,360 | 10,349 | ||||||
Hyundai Marine & Fire Insurance Company Ltd. | 332 | 9,887 | ||||||
Growthpoint Properties Ltd. | 5,360 | 9,849 | ||||||
Piraeus Bank S.A.* | 95,756 | 9,837 | ||||||
Banco do Brasil S.A. ADR | 2,242 | 9,192 | ||||||
Samsung Securities Company Ltd. | 216 | 9,152 | ||||||
China Resources Land Ltd. | 3,283 | 8,578 | ||||||
SinoPac Financial Holdings Company Ltd. | 25,766 | 8,532 | ||||||
First Financial Holding Company Ltd. | 17,040 | 8,267 | ||||||
Yuanta Financial Holding Company Ltd. | 20,524 | 8,092 | ||||||
CITIC Ltd. | 4,000 | 7,484 | ||||||
China Life Insurance Company Ltd. | 8,800 | 7,292 | ||||||
Daewoo Securities Company Ltd. | 736 | 7,166 | ||||||
China Development Financial Holding Corp. | 24,000 | 6,469 | ||||||
China Pacific Insurance Group Company Ltd. — Class H | 1,600 | 6,400 | ||||||
Hua Nan Financial Holdings Company Ltd. | 12,744 | 6,144 | ||||||
Country Garden Holdings Company Ltd. | 16,000 | 6,111 | ||||||
Bank of Communications Company Ltd. — Class H | 8,000 | 5,925 | ||||||
BNK Financial Group, Inc. | 476 | 5,845 | ||||||
Summarecon Agung Tbk PT | 57,200 | 5,830 | ||||||
NH Investment & Securities Company Ltd. | 636 | 5,634 | ||||||
Yuexiu Property Company Ltd. | 32,000 | 5,533 | ||||||
China Smarter Energy Group Holdings Ltd.* | 64,777 | 5,516 | ||||||
Industrial Bank of Korea | 448 | 5,502 | ||||||
Longfor Properties Company Ltd. | 4,000 | 5,378 | ||||||
China CITIC Bank Corporation Ltd. — Class H* | 8,000 | 5,192 | ||||||
Taishin Financial Holding Company Ltd. | 12,000 | 4,713 | ||||||
Chang Hwa Commercial Bank Ltd. | 8,560 | 4,456 | ||||||
China Minsheng Banking Corporation Ltd. — Class H | 4,000 | 4,031 | ||||||
Shimao Property Holdings Ltd. | 2,000 | 3,530 | ||||||
SOHO China Ltd. | 6,000 | 3,097 | ||||||
China Overseas Property Holdings Ltd.* | 2,666 | 458 | ||||||
Total Financial | 4,421,537 | |||||||
Communications - 9.2% | ||||||||
Naspers Ltd. ADR | 752 | 110,469 | ||||||
Hellenic Telecommunications Organization S.A. | 10,792 | 100,974 | ||||||
America Movil SAB de CV — Class L ADR | 5,141 | 91,561 | ||||||
Telekomunikasi Indonesia Persero Tbk PT | 323,200 | 63,281 | ||||||
Advanced Info Service PCL | 8,748 | 57,307 | ||||||
Tencent Holdings Ltd. ADR | 3,008 | 56,761 | ||||||
Philippine Long Distance Telephone Co. ADR | 1,015 | 48,131 | ||||||
Grupo Televisa SAB ADR | 1,592 | 46,391 | ||||||
China Mobile Ltd. ADR | 732 | 44,147 | ||||||
Global Telecom Holding SAE GDR* | 35,804 | 41,712 | ||||||
Turkcell Iletisim Hizmetleri AS ADR | 3,792 | 37,579 | ||||||
MTN Group Ltd. ADR | 3,276 | 37,379 | ||||||
Ooredoo QSC | 1,548 | 33,084 | ||||||
DiGi.com BHD | 17,600 | 21,549 | ||||||
Axiata Group BHD | 14,800 | 21,256 | ||||||
Mobile TeleSystems PJSC ADR | 2,750 | 19,333 | ||||||
True Corporation PCL* | 67,600 | 19,196 | ||||||
Chunghwa Telecom Company Ltd. ADR | 564 | 17,281 | ||||||
NAVER Corp. | 32 | 16,841 | ||||||
Orange Polska S.A. | 8,036 | 14,791 | ||||||
Maxis BHD | 9,600 | 14,726 | ||||||
Turk Telekomunikasyon AS | 6,552 | 14,154 | ||||||
Telefonica Brasil S.A. ADR | 1,261 | 13,064 | ||||||
Rostelecom PJSC ADR | 1,279 | 11,230 | ||||||
Telekom Malaysia BHD | 7,200 | 11,162 | ||||||
Vodacom Group Ltd. ADR | 860 | 9,271 | ||||||
Surya Citra Media Tbk PT | 36,664 | 7,835 | ||||||
China Unicom Hong Kong Ltd. ADR | 564 | 6,926 | ||||||
MegaFon OAOGDR | 510 | 6,605 | ||||||
Samsung SDI Company Ltd. | 68 | 6,352 | ||||||
China Telecom Corporation Ltd. ADR | 116 | 6,067 | ||||||
Sistema JSFCGDR | 863 | 5,998 | ||||||
Tim Participacoes S.A. ADR | 484 | 5,377 | ||||||
Total Communications | 1,017,790 | |||||||
Consumer, Non-cyclical - 9.0% | ||||||||
Richter Gedeon Nyrt | 7,652 | 128,221 | ||||||
DP World Ltd. | 3,127 | 63,197 | ||||||
Fomento Economico Mexicano SAB de CV ADR | 603 | 59,751 | ||||||
Ambev S.A. ADR | 11,631 | 56,643 | ||||||
Magnit PJSC GDR | 1,096 | 49,890 | ||||||
BIM Birlesik Magazalar AS | 2,368 | 48,229 | ||||||
JG Summit Holdings, Inc. | 31,000 | 47,274 | ||||||
Universal Robina Corp. | 10,640 | 45,587 | ||||||
Cencosud S.A. | 14,208 | 31,224 | ||||||
Unilever Indonesia Tbk PT | 10,800 | 29,195 | ||||||
BRF S.A. ADR | 1,650 | 25,295 | ||||||
Cia Cervecerias Unidas S.A. ADR | 912 | 21,861 | ||||||
Cielo S.A. ADR | 2,082 | 19,612 | ||||||
IHH Healthcare BHD | 13,200 | 19,388 | ||||||
Bidvest Group Ltd. | 724 | 18,563 | ||||||
Anadolu Efes Biracilik Ve Malt Sanayii AS | 2,276 | 17,979 | ||||||
Bangkok Dusit Medical Services PCL — Class F | 33,532 | 17,913 | ||||||
Aspen Pharmacare Holdings Ltd. | 756 | 17,019 | ||||||
Kalbe Farma Tbk PT | 156,400 | 16,340 | ||||||
Grupo Bimbo SAB de CV* | 5,518 | 15,647 | ||||||
IOI Corporation BHD | 15,600 | 15,470 | ||||||
Uni-President Enterprises Corp. | 8,320 | 14,096 | ||||||
Charoen Pokphand Foods PCL | 23,923 | 13,923 | ||||||
Coca-Cola Femsa SAB de CV | 1,722 | 13,228 | ||||||
76 | GUGGENHEIM ETFs ANNUAL REPORT | SEE NOTES TO FINANCIAL STATEMENTS. |
SCHEDULE OF INVESTMENTS (continued) | October 31, 2015 |
GUGGENHEIM MSCI EMERGING MARKETS EQUAL COUNTRY WEIGHT ETF | |
Shares | Value | |||||||
KT&G Corp. | 132 | $ | 13,200 | |||||
Kimberly-Clark de Mexico SAB de CV — Class A | 5,302 | 12,786 | ||||||
Kuala Lumpur Kepong BHD | 2,400 | 12,726 | ||||||
Charoen Pokphand Indonesia Tbk PT | 66,000 | 12,055 | ||||||
Indofood Sukses Makmur Tbk PT | 29,200 | 11,787 | ||||||
Kimberly-Clark de Mexico SAB de CV ADR | 957 | 11,550 | ||||||
Coca-Cola Icecek AS | 908 | 11,523 | ||||||
Gudang Garam Tbk PT | 3,600 | 11,296 | ||||||
Shoprite Holdings Ltd. | 1,024 | 10,619 | ||||||
Kroton Educational S.A. | 3,947 | 10,443 | ||||||
Coca-Cola Femsa SAB de CV ADR | 129 | 9,892 | ||||||
Mediclinic International Ltd. | 1,076 | 9,475 | ||||||
Tiger Brands Ltd. | 388 | 8,898 | ||||||
JBS S.A ADR | 1,071 | 8,033 | ||||||
Want Want China Holdings Ltd. | 8,000 | 6,668 | ||||||
Cia Brasileira de Distribuicao ADR | 492 | 6,460 | ||||||
PPB Group BHD | 1,700 | 6,118 | ||||||
British American Tobacco Malaysia BHD | 400 | 5,756 | ||||||
Estacio Participacoes S.A. ADR | 1,326 | 5,384 | ||||||
Westports Holdings BHD | 4,400 | 4,404 | ||||||
Celltrion, Inc.* | 24 | 1,621 | ||||||
Total Consumer, Non-cyclical | 996,239 | |||||||
Energy - 7.8% | ||||||||
Gazprom PAO ADR | 25,068 | 105,537 | ||||||
MOL Hungarian Oil & Gas plc | 2,258 | 102,493 | ||||||
Lukoil PJSC ADR | 2,204 | 80,005 | ||||||
Ecopetrol S.A. ADR | 6,875 | 64,075 | ||||||
PTT PCL | 7,967 | 61,599 | ||||||
Polski Koncern Naftowy Orlen S.A. | 3,408 | 55,533 | ||||||
Novatek OAO GDR | 412 | 37,678 | ||||||
Polskie Gornictwo Naftowe i Gazownictwo S.A. | 21,048 | 37,483 | ||||||
Tupras Turkiye Petrol Rafinerileri AS* | 1,408 | 37,236 | ||||||
Sasol Ltd. ADR | 1,040 | 33,446 | ||||||
Tatneft PAO ADR | 1,056 | 32,683 | ||||||
Rosneft OAO GDR | 6,830 | 27,320 | ||||||
Surgutneftegas OAO ADR | 4,553 | 24,928 | ||||||
PTT Exploration & Production PCL | 11,122 | 22,827 | ||||||
Petronas Gas BHD | 3,600 | 19,257 | ||||||
Petroleo Brasileiro S.A. ADR* | 4,591 | 18,318 | ||||||
China Petroleum & Chemical Corp. ADR | 248 | 17,876 | ||||||
Petroleo Brasileiro S.A. ADR* | 3,334 | 16,270 | ||||||
CNOOC Ltd. ADR | 124 | 14,096 | ||||||
GS Holdings Corp. | 280 | 12,329 | ||||||
PetroChina Company Ltd. ADR | 148 | 11,637 | ||||||
SK Innovation Company Ltd.* | 88 | 9,147 | ||||||
SapuraKencana Petroleum BHD | 18,400 | 9,037 | ||||||
China Shenhua Energy Company Ltd. ADR | 800 | 5,352 | ||||||
China Longyuan Power Group Corporation Ltd. — Class H | 4,000 | 3,675 | ||||||
Total Energy | 859,837 | |||||||
Consumer, Cyclical - 7.0% | ||||||||
OPAP S.A. | 9,404 | 83,624 | ||||||
SACI Falabella | 10,416 | 69,906 | ||||||
CP ALL PCL | 38,361 | 53,927 | ||||||
Astra International Tbk PT | 123,200 | 53,105 | ||||||
Wal-Mart de Mexico SAB de CV | 16,555 | 43,649 | ||||||
JUMBO S.A. | 4,124 | 40,089 | ||||||
SM Investments Corp. | 2,040 | 38,126 | ||||||
Steinhoff International Holdings Ltd. | 5,092 | 31,242 | ||||||
FF Group | 1,416 | 28,640 | ||||||
Almacenes Exito S.A. | 6,195 | 27,981 | ||||||
Jollibee Foods Corp. | 5,480 | 24,111 | ||||||
Hyundai Motor Co. | 168 | 22,989 | ||||||
Kia Motors Corp. | 416 | 20,361 | ||||||
Latam Airlines Group S.A. ADR* | 3,632 | 20,012 | ||||||
Turk Hava Yollari AO* | 5,876 | 17,376 | ||||||
Woolworths Holdings Limited/South Africa | 2,328 | 17,286 | ||||||
Genting BHD | 10,000 | 17,272 | ||||||
Genting Malaysia BHD | 17,200 | 17,216 | ||||||
Matahari Department Store Tbk PT | 14,000 | 16,954 | ||||||
Hyundai Mobis Company Ltd. | 80 | 16,841 | ||||||
LPP S.A. | 8 | 15,149 | ||||||
Pegas Nonwovens SA | 426 | 13,375 | ||||||
Dongfeng Motor Group Company Ltd. — Class H | 8,000 | 11,602 | ||||||
Mr Price Group Ltd. | 552 | 8,496 | ||||||
LG Corp. | 144 | 8,336 | ||||||
Samsung C&T Corp.* | 56 | 7,614 | ||||||
Far Eastern New Century Corp. | 8,160 | 7,440 | ||||||
Kangwon Land, Inc. | 200 | 7,421 | ||||||
Shinsegae Company Ltd. | 36 | 7,342 | ||||||
Great Wall Motor Company Ltd. — Class H | 6,000 | 7,339 | ||||||
Cheng Shin Rubber Industry Company Ltd. | 4,000 | 7,257 | ||||||
Lotte Shopping Company Ltd. | 24 | 4,884 | ||||||
Hankook Tire Company Ltd. | 104 | 3,991 | ||||||
Total Consumer, Cyclical | 770,953 | |||||||
Basic Materials - 6.6% | ||||||||
Southern Copper Corp. | 4,842 | 134,415 | ||||||
Industries Qatar QSC | 2,401 | 81,127 | ||||||
Cia de Minas Buenaventura S.A.A. ADR | 8,091 | 51,863 | ||||||
KGHM Polska Miedz S.A. | 1,544 | 36,017 | ||||||
MMC Norilsk Nickel PJSC ADR | 2,316 | 34,393 | ||||||
Empresas CMPC S.A. | 13,792 | 34,077 | ||||||
Grupo Mexico SAB de CV | 11,956 | 29,108 | ||||||
Fibria Celulose S.A. ADR | 1,879 | 25,404 | ||||||
PTT Global Chemical PCL | 15,511 | 24,312 | ||||||
Eregli Demir ve Celik Fabrikalari TAS | 15,908 | 22,619 | ||||||
Ultrapar Participacoes S.A. ADR | 1,171 | 20,270 | ||||||
Sociedad Quimica y Minera de Chile S.A. ADR | 1,012 | 19,613 | ||||||
Petronas Chemicals Group BHD | 12,800 | 18,920 | ||||||
Formosa Plastics Corp. | 8,000 | 18,605 | ||||||
Vale S.A. ADR | 5,109 | 18,392 | ||||||
SEE NOTES TO FINANCIAL STATEMENTS. | GUGGENHEIM ETFs ANNUAL REPORT | 77 |
SCHEDULE OF INVESTMENTS (continued) | October 31, 2015 |
GUGGENHEIM MSCI EMERGING MARKETS EQUAL COUNTRY WEIGHT ETF | |
Shares | Value | |||||||
Uralkali PJSC GDR* | 1,498 | $ | 18,006 | |||||
Vale S.A. ADR | 3,688 | 16,080 | ||||||
Nan Ya Plastics Corp. | 8,000 | 15,944 | ||||||
Severstal PAOGDR | 1,352 | 15,899 | ||||||
LG Chem Ltd. | 56 | 14,957 | ||||||
Braskem S.A. ADR | 1,339 | 14,930 | ||||||
POSCO ADR | 332 | 13,290 | ||||||
Mexichem SAB de CV | 3,810 | 9,875 | ||||||
China Steel Corp. | 16,000 | 9,685 | ||||||
Formosa Chemicals & Fibre Corp. | 4,000 | 9,180 | ||||||
Hyundai Steel Co. | 188 | 8,592 | ||||||
Korea Zinc Company Ltd. | 16 | 6,652 | ||||||
Jiangxi Copper Company Ltd. — Class H | 4,000 | 5,295 | ||||||
Gerdau S.A. ADR | 3,022 | 4,201 | ||||||
Total Basic Materials | 731,721 | |||||||
Utilities - 4.8% | ||||||||
CEZ AS | 10,212 | 205,260 | ||||||
Enersis S.A. ADR | 4,356 | 57,718 | ||||||
Empresa Nacional de Electricidad S.A. ADR | 1,216 | 45,940 | ||||||
Tenaga Nasional BHD | 13,200 | 38,899 | ||||||
PGE Polska Grupa Energetyczna S.A. | 8,980 | 33,545 | ||||||
Interconexion Electrica S.A. ESP | 11,415 | 27,398 | ||||||
Colbun S.A. | 94,312 | 25,040 | ||||||
Aboitiz Power Corp. | 26,000 | 23,323 | ||||||
Perusahaan Gas Negara Persero Tbk PT | 82,400 | 18,060 | ||||||
Aguas Andinas S.A. — Class A | 31,616 | 16,643 | ||||||
Energa S.A. | 2,800 | 11,993 | ||||||
CPFL Energia S.A. ADR* | 958 | 7,674 | ||||||
RusHydro PJSC ADR | 7,854 | 7,634 | ||||||
Cia de Saneamento Basico do Estado de Sao Paulo ADR | 1,680 | 7,375 | ||||||
Cia Energetica de Minas Gerais ADR | 2,782 | 5,425 | ||||||
Total Utilities | 531,927 | |||||||
Industrial - 4.0% | ||||||||
Grupo Argos S.A. | 8,347 | 51,383 | ||||||
Titan Cement Company S.A. | 1,952 | 43,017 | ||||||
Cementos Argos S.A. | 12,385 | 41,119 | ||||||
Hon Hai Precision Industry Company Ltd. | 12,600 | 33,612 | ||||||
Airports of Thailand PCL | 3,600 | 30,162 | ||||||
Cemex SAB de CV ADR* | 3,922 | 24,748 | ||||||
Delta Electronics, Inc. | 4,000 | 20,454 | ||||||
Semen Indonesia Persero Tbk PT | 24,000 | �� | 17,184 | |||||
BTS Group Holdings PCL | 61,960 | 16,811 | ||||||
United Tractors Tbk PT | 12,257 | 16,208 | ||||||
Indocement Tunggal Prakarsa Tbk PT | 11,600 | 15,255 | ||||||
Embraer S.A. ADR | 471 | 13,833 | ||||||
MISC BHD | 6,400 | 13,453 | ||||||
Gamuda BHD | 12,400 | 12,989 | ||||||
Arabtec Holding PJSC* | 25,444 | 11,292 | ||||||
Grupo Aeroportuario del Sureste SAB de CV — Class B | 727 | 11,252 | ||||||
Promotora y Operadora de Infraestructura SAB de CV* | 837 | 10,488 | ||||||
Taiwan Cement Corp. | 8,000 | 8,921 | ||||||
Orascom Construction Industries SAE GDR*,†††,1 | 434 | 8,680 | ||||||
LG Electronics, Inc. | 184 | 7,925 | ||||||
China Everbright International Ltd. | 4,000 | 6,472 | ||||||
LG Display Company Ltd. ADR | 592 | 5,624 | ||||||
China Communications Construction Company Ltd. — Class H | 4,000 | 5,533 | ||||||
Hyundai Heavy Industries Company Ltd.* | 64 | 5,344 | ||||||
China National Building Material Company Ltd. — Class H | 8,000 | 5,006 | ||||||
Hyundai Engineering & Construction Company Ltd. | 140 | 4,249 | ||||||
Asia Cement Corp. | 4,000 | 4,159 | ||||||
Total Industrial | 445,173 | |||||||
Technology - 3.2% | ||||||||
Samsung Electronics Company Ltd. GDR | 228 | 136,459 | ||||||
Taiwan Semiconductor Manufacturing Company Ltd. ADR | 5,324 | 116,915 | ||||||
MediaTek, Inc. | 4,000 | 31,358 | ||||||
SK Hynix, Inc. | 652 | 17,557 | ||||||
SK Holdings Co., Ltd. | 62 | 14,520 | ||||||
Advanced Semiconductor Engineering, Inc. ADR | 1,328 | 7,623 | ||||||
Quanta Computer, Inc. | 4,000 | 6,838 | ||||||
Siliconware Precision Industries Company Ltd. ADR | 768 | 5,138 | ||||||
United Microelectronics Corp. ADR | 2,744 | 5,076 | ||||||
Innolux Corp. | 12,000 | 4,048 | ||||||
Inotera Memories, Inc.* | 4,000 | 3,093 | ||||||
Total Technology | 348,625 | |||||||
Diversified - 2.5% | ||||||||
Empresas COPEC S.A. | 5,152 | 48,313 | ||||||
Siam Cement PCL | 2,800 | 35,741 | ||||||
Haci Omer Sabanci Holding AS | 10,120 | 32,185 | ||||||
KOC Holding AS ADR | 1,440 | 32,026 | ||||||
Aboitiz Equity Ventures, Inc. | 24,000 | 28,706 | ||||||
Sime Darby BHD | 14,400 | 28,022 | ||||||
Remgro Ltd. | 1,120 | 22,491 | ||||||
Alfa SAB de CV — Class A | 8,737 | 18,189 | ||||||
IJM Corporation BHD | 16,800 | 12,983 | ||||||
CJ Corp. | 56 | 11,789 | ||||||
YTL Corporation BHD | 15,500 | 5,448 | ||||||
Total Diversified | 275,893 | |||||||
Total Common Stocks | ||||||||
(Cost $12,157,840) | 10,399,695 | |||||||
78 | GUGGENHEIM ETFs ANNUAL REPORT | SEE NOTES TO FINANCIAL STATEMENTS. |
SCHEDULE OF INVESTMENTS (concluded) | October 31, 2015 |
GUGGENHEIM MSCI EMERGING MARKETS EQUAL COUNTRY WEIGHT ETF | |
Shares | Value | |||||||
PREFERRED STOCKS† - 1.2% | ||||||||
Grupo Aval Acciones y Valores S.A. | 104,519 | $ | 41,930 | |||||
Grupo de Inversiones Suramericana | 3,190 | 40,114 | ||||||
Banco Davivienda S.A. | 3,137 | 25,842 | ||||||
Samsung Electronics Company, Ltd. | 24 | 25,157 | ||||||
Hyundai Motor Co. | 52 | 5,200 | ||||||
Total Preferred Stocks | ||||||||
(Cost $156,905) | 138,243 | |||||||
EXCHANGE-TRADED FUNDS† - 6.2% | ||||||||
iShares MSCI India ETF | 16,871 | 480,487 | ||||||
Global X FTSE Greece 20 ETF | 10,306 | 108,213 | ||||||
Market Vectors Egypt Index ETF | 2,552 | 102,077 | ||||||
Total Exchange-Traded Funds | ||||||||
(Cost $786,600) | 690,777 | |||||||
Total Investments - 101.4% | ||||||||
(Cost $13,101,345) | $ | 11,228,715 | ||||||
Other Assets & Liabilities, net - (1.4)% | (156,573 | ) | ||||||
Total Net Assets - 100.0% | $ | 11,072,142 | ||||||
INVESTMENT CONCENTRATION
At October 31, 2015, the investment diversification of the Fund by country was as follows:
Country | % of Total Investments |
Colombia | 4.9% |
Republic of Korea | 4.8% |
Peru | 4.5% |
Russian Federation | 4.5% |
Indonesia | 4.5% |
Mexico | 4.5% |
Turkey | 4.5% |
China | 4.5% |
Taiwan, Province of China | 4.4% |
Greece | 4.4% |
Chile | 4.4% |
Qatar | 4.4% |
Thailand | 4.3% |
Philippines | 4.3% |
Egypt | 4.3% |
Malaysia | 4.3% |
India | 4.3% |
South Africa | 4.2% |
Hungary | 4.2% |
United Arab Emirates | 4.1% |
Poland | 4.0% |
Brazil | 3.9% |
Czech Republic | 3.8% |
Total Investments | 100.0% |
* | Non-income producing security. |
† | Value determined based on Level 1 inputs, unless otherwise noted — See Note 4. |
††† | Value determined based on Level 3 inputs — See Note 4. |
1 | This security was fair valued by the Valuation Committee at October 31, 2015. |
ADR — American Depositary Receipt | |
GDR — Global Depositary Receipt | |
plc — Public Limited Company | |
See Sector Classification in Other Information section. |
The following table summarizes the inputs used to value the Fund's net assets at October 31, 2015 (See Note 4 in the Notes to Financial Statements):
Investments in Securities | Level 1 | Level 2 | Level 3 | Total | ||||||||||||
Common Stocks | $ | 10,391,015 | $ | — | $ | 8,680 | $ | 10,399,695 | ||||||||
Exchange-Traded Funds | 690,777 | — | — | 690,777 | ||||||||||||
Preferred Stocks | 138,243 | — | — | 138,243 | ||||||||||||
Total | $ | 11,220,035 | $ | — | $ | 8,680 | $ | 11,228,715 | ||||||||
Transfers between investment levels may occur as the markets fluctuate and/or the availability of data used in the investment’s valuation changes. The Fund recognizes transfers between the levels as of the beginning of the period. As of October 31, 2015, Guggenheim MSCI Emerging Markets Equal Country Weight ETF had a security with a total value of $8,680 transfer from Level 1 to Level 3 based on a change in availability of market information.
SEE NOTES TO FINANCIAL STATEMENTS. | GUGGENHEIM ETFs ANNUAL REPORT | 79 |
SCHEDULE OF INVESTMENTS | October 31, 2015 |
GUGGENHEIM S&P 500® EQUAL WEIGHT CONSUMER DISCRETIONARY ETF | |
Shares | Value | |||||||
COMMON STOCKS† - 99.8% | ||||||||
Retail - 36.5% | ||||||||
McDonald’s Corp. | 20,677 | $ | 2,320,994 | |||||
Advance Auto Parts, Inc. | 11,497 | 2,281,349 | ||||||
O’Reilly Automotive, Inc.* | 8,179 | 2,259,531 | ||||||
Starbucks Corp. | 35,583 | 2,226,429 | ||||||
Signet Jewelers Ltd. | 14,409 | 2,174,894 | ||||||
AutoNation, Inc.* | 34,392 | 2,173,231 | ||||||
GameStop Corp. — Class A | 47,118 | 2,170,726 | ||||||
AutoZone, Inc.* | 2,766 | 2,169,678 | ||||||
Lowe’s Companies, Inc. | 29,372 | 2,168,535 | ||||||
Home Depot, Inc. | 17,439 | 2,156,158 | ||||||
Coach, Inc. | 68,756 | 2,145,188 | ||||||
Tractor Supply Co. | 22,928 | 2,118,318 | ||||||
L Brands, Inc. | 21,778 | 2,090,253 | ||||||
Tiffany & Co. | 25,250 | 2,081,610 | ||||||
TJX Companies, Inc. | 27,997 | 2,049,101 | ||||||
Ross Stores, Inc. | 40,228 | 2,034,732 | ||||||
Target Corp. | 25,894 | 1,998,499 | ||||||
Dollar Tree, Inc.* | 30,454 | 1,994,432 | ||||||
CarMax, Inc.* | 33,631 | 1,984,565 | ||||||
Bed Bath & Beyond, Inc.* | 32,878 | 1,960,515 | ||||||
Dollar General Corp. | 28,719 | 1,946,287 | ||||||
Urban Outfitters, Inc.* | 66,759 | 1,909,307 | ||||||
Staples, Inc. | 146,007 | 1,896,631 | ||||||
Best Buy Company, Inc. | 52,867 | 1,851,931 | ||||||
Kohl’s Corp. | 39,924 | 1,841,295 | ||||||
Nordstrom, Inc. | 27,387 | 1,785,906 | ||||||
Darden Restaurants, Inc. | 28,670 | 1,774,386 | ||||||
Macy’s, Inc. | 34,789 | 1,773,543 | ||||||
Yum! Brands, Inc. | 24,821 | 1,760,057 | ||||||
Chipotle Mexican Grill, Inc. — Class A* | 2,749 | 1,759,992 | ||||||
The Gap, Inc. | 62,581 | 1,703,455 | ||||||
PVH Corp. | 17,670 | 1,607,087 | ||||||
Total Retail | 64,168,615 | |||||||
Media - 15.3% | ||||||||
TEGNA, Inc. | 87,451 | 2,364,675 | ||||||
Cablevision Systems Corp. — Class A | 72,188 | 2,352,607 | ||||||
Scripps Networks Interactive, Inc. — Class A | 38,120 | 2,290,250 | ||||||
Viacom, Inc. — Class B | 45,923 | 2,264,463 | ||||||
Walt Disney Co. | 19,313 | 2,196,661 | ||||||
Time Warner, Inc. | 28,932 | 2,179,737 | ||||||
CBS Corp. — Class B | 46,185 | 2,148,526 | ||||||
Time Warner Cable, Inc. | 10,738 | 2,033,777 | ||||||
News Corp. — Class A | 126,565 | 1,949,101 | ||||||
Comcast Corp. — Class A | 31,018 | 1,942,347 | ||||||
Twenty-First Century Fox, Inc. — Class A | 59,476 | 1,825,318 | ||||||
Discovery Communications, Inc. — Class C* | 49,658 | 1,366,588 | ||||||
Discovery Communications, Inc. — Class A* | 28,367 | 835,124 | ||||||
Twenty-First Century Fox, Inc. — Class B | 16,826 | 519,587 | ||||||
News Corp. — Class B | 28,052 | 434,245 | ||||||
Comcast Corp. — Class A | 4,679 | 293,420 | ||||||
Total Media | 26,996,426 | |||||||
Apparel - 6.9% | ||||||||
NIKE, Inc. — Class B | 17,987 | 2,356,837 | ||||||
Hanesbrands, Inc. | 67,401 | 2,152,789 | ||||||
Ralph Lauren Corp. — Class A | 18,464 | 2,045,258 | ||||||
Under Armour, Inc. — Class A* | 20,762 | 1,974,051 | ||||||
VF Corp. | 28,360 | 1,914,867 | ||||||
Michael Kors Holdings Ltd.* | 45,752 | 1,767,857 | ||||||
Total Apparel | 12,211,659 | |||||||
Internet - 6.7% | ||||||||
TripAdvisor, Inc.* | 30,215 | 2,531,413 | ||||||
Amazon.com, Inc.* | 3,782 | 2,367,154 | ||||||
Expedia, Inc. | 17,246 | 2,350,630 | ||||||
Priceline Group, Inc.* | 1,557 | 2,264,252 | ||||||
Netflix, Inc.* | 20,651 | 2,238,155 | ||||||
Total Internet | 11,751,604 | |||||||
Auto Parts & Equipment - 5.0% | ||||||||
Johnson Controls, Inc. | 50,347 | 2,274,678 | ||||||
Goodyear Tire & Rubber Co. | 68,248 | 2,241,264 | ||||||
Delphi Automotive plc | 26,471 | 2,202,122 | ||||||
BorgWarner, Inc. | 47,044 | 2,014,424 | ||||||
Total Auto Parts & Equipment | 8,732,488 | |||||||
Lodging - 4.8% | ||||||||
Starwood Hotels & Resorts Worldwide, Inc. | 27,423 | 2,190,275 | ||||||
Marriott International, Inc. — Class A | 27,640 | 2,122,199 | ||||||
Wynn Resorts Ltd. | 30,034 | 2,100,878 | ||||||
Wyndham Worldwide Corp. | 25,585 | 2,081,340 | ||||||
Total Lodging | 8,494,692 | |||||||
Home Furnishings - 3.6% | ||||||||
Harman International Industries, Inc. | 20,693 | 2,275,402 | ||||||
Leggett & Platt, Inc. | 45,865 | 2,065,301 | ||||||
Whirlpool Corp. | 12,402 | 1,986,056 | ||||||
Total Home Furnishings | 6,326,759 | |||||||
Leisure Time - 3.4% | ||||||||
Royal Caribbean Cruises Ltd. | 21,581 | 2,122,491 | ||||||
Carnival Corp. | 39,137 | 2,116,529 | ||||||
Harley-Davidson, Inc. | 36,788 | 1,819,167 | ||||||
Total Leisure Time | 6,058,187 | |||||||
Home Builders - 3.2% | ||||||||
Lennar Corp. — Class A | 38,478 | 1,926,593 | ||||||
DR Horton, Inc. | 64,012 | 1,884,513 | ||||||
PulteGroup, Inc. | 95,981 | 1,759,332 | ||||||
Total Home Builders | 5,570,438 | |||||||
80 | GUGGENHEIM ETFs ANNUAL REPORT | SEE NOTES TO FINANCIAL STATEMENTS. |
SCHEDULE OF INVESTMENTS (concluded) | October 31, 2015 |
GUGGENHEIM S&P 500® EQUAL WEIGHT CONSUMER DISCRETIONARY ETF | |
Shares | Value | |||||||
Advertising - 2.6% | ||||||||
Interpublic Group of Companies, Inc. | 102,564 | $ | 2,351,792 | |||||
Omnicom Group, Inc. | 29,841 | 2,235,688 | ||||||
Total Advertising | 4,587,480 | |||||||
Auto Manufacturers - 2.6% | ||||||||
General Motors Co. | 67,128 | 2,343,439 | ||||||
Ford Motor Co. | 147,404 | 2,183,053 | ||||||
Total Auto Manufacturers | 4,526,492 | |||||||
Toys, Games & Hobbies - 2.4% | ||||||||
Mattel, Inc. | 89,503 | 2,199,983 | ||||||
Hasbro, Inc. | 26,220 | 2,014,483 | ||||||
Total Toys, Games & Hobbies | 4,214,466 | |||||||
Distribution & Wholesale - 2.3% | ||||||||
Genuine Parts Co. | 24,207 | 2,197,027 | ||||||
Fossil Group, Inc.* | 34,466 | 1,875,295 | ||||||
Total Distribution & Wholesale | 4,072,322 | |||||||
Commercial Services - 1.2% | ||||||||
H&R Block, Inc. | 55,485 | 2,067,371 | ||||||
Housewares - 1.1% | ||||||||
Newell Rubbermaid, Inc. | 47,336 | 2,008,466 | ||||||
Electronics - 1.1% | ||||||||
Garmin Ltd. | 56,453 | 2,002,388 | ||||||
Textiles - 1.1% | ||||||||
Mohawk Industries, Inc.* | 9,728 | 1,901,824 | ||||||
Total Common Stocks | ||||||||
(Cost $180,646,081) | 175,691,677 | |||||||
SHORT TERM INVESTMENTS† - 0.2% | ||||||||
Federated U.S. Treasury Cash Reserve Fund 0.00%1 | 288,874 | 288,874 | ||||||
Total Short Term Investments | ||||||||
(Cost $288,874) | 288,874 | |||||||
Total Investments - 100.0% | ||||||||
(Cost $180,934,955) | $ | 175,980,551 | ||||||
Other Assets & Liabilities, net - 0.0% | 20,496 | |||||||
Total Net Assets - 100.0% | $ | 176,001,047 | ||||||
* | Non-income producing security. |
† | Value determined based on Level 1 inputs — See Note 4. |
1 | Rate indicated is the 7 day yield as of October 31, 2015. |
plc — Public Limited Company | |
See Sector Classification in Other Information section. |
The following table summarizes the inputs used to value the Fund's net assets at October 31, 2015 (See Note 4 in the Notes to Financial Statements):
Investments in Securities | Level 1 | Level 2 | Level 3 | Total | ||||||||||||
Common Stocks | $ | 175,691,677 | $ | — | $ | — | $ | 175,691,677 | ||||||||
Short Term Investments | 288,874 | — | — | 288,874 | ||||||||||||
Total | $ | 175,980,551 | $ | — | $ | — | $ | 175,980,551 | ||||||||
For the year ended October 31, 2015, there were no transfers between levels.
SEE NOTES TO FINANCIAL STATEMENTS. | GUGGENHEIM ETFs ANNUAL REPORT | 81 |
SCHEDULE OF INVESTMENTS | October 31, 2015 |
GUGGENHEIM S&P 500® EQUAL WEIGHT CONSUMER STAPLES ETF | |
Shares | Value | |||||||
COMMON STOCKS† - 99.7% | ||||||||
Food - 36.6% | ||||||||
Hormel Foods Corp. | 219,785 | $ | 14,846,477 | |||||
Mondelez International, Inc. — Class A | 317,838 | 14,671,403 | ||||||
Kraft Heinz Co. | 183,903 | 14,338,917 | ||||||
Kellogg Co. | 202,498 | 14,280,159 | ||||||
McCormick & Company, Inc. | 167,774 | 14,089,661 | ||||||
Sysco Corp. | 339,535 | 14,005,819 | ||||||
General Mills, Inc. | 240,212 | 13,958,719 | ||||||
Campbell Soup Co. | 274,585 | 13,946,172 | ||||||
Tyson Foods, Inc. — Class A | 312,759 | 13,873,989 | ||||||
Kroger Co. | 363,763 | 13,750,241 | ||||||
JM Smucker Co. | 116,831 | 13,714,791 | ||||||
ConAgra Foods, Inc. | 325,541 | 13,200,688 | ||||||
Hershey Co. | 148,707 | 13,188,824 | ||||||
Whole Foods Market, Inc. | 419,956 | 12,581,882 | ||||||
Total Food | 194,447,742 | |||||||
Beverages - 24.8% | ||||||||
Molson Coors Brewing Co. — Class B | 195,594 | 17,231,831 | ||||||
Dr Pepper Snapple Group, Inc. | 177,435 | 15,857,365 | ||||||
PepsiCo, Inc. | 148,042 | 15,128,412 | ||||||
Coca-Cola Co. | 355,754 | 15,066,182 | ||||||
Brown-Forman Corp. — Class B | 141,089 | 14,980,830 | ||||||
Constellation Brands, Inc. — Class A | 106,454 | 14,349,999 | ||||||
Coca-Cola Enterprises, Inc. | 276,664 | 14,203,930 | ||||||
Monster Beverage Corp.* | 102,162 | 13,926,724 | ||||||
Keurig Green Mountain, Inc. | 222,737 | 11,303,903 | ||||||
Total Beverages | 132,049,176 | |||||||
Agriculture - 11.4% | ||||||||
Altria Group, Inc. | 257,946 | 15,597,994 | ||||||
Reynolds American, Inc. | 321,503 | 15,535,025 | ||||||
Philip Morris International, Inc. | 170,694 | 15,089,350 | ||||||
Archer-Daniels-Midland Co. | 316,798 | 14,464,997 | ||||||
Total Agriculture | 60,687,366 | |||||||
Retail - 10.0% | ||||||||
Costco Wholesale Corp. | 96,171 | 15,206,558 | ||||||
CVS Health Corp. | 133,606 | 13,197,601 | ||||||
Walgreens Boots Alliance, Inc. | 150,036 | 12,705,048 | ||||||
Wal-Mart Stores, Inc. | 209,820 | 12,010,097 | ||||||
Total Retail | 53,119,304 | |||||||
Cosmetics & Personal Care - 8.3% | ||||||||
Procter & Gamble Co. | 198,254 | 15,142,640 | ||||||
Colgate-Palmolive Co. | 219,056 | 14,534,366 | ||||||
Estee Lauder Companies, Inc. — Class A | 177,516 | 14,282,937 | ||||||
Total Cosmetics & Personal Care | 43,959,943 | |||||||
Household Products & Housewares - 5.8% | ||||||||
Kimberly-Clark Corp. | 130,364 | 15,605,874 | ||||||
Clorox Co. | 123,504 | 15,060,078 | ||||||
Total Household Products & Housewares | 30,665,952 | |||||||
Pharmaceuticals - 2.8% | ||||||||
Mead Johnson Nutrition Co. — Class A | 179,372 | 14,708,504 | ||||||
Total Common Stocks | ||||||||
(Cost $507,880,230) | 529,637,987 | |||||||
SHORT TERM INVESTMENTS† - 0.2% | ||||||||
Federated U.S. Treasury Cash Reserve Fund 0.00%1 | 842,605 | 842,605 | ||||||
Total Short Term Investments | ||||||||
(Cost $842,605) | 842,605 | |||||||
Total Investments - 99.9% | ||||||||
(Cost $508,722,835) | $ | 530,480,592 | ||||||
Other Assets & Liabilities, net - 0.1% | 391,804 | |||||||
Total Net Assets - 100.0% | $ | 530,872,396 | ||||||
* | Non-income producing security. |
† | Value determined based on Level 1 inputs — See Note 4. |
1 | Rate indicated is the 7 day yield as of October 31, 2015. |
See Sector Classification in Other Information section. |
The following table summarizes the inputs used to value the Fund's net assets at October 31, 2015 (See Note 4 in the Notes to Financial Statements):
Investments in Securities | Level 1 | Level 2 | Level 3 | Total | ||||||||||||
Common Stocks | $ | 529,637,987 | $ | — | $ | — | $ | 529,637,987 | ||||||||
Short Term Investments | 842,605 | — | — | 842,605 | ||||||||||||
Total | $ | 530,480,592 | $ | — | $ | — | $ | 530,480,592 | ||||||||
For the year ended October 31, 2015, there were no transfers between levels.
82 | GUGGENHEIM ETFs ANNUAL REPORT | SEE NOTES TO FINANCIAL STATEMENTS. |
SCHEDULE OF INVESTMENTS | October 31, 2015 |
GUGGENHEIM S&P 500® EQUAL WEIGHT ENERGY ETF | |
Shares | Value | |||||||
COMMON STOCKS† - 99.8% | ||||||||
Oil & Gas - 72.2% | ||||||||
Marathon Oil Corp. | 283,372 | $ | 5,208,378 | |||||
Chevron Corp. | 56,418 | 5,127,268 | ||||||
Newfield Exploration Co.* | 125,288 | 5,035,325 | ||||||
Apache Corp. | 106,370 | 5,013,218 | ||||||
Pioneer Natural Resources Co. | 36,127 | 4,954,457 | ||||||
Noble Energy, Inc. | 137,098 | 4,913,592 | ||||||
Helmerich & Payne, Inc. | 86,647 | 4,875,627 | ||||||
Exxon Mobil Corp. | 58,826 | 4,867,263 | ||||||
ConocoPhillips | 90,288 | 4,816,865 | ||||||
Tesoro Corp. | 44,737 | 4,783,727 | ||||||
Occidental Petroleum Corp. | 63,917 | 4,764,373 | ||||||
Cimarex Energy Co. | 40,343 | 4,762,895 | ||||||
EOG Resources, Inc. | 55,425 | 4,758,236 | ||||||
Transocean Ltd. | 300,288 | 4,753,559 | ||||||
Phillips 66 | 53,052 | 4,724,281 | ||||||
Marathon Petroleum Corp. | 89,326 | 4,627,087 | ||||||
Devon Energy Corp. | 110,095 | 4,616,283 | ||||||
Ensco plc — Class A | 276,231 | 4,593,722 | ||||||
Hess Corp. | 81,449 | 4,578,248 | ||||||
Murphy Oil Corp. | 159,673 | 4,539,503 | ||||||
Valero Energy Corp. | 67,971 | 4,480,648 | ||||||
Anadarko Petroleum Corp. | 65,134 | 4,356,162 | ||||||
Chesapeake Energy Corp. | 564,872 | 4,027,537 | ||||||
Cabot Oil & Gas Corp. — Class A | 184,713 | 4,010,119 | ||||||
Equities Corp. | 58,908 | 3,892,052 | ||||||
Diamond Offshore Drilling, Inc. | 194,456 | 3,865,785 | ||||||
Range Resources Corp. | 117,217 | 3,568,085 | ||||||
Southwestern Energy Co.* | 277,486 | 3,063,445 | ||||||
Total Oil & Gas | 127,577,740 | |||||||
Oil & Gas Services - 14.9% | ||||||||
Schlumberger Ltd. | 58,020 | 4,534,844 | ||||||
Cameron International Corp.* | 66,327 | 4,510,900 | ||||||
FMC Technologies, Inc.* | 131,409 | 4,445,566 | ||||||
Halliburton Co. | 114,948 | 4,411,704 | ||||||
Baker Hughes, Inc. | 80,558 | 4,243,795 | ||||||
National Oilwell Varco, Inc. | 110,664 | 4,165,393 | ||||||
Total Oil & Gas Services | 26,312,202 | |||||||
Pipelines - 11.4% | ||||||||
Spectra Energy Corp. | 156,747 | 4,478,262 | ||||||
ONEOK, Inc. | 121,514 | 4,121,755 | ||||||
Williams Companies, Inc. | 99,514 | 3,924,832 | ||||||
Kinder Morgan, Inc. | 142,063 | 3,885,423 | ||||||
Columbia Pipeline Group, Inc. | 181,961 | 3,779,330 | ||||||
Total Pipelines | 20,189,602 | |||||||
Coal - 1.3% | ||||||||
CONSOL Energy, Inc. | 341,266 | 2,272,832 | ||||||
Total Common Stocks | ||||||||
(Cost $226,692,290) | 176,352,376 | |||||||
SHORT TERM INVESTMENTS† - 0.1% | ||||||||
Federated U.S. Treasury Cash Reserve Fund 0.00%1 | 166,215 | 166,215 | ||||||
Total Short Term Investments | ||||||||
(Cost $166,215) | 166,215 | |||||||
Total Investments - 99.9% | ||||||||
(Cost $226,858,505) | $ | 176,518,591 | ||||||
Other Assets & Liabilities, net - 0.1% | 254,057 | |||||||
Total Net Assets - 100.0% | $ | 176,772,648 | ||||||
* | Non-income producing security. |
† | Value determined based on Level 1 inputs — See Note 4. |
1 | Rate indicated is the 7 day yield as of October 31, 2015. |
plc — Public Limited Company | |
See Sector Classification in Other Information section. |
The following table summarizes the inputs used to value the Fund's net assets at October 31, 2015 (See Note 4 in the Notes to Financial Statements):
Investments in Securities | Level 1 | Level 2 | Level 3 | Total | ||||||||||||
Common Stocks | $ | 176,352,376 | $ | — | $ | — | $ | 176,352,376 | ||||||||
Short Term Investments | 166,215 | — | — | 166,215 | ||||||||||||
Total | $ | 176,518,591 | $ | — | $ | — | $ | 176,518,591 | ||||||||
For the year ended October 31, 2015, there were no transfers between levels.
SEE NOTES TO FINANCIAL STATEMENTS. | GUGGENHEIM ETFs ANNUAL REPORT | 83 |
SCHEDULE OF INVESTMENTS | October 31, 2015 |
GUGGENHEIM S&P 500® EQUAL WEIGHT FINANCIALS ETF | |
Shares | Value | |||||||
COMMON STOCKS† - 99.8% | ||||||||
REITs - 28.3% | ||||||||
Kimco Realty Corp. | 86,120 | $ | 2,305,432 | |||||
General Growth Properties, Inc. | 79,507 | 2,301,728 | ||||||
Prologis, Inc. | 53,261 | 2,275,843 | ||||||
American Tower Corp. — Class A | 22,205 | 2,270,017 | ||||||
Macerich Co. | 26,746 | 2,266,456 | ||||||
Vornado Realty Trust | 22,332 | 2,245,483 | ||||||
Public Storage | 9,773 | 2,242,512 | ||||||
SL Green Realty Corp. | 18,893 | 2,241,087 | ||||||
Simon Property Group, Inc. | 11,052 | 2,226,536 | ||||||
Boston Properties, Inc. | 17,423 | 2,192,685 | ||||||
Realty Income Corp. | 43,929 | 2,172,728 | ||||||
Equity Residential | 27,936 | 2,160,011 | ||||||
Plum Creek Timber Company, Inc. | 52,932 | 2,156,450 | ||||||
Crown Castle International Corp. | 25,214 | 2,154,788 | ||||||
Apartment Investment & Management Co. — Class A | 54,830 | 2,148,788 | ||||||
Iron Mountain, Inc. | 69,976 | 2,144,065 | ||||||
Weyerhaeuser Co. | 72,758 | 2,133,992 | ||||||
AvalonBay Communities, Inc. | 11,937 | 2,086,946 | ||||||
Welltower, Inc. | 31,589 | 2,049,178 | ||||||
HCP, Inc. | 54,942 | 2,043,843 | ||||||
Essex Property Trust, Inc. | 9,230 | 2,034,661 | ||||||
Ventas, Inc. | 37,659 | 2,023,041 | ||||||
Equinix, Inc. | 6,813 | 2,021,281 | ||||||
Host Hotels & Resorts, Inc. | 111,938 | 1,939,886 | ||||||
Total REITs | 51,837,437 | |||||||
Insurance - 25.0% | ||||||||
Travelers Companies, Inc. | 19,902 | 2,246,737 | ||||||
ACE Ltd. | 19,655 | 2,231,629 | ||||||
Cincinnati Financial Corp. | 37,023 | 2,229,895 | ||||||
Aflac, Inc. | 34,122 | 2,175,277 | ||||||
Progressive Corp. | 65,354 | 2,165,178 | ||||||
American International Group, Inc. | 33,998 | 2,143,914 | ||||||
Lincoln National Corp. | 39,845 | 2,132,106 | ||||||
Allstate Corp. | 34,180 | 2,115,058 | ||||||
Chubb Corp. | 16,274 | 2,105,042 | ||||||
Unum Group | 60,563 | 2,098,508 | ||||||
Assurant, Inc. | 25,677 | 2,093,446 | ||||||
Prudential Financial, Inc. | 25,144 | 2,074,380 | ||||||
Principal Financial Group, Inc. | 41,191 | 2,066,141 | ||||||
MetLife, Inc. | 40,937 | 2,062,406 | ||||||
Berkshire Hathaway, Inc. — Class B* | 15,100 | 2,053,902 | ||||||
Marsh & McLennan Companies, Inc. | 36,686 | 2,044,878 | ||||||
XL Group plc — Class A | 53,554 | 2,039,336 | ||||||
Aon plc | 21,740 | 2,028,559 | ||||||
Torchmark Corp. | 34,371 | 1,993,862 | ||||||
Loews Corp. | 54,665 | 1,993,086 | ||||||
Hartford Financial Services Group, Inc. | 42,995 | 1,988,949 | ||||||
Genworth Financial, Inc. — Class A* | 391,851 | 1,833,863 | ||||||
Total Insurance | 45,916,152 | |||||||
Banks - 22.9% | ||||||||
Bank of New York Mellon Corp. | 50,175 | 2,089,788 | ||||||
SunTrust Banks, Inc. | 50,241 | 2,086,005 | ||||||
Bank of America Corp. | 123,714 | 2,075,920 | ||||||
Capital One Financial Corp. | 26,269 | 2,072,624 | ||||||
Citigroup, Inc. | 38,857 | 2,066,027 | ||||||
Comerica, Inc. | 47,323 | 2,053,818 | ||||||
Wells Fargo & Co. | 37,705 | 2,041,349 | ||||||
U.S. Bancorp | 48,332 | 2,038,644 | ||||||
JPMorgan Chase & Co. | 31,718 | 2,037,882 | ||||||
BB&T Corp. | 54,499 | 2,024,638 | ||||||
Zions Bancorporation | 70,075 | 2,016,058 | ||||||
Huntington Bancshares, Inc. | 183,471 | 2,012,677 | ||||||
Goldman Sachs Group, Inc. | 10,720 | 2,010,000 | ||||||
Northern Trust Corp. | 28,348 | 1,995,416 | ||||||
PNC Financial Services Group, Inc. | 21,964 | 1,982,471 | ||||||
M&T Bank Corp. | 16,379 | 1,963,023 | ||||||
Regions Financial Corp. | 208,760 | 1,951,906 | ||||||
Morgan Stanley | 58,469 | 1,927,723 | ||||||
State Street Corp. | 27,768 | 1,915,992 | ||||||
Fifth Third Bancorp | 100,327 | 1,911,229 | ||||||
KeyCorp | 147,025 | 1,826,051 | ||||||
Total Banks | 42,099,241 | |||||||
Diversified Financial Services - 17.0% | ||||||||
BlackRock, Inc. — Class A | 6,553 | 2,306,460 | ||||||
Nasdaq, Inc. | 38,246 | 2,214,061 | ||||||
Discover Financial Services | 37,745 | 2,122,024 | ||||||
Navient Corp. | 160,520 | 2,117,259 | ||||||
Intercontinental Exchange, Inc. | 8,385 | 2,116,374 | ||||||
T. Rowe Price Group, Inc. | 27,954 | 2,113,881 | ||||||
Legg Mason, Inc. | 46,717 | 2,090,586 | ||||||
Ameriprise Financial, Inc. | 18,115 | 2,089,746 | ||||||
E*TRADE Financial Corp.* | 73,263 | 2,088,728 | ||||||
Franklin Resources, Inc. | 50,506 | 2,058,625 | ||||||
Affiliated Managers Group, Inc.* | 11,309 | 2,038,560 | ||||||
Invesco Ltd. | 60,486 | 2,006,321 | ||||||
Charles Schwab Corp. | 65,089 | 1,986,516 | ||||||
CME Group, Inc. — Class A | 20,974 | 1,981,414 | ||||||
American Express Co. | 26,261 | 1,923,881 | ||||||
Total Diversified Financial Services | 31,254,436 | |||||||
Savings & Loans - 2.3% | ||||||||
Hudson City Bancorp, Inc. | 206,022 | 2,084,942 | ||||||
People’s United Financial, Inc. | 127,947 | 2,040,755 | ||||||
Total Savings & Loans | 4,125,697 | |||||||
84 | GUGGENHEIM ETFs ANNUAL REPORT | SEE NOTES TO FINANCIAL STATEMENTS. |
SCHEDULE OF INVESTMENTS (concluded) | October 31, 2015 |
GUGGENHEIM S&P 500® EQUAL WEIGHT FINANCIALS ETF | |
Shares | Value | |||||||
Commercial Services - 2.1% | ||||||||
McGraw Hill Financial, Inc. | 20,983 | $ | 1,943,865 | |||||
Moody’s Corp. | 19,527 | 1,877,716 | ||||||
Total Commercial Services | 3,821,581 | |||||||
Real Estate - 1.2% | ||||||||
CBRE Group, Inc. — Class A* | 60,613 | 2,259,653 | ||||||
Holding Companies-Diversified - 1.0% | ||||||||
Leucadia National Corp. | 95,446 | 1,909,874 | ||||||
Total Common Stocks | ||||||||
(Cost $187,934,384) | 183,224,071 | |||||||
SHORT TERM INVESTMENTS† - 0.1% | ||||||||
Federated U.S. Treasury Cash Reserve Fund 0.00%1 | 175,886 | 175,886 | ||||||
Total Short Term Investments | ||||||||
(Cost $175,886) | 175,886 | |||||||
Total Investments - 99.9% | ||||||||
(Cost $188,110,270) | $ | 183,399,957 | ||||||
Other Assets & Liabilities, net - 0.1% | 220,393 | |||||||
Total Net Assets - 100.0% | $ | 183,620,350 | ||||||
* | Non-income producing security. |
† | Value determined based on Level 1 inputs — See Note 4. |
1 | Rate indicated is the 7 day yield as of October 31, 2015. |
plc — Public Limited Company | |
REIT — Real Estate Investment Trust | |
See Sector Classification in Other Information section. |
The following table summarizes the inputs used to value the Fund's net assets at October 31, 2015 (See Note 4 in the Notes to Financial Statements):
Investments in Securities | Level 1 | Level 2 | Level 3 | Total | ||||||||||||
Common Stocks | $ | 183,224,071 | $ | — | $ | — | $ | 183,224,071 | ||||||||
Short Term Investments | 175,886 | — | — | 175,886 | ||||||||||||
Total | $ | 183,399,957 | $ | — | $ | — | $ | 183,399,957 | ||||||||
For the year ended October 31, 2015, there were no transfers between levels.
SEE NOTES TO FINANCIAL STATEMENTS. | GUGGENHEIM ETFs ANNUAL REPORT | 85 |
SCHEDULE OF INVESTMENTS | October 31, 2015 |
GUGGENHEIM S&P 500® EQUAL WEIGHT HEALTH CARE ETF | |
Shares | Value | |||||||
COMMON STOCKS† - 99.9% | ||||||||
Pharmaceuticals - 32.0% | ||||||||
Bristol-Myers Squibb Co. | 176,372 | $ | 11,631,733 | |||||
Johnson & Johnson | 112,334 | 11,349,104 | ||||||
Merck & Company, Inc. | 200,529 | 10,960,915 | ||||||
Allergan plc* | 35,337 | 10,900,404 | ||||||
Abbott Laboratories | 240,658 | 10,781,478 | ||||||
Pfizer, Inc. | 316,550 | 10,705,721 | ||||||
Express Scripts Holding Co.* | 123,516 | 10,669,312 | ||||||
AbbVie, Inc. | 176,038 | 10,483,063 | ||||||
Eli Lilly & Co. | 127,573 | 10,406,130 | ||||||
Cardinal Health, Inc. | 122,778 | 10,092,352 | ||||||
Baxalta, Inc. | 290,818 | 10,021,588 | ||||||
Zoetis, Inc. | 232,073 | 9,981,460 | ||||||
AmerisourceBergen Corp. — Class A | 100,051 | 9,655,922 | ||||||
Mylan N.V.* | 215,424 | 9,498,044 | ||||||
McKesson Corp. | 52,898 | 9,458,162 | ||||||
Perrigo Company plc | 58,077 | 9,161,066 | ||||||
Mallinckrodt plc* | 127,677 | 8,384,549 | ||||||
Endo International plc* | 139,586 | 8,373,764 | ||||||
Total Pharmaceuticals | 182,514,767 | |||||||
Healthcare-Products - 26.6% | ||||||||
DENTSPLY International, Inc. | 198,325 | 12,068,076 | ||||||
Edwards Lifesciences Corp.* | 74,932 | 11,775,564 | ||||||
Henry Schein, Inc.* | 77,185 | 11,709,737 | ||||||
Boston Scientific Corp.* | 617,932 | 11,295,797 | ||||||
Medtronic plc | 149,390 | 11,042,909 | ||||||
Becton Dickinson and Co. | 76,739 | 10,936,842 | ||||||
Zimmer Biomet Holdings, Inc. | 104,258 | 10,902,259 | ||||||
Baxter International, Inc. | 289,712 | 10,832,332 | ||||||
Patterson Companies, Inc. | 228,272 | 10,820,093 | ||||||
Varian Medical Systems, Inc.* | 131,766 | 10,347,584 | ||||||
CR Bard, Inc. | 54,016 | 10,065,882 | ||||||
Intuitive Surgical, Inc.* | 20,228 | 10,045,225 | ||||||
Stryker Corp. | 104,623 | 10,004,051 | ||||||
St. Jude Medical, Inc. | 149,593 | 9,545,529 | ||||||
Total Healthcare-Products | 151,391,880 | |||||||
Healthcare-Services - 18.9% | ||||||||
Quest Diagnostics, Inc. | 159,182 | 10,816,417 | ||||||
Laboratory Corporation of America Holdings* | 88,018 | 10,803,329 | ||||||
DaVita HealthCare Partners, Inc.* | 139,228 | 10,791,562 | ||||||
UnitedHealth Group, Inc. | 87,869 | 10,349,211 | ||||||
Aetna, Inc. | 88,457 | 10,153,094 | ||||||
Cigna Corp. | 74,697 | 10,012,386 | ||||||
Humana, Inc. | 55,771 | 9,962,374 | ||||||
Anthem, Inc. | 71,006 | 9,880,485 | ||||||
Universal Health Services, Inc. — Class B | 78,277 | 9,556,839 | ||||||
HCA Holdings, Inc.* | 123,123 | 8,469,631 | ||||||
Tenet Healthcare Corp.* | 222,905 | 6,992,530 | ||||||
Total Healthcare-Services | 107,787,858 | |||||||
Biotechnology - 12.7% | ||||||||
Regeneron Pharmaceuticals, Inc.* | 19,534 | 10,888,055 | ||||||
Amgen, Inc. | 68,099 | 10,771,900 | ||||||
Alexion Pharmaceuticals, Inc.* | 60,660 | 10,676,160 | ||||||
Celgene Corp.* | 84,005 | 10,308,254 | ||||||
Gilead Sciences, Inc. | 95,238 | 10,298,085 | ||||||
Vertex Pharmaceuticals, Inc.* | 77,727 | 9,695,666 | ||||||
Biogen, Inc.* | 33,157 | 9,632,440 | ||||||
Total Biotechnology | 72,270,560 | |||||||
Electronics - 7.7% | ||||||||
PerkinElmer, Inc. | 217,829 | 11,248,689 | ||||||
Thermo Fisher Scientific, Inc. | 84,943 | 11,108,846 | ||||||
Agilent Technologies, Inc. | 290,476 | 10,968,374 | ||||||
Waters Corp.* | 83,806 | 10,710,407 | ||||||
Total Electronics | 44,036,316 | |||||||
Software - 2.0% | ||||||||
Cerner Corp.* | 167,023 | 11,071,955 | ||||||
Total Common Stocks | ||||||||
(Cost $586,482,570) | 569,073,336 | |||||||
SHORT TERM INVESTMENTS† - 0.1% | ||||||||
Federated U.S. Treasury Cash Reserve Fund 0.00%1 | 767,528 | 767,528 | ||||||
Total Short Term Investments | ||||||||
(Cost $767,528) | 767,528 | |||||||
Total Investments - 100.0% | ||||||||
(Cost $587,250,098) | $ | 569,840,864 | ||||||
Other Assets & Liabilities, net - 0.0% | 52,244 | |||||||
Total Net Assets - 100.0% | $ | 569,893,108 | ||||||
* | Non-income producing security. |
† | Value determined based on Level 1 inputs — See Note 4. |
1 | Rate indicated is the 7 day yield as of October 31, 2015. |
plc — Public Limited Company | |
See Sector Classification in Other Information section. |
86 | GUGGENHEIM ETFs ANNUAL REPORT | SEE NOTES TO FINANCIAL STATEMENTS. |
SCHEDULE OF INVESTMENTS (concluded) | October 31, 2015 |
GUGGENHEIM S&P 500® EQUAL WEIGHT HEALTH CARE ETF | |
The following table summarizes the inputs used to value the Fund's net assets at October 31, 2015 (See Note 4 in the Notes to Financial Statements):
Investments in Securities | Level 1 | Level 2 | Level 3 | Total | ||||||||||||
Common Stocks | $ | 569,073,336 | $ | — | $ | — | $ | 569,073,336 | ||||||||
Short Term Investments | 767,528 | — | — | 767,528 | ||||||||||||
Total | $ | 569,840,864 | $ | — | $ | — | $ | 569,840,864 | ||||||||
For the year ended October 31, 2015, there were no transfers between levels.
SEE NOTES TO FINANCIAL STATEMENTS. | GUGGENHEIM ETFs ANNUAL REPORT | 87 |
SCHEDULE OF INVESTMENTS | October 31, 2015 |
GUGGENHEIM S&P 500® EQUAL WEIGHT INDUSTRIALS ETF | |
Shares | Value | |||||||
COMMON STOCKS† - 99.8% | ||||||||
Transportation - 14.4% | ||||||||
United Parcel Service, Inc. — Class B | 14,102 | $ | 1,452,787 | |||||
Union Pacific Corp. | 15,911 | 1,421,648 | ||||||
FedEx Corp. | 9,072 | 1,415,686 | ||||||
Expeditors International of Washington, Inc. | 27,949 | 1,391,581 | ||||||
Norfolk Southern Corp. | 17,310 | 1,385,319 | ||||||
CH Robinson Worldwide, Inc. | 19,954 | 1,384,409 | ||||||
J.B. Hunt Transport Services, Inc. | 17,899 | 1,366,947 | ||||||
CSX Corp. | 48,083 | 1,297,760 | ||||||
Kansas City Southern | 14,806 | 1,225,345 | ||||||
Ryder System, Inc. | 16,736 | 1,201,310 | ||||||
Total Transportation | 13,542,792 | |||||||
Miscellaneous Manufacturing - 14.0% | ||||||||
General Electric Co. | 54,923 | 1,588,372 | ||||||
3M Co. | 9,701 | 1,525,094 | ||||||
Illinois Tool Works, Inc. | 16,395 | 1,507,356 | ||||||
Ingersoll-Rand plc | 24,915 | 1,476,463 | ||||||
Dover Corp. | 22,628 | 1,457,922 | ||||||
Textron, Inc. | 33,828 | 1,426,527 | ||||||
Pentair plc | 25,186 | 1,408,401 | ||||||
Eaton Corporation plc | 24,594 | 1,375,051 | ||||||
Parker-Hannifin Corp. | 12,898 | 1,350,421 | ||||||
Total Miscellaneous Manufacturing | 13,115,607 | |||||||
Aerospace & Defense - 12.6% | ||||||||
L-3 Communications Holdings, Inc. | 12,975 | 1,640,040 | ||||||
Northrop Grumman Corp. | 8,131 | 1,526,596 | ||||||
Raytheon Co. | 12,862 | 1,509,999 | ||||||
Boeing Co. | 10,175 | 1,506,612 | ||||||
United Technologies Corp. | 14,842 | 1,460,601 | ||||||
Lockheed Martin Corp. | 6,627 | 1,456,813 | ||||||
General Dynamics Corp. | 9,659 | 1,435,134 | ||||||
Rockwell Collins, Inc. | 16,197 | 1,404,604 | ||||||
Total Aerospace & Defense | 11,940,399 | |||||||
Commercial Services - 10.2% | ||||||||
Equifax, Inc. | 13,983 | 1,490,168 | ||||||
Cintas Corp. | 15,977 | 1,487,299 | ||||||
United Rentals, Inc.* | 19,732 | 1,477,138 | ||||||
ADT Corp. | 43,244 | 1,428,782 | ||||||
Robert Half International, Inc. | 26,594 | 1,400,440 | ||||||
Verisk Analytics, Inc. — Class A* | 16,193 | 1,159,581 | ||||||
Quanta Services, Inc.* | 56,162 | 1,129,418 | ||||||
Total Commercial Services | 9,572,826 | |||||||
Machinery-Diversified - 9.1% | ||||||||
Roper Technologies, Inc. | 8,654 | 1,612,673 | ||||||
Xylem, Inc. | 42,178 | 1,535,701 | ||||||
Flowserve Corp. | 32,094 | 1,487,878 | ||||||
Rockwell Automation, Inc. | 12,941 | 1,412,640 | ||||||
Deere & Co. | 17,292 | 1,348,776 | ||||||
Cummins, Inc. | 11,373 | 1,177,219 | ||||||
Total Machinery-Diversified | 8,574,887 | |||||||
Airlines - 6.5% | ||||||||
Southwest Airlines Co. | 35,557 | 1,645,933 | ||||||
American Airlines Group, Inc. | 32,513 | 1,502,751 | ||||||
Delta Air Lines, Inc. | 29,206 | 1,484,833 | ||||||
United Continental Holdings, Inc.* | 24,112 | 1,454,195 | ||||||
Total Airlines | 6,087,712 | |||||||
Electronics - 4.5% | ||||||||
Allegion plc | 22,601 | 1,472,907 | ||||||
Honeywell International, Inc. | 13,754 | 1,420,513 | ||||||
Tyco International plc | 38,108 | 1,388,656 | ||||||
Total Electronics | 4,282,076 | |||||||
Environmental Control - 4.4% | ||||||||
Republic Services, Inc. — Class A | 33,870 | 1,481,474 | ||||||
Waste Management, Inc. | 27,408 | 1,473,454 | ||||||
Stericycle, Inc.* | 9,787 | 1,187,848 | ||||||
Total Environmental Control | 4,142,776 | |||||||
Hand & Machine Tools - 3.1% | ||||||||
Stanley Black & Decker, Inc. | 13,720 | 1,454,046 | ||||||
Snap-on, Inc. | 8,680 | 1,439,925 | ||||||
Total Hand & Machine Tools | 2,893,971 | |||||||
Electrical Components & Equipment - 3.0% | ||||||||
AMETEK, Inc. | 25,748 | 1,411,505 | ||||||
Emerson Electric Co. | 29,764 | 1,405,754 | ||||||
Total Electrical Components & Equipment | 2,817,259 | |||||||
Engineering & Construction - 3.0% | ||||||||
Fluor Corp. | 30,292 | 1,448,261 | ||||||
Jacobs Engineering Group, Inc.* | 34,095 | 1,368,573 | ||||||
Total Engineering & Construction | 2,816,834 | |||||||
Distribution & Wholesale - 2.9% | ||||||||
Fastenal Co. | 35,438 | 1,387,752 | ||||||
WW Grainger, Inc. | 6,174 | 1,296,540 | ||||||
Total Distribution & Wholesale | 2,684,292 | |||||||
Software - 1.6% | ||||||||
Dun & Bradstreet Corp. | 13,051 | 1,486,118 | ||||||
Healthcare-Products - 1.6% | ||||||||
Danaher Corp. | 15,779 | 1,472,338 | ||||||
Building Materials - 1.6% | ||||||||
Masco Corp. | 50,547 | 1,465,863 | ||||||
Advertising - 1.5% | ||||||||
Nielsen Holdings plc | 29,869 | 1,419,076 | ||||||
Office & Business Equipment - 1.5% | ||||||||
Pitney Bowes, Inc. | 67,076 | 1,385,119 | ||||||
88 | GUGGENHEIM ETFs ANNUAL REPORT | SEE NOTES TO FINANCIAL STATEMENTS. |
SCHEDULE OF INVESTMENTS (concluded) | October 31, 2015 |
GUGGENHEIM S&P 500® EQUAL WEIGHT INDUSTRIALS ETF | |
Shares | Value | |||||||
Machinery-Construction & Mining - 1.5% | ||||||||
Caterpillar, Inc. | 18,867 | $ | 1,377,102 | |||||
Metal Fabricate & Hardware - 1.5% | ||||||||
Precision Castparts Corp. | 5,964 | 1,376,551 | ||||||
Auto Manufacturers - 1.3% | ||||||||
PACCAR, Inc. | 23,845 | 1,255,439 | ||||||
Total Common Stocks | ||||||||
(Cost $97,355,825) | 93,709,037 | |||||||
SHORT TERM INVESTMENTS† - 0.1% | ||||||||
Federated U.S. Treasury Cash Reserve Fund 0.00%1 | 72,879 | 72,879 | ||||||
Total Short Term Investments | ||||||||
(Cost $72,879) | 72,879 | |||||||
Total Investments - 99.9% | ||||||||
(Cost $97,428,704) | $ | 93,781,916 | ||||||
Other Assets & Liabilities, net - 0.1% | 48,618 | |||||||
Total Net Assets - 100.0% | $ | 93,830,534 | ||||||
* | Non-income producing security. |
† | Value determined based on Level 1 inputs — See Note 4. |
1 | Rate indicated is the 7 day yield as of October 31, 2015. |
plc — Public Limited Company | |
See Sector Classification in Other Information section. |
The following table summarizes the inputs used to value the Fund's net assets at October 31, 2015 (See Note 4 in the Notes to Financial Statements):
Investments in Securities | Level 1 | Level 2 | Level 3 | Total | ||||||||||||
Common Stocks | $ | 93,709,037 | $ | — | $ | — | $ | 93,709,037 | ||||||||
Short Term Investments | 72,879 | — | — | 72,879 | ||||||||||||
Total | $ | 93,781,916 | $ | — | $ | — | $ | 93,781,916 | ||||||||
For the year ended October 31, 2015, there were no transfers between levels.
SEE NOTES TO FINANCIAL STATEMENTS. | GUGGENHEIM ETFs ANNUAL REPORT | 89 |
SCHEDULE OF INVESTMENTS | October 31, 2015 |
GUGGENHEIM S&P 500® EQUAL WEIGHT MATERIALS ETF | |
Shares | Value | |||||||
COMMON STOCKS† - 100.0% | ||||||||
Chemicals - 58.0% | ||||||||
EI du Pont de Nemours & Co. | 39,935 | $ | 2,531,879 | |||||
Dow Chemical Co. | 44,187 | 2,283,142 | ||||||
LyondellBasell Industries N.V. — Class A | 23,092 | 2,145,478 | ||||||
Ecolab, Inc. | 17,588 | 2,116,717 | ||||||
International Flavors & Fragrances, Inc. | 18,058 | 2,095,811 | ||||||
PPG Industries, Inc. | 20,002 | 2,085,409 | ||||||
Praxair, Inc. | 18,466 | 2,051,388 | ||||||
Sherwin-Williams Co. | 7,566 | 2,018,836 | ||||||
Eastman Chemical Co. | 27,684 | 1,997,954 | ||||||
Airgas, Inc. | 20,511 | 1,972,338 | ||||||
Air Products & Chemicals, Inc. | 14,180 | 1,970,736 | ||||||
Monsanto Co. | 20,916 | 1,949,789 | ||||||
Sigma-Aldrich Corp. | 13,849 | 1,934,982 | ||||||
FMC Corp. | 46,502 | 1,893,096 | ||||||
CF Industries Holdings, Inc. | 34,619 | 1,757,607 | ||||||
Mosaic Co. | 49,425 | 1,670,071 | ||||||
Total Chemicals | 32,475,233 | |||||||
Packaging & Containers - 13.8% | ||||||||
Owens-Illinois, Inc.* | 96,582 | 2,081,342 | ||||||
Ball Corp. | 29,043 | 1,989,446 | ||||||
Sealed Air Corp. | 37,828 | 1,858,111 | ||||||
WestRock Co. | 32,929 | 1,770,263 | ||||||
Total Packaging & Containers | 7,699,162 | |||||||
Mining - 10.9% | ||||||||
Newmont Mining Corp. | 119,120 | 2,318,075 | ||||||
Freeport-McMoRan, Inc. | 169,691 | 1,997,263 | ||||||
Alcoa, Inc. | 200,471 | 1,790,206 | ||||||
Total Mining | 6,105,544 | |||||||
Building Materials - 6.5% | ||||||||
Vulcan Materials Co. | 19,516 | 1,884,855 | ||||||
Martin Marietta Materials, Inc. | 11,281 | 1,750,247 | ||||||
Total Building Materials | 3,635,102 | |||||||
Household Products & Housewares - 3.8% | ||||||||
Avery Dennison Corp. | 32,950 | 2,140,762 | ||||||
Forest Products & Paper - 3.5% | ||||||||
International Paper Co. | 46,457 | 1,983,249 | ||||||
Iron & Steel - 3.5% | ||||||||
Nucor Corp. | 45,929 | 1,942,797 | ||||||
Total Common Stocks | ||||||||
(Cost $64,865,869) | 55,981,849 | |||||||
Total Investments - 100.0% | ||||||||
(Cost $64,865,869) | $ | 55,981,849 | ||||||
Other Assets & Liabilities, net - 0.0% | 274 | |||||||
Total Net Assets - 100.0% | $ | 55,982,123 | ||||||
* | Non-income producing security. |
† | Value determined based on Level 1 inputs — See Note 4. |
See Sector Classification in Other Information section. |
The following table summarizes the inputs used to value the Fund's net assets at October 31, 2015 (See Note 4 in the Notes to Financial Statements):
Investments in Securities | Level 1 | Level 2 | Level 3 | Total | ||||||||||||
Common Stocks | $ | 55,981,849 | $ | — | $ | — | $ | 55,981,849 | ||||||||
Total | $ | 55,981,849 | $ | — | $ | — | $ | 55,981,849 | ||||||||
For the year ended October 31, 2015, there were no transfers between levels.
90 | GUGGENHEIM ETFs ANNUAL REPORT | SEE NOTES TO FINANCIAL STATEMENTS. |
SCHEDULE OF INVESTMENTS | October 31, 2015 |
GUGGENHEIM S&P 500® EQUAL WEIGHT REAL ESTATE ETF | |
Shares | Value | |||||||
COMMON STOCKS† - 99.2% | ||||||||
REITs - 95.0% | ||||||||
Kimco Realty Corp. | 4,151 | $ | 111,122 | |||||
General Growth Properties, Inc. | 3,827 | 110,792 | ||||||
Prologis, Inc. | 2,565 | 109,602 | ||||||
American Tower Corp. — Class A | 1,070 | 109,386 | ||||||
Macerich Co. | 1,287 | 109,060 | ||||||
Public Storage | 472 | 108,305 | ||||||
Vornado Realty Trust | 1,075 | 108,091 | ||||||
SL Green Realty Corp. | 909 | 107,826 | ||||||
Simon Property Group, Inc. | 533 | 107,378 | ||||||
Boston Properties, Inc. | 839 | 105,588 | ||||||
Realty Income Corp. | 2,119 | 104,806 | ||||||
Equity Residential | 1,348 | 104,227 | ||||||
Crown Castle International Corp. | 1,215 | 103,834 | ||||||
Iron Mountain, Inc. | 3,367 | 103,165 | ||||||
Plum Creek Timber Company, Inc. | 2,523 | 102,787 | ||||||
Apartment Investment & Management Co. — Class A | 2,617 | 102,560 | ||||||
AvalonBay Communities, Inc. | 571 | 99,828 | ||||||
Equinix, Inc. | 330 | 97,904 | ||||||
Weyerhaeuser Co. | 3,120 | 91,510 | ||||||
Essex Property Trust, Inc. | 406 | 89,499 | ||||||
Welltower, Inc. | 1,357 | 88,029 | ||||||
HCP, Inc. | 2,360 | 87,792 | ||||||
Ventas, Inc. | 1,617 | 86,865 | ||||||
Host Hotels & Resorts, Inc. | 4,802 | 83,219 | ||||||
Total REITs | 2,433,175 | |||||||
Real Estate - 4.2% | ||||||||
CBRE Group, Inc. — Class A* | 2,913 | 108,597 | ||||||
Total Common Stocks | ||||||||
(Cost $2,516,059) | 2,541,772 | |||||||
SHORT TERM INVESTMENTS† - 0.2% | ||||||||
Federated U.S. Treasury Cash Reserve Fund 0.00%1 | 6,235 | 6,235 | ||||||
Total Short Term Investments | ||||||||
(Cost $6,235) | 6,235 | |||||||
Total Investments - 99.4% | ||||||||
(Cost $2,522,294) | $ | 2,548,007 | ||||||
Other Assets & Liabilities, net - 0.6% | 14,624 | |||||||
Total Net Assets - 100.0% | $ | 2,562,631 | ||||||
* | Non-income producing security. |
† | Value determined based on Level 1 inputs — See Note 4. |
1 | Rate indicated is the 7 day yield as of October 31, 2015. |
REIT — Real Estate Investment Trust | |
See Sector Classification in Other Information section. |
The following table summarizes the inputs used to value the Fund's net assets at October 31, 2015 (See Note 4 in the Notes to Financial Statements):
Investments in Securities | Level 1 | Level 2 | Level 3 | Total | ||||||||||||
Common Stocks | $ | 2,541,772 | $ | — | $ | — | $ | 2,541,772 | ||||||||
Short Term Investments | 6,235 | — | — | 6,235 | ||||||||||||
Total | $ | 2,548,007 | $ | — | $ | — | $ | 2,548,007 | ||||||||
For the year ended October 31, 2015, there were no transfers between levels.
SEE NOTES TO FINANCIAL STATEMENTS. | GUGGENHEIM ETFs ANNUAL REPORT | 91 |
SCHEDULE OF INVESTMENTS | October 31, 2015 |
GUGGENHEIM S&P 500® EQUAL WEIGHT TECHNOLOGY ETF |
Shares | Value | |||||||
COMMON STOCKS† - 99.9% | ||||||||
Semiconductors - 24.9% | ||||||||
KLA-Tencor Corp. | 198,385 | $ | 13,315,601 | |||||
NVIDIA Corp. | 448,067 | 12,711,662 | ||||||
Texas Instruments, Inc. | 213,598 | 12,115,279 | ||||||
Intel Corp. | 344,683 | 11,670,966 | ||||||
Xilinx, Inc. | 242,326 | 11,539,564 | ||||||
Microchip Technology, Inc. | 231,457 | 11,177,059 | ||||||
Linear Technology Corp. | 250,470 | 11,125,877 | ||||||
QUALCOMM, Inc. | 185,990 | 11,051,526 | ||||||
Applied Materials, Inc. | 656,014 | 11,001,355 | ||||||
Analog Devices, Inc. | 180,371 | 10,843,905 | ||||||
Lam Research Corp. | 141,466 | 10,834,881 | ||||||
Altera Corp. | 200,882 | 10,556,349 | ||||||
Micron Technology, Inc.* | 605,749 | 10,031,203 | ||||||
Broadcom Corp. — Class A | 191,309 | 9,833,283 | ||||||
Avago Technologies Ltd. | 77,494 | 9,541,836 | ||||||
Skyworks Solutions, Inc. | 115,302 | 8,905,926 | ||||||
Qorvo, Inc.* | 190,180 | 8,354,607 | ||||||
Total Semiconductors | 184,610,879 | |||||||
Software - 22.5% | ||||||||
Microsoft Corp. | 233,612 | 12,297,337 | ||||||
Autodesk, Inc.* | 219,517 | 12,115,143 | ||||||
Activision Blizzard, Inc. | 348,282 | 12,106,283 | ||||||
Citrix Systems, Inc.* | 144,123 | 11,832,498 | ||||||
Paychex, Inc. | 222,204 | 11,461,282 | ||||||
Red Hat, Inc.* | 144,056 | 11,396,270 | ||||||
Fiserv, Inc.* | 117,909 | 11,379,398 | ||||||
Adobe Systems, Inc.* | 128,226 | 11,368,517 | ||||||
salesforce.com, Inc.* | 144,974 | 11,265,930 | ||||||
Intuit, Inc. | 113,800 | 11,087,534 | ||||||
Fidelity National Information Services, Inc. | 145,746 | 10,627,798 | ||||||
Electronic Arts, Inc.* | 147,248 | 10,612,163 | ||||||
Oracle Corp. | 268,029 | 10,410,247 | ||||||
CA, Inc. | 366,499 | 10,155,687 | ||||||
Akamai Technologies, Inc.* | 135,965 | 8,269,391 | ||||||
Total Software | 166,385,478 | |||||||
Computers - 16.9% | ||||||||
SanDisk Corp. | 184,960 | 14,241,920 | ||||||
Accenture plc — Class A | 104,291 | 11,179,995 | ||||||
Cognizant Technology Solutions Corp. — Class A* | 161,725 | 11,015,090 | ||||||
NetApp, Inc. | 321,650 | 10,936,100 | ||||||
Computer Sciences Corp. | 163,361 | 10,878,209 | ||||||
EMC Corp. | 413,002 | 10,828,912 | ||||||
Apple, Inc. | 88,963 | 10,631,079 | ||||||
HP, Inc. | 374,395 | 10,093,689 | ||||||
Teradata Corp.* | 343,690 | 9,661,126 | ||||||
International Business Machines Corp. | 68,953 | 9,658,936 | ||||||
Western Digital Corp. | 126,198 | 8,432,550 | ||||||
Seagate Technology plc | 207,593 | 7,900,990 | ||||||
Total Computers | 125,458,596 | |||||||
Internet - 10.4% | ||||||||
VeriSign, Inc.* | 146,716 | 11,825,309 | ||||||
Yahoo!, Inc.* | 323,549 | 11,524,815 | ||||||
Facebook, Inc. — Class A* | 110,209 | 11,238,012 | ||||||
eBay, Inc.* | 385,663 | 10,759,998 | ||||||
Symantec Corp. | 508,489 | 10,474,873 | ||||||
F5 Networks, Inc.* | 85,953 | 9,472,021 | ||||||
Alphabet, Inc. — Class A* | 7,905 | 5,829,068 | ||||||
Alphabet, Inc. — Class C* | 7,925 | 5,633,169 | ||||||
Total Internet | 76,757,265 | |||||||
Commercial Services - 7.5% | ||||||||
Total System Services, Inc. | 217,432 | 11,404,309 | ||||||
Automatic Data Processing, Inc. | 129,718 | 11,284,169 | ||||||
MasterCard, Inc. — Class A | 113,267 | 11,212,300 | ||||||
PayPal Holdings, Inc.* | 303,237 | 10,919,564 | ||||||
Western Union Co. | 555,100 | 10,685,675 | ||||||
Total Commercial Services | 55,506,017 | |||||||
Electronics - 5.6% | ||||||||
TE Connectivity Ltd. | 167,244 | 10,777,204 | ||||||
Corning, Inc. | 575,212 | 10,698,943 | ||||||
Amphenol Corp. — Class A | 197,111 | 10,687,358 | ||||||
FLIR Systems, Inc. | 357,614 | 9,537,565 | ||||||
Total Electronics | 41,701,070 | |||||||
Telecommunications - 4.7% | ||||||||
Juniper Networks, Inc. | 402,175 | 12,624,273 | ||||||
Cisco Systems, Inc. | 390,456 | 11,264,656 | ||||||
Motorola Solutions, Inc. | 151,202 | 10,579,604 | ||||||
Total Telecommunications | 34,468,533 | |||||||
Diversified Financial Services - 3.1% | ||||||||
Alliance Data Systems Corp.* | 40,074 | 11,914,401 | ||||||
Visa, Inc. — Class A | 143,473 | 11,130,635 | ||||||
Total Diversified Financial Services | 23,045,036 | |||||||
Energy-Alternate Sources - 1.6% | ||||||||
First Solar, Inc.* | 208,159 | 11,879,634 | ||||||
Aerospace & Defense - 1.5% | ||||||||
Harris Corp. | 137,093 | 10,848,169 | ||||||
Office & Business Equipment - 1.2% | ||||||||
Xerox Corp. | 973,955 | 9,145,437 | ||||||
Total Common Stocks | ||||||||
(Cost $709,404,169) | 739,806,114 | |||||||
92 | GUGGENHEIM ETFs ANNUAL REPORT | SEE NOTES TO FINANCIAL STATEMENTS. |
SCHEDULE OF INVESTMENTS (concluded) | October 31, 2015 |
GUGGENHEIM S&P 500® EQUAL WEIGHT TECHNOLOGY ETF |
Shares | Value | |||||||
SHORT TERM INVESTMENTS† - 0.1% | ||||||||
Federated U.S. Treasury Cash Reserve Fund 0.00%1 | 758,209 | $ | 758,209 | |||||
Total Short Term Investments | ||||||||
(Cost $758,209) | 758,209 | |||||||
Total Investments - 100.0% | ||||||||
(Cost $710,162.378) | $ | 740,564,323 | ||||||
Other Assets & Liabilities, net - 0.0% | 64,346 | |||||||
Total Net Assets - 100.0% | $ | 740,628,669 | ||||||
* | Non-income producing security. |
† | Value determined based on Level 1 inputs — See Note 4. |
1 | Rate indicated is the 7 day yield as of October 31, 2015. |
plc — Public Limited Company | |
See Sector Classification in Other Information section. |
The following table summarizes the inputs used to value the Fund's net assets at October 31, 2015 (See Note 4 in the Notes to Financial Statements):
Investments in Securities | Level 1 | Level 2 | Level 3 | Total | ||||||||||||
Common Stocks | $ | 739,806,114 | $ | — | $ | — | $ | 739,806,114 | ||||||||
Short Term Investments | 758,209 | — | — | 758,209 | ||||||||||||
Total | $ | 740,564,323 | $ | — | $ | — | $ | 740,564,323 | ||||||||
For the year ended October 31, 2015, there were no transfers between levels.
SEE NOTES TO FINANCIAL STATEMENTS. | GUGGENHEIM ETFs ANNUAL REPORT | 93 |
SCHEDULE OF INVESTMENTS | October 31, 2015 |
GUGGENHEIM S&P 500® EQUAL WEIGHT UTILITIES ETF |
Shares | Value | |||||||
COMMON STOCKS† - 99.9% | ||||||||
Electric - 73.3% | ||||||||
PPL Corp. | 120,119 | $ | 4,132,094 | |||||
Pepco Holdings, Inc. | 154,614 | 4,117,370 | ||||||
SCANA Corp. | 69,135 | 4,094,174 | ||||||
Ameren Corp. | 91,805 | 4,010,042 | ||||||
Eversource Energy | 77,325 | 3,938,936 | ||||||
CMS Energy Corp. | 109,088 | 3,934,804 | ||||||
PG&E Corp. | 73,572 | 3,928,745 | ||||||
Entergy Corp. | 56,859 | 3,875,509 | ||||||
WEC Energy Group, Inc. | 74,435 | 3,837,869 | ||||||
Xcel Energy, Inc. | 107,476 | 3,829,370 | ||||||
DTE Energy Co. | 46,930 | 3,829,019 | ||||||
NextEra Energy, Inc. | 37,180 | 3,816,899 | ||||||
Pinnacle West Capital Corp. | 59,607 | 3,785,641 | ||||||
Southern Co. | 83,441 | 3,763,189 | ||||||
Dominion Resources, Inc. | 52,595 | 3,756,861 | ||||||
Consolidated Edison, Inc. | 57,123 | 3,755,837 | ||||||
American Electric Power Company, Inc. | 66,268 | 3,754,082 | ||||||
Public Service Enterprise Group, Inc. | 90,639 | 3,742,484 | ||||||
Duke Energy Corp. | 52,150 | 3,727,161 | ||||||
Edison International | 61,531 | 3,723,856 | ||||||
FirstEnergy Corp. | 116,505 | 3,634,956 | ||||||
TECO Energy, Inc. | 133,481 | 3,603,987 | ||||||
AES Corp. | 320,208 | 3,506,278 | ||||||
Exelon Corp. | 119,998 | 3,350,344 | ||||||
NRG Energy, Inc. | 193,163 | 2,489,871 | ||||||
Total Electric | 93,939,378 | |||||||
Telecommunications - 14.5% | ||||||||
Level 3 Communications, Inc.* | 78,900 | 4,019,955 | ||||||
CenturyLink, Inc. | 135,613 | 3,825,643 | ||||||
Verizon Communications, Inc. | 77,933 | 3,653,499 | ||||||
AT&T, Inc. | 108,921 | 3,649,943 | ||||||
Frontier Communications Corp. | 669,910 | 3,443,337 | ||||||
Total Telecommunications | 18,592,377 | |||||||
Gas - 12.1% | ||||||||
NiSource, Inc. | 214,565 | 4,111,065 | ||||||
Sempra Energy | 39,458 | 4,040,894 | ||||||
CenterPoint Energy, Inc. | 201,465 | 3,737,176 | ||||||
AGL Resources, Inc. | 58,424 | 3,651,500 | ||||||
Total Gas | 15,540,635 | |||||||
Total Common Stocks | ||||||||
(Cost $139,574,211) | 128,072,390 | |||||||
Total Investments - 99.9% | ||||||||
(Cost $139,574,211) | $ | 128,072,390 | ||||||
Other Assets & Liabilities, net - 0.1% | 185,929 | |||||||
Total Net Assets - 100.0% | $ | 128,258,319 | ||||||
* | Non-income producing security. |
† | Value determined based on Level 1 inputs — See Note 4. |
See Sector Classification in Other Information section. |
The following table summarizes the inputs used to value the Fund's net assets at October 31, 2015 (See Note 4 in the Notes to Financial Statements):
Investments in Securities | Level 1 | Level 2 | Level 3 | Total | ||||||||||||
Common Stocks | $ | 128,072,390 | $ | — | $ | — | $ | 128,072,390 | ||||||||
Total | $ | 128,072,390 | $ | — | $ | — | $ | 128,072,390 | ||||||||
For the year ended October 31, 2015, there were no transfers between levels.
94 | GUGGENHEIM ETFs ANNUAL REPORT | SEE NOTES TO FINANCIAL STATEMENTS. |
STATEMENTS OF ASSETS AND LIABILITIES | October 31, 2015 |
Guggenheim | Guggenheim | Guggenheim | Guggenheim MSCI Emerging Markets Equal Country | |||||||||||||
Assets: | ||||||||||||||||
Investments, at value* | $ | 132,499,179 | $ | 71,769,826 | $ | 43,889,500 | $ | 11,228,715 | ||||||||
Cash | — | — | 21,321 | — | ||||||||||||
Foreign currency, at value (cost $-, $-, $-, $591) | — | — | — | 589 | ||||||||||||
Receivables: | ||||||||||||||||
Investments sold | 512 | 250 | 19,563 | — | ||||||||||||
Dividends and interest | 77,157 | 54,213 | 18,687 | 5,451 | ||||||||||||
Tax reclaims | — | — | — | 7,507 | ||||||||||||
Total assets | 132,576,848 | 71,824,289 | 43,949,071 | 11,242,262 | ||||||||||||
Liabilities: | ||||||||||||||||
Payable for: | ||||||||||||||||
Investments purchased | — | — | 4,176 | — | ||||||||||||
Due to custodian | — | — | — | 163,895 | ||||||||||||
Fund shares redeemed | — | 1,226 | — | — | ||||||||||||
Management fees | 45,259 | 25,272 | 14,817 | 6,225 | ||||||||||||
Total liabilities | 45,259 | 26,498 | 18,993 | 170,120 | ||||||||||||
Commitments and contingent liabilities (Note 8) | — | — | — | — | ||||||||||||
Net assets | $ | 132,531,589 | $ | 71,797,791 | $ | 43,930,078 | $ | 11,072,142 | ||||||||
Net assets consist of: | ||||||||||||||||
Paid-in capital | $ | 129,259,021 | $ | 73,950,237 | $ | 49,932,802 | $ | 16,639,313 | ||||||||
Undistributed (distributions in excess of) net investment income | (856 | ) | — | (4,867 | ) | 42,626 | ||||||||||
Accumulated net realized loss on investments and foreign currency | (2,254,899 | ) | (1,341,440 | ) | (5,247,899 | ) | (3,737,130 | ) | ||||||||
Net unrealized appreciation (depreciation) on investments and foreign currency | 5,528,323 | (811,006 | ) | (749,958 | ) | (1,872,667 | ) | |||||||||
Net assets | $ | 132,531,589 | $ | 71,797,791 | $ | 43,930,078 | $ | 11,072,142 | ||||||||
Shares outstanding (unlimited shares authorized), no par value | 2,700,000 | 1,450,000 | 1,050,000 | 400,000 | ||||||||||||
Net asset value, offering price and repurchase price per share | $ | 49.09 | $ | 49.52 | $ | 41.84 | $ | 27.68 | ||||||||
*Total cost of investments | $ | 126,970,856 | $ | 72,580,832 | $ | 44,639,458 | $ | 13,101,345 | ||||||||
SEE NOTES TO FINANCIAL STATEMENTS. | GUGGENHEIM ETFs ANNUAL REPORT | 95 |
STATEMENTS OF ASSETS AND LIABILITIES (continued) | October 31, 2015 |
Guggenheim | Guggenheim | Guggenheim S&P | ||||||||||
Assets: | ||||||||||||
Investments, at value* | $ | 175,980,551 | $ | 530,480,592 | $ | 176,518,591 | ||||||
Receivables: | ||||||||||||
Fund shares sold | 9,732 | — | — | |||||||||
Dividends and interest | 77,387 | 527,253 | 314,806 | |||||||||
Total assets | 176,067,670 | 531,007,845 | 176,833,397 | |||||||||
Liabilities: | ||||||||||||
Payable for: | ||||||||||||
Fund shares redeemed | 9,677 | — | — | |||||||||
Management fees | 56,946 | 135,449 | 60,749 | |||||||||
Total liabilities | 66,623 | 135,449 | 60,749 | |||||||||
Commitments and contingent liabilities (Note 8) | — | — | — | |||||||||
Net assets | $ | 176,001,047 | $ | 530,872,396 | $ | 176,772,648 | ||||||
Net assets consist of: | ||||||||||||
Paid-in capital | $ | 184,327,348 | $ | 511,312,680 | $ | 251,855,526 | ||||||
Undistributed net investment income | 167,253 | 703,192 | 170,896 | |||||||||
Accumulated net realized loss on investments | (3,539,150 | ) | (2,901,233 | ) | (24,913,860 | ) | ||||||
Net unrealized appreciation (depreciation) on investments | (4,954,404 | ) | 21,757,757 | (50,339,914 | ) | |||||||
Net assets | $ | 176,001,047 | $ | 530,872,396 | $ | 176,772,648 | ||||||
Shares outstanding (unlimited shares authorized), no par value | 1,950,000 | 4,750,000 | 3,250,005 | |||||||||
Net asset value, offering price and repurchase price per share | $ | 90.26 | $ | 111.76 | $ | 54.39 | ||||||
*Total cost of investments | $ | 180,934,955 | $ | 508,722,835 | $ | 226,858,505 | ||||||
96 | GUGGENHEIM ETFs ANNUAL REPORT | SEE NOTES TO FINANCIAL STATEMENTS. |
STATEMENTS OF ASSETS AND LIABILITIES (continued) | October 31, 2015 |
Guggenheim S&P | Guggenheim S&P | Guggenheim S&P | Guggenheim S&P | |||||||||||||
Assets: | ||||||||||||||||
Investments, at value* | $ | 183,399,957 | $ | 569,840,864 | $ | 93,781,916 | $ | 55,981,849 | ||||||||
Receivables: | ||||||||||||||||
Fund shares sold | 50,162 | 5,583 | — | — | ||||||||||||
Dividends and interest | 226,580 | 247,729 | 85,350 | 43,806 | ||||||||||||
Total assets | 183,676,699 | 570,094,176 | 93,867,266 | 56,025,655 | ||||||||||||
Liabilities: | ||||||||||||||||
Payable for: | ||||||||||||||||
Due to custodian | — | 13,820 | — | 18,554 | ||||||||||||
Fund shares redeemed | — | — | 3,276 | 4,783 | ||||||||||||
Management fees | 56,349 | 187,248 | 33,456 | 20,195 | ||||||||||||
Total liabilities | 56,349 | 201,068 | 36,732 | 43,532 | ||||||||||||
Commitments and contingent liabilities (Note 8) | — | — | — | — | ||||||||||||
Net assets | $ | 183,620,350 | $ | 569,893,108 | $ | 93,830,534 | $ | 55,982,123 | ||||||||
Net assets consist of: | ||||||||||||||||
Paid-in capital | $ | 194,419,508 | $ | 587,837,490 | $ | 100,547,692 | $ | 68,451,320 | ||||||||
Undistributed net investment income | — | — | — | 70,106 | ||||||||||||
Accumulated net realized loss on investments | (6,088,845 | ) | (535,148 | ) | (3,070,370 | ) | (3,655,283 | ) | ||||||||
Net unrealized depreciation on investments | (4,710,313 | ) | (17,409,234 | ) | (3,646,788 | ) | (8,884,020 | ) | ||||||||
Net assets | $ | 183,620,350 | $ | 569,893,108 | $ | 93,830,534 | $ | 55,982,123 | ||||||||
Shares outstanding (unlimited shares authorized), no par value | 4,200,000 | 3,800,000 | 1,100,000 | 700,000 | ||||||||||||
Net asset value, offering price and repurchase price per share | $ | 43.72 | $ | 149.97 | $ | 85.30 | $ | 79.97 | ||||||||
*Total cost of investments | $ | 188,110,270 | $ | 587,250,098 | $ | 97,428,704 | $ | 64,865,869 | ||||||||
SEE NOTES TO FINANCIAL STATEMENTS. | GUGGENHEIM ETFs ANNUAL REPORT | 97 |
STATEMENTS OF ASSETS AND LIABILITIES (concluded) | October 31, 2015 |
Guggenheim S&P | Guggenheim S&P | Guggenheim S&P | ||||||||||
Assets: | ||||||||||||
Investments, at value* | $ | 2,548,007 | $ | 740,564,323 | $ | 128,072,390 | ||||||
Receivables: | ||||||||||||
Fund shares sold | — | 357 | — | |||||||||
Investments sold | 50,015 | — | — | |||||||||
Dividends and interest | 5,195 | 296,997 | 251,456 | |||||||||
Total assets | 2,603,217 | 740,861,677 | 128,323,846 | |||||||||
Liabilities: | ||||||||||||
Payable for: | ||||||||||||
Investments purchased | 39,729 | — | — | |||||||||
Due to custodian | — | — | 13,509 | |||||||||
Fund shares redeemed | — | — | 7,533 | |||||||||
Management fees | 857 | 233,008 | 44,485 | |||||||||
Total liabilities | 40,586 | 233,008 | 65,527 | |||||||||
Commitments and contingent liabilities (Note 8) | — | — | — | |||||||||
Net assets | $ | 2,562,631 | $ | 740,628,669 | $ | 128,258,319 | ||||||
Net assets consist of: | ||||||||||||
Paid-in capital | $ | 2,531,139 | $ | 722,037,775 | $ | 141,863,429 | ||||||
Undistributed net investment income | 5,779 | — | 20,079 | |||||||||
Accumulated net realized gain (loss) on investments | — | (11,811,051 | ) | (2,123,368 | ) | |||||||
Net unrealized appreciation (depreciation) on investments | 25,713 | 30,401,945 | (11,501,821 | ) | ||||||||
Net assets | $ | 2,562,631 | $ | 740,628,669 | $ | 128,258,319 | ||||||
Shares outstanding (unlimited shares authorized), no par value | 100,000 | 7,950,000 | 1,750,000 | |||||||||
Net asset value, offering price and repurchase price per share | $ | 25.63 | $ | 93.16 | $ | 73.29 | ||||||
*Total cost of investments | $ | 2,522,294 | $ | 710,162,378 | $ | 139,574,211 | ||||||
98 | GUGGENHEIM ETFs ANNUAL REPORT | SEE NOTES TO FINANCIAL STATEMENTS. |
STATEMENTS OF OPERATIONS |
For the Year Ended October 31, 2015
Guggenheim | Guggenheim | Guggenheim | Guggenheim MSCI | |||||||||||||
Investment Income: | ||||||||||||||||
Dividends, net of foreign taxes withheld* | $ | 2,300,695 | $ | 1,544,828 | $ | 547,780 | $ | 360,618 | ||||||||
Income from securities lending | 164,140 | 74,682 | 172,967 | 4,096 | ||||||||||||
Interest | 9 | 4 | 7 | 1 | ||||||||||||
Total investment income | 2,464,844 | 1,619,514 | 720,754 | 364,715 | ||||||||||||
Expenses: | ||||||||||||||||
Management fees | 605,105 | 374,837 | 190,296 | 88,245 | ||||||||||||
Trustee fees | 8,422 | 5,672 | 2,538 | — | ||||||||||||
Total expenses | 613,527 | 380,509 | 192,834 | 88,245 | ||||||||||||
Less: | ||||||||||||||||
Expenses waived by Adviser | — | — | — | (7,924 | ) | |||||||||||
Net investment income | 1,851,317 | 1,239,005 | 527,920 | 284,394 | ||||||||||||
Net Realized and Unrealized Gain (Loss): | ||||||||||||||||
Net realized gain (loss) on: | ||||||||||||||||
Investments | (1,343,349 | ) | (612,606 | ) | (3,827,031 | ) | (698,892 | ) | ||||||||
In-kind redemptions | 14,586,464 | 10,286,886 | 4,587,692 | — | ||||||||||||
Foreign currency transactions | — | — | — | (23,929 | ) | |||||||||||
Net realized gain (loss) | 13,243,115 | 9,674,280 | 760,661 | (722,821 | ) | |||||||||||
Net change in unrealized appreciation (depreciation) on: | ||||||||||||||||
Investments | (16,701,610 | ) | (10,917,352 | ) | (4,796,328 | ) | (1,886,931 | ) | ||||||||
Foreign currency transactions | — | — | — | 106 | ||||||||||||
Net change in unrealized appreciation (depreciation) | (16,701,610 | ) | (10,917,352 | ) | (4,796,328 | ) | (1,886,825 | ) | ||||||||
Net realized and unrealized loss | (3,458,495 | ) | (1,243,072 | ) | (4,035,667 | ) | (2,609,646 | ) | ||||||||
Net decrease in net assets resulting from operations | $ | (1,607,178 | ) | $ | (4,067 | ) | $ | (3,507,747 | ) | $ | (2,325,252 | ) | ||||
* Foreign taxes withheld | $ | 3,344 | $ | 1,587 | $ | 1,048 | $ | 45,686 | ||||||||
SEE NOTES TO FINANCIAL STATEMENTS. | GUGGENHEIM ETFs ANNUAL REPORT | 99 |
STATEMENTS OF OPERATIONS (continued) |
For the Year Ended October 31, 2015
Guggenheim | Guggenheim | Guggenheim S&P | ||||||||||
Investment Income: | ||||||||||||
Dividends | $ | 2,785,346 | $ | 6,427,510 | $ | 3,325,482 | ||||||
Income from securities lending | 79,449 | — | 395,821 | |||||||||
Interest | 3 | 9 | 2 | |||||||||
Total investment income | 2,864,798 | 6,427,519 | 3,721,305 | |||||||||
Expenses: | ||||||||||||
Management fees | 676,135 | 1,099,756 | 582,172 | |||||||||
Total expenses | 676,135 | 1,099,756 | 582,172 | |||||||||
Net investment income | 2,188,663 | 5,327,763 | 3,139,133 | |||||||||
Net Realized and Unrealized Gain (Loss): | ||||||||||||
Net realized gain (loss) on: | ||||||||||||
Investments | (152,843 | ) | (780,490 | ) | (17,284,000 | ) | ||||||
In-kind redemptions | 18,484,024 | 15,211,748 | 395,015 | |||||||||
Net realized gain (loss) | 18,331,181 | 14,431,258 | (16,888,985 | ) | ||||||||
Net change in unrealized appreciation (depreciation) on: | ||||||||||||
Investments | (9,745,175 | ) | 9,398,344 | (30,348,311 | ) | |||||||
Net realized and unrealized gain (loss) | 8,586,006 | 23,829,602 | (47,237,296 | ) | ||||||||
Net increase (decrease) in net assets resulting from operations | $ | 10,774,669 | $ | 29,157,365 | $ | (44,098,163 | ) | |||||
100 | GUGGENHEIM ETFs ANNUAL REPORT | SEE NOTES TO FINANCIAL STATEMENTS. |
STATEMENTS OF OPERATIONS (continued) |
For the Year Ended October 31, 2015
Guggenheim S&P | Guggenheim S&P | Guggenheim S&P | Guggenheim S&P | |||||||||||||
Investment Income: | ||||||||||||||||
Dividends, net of foreign taxes withheld* | $ | 3,552,567 | $ | 5,648,309 | $ | 2,080,080 | $ | 1,399,016 | ||||||||
Income from securities lending | — | — | 2,230 | — | ||||||||||||
Interest | 5 | 19 | 2 | 1 | ||||||||||||
Total investment income | 3,552,572 | 5,648,328 | 2,082,312 | 1,399,017 | ||||||||||||
Expenses: | ||||||||||||||||
Management fees | 695,811 | 2,543,781 | 493,290 | 301,355 | ||||||||||||
Total expenses | 695,811 | 2,543,781 | 493,290 | 301,355 | ||||||||||||
Net investment income | 2,856,761 | 3,104,547 | 1,589,022 | 1,097,662 | ||||||||||||
Net Realized and Unrealized Gain (Loss): | ||||||||||||||||
Net realized gain (loss) on: | ||||||||||||||||
Investments | 125,977 | 5,299,060 | (1,566,981 | ) | (1,331,366 | ) | ||||||||||
In-kind redemptions | 9,033,009 | 86,967,649 | 9,464,488 | 3,379,910 | ||||||||||||
Net realized gain | 9,158,986 | 92,266,709 | 7,897,507 | 2,048,544 | ||||||||||||
Net change in unrealized appreciation (depreciation) on: | ||||||||||||||||
Investments | (13,121,264 | ) | (71,010,844 | ) | (12,554,131 | ) | (8,146,411 | ) | ||||||||
Net realized and unrealized gain (loss) | (3,962,278 | ) | 21,255,865 | (4,656,624 | ) | (6,097,867 | ) | |||||||||
Net increase (decrease) in net assets resulting from operations | $ | (1,105,517 | ) | $ | 24,360,412 | $ | (3,067,602 | ) | $ | (5,000,205 | ) | |||||
* Foreign taxes withheld | $ | — | $ | — | $ | 5,154 | $ | — | ||||||||
SEE NOTES TO FINANCIAL STATEMENTS. | GUGGENHEIM ETFs ANNUAL REPORT | 101 |
STATEMENTS OF OPERATIONS (concluded) |
For the Year Ended October 31, 2015
Guggenheim S&P | Guggenheim S&P | Guggenheim S&P | ||||||||||
Investment Income: | ||||||||||||
Dividends | $ | 15,520 | $ | 13,198,556 | $ | 6,066,691 | ||||||
Income from securities lending | — | 13,525 | 17,130 | |||||||||
Interest | — | 19 | 6 | |||||||||
Total investment income | 15,520 | 13,212,100 | 6,083,827 | |||||||||
Expenses: | ||||||||||||
Management fees | 2,149 | 3,299,875 | 659,632 | |||||||||
Total expenses | 2,149 | 3,299,875 | 659,632 | |||||||||
Net investment income | 13,371 | 9,912,225 | 5,424,195 | |||||||||
Net Realized and Unrealized Gain (Loss): | ||||||||||||
Net realized gain (loss) on: | ||||||||||||
Investments | 722 | (6,557,181 | ) | (1,534,674 | ) | |||||||
In-kind redemptions | — | 86,482,602 | 4,227,681 | |||||||||
Net realized gain (loss) | 722 | 79,925,421 | 2,693,007 | |||||||||
Net change in unrealized appreciation (depreciation) on: | ||||||||||||
Investments | 25,713 | (42,809,730 | ) | (18,243,029 | ) | |||||||
Net realized and unrealized gain (loss) | 26,435 | 37,115,691 | (15,550,022 | ) | ||||||||
Net increase (decrease) in net assets resulting from operations | $ | 39,806 | $ | 47,027,916 | $ | (10,125,827 | ) | |||||
a | Since commencement of operations: August 12, 2015. |
102 | GUGGENHEIM ETFs ANNUAL REPORT | SEE NOTES TO FINANCIAL STATEMENTS. |
STATEMENTS OF CHANGES IN NET ASSETS |
Guggenheim Russell MidCap® | Guggenheim Russell 1000® Equal Weight ETF | |||||||||||||||
Year Ended | Year Ended | Year Ended | Year Ended | |||||||||||||
Increase (Decrease) in Net Assets from Operations: | ||||||||||||||||
Net investment income | $ | 1,851,317 | $ | 1,471,185 | $ | 1,239,005 | $ | 1,255,253 | ||||||||
Net realized gain on investments | 13,243,115 | 7,898,418 | 9,674,280 | 10,283,263 | ||||||||||||
Net change in unrealized appreciation (depreciation) on investments | (16,701,610 | ) | 4,759,529 | (10,917,352 | ) | (2,477,145 | ) | |||||||||
Net increase (decrease) in net assets resulting from operations | (1,607,178 | ) | 14,129,132 | (4,067 | ) | 9,061,371 | ||||||||||
Distributions to shareholders from: | ||||||||||||||||
Net investment income | (1,988,010 | ) | (1,462,291 | ) | (1,324,343 | ) | (1,246,900 | ) | ||||||||
Capital gains | — | (692,837 | ) | — | — | |||||||||||
Return of capital | (121,017 | ) | — | (104,474 | ) | — | ||||||||||
Total distributions to shareholders | (2,109,027 | ) | (2,155,128 | ) | (1,428,817 | ) | (1,246,900 | ) | ||||||||
Shareholder transactions: | ||||||||||||||||
Proceeds from shares purchased | 29,645,531 | 81,939,005 | 20,265,404 | 58,765,204 | ||||||||||||
Cost of shares redeemed | (39,522,719 | ) | (24,692,404 | ) | (40,171,647 | ) | (38,162,845 | ) | ||||||||
Net increase (decrease) in net assets resulting from share transactions | (9,877,188 | ) | 57,246,601 | (19,906,243 | ) | 20,602,359 | ||||||||||
Net increase (decrease) in net assets | (13,593,393 | ) | 69,220,605 | (21,339,127 | ) | 28,416,830 | ||||||||||
Net assets: | ||||||||||||||||
Beginning of year | 146,124,982 | 76,904,377 | 93,136,918 | 64,720,088 | ||||||||||||
End of year | $ | 132,531,589 | $ | 146,124,982 | $ | 71,797,791 | $ | 93,136,918 | ||||||||
Undistributed (distributions in excess of) net investment income at end of year | $ | (856 | ) | $ | (856 | ) | $ | — | $ | 19,357 | ||||||
Changes in shares outstanding: | ||||||||||||||||
Shares sold | 600,000 | 1,700,000 | 400,000 | 1,200,000 | ||||||||||||
Shares redeemed | (800,000 | ) | (500,000 | ) | (800,000 | ) | (800,000 | ) | ||||||||
Net increase (decrease) in shares | (200,000 | ) | 1,200,000 | (400,000 | ) | 400,000 | ||||||||||
SEE NOTES TO FINANCIAL STATEMENTS. | GUGGENHEIM ETFs ANNUAL REPORT | 103 |
STATEMENTS OF CHANGES IN NET ASSETS (continued) |
Guggenheim Russell 2000® Equal Weight ETF | Guggenheim MSCI Emerging Markets | |||||||||||||||
Year Ended | Year Ended | Year Ended | Year Ended | |||||||||||||
Increase (Decrease) in Net Assets from Operations: | ||||||||||||||||
Net investment income | $ | 527,920 | $ | 340,576 | $ | 284,394 | $ | 215,609 | ||||||||
Net realized gain (loss) on investments | 760,661 | 895,195 | (722,821 | ) | (411,708 | ) | ||||||||||
Net change in unrealized appreciation (depreciation) on investments | (4,796,328 | ) | 202,910 | (1,886,825 | ) | 203,736 | ||||||||||
Net increase (decrease) in net assets resulting from operations | (3,507,747 | ) | 1,438,681 | (2,325,252 | ) | 7,637 | ||||||||||
Distributions to shareholders from: | ||||||||||||||||
Net investment income | (544,593 | ) | (344,321 | ) | (256,801 | ) | (231,261 | ) | ||||||||
Return of capital | (29,410 | ) | — | — | — | |||||||||||
Total distributions to shareholders | (574,003 | ) | (344,321 | ) | (256,801 | ) | (231,261 | ) | ||||||||
Shareholder transactions: | ||||||||||||||||
Proceeds from shares purchased | 22,948,358 | 15,879,739 | — | 3,549,961 | ||||||||||||
Cost of shares redeemed | (15,317,007 | ) | (2,329,715 | ) | — | — | ||||||||||
Net increase in net assets resulting from share transactions | 7,631,351 | 13,550,024 | — | 3,549,961 | ||||||||||||
Net increase (decrease) in net assets | 3,549,601 | 14,644,384 | (2,582,053 | ) | 3,326,337 | |||||||||||
Net assets: | ||||||||||||||||
Beginning of year | 40,380,477 | 25,736,093 | 13,654,195 | 10,327,858 | ||||||||||||
End of year | $ | 43,930,078 | $ | 40,380,477 | $ | 11,072,142 | $ | 13,654,195 | ||||||||
Undistributed (distributions in excess of) net investment income at end of year | $ | (4,867 | ) | $ | (8,573 | ) | $ | 42,626 | $ | 16,910 | ||||||
Changes in shares outstanding: | ||||||||||||||||
Shares sold | 500,000 | 350,000 | — | 100,000 | ||||||||||||
Shares redeemed | (350,000 | ) | (50,000 | ) | — | — | ||||||||||
Net increase in shares | 150,000 | 300,000 | — | 100,000 | ||||||||||||
104 | GUGGENHEIM ETFs ANNUAL REPORT | SEE NOTES TO FINANCIAL STATEMENTS. |
STATEMENTS OF CHANGES IN NET ASSETS (continued) |
Guggenheim S&P 500® Equal Weight | Guggenheim S&P 500® Equal | |||||||||||||||
Year Ended | Year Ended | Year Ended | Year Ended | |||||||||||||
Increase (Decrease) in Net Assets from Operations: | ||||||||||||||||
Net investment income | $ | 2,188,663 | $ | 1,298,864 | $ | 5,327,763 | $ | 2,743,797 | ||||||||
Net realized gain on investments | 18,331,181 | 19,268,780 | 14,431,258 | 13,443,116 | ||||||||||||
Net change in unrealized appreciation (depreciation) on investments | (9,745,175 | ) | (13,526,852 | ) | 9,398,344 | 2,905,504 | ||||||||||
Net increase in net assets resulting from operations | 10,774,669 | 7,040,792 | 29,157,365 | 19,092,417 | ||||||||||||
Distributions to shareholders from: | ||||||||||||||||
Net investment income | (2,049,799 | ) | (1,282,123 | ) | (4,938,435 | ) | (2,571,891 | ) | ||||||||
Shareholder transactions: | ||||||||||||||||
Proceeds from shares purchased | 185,396,920 | 47,523,459 | 405,174,870 | 161,078,918 | ||||||||||||
Cost of shares redeemed | (105,017,902 | ) | (91,882,052 | ) | (84,903,374 | ) | (75,271,970 | ) | ||||||||
Net increase (decrease) in net assets resulting from share transactions | 80,379,018 | (44,358,593 | ) | 320,271,496 | 85,806,948 | |||||||||||
Net increase (decrease) in net assets | 89,103,888 | (38,599,924 | ) | 344,490,426 | 102,327,474 | |||||||||||
Net assets: | ||||||||||||||||
Beginning of year | 86,897,159 | 125,497,083 | 186,381,970 | 84,054,496 | ||||||||||||
End of year | $ | 176,001,047 | $ | 86,897,159 | $ | 530,872,396 | $ | 186,381,970 | ||||||||
Undistributed net investment income at end of year | $ | 167,253 | $ | 28,390 | $ | 703,192 | $ | 305,571 | ||||||||
Changes in shares outstanding: | ||||||||||||||||
Shares sold | 2,100,000 | 600,000 | 3,700,000 | 1,700,000 | ||||||||||||
Shares redeemed | (1,200,000 | ) | (1,200,000 | ) | (800,000 | ) | (800,000 | ) | ||||||||
Net increase (decrease) in shares | 900,000 | (600,000 | ) | 2,900,000 | 900,000 | |||||||||||
SEE NOTES TO FINANCIAL STATEMENTS. | GUGGENHEIM ETFs ANNUAL REPORT | 105 |
STATEMENTS OF CHANGES IN NET ASSETS (continued) |
Guggenheim S&P 500® Equal | Guggenheim S&P 500® Equal | |||||||||||||||
Year Ended | Year Ended | Year Ended | Year Ended | |||||||||||||
Increase (Decrease) in Net Assets from Operations: | ||||||||||||||||
Net investment income | $ | 3,139,133 | $ | 2,610,239 | $ | 2,856,761 | $ | 1,269,880 | ||||||||
Net realized gain (loss) on investments | (16,888,985 | ) | 1,887,504 | 9,158,986 | 9,241,788 | |||||||||||
Net change in unrealized appreciation (depreciation) on investments | (30,348,311 | ) | (22,261,676 | ) | (13,121,264 | ) | 4,351,272 | |||||||||
Net increase (decrease) in net assets resulting from operations | (44,098,163 | ) | (17,763,933 | ) | (1,105,517 | ) | 14,862,940 | |||||||||
Distributions to shareholders from: | ||||||||||||||||
Net investment income | (3,174,568 | ) | (2,499,608 | ) | (3,019,133 | ) | (1,579,128 | ) | ||||||||
Return of capital | — | — | (198,204 | ) | — | |||||||||||
Total distributions to shareholders | (3,174,568 | ) | (2,499,608 | ) | (3,217,337 | ) | (1,579,128 | ) | ||||||||
Shareholder transactions: | ||||||||||||||||
Proceeds from shares purchased | 146,213,054 | 318,175,018 | 172,998,339 | 121,631,679 | ||||||||||||
Cost of shares redeemed | (22,474,535 | ) | (241,528,311 | ) | (121,370,788 | ) | (56,936,567 | ) | ||||||||
Net increase in net assets resulting from share transactions | 123,738,519 | 76,646,707 | 51,627,551 | 64,695,112 | ||||||||||||
Net increase in net assets | 76,465,788 | 56,383,166 | 47,304,697 | 77,978,924 | ||||||||||||
Net assets: | ||||||||||||||||
Beginning of year | 100,306,860 | 43,923,694 | 136,315,653 | 58,336,729 | ||||||||||||
End of year | $ | 176,772,648 | $ | 100,306,860 | $ | 183,620,350 | $ | 136,315,653 | ||||||||
Undistributed net investment income at end of year | $ | 170,896 | $ | 110,631 | $ | — | $ | — | ||||||||
Changes in shares outstanding: | ||||||||||||||||
Shares sold | 2,300,000 | 3,700,000 | 3,900,000 | 3,000,000 | ||||||||||||
Shares redeemed | (350,000 | ) | (2,950,000 | ) | (2,850,000 | ) | (1,400,000 | ) | ||||||||
Net increase in shares | 1,950,000 | 750,000 | 1,050,000 | 1,600,000 | ||||||||||||
106 | GUGGENHEIM ETFs ANNUAL REPORT | SEE NOTES TO FINANCIAL STATEMENTS. |
STATEMENTS OF CHANGES IN NET ASSETS (continued) |
Guggenheim S&P 500® Equal | Guggenheim S&P 500® Equal | |||||||||||||||
Year Ended | Year Ended | Year Ended | Year Ended | |||||||||||||
Increase (Decrease) in Net Assets from Operations: | ||||||||||||||||
Net investment income | $ | 3,104,547 | $ | 1,172,940 | $ | 1,589,022 | $ | 1,404,910 | ||||||||
Net realized gain on investments | 92,266,709 | 22,872,428 | 7,897,507 | 11,502,355 | ||||||||||||
Net change in unrealized appreciation (depreciation) on investments | (71,010,844 | ) | 42,079,888 | (12,554,131 | ) | 2,104,725 | ||||||||||
Net increase (decrease) in net assets resulting from operations | 24,360,412 | 66,125,256 | (3,067,602 | ) | 15,011,990 | |||||||||||
Distributions to shareholders from: | ||||||||||||||||
Net investment income | (2,938,855 | ) | (1,057,835 | ) | (1,865,867 | ) | (1,179,408 | ) | ||||||||
Return of capital | — | — | (42,175 | ) | — | |||||||||||
Total distributions to shareholders | (2,938,855 | ) | (1,057,835 | ) | (1,908,042 | ) | (1,179,408 | ) | ||||||||
Shareholder transactions: | ||||||||||||||||
Proceeds from shares purchased | 640,046,161 | 275,032,704 | 54,081,202 | 102,807,929 | ||||||||||||
Cost of shares redeemed | (483,288,596 | ) | (79,013,536 | ) | (78,722,508 | ) | (50,443,556 | ) | ||||||||
Net increase (decrease) in net assets resulting from share transactions | 156,757,565 | 196,019,168 | (24,641,306 | ) | 52,364,373 | |||||||||||
Net increase (decrease) in net assets | 178,179,122 | 261,086,589 | (29,616,950 | ) | 66,196,955 | |||||||||||
Net assets: | ||||||||||||||||
Beginning of year | 391,713,986 | 130,627,397 | 123,447,484 | 57,250,529 | ||||||||||||
End of year | $ | 569,893,108 | $ | 391,713,986 | $ | 93,830,534 | $ | 123,447,484 | ||||||||
Undistributed net investment income at end of year | $ | — | $ | 232,378 | $ | — | $ | 276,845 | ||||||||
Changes in shares outstanding: | ||||||||||||||||
Shares sold | 4,200,000 | 2,250,000 | 600,000 | 1,250,000 | ||||||||||||
Shares redeemed | (3,250,000 | ) | (650,000 | ) | (900,000 | ) | (600,000 | ) | ||||||||
Net increase (decrease) in shares | 950,000 | 1,600,000 | (300,000 | ) | 650,000 | |||||||||||
SEE NOTES TO FINANCIAL STATEMENTS. | GUGGENHEIM ETFs ANNUAL REPORT | 107 |
STATEMENTS OF CHANGES IN NET ASSETS (continued) |
Guggenheim S&P 500® Equal | Guggenheim S&P 500® Equal Weight | |||||||||||
Year Ended | Year Ended | Period ended | ||||||||||
Increase (Decrease) in Net Assets from Operations: | ||||||||||||
Net investment income | $ | 1,097,662 | $ | 1,102,693 | $ | 13,371 | ||||||
Net realized gain (loss) on investments | 2,048,544 | 15,434,502 | 722 | |||||||||
Net change in unrealized appreciation (depreciation) on investments | (8,146,411 | ) | (10,400,723 | ) | 25,713 | |||||||
Net increase (decrease) in net assets resulting from operations | (5,000,205 | ) | 6,136,472 | 39,806 | ||||||||
Distributions to shareholders from: | ||||||||||||
Net investment income | (1,098,723 | ) | (1,078,681 | ) | (8,313 | ) | ||||||
Shareholder transactions: | ||||||||||||
Proceeds from shares purchased | 49,421,316 | 85,250,481 | 2,531,138 | |||||||||
Cost of shares redeemed | (61,478,764 | ) | (65,238,463 | ) | — | |||||||
Net increase (decrease) in net assets resulting from share transactions | (12,057,448 | ) | 20,012,018 | 2,531,138 | ||||||||
Net increase (decrease) in net assets | (18,156,376 | ) | 25,069,809 | 2,562,631 | ||||||||
Net assets: | ||||||||||||
Beginning of period | 74,138,499 | 49,068,690 | — | |||||||||
End of period | $ | 55,982,123 | $ | 74,138,499 | $ | 2,562,631 | ||||||
Undistributed net investment income at end of period | $ | 70,106 | $ | 71,167 | $ | 5,779 | ||||||
Changes in shares outstanding: | ||||||||||||
Shares sold | 550,000 | 1,050,000 | 100,000 | |||||||||
Shares redeemed | (750,000 | ) | (800,000 | ) | — | |||||||
Net increase (decrease) in shares | (200,000 | ) | 250,000 | 100,000 | ||||||||
a | Since commencement of operations: August 12, 2015. |
108 | GUGGENHEIM ETFs ANNUAL REPORT | SEE NOTES TO FINANCIAL STATEMENTS. |
STATEMENTS OF CHANGES IN NET ASSETS (concluded) |
Guggenheim S&P 500® Equal | Guggenheim S&P 500® Equal | |||||||||||||||
Year Ended | Year Ended | Year Ended | Year Ended | |||||||||||||
Increase (Decrease) in Net Assets from Operations: | ||||||||||||||||
Net investment income | $ | 9,912,225 | $ | 4,762,621 | $ | 5,424,195 | $ | 3,112,103 | ||||||||
Net realized gain on investments | 79,925,421 | 35,025,103 | 2,693,007 | 11,924,787 | ||||||||||||
Net change in unrealized appreciation (depreciation) on investments | (42,809,730 | ) | 52,724,598 | (18,243,029 | ) | 3,851,728 | ||||||||||
Net increase (decrease) in net assets resulting from operations | 47,027,916 | 92,512,322 | (10,125,827 | ) | 18,888,618 | |||||||||||
Distributions to shareholders from: | ||||||||||||||||
Net investment income | (10,224,817 | ) | (4,572,706 | ) | (5,791,076 | ) | (3,002,830 | ) | ||||||||
Return of capital | (617,780 | ) | — | — | — | |||||||||||
Total distributions to shareholders | (10,842,597 | ) | (4,572,706 | ) | (5,791,076 | ) | (3,002,830 | ) | ||||||||
Shareholder transactions: | ||||||||||||||||
Proceeds from shares purchased | 470,511,829 | 444,290,459 | 198,571,649 | 218,070,696 | ||||||||||||
Cost of shares redeemed | (437,289,257 | ) | (134,284,608 | ) | (196,271,911 | ) | (143,819,030 | ) | ||||||||
Net increase in net assets resulting from share transactions | 33,222,572 | 310,005,851 | 2,299,738 | 74,251,666 | ||||||||||||
Net increase (decrease) in net assets | 69,407,891 | 397,945,467 | (13,617,165 | ) | 90,137,454 | |||||||||||
Net assets: | ||||||||||||||||
Beginning of year | 671,220,778 | 273,275,311 | 141,875,484 | 51,738,030 | ||||||||||||
End of year | $ | 740,628,669 | $ | 671,220,778 | $ | 128,258,319 | $ | 141,875,484 | ||||||||
Undistributed net investment income at end of year | $ | — | $ | 117,510 | $ | 20,079 | $ | 199,574 | ||||||||
Changes in shares outstanding: | ||||||||||||||||
Shares sold | 5,100,000 | 5,550,000 | 2,550,000 | 3,050,000 | ||||||||||||
Shares redeemed | (4,850,000 | ) | (1,700,000 | ) | (2,650,000 | ) | (2,000,000 | ) | ||||||||
Net increase (decrease) in shares | 250,000 | 3,850,000 | (100,000 | ) | 1,050,000 | |||||||||||
SEE NOTES TO FINANCIAL STATEMENTS. | GUGGENHEIM ETFs ANNUAL REPORT | 109 |
GUGGENHEIM RUSSELL MIDCAP® EQUAL WEIGHT ETF |
FINANCIAL HIGHLIGHTS |
This table is presented to show selected data for a share outstanding throughout each period and to assist shareholders in evaluating the Fund’s performance for the periods presented.
Year Ended | Year Ended | Year Ended | Year Ended | Period Ended | ||||||||||||||||
Per Share Data: | ||||||||||||||||||||
Net asset value, beginning of period | $ | 50.39 | $ | 45.24 | $ | 33.95 | $ | 31.15 | $ | 30.21 | ||||||||||
Income from investment operations: | ||||||||||||||||||||
Net investment income (loss)b | 0.62 | 0.62 | 0.57 | 0.46 | 0.30 | |||||||||||||||
Net gain (loss) on investments (realized and unrealized) | (1.21 | ) | 5.48 | 11.28 | 2.80 | 0.85 | ||||||||||||||
Total from investment operations | (0.59 | ) | 6.10 | 11.85 | 3.26 | 1.15 | ||||||||||||||
Less distributions from: | ||||||||||||||||||||
Net investment income | (0.67 | ) | (0.59 | ) | (0.56 | ) | (0.46 | ) | (0.21 | ) | ||||||||||
Capital gains | — | (0.36 | ) | — | — | — | ||||||||||||||
Return of capital | (0.04 | ) | — | — | — | — | ||||||||||||||
Total distributions to shareholders | (0.71 | ) | (0.95 | ) | (0.56 | ) | (0.46 | ) | (0.21 | ) | ||||||||||
Net asset value, end of period | $ | 49.09 | $ | 50.39 | $ | 45.24 | $ | 33.95 | $ | 31.15 | ||||||||||
Total Returnc | (1.19 | %) | 13.61 | % | 35.21 | % | 10.52 | % | 3.80 | % | ||||||||||
Ratios/Supplemental Data: | ||||||||||||||||||||
Net assets, end of period (in thousands) | $ | 132,532 | $ | 146,125 | $ | 76,904 | $ | 52,617 | $ | 54,508 | ||||||||||
Ratio to average net assets of: | ||||||||||||||||||||
Net investment income (loss) | 1.22 | % | 1.27 | % | 1.44 | % | 1.39 | % | 1.06 | %d | ||||||||||
Total expenses | 0.41 | % | 0.41 | % | 0.41 | % | 0.41 | % | 0.41 | %d | ||||||||||
Portfolio turnover ratee | 31 | % | 29 | % | 29 | % | 33 | % | 30 | % | ||||||||||
a | The Fund commenced operations on December 3, 2010. |
b | Based on average shares outstanding. |
c | Total investment return is calculated assuming an initial investment made at the net asset value at the beginning of the period, reinvestment of all dividends and distribution at net asset value during the period, and redemption on the last day of the period. Transaction fees are not reflected in the calculation of total investment return. |
d | Annualized. |
e | Portfolio turnover does not include securities received or delivered from processing creations or redemptions. |
110 | GUGGENHEIM ETFs ANNUAL REPORT | SEE NOTES TO FINANCIAL STATEMENTS. |
GUGGENHEIM RUSSELL 1000® EQUAL WEIGHT ETF |
FINANCIAL HIGHLIGHTS |
This table is presented to show selected data for a share outstanding throughout each period and to assist shareholders in evaluating the Fund’s performance for the periods presented.
Year Ended | Year Ended | Year Ended | Year Ended | Period Ended | ||||||||||||||||
Per Share Data: | ||||||||||||||||||||
Net asset value, beginning of period | $ | 50.34 | $ | 44.63 | $ | 33.92 | $ | 31.08 | $ | 30.18 | ||||||||||
Income from investment operations: | ||||||||||||||||||||
Net investment income (loss)b | 0.68 | 0.67 | 0.62 | 0.51 | 0.36 | |||||||||||||||
Net gain (loss) on investments (realized and unrealized) | (0.71 | ) | 5.70 | 10.71 | 2.83 | 0.85 | ||||||||||||||
Total from investment operations | (0.03 | ) | 6.37 | 11.33 | 3.34 | 1.21 | ||||||||||||||
Less distributions from: | ||||||||||||||||||||
Net investment income | (0.73 | ) | (0.66 | ) | (0.62 | ) | (0.50 | ) | (0.31 | ) | ||||||||||
Return of capital | (0.06 | ) | — | — | — | — | ||||||||||||||
Total distributions to shareholders | (0.79 | ) | (0.66 | ) | (0.62 | ) | (0.50 | ) | (0.31 | ) | ||||||||||
Net asset value, end of period | $ | 49.52 | $ | 50.34 | $ | 44.63 | $ | 33.92 | $ | 31.08 | ||||||||||
Total Returnc | (0.07 | %) | 14.33 | % | 33.71 | % | 10.83 | % | 4.00 | % | ||||||||||
Ratios/Supplemental Data: | ||||||||||||||||||||
Net assets, end of period (in thousands) | $ | 71,798 | $ | 93,137 | $ | 64,720 | $ | 39,011 | $ | 34,183 | ||||||||||
Ratio to average net assets of: | ||||||||||||||||||||
Net investment income (loss) | 1.32 | % | 1.38 | % | 1.57 | % | 1.56 | % | 1.26 | %d | ||||||||||
Total expenses | 0.41 | % | 0.41 | % | 0.40 | % | 0.41 | % | 0.41 | %d | ||||||||||
Portfolio turnover ratee | 28 | % | 27 | % | 27 | % | 27 | % | 25 | % | ||||||||||
a | The Fund commenced operations on December 3, 2010. |
b | Based on average shares outstanding. |
c | Total investment return is calculated assuming an initial investment made at the net asset value at the beginning of the period, reinvestment of all dividends and distribution at net asset value during the period, and redemption on the last day of the period. Transaction fees are not reflected in the calculation of total investment return. |
d | Annualized. |
e | Portfolio turnover does not include securities received or delivered from processing creations or redemptions. |
SEE NOTES TO FINANCIAL STATEMENTS. | GUGGENHEIM ETFs ANNUAL REPORT | 111 |
GUGGENHEIM RUSSELL 2000® EQUAL WEIGHT ETF |
FINANCIAL HIGHLIGHTS |
This table is presented to show selected data for a share outstanding throughout each period and to assist shareholders in evaluating the Fund’s performance for the periods presented.
Year Ended | Year Ended | Year Ended | Year Ended | Period Ended | ||||||||||||||||
Per Share Data: | ||||||||||||||||||||
Net asset value, beginning of period | $ | 44.87 | $ | 42.89 | $ | 31.82 | $ | 29.48 | $ | 30.19 | ||||||||||
Income from investment operations: | ||||||||||||||||||||
Net investment income (loss)b | 0.49 | 0.43 | 0.54 | 0.34 | 0.22 | |||||||||||||||
Net gain (loss) on investments (realized and unrealized) | (2.97 | ) | 1.97 | 11.12 | 2.33 | (0.75 | ) | |||||||||||||
Total from investment operations | (2.48 | ) | 2.40 | �� | 11.66 | 2.67 | (0.53 | ) | ||||||||||||
Less distributions from: | ||||||||||||||||||||
Net investment income | (0.52 | ) | (0.42 | ) | (0.59 | ) | (0.33 | ) | (0.18 | ) | ||||||||||
Return of capital | (0.03 | ) | — | — | — | — | ||||||||||||||
Total distributions to shareholders | (0.55 | ) | (0.42 | ) | (0.59 | ) | (0.33 | ) | (0.18 | ) | ||||||||||
Net asset value, end of period | $ | 41.84 | $ | 44.87 | $ | 42.89 | $ | 31.82 | $ | 29.48 | ||||||||||
Total Returnc | (5.59 | %) | 5.58 | % | 37.07 | % | 9.08 | % | (1.78 | %) | ||||||||||
Ratios/Supplemental Data: | ||||||||||||||||||||
Net assets, end of period (in thousands) | $ | 43,930 | $ | 40,380 | $ | 25,736 | $ | 14,318 | $ | 23,584 | ||||||||||
Ratio to average net assets of: | ||||||||||||||||||||
Net investment income (loss) | 1.11 | % | 0.96 | % | 1.46 | % | 1.10 | % | 0.79 | %d | ||||||||||
Total expenses | 0.41 | % | 0.42 | % | 0.41 | % | 0.41 | % | 0.41 | %d | ||||||||||
Portfolio turnover ratee | 47 | % | 43 | % | 42 | % | 43 | % | 38 | % | ||||||||||
a | The Fund commenced operations on December 3, 2010. |
b | Based on average shares outstanding. |
c | Total investment return is calculated assuming an initial investment made at the net asset value at the beginning of the period, reinvestment of all dividends and distribution at net asset value during the period, and redemption on the last day of the period. Transaction fees are not reflected in the calculation of total investment return. |
d | Annualized. |
e | Portfolio turnover does not include securities received or delivered from processing creations or redemptions. |
112 | GUGGENHEIM ETFs ANNUAL REPORT | SEE NOTES TO FINANCIAL STATEMENTS. |
GUGGENHEIM MSCI EMERGING MARKETS EQUAL COUNTRY WEIGHT ETF |
FINANCIAL HIGHLIGHTS |
This table is presented to show selected data for a share outstanding throughout each period and to assist shareholders in evaluating the Fund’s performance for the periods presented.
Year Ended | Year Ended | Year Ended | Year Ended | Period Ended | ||||||||||||||||
Per Share Data: | ||||||||||||||||||||
Net asset value, beginning of period | $ | 34.14 | $ | 34.43 | $ | 33.31 | $ | 33.83 | $ | 40.21 | ||||||||||
Income from investment operations: | ||||||||||||||||||||
Net investment income (loss)b | 0.71 | 0.64 | 0.50 | 0.55 | 0.69 | |||||||||||||||
Net gain (loss) on investments (realized and unrealized) | (6.53 | ) | (0.31 | ) | 1.06 | (0.53 | ) | (6.35 | ) | |||||||||||
Total from investment operations | (5.82 | ) | 0.33 | 1.56 | 0.02 | (5.66 | ) | |||||||||||||
Less distributions from: | ||||||||||||||||||||
Net investment income | (0.64 | ) | (0.62 | ) | (0.44 | ) | (0.48 | ) | (0.36 | ) | ||||||||||
Return of capital | — | — | — | (0.06 | ) | (0.36 | ) | |||||||||||||
Total distributions to shareholders | (0.64 | ) | (0.62 | ) | (0.44 | ) | (0.54 | ) | (0.72 | ) | ||||||||||
Net asset value, end of period | $ | 27.68 | $ | 34.14 | $ | 34.43 | $ | 33.31 | $ | 33.83 | ||||||||||
Total Returnc | (17.21 | %) | 0.99 | % | 4.76 | % | 0.10 | % | (14.13 | %) | ||||||||||
Ratios/Supplemental Data: | ||||||||||||||||||||
Net assets, end of period (in thousands) | $ | 11,072 | $ | 13,654 | $ | 10,328 | $ | 13,325 | $ | 16,914 | ||||||||||
Ratio to average net assets of: | ||||||||||||||||||||
Net investment income (loss) | 2.26 | % | 1.86 | % | 1.47 | % | 1.66 | % | 1.99 | % | ||||||||||
Total expenses | 0.70 | % | 0.70 | % | 0.71 | % | 0.72 | % | 0.71 | %d | ||||||||||
Net expensese | 0.64 | % | 0.60 | % | 0.60 | % | 0.61 | % | 0.63 | %d | ||||||||||
Portfolio turnover ratef | 99 | % | 25 | % | 38 | % | 39 | % | 63 | % | ||||||||||
a | The Fund commenced operations on December 3, 2010. |
b | Based on average shares outstanding. |
c | Total investment return is calculated assuming an initial investment made at the net asset value at the beginning of the period, reinvestment of all dividends and distribution at net asset value during the period, and redemption on the last day of the period. Transaction fees are not reflected in the calculation of total investment return. |
d | Annualized and excludes expenses of the underlying funds in which the Fund invests. |
e | Net expense information reflects the expense ratios after expense waivers. |
f | Portfolio turnover does not include securities received or delivered from processing creations or redemptions. |
SEE NOTES TO FINANCIAL STATEMENTS. | GUGGENHEIM ETFs ANNUAL REPORT | 113 |
GUGGENHEIM S&P 500® EQUAL WEIGHT CONSUMER DISCRETIONARY ETF |
FINANCIAL HIGHLIGHTS |
This table is presented to show selected data for a share outstanding throughout each period and to assist shareholders in evaluating the Fund’s performance for the periods presented.
Year Ended | Year Ended | Year Ended | Year Ended | Year Ended | ||||||||||||||||
Per Share Data: | ||||||||||||||||||||
Net asset value, beginning of period | $ | 82.76 | $ | 76.06 | $ | 55.09 | $ | 47.70 | $ | 42.37 | ||||||||||
Income from investment operations: | ||||||||||||||||||||
Net investment income (loss)a | 1.15 | 0.95 | 0.79 | 0.64 | 0.56 | |||||||||||||||
Net gain (loss) on investments (realized and unrealized) | 7.39 | 6.67 | 21.02 | 7.46 | 5.31 | |||||||||||||||
Total from investment operations | 8.54 | 7.62 | 21.81 | 8.10 | 5.87 | |||||||||||||||
Less distributions from: | ||||||||||||||||||||
Net investment income | (1.04 | ) | (0.92 | ) | (0.84 | ) | (0.71 | ) | (0.54 | ) | ||||||||||
Total distributions to shareholders | (1.04 | ) | (0.92 | ) | (0.84 | ) | (0.71 | ) | (0.54 | ) | ||||||||||
Net asset value, end of period | $ | 90.26 | $ | 82.76 | $ | 76.06 | $ | 55.09 | $ | 47.70 | ||||||||||
Total Returnb | 10.35 | % | 10.07 | % | 39.91 | % | 17.05 | % | 13.91 | % | ||||||||||
Ratios/Supplemental Data: | ||||||||||||||||||||
Net assets, end of period (in thousands) | $ | 176,001 | $ | 86,897 | $ | 125,497 | $ | 41,314 | $ | 21,467 | ||||||||||
Ratio to average net assets of: | ||||||||||||||||||||
Net investment income (loss) | 1.29 | % | 1.20 | % | 1.19 | % | 1.22 | % | 1.20 | % | ||||||||||
Total expenses | 0.40 | % | 0.40 | % | 0.50 | % | 0.50 | % | 0.50 | % | ||||||||||
Portfolio turnover ratec | 23 | % | 22 | % | 20 | % | 25 | % | 26 | % | ||||||||||
a | Based on average shares outstanding. |
b | Total investment return is calculated assuming an initial investment made at the net asset value at the beginning of the period, reinvestment of all dividends and distribution at net asset value during the period, and redemption on the last day of the period. Transaction fees are not reflected in the calculation of total investment return. |
c | Portfolio turnover does not include securities received or delivered from processing creations or redemptions. |
114 | GUGGENHEIM ETFs ANNUAL REPORT | SEE NOTES TO FINANCIAL STATEMENTS. |
GUGGENHEIM S&P 500® EQUAL WEIGHT CONSUMER STAPLES ETF |
FINANCIAL HIGHLIGHTS |
This table is presented to show selected data for a share outstanding throughout each period and to assist shareholders in evaluating the Fund’s performance for the periods presented.
Year Ended | Year Ended | Year Ended | Year Ended | Year Ended | ||||||||||||||||
Per Share Data: | ||||||||||||||||||||
Net asset value, beginning of period | $ | 100.75 | $ | 88.48 | $ | 68.24 | $ | 61.01 | $ | 55.42 | ||||||||||
Income from investment operations: | ||||||||||||||||||||
Net investment income (loss)a | 2.08 | 2.04 | 1.73 | 1.41 | 1.31 | |||||||||||||||
Net gain (loss) on investments (realized and unrealized) | 10.86 | 12.03 | 20.22 | 7.20 | 5.49 | |||||||||||||||
Total from investment operations | 12.94 | 14.07 | 21.95 | 8.61 | 6.80 | |||||||||||||||
Less distributions from: | ||||||||||||||||||||
Net investment income | (1.93 | ) | (1.80 | ) | (1.71 | ) | (1.38 | ) | (1.21 | ) | ||||||||||
Total distributions to shareholders | (1.93 | ) | (1.80 | ) | (1.71 | ) | (1.38 | ) | (1.21 | ) | ||||||||||
Net asset value, end of period | $ | 111.76 | $ | 100.75 | $ | 88.48 | $ | 68.24 | $ | 61.01 | ||||||||||
Total Returnb | 12.95 | % | 16.04 | % | 32.59 | % | 14.19 | % | 12.37 | % | ||||||||||
Ratios/Supplemental Data: | ||||||||||||||||||||
Net assets, end of period (in thousands) | $ | 530,872 | $ | 186,382 | $ | 84,054 | $ | 40,944 | $ | 30,507 | ||||||||||
Ratio to average net assets of: | ||||||||||||||||||||
Net investment income (loss) | 1.94 | % | 2.18 | % | 2.15 | % | 2.14 | % | 2.20 | % | ||||||||||
Total expenses | 0.40 | % | 0.40 | % | 0.50 | % | 0.50 | % | 0.50 | % | ||||||||||
Portfolio turnover ratec | 16 | % | 20 | % | 17 | % | 18 | % | 15 | % | ||||||||||
a | Based on average shares outstanding. |
b | Total investment return is calculated assuming an initial investment made at the net asset value at the beginning of the period, reinvestment of all dividends and distribution at net asset value during the period, and redemption on the last day of the period. Transaction fees are not reflected in the calculation of total investment return. |
c | Portfolio turnover does not include securities received or delivered from processing creations or redemptions. |
SEE NOTES TO FINANCIAL STATEMENTS. | GUGGENHEIM ETFs ANNUAL REPORT | 115 |
GUGGENHEIM S&P 500® EQUAL WEIGHT ENERGY ETF |
FINANCIAL HIGHLIGHTS |
This table is presented to show selected data for a share outstanding throughout each period and to assist shareholders in evaluating the Fund’s performance for the periods presented.
Year Ended | Year Ended | Year Ended | Year Ended | Year Ended | ||||||||||||||||
Per Share Data: | ||||||||||||||||||||
Net asset value, beginning of period | $ | 77.16 | $ | 79.86 | $ | 64.01 | $ | 64.16 | $ | 53.74 | ||||||||||
Income from investment operations: | ||||||||||||||||||||
Net investment income (loss)a | 1.35 | 1.40 | 0.78 | 0.55 | 0.36 | |||||||||||||||
Net gain (loss) on investments (realized and unrealized) | (22.73 | ) | (2.91 | ) | 15.87 | (0.19 | ) | 10.43 | ||||||||||||
Total from investment operations | (21.38 | ) | (1.51 | ) | 16.65 | 0.36 | 10.79 | |||||||||||||
Less distributions from: | ||||||||||||||||||||
Net investment income | (1.39 | ) | (1.19 | ) | (0.80 | ) | (0.51 | ) | (0.37 | ) | ||||||||||
Total distributions to shareholders | (1.39 | ) | (1.19 | ) | (0.80 | ) | (0.51 | ) | (0.37 | ) | ||||||||||
Net asset value, end of period | $ | 54.39 | $ | 77.16 | $ | 79.86 | $ | 64.01 | $ | 64.16 | ||||||||||
Total Returnb | (27.93 | %) | (2.02 | %) | 26.19 | % | 0.58 | % | 20.09 | % | ||||||||||
Ratios/Supplemental Data: | ||||||||||||||||||||
Net assets, end of period (in thousands) | $ | 176,773 | $ | 100,307 | $ | 43,924 | $ | 32,004 | $ | 35,287 | ||||||||||
Ratio to average net assets of: | ||||||||||||||||||||
Net investment income (loss) | 2.16 | % | 1.64 | % | 1.09 | % | 0.88 | % | 0.53 | % | ||||||||||
Total expenses | 0.40 | % | 0.40 | % | 0.50 | % | 0.50 | % | 0.50 | % | ||||||||||
Portfolio turnover ratec | 34 | % | 25 | % | 17 | % | 30 | % | 23 | % | ||||||||||
a | Based on average shares outstanding. |
b | Total investment return is calculated assuming an initial investment made at the net asset value at the beginning of the period, reinvestment of all dividends and distribution at net asset value during the period, and redemption on the last day of the period. Transaction fees are not reflected in the calculation of total investment return. |
c | Portfolio turnover does not include securities received or delivered from processing creations or redemptions. |
116 | GUGGENHEIM ETFs ANNUAL REPORT | SEE NOTES TO FINANCIAL STATEMENTS. |
GUGGENHEIM S&P 500® EQUAL WEIGHT FINANCIALS ETF |
FINANCIAL HIGHLIGHTS |
This table is presented to show selected data for a share outstanding throughout each period and to assist shareholders in evaluating the Fund’s performance for the periods presented.
Year Ended | Year Ended | Year Ended | Year Ended | Year Ended | ||||||||||||||||
Per Share Data: | ||||||||||||||||||||
Net asset value, beginning of period | $ | 43.27 | $ | 37.64 | $ | 28.68 | $ | 24.48 | $ | 25.40 | ||||||||||
Income from investment operations: | ||||||||||||||||||||
Net investment income (loss)a | 0.72 | 0.53 | 0.57 | 0.39 | 0.42 | |||||||||||||||
Net gain (loss) on investments (realized and unrealized) | 0.58 | 5.76 | 9.08 | 4.32 | (0.96 | ) | ||||||||||||||
Total from investment operations | 1.30 | 6.29 | 9.65 | 4.71 | �� | (0.54 | ) | |||||||||||||
Less distributions from: | ||||||||||||||||||||
Net investment income | (0.80 | ) | (0.66 | ) | (0.58 | ) | (0.42 | ) | (0.38 | ) | ||||||||||
Return of capital | (0.05 | ) | — | (0.11 | ) | (0.09 | ) | — | ||||||||||||
Total distributions to shareholders | (0.85 | ) | (0.66 | ) | (0.69 | ) | (0.51 | ) | (0.38 | ) | ||||||||||
Net asset value, end of period | $ | 43.72 | $ | 43.27 | $ | 37.64 | $ | 28.68 | $ | 24.48 | ||||||||||
Total Returnb | 3.04 | % | 16.84 | % | 34.05 | % | 19.32 | % | (2.25 | %) | ||||||||||
Ratios/Supplemental Data: | ||||||||||||||||||||
Net assets, end of period (in thousands) | $ | 183,620 | $ | 136,316 | $ | 58,337 | $ | 14,339 | $ | 17,133 | ||||||||||
Ratio to average net assets of: | ||||||||||||||||||||
Net investment income (loss) | 1.64 | % | 1.30 | % | 1.65 | % | 1.48 | % | 1.59 | % | ||||||||||
Total expenses | 0.40 | % | 0.40 | % | 0.50 | % | 0.50 | % | 0.50 | % | ||||||||||
Portfolio turnover ratec | 13 | % | 19 | % | 14 | % | 17 | % | 18 | % | ||||||||||
a | Based on average shares outstanding. |
b | Total investment return is calculated assuming an initial investment made at the net asset value at the beginning of the period, reinvestment of all dividends and distribution at net asset value during the period, and redemption on the last day of the period. Transaction fees are not reflected in the calculation of total investment return. |
c | Portfolio turnover does not include securities received or delivered from processing creations or redemptions. |
SEE NOTES TO FINANCIAL STATEMENTS. | GUGGENHEIM ETFs ANNUAL REPORT | 117 |
GUGGENHEIM S&P 500® EQUAL WEIGHT HEALTH CARE ETF |
FINANCIAL HIGHLIGHTS |
This table is presented to show selected data for a share outstanding throughout each period and to assist shareholders in evaluating the Fund’s performance for the periods presented.
Year Ended | Year Ended | Year Ended | Year Ended | Year Ended | ||||||||||||||||
Per Share Data: | ||||||||||||||||||||
Net asset value, beginning of period | $ | 137.44 | $ | 104.50 | $ | 76.84 | $ | 66.49 | $ | 59.74 | ||||||||||
Income from investment operations: | ||||||||||||||||||||
Net investment income (loss)a | 0.75 | 0.66 | 0.55 | 0.47 | 0.32 | |||||||||||||||
Net gain (loss) on investments (realized and unrealized) | 12.46 | 32.89 | 27.63 | 11.04 | 6.73 | |||||||||||||||
Total from investment operations | 13.21 | 33.55 | 28.18 | 11.51 | 7.05 | |||||||||||||||
Less distributions from: | ||||||||||||||||||||
Net investment income | (0.68 | ) | (0.61 | ) | (0.52 | ) | (1.16 | ) | (0.30 | ) | ||||||||||
Total distributions to shareholders | (0.68 | ) | (0.61 | ) | (0.52 | ) | (1.16 | ) | (0.30 | ) | ||||||||||
Net asset value, end of period | $ | 149.97 | $ | 137.44 | $ | 104.50 | $ | 76.84 | $ | 66.49 | ||||||||||
Total Returnb | 9.61 | % | 32.20 | % | 36.81 | % | 17.39 | % | 11.80 | % | ||||||||||
Ratios/Supplemental Data: | ||||||||||||||||||||
Net assets, end of period (in thousands) | $ | 569,893 | $ | 391,714 | $ | 130,627 | $ | 38,419 | $ | 53,196 | ||||||||||
Ratio to average net assets of: | ||||||||||||||||||||
Net investment income (loss) | 0.49 | % | 0.55 | % | 0.60 | % | 0.65 | % | 0.47 | % | ||||||||||
Total expenses | 0.40 | % | 0.40 | % | 0.50 | % | 0.50 | % | 0.50 | % | ||||||||||
Portfolio turnover ratec | 22 | % | 23 | % | 24 | % | 15 | % | 19 | % | ||||||||||
a | Based on average shares outstanding. |
b | Total investment return is calculated assuming an initial investment made at the net asset value at the beginning of the period, reinvestment of all dividends and distribution at net asset value during the period, and redemption on the last day of the period. Transaction fees are not reflected in the calculation of total investment return. |
c | Portfolio turnover does not include securities received or delivered from processing creations or redemptions. |
118 | GUGGENHEIM ETFs ANNUAL REPORT | SEE NOTES TO FINANCIAL STATEMENTS. |
GUGGENHEIM S&P 500® EQUAL WEIGHT INDUSTRIALS ETF |
FINANCIAL HIGHLIGHTS |
This table is presented to show selected data for a share outstanding throughout each period and to assist shareholders in evaluating the Fund’s performance for the periods presented.
Year Ended | Year Ended | Year Ended | Year Ended | Year Ended | ||||||||||||||||
Per Share Data: | ||||||||||||||||||||
Net asset value, beginning of period | $ | 88.18 | $ | 76.33 | $ | 56.94 | $ | 51.50 | $ | 49.54 | ||||||||||
Income from investment operations: | ||||||||||||||||||||
Net investment income (loss)a | 1.13 | 1.22 | 0.95 | 1.05 | 0.83 | |||||||||||||||
Net gain (loss) on investments (realized and unrealized) | (2.69 | ) | 11.59 | 19.41 | 5.42 | 2.05 | ||||||||||||||
Total from investment operations | (1.56 | ) | 12.81 | 20.36 | 6.47 | 2.88 | ||||||||||||||
Less distributions from: | ||||||||||||||||||||
Net investment income | (1.29 | ) | (0.96 | ) | (0.97 | ) | (1.03 | ) | (0.92 | ) | ||||||||||
Return of capital | (0.03 | ) | — | — | — | — | ||||||||||||||
Total distributions to shareholders | (1.32 | ) | (0.96 | ) | (0.97 | ) | (1.03 | ) | (0.92 | ) | ||||||||||
Net asset value, end of period | $ | 85.30 | $ | 88.18 | $ | 76.33 | $ | 56.94 | $ | 51.50 | ||||||||||
Total Returnb | (1.78 | %) | 16.85 | % | 36.10 | % | 12.64 | % | 5.80 | % | ||||||||||
Ratios/Supplemental Data: | ||||||||||||||||||||
Net assets, end of period (in thousands) | $ | 93,831 | $ | 123,447 | $ | 57,251 | $ | 17,082 | $ | 15,450 | ||||||||||
Ratio to average net assets of: | ||||||||||||||||||||
Net investment income (loss) | 1.29 | % | 1.47 | % | 1.41 | % | 1.90 | % | 1.52 | % | ||||||||||
Total expenses | 0.40 | % | 0.40 | % | 0.50 | % | 0.50 | % | 0.50 | % | ||||||||||
Portfolio turnover ratec | 22 | % | 15 | % | 24 | % | 18 | % | 15 | % | ||||||||||
a | Based on average shares outstanding. |
b | Total investment return is calculated assuming an initial investment made at the net asset value at the beginning of the period, reinvestment of all dividends and distribution at net asset value during the period, and redemption on the last day of the period. Transaction fees are not reflected in the calculation of total investment return. |
c | Portfolio turnover does not include securities received or delivered from processing creations or redemptions. |
SEE NOTES TO FINANCIAL STATEMENTS. | GUGGENHEIM ETFs ANNUAL REPORT | 119 |
GUGGENHEIM S&P 500® EQUAL WEIGHT MATERIALS ETF |
FINANCIAL HIGHLIGHTS |
This table is presented to show selected data for a share outstanding throughout each period and to assist shareholders in evaluating the Fund’s performance for the periods presented.
Year Ended | Year Ended | Year Ended | Year Ended | Year Ended | ||||||||||||||||
Per Share Data: | ||||||||||||||||||||
Net asset value, beginning of period | $ | 82.38 | $ | 75.49 | $ | 60.71 | $ | 56.57 | $ | 57.32 | ||||||||||
Income from investment operations: | ||||||||||||||||||||
Net investment income (loss)a | 1.23 | 1.21 | 1.25 | 0.92 | 0.82 | |||||||||||||||
Net gain (loss) on investments (realized and unrealized) | (2.41 | ) | 6.85 | 14.73 | 4.14 | (0.76 | ) | |||||||||||||
Total from investment operations | (1.18 | ) | 8.06 | 15.98 | 5.06 | 0.06 | ||||||||||||||
Less distributions from: | ||||||||||||||||||||
Net investment income | (1.23 | ) | (1.17 | ) | (1.20 | ) | (0.92 | ) | (0.81 | ) | ||||||||||
Total distributions to shareholders | (1.23 | ) | (1.17 | ) | (1.20 | ) | (0.92 | ) | (0.81 | ) | ||||||||||
Net asset value, end of period | $ | 79.97 | $ | 82.38 | $ | 75.49 | $ | 60.71 | $ | 56.57 | ||||||||||
Total Returnb | (1.44 | %) | 10.68 | % | 26.59 | % | 8.99 | % | 0.04 | % | ||||||||||
Ratios/Supplemental Data: | ||||||||||||||||||||
Net assets, end of period (in thousands) | $ | 55,982 | $ | 74,138 | $ | 49,069 | $ | 33,388 | $ | 36,771 | ||||||||||
Ratio to average net assets of: | ||||||||||||||||||||
Net investment income (loss) | 1.46 | % | 1.48 | % | 1.84 | % | 1.55 | % | 1.33 | % | ||||||||||
Total expenses | 0.40 | % | 0.40 | % | 0.50 | % | 0.50 | % | 0.50 | % | ||||||||||
Portfolio turnover ratec | 27 | % | 22 | % | 18 | % | 20 | % | 21 | % | ||||||||||
a | Based on average shares outstanding. |
b | Total investment return is calculated assuming an initial investment made at the net asset value at the beginning of the period, reinvestment of all dividends and distribution at net asset value during the period, and redemption on the last day of the period. Transaction fees are not reflected in the calculation of total investment return. |
c | Portfolio turnover does not include securities received or delivered from processing creations or redemptions. |
120 | GUGGENHEIM ETFs ANNUAL REPORT | SEE NOTES TO FINANCIAL STATEMENTS. |
GUGGENHEIM S&P 500® EQUAL WEIGHT REAL ESTATE ETF |
FINANCIAL HIGHLIGHTS |
This table is presented to show selected data for a share outstanding throughout each period and to assist shareholders in evaluating the Fund’s performance for the periods presented.
Period Ended | ||||
Per Share Data: | ||||
Net asset value, beginning of period | $ | 25.31 | ||
Income from investment operations: | ||||
Net investment income (loss)b | 0.13 | |||
Net gain (loss) on investments (realized and unrealized) | 0.27 | |||
Total from investment operations | 0.40 | |||
Less distributions from: | ||||
Net investment income | (0.08 | ) | ||
Total distributions to shareholders | (0.08 | ) | ||
Net asset value, end of period | $ | 25.63 | ||
Total Returnc | 1.61 | % | ||
Ratios/Supplemental Data: | ||||
Net assets, end of period (in thousands) | $ | 2,563 | ||
Ratio to average net assets of: | ||||
Net investment income (loss) | 2.49 | %d | ||
Total expenses | 0.40 | %d | ||
Portfolio turnover ratee | 5 | % | ||
a | The Fund commenced operations on August 12, 2015. |
b | Based on average shares outstanding. |
c | Total investment return is calculated assuming an initial investment made at the net asset value at the beginning of the period, reinvestment of all dividends and distribution at net asset value during the period, and redemption on the last day of the period. Transaction fees are not reflected in the calculation of total investment return. |
d | Annualized. |
e | Portfolio turnover does not include securities received or delivered from processing creations or redemptions. |
SEE NOTES TO FINANCIAL STATEMENTS. | GUGGENHEIM ETFs ANNUAL REPORT | 121 |
GUGGENHEIM S&P 500® EQUAL WEIGHT TECHNOLOGY ETF |
FINANCIAL HIGHLIGHTS |
This table is presented to show selected data for a share outstanding throughout each period and to assist shareholders in evaluating the Fund’s performance for the periods presented.
Year Ended | Year Ended | Year Ended | Year Ended | Year Ended | ||||||||||||||||
Per Share Data: | ||||||||||||||||||||
Net asset value, beginning of period | $ | 87.17 | $ | 70.98 | $ | 51.53 | $ | 52.23 | $ | 50.72 | ||||||||||
Income from investment operations: | ||||||||||||||||||||
Net investment income (loss)a | 1.09 | 0.78 | 0.68 | 0.41 | 0.29 | |||||||||||||||
Net gain (loss) on investments (realized and unrealized) | 6.09 | 16.15 | 19.43 | (0.75 | ) | 1.49 | ||||||||||||||
Total from investment operations | 7.18 | 16.93 | 20.11 | (0.34 | ) | 1.78 | ||||||||||||||
Less distributions from: | ||||||||||||||||||||
Net investment income | (1.12 | ) | (0.74 | ) | (0.66 | ) | (0.36 | ) | (0.27 | ) | ||||||||||
Return of capital | (0.07 | ) | — | — | — | — | ||||||||||||||
Total distributions to shareholders | (1.19 | ) | (0.74 | ) | (0.66 | ) | (0.36 | ) | (0.27 | ) | ||||||||||
Net asset value, end of period | $ | 93.16 | $ | 87.17 | $ | 70.98 | $ | 51.53 | $ | 52.23 | ||||||||||
Total Returnb | 8.30 | % | 23.92 | % | 39.23 | % | 0.71 | % | 3.51 | % | ||||||||||
Ratios/Supplemental Data: | ||||||||||||||||||||
Net assets, end of period (in thousands) | $ | 740,629 | $ | 671,221 | $ | 273,275 | $ | 100,479 | $ | 109,685 | ||||||||||
Ratio to average net assets of: | ||||||||||||||||||||
Net investment income (loss) | 1.20 | % | 0.97 | % | 1.07 | % | 0.76 | % | 0.54 | % | ||||||||||
Total expenses | 0.40 | % | 0.40 | % | 0.50 | % | 0.50 | % | 0.50 | % | ||||||||||
Portfolio turnover ratec | 21 | % | 22 | % | 24 | % | 25 | % | 29 | % | ||||||||||
a | Based on average shares outstanding. |
b | Total investment return is calculated assuming an initial investment made at the net asset value at the beginning of the period, reinvestment of all dividends and distribution at net asset value during the period, and redemption on the last day of the period. Transaction fees are not reflected in the calculation of total investment return. |
c | Portfolio turnover does not include securities received or delivered from processing creations or redemptions. |
122 | GUGGENHEIM ETFs ANNUAL REPORT | SEE NOTES TO FINANCIAL STATEMENTS. |
GUGGENHEIM S&P 500® EQUAL WEIGHT UTILITIES ETF |
FINANCIAL HIGHLIGHTS |
This table is presented to show selected data for a share outstanding throughout each period and to assist shareholders in evaluating the Fund’s performance for the periods presented.
Year Ended | Year Ended | Year Ended | Year Ended | Year Ended | ||||||||||||||||
Per Share Data: | ||||||||||||||||||||
Net asset value, beginning of period | $ | 76.69 | $ | 64.67 | $ | 60.52 | $ | 54.03 | $ | 50.27 | ||||||||||
Income from investment operations: | ||||||||||||||||||||
Net investment income (loss)a | 2.48 | 2.59 | 2.36 | 2.03 | 1.89 | |||||||||||||||
Net gain (loss) on investments (realized and unrealized) | (2.97 | ) | 11.75 | 4.11 | 6.45 | 3.71 | ||||||||||||||
Total from investment operations | (0.49 | ) | 14.34 | 6.47 | 8.48 | 5.60 | ||||||||||||||
Less distributions from: | ||||||||||||||||||||
Net investment income | (2.91 | ) | (2.32 | ) | (2.32 | ) | (1.99 | ) | (1.84 | ) | ||||||||||
Total distributions to shareholders | (2.91 | ) | (2.32 | ) | (2.32 | ) | (1.99 | ) | (1.84 | ) | ||||||||||
Net asset value, end of period | $ | 73.29 | $ | 76.69 | $ | 64.67 | $ | 60.52 | $ | 54.03 | ||||||||||
Total Returnb | (0.56 | %) | 22.61 | % | 10.95 | % | 15.98 | % | 11.29 | % | ||||||||||
Ratios/Supplemental Data: | ||||||||||||||||||||
Net assets, end of period (in thousands) | $ | 128,258 | $ | 141,875 | $ | 51,738 | $ | 42,364 | $ | 32,417 | ||||||||||
Ratio to average net assets of: | ||||||||||||||||||||
Net investment income (loss) | 3.30 | % | 3.72 | % | 3.78 | % | 3.60 | % | 3.60 | % | ||||||||||
Total expenses | 0.40 | % | 0.40 | % | 0.50 | % | 0.50 | % | 0.50 | % | ||||||||||
Portfolio turnover ratec | 20 | % | 31 | % | 22 | % | 22 | % | 15 | % | ||||||||||
a | Based on average shares outstanding. |
b | Total investment return is calculated assuming an initial investment made at the net asset value at the beginning of the period, reinvestment of all dividends and distribution at net asset value during the period, and redemption on the last day of the period. Transaction fees are not reflected in the calculation of total investment return. |
c | Portfolio turnover does not include securities received or delivered from processing creations or redemptions. |
SEE NOTES TO FINANCIAL STATEMENTS. | GUGGENHEIM ETFs ANNUAL REPORT | 123 |
NOTES TO FINANCIAL STATEMENTS |
1. Organization and Significant Accounting Policies
Organization
Rydex ETF Trust (the “Trust”) is registered with the SEC under the Investment Company Act of 1940 (the “1940 Act”), as an open-ended investment company of the series type, and is authorized to issue an unlimited number of no par value shares. Each portfolio represents a separate series of beneficial interest in the Trust (each a “Fund”, and collectively, the “Funds”), each a non-diversified investment company. The Trust was organized as a Delaware statutory trust on November 22, 2002. At October 31, 2015, the Trust consisted of twenty-two funds.
The financial statements herein relate to the following Funds, whose investment objective is to replicate as closely as possible, before fees and expenses, the daily performance of an index representing publicly traded equity securities (the “Underlying Index”) as follows:
Fund | Underlying Index |
Guggenheim Russell MidCap® Equal Weight ETF | Russell MidCap® Equal Weight Index |
Guggenheim Russell 1000® Equal Weight ETF | Russell 1000® Equal Weight Index |
Guggenheim Russell 2000® Equal Weight ETF | Russell 2000® Equal Weight Index |
Guggenheim MSCI Emerging Markets Equal Country Weight ETF | MSCI Emerging Markets Equal Country Weighted Index |
Guggenheim S&P 500® Equal Weight Consumer Discretionary ETF | S&P 500® Equal Weight Index Consumer Discretionary |
Guggenheim S&P 500® Equal Weight Consumer Staples ETF | S&P 500® Equal Weight Index Consumer Staples |
Guggenheim S&P 500® Equal Weight Energy ETF | S&P 500® Equal Weight Index Energy |
Guggenheim S&P 500® Equal Weight Financials ETF | S&P 500® Equal Weight Index Financials |
Guggenheim S&P 500® Equal Weight Health Care ETF | S&P 500® Equal Weight Index Health Care |
Guggenheim S&P 500® Equal Weight Industrials ETF | S&P 500® Equal Weight Index Industrials |
Guggenheim S&P 500® Equal Weight Materials ETF | S&P 500® Equal Weight Index Materials |
Guggenheim S&P 500® Equal Weight Real Estate ETF | S&P 500® Equal Weight Real Estate Index |
Guggenheim S&P 500® Equal Weight Technology ETF | S&P 500® Equal Weight Index Information Technology |
Guggenheim S&P 500® Equal Weight Utilities ETF | S&P 500® Equal Weight Index Telecommunication Services and Utilities |
The Funds seek to achieve their objective by investing in common stocks or exchange-traded funds (“ETFs”), where applicable, that comprise the Underlying Index. The Funds use a “replication” strategy to track the Underlying Index. Replication refers to investing in substantially all of the securities in the Underlying Index in approximately the same proportions as in the Underlying Index.
The Funds operate as index funds and are not actively managed. Adverse performance of a security in the Funds’ portfolio will ordinarily not result in the elimination of the security from the Funds’ portfolio.
The Funds issue and redeem shares on a continuous basis, at net asset value per share (“NAV”), only in aggregation of 50,000 shares (100,000 shares for the Guggenheim MSCI Emerging Markets Equal Country Weight ETF) called a “Creation Unit”. Creation Units are issued and redeemed principally in-kind for securities included in the Underlying Index.
The Funds invest in various investments which are exposed to risk, such as market risk. Due to the level of risk associated with certain investments it is at least reasonably possible that changes in the values of investment securities will occur in the near term and that such changes could materially affect amounts reported in the financial statements.
Guggenheim Investments (“GI”) provides advisory services and Rydex Fund Services, LLC (“RFS”) provides administrative services to the Trust. Guggenheim Funds Distributors, LLC (“GFD”) acts as principal underwriter for the Trust. GI, RFS and GFD are affiliated entities.
Significant Accounting Policies
The Funds operate as investment companies and accordingly follow the investment company accounting and reporting guidance of the Financial Accounting Standards Board (“FASB”) Accounting Standards Codification Topic 946 Financial Services – Investment Companies.
The following significant accounting policies are in conformity with U.S. generally accepted accounting principles ("U.S. GAAP") and are consistently followed by the Trust. This requires management to make estimates and assumptions that affect the reported amount of assets and liabilities and disclosure of contingent assets and liabilities at the date of the financial statements and the reported amounts of revenues and expenses during the reporting period. Actual results could differ from these estimates. All time references are based on Eastern Time.
A. The Board of Trustees of the Funds (the “Board”) has adopted policies and procedures for the valuation of the Funds’ investments (the “Valuation Procedures”). Pursuant to the Valuation Procedures, the Board
124 | GUGGENHEIM ETFs ANNUAL REPORT |
NOTES TO FINANCIAL STATEMENTS (continued) |
has delegated to a valuation committee, consisting of representatives from Guggenheim’s investment management, fund administration, legal and compliance departments (the “Valuation Committee”), the day-to-day responsibility for implementing the Valuation Procedures, including, under most circumstances, the responsibility for determining the fair value of the Funds' securities or other assets.
Valuations of the Funds’ securities are supplied primarily by pricing services appointed pursuant to the processes set forth in the Valuation Procedures. The Valuation Committee convenes monthly, or more frequently as needed and will review the valuation of all assets which have been fair valued for reasonableness. The Funds’ officers, through the Valuation Committee and consistent with the monitoring and review responsibilities set forth in the Valuation Procedures, regularly review procedures used by, and valuations provided by, the pricing services.
If the pricing service cannot or does not provide a valuation for a particular investment or such valuation is deemed unreliable, such investment is fair valued by the Valuation Committee.
Equity securities listed on an exchange (New York Stock Exchange (“NYSE”) or American Stock Exchange) are valued at the last quoted sales price as of the close of business on the NYSE, usually 4:00 p.m. on the valuation date. Equity securities listed on the NASDAQ market system are valued at the NASDAQ Official Closing Price on the valuation date, which may not necessarily represent the last sale price. If there has been no sale on such exchange or NASDAQ on a given day, the security is valued at the closing bid price on that day. The Funds invest in money market mutual funds, which are valued at their NAV. ETFs are valued at the last quoted sales price.
Generally, trading in foreign securities markets is substantially completed each day at various times prior to the close of the NYSE. The values of foreign securities are determined as of the close of such foreign markets or the close of the NYSE, if earlier. All investments quoted in foreign currency are valued in U.S. dollars on the basis of the foreign currency exchange rates prevailing at the close of business. Investments in foreign securities may involve risks not present in domestic investments. The Valuation Committee will determine the current value of such foreign securities by taking into consideration certain factors which may include those discussed above, as well as the following factors, among others: the value of the securities traded on other foreign markets, ADR trading, closed-end fund trading, foreign currency exchange activity, and the trading prices of financial products that are tied to foreign securities. In addition, the Board of Trustees has authorized the Valuation Committee and GI to use prices and other information supplied by a third party pricing vendor in valuing foreign securities.
Investments for which market quotations are not readily available are fair valued as determined in good faith by GI under the direction of the Board of Trustees using methods established or ratified by the Board of Trustees. Valuations in accordance with these methods are intended to reflect each security’s (or asset’s) “fair value.” Each such determination is based on a consideration of all relevant factors, which are likely to vary from one pricing context to another. Examples of such factors may include, but are not limited to: (i) the type of security, (ii) the initial cost of the security, (iii) the existence of any contractual restrictions on the security’s disposition, (iv) the price and extent of public trading in similar securities of the issuer or of comparable companies, (v) quotations or evaluated prices from broker-dealers and/or pricing services, (vi) information obtained from the issuer, analysts, and/or the appropriate stock exchange (for exchange-traded securities), (vii) an analysis of the company’s financial statements, and (viii) an evaluation of the forces that influence the issuer and the market(s) in which the security is purchased and sold (e.g. the existence of pending merger activity, public offerings or tender offers that might affect the value of the security).
B. Investment securities and other assets and liabilities denominated in foreign currencies are translated into U.S. dollar amounts at the date of valuation. Purchases and sales of investment securities and income and expense items denominated in foreign currencies are translated into U.S. dollar amounts on the respective dates of such transactions. The Trust does not isolate that portion of the results of operations resulting from changes in foreign exchange rates on investments from the fluctuations arising from changes in market prices of securities held. Such fluctuations are included with the net realized and unrealized gain and loss from investments.
Reported net realized foreign exchange gains or losses arise from sales of foreign currencies and currency gains or losses realized between the trade and settlement dates on investment transactions. Net unrealized exchange gains and losses arise from changes in the fair values of assets and liabilities other than investments insecurities at the fiscal period end, resulting from changes in exchange rates.
GUGGENHEIM ETFs ANNUAL REPORT | 125 |
NOTES TO FINANCIAL STATEMENTS (continued) |
C. Security transactions are recorded on the trade date for financial reporting purposes. Realized gains and losses from securities transactions are recorded using the identified cost basis. Proceeds from lawsuits related to investment holdings are recorded as realized gains in the respective Fund. Dividend income is recorded on the ex-dividend date, net of applicable taxes withheld by foreign countries. Taxable non-cash dividends are recorded as dividend income. Interest income, including amortization of premiums and accretion of discounts, is accrued on a daily basis. Dividend income from REITs is recorded based on the income included in the distributions received from the REIT investments using published REIT classifications, including some management estimates when actual amounts are not available. Distributions received in excess of this estimated amount are recorded as a reduction of the cost of investments or reclassified to capital gains. The actual amounts of income, return of capital, and capital gains are only determined by each REIT after its fiscal year-end, and may differ from the estimated amounts.
D. Distributions of net investment income and net realized gains, if any, are declared and paid at least annually. Distributions are recorded on the ex-dividend date and are determined in accordance with income tax regulations which may differ from U.S. GAAP.
E. The Funds may leave cash overnight in their cash account with the custodian. Periodically, a Fund may have cash due to the custodian bank as an overdraft balance. A fee is incurred on this overdraft, calculated by multiplying the overdraft by a rate based on the federal funds rate.
F. Under the Funds’ organizational documents, their Trustees and Officers are indemnified against certain liabilities arising out of the performance of their duties to the Trust. In addition, throughout the normal course of business, the Funds enter into contracts that contain a variety of representations and warranties which provide general indemnifications. The Funds’ maximum exposure under these arrangements is unknown, as this would involve future claims that may be made against the Funds and/or their affiliates that have not yet occurred. However, based on experience, the Funds expect the risk of loss to be remote.
2. Capital
There is a minimum transaction fee per transaction to those persons purchasing or redeeming Creation Units. An additional charge of up to three times the standard transaction fee may be imposed for purchases and redemptions effected outside the National Securities Clearing Corporation usual clearing process or for cash. Such transactions are generally permitted on an in-kind basis, with a balancing cash component to equate the transaction to the NAV of the Fund on the transaction date. Transaction fees are not charged to or paid by the Funds.
The minimum transaction fees are:
Fund | Minimum |
Guggenheim Russell MidCap® Equal Weight ETF | $ 2,000 |
Guggenheim Russell 1000® Equal Weight ETF | 2,500 |
Guggenheim Russell 2000® Equal Weight ETF | 3,000 |
Guggenheim MSCI Emerging Markets Equal Country Weight ETF | 6,000 |
Guggenheim S&P 500® Equal Weight Consumer Discretionary ETF | 750 |
Guggenheim S&P 500® Equal Weight Consumer Staples ETF | 500 |
Guggenheim S&P 500® Equal Weight Energy ETF | 500 |
Guggenheim S&P 500® Equal Weight Financials ETF | 750 |
Guggenheim S&P 500® Equal Weight Health Care ETF | 500 |
Guggenheim S&P 500® Equal Weight Industrials ETF | 500 |
Guggenheim S&P 500® Equal Weight Materials ETF | 500 |
Guggenheim S&P 500® Equal Weight Real Estate ETF | 500 |
Guggenheim S&P 500® Equal Weight Technology ETF | 750 |
Guggenheim S&P 500® Equal Weight Utilities ETF | 500 |
3. Fees and Other Transactions with Affiliates
GI determines the composition of the portfolio of securities that must be delivered in exchange for the issuance of Creation Units and periodically adjusts the composition of the portfolio of the Funds to conform to changes in the composition of the relevant index. For these services, GI receives a management fee at the annual rate shown below as a percentage of the average daily net assets of the Funds.
Fund | Advisory Fee |
Guggenheim Russell MidCap® Equal Weight ETF | 0.40% |
Guggenheim Russell 1000® Equal Weight ETF | 0.40% |
Guggenheim Russell 2000® Equal Weight ETF | 0.40% |
Guggenheim MSCI Emerging Markets Equal Country Weight ETF | 0.70% |
Guggenheim S&P 500® Equal Weight Consumer Discretionary ETF | 0.40% |
Guggenheim S&P 500® Equal Weight Consumer Staples ETF | 0.40% |
Guggenheim S&P 500® Equal Weight Energy ETF | 0.40% |
Guggenheim S&P 500® Equal Weight Financials ETF | 0.40% |
Guggenheim S&P 500® Equal Weight Health Care ETF | 0.40% |
Guggenheim S&P 500® Equal Weight Industrials ETF | 0.40% |
Guggenheim S&P 500® Equal Weight Materials ETF | 0.40% |
Guggenheim S&P 500® Equal Weight Real Estate ETF | 0.40% |
Guggenheim S&P 500® Equal Weight Technology ETF | 0.40% |
Guggenheim S&P 500® Equal Weight Utilities ETF | 0.40% |
126 | GUGGENHEIM ETFs ANNUAL REPORT |
NOTES TO FINANCIAL STATEMENTS (continued) |
GI pays all expenses of the Funds, including the cost of transfer agency, custody, fund administration, fund accounting, legal, audit and other services, except: interest, taxes, distribution fees or expenses, trustee fees (where applicable) and extraordinary expenses.
Under a Fund Administration Agreement with the Trust, RFS provides various administrative and financial reporting services for the Funds. GI compensates RFS directly for this service.
Under a Fund Accounting Agreement with the Trust, BNYMellon maintains the books and records of the Funds. Under a Custodian Agreement with the Trust, BNYMellon maintains cash, securities and other assets of the Funds in a separate account for the Funds, keeps all necessary accounts and records, and provides other services. BNYMellon is required, upon the order of the Trust, to deliver securities held by the custodian and to make payments for securities purchased by the Trust for the Funds. Pursuant to a Transfer Agency and Service Agreement with the Trust, BNYMellon acts as a transfer agent for the Trust’s authorized and issued shares of beneficial interest, and as dividend disbursing agent of the Trust. GI compensates BNYMellon directly for the foregoing services.
For the Guggenheim MSCI Emerging Markets Equal Country Weight ETF, GI has contractually agreed to reduce fees and/or reimburse expenses to the extent necessary to keep the Fund’s net operating expenses (excluding interest, taxes, brokerage commissions, dividends on securities sold short, distribution fees and expenses, and extraordinary expenses (“Excluded Expenses”)) plus Acquired Fund Fees and Expense borne indirectly from exceeding 0.70% of the Fund’s average daily net assets until February 28, 2016. This agreement may be terminated only with the approval of the Fund’s Board of Trustees. In any event, this undertaking will continue until at least February 28, 2016.
The Funds have adopted a Distribution Plan (the “Plan”) that allows the Funds to pay distribution fees to GFD and other firms that provide distribution services (“Service Providers”). If a Service Provider provides distribution services, the Funds will pay distribution fees to GFD at an annual rate not to exceed 0.25% of average daily net assets, pursuant to Rule 12b-1 of the 1940 Act. GFD will, in turn, pay the Service Provider out of its fees. No such fee is currently charged to the Funds.
Certain trustees and officers of the Trust are also officers of GI, RFS and GFD.
4. Fair Value Measurement
In accordance with U.S. GAAP, fair value is defined as the price that the Funds would receive to sell an investment or pay to transfer a liability in an orderly transaction with an independent buyer in the principal market, or in the absence of a principal market, the most advantageous market for the investment or liability. U.S. GAAP establishes a three-tier fair value hierarchy based on the types of inputs used to value assets and liabilities and requires corresponding disclosure. The hierarchy and the corresponding inputs are summarized below:
Level 1 — quoted prices in active markets for identical securities.
Level 2 — other significant observable inputs (including quoted prices for similar securities, interest rates, prepayment speeds, credit risk, etc.).
Level 3 — significant unobservable inputs (including the fund’s own assumptions used to determine the fair value of investments).
The types of inputs available depend on a variety of factors, such as the type of security and the characteristics of the markets in which it trades, if any. Fair valuation determinations that rely on fewer or no observable inputs require greater judgment. Accordingly, fair value determinations for Level 3 securities require the greatest amount of judgment.
The inputs or methodologies used for valuing securities are not necessarily an indication of the risk associated with investing in those securities. The suitability of the techniques and sources employed to determine fair valuation are regularly monitored and subject to change.
5. Portfolio Securities Loaned
During the year ended October 31, 2015, certain Funds lent their securities to approved brokers to earn additional income.
Security lending income shown on the Statements of Operations is net of rebates paid to borrowers and earnings on cash collateral investments shared with the lending agent. As of October 31, 2015, all Funds had ceased participation in securities lending.
GUGGENHEIM ETFs ANNUAL REPORT | 127 |
NOTES TO FINANCIAL STATEMENTS (continued) |
6. Federal Income Tax Information
The Funds intend to comply with the provisions of Subchapter M of the Internal Revenue Code applicable to regulated investment companies and will distribute substantially all taxable net investment income and capital gains sufficient to relieve the Funds from all, or substantially all, federal income, excise and state income taxes. Therefore, no provision for federal or state income tax is required.
Tax positions taken or expected to be taken in the course of preparing the Funds' tax returns are evaluated to determine whether the tax positions are “more-likely-than-not” of being sustained by the applicable tax authority. Tax positions not deemed to meet the more-likely-than-not threshold would be recorded as a tax benefit or expense in the current year. Management has analyzed the Funds' tax positions taken, or to be taken, on Federal income tax returns for all open tax years, and has concluded that no provision for income tax is required in the Funds' financial statements. The Funds' federal tax returns are subject to examination by the Internal Revenue Service for a period of three years after they are filed.
Tax basis capital losses in excess of capital gains are carried forward to offset future net capital gains. For the year ended October 31, 2015, the following capital loss carryforward amounts were expired or used:
Fund | Amount | |||
Guggenheim S&P 500® Equal Weight Consumer Discretionary ETF | $ | 16,337 | ||
Guggenheim S&P 500® Equal Weight Financials ETF | 194,747 | |||
Guggenheim S&P 500® Equal Weight Health Care ETF | 265,349 | |||
The tax character of distributions paid during the year ended October 31, 2015 was as follows:
Fund | Ordinary | Return of | Long-Term | Total | ||||||||||||
Guggenheim Russell MidCap® Equal Weight ETF | $ | 1,988,010 | $ | 121,017 | $ | — | $ | 2,109,027 | ||||||||
Guggenheim Russell 1000® Equal Weight ETF | 1,324,343 | 104,474 | — | 1,428,817 | ||||||||||||
Guggenheim Russell 2000® Equal Weight ETF | 544,593 | 29,410 | — | 574,003 | ||||||||||||
Guggenheim MSCI Emerging Markets Equal Country Weight ETF | 256,801 | — | — | 256,801 | ||||||||||||
Guggenheim S&P 500® Equal Weight Consumer Discretionary ETF | 2,049,799 | — | — | 2,049,799 | ||||||||||||
Guggenheim S&P 500® Equal Weight Consumer Staples ETF | 4,938,435 | — | — | 4,938,435 | ||||||||||||
Guggenheim S&P 500® Equal Weight Energy ETF | 3,174,568 | — | — | 3,174,568 | ||||||||||||
Guggenheim S&P 500® Equal Weight Financials ETF | 3,019,133 | 198,204 | — | 3,217,337 | ||||||||||||
Guggenheim S&P 500® Equal Weight Health Care ETF | 2,938,855 | — | — | 2,938,855 | ||||||||||||
Guggenheim S&P 500® Equal Weight Industrials ETF | 1,865,867 | 42,175 | — | 1,908,042 | ||||||||||||
Guggenheim S&P 500® Equal Weight Materials ETF | 1,098,723 | — | — | 1,098,723 | ||||||||||||
Guggenheim S&P 500® Equal Weight Real Estate ETF | 8,313 | — | — | 8,313 | ||||||||||||
Guggenheim S&P 500® Equal Weight Technology ETF | 10,224,817 | 617,780 | — | 10,842,597 | ||||||||||||
Guggenheim S&P 500® Equal Weight Utilities ETF | 5,791,076 | — | — | 5,791,076 | ||||||||||||
Guggenheim S&P 500® Equal Weight Real Estate ETF commenced operations on August 12, 2015.
128 | GUGGENHEIM ETFs ANNUAL REPORT |
NOTES TO FINANCIAL STATEMENTS (continued) |
The tax character of distributions paid during the year ended October 31, 2014 was as follows:
Fund | Ordinary | Return of | Long-Term | Total | ||||||||||||
Guggenheim Russell MidCap® Equal Weight ETF | $ | 2,091,687 | $ | — | $ | 63,441 | $ | 2,155,128 | ||||||||
Guggenheim Russell 1000® Equal Weight ETF | 1,246,900 | — | — | 1,246,900 | ||||||||||||
Guggenheim Russell 2000® Equal Weight ETF | 344,321 | — | — | 344,321 | ||||||||||||
Guggenheim MSCI Emerging Markets Equal Country Weight ETF | 231,261 | — | — | 231,261 | ||||||||||||
Guggenheim S&P 500® Equal Weight Consumer Discretionary ETF | 1,282,123 | — | — | 1,282,123 | ||||||||||||
Guggenheim S&P 500® Equal Weight Consumer Staples ETF | 2,571,891 | — | — | 2,571,891 | ||||||||||||
Guggenheim S&P 500® Equal Weight Energy ETF | 2,499,607 | — | — | 2,499,607 | ||||||||||||
Guggenheim S&P 500® Equal Weight Financials ETF | 1,579,128 | — | — | 1,579,128 | ||||||||||||
Guggenheim S&P 500® Equal Weight Health Care ETF | 1,057,835 | — | — | 1,057,835 | ||||||||||||
Guggenheim S&P 500® Equal Weight Industrials ETF | 1,179,408 | — | — | 1,179,408 | ||||||||||||
Guggenheim S&P 500® Equal Weight Materials ETF | 1,078,681 | — | — | 1,078,681 | ||||||||||||
Guggenheim S&P 500® Equal Weight Technology ETF | 4,572,706 | — | — | 4,572,706 | ||||||||||||
Guggenheim S&P 500® Equal Weight Utilities ETF | 3,002,830 | — | — | 3,002,830 | ||||||||||||
The tax character of distributable earnings/(accumulated losses) at October 31, 2015 was as follows:
Fund | Undistributed | Undistributed | Accumulated | Net Unrealized | Total | |||||||||||||||
Guggenheim Russell MidCap® Equal Weight ETF | $ | — | $ | — | $ | (2,233,917 | ) | $ | 5,506,485 | $ | 3,272,568 | |||||||||
Guggenheim Russell 1000® Equal Weight ETF | — | — | (1,337,242 | ) | (815,204 | ) | (2,152,446 | ) | ||||||||||||
Guggenheim Russell 2000® Equal Weight ETF | — | — | (5,238,138 | ) | (764,586 | ) | (6,002,724 | ) | ||||||||||||
Guggenheim MSCI Emerging Markets Equal Country Weight ETF | 42,891 | — | (3,647,599 | ) | (1,962,463 | ) | (5,567,171 | ) | ||||||||||||
Guggenheim S&P 500® Equal Weight Consumer Discretionary ETF | 167,253 | — | (3,382,804 | ) | (5,110,750 | ) | (8,326,301 | ) | ||||||||||||
Guggenheim S&P 500® Equal Weight Consumer Staples ETF | 703,192 | — | (2,867,343 | ) | 21,723,867 | 19,559,716 | ||||||||||||||
Guggenheim S&P 500® Equal Weight Energy ETF | 170,896 | — | (22,695,807 | ) | (52,557,967 | ) | (75,082,878 | ) | ||||||||||||
Guggenheim S&P 500® Equal Weight Financials ETF | — | — | (5,996,030 | ) | (4,803,128 | ) | (10,799,158 | ) | ||||||||||||
Guggenheim S&P 500® Equal Weight Health Care ETF | — | — | — | (17,944,382 | ) | (17,944,382 | ) | |||||||||||||
Guggenheim S&P 500® Equal Weight Industrials ETF | — | — | (2,947,358 | ) | (3,769,800 | ) | (6,717,158 | ) | ||||||||||||
Guggenheim S&P 500® Equal Weight Materials ETF | 70,106 | — | (3,583,514 | ) | (8,955,789 | ) | (12,469,197 | ) | ||||||||||||
Guggenheim S&P 500® Equal Weight Real Estate ETF | 5,779 | — | — | 25,713 | 31,492 | |||||||||||||||
Guggenheim S&P 500® Equal Weight Technology ETF | — | — | (9,697,827 | ) | 28,288,721 | 18,590,894 | ||||||||||||||
Guggenheim S&P 500® Equal Weight Utilities ETF | 20,079 | — | (2,030,692 | ) | (11,594,497 | ) | (13,605,110 | ) | ||||||||||||
GUGGENHEIM ETFs ANNUAL REPORT | 129 |
NOTES TO FINANCIAL STATEMENTS (continued) |
For Federal income tax purposes, capital loss carryforwards represent realized losses of the Funds that may be carried forward and applied against future capital gains. For taxable years beginning on or before December 22, 2010, such capital losses may be carried forward for a maximum of eight years. Under the RIC Modernization Act of 2010, the Funds are permitted to carry forward capital losses incurred in taxable years beginning after December 22, 2010 for an unlimited period. However, any losses incurred during those taxable years must be utilized prior to the losses incurred in pre-enactment taxable years. As a result of this ordering rule, pre-enactment capital loss carryforwards may be more likely to expire unused. Additionally, post-enactment capital losses that are carried forward will retain their character as either short-term or long-term capital losses rather than being considered all short-term as under previous law. As of October 31, 2015, capital loss carryforwards for the Funds were as follows:
Unlimited | ||||||||||||||||||||||||||||
Fund | Expires in | Expires in | Expires in | Expires in | Short-Term | Long-Term | Remaining | |||||||||||||||||||||
Guggenheim Russell MidCap® Equal Weight ETF | $ | — | $ | — | $ | — | $ | — | $ | (1,640,029 | ) | $ | (593,888 | ) | $ | (2,233,917 | ) | |||||||||||
Guggenheim Russell 1000® Equal Weight ETF | — | — | — | (312 | ) | (722,558 | ) | (614,372 | ) | (1,337,242 | ) | |||||||||||||||||
Guggenheim Russell 2000® Equal Weight ETF | — | — | — | (259,648 | ) | (2,859,339 | ) | (2,119,151 | ) | (5,238,138 | ) | |||||||||||||||||
Guggenheim MSCI Emerging Markets Equal Country Weight ETF | — | — | — | (18,800 | ) | (1,016,632 | ) | (2,612,167 | ) | (3,647,599 | ) | |||||||||||||||||
Guggenheim S&P 500® Equal Weight Consumer Discretionary ETF | (800,018 | ) | (1,981,333 | ) | — | — | (71,902 | ) | (529,551 | ) | (3,382,804 | ) | ||||||||||||||||
Guggenheim S&P 500® Equal Weight Consumer Staples ETF | (11,426 | ) | (195,890 | ) | — | (61,000 | ) | (1,989,756 | ) | (609,271 | ) | (2,867,343 | ) | |||||||||||||||
Guggenheim S&P 500® Equal Weight Energy ETF | — | (1,743,348 | ) | (393,314 | ) | (128,371 | ) | (10,367,490 | ) | (10,063,284 | ) | (22,695,807 | ) | |||||||||||||||
Guggenheim S&P 500® Equal Weight Financials ETF | (1,557,104 | ) | (4,062,086 | ) | (376,840 | ) | — | — | — | (5,996,030 | ) | |||||||||||||||||
Guggenheim S&P 500® Equal Weight Health Care ETF | — | — | — | — | — | — | — | |||||||||||||||||||||
Guggenheim S&P 500® Equal Weight Industrials ETF | — | (1,121,641 | ) | — | — | (344,218 | ) | (1,481,499 | ) | (2,947,358 | ) | |||||||||||||||||
Guggenheim S&P 500® Equal Weight Materials ETF | — | (576,552 | ) | — | — | (368,749 | ) | (2,638,213 | ) | (3,583,514 | ) | |||||||||||||||||
Guggenheim S&P 500® Equal Weight Real Estate ETF | — | — | — | — | — | — | — | |||||||||||||||||||||
Guggenheim S&P 500® Equal Weight Technology ETF | — | (2,331,453 | ) | — | — | (1,553,465 | ) | (5,812,909 | ) | (9,697,827 | ) | |||||||||||||||||
Guggenheim S&P 500® Equal Weight Utilities ETF | — | — | — | — | (1,770,365 | ) | (260,327 | ) | (2,030,692 | ) | ||||||||||||||||||
130 | GUGGENHEIM ETFs ANNUAL REPORT |
NOTES TO FINANCIAL STATEMENTS (continued) |
In order to present paid-in-capital, undistributed net investment income (loss) and accumulated net realized gain (loss) on investments on the statement of assets and liabilities that more closely represent their tax character, certain adjustments have been made to these accounts. These adjustments have no effect on the net assets or NAV. The most significant of these adjustments are for net capital gains (losses) resulting from in-kind redemptions, equalization debits, passive foreign investment company adjustments, and return of capital on investments. For the year ended October 31, 2015, the adjustments for the Funds were as follows:
Fund | Paid-In Capital | Undistributed | Accumulated | |||||||||
Guggenheim Russell MidCap® Equal Weight ETF | $ | 14,486,167 | $ | 136,693 | $ | (14,622,860 | ) | |||||
Guggenheim Russell 1000® Equal Weight ETF | 10,265,243 | 65,981 | (10,331,224 | ) | ||||||||
Guggenheim Russell 2000® Equal Weight ETF | 4,572,815 | 20,379 | (4,593,194 | ) | ||||||||
Guggenheim MSCI Emerging Markets Equal Country Weight ETF | (12,907 | ) | (1,877 | ) | 14,784 | |||||||
Guggenheim S&P 500® Equal Weight Consumer Discretionary ETF | 18,428,371 | (1 | ) | (18,428,370 | ) | |||||||
Guggenheim S&P 500® Equal Weight Consumer Staples ETF | 15,178,715 | 8,293 | (15,187,008 | ) | ||||||||
Guggenheim S&P 500® Equal Weight Energy ETF | (242,848 | ) | 95,700 | 147,148 | ||||||||
Guggenheim S&P 500® Equal Weight Financials ETF | 8,760,658 | 162,372 | (8,923,030 | ) | ||||||||
Guggenheim S&P 500® Equal Weight Health Care ETF | 92,881,610 | (398,070 | ) | (92,483,540 | ) | |||||||
Guggenheim S&P 500® Equal Weight Industrials ETF | 9,142,142 | — | (9,142,142 | ) | ||||||||
Guggenheim S&P 500® Equal Weight Materials ETF | 3,160,095 | — | (3,160,095 | ) | ||||||||
Guggenheim S&P 500® Equal Weight Real Estate ETF | 1 | 721 | (722 | ) | ||||||||
Guggenheim S&P 500® Equal Weight Technology ETF | 84,301,792 | 195,082 | (84,496,874 | ) | ||||||||
Guggenheim S&P 500® Equal Weight Utilities ETF | 4,065,177 | 187,386 | (4,252,563 | ) | ||||||||
At October 31, 2015, the identified cost of investments in securities owned by each Fund for Federal income tax purposes and the gross unrealized appreciation and depreciation were as follows:
Fund | Tax | Tax | Tax | Net | ||||||||||||
Guggenheim Russell MidCap® Equal Weight ETF | $ | 126,992,694 | $ | 19,673,071 | $ | (14,166,586 | ) | $ | 5,506,485 | |||||||
Guggenheim Russell 1000® Equal Weight ETF | 72,585,030 | 7,916,360 | (8,731,564 | ) | (815,204 | ) | ||||||||||
Guggenheim Russell 2000® Equal Weight ETF | 44,654,086 | 6,186,032 | (6,950,618 | ) | (764,586 | ) | ||||||||||
Guggenheim MSCI Emerging Markets Equal Country Weight ETF | 13,191,141 | 584,573 | (2,546,999 | ) | (1,962,426 | ) | ||||||||||
Guggenheim S&P 500® Equal Weight Consumer Discretionary ETF | 181,091,301 | 11,826,515 | (16,937,265 | ) | (5,110,750 | ) | ||||||||||
Guggenheim S&P 500® Equal Weight Consumer Staples ETF | 508,756,725 | 39,692,416 | (17,968,549 | ) | 21,723,867 | |||||||||||
Guggenheim S&P 500® Equal Weight Energy ETF | 229,076,558 | 7,911,264 | (60,469,231 | ) | (52,557,967 | ) | ||||||||||
Guggenheim S&P 500® Equal Weight Financials ETF | 188,203,085 | 6,250,191 | (11,053,319 | ) | (4,803,128 | ) | ||||||||||
Guggenheim S&P 500® Equal Weight Health Care ETF | 587,785,246 | 18,026,979 | (35,971,361 | ) | (17,944,382 | ) | ||||||||||
Guggenheim S&P 500® Equal Weight Industrials ETF | 97,551,716 | 6,979,879 | (10,749,679 | ) | (3,769,800 | ) | ||||||||||
Guggenheim S&P 500® Equal Weight Materials ETF | 64,937,638 | 2,070,721 | (11,026,510 | ) | (8,955,789 | ) | ||||||||||
Guggenheim S&P 500® Equal Weight Real Estate ETF | 2,522,294 | 64,969 | (39,256 | ) | 25,713 | |||||||||||
Guggenheim S&P 500® Equal Weight Technology ETF | 712,275,602 | 79,199,102 | (50,910,381 | ) | 28,288,721 | |||||||||||
Guggenheim S&P 500® Equal Weight Utilities ETF | 139,666,887 | 2,319,135 | (13,913,632 | ) | (11,594,497 | ) | ||||||||||
GUGGENHEIM ETFs ANNUAL REPORT | 131 |
NOTES TO FINANCIAL STATEMENTS (continued) |
7. Investment Transactions
For the year ended October 31, 2015, the Funds had investments transactions in-kind associated with subscriptions and redemptions as follows:
Fund | Subscriptions | Redemptions | ||||||
Guggenheim Russell MidCap® Equal Weight ETF | $ | 29,582,320 | $ | 39,361,852 | ||||
Guggenheim Russell 1000® Equal Weight ETF | 20,187,747 | 40,017,790 | ||||||
Guggenheim Russell 2000® Equal Weight ETF | 22,904,243 | 15,285,868 | ||||||
Guggenheim MSCI Emerging Markets Equal Country Weight ETF | — | — | ||||||
Guggenheim S&P 500® Equal Weight Consumer Discretionary ETF | 185,032,051 | 104,916,334 | ||||||
Guggenheim S&P 500® Equal Weight Consumer Staples ETF | 404,133,375 | 84,846,083 | ||||||
Guggenheim S&P 500® Equal Weight Energy ETF | 145,824,908 | 22,423,427 | ||||||
Guggenheim S&P 500® Equal Weight Financials ETF | 172,661,812 | 121,047,442 | ||||||
Guggenheim S&P 500® Equal Weight Health Care ETF | 636,729,324 | 482,224,684 | ||||||
Guggenheim S&P 500® Equal Weight Industrials ETF | 53,933,365 | 78,647,601 | ||||||
Guggenheim S&P 500® Equal Weight Materials ETF | 49,339,367 | 61,375,528 | ||||||
Guggenheim S&P 500® Equal Weight Real Estate ETF | 2,531,139 | — | ||||||
Guggenheim S&P 500® Equal Weight Technology ETF | 467,878,099 | 434,657,550 | ||||||
Guggenheim S&P 500® Equal Weight Utilities ETF | 198,134,176 | 195,136,420 | ||||||
For the year ended October 31, 2015, the cost of purchases and proceeds from sales of investment securities, excluding government securities, short-term investments and in-kind transactions, were as follows:
Fund | Purchases | Sales | ||||||
Guggenheim Russell MidCap® Equal Weight ETF | $ | 46,886,580 | $ | 46,554,090 | ||||
Guggenheim Russell 1000® Equal Weight ETF | 25,443,283 | 25,374,743 | ||||||
Guggenheim Russell 2000® Equal Weight ETF | 21,799,711 | 21,646,854 | ||||||
Guggenheim MSCI Emerging Markets Equal Country Weight ETF | 12,576,013 | 12,405,498 | ||||||
Guggenheim S&P 500® Equal Weight Consumer Discretionary ETF | 37,685,961 | 37,324,949 | ||||||
Guggenheim S&P 500® Equal Weight Consumer Staples ETF | 46,842,305 | 44,966,377 | ||||||
Guggenheim S&P 500® Equal Weight Energy ETF | 49,949,069 | 49,710,819 | ||||||
Guggenheim S&P 500® Equal Weight Financials ETF | 23,265,539 | 23,168,764 | ||||||
Guggenheim S&P 500® Equal Weight Health Care ETF | 135,712,972 | 134,895,499 | ||||||
Guggenheim S&P 500® Equal Weight Industrials ETF | 27,139,096 | 27,280,864 | ||||||
Guggenheim S&P 500® Equal Weight Materials ETF | 19,621,556 | 19,589,526 | ||||||
Guggenheim S&P 500® Equal Weight Real Estate ETF | 112,643 | 122,979 | ||||||
Guggenheim S&P 500® Equal Weight Technology ETF | 173,213,911 | 172,859,351 | ||||||
Guggenheim S&P 500® Equal Weight Utilities ETF | 32,856,912 | 33,314,764 | ||||||
8. Legal Proceedings
Tribune Company
Rydex ETF Trust has been named as a defendant and a putative member of the proposed defendant class of shareholders in the case entitled Kirschner v. FitzSimons, No. 12-2652 (S.D.N.Y.) (formerly Official Committee of Unsecured Creditors of Tribune Co. v. FitzSimons, Adv. Pro. No. 10-54010 (Bankr. D. Del.)) (the “FitzSimons action”), as a result of ownership of shares by certain series of the Rydex ETF Trust in the Tribune Company (“Tribune”) in 2007, when Tribune effected a leveraged buyout transaction (“LBO”) by which Tribune converted to a privately-held company. In his complaint, the plaintiff has alleged that, in connection with the LBO, insiders and shareholders were overpaid for their Tribune stock using financing that the insiders knew would, and ultimately did, leave the Tribune Company insolvent. The plaintiff has asserted claims against certain insiders, major shareholders, professional advisers, and others involved in the LBO. The plaintiff is also attempting to obtain from former Tribune shareholders, including Rydex ETF Trust, the proceeds they received in connection with the LBO.
132 | GUGGENHEIM ETFs ANNUAL REPORT |
NOTES TO FINANCIAL STATEMENTS (continued) |
In June 2011, a group of Tribune creditors filed multiple actions against former Tribune shareholders involving state law constructive fraudulent conveyance claims arising out of the 2007 LBO (the “SLCFC actions”). Rydex ETF Trust has been named as a defendant in one of the SLCFC actions: Deutsche Bank Trust Co. Americas v. McGurn, No. 11-1510 (S.D.N.Y.). In those actions, the creditors seek to recover from Tribune’s former shareholders the proceeds received in connection with the 2007 LBO.
The FitzSimons action and the SLCFC actions have been consolidated with the majority of the other Tribune LBO-related lawsuits in a multidistrict litigation proceeding captioned In re Tribune Company Fraudulent Conveyance Litig., No. 11-md-2696 (S.D.N.Y.) (the “MDL Proceeding”).
On September 23, 2013, the District Court granted the defendants’ omnibus motion to dismiss the SLCFC actions, on the basis that the creditors lacked standing. On September 30, 2013, the creditors filed a notice of appeal of the September 23 order. On October 28, 2013, the defendants filed a joint notice of cross-appeal of that same order. The SLCFC appeals have been fully briefed, and oral argument in front of the U.S. Court of Appeals for the Second Circuit occurred on November 5, 2014. The Court has not yet issued a decision on the appeals.
On May 23, 2014, the defendants filed motions to dismiss the FitzSimons action, including a global motion to dismiss Count I, which is the claim brought against former Tribune shareholders for intentional fraudulent conveyance under U.S. federal law. The Court has not yet issued a decision on any of these motions.
None of these lawsuits alleges any wrongdoing on the part of Rydex ETF Trust. The following series of Rydex ETF Trust held shares of Tribune and tendered these shares as part of Tribune’s LBO: Guggenheim S&P 500 Equal Weight Consumer Discretionary Fund (the “Fund”). The value of the proceeds received by the foregoing Fund was $249,481. At this stage of the proceedings, Rydex ETF Trust is not able to make a reliable prediction as to the outcome of these lawsuits or the effect, if any, on the Fund’s net asset value.
9. Subsequent Event
At a meeting held on October 14, 2015, the Adviser recommended and the Board of the Trust approved the following changes to the following Funds:
A. | The Underlying Index for the Guggenheim Russell MidCap® Equal Weight ETF (ticker EWRM) will change from the Russell MidCap® Equal Weight Index to the S&P MidCap 400® Equal Weight Index. In connection with the change in the Fund’s Underlying Index, the Board also approved changing the Fund’s name and ticker to Guggenheim S&P MidCap 400® Equal Weight ETF (new ticker EWMC). The changes in index, Fund name and Fund ticker are expected to become effective on January 26, 2016, or such other date as deemed appropriate by the officers of the Trust. |
B. | The Underlying Index for the Guggenheim Russell 2000® Equal Weight ETF (ticker EWRS) will change from the Russell 2000® Equal Weight Index to the S&P SmallCap 600® Equal Weight Index. In connection with the change in the Fund’s Underlying Index, the Board also approved changing the Fund’s name and ticker to Guggenheim S&P SmallCap 600® Equal Weight ETF (new ticker EWSC). The changes in index, Fund name and Fund ticker are expected to become effective on January 26, 2016, or such other date as deemed appropriate by the officers of the Trust. |
C. | An Agreement and Plan of Reorganization (the “Agreement”) was unanimously approved by the Board of the Trust providing for the reorganization of the Guggenheim Russell 1000® Equal Weight ETF (the “Acquired Fund”) with and into the Guggenheim S&P 500® Equal Weight ETF (the “Surviving Fund”), each a separate series of the Trust. The Agreement provides for: (a) the transfer of the assets and stated liabilities of the Acquired Fund in exchange for shares of the Surviving Fund and cash in lieu of fractional shares of the Surviving Fund, and (b) the pro rata distribution of shares of the Surviving Fund and cash in lieu of fractional shares of the Surviving Fund by the Acquired Fund to its shareholders, in complete liquidation of the Acquired Fund (the “Reorganization”). |
GUGGENHEIM ETFs ANNUAL REPORT | 133 |
NOTES TO FINANCIAL STATEMENTS (concluded) |
The Reorganization is expected to be a tax-free transaction. Security Investors, LLC, the investment adviser to both the Acquired Fund and the Surviving Fund, has agreed to bear the costs (except for brokerage expenses incurred by the Acquired Fund prior to the Reorganization) directly related to the Reorganization.
The decision of the Board to reorganize the Acquired Fund is not subject to shareholder approval. However, an Information Statement that contains more information about the Reorganization and the Surviving Fund will be mailed to Acquired Fund shareholders. It is expected that the Reorganization will occur on or after January 26, 2016.
134 | GUGGENHEIM ETFs ANNUAL REPORT |
REPORT OF INDEPENDENT REGISTERED PUBLIC ACCOUNTING FIRM |
The Board of Trustees and Shareholders of Rydex ETF Trust:
We have audited the accompanying statements of assets and liabilities, including the schedules of investments, of Guggenheim Russell MidCap® Equal Weight ETF, Guggenheim Russell 1000® Equal Weight ETF, Guggenheim Russell 2000® Equal Weight ETF, Guggenheim MSCI Emerging Markets Equal Country Weight ETF, Guggenheim S&P 500® Equal Weight Consumer Discretionary ETF, Guggenheim S&P 500® Equal Weight Consumer Staples ETF, Guggenheim S&P 500® Equal Weight Energy ETF, Guggenheim S&P 500® Equal Weight Financials ETF, Guggenheim S&P 500® Equal Weight Health Care ETF, Guggenheim S&P 500® Equal Weight Industrials ETF, Guggenheim S&P 500® Equal Weight Materials ETF, Guggenheim S&P 500® Equal Weight Real Estate ETF, Guggenheim S&P 500® Equal Weight Technology ETF and Guggenheim S&P 500® Equal Weight Utilities ETF (fourteen of the series constituting the Rydex ETF Trust) (the “Funds”) as of October 31, 2015, and the related statements of operations, the statements of changes in net assets, and the financial highlights for each of the years or periods indicated therein. These financial statements and financial highlights are the responsibility of the Funds’ management. Our responsibility is to express an opinion on these financial statements and financial highlights based on our audits.
We conducted our audits in accordance with the standards of the Public Company Accounting Oversight Board (United States). Those standards require that we plan and perform the audit to obtain reasonable assurance about whether the financial statements and financial highlights are free of material misstatement. We were not engaged to perform an audit of the Funds’ internal control over financial reporting. Our audits included consideration of internal control over financial reporting as a basis for designing audit procedures that are appropriate in the circumstances, but not for the purpose of expressing an opinion on the effectiveness of the Funds’ internal control over financial reporting. Accordingly, we express no such opinion. An audit also includes examining, on a test basis, evidence supporting the amounts and disclosures in the financial statements and financial highlights, assessing the accounting principles used and significant estimates made by management, and evaluating the overall financial statement presentation. Our procedures included confirmation of securities owned as of October 31, 2015, by correspondence with the custodian. We believe that our audits provide a reasonable basis for our opinion.
In our opinion, the financial statements and financial highlights referred to above present fairly, in all material respects, the financial position of the above listed Funds (fourteen of the series constituting the Rydex ETF Trust) at October 31, 2015, and the results of their operations, the changes in their net assets, and their financial highlights for each of the years or periods indicated therein, in conformity with U.S. generally accepted accounting principles.

McLean, Virginia
December 23, 2015
GUGGENHEIM ETFs ANNUAL REPORT | 135 |
OTHER INFORMATION (Unaudited) |
Federal Income Tax Information
In January 2016, shareholders will be advised on IRS Form 1099 DIV or substitute 1099 DIV as to the federal tax status of the distributions received by shareholders in the calendar year 2015.
Of the ordinary income distributions paid during the year, the following funds had the corresponding percentages qualify for the dividends received deduction for corporations:
Fund | Dividend |
Guggenheim Russell MidCap® Equal Weight ETF | 100.00% |
Guggenheim Russell 1000® Equal Weight ETF | 100.00% |
Guggenheim Russell 2000® Equal Weight ETF | 82.90% |
Guggenheim MSCI Emerging Markets Equal Country Weight ETF | 10.21% |
Guggenheim S&P 500® Equal Weight Consumer Discretionary ETF | 100.00% |
Guggenheim S&P 500® Equal Weight Consumer Staples ETF | 100.00% |
Guggenheim S&P 500® Equal Weight Energy ETF | 84.48% |
Guggenheim S&P 500® Equal Weight Financials ETF | 75.48% |
Guggenheim S&P 500® Equal Weight Health Care ETF | 100.00% |
Guggenheim S&P 500® Equal Weight Industrials ETF | 100.00% |
Guggenheim S&P 500® Equal Weight Materials ETF | 100.00% |
Guggenheim S&P 500® Equal Weight Real Estate ETF | 0.00% |
Guggenheim S&P 500® Equal Weight Technology ETF | 100.00% |
Guggenheim S&P 500® Equal Weight Utilities ETF | 100.00% |
Additionally, the following amounts of taxable ordinary income dividends paid during the fiscal year qualified for the lower income tax rate available to individuals under the Jobs and Growth Tax Relief Reconciliation Act of 2003:
Fund | Qualified |
Guggenheim Russell MidCap® Equal Weight ETF | 100.00% |
Guggenheim Russell 1000® Equal Weight ETF | 100.00% |
Guggenheim Russell 2000® Equal Weight ETF | 90.60% |
Guggenheim MSCI Emerging Markets Equal Country Weight ETF | 85.87% |
Guggenheim S&P 500® Equal Weight Consumer Discretionary ETF | 100.00% |
Guggenheim S&P 500® Equal Weight Consumer Staples ETF | 100.00% |
Guggenheim S&P 500® Equal Weight Energy ETF | 100.00% |
Guggenheim S&P 500® Equal Weight Financials ETF | 83.06% |
Guggenheim S&P 500® Equal Weight Health Care ETF | 100.00% |
Guggenheim S&P 500® Equal Weight Industrials ETF | 100.00% |
Guggenheim S&P 500® Equal Weight Materials ETF | 100.00% |
Guggenheim S&P 500® Equal Weight Real Estate ETF | 0.00% |
Guggenheim S&P 500® Equal Weight Technology ETF | 100.00% |
Guggenheim S&P 500® Equal Weight Utilities ETF | 100.00% |
For the fiscal year ending October 31, 2015, Guggenheim MSCI Emerging Markets Equal Country Weight ETF earned gross income derived from foreign sources totaling $369,061. The Guggenheim MSCI Emerging Markets Equal Country Weight ETF paid foreign taxes totaling $45,635 for the fiscal year and may pass these taxes through to shareholders, who may be able to claim them as a foreign tax credit.
With respect to the taxable year ended October 31, 2015, the Guggenheim S&P 500® Equal Weight Health Care ETF hereby designates as capital gain dividends $2,784,957 using proceeds from shareholder redemptions, or, if subsequently determined to be different, the net capital gain of such year.
136 | GUGGENHEIM ETFs ANNUAL REPORT |
OTHER INFORMATION (Unaudited)(continued) |
Proxy Voting Information
A description of the policies and procedures that the Trust uses to determine how to vote proxies relating to securities held in the Funds’ portfolios is available, without charge and upon request, by calling 800.820.0888. This information is also available from the EDGAR database on the SEC’s website at http://www.sec.gov.
Information regarding how the Funds voted proxies relating to portfolio securities during the most recent 12-month period ended June 30 is available without charge, upon request, by calling 800.820.0888. This information is also available from the EDGAR database on the SEC’s website at http://www.sec.gov.
Sector Classification
Information in the “Schedule of Investments” is categorized by sectors using sector-level Classifications defined by the Bloomberg Industry Classification System, a widely recognized industry classification system provider. Each Fund’s registration statement has investment policies relating to concentration in specific sectors/industries. For purposes of these investment policies, the Funds usually classify sectors/industries based on industry-level Classifications used by widely recognized industry classification system providers such as Bloomberg Industry Classification System, Global Industry Classification Standards and Barclays Global Classification Scheme.
Quarterly Portfolio Schedules Information
The Trust files its complete schedule of portfolio holdings with the SEC for the first and third quarters of each fiscal year on Form N-Q; which are available on the SEC’s website at http://www.sec.gov. The Funds’ Forms N-Q may be reviewed and copied at the SEC’s Public Reference Room in Washington, DC, and that information on the operation of the Public Reference Room may be obtained by calling 800-SEC-0330. Copies of the portfolio holdings are also available to shareholders, without charge and upon request, by calling 800.820.0888.
Board Considerations in Approving the Continuation of the Investment Advisory Agreement
The Board, including the Independent Trustees, attended an in-person meeting held on May 18, 2015, called for the purpose of, among other things, the consideration of, and voting on, the approval and continuation of the investment advisory agreement (the “Investment Advisory Agreement”) between the Trust and the Advisor applicable to each series of the Trust except for the S&P 500® Equal Weight Real Estate ETF (each, a “Fund” and, collectively, the “Funds”). The Board unanimously approved the continuation of the Investment Advisory Agreement for an additional one-year period based on the Board’s review of qualitative and quantitative information provided by the Advisor. The Board had previously considered information pertaining to the renewal of the Investment Advisory Agreement at an in-person meeting held on April 28, 2015 (together, with the May 18 meeting, the “Meetings”).
Prior to reaching the conclusion to approve the continuation of the Investment Advisory Agreement, the Independent Trustees requested and obtained from the Advisor such information as the Independent Trustees deemed reasonably necessary to evaluate the Investment Advisory Agreement. In addition, the Board received a memorandum from fund counsel regarding the responsibilities of the Board with respect to the approval of investment advisory agreements and participated in question and answer sessions with representatives of the Advisor. The Trustees also carefully considered information that they had received throughout the year as part of their regular oversight of the Funds. At the Meetings, the Board obtained and reviewed a wide variety of information, including certain comparative information regarding the Funds’ fees, expenses, and performance relative to the fees, expenses, and performance of other comparable funds (the “FUSE reports”). The Independent Trustees carefully evaluated this information, met in executive session outside the presence of fund management, and were advised by independent legal counsel with respect to their deliberations.
At the Meetings, the Board, including the Independent Trustees, evaluated a number of factors, including among others: (a) the nature, extent and quality of the Advisor’s investment advisory and other services; (b) the Advisor’s investment management personnel; (c) the Advisor’s operations and financial condition; (d) the Advisor’s brokerage practices (including any soft dollar arrangements) and the variety and complexity of its investment strategies; (e) a comparison of the Funds’ advisory fees to the advisory fees charged to comparable funds or accounts, giving special attention to the existence of economies of scale and the absence of breakpoints in these fees and the Advisor’s rationale for not providing for breakpoints at this point in time; (f) each Fund’s overall fees and operating expenses compared with those of similar
GUGGENHEIM ETFs ANNUAL REPORT | 137 |
OTHER INFORMATION (Unaudited)(continued) |
funds; (g) the level of the Advisor’s profitability from its Fund-related operations; (h) the Advisor’s compliance processes and systems; (i) the Advisor’s compliance policies and procedures; (j) the Advisor’s reputation, expertise and resources in the financial markets; and (k) Fund performance compared with that of similar funds and/or appropriate benchmarks. In its deliberations, the Trustees did not identify any single piece of information that was all-important or controlling, noting that each Trustee could attribute different weights to the various factors considered.
Based on the Board’s deliberations at the Meetings, the Board, including all of the Independent Trustees, unanimously: (a) concluded that the terms of the Investment Advisory Agreement are fair and reasonable; (b) concluded that the Advisor’s fees are reasonable in light of the services that it provides to the Funds; and (c) agreed to approve and continue the Investment Advisory Agreement based upon the following considerations, among others:
● | Nature, Extent and Quality of Services Provided by the Advisor. The Board evaluated, among other things, the Advisor’s business, financial resources, quality and quantity of personnel, experience, past performance, the variety and complexity of its investment strategies, brokerage practices, and the adequacy of its compliance systems and processes. The Board reviewed the scope of services to be provided by the Advisor under the Investment Advisory Agreement and noted that there would be no significant differences between the scope of services required to be provided by the Advisor for the past year and the scope of services required to be provided during the upcoming year. The Board also considered the Advisor’s representations to the Board that the Advisor would continue to provide investment and related services that were of materially the same quality and quantity as services provided to the Funds in the past, and whether these services are appropriate in scope and extent in light of the Funds’ operations, the competitive landscape of the investment company business and investor needs. Based on the foregoing, the Trustees determined that the approval of the Investment Advisory Agreement would enable shareholders of the Funds to receive high quality services at a cost that was appropriate and reasonable. |
● | Fund Expenses and Performance of the Funds and the Advisor. The Board reviewed statistical information provided by the Advisor regarding the expense ratio components and performance of each Fund. The Advisor engaged FUSE Research Network LLC (“FUSE”), an independent, third party research provider, to prepare reports to help the Board compare the Funds’ fees, expenses, and total return performance with those of a peer group and peer universe of funds selected by FUSE. In the reports, each Fund’s expense ratio components, including actual advisory fees, waivers/reimbursements, and gross and net total expenses, are compared to those of other funds with shared key characteristics (e.g., asset size, fee structure, sector or industry investment focus) determined by FUSE to comprise a Fund’s applicable peer group. The Board also considered the Advisor’s representation that it found the peer groups compiled by FUSE to be appropriate. The statistical information related to the performance of each Fund included three month and one-, three-, and five-year performance for the Fund compared to that of its peers. Based on the foregoing, the Board determined that the proposed advisory fees paid by the Funds are reasonable in relation to the nature and quality of the services provided by the Advisor. |
● | Costs of Services Provided to the Funds and Profits Realized by the Advisor and its Affiliates. The Board reviewed information about the profitability of the Funds to the Advisor based on the advisory fees payable under the current Investment Advisory Agreement for the last calendar year. The Board noted that the Advisor had contractually agreed to pay all operating expenses of the Funds, including the cost of index licensing fees, transfer agency, custody, fund administration, legal, audit and other services, except interest, taxes, brokerage commissions and other expenses connected with the execution of portfolio transactions, distribution fees, and extraordinary expenses. The Board also analyzed the Funds’ expenses, including the investment advisory fees paid to the Advisor, and reviewed the FUSE reports. The Board also reviewed information regarding the direct revenue received by the Advisor and ancillary revenue, if any, received by the Advisor and/or its affiliates in connection with the services provided to the Funds by the Advisor and/or its affiliates. The Board considered information regarding the Advisor’s profit margin as reflected in the Advisor’s profitability analysis, as well as information provided by the Advisor concerning the methodology used to allocate various expenses among the individual Funds in determining the Advisor’s profitability. Based on the foregoing, the Board determined that the profit to the Advisor on the fees paid by the Funds is not excessive in view of the nature and quality of the services provided by the Advisor. |
138 | GUGGENHEIM ETFs ANNUAL REPORT |
OTHER INFORMATION (Unaudited)(continued) |
● | Economies of Scale. The Board considered the absence of breakpoints in the Advisor’s fee schedule and reviewed information regarding the extent to which economies of scale or other efficiencies may result from increases in the Funds’ asset levels. The Board noted that the Investment Advisory Agreement did not provide for breakpoints in each Fund’s advisory fee rates as assets of a Fund increase. However, the Board further noted the Advisor’s assertion that future economies of scale had been taken into consideration by fixing relatively low advisory fees for the Funds, effectively sharing the benefits of lower fees with the Funds from inception. The Board noted that it intends to continue to monitor fees as each Fund grows in size and assess whether fee breakpoints may be warranted. |
● | Other Benefits to the Advisor and/or its Affiliates. In addition to evaluating the Advisor’s services, the Board considered the nature and amount of other benefits to be received by the Advisor and its affiliates as a result of their relationship with the Fund, including any soft dollar usage by the Advisor and any intangible benefits. In particular, the Board considered the nature, extent, quality, and cost of certain distribution services performed by the Advisor’s affiliate under the distribution agreement and the Distribution Plan pursuant to Rule 12b-1 of the 1940 Act. In light of the costs of providing services pursuant to the separate agreements as well as the Advisor’s and its affiliates’ commitment to the Funds, the Board concluded the ancillary benefits the Advisor and its affiliates received were reasonable. |
On the basis of the information provided to it and its evaluation of that information, the Board, including the Independent Trustees, concluded that the terms of the Investment Advisory Agreement were reasonable, and that approval of the continuation of the Investment Advisory Agreement was in the best interests of the Funds and their shareholders.
Board Considerations in Approving the Investment Advisory Agreement for the S&P 500® Equal Weight Real Estate ETF
The Board of Trustees (the “Board”) of Rydex ETF Trust (the “Trust”), including the Trustees who are not “interested persons,” as defined by the Investment Company Act of 1940, of the Trust (“Independent Trustees”), attended an in-person meeting held on May 18, 2015 (the “May Meeting”), called for the purpose of, among other things, the consideration of, and voting on, the approval of the investment advisory agreement (the “EWRE Investment Advisory Agreement”) between the Trust and Security Investors, LLC (the “Advisor”) applicable to the S&P 500® Equal Weight Real Estate ETF, a new series of the Trust (the “EWRE Fund”). The Board unanimously approved the EWRE Investment Advisory Agreement based on the Board’s review of qualitative and quantitative information provided by the Advisor.
Prior to reaching the conclusion to approve the EWRE Investment Advisory Agreement, the Independent Trustees requested and obtained from the Advisor such information as the Independent Trustees deemed reasonably necessary to evaluate the EWRE Investment Advisory Agreement. In addition, the Board received a memorandum from fund counsel regarding the responsibilities of the Board with respect to the approval of investment advisory agreements and participated in question and answer sessions with representatives of the Advisor. The Trustees also carefully considered information that they had received about the Advisor throughout the year as part of their regular oversight of the other series of the Trust. At the May Meeting, the Board obtained and reviewed a wide variety of information, including certain comparative information regarding the EWRE Fund’s proposed fees and expenses relative to the fees and expenses of other comparable funds (the “FUSE reports”). The Independent Trustees carefully evaluated this information, met in executive session outside the presence of fund management, and were advised by independent legal counsel with respect to their deliberations.
At the May Meeting, the Board, including the Independent Trustees, evaluated a number of factors, including among others: (a) the nature, extent and quality of the investment advisory and other services to be provided by the Advisor; (b) the Advisor’s investment management personnel; (c) the Advisor’s operations and financial condition; (d) the expected benefits (such as soft dollars) to the Advisor and its affiliates from their relationship with the EWRE Fund; (e) a comparison of the Fund’s projected advisory fees to the advisory fees charged to comparable funds or accounts, giving special attention to the absence of breakpoints in these fees and the Advisor’s rationale for not providing for breakpoints at this point in time; (f) the EWRE Fund’s expected overall fees and operating expenses compared with those of similar funds; (g) the Advisor’s compliance processes and systems; (h) the Advisor’s compliance policies and procedures; and (i) the Advisor’s reputation, expertise and resources in the financial markets. In its deliberations, the Trustees did not identify any single piece of information that was all-important or controlling, noting that each Trustee could attribute different weights to the various factors considered.
GUGGENHEIM ETFs ANNUAL REPORT | 139 |
OTHER INFORMATION (Unaudited)(concluded) |
Based on the Board’s deliberations at the May Meeting, the Board, including all of the Independent Trustees, unanimously: (a) concluded that the terms of the EWRE Investment Advisory Agreement are fair and reasonable; (b) concluded that the Advisor’s fees are reasonable in light of the services that it will provide to the EWRE Fund; and (c) agreed to approve the EWRE Investment Advisory Agreement based upon the following considerations, among others:
● | Nature, Extent and Quality of Services Provided by the Advisor. The Board reviewed the scope of services to be provided by the Advisor under the EWRE Investment Advisory Agreement and determined that the Advisor was capable of providing high quality advisory services to the EWRE Fund, as indicated by the nature and quality of services provided by the Advisor in the past, the firm’s management capabilities, the professional qualifications and experience of its portfolio managers, and its investment and management oversight processes. Based on the foregoing, the Trustees determined that the approval of the EWRE Investment Advisory Agreement would enable shareholders of the Fund to receive high quality services at a cost that was appropriate and reasonable. |
● | Fund Expenses and Performance of the EWRE Fund and the Advisor. As the EWRE Fund had not yet commenced operations, the Board was not able to review the EWRE Fund’s performance. However, the Board considered the Advisor’s track record of successfully managing funds that seek to track the performance of a benchmark and determined that the Advisor would have the capabilities, resources, and personnel necessary to provide the EWRE Fund with a reasonable potential for positive performance.. The Board also reviewed statistical information provided by the Advisor regarding the EWRE Fund’s proposed expense ratio components. The Advisor engaged FUSE Research Network LLC (“FUSE”), an independent, third party research provider, to prepare a report to help the Board compare the EWRE Fund’s fees and expenses to those of comparable funds in the EWRE Fund’s peer group, and the broader peer universe, as determined by FUSE. In the report, the EWRE Fund’s proposed expense ratio components, including advisory fees, waivers/reimbursements, and gross and net total expenses, are compared to those of other funds with shared key characteristics (e.g., asset size, fee structure, sector or industry investment focus) determined by FUSE to comprise the EWRE Fund’s applicable peer group. The Board also considered the Advisor’s representation that it found the peer groups compiled by FUSE to be appropriate. Based on the foregoing, the Board determined that the proposed advisory fee to be paid by the EWRE Fund is reasonable in relation to the nature and quality of the services to be provided by the Advisor. |
● | Costs of Services Provided to the EWRE Fund and Profits Realized by the Advisor and its Affiliates. The Board noted that the Advisor had contractually agreed to pay all operating expenses of the Fund, including the cost of index licensing fees, transfer agency, custody, fund administration, legal, audit and other services, except interest, taxes, brokerage commissions and other expenses connected with the execution of portfolio transactions, distribution fees, and extraordinary expenses. With respect to the cost of advisory services provided and the Advisor’s profitability, the Board concluded that it was too early to predict the profitability of the EWRE Fund to the Advisor, but noted that they would monitor the Advisor’s profitability with respect to the EWRE Fund after the EWRE Fund commenced operations. |
● | Economies of Scale. The Board noted that because the EWRE Fund had not yet commenced operations, there were as of now, no economies of scale to share with shareholders. The Board noted that it intends to continue monitoring the existence of economies of scale as the EWRE Fund grows in size. |
● | Other Benefits to the Advisor and/or its Affiliates. In addition to evaluating the Advisor’s services, the Board considered the nature and amount of other benefits to be received by the Advisor and its affiliates as a result of their relationship with the EWRE Fund, including any soft dollar usage by the Advisor and any intangible benefits. In particular, the Board considered the nature, extent, quality, and cost of certain distribution services to be performed by the Advisor’s affiliate and the fees to be paid to the Advisor’s affiliates for those services under the distribution agreement and the Distribution Plan pursuant to Rule 12b-1 of the 1940 Act. In light of the costs of providing services pursuant to the separate agreements as well as the Advisor’s and its affiliates’ commitment to the EWRE Fund, the Board concluded the ancillary benefits the Advisor and its affiliates received were reasonable. |
On the basis of the information provided to it and its evaluation of that information, the Board, including the Independent Trustees, concluded that the terms of the EWRE Investment Advisory Agreement were reasonable, and that approval of the EWRE Investment Advisory Agreement was in the best interests of the EWRE Fund and its shareholders.
140 | GUGGENHEIM ETFs ANNUAL REPORT |
INFORMATION ON BOARD OF TRUSTEES AND OFFICERS (Unaudited) |
A Board of Trustees oversees the Trust, as well as other trusts of GI, in which its members have no stated term of service, and continue to serve after election until resignation. The Statement of Additional Information includes further information about Fund Trustees and Officers, and can be obtained without charge by visiting guggenheiminvestments.com or by calling 800.820.0888.
Name, Address* | Position(s) Held with the | Principal Occupation(s) | Number of | Other |
INTERESTED TRUSTEE | ||||
Donald C. Cacciapaglia** (1951) | Trustee from 2012 to present. | Current: President and CEO, certain other funds in the Fund Complex (2012-present); Vice Chairman, Guggenheim Investments (2010-present).
Former: Chairman and CEO, Channel Capital Group, Inc. (2002-2010). | 224 | Clear Spring Life Insurance Company (2015-present); Guggenheim Partners Japan, Ltd. (2014-present); Delaware Life (2013-present); Guggenheim Life and Annuity Company (2011-present); Paragon Life Insurance Company of Indiana (2011-present). |
INDEPENDENT TRUSTEES | ||||
Corey A. Colehour (1945) | Trustee and Member of the Audit Committee from 2003 to present; Member of the Governance and Nominating Committees from 2005 to present; and Member of the Investment and Performance Committee from 2014 to present. | Retired. | 133 | None. |
J. Kenneth Dalton (1941) | Trustee from 2003 to present; Chairman and Member of the Audit Committee from 2003 to present; Member of the Governance and Nominating Committees from 2005 to present; and Member of the Complinace and Risk Oversight Committee from 2010 to present. | Retired. | 133 | Epiphany Funds (4) (2009-present). |
John O. Demaret (1940) | Vice Chairman of the Board of Trustees from 2014 to present; Trustee and Member of the Audit Committee from 2003 to present; Chairman of the Board from 2006 to 2014; Member of the Compliance and Risk Oversight Committee from 2010 to present; Chairman and Member of the Investment and Performance Committee from 2014 to present; and Member of the Nominating Committee from 2014 to present. | Retired. | 133 | None. |
GUGGENHEIM ETFs ANNUAL REPORT | 141 |
INFORMATION ON BOARD OF TRUSTEES AND OFFICERS (Unaudited)(continued) |
Name, Address* | Position(s) Held with the | Principal Occupation(s) | Number of | Other |
INDEPENDENT TRUSTEES - concluded | ||||
Werner E. Keller (1940) | Chairman of the Board from 2014 to present; Trustee and Member of the Audit, Governance and Nominating Committees from 2005 to present; Chairman and Member of the Compliance and Risk Oversight Committee from 2010 to present; and Member of the Investment and Performance Committee from 2014 to present. | Current: Founder and President, Keller Partners, LLC (investment research firm) (2005-present). | 133 | None. |
Thomas F. Lydon, Jr. (1960) | Trustee and Member of the Audit, Governance and Nominating Committees from 2005 to present. | Current: President, Global Trends Investments (registered investment adviser) (1996-present). | 133 | US Global Investors (GROW) (1995-present). |
Patrick T. McCarville (1942) | Trustee and Member of the Audit Committee from 2003 to present; Chairman and Member of the Governance and Nominating Committees from 2005 to present. | Retired.
Former: Chief Executive Officer, Par Industries, Inc., d/b/a Par Leasing (1977-2010). | 133 | None. |
Name, Address* | Position(s) Held with the | Principal Occupation(s) |
OFFICERS | ||
Donald C. Cacciapaglia (1951) | President (2012-present). | Current: President and CEO, certain other funds in the Fund Complex (2012-present); Vice Chairman, Guggenheim Investments (2010-present).
Former: Chairman and CEO, Channel Capital Group Inc. (2002-2010). |
Michael P. Byrum (1970) | Vice President (1999-present). | Current: Senior Vice President, Security Investors, LLC (2010-present); President and Chief Investment Officer, Rydex Holdings, LLC (2008-present); Director and Chairman, Advisory Research Center, Inc. (2006-present); Manager, Guggenheim Specialized Products, LLC (2005-present).
Former: Vice President, Guggenheim Distributors, LLC (2009); Director (2009-2010) and Secretary (2002-2010), Rydex Fund Services, LLC; Director (2008-2010), Chief Investment Officer (2006-2010), President (2004-2010) and Secretary (2002-2010), Rydex Advisors, LLC; Director (2008-2010), Chief Investment Officer (2006-2010), President (2004-2010) and Secretary (2002-2010), Rydex Advisors II, LLC. |
142 | GUGGENHEIM ETFs ANNUAL REPORT |
INFORMATION ON BOARD OF TRUSTEES AND OFFICERS (Unaudited)(concluded) |
Name, Address* | Position(s) Held with the | Principal Occupation(s) |
OFFICERS - concluded | ||
Nikolaos Bonos (1963) | Vice President and Treasurer (2003-present). | Current: Senior Vice President, Security Investors, LLC (2010-present); Chief Executive Officer, Guggenheim Specialized Products, LLC (2009-present); Chief Executive Officer & President, Rydex Fund Services, LLC (2009-present); Vice President, Rydex Holdings, LLC (2008-present).
Former: Senior Vice President, Security Global Investors, LLC (2010-2011); and Senior Vice President, Rydex Advisors, LLC and Rydex Advisors II, LLC (2006-2011). |
Elisabeth Miller (1968) | Chief Compliance Officer (2012-present). | Current: CCO, certain other funds in the Fund Complex (2012-present); CCO, Security Investors, LLC (2012-present); CCO, Guggenheim Funds Investment Advisors, LLC (2012-present); Managing Director, Guggenheim Investments (2012-present); Vice President, Guggenheim Funds Distributors, LLC (March 2014-present).
Former: CCO, Guggenheim Distributors, LLC (2009-March 2014); Senior Manager, Security Investors, LLC (2004-2009); Senior Manager, Guggenheim Distributors, LLC (2004-2009). |
Joseph M. Arruda (1966) | Assistant Treasurer (2006-present). | Current: Assistant Treasurer, certain other funds in the Fund Complex (2006-present); Vice President, Security Investors, LLC (2010-present); CFO and Manager, Guggenheim Specialized Products, LLC (2009-present).
Former: Vice President, Security Global Investors, LLC (2010-2011); Vice President, Rydex Advisors, LLC (2010); Vice President, Rydex Advisors II, LLC (2010). |
Paul J. Davio (1972) | Assistant Treasurer (2014-present). | Current: Assistant Treasurer, certain other funds in the Fund Complex (2014-present); Director, Guggenheim Investments (2006-present).
Former: Manager, Mutual Fund Administration, Guggenheim Investments (2003-2006). |
Amy J. Lee (1961) | Vice President (2009-present) and Secretary (2012-present). | Current: Chief Legal Officer, certain other funds in the Fund Complex (2013-present); Senior Managing Director, Guggenheim Investments (2012-present).
Former: Vice President, Associate General Counsel and Assistant Secretary, Security Benefit Life Insurance Company and Security Benefit Corporation (2004-2012). |
* | All Trustees and Officers may be reached c/o Guggenheim Investments, 805 King Farm Boulevard, Suite 600, Rockville, MD 20850. |
** | Mr. Cacciapaglia is an “interested” person of the Trust, as that term is defined in the 1940 Act by virtue of his affiliation with the Adviser’s parent company. |
*** | The “Fund Complex” includes all closed-end and open-end funds (including all of their portfolios) advised by the Adviser and any funds that have an investment adviser or servicing agent that is an affiliated person of the Adviser. Information provided is as of the date of this report. |
GUGGENHEIM ETFs ANNUAL REPORT | 143 |
GUGGENHEIM INVESTMENTS PRIVACY POLICIES (Unaudited) |
Rydex Funds, Guggenheim Funds, Rydex Investments, Guggenheim Funds Distributors, LLC, Security Investors, LLC, Security Distributors, Inc., Guggenheim Partners Investment Managers, LLC, and Rydex Advisory Services (Collectively “Guggenheim Investments”).
Our Commitment to You
When you become a Guggenheim Investments investor, you entrust us with not only your hard-earned money but also with personal and financial information about you. We recognize that your relationship with us is based on trust and that you expect us to act responsibly and in your best interests. Because we have access to this private information about you, we hold ourselves to the highest standards in its safekeeping and use. This means, most importantly, that we do not sell client information to anyone—whether it is your personal information or if you are a current or former Guggenheim Investments client.
The Information We Collect About You
In the course of doing business with shareholders and investors, we collect nonpublic personal information about you. You typically provide personal information when you complete a Guggenheim Investments account application or when you request a transaction that involves Rydex and Guggenheim Investments funds or one of the Guggenheim Investments affiliated companies. “Nonpublic personal information” is personally identifiable private information about you. For example, it includes information regarding your name and address, Social Security or taxpayer identification number, assets, income, account balance, bank account information and investment activity (e.g., purchase and redemption history).
How We Handle Your Personal Information
As emphasized above, we do not sell information about current or former clients or their accounts to third parties. Nor do we share such information, except when necessary to complete transactions at your request or to make you aware of related investment products and services that we offer. Additional details about how we handle your personal information are provided below. To complete certain transactions or account changes that you direct, it may be necessary to provide identifying information to companies, individuals or groups that are not affiliated with Guggenheim Investments. For example, if you ask to transfer assets from another financial institution to Guggenheim Investments, we will need to provide certain information about you to that company to complete the transaction. To alert you to other Guggenheim Investments investment products and services, we may share your information within the Guggenheim Investments family of affiliated companies. This would include, for example, sharing your information within Guggenheim Investments so we can make you aware of new Rydex and Guggenheim Investments funds or the services offered through another Guggenheim Investments affiliated company. In certain instances, we may contract with nonaffiliated companies to perform services for us. Where necessary, we will disclose information we have about you to these third parties. In all such cases, we provide the third party with only the information necessary to carry out its assigned responsibilities and only for that purpose. And we require these third parties to treat your private information with the same high degree of confidentiality that we do. In certain instances, we may share information with other financial institutions regarding individuals and entities in response to the U.S.A. Patriot Act. Finally, we will release information about you if you direct us to do so, if we are compelled by law to do so or in other circumstances permitted by law.
Opt Out Provisions
We do not sell your personal information to anyone. The law allows you to “opt out” of only certain kinds of information sharing with third parties. The firm does not share personal information about you with any third parties that triggers this opt-out right. This means YOU ARE ALREADY OPTED OUT.
144 | GUGGENHEIM ETFs ANNUAL REPORT |
GUGGENHEIM INVESTMENTS PRIVACY POLICIES (Unaudited)(concluded) |
How We Protect Privacy Online
Our concern for the privacy of our shareholders also extends to those who use our web site, guggenheiminvestments.com. Our web site uses some of the most secure forms of online communication available, including encryption technology, Secure Socket Layer (SSL) protocol, firewalls and user names and passwords. These technologies provide a high level of security and privacy when you access your account information or initiate online transactions. The Guggenheim Investments web site offers customized features that require our use of “http cookies”—tiny pieces of information that we ask your browser to store. However, we make very limited use of these cookies. We only use cookies for session management and security features on the Guggenheim Investments web site. We do not use them to pull data from your hard drive, to learn your email address, or to view data in cookies created by other web sites. We will not share the information in our cookies or give others access to it. See the legal information area on our web site for more details about web site security and privacy features.
How We Safeguard Your Personal Information
We restrict access to nonpublic personal information about shareholders to our employees and in some cases to third parties (for example, the service providers described above) as permitted by law. We maintain strict physical, electronic and procedural safeguards that comply with federal standards to guard your nonpublic personal information.
We’ll Keep You Informed
As required by federal law, we will notify shareholders of our privacy policy annually. We reserve the right to modify this policy at any time, but rest assured that if we do change it, we will tell you promptly. You will also be able to access our privacy policy from our web site at guggenheiminvestments.com. Should you have any questions regarding our privacy policy, contact us at 800.820.0888 or 301.296.5100.
GUGGENHEIM ETFs ANNUAL REPORT | 145 |
This page intentionally left blank.
This page intentionally left blank.
This page intentionally left blank.
This page intentionally left blank.
 |
10.31.2015
Guggenheim ETFs Annual Report
| |||
XLG | Guggenheim Russell Top 50® Mega Cap ETF | ||
RPV | Guggenheim S&P 500® Pure Value ETF | ||
RPG | Guggenheim S&P 500® Pure Growth ETF | ||
RFV | Guggenheim S&P MidCap 400® Pure Value ETF | ||
RFG | Guggenheim S&P MidCap 400® Pure Growth ETF | ||
RZV | Guggenheim S&P SmallCap 600® Pure Value ETF | ||
RZG | Guggenheim S&P SmallCap 600® Pure Growth ETF | ||
ETF2-ANN-1015x1016 | guggenheiminvestments.com |
TABLE OF CONTENTS |
DEAR SHAREHOLDER | 2 |
ECONOMIC AND MARKET OVERVIEW | 3 |
FEES AND EXPENSES | 5 |
MANAGER'S ANALYSIS | 7 |
PORTFOLIO SUMMARY | 8 |
SCHEDULES OF INVESTMENTS | 21 |
STATEMENTS OF ASSETS AND LIABILITIES | 35 |
STATEMENTS OF OPERATIONS | 37 |
STATEMENTS OF CHANGES IN NET ASSETS | 39 |
FINANCIAL HIGHLIGHTS | 43 |
NOTES TO FINANCIAL STATEMENTS | 50 |
REPORT OF INDEPENDENT REGISTERED PUBLIC ACCOUNTING FIRM | 58 |
OTHER INFORMATION | 59 |
INFORMATION ON BOARD OF TRUSTEES AND OFFICERS | 62 |
GUGGENHEIM INVESTMENTS PRIVACY POLICIES | 65 |
GUGGENHEIM ETFs ANNUAL REPORT | 1 |
October 31, 2015 |
Dear Shareholder:
Security Investors, LLC (the “Investment Adviser”) is pleased to present the annual shareholder report for a selection of our exchange-traded funds (“ETFs”) for the 12-month period ended October 31, 2015.
The Investment Adviser is part of Guggenheim Investments, which represents the investment management businesses of Guggenheim Partners, LLC (“Guggenheim”), a global, diversified financial services firm.
Guggenheim Funds Distributors, LLC is the distributor of the Funds. Guggenheim Funds Distributors, LLC is affiliated with Guggenheim and the Investment Adviser.
We encourage you to read the Economic and Market Overview, which follows this letter, followed by the Manager’s Analysis for each ETF.
Sincerely,
Donald C. Cacciapaglia
President
November 30, 2015
Read a prospectus and summary prospectus (if available) carefully before investing. It contains the investment objectives, risks, charges, expenses, and other information, which should be considered carefully before investing. Obtain a prospectus and summary prospectus (if available) at guggenheiminvestments.com or call 800.820.0888.
The Russell Top 50® ETF may not be suitable for all investors. ● The Fund is subject to the risk that unanticipated early closings of securities exchanges and other financial markets may result in the Fund’s inability to buy or sell securities or other financial instruments on that day. ● In certain circumstances, it may be difficult for the Fund to purchase and sell particular investments within a reasonable time at a fair price. ● Investments in securities and derivatives, in general, are subject to market risks that may cause their prices to fluctuate over time. An investment in the Fund may lose money. ● Unlike many investment companies, the Fund is not actively “managed.” This means that, based on market and economic conditions, the Fund’s performance could be lower than other types of mutual funds that may actively shift their portfolio assets to take advantage of market opportunities or to lessen the impact of a market decline. ● Tracking error risk refers to the risk that the Advisor may not be able to cause the Fund’s performance to match or correlate to that of the Fund’s Underlying Index, either on a daily or aggregate basis. Tracking error risk may cause the Fund’s performance to be less than you expect. ● Shares may trade below their net asset value (“NAV”). The NAV of shares will fluctuate with changes in the market value of the Fund’s holdings. In addition, although the Fund’s shares are currently listed on NYSE Arca, Inc. (the “Exchange”), there can be no assurance that an active trading market for shares will develop or be maintained. ● The Fund is subject to the risk that large-capitalization stocks may underperform other segments of the equity market or the equity market as a whole. ● Please read the prospectus for more detailed information regarding these and other risks.
Pure style ETFs may not be suitable for all investors. The ETFs are subject to the risk that large-, medium-, and small-capitalization stocks may under-perform other segments of the equity market or the equity market as a whole ● Value stocks are subject to the risk that the intrinsic value of the stock may never be realized by the market or that the price goes down. Growth stocks typically invest a high portion of their earnings back into their business and may lack the dividend yield that could cushion their decline in a market downturn. Growth stocks may be more volatile than other stocks because they are more sensitive to investor perceptions regarding the growth potential of the issuing company. ● The Funds are subject to the risk that unanticipated early closings of securities exchanges and other financial markets may result in the Fund's inability to buy or sell securities or other financial instruments on that day. ● In certain circumstances, it may be difficult for the Funds to purchase and sell particular investments within a reasonable time at a fair price. ● Investments in securities, in general, are subject to market risks that may cause their prices to fluctuate over time. An investment in the Funds may lose money. ● Unlike many investment companies, the Funds are not actively "managed." This means that based on market and economic conditions, the Funds’ performance could be lower than other types of funds that may actively shift their portfolio assets to take advantage of market opportunities or to lessen the impact of a market decline. ● Tracking error risk refers to the risk that the Advisor may not be able to cause the Funds’ performance to match or correlate to that of the Funds’ Underlying Index, either on a daily or aggregate basis. Tracking error risk may cause the Funds’ performance to be less than you expect. ● Shares may trade below their net asset value ("NAV"). The NAV of shares will fluctuate with changes in the market value of the Funds’ holdings. In addition, although the Funds’ shares are currently listed on NYSE Arca, Inc. (the "Exchange"), there can be no assurance that an active trading market for shares will develop or be maintained. ● Each Fund is considered nondiversified and can invest a greater portion of its assets in securities of individual issuers than a diversified Fund. As a result, changes in the market value of a single security could cause greater fluctuations in the value of fund shares than would occur in a more diversified Fund. ● Please read the prospectus for more detailed information regarding these and other risks.
2 | GUGGENHEIM ETFs ANNUAL REPORT |
ECONOMIC AND MARKET OVERVIEW (Unaudited) | October 31, 2015 |
At the end of the period, the U.S. economic expansion was continuing to mature, but remained strong. Central banks’ aversion to any downturn should support the rebound in risk assets that began after the market correction in the third quarter.
The U.S. Federal Open Market Committee’s resolution to remain on hold at its September meeting, due to volatility emanating from China, confirmed that global macroeconomic issues and market volatility can play a significant role in determining when policy tightening finally commences. Any bad news or setback in the global economy is likely to be met with a policy decision that will be supportive for credit and equity markets.
In Europe, European Central Bank (ECB) President Mario Draghi hinted strongly that additional monetary policy easing is on the way, as inflation remains well below the ECB’s 2% target and the growth outlook remains uncertain. In Japan, the central bank revised down inflation and growth forecasts, and signaled a willingness to expand its quantitative easing program further.
In the U.S., a decision to raise rates will be data dependent. Given the October employment report, December liftoff appears likely, unless there is some catastrophic event before then. A December hike should be taken as a sign that the U.S. Federal Reserve is sufficiently comfortable with the strength of the economy and the near-term outlook, which should be good news for investors.
As for the fundamentals of the U.S. economy, the data look encouraging. Underlying real GDP growth was actually stronger than the 1.5% preliminary estimate for the third quarter would suggest. This is because the U.S. was due for an inventory correction, and declining inventory investment shaved 1.4 percentage points off the headline growth figure. Consumer spending, which accounts for about two-thirds of U.S. demand, rose by 3.2%, indicating that consumer spending is strong heading into the holiday shopping season. Robust equity returns in October—the largest monthly gains in four years—also bode well for Christmas sales.
It would be premature to pop the champagne just yet. Slowing emerging market growth continues to weigh upon economic growth around the world, particularly in Europe. Meanwhile, the measure of New York Stock Exchange market breadth has failed to make new highs, or at least return to old highs, which would confirm sustainability of the equity market rally occurring at period end. This is okay for the moment, because equities have yet to quite reach their old highs either—at period end, the market remained a stone’s throw away from its peak in May—but breadth often leads the market, and over the coming months investors should keep a close eye on it.
For the 12-month period ended October 31, 2015, the return of the Standard & Poor’s 500® Index* (“S&P 500”) was 5.20%. The Barclays U.S. Aggregate Bond Index* returned 1.96% for the period, while the Bank of America Merrill Lynch 3-Month U.S. Treasury Bill Index* returned 0.02%. The MSCI World Index* returned 1.77%, while the MSCI Emerging Markets Index* returned -14.53%.
The opinions and forecasts expressed may not actually come to pass. This information is subject to change at any time, based on market and other conditions, and should not be construed as a recommendation of any specific security or strategy.
*Index Definitions:
The following indices are referenced throughout this report. Indices are unmanaged and not available for direct investment. Index performance does not reflect transaction costs, fees, or expenses.
Bank of America (”BofA”) Merrill Lynch 3-Month U.S. Treasury Bill Index is an unmanaged market index of U.S. Treasury securities maturing in 90 days that assumes reinvestment of all income.
Barclays U.S. Aggregate Bond Index is a broad-based benchmark that measures the investment grade, U.S. dollar-denominated, fixed-rate taxable bond market, including U.S. Treasuries, government-related and corporate securities, MBS (agency fixed-rate and hybrid ARM pass-throughs), ABS and CMBS.
MSCI Emerging Markets Index is a free float-adjusted market capitalization weighted index that is designed to measure equity market performance in the global emerging markets.
MSCI World Index is a free float-adjusted market capitalization weighted index that is designed to measure the equity market performance of developed markets.
GUGGENHEIM ETFs ANNUAL REPORT | 3 |
ECONOMIC AND MARKET OVERVIEW (Unaudited)(concluded) | October 31, 2015 |
S&P 500® Index is a capitalization-weighted index of 500 stocks designed to measure the performance of the broad economy, representing all major industries and is considered a representation of the U.S. stock market.
Russell Top 50® Mega Cap Index measures the performance of the largest companies in the Russell 3000® Index, which measures the performance of the largest 3,000 U.S. companies and represents approximately 98% of the investable U.S. equity market. The Mega Cap Index includes approximately 50 of the largest securities based on a combination of their market cap and current index membership and represents approximately 40% of the total market capitalization of the Russell 3000.
Russell 1000® Index measures the performance of the large-cap segment of the U.S. equity universe. It is a subset of the Russell 3000® Index and includes approximately 1,000 of the largest securities based on a combination of their market cap and current index membership. The Russell 1000 represents approximately 92% of the U.S. market.
Russell 2000® Index measures the performance of the small-cap segment of the U.S. equity universe. The Russell 2000 is a subset of the Russell 3000® Index representing approximately 10% of the total market capitalization of that index. It includes approximately 2,000 of the smallest securities based on a combination of their market cap and current index membership.
Russell 3000® Index measures the performance of the largest 3,000 U.S. companies representing approximately 98% of the investable U.S. equity market.
Russell Midcap® Index measures the performance of the mid-cap segment of the U.S. equity universe. The Russell Midcap is a subset of the Russell 1000® Index. It includes approximately 800 of the smallest securities based on a combination of their market cap and current index membership. The Russell Midcap represents approximately 31% of the total market capitalization of the Russell 1,000 companies.
S&P 500® Pure Value Index is narrow in focus, containing only those stocks from the S&P (Standard & Poor’s) 500® Index (S&P 500), as selected by S&P, that exhibit strong value characteristics, and weights them by style score. It is a complement to the S&P 500® Value Index, which consists of all value companies in the S&P 500 and measures value across several risk factors, including book value to price ratio, earnings to price ratio, and sales to price ratio. The S&P 500 itself measures the performance of the large-capitalization sector of the U.S. equity market and includes 500 widely held common stocks chosen for market size, liquidity and industry group representation.
S&P 500® Pure Growth Index is narrow in focus, containing only those stocks from the S&P (Standard & Poor’s) 500® Index (S&P 500), as selected by S&P, that exhibit strong growth characteristics, and weights them by style score. It is a complement to the S&P 500® Growth Index, which consists of all growth companies in the S&P 500 and measures growth across several risk factors, including sales growth, earnings change to price and momentum. The S&P 500 itself measures the performance of the large-capitalization sector of the U.S. equity market and includes 500 widely held common stocks chosen for market size, liquidity and industry group representation.
S&P MidCap 400® Index is a capitalization-weighted index that measures the performance of the mid-cap segment of the U.S. equity universe and includes 400 domestic mid-cap stocks chosen for market capitalization, liquidity, and industry group representation.
S&P MidCap 400® Pure Value Index is narrow in focus, containing only those S&P (Standard & Poor’s) MidCap 400® Index (S&P 400) companies with strong value characteristics as selected by S&P. It is a complement to the S&P MidCap 400® Value Index, which consists of all value companies in the S&P 400 and measures value across several risk factors, including book value to price ratio, earnings to price ratio, and sales to price ratio. The S&P 400 itself measures the performance of the mid-capitalization sector of the U.S. equity market.
S&P MidCap 400® Pure Growth Index is narrow in focus, containing only those S&P (Standard & Poor’s) MidCap 400® Index (S&P 400) companies with strong growth characteristics as selected by S&P. It is a complement to the S&P MidCap 400® Growth Index, which consists of all growth companies in the S&P 400 and measures growth across several risk factors, including sales growth, earnings change to price and momentum. The S&P 400 itself measures the performance of the mid-capitalization sector of the U.S. equity market.
S&P SmallCap 600® Index is a capitalization-weighted index that measures the performance of the small-cap segment of the U.S. equity universe and includes 600 domestic small-cap stocks chosen for market capitalization, liquidity, and industry group representation.
S&P SmallCap 600® Pure Value Index is narrow in focus, containing only those S&P (Standard & Poor’s) SmallCap 600® Index (S&P 600) companies with strong value characteristics as selected by S&P. It is a complement to the S&P SmallCap 600® Value Index, which consists of all value companies in the S&P 600 and measures value across several risk factors, including book value to price ratio, earnings to price ratio, and sales to price ratio. The S&P 600 itself measures the performance of the small-capitalization sector of the U.S. equity market.
S&P SmallCap 600® Pure Growth Index is narrow in focus, containing only those S&P (Standard & Poor’s) SmallCap 600® Index (S&P 400) companies with strong growth characteristics as selected by S&P. It is a complement to the S&P SmallCap 600® Growth Index, which consists of all growth companies in the S&P 600 and measures growth across several risk factors, including sales growth, earnings change to price and momentum. The S&P 600 itself measures the performance of the small-capitalization sector of the U.S. equity market.
4 | GUGGENHEIM ETFs ANNUAL REPORT |
FEES AND EXPENSES (Unaudited) |
Shareholder Expense Example
As a shareholder of the Rydex ETF Trust, you incur transaction costs such as creation and redemption fees or brokerage charges, and ongoing costs including advisory fees, trustee fees and, if applicable, distribution fees. All other Trust expenses are paid by the advisor. This Example is intended to help you understand your ongoing costs (in dollars) of investing in a Fund and to compare these costs with the ongoing costs of investing in other mutual funds.
The example in the table is based on an investment of $1,000 invested on April 30, 2015 and held for the six months ended October 31, 2015.
Actual Expenses
The first table below provides information about actual account values and actual expenses. You may use the information in this table, together with the amount you invested, to estimate the expenses that you incurred over the period. Simply divide your account value by $1,000 (for example, an $8,600 account value divided by $1,000 = 8.6), then multiply the result by the number in the first table under the heading entitled “Expenses Paid During the Six-Month Period” to estimate the expenses attributable to your investment during this period.
Hypothetical Example for Comparison Purposes
The second table below provides information about hypothetical account values and hypothetical expenses based on a Fund’s actual expense ratio and an assumed rate of return of 5% per year before expenses, which is not a Fund’s actual return. Thus, you should not use the hypothetical account values and expenses to estimate the actual ending account balance or your expenses for the period. Rather, these figures are provided to enable you to compare the ongoing costs of investing in a Fund and other funds. To do so, compare this 5% hypothetical example with the 5% hypothetical examples that appear in the shareholder reports of other funds.
Please note that the expenses shown in the table are meant to highlight your ongoing costs only and do not reflect any transaction costs, such as creation and redemption fees, or brokerage charges. Therefore, the second table is useful in comparing ongoing costs only, and will not help you determine the relative total costs of owning different funds. In addition, if these transaction costs were included, your costs would have been higher.
GUGGENHEIM ETFs ANNUAL REPORT | 5 |
FEES AND EXPENSES (Unaudited)(concluded) |
Expense | Fund | Beginning | Ending | Expenses | |
Table 1. Based on actual Fund return3 | |||||
Guggenheim Russell Top 50® Mega Cap ETF | 0.20% | 2.67% | $ 1,000.00 | $ 1,026.70 | $ 1.02 |
Guggenheim S&P 500® Pure Value ETF | 0.35% | (5.79%) | 1,000.00 | 942.10 | 1.71 |
Guggenheim S&P 500® Pure Growth ETF | 0.35% | 1.63% | 1,000.00 | 1,016.30 | 1.78 |
Guggenheim S&P MidCap 400® Pure Value ETF | 0.35% | (8.12%) | 1,000.00 | 918.80 | 1.69 |
Guggenheim S&P MidCap 400® Pure Growth ETF | 0.35% | 0.20% | 1,000.00 | 1,002.00 | 1.77 |
Guggenheim S&P SmallCap 600® Pure Value ETF | 0.35% | (10.00%) | 1,000.00 | 900.00 | 1.68 |
Guggenheim S&P SmallCap 600® Pure Growth ETF | 0.35% | (0.82%) | 1,000.00 | 991.80 | 1.76 |
Table 2. Based on hypothetical 5% return (before expenses) | |||||
Guggenheim Russell Top 50® Mega Cap ETF | 0.20% | 5.00% | 1,000.00 | 1,024.20 | 1.02 |
Guggenheim S&P 500® Pure Value ETF | 0.35% | 5.00% | 1,000.00 | 1,023.44 | 1.79 |
Guggenheim S&P 500® Pure Growth ETF | 0.35% | 5.00% | 1,000.00 | 1,023.44 | 1.79 |
Guggenheim S&P MidCap 400® Pure Value ETF | 0.35% | 5.00% | 1,000.00 | 1,023.44 | 1.79 |
Guggenheim S&P MidCap 400® Pure Growth ETF | 0.35% | 5.00% | 1,000.00 | 1,023.44 | 1.79 |
Guggenheim S&P SmallCap 600® Pure Value ETF | 0.35% | 5.00% | 1,000.00 | 1,023.44 | 1.79 |
Guggenheim S&P SmallCap 600® Pure Growth ETF | 0.35% | 5.00% | 1,000.00 | 1,023.44 | 1.79 |
1 | Annualized. |
2 | Expenses are equal to the Fund’s annualized expense ratio, net of any applicable fee waivers, multiplied by the average account value over the period, multiplied by 184/365 (to reflect the one-half year period). |
3 | Actual cumulative return at net asset value for the period April 30, 2015 to October 31, 2015. |
6 | GUGGENHEIM ETFs ANNUAL REPORT |
MANAGER'S ANALYSIS (Unaudited) | October 31, 2015 |
GUGGENHEIM RUSSELL TOP 50® MEGA CAP ETF
Guggenheim Russell Top 50® Mega Cap ETF (XLG) returned 5.87% for the one-year period ended October 31, 2015, compared with the Russell Top 50® Mega Cap Index benchmark, which returned 5.94% for the same period. The cap-weighted S&P 100 Index returned 5.81%. During the period, XLG achieved over 99% correlation to its benchmark on a daily basis.
The Information Technology sector was the largest contributor to the Fund’s performance, followed by Consumer Discretionary, and Financials. The Energy, Health Care, and Telecommunications Services sectors detracted the most from the Fund’s performance.
The top contributors to Fund return were Amazon.com. Inc., Apple, Inc., and Microsoft Corp. The largest detractors were Exxon Mobil Corp., Chevron Corp., and Qualcomm, Inc.
Mega-cap stocks, as represented by the Russell Top 50 Mega Cap Index, outpaced performance of large-cap stocks, mid-cap stocks, and small-cap stocks, as represented by returns for the Russell 1000 Index, the Russell Midcap Index, and the Russell 2000 Index, whose returns were 4.86%, 2.77%, and 0.34%, respectively.
Cumulative Fund Performance: October 31, 2005 – October 31, 2015
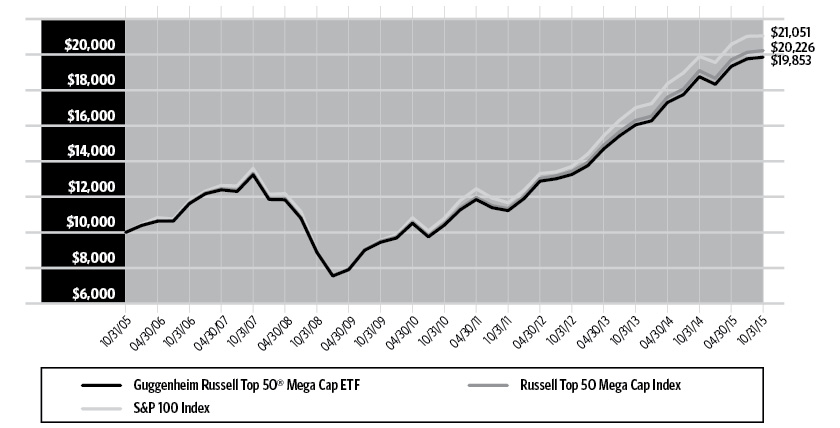
AVERAGE ANNUAL TOTAL RETURNS FOR THE PERIOD ENDED OCTOBER 31, 2015 | ||||
One Year | Three Year | Five Year | 10 Year | |
Guggenheim Russell Top 50® Mega Cap ETF | 5.87% | 14.42% | 13.78% | 7.10% |
Russell Top 50 Mega Cap Index | 5.94% | 14.64% | 14.02% | 7.30% |
S&P 100 Index | 5.81% | 15.37% | 14.28% | 7.73% |
The returns presented above do not reflect the effect of taxes. Index returns represent total returns. Performance displayed represents past performance, which is no guarantee of future results.
GUGGENHEIM ETFs ANNUAL REPORT | 7 |
PORTFOLIO SUMMARY (Unaudited) | October 31, 2015 |
GUGGENHEIM RUSSELL TOP 50® MEGA CAP ETF
Holdings Diversification (Market Exposure as % of Net Assets)
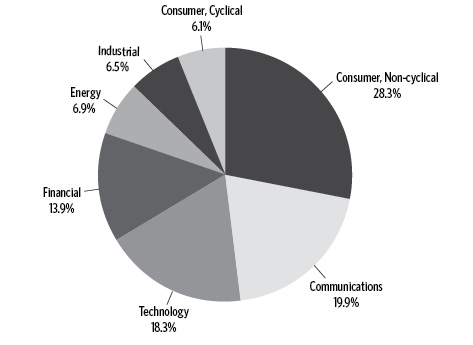
“Holdings Diversification (Market Exposure as % of Net Assets)” excludes any temporary cash investments.
Ten Largest Holdings | (% of Total |
Apple, Inc. | 7.7% |
Microsoft Corp. | 4.8% |
Exxon Mobil Corp. | 3.9% |
General Electric Co. | 3.3% |
Johnson & Johnson | 3.2% |
Berkshire Hathaway, Inc. — Class B | 2.8% |
Wells Fargo & Co. | 2.8% |
Amazon.com, Inc. | 2.7% |
JPMorgan Chase & Co. | 2.7% |
Facebook, Inc. — Class A | 2.5% |
Top Ten Total | 36.4% |
“Ten Largest Holdings” exclude any temporary cash or derivative investments. | |
8 | GUGGENHEIM ETFs ANNUAL REPORT |
MANAGER'S ANALYSIS (Unaudited) | October 31, 2015 |
GUGGENHEIM S&P 500® PURE VALUE ETF
For the one-year period ended October 31, 2015, Guggenheim S&P 500® Pure Value ETF (RPV) returned -2.94%. Over the year, its benchmark, the S&P 500® Pure Value Index, posted a return of -2.78%.
For comparison, the S&P 500® Value Index returned 0.79% for the year.
For the period, RPV achieved a correlation of over 99% to its benchmark of the daily price movement of the S&P 500® Pure Value Index.
The Consumer Discretionary sector was the largest contributor to the Fund’s performance during the period, followed by Health Care and Consumer Staples. The Energy, Industrials, and Materials sectors were the largest detractors from the Fund’s performance.
Stocks contributing the most to the Fund’s return were Tesoro Corp., Valero Energy Corp., and Newfield Exploration Co. Stocks detracting most from performance were Genworth Financial, Inc.—Class A, Chesapeake Energy Corp., and NRG Energy, Inc.
Cumulative Fund Performance: March 1, 2006 – October 31, 2015
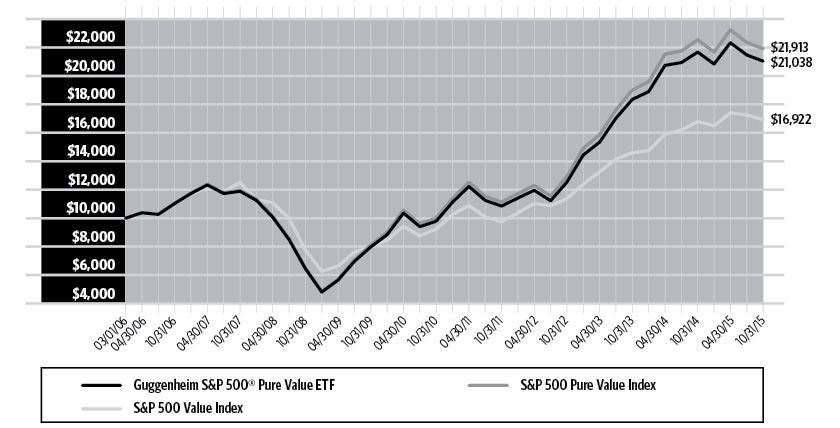
AVERAGE ANNUAL TOTAL RETURNS FOR THE PERIOD ENDED OCTOBER 31, 2015 | ||||
One Year | Three Year | Five Year | Since Inception | |
Guggenheim S&P 500® Pure Value ETF | -2.94% | 18.84% | 16.54% | 8.00% |
S&P 500 Pure Value Index | -2.78% | 19.24% | 16.97% | 8.45% |
S&P 500 Value Index | 0.79% | 14.16% | 12.90% | 5.59% |
The returns presented above do not reflect the effect of taxes. Index returns represent total returns. Performance displayed represents past performance, which is no guarantee of future results.
GUGGENHEIM ETFs ANNUAL REPORT | 9 |
PORTFOLIO SUMMARY (Unaudited) | October 31, 2015 |
GUGGENHEIM S&P 500® PURE VALUE ETF
Holdings Diversification (Market Exposure as % of Net Assets)
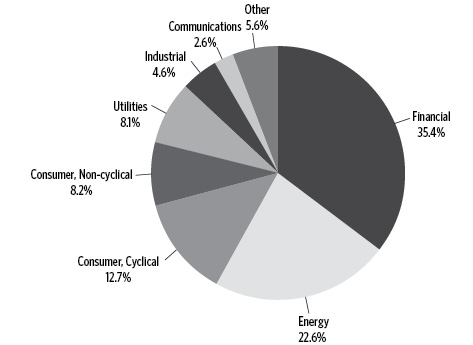
“Holdings Diversification (Market Exposure as % of Net Assets)” excludes any temporary cash investments.
Ten Largest Holdings | (% of Total |
Valero Energy Corp. | 2.7% |
Assurant, Inc. | 2.6% |
Berkshire Hathaway, Inc. — Class B | 2.1% |
Phillips 66 | 2.0% |
Tesoro Corp. | 2.0% |
GameStop Corp. — Class A | 1.9% |
General Motors Co. | 1.8% |
Marathon Petroleum Corp. | 1.7% |
Unum Group | 1.7% |
Anthem, Inc. | 1.7% |
Top Ten Total | 20.2% |
“Ten Largest Holdings” exclude any temporary cash or derivative investments. | |
10 | GUGGENHEIM ETFs ANNUAL REPORT |
MANAGER'S ANALYSIS (Unaudited) | October 31, 2015 |
GUGGENHEIM S&P 500® PURE GROWTH ETF
For the one-year period ended October 31, 2015, Guggenheim S&P 500® Pure Growth ETF (RPG) returned 5.65%. Over the year, its benchmark, the S&P 500® Pure Growth Index, produced a return of 6.01%. For the period, RPG achieved over 99% correlation to its benchmark on a daily basis.
For comparison, the S&P 500® Growth Index returned 9.24% for the year.
The Consumer Discretionary, Health Care, and Financials sectors contributed the most to the Fund’s performance. The Energy and Information Technology sectors were the largest detractors from the Fund’s performance. The Materials sector contributed least.
Stocks contributing the most to the Fund’s return were Expedia, Inc., Under Armour, Inc.—Class A, and Constellation Brands, Inc. —Class A. Stocks detracting most from performance were Micron Technology, Inc., Keurig Green Mountain, Inc., and Range Resources Corp.
Cumulative Fund Performance: March 1, 2006 – October 31, 2015
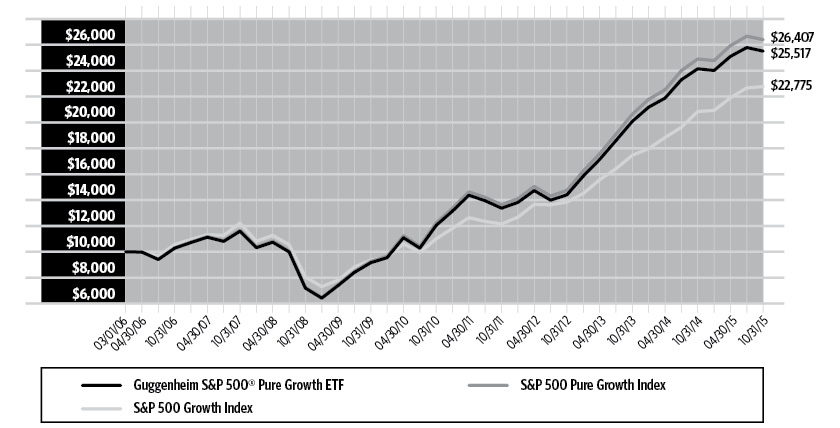
AVERAGE ANNUAL TOTAL RETURNS FOR THE PERIOD ENDED OCTOBER 31, 2015 | ||||
One Year | Three Year | Five Year | Since Inception | |
Guggenheim S&P 500® Pure Growth ETF | 5.65% | 21.00% | 16.21% | 10.17% |
S&P 500 Pure Growth Index | 6.01% | 21.44% | 16.66% | 10.57% |
S&P 500 Growth Index | 9.24% | 18.05% | 15.66% | 8.89% |
The returns presented above do not reflect the effect of taxes. Index returns represent total returns. Performance displayed represents past performance, which is no guarantee of future results.
GUGGENHEIM ETFs ANNUAL REPORT | 11 |
PORTFOLIO SUMMARY (Unaudited) | October 31, 2015 |
GUGGENHEIM S&P 500® PURE GROWTH ETF
Holdings Diversification (Market Exposure as % of Net Assets)
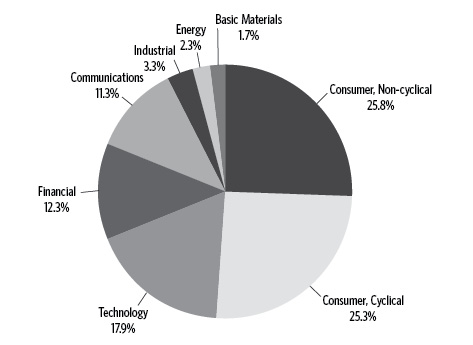
“Holdings Diversification (Market Exposure as % of Net Assets)” excludes any temporary cash investments.
Ten Largest Holdings | (% of Total |
DR Horton, Inc. | 2.7% |
Expedia, Inc. | 2.3% |
Under Armour, Inc. — Class A | 2.2% |
Facebook, Inc. — Class A | 2.2% |
Constellation Brands, Inc. — Class A | 2.1% |
Regeneron Pharmaceuticals, Inc. | 2.0% |
Lennar Corp. — Class A | 2.0% |
VeriSign, Inc. | 1.9% |
Allergan plc | 1.8% |
O'Reilly Automotive, Inc. | 1.8% |
Top Ten Total | 21.0% |
“Ten Largest Holdings” exclude any temporary cash or derivative investments. | |
12 | GUGGENHEIM ETFs ANNUAL REPORT |
MANAGER'S ANALYSIS (Unaudited) | October 31, 2015 |
GUGGENHEIM S&P MIDCAP 400® PURE VALUE ETF
For the one-year period ended October 31, 2015, Guggenheim S&P MidCap 400® Pure Value ETF (RFV) returned -2.12%. Over the year, its benchmark, the S&P MidCap 400® Pure Value Index, posted a -1.87% return. RFV achieved over 99% correlation to its benchmark on a daily basis.
For comparison, the S&P MidCap 400® Value Index returned -0.42% for the year.
The Financials, Information Technology, and Utilities sectors were the largest contributors to the Fund’s performance. The Energy, Materials, and Consumer Discretionary sectors were the largest detractors from the Fund’s performance.
Stocks contributing the most to the Fund’s return were JetBlue Airways Corp., Orbital ATK, Inc., and StanCorp. Financial Group, Inc. Community Health Systems, Inc., U.S. Steel Corp. and Unit Corp. detracted the most from the Fund’s return.
Cumulative Fund Performance: March 1, 2006 – October 31, 2015
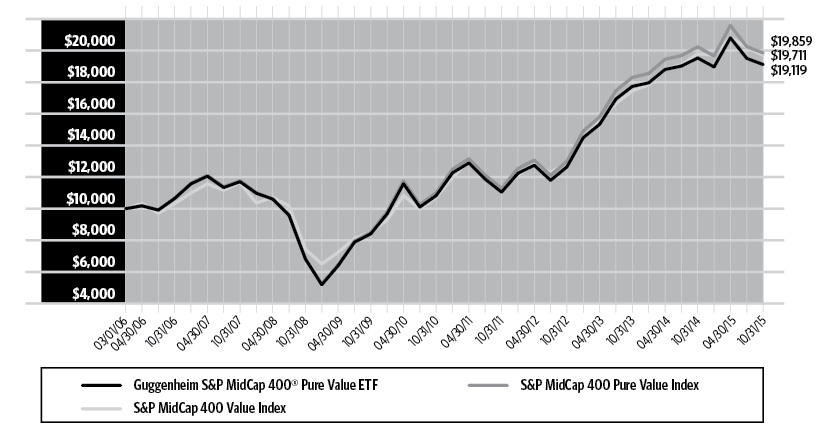
AVERAGE ANNUAL TOTAL RETURNS FOR THE PERIOD ENDED OCTOBER 31, 2015 | ||||
One Year | Three Year | Five Year | Since Inception | |
Guggenheim S&P MidCap 400® Pure Value ETF | -2.12% | 14.78% | 12.05% | 6.93% |
S&P MidCap 400 Pure Value Index | -1.87% | 15.16% | 12.52% | 7.35% |
S&P MidCap 400 Value Index | -0.42% | 15.27% | 12.99% | 7.27% |
The returns presented above do not reflect the effect of taxes. Index returns represent total returns. Performance displayed represents past performance, which is no guarantee of future results.
GUGGENHEIM ETFs ANNUAL REPORT | 13 |
PORTFOLIO SUMMARY (Unaudited) | October 31, 2015 |
GUGGENHEIM S&P MIDCAP 400® PURE VALUE ETF
Holdings Diversification (Market Exposure as % of Net Assets)
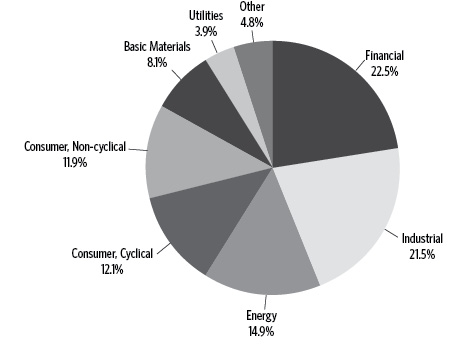
“Holdings Diversification (Market Exposure as % of Net Assets)” excludes any temporary cash investments.
Ten Largest Holdings | (% of Total |
AGCO Corp. | 2.3% |
Tech Data Corp. | 2.3% |
HollyFrontier Corp. | 2.2% |
Ingram Micro, Inc. — Class A | 2.2% |
Domtar Corp. | 2.1% |
Reinsurance Group of America, Inc. — Class A | 2.1% |
ManpowerGroup, Inc. | 2.0% |
Ascena Retail Group, Inc. | 1.9% |
Avnet, Inc. | 1.9% |
Old Republic International Corp. | 1.9% |
Top Ten Total | 20.9% |
“Ten Largest Holdings” exclude any temporary cash or derivative investments. | |
14 | GUGGENHEIM ETFs ANNUAL REPORT |
MANAGER'S ANALYSIS (Unaudited) | October 31, 2015 |
GUGGENHEIM S&P MIDCAP 400® PURE GROWTH ETF
For the one-year period ended October 31, 2015, Guggenheim S&P MidCap 400® Pure Growth ETF (RFG) returned 4.71%. Over the year, its benchmark, the S&P MidCap 400® Pure Growth Index, returned 5.00%. RFG achieved over 99% correlation to its benchmark on a daily basis.
For comparison, the S&P MidCap 400® Growth Index returned 7.05% for the year.
The Information Technology, Financials, and Industrials sectors contributed the most to the Fund’s performance. The Energy, Materials, and Consumer Staples sectors detracted the most from the Fund’s performance.
Stocks contributing the most to return were JetBlue Airways Corp., Global Payments, Inc., and Skyworks Solutions, Inc. Skechers U.S.A., Inc.—Class A, Akorn, Inc., and Trinity Industries, Inc., were the largest detractors.
Cumulative Fund Performance: March 1, 2006 – October 31, 2015
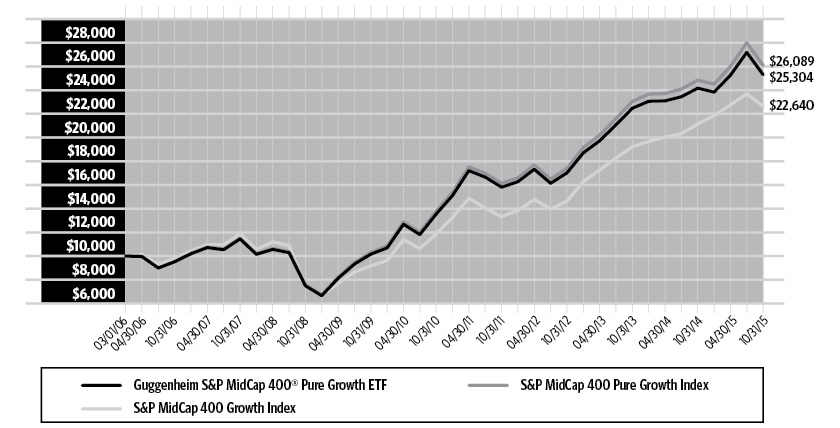
AVERAGE ANNUAL TOTAL RETURNS FOR THE PERIOD ENDED OCTOBER 31, 2015 | ||||
One Year | Three Year | Five Year | Since Inception | |
Guggenheim S&P MidCap 400® Pure Growth ETF | 4.71% | 14.14% | 13.31% | 10.08% |
S&P MidCap 400 Pure Growth Index | 5.00% | 14.45% | 13.61% | 10.43% |
S&P MidCap 400 Growth Index | 7.05% | 15.67% | 13.78% | 8.82% |
The returns presented above do not reflect the effect of taxes. Index returns represent total returns. Performance displayed represents past performance, which is no guarantee of future results.
GUGGENHEIM ETFs ANNUAL REPORT | 15 |
PORTFOLIO SUMMARY (Unaudited) | October 31, 2015 |
GUGGENHEIM S&P MIDCAP 400® PURE GROWTH ETF
Holdings Diversification (Market Exposure as % of Net Assets)
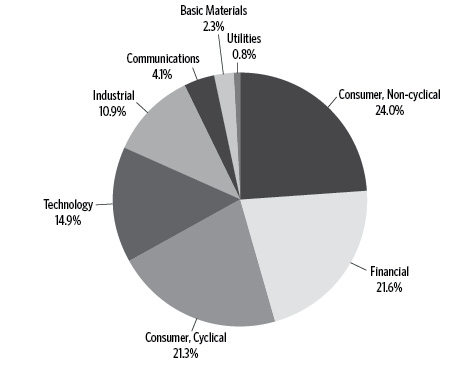
“Holdings Diversification (Market Exposure as % of Net Assets)” excludes any temporary cash investments.
Ten Largest Holdings | (% of Total |
JetBlue Airways Corp. | 2.9% |
Cadence Design Systems, Inc. | 2.1% |
Centene Corp. | 2.0% |
SolarWinds, Inc. | 1.9% |
Manhattan Associates, Inc. | 1.8% |
Trinity Industries, Inc. | 1.8% |
United Therapeutics Corp. | 1.8% |
Extra Space Storage, Inc. | 1.8% |
Alexander & Baldwin, Inc. | 1.8% |
Toll Brothers, Inc. | 1.8% |
Top Ten Total | 19.7% |
“Ten Largest Holdings” exclude any temporary cash or derivative investments. | |
16 | GUGGENHEIM ETFs ANNUAL REPORT |
MANAGER'S ANALYSIS (Unaudited) | October 31, 2015 |
GUGGENHEIM S&P SMALLCAP 600® PURE VALUE ETF
For the one-year period ended October 31, 2015, Guggenheim S&P SmallCap 600® Pure Value ETF (RZV) returned -6.60%. Over the year, its benchmark, the S&P SmallCap 600® Pure Value Index, returned -6.31%. RZV achieved over 99% correlation to its benchmark on a daily basis.
For comparison, the S&P SmallCap 600® Value Index returned -1.28% for the year.
The largest contributors to the Fund’s performance were the Industrials, Financials, and Consumer Staples sectors. The Energy and Materials sectors detracted the most from the Fund’s performance. The Telecommunications Services sector contributed least.
Central Garden & Pet Co.—Class A, Cash America International, Inc., and Skywest, Inc. contributed the most to the Fund’s return. Pioneer Energy Services Corp., Swift Energy Co., and Green Plains, Inc. were the largest detractors from the Fund’s return.
Cumulative Fund Performance: March 1, 2006 – October 31, 2015
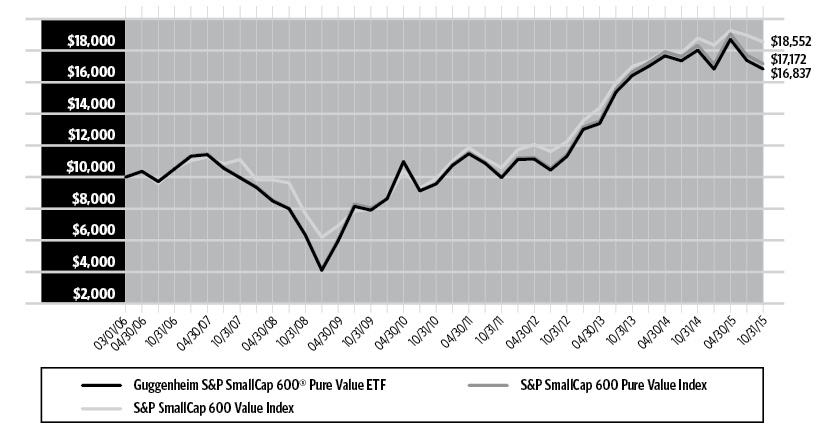
AVERAGE ANNUAL TOTAL RETURNS FOR THE PERIOD ENDED OCTOBER 31, 2015 | ||||
One Year | Three Year | Five Year | Since Inception | |
Guggenheim S&P SmallCap 600® Pure Value ETF | -6.60% | 14.17% | 11.97% | 5.54% |
S&P SmallCap 600 Pure Value Index | -6.31% | 14.55% | 12.35% | 5.75% |
S&P SmallCap 600 Value Index | -1.28% | 14.89% | 13.42% | 6.60% |
The returns presented above do not reflect the effect of taxes. Index returns represent total returns. Performance displayed represents past performance, which is no guarantee of future results.
GUGGENHEIM ETFs ANNUAL REPORT | 17 |
PORTFOLIO SUMMARY (Unaudited) | October 31, 2015 |
GUGGENHEIM S&P SMALLCAP 600® PURE VALUE ETF
Holdings Diversification (Market Exposure as % of Net Assets)
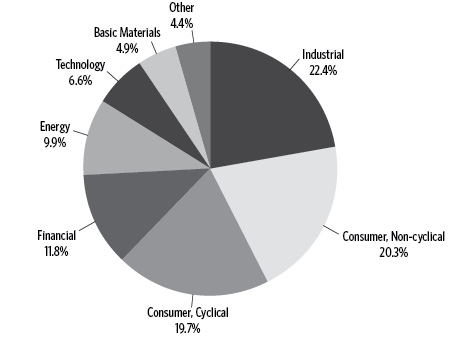
“Holdings Diversification (Market Exposure as % of Net Assets)” excludes any temporary cash investments.
Ten Largest Holdings | (% of Total |
Cash America International, Inc. | 2.3% |
Central Garden & Pet Co. — Class A | 1.9% |
SkyWest, Inc. | 1.9% |
Pep Boys-Manny Moe & Jack | 1.8% |
Gibraltar Industries, Inc. | 1.8% |
Universal Corp. | 1.7% |
Comfort Systems USA, Inc. | 1.4% |
Universal Forest Products, Inc. | 1.4% |
Seneca Foods Corp. — Class A | 1.3% |
Griffon Corp. | 1.3% |
Top Ten Total | 16.8% |
“Ten Largest Holdings” exclude any temporary cash or derivative investments. | |
18 | GUGGENHEIM ETFs ANNUAL REPORT |
MANAGER'S ANALYSIS (Unaudited) | October 31, 2015 |
GUGGENHEIM S&P SMALLCAP 600® PURE GROWTH ETF
For the one-year period ended October 31, 2015, Guggenheim S&P SmallCap 600® Pure Growth ETF (RZG) returned 6.42%. Over the year, its benchmark, the S&P SmallCap 600® Pure Growth Index, returned 6.76%. RZG achieved over 99% correlation to its benchmark on a daily basis.
For comparison, the S&P SmallCap 600® Growth Index returned 6.86% for the year.
The largest contributors to the Fund’s performance were the Consumer Discretionary, Information Technology, and Health Care sectors. The Energy and Materials sectors were the largest detractors from the Fund’s performance. The Industrials sector contributed least.
Skechers U.S.A., Inc.—Class A, Abiomed, Inc., and Cal-Maine Foods, Inc., were the holdings contributing the most to the Fund’s return. U.S. Silica Holdings, Inc., Carrizo Oil & Gas, Inc., and Century Aluminum Co. were the largest detractors.
Cumulative Fund Performance: March 1, 2006 – October 31, 2015
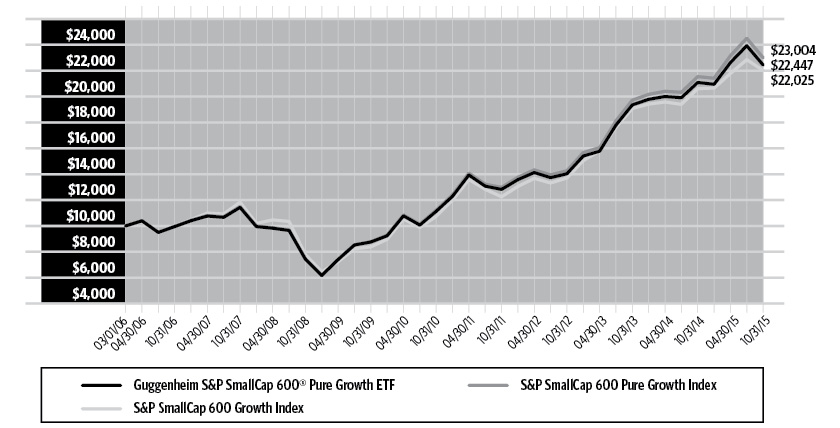
AVERAGE ANNUAL TOTAL RETURNS FOR THE PERIOD ENDED OCTOBER 31, 2015 | ||||
One Year | Three Year | Five Year | Since Inception | |
Guggenheim S&P SmallCap 600® Pure Growth ETF | 6.42% | 16.95% | 15.06% | 8.72% |
S&P SmallCap 600 Pure Growth Index | 6.76% | 17.28% | 15.45% | 9.00% |
S&P SmallCap 600 Growth Index | 6.86% | 17.13% | 15.46% | 8.51% |
The returns presented above do not reflect the effect of taxes. Index returns represent total returns. Performance displayed represents past performance, which is no guarantee of future results.
GUGGENHEIM ETFs ANNUAL REPORT | 19 |
PORTFOLIO SUMMARY (Unaudited) | October 31, 2015 |
GUGGENHEIM S&P SMALLCAP 600® PURE GROWTH ETF
Holdings Diversification (Market Exposure as % of Net Assets)
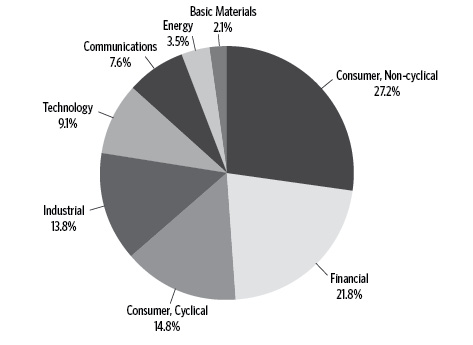
“Holdings Diversification (Market Exposure as % of Net Assets)” excludes any temporary cash investments.
Ten Largest Holdings | (% of Total |
Take-Two Interactive Software, Inc. | 2.2% |
LendingTree, Inc. | 2.1% |
General Communication, Inc. — Class A | 2.0% |
Gentherm, Inc. | 2.0% |
Universal Insurance Holdings, Inc. | 1.9% |
Lannett Company, Inc. | 1.9% |
ABIOMED, Inc. | 1.8% |
TASER International, Inc. | 1.6% |
On Assignment, Inc. | 1.6% |
CoreSite Realty Corp. | 1.6% |
Top Ten Total | 18.7% |
“Ten Largest Holdings” exclude any temporary cash or derivative investments. | |
20 | GUGGENHEIM ETFs ANNUAL REPORT |
SCHEDULE OF INVESTMENTS | October 31, 2015 |
GUGGENHEIM RUSSELL TOP 50® MEGA CAP ETF |
Shares | Value | |||||||
COMMON STOCKS† - 99.9% | ||||||||
Consumer, Non-cyclical - 28.3% | ||||||||
Johnson & Johnson | 154,878 | $ | 15,647,325 | |||||
Pfizer, Inc. | 343,911 | 11,631,071 | ||||||
Procter & Gamble Co. | 151,524 | 11,573,403 | ||||||
Coca-Cola Co. | 219,008 | 9,274,989 | ||||||
Gilead Sciences, Inc. | 82,078 | 8,875,093 | ||||||
Merck & Company, Inc. | 157,792 | 8,624,911 | ||||||
PepsiCo, Inc. | 82,438 | 8,424,339 | ||||||
Philip Morris International, Inc. | 86,520 | 7,648,368 | ||||||
Allergan plc* | 21,918 | 6,761,045 | ||||||
Amgen, Inc. | 42,466 | 6,717,272 | ||||||
Altria Group, Inc. | 109,834 | 6,641,662 | ||||||
UnitedHealth Group, Inc. | 53,167 | 6,262,009 | ||||||
Bristol-Myers Squibb Co. | 93,103 | 6,140,143 | ||||||
Medtronic plc | 79,592 | 5,883,441 | ||||||
MasterCard, Inc. — Class A | 56,687 | 5,611,446 | ||||||
AbbVie, Inc. | 92,524 | 5,509,804 | ||||||
Celgene Corp.* | 44,297 | 5,435,685 | ||||||
Biogen, Inc.* | 12,456 | 3,618,593 | ||||||
Total Consumer, Non-cyclical | 140,280,599 | |||||||
Communications - 19.9% | ||||||||
Amazon.com, Inc.* | 21,291 | 13,326,037 | ||||||
Facebook, Inc. — Class A* | 120,864 | 12,324,502 | ||||||
Alphabet, Inc. — Class A* | 16,100 | 11,871,979 | ||||||
Alphabet, Inc. — Class C* | 16,429 | 11,677,897 | ||||||
AT&T, Inc. | 339,209 | 11,366,893 | ||||||
Walt Disney Co. | 94,766 | 10,778,685 | ||||||
Verizon Communications, Inc. | 227,787 | 10,678,655 | ||||||
Cisco Systems, Inc. | 284,053 | 8,194,929 | ||||||
Comcast Corp. — Class A | 118,567 | 7,424,666 | ||||||
Comcast Corp. — Special Class A | 21,289 | 1,335,033 | ||||||
Total Communications | 98,979,276 | |||||||
Technology - 18.3% | ||||||||
Apple, Inc. | 321,759 | 38,450,200 | ||||||
Microsoft Corp. | 451,812 | 23,783,384 | ||||||
Intel Corp. | 264,956 | 8,971,410 | ||||||
International Business Machines Corp. | 50,716 | 7,104,297 | ||||||
Oracle Corp. | 176,959 | 6,873,088 | ||||||
QUALCOMM, Inc. | 91,047 | 5,410,013 | ||||||
Total Technology | 90,592,392 | |||||||
Financial - 13.9% | ||||||||
Berkshire Hathaway, Inc. — Class B* | 103,875 | 14,129,078 | ||||||
Wells Fargo & Co. | 260,200 | 14,087,228 | ||||||
JPMorgan Chase & Co. | 207,268 | 13,316,968 | ||||||
Bank of America Corp. | 586,552 | 9,842,343 | ||||||
Citigroup, Inc. | 169,460 | 9,010,188 | ||||||
Visa, Inc. — Class A | 109,324 | 8,481,356 | ||||||
Total Financial | 68,867,161 | |||||||
Energy - 6.9% | ||||||||
Exxon Mobil Corp. | 233,520 | 19,321,445 | ||||||
Chevron Corp. | 105,027 | 9,544,854 | ||||||
Schlumberger Ltd. | 70,914 | 5,542,638 | ||||||
Total Energy | 34,408,937 | |||||||
Industrial - 6.5% | ||||||||
General Electric Co. | 562,750 | 16,274,730 | ||||||
Boeing Co. | 38,621 | 5,718,611 | ||||||
3M Co. | 35,428 | 5,569,636 | ||||||
United Technologies Corp. | 49,717 | 4,892,650 | ||||||
Total Industrial | 32,455,627 | |||||||
Consumer, Cyclical - 6.1% | ||||||||
Home Depot, Inc. | 72,548 | 8,969,835 | ||||||
CVS Health Corp. | 63,017 | 6,224,819 | ||||||
McDonald’s Corp. | 53,533 | 6,009,079 | ||||||
Wal-Mart Stores, Inc. | 88,220 | 5,049,713 | ||||||
Walgreens Boots Alliance, Inc. | 48,015 | 4,065,910 | ||||||
Total Consumer, Cyclical | 30,319,356 | |||||||
Total Common Stocks | ||||||||
(Cost $420,192,466) | 495,903,348 | |||||||
Total Investments - 99.9% | ||||||||
(Cost $420,192,466) | $ | 495,903,348 | ||||||
Other Assets & Liabilities, net - 0.1% | 360,623 | |||||||
Total Net Assets - 100.0% | $ | 496,263,971 | ||||||
* | Non-income producing security. |
† | Value determined based on Level 1 inputs — See Note 4. |
plc — Public Limited Company | |
See Sector Classification in Other Information section. |
The following table summarizes the inputs used to value the Fund’s net assets at October 31, 2015 (See Note 4 in the Notes to Financial Statements):
Investments in Securities | Level 1 | Level 2 | Level 3 | Total | ||||||||||||
Common Stocks | $ | 495,903,348 | $ | — | $ | — | $ | 495,903,348 | ||||||||
Total | $ | 495,903,348 | $ | — | $ | — | $ | 495,903,348 | ||||||||
For the year ended October 31, 2015, there were no transfers between levels.
SEE NOTES TO FINANCIAL STATEMENTS. | GUGGENHEIM ETFs ANNUAL REPORT | 21 |
SCHEDULE OF INVESTMENTS | October 31, 2015 |
GUGGENHEIM S&P 500® PURE VALUE ETF |
Shares | Value | |||||||
COMMON STOCKS† - 99.8% | ||||||||
Financial - 35.4% | ||||||||
Assurant, Inc. | 259,415 | $ | 21,150,105 | |||||
Berkshire Hathaway, Inc. — Class B* | 126,722 | 17,236,726 | ||||||
Unum Group | 392,054 | 13,584,671 | ||||||
American International Group, Inc. | 200,802 | 12,662,574 | ||||||
Hartford Financial Services Group, Inc. | 260,481 | 12,049,851 | ||||||
MetLife, Inc. | 232,665 | 11,721,663 | ||||||
Prudential Financial, Inc. | 138,828 | 11,453,310 | ||||||
Lincoln National Corp. | 188,323 | 10,077,164 | ||||||
XL Group plc — Class A | 231,067 | 8,799,031 | ||||||
Loews Corp. | 237,422 | 8,656,406 | ||||||
SunTrust Banks, Inc. | 189,941 | 7,886,350 | ||||||
Citigroup, Inc. | 144,702 | 7,693,805 | ||||||
Zions Bancorporation | 258,073 | 7,424,760 | ||||||
JPMorgan Chase & Co. | 113,468 | 7,290,319 | ||||||
People’s United Financial, Inc. | 441,115 | 7,035,785 | ||||||
Genworth Financial, Inc. — Class A* | 1,485,824 | 6,953,656 | ||||||
Travelers Companies, Inc. | 60,940 | 6,879,517 | ||||||
Bank of America Corp. | 398,657 | 6,689,464 | ||||||
Morgan Stanley | 200,034 | 6,595,121 | ||||||
Capital One Financial Corp. | 83,488 | 6,587,203 | ||||||
Aflac, Inc. | 102,325 | 6,523,219 | ||||||
Nasdaq, Inc. | 107,758 | 6,238,111 | ||||||
Progressive Corp. | 186,717 | 6,185,934 | ||||||
Chubb Corp. | 46,215 | 5,977,910 | ||||||
PNC Financial Services Group, Inc. | 65,095 | 5,875,475 | ||||||
Cincinnati Financial Corp. | 96,945 | 5,838,997 | ||||||
Goldman Sachs Group, Inc. | 31,093 | 5,829,938 | ||||||
ACE Ltd. | 49,975 | 5,674,162 | ||||||
KeyCorp | 414,233 | 5,144,774 | ||||||
Fifth Third Bancorp | 269,413 | 5,132,318 | ||||||
Comerica, Inc. | 110,800 | 4,808,720 | ||||||
Torchmark Corp. | 79,342 | 4,602,629 | ||||||
BB&T Corp. | 123,144 | 4,574,800 | ||||||
Bank of New York Mellon Corp. | 108,614 | 4,523,773 | ||||||
Principal Financial Group, Inc. | 86,495 | 4,338,589 | ||||||
Hudson City Bancorp, Inc. | 413,295 | 4,182,545 | ||||||
Huntington Bancshares, Inc. | 352,507 | 3,867,002 | ||||||
Total Financial | 287,746,377 | |||||||
Energy - 22.6% | ||||||||
Valero Energy Corp. | 331,384 | 21,844,834 | ||||||
Phillips 66 | 185,619 | 16,529,372 | ||||||
Tesoro Corp. | 151,785 | 16,230,370 | ||||||
Marathon Petroleum Corp. | 264,311 | 13,691,310 | ||||||
Newfield Exploration Co.* | 336,573 | 13,526,869 | ||||||
First Solar, Inc.* | 176,520 | 10,073,996 | ||||||
Hess Corp. | 167,465 | 9,413,208 | ||||||
Chevron Corp. | 75,505 | 6,861,894 | ||||||
Marathon Oil Corp. | 361,642 | 6,646,980 | ||||||
Devon Energy Corp. | 148,766 | 6,237,758 | ||||||
Diamond Offshore Drilling, Inc. | 311,600 | 6,194,608 | ||||||
Baker Hughes, Inc. | 114,127 | 6,012,211 | ||||||
Ensco plc — Class A | 341,845 | 5,684,882 | ||||||
Murphy Oil Corp. | 185,028 | 5,260,346 | ||||||
Apache Corp. | 111,540 | 5,256,880 | ||||||
Chesapeake Energy Corp. | 692,184 | 4,935,272 | ||||||
ConocoPhillips | 87,267 | 4,655,694 | ||||||
Transocean Ltd. | 291,731 | 4,618,102 | ||||||
Exxon Mobil Corp. | 54,154 | 4,480,702 | ||||||
National Oilwell Varco, Inc. | 112,519 | 4,235,215 | ||||||
Occidental Petroleum Corp. | 55,483 | 4,135,703 | ||||||
Halliburton Co. | 98,772 | 3,790,869 | ||||||
Helmerich & Payne, Inc. | 66,653 | 3,750,564 | ||||||
Total Energy | 184,067,639 | |||||||
Consumer, Cyclical - 12.7% | ||||||||
GameStop Corp. — Class A | 332,629 | 15,324,218 | ||||||
General Motors Co. | 424,297 | 14,812,209 | ||||||
Staples, Inc. | 904,574 | 11,750,416 | ||||||
Goodyear Tire & Rubber Co. | 336,795 | 11,060,348 | ||||||
Ford Motor Co. | 743,774 | 11,015,293 | ||||||
Best Buy Company, Inc. | 276,011 | 9,668,665 | ||||||
Kohl’s Corp. | 125,073 | 5,768,367 | ||||||
Costco Wholesale Corp. | 30,352 | 4,799,258 | ||||||
Target Corp. | 61,650 | 4,758,147 | ||||||
Carnival Corp. | 76,578 | 4,141,338 | ||||||
Wal-Mart Stores, Inc. | 64,195 | 3,674,522 | ||||||
Whirlpool Corp. | 21,474 | 3,438,846 | ||||||
Johnson Controls, Inc. | 70,803 | 3,198,880 | ||||||
Total Consumer, Cyclical | 103,410,507 | |||||||
Consumer, Non-cyclical - 8.2% | ||||||||
Anthem, Inc. | 97,491 | 13,565,872 | ||||||
Tyson Foods, Inc. — Class A | 290,256 | 12,875,756 | ||||||
Humana, Inc. | 67,428 | 12,044,664 | ||||||
Archer-Daniels-Midland Co. | 236,067 | 10,778,819 | ||||||
Cardinal Health, Inc. | 91,551 | 7,525,492 | ||||||
Sysco Corp. | 142,759 | 5,888,809 | ||||||
Avery Dennison Corp. | 64,212 | 4,171,854 | ||||||
Total Consumer, Non-cyclical | 66,851,266 | |||||||
Utilities - 8.1% | ||||||||
FirstEnergy Corp. | 185,825 | 5,797,740 | ||||||
Consolidated Edison, Inc. | 80,416 | 5,287,352 | ||||||
AES Corp. | 476,650 | 5,219,318 | ||||||
Exelon Corp. | 185,789 | 5,187,229 | ||||||
PG&E Corp. | 87,913 | 4,694,554 | ||||||
Entergy Corp. | 65,824 | 4,486,564 | ||||||
TECO Energy, Inc. | 149,819 | 4,045,113 | ||||||
SCANA Corp. | 65,271 | 3,865,349 | ||||||
NRG Energy, Inc. | 287,306 | 3,703,374 | ||||||
DTE Energy Co. | 44,911 | 3,664,288 | ||||||
Xcel Energy, Inc. | 101,126 | 3,603,119 | ||||||
Ameren Corp. | 80,293 | 3,507,198 | ||||||
American Electric Power Company, Inc. | 59,064 | 3,345,976 | ||||||
22 | GUGGENHEIM ETFs ANNUAL REPORT | SEE NOTES TO FINANCIAL STATEMENTS. |
SCHEDULE OF INVESTMENTS (concluded) | October 31, 2015 |
GUGGENHEIM S&P 500® PURE VALUE ETF |
Shares | Value | |||||||
Pepco Holdings, Inc. | 123,761 | $ | 3,295,755 | |||||
Duke Energy Corp. | 44,331 | 3,168,337 | ||||||
Pinnacle West Capital Corp. | 49,660 | 3,153,907 | ||||||
Total Utilities | 66,025,173 | |||||||
Industrial - 4.6% | ||||||||
Jacobs Engineering Group, Inc.* | 291,781 | 11,712,090 | ||||||
Fluor Corp. | 166,800 | 7,974,708 | ||||||
L-3 Communications Holdings, Inc. | 45,761 | 5,784,190 | ||||||
Owens-Illinois, Inc.* | 219,542 | 4,731,130 | ||||||
Ryder System, Inc. | 50,813 | 3,647,357 | ||||||
Deere & Co. | 41,915 | 3,269,370 | ||||||
Total Industrial | 37,118,845 | |||||||
Communications - 2.6% | ||||||||
News Corp. — Class A | 494,721 | 7,618,703 | ||||||
Juniper Networks, Inc. | 131,112 | 4,115,606 | ||||||
AT&T, Inc. | 111,883 | 3,749,200 | ||||||
CenturyLink, Inc. | 115,287 | 3,252,246 | ||||||
News Corp. — Class B | 143,511 | 2,221,550 | ||||||
Total Communications | 20,957,305 | |||||||
Basic Materials - 2.3% | ||||||||
Newmont Mining Corp. | 258,951 | 5,039,186 | ||||||
LyondellBasell Industries N.V. — Class A | 38,146 | 3,544,145 | ||||||
Dow Chemical Co. | 68,458 | 3,537,225 | ||||||
Freeport-McMoRan, Inc. | 293,865 | 3,458,791 | ||||||
Nucor Corp. | 76,939 | 3,254,520 | ||||||
Total Basic Materials | 18,833,867 | |||||||
Technology - 2.0% | ||||||||
Computer Sciences Corp. | 90,910 | 6,053,697 | ||||||
Xerox Corp. | 643,921 | 6,046,418 | ||||||
HP, Inc. | 156,279 | 4,213,282 | ||||||
Total Technology | 16,313,397 | |||||||
Diversified - 1.3% | ||||||||
Leucadia National Corp. | 533,600 | 10,677,336 | ||||||
Total Common Stocks | ||||||||
(Cost $867,100,580) | 812,001,712 | |||||||
SHORT TERM INVESTMENTS† - 0.1% | ||||||||
Federated U.S. Treasury Cash Reserve Fund 0.00%1 | 473,335 | 473,335 | ||||||
Total Short Term Investments | ||||||||
(Cost $473,335) | 473,335 | |||||||
Total Investments - 99.9% | ||||||||
(Cost $867,573,915) | $ | 812,475,047 | ||||||
Other Assets & Liabilities, net - 0.1% | 554,176 | |||||||
Total Net Assets - 100.0% | $ | 813,029,223 | ||||||
* | Non-income producing security. |
† | Value determined based on Level 1 inputs — See Note 4. |
1 | Rate indicated is the 7 day yield as of October 31, 2015. |
plc — Public Limited Company | |
See Sector Classification in Other Information section. |
The following table summarizes the inputs used to value the Fund’s net assets at October 31, 2015 (See Note 4 in the Notes to Financial Statements):
Investments in Securities | Level 1 | Level 2 | Level 3 | Total | ||||||||||||
Common Stocks | $ | 812,001,712 | $ | — | $ | — | $ | 812,001,712 | ||||||||
Short Term Investments | 473,335 | — | — | 473,335 | ||||||||||||
Total | $ | 812,475,047 | $ | — | $ | — | $ | 812,475,047 | ||||||||
For the year ended October 31, 2015, there were no transfers between levels.
SEE NOTES TO FINANCIAL STATEMENTS. | GUGGENHEIM ETFs ANNUAL REPORT | 23 |
SCHEDULE OF INVESTMENTS | October 31, 2015 |
GUGGENHEIM S&P 500® PURE GROWTH ETF |
Shares | Value | |||||||
COMMON STOCKS† - 99.9% | ||||||||
Consumer, Non-cyclical - 25.8% | ||||||||
Constellation Brands, Inc. — Class A | 359,226 | $ | 48,423,665 | |||||
Regeneron Pharmaceuticals, Inc.* | 84,569 | 47,137,914 | ||||||
Allergan plc* | 132,847 | 40,979,314 | ||||||
Celgene Corp.* | 290,929 | 35,699,897 | ||||||
Gilead Sciences, Inc. | 323,314 | 34,959,943 | ||||||
Monster Beverage Corp.* | 253,949 | 34,618,328 | ||||||
Alexion Pharmaceuticals, Inc.* | 192,907 | 33,951,632 | ||||||
Edwards Lifesciences Corp.* | 188,055 | 29,552,843 | ||||||
AmerisourceBergen Corp. — Class A | 298,904 | 28,847,225 | ||||||
Zoetis, Inc. | 616,181 | 26,501,945 | ||||||
DaVita HealthCare Partners, Inc.* | 332,324 | 25,758,433 | ||||||
Amgen, Inc. | 159,237 | 25,188,109 | ||||||
Moody’s Corp. | 226,673 | 21,796,876 | ||||||
Robert Half International, Inc. | 348,837 | 18,369,756 | ||||||
Molson Coors Brewing Co. — Class B | 205,702 | 18,122,346 | ||||||
United Rentals, Inc.* | 232,195 | 17,382,118 | ||||||
Cintas Corp. | 181,830 | 16,926,555 | ||||||
Dr Pepper Snapple Group, Inc. | 185,857 | 16,610,040 | ||||||
Intuitive Surgical, Inc.* | 30,990 | 15,389,634 | ||||||
Biogen, Inc.* | 52,440 | 15,234,344 | ||||||
MasterCard, Inc. — Class A | 147,735 | 14,624,288 | ||||||
Mylan N.V.* | 309,035 | 13,625,353 | ||||||
AbbVie, Inc. | 217,680 | 12,962,844 | ||||||
Keurig Green Mountain, Inc. | 218,474 | 11,087,556 | ||||||
Total Consumer, Non-cyclical | 603,750,958 | |||||||
Consumer, Cyclical - 25.3% | ||||||||
DR Horton, Inc. | 2,141,902 | 63,057,595 | ||||||
Under Armour, Inc. — Class A* | 550,970 | 52,386,228 | ||||||
Lennar Corp. — Class A | 917,050 | 45,916,694 | ||||||
O’Reilly Automotive, Inc.* | 148,146 | 40,926,814 | ||||||
Southwest Airlines Co. | 881,375 | 40,798,849 | ||||||
Delta Air Lines, Inc. | 769,994 | 39,146,495 | ||||||
Advance Auto Parts, Inc. | 192,615 | 38,220,594 | ||||||
Signet Jewelers Ltd. | 220,145 | 33,228,686 | ||||||
Chipotle Mexican Grill, Inc. — Class A* | 40,452 | 25,898,584 | ||||||
CVS Health Corp. | 237,067 | 23,417,478 | ||||||
Lowe’s Companies, Inc. | 298,305 | 22,023,858 | ||||||
AutoZone, Inc.* | 24,373 | 19,118,425 | ||||||
Harman International Industries, Inc. | 172,965 | 19,019,231 | ||||||
Wyndham Worldwide Corp. | 200,610 | 16,319,624 | ||||||
Dollar Tree, Inc.* | 240,406 | 15,744,189 | ||||||
NIKE, Inc. — Class B | 115,968 | 15,195,287 | ||||||
Hanesbrands, Inc. | 442,329 | 14,127,988 | ||||||
Home Depot, Inc. | 106,855 | 13,211,552 | ||||||
VF Corp. | 187,940 | 12,689,709 | ||||||
Ross Stores, Inc. | 221,008 | 11,178,585 | ||||||
Leggett & Platt, Inc. | 245,876 | 11,071,796 | ||||||
Nordstrom, Inc. | 154,411 | 10,069,141 | ||||||
Michael Kors Holdings Ltd.* | 246,877 | 9,539,327 | ||||||
Total Consumer, Cyclical | 592,306,729 | |||||||
Technology - 17.9% | ||||||||
Avago Technologies Ltd. | 332,022 | 40,881,868 | ||||||
Apple, Inc. | 306,370 | 36,611,215 | ||||||
Akamai Technologies, Inc.* | 531,896 | 32,349,915 | ||||||
Red Hat, Inc.* | 367,617 | 29,082,181 | ||||||
Electronic Arts, Inc.* | 383,320 | 27,625,873 | ||||||
Activision Blizzard, Inc. | 778,582 | 27,063,510 | ||||||
Skyworks Solutions, Inc. | 348,030 | 26,881,837 | ||||||
Micron Technology, Inc.* | 1,589,119 | 26,315,811 | ||||||
Cognizant Technology Solutions Corp. — Class A* | 356,720 | 24,296,199 | ||||||
Fiserv, Inc.* | 196,141 | 18,929,568 | ||||||
Seagate Technology plc | 463,919 | 17,656,758 | ||||||
NVIDIA Corp. | 530,430 | 15,048,299 | ||||||
Western Digital Corp. | 216,353 | 14,456,707 | ||||||
Citrix Systems, Inc.* | 165,573 | 13,593,543 | ||||||
SanDisk Corp. | 166,141 | 12,792,857 | ||||||
Lam Research Corp. | 146,696 | 11,235,447 | ||||||
Intel Corp. | 331,455 | 11,223,066 | ||||||
Qorvo, Inc.* | 254,900 | 11,197,757 | ||||||
Cerner Corp.* | 161,570 | 10,710,475 | ||||||
QUALCOMM, Inc. | 158,052 | 9,391,450 | ||||||
Total Technology | 417,344,336 | |||||||
Financial - 12.3% | ||||||||
Equinix, Inc. | 112,463 | 33,365,523 | ||||||
American Tower Corp. — Class A | 285,535 | 29,190,243 | ||||||
CBRE Group, Inc. — Class A* | 614,003 | 22,890,032 | ||||||
Visa, Inc. — Class A | 250,040 | 19,398,103 | ||||||
Kimco Realty Corp. | 663,993 | 17,775,093 | ||||||
Equity Residential | 223,347 | 17,269,190 | ||||||
Welltower, Inc. | 257,162 | 16,682,099 | ||||||
Host Hotels & Resorts, Inc. | 954,313 | 16,538,244 | ||||||
AvalonBay Communities, Inc. | 88,099 | 15,402,348 | ||||||
Alliance Data Systems Corp.* | 47,033 | 13,983,381 | ||||||
Legg Mason, Inc. | 308,037 | 13,784,656 | ||||||
Macerich Co. | 154,670 | 13,106,736 | ||||||
Essex Property Trust, Inc. | 57,575 | 12,691,833 | ||||||
Ameriprise Financial, Inc. | 105,353 | 12,153,522 | ||||||
Navient Corp. | 914,452 | 12,061,622 | ||||||
Boston Properties, Inc. | 90,824 | 11,430,200 | ||||||
Ventas, Inc. | 188,765 | 10,140,456 | ||||||
Total Financial | 287,863,281 | |||||||
Communications - 11.3% | ||||||||
Expedia, Inc. | 387,328 | 52,792,807 | ||||||
Facebook, Inc. — Class A* | 508,443 | 51,845,933 | ||||||
VeriSign, Inc.* | 547,011 | 44,089,087 | ||||||
F5 Networks, Inc.* | 212,641 | 23,433,038 | ||||||
Yahoo!, Inc.* | 522,183 | 18,600,158 | ||||||
Priceline Group, Inc.* | 12,236 | 17,794,081 | ||||||
24 | GUGGENHEIM ETFs ANNUAL REPORT | SEE NOTES TO FINANCIAL STATEMENTS. |
SCHEDULE OF INVESTMENTS (concluded) | October 31, 2015 |
GUGGENHEIM S&P 500® PURE GROWTH ETF |
Shares | Value | |||||||
Walt Disney Co. | 125,316 | $ | 14,253,441 | |||||
Time Warner, Inc. | 174,787 | 13,168,453 | ||||||
eBay, Inc.* | 455,677 | 12,713,388 | ||||||
Alphabet, Inc. — Class A* | 10,634 | 7,841,405 | ||||||
Alphabet, Inc. — Class C* | 10,571 | 7,513,973 | ||||||
Total Communications | 264,045,764 | |||||||
Industrial - 3.3% | ||||||||
Martin Marietta Materials, Inc. | 129,466 | 20,086,650 | ||||||
Union Pacific Corp. | 168,846 | 15,086,390 | ||||||
Thermo Fisher Scientific, Inc. | 108,490 | 14,188,322 | ||||||
Amphenol Corp. — Class A | 258,885 | 14,036,745 | ||||||
CH Robinson Worldwide, Inc. | 194,028 | 13,461,663 | ||||||
Total Industrial | 76,859,770 | |||||||
Energy - 2.3% | ||||||||
EOG Resources, Inc. | 223,209 | 19,162,493 | ||||||
Cabot Oil & Gas Corp. — Class A | 609,548 | 13,233,287 | ||||||
Range Resources Corp. | 351,528 | 10,700,512 | ||||||
Williams Companies, Inc. | 245,363 | 9,677,117 | ||||||
Total Energy | 52,773,409 | |||||||
Basic Materials - 1.7% | ||||||||
Sherwin-Williams Co. | 61,990 | 16,540,792 | ||||||
Sigma-Aldrich Corp. | 86,910 | 12,143,064 | ||||||
Ecolab, Inc. | 96,370 | 11,598,130 | ||||||
Total Basic Materials | 40,281,986 | |||||||
Total Common Stocks | ||||||||
(Cost $2,129,483,577) | 2,335,226,233 | |||||||
SHORT TERM INVESTMENTS† - 0.1% | ||||||||
Federated U.S. Treasury Cash Reserve Fund 0.00%1 | 2,384,919 | 2,384,919 | ||||||
Total Short Term Investments | ||||||||
(Cost $2,384,919) | 2,384,919 | |||||||
Total Investments - 100.0% | ||||||||
(Cost $2,131,868,496) | $ | 2,337,611,152 | ||||||
Other Assets & Liabilities, net - 0.0% | 974,393 | |||||||
Total Net Assets - 100.0% | $ | 2,338,585,545 | ||||||
* | Non-income producing security. |
† | Value determined based on Level 1 inputs — See Note 4. |
1 | Rate indicated is the 7 day yield as of October 31, 2015. |
plc — Public Limited Company | |
See Sector Classification in Other Information section. |
The following table summarizes the inputs used to value the Fund’s net assets at October 31, 2015 (See Note 4 in the Notes to Financial Statements):
Investments in Securities | Level 1 | Level 2 | Level 3 | Total | ||||||||||||
Common Stocks | $ | 2,335,226,233 | $ | — | $ | — | $ | 2,335,226,233 | ||||||||
Short Term Investments | 2,384,919 | — | — | 2,384,919 | ||||||||||||
Total | $ | 2,337,611,152 | $ | — | $ | — | $ | 2,337,611,152 | ||||||||
For the year ended October 31, 2015, there were no transfers between levels.
SEE NOTES TO FINANCIAL STATEMENTS. | GUGGENHEIM ETFs ANNUAL REPORT | 25 |
SCHEDULE OF INVESTMENTS | October 31, 2015 |
GUGGENHEIM S&P MIDCAP 400® PURE VALUE ETF |
Shares | Value | |||||||
COMMON STOCKS† - 99.7% | ||||||||
Financial - 22.5% | ||||||||
Reinsurance Group of America, Inc. — Class A | 23,731 | $ | 2,141,486 | |||||
Old Republic International Corp. | 107,885 | 1,946,246 | ||||||
Hanover Insurance Group, Inc. | 21,652 | 1,824,181 | ||||||
StanCorp Financial Group, Inc. | 14,481 | 1,661,260 | ||||||
Aspen Insurance Holdings Ltd. | 32,084 | 1,559,603 | ||||||
CNO Financial Group, Inc. | 75,309 | 1,446,686 | ||||||
Kemper Corp. | 39,677 | 1,417,262 | ||||||
American Financial Group, Inc. | 19,443 | 1,403,590 | ||||||
First American Financial Corp. | 32,062 | 1,222,524 | ||||||
Everest Re Group Ltd. | 5,772 | 1,027,243 | ||||||
Fulton Financial Corp. | 55,507 | 744,904 | ||||||
Associated Banc-Corp. | 37,496 | 725,173 | ||||||
FirstMerit Corp. | 38,070 | 715,335 | ||||||
International Bancshares Corp. | 26,484 | 713,744 | ||||||
Trustmark Corp. | 28,997 | 696,798 | ||||||
Washington Federal, Inc. | 26,632 | 664,202 | ||||||
Mercury General Corp. | 12,237 | 660,920 | ||||||
Umpqua Holdings Corp. | 36,338 | 606,845 | ||||||
Hancock Holding Co. | 20,765 | 573,114 | ||||||
Valley National Bancorp | 44,934 | 471,807 | ||||||
TCF Financial Corp. | 28,426 | 437,476 | ||||||
New York Community Bancorp, Inc. | 24,831 | 410,208 | ||||||
Prosperity Bancshares, Inc. | 7,613 | 391,156 | ||||||
Total Financial | 23,461,763 | |||||||
Industrial - 21.5% | ||||||||
AGCO Corp. | 49,655 | 2,402,805 | ||||||
Tech Data Corp.* | 32,340 | 2,354,029 | ||||||
Avnet, Inc. | 43,549 | 1,978,430 | ||||||
KBR, Inc. | 97,003 | 1,788,736 | ||||||
Arrow Electronics, Inc.* | 31,705 | 1,743,458 | ||||||
AECOM* | 58,954 | 1,737,374 | ||||||
Orbital ATK, Inc. | 18,683 | 1,599,639 | ||||||
Terex Corp. | 65,709 | 1,318,122 | ||||||
Jabil Circuit, Inc. | 55,617 | 1,278,079 | ||||||
Oshkosh Corp. | 25,376 | 1,042,700 | ||||||
Greif, Inc. — Class A | 29,300 | 960,454 | ||||||
Vishay Intertechnology, Inc. | 83,524 | 885,354 | ||||||
Triumph Group, Inc. | 12,354 | 575,449 | ||||||
Kennametal, Inc. | 18,618 | 523,538 | ||||||
Granite Construction, Inc. | 15,421 | 506,426 | ||||||
Regal Beloit Corp. | 7,626 | 486,463 | ||||||
Bemis Company, Inc. | 10,550 | 482,979 | ||||||
Joy Global, Inc. | 26,084 | 448,123 | ||||||
Timken Co. | 9,626 | 304,182 | ||||||
Total Industrial | 22,416,340 | |||||||
Energy - 14.9% | ||||||||
HollyFrontier Corp. | 47,193 | 2,311,041 | ||||||
Nabors Industries Ltd. | 165,870 | 1,665,336 | ||||||
Noble Corporation plc | 123,052 | 1,657,510 | ||||||
Patterson-UTI Energy, Inc. | 92,573 | 1,378,412 | ||||||
Western Refining, Inc. | 32,185 | 1,339,540 | ||||||
Rowan Companies plc — Class A | 59,673 | 1,174,365 | ||||||
Murphy USA, Inc.* | 16,185 | 993,273 | ||||||
Superior Energy Services, Inc. | 65,959 | 933,979 | ||||||
QEP Resources, Inc. | 56,625 | 875,422 | ||||||
SM Energy Co. | 22,943 | 765,149 | ||||||
Denbury Resources, Inc. | 209,748 | 742,508 | ||||||
Atwood Oceanics, Inc. | 40,595 | 671,847 | ||||||
NOW, Inc.* | 39,882 | 658,452 | ||||||
Oil States International, Inc.* | 12,820 | 384,728 | ||||||
Total Energy | 15,551,562 | |||||||
Consumer, Cyclical - 12.1% | ||||||||
Ingram Micro, Inc. — Class A | 75,491 | 2,248,122 | ||||||
Ascena Retail Group, Inc.* | 150,858 | 2,009,429 | ||||||
World Fuel Services Corp. | 30,961 | 1,376,526 | ||||||
MDC Holdings, Inc. | 51,319 | 1,333,781 | ||||||
JC Penney Company, Inc.* | 99,100 | 908,747 | ||||||
Abercrombie & Fitch Co. — Class A | 41,541 | 880,254 | ||||||
Casey’s General Stores, Inc. | 7,705 | 818,425 | ||||||
Guess?, Inc. | 36,148 | 760,915 | ||||||
CST Brands, Inc. | 19,961 | 717,199 | ||||||
International Speedway Corp. — Class A | 18,080 | 627,195 | ||||||
Dana Holding Corp. | 29,779 | 500,287 | ||||||
Office Depot, Inc.* | 56,026 | 426,918 | ||||||
Total Consumer, Cyclical | 12,607,798 | |||||||
Consumer, Non-cyclical - 11.9% | ||||||||
ManpowerGroup, Inc. | 23,225 | 2,131,590 | ||||||
Health Net, Inc.* | 22,783 | 1,464,035 | ||||||
WellCare Health Plans, Inc.* | 15,699 | 1,390,931 | ||||||
Owens & Minor, Inc. | 34,748 | 1,245,716 | ||||||
RR Donnelley & Sons Co. | 64,878 | 1,094,492 | ||||||
Halyard Health, Inc.* | 29,955 | 889,064 | ||||||
Community Health Systems, Inc.* | 27,572 | 773,119 | ||||||
Rent-A-Center, Inc. | 40,853 | 751,287 | ||||||
Dean Foods Co. | 39,006 | 706,399 | ||||||
FTI Consulting, Inc.* | 19,655 | 668,467 | ||||||
Aaron’s, Inc. | 21,939 | 541,235 | ||||||
United Natural Foods, Inc.* | 9,384 | 473,423 | ||||||
Avon Products, Inc. | 65,155 | 262,575 | ||||||
Total Consumer, Non-cyclical | 12,392,333 | |||||||
26 | GUGGENHEIM ETFs ANNUAL REPORT | SEE NOTES TO FINANCIAL STATEMENTS. |
SCHEDULE OF INVESTMENTS (concluded) | October 31, 2015 |
GUGGENHEIM S&P MIDCAP 400® PURE VALUE ETF |
Shares | Value | |||||||
Basic Materials - 8.1% | ||||||||
Domtar Corp. | 53,601 | $ | 2,210,505 | |||||
Reliance Steel & Aluminum Co. | 27,436 | 1,645,062 | ||||||
Commercial Metals Co. | 100,389 | 1,442,590 | ||||||
Cabot Corp. | 24,991 | 898,177 | ||||||
Steel Dynamics, Inc. | 39,282 | 725,539 | ||||||
United States Steel Corp. | 55,009 | 642,505 | ||||||
Olin Corp. | 26,068 | 499,984 | ||||||
Allegheny Technologies, Inc. | 21,057 | 309,538 | ||||||
Total Basic Materials | 8,373,900 | |||||||
Utilities - 3.9% | ||||||||
ONE Gas, Inc. | 20,863 | 1,018,949 | ||||||
Great Plains Energy, Inc. | 28,439 | 782,073 | ||||||
Hawaiian Electric Industries, Inc. | 21,974 | 642,959 | ||||||
MDU Resources Group, Inc. | 29,618 | 558,595 | ||||||
Atmos Energy Corp. | 8,822 | 555,786 | ||||||
WGL Holdings, Inc. | 7,717 | 480,229 | ||||||
Total Utilities | 4,038,591 | |||||||
Communications - 2.4% | ||||||||
Telephone & Data Systems, Inc. | 54,834 | 1,570,446 | ||||||
Time, Inc. | 50,359 | 935,670 | ||||||
Total Communications | 2,506,116 | |||||||
Technology - 2.4% | ||||||||
Advanced Micro Devices, Inc.* | 317,498 | 673,096 | ||||||
Convergys Corp. | 26,005 | 667,548 | ||||||
Lexmark International, Inc. — Class A | 19,291 | 626,765 | ||||||
NCR Corp.* | 19,070 | 507,262 | ||||||
Total Technology | 2,474,671 | |||||||
Total Common Stocks | ||||||||
(Cost $105,625,516) | 103,823,074 | |||||||
SHORT TERM INVESTMENTS† - 0.3% | ||||||||
Federated U.S. Treasury Cash Reserve Fund 0.00%1 | 307,905 | 307,905 | ||||||
Total Short Term Investments | ||||||||
(Cost $307,905) | 307,905 | |||||||
Total Investments - 100.0% | ||||||||
(Cost $105,933,421) | $ | 104,130,979 | ||||||
Other Assets & Liabilities, net - 0.0% | 11,465 | |||||||
Total Net Assets - 100.0% | $ | 104,142,444 | ||||||
* | Non-income producing security. |
† | Value determined based on Level 1 inputs — See Note 4. |
1 | Rate indicated is the 7 day yield as of October 31, 2015. |
plc — Public Limited Company | |
See Sector Classification in Other Information section. |
The following table summarizes the inputs used to value the Fund’s net assets at October 31, 2015 (See Note 4 in the Notes to Financial Statements):
Investments in Securities | Level 1 | Level 2 | Level 3 | Total | ||||||||||||
Common Stocks | $ | 103,823,074 | $ | — | $ | — | $ | 103,823,074 | ||||||||
Short Term Investments | 307,905 | — | — | 307,905 | ||||||||||||
Total | $ | 104,130,979 | $ | — | $ | — | $ | 104,130,979 | ||||||||
For the year ended October 31, 2015, there were no transfers between levels.
SEE NOTES TO FINANCIAL STATEMENTS. | GUGGENHEIM ETFs ANNUAL REPORT | 27 |
SCHEDULE OF INVESTMENTS | October 31, 2015 |
GUGGENHEIM S&P MIDCAP 400® PURE GROWTH ETF |
Shares | Value | |||||||
COMMON STOCKS† - 99.9% | ||||||||
Consumer, Non-cyclical - 24.0% | ||||||||
Centene Corp.* | 261,873 | $ | 15,576,206 | |||||
United Therapeutics Corp.* | 95,435 | 13,993,635 | ||||||
PAREXEL International Corp.* | 211,111 | 13,325,326 | ||||||
Molina Healthcare, Inc.* | 196,968 | 12,212,016 | ||||||
Global Payments, Inc. | 87,138 | 11,886,495 | ||||||
WhiteWave Foods Co. — Class A* | 267,859 | 10,976,862 | ||||||
Hain Celestial Group, Inc.* | 192,717 | 9,606,942 | ||||||
Akorn, Inc.* | 315,444 | 8,434,973 | ||||||
Gartner, Inc.* | 79,923 | 7,246,619 | ||||||
VCA, Inc.* | 129,137 | 7,072,833 | ||||||
IDEXX Laboratories, Inc.* | 102,798 | 7,053,999 | ||||||
Live Nation Entertainment, Inc.* | 233,695 | 6,375,200 | ||||||
STERIS Corp. | 81,568 | 6,113,522 | ||||||
Service Corporation International | 209,281 | 5,914,281 | ||||||
SEI Investments Co. | 113,476 | 5,880,326 | ||||||
Boston Beer Company, Inc. — Class A* | 26,548 | 5,829,675 | ||||||
CEB, Inc. | 76,761 | 5,738,652 | ||||||
Catalent, Inc.* | 205,973 | 5,474,762 | ||||||
Align Technology, Inc.* | 77,167 | 5,051,352 | ||||||
MEDNAX, Inc.* | 68,221 | 4,807,534 | ||||||
Sirona Dental Systems, Inc.* | 43,777 | 4,777,384 | ||||||
Charles River Laboratories International, Inc.* | 60,277 | 3,932,471 | ||||||
WEX, Inc.* | 39,318 | 3,535,081 | ||||||
Cooper Companies, Inc. | 22,219 | 3,385,287 | ||||||
Total Consumer, Non-cyclical | 184,201,433 | |||||||
Financial - 21.6% | ||||||||
Extra Space Storage, Inc. | 175,643 | 13,917,951 | ||||||
Alexander & Baldwin, Inc. | 367,715 | 13,877,564 | ||||||
WisdomTree Investments, Inc. | 689,701 | 13,262,950 | ||||||
Post Properties, Inc. | 170,737 | 10,199,829 | ||||||
Camden Property Trust | 135,465 | 9,995,963 | ||||||
Jones Lang LaSalle, Inc. | 59,805 | 9,970,092 | ||||||
RenaissanceRe Holdings Ltd. | 78,872 | 8,646,737 | ||||||
Bank of the Ozarks, Inc. | 161,418 | 8,074,128 | ||||||
LaSalle Hotel Properties | 261,394 | 7,687,598 | ||||||
Care Capital Properties, Inc. | 222,438 | 7,329,332 | ||||||
Duke Realty Corp. | 352,777 | 7,302,484 | ||||||
Douglas Emmett, Inc. | 233,782 | 7,142,040 | ||||||
Sovran Self Storage, Inc. | 67,132 | 6,704,473 | ||||||
Signature Bank* | 42,439 | 6,320,016 | ||||||
Omega Healthcare Investors, Inc. | 179,190 | 6,185,639 | ||||||
Primerica, Inc. | 127,637 | 6,079,350 | ||||||
Weingarten Realty Investors | 167,562 | 5,992,017 | ||||||
Lamar Advertising Co. — Class A | 95,754 | 5,403,398 | ||||||
Regency Centers Corp. | 75,756 | 5,148,378 | ||||||
UDR, Inc. | 105,183 | 3,624,606 | ||||||
Kilroy Realty Corp. | 53,217 | 3,503,807 | ||||||
Total Financial | 166,368,352 | |||||||
Consumer, Cyclical - 21.3% | ||||||||
JetBlue Airways Corp.* | 902,900 | 22,428,037 | ||||||
Toll Brothers, Inc.* | 382,952 | 13,774,784 | ||||||
NVR, Inc.* | 8,403 | 13,762,097 | ||||||
Skechers U.S.A., Inc. — Class A* | 426,506 | 13,306,987 | ||||||
CalAtlantic Group, Inc.* | 301,764 | 11,494,191 | ||||||
Tempur Sealy International, Inc.* | 137,147 | 10,675,522 | ||||||
Alaska Air Group, Inc. | 130,981 | 9,987,301 | ||||||
Foot Locker, Inc. | 135,732 | 9,195,843 | ||||||
Buffalo Wild Wings, Inc.* | 52,764 | 8,139,902 | ||||||
Brunswick Corp. | 118,427 | 6,372,557 | ||||||
Domino’s Pizza, Inc. | 56,288 | 6,004,241 | ||||||
Polaris Industries, Inc. | 53,374 | 5,996,035 | ||||||
Carter’s, Inc. | 62,174 | 5,650,373 | ||||||
Williams-Sonoma, Inc. | 72,003 | 5,310,221 | ||||||
Jack in the Box, Inc. | 68,427 | 5,099,864 | ||||||
LKQ Corp.* | 163,869 | 4,852,161 | ||||||
Brinker International, Inc. | 70,907 | 3,226,978 | ||||||
HSN, Inc. | 51,036 | 3,156,577 | ||||||
Dunkin’ Brands Group, Inc. | 74,064 | 3,066,990 | ||||||
Deckers Outdoor Corp.* | 44,201 | 2,460,228 | ||||||
Total Consumer, Cyclical | 163,960,889 | |||||||
Technology - 14.9% | ||||||||
Cadence Design Systems, Inc.* | 713,703 | 15,858,481 | ||||||
SolarWinds, Inc.* | 248,770 | 14,436,123 | ||||||
Manhattan Associates, Inc.* | 195,206 | 14,220,757 | ||||||
Fortinet, Inc.* | 346,346 | 11,900,449 | ||||||
MAXIMUS, Inc. | 165,900 | 11,314,380 | ||||||
Synaptics, Inc.* | 110,159 | 9,373,429 | ||||||
NetScout Systems, Inc.* | 235,129 | 8,434,077 | ||||||
Ultimate Software Group, Inc.* | 35,142 | 7,181,268 | ||||||
Fair Isaac Corp. | 72,990 | 6,742,086 | ||||||
ACI Worldwide, Inc.* | 248,198 | 5,944,342 | ||||||
Tyler Technologies, Inc.* | 32,158 | 5,478,437 | ||||||
Rackspace Hosting, Inc.* | 148,552 | 3,840,069 | ||||||
Total Technology | 114,723,898 | |||||||
Industrial - 10.9% | ||||||||
Trinity Industries, Inc. | 522,718 | 14,149,976 | ||||||
Eagle Materials, Inc. | 186,368 | 12,305,879 | ||||||
Packaging Corporation of America | 129,889 | 8,890,902 | ||||||
Acuity Brands, Inc. | 37,401 | 8,175,859 | ||||||
Wabtec Corp. | 90,051 | 7,462,526 | ||||||
ITT Corp. | 174,752 | 6,916,684 | ||||||
Old Dominion Freight Line, Inc.* | 110,782 | 6,861,837 | ||||||
Zebra Technologies Corp. — Class A* | 82,040 | 6,308,876 | ||||||
Landstar System, Inc. | 83,590 | 5,269,514 | ||||||
Cognex Corp. | 114,363 | 4,300,049 | ||||||
Gentex Corp. | 210,673 | 3,452,930 | ||||||
Total Industrial | 84,095,032 | |||||||
28 | GUGGENHEIM ETFs ANNUAL REPORT | SEE NOTES TO FINANCIAL STATEMENTS. |
SCHEDULE OF INVESTMENTS (concluded) | October 31, 2015 |
GUGGENHEIM S&P MIDCAP 400® PURE GROWTH ETF |
Shares | Value | |||||||
Communications - 4.1% | ||||||||
ARRIS Group, Inc.* | 486,156 | $ | 13,738,769 | |||||
InterDigital, Inc. | 165,786 | 8,411,982 | ||||||
AMC Networks, Inc. — Class A* | 71,324 | 5,270,130 | ||||||
FactSet Research Systems, Inc. | 24,579 | 4,304,274 | ||||||
Total Communications | 31,725,155 | |||||||
Basic Materials - 2.3% | ||||||||
Cytec Industries, Inc. | 115,218 | 8,574,523 | ||||||
Minerals Technologies, Inc. | 89,121 | 5,252,792 | ||||||
Valspar Corp. | 47,730 | 3,863,744 | ||||||
Total Basic Materials | 17,691,059 | |||||||
Utilities - 0.8% | ||||||||
UGI Corp. | 172,914 | 6,340,756 | ||||||
Total Common Stocks | ||||||||
(Cost $707,822,915) | 769,106,574 | |||||||
SHORT TERM INVESTMENTS† - 0.1% | ||||||||
Federated U.S. Treasury Cash Reserve Fund 0.00%1 | 791,932 | 791,932 | ||||||
Total Short Term Investments | ||||||||
(Cost $791,932) | 791,932 | |||||||
Total Investments - 100.0% | ||||||||
(Cost $708,614,847) | $ | 769,898,506 | ||||||
Other Assets & Liabilities, net - 0.0% | (26,424 | ) | ||||||
Total Net Assets - 100.0% | $ | 769,872,082 | ||||||
* | Non-income producing security. |
† | Value determined based on Level 1 inputs — See Note 4. |
1 | Rate indicated is the 7 day yield as of October 31, 2015. |
See Sector Classification in Other Information section. |
The following table summarizes the inputs used to value the Fund’s net assets at October 31, 2015 (See Note 4 in the Notes to Financial Statements):
Investments in Securities | Level 1 | Level 2 | Level 3 | Total | ||||||||||||
Common Stocks | $ | 769,106,574 | $ | — | $ | — | $ | 769,106,574 | ||||||||
Short Term Investments | 791,932 | — | — | 791,932 | ||||||||||||
Total | $ | 769,898,506 | $ | — | $ | — | $ | 769,898,506 | ||||||||
For the year ended October 31, 2015, there were no transfers between levels.
SEE NOTES TO FINANCIAL STATEMENTS. | GUGGENHEIM ETFs ANNUAL REPORT | 29 |
SCHEDULE OF INVESTMENTS | October 31, 2015 |
GUGGENHEIM S&P SMALLCAP 600® PURE VALUE ETF |
Shares | Value | |||||||
COMMON STOCKS† - 100.0% | ||||||||
Industrial - 22.4% | ||||||||
Gibraltar Industries, Inc.* | 104,049 | $ | 2,634,520 | |||||
Comfort Systems USA, Inc. | 65,913 | 2,104,602 | ||||||
Universal Forest Products, Inc. | 27,862 | 2,023,617 | ||||||
Griffon Corp. | 110,676 | 1,901,414 | ||||||
TTM Technologies, Inc.* | 250,962 | 1,832,023 | ||||||
Benchmark Electronics, Inc.* | 73,995 | 1,463,620 | ||||||
Atlas Air Worldwide Holdings, Inc.* | 33,079 | 1,364,178 | ||||||
AAR Corp. | 59,103 | 1,341,047 | ||||||
Aegion Corp. — Class A* | 68,499 | 1,321,346 | ||||||
EMCOR Group, Inc. | 24,215 | 1,169,100 | ||||||
Sanmina Corp.* | 56,088 | 1,159,339 | ||||||
Olympic Steel, Inc. | 113,920 | 1,090,214 | ||||||
National Presto Industries, Inc. | 12,189 | 1,073,241 | ||||||
Fabrinet* | 47,826 | 1,036,389 | ||||||
Hub Group, Inc. — Class A* | 25,038 | 1,001,019 | ||||||
Encore Wire Corp. | 21,797 | 932,258 | ||||||
Briggs & Stratton Corp. | 50,423 | 896,017 | ||||||
Tidewater, Inc. | 69,739 | 861,277 | ||||||
Plexus Corp.* | 23,932 | 828,526 | ||||||
II-VI, Inc.* | 42,003 | 761,094 | ||||||
Tredegar Corp. | 47,449 | 676,623 | ||||||
SPX Corp. | 53,619 | 656,833 | ||||||
Kaman Corp. | 16,881 | 656,502 | ||||||
Hornbeck Offshore Services, Inc.* | 47,516 | 641,941 | ||||||
General Cable Corp. | 37,788 | 581,557 | ||||||
Roadrunner Transportation Systems, Inc.* | 53,184 | 565,878 | ||||||
Powell Industries, Inc. | 13,630 | 454,152 | ||||||
Tetra Tech, Inc. | 16,324 | 439,116 | ||||||
Celadon Group, Inc. | 29,930 | 433,386 | ||||||
Chart Industries, Inc.* | 21,887 | 376,238 | ||||||
DXP Enterprises, Inc.* | 12,254 | 370,806 | ||||||
Astec Industries, Inc. | 10,792 | 350,740 | ||||||
TimkenSteel Corp. | 22,906 | 243,720 | ||||||
LSB Industries, Inc.* | 12,801 | 200,336 | ||||||
Total Industrial | 33,442,669 | |||||||
Consumer, Non-cyclical - 20.3% | ||||||||
Central Garden & Pet Co. — Class A* | 172,052 | 2,904,238 | ||||||
Universal Corp. | 48,020 | 2,593,560 | ||||||
Seneca Foods Corp. — Class A* | 66,508 | 1,940,703 | ||||||
Kelly Services, Inc. — Class A | 114,901 | 1,815,436 | ||||||
Monster Worldwide, Inc.* | 280,126 | 1,756,390 | ||||||
LHC Group, Inc.* | 38,116 | 1,717,698 | ||||||
Viad Corp. | 55,883 | 1,682,637 | ||||||
PharMerica Corp.* | 57,718 | 1,649,003 | ||||||
Almost Family, Inc.* | 39,659 | 1,641,089 | ||||||
SpartanNash Co. | 57,111 | 1,593,397 | ||||||
ABM Industries, Inc. | 45,319 | 1,287,060 | ||||||
Brink’s Co. | 40,058 | 1,240,997 | ||||||
TrueBlue, Inc.* | 40,444 | 1,171,663 | ||||||
Magellan Health, Inc.* | 20,573 | 1,098,598 | ||||||
Insperity, Inc. | 21,633 | 1,005,069 | ||||||
Invacare Corp. | 53,241 | 920,004 | ||||||
Kindred Healthcare, Inc. | 64,787 | 868,146 | ||||||
Andersons, Inc. | 22,749 | 805,315 | ||||||
Central Garden & Pet Co.* | 46,073 | 733,021 | ||||||
CDI Corp. | 88,872 | 710,976 | ||||||
Hanger, Inc.* | 47,587 | 686,205 | ||||||
Heidrick & Struggles International, Inc. | 25,093 | 666,470 | ||||||
Total Consumer, Non-cyclical | 30,487,675 | |||||||
Consumer, Cyclical - 19.7% | ||||||||
Cash America International, Inc. | 97,750 | 3,375,307 | ||||||
SkyWest, Inc. | 146,087 | 2,781,496 | ||||||
Pep Boys-Manny Moe & Jack* | 178,133 | 2,679,120 | ||||||
M/I Homes, Inc.* | 71,648 | 1,644,322 | ||||||
ScanSource, Inc.* | 35,460 | 1,223,725 | ||||||
Sonic Automotive, Inc. — Class A | 44,246 | 1,103,495 | ||||||
Superior Industries International, Inc. | 55,195 | 1,086,237 | ||||||
Essendant, Inc. | 30,621 | 1,058,568 | ||||||
EZCORP, Inc. — Class A* | 151,898 | 1,011,641 | ||||||
Big 5 Sporting Goods Corp. | 103,606 | 947,995 | ||||||
Fred’s, Inc. — Class A | 67,506 | 933,608 | ||||||
Veritiv Corp.* | 22,159 | 930,678 | ||||||
Perry Ellis International, Inc.* | 42,141 | 904,767 | ||||||
Titan International, Inc. | 123,857 | 879,385 | ||||||
Haverty Furniture Companies, Inc. | 36,107 | 845,265 | ||||||
Biglari Holdings, Inc.* | 2,114 | 812,051 | ||||||
Express, Inc.* | 40,058 | 773,119 | ||||||
Unifi, Inc.* | 23,035 | 704,641 | ||||||
Marcus Corp. | 33,972 | 702,881 | ||||||
Callaway Golf Co. | 66,682 | 663,486 | ||||||
Ruby Tuesday, Inc.* | 121,991 | 638,013 | ||||||
Barnes & Noble, Inc. | 48,220 | 626,378 | ||||||
Stage Stores, Inc. | 61,343 | 596,867 | ||||||
VOXX International Corp. — Class A* | 98,679 | 509,184 | ||||||
Arctic Cat, Inc. | 22,832 | 468,969 | ||||||
Children’s Place, Inc. | 8,421 | 451,955 | ||||||
Stein Mart, Inc. | 50,580 | 448,139 | ||||||
Genesco, Inc.* | 6,738 | 422,136 | ||||||
Movado Group, Inc. | 13,596 | 349,961 | ||||||
Total Consumer, Cyclical | 29,573,389 | |||||||
Financial - 11.8% | ||||||||
United Fire Group, Inc. | 46,554 | 1,731,344 | ||||||
Stewart Information Services Corp. | 40,701 | 1,634,959 | ||||||
International. FCStone, Inc.* | 47,892 | 1,532,065 | ||||||
Employers Holdings, Inc. | 56,901 | 1,506,169 | ||||||
Selective Insurance Group, Inc. | 38,295 | 1,397,385 | ||||||
Infinity Property & Casualty Corp. | 14,482 | 1,166,091 | ||||||
Navigators Group, Inc.* | 13,189 | 1,125,681 | ||||||
Astoria Financial Corp. | 65,150 | 1,039,794 | ||||||
Horace Mann Educators Corp. | 28,305 | 969,163 | ||||||
Forestar Group, Inc.* | 53,602 | 758,468 | ||||||
Provident Financial Services, Inc. | 32,053 | 651,317 | ||||||
30 | GUGGENHEIM ETFs ANNUAL REPORT | SEE NOTES TO FINANCIAL STATEMENTS. |
SCHEDULE OF INVESTMENTS (continued) | October 31, 2015 |
GUGGENHEIM S&P SMALLCAP 600® PURE VALUE ETF |
Shares | Value | |||||||
Calamos Asset Management, Inc. — Class A | 63,500 | $ | 596,265 | |||||
Safety Insurance Group, Inc. | 9,729 | 563,796 | ||||||
Wintrust Financial Corp. | 10,512 | 530,751 | ||||||
First BanCorp* | 138,572 | 525,188 | ||||||
OFG Bancorp | 56,388 | 519,333 | ||||||
ProAssurance Corp. | 8,605 | 455,721 | ||||||
Central Pacific Financial Corp. | 17,615 | 393,871 | ||||||
Old National Bancorp | 25,886 | 362,404 | ||||||
Capstead Mortgage Corp. | 33,986 | 327,965 | ||||||
Total Financial | 17,787,730 | |||||||
Energy - 9.9% | ||||||||
Green Plains, Inc. | 65,564 | 1,344,718 | ||||||
TETRA Technologies, Inc.* | 188,679 | 1,271,697 | ||||||
Matrix Service Co.* | 54,443 | 1,235,857 | ||||||
Basic Energy Services, Inc.* | 272,999 | 1,012,826 | ||||||
Northern Oil and Gas, Inc.* | 189,964 | 957,418 | ||||||
Pioneer Energy Services Corp.* | 366,220 | 845,968 | ||||||
PDC Energy, Inc.* | 12,873 | 776,757 | ||||||
SEACOR Holdings, Inc.* | 12,644 | 738,662 | ||||||
Gulf Island Fabrication, Inc. | 72,628 | 734,269 | ||||||
Unit Corp.* | 51,227 | 645,972 | ||||||
FutureFuel Corp. | 39,049 | 601,745 | ||||||
Cloud Peak Energy, Inc.* | 187,041 | 555,512 | ||||||
Tesco Corp. | 62,791 | 502,328 | ||||||
Helix Energy Solutions Group, Inc.* | 79,702 | 460,678 | ||||||
Newpark Resources, Inc.* | 80,486 | 455,551 | ||||||
Geospace Technologies Corp.* | 28,931 | 444,380 | ||||||
Archrock, Inc.* | 19,188 | 417,147 | ||||||
CARBO Ceramics, Inc. | 23,367 | 409,390 | ||||||
Rex Energy Corp.* | 162,730 | 367,770 | ||||||
Stone Energy Corp.* | 58,732 | 328,312 | ||||||
Gulfmark Offshore, Inc. — Class A | 46,959 | 293,024 | ||||||
Bristow Group, Inc. | 6,529 | 226,752 | ||||||
ION Geophysical Corp.* | 409,084 | 151,361 | ||||||
Penn Virginia Corp.* | 203,518 | 125,957 | ||||||
Total Energy | 14,904,051 | |||||||
Technology - 6.6% | ||||||||
Insight Enterprises, Inc.* | 65,038 | 1,651,965 | ||||||
SYNNEX Corp. | 16,872 | 1,492,160 | ||||||
Digi International, Inc.* | 109,337 | 1,410,447 | ||||||
Ciber, Inc.* | 385,229 | 1,375,268 | ||||||
CACI International, Inc. — Class A* | 10,304 | 999,900 | ||||||
ManTech International Corp. — Class A | 31,899 | 921,881 | ||||||
Engility Holdings, Inc. | 25,082 | 807,390 | ||||||
Sykes Enterprises, Inc.* | 26,410 | 765,890 | ||||||
Cohu, Inc. | 42,268 | 532,154 | ||||||
Total Technology | 9,957,055 | |||||||
Basic Materials - 4.9% | ||||||||
Stepan Co. | 29,482 | 1,560,482 | ||||||
Kraton Performance Polymers, Inc.* | 71,657 | 1,461,086 | ||||||
A. Schulman, Inc. | 24,232 | 869,686 | ||||||
Kaiser Aluminum Corp. | 10,419 | 846,961 | ||||||
Materion Corp. | 23,318 | 703,038 | ||||||
PH Glatfelter Co. | 34,367 | 666,720 | ||||||
American Vanguard Corp. | 37,378 | 501,239 | ||||||
Innospec, Inc. | 7,170 | 396,070 | ||||||
Koppers Holdings, Inc. | 17,934 | 340,029 | ||||||
Total Basic Materials | 7,345,311 | |||||||
Communications - 3.9% | ||||||||
Liquidity Services, Inc.* | 180,828 | 1,480,981 | ||||||
Scholastic Corp. | 25,691 | 1,049,991 | ||||||
Anixter International, Inc.* | 11,745 | 805,473 | ||||||
Harte-Hanks, Inc. | 159,015 | 675,814 | ||||||
Blucora, Inc.* | 66,178 | 648,544 | ||||||
NETGEAR, Inc.* | 12,735 | 527,229 | ||||||
Spok Holdings, Inc. | 26,871 | 484,484 | ||||||
Black Box Corp. | 15,481 | 189,023 | ||||||
Total Communications | 5,861,539 | |||||||
Utilities - 0.5% | ||||||||
Laclede Group, Inc. | 7,269 | 425,745 | ||||||
Avista Corp. | 10,768 | 364,497 | ||||||
Total Utilities | 790,242 | |||||||
Total Common Stocks | ||||||||
(Cost $155,043,112) | 150,149,661 | |||||||
SHORT TERM INVESTMENTS† - 0.0% | ||||||||
Federated U.S. Treasury Cash Reserve Fund 0.00%1 | 23,789 | 23,789 | ||||||
Total Short Term Investments | ||||||||
(Cost $23,789) | 23,789 | |||||||
Total Investments - 100.0% | ||||||||
(Cost $155,066,901) | $ | 150,173,450 | ||||||
Other Assets & Liabilities, net - 0.0% | 16,711 | |||||||
Total Net Assets - 100.0% | $ | 150,190,161 | ||||||
* | Non-income producing security. |
† | Value determined based on Level 1 inputs — See Note 4. |
1 | Rate indicated is the 7 day yield as of October 31, 2015. |
See Sector Classification in Other Information section. |
SEE NOTES TO FINANCIAL STATEMENTS. | GUGGENHEIM ETFs ANNUAL REPORT | 31 |
SCHEDULE OF INVESTMENTS (concluded) | October 31, 2015 |
GUGGENHEIM S&P SMALLCAP 600® PURE VALUE ETF |
The following table summarizes the inputs used to value the Fund’s net assets at October 31, 2015 (See Note 4 in the Notes to Financial Statements):
Investments in Securities | Level 1 | Level 2 | Level 3 | Total | ||||||||||||
Common Stocks | $ | 150,149,661 | $ | — | $ | — | $ | 150,149,661 | ||||||||
Short Term Investments | 23,789 | — | — | 23,789 | ||||||||||||
Total | $ | 150,173,450 | $ | — | $ | — | $ | 150,173,450 | ||||||||
For the year ended October 31, 2015, there were no transfers between levels.
32 | GUGGENHEIM ETFs ANNUAL REPORT | SEE NOTES TO FINANCIAL STATEMENTS. |
SCHEDULE OF INVESTMENTS | October 31, 2015 |
GUGGENHEIM S&P SMALLCAP 600® PURE GROWTH ETF |
Shares | Value | |||||||
COMMON STOCKS† - 99.9% | ||||||||
Consumer, Non-cyclical - 27.2% | ||||||||
LendingTree, Inc.* | 38,569 | $ | 4,680,734 | |||||
Lannett Company, Inc.* | 96,038 | 4,299,621 | ||||||
ABIOMED, Inc.* | 54,316 | 4,000,917 | ||||||
On Assignment, Inc.* | 78,178 | 3,526,609 | ||||||
Repligen Corp.* | 101,231 | 3,364,918 | ||||||
Supernus Pharmaceuticals, Inc.* | 188,823 | 3,115,580 | ||||||
AMN Healthcare Services, Inc.* | 91,950 | 2,608,622 | ||||||
Natus Medical, Inc.* | 54,116 | 2,463,902 | ||||||
Nektar Therapeutics* | 203,702 | 2,417,942 | ||||||
Cal-Maine Foods, Inc. | 42,134 | 2,252,484 | ||||||
MiMedx Group, Inc.* | 305,901 | 2,226,959 | ||||||
Depomed, Inc.* | 123,191 | 2,155,843 | ||||||
Cynosure, Inc. — Class A* | 57,032 | 2,146,684 | ||||||
Cambrex Corp.* | 45,376 | 2,085,935 | ||||||
Chemed Corp. | 13,148 | 2,068,049 | ||||||
Ligand Pharmaceuticals, Inc. — Class B* | 22,465 | 2,029,713 | ||||||
Calavo Growers, Inc. | 39,154 | 2,012,907 | ||||||
ExamWorks Group, Inc.* | 62,899 | 1,776,268 | ||||||
Anika Therapeutics, Inc.* | 39,378 | 1,516,841 | ||||||
Albany Molecular Research, Inc.* | 80,609 | 1,454,186 | ||||||
Snyder’s-Lance, Inc. | 40,838 | 1,451,383 | ||||||
Helen of Troy Ltd.* | 14,353 | 1,423,961 | ||||||
Ensign Group, Inc. | 31,984 | 1,348,445 | ||||||
Cantel Medical Corp. | 20,795 | 1,232,728 | ||||||
Abaxis, Inc. | 24,386 | 1,224,421 | ||||||
Impax Laboratories, Inc.* | 26,371 | 913,228 | ||||||
J&J Snack Foods Corp. | 6,599 | 810,291 | ||||||
Affymetrix, Inc.* | 86,721 | 797,833 | ||||||
Total Consumer, Non-cyclical | 61,407,004 | |||||||
Financial - 21.8% | ||||||||
Universal Insurance Holdings, Inc. | 138,273 | 4,362,513 | ||||||
CoreSite Realty Corp. | 63,991 | 3,516,305 | ||||||
Chesapeake Lodging Trust | 94,607 | 2,605,477 | ||||||
Bank Mutual Corp. | 335,991 | 2,432,575 | ||||||
Sabra Health Care REIT, Inc. | 103,007 | 2,336,200 | ||||||
American Assets Trust, Inc. | 54,627 | 2,303,074 | ||||||
Ameris Bancorp | 69,476 | 2,188,494 | ||||||
HFF, Inc. — Class A | 62,655 | 2,162,851 | ||||||
DiamondRock Hospitality Co. | 171,456 | 2,002,606 | ||||||
Universal Health Realty Income Trust | 38,891 | 1,932,494 | ||||||
Home BancShares, Inc. | 44,948 | 1,929,168 | ||||||
Glacier Bancorp, Inc. | 64,151 | 1,755,171 | ||||||
First Midwest Bancorp, Inc. | 97,460 | 1,736,737 | ||||||
Retail Opportunity Investments Corp. | 94,603 | 1,715,152 | ||||||
PrivateBancorp, Inc. — Class A | 39,429 | 1,649,315 | ||||||
MB Financial, Inc. | 47,834 | 1,542,168 | ||||||
Boston Private Financial Holdings, Inc. | 128,919 | 1,477,412 | ||||||
HCI Group, Inc. | 32,267 | 1,407,164 | ||||||
PRA Group, Inc.* | 24,601 | 1,348,135 | ||||||
Pinnacle Financial Partners, Inc. | 24,903 | 1,310,396 | ||||||
BofI Holding, Inc.* | 16,001 | 1,280,240 | ||||||
Medical Properties Trust, Inc. | 102,888 | 1,162,634 | ||||||
Education Realty Trust, Inc. | 31,424 | 1,128,436 | ||||||
Healthcare Realty Trust, Inc. | 39,029 | 1,028,804 | ||||||
Inland Real Estate Corp. | 98,268 | 869,672 | ||||||
Enova International, Inc.* | 59,621 | 775,073 | ||||||
Cousins Properties, Inc. | 75,395 | 756,966 | ||||||
CareTrust REIT, Inc. | 54,016 | 611,461 | ||||||
Total Financial | 49,326,693 | |||||||
Consumer, Cyclical - 14.8% | ||||||||
Gentherm, Inc.* | 90,505 | 4,449,226 | ||||||
Pinnacle Entertainment, Inc.* | 90,911 | 3,182,794 | ||||||
Meritage Homes Corp.* | 72,184 | 2,545,208 | ||||||
G-III Apparel Group Ltd.* | 44,600 | 2,457,014 | ||||||
Allegiant Travel Co. — Class A | 10,882 | 2,148,651 | ||||||
DTS, Inc.* | 66,915 | 1,991,390 | ||||||
Papa John’s International, Inc. | 28,263 | 1,983,215 | ||||||
Popeyes Louisiana Kitchen, Inc.* | 28,258 | 1,594,882 | ||||||
Sonic Corp. | 52,156 | 1,488,532 | ||||||
Winnebago Industries, Inc. | 69,779 | 1,464,661 | ||||||
BJ’s Restaurants, Inc.* | 33,514 | 1,438,756 | ||||||
Texas Roadhouse, Inc. — Class A | 35,511 | 1,219,803 | ||||||
Outerwall, Inc. | 20,000 | 1,200,000 | ||||||
Select Comfort Corp.* | 55,276 | 1,171,851 | ||||||
Universal Electronics, Inc.* | 19,624 | 933,514 | ||||||
Marriott Vacations Worldwide Corp. | 12,867 | 828,635 | ||||||
Zumiez, Inc.* | 47,250 | 825,930 | ||||||
Wolverine World Wide, Inc. | 37,498 | 696,337 | ||||||
Francesca’s Holdings Corp.* | 46,390 | 659,202 | ||||||
Scientific Games Corp. — Class A* | 56,489 | 626,463 | ||||||
Iconix Brand Group, Inc.* | 37,430 | 573,428 | ||||||
Total Consumer, Cyclical | 33,479,492 | |||||||
Industrial - 13.8% | ||||||||
TASER International, Inc.* | 154,612 | 3,619,467 | ||||||
PGT, Inc.* | 253,194 | 3,053,519 | ||||||
Apogee Enterprises, Inc. | 51,901 | 2,570,657 | ||||||
Methode Electronics, Inc. | 69,946 | 2,331,300 | ||||||
Lydall, Inc.* | 67,904 | 2,324,353 | ||||||
Headwaters, Inc.* | 109,416 | 2,248,499 | ||||||
Heartland Express, Inc. | 88,523 | 1,666,889 | ||||||
Hillenbrand, Inc. | 53,133 | 1,576,456 | ||||||
ArcBest Corp. | 59,930 | 1,552,187 | ||||||
US Ecology, Inc. | 39,524 | 1,549,736 | ||||||
KapStone Paper and Packaging Corp. | 64,975 | 1,413,206 | ||||||
Bel Fuse, Inc. — Class B | 68,825 | 1,240,915 | ||||||
Knight Transportation, Inc. | 48,012 | 1,220,465 | ||||||
Curtiss-Wright Corp. | 16,974 | 1,180,711 | ||||||
Matson, Inc. | 25,271 | 1,158,170 | ||||||
AZZ, Inc. | 18,741 | 1,036,940 | ||||||
Saia, Inc.* | 30,089 | 710,401 | ||||||
SEE NOTES TO FINANCIAL STATEMENTS. | GUGGENHEIM ETFs ANNUAL REPORT | 33 |
SCHEDULE OF INVESTMENTS (concluded) | October 31, 2015 |
GUGGENHEIM S&P SMALLCAP 600® PURE GROWTH ETF |
Shares | Value | |||||||
Forward Air Corp. | 14,722 | $ | 667,790 | |||||
Total Industrial | 31,121,661 | |||||||
Technology - 9.1% | ||||||||
Take-Two Interactive Software, Inc.* | 151,635 | 5,034,282 | ||||||
Synchronoss Technologies, Inc.* | 77,627 | 2,730,918 | ||||||
Omnicell, Inc.* | 71,262 | 1,938,327 | ||||||
Monolithic Power Systems, Inc. | 29,423 | 1,836,584 | ||||||
Virtusa Corp.* | 30,673 | 1,761,550 | ||||||
Super Micro Computer, Inc.* | 57,083 | 1,610,311 | ||||||
Tessera Technologies, Inc. | 40,512 | 1,416,705 | ||||||
Blackbaud, Inc. | 22,265 | 1,395,793 | ||||||
Constant Contact, Inc.* | 45,983 | 1,200,156 | ||||||
Electronics for Imaging, Inc.* | 22,543 | 1,046,897 | ||||||
MicroStrategy, Inc. — Class A* | 3,507 | 603,449 | ||||||
Total Technology | 20,574,972 | |||||||
Communications - 7.6% | ||||||||
General Communication, Inc. — Class A* | 221,575 | 4,512,375 | ||||||
LogMeIn, Inc.* | 45,187 | 3,043,796 | ||||||
DHI Group, Inc.* | 233,807 | 2,115,953 | ||||||
j2 Global, Inc. | 27,116 | 2,102,846 | ||||||
comScore, Inc.* | 36,465 | 1,559,973 | ||||||
EW Scripps Co. — Class A | 62,362 | 1,375,706 | ||||||
Consolidated Communications Holdings, Inc. | 43,334 | 957,681 | ||||||
VASCO Data Security International, Inc.* | 41,631 | 791,405 | ||||||
ViaSat, Inc.* | 11,584 | 764,081 | ||||||
Total Communications | 17,223,816 | |||||||
Energy - 3.5% | ||||||||
Synergy Resources Corp.* | 294,596 | 3,296,529 | ||||||
Carrizo Oil & Gas, Inc.* | 79,038 | 2,974,200 | ||||||
Flotek Industries, Inc.* | 89,242 | 1,615,280 | ||||||
Total Energy | 7,886,009 | |||||||
Basic Materials - 2.1% | ||||||||
Deltic Timber Corp. | 20,595 | 1,276,066 | ||||||
Neenah Paper, Inc. | 17,924 | 1,208,257 | ||||||
US Silica Holdings, Inc. | 59,503 | 1,074,624 | ||||||
Balchem Corp. | 13,448 | 918,498 | ||||||
Century Aluminum Co.* | 59,019 | 213,649 | ||||||
Total Basic Materials | 4,691,094 | |||||||
Total Common Stocks | ||||||||
(Cost $228,581,287) | 225,710,741 | |||||||
SHORT TERM INVESTMENTS† - 0.1% | ||||||||
Federated U.S. Treasury Cash Reserve Fund 0.00%1 | 178,982 | 178,982 | ||||||
Total Short Term Investments | ||||||||
(Cost $178,982) | 178,982 | |||||||
Total Investments - 100.0% | ||||||||
(Cost $228,760,269) | $ | 225,889,723 | ||||||
Other Assets & Liabilities, net - 0.0% | 43,311 | |||||||
Total Net Assets - 100.0% | $ | 225,933,034 | ||||||
* | Non-income producing security. |
† | Value determined based on Level 1 inputs — See Note 4. |
1 | Rate indicated is the 7 day yield as of October 31, 2015. |
REIT — Real Estate Investment Trust | |
See Sector Classification in Other Information section. |
The following table summarizes the inputs used to value the Fund’s net assets at October 31, 2015 (See Note 4 in the Notes to Financial Statements):
Investments in Securities | Level 1 | Level 2 | Level 3 | Total | ||||||||||||
Common Stocks | $ | 225,710,741 | $ | — | $ | — | $ | 225,710,741 | ||||||||
Short Term Investments | 178,982 | — | — | 178,982 | ||||||||||||
Total | $ | 225,889,723 | $ | — | $ | — | $ | 225,889,723 | ||||||||
For the year ended October 31, 2015, there were no transfers between levels.
34 | GUGGENHEIM ETFs ANNUAL REPORT | SEE NOTES TO FINANCIAL STATEMENTS. |
STATEMENTS OF ASSETS AND LIABILITIES | October 31, 2015 |
Guggenheim | Guggenheim | Guggenheim | Guggenheim S&P | |||||||||||||
Assets: | ||||||||||||||||
Investments, at value* | $ | 495,903,348 | $ | 812,475,047 | $ | 2,337,611,152 | $ | 104,130,979 | ||||||||
Receivables: | ||||||||||||||||
Fund shares sold | — | — | 9,403 | — | ||||||||||||
Investments sold | 198,121 | — | 97 | — | ||||||||||||
Dividends and interest | 601,005 | 790,734 | 1,628,310 | 42,224 | ||||||||||||
Total assets | 496,702,474 | 813,265,781 | 2,339,248,962 | 104,173,203 | ||||||||||||
Liabilities: | ||||||||||||||||
Payable for: | ||||||||||||||||
Due to custodian | 357,574 | — | — | — | ||||||||||||
Management fees | 80,929 | 236,558 | 663,417 | 30,759 | ||||||||||||
Total liabilities | 438,503 | 236,558 | 663,417 | 30,759 | ||||||||||||
Commitments and contingent liabilities (Note 8) | — | — | — | — | ||||||||||||
Net assets | $ | 496,263,971 | $ | 813,029,223 | $ | 2,338,585,545 | $ | 104,142,444 | ||||||||
Net assets consist of: | ||||||||||||||||
Paid-in capital | $ | 522,723,220 | $ | 890,828,251 | $ | 2,134,651,814 | $ | 110,777,662 | ||||||||
Undistributed net investment income | 861,244 | 249,496 | — | 65,209 | ||||||||||||
Accumulated net realized loss on investments | (103,031,375 | ) | (22,949,656 | ) | (1,808,925 | ) | (4,897,985 | ) | ||||||||
Net unrealized appreciation (depreciation) on investments | 75,710,882 | (55,098,868 | ) | 205,742,656 | (1,802,442 | ) | ||||||||||
Net assets | $ | 496,263,971 | $ | 813,029,223 | $ | 2,338,585,545 | $ | 104,142,444 | ||||||||
Shares outstanding (unlimited shares authorized), no par value | 3,400,785 | 15,802,836 | 28,200,299 | 2,050,499 | ||||||||||||
Net asset value, offering price and repurchase price per share | $ | 145.93 | $ | 51.45 | $ | 82.93 | $ | 50.79 | ||||||||
*Total cost of investments | $ | 420,192,466 | $ | 867,573,915 | $ | 2,131,868,496 | $ | 105,933,421 | ||||||||
SEE NOTES TO FINANCIAL STATEMENTS. | GUGGENHEIM ETFs ANNUAL REPORT | 35 |
STATEMENTS OF ASSETS AND LIABILITIES (concluded) | October 31, 2015 |
Guggenheim S&P | Guggenheim S&P | Guggenheim S&P | ||||||||||
Assets: | ||||||||||||
Investments, at value* | $ | 769,898,506 | $ | 150,173,450 | $ | 225,889,723 | ||||||
Receivables: | ||||||||||||
Investments sold | — | — | 2,212,851 | |||||||||
Dividends and interest | 199,763 | 60,482 | 83,396 | |||||||||
Tax reclaims | — | 992 | 775 | |||||||||
Total assets | 770,098,269 | 150,234,924 | 228,186,745 | |||||||||
Liabilities: | ||||||||||||
Payable for: | ||||||||||||
Investments purchased | — | — | 2,188,494 | |||||||||
Management fees | 226,187 | 44,763 | 65,217 | |||||||||
Total liabilities | 226,187 | 44,763 | 2,253,711 | |||||||||
Commitments and contingent liabilities (Note 8) | — | — | — | |||||||||
Net assets | $ | 769,872,082 | $ | 150,190,161 | $ | 225,933,034 | ||||||
Net assets consist of: | ||||||||||||
Paid-in capital | $ | 716,433,193 | $ | 176,816,130 | $ | 230,126,152 | ||||||
Undistributed net investment income | — | 14,208 | — | |||||||||
Accumulated net realized loss on investments | (7,844,770 | ) | (21,746,726 | ) | (1,322,572 | ) | ||||||
Net unrealized appreciation (depreciation) on investments | 61,283,659 | (4,893,451 | ) | (2,870,546 | ) | |||||||
Net assets | $ | 769,872,082 | $ | 150,190,161 | $ | 225,933,034 | ||||||
Shares outstanding (unlimited shares authorized), no par value | 6,000,021 | 2,600,040 | 2,650,004 | |||||||||
Net asset value, offering price and repurchase price per share | $ | 128.31 | $ | 57.76 | $ | 85.26 | ||||||
*Total cost of investments | $ | 708,614,847 | $ | 155,066,901 | $ | 228,760,269 | ||||||
36 | GUGGENHEIM ETFs ANNUAL REPORT | SEE NOTES TO FINANCIAL STATEMENTS. |
STATEMENTS OF OPERATIONS |
For the Year Ended October 31, 2015
Guggenheim | Guggenheim | Guggenheim | Guggenheim S&P | |||||||||||||
Investment Income: | ||||||||||||||||
Dividends | $ | 12,294,526 | $ | 23,277,641 | $ | 20,378,198 | $ | 2,213,909 | ||||||||
Income from securities lending | — | 1,637,139 | 25,323 | 86,074 | ||||||||||||
Interest | 15 | 16 | 11 | 4 | ||||||||||||
Total investment income | 12,294,541 | 24,914,796 | 20,403,532 | 2,299,987 | ||||||||||||
Expenses: | ||||||||||||||||
Management fees | 1,065,507 | 3,572,028 | 7,241,303 | 407,904 | ||||||||||||
Total expenses | 1,065,507 | 3,572,028 | 7,241,303 | 407,904 | ||||||||||||
Net investment income | 11,229,034 | 21,342,768 | 13,162,229 | 1,892,083 | ||||||||||||
Net Realized and Unrealized Gain (Loss): | ||||||||||||||||
Net realized gain (loss) on: | ||||||||||||||||
Investments | 2,952,909 | (20,214,367 | ) | 6,225,299 | (3,583,930 | ) | ||||||||||
In-kind redemptions | 49,768,138 | 105,478,890 | 73,503,328 | 13,071,433 | ||||||||||||
Net realized gain | 52,721,047 | 85,264,523 | 79,728,627 | 9,487,503 | ||||||||||||
Net change in unrealized appreciation (depreciation) on: | ||||||||||||||||
Investments | (33,501,768 | ) | (123,793,479 | ) | 20,956,005 | (13,390,444 | ) | |||||||||
Net realized and unrealized gain (loss) | 19,219,279 | (38,528,956 | ) | 100,684,632 | (3,902,941 | ) | ||||||||||
Net increase (decrease) in net assets resulting from operations | $ | 30,448,313 | $ | (17,186,188 | ) | $ | 113,846,861 | $ | (2,010,858 | ) | ||||||
SEE NOTES TO FINANCIAL STATEMENTS. | GUGGENHEIM ETFs ANNUAL REPORT | 37 |
STATEMENTS OF OPERATIONS (concluded) |
For the Year Ended October 31, 2015
Guggenheim S&P | Guggenheim S&P | Guggenheim S&P | ||||||||||
Investment Income: | ||||||||||||
Dividends, net of foreign taxes withheld* | $ | 6,487,872 | $ | 2,391,456 | $ | 1,322,162 | ||||||
Income from securities lending | 130,444 | 154,041 | 63,527 | |||||||||
Interest | 10 | 3 | �� | 2 | ||||||||
Total investment income | 6,618,326 | 2,545,500 | 1,385,691 | |||||||||
Expenses: | ||||||||||||
Management fees | 2,594,612 | 593,927 | 536,658 | |||||||||
Total expenses | 2,594,612 | 593,927 | 536,658 | |||||||||
Net investment income | 4,023,714 | 1,951,573 | 849,033 | |||||||||
Net Realized and Unrealized Gain (Loss): | ||||||||||||
Net realized gain (loss) on: | ||||||||||||
Investments | (7,537,899 | ) | (7,778,300 | ) | (1,332,745 | ) | ||||||
In-kind redemptions | 45,849,259 | 15,750,696 | 14,277,538 | |||||||||
Net realized gain | 38,311,360 | 7,972,396 | 12,944,793 | |||||||||
Net change in unrealized appreciation (depreciation) on: | ||||||||||||
Investments | (13,305,481 | ) | (21,140,206 | ) | (13,529,320 | ) | ||||||
Net realized and unrealized gain (loss) | 25,005,879 | (13,167,810 | ) | (584,527 | ) | |||||||
Net increase (decrease) in net assets resulting from operations | $ | 29,029,593 | $ | (11,216,237 | ) | $ | 264,506 | |||||
* Foreign taxes withheld | $ | — | $ | 3,853 | $ | 376 | ||||||
38 | GUGGENHEIM ETFs ANNUAL REPORT | SEE NOTES TO FINANCIAL STATEMENTS. |
STATEMENTS OF CHANGES IN NET ASSETS |
Guggenheim Russell | Guggenheim S&P 500® | |||||||||||||||
Year Ended | Year Ended | Year Ended | Year Ended | |||||||||||||
Increase (Decrease) in Net Assets from Operations: | ||||||||||||||||
Net investment income | $ | 11,229,034 | $ | 10,854,977 | $ | 21,342,768 | $ | 15,060,597 | ||||||||
Net realized gain on investments | 52,721,047 | 17,409,553 | 85,264,523 | 94,111,013 | ||||||||||||
Net change in unrealized appreciation (depreciation) on investments | (33,501,768 | ) | 53,282,676 | (123,793,479 | ) | 1,693,099 | ||||||||||
Net increase (decrease) in net assets resulting from operations | 30,448,313 | 81,547,206 | (17,186,188 | ) | 110,864,709 | |||||||||||
Distributions to shareholders from: | ||||||||||||||||
Net investment income | (11,355,966 | ) | (10,780,498 | ) | (22,046,039 | ) | (14,264,565 | ) | ||||||||
Shareholder transactions: | ||||||||||||||||
Proceeds from shares purchased | 49,329,473 | 81,178,515 | 437,829,978 | 1,190,583,615 | ||||||||||||
Cost of shares redeemed | (170,955,031 | ) | (76,270,708 | ) | (860,630,837 | ) | (386,686,594 | ) | ||||||||
Net increase (decrease) in net assets resulting from share transactions | (121,625,558 | ) | 4,907,807 | (422,800,859 | ) | 803,897,021 | ||||||||||
Net increase (decrease) in net assets | (102,533,211 | ) | 75,674,515 | (462,033,086 | ) | 900,497,165 | ||||||||||
Net assets: | ||||||||||||||||
Beginning of year | 598,797,182 | 523,122,667 | 1,275,062,309 | 374,565,144 | ||||||||||||
End of year | $ | 496,263,971 | $ | 598,797,182 | $ | 813,029,223 | $ | 1,275,062,309 | ||||||||
Undistributed net investment income at end of year | $ | 861,244 | $ | 982,575 | $ | 249,496 | $ | 952,767 | ||||||||
Changes in shares outstanding: | ||||||||||||||||
Shares sold | 350,000 | 600,000 | 8,200,000 | 23,250,000 | ||||||||||||
Shares redeemed | (1,200,000 | ) | (600,000 | ) | (15,950,000 | ) | (7,750,000 | ) | ||||||||
Net increase (decrease) in shares | (850,000 | ) | — | (7,750,000 | ) | 15,500,000 | ||||||||||
SEE NOTES TO FINANCIAL STATEMENTS. | GUGGENHEIM ETFs ANNUAL REPORT | 39 |
STATEMENTS OF CHANGES IN NET ASSETS (continued) |
Guggenheim S&P 500® | Guggenheim S&P MidCap 400® | |||||||||||||||
Year Ended | Year Ended | Year Ended | Year Ended | |||||||||||||
Increase (Decrease) in Net Assets from Operations: | ||||||||||||||||
Net investment income | $ | 13,162,229 | $ | 9,650,949 | $ | 1,892,083 | $ | 1,355,738 | ||||||||
Net realized gain on investments | 79,728,627 | 170,107,806 | 9,487,503 | 11,809,141 | ||||||||||||
Net change in unrealized appreciation (depreciation) on investments | 20,956,005 | 24,829,879 | (13,390,444 | ) | (3,924,921 | ) | ||||||||||
Net increase (decrease) in net assets resulting from operations | 113,846,861 | 204,588,634 | (2,010,858 | ) | 9,239,958 | |||||||||||
Distributions to shareholders from: | ||||||||||||||||
Net investment income | (12,287,095 | ) | (9,850,742 | ) | (1,909,844 | ) | (1,275,783 | ) | ||||||||
Shareholder transactions: | ||||||||||||||||
Proceeds from shares purchased | 752,877,885 | 1,424,145,593 | 42,976,874 | 70,386,738 | ||||||||||||
Cost of shares redeemed | (308,368,180 | ) | (586,763,950 | ) | (53,544,609 | ) | (37,222,874 | ) | ||||||||
Net increase (decrease) in net assets resulting from share transactions | 444,509,705 | 837,381,643 | (10,567,735 | ) | 33,163,864 | |||||||||||
Net increase (decrease) in net assets | 546,069,471 | 1,032,119,535 | (14,488,437 | ) | 41,128,039 | |||||||||||
Net assets: | ||||||||||||||||
Beginning of year | 1,792,516,074 | 760,396,539 | 118,630,881 | 77,502,842 | ||||||||||||
End of year | $ | 2,338,585,545 | $ | 1,792,516,074 | $ | 104,142,444 | $ | 118,630,881 | ||||||||
Undistributed net investment income at end of year | $ | — | $ | — | $ | 65,209 | $ | 82,970 | ||||||||
Changes in shares outstanding: | ||||||||||||||||
Shares sold | 9,350,000 | 19,500,000 | 800,000 | 1,400,000 | ||||||||||||
Shares redeemed | (3,850,000 | ) | (8,300,000 | ) | (1,000,000 | ) | (750,000 | ) | ||||||||
Net increase (decrease) in shares | 5,500,000 | 11,200,000 | (200,000 | ) | 650,000 | |||||||||||
40 | GUGGENHEIM ETFs ANNUAL REPORT | SEE NOTES TO FINANCIAL STATEMENTS. |
STATEMENTS OF CHANGES IN NET ASSETS (continued) |
Guggenheim S&P MidCap 400® | Guggenheim S&P SmallCap 600® | |||||||||||||||
Year Ended | Year Ended | Year Ended | Year Ended | |||||||||||||
Increase (Decrease) in Net Assets from Operations: | ||||||||||||||||
Net investment income | $ | 4,023,714 | $ | 4,925,126 | $ | 1,951,573 | $ | 1,228,980 | ||||||||
Net realized gain on investments | 38,311,360 | 141,305,766 | 7,972,396 | 19,660,177 | ||||||||||||
Net change in unrealized appreciation (depreciation) on investments | (13,305,481 | ) | (89,652,357 | ) | (21,140,206 | ) | (7,910,036 | ) | ||||||||
Net increase (decrease) in net assets resulting from operations | 29,029,593 | 56,578,535 | (11,216,237 | ) | 12,979,121 | |||||||||||
Distributions to shareholders from: | ||||||||||||||||
Net investment income | (4,173,726 | ) | (5,020,350 | ) | (1,976,663 | ) | (1,189,682 | ) | ||||||||
Return of capital | (467,016 | ) | — | — | — | |||||||||||
Total distributions to shareholders | (4,640,742 | ) | (5,020,350 | ) | (1,976,663 | ) | (1,189,682 | ) | ||||||||
Shareholder transactions: | ||||||||||||||||
Proceeds from shares purchased | 206,271,851 | 364,665,781 | 50,291,876 | 75,735,185 | ||||||||||||
Cost of shares redeemed | (206,731,035 | ) | (408,252,769 | ) | (58,898,695 | ) | (38,885,016 | ) | ||||||||
Net increase (decrease) in net assets resulting from share transactions | (459,184 | ) | (43,586,988 | ) | (8,606,819 | ) | 36,850,169 | |||||||||
Net increase (decrease) in net assets | 23,929,667 | 7,971,197 | (21,799,719 | ) | 48,639,608 | |||||||||||
Net assets: | ||||||||||||||||
Beginning of year | 745,942,415 | 737,971,218 | 171,989,880 | 123,350,272 | ||||||||||||
End of year | $ | 769,872,082 | $ | 745,942,415 | $ | 150,190,161 | $ | 171,989,880 | ||||||||
Undistributed net investment income at end of year | $ | — | $ | 150,013 | $ | 14,208 | $ | 39,298 | ||||||||
Changes in shares outstanding: | ||||||||||||||||
Shares sold | 1,600,000 | 3,050,000 | 800,000 | 1,250,000 | ||||||||||||
Shares redeemed | (1,650,000 | ) | (3,400,000 | ) | (950,000 | ) | (650,000 | ) | ||||||||
Net increase (decrease) in shares | (50,000 | ) | (350,000 | ) | (150,000 | ) | 600,000 | |||||||||
SEE NOTES TO FINANCIAL STATEMENTS. | GUGGENHEIM ETFs ANNUAL REPORT | 41 |
STATEMENTS OF CHANGES IN NET ASSETS (concluded) |
Guggenheim S&P SmallCap 600® | ||||||||
Year Ended | Year Ended | |||||||
Increase (Decrease) in Net Assets from Operations: | ||||||||
Net investment income | $ | 849,033 | $ | 432,137 | ||||
Net realized gain on investments | 12,944,793 | 21,771,031 | ||||||
Net change in unrealized appreciation (depreciation) on investments | (13,529,320 | ) | (12,261,811 | ) | ||||
Net increase in net assets resulting from operations | 264,506 | 9,941,357 | ||||||
Distributions to shareholders from: | ||||||||
Net investment income | (849,033 | ) | (499,340 | ) | ||||
Return of capital | (5,968 | ) | — | |||||
Total distributions to shareholders | (855,001 | ) | (499,340 | ) | ||||
Shareholder transactions: | ||||||||
Proceeds from shares purchased | 188,816,454 | 50,760,931 | ||||||
Cost of shares redeemed | (67,016,341 | ) | (63,109,671 | ) | ||||
Net increase (decrease) in net assets resulting from share transactions | 121,800,113 | (12,348,740 | ) | |||||
Net increase (decrease) in net assets | 121,209,618 | (2,906,723 | ) | |||||
Net assets: | ||||||||
Beginning of year | 104,723,416 | 107,630,139 | ||||||
End of year | $ | 225,933,034 | $ | 104,723,416 | ||||
Undistributed net investment income at end of year | $ | — | $ | — | ||||
Changes in shares outstanding: | ||||||||
Shares sold | 2,150,000 | 650,000 | ||||||
Shares redeemed | (800,000 | ) | (800,000 | ) | ||||
Net increase (decrease) in shares | 1,350,000 | (150,000 | ) | |||||
42 | GUGGENHEIM ETFs ANNUAL REPORT | SEE NOTES TO FINANCIAL STATEMENTS. |
GUGGENHEIM RUSSELL TOP 50® MEGA CAP ETF |
FINANCIAL HIGHLIGHTS |
This table is presented to show selected data for a share outstanding throughout each period and to assist shareholders in evaluating the Fund’s performance for the periods presented.
Year Ended | Year Ended | Year Ended | Year Ended | Year Ended | ||||||||||||||||
Per Share Data: | ||||||||||||||||||||
Net asset value, beginning of period | $ | 140.87 | $ | 123.06 | $ | 104.06 | $ | 89.97 | $ | 85.16 | ||||||||||
Income from investment operations: | ||||||||||||||||||||
Net investment income (loss)a | 3.00 | 2.74 | 2.56 | 2.17 | 1.87 | |||||||||||||||
Net gain (loss) on investments (realized and unrealized) | 5.09 | 17.82 | 19.05 | 14.02 | 4.74 | |||||||||||||||
Total from investment operations | 8.09 | 20.56 | 21.61 | 16.19 | 6.61 | |||||||||||||||
Less distributions from: | ||||||||||||||||||||
Net investment income | (3.03 | ) | (2.75 | ) | (2.61 | ) | (2.10 | ) | (1.80 | ) | ||||||||||
Total distributions to shareholders | (3.03 | ) | (2.75 | ) | (2.61 | ) | (2.10 | ) | (1.80 | ) | ||||||||||
Net asset value, end of period | $ | 145.93 | $ | 140.87 | $ | 123.06 | $ | 104.06 | $ | 89.97 | ||||||||||
Total Returnb | 5.87 | % | 16.86 | % | 21.07 | % | 18.11 | % | 7.80 | % | ||||||||||
Ratios/Supplemental Data: | ||||||||||||||||||||
Net assets, end of period (in thousands) | $ | 496,264 | $ | 598,797 | $ | 523,123 | $ | 624,468 | $ | 454,409 | ||||||||||
Ratio to average net assets of: | ||||||||||||||||||||
Net investment income (loss) | 2.11 | % | 2.08 | % | 2.28 | % | 2.19 | % | 2.08 | % | ||||||||||
Total expenses | 0.20 | % | 0.20 | % | 0.20 | % | 0.20 | % | 0.20 | % | ||||||||||
Portfolio turnover ratec | 8 | % | 6 | % | 8 | % | 7 | % | 6 | % | ||||||||||
a | Based on average shares outstanding. |
b | Total investment return is calculated assuming an initial investment made at the net asset value at the beginning of the period, reinvestment of all dividends and distribution at net asset value during the period, and redemption on the last day of the period. Transaction fees are not reflected in the calculation of total investment return. |
c | Portfolio turnover does not include securities received or delivered from processing creations or redemptions. |
SEE NOTES TO FINANCIAL STATEMENTS. | GUGGENHEIM ETFs ANNUAL REPORT | 43 |
GUGGENHEIM S&P 500® PURE VALUE ETF |
FINANCIAL HIGHLIGHTS |
This table is presented to show selected data for a share outstanding throughout each period and to assist shareholders in evaluating the Fund’s performance for the periods presented.
Year Ended | Year Ended | Year Ended | Year Ended | Year Ended | ||||||||||||||||
Per Share Data: | ||||||||||||||||||||
Net asset value, beginning of period | $ | 54.14 | $ | 46.51 | $ | 32.26 | $ | 28.38 | $ | 25.95 | ||||||||||
Income from investment operations: | ||||||||||||||||||||
Net investment income (loss)a | 1.12 | 0.90 | 0.67 | 0.48 | 0.42 | |||||||||||||||
Net gain (loss) on investments (realized and unrealized) | (2.70 | ) | 7.50 | 14.18 | 3.89 | 2.40 | ||||||||||||||
Total from investment operations | (1.58 | ) | 8.40 | 14.85 | 4.37 | 2.82 | ||||||||||||||
Less distributions from: | ||||||||||||||||||||
Net investment income | (1.11 | ) | (0.77 | ) | (0.60 | ) | (0.49 | ) | (0.39 | ) | ||||||||||
Total distributions to shareholders | (1.11 | ) | (0.77 | ) | (0.60 | ) | (0.49 | ) | (0.39 | ) | ||||||||||
Net asset value, end of period | $ | 51.45 | $ | 54.14 | $ | 46.51 | $ | 32.26 | $ | 28.38 | ||||||||||
Total Returnb | (2.94 | %) | 18.13 | % | 46.39 | % | 15.54 | % | 10.84 | % | ||||||||||
Ratios/Supplemental Data: | ||||||||||||||||||||
Net assets, end of period (in thousands) | $ | 813,029 | $ | 1,275,062 | $ | 374,565 | $ | 85,583 | $ | 79,550 | ||||||||||
Ratio to average net assets of: | ||||||||||||||||||||
Net investment income (loss) | 2.09 | % | 1.74 | % | 1.65 | % | 1.60 | % | 1.44 | % | ||||||||||
Total expenses | 0.35 | % | 0.35 | % | 0.35 | % | 0.35 | % | 0.35 | % | ||||||||||
Portfolio turnover ratec | 54 | % | 25 | % | 24 | % | 37 | % | 23 | % | ||||||||||
a | Based on average shares outstanding. |
b | Total investment return is calculated assuming an initial investment made at the net asset value at the beginning of the period, reinvestment of all dividends and distribution at net asset value during the period, and redemption on the last day of the period. Transaction fees are not reflected in the calculation of total investment return. |
c | Portfolio turnover does not include securities received or delivered from processing creations or redemptions. |
44 | GUGGENHEIM ETFs ANNUAL REPORT | SEE NOTES TO FINANCIAL STATEMENTS. |
GUGGENHEIM S&P 500® PURE GROWTH ETF |
FINANCIAL HIGHLIGHTS |
This table is presented to show selected data for a share outstanding throughout each period and to assist shareholders in evaluating the Fund’s performance for the periods presented.
Year Ended | Year Ended | Year Ended | Year Ended | Year Ended | ||||||||||||||||
Per Share Data: | ||||||||||||||||||||
Net asset value, beginning of period | $ | 78.96 | $ | 66.12 | $ | 47.80 | $ | 44.68 | $ | 40.40 | ||||||||||
Income from investment operations: | ||||||||||||||||||||
Net investment income (loss)a | 0.52 | 0.55 | 0.44 | 0.33 | 0.18 | |||||||||||||||
Net gain (loss) on investments (realized and unrealized) | 3.93 | 12.81 | 18.33 | 3.11 | 4.28 | |||||||||||||||
Total from investment operations | 4.45 | 13.36 | 18.77 | 3.44 | 4.46 | |||||||||||||||
Less distributions from: | ||||||||||||||||||||
Net investment income | (0.48 | ) | (0.52 | ) | (0.42 | ) | (0.32 | ) | (0.18 | ) | ||||||||||
Return of capital | — | — | (0.03 | ) | — | — | ||||||||||||||
Total distributions to shareholders | (0.48 | ) | (0.52 | ) | (0.45 | ) | (0.32 | ) | (0.18 | ) | ||||||||||
Net asset value, end of period | $ | 82.93 | $ | 78.96 | $ | 66.12 | $ | 47.80 | $ | 44.68 | ||||||||||
Total Returnb | 5.65 | % | 20.24 | % | 39.45 | % | 7.72 | % | 11.06 | % | ||||||||||
Ratios/Supplemental Data: | ||||||||||||||||||||
Net assets, end of period (in thousands) | $ | 2,338,586 | $ | 1,792,516 | $ | 760,397 | $ | 332,253 | $ | 265,889 | ||||||||||
Ratio to average net assets of: | ||||||||||||||||||||
Net investment income (loss) | 0.64 | % | 0.74 | % | 0.76 | % | 0.71 | % | 0.41 | % | ||||||||||
Total expenses | 0.35 | % | 0.35 | % | 0.35 | % | 0.35 | % | 0.35 | % | ||||||||||
Portfolio turnover ratec | 62 | % | 46 | % | 44 | % | 35 | % | 21 | % | ||||||||||
a | Based on average shares outstanding. |
b | Total investment return is calculated assuming an initial investment made at the net asset value at the beginning of the period, reinvestment of all dividends and distribution at net asset value during the period, and redemption on the last day of the period. Transaction fees are not reflected in the calculation of total investment return. |
c | Portfolio turnover does not include securities received or delivered from processing creations or redemptions. |
SEE NOTES TO FINANCIAL STATEMENTS. | GUGGENHEIM ETFs ANNUAL REPORT | 45 |
GUGGENHEIM S&P MIDCAP 400® PURE VALUE ETF |
FINANCIAL HIGHLIGHTS |
This table is presented to show selected data for a share outstanding throughout each period and to assist shareholders in evaluating the Fund’s performance for the periods presented.
Year Ended | Year Ended | Year Ended | Year Ended | Year Ended | ||||||||||||||||
Per Share Data: | ||||||||||||||||||||
Net asset value, beginning of period | $ | 52.71 | $ | 48.42 | $ | 35.00 | $ | 31.00 | $ | 30.77 | ||||||||||
Income from investment operations: | ||||||||||||||||||||
Net investment income (loss)a | 0.86 | 0.71 | 0.52 | 0.46 | 0.41 | |||||||||||||||
Net gain (loss) on investments (realized and unrealized) | (1.96 | ) | 4.18 | 13.46 | 4.01 | 0.22 | ||||||||||||||
Total from investment operations | (1.10 | ) | 4.89 | 13.98 | 4.47 | 0.63 | ||||||||||||||
Less distributions from: | ||||||||||||||||||||
Net investment income | (0.82 | ) | (0.60 | ) | (0.56 | ) | (0.47 | ) | (0.40 | ) | ||||||||||
Total distributions to shareholders | (0.82 | ) | (0.60 | ) | (0.56 | ) | (0.47 | ) | (0.40 | ) | ||||||||||
Net asset value, end of period | $ | 50.79 | $ | 52.71 | $ | 48.42 | $ | 35.00 | $ | 31.00 | ||||||||||
Total Returnb | (2.12 | %) | 10.14 | % | 40.27 | % | 14.46 | % | 2.03 | % | ||||||||||
Ratios/Supplemental Data: | ||||||||||||||||||||
Net assets, end of period (in thousands) | $ | 104,142 | $ | 118,631 | $ | 77,503 | $ | 35,015 | $ | 35,671 | ||||||||||
Ratio to average net assets of: | ||||||||||||||||||||
Net investment income (loss) | 1.62 | % | 1.38 | % | 1.22 | % | 1.36 | % | 1.22 | % | ||||||||||
Total expenses | 0.35 | % | 0.35 | % | 0.35 | % | 0.35 | % | 0.35 | % | ||||||||||
Portfolio turnover ratec | 59 | % | 40 | % | 28 | % | 47 | % | 49 | % | ||||||||||
a | Based on average shares outstanding. |
b | Total investment return is calculated assuming an initial investment made at the net asset value at the beginning of the period, reinvestment of all dividends and distribution at net asset value during the period, and redemption on the last day of the period. Transaction fees are not reflected in the calculation of total investment return. |
c | Portfolio turnover does not include securities received or delivered from processing creations or redemptions. |
46 | GUGGENHEIM ETFs ANNUAL REPORT | SEE NOTES TO FINANCIAL STATEMENTS. |
GUGGENHEIM S&P MIDCAP 400® PURE GROWTH ETF |
FINANCIAL HIGHLIGHTS |
This table is presented to show selected data for a share outstanding throughout each period and to assist shareholders in evaluating the Fund’s performance for the periods presented.
Year Ended | Year Ended | Year Ended | Year Ended | Year Ended | ||||||||||||||||
Per Share Data: | ||||||||||||||||||||
Net asset value, beginning of period | $ | 123.30 | $ | 115.31 | $ | 88.25 | $ | 82.17 | $ | 70.46 | ||||||||||
Income from investment operations: | ||||||||||||||||||||
Net investment income (loss)a | 0.70 | 0.75 | 1.02 | 0.20 | 0.07 | |||||||||||||||
Net gain (loss) on investments (realized and unrealized) | 5.10 | 7.93 | 27.10 | 6.04 | 11.72 | |||||||||||||||
Total from investment operations | 5.80 | 8.68 | 28.12 | 6.24 | 11.79 | |||||||||||||||
Less distributions from: | ||||||||||||||||||||
Net investment income | (0.71 | ) | (0.69 | ) | (1.06 | ) | (0.16 | ) | (0.08 | ) | ||||||||||
Return of capital | (0.08 | ) | — | — | — | — | ||||||||||||||
Total distributions to shareholders | (0.79 | ) | (0.69 | ) | (1.06 | ) | (0.16 | ) | (0.08 | ) | ||||||||||
Net asset value, end of period | $ | 128.31 | $ | 123.30 | $ | 115.31 | $ | 88.25 | $ | 82.17 | ||||||||||
Total Returnb | 4.71 | % | 7.53 | % | 32.07 | % | 7.60 | % | 16.73 | % | ||||||||||
Ratios/Supplemental Data: | ||||||||||||||||||||
Net assets, end of period (in thousands) | $ | 769,872 | $ | 745,942 | $ | 737,971 | $ | 511,881 | $ | 653,246 | ||||||||||
Ratio to average net assets of: | ||||||||||||||||||||
Net investment income (loss) | 0.54 | % | 0.62 | % | 1.01 | % | 0.23 | % | 0.09 | % | ||||||||||
Total expenses | 0.35 | % | 0.35 | % | 0.35 | % | 0.35 | % | 0.35 | % | ||||||||||
Portfolio turnover ratec | 102 | % | 75 | % | 72 | % | 56 | % | 45 | % | ||||||||||
a | Based on average shares outstanding. |
b | Total investment return is calculated assuming an initial investment made at the net asset value at the beginning of the period, reinvestment of all dividends and distribution at net asset value during the period, and redemption on the last day of the period. Transaction fees are not reflected in the calculation of total investment return. |
c | Portfolio turnover does not include securities received or delivered from processing creations or redemptions. |
SEE NOTES TO FINANCIAL STATEMENTS. | GUGGENHEIM ETFs ANNUAL REPORT | 47 |
GUGGENHEIM S&P SMALLCAP 600® PURE VALUE ETF |
FINANCIAL HIGHLIGHTS |
This table is presented to show selected data for a share outstanding throughout each period and to assist shareholders in evaluating the Fund’s performance for the periods presented.
Year Ended | Year Ended | Year Ended | Year Ended | Year Ended | ||||||||||||||||
Per Share Data: | ||||||||||||||||||||
Net asset value, beginning of period | $ | 62.54 | $ | 57.37 | $ | 40.04 | $ | 35.50 | $ | 34.27 | ||||||||||
Income from investment operations: | ||||||||||||||||||||
Net investment income (loss)a | 0.71 | 0.44 | 0.56 | 0.25 | 0.20 | |||||||||||||||
Net gain (loss) on investments (realized and unrealized) | (4.79 | ) | 5.14 | 17.40 | 4.56 | 1.23 | ||||||||||||||
Total from investment operations | (4.08 | ) | 5.58 | 17.96 | 4.81 | 1.43 | ||||||||||||||
Less distributions from: | ||||||||||||||||||||
Net investment income | (0.70 | ) | (0.41 | ) | (0.63 | ) | (0.25 | ) | (0.20 | ) | ||||||||||
Return of capital | — | — | — | (0.02 | ) | — | ||||||||||||||
Total distributions to shareholders | (0.70 | ) | (0.41 | ) | (0.63 | ) | (0.27 | ) | (0.20 | ) | ||||||||||
Net asset value, end of period | $ | 57.76 | $ | 62.54 | $ | 57.37 | $ | 40.04 | $ | 35.50 | ||||||||||
Total Returnb | (6.60 | %) | 9.73 | % | 45.20 | % | 13.52 | % | 4.16 | % | ||||||||||
Ratios/Supplemental Data: | ||||||||||||||||||||
Net assets, end of period (in thousands) | $ | 150,190 | $ | 171,990 | $ | 123,350 | $ | 72,066 | $ | 62,130 | ||||||||||
Ratio to average net assets of: | ||||||||||||||||||||
Net investment income (loss) | 1.15 | % | 0.73 | % | 1.14 | % | 0.65 | % | 0.53 | % | ||||||||||
Total expenses | 0.35 | % | 0.35 | % | 0.35 | % | 0.35 | % | 0.35 | % | ||||||||||
Portfolio turnover ratec | 52 | % | 51 | % | 43 | % | 48 | % | 76 | % | ||||||||||
a | Based on average shares outstanding. |
b | Total investment return is calculated assuming an initial investment made at the net asset value at the beginning of the period, reinvestment of all dividends and distribution at net asset value during the period, and redemption on the last day of the period. Transaction fees are not reflected in the calculation of total investment return. |
c | Portfolio turnover does not include securities received or delivered from processing creations or redemptions. |
48 | GUGGENHEIM ETFs ANNUAL REPORT | SEE NOTES TO FINANCIAL STATEMENTS. |
GUGGENHEIM S&P SMALLCAP 600® PURE GROWTH ETF |
FINANCIAL HIGHLIGHTS |
This table is presented to show selected data for a share outstanding throughout each period and to assist shareholders in evaluating the Fund’s performance for the periods presented.
Year Ended | Year Ended | Year Ended | Year Ended | Year Ended | ||||||||||||||||
Per Share Data: | ||||||||||||||||||||
Net asset value, beginning of period | $ | 80.56 | $ | 74.23 | $ | 54.34 | $ | 49.82 | $ | 43.32 | ||||||||||
Income from investment operations: | ||||||||||||||||||||
Net investment income (loss)a | 0.47 | 0.31 | 0.59 | 0.20 | 0.02 | |||||||||||||||
Net gain (loss) on investments (realized and unrealized) | 4.70 | 6.33 | 19.87 | 4.50 | 6.57 | |||||||||||||||
Total from investment operations | 5.17 | 6.64 | 20.46 | 4.70 | 6.59 | |||||||||||||||
Less distributions from: | ||||||||||||||||||||
Net investment income | (0.47 | ) | (0.31 | ) | (0.54 | ) | (0.18 | ) | (0.09 | ) | ||||||||||
Return of capital | (— | )d | — | (0.03 | ) | — | — | |||||||||||||
Total distributions to shareholders | (0.47 | ) | (0.31 | ) | (0.57 | ) | (0.18 | ) | (0.09 | ) | ||||||||||
Net asset value, end of period | $ | 85.26 | $ | 80.56 | $ | 74.23 | $ | 54.34 | $ | 49.82 | ||||||||||
Total Returnb | 6.42 | % | 8.96 | % | 37.94 | % | 9.44 | % | 15.22 | % | ||||||||||
Ratios/Supplemental Data: | ||||||||||||||||||||
Net assets, end of period (in thousands) | $ | 225,933 | $ | 104,723 | $ | 107,630 | $ | 73,359 | $ | 34,873 | ||||||||||
Ratio to average net assets of: | ||||||||||||||||||||
Net investment income (loss) | 0.55 | % | 0.39 | % | 0.94 | % | 0.38 | % | 0.03 | % | ||||||||||
Total expenses | 0.35 | % | 0.35 | % | 0.35 | % | 0.35 | % | 0.35 | % | ||||||||||
Portfolio turnover ratec | 62 | % | 78 | % | 73 | % | 44 | % | 33 | % | ||||||||||
a | Based on average shares outstanding. |
b | Total investment return is calculated assuming an initial investment made at the net asset value at the beginning of the period, reinvestment of all dividends and distribution at net asset value during the period, and redemption on the last day of the period. Transaction fees are not reflected in the calculation of total investment return. |
c | Portfolio turnover does not include securities received or delivered from processing creations or redemptions. |
d | Less than $0.01 per share. |
SEE NOTES TO FINANCIAL STATEMENTS. | GUGGENHEIM ETFs ANNUAL REPORT | 49 |
NOTES TO FINANCIAL STATEMENTS |
1. Organization and Significant Accounting Policies
Organization
Rydex ETF Trust (the “Trust”) is registered with the SEC under the Investment Company Act of 1940 (the “1940 Act”), as an open-ended investment company of the series type, and is authorized to issue an unlimited number of no par value shares. Each portfolio represents a separate series of beneficial interest in the Trust (each a “Fund”, and collectively, the “Funds”), each a non-diversified investment company. The Trust was organized as a Delaware statutory trust on November 22, 2002. At October 31, 2015, the Trust consisted of twenty-two funds.
The financial statements herein relate to the following Funds, whose investment objective is to replicate as closely as possible, before fees and expenses, the daily performance of an index representing publicly traded equity securities (the “Underlying Index”) as follows:
Fund | Underlying Index |
Guggenheim Russell Top 50® Mega Cap ETF | Russell Top 50® Mega Cap Index |
Guggenheim S&P 500® Pure Value ETF | S&P 500® Pure Value Index |
Guggenheim S&P 500® Pure Growth ETF | S&P 500® Pure Growth Index |
Guggenheim S&P MidCap 400® Pure Value ETF | S&P MidCap 400® Pure Value Index |
Guggenheim S&P MidCap 400® Pure Growth ETF | S&P MidCap 400® Pure Growth Index |
Guggenheim S&P SmallCap 600® Pure Value ETF | S&P SmallCap 600® Pure Value Index |
Guggenheim S&P SmallCap 600® Pure Growth ETF | S&P SmallCap 600® Pure Growth Index |
The Funds seek to achieve their objective by investing in common stocks that comprise the Underlying Index. The Funds use a “replication” strategy to track the Underlying Index. Replication refers to investing in substantially all of the securities in the Underlying Index in approximately the same proportions as in the Underlying Index.
The Funds operate as index funds and are not actively managed. Adverse performance of a security in the Funds’ portfolio will ordinarily not result in the elimination of the security from the Funds’ portfolio.
The Funds issue and redeem shares on a continuous basis, at net asset value per share (“NAV”), only in aggregation of 50,000 shares (a “Creation Unit”). Creation Units are issued and redeemed principally in-kind for securities included in the Underlying Index.
The Funds invest in various investments which are exposed to risk, such as market risk. Due to the level of risk associated with certain investments it is at least reasonably possible that changes in the values of investment securities will occur in the near term and that such changes could materially affect amounts reported in the financial statements.
Guggenheim Investments (“GI”) provides advisory services and Rydex Fund Services, LLC (“RFS”) provides administrative services to the Trust. Guggenheim Funds Distributors, LLC (“GFD”) acts as principal underwriter for the Trust. GI, RFS and GFD are affiliated entities.
Significant Accounting Policies
The Funds operate as investment companies and accordingly follow the investment company accounting and reporting guidance of the Financial Accounting Standards Board (“FASB”) Accounting Standards Codification Topic 946 Financial Services – Investment Companies.
The following significant accounting policies are in conformity with U.S. generally accepted accounting principles (“U.S. GAAP”) and are consistently followed by the Trust. This requires management to make estimates and assumptions that affect the reported amount of assets and liabilities and disclosure of contingent assets and liabilities at the date of the financial statements and the reported amounts of revenues and expenses during the reporting period. Actual results could differ from these estimates. All time references are based on Eastern Time.
A. The Board of Trustees of the Funds (the “Board”) has adopted policies and procedures for the valuation of the Funds’ investments (the “Valuation Procedures”). Pursuant to the Valuation Procedures, the Board has delegated to a valuation committee, consisting of representatives from Guggenheim’s investment management, fund administration, legal and compliance departments (the “Valuation Committee”), the day-to-day responsibility for implementing the Valuation Procedures, including, under most circumstances, the responsibility for determining the fair value of the Funds' securities or other assets.
Valuations of the Funds’ securities are supplied primarily by pricing services appointed pursuant to the processes set forth in the Valuation Procedures. The Valuation Committee convenes monthly, or more frequently as needed and will review the valuation of all assets which have been fair valued for reasonableness. The
50 | GUGGENHEIM ETFs ANNUAL REPORT |
NOTES TO FINANCIAL STATEMENTS (continued) |
Funds’ officers, through the Valuation Committee and consistent with the monitoring and review responsibilities set forth in the Valuation Procedures, regularly review procedures used by, and valuations provided by, the pricing services.
If the pricing service cannot or does not provide a valuation for a particular investment or such valuation is deemed unreliable, such investment is fair valued by the Valuation Committee.
Equity securities listed on an exchange (New York Stock Exchange (“NYSE”) or American Stock Exchange) are valued at the last quoted sales price as of the close of business on the NYSE, usually 4:00 p.m. on the valuation date. Equity securities listed on the NASDAQ market system are valued at the NASDAQ Official Closing Price on the valuation date, which may not necessarily represent the last sale price. If there has been no sale on such exchange or NASDAQ on a given day, the security is valued at the closing bid price on that day.
The Funds invest in money market mutual funds, which are valued at their NAV.
Investments for which market quotations are not readily available are fair valued as determined in good faith by GI under the direction of the Board of Trustees using methods established or ratified by the Board of Trustees. Valuations in accordance with these methods are intended to reflect each security’s (or asset’s) “fair value.” Each such determination is based on a consideration of all relevant factors, which are likely to vary from one pricing context to another. Examples of such factors may include, but are not limited to: (i) the type of security, (ii) the initial cost of the security, (iii) the existence of any contractual restrictions on the security’s disposition, (iv) the price and extent of public trading in similar securities of the issuer or of comparable companies, (v) quotations or evaluated prices from broker-dealers and/or pricing services, (vi) information obtained from the issuer, analysts, and/or the appropriate stock exchange (for exchange-traded securities), (vii) an analysis of the company’s financial statements, and (viii) an evaluation of the forces that influence the issuer and the market(s) in which the security is purchased and sold (e.g. the existence of pending merger activity, public offerings or tender offers that might affect the value of the security).
B. Security transactions are recorded on the trade date for financial reporting purposes. Realized gains and losses from securities transactions are recorded using the identified cost basis. Proceeds from lawsuits related to investment holdings are recorded as realized gains in the respective Fund. Dividend income is recorded on the ex-dividend date, net of applicable taxes withheld by foreign countries. Taxable non-cash dividends are recorded as dividend income. Interest income, including amortization of premiums and accretion of discounts, is accrued on a daily basis. Dividend income from REITs is recorded based on the income included in the distributions received from the REIT investments using published REIT classifications, including some management estimates when actual amounts are not available. Distributions received in excess of this estimated amount are recorded as a reduction of the cost of investments or reclassified to capital gains. The actual amounts of income, return of capital, and capital gains are only determined by each REIT after its fiscal year-end, and may differ from the estimated amounts.
C. Distributions of net investment income and net realized gains, if any, are declared and paid at least annually. Distributions are recorded on the ex-dividend date and are determined in accordance with income tax regulations which may differ from U.S. GAAP.
D. The Funds may leave cash overnight in their cash account with the custodian. Periodically, a Fund may have cash due to the custodian bank as an overdraft balance. A fee is incurred on this overdraft, calculated by multiplying the overdraft by a rate based on the federal funds rate.
E. Under the Funds’ organizational documents, their Trustees and Officers are indemnified against certain liabilities arising out of the performance of their duties to the Trust. In addition, throughout the normal course of business, the Funds enter into contracts that contain a variety of representations and warranties which provide general indemnifications. The Funds’ maximum exposure under these arrangements is unknown, as this would involve future claims that may be made against the Funds and/or their affiliates that have not yet occurred. However, based on experience, the Funds expect the risk of loss to be remote.
2. Capital
There is a minimum transaction fee per transaction to those persons purchasing or redeeming Creation Units. An additional charge of up to three times the standard transaction fee may be imposed for purchases and
GUGGENHEIM ETFs ANNUAL REPORT | 51 |
NOTES TO FINANCIAL STATEMENTS (continued) |
redemptions effected outside the National Securities Clearing Corporation usual clearing process or for cash. Such transactions are generally permitted on an in-kind basis, with a balancing cash component to equate the transaction to the NAV of the Fund on the transaction date. Transaction fees are not charged to or paid by the Funds. The minimum transaction fees are:
Fund | Minimum Transaction Fee | |||
Guggenheim Russell Top 50® Mega Cap ETF | $ | 500 | ||
Guggenheim S&P 500® Pure Value ETF | 1,000 | |||
Guggenheim S&P 500® Pure Growth ETF | 1,000 | |||
Guggenheim S&P MidCap 400® Pure Value ETF | 750 | |||
Guggenheim S&P MidCap 400® Pure Growth ETF | 750 | |||
Guggenheim S&P SmallCap 600® Pure Value ETF | 1,000 | |||
Guggenheim S&P SmallCap 600® Pure Growth ETF | 1,000 | |||
3. Fees and Other Transactions with Affiliates
GI determines the composition of the portfolio of securities that must be delivered in exchange for the issuance of Creation Units and periodically adjusts the composition of the portfolio of the Funds to conform to changes in the composition of the relevant index. For these services, GI receives a management fee at the annual rate shown below as a percentage of the average daily net assets of the Funds.
Fund | Advisory Fee |
Guggenheim Russell Top 50® Mega Cap ETF | 0.20% |
Guggenheim S&P 500® Pure Value ETF | 0.35% |
Guggenheim S&P 500® Pure Growth ETF | 0.35% |
Guggenheim S&P MidCap 400® Pure Value ETF | 0.35% |
Guggenheim S&P MidCap 400® Pure Growth ETF | 0.35% |
Guggenheim S&P SmallCap 600® Pure Value ETF | 0.35% |
Guggenheim S&P SmallCap 600® Pure Growth ETF | 0.35% |
GI pays all expenses of the Funds, including the cost of transfer agency, custody, fund administration, fund accounting, legal, audit and other services, except: interest, taxes, distribution fees or expenses and extraordinary expenses.
Under a Fund Administration Agreement with the Trust, RFS provides various administrative and financial reporting services for the Funds. GI compensates RFS directly for this service.
Under a Fund Accounting Agreement with the Trust, BNYMellon maintains the books and records of the Funds. Under a Custodian Agreement with the Trust, BNYMellon maintains cash, securities and other assets of the Funds in a separate account for the Funds, keeps all necessary accounts and records, and provides other services. BNYMellon is required, upon the order of the Trust, to deliver securities held by the custodian and to make payments for securities purchased by the Trust for the Funds. Pursuant to a Transfer Agency and Service Agreement with the Trust, BNYMellon acts as a transfer agent for the Trust’s authorized and issued shares of beneficial interest, and as dividend disbursing agent of the Trust. GI compensates BNYMellon directly for the foregoing services.
The Funds have adopted a Distribution Plan (the “Plan”) that allows the Funds to pay distribution fees to GFD and other firms that provide distribution services (“Service Providers”). If a Service Provider provides distribution services, the Funds will pay distribution fees to GFD at an annual rate not to exceed 0.25% of average daily net assets, pursuant to Rule 12b-1 of the 1940 Act. GFD will, in turn, pay the Service Provider out of its fees. No such fee is currently charged to the Funds.
Certain trustees and officers of the Trust are also officers of GI, RFS and GFD.
52 | GUGGENHEIM ETFs ANNUAL REPORT |
NOTES TO FINANCIAL STATEMENTS (continued) |
4. Fair Value Measurement
In accordance with U.S. GAAP, fair value is defined as the price that the Funds would receive to sell an investment or pay to transfer a liability in an orderly transaction with an independent buyer in the principal market, or in the absence of a principal market, the most advantageous market for the investment or liability. U.S. GAAP establishes a three-tier fair value hierarchy based on the types of inputs used to value assets and liabilities and requires corresponding disclosure. The hierarchy and the corresponding inputs are summarized below:
Level 1 | — quoted prices in active markets for identical securities. |
Level 2 | — other significant observable inputs (including quoted prices for similar securities, interest rates, prepayment speeds, credit risk, etc.). |
Level 3 | — significant unobservable inputs (including the fund’s own assumptions used to determine the fair value of investments). |
The types of inputs available depend on a variety of factors, such as the type of security and the characteristics of the markets in which it trades, if any. Fair valuation determinations that rely on fewer or no observable inputs require greater judgment. Accordingly, fair value determinations for Level 3 securities require the greatest amount of judgment.
The inputs or methodologies used for valuing securities are not necessarily an indication of the risk associated with investing in those securities. The suitability of the techniques and sources employed to determine fair valuation are regularly monitored and subject to change.
5. Portfolio Securities Loaned
During the year ended October 31, 2015, certain Funds lent their securities to approved brokers to earn additional income. Security lending income shown on the Statements of Operations is net of rebates paid to borrowers and earnings on cash collateral investments shared with the lending agent. As of October 31, 2015, all Funds had ceased participation in securities lending.
6. Federal Income Tax Information
The Funds intend to comply with the provisions of Subchapter M of the Internal Revenue Code applicable to regulated investment companies and will distribute substantially all taxable net investment income and capital gains sufficient to relieve the Funds from all, or substantially all, federal income, excise and state income taxes. Therefore, no provision for federal or state income tax is required.
Tax positions taken or expected to be taken in the course of preparing the Funds' tax returns are evaluated to determine whether the tax positions are “more-likely-than-not” of being sustained by the applicable tax authority. Tax positions not deemed to meet the more-likely-than-not threshold would be recorded as a tax benefit or expense in the current year. Management has analyzed the Funds' tax positions taken, or to be taken, on Federal income tax returns for all open tax years, and has concluded that no provision for income tax is required in the Funds' financial statements. The Funds' federal tax returns are subject to examination by the Internal Revenue Service for a period of three years after they are filed.
Tax basis capital losses in excess of capital gains are carried forward to offset future net capital gains. For the year ended October 31, 2015, the following capital loss carryforward amounts were expired or used:
Fund | Amount | |||
Guggenheim Russell Top 50® Mega Cap ETF | $ | 3,823,339 | ||
Guggenheim S&P 500® Pure Growth ETF | 5,274,446 | |||
GUGGENHEIM ETFs ANNUAL REPORT | 53 |
NOTES TO FINANCIAL STATEMENTS (continued) |
The tax character of distributions paid during the year ended October 31, 2015 was as follows:
Fund | Ordinary | Return of | Total | |||||||||
Guggenheim Russell Top 50® Mega Cap ETF | $ | 11,355,966 | $ | — | $ | 11,355,966 | ||||||
Guggenheim S&P 500® Pure Value ETF | 22,046,039 | — | 22,046,039 | |||||||||
Guggenheim S&P 500® Pure Growth ETF | 12,287,095 | — | 12,287,095 | |||||||||
Guggenheim S&P MidCap 400® Pure Value ETF | 1,909,844 | — | 1,909,844 | |||||||||
Guggenheim S&P MidCap 400® Pure Growth ETF | 4,173,726 | 467,016 | 4,640,742 | |||||||||
Guggenheim S&P SmallCap 600® Pure Value ETF | 1,976,663 | — | 1,976,663 | |||||||||
Guggenheim S&P SmallCap 600® Pure Growth ETF | 849,033 | 5,968 | 855,001 | |||||||||
The tax character of distributions paid during the year ended October 31, 2014 was as follows:
Fund | Ordinary | Return of | Total | |||||||||
Guggenheim Russell Top 50® Mega Cap ETF | $ | 10,780,498 | $ | — | $ | 10,780,498 | ||||||
Guggenheim S&P 500® Pure Value ETF | 14,264,565 | — | 14,264,565 | |||||||||
Guggenheim S&P 500® Pure Growth ETF | 9,850,742 | — | 9,850,742 | |||||||||
Guggenheim S&P MidCap 400® Pure Value ETF | 1,275,783 | — | 1,275,783 | |||||||||
Guggenheim S&P MidCap 400® Pure Growth ETF | 5,020,350 | — | 5,020,350 | |||||||||
Guggenheim S&P SmallCap 600® Pure Value ETF | 1,189,682 | — | 1,189,682 | |||||||||
Guggenheim S&P SmallCap 600® Pure Growth ETF | 499,340 | — | 499,340 | |||||||||
The tax character of distributable earnings/(accumulated losses) at October 31, 2015 was as follows:
Fund | Undistributed | Undistributed | Accumulated | Net Unrealized | Total | |||||||||||||||
Guggenheim Russell Top 50® Mega Cap ETF | $ | 861,244 | $ | — | $ | (102,531,923 | ) | $ | 75,211,430 | $ | (26,459,249 | ) | ||||||||
Guggenheim S&P 500® Pure Value ETF | 249,496 | — | (22,255,596 | ) | (55,792,928 | ) | (77,799,028 | ) | ||||||||||||
Guggenheim S&P 500® Pure Growth ETF | — | — | — | 203,933,731 | 203,933,731 | |||||||||||||||
Guggenheim S&P MidCap 400® Pure Value ETF | 65,209 | — | (4,446,838 | ) | (2,253,589 | ) | (6,635,218 | ) | ||||||||||||
Guggenheim S&P MidCap 400® Pure Growth ETF | — | — | (7,247,888 | ) | 60,686,777 | 53,438,889 | ||||||||||||||
Guggenheim S&P SmallCap 600® Pure Value ETF | 14,208 | — | (20,666,281 | ) | (5,973,896 | ) | (26,625,969 | ) | ||||||||||||
Guggenheim S&P SmallCap 600® Pure Growth ETF | — | — | (104,981 | ) | (4,088,137 | ) | (4,193,118 | ) | ||||||||||||
54 | GUGGENHEIM ETFs ANNUAL REPORT |
NOTES TO FINANCIAL STATEMENTS (continued) |
For Federal income tax purposes, capital loss carryforwards represent realized losses of the Funds that may be carried forward and applied against future capital gains. For taxable years beginning on or before December 22, 2010, such capital losses may be carried forward for a maximum of eight years. Under the RIC Modernization Act of 2010, the Funds are permitted to carry forward capital losses incurred in taxable years beginning after December 22, 2010 for an unlimited period. However, any losses incurred during those taxable years must be utilized prior to the losses incurred in pre-enactment taxable years. As a result of this ordering rule, pre-enactment capital loss carryforwards may be more likely to expire unused. Additionally, post-enactment capital losses that are carried forward will retain their character as either short-term or long-term capital losses rather than being considered all short-term as under previous law. As of October 31, 2015, capital loss carryforwards for the Funds were as follows:
Unlimited | ||||||||||||||||||||||||||||
Fund | Expires in | Expires in | Expires in | Expires in | Short-Term | Long-Term | Remaining | |||||||||||||||||||||
Guggenheim Russell Top 50® Mega Cap ETF | $ | (32,651,414 | ) | $ | (51,313,952 | ) | $ | (10,584,384 | ) | $ | (3,619,667 | ) | $ | (263,133 | ) | $ | (4,099,373 | ) | $ | (102,531,923 | ) | |||||||
Guggenheim S&P 500® Pure Value ETF | — | (2,158,232 | ) | — | — | (11,245,644 | ) | (8,851,720 | ) | (22,255,596 | ) | |||||||||||||||||
Guggenheim S&P 500® Pure Growth ETF | — | — | — | — | — | — | — | |||||||||||||||||||||
Guggenheim S&P MidCap 400® Pure Value ETF | — | (1,163,866 | ) | — | — | (3,061,967 | ) | (221,005 | ) | (4,446,838 | ) | |||||||||||||||||
Guggenheim S&P MidCap 400® Pure Growth ETF | — | — | — | — | (7,247,888 | ) | — | (7,247,888 | ) | |||||||||||||||||||
Guggenheim S&P SmallCap 600® Pure Value ETF | — | (5,771,118 | ) | (8,325,244 | ) | — | (3,322,265 | ) | (3,247,654 | ) | (20,666,281 | ) | ||||||||||||||||
Guggenheim S&P SmallCap 600® Pure Growth ETF | — | — | — | — | (104,981 | ) | — | (104,981 | ) | |||||||||||||||||||
In order to present paid-in-capital, undistributed net investment income and accumulated net realized gain (loss) on investments on the statement of assets and liabilities that more closely represent their tax character, certain adjustments have been made to these accounts. These adjustments have no effect on the net assets or NAV. The most significant of these adjustments are for net capital gains (losses) resulting from in-kind redemptions, return of capital on investments, and the use of equalization accounting. For the year ended October 31, 2015, the adjustments for the Funds were as follows:
Fund | Paid-In | Undistributed | Accumulated | |||||||||
Guggenheim Russell Top 50® Mega Cap ETF | $ | 48,134,045 | $ | 5,601 | $ | (48,139,646 | ) | |||||
Guggenheim S&P 500® Pure Value ETF | 104,627,018 | — | (104,627,018 | ) | ||||||||
Guggenheim S&P 500® Pure Growth ETF | 77,077,805 | (875,134 | ) | (76,202,671 | ) | |||||||
Guggenheim S&P MidCap 400® Pure Value ETF | 12,640,589 | — | (12,640,589 | ) | ||||||||
Guggenheim S&P MidCap 400® Pure Growth ETF | 45,260,200 | (1 | ) | (45,260,199 | ) | |||||||
Guggenheim S&P SmallCap 600® Pure Value ETF | 15,056,918 | — | (15,056,918 | ) | ||||||||
Guggenheim S&P SmallCap 600® Pure Growth ETF | 14,038,064 | — | (14,038,064 | ) | ||||||||
At October 31, 2015, the identified cost of investments in securities owned by each Fund for Federal income tax purposes and the gross unrealized appreciation and depreciation were as follows:
Fund | Tax | Tax | Tax | Net | ||||||||||||
Guggenheim Russell Top 50® Mega Cap ETF | $ | 420,691,918 | $ | 104,286,142 | $ | (29,074,712 | ) | $ | 75,211,430 | |||||||
Guggenheim S&P 500® Pure Value ETF | 868,267,975 | 65,106,955 | (120,899,883 | ) | (55,792,928 | ) | ||||||||||
Guggenheim S&P 500® Pure Growth ETF | 2,133,677,421 | 360,540,105 | (156,606,374 | ) | 203,933,731 | |||||||||||
Guggenheim S&P MidCap 400® Pure Value ETF | 106,384,568 | 10,027,065 | (12,280,654 | ) | (2,253,589 | ) | ||||||||||
Guggenheim S&P MidCap 400® Pure Growth ETF | 709,211,729 | 101,836,953 | (41,150,176 | ) | 60,686,777 | |||||||||||
Guggenheim S&P SmallCap 600® Pure Value ETF | 156,147,346 | 22,725,633 | (28,699,529 | ) | (5,973,896 | ) | ||||||||||
Guggenheim S&P SmallCap 600® Pure Growth ETF | 229,977,860 | 17,763,352 | (21,851,489 | ) | (4,088,137 | ) | ||||||||||
GUGGENHEIM ETFs ANNUAL REPORT | 55 |
NOTES TO FINANCIAL STATEMENTS (continued) |
7. Investment Transactions
For the year ended October 31, 2015, the Funds had investments transactions in-kind associated with subscriptions and redemptions as follows:
Fund | Subscriptions | Redemptions | ||||||
Guggenheim Russell Top 50® Mega Cap ETF | $ | 49,219,504 | $ | 170,372,322 | ||||
Guggenheim S&P 500® Pure Value ETF | 432,982,489 | 856,733,933 | ||||||
Guggenheim S&P 500® Pure Growth ETF | 750,165,757 | 304,060,498 | ||||||
Guggenheim S&P MidCap 400® Pure Value ETF | 42,817,352 | 53,393,997 | ||||||
Guggenheim S&P MidCap 400® Pure Growth ETF | 205,998,048 | 203,303,929 | ||||||
Guggenheim S&P SmallCap 600® Pure Value ETF | 50,199,609 | 58,847,892 | ||||||
Guggenheim S&P SmallCap 600® Pure Growth ETF | 188,542,636 | 63,213,694 | ||||||
For the year ended October 31, 2015, the cost of purchases and proceeds from sales of investment securities, excluding government securities, short-term investments and in-kind transactions, were as follows:
Fund | Purchases | Sales | ||||||
Guggenheim Russell Top 50® Mega Cap ETF | $ | 41,680,931 | $ | 41,143,999 | ||||
Guggenheim S&P 500® Pure Value ETF | 547,901,815 | 546,943,424 | ||||||
Guggenheim S&P 500® Pure Growth ETF | 1,276,111,602 | 1,278,124,680 | ||||||
Guggenheim S&P MidCap 400® Pure Value ETF | 67,821,321 | 68,003,032 | ||||||
Guggenheim S&P MidCap 400® Pure Growth ETF | 751,402,113 | 754,376,327 | ||||||
Guggenheim S&P SmallCap 600® Pure Value ETF | 86,972,480 | 86,745,578 | ||||||
Guggenheim S&P SmallCap 600® Pure Growth ETF | 94,455,764 | 97,891,598 | ||||||
8. Legal Proceedings
Lyondell Chemical Company
In December 2011, Rydex ETF Trust was named as a defendant in Weisfelner,as Trustee of the LB Creditor Trust, v. Fund 1 (In re Lyondell Chemical Co.), Adv. Pro. No. 10-4609 (Bankr. S.D.N.Y.) (the “Creditor Trust Action”).
Similar to the claims made in the Tribune matter, the Weisfelner complaint seeks to have set aside and recovered as fraudulent transfers from former Lyondell Chemical Company (“Lyondell”) shareholders the consideration paid to them pursuant to the cash out merger of Lyondell shareholders in connection with the combination of Lyondell and Basell AF in 2007. Lyondell filed for bankruptcy in 2008.
On April 7, 2014, the plaintiff filed a Third Amended Complaint. In the related action entitled Weisfelner, as Trustee of the LB Litigation Trust v. A. Holmes & H. Holmes TTEE (In re Lyondell Co.), Adversary Proceeding No. 10-5525 (Bankr. S.D.N.Y.) (the “Litigation Trust Action”), the plaintiff also filed a Second Amended Complaint that alleges a claim against the former Lyondell shareholders under federal law for intentional fraudulent transfer. A third related action against the former Lyondell shareholders, Weisfelner, as Trustee of the LB Creditor Trust v. Reichman, Adversary Proceeding No. 12-1570 (Bankr. S.D.N.Y.) (the “Reichman Action”), is pending as well.
On May 8, 2014, the plaintiff in the Litigation Trust action filed a motion to certify a defendant class generally comprised of all former Lyondell shareholders that received proceeds in exchange for their shares in the 2007 merger transaction.
On July 30, 2014, the defendants filed a motion to dismiss these lawsuits. The Court held oral argument on the motions to dismiss and on the motion for class certification on January 14 and January 15, 2015. On September 15, 2015, the Court denied the motion for class certification without prejudice to the plaintiff’s right to file a renewed motion.
On November 18, 2015, the Court granted the defendants’ motion to dismiss the Litigation Trust Action and denied their motion to dismiss the Creditor Trust and Reichman Actions. The Litigation Trust Action is now over, though the plaintiff may appeal the dismissal.. Discovery has commenced, and will continue, in the Creditor Trust and Reichman Actions.
56 | GUGGENHEIM ETFs ANNUAL REPORT |
NOTES TO FINANCIAL STATEMENTS (concluded) |
This lawsuit does not allege any wrongdoing on the part of Rydex ETF Trust. The following series of Rydex ETF Trust received cash proceeds from the merger in the following amounts: Guggenheim S&P Midcap 400 Pure Value ETF Fund - $572,640. At this stage of the proceedings, Rydex ETF Trust is not able to make a reliable prediction as to the outcome of this lawsuit or the effect, if any, on the fund’s net asset value.
Tribune Company
Rydex ETF Trust has been named as a defendant and a putative member of the proposed defendant class of shareholders in the case entitled Kirschner v. FitzSimons, No. 12-2652 (S.D.N.Y.) (formerly Official Committee of Unsecured Creditors of Tribune Co. v. FitzSimons, Adv. Pro. No. 10-54010 (Bankr. D. Del.)) (the “FitzSimons action”), as a result of ownership of shares by certain series of the Rydex ETF Trust in the Tribune Company (“Tribune”) in 2007, when Tribune effected a leveraged buyout transaction (“LBO”) by which Tribune converted to a privately-held company. In his complaint, the plaintiff has alleged that, in connection with the LBO, insiders and shareholders were overpaid for their Tribune stock using financing that the insiders knew would, and ultimately did, leave the Tribune Company insolvent. The plaintiff has asserted claims against certain insiders, major shareholders, professional advisers, and others involved in the LBO. The plaintiff is also attempting to obtain from former Tribune shareholders, including Rydex ETF Trust, the proceeds they received in connection with the LBO.
In June 2011, a group of Tribune creditors filed multiple actions against former Tribune shareholders involving state law constructive fraudulent conveyance claims arising out of the 2007 LBO (the “SLCFC actions”). Rydex ETF Trust has been named as a defendant in one of the SLCFC actions: Deutsche Bank Trust Co. Americas v. McGurn, No. 11-1510 (S.D.N.Y.). In those actions, the creditors seek to recover from Tribune’s former shareholders the proceeds received in connection with the 2007 LBO.
The FitzSimons action and the SLCFC actions have been consolidated with the majority of the other Tribune LBO-related lawsuits in a multidistrict litigation proceeding captioned In re Tribune Company Fraudulent Conveyance Litig., No. 11-md-2696 (S.D.N.Y.) (the “MDL Proceeding”).
On September 23, 2013, the District Court granted the defendants’ omnibus motion to dismiss the SLCFC actions, on the basis that the creditors lacked standing. On September 30, 2013, the creditors filed a notice of appeal of the September 23 order. On October 28, 2013, the defendants filed a joint notice of cross-appeal of that same order. The SLCFC appeals have been fully briefed, and oral argument in front of the U.S. Court of Appeals for the Second Circuit occurred on November 5, 2014. The Court has not yet issued a decision on the appeals.
On May 23, 2014, the defendants filed motions to dismiss the FitzSimons action, including a global motion to dismiss Count I, which is the claim brought against former Tribune shareholders for intentional fraudulent conveyance under U.S. federal law. The Court has not yet issued a decision on any of these motions.
None of these lawsuits alleges any wrongdoing on the part of Rydex ETF Trust. The following series of Rydex ETF Trust held shares of Tribune and tendered these shares as part of Tribune’s LBO: Guggenheim S&P 500 Pure Value ETF (the “Fund”). The value of the proceeds received by the foregoing Fund was $197,050. At this stage of the proceedings, Rydex ETF Trust is not able to make a reliable prediction as to the outcome of these lawsuits or the effect, if any, on the Fund’s net asset value.
9. Subsequent Event
At a meeting held on October 14, 2015, the Adviser recommended and the Board of the Trust approved changing the Underlying Index for the Guggenheim Russell Top 50® Mega Cap ETF from the Russell Top 50® Mega Cap Index to the S&P 500® Top 50 Index. In connection with the change in the Fund’s Underlying Index, the Board also approved changing the Fund’s name to Guggenheim S&P 500® Top 50 ETF. The changes in index and Fund name are expected to become effective on January 26, 2016, or such other date as deemed appropriate by the officers of the Trust.
GUGGENHEIM ETFs ANNUAL REPORT | 57 |
REPORT OF INDEPENDENT REGISTERED PUBLIC ACCOUNTING FIRM |
The Board of Trustees and Shareholders of Rydex ETF Trust:
We have audited the accompanying statements of assets and liabilities, including the schedules of investments, of Guggenheim Russell Top 50® Mega Cap ETF, Guggenheim S&P 500® Pure Value ETF, Guggenheim S&P 500® Pure Growth ETF, Guggenheim S&P MidCap 400® Pure Value ETF, Guggenheim S&P MidCap 400® Pure Growth ETF, Guggenheim S&P SmallCap 600® Pure Value ETF and Guggenheim S&P SmallCap 600® Pure Growth ETF (seven of the series constituting the Rydex ETF Trust) (the “Funds”) as of October 31, 2015, and the related statements of operations for the year then ended, the statements of changes in net assets for each of the two years in the period then ended, and the financial highlights for each of the five years in the period then ended. These financial statements and financial highlights are the responsibility of the Funds’ management. Our responsibility is to express an opinion on these financial statements and financial highlights based on our audits.
We conducted our audits in accordance with the standards of the Public Company Accounting Oversight Board (United States). Those standards require that we plan and perform the audit to obtain reasonable assurance about whether the financial statements and financial highlights are free of material misstatement. We were not engaged to perform an audit of the Funds’ internal control over financial reporting. Our audits included consideration of internal control over financial reporting as a basis for designing audit procedures that are appropriate in the circumstances, but not for the purpose of expressing an opinion on the effectiveness of the Funds’ internal control over financial reporting. Accordingly, we express no such opinion. An audit also includes examining, on a test basis, evidence supporting the amounts and disclosures in the financial statements and financial highlights, assessing the accounting principles used and significant estimates made by management, and evaluating the overall financial statement presentation. Our procedures included confirmation of securities owned as of October 31, 2015, by correspondence with the custodian and brokers. We believe that our audits provide a reasonable basis for our opinion.
In our opinion, the financial statements and financial highlights referred to above present fairly, in all material respects, the financial position of the above listed Funds (seven of the series constituting the Rydex ETF Trust) at October 31, 2015, the results of their operations for the year then ended, the changes in their net assets for each of the two years in the period then ended, and their financial highlights for each of the five years in the period then ended, in conformity with U.S. generally accepted accounting principles.
McLean, Virginia
December 23, 2015
58 | GUGGENHEIM ETFs ANNUAL REPORT |
OTHER INFORMATION (Unaudited) |
Federal Income Tax Information
In January 2016, shareholders will be advised on IRS Form 1099 DIV or substitute 1099 DIV as to the federal tax status of the distributions received by shareholders in the calendar year 2015.
Of the ordinary income distributions paid during the year, the following funds had the corresponding percentages qualify for the dividends received deduction for corporations:
Fund | Dividend |
Guggenheim Russell Top 50® Mega Cap ETF | 100.00% |
Guggenheim S&P 500® Pure Value ETF | 95.93% |
Guggenheim S&P 500® Pure Growth ETF | 100.00% |
Guggenheim S&P MidCap 400® Pure Value ETF | 100.00% |
Guggenheim S&P MidCap 400® Pure Growth ETF | 100.00% |
Guggenheim S&P SmallCap 600® Pure Value ETF | 100.00% |
Guggenheim S&P SmallCap 600® Pure Growth ETF | 95.64% |
Additionally, the following amounts of taxable ordinary income dividends paid during the fiscal year qualified for the lower income tax rate available to individuals under the Jobs and Growth Tax Relief Reconciliation Act of 2003:
Fund | Qualified |
Guggenheim Russell Top 50® Mega Cap ETF | 100.00% |
Guggenheim S&P 500® Pure Value ETF | 100.00% |
Guggenheim S&P 500® Pure Growth ETF | 100.00% |
Guggenheim S&P MidCap 400® Pure Value ETF | 100.00% |
Guggenheim S&P MidCap 400® Pure Growth ETF | 100.00% |
Guggenheim S&P SmallCap 600® Pure Value ETF | 100.00% |
Guggenheim S&P SmallCap 600® Pure Growth ETF | 100.00% |
With respect to the taxable year ended October 31, 2015, the Guggenheim S&P 500® Pure Growth ETF hereby designates as capital gain dividends $2,872,129 using proceeds from shareholder redemptions, or, if subsequently determined to be different, the net capital gain of such year.
Proxy Voting Information
A description of the policies and procedures that the Trust uses to determine how to vote proxies relating to securities held in the Funds’ portfolios is available, without charge and upon request, by calling 800.820.0888. This information is also available from the EDGAR database on the SEC’s website at http://www.sec.gov.
Information regarding how the Funds voted proxies relating to portfolio securities during the most recent 12-month period ended June 30 is available without charge, upon request, by calling 800.820.0888. This information is also available from the EDGAR database on the SEC’s website at http://www.sec.gov.
Sector Classification
Information in the “Schedule of Investments” is categorized by sectors using sector-level Classifications defined by the Bloomberg Industry Classification System, a widely recognized industry classification system provider. Each Fund’s registration statement has investment policies relating to concentration in specific sectors/industries. For purposes of these investment policies, the Funds usually classify sectors/industries based on industry-level Classifications used by widely recognized industry classification system providers such as Bloomberg Industry Classification System, Global Industry Classification Standards and Barclays Global Classification Scheme.
GUGGENHEIM ETFs ANNUAL REPORT | 59 |
OTHER INFORMATION (Unaudited)(continued) |
Quarterly Portfolio Schedules Information
The Trust files its complete schedule of portfolio holdings with the SEC for the first and third quarters of each fiscal year on Form N-Q; which are available on the SEC’s website at http://www.sec.gov. The Funds’ Forms N-Q may be reviewed and copied at the SEC’s Public Reference Room in Washington, DC, and that information on the operation of the Public Reference Room may be obtained by calling 800-SEC-0330. Copies of the portfolio holdings are also available to shareholders, without charge and upon request, by calling 800.820.0888.
Board Considerations in Approving the Continuation of the Investment Advisory Agreement
The Board, including the Independent Trustees, attended an in-person meeting held on May 18, 2015, called for the purpose of, among other things, the consideration of, and voting on, the approval and continuation of the investment advisory agreement (the “Investment Advisory Agreement”) between the Trust and the Advisor applicable to each series of the Trust except for the S&P 500® Equal Weight Real Estate ETF (each, a “Fund” and, collectively, the “Funds”). The Board unanimously approved the continuation of the Investment Advisory Agreement for an additional one-year period based on the Board’s review of qualitative and quantitative information provided by the Advisor. The Board had previously considered information pertaining to the renewal of the Investment Advisory Agreement at an in-person meeting held on April 28, 2015 (together, with the May 18 meeting, the “Meetings”).
Prior to reaching the conclusion to approve the continuation of the Investment Advisory Agreement, the Independent Trustees requested and obtained from the Advisor such information as the Independent Trustees deemed reasonably necessary to evaluate the Investment Advisory Agreement. In addition, the Board received a memorandum from fund counsel regarding the responsibilities of the Board with respect to the approval of investment advisory agreements and participated in question and answer sessions with representatives of the Advisor. The Trustees also carefully considered information that they had received throughout the year as part of their regular oversight of the Funds. At the Meetings, the Board obtained and reviewed a wide variety of information, including certain comparative information regarding the Funds’ fees, expenses, and performance relative to the fees, expenses, and performance of other comparable funds (the “FUSE reports”). The Independent Trustees carefully evaluated this information, met in executive session outside the presence of fund management, and were advised by independent legal counsel with respect to their deliberations.
At the Meetings, the Board, including the Independent Trustees, evaluated a number of factors, including among others: (a) the nature, extent and quality of the Advisor’s investment advisory and other services; (b) the Advisor’s investment management personnel; (c) the Advisor’s operations and financial condition; (d) the Advisor’s brokerage practices (including any soft dollar arrangements) and the variety and complexity of its investment strategies; (e) a comparison of the Funds’ advisory fees to the advisory fees charged to comparable funds or accounts, giving special attention to the existence of economies of scale and the absence of breakpoints in these fees and the Advisor’s rationale for not providing for breakpoints at this point in time; (f) each Fund’s overall fees and operating expenses compared with those of similar funds; (g) the level of the Advisor’s profitability from its Fund-related operations; (h) the Advisor’s compliance processes and systems; (i) the Advisor’s compliance policies and procedures; (j) the Advisor’s reputation, expertise and resources in the financial markets; and (k) Fund performance compared with that of similar funds and/or appropriate benchmarks. In its deliberations, the Trustees did not identify any single piece of information that was all-important or controlling, noting that each Trustee could attribute different weights to the various factors considered.
Based on the Board’s deliberations at the Meetings, the Board, including all of the Independent Trustees, unanimously: (a) concluded that the terms of the Investment Advisory Agreement are fair and reasonable; (b) concluded that the Advisor’s fees are reasonable in light of the services that it provides to the Funds; and (c) agreed to approve and continue the Investment Advisory Agreement based upon the following considerations, among others:
● | Nature, Extent and Quality of Services Provided by the Advisor. The Board evaluated, among other things, the Advisor’s business, financial resources, quality and quantity of personnel, experience, past performance, the variety and complexity of its investment strategies, brokerage practices, and the adequacy of its compliance systems and processes. The Board reviewed the scope of services to be provided by the Advisor under the Investment Advisory Agreement and noted that there would be no significant differences between the scope of services required to be provided by the Advisor for the past year and the scope of services required to be provided during the upcoming year. The Board also considered the Advisor’s representations to the Board that the Advisor would continue |
60 | GUGGENHEIM ETFs ANNUAL REPORT |
OTHER INFORMATION (Unaudited)(concluded) |
to provide investment and related services that were of materially the same quality and quantity as services provided to the Funds in the past, and whether these services are appropriate in scope and extent in light of the Funds’ operations, the competitive landscape of the investment company business and investor needs. Based on the foregoing, the Trustees determined that the approval of the Investment Advisory Agreement would enable shareholders of the Funds to receive high quality services at a cost that was appropriate and reasonable.
● | Fund Expenses and Performance of the Funds and the Advisor. The Board reviewed statistical information provided by the Advisor regarding the expense ratio components and performance of each Fund. The Advisor engaged FUSE Research Network LLC (“FUSE”), an independent, third party research provider, to prepare reports to help the Board compare the Funds’ fees, expenses, and total return performance with those of a peer group and peer universe of funds selected by FUSE. In the reports, each Fund’s expense ratio components, including actual advisory fees, waivers/reimbursements, and gross and net total expenses, are compared to those of other funds with shared key characteristics (e.g., asset size, fee structure, sector or industry investment focus) determined by FUSE to comprise a Fund’s applicable peer group. The Board also considered the Advisor’s representation that it found the peer groups compiled by FUSE to be appropriate. The statistical information related to the performance of each Fund included three month and one-, three-, and five-year performance for the Fund compared to that of its peers. Based on the foregoing, the Board determined that the proposed advisory fees paid by the Funds are reasonable in relation to the nature and quality of the services provided by the Advisor. |
● | Costs of Services Provided to the Funds and Profits Realized by the Advisor and its Affiliates. The Board reviewed information about the profitability of the Funds to the Advisor based on the advisory fees payable under the current Investment Advisory Agreement for the last calendar year. The Board noted that the Advisor had contractually agreed to pay all operating expenses of the Funds, including the cost of index licensing fees, transfer agency, custody, fund administration, legal, audit and other services, except interest, taxes, brokerage commissions and other expenses connected with the execution of portfolio transactions, distribution fees, and extraordinary expenses. The Board also analyzed the Funds’ expenses, including the investment advisory fees paid to the Advisor, and reviewed the FUSE reports. The Board also reviewed information regarding the direct revenue received by the Advisor and ancillary revenue, if any, received by the Advisor and/or its affiliates in connection with the services provided to the Funds by the Advisor and/or its affiliates. The Board considered information regarding the Advisor’s profit margin as reflected in the Advisor’s profitability analysis, as well as information provided by the Advisor concerning the methodology used to allocate various expenses among the individual Funds in determining the Advisor’s profitability. Based on the foregoing, the Board determined that the profit to the Advisor on the fees paid by the Funds is not excessive in view of the nature and quality of the services provided by the Advisor. |
● | Economies of Scale. The Board considered the absence of breakpoints in the Advisor’s fee schedule and reviewed information regarding the extent to which economies of scale or other efficiencies may result from increases in the Funds’ asset levels. The Board noted that the Investment Advisory Agreement did not provide for breakpoints in each Fund’s advisory fee rates as assets of a Fund increase. However, the Board further noted the Advisor’s assertion that future economies of scale had been taken into consideration by fixing relatively low advisory fees for the Funds, effectively sharing the benefits of lower fees with the Funds from inception. The Board noted that it intends to continue to monitor fees as each Fund grows in size and assess whether fee breakpoints may be warranted. |
● | Other Benefits to the Advisor and/or its Affiliates. In addition to evaluating the Advisor’s services, the Board considered the nature and amount of other benefits to be received by the Advisor and its affiliates as a result of their relationship with the Fund, including any soft dollar usage by the Advisor and any intangible benefits. In particular, the Board considered the nature, extent, quality, and cost of certain distribution services performed by the Advisor’s affiliate under the distribution agreement and the Distribution Plan pursuant to Rule 12b-1 of the 1940 Act. In light of the costs of providing services pursuant to the separate agreements as well as the Advisor’s and its affiliates’ commitment to the Funds, the Board concluded the ancillary benefits the Advisor and its affiliates received were reasonable. |
On the basis of the information provided to it and its evaluation of that information, the Board, including the Independent Trustees, concluded that the terms of the Investment Advisory Agreement were reasonable, and that approval of the continuation of the Investment Advisory Agreement was in the best interests of the Funds and their shareholders.
GUGGENHEIM ETFs ANNUAL REPORT | 61 |
INFORMATION ON BOARD OF TRUSTEES AND OFFICERS (Unaudited) |
A Board of Trustees oversees the Trust, as well as other trusts of GI, in which its members have no stated term of service, and continue to serve after election until resignation. The Statement of Additional Information includes further information about Fund Trustees and Officers, and can be obtained without charge by visiting guggenheiminvestments.com or by calling 800.820.0888.
Name, Address* | Position(s) Held with the | Principal Occupation(s) | Number of | Other |
INTERESTED TRUSTEE | ||||
Donald C. Cacciapaglia** (1951) | Trustee from 2012 to present. | Current: President and CEO, certain other funds in the Fund Complex (2012-present); Vice Chairman, Guggenheim Investments (2010-present).
Former: Chairman and CEO, Channel Capital Group, Inc. (2002-2010). | 224 | Clear Spring Life Insurance Company (2015-present); Guggenheim Partners Japan, Ltd. (2014-present); Delaware Life (2013-present); Guggenheim Life and Annuity Company (2011-present); Paragon Life Insurance Company of Indiana (2011-present). |
INDEPENDENT TRUSTEES | ||||
Corey A. Colehour (1945) | Trustee and Member of the Audit Committee from 2003 to present; Member of the Governance and Nominating Committees from 2005 to present; and Member of the Investment and Performance Committee from 2014 to present. | Retired. | 133 | None. |
J. Kenneth Dalton (1941) | Trustee from 2003 to present; Chairman and Member of the Audit Committee from 2003 to present; Member of the Governance and Nominating Committees from 2005 to present; and Member of the Complinace and Risk Oversight Committee from 2010 to present. | Retired. | 133 | Epiphany Funds (4) (2009-present). |
John O. Demaret (1940) | Vice Chairman of the Board of Trustees from 2014 to present; Trustee and Member of the Audit Committee from 2003 to present; Chairman of the Board from 2006 to 2014; Member of the Compliance and Risk Oversight Committee from 2010 to present; Chairman and Member of the Investment and Performance Committee from 2014 to present; and Member of the Nominating Committee from 2014 to present. | Retired. | 133 | None. |
62 | GUGGENHEIM ETFs ANNUAL REPORT |
INFORMATION ON BOARD OF TRUSTEES AND OFFICERS (Unaudited)(continued) |
Name, Address* | Position(s) Held with the | Principal Occupation(s) | Number of | Other |
INDEPENDENT TRUSTEES - concluded | ||||
Werner E. Keller (1940) | Chairman of the Board from 2014 to present; Trustee and Member of the Audit, Governance and Nominating Committees from 2005 to present; Chairman and Member of the Compliance and Risk Oversight Committee from 2010 to present; and Member of the Investment and Performance Committee from 2014 to present. | Current: Founder and President, Keller Partners, LLC (investment research firm) (2005-present). | 133 | None. |
Thomas F. Lydon, Jr. (1960) | Trustee and Member of the Audit, Governance and Nominating Committees from 2005 to present. | Current: President, Global Trends Investments (registered investment adviser) (1996-present). | 133 | US Global Investors (GROW) (1995-present). |
Patrick T. McCarville (1942) | Trustee and Member of the Audit Committee from 2003 to present; Chairman and Member of the Governance and Nominating Committees from 2005 to present. | Retired. Former: Chief Executive Officer, Par Industries, Inc., d/b/a Par Leasing (1977-2010). | 133 | None. |
Name, Address* | Position(s) Held with the | Principal Occupation(s) |
OFFICERS | ||
Donald C. Cacciapaglia (1951) | President (2012-present). | Current: President and CEO, certain other funds in the Fund Complex (2012-present); Vice Chairman, Guggenheim Investments (2010-present).
Former: Chairman and CEO, Channel Capital Group Inc. (2002-2010). |
Michael P. Byrum (1970) | Vice President (1999-present). | Current: Senior Vice President, Security Investors, LLC (2010-present); President and Chief Investment Officer, Rydex Holdings, LLC (2008-present); Director and Chairman, Advisory Research Center, Inc. (2006-present); Manager, Guggenheim Specialized Products, LLC (2005-present).
Former: Vice President, Guggenheim Distributors, LLC (2009); Director (2009-2010) and Secretary (2002-2010), Rydex Fund Services, LLC; Director (2008-2010), Chief Investment Officer (2006-2010), President (2004-2010) and Secretary (2002-2010), Rydex Advisors, LLC; Director (2008-2010), Chief Investment Officer (2006-2010), President (2004-2010) and Secretary (2002-2010), Rydex Advisors II, LLC. |
GUGGENHEIM ETFs ANNUAL REPORT | 63 |
INFORMATION ON BOARD OF TRUSTEES AND OFFICERS (Unaudited)(concluded) |
Name, Address* | Position(s) Held with the | Principal Occupation(s) |
OFFICERS - concluded | ||
Nikolaos Bonos (1963) | Vice President and Treasurer (2003-present). | Current: Senior Vice President, Security Investors, LLC (2010-present); Chief Executive Officer, Guggenheim Specialized Products, LLC (2009-present); Chief Executive Officer & President, Rydex Fund Services, LLC (2009-present); Vice President, Rydex Holdings, LLC (2008-present).
Former: Senior Vice President, Security Global Investors, LLC (2010-2011); and Senior Vice President, Rydex Advisors, LLC and Rydex Advisors II, LLC (2006-2011). |
Elisabeth Miller (1968) | Chief Compliance Officer (2012-present). | Current: CCO, certain other funds in the Fund Complex (2012-present); CCO, Security Investors, LLC (2012-present); CCO, Guggenheim Funds Investment Advisors, LLC (2012-present); Managing Director, Guggenheim Investments (2012-present); Vice President, Guggenheim Funds Distributors, LLC (March 2014-present).
Former: CCO, Guggenheim Distributors, LLC (2009-March 2014); Senior Manager, Security Investors, LLC (2004-2009); Senior Manager, Guggenheim Distributors, LLC (2004-2009). |
Joseph M. Arruda (1966) | Assistant Treasurer (2006-present). | Current: Assistant Treasurer, certain other funds in the Fund Complex (2006-present); Vice President, Security Investors, LLC (2010-present); CFO and Manager, Guggenheim Specialized Products, LLC (2009-present).
Former: Vice President, Security Global Investors, LLC (2010-2011); Vice President, Rydex Advisors, LLC (2010); Vice President, Rydex Advisors II, LLC (2010). |
Paul J. Davio (1972) | Assistant Treasurer (2014-present). | Current: Assistant Treasurer, certain other funds in the Fund Complex (2014-present); Director, Guggenheim Investments (2006-present).
Former: Manager, Mutual Fund Administration, Guggenheim Investments (2003-2006). |
Amy J. Lee (1961) | Vice President (2009-present) and Secretary (2012-present). | Current: Chief Legal Officer, certain other funds in the Fund Complex (2013-present); Senior Managing Director, Guggenheim Investments (2012-present).
Former: Vice President, Associate General Counsel and Assistant Secretary, Security Benefit Life Insurance Company and Security Benefit Corporation (2004-2012). |
* | All Trustees and Officers may be reached c/o Guggenheim Investments, 805 King Farm Boulevard, Suite 600, Rockville, MD 20850. |
** | Mr. Cacciapaglia is an “interested” person of the Trust, as that term is defined in the 1940 Act by virtue of his affiliation with the Adviser’s parent company. |
*** | The “Fund Complex” includes all closed-end and open-end funds (including all of their portfolios) advised by the Adviser and any funds that have an investment adviser or servicing agent that is an affiliated person of the Adviser. Information provided is as of the date of this report. |
64 | GUGGENHEIM ETFs ANNUAL REPORT |
GUGGENHEIM INVESTMENTS PRIVACY POLICIES (Unaudited) |
Rydex Funds, Guggenheim Funds, Rydex Investments, Guggenheim Funds Distributors, LLC, Security Investors, LLC, Security Distributors, Inc., Guggenheim Partners Investment Managers, LLC, and Rydex Advisory Services (Collectively “Guggenheim Investments”).
Our Commitment to You
When you become a Guggenheim Investments investor, you entrust us with not only your hard-earned money but also with personal and financial information about you. We recognize that your relationship with us is based on trust and that you expect us to act responsibly and in your best interests. Because we have access to this private information about you, we hold ourselves to the highest standards in its safekeeping and use. This means, most importantly, that we do not sell client information to anyone—whether it is your personal information or if you are a current or former Guggenheim Investments client.
The Information We Collect About You
In the course of doing business with shareholders and investors, we collect nonpublic personal information about you. You typically provide personal information when you complete a Guggenheim Investments account application or when you request a transaction that involves Rydex and Guggenheim Investments funds or one of the Guggenheim Investments affiliated companies. “Nonpublic personal information” is personally identifiable private information about you. For example, it includes information regarding your name and address, Social Security or taxpayer identification number, assets, income, account balance, bank account information and investment activity (e.g., purchase and redemption history).
How We Handle Your Personal Information
As emphasized above, we do not sell information about current or former clients or their accounts to third parties. Nor do we share such information, except when necessary to complete transactions at your request or to make you aware of related investment products and services that we offer. Additional details about how we handle your personal information are provided below. To complete certain transactions or account changes that you direct, it may be necessary to provide identifying information to companies, individuals or groups that are not affiliated with Guggenheim Investments. For example, if you ask to transfer assets from another financial institution to Guggenheim Investments, we will need to provide certain information about you to that company to complete the transaction. To alert you to other Guggenheim Investments investment products and services, we may share your information within the Guggenheim Investments family of affiliated companies. This would include, for example, sharing your information within Guggenheim Investments so we can make you aware of new Rydex and Guggenheim Investments funds or the services offered through another Guggenheim Investments affiliated company. In certain instances, we may contract with nonaffiliated companies to perform services for us. Where necessary, we will disclose information we have about you to these third parties. In all such cases, we provide the third party with only the information necessary to carry out its assigned responsibilities and only for that purpose. And we require these third parties to treat your private information with the same high degree of confidentiality that we do. In certain instances, we may share information with other financial institutions regarding individuals and entities in response to the U.S.A. Patriot Act. Finally, we will release information about you if you direct us to do so, if we are compelled by law to do so or in other circumstances permitted by law.
Opt Out Provisions
We do not sell your personal information to anyone. The law allows you to “opt out” of only certain kinds of information sharing with third parties. The firm does not share personal information about you with any third parties that triggers this opt-out right. This means YOU ARE ALREADY OPTED OUT.
GUGGENHEIM ETFs ANNUAL REPORT | 65 |
GUGGENHEIM INVESTMENTS PRIVACY POLICIES (Unaudited)(concluded) |
How We Protect Privacy Online
Our concern for the privacy of our shareholders also extends to those who use our web site, guggenheiminvestments.com. Our web site uses some of the most secure forms of online communication available, including encryption technology, Secure Socket Layer (SSL) protocol, firewalls and user names and passwords. These technologies provide a high level of security and privacy when you access your account information or initiate online transactions. The Guggenheim Investments web site offers customized features that require our use of “http cookies”—tiny pieces of information that we ask your browser to store. However, we make very limited use of these cookies. We only use cookies for session management and security features on the Guggenheim Investments web site. We do not use them to pull data from your hard drive, to learn your email address, or to view data in cookies created by other web sites. We will not share the information in our cookies or give others access to it. See the legal information area on our web site for more details about web site security and privacy features.
How We Safeguard Your Personal Information
We restrict access to nonpublic personal information about shareholders to our employees and in some cases to third parties (for example, the service providers described above) as permitted by law. We maintain strict physical, electronic and procedural safeguards that comply with federal standards to guard your nonpublic personal information.
We’ll Keep You Informed
As required by federal law, we will notify shareholders of our privacy policy annually. We reserve the right to modify this policy at any time, but rest assured that if we do change it, we will tell you promptly. You will also be able to access our privacy policy from our web site at guggenheiminvestments.com. Should you have any questions regarding our privacy policy, contact us at 800.820.0888 or 301.296.5100.
66 | GUGGENHEIM ETFs ANNUAL REPORT |
This page intentionally left blank.
This page intentionally left blank.
This page intentionally left blank.
| |
10.31.2015
Guggenheim ETFs Annual Report
RSP | Guggenheim S&P 500® Equal Weight ETF | ||
ETF3-ANN-1015x1016 | guggenheiminvestments.com |
TABLE OF CONTENTS |
DEAR SHAREHOLDER | 2 |
ECONOMIC AND MARKET OVERVIEW | 3 |
FEES AND EXPENSES | 5 |
MANAGER'S ANALYSIS | 6 |
PORTFOLIO SUMMARY | 7 |
SCHEDULE OF INVESTMENTS | 8 |
STATEMENT OF ASSETS AND LIABILITIES | 14 |
STATEMENT OF OPERATIONS | 15 |
STATEMENTS OF CHANGES IN NET ASSETS | 16 |
FINANCIAL HIGHLIGHTS | 17 |
NOTES TO FINANCIAL STATEMENTS | 18 |
REPORT OF INDEPENDENT REGISTERED PUBLIC ACCOUNTING FIRM | 24 |
OTHER INFORMATION | 25 |
INFORMATION ON BOARD OF TRUSTEES AND OFFICERS | 28 |
GUGGENHEIM INVESTMENTS PRIVACY POLICIES | 31 |
GUGGENHEIM ETFs ANNUAL REPORT | 1 |
October 31, 2015 |
Dear Shareholder:
Security Investors, LLC (the “Investment Adviser”) is pleased to present the annual shareholder report for Guggenheim S&P 500® Equal Weight Exchange-Traded Fund (“ETF”) for the 12-month period ended October 31, 2015.
The Investment Adviser is part of Guggenheim Investments, which represents the investment management businesses of Guggenheim Partners, LLC (“Guggenheim”), a global, diversified financial services firm.
Guggenheim Funds Distributors, LLC is the distributor of the Fund. Guggenheim Funds Distributors, LLC is affiliated with Guggenheim and the Investment Adviser.
We encourage you to read the Economic and Market Overview, which follows this letter, followed by the Manager’s Analysis for the ETF.
Sincerely,
Donald C. Cacciapaglia
President
November 30, 2015
Read a prospectus and summary prospectus (if available) carefully before investing. It contains the investment objectives, risks, charges, expenses, and other information, which should be considered carefully before investing. Obtain a prospectus and summary prospectus (if available) at guggenheiminvestments.com or call 800.820.0888.
Guggenheim S&P 500® Equal Weight ETF may not be suitable for all investors. ● The Fund is subject to the risk that unanticipated early closings of securities exchanges and other financial markets may result in the Fund’s inability to buy or sell securities or other financial instruments on that day. ● In certain circumstances, it may be difficult for the Fund to purchase and sell particular investments within a reasonable time at a fair price. ● Investments in securities and derivatives, in general, are subject to market risks that may cause their prices to fluctuate over time. An investment in the Fund may lose money. ● Unlike many investment companies, the Fund is not actively “managed.” This means that, based on market and economic conditions, the Fund’s performance could be lower than other types of mutual funds that may actively shift their portfolio assets to take advantage of market opportunities or to lessen the impact of a market decline. ● Tracking error risk refers to the risk that the Adviser may not be able to cause the Fund’s performance to match or correlate to that of the Fund’s Underlying Index, either on a daily or aggregate basis. Tracking error risk may cause the Fund’s performance to be less than you expect. ● Shares may trade below their net asset value (“NAV”). The NAV of shares will fluctuate with changes in the market value of the Fund’s holdings. In addition, although the Fund’s shares are currently listed on NYSE Arca, Inc. (the “Exchange”), there can be no assurance that an active trading market for shares will develop or be maintained. ● The Fund is subject to the risk that large-capitalization stocks may underperform other segments of the equity market or the equity market as a whole. ● Please read the prospectus for more detailed information regarding these and other risks.
ECONOMIC AND MARKET OVERVIEW (Unaudited) | October 31, 2015 |
At the end of the period, the U.S. economic expansion was continuing to mature, but remained strong. Central banks’ aversion to any downturn should support the rebound in risk assets that began after the market correction in the third quarter.
The U.S. Federal Open Market Committee’s resolution to remain on hold at its September meeting, due to volatility emanating from China, confirmed that global macroeconomic issues and market volatility can play a significant role in determining when policy tightening finally commences. Any bad news or setback in the global economy is likely to be met with a policy decision that will be supportive for credit and equity markets.
In Europe, European Central Bank (ECB) President Mario Draghi hinted strongly that additional monetary policy easing is on the way, as inflation remains well below the ECB’s 2% target and the growth outlook remains uncertain. In Japan, the central bank revised down inflation and growth forecasts, and signaled a willingness to expand its quantitative easing program further.
In the U.S., a decision to raise rates will be data dependent. Given the October employment report, December liftoff appears likely, unless there is some catastrophic event before then. A December hike should be taken as a sign that the U.S. Federal Reserve is sufficiently comfortable with the strength of the economy and the near-term outlook, which should be good news for investors.
As for the fundamentals of the U.S. economy, the data look encouraging. Underlying real GDP growth was actually stronger than the 1.5% preliminary estimate for the third quarter would suggest. This is because the U.S. was due for an inventory correction, and declining inventory investment shaved 1.4 percentage points off the headline growth figure. Consumer spending, which accounts for about two-thirds of U.S. demand, rose by 3.2%, indicating that consumer spending is strong heading into the holiday shopping season. Robust equity returns in October—the largest monthly gains in four years—also bode well for Christmas sales.
It would be premature to pop the champagne just yet. Slowing emerging market growth continues to weigh upon economic growth around the world, particularly in Europe. Meanwhile, the measure of New York Stock Exchange market breadth has failed to make new highs, or at least return to old highs, which would confirm sustainability of the equity market rally occurring at period end. This is okay for the moment, because equities have yet to quite reach their old highs either—at period end, the market remained a stone’s throw away from its peak in May—but breadth often leads the market, and over the coming months investors should keep a close eye on it.
For the 12-month period ended October 31, 2015, the return of the Standard & Poor’s 500® Index* (“S&P 500”) was 5.20%. The Barclays U.S. Aggregate Bond Index* returned 1.96% for the period, while the Bank of America Merrill Lynch 3-Month U.S. Treasury Bill Index* returned 0.02%. The MSCI World Index* returned 1.77%, while the MSCI Emerging Markets Index* returned -14.53%.
The opinions and forecasts expressed may not actually come to pass. This information is subject to change at any time, based on market and other conditions, and should not be construed as a recommendation of any specific security or strategy.
GUGGENHEIM ETFs ANNUAL REPORT | 3 |
ECONOMIC AND MARKET OVERVIEW (Unaudited)(concluded) | October 31, 2015 |
*Index Definitions:
The following indices are referenced throughout this report. Indices are unmanaged and not available for direct investment. Index performance does not reflect transaction costs, fees, or expenses.
Bank of America (“BofA”) Merrill Lynch 3-Month U.S. Treasury Bill Index is an unmanaged market index of U.S. Treasury securities maturing in 90 days that assumes reinvestment of all income.
Barclays U.S. Aggregate Bond Index is a broad-based benchmark that measures the investment grade, U.S. dollar-denominated, fixed-rate taxable bond market, including U.S. Treasuries, government-related and corporate securities, MBS (agency fixed-rate and hybrid ARM pass-throughs), ABS and CMBS.
MSCI Emerging Markets Index is a free float-adjusted market capitalization weighted index that is designed to measure equity market performance in the global emerging markets.
MSCI World Index is a free float-adjusted market capitalization weighted index that is designed to measure the equity market performance of developed markets.
S&P 500® Index is a capitalization-weighted index of 500 stocks designed to measure the performance of the broad economy, representing all major industries and is considered a representation of the U.S. stock market.
S&P 500® Equal Weight Index is an unmanaged equal-weighted version of the S&P 500® Index, which measures the performance of the large-capitalization sector of the U.S. equity market and includes 500 widely held common stocks chosen for market size, liquidity and industry group representation. The S&P 500 Equal Weight Index has the same constituents as the unmanaged capitalization-weighted S&P 500 Index, but each company in the equal-weighted index is allocated a fixed weight, and is rebalanced quarterly.
4 | GUGGENHEIM ETFs ANNUAL REPORT |
FEES AND EXPENSES (Unaudited) |
Shareholder Expense Example
As a shareholder of the Rydex ETF Trust, you incur transaction costs such as creation and redemption fees or brokerage charges, and ongoing costs including advisory fees, trustee fees and, if applicable, distribution fees. All other Trust expenses are paid by the advisor. This Example is intended to help you understand your ongoing costs (in dollars) of investing in a Fund and to compare these costs with the ongoing costs of investing in other mutual funds.
The example in the table is based on an investment of $1,000 invested on April 30, 2015 and held for the six months ended October 31, 2015.
Actual Expenses
The first table below provides information about actual account values and actual expenses. You may use the information in this table, together with the amount you invested, to estimate the expenses that you incurred over the period. Simply divide your account value by $1,000 (for example, an $8,600 account value divided by $1,000 = 8.6), then multiply the result by the number in the first table under the heading entitled “Expenses Paid During the Six-Month Period” to estimate the expenses attributable to your investment during this period.
Hypothetical Example for Comparison Purposes
The second table below provides information about hypothetical account values and hypothetical expenses based on a Fund’s actual expense ratio and an assumed rate of return of 5% per year before expenses, which is not a Fund’s actual return. Thus, you should not use the hypothetical account values and expenses to estimate the actual ending account balance or your expenses for the period. Rather, these figures are provided to enable you to compare the ongoing costs of investing in a Fund and other funds. To do so, compare this 5% hypothetical example with the 5% hypothetical examples that appear in the shareholder reports of other funds.
Please note that the expenses shown in the table are meant to highlight your ongoing costs only and do not reflect any transaction costs, such as creation and redemption fees, or brokerage charges. Therefore, the second table is useful in comparing ongoing costs only, and will not help you determine the relative total costs of owning different funds. In addition, if these transaction costs were included, your costs would have been higher.
Expense | Fund | Beginning | Ending | Expenses | |
Table 1. Based on actual Fund return3 | |||||
Guggenheim S&P 500® Equal Weight ETF | 0.40% | (2.46%) | $ 1,000.00 | $ 975.40 | $ 1.99 |
Table 2. Based on hypothetical 5% return (before expenses) | |||||
Guggenheim S&P 500® Equal Weight ETF | 0.40% | 5.00% | 1,000.00 | 1,023.19 | 2.04 |
1 | Annualized. |
2 | Expenses are equal to the Fund’s annualized expense ratio, net of any applicable fee waivers, multiplied by the average account value over the period, multiplied by 184/365 (to reflect the one-half year period). |
3 | Actual cumulative return at net asset value for the period April 30, 2015 to October 31, 2015. |
GUGGENHEIM ETFs ANNUAL REPORT | 5 |
MANAGER'S ANALYSIS (Unaudited) | October 31, 2015 |
GUGGENHEIM S&P 500® EQUAL WEIGHT ETF
Guggenheim S&P 500® Equal Weight ETF (RSP) returned 2.49% for the one-year period ended October 31, 2015, compared with the benchmark S&P 500® Equal Weight Index, which returned 2.85%. The cap-weighted S&P 500 Index returned 5.20%. During the period, RSP achieved over 99% correlation to its benchmark on a daily basis.
The Consumer Discretionary, Health Care, and Information Technology sectors contributed the most to the Fund’s performance. The Energy, Industrials, and Telecommunications Services sectors detracted the most.
Top contributors to the Fund’s return included Netflix, Inc., Amazon.com, Inc., and Cablevision Systems Corp.—Class A. The top detractors were Consol Energy, Inc., Chesapeake Energy Corp., and Genworth Financial, Inc.—Class A.
Cumulative Fund Performance: October 31, 2005 – October 31, 2015
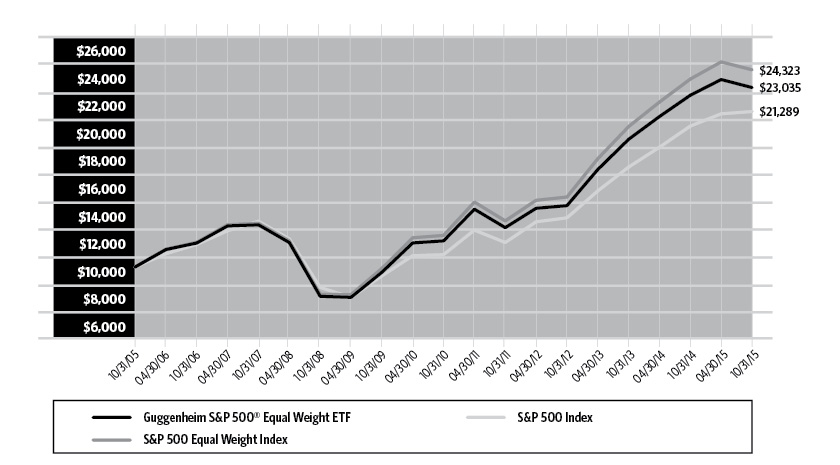
AVERAGE ANNUAL TOTAL RETURNS FOR THE PERIOD ENDED OCTOBER 31, 2015 | ||||
One Year | Three Year | Five Year | 10 Year | |
Guggenheim S&P 500® Equal Weight ETF | 2.49% | 16.81% | 14.13% | 8.70% |
S&P 500 Equal Weight Index | 2.85% | 17.27% | 14.62% | 9.30% |
S&P 500 Index | 5.20% | 16.20% | 14.33% | 7.85% |
The returns presented above do not reflect the effect of taxes. Index returns represent total returns. Performance displayed represents past performance, which is no guarantee of future results.
6 | GUGGENHEIM ETFs ANNUAL REPORT |
PORTFOLIO SUMMARY (Unaudited) | October 31, 2015 |
GUGGENHEIM S&P 500® EQUAL WEIGHT ETF
Holdings Diversification (Market Exposure as % of Net Assets)

"Holdings Diversification (Market Exposure as % of Net Assets)" excludes any temporary cash investments.
Ten Largest Holdings | (% of Total |
SanDisk Corp. | 0.3% |
KLA-Tencor Corp. | 0.3% |
EI du Pont de Nemours & Co. | 0.3% |
Molson Coors Brewing Co. — Class B | 0.2% |
NVIDIA Corp. | 0.2% |
TripAdvisor, Inc. | 0.2% |
Juniper Networks, Inc. | 0.2% |
Marathon Oil Corp. | 0.2% |
Microsoft Corp. | 0.2% |
Southwest Airlines Co. | 0.2% |
Top Ten Total | 2.3% |
“Ten Largest Holdings” exclude any temporary cash or derivative investments. | |
GUGGENHEIM ETFs ANNUAL REPORT | 7 |
SCHEDULE OF INVESTMENTS | October 31, 2015 |
GUGGENHEIM S&P 500® EQUAL WEIGHT ETF |
Shares | Value | |||||||
COMMON STOCKS† - 99.8% | ||||||||
Consumer, Non-cyclical - 19.5% | ||||||||
Molson Coors Brewing Co. — Class B | 271,193 | $ | 23,892,103 | |||||
Dr Pepper Snapple Group, Inc. | 246,021 | 21,986,897 | ||||||
DENTSPLY International, Inc. | 357,647 | 21,762,820 | ||||||
Kimberly-Clark Corp. | 180,762 | 21,639,019 | ||||||
Altria Group, Inc. | 357,673 | 21,628,486 | ||||||
Reynolds American, Inc. | 445,851 | 21,543,520 | ||||||
Edwards Lifesciences Corp.* | 135,178 | 21,243,223 | ||||||
Total System Services, Inc. | 403,127 | 21,144,010 | ||||||
Henry Schein, Inc.* | 139,064 | 21,097,399 | ||||||
Procter & Gamble Co. | 274,844 | 20,992,585 | ||||||
PepsiCo, Inc. | 205,262 | 20,975,724 | ||||||
Bristol-Myers Squibb Co. | 317,578 | 20,944,268 | ||||||
Philip Morris International, Inc. | 236,652 | 20,920,037 | ||||||
Automatic Data Processing, Inc. | 240,141 | 20,889,865 | ||||||
Coca-Cola Co. | 493,234 | 20,888,460 | ||||||
Clorox Co. | 171,240 | 20,881,006 | ||||||
Avery Dennison Corp. | 320,342 | 20,812,620 | ||||||
Brown-Forman Corp. — Class B | 195,631 | 20,772,099 | ||||||
Hormel Foods Corp. | 304,739 | 20,585,120 | ||||||
Equifax, Inc. | 191,912 | 20,452,062 | ||||||
Johnson & Johnson | 202,365 | 20,444,936 | ||||||
Cintas Corp. | 219,297 | 20,414,358 | ||||||
Mead Johnson Nutrition Co. — Class A | 248,683 | 20,392,006 | ||||||
MasterCard, Inc. — Class A | 205,887 | 20,380,754 | ||||||
Boston Scientific Corp.* | 1,113,507 | 20,354,908 | ||||||
Mondelez International, Inc. — Class A | 440,692 | 20,342,342 | ||||||
United Rentals, Inc.* | 270,757 | 20,268,869 | ||||||
Danaher Corp. | 216,577 | 20,208,800 | ||||||
PayPal Holdings, Inc.* | 560,445 | 20,181,624 | ||||||
Colgate-Palmolive Co. | 303,723 | 20,152,021 | ||||||
Archer-Daniels-Midland Co. | 439,151 | 20,051,635 | ||||||
Constellation Brands, Inc. — Class A | 147,612 | 19,898,098 | ||||||
Medtronic plc | 269,048 | 19,888,028 | ||||||
Kraft Heinz Co. | 254,939 | 19,877,594 | ||||||
Kellogg Co. | 280,782 | 19,800,747 | ||||||
Estee Lauder Companies, Inc. — Class A | 246,089 | 19,800,321 | ||||||
Western Union Co. | 1,027,068 | 19,771,059 | ||||||
Merck & Company, Inc. | 361,033 | 19,734,064 | ||||||
Becton Dickinson and Co. | 138,324 | 19,713,936 | ||||||
Coca-Cola Enterprises, Inc. | 383,636 | 19,695,872 | ||||||
Regeneron Pharmaceuticals, Inc.* | 35,262 | 19,654,685 | ||||||
Allergan plc* | 63,714 | 19,653,858 | ||||||
Zimmer Biomet Holdings, Inc. | 187,673 | 19,624,966 | ||||||
ADT Corp. | 593,412 | 19,606,332 | ||||||
McCormick & Company, Inc. | 232,624 | 19,535,764 | ||||||
Baxter International, Inc. | 522,142 | 19,522,889 | ||||||
Patterson Companies, Inc. | 411,248 | 19,493,155 | ||||||
Laboratory Corporation of America Holdings* | 158,690 | 19,477,610 | ||||||
Quest Diagnostics, Inc. | 286,585 | 19,473,451 | ||||||
DaVita HealthCare Partners, Inc.* | 250,758 | 19,436,253 | ||||||
Sysco Corp. | 470,812 | 19,420,995 | ||||||
Amgen, Inc. | 122,739 | 19,414,855 | ||||||
Abbott Laboratories | 433,219 | 19,408,211 | ||||||
H&R Block, Inc. | 520,356 | 19,388,465 | ||||||
General Mills, Inc. | 333,076 | 19,355,046 | ||||||
Campbell Soup Co. | 380,742 | 19,337,886 | ||||||
Monster Beverage Corp.* | 141,659 | 19,310,955 | ||||||
Pfizer, Inc. | 570,432 | 19,292,010 | ||||||
Alexion Pharmaceuticals, Inc.* | 109,390 | 19,252,640 | ||||||
Tyson Foods, Inc. — Class A | 433,665 | 19,237,379 | ||||||
Express Scripts Holding Co.* | 222,583 | 19,226,720 | ||||||
Robert Half International, Inc. | 364,972 | 19,219,426 | ||||||
Kroger Co. | 504,394 | 19,066,093 | ||||||
JM Smucker Co. | 161,988 | 19,015,771 | ||||||
AbbVie, Inc. | 316,855 | 18,868,715 | ||||||
Eli Lilly & Co. | 229,901 | 18,753,025 | ||||||
UnitedHealth Group, Inc. | 158,459 | 18,663,301 | ||||||
Varian Medical Systems, Inc.* | 237,294 | 18,634,698 | ||||||
Celgene Corp.* | 151,722 | 18,617,807 | ||||||
Gilead Sciences, Inc. | 171,549 | 18,549,593 | ||||||
McGraw Hill Financial, Inc. | 198,863 | 18,422,668 | ||||||
Aetna, Inc. | 159,529 | 18,310,739 | ||||||
ConAgra Foods, Inc. | 451,381 | 18,303,500 | ||||||
Hershey Co. | 206,206 | 18,288,410 | ||||||
Cardinal Health, Inc. | 221,233 | 18,185,353 | ||||||
CR Bard, Inc. | 97,572 | 18,182,542 | ||||||
Intuitive Surgical, Inc.* | 36,508 | 18,129,873 | ||||||
Baxalta, Inc. | 525,268 | 18,100,735 | ||||||
Cigna Corp. | 134,701 | 18,055,322 | ||||||
Stryker Corp. | 188,751 | 18,048,371 | ||||||
Zoetis, Inc. | 417,923 | 17,974,868 | ||||||
Humana, Inc. | 100,376 | 17,930,165 | ||||||
Moody’s Corp. | 185,162 | 17,805,178 | ||||||
Anthem, Inc. | 127,847 | 17,789,910 | ||||||
Vertex Pharmaceuticals, Inc.* | 140,287 | 17,499,400 | ||||||
Whole Foods Market, Inc. | 582,187 | 17,442,323 | ||||||
AmerisourceBergen Corp. — Class A | 180,236 | 17,394,576 | ||||||
Biogen, Inc.* | 59,623 | 17,321,078 | ||||||
Universal Health Services, Inc. — Class B | 141,193 | 17,238,253 | ||||||
St. Jude Medical, Inc. | 269,468 | 17,194,753 | ||||||
Mylan N.V.* | 386,466 | 17,039,286 | ||||||
McKesson Corp. | 95,140 | 17,011,032 | ||||||
Perrigo Company plc | 104,672 | 16,510,961 | ||||||
Verisk Analytics, Inc. — Class A* | 222,437 | 15,928,714 | ||||||
Keurig Green Mountain, Inc. | 308,753 | 15,669,215 | ||||||
Quanta Services, Inc.* | 770,708 | 15,498,938 | ||||||
HCA Holdings, Inc.* | 222,073 | 15,276,402 | ||||||
Endo International plc* | 251,419 | 15,082,626 | ||||||
Mallinckrodt plc* | 229,070 | 15,043,027 | ||||||
Tenet Healthcare Corp.* | 401,323 | 12,589,503 | ||||||
Total Consumer, Non-cyclical | 1,917,203,570 | |||||||
Financial - 17.6% | ||||||||
Alliance Data Systems Corp.* | 74,147 | 22,044,646 | ||||||
Kimco Realty Corp. | 817,742 | 21,890,953 | ||||||
8 | GUGGENHEIM ETFs ANNUAL REPORT | SEE NOTES TO FINANCIAL STATEMENTS. |
SCHEDULE OF INVESTMENTS (continued) | October 31, 2015 |
GUGGENHEIM S&P 500® EQUAL WEIGHT ETF |
Shares | Value | |||||||
General Growth Properties, Inc. | 753,784 | $ | 21,822,047 | |||||
BlackRock, Inc. — Class A | 61,996 | 21,820,733 | ||||||
Prologis, Inc. | 505,162 | 21,585,572 | ||||||
American Tower Corp. — Class A | 210,709 | 21,540,781 | ||||||
Macerich Co. | 253,461 | 21,478,285 | ||||||
CBRE Group, Inc. — Class A* | 573,889 | 21,394,582 | ||||||
Public Storage | 93,010 | 21,342,075 | ||||||
Travelers Companies, Inc. | 189,042 | 21,340,951 | ||||||
Vornado Realty Trust | 211,610 | 21,277,386 | ||||||
SL Green Realty Corp. | 179,023 | 21,235,709 | ||||||
Cincinnati Financial Corp. | 352,012 | 21,201,682 | ||||||
ACE Ltd. | 186,467 | 21,171,463 | ||||||
Simon Property Group, Inc. | 104,982 | 21,149,674 | ||||||
Nasdaq, Inc. | 363,442 | 21,039,657 | ||||||
Boston Properties, Inc. | 165,044 | 20,770,787 | ||||||
Realty Income Corp. | 417,218 | 20,635,602 | ||||||
Visa, Inc. — Class A | 265,806 | 20,621,229 | ||||||
Aflac, Inc. | 323,470 | 20,621,212 | ||||||
Progressive Corp. | 622,207 | 20,613,718 | ||||||
Equity Residential | 265,278 | 20,511,295 | ||||||
Crown Castle International Corp. | 239,177 | 20,440,066 | ||||||
Plum Creek Timber Company, Inc. | 501,653 | 20,437,343 | ||||||
Apartment Investment & Management Co. — Class A | 520,402 | 20,394,554 | ||||||
American International Group, Inc. | 322,434 | 20,332,688 | ||||||
Iron Mountain, Inc. | 662,647 | 20,303,504 | ||||||
Weyerhaeuser Co. | 688,355 | 20,189,452 | ||||||
Lincoln National Corp. | 376,617 | 20,152,776 | ||||||
Chubb Corp. | 155,580 | 20,124,273 | ||||||
Discover Financial Services | 357,470 | 20,096,963 | ||||||
Intercontinental Exchange, Inc. | 79,614 | 20,094,574 | ||||||
T. Rowe Price Group, Inc. | 264,868 | 20,029,318 | ||||||
Allstate Corp. | 323,452 | 20,015,210 | ||||||
Assurant, Inc. | 244,846 | 19,962,294 | ||||||
Navient Corp. | 1,510,211 | 19,919,683 | ||||||
Unum Group | 573,519 | 19,872,433 | ||||||
AvalonBay Communities, Inc. | 113,465 | 19,837,086 | ||||||
Bank of New York Mellon Corp. | 475,390 | 19,799,993 | ||||||
Hudson City Bancorp, Inc. | 1,955,054 | 19,785,146 | ||||||
E*TRADE Financial Corp.* | 693,699 | 19,777,359 | ||||||
Ameriprise Financial, Inc. | 171,398 | 19,772,473 | ||||||
SunTrust Banks, Inc. | 475,984 | 19,762,856 | ||||||
Legg Mason, Inc. | 441,415 | 19,753,321 | ||||||
Bank of America Corp. | 1,172,479 | 19,674,197 | ||||||
Prudential Financial, Inc. | 238,087 | 19,642,178 | ||||||
Capital One Financial Corp. | 248,588 | 19,613,593 | ||||||
Principal Financial Group, Inc. | 390,345 | 19,579,705 | ||||||
Citigroup, Inc. | 368,024 | 19,567,836 | ||||||
MetLife, Inc. | 387,515 | 19,523,006 | ||||||
Berkshire Hathaway, Inc. — Class B* | 143,175 | 19,474,664 | ||||||
Franklin Resources, Inc. | 477,034 | 19,443,906 | ||||||
Welltower, Inc. | 299,413 | 19,422,921 | ||||||
Comerica, Inc. | 447,208 | 19,408,827 | ||||||
HCP, Inc. | 521,106 | 19,385,143 | ||||||
Marsh & McLennan Companies, Inc. | 347,696 | 19,380,575 | ||||||
People’s United Financial, Inc. | 1,214,167 | 19,365,964 | ||||||
XL Group plc — Class A | 508,440 | 19,361,395 | ||||||
Wells Fargo & Co. | 357,415 | 19,350,448 | ||||||
Essex Property Trust, Inc. | 87,658 | 19,323,330 | ||||||
U.S. Bancorp | 458,025 | 19,319,495 | ||||||
JPMorgan Chase & Co. | 300,621 | 19,314,899 | ||||||
Equinix, Inc. | 64,938 | 19,265,806 | ||||||
Affiliated Managers Group, Inc.* | 106,832 | 19,257,536 | ||||||
Aon plc | 205,945 | 19,216,728 | ||||||
Ventas, Inc. | 357,121 | 19,184,540 | ||||||
BB&T Corp. | 516,069 | 19,171,963 | ||||||
Zions Bancorporation | 663,596 | 19,091,657 | ||||||
Huntington Bancshares, Inc. | 1,739,770 | 19,085,277 | ||||||
Goldman Sachs Group, Inc. | 101,511 | 19,033,313 | ||||||
Invesco Ltd. | 571,941 | 18,971,283 | ||||||
Hartford Financial Services Group, Inc. | 409,326 | 18,935,421 | ||||||
Torchmark Corp. | 326,407 | 18,934,870 | ||||||
Northern Trust Corp. | 268,550 | 18,903,235 | ||||||
Loews Corp. | 517,937 | 18,883,983 | ||||||
Charles Schwab Corp. | 616,814 | 18,825,163 | ||||||
CME Group, Inc. — Class A | 199,061 | 18,805,293 | ||||||
PNC Financial Services Group, Inc. | 208,164 | 18,788,883 | ||||||
M&T Bank Corp. | 155,373 | 18,621,454 | ||||||
Regions Financial Corp. | 1,977,539 | 18,489,990 | ||||||
Host Hotels & Resorts, Inc. | 1,060,100 | 18,371,533 | ||||||
American Express Co. | 249,098 | 18,248,919 | ||||||
Morgan Stanley | 552,810 | 18,226,146 | ||||||
State Street Corp. | 262,959 | 18,144,171 | ||||||
Fifth Third Bancorp | 951,277 | 18,121,827 | ||||||
KeyCorp | 1,391,994 | 17,288,565 | ||||||
Genworth Financial, Inc. — Class A* | 3,686,709 | 17,253,798 | ||||||
Total Financial | 1,725,236,840 | |||||||
Consumer, Cyclical - 14.4% | ||||||||
Southwest Airlines Co. | 488,052 | 22,591,927 | ||||||
NIKE, Inc. — Class B | 168,214 | 22,041,080 | ||||||
General Motors Co. | 623,732 | 21,774,484 | ||||||
McDonald’s Corp. | 193,090 | 21,674,353 | ||||||
Advance Auto Parts, Inc. | 107,575 | 21,346,107 | ||||||
O’Reilly Automotive, Inc.* | 76,515 | 21,138,034 | ||||||
Harman International Industries, Inc. | 192,096 | 21,122,876 | ||||||
Johnson Controls, Inc. | 466,847 | 21,092,148 | ||||||
Costco Wholesale Corp. | 133,355 | 21,086,093 | ||||||
Goodyear Tire & Rubber Co. | 635,785 | 20,879,179 | ||||||
Starbucks Corp. | 332,735 | 20,819,229 | ||||||
American Airlines Group, Inc. | 446,215 | 20,624,057 | ||||||
Delphi Automotive plc | 246,154 | 20,477,551 | ||||||
Genuine Parts Co. | 225,429 | 20,459,936 | ||||||
Mattel, Inc. | 832,100 | 20,453,018 | ||||||
Signet Jewelers Ltd. | 135,081 | 20,389,126 | ||||||
Starwood Hotels & Resorts Worldwide, Inc. | 255,190 | 20,382,024 | ||||||
Delta Air Lines, Inc. | 400,892 | 20,381,349 | ||||||
SEE NOTES TO FINANCIAL STATEMENTS. | GUGGENHEIM ETFs ANNUAL REPORT | 9 |
SCHEDULE OF INVESTMENTS (continued) | October 31, 2015 |
GUGGENHEIM S&P 500® EQUAL WEIGHT ETF |
Shares | Value | |||||||
Ford Motor Co. | 1,371,714 | $ | 20,315,084 | |||||
AutoZone, Inc.* | 25,842 | 20,270,723 | ||||||
GameStop Corp. — Class A | 439,647 | 20,254,537 | ||||||
AutoNation, Inc.* | 320,338 | 20,242,158 | ||||||
Lowe’s Companies, Inc. | 274,038 | 20,232,226 | ||||||
Home Depot, Inc. | 162,916 | 20,142,934 | ||||||
Hanesbrands, Inc. | 627,508 | 20,042,605 | ||||||
United Continental Holdings, Inc.* | 330,951 | 19,959,655 | ||||||
Coach, Inc. | 638,772 | 19,929,687 | ||||||
Royal Caribbean Cruises Ltd. | 202,560 | 19,921,776 | ||||||
Carnival Corp. | 366,075 | 19,797,336 | ||||||
Marriott International, Inc. — Class A | 257,579 | 19,776,916 | ||||||
Tractor Supply Co. | 213,817 | 19,754,553 | ||||||
L Brands, Inc. | 203,740 | 19,554,965 | ||||||
Wynn Resorts Ltd. | 277,659 | 19,422,247 | ||||||
Wyndham Worldwide Corp. | 238,310 | 19,386,519 | ||||||
Tiffany & Co. | 234,762 | 19,353,779 | ||||||
Leggett & Platt, Inc. | 426,803 | 19,218,939 | ||||||
TJX Companies, Inc. | 261,963 | 19,173,072 | ||||||
Fastenal Co. | 486,320 | 19,044,291 | ||||||
Ross Stores, Inc. | 375,720 | 19,003,918 | ||||||
Ralph Lauren Corp. — Class A | 171,401 | 18,986,089 | ||||||
Hasbro, Inc. | 245,048 | 18,827,038 | ||||||
Newell Rubbermaid, Inc. | 442,143 | 18,760,127 | ||||||
BorgWarner, Inc. | 435,559 | 18,650,636 | ||||||
Target Corp. | 241,490 | 18,638,198 | ||||||
Dollar Tree, Inc.* | 282,965 | 18,531,378 | ||||||
Under Armour, Inc. — Class A* | 194,744 | 18,516,260 | ||||||
Whirlpool Corp. | 115,328 | 18,468,626 | ||||||
CarMax, Inc.* | 312,298 | 18,428,705 | ||||||
CVS Health Corp. | 185,244 | 18,298,403 | ||||||
Bed Bath & Beyond, Inc.* | 305,790 | 18,234,258 | ||||||
Dollar General Corp. | 267,274 | 18,113,159 | ||||||
Lennar Corp. — Class A | 360,065 | 18,028,454 | ||||||
VF Corp. | 264,820 | 17,880,646 | ||||||
WW Grainger, Inc. | 84,733 | 17,793,930 | ||||||
Mohawk Industries, Inc.* | 91,005 | 17,791,478 | ||||||
Urban Outfitters, Inc.* | 620,425 | 17,744,155 | ||||||
DR Horton, Inc. | 600,212 | 17,670,241 | ||||||
Staples, Inc. | 1,356,814 | 17,625,014 | ||||||
Walgreens Boots Alliance, Inc. | 208,068 | 17,619,198 | ||||||
Fossil Group, Inc.* | 320,094 | 17,416,315 | ||||||
Best Buy Company, Inc. | 494,863 | 17,335,051 | ||||||
PACCAR, Inc. | 327,212 | 17,227,712 | ||||||
Kohl’s Corp. | 370,610 | 17,092,533 | ||||||
Harley-Davidson, Inc. | 343,334 | 16,977,866 | ||||||
Nordstrom, Inc. | 255,544 | 16,664,024 | ||||||
Wal-Mart Stores, Inc. | 290,889 | 16,650,486 | ||||||
Darden Restaurants, Inc. | 267,780 | 16,572,904 | ||||||
Chipotle Mexican Grill, Inc. — Class A* | 25,788 | 16,510,251 | ||||||
Macy’s, Inc. | 323,175 | 16,475,462 | ||||||
Michael Kors Holdings Ltd.* | 425,965 | 16,459,288 | ||||||
PulteGroup, Inc. | 897,829 | 16,457,206 | ||||||
Yum! Brands, Inc. | 230,947 | 16,376,452 | ||||||
The Gap, Inc. | 581,495 | 15,828,294 | ||||||
PVH Corp. | 164,930 | 15,000,384 | ||||||
Total Consumer, Cyclical | 1,407,180,712 | |||||||
Industrial - 12.7% | ||||||||
L-3 Communications Holdings, Inc. | 178,083 | 22,509,691 | ||||||
Roper Technologies, Inc. | 118,789 | 22,136,330 | ||||||
General Electric Co. | 753,770 | 21,799,028 | ||||||
Xylem, Inc. | 578,841 | 21,075,600 | ||||||
Northrop Grumman Corp. | 111,615 | 20,955,717 | ||||||
3M Co. | 133,114 | 20,926,852 | ||||||
Raytheon Co. | 176,542 | 20,726,031 | ||||||
Illinois Tool Works, Inc. | 224,996 | 20,686,132 | ||||||
Boeing Co. | 139,649 | 20,677,827 | ||||||
Flowserve Corp. | 440,385 | 20,416,249 | ||||||
Republic Services, Inc. — Class A | 464,857 | 20,332,845 | ||||||
Ingersoll-Rand plc | 341,883 | 20,259,987 | ||||||
PerkinElmer, Inc. | 392,301 | 20,258,424 | ||||||
Owens-Illinois, Inc.* | 938,839 | 20,231,980 | ||||||
Waste Management, Inc. | 376,167 | 20,222,738 | ||||||
Allegion plc | 310,210 | 20,216,386 | ||||||
Masco Corp. | 693,837 | 20,121,273 | ||||||
Harris Corp. | 253,841 | 20,086,438 | ||||||
United Technologies Corp. | 203,667 | 20,042,869 | ||||||
Thermo Fisher Scientific, Inc. | 153,009 | 20,010,517 | ||||||
Dover Corp. | 310,528 | 20,007,319 | ||||||
Lockheed Martin Corp. | 90,958 | 19,995,297 | ||||||
Stanley Black & Decker, Inc. | 188,306 | 19,956,670 | ||||||
TE Connectivity Ltd. | 309,500 | 19,944,180 | ||||||
United Parcel Service, Inc. — Class B | 193,537 | 19,938,181 | ||||||
Fluor Corp. | 415,666 | 19,872,991 | ||||||
Corning, Inc. | 1,064,277 | 19,795,552 | ||||||
Amphenol Corp. — Class A | 364,827 | 19,780,920 | ||||||
Snap-on, Inc. | 119,144 | 19,764,798 | ||||||
Agilent Technologies, Inc. | 522,975 | 19,747,536 | ||||||
General Dynamics Corp. | 132,551 | 19,694,428 | ||||||
Textron, Inc. | 464,245 | 19,577,212 | ||||||
Union Pacific Corp. | 218,370 | 19,511,359 | ||||||
Honeywell International, Inc. | 188,792 | 19,498,438 | ||||||
FedEx Corp. | 124,470 | 19,423,544 | ||||||
Rockwell Automation, Inc. | 177,561 | 19,382,559 | ||||||
AMETEK, Inc. | 353,384 | 19,372,511 | ||||||
Ball Corp. | 282,324 | 19,339,194 | ||||||
Pentair plc | 345,630 | 19,327,630 | ||||||
Waters Corp.* | 150,955 | 19,292,049 | ||||||
Emerson Electric Co. | 408,425 | 19,289,913 | ||||||
Rockwell Collins, Inc. | 222,281 | 19,276,208 | ||||||
Expeditors International of Washington, Inc. | 383,602 | 19,099,544 | ||||||
Tyco International plc | 522,971 | 19,057,063 | ||||||
Norfolk Southern Corp. | 237,523 | 19,008,966 | ||||||
CH Robinson Worldwide, Inc. | 273,861 | 19,000,476 | ||||||
Caterpillar, Inc. | 258,908 | 18,897,695 | ||||||
Precision Castparts Corp. | 81,854 | 18,892,722 | ||||||
10 | GUGGENHEIM ETFs ANNUAL REPORT | SEE NOTES TO FINANCIAL STATEMENTS. |
SCHEDULE OF INVESTMENTS (continued) | October 31, 2015 |
GUGGENHEIM S&P 500® EQUAL WEIGHT ETF |
Shares | Value | |||||||
Eaton Corporation plc | 337,484 | $ | 18,868,730 | |||||
Jacobs Engineering Group, Inc.* | 467,943 | 18,783,232 | ||||||
J.B. Hunt Transport Services, Inc. | 245,656 | 18,760,749 | ||||||
Garmin Ltd. | 523,963 | 18,584,968 | ||||||
Parker-Hannifin Corp. | 176,991 | 18,530,958 | ||||||
Deere & Co. | 237,280 | 18,507,840 | ||||||
Vulcan Materials Co. | 189,737 | 18,324,799 | ||||||
Sealed Air Corp. | 367,781 | 18,065,402 | ||||||
CSX Corp. | 659,820 | 17,808,542 | ||||||
FLIR Systems, Inc. | 661,965 | 17,654,607 | ||||||
WestRock Co. | 320,122 | 17,209,759 | ||||||
Martin Marietta Materials, Inc. | 109,692 | 17,018,714 | ||||||
Kansas City Southern | 203,200 | 16,816,832 | ||||||
Ryder System, Inc. | 229,660 | 16,484,995 | ||||||
Stericycle, Inc.* | 134,322 | 16,302,661 | ||||||
Cummins, Inc. | 156,080 | 16,155,841 | ||||||
Total Industrial | 1,243,316,498 | |||||||
Technology - 9.8% | ||||||||
SanDisk Corp. | 342,148 | 26,345,396 | ||||||
KLA-Tencor Corp. | 367,252 | 24,649,954 | ||||||
NVIDIA Corp. | 830,440 | 23,559,582 | ||||||
Microsoft Corp. | 432,552 | 22,769,538 | ||||||
Activision Blizzard, Inc. | 645,211 | 22,427,534 | ||||||
Texas Instruments, Inc. | 395,342 | 22,423,798 | ||||||
Autodesk, Inc.* | 406,158 | 22,415,860 | ||||||
Citrix Systems, Inc.* | 266,912 | 21,913,475 | ||||||
Intel Corp. | 638,157 | 21,607,996 | ||||||
Xilinx, Inc. | 448,506 | 21,357,856 | ||||||
Paychex, Inc. | 411,436 | 21,221,869 | ||||||
Red Hat, Inc.* | 266,634 | 21,093,416 | ||||||
Fiserv, Inc.* | 218,531 | 21,090,427 | ||||||
Adobe Systems, Inc.* | 237,484 | 21,055,331 | ||||||
salesforce.com, Inc.* | 268,492 | 20,864,513 | ||||||
Accenture plc — Class A | 193,210 | 20,712,111 | ||||||
Microchip Technology, Inc. | 428,489 | 20,691,734 | ||||||
Linear Technology Corp. | 463,535 | 20,590,224 | ||||||
Intuit, Inc. | 210,570 | 20,515,835 | ||||||
QUALCOMM, Inc. | 344,021 | 20,441,728 | ||||||
Cognizant Technology Solutions Corp. — Class A* | 299,523 | 20,400,512 | ||||||
Dun & Bradstreet Corp. | 179,109 | 20,395,142 | ||||||
Applied Materials, Inc. | 1,213,206 | 20,345,465 | ||||||
NetApp, Inc. | 595,528 | 20,247,952 | ||||||
Computer Sciences Corp. | 302,389 | 20,136,084 | ||||||
Analog Devices, Inc. | 333,722 | 20,063,367 | ||||||
Lam Research Corp. | 261,804 | 20,051,568 | ||||||
EMC Corp. | 764,480 | 20,044,666 | ||||||
Cerner Corp.* | 300,809 | 19,940,629 | ||||||
Fidelity National Information Services, Inc. | 270,187 | 19,702,036 | ||||||
Apple, Inc. | 164,655 | 19,676,272 | ||||||
Electronic Arts, Inc.* | 272,965 | 19,672,588 | ||||||
Altera Corp. | 372,038 | 19,550,597 | ||||||
Oracle Corp. | 495,916 | 19,261,378 | ||||||
Pitney Bowes, Inc. | 920,562 | 19,009,605 | ||||||
CA, Inc. | 678,465 | 18,800,265 | ||||||
HP, Inc. | 692,631 | 18,673,332 | ||||||
Micron Technology, Inc.* | 1,119,204 | 18,534,018 | ||||||
Broadcom Corp. — Class A | 354,307 | 18,211,380 | ||||||
International Business Machines Corp. | 127,601 | 17,874,348 | ||||||
Teradata Corp.* | 635,479 | 17,863,315 | ||||||
Avago Technologies Ltd. | 143,480 | 17,666,692 | ||||||
Xerox Corp. | 1,803,160 | 16,931,672 | ||||||
Skyworks Solutions, Inc. | 213,318 | 16,476,682 | ||||||
Western Digital Corp. | 233,526 | 15,604,207 | ||||||
Qorvo, Inc.* | 351,303 | 15,432,741 | ||||||
Akamai Technologies, Inc.* | 251,875 | 15,319,038 | ||||||
Seagate Technology plc | 384,264 | 14,625,088 | ||||||
Total Technology | 958,258,816 | |||||||
Energy - 8.1% | ||||||||
Marathon Oil Corp. | 1,245,933 | 22,900,249 | ||||||
Chevron Corp. | 248,110 | 22,548,237 | ||||||
Newfield Exploration Co.* | 551,019 | 22,145,453 | ||||||
Apache Corp. | 467,735 | 22,044,350 | ||||||
First Solar, Inc.* | 385,482 | 21,999,458 | ||||||
Pioneer Natural Resources Co. | 158,877 | 21,788,391 | ||||||
Noble Energy, Inc. | 602,834 | 21,605,571 | ||||||
Helmerich & Payne, Inc. | 380,994 | 21,438,533 | ||||||
Exxon Mobil Corp. | 258,714 | 21,405,996 | ||||||
ConocoPhillips | 397,050 | 21,182,618 | ||||||
Tesoro Corp. | 196,792 | 21,042,969 | ||||||
Occidental Petroleum Corp. | 281,099 | 20,953,119 | ||||||
Cimarex Energy Co. | 177,420 | 20,946,205 | ||||||
EOG Resources, Inc. | 243,753 | 20,926,195 | ||||||
Transocean Ltd. | 1,320,569 | 20,904,607 | ||||||
Phillips 66 | 233,358 | 20,780,530 | ||||||
Marathon Petroleum Corp. | 392,873 | 20,350,821 | ||||||
Devon Energy Corp. | 484,100 | 20,298,313 | ||||||
Ensco plc — Class A | 1,214,615 | 20,199,047 | ||||||
Hess Corp. | 358,178 | 20,133,185 | ||||||
Murphy Oil Corp. | 702,072 | 19,959,907 | ||||||
Schlumberger Ltd. | 255,172 | 19,944,244 | ||||||
Cameron International Corp.* | 291,777 | 19,843,754 | ||||||
Valero Energy Corp. | 298,977 | 19,708,564 | ||||||
Spectra Energy Corp. | 689,335 | 19,694,301 | ||||||
FMC Technologies, Inc.* | 577,863 | 19,549,105 | ||||||
Halliburton Co. | 505,505 | 19,401,282 | ||||||
Anadarko Petroleum Corp. | 286,429 | 19,156,372 | ||||||
Baker Hughes, Inc. | 354,261 | 18,662,469 | ||||||
National Oilwell Varco, Inc. | 486,673 | 18,318,372 | ||||||
ONEOK, Inc. | 534,432 | 18,127,933 | ||||||
Chesapeake Energy Corp. | 2,483,712 | 17,708,867 | ||||||
Cabot Oil & Gas Corp. — Class A | 812,206 | 17,632,992 | ||||||
Williams Companies, Inc. | 437,672 | 17,261,784 | ||||||
Equities Corp. | 259,064 | 17,116,358 | ||||||
Kinder Morgan, Inc. | 624,726 | 17,086,256 | ||||||
Diamond Offshore Drilling, Inc. | 855,137 | 17,000,124 | ||||||
SEE NOTES TO FINANCIAL STATEMENTS. | GUGGENHEIM ETFs ANNUAL REPORT | 11 |
SCHEDULE OF INVESTMENTS (continued) | October 31, 2015 |
GUGGENHEIM S&P 500® EQUAL WEIGHT ETF |
Shares | Value | |||||||
Columbia Pipeline Group, Inc. | 800,198 | $ | 16,620,112 | |||||
Range Resources Corp. | 515,424 | 15,689,507 | ||||||
Southwestern Energy Co.* | 1,220,140 | 13,470,346 | ||||||
CONSOL Energy, Inc. | 1,500,375 | 9,992,498 | ||||||
Total Energy | 797,538,994 | |||||||
Communications - 7.4% | ||||||||
TripAdvisor, Inc.* | 281,022 | 23,544,022 | ||||||
Juniper Networks, Inc. | 744,516 | 23,370,357 | ||||||
Amazon.com, Inc.* | 35,518 | 22,230,716 | ||||||
Cablevision Systems Corp. — Class A | 676,642 | 22,051,763 | ||||||
Expedia, Inc. | 161,305 | 21,985,872 | ||||||
TEGNA, Inc. | 811,592 | 21,945,448 | ||||||
Interpublic Group of Companies, Inc. | 956,635 | 21,935,640 | ||||||
VeriSign, Inc.* | 271,960 | 21,919,976 | ||||||
Yahoo!, Inc.* | 598,276 | 21,310,592 | ||||||
Scripps Networks Interactive, Inc. — Class A | 353,732 | 21,252,218 | ||||||
Level 3 Communications, Inc.* | 416,309 | 21,210,944 | ||||||
Priceline Group, Inc.* | 14,573 | 21,192,640 | ||||||
Viacom, Inc. — Class B | 424,638 | 20,938,899 | ||||||
Netflix, Inc.* | 192,867 | 20,902,925 | ||||||
Cisco Systems, Inc. | 722,754 | 20,851,453 | ||||||
Facebook, Inc. — Class A* | 204,342 | 20,836,754 | ||||||
Omnicom Group, Inc. | 277,967 | 20,825,288 | ||||||
Walt Disney Co. | 179,994 | 20,472,518 | ||||||
Time Warner, Inc. | 268,602 | 20,236,475 | ||||||
CenturyLink, Inc. | 715,569 | 20,186,201 | ||||||
eBay, Inc.* | 714,604 | 19,937,452 | ||||||
CBS Corp. — Class B | 428,035 | 19,912,188 | ||||||
Motorola Solutions, Inc. | 280,431 | 19,621,757 | ||||||
Nielsen Holdings plc | 409,947 | 19,476,582 | ||||||
Symantec Corp. | 940,742 | 19,379,285 | ||||||
Verizon Communications, Inc. | 411,256 | 19,279,681 | ||||||
AT&T, Inc. | 574,784 | 19,261,012 | ||||||
Time Warner Cable, Inc. | 100,325 | 19,001,555 | ||||||
News Corp. — Class A | 1,184,414 | 18,239,976 | ||||||
Comcast Corp. — Class A | 290,358 | 18,182,218 | ||||||
Frontier Communications Corp. | 3,535,549 | 18,172,722 | ||||||
F5 Networks, Inc.* | 159,148 | 17,538,110 | ||||||
Twenty-First Century Fox, Inc. — Class A | 555,552 | 17,049,891 | ||||||
Discovery Communications, Inc. — Class C* | 461,246 | 12,693,490 | ||||||
Alphabet, Inc. — Class A* | 14,665 | 10,813,824 | ||||||
Alphabet, Inc. — Class C* | 14,705 | 10,452,461 | ||||||
Discovery Communications, Inc. — Class A* | 263,495 | 7,757,293 | ||||||
Twenty-First Century Fox, Inc. — Class B | 152,783 | 4,717,939 | ||||||
News Corp. — Class B | 254,728 | 3,943,189 | ||||||
Comcast Corp. — Class A | 42,486 | 2,664,297 | ||||||
Total Communications | 727,295,623 | |||||||
Utilities - 5.9% | ||||||||
PPL Corp. | 633,905 | 21,806,332 | ||||||
Pepco Holdings, Inc. | 815,866 | 21,726,512 | ||||||
NiSource, Inc. | 1,132,251 | 21,693,929 | ||||||
SCANA Corp. | 364,867 | 21,607,424 | ||||||
Sempra Energy | 208,221 | 21,323,913 | ||||||
Ameren Corp. | 484,507 | 21,163,266 | ||||||
Eversource Energy | 408,069 | 20,787,035 | ||||||
CMS Energy Corp. | 575,690 | 20,765,138 | ||||||
PG&E Corp. | 388,261 | 20,733,137 | ||||||
Entergy Corp. | 300,047 | 20,451,204 | ||||||
WEC Energy Group, Inc. | 392,838 | 20,254,727 | ||||||
Xcel Energy, Inc. | 567,194 | 20,209,122 | ||||||
DTE Energy Co. | 247,687 | 20,208,782 | ||||||
NextEra Energy, Inc. | 196,214 | 20,143,329 | ||||||
Pinnacle West Capital Corp. | 314,565 | 19,978,023 | ||||||
Southern Co. | 440,367 | 19,860,552 | ||||||
Dominion Resources, Inc. | 277,580 | 19,827,539 | ||||||
Consolidated Edison, Inc. | 301,473 | 19,821,850 | ||||||
American Electric Power Company, Inc. | 349,721 | 19,811,695 | ||||||
Public Service Enterprise Group, Inc. | 478,317 | 19,749,709 | ||||||
CenterPoint Energy, Inc. | 1,063,119 | 19,720,857 | ||||||
Duke Energy Corp. | 275,207 | 19,669,044 | ||||||
Edison International | 324,710 | 19,651,449 | ||||||
AGL Resources, Inc. | 308,397 | 19,274,813 | ||||||
FirstEnergy Corp. | 614,784 | 19,181,261 | ||||||
TECO Energy, Inc. | 704,720 | 19,027,440 | ||||||
AES Corp. | 1,689,602 | 18,501,142 | ||||||
Exelon Corp. | 633,186 | 17,678,553 | ||||||
NRG Energy, Inc. | 1,019,210 | 13,137,617 | ||||||
Total Utilities | 577,765,394 | |||||||
Basic Materials - 4.2% | ||||||||
EI du Pont de Nemours & Co. | 388,185 | 24,610,930 | ||||||
Newmont Mining Corp. | 1,157,803 | 22,530,846 | ||||||
Dow Chemical Co. | 429,549 | 22,194,797 | ||||||
LyondellBasell Industries N.V. — Class A | 224,467 | 20,855,229 | ||||||
Ecolab, Inc. | 170,996 | 20,579,369 | ||||||
International Flavors & Fragrances, Inc. | 175,566 | 20,376,190 | ||||||
PPG Industries, Inc. | 194,424 | 20,270,646 | ||||||
Praxair, Inc. | 179,486 | 19,939,100 | ||||||
Sherwin-Williams Co. | 73,566 | 19,629,616 | ||||||
Eastman Chemical Co. | 269,114 | 19,421,957 | ||||||
Freeport-McMoRan, Inc. | 1,649,220 | 19,411,319 | ||||||
International Paper Co. | 451,588 | 19,278,292 | ||||||
Airgas, Inc. | 199,381 | 19,172,477 | ||||||
Air Products & Chemicals, Inc. | 137,844 | 19,157,559 | ||||||
Monsanto Co. | 203,318 | 18,953,303 | ||||||
Nucor Corp. | 446,467 | 18,885,554 | ||||||
Sigma-Aldrich Corp. | 134,634 | 18,811,062 | ||||||
FMC Corp. | 452,021 | 18,401,775 | ||||||
Alcoa, Inc. | 1,948,670 | 17,401,623 | ||||||
CF Industries Holdings, Inc. | 336,528 | 17,085,527 | ||||||
Mosaic Co. | 480,473 | 16,235,183 | ||||||
Total Basic Materials | 413,202,354 | |||||||
12 | GUGGENHEIM ETFs ANNUAL REPORT | SEE NOTES TO FINANCIAL STATEMENTS. |
SCHEDULE OF INVESTMENTS (concluded) | October 31, 2015 |
GUGGENHEIM S&P 500® EQUAL WEIGHT ETF |
Shares | Value | |||||||
Diversified - 0.2% | ||||||||
Leucadia National Corp. | 903,252 | $ | 18,074,073 | |||||
Total Common Stocks | ||||||||
(Cost $9,048,375,770) | 9,785,072,874 | |||||||
SHORT TERM INVESTMENTS† - 0.1% | ||||||||
Federated U.S. Treasury Cash Reserve Fund 0.00%1 | 8,724,763 | 8,724,763 | ||||||
Total Short Term Investments | ||||||||
(Cost $8,724,763) | 8,724,763 | |||||||
Total Investments - 99.9% | ||||||||
(Cost $9,057,100,533) | $ | 9,793,797,637 | ||||||
Other Assets & Liabilities, net - 0.1% | 5,744,201 | |||||||
Total Net Assets - 100.0% | $ | 9,799,541,838 | ||||||
* | Non-income producing security. |
† | Value determined based on Level 1 inputs — See Note 4. |
1 | Rate indicated is the 7 day yield as of October 31, 2015. |
plc — Public Limited Company | |
See Sector Classification in Other Information section. |
The following table summarizes the inputs used to value the Fund's net assets at October 31, 2015 (See Note 4 in the Notes to Financial Statements):
Investments in Securities | Level 1 | Level 2 | Level 3 | Total | ||||||||||||
Common Stocks | $ | 9,785,072,874 | $ | — | $ | — | $ | 9,785,072,874 | ||||||||
Short Term Investments | 8,724,763 | — | — | 8,724,763 | ||||||||||||
Total | $ | 9,793,797,637 | $ | — | $ | — | $ | 9,793,797,637 | ||||||||
For the year ended October 31, 2015, there were no transfers between levels.
SEE NOTES TO FINANCIAL STATEMENTS. | GUGGENHEIM ETFs ANNUAL REPORT | 13 |
STATEMENT OF ASSETS AND LIABILITIES | October 31, 2015 |
Guggenheim | ||||
Assets: | ||||
Investments, at value* | $ | 9,793,797,637 | ||
Receivables: | ||||
Fund shares sold | 21,074 | |||
Dividends and interest | 8,944,082 | |||
Total assets | 9,802,762,793 | |||
Liabilities: | ||||
Payable for: | ||||
Due to custodian | 89 | |||
Management fees | 3,220,866 | |||
Total liabilities | 3,220,955 | |||
Commitments and contingent liabilities (Note 8) | — | |||
Net Assets | $ | 9,799,541,838 | ||
Net Assets consist of: | ||||
Paid-in capital | $ | 9,549,924,260 | ||
Undistributed net investment income | — | |||
Accumulated net realized loss on investments | (487,079,526 | ) | ||
Net unrealized appreciation on investments | 736,697,104 | |||
Net Assets | $ | 9,799,541,838 | ||
Shares outstanding (unlimited shares authorized), no par value | 124,508,863 | |||
Net asset value, offering price and repurchase price per share | $ | 78.71 | ||
*Total cost of investments | $ | 9,057,100,533 | ||
14 | GUGGENHEIM ETFs ANNUAL REPORT | SEE NOTES TO FINANCIAL STATEMENTS. |
STATEMENT OF OPERATIONS |
For the Year Ended October 31, 2015
Guggenheim | ||||
Investment Income: | ||||
Dividends, net of foreign taxes withheld* | $ | 199,765,248 | ||
Income from securities lending | 3,488,004 | |||
Interest | 95 | |||
Total investment income | 203,253,347 | |||
Expenses: | ||||
Management fees | 42,056,662 | |||
Total expenses | 42,056,662 | |||
Net investment income | 161,196,685 | |||
Net Realized and Unrealized Gain(Loss): | ||||
Net realized gain (loss) on: | ||||
Investments | 25,496,282 | |||
In-kind redemptions | 790,011,282 | |||
Net realized gain | 815,507,564 | |||
Net change in unrealized appreciation (depreciation) on: | ||||
Investments | (816,243,971 | ) | ||
Net realized and unrealized loss | (736,407 | ) | ||
Net increase in net assets resulting from operations | $ | 160,460,278 | ||
* Foreign taxes withheld | $ | 56,010 | ||
SEE NOTES TO FINANCIAL STATEMENTS. | GUGGENHEIM ETFs ANNUAL REPORT | 15 |
STATEMENTS OF CHANGES IN NET ASSETS |
Guggenheim S&P 500® | ||||||||
Year Ended | Year Ended | |||||||
Increase (Decrease) in Net Assets from Operations: | ||||||||
Net investment income | $ | 161,196,685 | $ | 109,088,349 | ||||
Net realized gain on investments | 815,507,564 | 310,206,875 | ||||||
Net change in unrealized appreciation (depreciation) on investments | (816,243,971 | ) | 663,737,970 | |||||
Net increase in net assets resulting from operations | 160,460,278 | 1,083,033,194 | ||||||
Distributions to shareholders from: | ||||||||
Net investment income | (171,350,548 | ) | (109,511,409 | ) | ||||
Shareholder transactions: | ||||||||
Proceeds from shares purchased | 3,306,916,862 | 3,153,662,668 | ||||||
Cost of shares redeemed | (2,472,681,822 | ) | (814,758,926 | ) | ||||
Net increase in net assets resulting from share transactions | 834,235,040 | 2,338,903,742 | ||||||
Net increase in net assets | 823,344,770 | 3,312,425,527 | ||||||
Net Assets: | ||||||||
Beginning of year | 8,976,197,068 | 5,663,771,541 | ||||||
End of year | $ | 9,799,541,838 | $ | 8,976,197,068 | ||||
Undistributed net investment income at end of year | $ | — | $ | 468,285 | ||||
Changes in shares outstanding: | ||||||||
Shares sold | 41,400,000 | 42,950,000 | ||||||
Shares redeemed | (31,850,000 | ) | (11,350,000 | ) | ||||
Net increase in shares | 9,550,000 | 31,600,000 | ||||||
16 | GUGGENHEIM ETFs ANNUAL REPORT | SEE NOTES TO FINANCIAL STATEMENTS. |
GUGGENHEIM S&P 500® EQUAL WEIGHT ETF |
FINANCIAL HIGHLIGHTS |
This table is presented to show selected data for a share outstanding throughout each period and to assist shareholders in evaluating the Fund’s performance for the periods presented.
Year Ended | Year Ended | Year Ended | Year Ended | Year Ended | ||||||||||||||||
Per Share Data: | ||||||||||||||||||||
Net asset value, beginning of period | $ | 78.08 | $ | 67.94 | $ | 51.76 | $ | 46.77 | $ | 43.87 | ||||||||||
Income from investment operations: | ||||||||||||||||||||
Net investment income (loss)a | 1.22 | 1.09 | 0.99 | 0.80 | 0.69 | |||||||||||||||
Net gain (loss) on investments (realized and unrealized) | 0.71 | 10.13 | 16.13 | 4.97 | 2.87 | |||||||||||||||
Total from investment operations | 1.93 | 11.22 | 17.12 | 5.77 | 3.56 | |||||||||||||||
Less distributions from: | ||||||||||||||||||||
Net investment income | (1.30 | ) | (1.08 | ) | (0.94 | ) | (0.78 | ) | (0.66 | ) | ||||||||||
Total distributions to shareholders | (1.30 | ) | (1.08 | ) | (0.94 | ) | (0.78 | ) | (0.66 | ) | ||||||||||
Net asset value, end of period | $ | 78.71 | $ | 78.08 | $ | 67.94 | $ | 51.76 | $ | 46.77 | ||||||||||
Total Returnb | 2.49 | % | 16.60 | % | 33.36 | % | 12.42 | % | 8.12 | % | ||||||||||
Ratios/Supplemental Data: | ||||||||||||||||||||
Net assets, end of period (in thousands) | $ | 9,799,542 | $ | 8,976,197 | $ | 5,663,772 | $ | 2,772,440 | $ | 3,063,809 | ||||||||||
Ratio to average net assets of: | ||||||||||||||||||||
Net investment income (loss) | 1.53 | % | 1.48 | % | 1.64 | % | 1.61 | % | 1.45 | % | ||||||||||
Total expenses | 0.40 | % | 0.40 | % | 0.40 | % | 0.40 | % | 0.40 | % | ||||||||||
Portfolio turnover ratec | 22 | % | 18 | % | 37 | % | 20 | % | 21 | % | ||||||||||
a | Based on average shares outstanding. |
b | Total investment return is calculated assuming an initial investment made at the net asset value at the beginning of the period, reinvestment of all dividends and distribution at net asset value during the period, and redemption on the last day of the period. Transaction fees are not reflected in the calculation of total investment return. |
c | Portfolio turnover does not include securities received or delivered from processing creations or redemptions. |
SEE NOTES TO FINANCIAL STATEMENTS. | GUGGENHEIM ETFs ANNUAL REPORT | 17 |
NOTES TO FINANCIAL STATEMENTS |
1. Organization and Significant Accounting Policies
Organization
Rydex ETF Trust (the “Trust”) is registered with the SEC under the Investment Company Act of 1940 (the “1940 Act”), as an open-ended investment company of the series type, and is authorized to issue an unlimited number of no par value shares. Each portfolio represents a separate series of beneficial interest in the Trust (each a “Fund”, and collectively, the “Funds”), each a non-diversified investment company. The Trust was organized as a Delaware statutory trust on November 22, 2002. At October 31, 2015, the Trust consisted of twenty-two funds.
The financial statements herein relate to the following Fund, whose investment objective is to replicate as closely as possible, before fees and expenses, the daily performance of an index representing publicly traded equity securities (the “Underlying Index”) as follows:
Fund | Underlying Index |
Guggenheim S&P 500® Equal Weight ETF | S&P 500® Equal Weight Index |
The Fund seeks to achieve its objective by investing in common stocks that comprise the Underlying Index. The Fund uses a “replication” strategy to track the Underlying Index. Replication refers to investing in substantially all of the securities in the Underlying Index in approximately the same proportions as in the Underlying Index.
The Fund operates as an index fund and is not actively managed. Adverse performance of a security in the Fund's portfolio will ordinarily not result in the elimination of the security from the Fund's portfolio.
The Fund issues and redeems shares on a continuous basis, at net asset value per share (“NAV”), only in aggregation of 50,000 shares (a “Creation Unit”). Creation Units are issued and redeemed principally in-kind for securities included in the Underlying Index.
The Fund invests in various investments which are exposed to risk, such as market risk. Due to the level of risk associated with certain investments it is at least reasonably possible that changes in the values of investment securities will occur in the near term and that such changes could materially affect amounts reported in the financial statements.
Guggenheim Investments (“GI”) provides advisory services and Rydex Fund Services, LLC (“RFS”) provides administrative services to the Trust. Guggenheim Funds Distributors, LLC (“GFD”) acts as principal underwriter for the Trust. GI, RFS and GFD are affiliated entities.
Significant Accounting Policies
The Fund operates as an investment company and accordingly follows the investment company accounting and reporting guidance of the Financial Accounting Standards Board (“FASB”) Accounting Standards Codification Topic 946 Financial Services – Investment Companies.
The following significant accounting policies are in conformity with U.S. generally accepted accounting principles (“U.S. GAAP”) and are consistently followed by the Trust. This requires management to make estimates and assumptions that affect the reported amount of assets and liabilities and disclosure of contingent assets and liabilities at the date of the financial statements and the reported amounts of revenues and expenses during the reporting period. Actual results could differ from these estimates. All time references are based on Eastern Time.
A. The Board of Trustees of the Fund (the “Board”) has adopted policies and procedures for the valuation of the Fund's investments (the “Valuation Procedures”). Pursuant to the Valuation Procedures, the Board has delegated to a valuation committee, consisting of representatives from Guggenheim’s investment management, fund administration, legal and compliance departments (the “Valuation Committee”), the day-to-day responsibility for implementing the Valuation Procedures, including, under most circumstances, the responsibility for determining the fair value of the Fund’s securities or other assets.
Valuations of the Fund's securities are supplied primarily by pricing services appointed pursuant to the processes set forth in the Valuation Procedures. The Valuation Committee convenes monthly, or more frequently as needed and will review the valuation of all assets which have been fair valued for reasonableness. The Fund's officers, through the Valuation Committee and consistent with the monitoring and review responsibilities set forth in the Valuation Procedures, regularly review procedures used by, and valuations provided by, the pricing services.
18 | GUGGENHEIM ETFs ANNUAL REPORT |
NOTES TO FINANCIAL STATEMENTS (continued) |
If the pricing service cannot or does not provide a valuation for a particular investment or such valuation is deemed unreliable, such investment is fair valued by the Valuation Committee.
Equity securities listed on an exchange (New York Stock Exchange (“NYSE”) or American Stock Exchange) are valued at the last quoted sales price as of the close of business on the NYSE, usually 4:00 p.m. on the valuation date. Equity securities listed on the NASDAQ market system are valued at the NASDAQ Official Closing Price on the valuation date, which may not necessarily represent the last sale price. If there has been no sale on such exchange or NASDAQ on a given day, the security is valued at the closing bid price on that day.
The Fund invests in money market mutual funds, which are valued at their NAV.
Investments for which market quotations are not readily available are fair valued as determined in good faith by GI under the direction of the Board of Trustees using methods established or ratified by the Board of Trustees. Valuations in accordance with these methods are intended to reflect each security’s (or asset’s) “fair value.” Each such determination is based on a consideration of all relevant factors, which are likely to vary from one pricing context to another. Examples of such factors may include, but are not limited to: (i) the type of security, (ii) the initial cost of the security, (iii) the existence of any contractual restrictions on the security’s disposition, (iv) the price and extent of public trading in similar securities of the issuer or of comparable companies, (v) quotations or evaluated prices from broker-dealers and/or pricing services, (vi) information obtained from the issuer, analysts, and/or the appropriate stock exchange (for exchange-traded securities), (vii) an analysis of the company’s financial statements, and (viii) an evaluation of the forces that influence the issuer and the market(s) in which the security is purchased and sold (e.g. the existence of pending merger activity, public offerings or tender offers that might affect the value of the security).
B. Security transactions are recorded on the trade date for financial reporting purposes. Realized gains and losses from securities transactions are recorded using the identified cost basis. Proceeds from lawsuits related to investment holdings are recorded as realized gains in the Fund. Dividend income is recorded on the ex-dividend date, net of applicable taxes withheld by foreign countries. Taxable non-cash dividends are recorded as dividend income. Interest income, including amortization of premiums and accretion of discounts, is accrued on a daily basis. Dividend income from REITs is recorded based on the income included in the distributions received from the REIT investments using published REIT classifications, including some management estimates when actual amounts are not available. Distributions received in excess of this estimated amount are recorded as a reduction of the cost of investments or reclassified to capital gains. The actual amounts of income, return of capital, and capital gains are only determined by each REIT after its fiscal year-end, and may differ from the estimated amounts.
C. Distributions of net investment income and net realized gains, if any, are declared and paid at least annually. Distributions are recorded on the ex-dividend date and are determined in accordance with income tax regulations which may differ from U.S. GAAP.
D. The Fund may leave cash overnight in its cash account with the custodian. Periodically, the Fund may have cash due to the custodian bank as an overdraft balance. A fee is incurred on this overdraft, calculated by multiplying the overdraft by a rate based on the federal funds rate.
E. Under the Fund's organizational documents, its Trustees and Officers are indemnified against certain liabilities arising out of the performance of their duties to the Trust. In addition, throughout the normal course of business, the Fund enters into contracts that contain a variety of representations and warranties which provide general indemnifications. The Fund's maximum exposure under these arrangements is unknown, as this would involve future claims that may be made against the Fund and/or its affiliates that have not yet occurred. However, based on experience, the Fund expects the risk of loss to be remote.
2. Capital
There is a minimum transaction fee per transaction to those persons purchasing or redeeming Creation Units. An additional charge of up to three times the standard transaction fee may be imposed for purchases and redemptions effected outside the National Securities Clearing Corporation usual clearing process or for cash. Such transactions are generally permitted on an in-kind basis, with a balancing cash component to equate the transaction to the NAV of the Fund on the transaction date. Transaction fees are not charged to or paid by the Fund.
GUGGENHEIM ETFs ANNUAL REPORT | 19 |
NOTES TO FINANCIAL STATEMENTS (continued) |
The minimum transaction fees are:
Fund | Minimum Transaction Fee | |||
Guggenheim S&P 500® Equal Weight ETF | $ | 2,000 | ||
3. Fees and Other Transactions with Affiliates
GI determines the composition of the portfolio of securities that must be delivered in exchange for the issuance of Creation Units and periodically adjusts the composition of the portfolio of the Fund to conform to changes in the composition of the relevant index. For these services, GI receives a management fee at the annual rate shown below as a percentage of the average daily net assets of the Fund.
Fund | Advisory Fee |
Guggenheim S&P 500® Equal Weight ETF | 0.40% |
GI pays all expenses of the Fund, including the cost of transfer agency, custody, fund administration, fund accounting, legal, audit and other services, except: interest, taxes, distribution fees or expenses and extraordinary expenses.
Under a Fund Administration Agreement with the Trust, RFS provides various administrative and financial reporting services for the Fund. GI compensates RFS directly for this service.
Under a Fund Accounting Agreement with the Trust, BNYMellon maintains the books and records of the Fund. Under a Custodian Agreement with the Trust, BNYMellon maintains cash, securities and other assets of the Fund in a separate account for the Fund, keeps all necessary accounts and records, and provides other services. BNYMellon is required, upon the order of the Trust, to deliver securities held by the custodian and to make payments for securities purchased by the Trust for the Fund. Pursuant to a Transfer Agency and Service Agreement with the Trust, BNYMellon acts as a transfer agent for the Trust’s authorized and issued shares of beneficial interest, and as dividend disbursing agent of the Trust. GI compensates BNYMellon directly for the foregoing services.
The Fund has adopted a Distribution Plan (the “Plan”) that allows the Fund to pay distribution fees to GFD and other firms that provide distribution services (“Service Providers”). If a Service Provider provides distribution services, the Fund will pay distribution fees to GFD at an annual rate not to exceed 0.25% of average daily net assets, pursuant to Rule 12b-1 of the 1940 Act. GFD will, in turn, pay the Service Provider out of its fees. No such fee is currently charged to the Fund.
Certain trustees and officers of the Trust are also officers of GI, RFS and GFD.
4. Fair Value Measurement
In accordance with U.S. GAAP, fair value is defined as the price that the Funds would receive to sell an investment or pay to transfer a liability in an orderly transaction with an independent buyer in the principal market, or in the absence of a principal market, the most advantageous market for the investment or liability. U.S. GAAP establishes a three-tier fair value hierarchy based on the types of inputs used to value assets and liabilities and requires corresponding disclosure. The hierarchy and the corresponding inputs are summarized below:
Level 1 — quoted prices in active markets for identical securities.
Level 2 — other significant observable inputs (including quoted prices for similar securities, interest rates, prepayment speeds, credit risk, etc.).
Level 3 — significant unobservable inputs (including the fund’s own assumptions used to determine the fair value of investments).
The types of inputs available depend on a variety of factors, such as the type of security and the characteristics of the markets in which it trades, if any. Fair valuation determinations that rely on fewer or no observable inputs require greater judgment. Accordingly, fair value determinations for Level 3 securities require the greatest amount of judgment.
The inputs or methodologies used for valuing securities are not necessarily an indication of the risk associated with investing in those securities. The suitability of the techniques and sources employed to determine fair valuation are regularly monitored and subject to change.
5. Portfolio Securities Loaned
During the year ended October 31, 2015, the Fund lent its securities to approved brokers to earn additional income.
20 | GUGGENHEIM ETFs ANNUAL REPORT |
NOTES TO FINANCIAL STATEMENTS (continued) |
Security lending income shown on the Statement of Operations is net of rebates paid to borrowers and earnings on cash collateral investments shared with the lending agent. As of October 31, 2015, the Fund had ceased participation in securities lending.
6. Federal Income Tax Information
The Fund intends to comply with the provisions of Subchapter M of the Internal Revenue Code applicable to regulated investment companies and will distribute substantially all taxable net investment income and capital gains sufficient to relieve the Fund from all, or substantially all, federal income, excise and state income taxes. Therefore, no provision for federal or state income tax is required.
Tax positions taken or expected to be taken in the course of preparing the Fund’s tax returns are evaluated to determine whether the tax positions are “more-likely-than-not” of being sustained by the applicable tax authority. Tax positions not deemed to meet the more-likely-than-not threshold would be recorded as a tax benefit or expense in the current year. Management has analyzed the Fund’s tax positions taken, or to be taken, on Federal income tax returns for all open tax years, and has concluded that no provision for income tax is required in the Fund’s financial statements. The Fund’s federal tax returns are subject to examination by the Internal Revenue Service for a period of three years after they are filed.
Tax basis capital losses in excess of capital gains are carried forward to offset future net capital gains. For the year ended October 31, 2015, the following capital loss carryforward amounts were expired or used:
Fund | Amount | |||
Guggenheim S&P 500® Equal Weight ETF | $ | 27,012,245 | ||
The tax character of distributions paid during the year ended October 31, 2015 was as follows:
Fund | Ordinary | Long-Term | Total | |||||||||
Guggenheim S&P 500® Equal Weight ETF | $ | 171,350,548 | $ | — | $ | 171,350,548 | ||||||
The tax character of distributions paid during the year ended October 31, 2014 was as follows:
Fund | Ordinary | Long-Term | Total | |||||||||
Guggenheim S&P 500® Equal Weight ETF | $ | 109,511,409 | $ | — | $ | 109,511,409 | ||||||
The tax character of distributable earnings/(accumulated losses) at October 31, 2015 was as follows:
Fund | Undistributed | Undistributed | Accumulated | Net Unrealized | Total | |||||||||||||||
Guggenheim S&P 500® Equal Weight ETF | $ | — | $ | — | $ | (476,954,776 | ) | $ | 726,572,354 | $ | 249,617,578 | |||||||||
GUGGENHEIM ETFs ANNUAL REPORT | 21 |
NOTES TO FINANCIAL STATEMENTS (continued) |
For Federal income tax purposes, capital loss carryforwards represent realized losses of the Funds that may be carried forward and applied against future capital gains. For taxable years beginning on or before December 22, 2010, such capital losses may be carried forward for a maximum of eight years. Under the RIC Modernization Act of 2010, the Funds are permitted to carry forward capital losses incurred in taxable years beginning after December 22, 2010 for an unlimited period. However, any losses incurred during those taxable years must be utilized prior to the losses incurred in pre-enactment taxable years. As a result of this ordering rule, pre-enactment capital loss carryforwards may be more likely to expire unused. Additionally, post-enactment capital losses that are carried forward will retain their character as either short-term or long-term capital losses rather than being considered all short-term as under previous law. As of October 31, 2015, capital loss carryforwards for the Fund were as follows:
Unlimited | ||||||||||||||||||||||||||||
Fund | Expires in | Expires in | Expires in | Expires in | Short-Term | Long-Term | Remaining | |||||||||||||||||||||
Guggenheim S&P 500® Equal Weight ETF | $ | (107,158,339 | ) | $ | (313,762,207 | ) | $ | (35,251,288 | ) | $ | (20,782,942 | ) | $ | — | $ | — | $ | (476,954,776 | ) | |||||||||
In order to present paid-in-capital, distributions in excess of net investment income and accumulated net realized gain on investments on the statement of assets and liabilities that more closely represent their tax character, certain adjustments have been made to these accounts. These adjustments have no effect on the net assets or NAV. The most significant of these adjustments are for net capital gains (losses) resulting from in-kind redemptions and return of capital on investments. For the year ended October 31, 2015, the adjustments for the Fund were as follows:
Fund | Paid-In Capital | Undistributed | Accumulated | |||||||||
Guggenheim S&P 500® Equal Weight ETF | $ | 781,266,195 | $ | 9,685,578 | $ | (790,951,773 | ) | |||||
At October 31, 2015, the identified cost of investments in securities owned by the Fund for Federal income tax purposes and the gross unrealized appreciation and depreciation were as follows:
Fund | Tax | Tax | Tax | Net | ||||||||||||
Guggenheim S&P 500® Equal Weight ETF | $ | 9,067,225,283 | $ | 1,506,839,724 | $ | (780,267,370 | ) | $ | 726,572,354 | |||||||
7. Investment Transactions
For the year ended October 31, 2015, the Fund had investments transactions in-kind associated with subscriptions and redemptions as follows:
Fund | Subscriptions | Redemptions | ||||||
Guggenheim S&P 500® Equal Weight ETF | $ | 3,299,284,264 | $ | 2,467,621,971 | ||||
For the year ended October 31, 2015, the cost of purchases and proceeds from sales of investment securities, excluding government securities, short-term investments and in-kind transactions, were as follows:
Fund | Purchases | Sales | ||||||
Guggenheim S&P 500® Equal Weight ETF | $ | 2,266,069,682 | $ | 2,266,535,540 | ||||
22 | GUGGENHEIM ETFs ANNUAL REPORT |
NOTES TO FINANCIAL STATEMENTS (concluded) |
8. Legal Proceedings
Tribune Company
Rydex ETF Trust has been named as a defendant and a putative member of the proposed defendant class of shareholders in the case entitled Kirschner v. FitzSimons, No. 12-2652 (S.D.N.Y.) (formerly Official Committee of Unsecured Creditors of Tribune Co. v. FitzSimons, Adv. Pro. No. 10-54010 (Bankr. D. Del.)) (the “FitzSimons action”), as a result of ownership of shares by certain series of the Rydex ETF Trust in the Tribune Company (“Tribune”) in 2007, when Tribune effected a leveraged buyout transaction (“LBO”) by which Tribune converted to a privately-held company. In his complaint, the plaintiff has alleged that, in connection with the LBO, insiders and shareholders were overpaid for their Tribune stock using financing that the insiders knew would, and ultimately did, leave the Tribune Company insolvent. The plaintiff has asserted claims against certain insiders, major shareholders, professional advisers, and others involved in the LBO. The plaintiff is also attempting to obtain from former Tribune shareholders, including Rydex ETF Trust, the proceeds they received in connection with the LBO.
In June 2011, a group of Tribune creditors filed multiple actions against former Tribune shareholders involving state law constructive fraudulent conveyance claims arising out of the 2007 LBO (the “SLCFC actions”). Rydex ETF Trust has been named as a defendant in one of the SLCFC actions: Deutsche Bank Trust Co. Americas v. McGurn, No. 11-1510 (S.D.N.Y.). In those actions, the creditors seek to recover from Tribune’s former shareholders the proceeds received in connection with the 2007 LBO.
The FitzSimons action and the SLCFC actions have been consolidated with the majority of the other Tribune LBO-related lawsuits in a multidistrict litigation proceeding captioned In re Tribune Company Fraudulent Conveyance Litig., No. 11-md-2696 (S.D.N.Y.) (the “MDL Proceeding”).
On September 23, 2013, the District Court granted the defendants’ omnibus motion to dismiss the SLCFC actions, on the basis that the creditors lacked standing. On September 30, 2013, the creditors filed a notice of appeal of the September 23 order. On October 28, 2013, the defendants filed a joint notice of cross-appeal of that same order. The SLCFC appeals have been fully briefed, and oral argument in front of the U.S. Court of Appeals for the Second Circuit occurred on November 5, 2014. The Court has not yet issued a decision on the appeals.
On May 23, 2014, the defendants filed motions to dismiss the FitzSimons action, including a global motion to dismiss Count I, which is the claim brought against former Tribune shareholders for intentional fraudulent conveyance under U.S. federal law. The Court has not yet issued a decision on any of these motions.
None of these lawsuits alleges any wrongdoing on the part of Rydex ETF Trust. The following series of Rydex ETF Trust held shares of Tribune and tendered these shares as part of Tribune’s LBO: Guggenheim S&P 500 Equal Weight ETF (the “Fund”). The value of the proceeds received by the foregoing Fund was $4,766,035. At this stage of the proceedings, Rydex ETF Trust is not able to make a reliable prediction as to the outcome of these lawsuits or the effect, if any, on the Fund’s net asset value.
GUGGENHEIM ETFs ANNUAL REPORT | 23 |
REPORT OF INDEPENDENT REGISTERED PUBLIC ACCOUNTING FIRM |
The Board of Trustees and Shareholders of Rydex ETF Trust:
We have audited the accompanying statement of assets and liabilities, including the schedule of investments, of Guggenheim S&P 500® Equal Weight ETF (one of the series constituting the Rydex ETF Trust) (the “Fund”) as of October 31, 2015, and the related statement of operations for the year then ended, the statements of changes in net assets for each of the two years in the period then ended, and the financial highlights for each of the five years in the period then ended. These financial statements and financial highlights are the responsibility of the Fund’s management. Our responsibility is to express an opinion on these financial statements and financial highlights based on our audits.
We conducted our audits in accordance with the standards of the Public Company Accounting Oversight Board (United States). Those standards require that we plan and perform the audit to obtain reasonable assurance about whether the financial statements and financial highlights are free of material misstatement. We were not engaged to perform an audit of the Fund’s internal control over financial reporting. Our audits included consideration of internal control over financial reporting as a basis for designing audit procedures that are appropriate in the circumstances, but not for the purpose of expressing an opinion on the effectiveness of the Fund’s internal control over financial reporting. Accordingly, we express no such opinion. An audit also includes examining, on a test basis, evidence supporting the amounts and disclosures in the financial statements and financial highlights, assessing the accounting principles used and significant estimates made by management, and evaluating the overall financial statement presentation. Our procedures included confirmation of securities owned as of October 31, 2015, by correspondence with the custodian and brokers. We believe that our audits provide a reasonable basis for our opinion.
In our opinion, the financial statements and financial highlights referred to above present fairly, in all material respects, the financial position of Guggenheim S&P 500® Equal Weight ETF (one of the series constituting the Rydex ETF Trust) at October 31, 2015, the results of its operations for the year then ended, the changes in its net assets for each of the two years in the period then ended, and its financial highlights for each of the five years in the period then ended, in conformity with U.S. generally accepted accounting principles.
McLean, Virginia
December 23, 2015
24 | GUGGENHEIM ETFs ANNUAL REPORT |
OTHER INFORMATION (Unaudited) |
Federal Income Tax Information
In January 2016, shareholders will be advised on IRS Form 1099 DIV or substitute 1099 DIV as to the federal tax status of the distributions received by shareholders in the calendar year 2015.
Of the ordinary income distributions paid during the year, 100% qualifies for the dividends received deduction for corporations.
Additionally, of the ordinary income distributions paid during the year, 100% qualifies for the lower income tax rate available to individuals under the Jobs and Growth Tax Relief Reconciliation Act of 2003.
Proxy Voting Information
A description of the policies and procedures that the Trust uses to determine how to vote proxies relating to securities held in the Funds’ portfolios is available, without charge and upon request, by calling 800.820.0888. This information is also available from the EDGAR database on the SEC’s website at http://www.sec.gov.
Information regarding how the Funds voted proxies relating to portfolio securities during the most recent 12-month period ended June 30 is available without charge, upon request, by calling 800.820.0888. This information is also available from the EDGAR database on the SEC’s website at http://www.sec.gov.
Sector Classification
Information in the “Schedule of Investments” is categorized by sectors using sector-level Classifications defined by the Bloomberg Industry Classification System, a widely recognized industry classification system provider. Each Fund’s registration statement has investment policies relating to concentration in specific sectors/industries. For purposes of these investment policies, the Funds usually classify sectors/industries based on industry-level Classifications used by widely recognized industry classification system providers such as Bloomberg Industry Classification System, Global Industry Classification Standards and Barclays Global Classification Scheme.
Quarterly Portfolio Schedules Information
The Trust files its complete schedule of portfolio holdings with the SEC for the first and third quarters of each fiscal year on Form N-Q; which are available on the SEC’s website at http://www.sec.gov. The Funds’ Forms N-Q may be reviewed and copied at the SEC’s Public Reference Room in Washington, DC, and that information on the operation of the Public Reference Room may be obtained by calling 800-SEC-0330. Copies of the portfolio holdings are also available to shareholders, without charge and upon request, by calling 800.820.0888.
Board Considerations in Approving the Continuation of the Investment Advisory Agreement
The Board, including the Independent Trustees, attended an in-person meeting held on May 18, 2015, called for the purpose of, among other things, the consideration of, and voting on, the approval and continuation of the investment advisory agreement (the “Investment Advisory Agreement”) between the Trust and the Advisor applicable to each series of the Trust except for the S&P 500® Equal Weight Real Estate ETF (each, a “Fund” and, collectively, the “Funds”). The Board unanimously approved the continuation of the Investment Advisory Agreement for an additional one-year period based on the Board’s review of qualitative and quantitative information provided by the Advisor. The Board had previously considered information pertaining to the renewal of the Investment Advisory Agreement at an in-person meeting held on April 28, 2015 (together, with the May 18 meeting, the “Meetings”).
Prior to reaching the conclusion to approve the continuation of the Investment Advisory Agreement, the Independent Trustees requested and obtained from the Advisor such information as the Independent Trustees deemed reasonably necessary to evaluate the Investment Advisory Agreement. In addition, the Board received a memorandum from fund counsel regarding the responsibilities of the Board with respect to the approval of investment advisory agreements and participated in question and answer sessions with representatives of the Advisor. The Trustees also carefully considered information that they had received throughout the year as part of their regular oversight of the Funds. At the Meetings, the Board obtained and reviewed a wide variety of information, including certain comparative information regarding the
GUGGENHEIM ETFs ANNUAL REPORT | 25 |
OTHER INFORMATION (Unaudited)(continued) |
Funds’ fees, expenses, and performance relative to the fees, expenses, and performance of other comparable funds (the “FUSE reports”). The Independent Trustees carefully evaluated this information, met in executive session outside the presence of fund management, and were advised by independent legal counsel with respect to their deliberations.
At the Meetings, the Board, including the Independent Trustees, evaluated a number of factors, including among others: (a) the nature, extent and quality of the Advisor’s investment advisory and other services; (b) the Advisor’s investment management personnel; (c) the Advisor’s operations and financial condition; (d) the Advisor’s brokerage practices (including any soft dollar arrangements) and the variety and complexity of its investment strategies; (e) a comparison of the Funds’ advisory fees to the advisory fees charged to comparable funds or accounts, giving special attention to the existence of economies of scale and the absence of breakpoints in these fees and the Advisor’s rationale for not providing for breakpoints at this point in time; (f) each Fund’s overall fees and operating expenses compared with those of similar funds; (g) the level of the Advisor’s profitability from its Fund-related operations; (h) the Advisor’s compliance processes and systems; (i) the Advisor’s compliance policies and procedures; (j) the Advisor’s reputation, expertise and resources in the financial markets; and (k) Fund performance compared with that of similar funds and/or appropriate benchmarks. In its deliberations, the Trustees did not identify any single piece of information that was all-important or controlling, noting that each Trustee could attribute different weights to the various factors considered.
Based on the Board’s deliberations at the Meetings, the Board, including all of the Independent Trustees, unanimously: (a) concluded that the terms of the Investment Advisory Agreement are fair and reasonable; (b) concluded that the Advisor’s fees are reasonable in light of the services that it provides to the Funds; and (c) agreed to approve and continue the Investment Advisory Agreement based upon the following considerations, among others:
● | Nature, Extent and Quality of Services Provided by the Advisor. The Board evaluated, among other things, the Advisor’s business, financial resources, quality and quantity of personnel, experience, past performance, the variety and complexity of its investment strategies, brokerage practices, and the adequacy of its compliance systems and processes. The Board reviewed the scope of services to be provided by the Advisor under the Investment Advisory Agreement and noted that there would be no significant differences between the scope of services required to be provided by the Advisor for the past year and the scope of services required to be provided during the upcoming year. The Board also considered the Advisor’s representations to the Board that the Advisor would continue to provide investment and related services that were of materially the same quality and quantity as services provided to the Funds in the past, and whether these services are appropriate in scope and extent in light of the Funds’ operations, the competitive landscape of the investment company business and investor needs. Based on the foregoing, the Trustees determined that the approval of the Investment Advisory Agreement would enable shareholders of the Funds to receive high quality services at a cost that was appropriate and reasonable. |
● | Fund Expenses and Performance of the Funds and the Advisor. The Board reviewed statistical information provided by the Advisor regarding the expense ratio components and performance of each Fund. The Advisor engaged FUSE Research Network LLC (“FUSE”), an independent, third party research provider, to prepare reports to help the Board compare the Funds’ fees, expenses, and total return performance with those of a peer group and peer universe of funds selected by FUSE. In the reports, each Fund’s expense ratio components, including actual advisory fees, waivers/reimbursements, and gross and net total expenses, are compared to those of other funds with shared key characteristics (e.g., asset size, fee structure, sector or industry investment focus) determined by FUSE to comprise a Fund’s applicable peer group. The Board also considered the Advisor’s representation that it found the peer groups compiled by FUSE to be appropriate. The statistical information related to the performance of each Fund included three month and one-, three-, and five-year performance for the Fund compared to that of its peers. Based on the foregoing, the Board determined that the proposed advisory fees paid by the Funds are reasonable in relation to the nature and quality of the services provided by the Advisor. |
● | Costs of Services Provided to the Funds and Profits Realized by the Advisor and its Affiliates. The Board reviewed information about the profitability of the Funds to the Advisor based on the advisory fees payable under the current Investment Advisory Agreement for the last calendar year. The Board noted that the Advisor had contractually agreed to pay all operating expenses of the Funds, including the cost of index licensing fees, transfer agency, custody, fund administration, legal, audit and other services, except interest, taxes, brokerage commissions and other expenses connected with the execution of portfolio transactions, distribution fees, and extraordinary |
26 | GUGGENHEIM ETFs ANNUAL REPORT |
OTHER INFORMATION (Unaudited)(concluded) |
expenses. The Board also analyzed the Funds’ expenses, including the investment advisory fees paid to the Advisor, and reviewed the FUSE reports. The Board also reviewed information regarding the direct revenue received by the Advisor and ancillary revenue, if any, received by the Advisor and/or its affiliates in connection with the services provided to the Funds by the Advisor and/or its affiliates. The Board considered information regarding the Advisor’s profit margin as reflected in the Advisor’s profitability analysis, as well as information provided by the Advisor concerning the methodology used to allocate various expenses among the individual Funds in determining the Advisor’s profitability. Based on the foregoing, the Board determined that the profit to the Advisor on the fees paid by the Funds is not excessive in view of the nature and quality of the services provided by the Advisor.
● | Economies of Scale. The Board considered the absence of breakpoints in the Advisor’s fee schedule and reviewed information regarding the extent to which economies of scale or other efficiencies may result from increases in the Funds’ asset levels. The Board noted that the Investment Advisory Agreement did not provide for breakpoints in each Fund’s advisory fee rates as assets of a Fund increase. However, the Board further noted the Advisor’s assertion that future economies of scale had been taken into consideration by fixing relatively low advisory fees for the Funds, effectively sharing the benefits of lower fees with the Funds from inception. The Board noted that it intends to continue to monitor fees as each Fund grows in size and assess whether fee breakpoints may be warranted. |
● | Other Benefits to the Advisor and/or its Affiliates. In addition to evaluating the Advisor’s services, the Board considered the nature and amount of other benefits to be received by the Advisor and its affiliates as a result of their relationship with the Fund, including any soft dollar usage by the Advisor and any intangible benefits. In particular, the Board considered the nature, extent, quality, and cost of certain distribution services performed by the Advisor’s affiliate under the distribution agreement and the Distribution Plan pursuant to Rule 12b-1 of the 1940 Act. In light of the costs of providing services pursuant to the separate agreements as well as the Advisor’s and its affiliates’ commitment to the Funds, the Board concluded the ancillary benefits the Advisor and its affiliates received were reasonable. |
On the basis of the information provided to it and its evaluation of that information, the Board, including the Independent Trustees, concluded that the terms of the Investment Advisory Agreement were reasonable, and that approval of the continuation of the Investment Advisory Agreement was in the best interests of the Funds and their shareholders.
GUGGENHEIM ETFs ANNUAL REPORT | 27 |
INFORMATION ON BOARD OF TRUSTEES AND OFFICERS (Unaudited) |
A Board of Trustees oversees the Trust, as well as other trusts of GI, in which its members have no stated term of service, and continue to serve after election until resignation. The Statement of Additional Information includes further information about Fund Trustees and Officers, and can be obtained without charge by visiting guggenheiminvestments.com or by calling 800.820.0888.
Name, Address* | Position(s) Held with the | Principal Occupation(s) | Number of | Other Directorships Held by Trustee |
INTERESTED TRUSTEE | ||||
Donald C. Cacciapaglia** (1951) | Trustee from 2012 to present. | Current: President and CEO, certain other funds in the Fund Complex (2012-present); Vice Chairman, Guggenheim Investments (2010-present).
Former: Chairman and CEO, Channel Capital Group, Inc. (2002-2010). | 224 | Clear Spring Life Insurance Company (2015-present); Guggenheim Partners Japan, Ltd. (2014-present); Delaware Life (2013-present); Guggenheim Life and Annuity Company (2011-present); Paragon Life Insurance Company of Indiana (2011-present). |
INDEPENDENT TRUSTEES | ||||
Corey A. Colehour (1945) | Trustee and Member of the Audit Committee from 2003 to present; Member of the Governance and Nominating Committees from 2005 to present; and Member of the Investment and Performance Committee from 2014 to present. | Retired. | 133 | None. |
J. Kenneth Dalton (1941) | Trustee from 2003 to present; Chairman and Member of the Audit Committee from 2003 to present; Member of the Governance and Nominating Committees from 2005 to present; and Member of the Complinace and Risk Oversight Committee from 2010 to present. | Retired. | 133 | Epiphany Funds (4) (2009-present). |
John O. Demaret (1940) | Vice Chairman of the Board of Trustees from 2014 to present; Trustee and Member of the Audit Committee from 2003 to present; Chairman of the Board from 2006 to 2014; Member of the Compliance and Risk Oversight Committee from 2010 to present; Chairman and Member of the Investment and Performance Committee from 2014 to present; and Member of the Nominating Committee from 2014 to present. | Retired. | 133 | None. |
28 | GUGGENHEIM ETFs ANNUAL REPORT |
INFORMATION ON BOARD OF TRUSTEES AND OFFICERS (Unaudited)(continued) |
Name, Address* | Position(s) Held with the | Principal Occupation(s) | Number of | Other |
INDEPENDENT TRUSTEES - concluded | ||||
Werner E. Keller (1940) | Chairman of the Board from 2014 to present; Trustee and Member of the Audit, Governance and Nominating Committees from 2005 to present; Chairman and Member of the Compliance and Risk Oversight Committee from 2010 to present; and Member of the Investment and Performance Committee from 2014 to present. | Current: Founder and President, Keller Partners, LLC (investment research firm) (2005-present). | 133 | None. |
Thomas F. Lydon, Jr. (1960) | Trustee and Member of the Audit, Governance and Nominating Committees from 2005 to present. | Current: President, Global Trends Investments (registered investment adviser) (1996-present). | 133 | US Global Investors (GROW) (1995-present). |
Patrick T. McCarville (1942) | Trustee and Member of the Audit Committee from 2003 to present; Chairman and Member of the Governance and Nominating Committees from 2005 to present. | Retired. Former: Chief Executive Officer, Par Industries, Inc., d/b/a Par Leasing (1977-2010). | 133 | None. |
Name, Address* | Position(s) Held with the | Principal Occupation(s) |
OFFICERS | ||
Donald C. Cacciapaglia (1951) | President (2012-present). | Current: President and CEO, certain other funds in the Fund Complex (2012-present); Vice Chairman, Guggenheim Investments (2010-present).
Former: Chairman and CEO, Channel Capital Group Inc. (2002-2010). |
Michael P. Byrum (1970) | Vice President (1999-present). | Current: Senior Vice President, Security Investors, LLC (2010-present); President and Chief Investment Officer, Rydex Holdings, LLC (2008-present); Director and Chairman, Advisory Research Center, Inc. (2006-present); Manager, Guggenheim Specialized Products, LLC (2005-present).
Former: Vice President, Guggenheim Distributors, LLC (2009); Director (2009-2010) and Secretary (2002-2010), Rydex Fund Services, LLC; Director (2008-2010), Chief Investment Officer (2006-2010), President (2004-2010) and Secretary (2002-2010), Rydex Advisors, LLC; Director (2008-2010), Chief Investment Officer (2006-2010), President (2004-2010) and Secretary (2002-2010), Rydex Advisors II, LLC. |
GUGGENHEIM ETFs ANNUAL REPORT | 29 |
INFORMATION ON BOARD OF TRUSTEES AND OFFICERS (Unaudited)(concluded) |
Name, Address* | Position(s) Held with the | Principal Occupation(s) |
OFFICERS - concluded | ||
Nikolaos Bonos (1963) | Vice President and Treasurer (2003-present). | Current: Senior Vice President, Security Investors, LLC (2010-present); Chief Executive Officer, Guggenheim Specialized Products, LLC (2009-present); Chief Executive Officer & President, Rydex Fund Services, LLC (2009-present); Vice President, Rydex Holdings, LLC (2008-present).
Former: Senior Vice President, Security Global Investors, LLC (2010-2011); and Senior Vice President, Rydex Advisors, LLC and Rydex Advisors II, LLC (2006-2011). |
Elisabeth Miller (1968) | Chief Compliance Officer (2012-present). | Current: CCO, certain other funds in the Fund Complex (2012-present); CCO, Security Investors, LLC (2012-present); CCO, Guggenheim Funds Investment Advisors, LLC (2012-present); Managing Director, Guggenheim Investments (2012-present); Vice President, Guggenheim Funds Distributors, LLC (March 2014-present).
Former: CCO, Guggenheim Distributors, LLC (2009-March 2014); Senior Manager, Security Investors, LLC (2004-2009); Senior Manager, Guggenheim Distributors, LLC (2004-2009). |
Joseph M. Arruda (1966) | Assistant Treasurer (2006-present). | Current: Assistant Treasurer, certain other funds in the Fund Complex (2006-present); Vice President, Security Investors, LLC (2010-present); CFO and Manager, Guggenheim Specialized Products, LLC (2009-present).
Former: Vice President, Security Global Investors, LLC (2010-2011); Vice President, Rydex Advisors, LLC (2010); Vice President, Rydex Advisors II, LLC (2010). |
Paul J. Davio (1972) | Assistant Treasurer (2014-present). | Current: Assistant Treasurer, certain other funds in the Fund Complex (2014-present); Director, Guggenheim Investments (2006-present).
Former: Manager, Mutual Fund Administration, Guggenheim Investments (2003-2006). |
Amy J. Lee (1961) | Vice President (2009-present) and Secretary (2012-present). | Current: Chief Legal Officer, certain other funds in the Fund Complex (2013-present); Senior Managing Director, Guggenheim Investments (2012-present).
Former: Vice President, Associate General Counsel and Assistant Secretary, Security Benefit Life Insurance Company and Security Benefit Corporation (2004-2012). |
* | All Trustees and Officers may be reached c/o Guggenheim Investments, 805 King Farm Boulevard, Suite 600, Rockville, MD 20850. |
** | Mr. Cacciapaglia is an “interested” person of the Trust, as that term is defined in the 1940 Act by virtue of his affiliation with the Adviser’s parent company. |
*** | The “Fund Complex” includes all closed-end and open-end funds (including all of their portfolios) advised by the Adviser and any funds that have an investment adviser or servicing agent that is an affiliated person of the Adviser. Information provided is as of the date of this report. |
30 | GUGGENHEIM ETFs ANNUAL REPORT |
GUGGENHEIM INVESTMENTS PRIVACY POLICIES (Unaudited) |
Rydex Funds, Guggenheim Funds, Rydex Investments, Guggenheim Funds Distributors, LLC, Security Investors, LLC, Security Distributors, Inc., Guggenheim Partners Investment Managers, LLC, and Rydex Advisory Services (Collectively “Guggenheim Investments”).
Our Commitment to You
When you become a Guggenheim Investments investor, you entrust us with not only your hard-earned money but also with personal and financial information about you. We recognize that your relationship with us is based on trust and that you expect us to act responsibly and in your best interests. Because we have access to this private information about you, we hold ourselves to the highest standards in its safekeeping and use. This means, most importantly, that we do not sell client information to anyone—whether it is your personal information or if you are a current or former Guggenheim Investments client.
The Information We Collect About You
In the course of doing business with shareholders and investors, we collect nonpublic personal information about you. You typically provide personal information when you complete a Guggenheim Investments account application or when you request a transaction that involves Rydex and Guggenheim Investments funds or one of the Guggenheim Investments affiliated companies. “Nonpublic personal information” is personally identifiable private information about you. For example, it includes information regarding your name and address, Social Security or taxpayer identification number, assets, income, account balance, bank account information and investment activity (e.g., purchase and redemption history).
How We Handle Your Personal Information
As emphasized above, we do not sell information about current or former clients or their accounts to third parties. Nor do we share such information, except when necessary to complete transactions at your request or to make you aware of related investment products and services that we offer. Additional details about how we handle your personal information are provided below. To complete certain transactions or account changes that you direct, it may be necessary to provide identifying information to companies, individuals or groups that are not affiliated with Guggenheim Investments. For example, if you ask to transfer assets from another financial institution to Guggenheim Investments, we will need to provide certain information about you to that company to complete the transaction. To alert you to other Guggenheim Investments investment products and services, we may share your information within the Guggenheim Investments family of affiliated companies. This would include, for example, sharing your information within Guggenheim Investments so we can make you aware of new Rydex and Guggenheim Investments funds or the services offered through another Guggenheim Investments affiliated company. In certain instances, we may contract with nonaffiliated companies to perform services for us. Where necessary, we will disclose information we have about you to these third parties. In all such cases, we provide the third party with only the information necessary to carry out its assigned responsibilities and only for that purpose. And we require these third parties to treat your private information with the same high degree of confidentiality that we do. In certain instances, we may share information with other financial institutions regarding individuals and entities in response to the U.S.A. Patriot Act. Finally, we will release information about you if you direct us to do so, if we are compelled by law to do so or in other circumstances permitted by law.
Opt Out Provisions
We do not sell your personal information to anyone. The law allows you to “opt out” of only certain kinds of information sharing with third parties. The firm does not share personal information about you with any third parties that triggers this opt-out right. This means YOU ARE ALREADY OPTED OUT.
GUGGENHEIM ETFs ANNUAL REPORT | 31 |
GUGGENHEIM INVESTMENTS PRIVACY POLICIES (Unaudited)(concluded) |
How We Protect Privacy Online
Our concern for the privacy of our shareholders also extends to those who use our web site, guggenheiminvestments.com. Our web site uses some of the most secure forms of online communication available, including encryption technology, Secure Socket Layer (SSL) protocol, firewalls and user names and passwords. These technologies provide a high level of security and privacy when you access your account information or initiate online transactions. The Guggenheim Investments web site offers customized features that require our use of “http cookies”—tiny pieces of information that we ask your browser to store. However, we make very limited use of these cookies. We only use cookies for session management and security features on the Guggenheim Investments web site. We do not use them to pull data from your hard drive, to learn your email address, or to view data in cookies created by other web sites. We will not share the information in our cookies or give others access to it. See the legal information area on our web site for more details about web site security and privacy features.
How We Safeguard Your Personal Information
We restrict access to nonpublic personal information about shareholders to our employees and in some cases to third parties (for example, the service providers described above) as permitted by law. We maintain strict physical, electronic and procedural safeguards that comply with federal standards to guard your nonpublic personal information.
We’ll Keep You Informed
As required by federal law, we will notify shareholders of our privacy policy annually. We reserve the right to modify this policy at any time, but rest assured that if we do change it, we will tell you promptly. You will also be able to access our privacy policy from our web site at guggenheiminvestments.com. Should you have any questions regarding our privacy policy, contact us at 800.820.0888 or 301.296.5100.
32 | GUGGENHEIM ETFs ANNUAL REPORT |
This page intentionally left blank.
This page intentionally left blank.
This page intentionally left blank.
This page intentionally left blank.
This page intentionally left blank.
| (Registrant) | Rydex ETF Trust | ||
By (Signature and Title)* | /s/ Donald C. Cacciapaglia | ||
| Donald C. Cacciapaglia, President and Chief Executive Officer | |||
| Date | January 8, 2016 | ||
By (Signature and Title)* | /s/ Donald C. Cacciapaglia | ||
| Donald C. Cacciapaglia, President and Chief Executive Officer | |||
| Date | January 8, 2016 | ||
By (Signature and Title)* | /s/ Nikolaos Bonos | ||
| Nikolaos Bonos, Vice President and Treasurer | |||
| Date | January 8, 2016 | ||
* | Print the name and title of each signing officer under his or her signature. |