| | OMB APPROVAL |
| | OMB Number: 3235-0570 Expires: August 31, 2011 Estimated average burden hours per response: 18.9 |
UNITED STATES
SECURITIES AND EXCHANGE COMMISSION
Washington, D.C. 20549
FORM N-CSR
CERTIFIED SHAREHOLDER REPORT OF REGISTERED MANAGEMENT INVESTMENT COMPANIES
Investment Company Act file number __811-21360
CM Advisers Family of Funds
(Exact name of registrant as specified in charter)
| 805 Las Cimas Parkway, Suite 430 Austin, Texas | 78746 |
| (Address of principal executive offices) | (Zip code) |
John F. Splain, Esq.
Ultimus Fund Solutions, LCC 225 Pictoria Drive, Suite 450 Cincinnati, Ohio 45246
(Name and address of agent for service)
Registrant's telephone number, including area code: (512) 329-0050
Date of fiscal year end: February 28, 2010
Date of reporting period: August 31, 2009
Form N-CSR is to be used by management investment companies to file reports with the Commission not later than 10 days after the transmission to stockholders of any report that is required to be transmitted to stockholders under Rule 30e-1 under the Investment Company Act of 1940 (17 CFR 270.30e-1). The Commission may use the information provided on Form N-CSR in its regulatory, disclosure review, inspection, and policymaking roles.
A registrant is required to disclose the information specified by Form N-CSR, and the Commission will make this information public. A registrant is not required to respond to the collection of information contained in Form N-CSR unless the Form displays a currently valid Office of Management and Budget ("OMB") control number. Please direct comments concerning the accuracy of the information collection burden estimate and any suggestions for reducing the burden to Secretary, Securities and Exchange Commission, 450 Fifth Street, NW, Washington, DC 20549-0609. The OMB has reviewed this collection of information under the clearance requirements of 44 U.S.C. § 3507.
Item 1. Reports to Stockholders.
CM Advisers Family of Funds
Semi-Annual Report 2009
CM Advisers Fund
CM Advisers Fixed Income Fund
August 31, 2009
(Unaudited)
This report and the financial statements contained herein are submitted for the general information of the shareholders of the CM Advisers Family of Funds (the “Funds”). This report is not authorized for distribution to prospective investors in the Funds unless preceded or accompanied by an effective prospectus. Mutual fund shares are not deposits or obligations of, or guaranteed by, any depository institution. Shares are not insured by the FDIC, Federal Reserve Board or any other agency, and are subject to investment risks, including possible loss of principal amount invested.
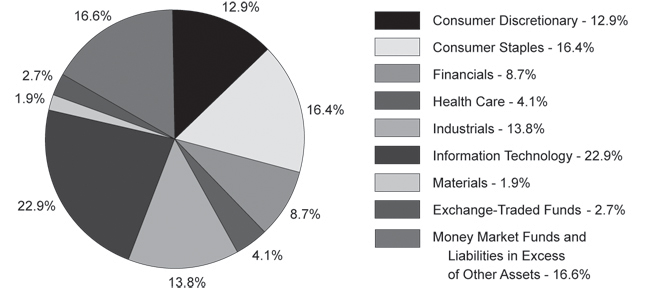
CM Advisers Fund
Supplementary Portfolio Information
August 31, 2009 (Unaudited)
Asset and Sector Allocation
Top 10 Equity Holdings
Security Description | % of Net Assets |
| Microsoft Corporation | 7.2% |
| Wal-Mart Stores, Inc. | 4.5% |
| UnitedHealth Group, Inc. | 4.1% |
| Coca-Cola Company (The) | 4.0% |
| Dell, Inc. | 3.7% |
| Colgate-Palmolive Company | 3.7% |
| Marsh & McLennan Companies, Inc. | 3.2% |
| Masco Corporation | 3.1% |
| Walgreen Company | 3.1% |
| Applied Materials, Inc. | 3.0% |
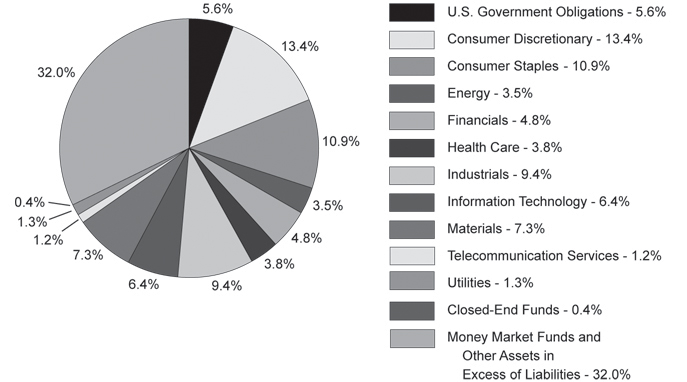
CM Advisers Fixed Income Fund
Supplementary Portfolio Information
August 31, 2009 (Unaudited)
Asset and Sector Allocation
Top 10 Long-Term Holdings
Security Description | % of Net Assets |
| U.S. Treasury Bonds, 4.50%, due 05/15/38 | 2.6% |
| American Express Company, 7.00%, due 03/19/18 | 2.6% |
| UnitedHealth Group, Inc., 6.00%, due 02/15/18 | 2.5% |
| Estee Lauder Companies, Inc. (The), 6.00%, due 05/15/37 | 2.1% |
| Kraft Foods, Inc., 6.125%, due 02/01/18 | 2.0% |
| Coca-Cola Company (The), 5.35%, due 11/15/17 | 2.0% |
| Western Union Company (The), 5.93%, due 10/01/16 | 2.0% |
| Home Depot, Inc. (The), 5.40%, due 03/01/16 | 1.9% |
| Wal-Mart Stores, Inc., 6.50%, due 08/15/37 | 1.8% |
| U.S. Treasury Bonds, 5.00%, due 05/15/37 | 1.7% |
CM Advisers Fund
Schedule of Investments
August 31, 2009 (Unaudited)
| COMMON STOCKS — 80.7% | | Shares | | | Value | |
| Consumer Discretionary — 12.9% | | | | | | |
| Diversified Consumer Services — 2.6% | | | | | | |
| CPI Corporation | | | 215,050 | | | $ | 3,888,104 | |
| | | | | | | | | |
| Household Durables — 3.4% | | | | | | | | |
| Ethan Allen Interiors, Inc. | | | 81,785 | | | | 1,270,939 | |
| MDC Holdings, Inc. | | | 21,775 | | | | 815,692 | |
| Toll Brothers, Inc. * | | | 130,775 | | | | 2,973,823 | |
| | | | | | | | 5,060,454 | |
| | | | | | | | | |
| Leisure Equipment & Products — 0.5% | | | | | | | | |
| Arctic Cat, Inc.* | | | 101,565 | | | | 725,174 | |
| Eastman Kodak Company* | | | 7,930 | | | | 42,188 | |
| | | | | | | | 767,362 | |
| | | | | | | | | |
| Media — 4.4% | | | | | | | | |
| Comcast Corporation - Class A Special | | | 12,900 | | | | 188,211 | |
| News Corporation - Class A | | | 226,200 | | | | 2,424,864 | |
| Walt Disney Company (The) | | | 146,375 | | | | 3,811,605 | |
| | | | | | | | 6,424,680 | |
| | | | | | | | | |
| Multi-Line Retail — 0.6% | | | | | | | | |
| J. C. Penney Company, Inc. | | | 29,435 | | | | 884,227 | |
| | | | | | | | | |
| Specialty Retail — 1.4% | | | | | | | | |
| Cost Plus, Inc. * | | | 252,052 | | | | 496,542 | |
| Pacific Sunwear of California, Inc. * | | | 349,000 | | | | 1,542,580 | |
| | | | | | | | 2,039,122 | |
| | | | | | | | | |
| Consumer Staples — 16.4% | | | | | | | | |
| Beverages — 4.0% | | | | | | | | |
| Coca-Cola Company (The) | | | 121,520 | | | | 5,926,530 | |
| | | | | | | | | |
| Food & Staples Retailing — 7.6% | | | | | | | | |
| Walgreen Company | | | 134,820 | | | | 4,567,701 | |
| Wal-Mart Stores, Inc. | | | 131,825 | | | | 6,705,938 | |
| | | | | | | | 11,273,639 | |
| | | | | | | | | |
| Food Products — 0.7% | | | | | | | | |
| General Mills, Inc. | | | 17,240 | | | | 1,029,745 | |
| | | | | | | | | |
| Household Products — 4.1% | | | | | | | | |
| Colgate-Palmolive Company | | | 74,875 | | | | 5,443,413 | |
| Procter & Gamble Company (The) | | | 12,900 | | | | 698,019 | |
| | | | | | | | 6,141,432 | |
| | | | | | | | | |
| Financials — 8.7% | | | | | | | | |
| Commercial Banks — 2.6% | | | | | | | | |
| Wells Fargo & Company | | | 140,817 | | | | 3,875,284 | |
| | | | | | | | | |
| Consumer Finance — 2.9% | | | | | | | | |
| American Express Company | | | 124,470 | | | | 4,209,575 | |
CM Advisers Fund
Schedule of Investments (Continued)
| COMMON STOCKS — 80.7% (Continued) | | Shares | | | Value | |
| Financials — 8.7% (Continued) | | | | | | |
| Insurance — 3.2% | | | | | | |
| Marsh & McLennan Companies, Inc. | | | 202,142 | | | $ | 4,758,423 | |
| | | | | | | | | |
| Health Care — 4.1% | | | | | | | | |
| Health Care Providers & Services — 4.1% | | | | | | | | |
| UnitedHealth Group, Inc. | | | 217,465 | | | | 6,089,020 | |
| | | | | | | | | |
| Industrials — 13.8% | | | | | | | | |
| Air Freight & Logistics — 1.4% | | | | | | | | |
| FedEx Corporation | | | 15,235 | | | | 1,046,797 | |
| United Parcel Service, Inc. - Class B | | | 20,380 | | | | 1,089,515 | |
| | | | | | | | 2,136,312 | |
| | | | | | | | | |
| Building Products — 3.1% | | | | | | | | |
| Masco Corporation | | | 317,475 | | | | 4,597,038 | |
| | | | | | | | | |
| Commercial Services & Supplies — 3.0% | | | | | | | | |
| Avery Dennison Corporation | | | 115,349 | | | | 3,564,284 | |
| Cintas Corporation | | | 29,625 | | | | 812,910 | |
| | | | | | | | 4,377,194 | |
| | | | | | | | | |
| Electrical Equipment — 0.9% | | | | | | | | |
| Emerson Electric Company | | | 37,915 | | | | 1,397,926 | |
| | | | | | | | | |
| Industrial Conglomerates — 4.2% | | | | | | | | |
| 3M Company | | | 58,940 | | | | 4,249,574 | |
| General Electric Company | | | 142,495 | | | | 1,980,681 | |
| | | | | | | | 6,230,255 | |
| | | | | | | | | |
| Professional Services — 0.5% | | | | | | | | |
| CDI Corporation | | | 40,764 | | | | 619,205 | |
| LECG Corporation * | | | 23,900 | | | | 80,304 | |
| | | | | | | | 699,509 | |
| | | | | | | | | |
| Road & Rail — 0.2% | | | | | | | | |
| YRC Worldwide, Inc. * | | | 105,930 | | | | 236,224 | |
| | | | | | | | | |
| Trading Companies & Distributors — 0.5% | | | | | | | | |
| Lawson Products, Inc. | | | 45,090 | | | | 815,227 | |
| | | | | | | | | |
| Information Technology — 22.9% | | | | | | | | |
| Computers & Peripherals — 4.9% | | | | | | | | |
| Dell, Inc. * | | | 349,375 | | | | 5,530,606 | |
| Hutchinson Technology, Inc. * | | | 286,600 | | | | 1,705,270 | |
| | | | | | | | 7,235,876 | |
| | | | | | | | | |
| Electronic Equipment, Instruments | | | | | | | | |
| & Components — 1.8% | | | | | | | | |
| Maxwell Technologies, Inc. * | | | 97,365 | | | | 1,317,349 | |
| Newport Corporation * | | | 186,700 | | | | 1,323,703 | |
| | | | | | | | 2,641,052 | |
CM Advisers Fund
Schedule of Investments (Continued)
| COMMON STOCKS — 80.7% (Continued) | | Shares | | | Value | |
| Information Technology — 22.9% (Continued) | | | | | | |
| IT Services — 2.7% | | | | | | |
| Automatic Data Processing, Inc. | | | 66,450 | | | $ | 2,548,357 | |
| Paychex, Inc. | | | 51,010 | | | | 1,443,073 | |
| | | | | | | | 3,991,430 | |
| | | | | | | | | |
| Semiconductors & Semiconductor Equipment — 6.3% | | | | | | | | |
| Applied Materials, Inc. | | | 332,405 | | | | 4,381,098 | |
| Cohu, Inc. | | | 700 | | | | 8,288 | |
| Intel Corporation | | | 200,000 | | | | 4,064,000 | |
| MEMC Electronic Materials, Inc. * | | | 1,000 | | | | 15,950 | |
| Texas Instruments, Inc. | | | 36,000 | | | | 885,240 | |
| | | | | | | | 9,354,576 | |
| | | | | | | | | |
| Software — 7.2% | | | | | | | | |
| Microsoft Corporation | | | 435,995 | | | | 10,747,277 | |
| | | | | | | | | |
| Materials — 1.9% | | | | | | | | |
| Chemicals — 1.9% | | | | | | | | |
| E.I. du Pont de Nemours and Company | | | 86,610 | | | | 2,765,457 | |
| | | | | | | | | |
Total Common Stocks (Cost $134,313,594) | | | | | | $ | 119,592,950 | |
| EXCHANGE-TRADED FUNDS — 2.7% | | Shares | | | Value | |
| Financial Select Sector SPDR Fund (The) | | | | | | |
| (Cost $7,077,118) | | | 270,995 | | | $ | 3,983,627 | |
| MONEY MARKET FUNDS — 17.1% | | Shares | | | Value | |
| Evergreen Institutional Treasury Money Market Fund – | | | | | | |
Institutional Class, 0.02% (a) (Cost $25,324,755) | | | 25,324,755 | | | $ | 25,324,755 | |
| | | | | | | | | |
| Total Investments at Value — 100.5% | | | | | | | | |
| (Cost $166,715,467) | | | | | | $ | 148,901,332 | |
| | | | | | | | | |
| Liabilities in Excess of Other Assets — (0.5%) | | | | | | | (696,533 | ) |
| | | | | | | | | |
| Total Net Assets — 100.0% | | | | | | $ | 148,204,799 | |
| * | Non-income producing security. |
| (a) | Variable rate security. The rate shown is the 7-day effective yield as of August 31, 2009. |
See accompanying notes to financial statements.
CM Advisers Fixed Income Fund
Schedule of Investments
August 31, 2009 (Unaudited)
| CORPORATE BONDS — 62.0% | | Par Value | | | Value | |
| Consumer Discretionary — 13.4% | | | | | | |
| Auto Components — 1.2% | | | | | | |
| Johnson Controls, Inc., 5.50%, due 01/15/16 | | | $ 400,000 | | | $ | 406,118 | |
| | | | | | | | | |
| Hotels, Restaurants & Leisure — 2.1% | | | | | | | | |
| Marriott International, Inc., 6.375%, due 06/15/17 | | | 400,000 | | | | 385,677 | |
| Starbucks Corporation, 6.25%, due 08/15/17 | | | 300,000 | | | | 310,682 | |
| | | | | | | | 696,359 | |
| | | | | | | | | |
| Household Durables — 1.0% | | | | | | | | |
| Newell Rubbermaid, Inc., 6.25%, due 04/15/18 | | | 185,000 | | | | 176,204 | |
| Toll Brothers, Inc., 5.15%, due 05/15/15 | | | 150,000 | | | | 137,025 | |
| | | | | | | | 313,229 | |
| | | | | | | | | |
| Media — 3.3% | | | | | | | | |
| Comcast Corporation, | | | | | | | | |
| 6.30%, due 11/15/17 | | | 200,000 | | | | 218,266 | |
| 5.70%, due 05/15/18 | | | 400,000 | | | | 422,385 | |
| Gannett Company, Inc., 6.375%, due 04/01/12 | | | 300,000 | | | | 251,386 | |
| McGraw-Hill Companies, Inc. (The), 5.90%, due 11/15/17 | | | 200,000 | | | | 202,584 | |
| | | | | | | | 1,094,621 | |
| | | | | | | | | |
| Multi-Line Retail — 1.9% | | | | | | | | |
| Kohl’s Corporation, | | | | | | | | |
| 6.25%, due 12/15/17 | | | 500,000 | | | | 533,189 | |
| 6.00%, due 01/15/33 | | | 100,000 | | | | 97,180 | |
| | | | | | | | 630,369 | |
| | | | | | | | | |
| Specialty Retail — 3.9% | | | | | | | | |
| Home Depot, Inc. (The), 5.40%, due 03/01/16 | | | 600,000 | | | | 620,731 | |
| Staples, Inc., | | | | | | | | |
| 7.75%, due 04/01/11 | | | 500,000 | | | | 531,320 | |
| 9.75%, due 01/15/14 | | | 100,000 | | | | 117,389 | |
| | | | | | | | 1,269,440 | |
| | | | | | | | | |
| Consumer Staples — 10.9% | | | | | | | | |
| Beverages — 2.9% | | | | | | | | |
| Coca-Cola Company (The), 5.35%, due 11/15/17 | | | 600,000 | | | | 651,745 | |
| PepsiCo, Inc., 5.00%, due 06/01/18 | | | 300,000 | | | | 315,543 | |
| | | | | | | | 967,288 | |
| | | | | | | | | |
| Food & Staples Retailing — 1.8% | | | | | | | | |
| Wal-Mart Stores, Inc., 6.50%, due 08/15/37 | | | 500,000 | | | | 576,466 | |
| | | | | | | | | |
| Food Products — 2.0% | | | | | | | | |
| Kraft Foods, Inc., 6.125%, due 02/01/18 | | | 600,000 | | | | 656,628 | |
| | | | | | | | | |
| Household Products — 2.1% | | | | | | | | |
| Church & Dwight Company, Inc., 6.00%, due 12/15/12 | | | 300,000 | | | | 303,750 | |
| Clorox Company (The), 5.45%, due 10/15/12 | | | 370,000 | | | | 396,374 | |
| | | | | | | | 700,124 | |
CM Advisers Fixed Income Fund
Schedule of Investments (Continued)
| CORPORATE BONDS — 62.0% (Continued) | | Par Value | | | Value | |
| Consumer Staples — 10.9% (Continued) | | | | | | |
| Personal Products — 2.1% | | | | | | |
Estée Lauder Companies, Inc. (The), 6.00%, | | | | | | |
| due 05/15/37 | | | $ 700,000 | | | $ | 692,467 | |
| | | | | | | | | |
| Energy — 3.5% | | | | | | | | |
| Energy Equipment & Services — 2.2% | | | | | | | | |
| Transocean, Inc., 6.00%, due 03/15/18 | | | 200,000 | | | | 213,022 | |
| Weatherford International Ltd., | | | | | | | | |
| 6.35%, due 06/15/17 | | | 200,000 | | | | 208,766 | |
| 6.00%, due 03/15/18 | | | 300,000 | | | | 306,007 | |
| | | | | | | | 727,795 | |
| | | | | | | | | |
| Oil, Gas & Consumable Fuels — 1.3% | | | | | | | | |
| Valero Energy Corporation, 6.125%, due 06/15/17 | | | 400,000 | | | | 399,294 | |
| | | | | | | | | |
| Financials — 4.8% | | | | | | | | |
| Commercial Banks — 1.6% | | | | | | | | |
| Wells Fargo & Company, 5.625%, due 12/11/17 | | | 500,000 | | | | 523,886 | |
| | | | | | | | | |
| Consumer Finance — 3.2% | | | | | | | | |
| American Express Company, | | | | | | | | |
| 7.00%, due 03/19/18 | | | 800,000 | | | | 839,365 | |
| 8.125%, due 05/20/19 | | | 200,000 | | | | 223,826 | |
| | | | | | | | 1,063,191 | |
| | | | | | | | | |
| Health Care — 3.8% | | | | | | | | |
| Health Care Providers & Services — 2.5% | | | | | | | | |
| UnitedHealth Group, Inc., 6.00%, due 02/15/18 | | | 800,000 | | | | 813,208 | |
| | | | | | | | | |
| Pharmaceuticals — 1.3% | | | | | | | | |
| Johnson & Johnson, 5.15%, due 07/15/18 | | | 400,000 | | | | 434,035 | |
| | | | | | | | | |
| Industrials — 9.4% | | | | | | | | |
| Aerospace & Defense — 0.7% | | | | | | | | |
| United Technologies Corporation, 5.375%, due 12/15/17 | | | 200,000 | | | | 217,786 | |
| | | | | | | | | |
| Building Products — 1.7% | | | | | | | | |
| Masco Corporation, | | | | | | | | |
| 5.85%, due 03/15/17 | | | 400,000 | | | | 353,985 | |
| 7.75%, due 08/01/29 | | | 240,000 | | | | 198,344 | |
| | | | | | | | 552,329 | |
| | | | | | | | | |
| Commercial Services & Supplies — 2.4% | | | | | | | | |
| Pitney Bowes, Inc., 5.75%, due 09/15/17 | | | 200,000 | | | | 213,224 | |
| R.R. Donnelley & Sons Company, | | | | | | | | |
| 6.125%, due 01/15/17 | | | 400,000 | | | | 371,251 | |
| 11.25%, due 02/01/19 | | | 200,000 | | | | 223,406 | |
| | | | | | | | 807,881 | |
| | | | | | | | | |
| Electrical Equipment — 1.3% | | | | | | | | |
| Emerson Electric Company, 5.25%, due 10/15/18 | | | 400,000 | | | | 431,836 | |
CM Advisers Fixed Income Fund
Schedule of Investments (Continued)
| CORPORATE BONDS — 62.0% (Continued) | | Par Value | | | Value | |
| Industrials — 9.4% (Continued) | | | | | | |
| Machinery — 0.4% | | | | | | |
| Dover Corporation, 5.45%, due 03/15/18 | | | $ 115,000 | | | $ | 122,669 | |
| | | | | | | | | |
| Professional Services — 0.6% | | | | | | | | |
| Dun & Bradstreet Corporation (The), 6.00%, | | | | | | | | |
| due 04/01/13 | | | 200,000 | | | | 206,310 | |
| | | | | | | | | |
| Road & Rail — 2.3% | | | | | | | | |
| CSX Corporation, 6.25%, due 03/15/18 | | | 500,000 | | | | 539,372 | |
| Union Pacific Corporation, 5.70%, due 08/15/18 | | | 200,000 | | | | 213,623 | |
| | | | | | | | 752,995 | |
| | | | | | | | | |
| Information Technology — 6.4% | | | | | | | | |
| Computers & Peripherals — 2.8% | | | | | | | | |
| Dell, Inc., 5.65%, due 04/15/18 | | | 400,000 | | | | 415,161 | |
| International Business Machines Corporation, 7.625%, | | | | | | | | |
| due 10/15/18 | | | 250,000 | | | | 306,827 | |
| Seagate Technology HDD Holdings, 6.375%, | | | | | | | | |
| due 10/01/11 | | | 200,000 | | | | 197,000 | |
| | | | | | | | 918,988 | |
| | | | | | | | | |
| Electric Equipment, Instruments | | | | | | | | |
| & Components — 1.6% | | | | | | | | |
| Corning, Inc., 7.25%, due 08/15/36 | | | 500,000 | | | | 522,518 | |
| | | | | | | | | |
| IT Services — 2.0% | | | | | | | | |
| Western Union Company (The), | | | | | | | | |
| 5.93%, due 10/01/16 | | | 600,000 | | | | 647,473 | |
| 6.20%, due 11/17/36 | | | 25,000 | | | | 24,674 | |
| | | | | | | | 672,147 | |
| | | | | | | | | |
| | | | | | | | | |
| Materials — 7.3% | | | | | | | | |
| Chemicals — 3.2% | | | | | | | | |
| Cytec Industries, Inc., 8.95%, due 07/01/17 | | | 500,000 | | | | 530,191 | |
| E.I. du Pont de Nemours and Company, 6.00%, | | | | | | | | |
| due 07/15/18 | | | 475,000 | | | | 526,591 | |
| | | | | | | | 1,056,782 | |
| | | | | | | | | |
| Containers & Packaging — 0.2% | | | | | | | | |
| Ball Corporation, 6.875%, due 12/15/12 | | | 50,000 | | | | 50,125 | |
| | | | | | | | | |
| Metals & Mining — 3.1% | | | | | | | | |
| Alcoa, Inc., | | | | | | | | |
| 5.72%, due 02/23/19 | | | 600,000 | | | | 530,712 | |
| 5.87%, due 02/23/22 | | | 200,000 | | | | 166,348 | |
| Nucor Corporation, 5.85%, due 06/01/18 | | | 300,000 | | | | 326,725 | |
| | | | | | | | 1,023,785 | |
| | | | | | | | | |
| Paper & Forest Products — 0.8% | | | | | | | | |
| Weyerhaeuser Company, 7.375%, due 03/15/32 | | | 330,000 | | | | 277,620 | |
| | | | | | | | | |
| Telecommunication Services — 1.2% | | | | | | | | |
| Telecommunications Equipment — 1.2% | | | | | | | | |
| Tele-Communications, Inc., 10.125%, due 04/15/22 | | | 300,000 | | | | 375,055 | |
CM Advisers Fixed Income Fund
Schedule of Investments (Continued)
| CORPORATE BONDS — 62.0% (Continued) | | Par Value | | | Value | |
| Utilities — 1.3% | | | | | | |
| Multi-Utilities — 1.3% | | | | | | |
| Consolidated Edison, Inc., 5.85%, due 04/01/18 | | | $ 400,000 | | | $ | 433,589 | |
| | | | | | | | | |
Total Corporate Bonds (Cost $18,508,623) | | | | | | $ | 20,386,933 | |
| U.S. GOVERNMENT OBLIGATIONS — 5.6% | | Par Value | | | Value | |
| U.S. TREASURY BONDS — 5.6% | | | | | | |
| 5.00%, due 05/15/37 | | | $ 500,000 | | | $ | 567,422 | |
| 4.50%, due 05/15/38 | | | 800,000 | | | | 842,500 | |
| 3.50%, due 02/15/39 | | | 500,000 | | | | 441,719 | |
| | | | | | | | | |
| Total U.S. Government Obligations | | | | | | | | |
| (Cost $1,861,868) | | | | | | $ | 1,851,641 | |
| CLOSED-END FUNDS — 0.4% | | Shares | | | Value | |
| Western Asset Managed High Income Fund, Inc. | | | | | | |
| (Cost $102,480) | | | 27,500 | | | $ | 147,675 | |
| MONEY MARKET FUNDS — 30.3% | | Shares | | | Value | |
| Evergreen Institutional Treasury Money Market Fund - | | | | | | |
Institutional Class, 0.02% (a) (Cost $9,958,635) | | | 9,958,635 | | | $ | 9,958,635 | |
| | | | | | | | | |
| Total Investments at Value — 98.3% | | | | | | | | |
| (Cost $30,431,606) | | | | | | $ | 32,344,884 | |
| | | | | | | | | |
| Other Assets in Excess of Liabilities — 1.7% | | | | | | | 546,382 | |
| | | | | | | | | |
| Total Net Assets — 100.0% | | | | | | $ | 32,891,266 | |
| (a) | Variable rate security. The rate shown is the 7-day effective yield as of August 31, 2009. |
See accompanying notes to financial statements.
CM Advisers Family of Funds
Statements of Assets and Liabilities
August 31, 2009 (Unaudited)
| | | | | | CM Advisers | |
| | | CM Advisers | | | Fixed Income | |
| | | Fund | | | Fund | |
| ASSETS | | | | | | |
| Investments in securities: | | | | | | |
| At cost | | $ | 166,715,467 | | | $ | 30,431,606 | |
| At value (Note 2) | | $ | 148,901,332 | | | $ | 32,344,884 | |
| Dividends and interest receivable | | | 288,762 | | | | 347,779 | |
| Receivable for capital shares sold | | | 6,678 | | | | 215,080 | |
| Other assets | | | 20,474 | | | | 13,906 | |
| TOTAL ASSETS | | | 149,217,246 | | | | 32,921,649 | |
| | | | | | | | | |
| LIABILITIES | | | | | | | | |
| Payable for investment securities purchased | | | 399,919 | | | | — | |
| Payable for capital shares redeemed | | | 430,982 | | | | — | |
| Payable to Adviser (Note 5) | | | 151,844 | | | | 13,478 | |
| Payable to administrator (Note 5) | | | 15,930 | | | | 5,920 | |
| Other accrued expenses and liabilities | | | 13,772 | | | | 10,985 | |
| TOTAL LIABILITIES | | | 1,012,447 | | | | 30,383 | |
| | | | | | | | | |
| NET ASSETS | | $ | 148,204,799 | | | $ | 32,891,266 | |
| | | | | | | | | |
| Net assets consist of: | | | | | | | | |
| Paid-in capital | | $ | 210,632,242 | | | $ | 30,796,763 | |
| Accumulated undistributed net investment income | | | 184,601 | | | | 181,225 | |
| Accumulated net realized losses | | | | | | | | |
| from security transactions | | | (44,797,909 | ) | | | — | |
| Net unrealized appreciation (depreciation) on investments | | | (17,814,135 | ) | | | 1,913,278 | |
| | | | | | | | | |
| Net assets | | $ | 148,204,799 | | | $ | 32,891,266 | |
| | | | | | | | | |
| Shares of beneficial interest outstanding (unlimited | | | | | | | | |
| number of shares authorized, no par value) | | | 17,360,787 | | | | 3,017,664 | |
| | | | | | | | | |
| Net asset value, redemption price and | | | | | | | | |
offering price per share (a) | | $ | 8.54 | | | $ | 10.90 | |
| (a) | Redemption price may differ from the net asset value per share depending upon the length of time the shares are held (Note 2). |
See accompanying notes to financial statements.
CM Advisers Family of Funds
Statements of Operations
Six Months Ended August 31, 2009 (Unaudited)
| | | | | | CM Advisers | |
| | | CM Advisers | | | Fixed Income | |
| | | Fund | | | Fund | |
| INVESTMENT INCOME | | | | | | |
| Dividend | | $ | 1,454,447 | | | $ | 13,194 | |
| Interest | | | — | | | | 606,986 | |
| TOTAL INVESTMENT INCOME | | | 1,454,447 | | | | 620,180 | |
| | | | | | | | | |
| EXPENSES | | | | | | | | |
| Investment advisory fees (Note 5) | | | 808,959 | | | | 64,233 | |
| Administration fees (Note 5) | | | 51,744 | | | | 12,150 | |
| Professional fees | | | 20,772 | | | | 15,123 | |
| Fund accounting fees (Note 5) | | | 18,467 | | | | 13,284 | |
| Transfer agent fees (Note 5) | | | 16,737 | | | | 9,000 | |
| Registration fees | | | 14,364 | | | | 10,599 | |
| Trustees’ fees and expenses | | | 14,480 | | | | 6,518 | |
| Postage and supplies | | | 11,234 | | | | 3,585 | |
| Custody and bank service fees | | | 6,646 | | | | 3,984 | |
| Printing of shareholder reports | | | 6,352 | | | | 2,006 | |
| Insurance expense | | | 4,836 | | | | 707 | |
| Pricing fees | | | 427 | | | | 3,347 | |
| Other expenses | | | 11,950 | | | | 6,214 | |
| TOTAL EXPENSES | | | 986,968 | | | | 150,750 | |
| Advisory fees waived by Adviser (Note 5) | | | (15,794 | ) | | | — | |
| NET EXPENSES | | | 971,174 | | | | 150,750 | |
| | | | | | | | | |
| NET INVESTMENT INCOME | | | 483,273 | | | | 469,430 | |
| | | | | | | | | |
| REALIZED AND UNREALIZED GAINS (LOSSES) | | | | | | | | |
| ON INVESTMENTS | | | | | | | | |
| Net realized losses from security transactions | | | (17,954,270 | ) | | | — | |
| Net change in unrealized appreciation/ | | | | | | | | |
| depreciation on investments | | | 68,058,973 | | | | 2,401,649 | |
| | | | | | | | | |
| NET REALIZED AND UNREALIZED | | | | | | | | |
| GAINS ON INVESTMENTS | | | 50,104,703 | | | | 2,401,649 | |
| | | | | | | | | |
| NET INCREASE IN NET ASSETS | | | | | | | | |
| FROM OPERATIONS | | $ | 50,587,976 | | | $ | 2,871,079 | |
See accompanying notes to financial statements.
CM Advisers Fund
Statements of Changes in Net Assets
| | | Six Months | | | | |
| | | Ended | | | | |
| | | August 31, | | | Year Ended | |
| | | 2009 | | | February 28, | |
| | | (Unaudited) | | | 2009 | |
| FROM OPERATIONS | | | | | | |
| Net investment income | | $ | 483,273 | | | $ | 1,861,279 | |
| Net realized losses from security transactions | | | (17,954,270 | ) | | | (26,843,639 | ) |
| Net change in unrealized appreciation/ | | | | | | | | |
| depreciation on investments | | | 68,058,973 | | | | (51,284,018 | ) |
| Net increase (decrease) in net assets from operations | | | 50,587,976 | | | | (76,266,378 | ) |
| | | | | | | | | |
| DISTRIBUTIONS TO SHAREHOLDERS | | | | | | | | |
| Distributions from net investment income | | | (355,646 | ) | | | (1,804,305 | ) |
| Distributions from net realized gains | | | | | | | | |
| from security transactions | | | — | | | | (5,100,749 | ) |
| Decrease in net assets from distributions to shareholders | | | (355,646 | ) | | | (6,905,054 | ) |
| | | | | | | | | |
| FROM CAPITAL SHARE TRANSACTIONS | | | | | | | | |
| Proceeds from shares sold | | | 5,810,434 | | | | 17,857,122 | |
| Net asset value of shares issued in reinvestment of | | | | | | | | |
| distributions to shareholders | | | 343,352 | | | | 6,700,951 | |
| Proceeds from redemption fees collected (Note 2) | | | 10,354 | | | | 31,140 | |
| Payments for shares redeemed | | | (11,558,401 | ) | | | (47,161,605 | ) |
| Net decrease in net assets from capital share transactions | | | (5,394,261 | ) | | | (22,572,392 | ) |
| | | | | | | | | |
| TOTAL INCREASE (DECREASE) IN NET ASSETS | | | 44,838,069 | | | | (105,743,824 | ) |
| | | | | | | | | |
| NET ASSETS | | | | | | | | |
| Beginning of period | | | 103,366,730 | | | | 209,110,554 | |
| End of period | | $ | 148,204,799 | | | $ | 103,366,730 | |
| | | | | | | | | |
| ACCUMULATED UNDISTRIBUTED | | | | | | | | |
| NET INVESTMENT INCOME | | $ | 184,601 | | | $ | 56,974 | |
| | | | | | | | | |
| CAPITAL SHARE ACTIVITY | | | | | | | | |
| Shares sold | | | 837,774 | | | | 2,052,765 | |
| Shares reinvested | | | 50,341 | | | | 962,980 | |
| Shares redeemed | | | (1,638,322 | ) | | | (5,304,873 | ) |
| Net decrease in shares outstanding | | | (750,207 | ) | | | (2,289,128 | ) |
| Shares outstanding, beginning of period | | | 18,110,994 | | | | 20,400,122 | |
| Shares outstanding, end of period | | | 17,360,787 | | | | 18,110,994 | |
See accompanying notes to financial statements.
CM Advisers Fixed Income Fund
Statements of Changes in Net Assets
| | | Six Months | | | | |
| | | Ended | | | | |
| | | August 31, | | | Year Ended | |
| | | 2009 | | | February 28, | |
| | | (Unaudited) | | | 2009 | |
| FROM OPERATIONS | | | | | | |
| Net investment income | | $ | 469,430 | | | $ | 415,494 | |
| Net realized gains from security transactions | | | — | | | | 385,747 | |
| Net change in unrealized appreciation/ | | | | | | | | |
| depreciation on investments | | | 2,401,649 | | | | (693,844 | ) |
| Net increase in net assets from operations | | | 2,871,079 | | | | 107,397 | |
| | | | | | | | | |
| DISTRIBUTIONS TO SHAREHOLDERS | | | | | | | | |
| From net investment income | | | (391,361 | ) | | | (312,338 | ) |
| From net realized gains from security transactions | | | (90,634 | ) | | | (1,106,674 | ) |
| Decrease in net assets from distributions to shareholders | | | (481,995 | ) | | | (1,419,012 | ) |
| | | | | | | | | |
| FROM CAPITAL SHARE TRANSACTIONS | | | | | | | | |
| Proceeds from shares sold | | | 12,630,493 | | | | 8,978,026 | |
| Net asset value of shares issued in reinvestment | | | | | | | | |
| of distributions to shareholders | | | 441,572 | | | | 1,376,986 | |
| Proceeds from redemption fees collected (Note 2) | | | 7,342 | | | | 9,304 | |
| Payments for shares redeemed | | | (1,994,490 | ) | | | (2,460,657 | ) |
| Net increase in net assets from capital share transactions | | | 11,084,917 | | | | 7,903,659 | |
| | | | | | | | | |
| TOTAL INCREASE IN NET ASSETS | | | 13,474,001 | | | | 6,592,044 | |
| | | | | | | | | |
| NET ASSETS | | | | | | | | |
| Beginning of period | | | 19,417,265 | | | | 12,825,221 | |
| End of period | | $ | 32,891,266 | | | $ | 19,417,265 | |
| | | | | | | | | |
| ACCUMULATED UNDISTRIBUTED | | | | | | | | |
| NET INVESTMENT INCOME | | $ | 181,225 | | | $ | 103,156 | |
| | | | | | | | | |
| CAPITAL SHARE ACTIVITY | | | | | | | | |
| Shares sold | | | 1,228,220 | | | | 874,052 | |
| Shares reinvested | | | 43,479 | | | | 142,810 | |
| Shares redeemed | | | (198,157 | ) | | | (237,826 | ) |
| Net increase in shares outstanding | | | 1,073,542 | | | | 779,036 | |
| Shares outstanding, beginning of period | | | 1,944,122 | | | | 1,165,086 | |
| Shares outstanding, end of period | | | 3,017,664 | | | | 1,944,122 | |
See accompanying notes to financial statements.
CM Advisers Fund
Financial Highlights
Per share data for a share outstanding throughout each period:
| | | Six Months | | | | | | | | | | | | | | | | |
| | | Ended | | | | | | | | | | | | | | | | |
| | | August 31, | | | Years Ended | |
| | | 2009 | | | February 28, | | | February 29, | | | February 28, | | | February 28, | | | February 28, | |
| | | (Unaudited) | | | 2009 | | | 2008 | | | 2007 | | | 2006 | | | 2005 | |
| Net asset value at | | | | | | | | | | | | | | | | | | |
| beginning of period | | $ | 5.71 | | | $ | 10.25 | | | $ | 12.75 | | | $ | 12.11 | | | $ | 11.50 | | | $ | 10.74 | |
| | | | | | | | | | | | | | | | | | | | | | | | | |
| Income (loss) from | | | | | | | | | | | | | | | | | | | | | | | | |
| investment operations: | | | | | | | | | | | | | | | | | | | | | | | | |
| Net investment income | | | 0.03 | | | | 0.10 | | | | 0.14 | | | | 0.19 | | | | 0.17 | | | | 0.01 | |
| Net realized and unrealized | | | | | | | | | | | | | | | | | | | | | | | | |
| gains (losses) | | | | | | | | | | | | | | | | | | | | | | | | |
| on investments | | | 2.82 | | | | (4.26 | ) | | | (2.19 | ) | | | 1.00 | | | | 1.11 | | | | 0.78 | |
| Total from investment | | | | | | | | | | | | | | | | | | | | | | | | |
| operations | | | 2.85 | | | | (4.16 | ) | | | (2.05 | ) | | | 1.19 | | | | 1.28 | | | | 0.79 | |
| | | | | | | | | | | | | | | | | | | | | | | | | |
| Less distributions: | | | | | | | | | | | | | | | | | | | | | | | | |
| Dividends from net | | | | | | | | | | | | | | | | | | | | | | | | |
| investment income | | | (0.02 | ) | | | (0.10 | ) | | | (0.16 | ) | | | (0.19 | ) | | | (0.15 | ) | | | — | |
| Distributions from net | | | | | | | | | | | | | | | | | | | | | | | | |
| realized gains | | | — | | | | (0.28 | ) | | | (0.29 | ) | | | (0.36 | ) | | | (0.52 | ) | | | (0.03 | ) |
| Total distributions | | | (0.02 | ) | | | (0.38 | ) | | | (0.45 | ) | | | (0.55 | ) | | | (0.67 | ) | | | (0.03 | ) |
| | | | | | | | | | | | | | | | | | | | | | | | | |
| Proceeds from redemption | | | | | | | | | | | | | | | | | | | | | | | | |
| fees collected (Note 2) | | | 0.00 | (c) | | | 0.00 | (c) | | | 0.00 | (c) | | | 0.00 | (c) | | | 0.00 | (c) | | | 0.00 | (c) |
| | | | | | | | | | | | | | | | | | | | | | | | | |
| Net asset value at | | | | | | | | | | | | | | | | | | | | | | | | |
| end of period | | $ | 8.54 | | | $ | 5.71 | | | $ | 10.25 | | | $ | 12.75 | | | $ | 12.11 | | | $ | 11.50 | |
| | | | | | | | | | | | | | | | | | | | | | | | | |
Total return (a) | | | 50.00% | (d) | | | (41.21% | ) | | | (16.43% | ) | | | 9.88% | | | | 11.31% | | | | 7.36% | |
| | | | | | | | | | | | | | | | | | | | | | | | | |
| Ratios and supplemental data: | | | | | | | | | | | | | | | | | | | | | | | | |
| Net assets at | | | | | | | | | | | | | | | | | | | | | | | | |
| end of period (000’s) | | $ | 148,205 | | | $ | 103,367 | | | $ | 209,111 | | | $ | 268,861 | | | $ | 187,557 | | | $ | 79,992 | |
| | | | | | | | | | | | | | | | | | | | | | | | | |
| Ratio of gross expenses | | | | | | | | | | | | | | | | | | | | | | | | |
| to average net assets | | | 1.52% | (e) | | | 1.48% | | | | 1.46% | | | | 1.50% | | | | 1.83% | | | | 2.03% | |
| | | | | | | | | | | | | | | | | | | | | | | | | |
| Ratio of net expenses | | | | | | | | | | | | | | | | | | | | | | | | |
to average net assets (b) | | | 1.50% | (e) | | | 1.48% | | | | 1.46% | | | | 1.50% | | | | 1.50% | | | | 1.50% | |
| | | | | | | | | | | | | | | | | | | | | | | | | |
| Ratio of net investment income | | | | | | | | | | | | | | | | | | | | | | | | |
to average net assets (b) | | | 0.75% | (e) | | | 1.09% | | | | 1.07% | | | | 1.70% | | | | 1.86% | | | | 0.10% | |
| | | | | | | | | | | | | | | | | | | | | | | | | |
| Portfolio turnover rate | | | 7% | (d) | | | 23% | | | | 66% | | | | 22% | | | | 19% | | | | 18% | |
| (a) | Total return is a measure of the change in value of an investment in the Fund over the period covered, which assumes any dividends or capital gains distributions are reinvested in shares of the Fund. The returns shown do not reflect the deduction of taxes a shareholder would pay on Fund distributions or the redemption of Fund shares. |
| (b) | Ratio was determined after investment advisory fee waivers and/or expense reimbursements. |
| (c) | Amount rounds to less than $0.01 per share. |
See accompanying notes to financial statements.
CM Advisers Fixed Income Fund
Per share data for a share outstanding throughout each period:
| | | Six Months | | | | | | | | | | |
| | | Ended | | | Year | | | Year | | | Period | |
| | | August 31, | | | Ended | | | Ended | | | Ended | |
| | | 2009 | | | February 28, | | | February 29, | | | February 28, | |
| | | (Unaudited) | | | 2009 | | | 2008 | | | 2007 (a) | |
| Net asset value at beginning of period | | $ | 9.99 | | | $ | 11.01 | | | $ | 10.66 | | | $ | 10.00 | |
| | | | | | | | | | | | | | | | | |
| Income (loss) from investment operations: | | | | | | | | | | | | | | | | |
| Net investment income | | | 0.17 | | | | 0.26 | | | | 0.25 | | | | 0.29 | |
| Net realized and unrealized gains | | | | | | | | | | | | | | | | |
| (losses) on investments | | | 0.94 | | | | (0.38 | ) | | | 0.57 | | | | 0.84 | |
| Total from investment operations | | | 1.11 | | | | (0.12 | ) | | | 0.82 | | | | 1.13 | |
| | | | | | | | | | | | | | | | | |
| Less distributions: | | | | | | | | | | | | | | | | |
| Dividends from net | | | | | | | | | | | | | | | | |
| investment income | | | (0.16 | ) | | | (0.21 | ) | | | (0.25 | ) | | | (0.29 | ) |
| Distributions from | | | | | | | | | | | | | | | | |
| net realized gains | | | (0.04 | ) | | | (0.70 | ) | | | (0.22 | ) | | | — | |
| In excess of net | | | | | | | | | | | | | | | | |
| investment income | | | — | | | | — | | | | — | | | | (0.18 | ) |
| Total distributions | | | (0.20 | ) | | | (0.91 | ) | | | (0.47 | ) | | | (0.47 | ) |
| | | | | | | | | | | | | | | | | |
| Proceeds from redemption fees | | | | | | | | | | | | | | | | |
| collected (Note 2) | | | 0.00 | (f) | | | 0.01 | | | | 0.00 | (f) | | | 0.00 | (f) |
| | | | | | | | | | | | | | | | | |
| Net asset value at end of period | | $ | 10.90 | | | $ | 9.99 | | | $ | 11.01 | | | $ | 10.66 | |
| | | | | | | | | | | | | | | | | |
Total return (b) | | | 11.33% | (d) | | | (0.60% | ) | | | 8.05 | % | | | 11.39% | (d) |
| | | | | | | | | | | | | | | | | |
| Ratios and supplemental data: | | | | | | | | | | | | | | | | |
| Net assets at end of period (000’s) | | $ | 32,891 | | | $ | 19,417 | | | $ | 12,825 | | | $ | 3,126 | |
| | | | | | | | | | | | | | | | | |
| Ratio of gross expenses | | | | | | | | | | | | | | | | |
| to average net assets | | | 1.17% | (e) | | | 1.54% | | | | 2.28% | | | | 7.28% | (e) |
| | | | | | | | | | | | | | | | | |
| Ratio of net expenses | | | | | | | | | | | | | | | | |
to average net assets (c) | | | 1.17% | (e) | | | 1.50% | | | | 1.50% | | | | 1.50% | (e) |
| | | | | | | | | | | | | | | | | |
| Ratio of net investment income to | | | | | | | | | | | | | | | | |
average net assets (c) | | | 3.64% | (e) | | | 2.77% | | | | 2.79% | | | | 3.28% | (e) |
| | | | | | | | | | | | | | | | | |
| Portfolio turnover rate | | | 0% | | | | 37% | | | | 188% | | | | 0% | |
| (a) | Represents the period from the commencement of operations (March 24, 2006) through February 28, 2007. |
| (b) | Total return is a measure of the change in value of an investment in the Fund over the period covered, which assumes any dividends or capital gains distributions are reinvested in shares of the Fund. The returns shown do not reflect the deduction of taxes a shareholder would pay on Fund distributions or the redemption of Fund shares. |
| (c) | Ratio was determined after investment advisory fee waivers and/or expense reimbursements. |
| (f) | Amount rounds to less than $0.01 per share. |
See accompanying notes to financial statements.
CM Advisers Family of Funds
Notes to Financial Statements
August 31, 2009 (Unaudited)
1. Organization
The CM Advisers Fund and the CM Advisers Fixed Income Fund (collectively the “Funds” and individually a “Fund”) are each a no-load series of the CM Advisers Family of Funds (the “Trust”), which was organized as a Delaware statutory trust and is registered under the Investment Company Act of 1940 (the “1940 Act”) as an open-end management investment company.
The CM Advisers Fund commenced operations on May 13, 2003. The investment objective of the Fund is long-term growth of capital.
The CM Advisers Fixed Income Fund commenced operations on March 24, 2006. The investment objective of the Fund is to seek to preserve capital and maximize total return using fixed income securities.
2. Significant Accounting Policies
The following is a summary of the Funds’ significant accounting policies:
Investment Valuation – The Funds’ portfolio securities are generally valued at their market values determined on the basis of available market quotations as of the close of regular trading on the New York Stock Exchange (typically 4:00 p.m. Eastern time). Securities listed on an exchange or quoted on a national market system are valued at the last sales price. Securities which are quoted by NASDAQ are valued at the NASDAQ Official Closing Price. Securities traded in the over-the-counter market and listed securities for which no sale was reported on that date are valued at the most recent bid price. It is expected that fixed income securities will ordinarily be traded in the over-the-counter market. Securities and assets for which representative market quotations are not readily available (e.g., if the exchange on which the portfolio security is principally traded closes early or if trading of the particular portfolio security is halted during the day and does not resume prior to the Funds’ net asset value calculations) or which cannot be accurately valued using the Funds’ normal pricing procedures are valued at fair value as determined in good faith under policies approved by the Board of Trustees. A portfolio security’s “fair value” price may differ from the price next available for that portfolio security using the Funds’ normal pricing procedures. Instruments with maturities of 60 days or less are valued at amortized cost, which approximates market value.
The Financial Accounting Standards Board’s (“FASB”) Statement of Financial Accounting Standards No. 157 “Fair Value Measurements” establishes a single authoritative definition of fair value, sets out a framework for measuring fair value and requires additional disclosures about fair value measurements.
Various inputs are used in determining the value of each of the Fund’s investments.
These inputs are summarized in the three broad levels listed below:
| | • | Level 1 – quoted prices in active markets for identical securities |
| | • | Level 2 – other significant observable inputs |
| | • | Level 3 – significant unobservable inputs |
The inputs or methodology used for valuing securities are not necessarily an indication of the risk associated with investing in those securities.
CM Advisers Family of Funds
Notes to Financial Statements (Continued)
The following is a summary of the inputs used to value the Funds’ investments as of August 31, 2009:
| | | | | | CM Advisers | |
| | | CM Advisers | | | Fixed Income | |
| Valuation Inputs | | Fund | | | Fund | |
| Level 1 - Quoted Prices | | $ | 148,901,332 | | | $ | 10,106,310 | |
| Level 2 - Other Significant Observable Inputs | | | — | | | | 22,238,574 | |
| Level 3 - Significant Unobservable Inputs | | | — | | | | — | |
| Total | | $ | 148,901,332 | | | $ | 32,344,884 | |
In April 2009, FASB issued Staff Position No. 157-4, “Determining Fair Value When the Volume and Level of Activity for the Asset or Liability Have Significantly Decreased and Identifying Transactions That Are Not Orderly” (“FSP 157-4” or the “Position”). FSP 157-4 provides additional guidance for estimating fair value when the volume and level of activity has significantly decreased in relation to normal market activity for the asset or liability. The Position also provides additional guidance on circumstances that may indicate that a transaction is not orderly and requires additional disclosures in annual and interim reporting periods. FSP 157-4 is effective for fiscal periods and interim periods ending after June 15, 2009.
As of August 31, 2009, all of the securities held by the CM Advisers Fund were valued using Level 1 inputs. See the Fund’s Schedule of Investments for a listing of the securities valued using Level 1 inputs by security type and industry type as required by FSP 157-4.
The following is a summary of the inputs used to value the CM Advisers Fixed Income Fund’s investments as of August 31, 2009 by security type as required by FSP 157-4:
| | | Level 1 | | | Level 2 | | | Level 3 | | | Total | |
| Corporate bonds | | $ | — | | | $ | 20,386,933 | | | $ | — | | | $ | 20,386,933 | |
| U.S. government & agency bonds | | | — | | | | 1,851,641 | | | | — | | | | 1,851,641 | |
| Closed-end funds | | | 147,675 | | | | — | | | | — | | | | 147,675 | |
| Money market funds | | | 9,958,635 | | | | — | | | | — | | | | 9,958,635 | |
| Total | | $ | 10,106,310 | | | $ | 22,238,574 | | | $ | — | | | $ | 32,344,884 | |
Share Valuation and Redemption Fees — The net asset value per share of each Fund is calculated on each business day by dividing the total value of each Fund’s assets, less liabilities, by the number of shares outstanding. The offering price and redemption price per share of each Fund is equal to the net asset value per share, except that shares of each Fund are subject to a redemption fee of 1% payable to the applicable Fund, if redeemed within one year of the date of the purchase for the CM Advisers Fund and if redeemed within 180 days of the date of purchase for the CM Advisers Fixed Income Fund. Prior to August 1, 2009, shares of the CM Advisers Fixed Income Fund that were redeemed within one year of purchase were subject to the 1% redemption fee. During the periods ended August 31, 2009 and February 28, 2009, proceeds from redemption fees totaled $10,354 and $31,140, respectively, for the CM Advisers Fund and $7,342 and $9,304, respectively, for the CM Advisers Fixed Income Fund.
CM Advisers Family of Funds
Notes to Financial Statements (Continued)
Investment Transactions and Investment Income – Investment transactions are accounted for on trade date. Dividend income is recorded on the ex-dividend date. Interest income is accrued as earned. Discounts and premiums on fixed income securities purchased are amortized using the interest method. Gains and losses on securities sold are determined on a specific identification basis, which is the same basis used for federal income tax purposes.
Expenses – The Funds bear expenses incurred specifically on their behalf as well as a portion of general Trust expenses, which are allocated according to methods authorized by the Board of Trustees.
Dividend Distributions – Dividends arising from net investment income, if any, are declared and paid quarterly to shareholders of each Fund. Distributions from capital gains, if any, are generally declared and distributed annually. The amount of distributions from net investment income and net realized gains are determined in accordance with federal income tax regulations which may differ from accounting principles generally accepted in the United States of America. These “book/tax” differences are either temporary or permanent in nature and are primarily due to differing treatments of net short-term gains. Dividends and distributions are recorded on the ex-dividend date.
The tax character of distributions paid during the periods ended August 31, 2009 and February 28, 2009 was as follows:
| | Periods | | Ordinary | | | Long-Term | | | Total | |
| | Ended | | Income | | | Capital Gains | | | Distributions | |
| CM Advisers Fund | 08/31/09 | | $ | 355,646 | | | $ | — | | | $ | 355,646 | |
| | 02/28/09 | | $ | 1,804,305 | | | $ | 5,100,749 | | | $ | 6,905,054 | |
| CM Advisers Fixed Income Fund | 08/31/09 | | $ | 481,995 | | | $ | — | | | $ | 481,995 | |
| | 02/28/09 | | $ | 1,286,319 | | | $ | 132,693 | | | $ | 1,419,012 | |
Estimates – The preparation of financial statements in conformity with accounting principles generally accepted in the United States of America requires management to make estimates and assumptions that affect the reported amounts of assets and liabilities and disclosure of contingent assets and liabilities at the date of the financial statements and the reported amounts of income and expenses during the reporting period. Actual results could differ from those estimates.
3. Federal Income Tax
It is each Fund’s policy to comply with the special provisions of Subchapter M of the Internal Revenue Code applicable to regulated investment companies. As provided therein, in any fiscal year in which a Fund so qualifies, and distributes at least 90% of its taxable net income, the Fund (but not the shareholders) will be relieved of federal income tax on the income distributed. Accordingly, no provision for income taxes has been made.
In order to avoid imposition of the excise tax applicable to regulated investment companies, it is also each Fund’s intention to declare as dividends in each calendar year at least 98% of its net investment income (earned during the calendar year) and 98% of its net realized capital gains (earned during the twelve months ended October 31) plus undistributed amounts from prior years.
CM Advisers Family of Funds
Notes to Financial Statements (Continued)
The following information is computed on a tax basis for each item as of August 31, 2009:
| | | | | | CM Advisers | |
| | | CM Advisers | | | Fixed Income | |
| | | Fund | | | Fund | |
| Tax cost of portfolio investments | | $ | 166,715,467 | | | $ | 30,431,606 | |
| Gross unrealized appreciation | | $ | 11,980,038 | | | $ | 2,084,297 | |
| Gross unrealized depreciation | | | (29,794,173 | ) | | | (171,019 | ) |
| Net unrealized appreciation (depreciation) | | $ | (17,814,135 | ) | | $ | 1,913,278 | |
| Undistributed ordinary income | | | 184,601 | | | | 181,225 | |
| Capital loss carryforward | | | (16,877,649 | ) | | | — | |
| Post-October losses | | | (9,965,990 | ) | | | — | |
| Other losses | | | (17,954,270 | ) | | | — | |
| Accumulated earnings (deficit) | | $ | (62,427,443 | ) | | $ | 2,094,503 | |
As of February 28, 2009, the CM Advisers Fund had a capital loss carryforward of $16,877,649, which expires on February 28, 2017. In addition, the Fund had net realized capital losses of $9,965,990 during the period November 1, 2008 through February 28, 2009, which are treated for federal income tax purposes as arising during the Fund’s tax year ending February 28, 2010. The capital loss carryforward and “post-October” losses may be utilized in the current and future years to offset net realized capital gains, if any, prior to distributing such gains to shareholders.
FASB’s Interpretation No. 48 (“FIN 48”) “Accounting for Uncertainty in Income Taxes” provides guidance for how uncertain tax positions should be recognized, measured, presented and disclosed in the financial statements. FIN 48 requires the evaluation of tax positions taken in the course of preparing the Funds’ tax returns to determine whether the tax positions are “more-likely-than-not” of being sustained by the applicable tax authority. Tax positions not deemed to meet the “more-likely-than-not” threshold would be recorded as a tax benefit or expense in the current year. As required by FIN 48, management has analyzed the Funds’ tax positions taken on Federal income tax returns for all open tax years (tax years ended February 28, 2006 through February 28, 2009) and has concluded that no provision for income tax is required in these financial statements.
4. Investment Transactions
During the period ended August 31, 2009, cost of purchases and proceeds from sales of investment securities, other than short-term investments and U.S. government securities, were as follows:
| | | | | | CM Advisers | |
| | | CM Advisers | | | Fixed Income | |
| | | Fund | | | Fund | |
| Cost of purchases of investment securities | | $ | 7,869,853 | | | $ | 5,274,605 | |
| Proceeds from sales of investment securities | | $ | 30,014,795 | | | $ | — | |
CM Advisers Family of Funds
Notes to Financial Statements (Continued)
5. Transactions with Affiliates
INVESTMENT ADVISORY AGREEMENT
The Funds pay a monthly advisory fee to Van Den Berg Management I, Inc. (the “Adviser”) based upon the average daily net assets of each Fund and calculated at the annual rate of 1.25% for the CM Advisers Fund and 0.50% for the CM Advisers Fixed Income Fund. The Adviser has entered into contractual agreements (the “Expense Limitation Agreements”) with the Funds under which it has agreed to waive its fees and to assume other expenses of the Funds, if necessary, in an amount that limits the Funds’ total operating expenses (exclusive of interest, taxes, brokerage fees and commissions, extraordinary expenses, and payments, if any, under a Rule 12b-1 plan) until February 28, 2010 to not more than 2.00% and 1.50% of the average daily net assets of the CM Advisers Fund and the CM Advisers Fixed Income Fund, respectively. There can be no assurance that the Expense Limitation Agreements will continue beyond February 28, 2010. During the period ended August 31, 2009, the Adviser waived advisory fees of $15,794 with respect to the CM Advisers Fund in order to limit such Fund’s total operating expenses to 1.50% of its average daily net assets. There were no advisory fee waivers or expense reimbursements with respect to the CM Advisers Fixed Income Fund during the period ended August 31, 2009.
Under the terms of an Administration Agreement with the Trust, Ultimus Fund Solutions, LLC (“Ultimus”) provides executive and administrative services and internal regulatory compliance services for the Funds. Ultimus supervises the preparation of tax returns, reports to shareholders of the Funds, reports to and filings with the Securities and Exchange Commission (“SEC”) and state securities commissions and prepares materials for meetings of the Board of Trustees. For these services, each Fund pays to Ultimus a monthly fee at an annual rate of 0.08% per annum of its average daily net assets up to $500 million, 0.05% of such assets from $500 million to $2 billion, 0.04% of such assets from $2 billion to $3 billion and 0.03% of such assets in excess of $3 billion, provided, however, that the minimum fee is $2,000 per month with respect to each Fund.
FUND ACCOUNTING AGREEMENT
Under the terms of a Fund Accounting Agreement with the Trust, Ultimus calculates the daily net asset value per share and maintains the financial books and records of each Fund. For these services, each Fund pays to Ultimus a base fee of $2,000 per month, plus an asset-based fee at the annual rate of 0.01% of the first $500 million of its Fund’s average daily net assets and 0.005% of such assets in excess of $500 million. In addition, each Fund pay all costs of external pricing services.
TRANSFER AGENT AND SHAREHOLDER SERVICES AGREEMENT
Under the terms of a Transfer Agent and Shareholder Services Agreement with the Trust, Ultimus maintains the records of each shareholder’s account, answers shareholders’ inquiries concerning their accounts, processes purchases and redemptions of each Fund’s shares, acts as dividend and distribution disbursing agent and performs other shareholder service functions. For these services, Ultimus receives from each Fund a fee, payable monthly, at an annual rate of $17 per account, provided, however, that the minimum fee with respect to each Fund is $1,000 per month if a Fund has 25 shareholder accounts or less, $1,250 if a Fund has more than 25 but less than 100 shareholder accounts, and $1,500 per month if a Fund has more than 100 shareholder accounts. In addition, each Fund pays out-of-pocket expenses, including but not limited to, postage and supplies.
CM Advisers Family of Funds
Notes to Financial Statements (Continued)
Pursuant to the terms of a Distribution Agreement with the Trust, Ultimus Fund Distributors, LLC (the “Distributor”) serves as the Funds’ principal underwriter. The Distributor is a wholly-owned subsidiary of Ultimus. The Distributor receives compensation of $250 per month from each Fund for such services.
DISTRIBUTION AND SERVICE FEES
The Board of Trustees, including a majority of the Trustees who are not “interested persons” of the Trust as defined in the 1940 Act (the “Independent Trustees”), has adopted a distribution plan pursuant to Rule 12b-1 under the 1940 Act for each of the Funds (the “Plans”). Rule 12b-1 regulates the manner in which a regulated investment company may assume costs of distributing and promoting the sales of its shares and servicing of its shareholder accounts. The Plans provide that the Funds may incur certain costs, which may not exceed 0.25% per annum of the CM Advisers Fund’s average daily net assets and 0.45% per annum of the CM Advisers Fixed Income Fund’s average daily net assets, related to activities reasonably intended to result in the sale of shares of the Funds or support servicing of shareholder accounts. During the period ended August 31, 2009, the Funds did not incur any distribution related expenses under the Plans.
6. Contingencies and Commitments
The Funds indemnify the Trust’s officers and Trustees for certain liabilities that might arise from their performance of their duties to the Funds. Additionally, in the normal course of business, the Funds enter into contracts that contain a variety of representations and warranties and which provide general indemnifications. Each Fund’s maximum exposure under these arrangements is unknown, as this would involve future claims that may be made against the Funds that have not yet occurred. However, based on experience, the Trust expects the risk of loss to be remote.
7. Recent Accounting Pronouncement
In June 2009, FASB issued Statement of Financial Accounting Standards No. 168, “The FASB Accounting Standards CodificationTM and the Hierarchy of Generally Accepted Accounting Principles – a replacement of FASB Statement No. 162” (“SFAS 168”). SFAS 168 replaces SFAS No. 162, “The Hierarchy of Generally Accepted Accounting Principles” and establishes the “FASB Accounting Standards CodificationTM” (the “Codification”) as the source of authoritative accounting principles recognized by FASB to be applied by nongovernmental entities in the preparation of financial statements in conformity with U.S. generally accepted accounting principles. All guidance contained in the Codification carries an equal level of authority. On the effective date of SFAS 168, the Codification will supersede all then-existing non-SEC accounting and reporting standards. All other non-grandfathered non-SEC accounting literature not included in the Codification will become non-authoritative. SFAS 168 is effective for financial statements issued for interim and annual periods ending after September 15, 2009. Management has evaluated this new statement and have determined that it will not have a significant impact on the determination or reporting of the Funds’ financial statements.
CM Advisers Family of Funds
Notes to Financial Statements (Continued)
8. Subsequent Events
In May 2009, FASB issued Statement of Financial Accounting Standards No. 165, “Subsequent Events” (“SFAS 165”). The Trust has adopted SFAS 165 with these financial statements. SFAS 165 requires the Funds to recognize in the financial statements the effects of all subsequent events that provide additional evidence about conditions that existed at the date of the Statements of Assets and Liabilities. For nonrecognized subsequent events that must be disclosed to keep the financial statements from being misleading, the Funds will be required to disclose the nature of the event as well as an estimate of its financial effect, or a statement that such an estimate cannot be made. In addition, SFAS 165 requires the Funds to disclose the date through which subsequent events have been evaluated. Management has evaluated subsequent events through the issuance of these financial statements on October 20, 2009 and has noted no such events.
CM Advisers Family of Funds
About Your Funds’ Expenses (Unaudited)
We believe it is important for you to understand the impact of costs on your investment. All mutual funds have operating expenses. As a shareholder of the Funds, you may incur two types of costs: (1) transaction costs, including redemption fees; and (2) ongoing costs, including management fees, distribution (12b-1) fees and other Fund expenses. Ongoing costs, which are deducted from each Fund’s gross income, directly reduce the investment return of the Funds.
A mutual fund’s ongoing costs are expressed as a percentage of its average net assets. This figure is known as the expense ratio. The following examples are intended to help you understand the ongoing costs (in dollars) of investing in the Funds and to compare these costs with the ongoing costs of investing in other mutual funds. The examples below are based on an investment of $1,000 made at the beginning of the period shown and held for the entire period (March 1, 2009 – August 31, 2009).
The table below illustrates each Fund’s costs in two ways:
Actual fund return – This section helps you to estimate the actual expenses that you paid over the period. The “Ending Account Value” shown is derived from each Fund’s actual return, and the third column shows the dollar amount of expenses that would have been paid by an investor who started with $1,000 in the Funds. You may use the information here, together with the amount you invested, to estimate the ongoing costs that you paid over the period.
To do so, simply divide your account value by $1,000 (for example, an $8,600 account value divided by $1,000 = 8.6), then multiply the result by the number given for the Funds under the heading “Expenses Paid During Period.”
Hypothetical 5% return – This section is intended to help you compare the Funds’ ongoing costs with those of other mutual funds. It assumes that each Fund had an annual return of 5% before expenses during the period shown, but that the expense ratio is unchanged. In this case, because the return used is not the Funds’ actual returns, the results do not apply to your investment. The example is useful in making comparisons because the SEC requires all mutual funds to calculate expenses based on a 5% return. You can assess each Fund’s ongoing costs by comparing this hypothetical example with the hypothetical examples that appear in shareholder reports of other funds.
Note that expenses shown in the table are meant to highlight and help you compare ongoing costs only. The Funds do not impose any sales loads. However, a redemption fee of 1% is charged on the sale of shares within one year of the date of their purchase for the CM Advisers Fund and within 180 days of the date of their purchase for the CM Advisers Fixed Income Fund.
The calculations assume no shares were bought or sold during the period. Your actual costs may have been higher or lower, depending on the amount of your investment and the timing of any purchases or redemptions.
More information about the Funds’ expenses, including annual expense ratios, can be found in this report. For additional information on operating expenses and other shareholder costs, please refer to the Funds’ prospectus.
CM Advisers Family of Funds
About Your Funds’ Expenses (Unaudited) (Continued)
CM Advisers Fund
| | | Beginning | | | Ending | | | | |
| | | Account Value | | | Account Value | | | | |
| | | March 1, | | | August 31, | | | Expenses Paid | |
| | | 2009 | | | 2009 | | | During Period* | |
| | | | | | | | | | |
| Based on Actual Fund Return | | | $ 1,000.00 | | | | $ 1,500.00 | | | | $ 9.45 | |
| Based on Hypothetical 5% Return | | | | | | | | | | | | |
| (before expenses) | | | $ 1,000.00 | | | | $ 1,017.64 | | | | $ 7.63 | |
| * | Expenses are equal to the CM Adviser Fund’s annualized expense ratio of 1.50% for the period, multiplied by the average account value over the period, multiplied by 184/365 (to reflect the one-half year period). |
CM Advisers Fixed Income Fund
| | | Beginning | | | Ending | | | | |
| | | Account Value | | | Account Value | | | | |
| | | March 1, | | | August 31, | | | Expenses Paid | |
| | | 2009 | | | 2009 | | | During Period* | |
| | | | | | | | | | |
| Based on Actual Fund Return | | | $ 1,000.00 | | | | $ 1,113.30 | | | | $ 6.23 | |
| Based on Hypothetical 5% Return | | | | | | | | | | | | |
| (before expenses) | | | $ 1,000.00 | | | | $ 1,019.31 | | | | $ 5.96 | |
| * | Expenses are equal to the CM Advisers Fixed Income Fund’s annualized expense ratio of 1.17% for the period, multiplied by the average account value over the period, multiplied by 184/365 (to reflect the one-half year period). |
Other Information (Unaudited)
The Trust files a complete listing of portfolio holdings for the Funds with the SEC as of the first and third quarters of each fiscal year on Form N-Q. The filings are available upon request, by calling 1-888-859-5856. Furthermore, you may obtain a copy of these filings on the SEC’s website at http://www.sec.gov. The Trust’s Forms N-Q may also be reviewed and copied at the SEC’s Public Reference Room in Washington, DC, and information on the operation of the Public Reference Room may be obtained by calling 1-800-SEC-0330.
A description of the policies and procedures that the Funds use to determine how to vote proxies relating to portfolio securities is available without charge upon request by calling toll-free 1-888-859-5856, or on the SEC’s website at http://www.sec.gov. Information regarding how the Funds voted proxies relating to portfolio securities during the most recent 12-month period ended June 30 is also available without charge upon request by calling toll-free 1-888-859-5856, or on the SEC’s website at http://www.sec.gov.
This page intentionally left blank.
CM Advisers Fund and
CM Advisers Fixed Income Fund
are series of the
CM Advisers Family of Funds
| For Shareholder Service Inquiries: | For Investment Adviser Inquiries: |
| | |
| Ultimus Fund Solutions, LLC | Van Den Berg Management I, Inc. |
| P.O. Box 46707 | (d/b/a CM Fund Advisers) |
Cincinnati, OH 45246-0707 | 805 Las Cimas Parkway, Suite 430 |
| | Austin, Texas 78746 |
| | |
| Toll-Free Telephone: | Toll-Free Telephone: |
| 1-888-859-5856 | 1-888-859-5856 |
| | |
| | World Wide Web @: |
| | centman.com |
| Investment in the Funds is subject to investment risks, including the possible loss of some or all of the principal amount invested. No investment strategy works all the time, and past performance is not necessarily indicative of future performance. The performance information quoted in this report represents past performance, which is not a guarantee of future results. Investment return and principal value of an investment will fluctuate so that an investor’s shares, when redeemed, may be worth more or less than their original cost. Current performance may be lower or higher than the performance data quoted. A redemption fee of 1% of the amount redeemed is imposed on redemptions of Fund shares occurring within one year following the issuance of such shares for the CM Advisers Fund and occuring within 180 days following the issuance of such shares for the CM Advisers Fixed Income Fund. An investor should consider the investment objectives, risks, and charges and expenses of the Funds carefully before investing. The prospectus contains this and other information about the Funds. A copy of the prospectus is available at www.centman.com or by calling Shareholder Services at 1-888-859-5856. The prospectus should be read carefully before investing. |
For More Information on your CM Advisers Family of Funds:
See Our Web site @ www.centman.com or
Call Our Shareholder Services Group Toll-Free at 1-888-859-5856
Item 2. Code of Ethics.
Not required
Item 3. Audit Committee Financial Expert.
Not required
Item 4. Principal Accountant Fees and Services.
Not required
Item 5. Audit Committee of Listed Registrants.
Item 6. Schedule of Investments.
(a) Not applicable [schedule filed with Item 1]
Item 7. Disclosure of Proxy Voting Policies and Procedures for Closed-End Management Investment Companies.
Item 8. Portfolio Managers of Closed-End Management Investment Companies.
Item 9. Purchases of Equity Securities by Closed-End Management Investment Company and Affiliated Purchasers.
Item 10. Submission of Matters to a Vote of Security Holders.
The registrant has not adopted procedures by which shareholders may recommend nominees to the registrant’s board of trustees.
Item 11. Controls and Procedures.
(a) Based on their evaluation of the registrant’s disclosure controls and procedures (as defined in Rule 30a-3(c) under the Investment Company Act of 1940) as of a date within 90 days of the filing date of this report, the registrant’s principal executive officer and principal financial officer have concluded that such disclosure controls and procedures are reasonably designed and are operating effectively to ensure that material information relating to the registrant, including its consolidated subsidiaries, is made known to them by others within those entities, particularly during the period in which this report is being prepared, and that the information required in filings on Form N-CSR is recorded, processed, summarized, and reported on a timely basis.
(b) There were no changes in the registrant’s internal control over financial reporting (as defined in Rule 30a-3(d) under the Investment Company Act of 1940) that occurred during the second fiscal quarter of the period covered by this report that have materially affected, or are reasonably likely to materially affect, the registrant’s internal control over financial reporting.
Item 12. Exhibits.
File the exhibits listed below as part of this Form. Letter or number the exhibits in the sequence indicated.
(a)(1) Any code of ethics, or amendment thereto, that is the subject of the disclosure required by Item 2, to the extent that the registrant intends to satisfy the Item 2 requirements through filing of an exhibit: Not required
(a)(2) A separate certification for each principal executive officer and principal financial officer of the registrant as required by Rule 30a-2(a) under the Act (17 CFR 270.30a-2(a)): Attached hereto
(a)(3) Any written solicitation to purchase securities under Rule 23c-1 under the Act (17 CFR 270.23c-1) sent or given during the period covered by the report by or on behalf of the registrant to 10 or more persons: Not applicable
(b) Certifications required by Rule 30a-2(b) under the Act (17 CFR 270.30a-2(b)): Attached hereto
| Exhibit 99.CERT | Certifications required by Rule 30a-2(a) under the Act |
| Exhibit 99.906CERT | Certifications required by Rule 30a-2(b) under the Act |
SIGNATURES
Pursuant to the requirements of the Securities Exchange Act of 1934 and the Investment Company Act of 1940, the registrant has duly caused this report to be signed on its behalf by the undersigned, thereunto duly authorized.
(Registrant) CM Advisers Family of Funds
| By (Signature and Title)* | /s/ Arnold Van Den Berg | |
| | Arnold Van Den Berg, Chairman and President | |
Date October 29, 2009
Pursuant to the requirements of the Securities Exchange Act of 1934 and the Investment Company Act of 1940, this report has been signed below by the following persons on behalf of the registrant and in the capacities and on the dates indicated.
| By (Signature and Title)* | /s/ Arnold Van Den Berg | |
| | Arnold Van Den Berg, Chairman and President | |
Date October 29, 2009
| By (Signature and Title)* | /s/ James D. Brilliant | |
| | James D. Brilliant, Treasurer | |
Date _ October 29, 2009
* Print the name and title of each signing officer under his or her signature.