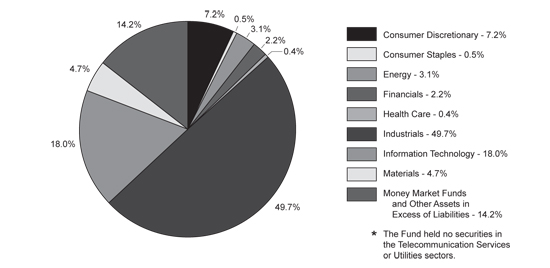
| CM Advisors Fund |
Portfolio Information August 31, 2012 (Unaudited) |
Asset and Sector Allocation*
Top 10 Equity Holdings
| | |
| Cisco Systems, Inc. | | 3.7% |
| Jacobs Engineering Group, Inc. | | 3.3% |
| Applied Materials, Inc. | | 2.9% |
| Intel Corporation | | 2.7% |
| Wells Fargo & Company | | 2.6% |
| Dell, Inc. | | 2.5% |
| Microsoft Corporation | | 2.4% |
| Orion Marine Group, Inc. | | 2.4% |
| Berkshire Hathaway, Inc. - Class B | | 2.3% |
| Tesco plc - ADR | | 2.1% |
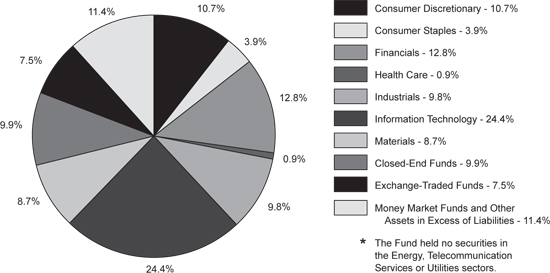
| CM Advisors Small Cap Value Fund |
Portfolio Information August 31, 2012 (Unaudited) |
Asset and Sector Allocation*
(% of Net Assets)
| | |
| Orion Marine Group, Inc. | | 2.8% |
| CDI Corporation | | 2.8% |
| Core-Mark Holding Company, Inc. | | 2.8% |
| Powell Industries, Inc. | | 2.8% |
| Steelcase, Inc. - Class A | | 2.5% |
| Universal Forest Products, Inc. | | 2.3% |
| Granite Construction, Inc. | | 2.3% |
| Benchmark Electronics, Inc. | | 2.3% |
| Apogee Enterprises, Inc. | | 2.2% |
| Vishay Precision Group, Inc. | | 2.2% |
| CM Advisors Opportunity Fund |
Portfolio Information August 31, 2012 (Unaudited) |
Asset and Sector Allocation*
(% of Net Assets)
Top 10 Equity Holdings
| | |
| Direxion Daily Small Cap Bear 3X Shares | | 7.5% |
| Central GoldTrust | | 5.1% |
| Japan Smaller Capitalization Fund, Inc. | | 4.8% |
| Safety Insurance Group, Inc. | | 2.8% |
| CalAmp Corporation | | 2.8% |
| Shaw Group, Inc. (The) | | 2.6% |
| Core-Mark Holding Company, Inc. | | 2.6% |
| USANA Health Sciences, Inc. | | 2.6% |
| PennyMac Mortgage Investment Trust | | 2.6% |
| Netspend Holdings, Inc. | | 2.5% |
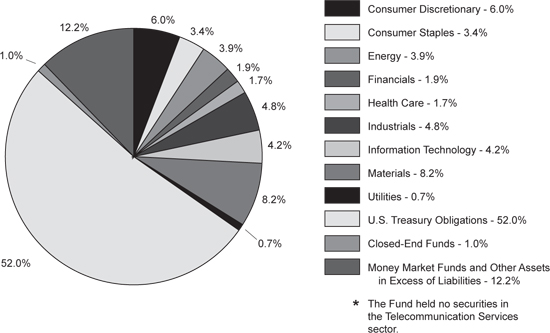
| CM Advisors Fixed Income Fund |
Portfolio Information August 31, 2012 (Unaudited) |
Asset and Sector Allocation*
(% of Net Assets)
Top 10 Long-Term Holdings
| | |
| Alcoa, Inc., 5.87%, due 02/23/22 | | 1.2% |
| Western Union Company (The), 6.20%, due 11/17/36 | | 1.2% |
| Rowan Companies, Inc., 7.875%, due 08/01/19 | | 1.1% |
| American Express Company, 7.00%, due 03/19/18 | | 1.0% |
| Transocean, Inc., 7.375%, due 04/15/18 | | 1.0% |
| Advance Auto Parts, Inc., 5.75%, due 05/01/20 | | 1.0% |
| UnitedHealth Group, Inc., 6.00%, due 02/15/18 | | 1.0% |
| Canadian Pacific Railroad Company, 7.25%, due 05/15/19 | | 1.0% |
| ArcelorMittal, 4.75%, due 02/25/17 | | 0.9% |
| Kraft Foods, Inc., 6.125%, due 02/01/18 | | 0.9% |
| CM Advisors Fund |
Schedule of Investments August 31, 2012 (Unaudited) |
| | | | | | |
| Consumer Discretionary — 5.8% | | | | | | |
| Auto Components — 0.1% | | | | | | |
| Drew Industries, Inc. * | | | 2,575 | | | $ | 74,598 | |
| | | | | | | | | |
| Distributors — 1.0% | | | | | | | | |
| Core-Mark Holding Company, Inc. | | | 25,945 | | | | 1,181,535 | |
| | | | | | | | | |
Hotels, Restaurants & Leisure — 0.0% (a) | | | | | | | | |
| WMS Industries, Inc. * | | | 1,930 | | | | 30,745 | |
| | | | | | | | | |
| Household Durables — 2.4% | | | | | | | | |
| MDC Holdings, Inc. | | | 57,600 | | | | 1,997,568 | |
| Toll Brothers, Inc. * | | | 28,870 | | | | 944,626 | |
| | | | | | | | 2,942,194 | |
| Media — 0.3% | | | | | | | | |
| Comcast Corporation - Class A Special | | | 12,900 | | | | 424,023 | |
| | | | | | | | | |
| Specialty Retail — 2.0% | | | | | | | | |
| Advance Auto Parts, Inc. | | | 300 | | | | 21,336 | |
| Staples, Inc. | | | 227,445 | | | | 2,483,700 | |
| | | | | | | | 2,505,036 | |
| Consumer Staples — 2.2% | | | | | | | | |
| Food & Staples Retailing — 2.1% | | | | | | | | |
| Kroger Company (The) | | | 230 | | | | 5,124 | |
| Tesco plc - ADR | | | 160,090 | | | | 2,579,050 | |
| | | | | | | | 2,584,174 | |
Food Products — 0.0% (a) | | | | | | | | |
| Kellogg Company | | | 620 | | | | 31,403 | |
| | | | | | | | | |
| Personal Products — 0.1% | | | | | | | | |
| LifeVantage Corporation * | | | 53,000 | | | | 157,940 | |
| | | | | | | | | |
| Energy — 3.7% | | | | | | | | |
| Energy Equipment & Services — 1.7% | | | | | | | | |
| Dawson Geophysical Company * | | | 28,595 | | | | 608,216 | |
| Tidewater, Inc. | | | 31,120 | | | | 1,476,021 | |
| Unit Corporation * | | | 600 | | | | 23,868 | |
| | | | | | | | 2,108,105 | |
| Oil, Gas & Consumable Fuels — 2.0% | | | | | | | | |
| Exxon Mobil Corporation | | | 14,085 | | | | 1,229,621 | |
| Total S.A. - ADR | | | 25,425 | | | | 1,267,690 | |
| Valero Energy Corporation | | | 910 | | | | 28,447 | |
| | | | | | | | 2,525,758 | |
| CM Advisors Fund |
Schedule of Investments (Continued) |
COMMON STOCKS — 76.0% (Continued) | | | | | | |
| Financials — 7.4% | | | | | | |
Capital Markets — 0.0% (a) | | | | | | |
| Charles Schwab Corporation (The) | | | 820 | | | $ | 11,062 | |
| | | | | | | | | |
| Commercial Banks — 2.6% | | | | | | | | |
| Wells Fargo & Company | | | 94,747 | | | | 3,224,240 | |
| | | | | | | | | |
| Consumer Finance — 1.4% | | | | | | | | |
| American Express Company | | | 29,630 | | | | 1,727,429 | |
| | | | | | | | | |
| Insurance — 3.4% | | | | | | | | |
| Berkshire Hathaway, Inc. - Class B * | | | 33,900 | | | | 2,859,126 | |
| Marsh & McLennan Companies, Inc. | | | 38,332 | | | | 1,309,805 | |
| Selective Insurance Group, Inc. | | | 3,710 | | | | 66,520 | |
| | | | | | | | 4,235,451 | |
| Health Care — 2.1% | | | | | | | | |
| Health Care Equipment & Supplies — 1.1% | | | | | | | | |
| Medtronic, Inc. | | | 34,675 | | | | 1,409,885 | |
| | | | | | | | | |
| Health Care Providers & Services — 0.3% | | | | | | | | |
| VCA Antech, Inc. * | | | 17,640 | | | | 341,158 | |
| | | | | | | | | |
| Life Sciences Tools & Services — 0.7% | | | | | | | | |
| Thermo Fisher Scientific, Inc. | | | 14,125 | | | | 810,069 | |
| | | | | | | | | |
| Industrials — 27.7% | | | | | | | | |
| Aerospace & Defense — 0.3% | | | | | | | | |
| Innovative Solutions & Support, Inc. * | | | 81,956 | | | | 316,350 | |
| | | | | | | | | |
| Building Products — 4.0% | | | | | | | | |
| Apogee Enterprises, Inc. | | | 68,830 | | | | 1,087,514 | |
| Fortune Brands Home & Security, Inc. * | | | 40,400 | | | | 1,030,200 | |
| Insteel Industries, Inc. | | | 121,073 | | | | 1,213,152 | |
| Masonite Worldwide Holdings, Inc. * | | | 4,415 | | | | 131,346 | |
| Universal Forest Products, Inc. | | | 37,195 | | | | 1,429,404 | |
| | | | | | | | 4,891,616 | |
| Commercial Services & Supplies — 2.6% | | | | | | | | |
| ABM Industries, Inc. | | | 61,582 | | | | 1,245,188 | |
| Steelcase, Inc. - Class A | | | 197,025 | | | | 1,911,143 | |
| | | | | | | | 3,156,331 | |
| Construction & Engineering — 7.1% | | | | | | | | |
| Granite Construction, Inc. | | | 32,675 | | | | 900,850 | |
| Jacobs Engineering Group, Inc. * | | | 104,450 | | | | 4,129,953 | |
| Layne Christensen Company * | | | 44,400 | | | | 863,136 | |
| Orion Marine Group, Inc. * | | | 385,115 | | | | 2,934,576 | |
| | | | | | | | 8,828,515 | |
| CM Advisors Fund |
Schedule of Investments (Continued) |
COMMON STOCKS — 76.0% (Continued) | | | | | | |
| Industrials — 27.7% (Continued) | | | | | | |
| Electrical Equipment — 4.3% | | | | | | |
| Emerson Electric Company | | | 48,845 | | | $ | 2,477,418 | |
| Encore Wire Corporation | | | 31,310 | | | | 886,699 | |
| II-VI, Inc. * | | | 3,925 | | | | 73,005 | |
| Powell Industries, Inc. * | | | 39,940 | | | | 1,514,525 | |
| Servotronics, Inc. | | | 41,598 | | | | 355,663 | |
| | | | | | | | 5,307,310 | |
| Industrial Conglomerates — 1.6% | | | | | | | | |
| 3M Company | | | 21,400 | | | | 1,981,640 | |
| | | | | | | | | |
| Machinery — 4.8% | | | | | | | | |
| Astec Industries, Inc. * | | | 82,693 | | | | 2,425,386 | |
| Harsco Corporation | | | 103,680 | | | | 2,114,035 | |
| L.S. Starrett Company (The) | | | 3,434 | | | | 43,543 | |
| Lydall, Inc. * | | | 97,567 | | | | 1,251,785 | |
| Omega Flex, Inc. * | | | 13,331 | | | | 141,975 | |
| | | | | | | | 5,976,724 | |
Marine — 0.0% (a) | | | | | | | | |
| Kirby Corporation * | | | 750 | | | | 39,487 | |
| | | | | | | | | |
| Professional Services — 2.1% | | | | | | | | |
| CDI Corporation | | | 89,174 | | | | 1,468,696 | |
| Heidrick & Struggles International, Inc. | | | 37,010 | | | | 455,963 | |
| Korn/Ferry International * | | | 46,015 | | | | 658,014 | |
| | | | | | | | 2,582,673 | |
| Trading Companies & Distributors — 0.9% | | | | | | | | |
| Lawson Products, Inc. | | | 139,522 | | | | 1,116,176 | |
| | | | | | | | | |
| Information Technology — 24.5% | | | | | | | | |
| Communications Equipment — 3.7% | | | | | | | | |
| Cisco Systems, Inc. | | | 237,590 | | | | 4,533,217 | |
| PCTEL, Inc. | | | 8,908 | | | | 56,121 | |
| | | | | | | | 4,589,338 | |
| Computers & Peripherals — 2.9% | | | | | | | | |
| Dell, Inc. * | | | 291,255 | | | | 3,084,390 | |
| Hewlett-Packard Company | | | 5,080 | | | | 85,750 | |
| Hutchinson Technology, Inc. * | | | 221,295 | | | | 367,350 | |
| | | | | | | | 3,537,490 | |
| Electronic Equipment, Instruments & Components — 7.7% | | | | | | | | |
| Benchmark Electronics, Inc. * | | | 92,640 | | | | 1,486,872 | |
| Corning, Inc. | | | 182,860 | | | | 2,192,491 | |
| Maxwell Technologies, Inc. * | | | 180,650 | | | | 1,374,747 | |
| Molex, Inc. | | | 27,575 | | | | 732,116 | |
| Newport Corporation * | | | 88,445 | | | | 1,099,371 | |
| CM Advisors Fund |
Schedule of Investments (Continued) |
COMMON STOCKS — 76.0% (Continued) | | | | | | |
| Information Technology — 24.5% (Continued) | | | | | | |
| Electronic Equipment, Instruments & Components — 7.7% (Continued) | | | | | | |
| Perceptron, Inc. * | | | 120,169 | | | $ | 684,963 | |
| Planar Systems, Inc. * | | | 141,435 | | | | 183,866 | |
| Vishay Precision Group, Inc. * | | | 126,690 | | | | 1,715,383 | |
| | | | | | | | 9,469,809 | |
| Internet Software & Services — 0.1% | | | | | | | | |
| EarthLink, Inc. | | | 17,080 | | | | 114,094 | |
| Velti plc * | | | 7,330 | | | | 50,797 | |
| | | | | | | | 164,891 | |
| IT Services — 1.4% | | | | | | | | |
| Paychex, Inc. | | | 51,010 | | | | 1,696,593 | |
| | | | | | | | | |
| Semiconductors & Semiconductor Equipment — 6.3% | | | | | | | | |
| Applied Materials, Inc. | | | 310,050 | | | | 3,624,485 | |
| Cohu, Inc. | | | 6,880 | | | | 60,544 | |
| Intel Corporation | | | 134,510 | | | | 3,339,883 | |
| Rudolph Technologies, Inc. * | | | 82,070 | | | | 766,534 | |
| | | | | | | | 7,791,446 | |
| Software — 2.4% | | | | | | | | |
| Microsoft Corporation | | | 96,570 | | | | 2,976,287 | |
| | | | | | | | | |
| Materials — 2.6% | | | | | | | | |
Chemicals — 0.0% (a) | | | | | | | | |
| Olin Corporation | | | 935 | | | | 20,037 | |
| | | | | | | | | |
| Metals & Mining — 2.6% | | | | | | | | |
| Comstock Mining, Inc. * | | | 290,725 | | | | 860,546 | |
| Newmont Mining Corporation | | | 44,900 | | | | 2,275,532 | |
| | | | | | | | 3,136,078 | |
Utilities — 0.0% (a) | | | | | | | | |
Electric Utilities — 0.0% (a) | | | | | | | | |
| Exelon Corporation | | | 1,080 | | | | 39,388 | |
| | | | | | | | | |
Total Common Stocks (Cost $84,911,533) | | | | | | $ | 93,942,984 | |
| | | | | | |
| Wells Fargo & Company * (Cost $130,130) | | | 16,900 | | | $ | 170,859 | |
| CM Advisors Fund |
Schedule of Investments (Continued) |
MONEY MARKET FUNDS — 23.9% | | | | | | |
Wells Fargo Advantage Treasury Plus Money Market Fund - Institutional Class, 0.01% (b) (Cost $29,492,436) | | | 29,492,436 | | | $ | 29,492,436 | |
| | | | | | | | | |
Total Investments at Value — 100.0% (Cost $114,534,099) | | | | | | $ | 123,606,279 | |
| | | | | | | | | |
Liabilities in Excess of Other Assets — (0.0%) (a) | | | | | | | (8,183 | ) |
| | | | | | | | | |
| Net Assets — 100.0% | | | | | | $ | 123,598,096 | |
| ADR - American Depositary Receipt. |
| * | Non-income producing security. |
| (a) | Percentage rounds to less than 0.1%. |
| (b) | Variable rate security. The rate shown is the 7-day effective yield as of August 31, 2012. |
| See accompanying notes to financial statements. |
| CM Advisors Small Cap Value Fund |
Schedule of Investments August 31, 2012 (Unaudited) |
| | | | | | |
| Consumer Discretionary — 7.2% | | | | | | |
| Auto Components — 1.1% | | | | | | |
| Drew Industries, Inc. * | | | 3,605 | | | $ | 104,437 | |
| | | | | | | | | |
| Distributors — 2.8% | | | | | | | | |
| Core-Mark Holding Company, Inc. | | | 5,800 | | | | 264,132 | |
| | | | | | | | | |
| Hotels, Restaurants & Leisure — 1.6% | | | | | | | | |
| WMS Industries, Inc. * | | | 9,825 | | | | 156,512 | |
| | | | | | | | | |
| Household Durables — 1.7% | | | | | | | | |
| MDC Holdings, Inc. | | | 3,450 | | | | 119,646 | |
| Toll Brothers, Inc. * | | | 1,200 | | | | 39,264 | |
| | | | | | | | 158,910 | |
| Consumer Staples — 0.5% | | | | | | | | |
| Personal Products — 0.5% | | | | | | | | |
| LifeVantage Corporation * | | | 15,500 | | | | 46,190 | |
| | | | | | | | | |
| Energy — 3.1% | | | | | | | | |
| Energy Equipment & Services — 3.1% | | | | | | | | |
| Dawson Geophysical Company * | | | 4,325 | | | | 91,993 | |
| Tidewater, Inc. | | | 3,285 | | | | 155,807 | |
| Unit Corporation * | | | 1,200 | | | | 47,736 | |
| | | | | | | | 295,536 | |
| Financials — 2.2% | | | | | | | | |
| Commercial Banks — 1.2% | | | | | | | | |
| Glacier Bancorp, Inc. | | | 7,235 | | | | 111,491 | |
| | | | | | | | | |
| Insurance — 1.0% | | | | | | | | |
| Selective Insurance Group, Inc. | | | 5,490 | | | | 98,436 | |
| | | | | | | | | |
| Health Care — 0.4% | | | | | | | | |
| Health Care Providers & Services — 0.4% | | | | | | | | |
| VCA Antech, Inc. * | | | 2,075 | | | | 40,131 | |
| | | | | | | | | |
| Industrials — 49.7% | | | | | | | | |
| Aerospace & Defense — 2.5% | | | | | | | | |
| Curtiss-Wright Corporation | | | 2,695 | | | | 81,012 | |
| Innovative Solutions & Support, Inc. * | | | 39,650 | | | | 153,049 | |
| | | | | | | | 234,061 | |
| Building Products — 9.9% | | | | | | | | |
| Apogee Enterprises, Inc. | | | 13,220 | | | | 208,876 | |
| Fortune Brands Home & Security, Inc. * | | | 3,522 | | | | 89,811 | |
| Insteel Industries, Inc. | | | 20,204 | | | | 202,444 | |
| CM Advisors Small Cap Value Fund |
Schedule of Investments (Continued) |
COMMON STOCKS — 85.8% (Continued) | | | | | | |
| Industrials — 49.7% (Continued) | | | | | | |
| Building Products — 9.9% (Continued) | | | | | | |
| Masonite Worldwide Holdings, Inc. * | | | 3,585 | | | $ | 106,654 | |
| Quanex Building Products Corporation | | | 5,800 | | | | 101,500 | |
| Universal Forest Products, Inc. | | | 5,755 | | | | 221,164 | |
| | | | | | | | 930,449 | |
| Commercial Services & Supplies — 4.3% | | | | | | | | |
| ABM Industries, Inc. | | | 8,350 | | | | 168,837 | |
| Steelcase, Inc. - Class A | | | 24,660 | | | | 239,202 | |
| | | | | | | | 408,039 | |
| Construction & Engineering — 8.2% | | | | | | | | |
| EMCOR Group, Inc. | | | 5,730 | | | | 158,320 | |
| Granite Construction, Inc. | | | 7,945 | | | | 219,044 | |
| Layne Christensen Company * | | | 6,780 | | | | 131,803 | |
| Orion Marine Group, Inc. * | | | 35,188 | | | | 268,132 | |
| | | | | | | | 777,299 | |
| Electrical Equipment — 7.9% | | | | | | | | |
| Encore Wire Corporation | | | 6,584 | | | | 186,459 | |
| II-VI, Inc. * | | | 8,865 | | | | 164,889 | |
| Powell Industries, Inc. * | | | 6,885 | | | | 261,079 | |
| Servotronics, Inc. | | | 15,414 | | | | 131,790 | |
| | | | | | | | 744,217 | |
| Machinery — 8.6% | | | | | | | | |
| Astec Industries, Inc. * | | | 5,490 | | | | 161,022 | |
| Flow International Corporation * | | | 5,745 | | | | 18,958 | |
| Harsco Corporation | | | 9,800 | | | | 199,822 | |
| L.S. Starrett Company (The) | | | 8,629 | | | | 109,416 | |
| Lydall, Inc. * | | | 13,765 | | | | 176,605 | |
| Omega Flex, Inc. * | | | 14,043 | | | | 149,558 | |
| | | | | | | | 815,381 | |
| Marine — 0.8% | | | | | | | | |
| Kirby Corporation * | | | 1,400 | | | | 73,710 | |
| | | | | | | | | |
| Professional Services — 5.9% | | | | | | | | |
| CDI Corporation | | | 16,240 | | | | 267,473 | |
| Heidrick & Struggles International, Inc. | | | 13,010 | | | | 160,283 | |
| Korn/Ferry International * | | | 9,260 | | | | 132,418 | |
| | | | | | | | 560,174 | |
| Trading Companies & Distributors — 1.6% | | | | | | | | |
| Lawson Products, Inc. | | | 19,327 | | | | 154,616 | |
| | | | | | | | | |
| Information Technology — 18.0% | | | | | | | | |
| Communications Equipment — 0.5% | | | | | | | | |
| PCTEL, Inc. | | | 7,856 | | | | 49,493 | |
| CM Advisors Small Cap Value Fund |
Schedule of Investments (Continued) |
COMMON STOCKS — 85.8% (Continued) | | | | | | |
| Information Technology — 18.0% (Continued) | | | | | | |
| Computers & Peripherals — 0.7% | | | | | | |
| Hutchinson Technology, Inc. * | | | 37,245 | | | $ | 61,827 | |
| | | | | | | | | |
| Electronic Equipment, Instruments & Components — 10.3% | | | | | | | | |
| Benchmark Electronics, Inc. * | | | 13,645 | | | | 219,002 | |
| Electro Scientific Industries, Inc. | | | 2,545 | | | | 31,202 | |
| Maxwell Technologies, Inc. * | | | 17,788 | | | | 135,367 | |
| Newport Corporation * | | | 13,030 | | | | 161,963 | |
| Perceptron, Inc. * | | | 34,944 | | | | 199,181 | |
| Planar Systems, Inc. * | | | 19,900 | | | | 25,870 | |
| Vishay Precision Group, Inc. * | | | 15,160 | | | | 205,266 | |
| | | | | | | | 977,851 | |
| Internet Software & Services — 2.1% | | | | | | | | |
| EarthLink, Inc. | | | 14,045 | | | | 93,820 | |
| Velti plc * | | | 15,000 | | | | 103,950 | |
| | | | | | | | 197,770 | |
| Semiconductors & Semiconductor Equipment — 4.4% | | | | | | | | |
| Cohu, Inc. | | | 18,839 | | | | 165,783 | |
| CyberOptics Corporation * | | | 2,949 | | | | 18,756 | |
| International Rectifier Corporation * | | | 2,180 | | | | 37,954 | |
| Rudolph Technologies, Inc. * | | | 20,850 | | | | 194,739 | |
| | | | | | | | 417,232 | |
| Materials — 4.7% | | | | | | | | |
| Chemicals — 0.8% | | | | | | | | |
| Olin Corporation | | | 3,200 | | | | 68,576 | |
| | | | | | | | | |
| Metals & Mining — 3.9% | | | | | | | | |
| Comstock Mining, Inc. * | | | 60,505 | | | | 179,095 | |
| Synalloy Corporation | | | 14,644 | | | | 191,836 | |
| | | | | | | | 370,931 | |
| | | | | | | | | |
Total Common Stocks (Cost $7,569,098) | | | | | | $ | 8,117,401 | |
| CM Advisors Small Cap Value Fund |
Schedule of Investments (Continued) |
MONEY MARKET FUNDS — 12.8% | | | | | | |
Wells Fargo Advantage Treasury Plus Money Market Fund - Institutional Class, 0.01% (a) (Cost $1,211,622) | | | 1,211,622 | | | $ | 1,211,622 | |
| | | | | | | | | |
Total Investments at Value — 98.6% (Cost $8,780,720) | | | | | | $ | 9,329,023 | |
| | | | | | | | | |
| Other Assets in Excess of Liabilities — 1.4% | | | | | | | 128,179 | |
| | | | | | | | | |
| Net Assets — 100.0% | | | | | | $ | 9,457,202 | |
| * | Non-income producing security. |
| (a) | Variable rate security. The rate shown is the 7-day effective yield as of August 31, 2012. |
| See accompanying notes to financial statements. |
| CM Advisors Opportunity Fund |
Schedule of Investments August 31, 2012 (Unaudited) |
| | | | | | |
| Consumer Discretionary — 10.7% | | | | | | |
| Distributors — 2.6% | | | | | | |
| Core-Mark Holding Company, Inc. | | | 1,000 | | | $ | 45,540 | |
| | | | | | | | | |
| Hotels, Restaurants & Leisure — 1.9% | | | | | | | | |
| Kona Grill, Inc. * | | | 2,000 | | | | 17,060 | |
| Multimedia Games Holding Company, Inc. * | | | 1,100 | | | | 17,237 | |
| | | | | | | | 34,297 | |
| Household Durables — 2.5% | | | | | | | | |
| SodaStream International, Ltd. * | | | 1,150 | | | | 44,378 | |
| | | | | | | | | |
| Internet & Catalog Retail — 1.2% | | | | | | | | |
| Gaiam, Inc. - Class A * | | | 6,000 | | | | 20,820 | |
| | | | | | | | | |
| Leisure Equipment & Products — 2.5% | | | | | | | | |
| LeapFrog Enterprises, Inc. * | | | 1,900 | | | | 20,596 | |
| Nautilus, Inc. * | | | 10,000 | | | | 23,600 | |
| | | | | | | | 44,196 | |
| Consumer Staples — 3.9% | | | | | | | | |
| Personal Products — 3.9% | | | | | | | | |
| LifeVantage Corporation * | | | 7,970 | | | | 23,751 | |
| USANA Health Sciences, Inc. * | | | 1,000 | | | | 45,350 | |
| | | | | | | | 69,101 | |
| Financials — 12.8% | | | | | | | | |
| Commercial Banks — 1.9% | | | | | | | | |
| Wilshire Bancorp, Inc. * | | | 5,400 | | | | 33,804 | |
| | | | | | | | | |
| Consumer Finance — 2.5% | | | | | | | | |
| Netspend Holdings, Inc. * | | | 4,700 | | | | 44,556 | |
| | | | | | | | | |
| Insurance — 5.8% | | | | | | | | |
| First American Financial Corporation | | | 1,200 | | | | 23,124 | |
| ProAssurance Corporation | | | 330 | | | | 29,446 | |
| Safety Insurance Group, Inc. | | | 1,100 | | | | 49,819 | |
| | | | | | | | 102,389 | |
| Real Estate Investment Trusts (REIT) — 2.6% | | | | | | | | |
| PennyMac Mortgage Investment Trust | | | 2,100 | | | | 45,234 | |
| | | | | | | | | |
| Health Care — 0.9% | | | | | | | | |
| Biotechnology — 0.9% | | | | | | | | |
| Biospecifics Technologies Corporation * | | | 858 | | | | 16,113 | |
| CM Advisors Opportunity Fund |
Schedule of Investments (Continued) |
COMMON STOCKS — 71.2% (Continued) | | | | | | |
| Industrials — 9.8% | | | | | | |
| Aerospace & Defense — 1.5% | | | | | | |
| TASER International, Inc. * | | | 5,000 | | | $ | 26,750 | |
| | | | | | | | | |
| Construction & Engineering — 6.2% | | | | | | | | |
| Argan, Inc. | | | 2,000 | | | | 33,500 | |
| MYR Group, Inc. * | | | 1,500 | | | | 30,510 | |
| Shaw Group, Inc. (The) * | | | 1,100 | | | | 46,288 | |
| | | | | | | | 110,298 | |
| Electrical Equipment — 0.3% | | | | | | | | |
| Active Power, Inc. * | | | 5,900 | | | | 4,484 | |
| | | | | | | | | |
| Machinery — 1.8% | | | | | | | | |
| Lydall, Inc. * | | | 2,500 | | | | 32,075 | |
| | | | | | | | | |
| Information Technology — 24.4% | | | | | | | | |
| Communications Equipment — 3.8% | | | | | | | | |
| Brocade Communications Systems, Inc. * | | | 3,100 | | | | 17,980 | |
| CalAmp Corporation * | | | 6,500 | | | | 49,400 | |
| | | | | | | | 67,380 | |
| Electronic Equipment, Instruments & Components — 4.1% | | | | | | | | |
| Daktronics, Inc. | | | 3,100 | | | | 29,636 | |
| IPG Photonics Corporation * | | | 700 | | | | 43,043 | |
| | | | | | | | 72,679 | |
| Internet Software & Services — 5.2% | | | | | | | | |
| Ancestry.com, Inc. * | | | 1,000 | | | | 31,080 | |
| AOL, Inc. * | | | 900 | | | | 30,303 | |
| Velti PLC * | | | 4,400 | | | | 30,492 | |
| | | | | | | | 91,875 | |
| IT Services — 2.4% | | | | | | | | |
| Syntel, Inc. | | | 750 | | | | 43,725 | |
| | | | | | | | | |
| Semiconductors & Semiconductor Equipment — 4.4% | | | | | | | | |
| Cirrus Logic, Inc. * | | | 400 | | | | 16,668 | |
| Kulicke & Soffa Industries, Inc. * | | | 3,900 | | | | 44,187 | |
| PDF Solutions, Inc. * | | | 1,400 | | | | 16,870 | |
| | | | | | | | 77,725 | |
| Software — 4.5% | | | | | | | | |
| KongZhong Corporation - ADR * | | | 6,435 | | | | 43,565 | |
| Tangoe, Inc. * | | | 2,200 | | | | 35,640 | |
| | | | | | | | 79,205 | |
| Materials — 8.7% | | | | | | | | |
| Construction Materials — 1.9% | | | | | | | | |
| Eagle Materials, Inc. | | | 800 | | | | 34,120 | |
| CM Advisors Opportunity Fund |
Schedule of Investments (Continued) |
COMMON STOCKS — 71.2% (Continued) | | | | | | |
| Materials — 8.7% (Continued) | | | | | | |
| Metals & Mining — 6.8% | | | | | | |
| Comstock Mining, Inc. * | | | 12,000 | | | $ | 35,520 | |
| Nevsun Resources Ltd. | | | 6,500 | | | | 26,195 | |
| Primero Mining Corporation * | | | 5,200 | | | | 23,348 | |
| RTI International Metals, Inc. * | | | 1,600 | | | | 34,704 | |
| | | | | | | | 119,767 | |
| | | | | | | | | |
Total Common Stocks (Cost $1,239,570) | | | | | | $ | 1,260,511 | |
| | | | | | |
| Central GoldTrust * | | | 1,365 | | | $ | 89,408 | |
| Japan Smaller Capitalization Fund, Inc. | | | 12,000 | | | | 85,680 | |
Total Closed-End Funds (Cost $173,285) | | | | | | $ | 175,088 | |
EXCHANGE-TRADED FUNDS — 7.5% | | | | | | |
| Direxion Daily Small Cap Bear 3X Shares * (Cost $145,109) | | | 8,000 | | | $ | 132,400 | |
MONEY MARKET FUNDS — 8.2% | | | | | | |
Wells Fargo Advantage Treasury Plus Money Market Fund - Institutional Class, 0.01% (a) (Cost $144,834) | | | 144,834 | | | $ | 144,834 | |
| | | | | | | | | |
Total Investments at Value — 96.8% (Cost $1,702,798) | | | | | | $ | 1,712,833 | |
| | | | | | | | | |
| Other Assets in Excess of Liabilities — 3.2% | | | | | | | 57,059 | |
| | | | | | | | | |
| Net Assets — 100.0% | | | | | | $ | 1,769,892 | |
| ADR - American Depositary Receipt. |
| * | Non-income producing security. |
| (a) | Variable rate security. The rate shown is the 7-day effective yield as of August 31, 2012. |
| See accompanying notes to financial statements. |
| CM Advisors Fixed Income Fund |
Schedule of Investments August 31, 2012 (Unaudited) |
| | | | | | |
| Consumer Discretionary — 6.0% | | | | | | |
| Auto Components — 0.4% | | | | | | |
| Johnson Controls, Inc., 5.50%, due 01/15/16 | | $ | 400,000 | | | $ | 452,595 | |
| | | | | | | | | |
| Hotels, Restaurants & Leisure — 0.8% | | | | | | | | |
| Marriott International, Inc., 6.375%, due 06/15/17 | | | 400,000 | | | | 471,589 | |
| Starbucks Corporation, 6.25%, due 08/15/17 | | | 300,000 | | | | 364,019 | |
| | | | | | | | 835,608 | |
| Household Durables — 0.9% | | | | | | | | |
| MDC Holdings, Inc., 5.625%, due 02/01/20 | | | 500,000 | | | | 511,289 | |
| Newell Rubbermaid, Inc., 6.25%, due 04/15/18 | | | 185,000 | | | | 214,409 | |
| Toll Brothers Finance Corporation, 5.15%, due 05/15/15 | | | 150,000 | | | | 158,700 | |
| | | | | | | | 884,398 | |
| Media — 1.4% | | | | | | | | |
| Comcast Corporation, | | | | | | | | |
| 6.30%, due 11/15/17 | | | 200,000 | | | | 246,241 | |
| 5.70%, due 05/15/18 | | | 400,000 | | | | 483,878 | |
| McGraw-Hill Companies, Inc. (The), 5.90%, due 11/15/17 | | | 200,000 | | | | 234,873 | |
| Tele-Communications, Inc., 10.125%, due 04/15/22 | | | 300,000 | | | | 447,759 | |
| | | | | | | | 1,412,751 | |
| Multiline Retail — 0.7% | | | | | | | | |
| Kohl's Corporation, | | | | | | | | |
| 6.25%, due 12/15/17 | | | 500,000 | | | | 609,054 | |
| 6.00%, due 01/15/33 | | | 100,000 | | | | 115,375 | |
| | | | | | | | 724,429 | |
| Specialty Retail — 1.8% | | | | | | | | |
| Advance Auto Parts, Inc., 5.75%, due 05/01/20 | | | 875,000 | | | | 999,064 | |
| Home Depot, Inc. (The), 5.40%, due 03/01/16 | | | 600,000 | | | | 696,139 | |
| Staples, Inc., 9.75%, due 01/15/14 | | | 100,000 | | | | 111,689 | |
| | | | | | | | 1,806,892 | |
| Consumer Staples — 3.4% | | | | | | | | |
| Beverages — 1.2% | | | | | | | | |
| Coca-Cola Company (The), 5.35%, due 11/15/17 | | | 770,000 | | | | 931,826 | |
| PepsiCo, Inc., 5.00%, due 06/01/18 | | | 300,000 | | | | 355,937 | |
| | | | | | | | 1,287,763 | |
| Food Products — 0.9% | | | | | | | | |
| Kraft Foods, Inc., 6.125%, due 02/01/18 | | | 770,000 | | | | 936,897 | |
| | | | | | | | | |
| Household Products — 0.4% | | | | | | | | |
| Clorox Company (The), 5.45%, due 10/15/12 | | | 370,000 | | | | 372,016 | |
| CM Advisors Fixed Income Fund |
Schedule of Investments (Continued) |
CORPORATE BONDS — 34.8% (Continued) | | | | | | |
| Consumer Staples — 3.4% (Continued) | | | | | | |
| Personal Products — 0.9% | | | | | | |
| Avon Products, Inc., 6.50%, due 03/01/19 | | $ | 840,000 | | | $ | 887,078 | |
| | | | | | | | | |
| Energy — 3.9% | | | | | | | | |
| Energy Equipment & Services — 2.8% | | | | | | | | |
| Rowan Companies, Inc., 7.875%, due 08/01/19 | | | 910,000 | | | | 1,110,864 | |
| Transocean, Inc., 7.375%, due 04/15/18 | | | 855,000 | | | | 1,010,596 | |
| Weatherford International Ltd., | | | | | | | | |
| 6.35%, due 06/15/17 | | | 370,000 | | | | 428,557 | |
| 6.00%, due 03/15/18 | | | 300,000 | | | | 342,456 | |
| | | | | | | | 2,892,473 | |
| Oil, Gas & Consumable Fuels — 1.1% | | | | | | | | |
| Valero Energy Corporation, | | | | | | | | |
| 6.125%, due 06/15/17 | | | 570,000 | | | | 678,382 | |
| 10.50%, due 03/15/39 | | | 250,000 | | | | 387,356 | |
| | | | | | | | 1,065,738 | |
| Financials — 1.9% | | | | | | | | |
| Commercial Banks — 0.6% | | | | | | | | |
| Wells Fargo & Company, 5.625%, due 12/11/17 | | | 500,000 | | | | 598,792 | |
| | | | | | | | | |
| Consumer Finance — 1.3% | | | | | | | | |
| American Express Company, | | | | | | | | |
| 7.00%, due 03/19/18 | | | 800,000 | | | | 1,015,069 | |
| 8.125%, due 05/20/19 | | | 200,000 | | | | 270,932 | |
| | | | | | | | 1,286,001 | |
| Health Care — 1.7% | | | | | | | | |
| Health Care Providers & Services — 1.0% | | | | | | | | |
| UnitedHealth Group, Inc., 6.00%, due 02/15/18 | | | 800,000 | | | | 986,210 | |
| | | | | | | | | |
| Pharmaceuticals — 0.7% | | | | | | | | |
| Johnson & Johnson, 5.15%, due 07/15/18 | | | 570,000 | | | | 700,401 | |
| | | | | | | | | |
| Industrials — 4.8% | | | | | | | | |
| Aerospace & Defense — 0.3% | | | | | | | | |
| United Technologies Corporation, 5.375%, due 12/15/17 | | | 200,000 | | | | 243,285 | |
| | | | | | | | | |
| Building Products — 0.7% | | | | | | | | |
| Masco Corporation, | | | | | | | | |
| 6.125%, due 10/03/16 | | | 300,000 | | | | 326,849 | |
| 5.85%, due 03/15/17 | | | 400,000 | | | | 421,776 | |
| | | | | | | | 748,625 | |
| Commercial Services & Supplies — 0.8% | | | | | | | | |
| Pitney Bowes, Inc., 5.75%, due 09/15/17 | | | 200,000 | | | | 214,978 | |
| CM Advisors Fixed Income Fund |
Schedule of Investments (Continued) |
CORPORATE BONDS — 34.8% (Continued) | | | | | | |
| Industrials — 4.8% (Continued) | | | | | | |
| Commercial Services & Supplies — 0.8% (Continued) | | | | | | |
| R.R. Donnelley & Sons Company, | | | | | | |
| 6.125%, due 01/15/17 | | $ | 400,000 | | | $ | 398,000 | |
| 12.00%, due 02/01/19 | | | 200,000 | | | | 217,500 | |
| | | | | | | | 830,478 | |
| Electrical Equipment — 0.9% | | | | | | | | |
| Eaton Corporation, 8.10%, due 08/15/22 | | | 150,000 | | | | 211,190 | |
| Emerson Electric Company, 5.25%, due 10/15/18 | | | 570,000 | | | | 693,714 | |
| | | | | | | | 904,904 | |
| Machinery — 0.1% | | | | | | | | |
| Dover Corporation, 5.45%, due 03/15/18 | | | 115,000 | | | | 136,342 | |
| | | | | | | | | |
| Professional Services — 0.2% | | | | | | | | |
| Dun & Bradstreet Corporation (The), 6.00%, due 04/01/13 | | | 200,000 | | | | 205,746 | |
| | | | | | | | | |
| Road & Rail — 1.8% | | | | | | | | |
| Canadian Pacific Railroad Company, 7.25%, due 05/15/19 | | | 790,000 | | | | 984,433 | |
| CSX Corporation, 6.25%, due 03/15/18 | | | 500,000 | | | | 611,036 | |
| Union Pacific Corporation, 5.70%, due 08/15/18 | | | 200,000 | | | | 242,058 | |
| | | | | | | | 1,837,527 | |
| Information Technology — 4.2% | | | | | | | | |
| Computers & Peripherals — 0.5% | | | | | | | | |
| Dell, Inc., 5.65%, due 04/15/18 | | | 400,000 | | | | 469,061 | |
| | | | | | | | | |
| Electronic Equipment, Instruments & Components — 1.3% | | | | | | | | |
| Avnet, Inc., 6.625%, due 09/15/16 | | | 500,000 | | | | 570,149 | |
| Corning, Inc., | | | | | | | | |
| 6.85%, due 03/01/29 | | | 100,000 | | | | 121,536 | |
| 7.25%, due 08/15/36 | | | 500,000 | | | | 637,504 | |
| | | | | | | | 1,329,189 | |
| IT Services — 2.4% | | | | | | | | |
| International Business Machines Corporation, 7.625%, due 10/15/18 | | | 420,000 | | | | 568,263 | |
| Western Union Company (The), | | | | | | | | |
| 5.93%, due 10/01/16 | | | 600,000 | | | | 708,815 | |
| 6.20%, due 11/17/36 | | | 1,025,000 | | | | 1,177,962 | |
| | | | | | | | 2,455,040 | |
| Materials — 8.2% | | | | | | | | |
| Chemicals — 1.4% | | | | | | | | |
| Cytec Industries, Inc., 8.95%, due 07/01/17 | | | 650,000 | | | | 808,543 | |
| CM Advisors Fixed Income Fund |
Schedule of Investments (Continued) |
CORPORATE BONDS — 34.8% (Continued) | | | | | | |
| Materials — 8.2% (Continued) | | | | | | |
| Chemicals — 1.4% (Continued) | | | | | | |
| E.I. du Pont de Nemours and Company, 6.00%, due 07/15/18 | | $ | 475,000 | | | $ | 597,597 | |
| | | | | | | | 1,406,140 | |
| Construction Materials — 1.0% | | | | | | | | |
| Vulcan Materials Company, | | | | | | | | |
| 6.40%, due 11/30/17 | | | 500,000 | | | | 528,750 | |
| 7.50%, due 06/15/21 | | | 500,000 | | | | 556,250 | |
| | | | | | | | 1,085,000 | |
| Containers & Packaging — 0.9% | | | | | | | | |
| Ball Corporation, 7.375%, due 09/01/19 | | | 830,000 | | | | 927,525 | |
| | | | | | | | | |
| Metals & Mining — 4.9% | | | | | | | | |
| Alcoa, Inc., | | | | | | | | |
| 5.72%, due 02/23/19 | | | 800,000 | | | | 857,814 | |
| 5.87%, due 02/23/22 | | | 1,200,000 | | | | 1,272,170 | |
| Allegheny Technologies, Inc., 9.375%, due 06/01/19 | | | 355,000 | | | | 457,864 | |
| ArcelorMittal, 4.75%, due 02/25/17 | | | 960,000 | | | | 940,800 | |
| Commercial Metals Company, | | | | | | | | |
| 6.50%, due 07/15/17 | | | 420,000 | | | | 430,500 | |
| 7.35%, due 08/15/18 | | | 230,000 | | | | 239,775 | |
| Nucor Corporation, 5.85%, due 06/01/18 | | | 300,000 | | | | 362,542 | |
| Reliance Steel & Aluminum Company, 6.20%, due 11/15/16 | | | 360,000 | | | | 403,742 | |
| | | | | | | | 4,965,207 | |
| Utilities — 0.7% | | | | | | | | |
| Multi-Utilities — 0.7% | | | | | | | | |
| Consolidated Edison, Inc., 5.85%, due 04/01/18 | | | 570,000 | | | | 705,922 | |
| | | | | | | | | |
Total Corporate Bonds (Cost $30,359,058) | | | | | | $ | 35,380,033 | |
U.S. TREASURY OBLIGATIONS — 52.0% | | | | | | |
U.S. Treasury Bills (a) — 52.0% | | | | | | |
| 0.10%, due 09/27/12 | | $ | 36,000,000 | | | $ | 35,998,056 | |
| 0.14%, due 11/08/12 | | | 17,000,000 | | | | 16,997,552 | |
Total U.S. Treasury Obligations (Cost $52,992,905) | | | | | | $ | 52,995,608 | |
| | | | | | |
| Pioneer High Income Trust | | | 13,600 | | | $ | 249,832 | |
| Western Asset Managed High Income Fund, Inc. | | | 122,153 | | | | 804,988 | |
Total Closed-End Funds (Cost $855,726) | | | | | | $ | 1,054,820 | |
| CM Advisors Fixed Income Fund |
Schedule of Investments (Continued) |
MONEY MARKET FUNDS — 11.8% | | | | | | |
Wells Fargo Advantage Treasury Plus Money Market Fund - Institutional Class, 0.01% (b) (Cost $12,023,992) | | | 12,023,992 | | | $ | 12,023,992 | |
| | | | | | | | | |
Total Investments at Value — 99.6% (Cost $96,231,681) | | | | | | $ | 101,454,453 | |
| | | | | | | | | |
| Other Assets in Excess of Liabilities — 0.4% | | | | | | | 381,976 | |
| | | | | | | | | |
| Net Assets — 100.0% | | | | | | $ | 101,836,429 | |
| (a) | Rate shown is the annualized yield at time of purchase, not a coupon rate. |
| (b) | Variable rate security. The rate shown is the 7-day effective yield as of August 31, 2012. |
| See accompanying notes to financial statements. |
| CM Advisors Family of Funds |
Statements of Assets and Liabilities August 31, 2012 (Unaudited) |
| | | | | CM Advisors Small Cap Value Fund | |
| ASSETS | | | | | | |
| Investments in securities: | | | | | | |
| At cost | | $ | 114,534,099 | | | $ | 8,780,720 | |
| At value (Note 2) | | $ | 123,606,279 | | | $ | 9,329,023 | |
| Dividends receivable | | | 196,428 | | | | 5,205 | |
| Receivable for investment securities sold | | | 849,876 | | | | 85,286 | |
| Receivable for capital shares sold | | | 27,393 | | | | 4,569 | |
| Receivable from Advisor (Note 5) | | | — | | | | 14,492 | |
| Other assets | | | 20,263 | | | | 31,120 | |
| TOTAL ASSETS | | | 124,700,239 | | | | 9,469,695 | |
| | | | | | | | | |
| LIABILITIES | | | | | | | | |
| Payable for investment securities purchased | | | 898,435 | | | | — | |
| Payable for capital shares redeemed | | | 60,849 | | | | — | |
| Payable to Advisor (Note 5) | | | 102,574 | | | | — | |
| Accrued distribution fees (Note 5) | | | 1,219 | | | | 1,467 | |
| Payable to administrator (Note 5) | | | 18,114 | | | | 8,330 | |
| Other accrued expenses and liabilities | | | 20,952 | | | | 2,696 | |
| TOTAL LIABILITIES | | | 1,102,143 | | | | 12,493 | |
| | | | | | | | | |
| NET ASSETS | | $ | 123,598,096 | | | $ | 9,457,202 | |
| | | | | | | | | |
| Net assets consist of: | | | | | | | | |
| Paid-in capital | | $ | 154,858,293 | | | $ | 8,686,002 | |
| Accumulated net investment income | | | 166,674 | | | | 18,125 | |
Accumulated net realized gains (losses) from security transactions | | | (40,499,051 | ) | | | 204,772 | |
| Net unrealized appreciation on investments | | | 9,072,180 | | | | 548,303 | |
| | | | | | | | | |
| Net assets | | $ | 123,598,096 | | | $ | 9,457,202 | |
| See accompanying notes to financial statements. |
| CM Advisors Family of Funds |
Statements of Assets and Liabilities (Continued) August 31, 2012 (Unaudited) |
| | | | | CM Advisors Small Cap Value Fund | |
| PRICING OF CLASS I SHARES | | | | | | |
| Net assets applicable to Class I shares | | $ | 123,495,494 | | | $ | 9,101,911 | |
Class I shares of beneficial interest outstanding (unlimited number of shares authorized, $0.001 par value) | | | 11,514,218 | | | | 934,685 | |
Net asset value, redemption price and offering price per share (a) | | $ | 10.73 | | | $ | 9.74 | |
| | | | | | | | | |
| PRICING OF CLASS C SHARES | | | | | | | | |
| Net assets applicable to Class C shares | | | | | | $ | 94,937 | |
Class C shares of beneficial interest outstanding (unlimited number of shares authorized, $0.001 par value) | | | | | | | 9,847 | |
Net asset value, redemption price and offering price per share (a) | | | | | | $ | 9.64 | |
| | | | | | | | | |
| PRICING OF CLASS R SHARES | | | | | | | | |
| Net assets applicable to Class R shares | | $ | 102,602 | | | $ | 260,354 | |
Class R shares of beneficial interest outstanding (unlimited number of shares authorized, $0.001 par value) | | | 9,575 | | | | 26,768 | |
Net asset value, redemption price and offering price per share (a) | | $ | 10.72 | | | $ | 9.73 | |
| (a) | Redemption price may differ from the net asset value per share depending upon the length of time the shares are held (Note 2). |
| See accompanying notes to financial statements. |
| CM Advisors Family of Funds |
Statements of Assets and Liabilities August 31, 2012 (Unaudited) |
| | CM Advisors Opportunity Fund | | | CM Advisors Fixed Income Fund | |
| ASSETS | | | | | | |
| Investments in securities: | | | | | | |
| At cost | | $ | 1,702,798 | | | $ | 96,231,681 | |
| At value (Note 2) | | $ | 1,712,833 | | | $ | 101,454,453 | |
| Dividends and interest receivable | | | 831 | | | | 505,675 | |
| Receivable for investment securities sold | | | 43,620 | | | | — | |
| Receivable for capital shares sold | | | 1,998 | | | | 24,826 | |
| Receivable from Advisor (Note 5) | | | 12,230 | | | | — | |
| Other assets | | | 13,917 | | | | 14,128 | |
| TOTAL ASSETS | | | 1,785,429 | | | | 101,999,082 | |
| | | | | | | | | |
| LIABILITIES | | | | | | | | |
| Payable for investment securities purchased | | | 8,498 | | | | — | |
| Payable for capital shares redeemed | | | — | | | | 90,755 | |
| Payable to Advisor (Note 5) | | | — | | | | 42,951 | |
| Payable to administrator (Note 5) | | | 5,015 | | | | 11,261 | |
| Other accrued expenses | | | 2,024 | | | | 17,686 | |
| TOTAL LIABILITIES | | | 15,537 | | | | 162,653 | |
| | | | | | | | | |
| NET ASSETS | | $ | 1,769,892 | | | $ | 101,836,429 | |
| | | | | | | | | |
| Net assets consist of: | | | | | | | | |
| Paid-in capital | | $ | 1,823,085 | | | $ | 95,248,848 | |
| Accumulated net investment income (loss) | | | (11,667 | ) | | | 219,700 | |
Accumulated net realized gains (losses) from security transactions | | | (51,561 | ) | | | 1,145,109 | |
| Net unrealized appreciation on investments | | | 10,035 | | | | 5,222,772 | |
| | | | | | | | | |
| Net assets | | $ | 1,769,892 | | | $ | 101,836,429 | |
| | | | | | | | | |
Shares of beneficial interest outstanding (unlimited number of shares authorized, $0.001 par value) | | | 183,953 | | | | 8,625,087 | |
Net asset value, redemption price and offering price per share (a) | | $ | 9.62 | | | $ | 11.81 | |
| (a) | Redemption price may differ from the net asset value per share depending upon the length of time the shares are held (Note 2). |
| See accompanying notes to financial statements. |
| CM Advisors Family of Funds |
Statements of Operations Six Months Ended August 31, 2012 (Unaudited) |
| | | | | CM Advisors Small Cap Value Fund | |
| INVESTMENT INCOME | | | | | | |
| Dividends | | $ | 983,864 | | | $ | 83,606 | |
| Interest | | | 1,625 | | | | — | |
| TOTAL INVESTMENT INCOME | | | 985,489 | | | | 83,606 | |
| | | | | | | | | |
| EXPENSES | | | | | | | | |
| Investment advisory fees (Note 5) | | | 623,337 | | | | 46,428 | |
| Registration and filing fees | | | 38,367 | | | | 29,609 | |
| Administration fees (Note 5) | | | 49,984 | | | | 12,000 | |
| Fund accounting fees (Note 5) | | | 32,247 | | | | 18,466 | |
| Transfer agent fees (Note 5) | | | 23,087 | | | | 19,500 | |
| Professional fees | | | 21,525 | | | | 17,966 | |
| Trustees’ fees and expenses | | | 19,636 | | | | 7,230 | |
| Printing of shareholder reports | | | 6,533 | | | | 4,074 | |
| Postage and supplies | | | 7,730 | | | | 2,271 | |
| Custody and bank service fees | | | 6,752 | | | | 2,879 | |
| Insurance expense | | | 7,309 | | | | 646 | |
| Compliance support services fees | | | 1,664 | | | | 304 | |
| Distributor service fees (Note 5) | | | 750 | | | | 750 | |
| Distribution fees (Note 5) | | | 475 | | | | 758 | |
| Pricing fees | | | 754 | | | | 422 | |
| Other expenses | | | 14,347 | | | | 5,373 | |
| TOTAL EXPENSES | | | 854,497 | | | | 168,676 | |
Advisory fees waived and expenses reimbursed by Advisor (Note 5) | | | (35,865 | ) | | | (109,882 | ) |
| NET EXPENSES | | | 818,632 | | | | 58,794 | |
| | | | | | | | | |
| NET INVESTMENT INCOME | | | 166,857 | | | | 24,812 | |
| | | | | | | | | |
REALIZED AND UNREALIZED GAINS (LOSSES) ON INVESTMENTS | | | | | | | | |
| Net realized gains from security transactions | | | 7,394,206 | | | | 369,099 | |
Net change in unrealized appreciation (depreciation) on investments | | | (6,636,463 | ) | | | (485,883 | ) |
| | | | | | | | | |
NET REALIZED AND UNREALIZED GAINS (LOSSES) ON INVESTMENTS | | | 757,743 | | | | (116,784 | ) |
| | | | | | | | | |
NET INCREASE (DECREASE) IN NET ASSETS FROM OPERATIONS | | $ | 924,600 | | | $ | (91,972 | ) |
| See accompanying notes to financial statements. |
| CM Advisors Family of Funds |
Statements of Operations Six Months Ended August 31, 2012 (Unaudited) |
| | CM Advisors Opportunity Fund | | | CM Advisors Fixed Income Fund | |
| INVESTMENT INCOME | | | | | | |
| Dividends | | $ | 4,267 | | | $ | 42,287 | |
| Interest | | | — | | | | 1,090,160 | |
| TOTAL INVESTMENT INCOME | | | 4,267 | | | | 1,132,447 | |
| | | | | | | | | |
| EXPENSES | | | | | | | | |
| Investment advisory fees (Note 5) | | | 10,963 | | | | 247,747 | |
| Administration fees (Note 5) | | | 12,000 | | | | 39,776 | |
| Professional fees | | | 14,815 | | | | 15,751 | |
| Fund accounting fees (Note 5) | | | 12,086 | | | | 16,969 | |
| Registration and filing fees | | | 10,215 | | | | 13,622 | |
| Trustees’ fees and expenses | | | 6,433 | | | | 16,694 | |
| Transfer agent fees (Note 5) | | | 6,000 | | | | 9,000 | |
| Custody and bank service fees | | | 3,045 | | | | 4,770 | |
| Postage and supplies | | | 1,887 | | | | 4,329 | |
| Pricing fees | | | 294 | | | | 5,734 | |
| Insurance expense | | | 223 | | | | 5,545 | |
| Printing of shareholder reports | | | 480 | | | | 2,992 | |
| Compliance support services fees | | | 210 | | | | 1,380 | |
| Distributor service fees (Note 5) | | | 750 | | | | 750 | |
| Other expenses | | | 2,974 | | | | 11,285 | |
| TOTAL EXPENSES | | | 82,375 | | | | 396,344 | |
Advisory fees waived and expenses reimbursed by Advisor (Note 5) | | | (69,219 | ) | | | — | |
| NET EXPENSES | | | 13,156 | | | | 396,344 | |
| | | | | | | | | |
| NET INVESTMENT INCOME (LOSS) | | | (8,889 | ) | | | 736,103 | |
| | | | | | | | | |
REALIZED AND UNREALIZED GAINS (LOSSES) ON INVESTMENTS | | | | | | | | |
| Net realized gains (losses) from security transactions | | | (32,462 | ) | | | 1,145,109 | |
Net change in unrealized appreciation (depreciation) on investments | | | 30,259 | | | | (548,397 | ) |
| | | | | | | | | |
NET REALIZED AND UNREALIZED GAINS (LOSSES) ON INVESTMENTS | | | (2,203 | ) | | | 596,712 | |
| | | | | | | | | |
NET INCREASE (DECREASE) IN NET ASSETS FROM OPERATIONS | | $ | (11,092 | ) | | $ | 1,332,815 | |
| See accompanying notes to financial statements. |
| CM Advisors Fund |
Statements of Changes in Net Assets |
| | Six Months Ended August 31, 2012 (Unaudited) | | | Year Ended February 29, 2012 | |
| FROM OPERATIONS | | | | | | |
| Net investment income | | $ | 166,857 | | | $ | 229,664 | |
| Net realized gains (losses) from security transactions | | | 7,394,206 | | | | (1,541,147 | ) |
Net change in unrealized appreciation (depreciation) on investments | | | (6,636,463 | ) | | | 2,120,467 | |
| Net increase in net assets from operations | | | 924,600 | | | | 808,984 | |
| | | | | | | | | |
| DISTRIBUTIONS TO SHAREHOLDERS | | | | | | | | |
| Distributions from net investment income, Class I | | | (33,477 | ) | | | (318,248 | ) |
| Distributions from net investment income, Class R | | | — | | | | (57 | ) |
| Decrease in net assets from distributions to shareholders | | | (33,477 | ) | | | (318,305 | ) |
| | | | | | | | | |
| FROM CAPITAL SHARE TRANSACTIONS (NOTE 6) | | | | | | | | |
| CLASS I | | | | | | | | |
| Proceeds from shares sold | | | 5,593,868 | | | | 11,100,437 | |
Net asset value of shares issued in reinvestment of distributions to shareholders | | | 31,960 | | | | 304,393 | |
| Proceeds from redemption fees collected (Note 2) | | | 947 | | | | 5,982 | |
| Payments for shares redeemed | | | (11,485,465 | ) | | | (26,095,827 | ) |
Net decrease in net assets from Class I share transactions | | | (5,858,690 | ) | | | (14,685,015 | ) |
| | | | | | | | | |
| CLASS C | | | | | | | | |
| Proceeds from shares sold | | | — | | | | 100,000 | |
| Payments for shares redeemed | | | (100,069 | ) | | | — | |
Net increase (decrease) in net assets from Class C share transactions | | | (100,069 | ) | | | 100,000 | |
| | | | | | | | | |
| CLASS R | | | | | | | | |
| Proceeds from shares sold | | | — | | | | 121,480 | |
Net asset value of shares issued in reinvestment of distributions to shareholders | | | — | | | | 57 | |
| Proceeds from redemption fees collected (Note 2) | | | 204 | | | | — | |
| Payments for shares redeemed | | | (20,400 | ) | | | — | |
Net increase (decrease) in net assets from Class R share transactions | | | (20,196 | ) | | | 121,537 | |
| | | | | | | | | |
| TOTAL DECREASE IN NET ASSETS | | | (5,087,832 | ) | | | (13,972,799 | ) |
| | | | | | | | | |
| NET ASSETS | | | | | | | | |
| Beginning of period | | | 128,685,928 | | | | 142,658,727 | |
| End of period | | $ | 123,598,096 | | | $ | 128,685,928 | |
| | | | | | | | | |
| ACCUMULATED NET INVESTMENT INCOME | | $ | 166,674 | | | $ | 33,294 | |
| See accompanying notes to financial statements. |
| CM Advisors Small Cap Value Fund |
Statements of Changes in Net Assets |
| | Six Months Ended August 31, 2012 (Unaudited) | | | Period Ended February 29, 2012(a) | |
| FROM OPERATIONS | | | | | | |
Net investment income | | $ | 24,812 | | | $ | 3,375 | |
| Net realized gains (losses) from security transactions | | | 369,099 | | | | (56,005 | ) |
Net change in unrealized appreciation (depreciation) on investments | | | (485,883 | ) | | | 1,034,186 | |
| Net increase (decrease) in net assets from operations | | | (91,972 | ) | | | 981,556 | |
| | | | | | | | | |
| DISTRIBUTIONS TO SHAREHOLDERS | | | | | | | | |
| Distributions from net investment income, Class I | | | — | | | | (3,375 | ) |
Distributions in excess of net investment income, Class I | | | — | | | | (6,687 | ) |
| Distributions from net realized gains, Class I | | | — | | | | (106,016 | ) |
| Distributions from net realized gains, Class C | | | — | | | | (1,153 | ) |
| Distributions from net realized gains, Class R | | | — | | | | (1,153 | ) |
| Decrease in net assets from distributions to shareholders | | | — | | | | (118,384 | ) |
| | | | | | | | | |
| FROM CAPITAL SHARE TRANSACTIONS (NOTE 6) | | | | | | | | |
| CLASS I | | | | | | | | |
Proceeds from shares sold | | | 281,668 | | | | 8,035,244 | |
Net asset value of shares issued in reinvestment of distributions to shareholders | | | — | | | | 116,078 | |
| Proceeds from redemption fees collected (Note 2) | | | — | | | | 543 | |
Payments for shares redeemed | | | (45,015 | ) | | | (72,378 | ) |
| Net increase in net assets from Class I share transactions | | | 236,653 | | | | 8,079,487 | |
| | | | | | | | | |
| CLASS C | | | | | | | | |
Proceeds from shares sold | | | — | | | | 100,000 | |
Net asset value of shares issued in reinvestment of distributions to shareholders | | | — | | | | 1,153 | |
| Increase in net assets from Class C share transactions | | | — | | | | 101,153 | |
| | | | | | | | | |
| CLASS R | | | | | | | | |
Proceeds from shares sold | | | 129,411 | | | | 138,145 | |
Net asset value of shares issued in reinvestment of distributions to shareholders | | | — | | | | 1,153 | |
| Increase in net assets from Class R share transactions | | | 129,411 | | | | 139,298 | |
| | | | | | | | | |
TOTAL INCREASE IN NET ASSETS | | | 274,092 | | | | 9,183,110 | |
| | | | | | | | | |
| NET ASSETS | | | | | | | | |
Beginning of period | | | 9,183,110 | | | | — | |
End of period | | $ | 9,457,202 | | | $ | 9,183,110 | |
| | | | | | | | | |
ACCUMULATED (DISTRIBUTIONS IN EXCESS OF) NET INVESTMENT INCOME | | $ | 18,125 | | | $ | (6,687) | |
| (a) | Represents the period from commencement of operations (April 15, 2011) through February 29, 2012. |
| See accompanying notes to financial statements. |
| CM Advisors Opportunity Fund |
Statements of Changes in Net Assets |
| | Six Months Ended August 31, 2012 (Unaudited) | | | Year Ended February 29, 2012 | |
| FROM OPERATIONS | | | | | | |
| Net investment loss | | $ | (8,889 | ) | | $ | (18,334 | ) |
| Net realized losses from security transactions | | | (32,462 | ) | | | (17,077 | ) |
Net change in unrealized appreciation (depreciation) on investments | | | 30,259 | | | | (28,500 | ) |
| Net decrease in net assets from operations | | | (11,092 | ) | | | (63,911 | ) |
| | | | | | | | | |
| DISTRIBUTIONS TO SHAREHOLDERS | | | | | | | | |
| Distributions from net realized gains | | | — | | | | (51,062 | ) |
| | | | | | | | | |
| FROM CAPITAL SHARE TRANSACTIONS | | | | | | | | |
| Proceeds from shares sold | | | 111,193 | | | | 666,113 | |
Net asset value of shares issued in reinvestment of distributions to shareholders | | | — | | | | 50,493 | |
| Proceeds from redemption fees collected (Note 2) | | | — | | | | 186 | |
| Payments for shares redeemed | | | (16,826 | ) | | | (52,865 | ) |
Net increase in net assets from capital share transactions | | | 94,367 | | | | 663,927 | |
| | | | | | | | | |
| TOTAL INCREASE IN NET ASSETS | | | 83,275 | | | | 548,954 | |
| | | | | | | | | |
| NET ASSETS | | | | | | | | |
| Beginning of period | | | 1,686,617 | | | | 1,137,663 | |
| End of period | | $ | 1,769,892 | | | $ | 1,686,617 | |
| | | | | | | | | |
| ACCUMULATED NET INVESTMENT LOSS | | $ | (11,667 | ) | | $ | (2,778 | ) |
| | | | | | | | | |
| CAPITAL SHARE ACTIVITY | | | | | | | | |
| Shares sold | | | 11,535 | | | | 67,378 | |
| Shares reinvested | | | — | | | | 4,759 | |
| Shares redeemed | | | (1,754 | ) | | | (5,538 | ) |
| Net increase in shares outstanding | | | 9,781 | | | | 66,599 | |
| Shares outstanding, beginning of period | | | 174,172 | | | | 107,573 | |
| Shares outstanding, end of period | | | 183,953 | | | | 174,172 | |
| See accompanying notes to financial statements. |
| CM Advisors Fixed Income Fund |
Statements of Changes in Net Assets |
| | Six Months Ended August 31, 2012 (Unaudited) | | | Year Ended February 29, 2012 | |
| FROM OPERATIONS | | | | | | |
| Net investment income | | $ | 736,103 | | | $ | 1,535,300 | |
| Net realized gains from security transactions | | | 1,145,109 | | | | 2,262,120 | |
Net change in unrealized appreciation (depreciation) on investments | | | (548,397 | ) | | | 1,576,605 | |
| Net increase in net assets from operations | | | 1,332,815 | | | | 5,374,025 | |
| | | | | | | | | |
| DISTRIBUTIONS TO SHAREHOLDERS | | | | | | | | |
| From net investment income | | | (767,529 | ) | | | (1,517,492 | ) |
| From net realized gains | | | — | | | | (2,265,922 | ) |
| Decrease in net assets from distributions to shareholders | | | (767,529 | ) | | | (3,783,414 | ) |
| | | | | | | | | |
| FROM CAPITAL SHARE TRANSACTIONS | | | | | | | | |
| Proceeds from shares sold | | | 14,137,960 | | | | 26,368,952 | |
Net asset value of shares issued in reinvestment of distributions to shareholders | | | 681,214 | | | | 3,427,707 | |
| Proceeds from redemption fees collected (Note 2) | | | 5,796 | | | | 5,841 | |
| Payments for shares redeemed | | | (7,871,058 | ) | | | (17,011,327 | ) |
Net increase in net assets from capital share transactions | | | 6,953,912 | | | | 12,791,173 | |
| | | | | | | | | |
| TOTAL INCREASE IN NET ASSETS | | | 7,519,198 | | | | 14,381,784 | |
| | | | | | | | | |
| NET ASSETS | | | | | | | | |
| Beginning of period | | | 94,317,231 | | | | 79,935,447 | |
| End of period | | $ | 101,836,429 | | | $ | 94,317,231 | |
| | | | | | | | | |
ACCUMULATED NET INVESTMENT INCOME | | $ | 219,700 | | | $ | 251,126 | |
| | | | | | | | | |
| CAPITAL SHARE ACTIVITY | | | | | | | | |
| Shares sold | | | 1,204,022 | | | | 2,246,498 | |
| Shares reinvested | | | 58,268 | | | | 295,058 | |
| Shares redeemed | | | (670,340 | ) | | | (1,453,776 | ) |
| Net increase in shares outstanding | | | 591,950 | | | | 1,087,780 | |
| Shares outstanding, beginning of period | | | 8,033,137 | | | | 6,945,357 | |
| Shares outstanding, end of period | | | 8,625,087 | | | | 8,033,137 | |
| See accompanying notes to financial statements. |
Per share data for a Class I share outstanding throughout each period: |
| | | Years Ended |
| | | Six Months Ended August 31, 2012 (Unaudited) | | | February 29, 2012 | | | February 28, 2011 | | | February 28, 2010 | | | February 28, 2009 | | | February 29, 2008 | |
Net asset value at beginning of period | | $ | 10.65 | | | $ | 10.56 | | | $ | 8.95 | | | $ | 5.71 | | | $ | 10.25 | | | $ | 12.75 | |
| | | | | | | | | | | | | | | | | | | | | | | | | |
Income (loss) from investment operations: | | | | | | | | | | | | | | | | | | | | | | | | |
| Net investment income | | | 0.01 | | | | 0.02 | | | | 0.04 | | | | 0.03 | | | | 0.10 | | | | 0.14 | |
Net realized and unrealized gains (losses) on investments | | | 0.07 | | | | 0.10 | | | | 1.61 | | | | 3.24 | | | | (4.26 | ) | | | (2.19 | ) |
| Total from investment operations | | | 0.08 | | | | 0.12 | | | | 1.65 | | | | 3.27 | | | | (4.16 | ) | | | (2.05 | ) |
| | | | | | | | | | | | | | | | | | | | | | | | | |
| Less distributions: | | | | | | | | | | | | | | | | | | | | | | | | |
Dividends from net investment income | | | (0.00 | )(a) | | | (0.03 | ) | | | (0.04 | ) | | | (0.03 | ) | | | (0.10 | ) | | | (0.16 | ) |
Distributions from net realized gains | | | — | | | | — | | | | — | | | | — | | | | (0.28 | ) | | | (0.29 | ) |
| Total distributions | | | (0.00 | )(a) | | | (0.03 | ) | | | (0.04 | ) | | | (0.03 | ) | | | (0.38 | ) | | | (0.45 | ) |
| | | | | | | | | | | | | | | | | | | | | | | | | |
Proceeds from redemption fees collected (Note 2) | | | 0.00 | (a) | | | 0.00 | (a) | | | 0.00 | (a) | | | 0.00 | (a) | | | 0.00 | (a) | | | 0.00 | (a) |
| | | | | | | | | | | | | | | | | | | | | | | | | |
Net asset value at end of period | | $ | 10.73 | | | $ | 10.65 | | | $ | 10.56 | | | $ | 8.95 | | | $ | 5.71 | | | $ | 10.25 | |
| | | | | | | | | | | | | | | | | | | | | | | | | |
Total return (b) | | | 0.78% | (c) | | | 1.11% | | | | 18.43% | | | | 57.39% | | | | (41.21% | ) | | | (16.43% | ) |
| | | | | | | | | | | | | | | | | | | | | | | | | |
| Ratios and supplemental data: | | | | | | | | | | | | | | | | | | | | | | | | |
Net assets at end of period (000's) | | $ | 123,495 | | | $ | 128,461 | | | $ | 142,659 | | | $ | 146,190 | | | $ | 103,367 | | | $ | 209,111 | |
| | | | | | | | | | | | | | | | | | | | | | | | | |
Ratio of total expenses to average net assets | | | 1.31% | (d) | | | 1.53% | | | | 1.52% | | | | 1.50% | | | | 1.48% | | | | 1.46% | |
| | | | | | | | | | | | | | | | | | | | | | | | | |
Ratio of net expenses to average net assets (e) | | | 1.31% | (d) | | | 1.50% | | | | 1.50% | | | | 1.49% | | | | 1.48% | | | | 1.46% | |
| | | | | | | | | | | | | | | | | | | | | | | | | |
Ratio of net investment income to average net assets (e) | | | 0.07% | (d) | | | 0.18% | | | | 0.39% | | | | 0.41% | | | | 1.09% | | | | 1.07% | |
| | | | | | | | | | | | | | | | | | | | | | | | | |
| Portfolio turnover rate | | | 17% | (c) | | | 45% | | | | 15% | | | | 19% | | | | 23% | | | | 66% | |
| (a) | Amount rounds to less than $0.01 per share. |
| (b) | Total return is a measure of the change in value of an investment in the Fund over the period covered, which assumes any dividends or capital gains distributions are reinvested in shares of the Fund. The returns shown do not reflect the deduction of taxes a shareholder would pay on Fund distributions or the redemption of Fund shares. |
| (c) | Not annualized. |
| (d) | Annualized. |
| (e) | Ratio was determined after investment advisory fee waivers and/or expense reimbursements (Note 5). |
| See accompanying notes to financial statements. |
Per share data for a Class R share outstanding throughout each period: |
| | Six Months Ended August 31, 2012 (Unaudited) | | | Period Ended February 29, 2012(a) | |
| Net asset value at beginning of period | | $ | 10.64 | | | $ | 10.45 | |
| | | | | | | | | |
| Income (loss) from investment operations: | | | | | | | | |
| Net investment income (loss) | | | (0.01 | ) | | | 0.01 | |
| Net realized and unrealized gains on investments | | | 0.07 | | | | 0.19 | |
| Total from investment operations | | | 0.06 | | | | 0.20 | |
| | | | | | | | | |
| Less distributions: | | | | | | | | |
| Distributions from net investment income | | | — | | | | (0.01 | ) |
| | | | | | | | | |
| Proceeds from redemption fees collected (Note 2) | | | 0.02 | | | | — | |
| | | | | | | | | |
| Net asset value at end of period | | $ | 10.72 | | | $ | 10.64 | |
| | | | | | | | | |
Total return (b) | | | 0.75% | (c) | | | 1.88% | (c) |
| | | | | | | | | |
| Ratios and supplemental data: | | | | | | | | |
| Net assets at end of period (000’s) | | $ | 103 | | | $ | 123 | |
| | | | | | | | | |
| Ratio of total expenses to average net assets | | | 27.86% | (d) | | | 30.63% | (d) |
| | | | | | | | | |
Ratio of net expenses to average net assets (e) | | | 1.75% | (d) | | | 1.75% | (d) |
| | | | | | | | | |
Ratio of net investment income (loss) to average net assets (e) | | | (0.04% | )(d) | | | 0.07% | (d) |
| | | | | | | | | |
| Portfolio turnover rate | | | 17% | (c) | | | 45% | (c)(f) |
| (a) | Represents the period from commencement of operations (July 8, 2011) through February 29, 2012. |
| (b) | Total return is a measure of the change in value of an investment in the Fund over the period covered, which assumes any dividends or capital gains distributions are reinvested in shares of the Fund. The returns shown do not reflect the deduction of taxes a shareholder would pay on Fund distributions or the redemption of Fund shares. |
| (c) | Not annualized. |
| (d) | Annualized. |
| (e) | Ratio was determined after investment advisory fee waivers and expense reimbursements (Note 5). |
| (f) | Represents the year ended February 29, 2012. |
| See accompanying notes to financial statements. |
CM Advisors Small Cap Value Fund Class I |
|
Per share data for a Class I share outstanding throughout each period: |
| | Six Months Ended August 31, 2012 (Unaudited) | | | Period Ended February 29, 2012(a) | |
| Net asset value at beginning of period | | $ | 9.84 | | | $ | 10.00 | |
| | | | | | | | | |
| Income (loss) from investment operations: | | | | | | | | |
| Net investment income | | | 0.03 | | | | 0.02 | |
| Net realized and unrealized losses on investments | | | (0.13 | ) | | | (0.05 | ) |
| Total from investment operations | | | (0.10 | ) | | | (0.03 | ) |
| | | | | | | | | |
| Less distributions: | | | | | | | | |
| Dividends from net investment income | | | — | | | | (0.01 | ) |
| Distributions from net realized gains | | | — | | | | (0.12 | ) |
| Total distributions | | | — | | | | (0.13 | ) |
| | | | | | | | | |
| Proceeds from redemption fees collected (Note 2) | | | — | | | | 0.00 | (b) |
| | | | | | | | | |
| Net asset value at end of period | | $ | 9.74 | | | $ | 9.84 | |
| | | | | | | | | |
Total return (c) | | | (1.02% | )(d) | | | (0.17% | )(d) |
| | | | | | | | | |
| Ratios and supplemental data: | | | | | | | | |
| Net assets at end of period (000’s) | | $ | 9,102 | | | $ | 8,953 | |
| | | | | | | | | |
| Ratio of total expenses to average net assets | | | 2.99% | (e) | | | 4.35% | (e) |
| | | | | | | | | |
Ratio of net expenses to average net assets (f) | | | 1.25% | (e) | | | 1.25% | (e) |
| | | | | | | | | |
Ratio of net investment income to average net assets (f) | | | 0.14% | (e) | | | 0.09% | (e) |
| | | | | | | | | |
| Portfolio turnover rate | | | 22% | (d) | | | 44% | (d) |
| (a) | Represents the period from commencement of operations (April 15, 2011) through February 29, 2012. |
| (b) | Amount rounds to less than $0.01 per share. |
| (c) | Total return is a measure of the change in value of an investment in the Fund over the period covered, which assumes any dividends or capital gains distributions are reinvested in shares of the Fund. The returns shown do not reflect the deduction of taxes a shareholder would pay on Fund distributions or the redemption of Fund shares. |
| (d) | Not annualized. |
| (e) | Annualized. |
| (f) | Ratio was determined after investment advisory fee waivers and expense reimbursements (Note 5). |
| See accompanying notes to financial statements. |
CM Advisors Small Cap Value Fund Class C |
|
Per share data for a Class C share outstanding throughout each period: |
| | Six Months Ended August 31, 2012 (Unaudited) | | | Period Ended February 29, 2012(a) | |
| Net asset value at beginning of period | | $ | 9.79 | | | $ | 10.29 | |
| | | | | | | | | |
| Loss from investment operations: | | | | | | | | |
| Net investment loss | | | (0.02 | ) | | | (0.06 | ) |
| Net realized and unrealized losses on investments | | | (0.13 | ) | | | (0.32 | ) |
| Total from investment operations | | | (0.15 | ) | | | (0.38 | ) |
| | | | | | | | | |
| Less distributions: | | | | | | | | |
| Distributions from net realized gains | | | — | | | | (0.12 | ) |
| | | | | | | | | |
| Net asset value at end of period | | $ | 9.64 | | | $ | 9.79 | |
| | | | | | | | | |
Total return (b) | | | (1.53% | )(c) | | | (3.60% | )(c) |
| | | | | | | | | |
| Ratios and supplemental data: | | | | | | | | |
| Net assets at end of period (000’s) | | $ | 95 | | | $ | 96 | |
| | | | | | | | | |
| Ratio of total expenses to average net assets | | | 34.68% | (d) | | | 34.77% | (d) |
| | | | | | | | | |
Ratio of net expenses to average net assets (e) | | | 2.25% | (d) | | | 2.25% | (d) |
| | | | | | | | | |
Ratio of net investment loss to average net assets (e) | | | (0.11% | )(d) | | | (0.96% | )(d) |
| | | | | | | | | |
| Portfolio turnover rate | | | 22% | (c) | | | 44% | (c)(f) |
| (a) | Represents the period from commencement of operations (July 8, 2011) through February 29, 2012. |
| (b) | Total return is a measure of the change in value of an investment in the Fund over the period covered, which assumes any dividends or capital gains distributions are reinvested in shares of the Fund. The returns shown do not reflect the deduction of taxes a shareholder would pay on Fund distributions or the redemption of Fund shares. |
| (c) | Not annualized. |
| (d) | Annualized. |
| (e) | Ratio was determined after investment advisory fee waivers and expense reimbursements (Note 5). |
| (f) | Represents the period from April 15, 2011 (the commencement of operations of Class I shares) through February 29, 2012. |
| See accompanying notes to financial statements. |
CM Advisors Small Cap Value Fund Class R |
|
Per share data for a Class R share outstanding throughout each period: |
| | Six Months Ended August 31, 2012 (Unaudited) | | | Period Ended February 29, 2012(a) | |
| Net asset value at beginning of period | | $ | 9.84 | | | $ | 10.29 | |
| | | | | | | | | |
| Income (loss) from investment operations: | | | | | | | | |
| Net investment income (loss) | | | 0.01 | | | | (0.01 | ) |
| Net realized and unrealized losses on investments | | | (0.12 | ) | | | (0.32 | ) |
| Total from investment operations | | | (0.11 | ) | | | (0.33 | ) |
| | | | | | | | | |
| Less distributions: | | | | | | | | |
| Distributions from net realized gains | | | — | | | | (0.12 | ) |
| | | | | | | | | |
| Net asset value at end of period | | $ | 9.73 | | | $ | 9.84 | |
| | | | | | | | | |
Total return (b) | | | (1.12% | )(c) | | | (3.11% | )(c) |
| | | | | | | | | |
| Ratios and supplemental data: | | | | | | | | |
| Net assets at end of period (000’s) | | $ | 260 | | | $ | 134 | |
| | | | | | | | | |
| Ratio of total expenses to average net assets | | | 16.04% | (d) | | | 33.38% | (d) |
| | | | | | | | | |
Ratio of net expenses to average net assets (e) | | | 1.50% | (d) | | | 1.50% | (d) |
| | | | | | | | | |
Ratio of net investment income (loss) to average net assets (e) | | | 0.06% | (d) | | | (0.23% | )(d) |
| | | | | | | | | |
| Portfolio turnover rate | | | 22% | (c) | | | 44% | (c)(f) |
| (a) | Represents the period from commencement of operations (July 8, 2011) through February 29, 2012. |
| (b) | Total return is a measure of the change in value of an investment in the Fund over the period covered, which assumes any dividends or capital gains distributions are reinvested in shares of the Fund. The returns shown do not reflect the deduction of taxes a shareholder would pay on Fund distributions or the redemption of Fund shares. |
| (c) | Not annualized. |
| (d) | Annualized. |
| (e) | Ratio was determined after investment advisory fee waivers and expense reimbursements (Note 5). |
| (f) | Represents the period from April 15, 2011 (the commencement of operations of Class I shares) through February 29, 2012. |
| See accompanying notes to financial statements. |
| CM Advisors Opportunity Fund |
|
Per share data for a share outstanding throughout each period: |
| | Six Months Ended August 31, 2012 (Unaudited) | | | Year Ended February 29, 2012 | | | Period Ended February 28, 2011(a) | |
| Net asset value at beginning of period | | $ | 9.68 | | | $ | 10.58 | | | $ | 10.00 | |
| | | | | | | | | | | | | |
| Income (loss) from investment operations: | | | | | | | | | | | | |
| Net investment loss | | | (0.05 | ) | | | (0.11 | ) | | | (0.04 | ) |
| Net realized and unrealized gains (losses) on investments | | | (0.01 | ) | | | (0.32 | ) | | | 0.62 | |
| Total from investment operations | | | (0.06 | ) | | | (0.43 | ) | | | 0.58 | |
| | | | | | | | | | | | | |
| Less distributions: | | | | | | | | | | | | |
| Distributions from net realized gains | | | — | | | | (0.47 | ) | | | — | |
| | | | | | | | | | | | | |
| Proceeds from redemption fees collected (Note 2) | | | — | | | | 0.00 | (b) | | | — | |
| | | | | | | | | | | | | |
| Net asset value at end of period | | $ | 9.62 | | | $ | 9.68 | | | $ | 10.58 | |
| | | | | | | | | | | | | |
Total return (c) | | | (0.62% | )(d) | | | (4.47% | ) | | | 5.80% | (d) |
| | | | | | | | | | | | | |
| Ratios and supplemental data: | | | | | | | | | | | | |
| Net assets at end of period (000’s) | | $ | 1,770 | | | $ | 1,687 | | | $ | 1,138 | |
| | | | | | | | | | | | | |
| Ratio of total expenses to average net assets | | | 9.39% | (e) | | | 12.21% | | | | 15.72% | (e) |
| | | | | | | | | | | | | |
Ratio of net expenses to average net assets (f) | | | 1.50% | (e) | | | 1.50% | | | | 1.50% | (e) |
| | | | | | | | | | | | | |
Ratio of net investment loss to average net assets (f) | | | (1.01% | )(e) | | | (1.25% | ) | | | (1.11% | )(e) |
| | | | | | | | | | | | | |
| Portfolio turnover rate | | | 230% | (d) | | | 820% | | | | 178% | (d) |
| (a) | Represents the period from commencement of operations (November 1, 2010) through February 28, 2011. |
| (b) | Amount rounds to less than $0.01 per share. |
| (c) | Total return is a measure of the change in value of an investment in the Fund over the period covered, which assumes any dividends or capital gains distributions are reinvested in shares of the Fund. The returns shown do not reflect the deduction of taxes a shareholder would pay on Fund distributions or the redemption of Fund shares. |
| (d) | Not annualized. |
| (e) | Annualized. |
| (f) | Ratio was determined after investment advisory fee waivers and expense reimbursements (Note 5). |
| See accompanying notes to financial statements. |
| CM Advisors Fixed Income Fund |
|
Per share data for a share outstanding throughout each period: |
| | | Years Ended |
| | | Six Months Ended August 31, 2012 (Unaudited) | | | February 29, 2012 | | | February 28, 2011 | | | February 28, 2010 | | | February 28, 2009 | | | February 29, 2008 | |
Net asset value at beginning of period | | $ | 11.74 | | | $ | 11.51 | | | $ | 11.14 | | | $ | 9.99 | | | $ | 11.01 | | | $ | 10.66 | |
| | | | | | | | | | | | | | | | | | | | | | | | | |
Income (loss) from investment operations: | | | | | | | | | | | | | | | | | | | | | | | | |
| Net investment income | | | 0.09 | | | | 0.20 | | | | 0.24 | | | | 0.32 | | | | 0.26 | | | | 0.25 | |
Net realized and unrealized gains (losses) on investments | | | 0.07 | | | | 0.53 | | | | 0.49 | | | | 1.19 | | | | (0.38 | ) | | | 0.57 | |
| Total from investment operations | | | 0.16 | | | | 0.73 | | | | 0.73 | | | | 1.51 | | | | (0.12 | ) | | | 0.82 | |
| | | | | | | | | | | | | | | | | | | | | | | | | |
| Less distributions: | | | | | | | | | | | | | | | | | | | | | | | | |
Dividends from net investment income | | | (0.09 | ) | | | (0.21 | ) | | | (0.26 | ) | | | (0.32 | ) | | | (0.21 | ) | | | (0.25 | ) |
Distributions from net realized gains | | | — | | | | (0.29 | ) | | | (0.10 | ) | | | (0.04 | ) | | | (0.70 | ) | | | (0.22 | ) |
| Total distributions | | | (0.09 | ) | | | (0.50 | ) | | | (0.36 | ) | | | (0.36 | ) | | | (0.91 | ) | | | (0.47 | ) |
| | | | | | | | | | | | | | | | | | | | | | | | | |
Proceeds from redemption fees collected (Note 2) | | | 0.00 | (a) | | | 0.00 | (a) | | | 0.00 | (a) | | | 0.00 | (a) | | | 0.01 | | | | 0.00 | (a) |
| | | | | | | | | | | | | | | | | | | | | | | | | |
Net asset value at end of period | | $ | 11.81 | | | $ | 11.74 | | | $ | 11.51 | | | $ | 11.14 | | | $ | 9.99 | | | $ | 11.01 | |
| | | | | | | | | | | | | | | | | | | | | | | | | |
Total return (b) | | | 1.39% | (c) | | | 6.37% | | | | 6.63% | | | | 15.45% | | | | (0.60% | ) | | | 8.05% | |
| | | | | | | | | | | | | | | | | | | | | | | | | |
| Ratios and supplemental data: | | | | | | | | | | | | | | | | | | | | | | | | |
Net assets at end of period (000’s) | | $ | 101,836 | | | $ | 94,317 | | | $ | 79,935 | | | $ | 46,424 | | | $ | 19,417 | | | $ | 12,825 | |
| | | | | | | | | | | | | | | | | | | | | | | | | |
Ratio of total expenses to average net assets | | | 0.80% | (d) | | | 0.81% | | | | 0.90% | | | | 1.06% | | | | 1.54% | | | | 2.28% | |
| | | | | | | | | | | | | | | | | | | | | | | | | |
Ratio of net expenses to average net assets (e) | | | 0.80% | (d) | | | 0.81% | | | | 0.90% | | | | 1.06% | | | | 1.50% | | | | 1.50% | |
| | | | | | | | | | | | | | | | | | | | | | | | | |
Ratio of net investment income to average net assets (e) | | | 1.48% | (d) | | | 1.76% | | | | 2.13% | | | | 3.31% | | | | 2.77% | | | | 2.79% | |
| | | | | | | | | | | | | | | | | | | | | | | | | |
| Portfolio turnover rate | | | 3% | (c) | | | 25% | | | | 21% | | | | 0% | | | | 37% | | | | 188% | |
| (a) | Amount rounds to less than $0.01 per share. |
| (b) | Total return is a measure of the change in value of an investment in the Fund over the period covered, which assumes any dividends or capital gains distributions are reinvested in shares of the Fund. The returns shown do not reflect the deduction of taxes a shareholder would pay on Fund distributions or the redemption of Fund shares. |
| (c) | Not annualized. |
| (d) | Annualized. |
| (e) | Ratio was determined after investment advisory fee waivers and/or expense reimbursements. |
| See accompanying notes to financial statements. |
| CM Advisors Family of Funds |
Notes to Financial Statements August 31, 2012 (Unaudited) |
1. Organization
CM Advisors Fund, CM Advisors Small Cap Value Fund, CM Advisors Opportunity Fund and CM Advisors Fixed Income Fund (collectively the “Funds” and individually a “Fund”) are each a series of CM Advisors Family of Funds (the “Trust”), which was organized as a Delaware statutory trust and is registered under the Investment Company Act of 1940 (the “1940 Act”) as an open-end management investment company.
CM Advisors Fund commenced operations on May 13, 2003. The investment objective of the Fund is long-term growth of capital.
CM Advisors Small Cap Value Fund commenced operations on April 15, 2011. The investment objective of the Fund is long-term growth of capital.
CM Advisors Opportunity Fund commenced operations on November 1, 2010. The investment objective of the Fund is long-term growth of capital.
CM Advisors Fixed Income Fund commenced operations on March 24, 2006. The investment objective of the Fund is to preserve capital and maximize total return.
CM Advisors Fund currently offers two classes of shares: Class I shares (sold without any sales loads and distribution and/or service fees) and Class R shares (sold without any sales loads but subject to a distribution and/or service fee of up to 0.25% of the average daily net assets attributable to Class R shares). Each class of shares represents an interest in the same assets of the Fund, has the same rights and is identical in all material respects except that (1) the classes bear differing levels of distribution fees, if any; (2) certain other class specific expenses will be borne solely by the class to which such expenses are attributable; (3) each class has exclusive voting rights with respect to matters relating to its own distribution arrangements; and (4) Class I shares require a higher minimum initial investment. Prior to June 29, 2012, a third class, Class C shares, was also offered by the Fund. Class C shares were sold without any sales load but were subject to a distribution and/or service fee of up to 1.00% of the average daily net assets attributable to the Class C shares. On June 29, 2012, the offering of Class C shares of the CM Advisors Fund was discontinued and all outstanding shares were redeemed.
CM Advisors Small Cap Value Fund currently offers three classes of shares: Class I shares (sold without any sales loads and distribution and/or service fees), Class C shares (sold without any sales loads but subject to a distribution and/or service fee of up to 1.00% of the average daily net assets attributable to Class C shares) and Class R shares (sold without any sales loads but subject to a distribution and/or service fee of up to 0.25% of the average daily net assets attributable to Class R shares). Each class of shares represents an interest in the same assets of the Fund, has the same rights and is identical in all material respects except that (1) the classes bear differing levels of distribution fees, if any; (2) certain other class specific expenses will be borne solely by the class to which such expenses are attributable; (3) each class has exclusive voting rights with respect to matters relating to its own distribution arrangements; and (4) Class I shares require a higher minimum initial investment.
| CM Advisors Family of Funds |
Notes to Financial Statements (Continued) |
2. Significant Accounting Policies
The following is a summary of the Funds’ significant accounting policies. These policies are in conformity with accounting principles generally accepted in the United States of America (“GAAP”).
Investment Valuation – The Funds’ portfolio securities are generally valued at their market values determined on the basis of available market quotations as of the close of regular trading on the New York Stock Exchange (typically 4:00 p.m. Eastern time). Securities listed on an exchange or quoted on a national market system are valued at the last sales price. Securities which are quoted by NASDAQ are valued at the NASDAQ Official Closing Price. Securities traded in the over-the-counter market and listed securities for which no sale was reported on that date are valued at the most recent bid price. It is expected that fixed income securities will ordinarily be traded in the over-the-counter market. Securities and assets for which representative market quotations are not readily available (e.g., if the exchange on which the portfolio security is principally traded closes early or if trading of the particular portfolio security is halted during the day and does not resume prior to the Funds’ net asset value calculations) or which cannot be accurately valued using the Funds’ normal pricing procedures are valued at fair value as determined in good faith under policies approved by the Board of Trustees and will be classified as Level 2 or 3 within the fair value hierarchy (see below), depending on the inputs used. A portfolio security’s “fair value” price may differ from the price next available for that portfolio security using the Funds’ normal pricing procedures. Instruments with maturities of 60 days or less may be valued at amortized cost, which approximates market value.
GAAP establishes a single authoritative definition of fair value, sets out a framework for measuring fair value and requires additional disclosures about fair value measurements.
Various inputs are used in determining the value of the Funds’ investments. These inputs are summarized in the three broad levels listed below:
| • | Level 1 – quoted prices in active markets for identical securities |
| • | Level 2 – other significant observable inputs |
| • | Level 3 – significant unobservable inputs |
For example, Corporate Bonds and U.S. Treasury Obligations held by CM Advisors Fixed Income Fund are classified as Level 2 since values are based on prices provided by an independent pricing service that utilizes various “other significant observable inputs” including bid and ask quotations, prices of similar securities and interest rates, among other factors.
The inputs or methodology used for valuing securities are not necessarily an indication of the risks associated with investing in those securities. The inputs used to measure the fair value of a particular security may fall into different levels of the fair value hierarchy. In such cases, for disclosure purposes, the level in the fair value hierarchy within which the fair value measurement of that security falls in its entirety is determined based on the lowest level input that is significant to the fair value measurement.
| CM Advisors Family of Funds |
Notes to Financial Statements (Continued) |
The following is a summary of the inputs used to value the Funds’ investments as of August 31, 2012 by security type:
| |
| | | | | | | | | | | | |
| Common Stocks | | $ | 93,942,984 | | | $ | — | | | $ | — | | | $ | 93,942,984 | |
| Warrants | | | 170,859 | | | | — | | | | — | | | | 170,859 | |
| Money Market Funds | | | 29,492,436 | | | | — | | | | — | | | | 29,492,436 | |
| Total | | $ | 123,606,279 | | | $ | — | | | $ | — | | | $ | 123,606,279 | |
CM Advisors Small Cap Value Fund | |
| | | | | | | | | | | | |
| Common Stocks | | $ | 8,117,401 | | | $ | — | | | $ | — | | | $ | 8,117,401 | |
| Money Market Funds | | | 1,211,622 | | | | — | | | | — | | | | 1,211,622 | |
| Total | | $ | 9,329,023 | | | $ | — | | | $ | — | | | $ | 9,329,023 | |
CM Advisors Opportunity Fund | |
| | | | | | | | | | | | |
| Common Stocks | | $ | 1,260,511 | | | $ | — | | | $ | — | | | $ | 1,260,511 | |
| Closed-End Funds | | | 175,088 | | | | — | | | | — | | | | 175,088 | |
| Exchange-Traded Funds | | | 132,400 | | | | — | | | | — | | | | 132,400 | |
| Money Market Funds | | | 144,834 | | | | — | | | | — | | | | 144,834 | |
| Total | | $ | 1,712,833 | | | $ | — | | | $ | — | | | $ | 1,712,833 | |
CM Advisors Fixed Income Fund | |
| | | | | | | | | | | | |
| Corporate Bonds | | $ | — | | | $ | 35,380,033 | | | $ | — | | | $ | 35,380,033 | |
| U.S. Treasury Obligations | | | — | | | | 52,995,608 | | | | — | | | | 52,995,608 | |
| Closed-End Funds | | | 1,054,820 | | | | — | | | | — | | | | 1,054,820 | |
| Money Market Funds | | | 12,023,992 | | | | — | | | | — | | | | 12,023,992 | |
| Total | | $ | 13,078,812 | | | $ | 88,375,641 | | | $ | — | | | $ | 101,454,453 | |
Refer to CM Advisors Fund’s, CM Advisors Small Cap Value Fund’s and CM Advisors Opportunity Fund’s Schedules of Investments for a listing of the common stocks valued using Level 1 inputs by industry type. Refer to CM Advisors Fixed Income Fund’s Schedule of Investments for a listing of the corporate bonds valued using Level 2 inputs by industry type.
| CM Advisors Family of Funds |
Notes to Financial Statements (Continued) |
As of August 31, 2012, the Funds did not have any transfers in and out of any Level. The Funds did not hold any derivative instruments or assets or liabilities that were measured at fair value on a recurring basis using significant unobservable inputs (Level 3) as of August 31, 2012. It is the Funds’ policy to recognize transfers into and out of any Level at the end of the reporting period.
Share Valuation and Redemption Fees – The net asset value per share of each class of shares of CM Advisors Fund and CM Advisors Small Cap Value Fund is calculated on each business day by dividing the total value of the assets attributable to that class, less liabilities attributable to that class, by the number of shares of that class outstanding. The net asset value per share of CM Advisors Opportunity Fund and CM Advisors Fixed Income Fund is calculated on each business day by dividing the total value of each Fund’s assets, less liabilities, by the number of shares outstanding. The offering price and redemption price per share of each Class and each Fund is equal to the net asset value per share, except that shares of each Class and each Fund are subject to a redemption fee of 1%, payable to the applicable Fund, if redeemed within 180 days of the date of purchase. During the periods ended August 31, 2012 and February 29, 2012, proceeds from redemption fees were as follows:
| | Six Months Ended August 31, 2012 | | | Period Ended February 29, 2012 | |
| CM Advisors Fund - Class I | | $ | 947 | | | $ | 5,982 | |
| CM Advisors Fund - Class R | | $ | 204 | | | $ | — | |
| CM Advisors Small Cap Value Fund - Class I | | $ | — | | | $ | 543 | |
| CM Advisors Opportunity Fund | | $ | — | | | $ | 186 | |
| CM Advisors Fixed Income Fund | | $ | 5,796 | | | $ | 5,841 | |
There were no redemption fees for Class C shares of CM Advisors Fund or Class C and Class R shares of CM Advisors Small Cap Value Fund during the periods ended August 31, 2012 and February 29, 2012.
Investment Transactions and Investment Income – Investment transactions are accounted for on trade date. Dividend income is recorded on the ex-dividend date. Interest income is accrued as earned. Discounts and premiums on fixed income securities purchased are amortized using the effective interest method. Gains and losses on securities sold are determined on a specific identification basis, which is the same basis used for federal income tax purposes.
Expenses – The Funds bear expenses incurred specifically on their behalf as well as a portion of general Trust expenses, which are allocated according to methods authorized by the Board of Trustees.
Allocation Between Classes – Investment income earned, realized capital gains and losses, and unrealized appreciation and depreciation are allocated daily to each class of shares based upon its proportionate share of total net assets of CM Advisors Fund and CM Advisors Small Cap Value Fund. Class specific expenses are charged directly to the class incurring the expense. Common expenses which are not attributable to a specific class are allocated daily to each class of shares based upon its proportionate share of total net assets of each Fund.
| CM Advisors Family of Funds |
Notes to Financial Statements (Continued) |
Dividend Distributions – Dividends arising from net investment income, if any, are declared and paid quarterly to shareholders of each Fund. Distributions from capital gains, if any, are generally declared and distributed annually. The amount of distributions from net investment income and net realized gains are determined in accordance with federal income tax regulations which may differ from GAAP. These “book/tax” differences are either temporary or permanent in nature and are primarily due to differing treatments of net short-term gains. Dividends and distributions are recorded on the ex-dividend date.
The tax character of distributions paid during the periods ended August 31, 2012 and February 29, 2012 was as follows:
| | | | | | | | | | |
| CM Advisors Fund - Class I | 08/31/12 | | $ | 33,477 | | | $ | — | | | $ | 33,477 | |
| | 02/29/12 | | $ | 318,248 | | | $ | — | | | $ | 318,248 | |
| CM Advisors Fund - Class R | 08/31/12 | | $ | — | | | $ | — | | | $ | — | |
| | 02/29/12 | | $ | 57 | | | $ | — | | | $ | 57 | |
| CM Advisors Small Cap Value Fund - Class I | 08/31/12 | | $ | — | | | $ | — | | | $ | — | |
| | 02/29/12 | | $ | 116,078 | | | $ | — | | | $ | 116,078 | |
| CM Advisors Small Cap Value Fund - Class C | 08/31/12 | | $ | — | | | $ | — | | | $ | — | |
| | 02/29/12 | | $ | 1,153 | | | $ | — | | | $ | 1,153 | |
| CM Advisors Small Cap Value Fund - Class R | 08/31/12 | | $ | — | | | $ | — | | | $ | — | |
| | 02/29/12 | | $ | 1,153 | | | $ | — | | | $ | 1,153 | |
| CM Advisors Opportunity Fund | 08/31/12 | | $ | — | | | $ | — | | | $ | — | |
| | 02/29/12 | | $ | 51,062 | | | $ | — | | | $ | 51,062 | |
| CM Advisors Fixed Income Fund | 08/31/12 | | $ | 767,529 | | | $ | — | | | $ | 767,529 | |
| | 02/29/12 | | $ | 3,571,380 | | | $ | 212,034 | | | $ | 3,783,414 | |
During the periods ended August 31, 2012 and February 29, 2012, no distributions were paid by Class C shares of CM Advisors Fund.
Estimates – The preparation of financial statements in conformity with GAAP requires management to make estimates and assumptions that affect the reported amounts of assets and liabilities and disclosure of contingent assets and liabilities as of the date of the financial statements and the reported amounts of income and expenses during the reporting period. Actual results could differ from those estimates.
3. Federal Income Tax
It is each Fund’s policy to comply with the special provisions of Subchapter M of the Internal Revenue Code applicable to regulated investment companies. As provided therein, in any fiscal year in which a Fund so qualifies, and distributes at least 90% of its taxable net income, the Fund (but not the shareholders) will be relieved of federal income tax on the income distributed. Accordingly, no provision for income taxes has been made.
| CM Advisors Family of Funds |
Notes to Financial Statements (Continued) |
In order to avoid imposition of the excise tax applicable to regulated investment companies, it is also each Fund’s intention to declare as dividends in each calendar year at least 98% of its net investment income (earned during the calendar year) and 98.2% of its net realized capital gains (earned during the twelve months ended October 31) plus undistributed amounts from prior years.
The following information is computed on a tax basis for each item as of August 31, 2012:
| | | | | CM Advisors Small Cap Value Fund | | | CM Advisors Opportunity Fund | | | CM Advisors Fixed Income Fund | |
| Tax cost of portfolio investments | | $ | 114,535,064 | | | $ | 8,780,720 | | | $ | 1,711,704 | | | $ | 96,231,681 | |
| Gross unrealized appreciation | | $ | 16,057,792 | | | $ | 1,174,533 | | | $ | 76,340 | | | $ | 5,310,332 | |
| Gross unrealized depreciation | | | (6,986,577 | ) | | | (626,230 | ) | | | (75,211 | ) | | | (87,560 | ) |
| Net unrealized appreciation | | | 9,071,215 | | | | 548,303 | | | | 1,129 | | | | 5,222,772 | |
| Accumulated ordinary income | | | 166,674 | | | | 18,125 | | | | — | | | | 219,700 | |
| Capital loss carryforwards | | | (39,829,048 | ) | | | — | | | | (19,099 | ) | | | — | |
| Post-October losses | | | (8,064,209 | ) | | | (164,327 | ) | | | — | | | | — | |
| Other gains (losses) | | | 7,395,171 | | | | 369,099 | | | | (35,223 | ) | | | 1,145,109 | |
| Accumulated earnings (deficit) | | $ | (31,260,197 | ) | | $ | 771,200 | | | $ | (53,193 | ) | | $ | 6,587,581 | |
Under the Regulated Investment Company Modernization Act of 2010 (the “Act”), net capital losses recognized after February 28, 2011 may be carried forward indefinitely, and their character is retained as short-term and/or long-term losses. Under the law in effect prior to the Act, pre-enactment net capital losses were carried forward for eight years and treated as short-term losses. As a transition rule, the Act requires that post-enactment net capital losses be used before pre-enactment net capital losses. Therefore, pre-enactment capital loss carryforwards are more likely to expire unused.
As of February 29, 2012, CM Advisors Fund and CM Advisors Opportunity Fund had the following capital loss carryforwards for income tax purposes:
| | | | | CM Advisors Opportunity Fund | |
| Expires February 28, 2017 - short-term | | $ | 8,868,813 | | | $ | — | |
| Expires February 28, 2018 - short-term | | | 30,960,235 | | | | — | |
| No expiration - short-term | | | — | | | | 19,099 | |
| | | $ | 39,829,048 | | | $ | 19,099 | |
In addition, CM Advisors Fund and CM Advisors Small Cap Value Fund had net realized losses of $8,064,209 and $164,327, respectively, during the period November 1, 2011 through February 29, 2012 (“post-October” losses), which are treated for federal income tax purposes as arising during each Fund’s tax year ending February 28, 2013. These capital loss carryforwards and post-October losses may be utilized in the current and future years to offset net realized capital gains, if any, prior to distributing such gains to shareholders.
| CM Advisors Family of Funds |
Notes to Financial Statements (Continued) |
The Funds recognize the benefits or expenses of uncertain tax positions only if the position is “more-likely-than-not” of being sustained assuming examination by tax authorities. Management has reviewed the tax positions taken on Federal income tax returns for all open tax years (tax years ended February 28, 2009 through February 29, 2012) and has concluded that no provision for unrecognized tax benefits or expenses is required in these financial statements.
4. Investment Transactions
During the six months ended August 31, 2012, cost of purchases and proceeds from sales of investment securities, other than short-term investments and U.S. government securities, were as follows:
| | | | | CM Advisors Small Cap Value Fund | | | CM Advisors Opportunity Fund | | | CM Advisors Fixed Income Fund | |
Cost of purchases of investment securities | | $ | 17,414,405 | | | $ | 2,047,086 | | | $ | 3,582,941 | | | $ | 1,153,017 | |
Proceeds from sales of investment securities | | $ | 29,435,318 | | | $ | 1,800,209 | | | $ | 3,121,824 | | | $ | 6,542,688 | |
5. Transactions with Affiliates
INVESTMENT ADVISORY AGREEMENT
The Funds pay a monthly advisory fee to Van Den Berg Management I, Inc. (the “Advisor”) based upon the average daily net assets of each Fund and calculated at the annual rate of 1.00% for each of CM Advisors Fund and CM Advisors Small Cap Value Fund, 1.25% for CM Advisors Opportunity Fund and 0.50% for CM Advisors Fixed Income Fund. The Advisor has entered into contractual agreements (the “Expense Limitation Agreements”) with each Fund under which it has agreed to waive its fees and to assume other expenses of the Funds, if necessary, in an amount that limits the Funds’ total operating expenses (exclusive of interest, taxes, brokerage commissions, extraordinary expenses, and payments, if any, under a Rule 12b-1 plan) to not more than 1.50% of the average daily net assets of CM Advisors Fund, CM Advisors Opportunity Fund and CM Advisors Fixed Income Fund and not more than 1.25% of the average daily net assets of CM Advisors Small Cap Value Fund, each until July 1, 2013. There can be no assurance that the Expense Limitation Agreements will continue beyond July 1, 2013. Accordingly, during the six months ended August 31, 2012, with respect to CM Advisors Fund, the Advisor reimbursed the Fund for $21,019 of Class C expenses and $14,846 of Class R expenses; with respect to CM Advisors Small Cap Value Fund, the Advisor waived its entire investment advisory fee of $46,428 and reimbursed the Fund for $16,493 of common expenses, $17,219 of Class I expenses, $14,782 of Class C expenses and $14,960 of Class R expenses; with respect to CM Advisors Opportunity Fund, the Advisor waived its entire investment advisory fee of $10,963 and reimbursed the Fund for $58,256 of other operating expenses. During the six months ended August 31, 2012, there were no advisory fees waived or expenses reimbursed by the Advisor for CM Advisors Fixed Income Fund.
Certain Trustees and Officers of the Trust are also officers of the Advisor.
| CM Advisors Family of Funds |
Notes to Financial Statements (Continued) |
ADMINISTRATION AGREEMENT
Under the terms of an Administration Agreement with the Trust, Ultimus Fund Solutions, LLC (“Ultimus”) provides executive and administrative services and internal regulatory compliance services for the Funds. Ultimus supervises the preparation of tax returns, reports to shareholders of the Funds, reports to and filings with the Securities and Exchange Commission (“SEC”) and state securities commissions and prepares materials for meetings of the Board of Trustees. For these services, each Fund pays to Ultimus a monthly fee at an annual rate of 0.08% per annum of its average daily net assets up to $500 million, 0.05% of such assets from $500 million to $2 billion, 0.04% of such assets from $2 billion to $3 billion and 0.03% of such assets in excess of $3 billion, provided, however, that the minimum fee is $2,000 per month with respect to each Fund.
Certain officers of the Trust are also officers of Ultimus, or of Ultimus Fund Distributors, LLC (the “Distributor”), the principal underwriter of the Funds’ shares and an affiliate of Ultimus.
FUND ACCOUNTING AGREEMENT
Under the terms of a Fund Accounting Agreement with the Trust, Ultimus calculates the daily net asset value per share and maintains the financial books and records of each Fund. For these services, Ultimus receives a base fee of $5,500 per month from CM Advisors Fund, $3,000 per month from CM Advisors Small Cap Value Fund and $2,000 per month from each of CM Advisors Opportunity Fund and CM Advisors Fixed Income Fund, plus an asset-based fee at the annual rate of 0.01% of the first $500 million of each Fund's average daily net assets and 0.005% of such assets in excess of $500 million. Prior to June 1, 2012, Ultimus received a base fee of $3,000 per month from the CM Advisors Fund. In addition, each Fund pay all costs of external pricing services.
TRANSFER AGENT AND SHAREHOLDER SERVICES AGREEMENT
Under the terms of a Transfer Agent and Shareholder Services Agreement with the Trust, Ultimus maintains the records of each shareholder’s account, answers shareholders’ inquiries concerning their accounts, processes purchases and redemptions of each Fund’s shares, acts as dividend and distribution disbursing agent and performs other shareholder service functions. For these services, Ultimus receives from each Fund a fee, payable monthly, at an annual rate of $17 per account, provided, however, that the minimum fee with respect to each share class is $1,000 per month if a class has 25 shareholder accounts or less, $1,250 if a class has more than 25 but less than 100 shareholder accounts, and $1,500 per month if a class has 100 or more shareholder accounts. In addition, each Fund pays out-of-pocket expenses, including but not limited to, postage and supplies.
During the six months ended August 31, 2012, the transfer agent fees per class incurred by CM Advisors Fund and CM Advisors Small Cap Value Fund related to the above agreement amounted to:
| | | | | CM Advisors Small Cap Value Fund | |
| Class I | | $ | 13,087 | | | $ | 7,500 | |
| Class C | | $ | 4,000 | | | $ | 6,000 | |
| Class R | | $ | 6,000 | | | $ | 6,000 | |
| CM Advisors Family of Funds |
Notes to Financial Statements (Continued) |
DISTRIBUTION AGREEMENT
Pursuant to the terms of a Distribution Agreement with the Trust, the Distributor serves as the Funds’ principal underwriter. The Distributor is a wholly-owned subsidiary of Ultimus. The Distributor receives annual compensation of $6,000 from the Trust for such services, of which each Fund pays its proportionate share.
DISTRIBUTION PLAN
The Trust has adopted plans of distribution (the “Plans”) pursuant to Rule 12b-1 under the 1940 Act, which permit Class C and Class R shares of CM Advisors Fund and CM Advisors Small Cap Value Fund to directly incur or reimburse the Funds’ principal underwriter for certain expenses related to the distribution of their shares. The annual limitation for payment of expenses pursuant to the Plans is 1.00% of each Fund’s average daily net assets attributable to Class C shares and 0.25% of each Fund’s average daily net assets attributable to Class R shares. The Trust has not adopted a plan of distribution with respect to Class I shares of CM Advisors Fund or CM Advisors Small Cap Value Fund, or with respect to CM Advisors Opportunity Fund or CM Advisors Fixed Income Fund.
During the six months ended August 31, 2012, Class C and Class R shares of CM Advisors Fund incurred distribution expenses of $333 and $142, respectively, and Class C and Class R shares of CM Advisors Small Cap Value Fund incurred distribution expenses of $475 and $283, respectively.
6. Capital Share Transactions
Proceeds and payments on capital shares as shown in the Statement of Changes in Net Assets for CM Advisors Fund and CM Advisors Small Cap Value Fund are the result of the following capital share transactions for the periods shown:
| | Six Months Ended August 31, 2012 | | | Period Ended February 29, 2012 | |
| CM Advisors Fund - Class I | | | | | | |
| Shares sold | | | 534,202 | | | | 1,118,353 | |
| Shares reinvested | | | 2,924 | | | | 30,487 | |
| Shares redeemed | | | (1,084,066 | ) | | | (2,599,118 | ) |
| Net decrease in shares outstanding | | | (546,940 | ) | | | (1,450,278 | ) |
| Shares outstanding, beginning of period | | | 12,061,158 | | | | 13,511,436 | |
| Shares outstanding, end of period | | | 11,514,218 | | | | 12,061,158 | |
| | | | | | | | | |
| CM Advisors Fund - Class C | | | | | | | | |
| Shares sold | | | — | | | | 9,569 | |
| Shares redeemed | | | (9,569 | ) | | | — | |
| Increase (decrease) in shares outstanding | | | (9,569 | ) | | | 9,569 | |
| Shares outstanding, beginning of period | | | 9,569 | | | | — | |
| Shares outstanding, end of period | | | — | | | | 9,569 | |
| CM Advisors Family of Funds |
Notes to Financial Statements (Continued) |
| | Six Months Ended August 31, 2012 | | | Period Ended February 29, 2012 | |
| | | | | | | | | |
| CM Advisors Fund - Class R | | | | | | | | |
| Shares sold | | | — | | | | 11,569 | |
| Shares reinvested | | | — | | | | 6 | |
| Shares redeemed | | | (2,000 | ) | | | — | |
| Increase (decrease) in shares outstanding | | | (2,000 | ) | | | 11,575 | |
| Shares outstanding, beginning of period | | | 11,575 | | | | — | |
| Shares outstanding, end of period | | | 9,575 | | | | 11,575 | |
| | | | | | | | | |
| CM Advisors Small Cap Value Fund - Class I | | | | | | | | |
| Shares sold | | | 29,442 | | | | 904,909 | |
| Shares reinvested | | | — | | | | 12,941 | |
| Shares redeemed | | | (4,635 | ) | | | (7,972 | ) |
| Net increase in shares outstanding | | | 24,807 | | | | 909,878 | |
| Shares outstanding, beginning of period | | | 909,878 | | | | — | |
| Shares outstanding, end of period | | | 934,685 | | | | 909,878 | |
| | | | | | | | | |
| CM Advisors Small Cap Value Fund - Class C | | | | | | | | |
| Shares sold | | | — | | | | 9,718 | |
| Shares reinvested | | | — | | | | 129 | |
| Increase in shares outstanding | | | — | | | | 9,847 | |
| Shares outstanding, beginning of period | | | 9,847 | | | | — | |
| Shares outstanding, end of period | | | 9,847 | | | | 9,847 | |
| | | | | | | | | |
| CM Advisors Small Cap Value Fund - Class R | | | | | | | | |
| Shares sold | | | 13,155 | | | | 13,485 | |
| Shares reinvested | | | — | | | | 128 | |
| Increase in shares outstanding | | | 13,155 | | | | 13,613 | |
| Shares outstanding, beginning of period | | | 13,613 | | | | — | |
| Shares outstanding, end of period | | | 26,768 | | | | 13,613 | |
Note 7. Sector Risk
If a Fund has significant investments in the securities of issuers in industries within a particular sector, any development affecting that sector will have a greater impact on the value of the net assets of the Fund than would be the case if the Fund did not have significant investments in that sector. In addition, this may increase the risk of loss of an investment in the Fund and increase the volatility of the Fund’s net asset value per share. As of August 31, 2012, CM Advisors Fund had 27.7% and 24.5%, respectively, of the value of its net assets invested in stocks within the Industrials and Information Technology sectors, CM Advisors Small Cap Value Fund had 49.7% of the value of its net assets invested in stocks within the Industrials sector and CM Advisors Opportunity Fund had 24.4% of the value of its net assets invested in the stocks within the Information Technology sector. From time to time, a particular set of circumstances may affect one of these sectors or certain companies within the sectors, while having little or no impact on other sectors or other companies with the sectors. For instance, economic
| CM Advisors Family of Funds |
Notes to Financial Statements (Continued) |
or market factors, regulation or deregulation, and technological or other developments may negatively impact all companies in a particular sector and therefore the value of the Funds’ portfolios will be adversely affected.
8. Contingencies and Commitments
The Funds indemnify the Trust’s officers and Trustees for certain liabilities that might arise from the performance of their duties to the Funds. Additionally, in the normal course of business, the Funds enter into contracts that contain a variety of representations and warranties and which provide general indemnifications. Each Fund’s maximum exposure under these arrangements is unknown, as this would involve future claims that may be made against the Funds that have not yet occurred. However, based on experience, the Trust expects the risk of loss to be remote.
9. Subsequent Events
The Funds are required to recognize in the financial statements the effects of all subsequent events that provide additional evidence about conditions that existed as of the date of the Statements of Assets and Liabilities. For non-recognized subsequent events that must be disclosed to keep the financial statements from being misleading, the Funds are required to disclose the nature of the event as well as an estimate of the financial effect, or a statement that such an estimate cannot be made. Management has evaluated subsequent events through the issuance of these financial statements and has noted no such events except as reflected in the following paragraph.
At a meeting held on October 26, 2012, the Board of Trustees of the Trust determined to discontinue the operations of CM Advisors Opportunity Fund. It is anticipated that all outstanding shares of the Fund will be redeemed and that the Fund will discontinue operations on or about December 14, 2012. The Adviser will continue to waive fees and reimburse expenses of the Fund, as necessary, in order to maintain fees and expenses at their current level.
| CM Advisors Family of Funds |
About Your Funds’ Expenses (Unaudited) |
We believe it is important for you to understand the impact of costs on your investment. As a shareholder of the Funds, you may incur two types of costs: (1) transaction costs, including redemption fees; and (2) ongoing costs, including management fees, distribution (12b-1) fees and other Fund expenses. Ongoing costs, which are deducted from each Fund’s gross income, directly reduce the investment return of the Funds.
A mutual fund’s ongoing costs are expressed as a percentage of its average net assets. This figure is known as the expense ratio. The following examples are intended to help you understand the ongoing costs (in dollars) of investing in the Funds and to compare these costs with the ongoing costs of investing in other mutual funds. The examples below are based on an investment of $1,000 made at the beginning of the most recent semi-annual period (March 1, 2012) and held until the end of the period (August 31, 2012).
The table below illustrates each Fund’s costs in two ways:
Actual fund return – This section helps you to estimate the actual expenses that you paid over the period. The “Ending Account Value” shown is derived from each Fund’s actual return, and the third column shows the dollar amount of expenses that would have been paid by an investor who started with $1,000 in the Funds. You may use the information here, together with the amount you invested, to estimate the ongoing costs that you paid over the period.
To do so, simply divide your account value by $1,000 (for example, an $8,600 account value divided by $1,000 = 8.6), then multiply the result by the number given for the Funds under the heading “Expenses Paid During Period.”
Hypothetical 5% return – This section is intended to help you compare the Funds’ ongoing costs with those of other mutual funds. It assumes that each Fund had an annual return of 5% before expenses during the period shown, but that the expense ratio is unchanged. In this case, because the return used is not the Funds’ actual returns, the results do not apply to your investment. The example is useful in making comparisons because the SEC requires all mutual funds to calculate expenses based on a 5% return. You can assess each Fund’s ongoing costs by comparing this hypothetical example with the hypothetical examples that appear in shareholder reports of other funds.
Note that expenses shown in the table are meant to highlight and help you compare ongoing costs only. The Funds do not impose any sales loads. However, a redemption fee of 1% is charged on the sale of shares within 180 days of the date of their purchase.
The calculations assume no shares were bought or sold during the period. Your actual costs may have been higher or lower, depending on the amount of your investment and the timing of any purchases or redemptions.
More information about the Funds’ expenses, including annual expense ratios, can be found in this report. For additional information on operating expenses and other shareholder costs, please refer to the Funds’ prospectus.
| CM Advisors Family of Funds |
About Your Funds’ Expenses (Unaudited) (Continued) |
| CM Advisors Fund - Class I |
| Beginning Account Value March 1, 2012 | Ending Account Value August 31, 2012 | Expenses Paid During Period* |
| Based on Actual Fund Return | $1,000.00 | $1,007.80 | $6.61 |
Based on Hypothetical 5% Return (before expenses) | $1,000.00 | $1,018.55 | $6.65 |
| * | Expenses are equal to the annualized expense ratio of 1.31% for the period, multiplied by the average account value over the period, multiplied by 184/366 (to reflect the one-half year period). |
| CM Advisors Fund - Class R |
| Beginning Account Value March 1, 2012 | Ending Account Value August 31, 2012 | Expenses Paid During Period* |
| Based on Actual Fund Return | $1,000.00 | $1,007.50 | $8.83 |
Based on Hypothetical 5% Return (before expenses) | $1,000.00 | $1,016.34 | $8.87 |
| * | Expenses are equal to the annualized expense ratio of 1.75% for the period, multiplied by the average account value over the period, multiplied by 184/366 (to reflect the one-half year period). |
| CM Advisors Small Cap Value Fund - Class I |
| Beginning Account Value March 1, 2012 | Ending Account Value August 31, 2012 | Expenses Paid During Period* |
| Based on Actual Fund Return | $1,000.00 | $989.80 | $6.25 |
Based on Hypothetical 5% Return (before expenses) | $1,000.00 | $1,018.85 | $6.34 |
| * | Expenses are equal to the annualized expense ratio of 1.25% for the period, multiplied by the average account value over the period, multiplied by 184/366 (to reflect the one-half year period). |
| CM Advisors Small Cap Value Fund - Class C |
| Beginning Account Value March 1, 2012 | Ending Account Value August 31, 2012 | Expenses Paid During Period* |
| Based on Actual Fund Return | $1,000.00 | $984.70 | $11.22 |
Based on Hypothetical 5% Return (before expenses) | $1,000.00 | $1,013.83 | $11.39 |
| * | Expenses are equal to the annualized expense ratio of 2.25% for the period, multiplied by the average account value over the period, multiplied by 184/366 (to reflect the one-half year period). |
| CM Advisors Family of Funds |
About Your Funds’ Expenses (Unaudited) (Continued) |
| CM Advisors Small Cap Value Fund - Class R |
| Beginning Account Value March 1, 2012 | Ending Account Value August 31, 2012 | Expenses Paid During Period* |
| Based on Actual Fund Return | $1,000.00 | $988.80 | $7.50 |
Based on Hypothetical 5% Return (before expenses) | $1,000.00 | $1,017.60 | $7.61 |
| * | Expenses are equal to the annualized expense ratio of 1.50% for the period, multiplied by the average account value over the period, multiplied by 184/366 (to reflect the one-half year period). |
| CM Advisors Opportunity Fund |
| Beginning Account Value March 1, 2012 | Ending Account Value August 31, 2012 | Expenses Paid During Period* |
| Based on Actual Fund Return | $1,000.00 | $993.80 | $7.52 |
Based on Hypothetical 5% Return (before expenses) | $1,000.00 | $1,017.60 | $7.61 |
| * | Expenses are equal to the annualized expense ratio of 1.50% for the period, multiplied by the average account value over the period, multiplied by 184/366 (to reflect the one-half year period). |
| CM Advisors Fixed Income Fund |
| Beginning Account Value March 1, 2012 | Ending Account Value August 31, 2012 | Expenses Paid During Period* |
| Based on Actual Fund Return | $1,000.00 | $1,013.90 | $4.05 |
Based on Hypothetical 5% Return (before expenses) | $1,000.00 | $1,021.11 | $4.06 |
| * | Expenses are equal to the annualized expense ratio of 0.80% for the period, multiplied by the average account value over the period, multiplied by 184/366 (to reflect the one-half year period). |
| CM Advisors Family of Funds |
Other Information (Unaudited) |
The Trust files a complete listing of portfolio holdings for the Funds with the SEC as of the end of the first and third quarters of each fiscal year on Form N-Q. The filings are available upon request, by calling 1-888-859-5856. Furthermore, you may obtain a copy of these filings on the SEC’s website at http://www.sec.gov. The Trust’s Forms N-Q may also be reviewed and copied at the SEC’s Public Reference Room in Washington, DC, and information on the operation of the Public Reference Room may be obtained by calling 1-800-SEC-0330.
A description of the policies and procedures that the Funds use to determine how to vote proxies relating to portfolio securities is available without charge upon request by calling toll-free 1-888-859-5856, or on the SEC’s website at http://www.sec.gov. Information regarding how the Funds voted proxies relating to portfolio securities during the most recent 12-month period ended June 30 is also available without charge upon request by calling toll-free 1-888-859-5856, or on the SEC’s website at http://www.sec.gov.
This page intentionally left blank.
CM Advisors Fund
CM Advisors Small Cap Value Fund
CM Advisors Opportunity Fund and
CM Advisors Fixed Income Fund
are each a series of
CM Advisors Family of Funds
_______________________
| | For Shareholder Service Inquiries: | For Investment Advisor Inquiries: |
| | Ultimus Fund Solutions, LLC P.O. Box 46707 Cincinnati, OH 45246-0707 | Van Den Berg Management I, Inc. (d/b/a CM Fund Advisors) 805 Las Cimas Parkway, Suite 430 Austin, Texas 78746 |
| | | |
| | Toll-Free Telephone: | Toll-Free Telephone: |
| | 1-888-859-5856 | 1-888-859-5856 |
| | | |
| | | World Wide Web @: |
| | | www.cmadvisorsfunds.com |
Investment in the Funds is subject to investment risks, including the possible loss of some or all of the principal amount invested. No investment strategy works all the time, and past performance is not necessarily indicative of future performance. The performance information quoted in this report represents past performance, which is not a guarantee of future results. Investment return and principal value of an investment will fluctuate so that an investor’s shares, when redeemed, may be worth more or less than their original cost. Current performance may be lower or higher than the performance data quoted. A redemption fee of 1% of the amount redeemed is imposed on redemptions of Fund shares occurring within 180 days following the purchase of such shares. An investor should consider the investment objectives, risks, and charges and expenses of the Funds carefully before investing. The prospectus contains this and other information about the Funds. A copy of the prospectus is available at www.cmadvisorsfunds.com or by calling Shareholder Services at 1-888-859-5856. The prospectus should be read carefully before investing. |
For More Information on your CM Advisors Family of Funds:
See Our Web site @ www.cmadvisorsfunds.com or
Call Our Shareholder Services Group Toll-Free at 1-888-859-5856
Not required
| Item 3. | Audit Committee Financial Expert. |
Not required
| Item 4. | Principal Accountant Fees and Services. |
Not required
| Item 5. | Audit Committee of Listed Registrants. |
Not applicable
| Item 6. | Schedule of Investments. |
(a) Not applicable [schedule filed with Item 1]
| Item 7. | Disclosure of Proxy Voting Policies and Procedures for Closed-End Management Investment Companies. |
| Item 8. | Portfolio Managers of Closed-End Management Investment Companies. |
| Item 9. | Purchases of Equity Securities by Closed-End Management Investment Company and Affiliated Purchasers. |
| Item 10. | Submission of Matters to a Vote of Security Holders. |
The registrant has not adopted procedures by which shareholders may recommend nominees to the registrant’s board of trustees.
| Item 11. | Controls and Procedures. |
(a) Based on their evaluation of the registrant’s disclosure controls and procedures (as defined in Rule 30a-3(c) under the Investment Company Act of 1940) as of a date within 90 days of the filing date of this report, the registrant’s principal executive officer and principal financial officer have concluded that such disclosure controls and procedures are reasonably designed and are operating effectively to ensure that material information relating to the registrant, including its consolidated subsidiaries, is made known to them by others within those entities, particularly during the period in which this report is being prepared, and that the information required in filings on Form N-CSR is recorded, processed, summarized, and reported on a timely basis.
(b) There were no changes in the registrant’s internal control over financial reporting (as defined in Rule 30a-3(d) under the Investment Company Act of 1940) that occurred during the second fiscal quarter of the period covered by this report that have materially affected, or are reasonably likely to materially affect, the registrant’s internal control over financial reporting.
File the exhibits listed below as part of this Form. Letter or number the exhibits in the sequence indicated.
(a)(1) Any code of ethics, or amendment thereto, that is the subject of the disclosure required by Item 2, to the extent that the registrant intends to satisfy the Item 2 requirements through filing of an exhibit: Not required
(a)(2) A separate certification for each principal executive officer and principal financial officer of the registrant as required by Rule 30a-2(a) under the Act (17 CFR 270.30a-2(a)): Attached hereto
(a)(3) Any written solicitation to purchase securities under Rule 23c-1 under the Act (17 CFR 270.23c-1) sent or given during the period covered by the report by or on behalf of the registrant to 10 or more persons: Not applicable
(b) Certifications required by Rule 30a-2(b) under the Act (17 CFR 270.30a-2(b)): Attached hereto