CM Advisors Family of Funds
Semi-Annual Report 2014
CM Advisors Fund
CM Advisors Small Cap Value Fund
CM Advisors Fixed Income Fund
August 31, 2014
(Unaudited)
This report and the financial statements contained herein are submitted for the general information of the shareholders of the CM Advisors Family of Funds (the "Funds"). This report is not authorized for distribution to prospective investors in the Funds unless preceded or accompanied by an effective prospectus. Mutual fund shares are not deposits or obligations of, or guaranteed by, any depository institution. Shares are not insured by the FDIC, Federal Reserve Board or any other agency, and are subject to investment risks, including possible loss of principal amount invested.
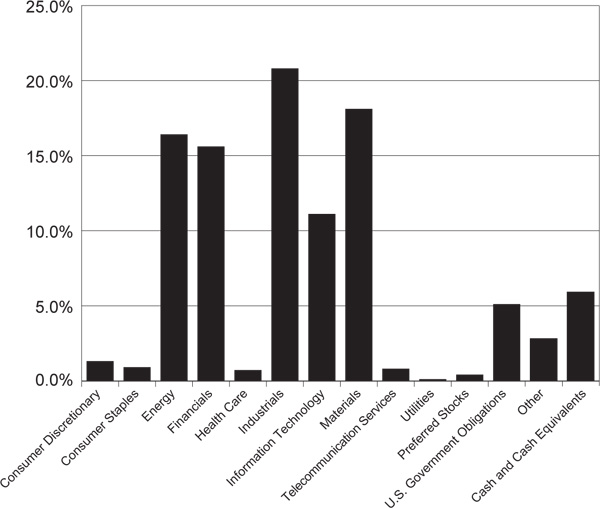
CM Advisors Fund
Supplementary Portfolio Information
August 31, 2014 (Unaudited)
Asset and Sector Allocation
(% of Net Assets)
Top 10 Equity Holdings
| Security Description | | % of Net Assets |
| Berkshire Hathaway, Inc. - Class B | | 3.8% |
| Wells Fargo & Company | | 3.6% |
| Jacobs Engineering Group, Inc. | | 3.5% |
| Orion Marine Group, Inc. | | 2.9% |
| Corning, Inc. | | 2.8% |
| POSCO - ADR | | 2.6% |
| Markel Corporation | | 2.2% |
| Cisco Systems, Inc. | | 2.1% |
| Layne Christensen Company | | 2.1% |
| McDermott International, Inc. | | 2.0% |
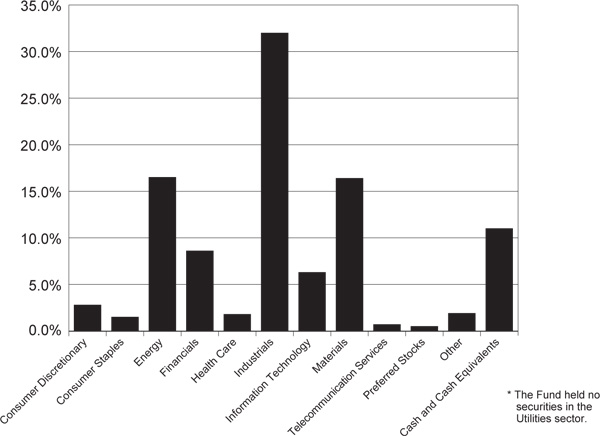
CM Advisors Small Cap Value Fund
Supplementary Portfolio Information
August 31, 2014 (Unaudited)
Asset and Sector Allocation*
(% of Net Assets)
Top 10 Equity Holdings
| Security Description | | % of Net Assets |
| Hallador Energy Company | | 3.1% |
| Synalloy Corporation | | 2.8% |
| Orion Marine Group, Inc. | | 2.7% |
| Astec Industries, Inc. | | 2.6% |
| McDermott International, Inc. | | 2.6% |
| Enstar Group Ltd. | | 2.5% |
| Dynamic Materials Corporation | | 2.4% |
| Insteel Industries, Inc. | | 2.4% |
| Layne Christensen Company | | 2.3% |
| Houston Wire & Cable Company | | 2.2% |
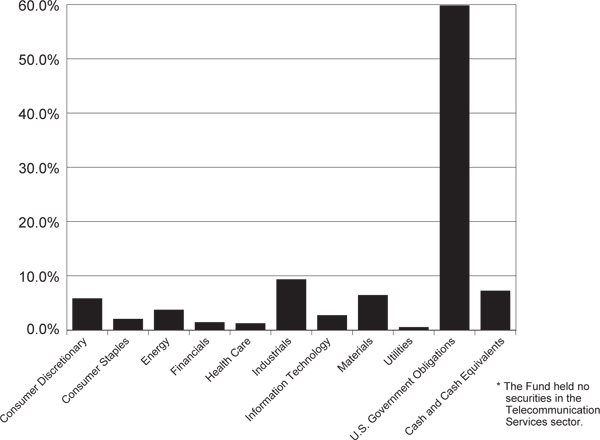
CM Advisors Fixed Income Fund
Supplementary Portfolio Information
August 31, 2014 (Unaudited)
Asset and Sector Allocation*
(% of Net Assets)
Top 10 Long-Term Holdings
| Security Description | | % of Net Assets |
| U.S. Treasury Notes, 2.50%, due 04/30/15 | | 8.1% |
| U.S. Treasury Notes, 0.75%, due 12/31/17 | | 7.8% |
| U.S. Treasury Notes, 2.75%, due 11/15/23 | | 5.1% |
| U.S. Treasury Notes, 2.375%, due 12/31/20 | | 5.1% |
| U.S. Treasury Notes, 2.00%, due 07/31/20 | | 4.8% |
| U.S. Treasury Notes, 4.625%, due 02/15/17 | | 4.3% |
| U.S. Treasury Notes, 0.375%, due 01/15/16 | | 4.0% |
| Great Lakes Dredge & Dock Company, 7.375%, due 02/01/19 | | 1.4% |
| Alcoa, Inc., 5.87%, due 02/23/22 | | 1.1% |
| Rowan Companies, Inc., 7.875%, due 08/01/19 | | 0.9% |
CM Advisors Fund
Schedule of Investments
August 31, 2014 (Unaudited)
| COMMON STOCKS — 85.8% | | Shares | | | Value | |
| Consumer Discretionary — 1.3% | | | | | | |
Auto Components — 0.0% (a) | | | | | | |
| Superior Industries International, Inc. | | | 1,690 | | | $ | 32,871 | |
| | | | | | | | | |
| Household Durables — 0.9% | | | | | | | | |
| UCP, Inc. - Class A * | | | 89,955 | | | | 1,146,926 | |
| | | | | | | | | |
| Media — 0.3% | | | | | | | | |
| Comcast Corporation - Class A Special | | | 6,450 | | | | 352,170 | |
| Reading International, Inc. - Class A * | | | 12,000 | | | | 103,680 | |
| | | | | | | | 455,850 | |
| Multiline Retail — 0.1% | | | | | | | | |
| Target Corporation | | | 1,190 | | | | 71,483 | |
| | | | | | | | | |
| Consumer Staples — 0.9% | | | | | | | | |
| Food & Staples Retailing — 0.1% | | | | | | | | |
| Tesco plc - ADR | | | 9,710 | | | | 112,345 | |
| | | | | | | | | |
| Food Products — 0.8% | | | | | | | | |
| Post Holdings, Inc. * | | | 29,750 | | | | 1,099,857 | |
| | | | | | | | | |
| Energy — 16.4% | | | | | | | | |
| Energy Equipment & Services — 13.0% | | | | | | | | |
| Atwood Oceanics, Inc. * | | | 26,085 | | | | 1,288,860 | |
| Dawson Geophysical Company | | | 39,180 | | | | 886,252 | |
| Diamond Offshore Drilling, Inc. | | | 52,885 | | | | 2,323,767 | |
| Ensco plc - Class A | | | 28,310 | | | | 1,429,089 | |
| Era Group, Inc. * | | | 65,135 | | | | 1,668,107 | |
| Halliburton Company | | | 32,935 | | | | 2,226,735 | |
| Key Energy Services, Inc. * | | | 223,800 | | | | 1,409,940 | |
| McDermott International, Inc. * | | | 385,825 | | | | 2,777,940 | |
| Pacific Drilling S.A. * | | | 7,130 | | | | 69,945 | |
| Tidewater, Inc. | | | 45,810 | | | | 2,330,355 | |
| Unit Corporation * | | | 20,955 | | | | 1,379,048 | |
| | | | | | | | 17,790,038 | |
| Oil, Gas & Consumable Fuels — 3.4% | | | | | | | | |
| Apache Corporation | | | 17,530 | | | | 1,785,080 | |
| Exxon Mobil Corporation | | | 14,085 | | | | 1,400,894 | |
| Hallador Energy Company | | | 9,724 | | | | 130,788 | |
| Total S.A. - ADR | | | 21,310 | | | | 1,405,608 | |
| | | | | | | | 4,722,370 | |
CM Advisors Fund
Schedule of Investments (Continued)
| COMMON STOCKS — 85.8% (Continued) | | Shares | | | Value | |
| Financials — 15.6% | | | | | | |
| Banks — 3.7% | | | | | | |
| Old National Bancorp | | | 4,590 | | | $ | 60,083 | |
| Trustmark Corporation | | | 2,005 | | | | 47,588 | |
| Wells Fargo & Company | | | 96,377 | | | | 4,957,633 | |
| | | | | | | | 5,065,304 | |
Capital Markets — 0.0% (a) | | | | | | | | |
| Charles Schwab Corporation (The) | | | 1,000 | | | | 28,510 | |
| | | | | | | | | |
| Diversified Financial Services — 1.1% | | | | | | | | |
| PICO Holdings, Inc. * | | | 65,647 | | | | 1,450,799 | |
| | | | | | | | | |
| Insurance — 9.5% | | | | | | | | |
| Berkshire Hathaway, Inc. - Class B * | | | 38,190 | | | | 5,241,577 | |
| Enstar Group Ltd. * | | | 8,666 | | | | 1,229,705 | |
| FNF Group * | | | 37,800 | | | | 1,070,118 | |
| FNFV Group * | | | 12,598 | | | | 188,718 | |
| Loews Corporation | | | 29,925 | | | | 1,308,920 | |
| Markel Corporation * | | | 4,526 | | | | 2,986,255 | |
| White Mountains Insurance Group Ltd. | | | 1,636 | | | | 1,037,617 | |
| | | | | | | | 13,062,910 | |
| Real Estate Management & Development — 0.5% | | | | | | | | |
| InterGroup Corporation (The) * | | | 38,825 | | | | 749,711 | |
| | | | | | | | | |
| Thrifts & Mortgage Finance — 0.8% | | | | | | | | |
| Nationstar Mortgage Holdings, Inc. * | | | 2,100 | | | | 73,500 | |
| Ocwen Financial Corporation * | | | 35,460 | | | | 990,752 | |
| | | | | | | | 1,064,252 | |
| Health Care — 0.7% | | | | | | | | |
Health Care Providers & Services — 0.0% (a) | | | | | | | | |
| InfuSystem Holdings, Inc. * | | | 10,279 | | | | 28,781 | |
| VCA Antech, Inc. * | | | 200 | | | | 8,150 | |
| | | | | | | | 36,931 | |
| Life Sciences Tools & Services — 0.7% | | | | | | | | |
| Harvard Bioscience, Inc. * | | | 209,625 | | | | 947,505 | |
| | | | | | | | | |
| Industrials — 20.8% | | | | | | | | |
| Aerospace & Defense — 0.3% | | | | | | | | |
| Innovative Solutions & Support, Inc. * | | | 86,956 | | | | 479,127 | |
| | | | | | | | | |
| Building Products — 2.0% | | | | | | | | |
| Insteel Industries, Inc. | | | 117,360 | | | | 2,755,613 | |
| Masonite International Corporation * | | | 400 | | | | 22,872 | |
| | | | | | | | 2,778,485 | |
CM Advisors Fund
Schedule of Investments (Continued)
| COMMON STOCKS — 85.8% (Continued) | | Shares | | | Value | |
| Industrials — 20.8% (Continued) | | | | | | |
| Commercial Services & Supplies — 1.0% | | | | | | |
| InnerWorkings, Inc. * | | | 157,725 | | | $ | 1,367,476 | |
| | | | | | | | | |
| Construction & Engineering — 9.9% | | | | | | | | |
| Granite Construction, Inc. | | | 33,010 | | | | 1,164,263 | |
| Great Lakes Dredge & Dock Corporation * | | | 120,545 | | | | 918,553 | |
| Jacobs Engineering Group, Inc. * | | | 88,565 | | | | 4,774,539 | |
| Layne Christensen Company * | | | 249,880 | | | | 2,843,634 | |
| Orion Marine Group, Inc. * | | | 388,115 | | | | 3,923,843 | |
| | | | | | | | 13,624,832 | |
| Electrical Equipment — 1.7% | | | | | | | | |
| Emerson Electric Company | | | 8,855 | | | | 566,897 | |
| Encore Wire Corporation | | | 10,170 | | | | 431,716 | |
| Powell Industries, Inc. | | | 25,120 | | | | 1,323,573 | |
| | | | | | | | 2,322,186 | |
| Machinery — 1.0% | | | | | | | | |
| Astec Industries, Inc. | | | 24,684 | | | | 1,025,373 | |
| Dynamic Materials Corporation | | | 8,685 | | | | 173,353 | |
| Omega Flex, Inc. | | | 8,715 | | | | 153,471 | |
| PMFG, Inc. * | | | 8,083 | | | | 43,325 | |
| | | | | | | | 1,395,522 | |
| Marine — 0.9% | | | | | | | | |
| Kirby Corporation * | | | 50 | | | | 5,964 | |
| Matson, Inc. | | | 43,845 | | | | 1,183,377 | |
| | | | | | | | 1,189,341 | |
| Professional Services — 1.1% | | | | | | | | |
| CDI Corporation | | | 84,861 | | | | 1,287,341 | |
| CTPartners Executive Search, Inc. * | | | 8,530 | | | | 153,114 | |
| | | | | | | | 1,440,455 | |
| Trading Companies & Distributors — 2.9% | | | | | | | | |
| Essex Rental Corporation * | | | 216,211 | | | | 553,500 | |
| Houston Wire & Cable Company | | | 104,395 | | | | 1,359,223 | |
| Lawson Products, Inc. * | | | 78,604 | | | | 1,399,151 | |
| Signature Group Holdings, Inc. * | | | 74,260 | | | | 611,903 | |
| Transcat, Inc. * | | | 7,671 | | | | 67,428 | |
| | | | | | | | 3,991,205 | |
| Information Technology — 11.1% | | | | | | | | |
| Communications Equipment — 2.2% | | | | | | | | |
| Cisco Systems, Inc. | | | 114,665 | | | | 2,865,478 | |
| QUALCOMM, Inc. | | | 1,150 | | | | 87,515 | |
| | | | | | | | 2,952,993 | |
| Electronic Equipment, Instruments & Components — 6.4% | | | | | | | | |
| Corning, Inc. | | | 181,735 | | | | 3,790,992 | |
| CUI Global, Inc * | | | 101,990 | | | | 755,746 | |
CM Advisors Fund
Schedule of Investments (Continued)
| COMMON STOCKS — 85.8% (Continued) | | Shares | | | Value | |
| Information Technology — 11.1% (Continued) | | | | | | |
| Electronic Equipment, Instruments & Components — 6.4% (Continued) | | | | | | |
| Dolby Laboratories, Inc. - Class A * | | | 300 | | | $ | 13,974 | |
| Maxwell Technologies, Inc. * | | | 218,365 | | | | 2,242,609 | |
| Vishay Precision Group, Inc. * | | | 132,265 | | | | 2,023,654 | |
| | | | | | | | 8,826,975 | |
Internet Software & Services — 0.0% (a) | | | | | | | | |
| Earthlink Holdings Corporation | | | 9,500 | | | | 39,235 | |
| | | | | | | | | |
| IT Services — 1.2% | | | | | | | | |
| International Business Machines Corporation | | | 8,525 | | | | 1,639,358 | |
| | | | | | | | | |
Semiconductors & Semiconductor Equipment — 0.0% (a) | | | | | | | | |
| Rubicon Technology, Inc. * | | | 7,500 | | | | 46,800 | |
| | | | | | | | | |
| Technology Hardware, Storage & Peripherals — 1.3% | | | | | | | | |
| Apple, Inc. | | | 560 | | | | 57,400 | |
| Avid Technology, Inc. * | | | 73,584 | | | | 621,785 | |
| EMC Corporation | | | 3,150 | | | | 93,019 | |
| Hutchinson Technology, Inc. * | | | 221,295 | | | | 993,615 | |
| | | | | | | | 1,765,819 | |
| Materials — 18.1% | | | | | | | | |
Chemicals — 0.0% (a) | | | | | | | | |
| Olin Corporation | | | 935 | | | | 25,516 | |
| | | | | | | | | |
| Metals & Mining — 18.1% | | | | | | | | |
| Agnico-Eagle Mines Ltd. | | | 45,920 | | | | 1,757,818 | |
| Allied Nevada Gold Corporation * | | | 660 | | | | 2,521 | |
| Anglo American plc - ADR | | | 4,910 | | | | 62,013 | |
| AngloGold Ashanti Ltd. - ADR * | | | 3,125 | | | | 53,687 | |
| Asanko Gold, Inc. * | | | 404,820 | | | | 943,231 | |
| Banro Corporation * | | | 541,380 | | | | 142,870 | |
| Compañia de Minas Buenaventura S.A. - ADR | | | 106,545 | | | | 1,551,295 | |
| Comstock Mining, Inc. * | | | 1,479,030 | | | | 2,233,335 | |
| Eldorado Gold Corporation | | | 180,360 | | | | 1,493,381 | |
| Gold Fields Ltd. - ADR | | | 113,540 | | | | 549,534 | |
| Gold Resource Corporation | | | 14,220 | | | | 88,164 | |
| Hecla Mining Company | | | 224,305 | | | | 733,477 | |
| Kinross Gold Corporation * | | | 279,835 | | | | 1,102,550 | |
| Major Drilling Group International Inc. | | | 100 | | | | 756 | |
| Newmont Mining Corporation | | | 65,570 | | | | 1,776,291 | |
| POSCO - ADR | | | 43,265 | | | | 3,582,342 | |
| Randgold Resources Ltd. - ADR | | | 25,925 | | | | 2,181,589 | |
CM Advisors Fund
Schedule of Investments (Continued)
| COMMON STOCKS — 85.8% (Continued) | | Shares | | | Value | |
| Materials — 18.1% (Continued) | | | | | | |
| Metals & Mining — 18.1% (Continued) | | | | | | |
| Rio Alto Mining Ltd. * | | | 356,545 | | | $ | 1,019,719 | |
| Seabridge Gold, Inc. * | | | 92,905 | | | | 1,076,769 | |
| Synalloy Corporation | | | 33,815 | | | | 603,598 | |
| Timmins Gold Corporation * | | | 737,840 | | | | 1,269,085 | |
| Yamana Gold, Inc. | | | 306,500 | | | | 2,605,250 | |
| | | | | | | | 24,829,275 | |
| Telecommunication Services — 0.8% | | | | | | | | |
| Diversified Telecommunication Services — 0.8% | | | | | | | | |
| AT&T, Inc. | | | 710 | | | | 24,822 | |
| Cogent Communications Holdings, Inc. | | | 29,305 | | | | 1,015,711 | |
| | | | | | | | 1,040,533 | |
| Utilities — 0.1% | | | | | | | | |
| Electric Utilities — 0.1% | | | | | | | | |
| Exelon Corporation | | | 5,220 | | | | 174,453 | |
| | | | | | | | | |
Total Common Stocks (Cost $96,590,084) | | | | | | $ | 117,767,248 | |
| PREFERRED STOCKS — 0.4% | | Shares | | | Value | |
SpendSmart Payments Company (The) - Series C * (Cost $406,575) (b) | | | 135,525 | | | $ | 615,283 | |
| CLOSED-END FUNDS — 0.5% | | Shares | | | Value | |
| ASA Gold and Precious Metals Ltd. (Cost $621,395) | | | 51,310 | | | $ | 739,890 | |
| EXCHANGE-TRADED FUNDS — 1.3% | | Shares | | | Value | |
Market Vectors® Junior Gold Miners ETF * (Cost $1,289,329) | | | 41,850 | | | $ | 1,761,885 | |
| U.S. GOVERNMENT OBLIGATIONS — 5.1% | | Par Value | | | Value | |
U.S. Treasury Bills (c) — 5.1% | | | | | | |
| 0.05%, due 01/22/15 (Cost $6,998,540) | | $ | 7,000,000 | | | $ | 6,999,244 | |
CM Advisors Fund
Schedule of Investments (Continued)
| WARRANTS — 0.2% | | Shares | | | Value | |
| Wells Fargo & Company * (Cost $130,130) | | | 16,900 | | | $ | 333,437 | |
| PUT OPTION CONTRACTS — 0.8% | | Contracts | | | Value | |
| iShares Russell 2000 ETF, 01/17/15 at $100 | | | 1,106 | | | $ | 141,015 | |
| iShares Russell 2000 ETF, 06/30/15 at $90 | | | 1,908 | | | | 362,520 | |
| SPDR S&P 500 ETF, 01/20/15 at $170 | | | 1,402 | | | | 154,921 | |
| SPDR S&P 500 ETF, 06/19/15 at $160 | | | 1,540 | | | | 374,220 | |
Total Put Option Contracts (Cost $1,503,373) | | | | | | $ | 1,032,676 | |
| MONEY MARKET FUNDS — 5.9% | | Shares | | | Value | |
Wells Fargo Advantage Treasury Plus Money Market Fund - Institutional Class, 0.01% (d) (Cost $8,030,587) | | | 8,030,587 | | | $ | 8,030,587 | |
| | | | | | | | | |
Total Investments at Value — 100.0% (Cost $115,570,013) | | | | | | $ | 137,280,250 | |
| | | | | | | | | |
Liabilities in Excess of Other Assets — (0.0%) (a) | | | | | | | (37,539 | ) |
| | | | | | | | | |
| Net Assets — 100.0% | | | | | | $ | 137,242,711 | |
| ADR - American Depositary Receipt. |
| |
| * | Non-income producing security. |
| | |
(a) | Percentage rounds to less than 0.1%. |
| | |
(b) | Security value has been determined in good faith by the Board of Trustees. The total value of such securities is $615,283 at August 31, 2014, representing 0.4% of net assets (Note 1). |
| | |
(c) | The rate shown is the annualized yield at time of purchase, not a coupon rate. |
| | |
(d) | The rate shown is the 7-day effective yield as of August 31, 2014. |
| | |
| See accompanying notes to financial statements. |
CM Advisors Small Cap Value Fund
Schedule of Investments
August 31, 2014 (Unaudited)
| COMMON STOCKS — 86.6% | | Shares | | | Value | |
| Consumer Discretionary — 2.8% | | | | | | |
| Household Durables — 1.7% | | | | | | |
| UCP, Inc. - Class A * | | | 17,755 | | | $ | 226,376 | |
| | | | | | | | | |
| Media — 1.1% | | | | | | | | |
| Reading International, Inc. - Class A * | | | 16,695 | | | | 144,245 | |
| | | | | | | | | |
| Consumer Staples — 1.5% | | | | | | | | |
| Food Products — 1.5% | | | | | | | | |
| Post Holdings, Inc. * | | | 5,435 | | | | 200,932 | |
| | | | | | | | | |
| Energy — 16.5% | | | | | | | | |
| Energy Equipment & Services — 13.4% | | | | | | | | |
| Atwood Oceanics, Inc. * | | | 4,150 | | | | 205,051 | |
| Dawson Geophysical Company | | | 6,325 | | | | 143,072 | |
| Era Group, Inc. * | | | 10,705 | | | | 274,155 | |
| Key Energy Services, Inc. * | | | 42,000 | | | | 264,600 | |
| McDermott International, Inc. * | | | 48,085 | | | | 346,212 | |
| Pacific Drilling S.A. * | | | 16,820 | | | | 165,004 | |
| Tidewater, Inc. | | | 4,155 | | | | 211,365 | |
| Unit Corporation * | | | 3,005 | | | | 197,759 | |
| | | | | | | | 1,807,218 | |
| Oil, Gas & Consumable Fuels — 3.1% | | | | | | | | |
| Hallador Energy Company | | | 31,310 | | | | 421,120 | |
| | | | | | | | | |
| Financials — 8.6% | | | | | | | | |
| Banks — 1.8% | | | | | | | | |
| Old National Bancorp | | | 12,315 | | | | 161,203 | |
| Trustmark Corporation | | | 3,680 | | | | 87,345 | |
| | | | | | | | 248,548 | |
| Diversified Financial Services — 1.7% | | | | | | | | |
| PICO Holdings, Inc. * | | | 10,615 | | | | 234,591 | |
| | | | | | | | | |
| Insurance — 3.5% | | | | | | | | |
| Enstar Group Ltd. * | | | 2,360 | | | | 334,884 | |
| White Mountains Insurance Group Ltd. | | | 220 | | | | 139,533 | |
| | | | | | | | 474,417 | |
| Real Estate Management & Development — 1.6% | | | | | | | | |
| InterGroup Corporation (The) * | | | 10,783 | | | | 208,220 | |
| | | | | | | | | |
| Health Care — 1.8% | | | | | | | | |
| Health Care Providers & Services — 0.5% | | | | | | | | |
| InfuSystem Holdings, Inc. * | | | 26,335 | | | | 73,738 | |
CM Advisors Small Cap Value Fund
Schedule of Investments (Continued)
| COMMON STOCKS — 86.6% (Continued) | | Shares | | | Value | |
| Health Care — 1.8% (Continued) | | | | | | |
| Life Sciences Tools & Services — 1.3% | | | | | | |
| Harvard Bioscience, Inc. * | | | 38,150 | | | $ | 172,438 | |
| | | | | | | | | |
| Industrials — 32.0% | | | | | | | | |
| Aerospace & Defense — 1.9% | | | | | | | | |
| Innovative Solutions & Support, Inc. * | | | 46,955 | | | | 258,722 | |
| | | | | | | | | |
| Building Products — 2.4% | | | | | | | | |
| Insteel Industries, Inc. | | | 13,784 | | | | 323,648 | |
| | | | | | | | | |
| Commercial Services & Supplies — 1.1% | | | | | | | | |
| InnerWorkings, Inc. * | | | 16,810 | | | | 145,743 | |
| | | | | | | | | |
| Construction & Engineering — 8.0% | | | | | | | | |
| Granite Construction, Inc. | | | 4,170 | | | | 147,076 | |
| Great Lakes Dredge & Dock Corporation * | | | 34,075 | | | | 259,652 | |
| Layne Christensen Company * | | | 27,710 | | | | 315,340 | |
| Orion Marine Group, Inc. * | | | 35,748 | | | | 361,412 | |
| | | | | | | | 1,083,480 | |
| Electrical Equipment — 3.1% | | | | | | | | |
| Encore Wire Corporation | | | 3,294 | | | | 139,830 | |
| Powell Industries, Inc. | | | 5,400 | | | | 284,526 | |
| | | | | | | | 424,356 | |
| Machinery — 5.7% | | | | | | | | |
| Astec Industries, Inc. | | | 8,465 | | | | 351,636 | |
| Dynamic Materials Corporation | | | 16,470 | | | | 328,741 | |
| Omega Flex, Inc. | | | 5,400 | | | | 95,094 | |
| | | | | | | | 775,471 | |
| Marine — 1.7% | | | | | | | | |
| Matson, Inc. | | | 8,215 | | | | 221,723 | |
| | | | | | | | | |
| Professional Services — 2.4% | | | | | | | | |
| CDI Corporation | | | 3,576 | | | | 54,248 | |
| CTPartners Executive Search, Inc. * | | | 15,105 | | | | 271,135 | |
| | | | | | | | 325,383 | |
| Trading Companies & Distributors — 5.7% | | | | | | | | |
| Essex Rental Corporation * | | | 33,362 | | | | 85,407 | |
| Houston Wire & Cable Company | | | 23,160 | | | | 301,543 | |
| Lawson Products, Inc. * | | | 7,995 | | | | 142,311 | |
| Signature Group Holdings, Inc. * | | | 14,685 | | | | 121,004 | |
| Transcat, Inc. * | | | 13,544 | | | | 119,052 | |
| | | | | | | | 769,317 | |
CM Advisors Small Cap Value Fund
Schedule of Investments (Continued)
| COMMON STOCKS — 86.6% (Continued) | | Shares | | | Value | |
| Information Technology — 6.3% | | | | | | |
| Electronic Equipment, Instruments & Components — 3.9% | | | | | | |
| CUI Global, Inc * | | | 9,705 | | | $ | 71,914 | |
| Maxwell Technologies, Inc. * | | | 27,403 | | | | 281,429 | |
| Vishay Precision Group, Inc. * | | | 11,680 | | | | 178,704 | |
| | | | | | | | 532,047 | |
| Semiconductors & Semiconductor Equipment — 0.4% | | | | | | | | |
| Rubicon Technology, Inc. * | | | 7,850 | | | | 48,984 | |
| | | | | | | | | |
| Technology Hardware, Storage & Peripherals — 2.0% | | | | | | | | |
| Avid Technology, Inc. * | | | 30,800 | | | | 260,260 | |
| Hutchinson Technology, Inc. * | | | 2,069 | | | | 9,290 | |
| | | | | | | | 269,550 | |
| Materials — 16.4% | | | | | | | | |
| Chemicals — 0.7% | | | | | | | | |
| Olin Corporation | | | 3,200 | | | | 87,328 | |
| | | | | | | | | |
| Metals & Mining — 15.7% | | | | | | | | |
| Allied Nevada Gold Corporation * | | | 1,135 | | | | 4,336 | |
| AngloGold Ashanti Ltd. - ADR * | | | 5,375 | | | | 92,342 | |
| Asanko Gold, Inc. * | | | 74,740 | | | | 174,144 | |
| Banro Corporation * | | | 53,920 | | | | 14,229 | |
| Compañia de Minas Buenaventura S.A. - ADR | | | 10,310 | | | | 150,114 | |
| Comstock Mining, Inc. * | | | 169,935 | | | | 256,602 | |
| Gold Fields Ltd. - ADR | | | 19,905 | | | | 96,340 | |
| Gold Resource Corporation | | | 24,940 | | | | 154,628 | |
| Hecla Mining Company | | | 59,005 | | | | 192,946 | |
| Kinross Gold Corporation * | | | 24,000 | | | | 94,560 | |
| Randgold Resources Ltd. - ADR | | | 1,015 | | | | 85,412 | |
| Rio Alto Mining Ltd. * | | | 56,025 | | | | 160,232 | |
| Seabridge Gold, Inc. * | | | 8,300 | | | | 96,197 | |
| Synalloy Corporation | | | 21,039 | | | | 375,546 | |
| Timmins Gold Corporation * | | | 104,090 | | | | 179,035 | |
| | | | | | | | 2,126,663 | |
| Telecommunication Services — 0.7% | | | | | | | | |
| Diversified Telecommunication Services — 0.7% | | | | | | | | |
| Cogent Communications Holdings, Inc. | | | 2,850 | | | | 98,781 | |
| | | | | | | | | |
Total Common Stocks (Cost $9,917,991) | | | | | | $ | 11,703,039 | |
CM Advisors Small Cap Value Fund
Schedule of Investments (Continued)
| PREFERRED STOCKS — 0.5% | | Shares | | | Value | |
SpendSmart Payments Company (The) - Series C * (Cost $43,425) (a) | | | 14,475 | | | $ | 65,716 | |
| EXCHANGE-TRADED FUNDS — 1.2% | | Shares | | | Value | |
Market Vectors® Junior Gold Miners ETF * (Cost $125,089) | | | 4,060 | | | $ | 170,926 | |
| PUT OPTION CONTRACTS — 0.7% | | Contracts | | | Value | |
| iShares Russell 2000 ETF, 01/17/15 at $100 | | | 209 | | | $ | 26,648 | |
| iShares Russell 2000 ETF, 06/30/15 at $90 | | | 376 | | | | 71,440 | |
Total Put Option Contracts (Cost $137,758) | | | | | | $ | 98,088 | |
| MONEY MARKET FUNDS — 10.6% | | Shares | | | Value | |
Wells Fargo Advantage Treasury Plus Money Market Fund - Institutional Class, 0.01% (b) (Cost $1,429,149) | | | 1,429,149 | | | $ | 1,429,149 | |
| | | | | | | | | |
Total Investments at Value — 99.6% (Cost $11,653,412) | | | | | | $ | 13,466,918 | |
| | | | | | | | | |
| Other Assets in Excess of Liabilities — 0.4% | | | | | | | 49,812 | |
| | | | | | | | | |
| Net Assets — 100.0% | | | | | | $ | 13,516,730 | |
| ADR - American Depositary Receipt. |
| |
| * | Non-income producing security. |
| | |
(a) | Security value has been determined in good faith by the Board of Trustees. The total value of such securities is $65,716 at August 31, 2014, representing 0.5% of net assets (Note 1). |
| | |
(b) | The rate shown is the 7-day effective yield as of August 31, 2014. |
| | |
| See accompanying notes to financial statements. |
CM Advisors Fixed Income Fund
Schedule of Investments
August 31, 2014 (Unaudited)
| CORPORATE BONDS — 33.0% | | Par Value | | | Value | |
| Consumer Discretionary — 5.8% | | | | | | |
| Auto Components — 0.8% | | | | | | |
| Johnson Controls, Inc., 5.50%, due 01/15/16 | | $ | 1,002,000 | | | $ | 1,066,082 | |
| | | | | | | | | |
| Hotels, Restaurants & Leisure — 0.6% | | | | | | | | |
| Marriott International, Inc., 6.375%, due 06/15/17 | | | 400,000 | | | | 452,212 | |
| Starbucks Corporation, 6.25%, due 08/15/17 | | | 300,000 | | | | 341,979 | |
| | | | | | | | 794,191 | |
| Household Durables — 0.7% | | | | | | | | |
| MDC Holdings, Inc., 5.625%, due 02/01/20 | | | 500,000 | | | | 532,500 | |
| Newell Rubbermaid, Inc., 6.25%, due 04/15/18 | | | 185,000 | | | | 211,144 | |
Toll Brothers Finance Corporation,
5.15%, due 05/15/15 | | | 150,000 | | | | 153,937 | |
| | | | | | | | 897,581 | |
| Media — 2.7% | | | | | | | | |
| Comcast Corporation, | | | | | | | | |
| 5.90%, due 03/15/16 | | | 914,000 | | | | 985,845 | |
| 6.30%, due 11/15/17 | | | 200,000 | | | | 230,676 | |
| 5.70%, due 05/15/18 | | | 400,000 | | | | 457,348 | |
| DIRECTV Holdings LLC, 3.55%, due 03/15/15 | | | 1,042,000 | | | | 1,058,901 | |
| McGraw-Hill Companies, Inc. (The), 5.90%, due 11/15/17 | | | 200,000 | | | | 220,774 | |
| Tele-Communications, Inc., 10.125%, due 04/15/22 | | | 300,000 | | | | 420,897 | |
| | | | | | | | 3,374,441 | |
| Multiline Retail — 0.5% | | | | | | | | |
| Kohl's Corporation, 6.25%, due 12/15/17 | | | 500,000 | | | | 570,403 | |
| | | | | | | | | |
| Specialty Retail — 0.5% | | | | | | | | |
| Home Depot, Inc. (The), 5.40%, due 03/01/16 | | | 600,000 | | | | 642,973 | |
| | | | | | | | | |
| Consumer Staples — 2.0% | | | | | | | | |
| Beverages — 1.0% | | | | | | | | |
| Coca-Cola Company (The), 5.35%, due 11/15/17 | | | 770,000 | | | | 867,885 | |
| PepsiCo, Inc., 5.00%, due 06/01/18 | | | 300,000 | | | | 336,392 | |
| | | | | | | | 1,204,277 | |
| Household Products — 0.3% | | | | | | | | |
| Clorox Company (The), 3.55%, due 11/01/15 | | | 335,000 | | | | 345,751 | |
| | | | | | | | | |
| Personal Products — 0.7% | | | | | | | | |
| Avon Products, Inc., 6.50%, due 03/01/19 | | | 840,000 | | | | 919,298 | |
| | | | | | | | | |
| Energy — 3.7% | | | | | | | | |
| Energy Equipment & Services — 2.3% | | | | | | | | |
| Rowan Companies, Inc., 7.875%, due 08/01/19 | | | 910,000 | | | | 1,119,061 | |
| Transocean, Inc., 7.375%, due 04/15/18 | | | 855,000 | | | | 989,692 | |
CM Advisors Fixed Income Fund
Schedule of Investments (Continued)
| CORPORATE BONDS — 33.0% (Continued) | | Par Value | | | Value | |
| Energy — 3.7% (Continued) | | | | | | |
| Energy Equipment & Services — 2.3% (Continued) | | | | | | |
| Weatherford International Ltd., | | | | | | |
| 6.35%, due 06/15/17 | | $ | 370,000 | | | $ | 417,194 | |
| 6.00%, due 03/15/18 | | | 300,000 | | | | 340,122 | |
| | | | | | | | 2,866,069 | |
| Oil, Gas & Consumable Fuels — 1.4% | | | | | | | | |
| Peabody Energy Corporation, 7.375%, due 11/01/16 | | | 882,000 | | | | 953,663 | |
| Valero Energy Corporation, | | | | | | | | |
| 4.50%, due 02/01/15 | | | 195,000 | | | | 198,261 | |
| 6.125%, due 06/15/17 | | | 570,000 | | | | 642,869 | |
| | | | | | | | 1,794,793 | |
| Financials — 1.4% | | | | | | | | |
| Commercial Banks — 0.5% | | | | | | | | |
| Wells Fargo & Company, 5.625%, due 12/11/17 | | | 500,000 | | | | 565,403 | |
| | | | | | | | | |
| Consumer Finance — 0.9% | | | | | | | | |
| American Express Company, | | | | | | | | |
| 7.00%, due 03/19/18 | | | 800,000 | | | | 942,010 | |
| 8.125%, due 05/20/19 | | | 200,000 | | | | 252,098 | |
| | | | | | | | 1,194,108 | |
| Health Care — 1.2% | | | | | | | | |
| Health Care Providers & Services — 0.7% | | | | | | | | |
| UnitedHealth Group, Inc., 6.00%, due 02/15/18 | | | 800,000 | | | | 915,179 | |
| | | | | | | | | |
| Pharmaceuticals — 0.5% | | | | | | | | |
| Johnson & Johnson, 5.15%, due 07/15/18 | | | 570,000 | | | | 647,965 | |
| | | | | | | | | |
| Industrials — 9.3% | | | | | | | | |
| Aerospace & Defense — 0.2% | | | | | | | | |
United Technologies Corporation,
5.375%, due 12/15/17 | | | 200,000 | | | | 225,889 | |
| | | | | | | | | |
| Building Products — 0.6% | | | | | | | | |
| Masco Corporation, | | | | | | | | |
| 6.125%, due 10/03/16 | | | 300,000 | | | | 324,750 | |
| 5.85%, due 03/15/17 | | | 400,000 | | | | 432,000 | |
| | | | | | | | 756,750 | |
| Commercial Services & Supplies — 0.8% | | | | | | | | |
| Pitney Bowes, Inc., 5.75%, due 09/15/17 | | | 31,000 | | | | 34,298 | |
| Waste Management, Inc., 6.375%, due 03/11/15 | | | 978,000 | | | | 1,007,904 | |
| | | | | | | | 1,042,202 | |
| Communications Equipment — 0.8% | | | | | | | | |
| Juniper Networks, Inc., 3.10%, due 03/15/16 | | | 1,007,000 | | | | 1,032,002 | |
CM Advisors Fixed Income Fund
Schedule of Investments (Continued)
| CORPORATE BONDS — 33.0% (Continued) | | Par Value | | | Value | |
| Industrials — 9.3% (Continued) | | | | | | |
| Constrcuction & Engineering — 1.4% | | | | | | |
Great Lakes Dredge & Dock Company,
7.375%, due 02/01/19 | | $ | 1,705,000 | | | $ | 1,768,937 | |
| | | | | | | | | |
| Electrical Equipment — 0.7% | | | | | | | | |
| Eaton Corporation, 8.10%, due 08/15/22 | | | 150,000 | | | | 196,596 | |
| Emerson Electric Company, 5.25%, due 10/15/18 | | | 570,000 | | | | 647,308 | |
| | | | | | | | 843,904 | |
| Health Care Providers & Services — 0.9% | | | | | | | | |
Laboratory Corporation of America Holdings,
3.125%, due 05/15/16 | | | 1,038,000 | | | | 1,077,569 | |
| | | | | | | | | |
| Machinery — 0.8% | | | | | | | | |
| Dover Corporation, 5.45%, due 03/15/18 | | | 115,000 | | | | 129,619 | |
| Harsco Corporation, 2.70%, due 10/15/15 | | | 885,000 | | | | 890,531 | |
| | | | | | | | 1,020,150 | |
| Road & Rail — 2.6% | | | | | | | | |
Canadian Pacific Railroad Company,
7.25%, due 05/15/19 | | | 790,000 | | | | 964,185 | |
| CSX Corporation, 6.25%, due 03/15/18 | | | 500,000 | | | | 577,573 | |
| Norfolk Southern Corporation, 5.75%, due 01/15/16 | | | 947,000 | | | | 1,010,420 | |
| Ryder System, Inc., 3.15%, due 03/02/15 | | | 454,000 | | | | 460,172 | |
| Union Pacific Corporation, 5.70%, due 08/15/18 | | | 200,000 | | | | 230,388 | |
| | | | | | | | 3,242,738 | |
| Semiconductors & Semiconductor Equipment — 0.5% | | | | | | | | |
| Applied Materials, Inc., 2.65%, due 06/15/16 | | | 633,000 | | | | 652,050 | |
| | | | | | | | | |
| Information Technology — 2.7% | | | | | | | | |
| Electronic Equipment, Instruments & Components — 1.0% | | | | | | | | |
| Avnet, Inc., 6.625%, due 09/15/16 | | | 500,000 | | | | 553,383 | |
| Corning, Inc., 7.25%, due 08/15/36 | | | 500,000 | | | | 645,675 | |
| | | | | | | | 1,199,058 | |
| IT Services — 0.9% | | | | | | | | |
International Business Machines Corporation,
7.625%, due 10/15/18 | | | 420,000 | | | | 515,394 | |
| Western Union Company (The), 5.93%, due 10/01/16 | | | 600,000 | | | | 656,020 | |
| | | | | | | | 1,171,414 | |
| Software — 0.8% | | | | | | | | |
| Intuit, Inc., 5.75%, due 03/15/17 | | | 946,000 | | | | 1,049,487 | |
CM Advisors Fixed Income Fund
Schedule of Investments (Continued)
| CORPORATE BONDS — 33.0% (Continued) | | Par Value | | | Value | |
| Materials — 6.4% | | | | | | |
| Chemicals — 1.0% | | | | | | |
| Cytec Industries, Inc., 8.95%, due 07/01/17 | | $ | 650,000 | | | $ | 776,848 | |
E.I. du Pont de Nemours and Company,
6.00%, due 07/15/18 | | | 475,000 | | | | 551,384 | |
| | | | | | | | 1,328,232 | |
| Construction Materials — 0.5% | | | | | | | | |
| Vulcan Materials Company, 7.50%, due 06/15/21 | | | 500,000 | | | | 593,750 | |
| | | | | | | | | |
| Metals & Mining — 4.9% | | | | | | | | |
| Alcoa, Inc., | | | | | | | | |
| 5.72%, due 02/23/19 | | | 800,000 | | | | 887,945 | |
| 5.87%, due 02/23/22 | | | 1,200,000 | | | | 1,333,430 | |
| Allegheny Technologies, Inc., 9.375%, due 06/01/19 | | | 355,000 | | | | 436,234 | |
| ArcelorMittal, 5.00%, due 02/25/17 | | | 960,000 | | | | 1,004,400 | |
| Commercial Metals Company, | | | | | | | | |
| 6.50%, due 07/15/17 | | | 420,000 | | | | 457,800 | |
| 7.35%, due 08/15/18 | | | 230,000 | | | | 259,900 | |
| Nucor Corporation, 5.85%, due 06/01/18 | | | 300,000 | | | | 342,300 | |
Reliance Steel & Aluminum Company,
6.20%, due 11/15/16 | | | 360,000 | | | | 389,089 | |
| Southern Copper Corporation, 6.375%, due 07/27/15 | | | 972,000 | | | | 1,015,342 | |
| | | | | | | | 6,126,440 | |
| Utilities — 0.5% | | | | | | | | |
| Multi-Utilities — 0.5% | | | | | | | | |
| Consolidated Edison Company of New York, Inc., 5.85%, due 04/01/18 | | | 570,000 | | | | 651,965 | |
| | | | | | | | | |
Total Corporate Bonds (Cost $38,111,854) | | | | | | $ | 41,581,051 | |
CM Advisors Fixed Income Fund
Schedule of Investments (Continued)
| U.S. GOVERNMENT OBLIGATIONS — 59.8% | | Par Value | | | Value | |
U.S. Treasury Bills (a) - 20.6% | | | | | | |
| 0.048%, due 11/06/14 | | $ | 8,000,000 | | | $ | 7,999,712 | |
| 0.025%, due 11/28/14 | | | 10,000,000 | | | | 9,999,400 | |
| 0.05%, due 01/08/15 | | | 8,000,000 | | | | 7,999,432 | |
| | | | | | | | 25,998,544 | |
| U.S. Treasury Notes — 39.2% | | | | | | | | |
| 2.50%, due 04/30/15 | | | 10,000,000 | | | | 10,159,770 | |
| 0.375%, due 01/15/16 | | | 5,000,000 | | | | 5,008,010 | |
| 4.625%, due 02/15/17 | | | 5,000,000 | | | | 5,473,045 | |
| 0.75%, due 12/31/17 | | | 10,000,000 | | | | 9,875,000 | |
| 2.00%, due 07/31/20 | | | 6,000,000 | | | | 6,052,032 | |
| 2.375%, due 12/31/20 | | | 6,250,000 | | | | 6,410,157 | |
| 2.75%, due 11/15/23 | | | 6,250,000 | | | | 6,489,256 | |
| | | | | | | | 49,467,270 | |
| | | | | | | | | |
Total U.S. Government Obligations (Cost $74,894,135) | | | | | | $ | 75,465,814 | |
| MONEY MARKET FUNDS — 6.6% | | Shares | | | Value | |
Wells Fargo Advantage Treasury Plus Money Market Fund - Institutional Class, 0.01% (b) (Cost $8,280,983) | | | 8,280,983 | | | $ | 8,280,983 | |
| | | | | | | | | |
Total Investments at Value — 99.4% (Cost $121,286,972) | | | | | | $ | 125,327,848 | |
| | | | | | | | | |
| Other Assets in Excess of Liabilities — 0.6% | | | | | | | 711,248 | |
| | | | | | | | | |
| Net Assets — 100.0% | | | | | | $ | 126,039,096 | |
(a) | The rate shown is the annualized yield at time of purchase, not a coupon rate. |
| | |
(b) | The rate shown is the 7-day effective yield as of August 31, 2014. |
| | |
| See accompanying notes to financial statements. |
CM Advisors Family of Funds
Statements of Assets and Liabilities
August 31, 2014 (Unaudited)
| | | CM Advisors
Fund | | | CM Advisors Small Cap
Value Fund | |
| ASSETS | | | | | | |
| Investments in securities: | | | | | | |
| At cost | | $ | 115,570,013 | | | $ | 11,653,412 | |
| At value (Note 2) | | $ | 137,280,250 | | | $ | 13,466,918 | |
| Dividends receivable | | | 158,069 | | | | 6,602 | |
| Receivable for capital shares sold | | | 16,153 | | | | 16,038 | |
| Receivable from Advisor (Note 5) | | | — | | | | 10,264 | |
| Other assets | | | 23,494 | | | | 27,206 | |
| TOTAL ASSETS | | | 137,477,966 | | | | 13,527,028 | |
| | | | | | | | | |
| LIABILITIES | | | | | | | | |
| Payable for investment securities purchased | | | 83,670 | | | | — | |
| Payable for capital shares redeemed | | | 5,540 | | | | — | |
| Payable to Advisor (Note 5) | | | 113,120 | | | | — | |
| Accrued distribution fees (Note 5) | | | 45 | | | | 38 | |
| Payable to administrator (Note 5) | | | 18,897 | | | | 7,363 | |
| Other accrued expenses | | | 13,983 | | | | 2,897 | |
| TOTAL LIABILITIES | | | 235,255 | | | | 10,298 | |
| | | | | | | | | |
| NET ASSETS | | $ | 137,242,711 | | | $ | 13,516,730 | |
| | | | | | | | | |
| Net assets consist of: | | | | | | | | |
| Paid-in capital | | $ | 135,716,508 | | | $ | 9,519,770 | |
| Accumulated net investment loss | | | (703,024 | ) | | | (111,631 | ) |
Accumulated net realized gains (losses) from security
transactions and options contracts (Note 6) | | | (19,481,010 | ) | | | 2,295,085 | |
Net unrealized appreciation (depreciation) on investments
and options contracts (Note 6) | | | 21,710,237 | | | | 1,813,506 | |
| Net assets | | $ | 137,242,711 | | | $ | 13,516,730 | |
| See accompanying notes to financial statements. |
CM Advisors Family of Funds
Statements of Assets and Liabilities (Continued)
August 31, 2014 (Unaudited)
| | | CM Advisors
Fund | | | CM Advisors Small Cap
Value Fund | |
| PRICING OF CLASS I SHARES | | | | | | |
| Net assets applicable to Class I shares | | $ | 137,025,890 | | | $ | 13,337,285 | |
Class I shares of beneficial interest outstanding
(unlimited number of shares authorized, $0.001 par value) | | | 9,883,351 | | | | 1,030,196 | |
Net asset value, redemption price and offering price per share (a) | | $ | 13.86 | | | $ | 12.95 | |
| | | | | | | | | |
| PRICING OF CLASS R SHARES | | | | | | | | |
| Net assets applicable to Class R shares | | $ | 216,821 | | | $ | 179,445 | |
Class R shares of beneficial interest outstanding
(unlimited number of shares authorized, $0.001 par value) | | | 15,709 | | | | 13,920 | |
Net asset value, redemption price and offering price per share (a) | | $ | 13.80 | | | $ | 12.89 | |
(a) | Redemption price may differ from the net asset value per share depending upon the length of time the shares are held (Note 2). |
| | |
| See accompanying notes to financial statements. |
CM Advisors Family of Funds
Statements of Assets and Liabilities (Continued)
August 31, 2014 (Unaudited)
| | | CM Advisors Fixed Income
Fund | |
| ASSETS | | | |
| Investments in securities: | | | |
| At cost | | $ | 121,286,972 | |
| At value (Note 2) | | $ | 125,327,848 | |
| Dividends and interest receivable | | | 771,022 | |
| Receivable for capital shares sold | | | 9,089 | |
| Other assets | | | 16,805 | |
| TOTAL ASSETS | | | 126,124,764 | |
| | | | | |
| LIABILITIES | | | | |
| Payable to Advisor (Note 5) | | | 53,495 | |
| Payable to administrator (Note 5) | | | 13,128 | |
| Other accrued expenses | | | 19,045 | |
| TOTAL LIABILITIES | | | 85,668 | |
| | | | | |
| NET ASSETS | | $ | 126,039,096 | |
| | | | | |
| Net assets consist of: | | | | |
| Paid-in capital | | $ | 121,168,195 | |
| Accumulated net investment income | | | 257,713 | |
| Accumulated net realized gains from security transactions | | | 572,312 | |
| Net unrealized appreciation on investments | | | 4,040,876 | |
| Net assets | | $ | 126,039,096 | |
| | | | | |
Shares of beneficial interest outstanding
(unlimited number of shares authorized, $0.001 par value) | | | 10,876,014 | |
| | | | | |
| Net asset value, redemption price and offering price per share | | $ | 11.59 | |
(a) | Redemption price may differ from the net asset value per share depending upon the length of time the shares are held (Note 2). |
| | |
| See accompanying notes to financial statements. |
CM Advisors Family of Funds
Statements of Operations
Six Months Ended August 31, 2014 (Unaudited)
| | | CM Advisors
Fund | | | CM Advisors
Small Cap
Value Fund | |
| INVESTMENT INCOME | | | | | | |
| Dividends | | $ | 660,210 | | | $ | 35,252 | |
| Foreign tax witholding | | | (25,158 | ) | | | (114 | ) |
| Interest | | | 398 | | | | — | |
| TOTAL INVESTMENT INCOME | | | 635,450 | | | | 35,138 | |
| | | | | | | | | |
| EXPENSES | | | | | | | | |
| Investment advisory fees (Note 5) | | | 697,167 | | | | 67,384 | |
| Administration fees (Note 5) | | | 55,779 | | | | 12,000 | |
| Fund accounting fees (Note 5) | | | 39,972 | | | | 18,674 | |
| Professional fees | | | 26,696 | | | | 24,136 | |
| Registration and filing fees | | | 17,645 | | | | 32,144 | |
| Transfer agent fees (Note 5) | | | 18,233 | | | | 18,500 | |
| Trustees' fees and expenses (Note 5) | | | 18,968 | | | | 7,730 | |
| Custody and bank service fees | | | 7,983 | | | | 3,013 | |
| Printing of shareholder reports | | | 6,829 | | | | 3,749 | |
| Postage and supplies | | | 5,237 | | | | 2,016 | |
| Insurance expense | | | 5,862 | | | | 775 | |
| Pricing fees | | | 2,402 | | | | 742 | |
| Compliance support services fees | | | 2,084 | | | | 202 | |
| Distributor service fees (Note 5) | | | 917 | | | | 917 | |
| Distribution fees (Note 5) | | | 254 | | | | 756 | |
| Other expenses | | | 7,154 | | | | 5,866 | |
| TOTAL EXPENSES | | | 913,182 | | | | 198,604 | |
Advisory fees waived and/or expenses
reimbursed by Advisor (Note 5) | | | (13,371 | ) | | | (113,618 | ) |
| NET EXPENSES | | | 899,811 | | | | 84,986 | |
| | | | | | | | | |
| NET INVESTMENT LOSS | | | (264,361 | ) | | | (49,848 | ) |
| | | | | | | | | |
| REALIZED AND UNREALIZED GAINS (LOSSES) ON INVESTMENTS AND OPTION CONTRACTS | | | | | | | | |
| Net realized gains from: | | | | | | | | |
| Security transactions | | | 9,173,348 | | | | 1,345,857 | |
| Option contracts (Note 6) | | | 156,946 | | | | — | |
| Net change in unrealized appreciation/depreciation on: | | | | | | | | |
| Investments | | | (6,473,531 | ) | | | (1,207,119 | ) |
| Option contracts (Note 6) | | | (470,697 | ) | | | (39,670 | ) |
| | | | | | | | | |
| NET REALIZED AND UNREALIZED GAINS ON INVESTMENTS AND OPTION CONTRACTS | | | 2,386,066 | | | | 99,068 | |
| | | | | | | | | |
| NET INCREASE IN NET ASSETS FROM OPERATIONS | | $ | 2,121,705 | | | $ | 49,220 | |
| See accompanying notes to financial statements. |
CM Advisors Family of Funds
Statements of Operations (Continued)
Six Months Ended August 31, 2014 (Unaudited)
| | | CM Advisors
Fixed Income
Fund | |
| INVESTMENT INCOME | | | |
| Dividends | | $ | 6,733 | |
| Interest | | | 1,278,567 | |
| TOTAL INVESTMENT INCOME | | | 1,285,300 | |
| | | | | |
| EXPENSES | | | | |
| Investment advisory fees (Note 5) | | | 319,425 | |
| Administration fees (Note 5) | | | 51,103 | |
| Professional fees | | | 18,519 | |
| Fund accounting fees (Note 5) | | | 18,389 | |
| Trustees' fees and expenses (Note 5) | | | 17,848 | |
| Registration and filing fees | | | 17,533 | |
| Transfer agent fees (Note 5) | | | 9,000 | |
| Pricing fees | | | 6,683 | |
| Custody and bank service fees | | | 5,790 | |
| Insurance expense | | | 5,584 | |
| Postage and supplies | | | 3,380 | |
| Printing of shareholder reports | | | 3,089 | |
| Compliance support services fees | | | 1,912 | |
| Distributor service fees (Note 5) | | | 917 | |
| Other expenses | | | 12,744 | |
| TOTAL EXPENSES | | | 491,916 | |
| | | | | |
| NET INVESTMENT INCOME | | | 793,384 | |
| | | | | |
| REALIZED AND UNREALIZED GAINS (LOSSES) ON INVESTMENTS | | | | |
| Net realized gains from security transactions | | | 276,213 | |
| Net change in unrealized appreciation/depreciation on investments | | | (124,590 | ) |
| | | | | |
| NET REALIZED AND UNREALIZED GAINS ON INVESTMENTS | | | 151,623 | |
| | | | | |
| NET INCREASE IN NET ASSETS FROM OPERATIONS | | $ | 945,007 | |
| See accompanying notes to financial statements. |
CM Advisors Fund
Statements of Changes in Net Assets
| | | Six Months Ended
August 31, 2014
(Unaudited) | | | Year Ended
February 28,
2014 | |
| FROM OPERATIONS | | | | | | |
| Net investment loss | | $ | (264,361 | ) | | $ | (88,564 | ) |
| Net realized gains from: | | | | | | | | |
| Security transactions | | | 9,173,348 | | | | 11,184,104 | |
| Option contracts (Note 6) | | | 156,946 | | | | — | |
| Net change in unrealized appreciation/depreciation on: | | | | | | | | |
| Investments | | | (6,473,531 | ) | | | 7,814,339 | |
| Option contracts (Note 6) | | | (470,697 | ) | | | — | |
| Net increase in net assets from operations | | | 2,121,705 | | | | 18,909,879 | |
| | | | | | | | | |
| DISTRIBUTIONS TO SHAREHOLDERS | | | | | | | | |
| From net investment income, Class I | | | (300,838 | ) | | | — | |
| | | | | | | | | |
| FROM CAPITAL SHARE TRANSACTIONS (NOTE 7) | | | | | | | | |
| CLASS I | | | | | | | | |
| Proceeds from shares sold | | | 3,816,694 | | | | 14,650,853 | |
Net asset value of shares issued in reinvestment of
distributions to shareholders | | | 290,748 | | | | — | |
| Proceeds from redemption fees collected (Note 2) | | | 151 | | | | 638 | |
| Payments for shares redeemed | | | (5,614,740 | ) | | | (22,242,762 | ) |
| Net decrease in net assets from Class I share transactions | | | (1,507,147 | ) | | | (7,591,271 | ) |
| | | | | | | | | |
| CLASS R | | | | | | | | |
| Proceeds from shares sold | | | 29,323 | | | | 41,488 | |
| Proceeds from redemption fees collected (Note 2) | | | — | | | | 158 | |
| Payments for shares redeemed | | | (10,000 | ) | | | (26,831 | ) |
| Net increase in net assets from Class R share transactions | | | 19,323 | | | | 14,815 | |
| | | | | | | | | |
| TOTAL INCREASE IN NET ASSETS | | | 333,043 | | | | 11,333,423 | |
| | | | | | | | | |
| NET ASSETS | | | | | | | | |
| Beginning of period | | | 136,909,668 | | | | 125,576,245 | |
| End of period | | $ | 137,242,711 | | | $ | 136,909,668 | |
| | | | | | | | | |
| ACCUMULATED NET INVESTMENT LOSS | | $ | (703,024 | ) | | $ | (137,825 | ) |
| See accompanying notes to financial statements. |
CM Advisors Small Cap Value Fund
Statements of Changes in Net Assets
| | | Six Months Ended
August 31, 2014
(Unaudited) | | | Year Ended
February 28,
2014 | |
| FROM OPERATIONS | | | | | | |
| Net investment loss | | $ | (49,848 | ) | | $ | (50,077 | ) |
| Net realized gains from security transactions | | | 1,345,857 | | | | 1,350,644 | |
| Net change in unrealized appreciation/depreciation on: | | | | | | | | |
| Investments | | | (1,207,119 | ) | | | 970,844 | |
| Option contracts (Note 6) | | | (39,670 | ) | | | — | |
| Net increase in net assets from operations | | | 49,220 | | | | 2,271,411 | |
| | | | | | | | | |
| DISTRIBUTIONS TO SHAREHOLDERS | | | | | | | | |
| From net realized gains, Class I | | | — | | | | (597,655 | ) |
| From net realized gains, Class C | | | — | | | | (6,387 | ) |
| From net realized gains, Class R | | | — | | | | (6,435 | ) |
| Decrease in net assets from distributions to shareholders | | | — | | | | (610,477 | ) |
| | | | | | | | | |
| FROM CAPITAL SHARE TRANSACTIONS (NOTE 7) | | | | | | | | |
| CLASS I | | | | | | | | |
| Proceeds from shares sold | | | 818,960 | | | | 523,136 | |
Net asset value of shares issued in reinvestment of
distributions to shareholders | | | — | | | | 597,655 | |
| Proceeds from redemption fees collected (Note 2) | | | 101 | | | | 63 | |
| Payments for shares redeemed | | | (345,147 | ) | | | (1,031,721 | ) |
| Net increase in net assets from Class I share transactions | | | 473,914 | | | | 89,133 | |
| | | | | | | | | |
| CLASS C | | | | | | | | |
| Proceeds from shares sold | | | 25,082 | | | | — | |
Net asset value of shares issued in reinvestment of
distributions to shareholders | | | — | | | | 6,387 | |
| Payments for shares redeemed | | | (134,396 | ) | | | — | |
Net increase (decrease) in net assets from Class C
share transactions | | | (109,314 | ) | | | 6,387 | |
| | | | | | | | | |
| CLASS R | | | | | | | | |
| Proceeds from shares sold | | | 32,642 | | | | 16,466 | |
Net asset value of shares issued in reinvestment of
distributions to shareholders | | | — | | | | 6,435 | |
| Payments for shares redeemed | | | — | | | | (270,134 | ) |
Net increase (decrease) in net assets from Class R
share transactions | | | 32,642 | | | | (247,233 | ) |
| | | | | | | | | |
| TOTAL INCREASE IN NET ASSETS | | | 446,462 | | | | 1,509,221 | |
| | | | | | | | | |
| NET ASSETS | | | | | | | | |
| Beginning of period | | | 13,070,268 | | | | 11,561,047 | |
| End of period | | $ | 13,516,730 | | | $ | 13,070,268 | |
| | | | | | | | | |
| ACCUMULATED NET INVESTMENT LOSS | | $ | (111,631 | ) | | $ | (61,783 | ) |
| See accompanying notes to financial statements. |
CM Advisors Fixed Income Fund
Statements of Changes in Net Assets
| | | Six Months Ended
August 31, 2014
(Unaudited) | | | Year Ended
February 28,
2014 | |
| FROM OPERATIONS | | | | | | |
| Net investment income | | $ | 793,384 | | | $ | 1,483,840 | |
| Net realized gains from security transactions | | | 276,213 | | | | 326,662 | |
Net change in unrealized appreciation/
depreciation on investments | | | (124,590 | ) | | | (815,142 | ) |
| Net increase in net assets from operations | | | 945,007 | | | | 995,360 | |
| | | | | | | | | |
| DISTRIBUTIONS TO SHAREHOLDERS | | | | | | | | |
| From net investment income | | | (821,859 | ) | | | (1,430,770 | ) |
| From net realized gains | | | — | | | | (41,229 | ) |
| Decrease in net assets from distributions to shareholders | | | (821,859 | ) | | | (1,471,999 | ) |
| | | | | | | | | |
| FROM CAPITAL SHARE TRANSACTIONS | | | | | | | | |
| Proceeds from shares sold | | | 5,556,828 | | | | 32,216,395 | |
Net asset value of shares issued in reinvestment of
distributions to shareholders | | | 713,932 | | | | 1,282,937 | |
| Payments for shares redeemed | | | (8,521,312 | ) | | | (12,848,790 | ) |
Net increase (decrease) in net assets from capital share
transactions | | | (2,250,552 | ) | | | 20,650,542 | |
| | | | | | | | | |
| TOTAL INCREASE (DECREASE) IN NET ASSETS | | | (2,127,404 | ) | | | 20,173,903 | |
| | | | | | | | | |
| NET ASSETS | | | | | | | | |
| Beginning of period | | | 128,166,500 | | | | 107,992,597 | |
| End of period | | $ | 126,039,096 | | | $ | 128,166,500 | |
| | | | | | | | | |
| ACCUMULATED NET INVESTMENT INCOME | | $ | 257,713 | | | $ | 286,188 | |
| | | | | | | | | |
| CAPITAL SHARE ACTIVITY | | | | | | | | |
| Shares sold | | | 480,390 | | | | 2,793,507 | |
| Shares reinvested | | | 61,874 | | | | 111,577 | |
| Shares redeemed | | | (736,393 | ) | | | (1,114,623 | ) |
| Net increase (decrease) in shares outstanding | | | (194,129 | ) | | | 1,790,461 | |
| Shares outstanding, beginning of period | | | 11,070,143 | | | | 9,279,682 | |
| Shares outstanding, end of period | | | 10,876,014 | | | | 11,070,143 | |
| See accompanying notes to financial statements. |
CM Advisors Fund
Class I
Financial Highlights
Per share data for a Class I share outstanding throughout each period:
| | | | | |
Years Ended
| |
| | | Six Months Ended
August 31, 2014
(Unaudited) | | | February 28, 2014 | | | February 28, 2013 | | | February 29, 2012 | | | February 28, 2011 | | | February 28, 2010 | |
Net asset value at
beginning of period | | $ | 13.68 | | | $ | 11.83 | | | $ | 10.65 | | | $ | 10.56 | | | $ | 8.95 | | | $ | 5.71 | |
| | | | | | | | | | | | | | | | | | | | | | | | | |
Income (loss) from
investment operations: | | | | | | | | | | | | | | | | | | | | | | | | |
| Net investment income (loss) | | | (0.03 | ) | | | (0.01 | ) | | | 0.05 | | | | 0.02 | | | | 0.04 | | | | 0.03 | |
Net realized and unrealized
gains on investments | | | 0.24 | | | | 1.86 | | | | 1.18 | | | | 0.10 | | | | 1.61 | | | | 3.24 | |
Total from investment
operations | | | 0.21 | | | | 1.85 | | | | 1.23 | | | | 0.12 | | | | 1.65 | | | | 3.27 | |
| | | | | | | | | | | | | | | | | | | | | | | | | |
| Less distributions: | | | | | | | | | | | | | | | | | | | | | | | | |
Dividends from net
investment income | | | (0.03 | ) | | | — | | | | (0.05 | ) | | | (0.03 | ) | | | (0.04 | ) | | | (0.03 | ) |
Distributions in excess of net
investment income | | | — | | | | — | | | | (0.00 | )(a) | | | — | | | | — | | | | — | |
| Total distributions | | | (0.03 | ) | | | — | | | | (0.05 | ) | | | (0.03 | ) | | | (0.04 | ) | | | (0.03 | ) |
| | | | | | | | | | | | | | | | | | | | | | | | | |
Proceeds from redemption fees
collected (Note 2) | | | 0.00 | (a) | | | 0.00 | (a) | | | 0.00 | (a) | | | 0.00 | (a) | | | 0.00 | (a) | | | 0.00 | (a) |
| | | | | | | | | | | | | | | | | | | | | | | | | |
| Net asset value at end of period | | $ | 13.86 | | | $ | 13.68 | | | $ | 11.83 | | | $ | 10.65 | | | $ | 10.56 | | | $ | 8.95 | |
| | | | | | | | | | | | | | | | | | | | | | | | | |
Total return (b) | | | 1.53% | (c) | | | 15.64% | | | | 11.61% | | | | 1.11% | | | | 18.43% | | | | 57.39% | |
| | | | | | | | | | | | | | | | | | | | | | | | | |
| Ratios and supplemental data: | | | | | | | | | | | | | | | | | | | | | | | | |
Net assets at end of period
(000's) | | $ | 137,026 | | | $ | 136,714 | | | $ | 125,422 | | | $ | 128,461 | | | $ | 142,659 | | | $ | 146,190 | |
| | | | | | | | | | | | | | | | | | | | | | | | | |
Ratio of total expenses to
average net assets | | | 1.29% | (d) | | | 1.29% | | | | 1.31% | | | | 1.53% | | | | 1.52% | | | | 1.50% | |
| | | | | | | | | | | | | | | | | | | | | | | | | |
Ratio of net expenses to
average net assets (e) | | | 1.29% | (d) | | | 1.29% | | | | 1.31% | | | | 1.50% | | | | 1.50% | | | | 1.49% | |
| | | | | | | | | | | | | | | | | | | | | | | | | |
Ratio of net investment income
(loss) to average net assets (e) | | | (0.10% | )(d) | | | (0.07% | ) | | | 0.40% | | | | 0.18% | | | | 0.39% | | | | 0.41% | |
| | | | | | | | | | | | | | | | | | | | | | | | | |
| Portfolio turnover rate | | | 22% | (c) | | | 34 | | | | 32% | | | | 45% | | | | 15% | | | | 19% | |
(a) | Amount rounds to less than $0.01 per share. |
| | |
(b) | Total return is a measure of the change in value of an investment in the Fund over the periods covered, which assumes any dividends or capital gains distributions are reinvested in shares of the Fund. The returns shown do not reflect the deduction of taxes a shareholder would pay on Fund distributions or the redemption of Fund shares. |
| | |
(c) | Not annualized. |
| | |
(d) | Annualized. |
| | |
(e) | Ratio was determined after investment advisory fee waivers and/or expense reimbursements (Note 5). |
| | |
| See accompanying notes to financial statements. |
CM Advisors Fund
Class R
Financial Highlights
Per share data for a Class R share outstanding throughout each period:
| | | Six Months Ended
August 31,
2014
(Unaudited) | | | Year Ended
February 28, 2014 | | | Year Ended
February 28, 2013 | | | Period Ended February 29, 2012(a) | |
| Net asset value at beginning of period | | $ | 13.63 | | | $ | 11.83 | | | $ | 10.64 | | | $ | 10.45 | |
| | | | | | | | | | | | | | | | | |
| Income (loss) from investment operations: | | | | | | | | | | | | | | | | |
| Net investment income (loss) | | | (0.05 | ) | | | (0.07 | ) | | | (0.00 | )(b) | | | 0.01 | |
Net realized and unrealized gains
on investments | | | 0.22 | | | | 1.86 | | | | 1.19 | | | | 0.19 | |
| Total from investment operations | | | 0.17 | | | | 1.79 | | | | 1.19 | | | | 0.20 | |
| | | | | | | | | | | | | | | | | |
| Less distributions: | | | | | | | | | | | | | | | | |
| Distributions from net investment income | | | — | | | | — | | | | (0.02 | ) | | | (0.01 | ) |
Distributions in excess of net
investment income | | | — | | | | — | | | | (0.00 | )(b) | | | — | |
| Total distributions | | | — | | | | — | | | | (0.02 | ) | | | (0.01 | ) |
| | | | | | | | | | | | | | | | | |
Proceeds from redemption
fees collected (Note 2) | | | — | | | | 0.01 | | | | 0.02 | | | | — | |
| | | | | | | | | | | | | | | | | |
| Net asset value at end of period | | $ | 13.80 | | | $ | 13.63 | | | $ | 11.83 | | | $ | 10.64 | |
| | | | | | | | | | | | | | | | | |
Total return (c) | | | 1.25% | (d) | | | 15.22% | | | | 11.38% | | | | 1.88% | (d) |
| | | | | | | | | | | | | | | | | |
| Ratios and supplemental data: | | | | | | | | | | | | | | | | |
| Net assets at end of period (000's) | | $ | 217 | | | $ | 195 | | | $ | 155 | | | $ | 123 | |
| | | | | | | | | | | | | | | | | |
| Ratio of total expenses to average net assets | | | 14.90% | (e) | | | 15.95% | | | | 24.80% | | | | 30.63% | (e) |
| | | | | | | | | | | | | | | | | |
Ratio of net expenses to average net assets (f) | | | 1.75% | (e) | | | 1.75% | | | | 1.75% | | | | 1.75% | (e) |
| | | | | | | | | | | | | | | | | |
Ratio of net investment income (loss)
to average net assets (f) | | | (0.21% | )(e) | | | (0.52% | ) | | | (0.04% | ) | | | 0.07% | (e) |
| | | | | | | | | | | | | | | | | |
| Portfolio turnover rate | | | 22% | (d) | | | 34% | | | | 32% | | | | 45% | (d)(g) |
(a) | Represents the period from commencement of operations (July 8, 2011) through February 29, 2012. |
| | |
(b) | Amount rounds to less than $0.01 per share. |
| | |
(c) | Total return is a measure of the change in value of an investment in the Fund over the periods covered, which assumes any dividends or capital gains distributions are reinvested in shares of the Fund. The returns shown do not reflect the deduction of taxes a shareholder would pay on Fund distributions or the redemption of Fund shares. |
| | |
(d) | Not annualized. |
| | |
(e) | Annualized. |
| | |
(f) | Ratio was determined after investment advisory fee waivers and expense reimbursements (Note 5). |
| | |
(g) | Represents the year ended February 29, 2012. |
| | |
| See accompanying notes to financial statements. |
CM Advisors Small Cap Value Fund
Class I
Financial Highlights
Per share data for a Class I share outstanding throughout each period:
| | | Six Months Ended
August 31,
2014
(Unaudited) | | | Year Ended
February 28, 2014 | | | Year Ended
February 28,
2013 | | | Period Ended February 29, 2012(a) | |
| Net asset value at beginning of period | | $ | 12.90 | | | $ | 11.25 | | | $ | 9.84 | | | $ | 10.00 | |
| | | | | | | | | | | | | | | | | |
| Income (loss) from investment operations: | | | | | | | | | | | | | | | | |
| Net investment income (loss) | | | (0.04 | ) | | | (0.05 | )(b) | | | 0.13 | | | | 0.02 | |
Net realized and unrealized gains (losses)
on investments | | | 0.09 | | | | 2.34 | | | | 1.56 | | | | (0.05 | ) |
| Total from investment operations | | | 0.05 | | | | 2.29 | | | | 1.69 | | | | (0.03 | ) |
| | | | | | | | | | | | | | | | | |
| Less distributions: | | | | | | | | | | | | | | | | |
| Dividends from net investment income | | | — | | | | — | | | | (0.12 | ) | | | (0.01 | ) |
Distributions in excess of net
investment income | | | — | | | | — | | | | (0.02 | ) | | | — | |
| Distributions from net realized gains | | | — | | | | (0.64 | ) | | | (0.14 | ) | | | (0.12 | ) |
| Total distributions | | | — | | | | (0.64 | ) | | | (0.28 | ) | | | (0.13 | ) |
| | | | | | | | | | | | | | | | | |
Proceeds from redemption
fees collected (Note 2) | | | 0.00 | (c) | | | 0.00 | (c) | | | — | | | | 0.00 | (c) |
| | | | | | | | | | | | | | | | | |
| Net asset value at end of period | | $ | 12.95 | | | $ | 12.90 | | | $ | 11.25 | | | $ | 9.84 | |
| | | | | | | | | | | | | | | | | |
Total return (d) | | | 0.39% | (e) | | | 20.53% | | | | 17.42% | | | | (0.17% | )(e) |
| | | | | | | | | | | | | | | | | |
| Ratios and supplemental data: | | | | | | | | | | | | | | | | |
| Net assets at end of period (000's) | | $ | 13,337 | | | $ | 12,790 | | | $ | 11,094 | | | $ | 8,953 | |
| | | | | | | | | | | | | | | | | |
| Ratio of total expenses to average net assets | | | 2.44% | (f) | | | 2.56% | | | | 2.92% | | | | 4.35% | (f) |
| | | | | | | | | | | | | | | | | |
Ratio of net expenses to average net assets (g) | | | 1.25% | (f) | | | 1.25% | | | | 1.25% | | | | 1.25% | (f) |
| | | | | | | | | | | | | | | | | |
Ratio of net investment income (loss) to average net assets (g) | | | (0.20% | )(f) | | | (0.40% | ) | | | 1.32% | | | | 0.09% | (f) |
| | | | | | | | | | | | | | | | | |
| Portfolio turnover rate | | | 27% | (e) | | | 42% | | | | 44% | | | | 44% | (e) |
(a) | Represents the period from commencement of operations (April 15, 2011) through February 29, 2012. |
| | |
(b) | Net investment loss per share is based on average shares outstanding during the year. |
| | |
(c) | Amount rounds to less than $0.01 per share. |
| | |
(d) | Total return is a measure of the change in value of an investment in the Fund over the periods covered, which assumes any dividends or capital gains distributions are reinvested in shares of the Fund. The returns shown do not reflect the deduction of taxes a shareholder would pay on Fund distributions or the redemption of Fund shares. |
| | |
(e) | Not annualized. |
| | |
(f) | Annualized. |
| | |
(g) | Ratio was determined after investment advisory fee waivers and expense reimbursements (Note 5). |
| | |
| See accompanying notes to financial statements. |
CM Advisors Small Cap Value Fund
Class R
Financial Highlights
Per share data for a Class R share outstanding throughout each period:
| | | Six Months Ended
August 31,
2014
(Unaudited) | | | Year Ended
February 28, 2014 | | | Year Ended
February 28,
2013 | | | Period Ended February 29, 2012(a) | |
| Net asset value at beginning of period | | $ | 12.86 | | | $ | 11.24 | | | $ | 9.84 | | | $ | 10.29 | |
| | | | | | | | | | | | | | | | | |
| Income (loss) from investment operations: | | | | | | | | | | | | | | | | |
| Net investment income (loss) | | | (0.02 | ) | | | (0.08 | )(b) | | | 0.11 | | | | (0.01 | ) |
Net realized and unrealized gains (losses)
on investments | | | 0.05 | | | | 2.34 | | | | 1.55 | | | | (0.32 | ) |
| Total from investment operations | | | 0.03 | | | | 2.26 | | | | 1.66 | | | | (0.33 | ) |
| | | | | | | | | | | | | | | | | |
| Less distributions: | | | | | | | | | | | | | | | | |
| Dividends from net investment income | | | — | | | | — | | | | (0.11 | ) | | | — | |
Distributions in excess of net
investment income | | | — | | | | — | | | | (0.01 | ) | | | — | |
| Distributions from net realized gains | | | — | | | | (0.64 | ) | | | (0.14 | ) | | | (0.12 | ) |
| Total distributions | | | — | | | | (0.64 | ) | | | (0.26 | ) | | | (0.12 | ) |
| | | | | | | | | | | | | | | | | |
Proceeds from redemption
fees collected (Note 2) | | | — | | | | — | | | | 0.00 | (c) | | | — | |
| | | | | | | | | | | | | | | | | |
| Net asset value at end of period | | $ | 12.89 | | | $ | 12.86 | | | $ | 11.24 | | | $ | 9.84 | |
| | | | | | | | | | | | | | | | | |
Total return (d) | | | 0.23% | (e) | | | 20.28% | | | | 17.11% | | | | (3.11% | )(e) |
| | | | | | | | | | | | | | | | | |
| Ratios and supplemental data: | | | | | | | | | | | | | | | | |
| Net assets at end of period (000's) | | $ | 179 | | | $ | 147 | | | $ | 355 | | | $ | 134 | |
| | | | | | | | | | | | | | | | | |
| Ratio of total expenses to average net assets | | | 17.21% | (f) | | | 12.76% | | | | 13.17% | | | | 33.38% | (f) |
| | | | | | | | | | | | | | | | | |
Ratio of net expenses to average net assets (g) | | | 1.50% | (f) | | | 1.50% | | | | 1.50% | | | | 1.50% | (f) |
| | | | | | | | | | | | | | | | | |
Ratio of net investment income (loss)
to average net assets (g) | | | (0.24% | )(f) | | | (0.65% | ) | | | 1.16% | | | | (0.23% | )(f) |
| | | | | | | | | | | | | | | | | |
| Portfolio turnover rate | | | 27 | % | | | 42% | | | | 44% | | | | 44% | (e)(h) |
(a) | Represents the period from commencement of operations (July 8, 2011) through February 29, 2012. |
| | |
(b) | Net investment loss per share is based on average shares outstanding during the year. |
| | |
(c) | Amount rounds to less than $0.01 per share. |
| | |
(d) | Total return is a measure of the change in value of an investment in the Fund over the periods covered, which assumes any dividends or capital gains distributions are reinvested in shares of the Fund. The returns shown do not reflect the deduction of taxes a shareholder would pay on Fund distributions or the redemption of Fund shares. |
| | |
(e) | Not annualized. |
| | |
(f) | Annualized. |
| | |
(g) | Ratio was determined after investment advisory fee waivers and expense reimbursements (Note 5). |
| | |
(h) | Represents the period from April 15, 2011 (the commencement of operations of Class I shares) through February 29, 2012. |
| | |
| See accompanying notes to financial statements. |
CM Advisors Fixed Income Fund
Financial Highlights
Per share data for a share outstanding throughout each period:
| | | | | |
Years Ended
| |
| | | Six Months Ended
August 31,
2014
(Unaudited) | | | February 28, 2014 | | | February 28, 2013 | | | February 29, 2012 | | | February 28, 2011 | | | February 28, 2010 | |
Net asset value at
beginning of period | | $ | 11.58 | | | $ | 11.64 | | | $ | 11.74 | | | $ | 11.51 | | | $ | 11.14 | | | $ | 9.99 | |
| | | | | | | | | | | | | | | | | | | | | | | | | |
Income (loss) from
investment operations: | | | | | | | | | | | | | | | | | | | | | | | | |
| Net investment income | | | 0.07 | | | | 0.14 | | | | 0.17 | | | | 0.20 | | | | 0.24 | | | | 0.32 | |
Net realized and unrealized gains
(losses) on investments | | | 0.01 | | | | (0.06 | ) | | | 0.04 | | | | 0.53 | | | | 0.49 | | | | 1.19 | |
| Total from investment operations | | | 0.08 | | | | 0.08 | | | | 0.21 | | | | 0.73 | | | | 0.73 | | | | 1.51 | |
| | | | | | | | | | | | | | | | | | | | | | | | | |
| Less distributions: | | | | | | | | | | | | | | | | | | | | | | | | |
Dividends from net
investment income | | | (0.07 | ) | | | (0.14 | ) | | | (0.17 | ) | | | (0.21 | ) | | | (0.26 | ) | | | (0.32 | ) |
Distributions from net
realized gains | | | — | | | | (0.00 | )(a) | | | (0.14 | ) | | | (0.29 | ) | | | (0.10 | ) | | | (0.04 | ) |
| Total distributions | | | (0.07 | ) | | | (0.14 | ) | | | (0.31 | ) | | | (0.50 | ) | | | (0.36 | ) | | | (0.36 | ) |
| | | | | | | | | | | | | | | | | | | | | | | | | |
Proceeds from redemption fees
collected (Note 2) | | | — | | | | — | | | | 0.00 | (a) | | | 0.00 | (a) | | | 0.00 | (a) | | | 0.00 | (a) |
| | | | | | | | | | | | | | | | | | | | | | | | | |
| Net asset value at end of period | | $ | 11.59 | | | $ | 11.58 | | | $ | 11.64 | | | $ | 11.74 | | | $ | 11.51 | | | $ | 11.14 | |
| | | | | | | | | | | | | | | | | | | | | | | | | |
Total return (b) | | | 0.74% | (c) | | | 0.71% | | | | 1.83% | | | | 6.37% | | | | 6.63% | | | | 15.45% | |
| | | | | | | | | | | | | | | | | | | | | | | | | |
| Ratios and supplemental data: | | | | | | | | | | | | | | | | | | | | | | | | |
Net assets at end of period
(000's) | | $ | 126,039 | | | $ | 128,167 | | | $ | 107,993 | | | $ | 94,317 | | | $ | 79,935 | | | $ | 46,424 | |
| | | | | | | | | | | | | | | | | | | | | | | | | |
Ratio of total expenses
to average net assets | | | 0.77% | (d) | | | 0.78% | | | | 0.79% | | | | 0.81% | | | | 0.90% | | | | 1.06% | |
| | | | | | | | | | | | | | | | | | | | | | | | | |
Ratio of net investment income
to average net assets | | | 1.24% | (d) | | | 1.22% | | | | 1.39% | | | | 1.76% | | | | 2.13% | | | | 3.31% | |
| | | | | | | | | | | | | | | | | | | | | | | | | |
| Portfolio turnover rate | | | 0% | | | | 6% | | | | 23% | | | | 25% | | | | 21% | | | | 0% | |
(a) | Amount rounds to less than $0.01 per share. |
| | |
(b) | Total return is a measure of the change in value of an investment in the Fund over the periods covered, which assumes any dividends or capital gains distributions are reinvested in shares of the Fund. The returns shown do not reflect the deduction of taxes a shareholder would pay on Fund distributions or the redemption of Fund shares. |
| | |
(c) | Not annualized. |
| | |
(d) | Annualized. |
| | |
| See accompanying notes to financial statements. |
CM Advisors Family of Funds
Notes to Financial Statements
August 31, 2014 (Unaudited)
1. Organization
CM Advisors Fund, CM Advisors Small Cap Value Fund, and CM Advisors Fixed Income Fund (collectively the "Funds" and individually a "Fund") are each a separate diversified no-load series of CM Advisors Family of Funds (the "Trust"), which was organized as a Delaware statutory trust and is registered under the Investment Company Act of 1940 as an open-end management investment company.
CM Advisors Fund commenced operations on May 13, 2003. The investment objective of the Fund is long-term growth of capital.
CM Advisors Small Cap Value Fund commenced operations on April 15, 2011. The investment objective of the Fund is long-term growth of capital.
CM Advisors Fixed Income Fund commenced operations on March 24, 2006. The investment objective of the Fund is to preserve capital and maximize total return.
CM Advisors Fund currently offers two classes of shares: Class I shares (sold without any sales loads and distribution and/or service fees) and Class R shares (sold without any sales loads but subject to a distribution and/or service fee of up to 0.25% of the average daily net assets attributable to Class R shares). Each class of shares represents an interest in the same assets of the Fund, has the same rights and is identical in all material respects except that (1) the classes bear differing levels of distribution fees, if any; (2) certain other class specific expenses will be borne solely by the class to which such expenses are attributable; (3) each class has exclusive voting rights with respect to matters relating to its own distribution arrangements; and (4) Class I shares require a higher minimum initial investment.
CM Advisors Small Cap Value Fund currently offers two classes of shares: Class I shares (sold without any sales loads and distribution and/or service fees) and Class R shares (sold without any sales loads but subject to a distribution and/or service fee of up to 0.25% of the average daily net assets attributable to Class R shares). Each class of shares represents an interest in the same assets of the Fund, has the same rights and is identical in all material respects except that (1) the classes bear differing levels of distribution fees, if any; (2) certain other class specific expenses will be borne solely by the class to which such expenses are attributable; (3) each class has exclusive voting rights with respect to matters relating to its own distribution arrangements; and (4) Class I shares require a higher minimum initial investment. Prior to July 31, 2014, the Fund also offered Class C shares. Class C shares were sold without any sales load but subject to a distribution and/or service fee of up to 1.00% of the average daily net assets attributable to the Class C shares. On July 31, 2014, the Class C shares of the CM Advisors Small Cap Value Fund were discontinued and all outstanding shares were redeemed.
CM Advisors Fixed Income Fund currently offers one class of Shares which is sold without any sales loads and distribution fees.
CM Advisors Family of Funds
Notes to Financial Statements (Continued)
2. Significant Accounting Policies
The following is a summary of the Funds' significant accounting policies used in the preparation of their financial statements. These policies are in conformity with accounting principles generally accepted in the United States of America ("GAAP").
Investment Valuation – The Funds' portfolio securities are generally valued at their market values determined on the basis of available market quotations as of the close of regular trading on the New York Stock Exchange (typically 4:00 p.m. Eastern time). Securities listed on an exchange or quoted on a national market system are valued at the last sales price. Securities which are quoted by NASDAQ are valued at the NASDAQ Official Closing Price. Securities traded in the over-the-counter market and listed securities for which no sale was reported on that date are valued at the most recent bid price. It is expected that fixed income securities will ordinarily be traded in the over-the-counter market. Options on securities and options on indexes listed on an exchange are valued at the mean of the closing bid and ask price on the exchange on which they are traded on the day of valuation. Securities and assets for which representative market quotations are not readily available (e.g., if the exchange on which the portfolio security is principally traded closes early or if trading of the particular portfolio security is halted during the day and does not resume prior to the Funds' net asset value calculations) or which cannot be accurately valued using the Funds' normal pricing procedures are valued at fair value as determined in good faith under policies approved by the Board of Trustees and will be classified as Level 2 or 3 within the fair value hierarchy (see below), depending on the inputs used. A portfolio security's "fair value" price may differ from the price next available for that portfolio security using the Funds' normal pricing procedures.
GAAP establishes a single authoritative definition of fair value, sets out a framework for measuring fair value and requires disclosures about fair value measurements.
Various inputs are used in determining the value of the Funds' investments. These inputs are summarized in the three broad levels listed below:
| • | Level 1 – quoted prices in active markets for identical securities |
| • | Level 2 – other significant observable inputs |
| • | Level 3 – significant unobservable inputs |
Corporate Bonds held by CM Advisors Fixed Income Fund and U.S. Government Obligations held by CM Advisors Fund and CM Advisors Fixed Income Fund are classified as Level 2 since values are based on prices provided by an independent pricing service that utilizes various "other significant observable inputs" including bid and ask quotations, prices of similar securities and interest rates, among other factors.
Option contracts purchased by CM Advisors Fund and CM Advisors Small Cap Value Fund are classified as Level 2 since they are valued using "other significant observable inputs" at a price of the mean of the closing bid and ask prices.
The inputs or methodology used for valuing securities are not necessarily an indication of the risks associated with investing in those securities. The inputs used to measure the fair value of a particular security may fall into different levels of the fair value hierarchy.
CM Advisors Family of Funds
Notes to Financial Statements (Continued)
In such cases, for disclosure purposes, the level in the fair value hierarchy within which the fair value measurement of that security falls in its entirety is determined based on the lowest level input that is significant to the fair value measurement.
The following is a summary of the inputs used to value the Funds' investments as of August 31, 2014 by security type:
CM Advisors Fund
| | | Level 1 | | | Level 2 | | | Level 3 | | | Total | |
| Common Stocks | | $ | 117,767,248 | | | $ | — | | | $ | — | | | $ | 117,767,248 | |
| Preferred Stocks | | | — | | | | — | | | | 615,283 | | | | 615,283 | |
| Closed-End Funds | | | 739,890 | | | | — | | | | — | | | | 739,890 | |
| Exchange-Traded Funds | | | 1,761,885 | | | | — | | | | — | | | | 1,761,885 | |
| U.S. Government Obligations | | | — | | | | 6,999,244 | | | | — | | | | 6,999,244 | |
| Warrants | | | 333,437 | | | | — | | | | — | | | | 333,437 | |
| Put Option Contracts | | | — | | | | 1,032,676 | | | | — | | | | 1,032,676 | |
| Money Market Funds | | | 8,030,587 | | | | — | | | | — | | | | 8,030,587 | |
| Total | | $ | 128,633,047 | | | $ | 8,031,920 | | | $ | 615,283 | | | $ | 137,280,250 | |
CM Advisors Small Cap Value Fund
| | | Level 1 | | | Level 2 | | | Level 3 | | | Total | |
| Common Stocks | | $ | 11,703,039 | | | $ | — | | | $ | — | | | $ | 11,703,039 | |
| Preferred Stocks | | | — | | | | — | | | | 65,716 | | | | 65,716 | |
| Exchange-Traded Funds | | | 170,926 | | | | — | | | | — | | | | 170,926 | |
| Put Option Contracts | | | — | | | | 98,088 | | | | — | | | | 98,088 | |
| Money Market Funds | | | 1,429,149 | | | | — | | | | — | | | | 1,429,149 | |
| Total | | $ | 13,303,114 | | | $ | 98,088 | | | $ | 65,716 | | | $ | 13,466,918 | |
CM Advisors Fixed Income Fund
| | | Level 1 | | | Level 2 | | | Level 3 | | | Total | |
| Corporate Bonds | | $ | — | | | $ | 41,581,051 | | | $ | — | | | $ | 41,581,051 | |
| U.S. Government Obligations | | | — | | | | 75,465,814 | | | | — | | | | 75,465,814 | |
| Money Market Funds | | | 8,280,983 | | | | — | | | | — | | | | 8,280,983 | |
| Total | | $ | 8,280,983 | | | $ | 117,046,865 | | | $ | — | | | $ | 125,327,848 | |
Refer to each Fund's Schedule of Investments for a listing of the securities by security type and sector or industry type. As of August 31, 2014, the Funds did not have any transfers in and out of any Level. It is the Funds' policy to recognize transfers into and out of any Level at the end of the reporting period.
CM Advisors Family of Funds
Notes to Financial Statements (Continued)
The following table is a reconciliation of Level 3 investments held in CM Advisors Fund and CM Advisors Small Cap Value Fund for which significant unobservable inputs were used to determine fair value as of August 31, 2014:
| | | CM Advisors
Fund | | | CM Advisors
Small Cap
Value Fund | |
| Balance as of February 28, 2014 | | $ | — | | | $ | — | |
| Purchases | | | 406,575 | | | | 43,425 | |
| Unrealized appreciation | | | 208,708 | | | | 22,291 | |
| Balance as of August 31, 2014 | | $ | 615,283 | | | $ | 65,716 | |
The total amount of unrealized appreciation on Level 3 investments was $208,708 and $22,291 for CM Advisors Fund and CM Advisors Small Cap Value Fund, respectively, at August 31, 2014.
The following table summarizes the valuation techniques used and unobservable inputs developed by the Board to determine the fair value of the Level 3 investments:
| | | Fair Value at 8/31/2014 | Valuation
Technique | Unobservable
Input | Range | Impact to Valuation from an Increase
in Input |
| CM Advisors Fund | Preferred Stocks | $615,283 | Discount from Common Stock/Broker Quotes | Discount Percentage | 0% - 32.3% | Decrease |
| CM Advisors Small Cap Value Fund | Preferred Stocks | $65,716 | Discount from Common Stock/Broker Quotes | Discount Percentage | 0% - 32.3% | Decrease |
Share Valuation and Redemption Fees – The net asset value per share of each class of shares of CM Advisors Fund and CM Advisors Small Cap Value Fund is calculated daily by dividing the total value of the assets attributable to that class, less liabilities attributable to that class, by the number of shares of that class outstanding. The net asset value per share of CM Advisors Fixed Income Fund is calculated on each business day by dividing the total value of the Fund's assets, less liabilities, by the number of shares outstanding. The offering price and redemption price per share of each Class and each Fund is equal to the net asset value per share, except that shares of each Class of CM Advisors Fund and CM Advisors Small Cap Value Fund are subject to a redemption fee of 1% payable to the applicable Fund, if redeemed within 180 days of the date of purchase. No redemption fee, however, will be imposed on the exchange of shares of CM Advisors Fund or CM Advisors Small Cap Value Fund for shares of another Fund within the Trust. Shares of CM Advisors Fixed Income Fund are not subject to a redemption fee.
CM Advisors Family of Funds
Notes to Financial Statements (Continued)
During the periods ended August 31, 2014 and February 28, 2014, proceeds from redemption fees were as follows:
| | | Six Months Ended
August 31, 2014 | | | Year Ended
February 28, 2014 | |
| CM Advisors Fund - Class I | | $ | 151 | | | $ | 638 | |
| CM Advisors Fund - Class R | | $ | — | | | $ | 158 | |
| CM Advisors Small Cap Value – Class I | | $ | 101 | | | $ | 63 | |
There were no redemption fees for Class R shares of CM Advisors Small Cap Value Fund during the periods ended August 31, 2014 and February 28, 2014.
Investment Transactions and Investment Income – Investment transactions are accounted for on trade date. Dividend income is recorded on the ex-dividend date. Interest income is accrued as earned. Discounts and premiums on fixed income securities purchased are amortized using the effective interest method. Gains and losses on securities sold are determined on a specific identification basis, which is the same basis used for federal income tax purposes. Withholding taxes on foreign dividends have been provided for in accordance with the Funds' understanding of the applicable country's tax rules and rates.
Expenses – The Funds bear expenses incurred specifically on their behalf as well as a portion of general Trust expenses, which are allocated according to methods authorized by the Board of Trustees.
Allocation Between Classes – Investment income earned, realized capital gains and losses, and unrealized appreciation and depreciation are allocated daily to each class of shares based upon its proportionate share of total net assets of CM Advisors Fund and CM Advisors Small Cap Value Fund. Class specific expenses are charged directly to the class incurring the expense. Common expenses which are not attributable to a specific class are allocated daily to each class of shares based upon its proportionate share of total net assets of each Fund.
Dividends and Distributions – Dividends arising from net investment income, if any, are declared and paid quarterly to shareholders of each Fund. Distributions from capital gains, if any, are generally declared and distributed annually. The amount of distributions from net investment income and net realized gains are determined in accordance with federal income tax regulations which may differ from GAAP. These "book/tax" differences are either temporary or permanent in nature and are primarily due to differing treatments of net short-term gains. Dividends and distributions are recorded on the ex-dividend date.
CM Advisors Family of Funds
Notes to Financial Statements (Continued)
The tax character of distributions paid during the periods ended August 31, 2014 and February 28, 2014 was as follows:
| Years Ended | | Ordinary
Income | | | Long-Term
Capital Gains | | | Total Distributions | |
| CM Advisors Fund - Class I | | | | | | | | | |
| August 31, 2014 | | $ | 300,838 | | | $ | — | | | $ | 300,838 | |
| February 28, 2014 | | $ | — | | | $ | — | | | $ | — | |
| CM Advisors Small Cap Value Fund - Class I | | | | | | | | | | | | |
| August 31, 2014 | | $ | — | | | $ | — | | | $ | — | |
| February 28, 2014 | | $ | 36,756 | | | $ | 560,899 | | | $ | 597,655 | |
| CM Advisors Small Cap Value Fund - Class C | | | | | | | | | | | | |
| August 31, 2014 | | $ | — | | | $ | — | | | $ | — | |
| February 28, 2014 | | $ | 393 | | | $ | 5,994 | | | $ | 6,387 | |
| CM Advisors Small Cap Value Fund - Class R | | | | | | | | | | | | |
| August 31, 2014 | | $ | — | | | $ | — | | | $ | — | |
| February 28, 2014 | | $ | 396 | | | $ | 6,039 | | | $ | 6,435 | |
| CM Advisors Fixed Income Fund | | | | | | | | | | | | |
| August 31, 2014 | | $ | 821,859 | | | $ | — | | | $ | 821,859 | |
| February 28, 2014 | | $ | 1,431,167 | | | $ | 40,832 | | | $ | 1,471,999 | |
During the periods ended August 31, 2014 and February 28, 2014, no distributions were paid by Class R shares of CM Advisors Fund.
Option Transactions – The CM Advisors Fund and the CM Advisors Small Cap Value Fund may purchase and write (sell) put and call options on securities. By purchasing a put option on an individual stock, the Funds could hedge the risk of a general market decline. The value of the put option would be expected to rise as a result of a market decline and thus could offset all or a portion of losses resulting from declines in the prices of individual securities held by the Fund. However, option premiums tend to decrease over time as the expiration date nears. Therefore, because of the cost of the option (in the form of premium and transactions costs), the Fund would suffer a loss in the put option if prices do not decline sufficiently to offset the deterioration in the value of the option premium. By purchasing a call option on a stock index, the Funds would attempt to participate in potential price increases of the underlying index, with results similar to those obtainable from purchasing a futures contract, but with risk limited to the cost of the option if stock prices fell. At the same time, the Funds would suffer a loss if stock prices do not rise sufficiently to offset the cost of the option.
Estimates – The preparation of financial statements in conformity with GAAP requires management to make estimates and assumptions that affect the reported amounts of assets and liabilities and disclosure of contingent assets and liabilities as of the date of the financial statements and the reported amounts of income and expenses during the reporting period. Actual results could differ from those estimates.
CM Advisors Family of Funds
Notes to Financial Statements (Continued)
3. Federal Income Tax
It is each Fund's intention to continue to qualify each year as a "regulated investment company" under Subchapter M of the Internal Revenue Code of 1986 (the "Code"). Qualification generally will relieve the Funds of liability for federal income taxes to the extent 100% of their net investment income and net realized gains are distributed in accordance with the Code. Accordingly, no provision for income taxes has been made.
In order to avoid imposition of the excise tax applicable to regulated investment companies, it is also each Fund's intention to declare as dividends in each calendar year at least 98% of its net investment income (earned during the calendar year) and 98.2% of its net realized capital gains (earned during the twelve months ended October 31) plus undistributed amounts from prior years.
The following information is computed on a tax basis for each item as of August 31, 2014:
| | | CM Advisors Fund | | | CM Advisors
Small Cap
Value Fund | | | CM Advisors
Fixed Income Fund | |
| Tax cost of portfolio investments | | $ | 116,406,340 | | | $ | 11,736,103 | | | $ | 121,286,972 | |
| Gross unrealized appreciation | | $ | 26,579,207 | | | $ | 2,218,339 | | | $ | 4,164,033 | |
| Gross unrealized depreciation | | | (5,705,297 | ) | | | (487,524 | ) | | | (123,157 | ) |
| Net unrealized appreciation | | | 20,873,910 | | | | 1,730,815 | | | | 4,040,876 | |
| Accumulated ordinary income (loss) | | | 73,719 | | | | (28,939 | ) | | | 257,713 | |
| Capital loss carryforwards | | | (28,751,720 | ) | | | — | | | | — | |
| Undistributed long-term gains | | | — | | | | 1,003,085 | | | | 296,099 | |
| Other gains | | | 9,330,294 | | | | 1,291,999 | | | | 276,213 | |
| Accumulated earnings | | $ | 1,526,203 | | | $ | 3,996,960 | | | $ | 4,870,901 | |
The difference between the federal income tax cost of portfolio investments and the financial statement cost for CM Advisors Fund and CM Advisors Small Cap Value Fund is due to certain timing differences in the recognition of capital gains or losses under income tax regulations and GAAP. These "book/tax" differences are temporary in nature and are due to the tax deferral of losses on wash sales and holdings classified as passive foreign investment companies (PFICs).
Under the Regulated Investment Company Modernization Act of 2010 (the "Act"), net capital losses recognized after February 28, 2011 may be carried forward indefinitely and their character is retained as short-term and/or long-term losses. Under the law in effect prior to the Act, pre-enactment net capital losses were carried forward for eight years and treated as short-term losses. As a transition rule, the Act requires that post-enactment net capital losses be used before pre-enactment net capital losses. Therefore, pre-enactment capital loss carryforwards are more likely to expire unused.
As of February 28, 2014, CM Advisors Fund had $28,751,720 of pre-enactment short-term capital loss carryforwards which expire February 28, 2018.
CM Advisors Family of Funds
Notes to Financial Statements (Continued)
The Funds recognize the benefits or expenses of uncertain tax positions only if the position is "more-likely-than-not" of being sustained assuming examination by tax authorities. Management has reviewed the tax positions taken on federal income tax returns for the current and all open tax years (tax years ended February 28, 2011 through February 28, 2014) and has concluded that no provision for unrecognized tax benefits or expenses is required in these financial statements.
4. Investment Transactions
During the six months ended August 31, 2014, cost of purchases and proceeds from sales of investment securities, other than short-term investments, options and U.S. government securities, were as follows:
| | | CM Advisors
Fund | | | CM Advisors
Small Cap
Value Fund | | | CM Advisors
Fixed Income
Fund | |
| Cost of purchases of investment securities | | $ | 27,488,710 | | | $ | 3,868,483 | | | $ | — | |
| Proceeds from sales of investment securities | | $ | 35,305,613 | | | $ | 3,150,632 | | | $ | 3,866,865 | |
5. Transactions with Related Parties
INVESTMENT ADVISORY AGREEMENT
The Funds pay a monthly advisory fee to Van Den Berg Management I, Inc. (the "Advisor") based upon the average daily net assets of each Fund and calculated at the annual rate of 1.00% for CM Advisors Fund and CM Advisors Small Cap Value Fund, and 0.50% for CM Advisors Fixed Income Fund. The Advisor has entered into contractual agreements (the "Expense Limitation Agreements") with each Fund under which it has agreed to waive its fees and to assume other expenses of the Funds, if necessary, in an amount that limits the Funds' total operating expenses (exclusive of interest, taxes, brokerage commissions, extraordinary expenses, and payments, if any, under a Rule 12b-1 plan) to not more than 1.50% of the average daily net assets of CM Advisors Fund and CM Advisors Fixed Income Fund and not more than 1.25% of the average daily net assets of CM Advisors Small Cap Value Fund, each until July 1, 2015. There can be no assurance that the Expense Limitation Agreements will continue beyond July 1, 2015. Accordingly, during the six months ended August 31, 2014, with respect to CM Advisors Fund, the Advisor reimbursed the Fund for $13,371 of Class R expenses. During the six months ended August 31, 2014, with respect to CM Advisors Small Cap Value Fund, the Advisor waived its entire investment advisory fee of $67,384 and reimbursed the Fund for $15,372 of Class I expenses, $21,195 of Class C expenses and $9,667 of Class R expenses. During the six months ended August 31, 2014, there were no advisory fees waived or expenses reimbursed by the Advisor for CM Advisors Fixed Income Fund.
Certain Trustees and officers of the Trust are also officers of the Advisor.
CM Advisors Family of Funds
Notes to Financial Statements (Continued)
OTHER SERVICE PROVIDERS
Ultimus Fund Solutions, LLC ("Ultimus") provides fund administration, fund accounting, and transfer agency services to the Funds. The Funds pay Ultimus fees in accordance with the agreements for its services. In addition, the Funds pay out-of-pocket expenses including, but not limited to, postage, supplies and costs of pricing the Funds' portfolio securities. Certain officers of the Trust are also officers of Ultimus, or of Ultimus Fund Distributors, LLC (the "Distributor"), the principal underwriter of the Funds' shares and an affiliate of Ultimus.
DISTRIBUTION AGREEMENT
Pursuant to the terms of a Distribution Agreement with the Trust, the Distributor serves as the Funds' principal underwriter. The Distributor is a wholly-owned subsidiary of Ultimus. The Distributor receives annual compensation from the Trust for such services, of which each Fund pays its proportionate share.
DISTRIBUTION PLAN
The Trust has adopted plans of distribution (the "Plans") pursuant to Rule 12b-1 under the 1940 Act, which permit Class R shares of CM Advisors Fund and Class R shares of CM Advisors Small Cap Value Fund to directly incur or reimburse the Funds' principal underwriter for certain expenses related to the distribution of its shares. The annual limitation for payment of expenses pursuant to the Plans is 0.25% of average daily net assets attributable to Class R shares. The Trust has not adopted a plan of distribution with respect to Class I shares of CM Advisors Fund or CM Advisors Small Cap Value Fund, or with respect to CM Advisors Fixed Income Fund.
During the six months ended August 31, 2014, Class R shares of CM Advisors Fund incurred distribution expenses of $254, and Class C and Class R shares of CM Advisors Small Cap Value Fund incurred distribution expenses of $543 and $213, respectively.
COMPENSATION OF TRUSTEES
Trustees and officers affiliated with the Advisor or Ultimus are not compensated by the Trust for their services. Each Trustee who is not an affiliated person of the Advisor or Ultimus receives from the Trust an annual retainer of $10,000, paid quarterly, a fee of $2,000 per fund for attendance at each in-person meeting of the Board of Trustees and a fee of $500 per fund for attendance at each telephonic meeting of the Board of Trustees. The Trust reimburses each Trustee and officer for his or her travel and other expenses relating to attendance at Board or committee meetings.
CM Advisors Family of Funds
Notes to Financial Statements (Continued)
6. Derivatives Risk and Transactions
Investing in derivatives, including options, involves the risk of sustaining large and sudden losses. The use of derivatives by CM Advisors Fund and CM Advisors Small Cap Value Fund may reduce their returns and/or increase their volatility, and fluctuations in the value of a derivative may not correlate perfectly with the overall securities markets.
The locations in the Statements of Assets and Liabilities of the derivative positions of CM Advisors Fund and CM Advisors Small Cap Value Fund are as follows:
CM Advisors Fund
| | |
Fair Value
| Gross Notional Amount Outstanding August 31, 2014 | Average Monthly Notional Amount During the Six Months Ended August 31, 2014 |
| Type of Derivative | Location | Asset
Derivatives | Liability Derivatives |
| Index put options purchased | Investments in securities at value | $1,032,676 | $— | $94,180,066 | $30,744,945 |
CM Advisors Small Cap Value Fund
| | |
Fair Value
| Gross Notional Amount Outstanding August 31, 2014 | Average Monthly Notional Amount During the Six Months Ended August 31, 2014 |
| Type of Derivative | Location | Asset
Derivatives | Liability Derivatives |
| Index put options purchased | Investments in securities at value | $98,088 | $— | $6,818,760 | $2,219,588 |
There were no option contracts written by the Funds during the six months ended August 31, 2014.
CM Advisors Family of Funds
Notes to Financial Statements (Continued)
Transactions in derivative instruments for CM Advisors Fund and CM Advisors Small Cap Value Fund during the six months ended August 31, 2014 are recorded in the following locations in the Statements of Operations:
CM Advisors Fund
| Type of Derivative | Location | Realized Gains (Losses) | Location | Change in
Unrealized Appreciation/ Depreciation |
| Option contracts | Net realized gains from option contracts | $156,946 | Net change in unrealized appreciation/depreciation on option contracts | $(470,697) |
CM Advisors Small Cap Value Fund
| Type of Derivative | Location | Realized Gains (Losses) | Location | Change in
Unrealized Appreciation/ Depreciation |
| Option contracts | Net realized gains from option contracts | $— | Net change in unrealized appreciation/depreciation on option contracts | $(39,670) |
CM Advisors Fixed Income Fund did not hold any derivative instruments as of or during the six months ended August 31, 2014.
7. Capital Share Transactions
Proceeds and payments on capital shares as shown in the Statements of Changes in Net Assets for CM Advisors Fund and CM Advisors Small Cap Value Fund are the result of the following capital share transactions for the periods shown:
| | | Six Months Ended August 31, 2014 | | | Year Ended February 28, 2014 | |
| CM Advisors Fund - Class I | | | | | | |
| Shares sold | | | 276,325 | | | | 1,171,982 | |
| Shares reinvested | | | 20,389 | | | | — | |
| Shares redeemed | | | (404,769 | ) | | | (1,779,274 | ) |
| Net decrease in shares outstanding | | | (108,055 | ) | | | (607,292 | ) |
| Shares outstanding, beginning of period | | | 9,991,406 | | | | 10,598,698 | |
| Shares outstanding, end of period | | | 9,883,351 | | | | 9,991,406 | |
CM Advisors Family of Funds
Notes to Financial Statements (Continued)
| | | Six Months Ended August 31, 2014 | | | Year Ended February 28, 2014 | |
| CM Advisors Fund - Class R | | | | | | | | |
| Shares sold | | | 2,098 | | | | 3,314 | |
| Shares redeemed | | | (713 | ) | | | (2,069 | ) |
| Net increase in shares outstanding | | | 1,385 | | | | 1,245 | |
| Shares outstanding, beginning of period | | | 14,324 | | | | 13,079 | |
| Shares outstanding, end of period | | | 15,709 | | | | 14,324 | |
| | | | | | | | | |
| CM Advisors Small Cap Value Fund - Class I | | | | | | | | |
| Shares sold | | | 63,256 | | | | 42,656 | |
| Shares reinvested | | | — | | | | 47,927 | |
| Shares redeemed | | | (24,827 | ) | | | (85,375 | ) |
| Net increase in shares outstanding | | | 38,429 | | | | 5,208 | |
| Shares outstanding, beginning of period | | | 991,767 | | | | 986,559 | |
| Shares outstanding, end of period | | | 1,030,196 | | | | 991,767 | |
| | | | | | | | | |
| CM Advisors Small Cap Value Fund - Class C | | | | | | | | |
| Shares reinvested | | | — | | | | 520 | |
| Shares redeemed | | | (10,541 | ) | | | — | |
| Net increase (decrease) in shares outstanding | | | (10,541 | ) | | | 520 | |
| Shares outstanding, beginning of period | | | 10,541 | | | | 10,021 | |
| Shares outstanding, end of period | | | — | | | | 10,541 | |
| | | | | | | | | |
| CM Advisors Small Cap Value Fund - Class R | | | | | | | | |
| Shares sold | | | 2,512 | | | | 1,359 | |
| Shares reinvested | | | — | | | | 517 | |
| Shares redeemed | | | — | | | | (22,014 | ) |
| Net increase (decrease) in shares outstanding | | | 2,512 | | | | (20,138 | ) |
| Shares outstanding, beginning of period | | | 11,408 | | | | 31,546 | |
| Shares outstanding, end of period | | | 13,920 | | | | 11,408 | |
8. Sector Risk
If a Fund has significant investments in the securities of issuers in industries within a particular sector, any development affecting that sector will have a greater impact on the value of the net assets of the Fund than would be the case if the Fund did not have significant investments in that sector. In addition, this may increase the risk of loss of an investment in the Fund and increase the volatility of the Fund's net asset value per share. From time to time, a particular set of circumstances may affect this sector or certain companies within the sector, while having little or no impact on other sectors or other companies within the sector. For instance, economic or market factors, regulation or deregulation, and technological or other developments may negatively impact all companies in a particular sector and therefore the value of the Funds' portfolios will be adversely affected. As of August 31, 2014, CM Advisors Small Cap Value Fund had 32.0% of the value of their net assets invested in stocks within the Industrials sector.
CM Advisors Family of Funds
Notes to Financial Statements (Continued)
9. Contingencies and Commitments
The Funds indemnify the Trust's officers and Trustees for certain liabilities that might arise from the performance of their duties to the Funds. Additionally, in the normal course of business, the Funds enter into contracts that contain a variety of representations and warranties and which provide general indemnifications. Each Fund's maximum exposure under these arrangements is unknown, as this would involve future claims that may be made against the Funds that have not yet occurred. However, based on experience, the Trust expects the risk of loss to be remote.
10. Subsequent Events
The Funds are required to recognize in the financial statements the effects of all subsequent events that provide additional evidence about conditions that existed as of the date of the Statements of Assets and Liabilities. For non-recognized subsequent events that must be disclosed to keep the financial statements from being misleading, the Funds are required to disclose the nature of the event as well as an estimate of the financial effect, or a statement that such an estimate cannot be made. Management has evaluated subsequent events through the issuance of these financial statements and has noted no such events.
CM Advisors Family of Funds
About Your Funds' Expenses (Unaudited)
We believe it is important for you to understand the impact of costs on your investment. As a shareholder of the Funds, you may incur two types of costs: (1) transaction costs, including redemption fees; and (2) ongoing costs, including management fees, distribution (12b-1) fees and other Fund expenses. Ongoing costs, which are deducted from each Fund's gross income, directly reduce the investment return of the Funds.
A mutual fund's ongoing costs are expressed as a percentage of its average net assets. This figure is known as the expense ratio. The following examples are intended to help you understand the ongoing costs (in dollars) of investing in the Funds and to compare these costs with the ongoing costs of investing in other mutual funds. The examples below are based on an investment of $1,000 made at the beginning of the most recent semi-annual period (March 1, 2014) and held until the end of the period (August 31, 2014).
The table below illustrates each Fund's costs in two ways:
Actual fund return – This section helps you to estimate the actual expenses that you paid over the period. The "Ending Account Value" shown is derived from each Fund's actual return, and the third column shows the dollar amount of expenses that would have been paid by an investor who started with $1,000 in the Funds. You may use the information here, together with the amount you invested, to estimate the ongoing costs that you paid over the period.
To do so, simply divide your account value by $1,000 (for example, an $8,600 account value divided by $1,000 = 8.6), then multiply the result by the number given for the Funds under the heading "Expenses Paid During Period."
Hypothetical 5% return – This section is intended to help you compare the Funds' ongoing costs with those of other mutual funds. It assumes that each Fund had an annual return of 5% before expenses during the period shown, but that the expense ratio is unchanged. In this case, because the return used is not the Funds' actual returns, the results do not apply to your investment. The example is useful in making comparisons because the SEC requires all mutual funds to calculate expenses based on a 5% return. You can assess each Fund's ongoing costs by comparing this hypothetical example with the hypothetical examples that appear in shareholder reports of other funds.
Note that expenses shown in the table are meant to highlight and help you compare ongoing costs only. The Funds do not impose any sales loads. However, a redemption fee of 1% is charged on the sale of each class of shares of CM Advisors Fund and CM Advisors Small Cap Value Fund within 180 days of the date of their purchase.
The calculations assume no shares were bought or sold during the period. Your actual costs may have been higher or lower, depending on the amount of your investment and the timing of any purchases or redemptions.
More information about the Funds' expenses, including annual expense ratios, can be found in this report. For additional information on operating expenses and other shareholder costs, please refer to the Funds' prospectus.
CM Advisors Family of Funds
About Your Funds' Expenses (Unaudited) (Continued)
CM Advisors Fund - Class I
| | Beginning
Account Value March 1, 2014 | Ending
Account Value August 31, 2014 | Expenses Paid During Period* |
| Based on Actual Fund Return | $1,000.00 | $1,015.30 | $6.55 |
| Based on Hypothetical 5% Return (before expenses) | $1,000.00 | $1,018.70 | $6.56 |
| * | Expenses are equal to the annualized expense ratio of 1.29% for the period, multiplied by the average account value over the period, multiplied by 184/365 (to reflect the one-half year period). |
CM Advisors Fund - Class R
| | Beginning
Account Value March 1, 2014 | Ending
Account Value August 31, 2014 | Expenses Paid During Period* |
| Based on Actual Fund Return | $1,000.00 | $1,012.50 | $8.88 |
| Based on Hypothetical 5% Return (before expenses) | $1,000.00 | $1,016.38 | $8.89 |
| * | Expenses are equal to the annualized expense ratio of 1.75% for the period, multiplied by the average account value over the period, multiplied by 184/365 (to reflect the one-half year period). |
CM Advisors Small Cap Value Fund - Class I
| | Beginning
Account Value March 1, 2014 | Ending
Account Value August 31, 2014 | Expenses Paid During Period* |
| Based on Actual Fund Return | $1,000.00 | $1,003.90 | $6.31 |
| Based on Hypothetical 5% Return (before expenses) | $1,000.00 | $1,018.90 | $6.36 |
| * | Expenses are equal to the annualized expense ratio of 1.25% for the period, multiplied by the average account value over the period, multiplied by 184/365 (to reflect the one-half year period). |
CM Advisors Small Cap Value Fund - Class R
| | Beginning
Account Value March 1, 2014 | Ending
Account Value August 31, 2014 | Expenses Paid During Period* |
| Based on Actual Fund Return | $1,000.00 | $1,002.30 | $7.57 |
| Based on Hypothetical 5% Return (before expenses) | $1,000.00 | $1,017.64 | $7.63 |
| * | Expenses are equal to the annualized expense ratio of 1.50% for the period, multiplied by the average account value over the period, multiplied by 184/365 (to reflect the one-half year period). |
CM Advisors Family of Funds
About Your Funds' Expenses (Unaudited) (Continued)
CM Advisors Fixed Income Fund
| | Beginning
Account Value March 1, 2014 | Ending
Account Value August 31, 2014 | Expenses Paid During Period* |
| Based on Actual Fund Return | $1,000.00 | $1,007.40 | $3.90 |
| Based on Hypothetical 5% Return (before expenses) | $1,000.00 | $1,021.32 | $3.92 |
| * | Expenses are equal to the annualized expense ratio of 0.77% for the period, multiplied by the average account value over the period, multiplied by 184/365 (to reflect the one-half year period). |
CM Advisors Family of Funds
Other Information (Unaudited)
The Trust files a complete listing of portfolio holdings for the Funds with the SEC as of the end of the first and third quarters of each fiscal year on Form N-Q. The filings are available upon request, by calling 1-888-859-5856. Furthermore, you may obtain a copy of these filings on the SEC's website at http://www.sec.gov. The Trust's Forms N-Q may also be reviewed and copied at the SEC's Public Reference Room in Washington, DC, and information on the operation of the Public Reference Room may be obtained by calling 1-800-SEC-0330.
A description of the policies and procedures that the Funds use to determine how to vote proxies relating to portfolio securities is available without charge upon request by calling toll-free 1-888-859-5856, or on the SEC's website at http://www.sec.gov. Information regarding how the Funds voted proxies relating to portfolio securities during the most recent 12-month period ended June 30 is also available without charge upon request by calling toll-free 1-888-859-5856, or on the SEC's website at http://www.sec.gov.
This page intentionally left blank.
CM Advisors Fund
CM Advisors Small Cap Value Fund and
CM Advisors Fixed Income Fund
are each a series of
CM Advisors Family of Funds
| For Shareholder Service Inquiries: | | For Investment Advisor Inquiries: |
| Ultimus Fund Solutions, LLC P.O. Box 46707 Cincinnati, OH 45246-0707 | | Van Den Berg Management I, Inc. (d/b/a CM Fund Advisors) 805 Las Cimas Parkway, Suite 430 Austin, Texas 78746 |
| | | |
| Toll-Free Telephone: | | Toll-Free Telephone: |
| 1-888-859-5856 | | 1-888-859-5856 |
| | | |
| | | World Wide Web @: |
| | | www.cmadvisorsfunds.com |
Investment in the Funds is subject to investment risks, including the possible loss of some or all of the principal amount invested. No investment strategy works all the time, and past performance is not necessarily indicative of future performance. The performance information quoted in this report represents past performance, which is not a guarantee of future results. Investment return and principal value of an investment will fluctuate so that an investor's shares, when redeemed, may be worth more or less than their original cost. Current performance may be lower or higher than the performance data quoted. A redemption fee of 1% of the amount redeemed is imposed on redemptions of Fund shares for CM Advisors Fund and CM Advisors Small Cap Value Fund occurring within 180 days following the purchase of such shares. An investor should consider the investment objectives, risks, and charges and expenses of the Funds carefully before investing. The prospectus contains this and other information about the Funds. A copy of the prospectus is available at www.cmadvisorsfunds.com or by calling Shareholder Services at 1-888-859-5856. The prospectus should be read carefully before investing. |
For More Information on your CM Advisors Family of Funds:
See Our Web site @ www.cmadvisorsfunds.com or
Call Our Shareholder Services Group Toll-Free at 1-888-859-5856