| OMB APPROVAL |
OMB Number: 3235-0570 Expires: August 31, 2011 Estimated average burden hours per response: 18.9 |
UNITED STATES
SECURITIES AND EXCHANGE COMMISSION
Washington, D.C. 20549
FORM N-CSR
CERTIFIED SHAREHOLDER REPORT OF REGISTERED
MANAGEMENT INVESTMENT COMPANIES
Investment Company Act file number 811-21260
CM Advisors Family of Funds
(Exact name of registrant as specified in charter)
| 805 Las Cimas Parkway, Suite 430 Austin, Texas | 78746 |
| (Address of principal executive offices) | (Zip code) |
Tina H. Bloom, Esq.
Ultimus Fund Solutions, LCC 225 Pictoria Drive, Suite 450 Cincinnati, Ohio 45246
(Name and address of agent for service)
Registrant's telephone number, including area code: (512) 329-0050
Date of fiscal year end: February 28, 2012
Date of reporting period: August 31, 2011
Form N-CSR is to be used by management investment companies to file reports with the Commission not later than 10 days after the transmission to stockholders of any report that is required to be transmitted to stockholders under Rule 30e-1 under the Investment Company Act of 1940 (17 CFR 270.30e-1). The Commission may use the information provided on Form N-CSR in its regulatory, disclosure review, inspection, and policymaking roles.
A registrant is required to disclose the information specified by Form N-CSR, and the Commission will make this information public. A registrant is not required to respond to the collection of information contained in Form N-CSR unless the Form displays a currently valid Office of Management and Budget ("OMB") control number. Please direct comments concerning the accuracy of the information collection burden estimate and any suggestions for reducing the burden to Secretary, Securities and Exchange Commission, 450 Fifth Street, NW, Washington, DC 20549-0609. The OMB has reviewed this collection of information under the clearance requirements of 44 U.S.C. § 3507.
| Item 1. | Reports to Stockholders. |
CM Advisors Family of Funds
CM Advisors Small Cap Value Fund
CM Advisors Opportunity Fund
CM Advisors Fixed Income Fund
August 31, 2011
(Unaudited)
This report and the financial statements contained herein are submitted for the general information of the shareholders of the CM Advisors Family of Funds (the “Funds”). This report is not authorized for distribution to prospective investors in the Funds unless preceded or accompanied by an effective prospectus. Mutual fund shares are not deposits or obligations of, or guaranteed by, any depository institution. Shares are not insured by the FDIC, Federal Reserve Board or any other agency, and are subject to investment risks, including possible loss of principal amount invested.
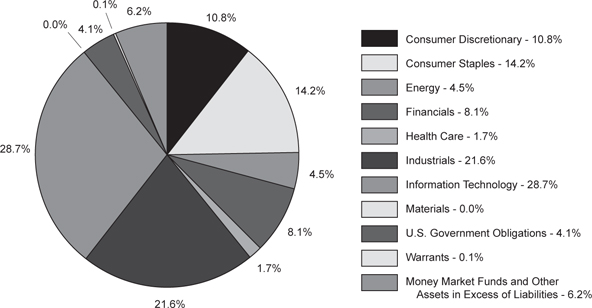
| CM Advisors Fund |
Portfolio Information August 31, 2011 (Unaudited) |
Asset and Sector Allocation
| | |
| |
| Microsoft Corporation | 5.8% |
| Wal-Mart Stores, Inc. | 5.1% |
| Coca-Cola Company (The) | 5.1% |
| 3M Company | 3.6% |
| Dell, Inc. | 3.4% |
| Jacobs Engineering Group, Inc. | 3.2% |
| Cisco Systems, Inc. | 2.9% |
| Colgate-Palmolive Company | 2.9% |
| Wells Fargo & Company | 2.8% |
| Applied Materials, Inc. | 2.8% |
| CM Advisors Small Cap Value Fund |
Portfolio Information August 31, 2011 (Unaudited) |
Asset and Sector Allocation
| | |
| |
| MDC Holdings, Inc. | 2.7% |
| Apogee Enterprises, Inc. | 2.6% |
| Lydall, Inc. | 2.5% |
| Encore Wire Corporation | 2.5% |
| Insteel Industries, Inc. | 2.5% |
| Steelcase, Inc. - Class A | 2.5% |
| Powell Industries, Inc. | 2.4% |
| Orion Marine Group, Inc. | 2.4% |
| Harsco Corporation | 2.4% |
| Thomas & Betts Corporation | 2.4% |
| CM Advisors Opportunity Fund |
Portfolio Information August 31, 2011 (Unaudited) |
Asset and Sector Allocation
| | |
| |
iPath Dow Jones-UBS Cocoa Subindex Total ReturnSM ETN | 4.5% |
| Hexcel Corporation | 2.7% |
| Jazz Pharmaceuticals, Inc. | 2.6% |
| Tennant Company | 2.4% |
| IPG Photonics Corporation | 2.3% |
| Questcor Pharmaceuticals, Inc. | 2.3% |
| Liquidity Services, Inc. | 2.3% |
| Majesco Entertainment Company | 2.1% |
| CROCS, Inc. | 2.0% |
| Central GoldTrust | 2.0% |
| CM Advisors Fixed Income Fund |
Portfolio Information August 31, 2011 (Unaudited) |
Asset and Sector Allocation
Top 10 Long-Term Holdings
| | |
| |
| U.S. Treasury Notes, 2.625%, due 11/15/20 | 4.1% |
| U.S. Treasury Bonds, 4.625%, due 02/15/40 | 3.6% |
| Rowan Companies, Inc., 7.875%, due 08/01/19 | 1.2% |
| Western Union Company (The), 6.20%, due 11/17/36 | 1.2% |
| Estée Lauder Companies, Inc. (The), 6.00%, due 05/15/37 | 1.2% |
| American Express Company, 7.00%, due 03/19/18 | 1.1% |
| UnitedHealth Group, Inc., 6.00%, due 02/15/18 | 1.0% |
| Coca-Cola Company (The), 5.35%, due 11/15/17 | 1.0% |
| Kraft Foods, Inc., 6.125%, due 02/01/18 | 1.0% |
| Ball Corporation, 7.375%, due 09/01/19 | 1.0% |
| CM Advisors Fund | |
Schedule of Investments August 31, 2011 (Unaudited) | |
| | | | | | |
| Consumer Discretionary — 10.8% | | | | | | |
| Auto Components — 0.0% | | | | | | |
Drew Industries, Inc. | | | 2,575 | | | $ | 51,268 | |
| | | | | | | | | |
| Distributors — 0.8% | | | | | | | | |
Core-Mark Holding Company, Inc. * | | | 25,615 | | | | 909,845 | |
| | | | | | | | | |
| Diversified Consumer Services — 1.2% | | | | | | | | |
CPI Corporation | | | 163,030 | | | | 1,413,470 | |
| | | | | | | | | |
| Household Durables — 4.1% | | | | | | | | |
MDC Holdings, Inc. | | | 149,120 | | | | 2,916,787 | |
Toll Brothers, Inc. * | | | 116,910 | | | | 2,009,683 | |
| | | | | | | | 4,926,470 | |
| Leisure Equipment & Products — 0.5% | | | | | | | | |
Arctic Cat, Inc. * | | | 41,750 | | | | 654,640 | |
| | | | | | | | | |
| Media — 0.2% | | | | | | | | |
Comcast Corporation - Class A Special | | | 12,900 | | | | 272,964 | |
| | | | | | | | | |
| Multiline Retail — 0.9% | | | | | | | | |
Target Corporation | | | 21,025 | | | | 1,086,362 | |
| | | | | | | | | |
| Specialty Retail — 3.1% | | | | | | | | |
Lowe's Companies, Inc. | | | 29,425 | | | | 586,440 | |
Staples, Inc. | | | 216,075 | | | | 3,184,946 | |
| | | | | | | | 3,771,386 | |
| Consumer Staples — 14.2% | | | | | | | | |
| Beverages — 5.1% | | | | | | | | |
Coca-Cola Company (The) | | | 87,970 | | | | 6,197,486 | |
| | | | | | | | | |
| Food & Staples Retailing — 5.6% | | | | | | | | |
Safeway, Inc. | | | 30,900 | | | | 566,397 | |
Wal-Mart Stores, Inc. | | | 117,850 | | | | 6,270,799 | |
| | | | | | | | 6,837,196 | |
| Household Products — 3.5% | | | | | | | | |
Colgate-Palmolive Company | | | 38,785 | | | | 3,489,486 | |
Procter & Gamble Company (The) | | | 12,900 | | | | 821,472 | |
| | | | | | | | 4,310,958 | |
| Energy — 4.5% | | | | | | | | |
| Energy Equipment & Services — 1.3% | | | | | | | | |
Global Industries Ltd. * | | | 12,585 | | | | 55,500 | |
Tidewater, Inc. | | | 28,480 | | | | 1,526,528 | |
| | | | | | | | 1,582,028 | |
| Oil, Gas & Consumable Fuels — 3.2% | | | | | | | | |
Exxon Mobil Corporation | | | 21,295 | | | | 1,576,682 | |
Penn Virginia Corporation | | | 56,960 | | | | 464,793 | |
Valero Energy Corporation | | | 83,800 | | | | 1,903,936 | |
| | | | | | | | 3,945,411 | |
| CM Advisors Fund | |
Schedule of Investments (Continued) | |
COMMON STOCKS — 89.6% (Continued) | | | | | | |
| Financials — 8.1% | | | | | | |
| Commercial Banks — 2.8% | | | | | | |
Wells Fargo & Company | | | 129,417 | | | $ | 3,377,784 | |
| | | | | | | | | |
| Consumer Finance — 1.5% | | | | | | | | |
American Express Company | | | 37,275 | | | | 1,852,940 | |
| | | | | | | | | |
| Insurance — 3.8% | | | | | | | | |
Berkshire Hathaway, Inc. - Class B * | | | 33,800 | | | | 2,467,400 | |
Marsh & McLennan Companies, Inc. | | | 38,332 | | | | 1,139,227 | |
SeaBright Holdings, Inc. | | | 154,869 | | | | 977,224 | |
Selective Insurance Group, Inc. | | | 3,710 | | | | 56,429 | |
| | | | | | | | 4,640,280 | |
| Health Care — 1.7% | | | | | | | | |
| Health Care Equipment & Supplies — 1.0% | | | | | | | | |
Medtronic, Inc. | | | 34,675 | | | | 1,216,052 | |
| | | | | | | | | |
| Health Care Providers & Services — 0.1% | | | | | | | | |
VCA Antech, Inc. * | | | 3,340 | | | | 61,824 | |
| | | | | | | | | |
| Life Sciences Tools & Services — 0.6% | | | | | | | | |
Thermo Fisher Scientific, Inc. * | | | 14,125 | | | | 775,886 | |
| | | | | | | | | |
| Industrials — 21.6% | | | | | | | | |
| Aerospace & Defense — 0.1% | | | | | | | | |
Innovative Solutions & Support, Inc. * | | | 24,570 | | | | 117,936 | |
| | | | | | | | | |
| Air Freight & Logistics — 1.3% | | | | | | | | |
FedEx Corporation | | | 7,615 | | | | 599,453 | |
United Parcel Service, Inc. - Class B | | | 13,650 | | | | 919,873 | |
| | | | | | | | 1,519,326 | |
| Building Products — 2.3% | | | | | | | | |
Apogee Enterprises, Inc. | | | 10,155 | | | | 95,356 | |
Insteel Industries, Inc. | | | 17,193 | | | | 180,183 | |
Masco Corporation | | | 272,800 | | | | 2,419,736 | |
Universal Forest Products, Inc. | | | 2,240 | | | | 68,454 | |
| | | | | | | | 2,763,729 | |
| Commercial Services & Supplies — 1.8% | | | | | | | | |
ABM Industries, Inc. | | | 61,582 | | | | 1,258,736 | |
Cintas Corporation | | | 29,625 | | | | 947,408 | |
| | | | | | | | 2,206,144 | |
| Construction & Engineering — 5.7% | | | | | | | | |
Granite Construction, Inc. | | | 32,675 | | | | 677,353 | |
Jacobs Engineering Group, Inc. * | | | 104,250 | | | | 3,882,270 | |
Orion Marine Group, Inc. * | | | 374,550 | | | | 2,408,356 | |
| | | | | | | | 6,967,979 | |
| Electrical Equipment — 2.0% | | | | | | | | |
Emerson Electric Company | | | 39,790 | | | | 1,852,225 | |
Encore Wire Corporation | | | 4,490 | | | | 100,621 | |
Servotronics, Inc. | | | 38,823 | | | | 330,384 | |
| CM Advisors Fund | |
Schedule of Investments (Continued) | |
COMMON STOCKS — 89.6% (Continued) | | | | | | |
| Industrials — 21.6% (Continued) | | | | | | |
Electrical Equipment — 2.0% (Continued) | | | | | | |
Thomas & Betts Corporation * | | | 2,280 | | | $ | 99,590 | |
| | | | | | | | 2,382,820 | |
| Industrial Conglomerates — 4.5% | | | | | | | | |
3M Company | | | 52,690 | | | | 4,372,216 | |
General Electric Company | | | 71,600 | | | | 1,167,796 | |
| | | | | | | | 5,540,012 | |
| Machinery — 2.6% | | | | | | | | |
Harsco Corporation | | | 100,390 | | | | 2,294,915 | |
L.S. Starrett Company (The) | | | 3,434 | | | | 37,499 | |
Lydall, Inc. * | | | 80,137 | | | | 874,295 | |
| | | | | | | | 3,206,709 | |
| Professional Services — 0.9% | | | | | | | | |
CDI Corporation | | | 92,674 | | | | 1,043,509 | |
| | | | | | | | | |
| Trading Companies & Distributors — 0.4% | | | | | | | | |
Lawson Products, Inc. | | | 30,332 | | | | 517,464 | |
| | | | | | | | | |
| Information Technology — 28.7% | | | | | | | | |
| Communications Equipment — 3.0% | | | | | | | | |
Cisco Systems, Inc. | | | 227,350 | | | | 3,564,848 | |
PCTEL, Inc. * | | | 16,908 | | | | 107,704 | |
| | | | | | | | 3,672,552 | |
| Computers & Peripherals — 4.5% | | | | | | | | |
Dell, Inc. * | | | 281,115 | | | | 4,178,774 | |
Hutchinson Technology, Inc. * | | | 557,335 | | | | 1,259,577 | |
| | | | | | | | 5,438,351 | |
Electronic Equipment, Instruments & Components — 4.4% | | | | | | | | |
Benchmark Electronics, Inc. * | | | 51,140 | | | | 692,947 | |
Maxwell Technologies, Inc. * | | | 107,365 | | | | 1,860,636 | |
Molex, Inc. | | | 28,765 | | | | 628,515 | |
Newport Corporation * | | | 109,500 | | | | 1,416,930 | |
Perceptron, Inc. * | | | 23,719 | | | | 147,532 | |
Planar Systems, Inc. * | | | 45,645 | | | | 91,290 | |
Vishay Precision Group, Inc. * | | | 37,000 | | | | 555,000 | |
| | | | | | | | 5,392,850 | |
| IT Services — 3.6% | | | | | | | | |
Automatic Data Processing, Inc. | | | 59,405 | | | | 2,972,032 | |
Paychex, Inc. | | | 51,010 | | | | 1,376,250 | |
| | | | | | | | 4,348,282 | |
| Semiconductors & Semiconductor Equipment — 7.4% | | | | | | | | |
Applied Materials, Inc. | | | 297,170 | | | | 3,363,964 | |
Cabot Microelectronics Corporation * | | | 1,965 | | | | 78,129 | |
Cohu, Inc. | | | 700 | | | | 7,763 | |
Exar Corporation * | | | 16,175 | | | | 98,021 | |
Intel Corporation | | | 134,100 | | | | 2,699,433 | |
MEMC Electronic Materials, Inc. * | | | 391,550 | | | | 2,733,019 | |
Micrel, Inc. | | | 10,030 | | | | 101,403 | |
| | | | | | | | 9,081,732 | |
| CM Advisors Fund | |
Schedule of Investments (Continued) | |
COMMON STOCKS — 89.6% (Continued) | | | | | | |
Information Technology — 28.7% (Continued) | | | | | | |
| Software — 5.8% | | | | | | |
Microsoft Corporation | | | 264,305 | | | $ | 7,030,513 | |
| | | | | | | | | |
| Materials — 0.0% | | | | | | | | |
| Chemicals — 0.0% | | | | | | | | |
Landec Corporation * | | | 6,150 | | | | 36,592 | |
| | | | | | | | | |
Total Common Stocks (Cost $110,388,340) | | | | | | $ | 109,150,750 | |
| |
U.S. GOVERNMENT OBLIGATIONS — 4.1% | | | | | | |
U.S. Treasury Bills (a) — 4.1% | | | | | | |
0.095%, due 10/27/11 (Cost $4,999,261) | | $ | 5,000,000 | | | $ | 4,999,900 | |
| |
| | | | | | |
Wells Fargo & Company * (Cost $130,130) | | | 16,900 | | | $ | 158,015 | |
| |
MONEY MARKET FUNDS — 6.1% | | | | | | |
Wells Fargo Advantage Treasury Plus Money Market Fund - Institutional Class, 0.01% (b) (Cost $7,435,054) | | | 7,435,054 | | | $ | 7,435,054 | |
| | | | | | | | | |
Total Investments at Value — 99.9% (Cost $122,952,785) | | | | | | $ | 121,743,719 | |
| | | | | | | | | |
Other Assets in Excess of Liabilities — 0.1% | | | | | | | 126,699 | |
| | | | | | | | | |
Net Assets — 100.0% | | | | | | $ | 121,870,418 | |
| * | Non-income producing security. |
| (a) | Rate shown is the annualized yield at time of purchase, not a coupon rate. |
| (b) | Variable rate security. The rate shown is the 7-day effective yield as of August 31, 2011. |
| See accompanying notes to financial statements. |
| CM Advisors Small Cap Value Fund | |
Schedule of Investments August 31, 2011 (Unaudited) | |
| | | | | | |
| Consumer Discretionary — 10.3% | | | | | | |
| Auto Components — 1.6% | | | | | | |
Drew Industries, Inc. | | | 4,805 | | | $ | 95,668 | |
| | | | | | | | | |
| Distributors — 2.1% | | | | | | | | |
Core-Mark Holding Company, Inc. * | | | 3,405 | | | | 120,946 | |
| | | | | | | | | |
| Diversified Consumer Services — 2.0% | | | | | | | | |
CPI Corporation | | | 8,515 | | | | 73,825 | |
Learning Tree International, Inc. * | | | 4,715 | | | | 45,735 | |
| | | | | | | | 119,560 | |
| Hotels, Restaurants & Leisure — 1.3% | | | | | | | | |
WMS Industries, Inc. * | | | 3,500 | | | | 76,370 | |
| | | | | | | | | |
| Household Durables — 2.7% | | | | | | | | |
MDC Holdings, Inc. | | | 8,015 | | | | 156,773 | |
| | | | | | | | | |
| Leisure Equipment & Products — 0.6% | | | | | | | | |
Arctic Cat, Inc. * | | | 2,445 | | | | 38,338 | |
| | | | | | | | | |
| Energy — 4.3% | | | | | | | | |
| Energy Equipment & Services — 2.4% | | | | | | | | |
Global Industries Ltd. * | | | 28,480 | | | | 125,597 | |
Gulf Island Fabrication, Inc. | | | 780 | | | | 19,188 | |
| | | | | | | | 144,785 | |
| Oil, Gas & Consumable Fuels — 1.9% | | | | | | | | |
Comstock Resources, Inc. * | | | 730 | | | | 14,856 | |
CREDO Petroleum Corporation * | | | 1,950 | | | | 17,998 | |
Double Eagle Petroleum Company * | | | 1,455 | | | | 13,808 | |
Penn Virginia Corporation | | | 8,055 | | | | 65,729 | |
| | | | | | | | 112,391 | |
| Financials — 4.1% | | | | | | | | |
| Commercial Banks — 0.5% | | | | | | | | |
Glacier Bancorp, Inc. | | | 2,785 | | | | 32,055 | |
| | | | | | | | | |
| Insurance — 3.6% | | | | | | | | |
AMERISAFE, Inc. * | | | 760 | | | | 14,995 | |
Employers Holdings, Inc. | | | 2,240 | | | | 27,395 | |
RLI Corporation | | | 480 | | | | 30,345 | |
SeaBright Holdings, Inc. | | | 13,425 | | | | 84,712 | |
Selective Insurance Group, Inc. | | | 3,670 | | | | 55,821 | |
| | | | | | | | 213,268 | |
| Health Care — 4.1% | | | | | | | | |
| Health Care Providers & Services — 2.0% | | | | | | | | |
VCA Antech, Inc. * | | | 6,410 | | | | 118,649 | |
| | | | | | | | | |
| Life Sciences Tools & Services — 1.7% | | | | | | | | |
| Charles River Laboratories International, Inc. * | | | 2,985 | | | | 98,863 | |
| CM Advisors Small Cap Value Fund | |
Schedule of Investments (Continued) | |
COMMON STOCKS — 96.7% (Continued) | | | | | | |
| Health Care — 4.1% (Continued) | | | | | | |
| Pharmaceuticals — 0.4% | | | | | | |
LifeVantage Corporation * | | | 16,200 | | | $ | 23,814 | |
| | | | | | | | | |
| Industrials — 41.9% | | | | | | | | |
| Aerospace & Defense — 3.0% | | | | | | | | |
Curtiss-Wright Corporation | | | 2,695 | | | | 82,979 | |
Innovative Solutions & Support, Inc. * | | | 19,020 | | | | 91,296 | |
| | | | | | | | 174,275 | |
| Building Products — 7.9% | | | | | | | | |
Apogee Enterprises, Inc. | | | 16,085 | | | | 151,038 | |
Insteel Industries, Inc. | | | 13,900 | | | | 145,672 | |
Trex Company, Inc. * | | | 2,655 | | | | 48,427 | |
Universal Forest Products, Inc. | | | 3,965 | | | | 121,171 | |
| | | | | | | | 466,308 | |
| Commercial Services & Supplies — 4.7% | | | | | | | | |
ABM Industries, Inc. | | | 6,415 | | | | 131,123 | |
Steelcase, Inc. - Class A | | | 17,580 | | | | 145,562 | |
| | | | | | | | 276,685 | |
| Construction & Engineering — 4.5% | | | | | | | | |
Granite Construction, Inc. | | | 5,160 | | | | 106,967 | |
Layne Christensen Company * | | | 585 | | | | 16,421 | |
Orion Marine Group, Inc. * | | | 22,175 | | | | 142,585 | |
| | | | | | | | 265,973 | |
| Electrical Equipment — 9.0% | | | | | | | | |
AZZ, Inc. | | | 655 | | | | 31,001 | |
Encore Wire Corporation | | | 6,545 | | | | 146,674 | |
Powell Industries, Inc. * | | | 3,820 | | | | 142,944 | |
Servotronics, Inc. | | | 8,414 | | | | 71,603 | |
Thomas & Betts Corporation * | | | 3,190 | | | | 139,339 | |
| | | | | | | | 531,561 | |
| Machinery — 7.9% | | | | | | | | |
Astec Industries, Inc. * | | | 1,680 | | | | 58,145 | |
Badger Meter, Inc. | | | 280 | | | | 9,808 | |
CLARCOR, Inc. | | | 285 | | | | 13,264 | |
Harsco Corporation | | | 6,120 | | | | 139,903 | |
L.S. Starrett Company | | | 8,629 | | | | 94,229 | |
Lydall, Inc. * | | | 13,655 | | | | 148,976 | |
| | | | | | | | 464,325 | |
| Professional Services — 3.3% | | | | | | | | |
CDI Corporation | | | 10,980 | | | | 123,635 | |
Heidrick & Struggles International, Inc. | | | 2,180 | | | | 45,278 | |
Korn/Ferry International * | | | 1,645 | | | | 26,748 | |
| | | | | | | | 195,661 | |
| Trading Companies & Distributors — 1.6% | | | | | | | | |
Lawson Products, Inc. | | | 5,575 | | | | 95,110 | |
| | | | | | | | | |
| Information Technology — 27.7% | | | | | | | | |
| Communications Equipment — 1.4% | | | | | | | | |
PCTEL, Inc. * | | | 12,305 | | | | 78,383 | |
| CM Advisors Small Cap Value Fund | |
Schedule of Investments (Continued) | |
COMMON STOCKS — 96.7% (Continued) | | | | | | |
| Information Technology — 27.7% (Continued) | | | | | | |
| Computers & Peripherals — 1.4% | | | | | | |
Hutchinson Technology, Inc. * | | | 37,245 | | | $ | 84,174 | |
| | | | | | | | | |
Electronic Equipment, Instruments & Components — 13.9% | | | | | | | | |
Benchmark Electronics, Inc. * | | | 9,635 | | | | 130,554 | |
Daktronics, Inc. | | | 9,225 | | | | 88,929 | |
Electro Scientific Industries, Inc. * | | | 970 | | | | 14,666 | |
FEI Company * | | | 395 | | | | 12,636 | |
Maxwell Technologies, Inc. * | | | 6,180 | | | | 107,099 | |
Nam Tai Electronics, Inc. | | | 5,150 | | | | 26,574 | |
Newport Corporation * | | | 8,510 | | | | 110,120 | |
Perceptron, Inc. * | | | 18,704 | | | | 116,339 | |
Planar Systems, Inc. * | | | 39,429 | | | | 78,858 | |
Vishay Precision Group, Inc. * | | | 8,880 | | | | 133,200 | |
| | | | | | | | 818,975 | |
| Semiconductors & Semiconductor Equipment — 11.0% | | | | | | | | |
Cabot Microelectronics Corporation * | | | 3,215 | | | | 127,828 | |
Cohu, Inc. | | | 3,870 | | | | 42,918 | |
Cyberoptics Corporation * | | | 4,775 | | | | 41,495 | |
Exar Corporation * | | | 19,230 | | | | 116,534 | |
International Rectifier Corporation * | | | 715 | | | | 16,295 | |
MEMC Electronic Materials, Inc. * | | | 16,815 | | | | 117,369 | |
Micrel, Inc. | | | 7,525 | | | | 76,078 | |
Power Integrations, Inc. | | | 195 | | | | 6,267 | |
Rudolph Technologies, Inc. * | | | 15,535 | | | | 105,793 | |
| | | | | | | | 650,577 | |
| Materials — 4.3% | | | | | | | | |
| Chemicals — 1.6% | | | | | | | | |
Landec Corporation * | | | 11,895 | | | | 70,775 | |
OM Group, Inc. * | | | 730 | | | | 23,090 | |
| | | | | | | | 93,865 | |
| Containers & Packaging — 0.3% | | | | | | | | |
UFP Technologies, Inc. * | | | 990 | | | | 16,048 | |
| | | | | | | | | |
| Metals & Mining — 2.4% | | | | | | | | |
A.M. Castle & Company * | | | 7,825 | | | | 94,996 | |
Synalloy Corporation | | | 4,731 | | | | 47,925 | |
| | | | | | | | 142,921 | |
| | | | | | | | | |
Total Common Stocks (Cost $6,025,501) | | | | | | $ | 5,706,321 | |
| CM Advisors Small Cap Value Fund | |
Schedule of Investments (Continued) | |
MONEY MARKET FUNDS — 2.5% | | | | | | |
Wells Fargo Advantage Treasury Plus Money Market Fund - Institutional Class, 0.01% (a) (Cost $144,749) | | | 144,749 | | | $ | 144,749 | |
| | | | | | | | | |
Total Investments at Value — 99.2% (Cost $6,170,250) | | | | | | $ | 5,851,070 | |
| | | | | | | | | |
Other Assets in Excess of Liabilities — 0.8% | | | | | | | 49,030 | |
| | | | | | | | | |
Net Assets — 100.0% | | | | | | $ | 5,900,100 | |
| * | Non-income producing security. |
| (a) | Variable rate security. The rate shown is the 7-day effective yield as of August 31, 2011. |
| See accompanying notes to financial statements. |
| CM Advisors Opportunity Fund | |
Schedule of Investments August 31, 2011 (Unaudited) | |
| | | | | | |
| Consumer Discretionary — 2.0% | | | | | | |
| Textiles, Apparel & Luxury Goods — 2.0% | | | | | | |
CROCS, Inc. * | | | 1,185 | | | $ | 32,422 | |
| | | | | | | | | |
| Consumer Staples — 1.7% | | | | | | | | |
| Food Products — 1.7% | | | | | | | | |
Smart Balance, Inc. * | | | 5,340 | | | | 26,967 | |
| | | | | | | | | |
| Energy — 3.0% | | | | | | | | |
| Energy Equipment & Services — 1.6% | | | | | | | | |
Mitcham Industries, Inc. * | | | 1,530 | | | | 25,719 | |
| | | | | | | | | |
| Oil, Gas & Consumable Fuels — 1.4% | | | | | | | | |
Rosetta Resources, Inc. * | | | 465 | | | | 21,367 | |
| | | | | | | | | |
| Health Care — 10.7% | | | | | | | | |
| Biotechnology — 3.4% | | | | | | | | |
DUSA Pharmaceuticals, Inc. * | | | 5,310 | | | | 23,151 | |
Momenta Pharmaceuticals, Inc. * | | | 1,815 | | | | 30,710 | |
| | | | | | | | 53,861 | |
| Pharmaceuticals — 7.3% | | | | | | | | |
Akorn, Inc. * | | | 2,860 | | | | 22,995 | |
Jazz Pharmaceuticals, Inc. * | | | 970 | | | | 41,603 | |
LifeVantage Corporation * | | | 9,070 | | | | 13,333 | |
Questcor Pharmaceuticals, Inc. * | | | 1,205 | | | | 36,210 | |
| | | | | | | | 114,141 | |
| Industrials — 6.6% | | | | | | | | |
| Aerospace & Defense — 2.7% | | | | | | | | |
Hexcel Corporation * | | | 1,865 | | | | 42,839 | |
| | | | | | | | | |
| Machinery — 2.4% | | | | | | | | |
Tennant Company | | | 855 | | | | 37,586 | |
| | | | | | | | | |
| Professional Services — 1.5% | | | | | | | | |
Acacia Research Corporation * | | | 525 | | | | 22,943 | |
| | | | | | | | | |
| Information Technology — 14.8% | | | | | | | | |
| Computers & Peripherals — 2.0% | | | | | | | | |
Datalink Corporation * | | | 3,675 | | | | 31,826 | |
| | | | | | | | | |
Electronic Equipment, Instruments & Components — 6.4% | | | | | | | | |
CalAmp Corporation * | | | 4,700 | | | | 14,288 | |
Elecsys Corporation * | | | 2,350 | | | | 12,314 | |
Electro Scientific Industries, Inc. * | | | 1,000 | | | | 15,120 | |
Insight Enterprises, Inc. * | | | 1,215 | | | | 22,866 | |
IPG Photonics Corporation * | | | 630 | | | | 36,527 | |
| | | | | | | | 101,115 | |
| CM Advisors Opportunity Fund | |
Schedule of Investments (Continued) | |
COMMON STOCKS — 41.5% (Continued) | | | | | | |
| Information Technology — 14.8% (Continued) | | | | | | |
| Internet Software & Services — 2.3% | | | | | | |
Liquidity Services, Inc. * | | | 1,500 | | | $ | 36,000 | |
| | | | | | | | | |
| Semiconductors & Semiconductor Equipment — 2.0% | | | | | | | | |
AXT, Inc. * | | | 4,080 | | | | 31,702 | |
| | | | | | | | | |
| Software — 2.1% | | | | | | | | |
Majesco Entertainment Company * | | | 13,350 | | | | 32,707 | |
| | | | | | | | | |
| Materials — 2.7% | | | | | | | | |
| Metals & Mining — 2.7% | | | | | | | | |
Carpenter Technology Corporation | | | 445 | | | | 22,459 | |
DRDGOLD Ltd. - ADR | | | 3,700 | | | | 19,906 | |
| | | | | | | | 42,365 | |
| | | | | | | | | |
Total Common Stocks (Cost $678,978) | | | | | | $ | 653,560 | |
| |
| | | | | | |
Central GoldTrust * (Cost $28,938) | | | 450 | | | $ | 32,256 | |
| |
EXCHANGE-TRADED NOTES — 4.5% | | | | | | |
iPath Dow Jones-UBS Cocoa Subindex Total ReturnSM ETN * (Cost $68,101) | | | 1,595 | | | $ | 70,084 | |
| |
MONEY MARKET FUNDS — 50.3% | | | | | | |
Wells Fargo Advantage Treasury Plus Money Market Fund - Institutional Class, 0.01% (a) (Cost $792,779) | | | 792,779 | | | $ | 792,779 | |
| | | | | | | | | |
Total Investments at Value — 98.3% (Cost $1,568,796) | | | | | | $ | 1,548,679 | |
| | | | | | | | | |
Other Assets in Excess of Liabilities — 1.7% | | | | | | | 26,847 | |
| | | | | | | | | |
Net Assets — 100.0% | | | | | | $ | 1,575,526 | |
| ADR - American Depositary Receipt. |
| * | Non-income producing security. |
| (a) | Variable rate security. The rate shown is the 7-day effective yield as of August 31, 2011. |
| See accompanying notes to financial statements. |
| CM Advisors Fixed Income Fund | |
Schedule of Investments August 31, 2011 (Unaudited) | |
| | | | | | |
| Consumer Discretionary — 6.8% | | | | | | |
| Auto Components — 0.5% | | | | | | |
Johnson Controls, Inc., 5.50%, due 01/15/16 | | $ | 400,000 | | | $ | 450,074 | |
| | | | | | | | | |
| Hotels, Restaurants & Leisure — 0.9% | | | | | | | | |
| Marriott International, Inc., 6.375%, due 06/15/17 | | | 400,000 | | | | 464,100 | |
Starbucks Corporation, 6.25%, due 08/15/17 | | | 300,000 | | | | 358,952 | |
| | | | | | | | 823,052 | |
| Household Durables — 0.9% | | | | | | | | |
MDC Holdings, Inc., 5.625%, due 02/01/20 | | | 500,000 | | | | 485,490 | |
| Newell Rubbermaid, Inc., 6.25%, due 04/15/18 | | | 185,000 | | | | 209,527 | |
Toll Brothers Finance Corporation, 5.15%, due 05/15/15 | | | 150,000 | | | | 154,027 | |
| | | | | | | | 849,044 | |
| Media — 2.4% | | | | | | | | |
| Comcast Corporation, | | | | | | | | |
6.30%, due 11/15/17 | | | 200,000 | | | | 238,489 | |
5.70%, due 05/15/18 | | | 400,000 | | | | 463,704 | |
Gannett Company, Inc., 6.375%, due 04/01/12 | | | 300,000 | | | | 301,500 | |
| McGraw-Hill Companies, Inc. (The), | | | | | | | | |
5.90%, due 11/15/17 | | | 200,000 | | | | 227,070 | |
6.55%, due 11/15/37 | | | 400,000 | | | | 435,940 | |
| Tele-Communications, Inc., 10.125%, due 04/15/22 | | | 300,000 | | | | 430,938 | |
| | | | | | | | 2,097,641 | |
| Multi-Line Retail — 0.8% | | | | | | | | |
| Kohl's Corporation, | | | | | | | | |
6.25%, due 12/15/17 | | | 500,000 | | | | 596,928 | |
6.00%, due 01/15/33 | | | 100,000 | | | | 107,901 | |
| | | | | | | | 704,829 | |
| Specialty Retail — 1.3% | | | | | | | | |
| Home Depot, Inc. (The), | | | | | | | | |
5.40%, due 03/01/16 | | | 600,000 | | | | 681,508 | |
5.875%, due 12/16/36 | | | 300,000 | | | | 327,250 | |
Staples, Inc., 9.75%, due 01/15/14 | | | 100,000 | | | | 117,213 | |
| | | | | | | | 1,125,971 | |
| Consumer Staples — 5.0% | | | | | | | | |
| Beverages — 1.4% | | | | | | | | |
| Coca-Cola Company (The), 5.35%, due 11/15/17 | | | 770,000 | | | | 919,842 | |
PepsiCo, Inc., 5.00%, due 06/01/18 | | | 300,000 | | | | 348,845 | |
| | | | | | | | 1,268,687 | |
| Food & Staples Retailing — 1.0% | | | | | | | | |
Wal-Mart Stores, Inc., 6.50%, due 08/15/37 | | | 670,000 | | | | 831,813 | |
| | | | | | | | | |
| Food Products — 1.0% | | | | | | | | |
Kraft Foods, Inc., 6.125%, due 02/01/18 | | | 770,000 | | | | 911,170 | |
| | | | | | | | | |
| Household Products — 0.4% | | | | | | | | |
Clorox Company (The), 5.45%, due 10/15/12 | | | 370,000 | | | | 387,791 | |
| CM Advisors Fixed Income Fund | |
Schedule of Investments (Continued) | |
CORPORATE BONDS — 36.3% (Continued) | | | | | | |
| Consumer Staples — 5.0% (Continued) | | | | | | |
| Personal Products — 1.2% | | | | | | |
| Estée Lauder Companies, Inc. (The), 6.00%, due 05/15/37 | | $ | 880,000 | | | $ | 1,038,815 | |
| | | | | | | | | |
| Energy — 3.3% | | | | | | | | |
| Energy Equipment & Services — 2.1% | | | | | | | | |
| Rowan Companies, Inc., 7.875%, due 08/01/19 | | | 910,000 | | | | 1,090,850 | |
| Weatherford International Ltd., | | | | | | | | |
6.35%, due 06/15/17 | | | 370,000 | | | | 421,729 | |
6.00%, due 03/15/18 | | | 300,000 | | | | 336,166 | |
9.875%, due 03/01/39 | | | 20,000 | | | | 28,926 | |
| | | | | | | | 1,877,671 | |
| Oil, Gas & Consumable Fuels — 1.2% | | | | | | | | |
| Valero Energy Corporation, | | | | | | | | |
6.125%, due 06/15/17 | | | 570,000 | | | | 645,899 | |
10.50%, due 03/15/39 | | | 250,000 | | | | 360,141 | |
| | | | | | | | 1,006,040 | |
| Financials — 2.9% | | | | | | | | |
| Commercial Banks — 0.6% | | | | | | | | |
| Wells Fargo & Company, 5.625%, due 12/11/17 | | | 500,000 | | | | 573,404 | |
| | | | | | | | | |
| Consumer Finance — 1.4% | | | | | | | | |
| American Express Company, | | | | | | | | |
7.00%, due 03/19/18 | | | 800,000 | | | | 952,529 | |
8.125%, due 05/20/19 | | | 200,000 | | | | 256,986 | |
| | | | | | | | 1,209,515 | |
| Real Estate Investment Trusts — 0.9% | | | | | | | | |
| Weyerhaeuser Company, 7.375%, due 03/15/32 | | | 730,000 | | | | 778,328 | |
| | | | | | | | | |
| Health Care — 1.8% | | | | | | | | |
| Health Care Providers & Services — 1.0% | | | | | | | | |
| UnitedHealth Group, Inc., 6.00%, due 02/15/18 | | | 800,000 | | | | 936,039 | |
| | | | | | | | | |
| Pharmaceuticals — 0.8% | | | | | | | | |
Johnson & Johnson, 5.15%, due 07/15/18 | | | 570,000 | | | | 685,736 | |
| | | | | | | | | |
| Industrials — 5.0% | | | | | | | | |
| Aerospace & Defense — 0.3% | | | | | | | | |
| United Technologies Corporation, 5.375%, due 12/15/17 | | | 200,000 | | | | 236,340 | |
| | | | | | | | | |
| Building Products — 1.0% | | | | | | | | |
| Masco Corporation, | | | | | | | | |
6.125%, due 10/03/16 | | | 300,000 | | | | 293,882 | |
5.85%, due 03/15/17 | | | 400,000 | | | | 398,076 | |
7.75%, due 08/01/29 | | | 240,000 | | | | 231,381 | |
| | | | | | | | 923,339 | |
| Commercial Services & Supplies — 0.9% | | | | | | | | |
Pitney Bowes, Inc., 5.75%, due 09/15/17 | | | 200,000 | | | | 217,980 | |
| CM Advisors Fixed Income Fund | |
Schedule of Investments (Continued) | |
CORPORATE BONDS — 36.3% (Continued) | | | | | | |
| Industrials — 5.0% (Continued) | | | | | | |
| Commercial Services & Supplies — 0.9% (Continued) | | | | | | |
| R.R. Donnelley & Sons Company, | | | | | | |
6.125%, due 01/15/17 | | $ | 400,000 | | | $ | 364,000 | |
11.75%, due 02/01/19 | | | 200,000 | | | | 248,000 | |
| | | | | | | | 829,980 | |
| Electrical Equipment — 0.8% | | | | | | | | |
| Emerson Electric Company, 5.25%, due 10/15/18 | | | 570,000 | | | | 667,441 | |
| | | | | | | | | |
| Machinery — 0.2% | | | | | | | | |
Dover Corporation, 5.45%, due 03/15/18 | | | 115,000 | | | | 134,779 | |
| | | | | | | | | |
| Professional Services — 0.9% | | | | | | | | |
| Dun & Bradstreet Corporation (The), 6.00%, due 04/01/13 | | | 200,000 | | | | 214,405 | |
Equifax, Inc., 7.00%, due 07/01/37 | | | 500,000 | | | | 539,391 | |
| | | | | | | | 753,796 | |
| Road & Rail — 0.9% | | | | | | | | |
CSX Corporation, 6.25%, due 03/15/18 | | | 500,000 | | | | 601,226 | |
| Union Pacific Corporation, 5.70%, due 08/15/18 | | | 200,000 | | | | 238,163 | |
| | | | | | | | 839,389 | |
| Information Technology — 4.2% | | | | | | | | |
| Computers & Peripherals — 0.8% | | | | | | | | |
Dell, Inc., 5.65%, due 04/15/18 | | | 400,000 | | | | 455,898 | |
| Seagate Technology HDD Holdings, 6.375%, due 10/01/11 | | | 200,000 | | | | 200,000 | |
| | | | | | | | 655,898 | |
Electronic Equipment, Instruments & Components — 0.8% | | | | | | | | |
| Corning, Inc., | | | | | | | | |
6.85%, due 03/01/29 | | | 100,000 | | | | 116,611 | |
7.25%, due 08/15/36 | | | 500,000 | | | | 604,527 | |
| | | | | | | | 721,138 | |
| IT Services — 2.6% | | | | | | | | |
| International Business Machines Corporation, 7.625%, due 10/15/18 | | | 420,000 | | | | 555,511 | |
| Western Union Company (The), | | | | | | | | |
5.93%, due 10/01/16 | | | 600,000 | | | | 678,985 | |
6.20%, due 11/17/36 | | | 1,025,000 | | | | 1,068,688 | |
| | | | | | | | 2,303,184 | |
| Materials — 6.5% | | | | | | | | |
| Chemicals — 1.9% | | | | | | | | |
Cytec Industries, Inc., 8.95%, due 07/01/17 | | | 650,000 | | | | 828,194 | |
| E.I. du Pont de Nemours and Company, 6.00%, due 07/15/18 | | | 475,000 | | | | 573,512 | |
Lubrizol Corporation, 6.50%, due 10/01/34 | | | 200,000 | | | | 247,335 | |
| | | | | | | | 1,649,041 | |
| Construction Materials — 0.5% | | | | | | | | |
| Vulcan Materials Company, 6.40%, due 11/30/17 | | | 500,000 | | | | 470,000 | |
| CM Advisors Fixed Income Fund | |
Schedule of Investments (Continued) | |
CORPORATE BONDS — 36.3% (Continued) | | | | | | |
| Materials — 6.5% (Continued) | | | | | | |
| Containers & Packaging — 1.0% | | | | | | |
Ball Corporation, 7.375%, due 09/01/19 | | $ | 830,000 | | | $ | 900,550 | |
| | | | | | | | | |
| Metals & Mining — 3.1% | | | | | | | | |
| Alcoa, Inc., | | | | | | | | |
5.72%, due 02/23/19 | | | 800,000 | | | | 829,448 | |
5.87%, due 02/23/22 | | | 200,000 | | | | 201,549 | |
| Allegheny Technologies, Inc., 9.375%, due 06/01/19 | | | 355,000 | | | | 461,019 | |
Nucor Corporation, 5.85%, due 06/01/18 | | | 300,000 | | | | 363,178 | |
| Reliance Steel & Aluminum Company, | | | | | | | | |
6.20%, due 11/15/16 | | | 360,000 | | | | 397,608 | |
6.85%, due 11/15/36 | | | 500,000 | | | | 475,656 | |
| | | | | | | | 2,728,458 | |
| Utilities — 0.8% | | | | | | | | |
| Multi-Utilities — 0.8% | | | | | | | | |
| Consolidated Edison, Inc., 5.85%, due 04/01/18 | | | 570,000 | | | | 690,006 | |
| | | | | | | | | |
Total Corporate Bonds (Cost $27,473,157) | | | | | | $ | 32,058,959 | |
| |
U.S. GOVERNMENT OBLIGATIONS — 60.3% | | | | | | |
U.S. Treasury Bills (a) — 52.6% | | | | | | |
0.10%, due 10/27/11 | | $ | 16,400,000 | | | $ | 16,399,672 | |
0.00%, due 11/25/11 | | | 30,000,000 | | | | 29,998,230 | |
| | | | | | | | 46,397,902 | |
| U.S. Treasury Bonds — 3.6% | | | | | | | | |
4.625%, due 02/15/40 | | | 2,700,000 | | | | 3,217,217 | |
| | | | | | | | | |
| U.S. Treasury Notes — 4.1% | | | | | | | | |
2.625%, due 11/15/20 | | | 3,500,000 | | | | 3,656,681 | |
| | | | | | | | | |
Total U.S. Government Obligations (Cost $52,257,073) | | | | | | $ | 53,271,800 | |
| |
| | | | | | |
Pioneer High Income Trust | | | 1,600 | | | $ | 26,000 | |
| Western Asset Managed High Income Fund, Inc. | | | 92,153 | | | | 547,389 | |
Total Closed-End Funds (Cost $508,518) | | | | | | $ | 573,389 | |
| CM Advisors Fixed Income Fund | |
Schedule of Investments (Continued) | |
MONEY MARKET FUNDS — 2.6% | | | | | | |
Wells Fargo Advantage Treasury Plus Money Market Fund - Institutional Class, 0.01% (b) (Cost $2,335,713) | | | 2,335,713 | | | $ | 2,335,713 | |
| | | | | | | | | |
Total Investments at Value — 99.9% (Cost $82,574,461) | | | | | | $ | 88,239,861 | |
| | | | | | | | | |
Other Assets in Excess of Liabilities — 0.1% | | | | | | | 60,195 | |
| | | | | | | | | |
Net Assets — 100.0% | | | | | | $ | 88,300,056 | |
| (a) | Rate shown is the annualized yield at time of purchase, not a coupon rate. |
| (b) | Variable rate security. The rate shown is the 7-day effective yield as of August 31, 2011. |
| See accompanying notes to financial statements. |
| CM Advisors Family of Funds | |
Statements of Assets and Liabilities August 31, 2011 (Unaudited) | |
| | | | | CM Advisors Small Cap Value Fund | |
| ASSETS | | | | | | |
| Investments in securities: | | | | | | |
At cost | | $ | 122,952,785 | | | $ | 6,170,250 | |
At value (Note 2) | | $ | 121,743,719 | | | $ | 5,851,070 | |
Dividends and interest receivable | | | 233,564 | | | | 1,303 | |
Receivable for capital shares sold | | | 50,138 | | | | 2,935 | |
Receivable from Advisor (Note 5) | | | — | | | | 19,581 | |
Other assets | | | 41,537 | | | | 40,537 | |
TOTAL ASSETS | | | 122,068,958 | | | | 5,915,426 | |
| | | | | | | | | |
| LIABILITIES | | | | | | | | |
Payable for investment securities purchased | | | 46,656 | | | | — | |
Payable for capital shares redeemed | | | 8,697 | | | | — | |
Payable to Advisor (Note 5) | | | 111,240 | | | | — | |
Accrued distribution fees (Note 5) | | | 161 | | | | 156 | |
Payable to administrator (Note 5) | | | 16,425 | | | | 8,040 | |
Other accrued expenses and liabilities | | | 15,361 | | | | 7,130 | |
TOTAL LIABILITIES | | | 198,540 | | | | 15,326 | |
| | | | | | | | | |
NET ASSETS | | $ | 121,870,418 | | | $ | 5,900,100 | |
| | | | | | | | | |
| Net assets consist of: | | | | | | | | |
Paid-in capital | | $ | 167,950,792 | | | $ | 6,211,472 | |
Accumulated net investment income (loss) | | | 101,751 | | | | (635 | ) |
Accumulated net realized gains (losses)
from security transactions | | | (44,973,059 | ) | | | 8,443 | |
Net unrealized depreciation on investments | | | (1,209,066 | ) | | | (319,180 | ) |
| | | | | | | | | |
Net assets | | $ | 121,870,418 | | | $ | 5,900,100 | |
| See accompanying notes to financial statements. |
| CM Advisors Family of Funds | |
Statements of Assets and Liabilities August 31, 2011 (Unaudited) (Continued) | |
| | | | | CM Advisors Small Cap Value Fund | |
| PRICING OF CLASS I SHARES | | | | | | |
Net assets applicable to Class I Shares | | $ | 121,688,318 | | | $ | 5,729,771 | |
Class I shares of beneficial interest outstanding
(unlimited number of shares authorized, no par value) | | | 12,774,114 | | | | 653,527 | |
Net asset value, redemption price and
offering price per share (a) | | $ | 9.53 | | | $ | 8.77 | |
| | | | | | | | | |
| PRICING OF CLASS C SHARES | | | | | | | | |
Net assets applicable to Class C Shares | | $ | 91,002 | | | $ | 85,120 | |
Class C shares of beneficial interest outstanding
(unlimited number of shares authorized, no par value) | | | 9,569 | | | | 9,718 | |
Net asset value, redemption price and
offering price per share (a) | | $ | 9.51 | | | $ | 8.76 | |
| | | | | | | | | |
| PRICING OF CLASS R SHARES | | | | | | | | |
Net assets applicable to Class R Shares | | $ | 91,098 | | | $ | 85,209 | |
Class R shares of beneficial interest outstanding
(unlimited number of shares authorized, no par value) | | | 9,569 | | | | 9,718 | |
Net asset value, redemption price and
offering price per share (a) | | $ | 9.52 | | | $ | 8.77 | |
| (a) | Redemption price may differ from the net asset value per share depending upon the length of time the shares are held (Note 2). |
| |
| See accompanying notes to financial statements. |
| CM Advisors Family of Funds | |
Statements of Assets and Liabilities August 31, 2011 (Unaudited) (Continued) | |
| | CM Advisors Opportunity Fund | | | CM Advisors Fixed Income Fund | |
| ASSETS | | | | | | |
| Investments in securities: | | | | | | |
At cost | | $ | 1,568,796 | | | $ | 82,574,461 | |
At value (Note 2) | | $ | 1,548,679 | | | $ | 88,239,861 | |
Dividends and interest receivable | | | 360 | | | | 514,469 | |
Receivable for investment securities sold | | | 49,156 | | | | — | |
Receivable for capital shares sold | | | 2,812 | | | | 76,530 | |
Receivable from Advisor (Note 5) | | | 10,188 | | | | — | |
Other assets | | | 14,673 | | | | 14,782 | |
TOTAL ASSETS | | | 1,625,868 | | | | 88,845,642 | |
| | | | | | | | | |
| LIABILITIES | | | | | | | | |
Payable for investment securities purchased | | | 43,147 | | | | 478,089 | |
Payable to Advisor (Note 5) | | | — | | | | 37,058 | |
Payable to administrator (Note 5) | | | 5,010 | | | | 10,170 | |
Other accrued expenses and liabilities | | | 2,185 | | | | 20,269 | |
TOTAL LIABILITIES | | | 50,342 | | | | 545,586 | |
| | | | | | | | | |
NET ASSETS | | $ | 1,575,526 | | | $ | 88,300,056 | |
| | | | | | | | | |
| Net assets consist of: | | | | | | | | |
Paid-in capital | | $ | 1,629,491 | | | $ | 81,521,857 | |
Accumulated net investment income (loss) | | | (9,018 | ) | | | 264,752 | |
Accumulated net realized gains (losses)
from security transactions | | | (24,830 | ) | | | 848,047 | |
Net unrealized appreciation (depreciation)
on investments | | | (20,117 | ) | | | 5,665,400 | |
| | | | | | | | | |
Net assets | | $ | 1,575,526 | | | $ | 88,300,056 | |
| | | | | | | | | |
Shares of beneficial interest outstanding
(unlimited number of shares authorized, no par value) | | | 162,173 | | | | 7,458,704 | |
Net asset value, redemption price and
offering price per share (a) | | $ | 9.72 | | | $ | 11.84 | |
| (a) | Redemption price may differ from the net asset value per share depending upon the length of time the shares are held (Note 2). |
| |
| See accompanying notes to financial statements. |
| CM Advisors Family of Funds | |
Statements of Operations Six Months Ended August 31, 2011(a) (Unaudited) | |
| | | | | CM Advisors Small Cap Value Fund | |
| INVESTMENT INCOME | | | | | | |
Dividends | | $ | 1,108,445 | | | $ | 9,424 | |
Interest | | | 4,974 | | | | — | |
TOTAL INVESTMENT INCOME | | | 1,113,419 | | | | 9,424 | |
| | | | | | | | | |
| EXPENSES | | | | | | | | |
Investment advisory fees (Note 5) | | | 842,465 | | | | 7,923 | |
Administration fees (Note 5) | | | 53,847 | | | | 9,000 | |
Registration fees, Common | | | 11,646 | | | | 4,471 | |
Registration fees, Class I | | | 4,050 | | | | 4,023 | |
Registration fees, Class C | | | 2,185 | | | | 2,202 | |
Registration fees, Class R | | | 2,220 | | | | 2,202 | |
Fund accounting fees (Note 5) | | | 20,727 | | | | 11,079 | |
Professional fees | | | 27,984 | | | | 5,798 | |
Trustees’ fees and expenses | | | 16,551 | | | | 8,101 | |
Transfer agent fees, Class I (Note 5) | | | 14,377 | | | | 4,500 | |
Transfer agent fees, Class C (Note 5) | | | 2,000 | | | | 2,000 | |
Transfer agent fees, Class R (Note 5) | | | 2,000 | | | | 2,000 | |
Custody and bank service fees | | | 8,843 | | | | 6,583 | |
Printing of shareholder reports | | | 11,087 | | | | 1,470 | |
Postage and supplies | | | 7,027 | | | | 3,268 | |
Insurance expense | | | 5,498 | | | | — | |
Pricing fees | | | 626 | | | | 618 | |
Distributor service fees (Note 5) | | | 954 | | | | 438 | |
Distribution fees, Class C (Note 5) | | | 129 | | | | 125 | |
Distribution fees, Class R (Note 5) | | | 32 | | | | 31 | |
Other expenses | | | 13,397 | | | | 4,917 | |
TOTAL EXPENSES | | | 1,047,645 | | | | 80,749 | |
Advisory fees waived and expenses reimbursed by Advisor (Note 5) | | | (19,329 | ) | | | (56,263 | ) |
| Class I expenses reimbursed by Advisor (Note 5) | | | (8,792 | ) | | | (6,023 | ) |
| Class C expenses reimbursed by Advisor (Note 5) | | | (4,185 | ) | | | (4,202 | ) |
| Class R expenses reimbursed by Advisor (Note 5) | | | (4,220 | ) | | | (4,202 | ) |
NET EXPENSES | | | 1,011,119 | | | | 10,059 | |
| | | | | | | | | |
NET INVESTMENT INCOME (LOSS) | | | 102,300 | | | | (635 | ) |
| (a) | Except for CM Advisors Small Cap Value Fund, which represents the period from commencement of operations (April 15, 2011) through August 31, 2011. |
| |
| See accompanying notes to financial statements. |
| CM Advisors Family of Funds | |
Statements of Operations Six Months Ended August 31, 2011(a) (Unaudited) (Continued) | |
| | | | | CM Advisors Small Cap Value Fund | |
REALIZED AND UNREALIZED GAINS
(LOSSES) ON INVESTMENTS | | | | | | |
Net realized gains from security transactions | | | 1,379,051 | | | | 8,443 | |
Net change in unrealized appreciation
(depreciation) on investments | | | (14,797,242 | ) | | | (319,180 | ) |
| | | | | | | | | |
NET REALIZED AND UNREALIZED
LOSSES ON INVESTMENTS | | | (13,418,191 | ) | | | (310,737 | ) |
| | | | | | | | | |
NET DECREASE IN NET ASSETS
FROM OPERATIONS | | $ | (13,315,891 | ) | | $ | (311,372 | ) |
| (a) | Except for CM Advisors Small Cap Value Fund, which represents the period from commencement of operations (April 15, 2011) through August 31, 2011. |
| |
| See accompanying notes to financial statements. |
| CM Advisors Family of Funds | |
Statements of Operations Six Months Ended August 31, 2011 (Unaudited) (Continued) | |
| | CM Advisors Opportunity Fund | | | CM Advisors Fixed Income Fund | |
| INVESTMENT INCOME | | | | | | |
Dividends | | $ | 953 | | | $ | 11,776 | |
Interest | | | — | | | | 1,138,181 | |
TOTAL INVESTMENT INCOME | | | 953 | | | | 1,149,957 | |
| | | | | | | | | |
| EXPENSES | | | | | | | | |
Investment advisory fees (Note 5) | | | 8,309 | | | | 208,639 | |
Administration fees (Note 5) | | | 12,000 | | | | 33,407 | |
Registration fees, Common | | | 14,649 | | | | 13,499 | |
Fund accounting fees (Note 5) | | | 12,063 | | | | 16,178 | |
Professional fees | | | 10,117 | | | | 14,053 | |
Trustees’ fees and expenses | | | 8,789 | | | | 13,288 | |
Transfer agent fees (Note 5) | | | 6,000 | | | | 9,000 | |
Custody and bank service fees | | | 3,157 | | | | 4,328 | |
Printing of shareholder reports | | | 929 | | | | 1,744 | |
Postage and supplies | | | 1,544 | | | | 2,721 | |
Insurance expense | | | — | | | | 3,239 | |
Pricing fees | | | 560 | | | | 4,497 | |
Distributor service fees (Note 5) | | | 854 | | | | 1,054 | |
Other expenses | | | 4,730 | | | | 15,450 | |
TOTAL EXPENSES | | | 83,701 | | | | 341,097 | |
Advisory fees waived and expenses reimbursed
by Advisor (Note 5) | | | (73,730 | ) | | | — | |
NET EXPENSES | | | 9,971 | | | | 341,097 | |
| | | | | | | | | |
NET INVESTMENT INCOME (LOSS) | | | (9,018 | ) | | | 808,860 | |
| | | | | | | | | |
REALIZED AND UNREALIZED GAINS
(LOSSES) ON INVESTMENTS | | | | | | | | |
| Net realized gains (losses) from security transactions | | | (24,830 | ) | | | 848,047 | |
Net change in unrealized appreciation
(depreciation) on investments | | | (28,393 | ) | | | 1,470,836 | |
| | | | | | | | | |
NET REALIZED AND UNREALIZED GAINS
(LOSSES) ON INVESTMENTS | | | (53,223 | ) | | | 2,318,883 | |
| | | | | | | | | |
NET INCREASE (DECREASE) IN NET ASSETS
FROM OPERATIONS | | $ | (62,241 | ) | | $ | 3,127,743 | |
| See accompanying notes to financial statements. |
| CM Advisors Fund | |
Statements of Changes in Net Assets | |
| | Six Months Ended August 31, 2011 (Unaudited) | | | Year Ended February 28, 2011 | |
| FROM OPERATIONS | | | | | | |
Net investment income | | $ | 102,300 | | | $ | 524,524 | |
Net realized gains from security transactions | | | 1,379,051 | | | | 4,685,961 | |
Net change in unrealized appreciation
(depreciation) on investments | | | (14,797,242 | ) | | | 17,977,299 | |
| Net increase (decrease) in net assets from operations | | | (13,315,891 | ) | | | 23,187,784 | |
| | | | | | | | | |
| DISTRIBUTIONS TO SHAREHOLDERS | | | | | | | | |
| Distributions from net investment income, Class I | | | (122,484 | ) | | | (490,642 | ) |
| | | | | | | | | |
| FROM CAPITAL SHARE TRANSACTIONS (NOTE 6) | | | | | | | | |
| CLASS I | | | | | | | | |
Proceeds from shares sold | | | 6,882,424 | | | | 14,829,094 | |
Net asset value of shares issued in reinvestment
of distributions to shareholders | | | 116,719 | | | | 470,816 | |
| Proceeds from redemption fees collected (Note 2) | | | 5,127 | | | | 8,999 | |
Payments for shares redeemed | | | (14,554,204 | ) | | | (41,536,933 | ) |
Net decrease in net assets from Class I
share transactions | | | (7,549,934 | ) | | | (26,228,024 | ) |
| | | | | | | | | |
| CLASS C | | | | | | | | |
Proceeds from shares sold | | | 100,000 | | | | — | |
| | | | | | | | | |
| CLASS R | | | | | | | | |
Proceeds from shares sold | | | 100,000 | | | | — | |
| | | | | | | | | |
TOTAL DECREASE IN NET ASSETS | | | (20,788,309 | ) | | | (3,530,882 | ) |
| | | | | | | | | |
| NET ASSETS | | | | | | | | |
Beginning of period | | | 142,658,727 | | | | 146,189,609 | |
End of period | | $ | 121,870,418 | | | $ | 142,658,727 | |
| | | | | | | | | |
| ACCUMULATED NET INVESTMENT INCOME | | $ | 101,751 | | | $ | 121,935 | |
| See accompanying notes to financial statements. |
| CM Advisors Small Cap Value Fund | |
Statement of Changes in Net Assets | |
| | Period Ended August 31, 2011(a) (Unaudited) | |
| FROM OPERATIONS | | | |
| Net investment loss | | $ | (635 | ) |
| Net realized gains from security transactions | | | 8,443 | |
| Net change in unrealized appreciation (depreciation) on investments | | | (319,180 | ) |
| Net decrease in net assets from operations | | | (311,372 | ) |
| | | | | |
| FROM CAPITAL SHARE TRANSACTIONS (NOTE 6) | | | | |
| CLASS I | | | | |
| Proceeds from shares sold | | | 6,011,472 | |
| | | | | |
| CLASS C | | | | |
| Proceeds from shares sold | | | 100,000 | |
| | | | | |
| CLASS R | | | | |
| Proceeds from shares sold | | | 100,000 | |
| | | | | |
| TOTAL INCREASE IN NET ASSETS | | | 5,900,100 | |
| | | | | |
| NET ASSETS | | | | |
| Beginning of period | | | — | |
| End of period | | $ | 5,900,100 | |
| | | | | |
| ACCUMULATED NET INVESTMENT LOSS | | $ | (635 | ) |
| (a) | Represents the period from commencement of operations (April 15, 2011) through August 31, 2011. |
| |
| See accompanying notes to financial statements. |
| CM Advisors Opportunity Fund | |
Statements of Changes in Net Assets | |
| | Six Months Ended August 31, 2011 (Unaudited) | | | Period Ended February 28, 2011(a) | |
| FROM OPERATIONS | | | | | | |
Net investment loss | | $ | (9,018 | ) | | $ | (3,917 | ) |
| Net realized gains (losses) from security transactions | | | (24,830 | ) | | | 54,979 | |
Net change in unrealized appreciation
(depreciation) on investments | | | (28,393 | ) | | | 8,276 | |
| Net increase (decrease) in net assets from operations | | | (62,241 | ) | | | 59,338 | |
| | | | | | | | | |
| DISTRIBUTIONS TO SHAREHOLDERS | | | | | | | | |
Distributions from net realized gains
from security transactions | | | (51,062 | ) | | | — | |
| | | | | | | | | |
| FROM CAPITAL SHARE TRANSACTIONS | | | | | | | | |
Proceeds from shares sold | | | 500,673 | | | | 1,078,340 | |
Net asset value of shares issued in reinvestment
of distributions to shareholders | | | 50,493 | | | | — | |
Payments for shares redeemed | | | — | | | | (15 | ) |
Net increase in net assets from capital
share transactions | | | 551,166 | | | | 1,078,325 | |
| | | | | | | | | |
TOTAL INCREASE IN NET ASSETS | | | 437,863 | | | | 1,137,663 | |
| | | | | | | | | |
| NET ASSETS | | | | | | | | |
Beginning of period | | | 1,137,663 | | | | — | |
End of period | | $ | 1,575,526 | | | $ | 1,137,663 | |
| | | | | | | | | |
| ACCUMULATED NET INVESTMENT LOSS | | $ | (9,018 | ) | | $ | — | |
| | | | | | | | | |
| CAPITAL SHARE ACTIVITY | | | | | | | | |
Shares sold | | | 49,841 | | | | 107,574 | |
Shares reinvested | | | 4,759 | | | | — | |
Shares redeemed | | | — | | | | (1 | ) |
Net increase in shares outstanding | | | 54,600 | | | | 107,573 | |
Shares outstanding, beginning of period | | | 107,573 | | | | — | |
Shares outstanding, end of period | | | 162,173 | | | | 107,573 | |
| (a) | Represents the period from commencement of operations (November 1, 2010) through February 28, 2011. |
| |
| See accompanying notes to financial statements. |
| CM Advisors Fixed Income Fund | |
Statements of Changes in Net Assets | |
| | Six Months Ended August 31, 2011 (Unaudited) | | | Year Ended February 28, 2011 | |
| FROM OPERATIONS | | | | | | |
Net investment income | | $ | 808,860 | | | $ | 1,371,859 | |
Net realized gains from security transactions | | | 848,047 | | | | 701,912 | |
Net change in unrealized appreciation
(depreciation) on investments | | | 1,470,836 | | | | 1,418,852 | |
Net increase in net assets from operations | | | 3,127,743 | | | | 3,492,623 | |
| | | | | | | | | |
| DISTRIBUTIONS TO SHAREHOLDERS | | | | | | | | |
From net investment income | | | (777,426 | ) | | | (1,366,350 | ) |
| From net realized gains from security transactions | | | (3,802 | ) | | | (698,110 | ) |
| Decrease in net assets from distributions to shareholders | | | (781,228 | ) | | | (2,064,460 | ) |
| | | | | | | | | |
| FROM CAPITAL SHARE TRANSACTIONS | | | | | | | | |
Proceeds from shares sold | | | 11,232,004 | | | | 38,662,676 | |
Net asset value of shares issued in reinvestment
of distributions to shareholders | | | 693,312 | | | | 1,817,475 | |
| Proceeds from redemption fees collected (Note 2) | | | 660 | | | | 19,539 | |
Payments for shares redeemed | | | (5,907,882 | ) | | | (8,416,481 | ) |
Net increase in net assets from capital
share transactions | | | 6,018,094 | | | | 32,083,209 | |
| | | | | | | | | |
TOTAL INCREASE IN NET ASSETS | | | 8,364,609 | | | | 33,511,372 | |
| | | | | | | | | |
| NET ASSETS | | | | | | | | |
Beginning of period | | | 79,935,447 | | | | 46,424,075 | |
End of period | | $ | 88,300,056 | | | $ | 79,935,447 | |
| | | | | | | | | |
| ACCUMULATED NET INVESTMENT INCOME | | $ | 264,752 | | | $ | 233,318 | |
| | | | | | | | | |
| CAPITAL SHARE ACTIVITY | | | | | | | | |
Shares sold | | | 960,585 | | | | 3,353,444 | |
Shares reinvested | | | 60,279 | | | | 159,340 | |
Shares redeemed | | | (507,517 | ) | | | (734,395 | ) |
Net increase in shares outstanding | | | 513,347 | | | | 2,778,389 | |
Shares outstanding, beginning of period | | | 6,945,357 | | | | 4,166,968 | |
Shares outstanding, end of period | | | 7,458,704 | | | | 6,945,357 | |
| See accompanying notes to financial statements. |
CM Advisors Fund Class I | |
| |
Per share data for a Class I share outstanding throughout each period: | |
| | | Six Months Ended August 31, 2011 (Unaudited) | | | | |
| | | | | | | | | | | | | | | |
Net asset value at
beginning of period | | $ | 10.56 | | | $ | 8.95 | | | $ | 5.71 | | | $ | 10.25 | | | $ | 12.75 | | | $ | 12.11 | |
| | | | | | | | | | | | | | | | | | | | | | | | | |
Income (loss) from
investment operations: | | | | | | | | | | | | | | | | | | | | | | | | |
Net investment income | | | 0.01 | | | | 0.04 | | | | 0.03 | | | | 0.10 | | | | 0.14 | | | | 0.19 | |
Net realized and unrealized gains (losses) on
investments | | | (1.03 | ) | | | 1.61 | | | | 3.24 | | | | (4.26 | ) | | | (2.19 | ) | | | 1.00 | |
Total from investment
operations | | | (1.02 | ) | | | 1.65 | | | | 3.27 | | | | (4.16 | ) | | | (2.05 | ) | | | 1.19 | |
| | | | | | | | | | | | | | | | | | | | | | | | | |
| Less distributions: | | | | | | | | | | | | | | | | | | | | | | | | |
Dividends from net
investment income | | | (0.01 | ) | | | (0.04 | ) | | | (0.03 | ) | | | (0.10 | ) | | | (0.16 | ) | | | (0.19 | ) |
Distributions from net
realized gains | | | — | | | | — | | | | — | | | | (0.28 | ) | | | (0.29 | ) | | | (0.36 | ) |
Total distributions | | | (0.01 | ) | | | (0.04 | ) | | | (0.03 | ) | | | (0.38 | ) | | | (0.45 | ) | | | (0.55 | ) |
| | | | | | | | | | | | | | | | | | | | | | | | | |
Proceeds from redemption
fees collected (Note 2) | | | 0.00 | (a) | | | 0.00 | (a) | | | 0.00 | (a) | | | 0.00 | (a) | | | 0.00 | (a) | | | 0.00 | (a) |
| | | | | | | | | | | | | | | | | | | | | | | | | |
Net asset value at
end of period | | $ | 9.53 | | | $ | 10.56 | | | $ | 8.95 | | | $ | 5.71 | | | $ | 10.25 | | | $ | 12.75 | |
| | | | | | | | | | | | | | | | | | | | | | | | | |
Total return (b) | | | (9.68% | )(c) | | | 18.43% | | | | 57.39% | | | | (41.21% | ) | | | (16.43% | ) | | | 9.88% | |
| | | | | | | | | | | | | | | | | | | | | | | | | |
| Ratios and supplemental data: | | | | | | | | | | | | | | | | | | | | | | | | |
Net assets at end
of period (000's) | | $ | 121,688 | | | $ | 142,659 | | | $ | 146,190 | | | $ | 103,367 | | | $ | 209,111 | | | $ | 268,861 | |
| | | | | | | | | | | | | | | | | | | | | | | | | |
Ratio of total expenses to
average net assets | | | 1.54% | (e) | | | 1.52% | | | | 1.50% | | | | 1.48% | | | | 1.46% | | | | 1.50% | |
| | | | | | | | | | | | | | | | | | | | | | | | | |
Ratio of net expenses to
average net assets (d) | | | 1.50% | (e) | | | 1.50% | | | | 1.49% | | | | 1.48% | | | | 1.46% | | | | 1.50% | |
| | | | | | | | | | | | | | | | | | | | | | | | | |
Ratio of net investment income
to average net assets (d) | | | 0.15% | (e) | | | 0.39% | | | | 0.41% | | | | 1.09% | | | | 1.07% | | | | 1.70% | |
| | | | | | | | | | | | | | | | | | | | | | | | | |
Portfolio turnover rate | | | 15% | (c) | | | 15% | | | | 19% | | | | 23% | | | | 66% | | | | 22% | |
| (a) | Amount rounds to less than $0.01 per share. |
| (b) | Total return is a measure of the change in value of an investment in the Fund over the period covered, which assumes any dividends or capital gains distributions are reinvested in shares of the Fund. The returns shown do not reflect the deduction of taxes a shareholder would pay on Fund distributions or the redemption of Fund shares. |
| (c) | Not annualized. |
| (d) | Ratio was determined after investment advisory fee waivers and/or expense reimbursements. |
| (e) | Annualized. |
| |
| See accompanying notes to financial statements. |
CM Advisors Fund Class C | |
| |
Per share data for a Class C share outstanding throughout the period: | |
| | Period Ended August 31, 2011(a) (Unaudited) | |
| Net asset value at beginning of period | | $ | 10.45 | |
| | | | | |
| Loss from investment operations: | | | | |
| Net investment loss | | | (0.00 | )(b) |
| Net realized and unrealized losses on investments | | | (0.94 | ) |
| Total from investment operations | | | (0.94 | ) |
| | | | | |
| Net asset value at end of period | | $ | 9.51 | |
| | | | | |
Total return (c) | | | (9.00% | )(d) |
| | | | | |
| Ratios and supplemental data: | | | | |
| Net assets at end of period (000’s) | | $ | 91 | |
| | | | | |
| Ratio of total expenses to average net assets | | | 35.03% | (e) |
| | | | | |
Ratio of net expenses to average net assets (f) | | | 2.50% | (e) |
| | | | | |
Ratio of net investment loss to average net assets (f) | | | (0.27% | )(e) |
| | | | | |
| Portfolio turnover rate | | | 15% | (d)(g) |
| (a) | Represents the period from commencement of operations (July 11, 2011) through August 31, 2011. |
| (b) | Amount rounds to less than $0.01 per share. |
| (c) | Total return is a measure of the change in value of an investment in the Fund over the period covered, which assumes any dividends or capital gains distributions are reinvested in shares of the Fund. The return shown does not reflect the deduction of taxes a shareholder would pay on Fund distributions or the redemption of Fund shares. |
| (d) | Not annualized. |
| (e) | Annualized. |
| (f) | Ratio was determined after investment advisory fee waivers and expense reimbursements. |
| (g) | Represents the six months ended August 31, 2011. |
| |
| See accompanying notes to financial statements. |
CM Advisors Fund Class R | |
| |
Per share data for a Class R share outstanding throughout the period: | |
| | Period Ended August 31, 2011(a) (Unaudited) | |
| Net asset value at beginning of period | | $ | 10.45 | |
| | | | | |
| Income (loss) from investment operations: | | | | |
| Net investment income | | | 0.01 | |
| Net realized and unrealized losses on investments | | | (0.94 | ) |
| Total from investment operations | | | (0.93 | ) |
| | | | | |
| Net asset value at end of period | | $ | 9.52 | |
| | | | | |
Total return (b) | | | (8.90% | )(c) |
| | | | | |
| Ratios and supplemental data: | | | | |
| Net assets at end of period (000’s) | | $ | 91 | |
| | | | | |
| Ratio of total expenses to average net assets | | | 34.54% | (d) |
| | | | | |
Ratio of net expenses to average net assets (e) | | | 1.75% | (d) |
| | | | | |
Ratio of net investment income to average net assets (e) | | | 0.47% | (d) |
| | | | | |
| Portfolio turnover rate | | | 15% | (c)(f) |
| (a) | Represents the period from commencement of operations (July 11, 2011) through August 31, 2011. |
| (b) | Total return is a measure of the change in value of an investment in the Fund over the period covered, which assumes any dividends or capital gains distributions are reinvested in shares of the Fund. The return shown does not reflect the deduction of taxes a shareholder would pay on Fund distributions or the redemption of Fund shares. |
| (c) | Not annualized. |
| (d) | Annualized. |
| (e) | Ratio was determined after investment advisory fee waivers and expense reimbursements. |
| (f) | Represents the six months ended August 31, 2011. |
| |
| See accompanying notes to financial statements. |
CM Advisors Small Cap Value Fund Class I | |
| |
Per share data for a Class I share outstanding throughout the period: | |
| | Period Ended August 31, 2011(a) (Unaudited) | |
| Net asset value at beginning of period | | $ | 10.00 | |
| | | | | |
| Loss from investment operations: | | | | |
| Net investment loss | | | (0.00 | )(b) |
| Net realized and unrealized losses on investments | | | (1.23 | ) |
| Total from investment operations | | | (1.23 | ) |
| | | | | |
| Net asset value at end of period | | $ | 8.77 | |
| | | | | |
Total return (c) | | | (12.30% | )(d) |
| | | | | |
| Ratios and supplemental data: | | | | |
| Net assets at end of period (000’s) | | $ | 5,730 | |
| | | | | |
| Ratio of total expenses to average net assets | | | 9.10% | (e) |
| | | | | |
Ratio of net expenses to average net assets (f) | | | 1.25% | (e) |
| | | | | |
Ratio of net investment loss to average net assets (f) | | | (0.06% | )(e) |
| | | | | |
| Portfolio turnover rate | | | 10% | (d) |
| (a) | Represents the period from commencement of operations (April 15, 2011) through August 31, 2011. |
| (b) | Amount rounds to less than $0.01 per share. |
| (c) | Total return is a measure of the change in value of an investment in the Fund over the period covered, which assumes any dividends or capital gains distributions are reinvested in shares of the Fund. The return shown does not reflect the deduction of taxes a shareholder would pay on Fund distributions or the redemption of Fund shares. |
| (d) | Not annualized. |
| (e) | Annualized. |
| (f) | Ratio was determined after investment advisory fee waivers and expense reimbursements. |
| |
| See accompanying notes to financial statements. |
CM Advisors Small Cap Value Fund Class C | |
| |
Per share data for a Class C share outstanding throughout the period: | |
| | Period Ended August 31, 2011(a) (Unaudited) | |
| Net asset value at beginning of period | | $ | 10.29 | |
| | | | | |
| Loss from investment operations: | | | | |
| Net investment loss | | | (0.01 | ) |
| Net realized and unrealized losses on investments | | | (1.52 | ) |
| Total from investment operations | | | (1.53 | ) |
| | | | | |
| Net asset value at end of period | | $ | 8.76 | |
| | | | | |
Total return (b) | | | (14.87% | )(c) |
| | | | | |
| Ratios and supplemental data: | | | | |
| Net assets at end of period (000’s) | | $ | 85 | |
| | | | | |
| Ratio of total expenses to average net assets | | | 35.87% | (d) |
| | | | | |
Ratio of net expenses to average net assets (e) | | | 2.25% | (d) |
| | | | | |
Ratio of net investment loss to average net assets (e) | | | (1.13% | )(d) |
| | | | | |
| Portfolio turnover rate | | | 10% | (c)(f) |
| (a) | Represents the period from commencement of operations (July 11, 2011) through August 31, 2011. |
| (b) | Total return is a measure of the change in value of an investment in the Fund over the period covered, which assumes any dividends or capital gains distributions are reinvested in shares of the Fund. The return shown does not reflect the deduction of taxes a shareholder would pay on Fund distributions or the redemption of Fund shares. |
| (c) | Not annualized. |
| (d) | Annualized. |
| (e) | Ratio was determined after investment advisory fee waivers and expense reimbursements. |
| (f) | Represents the period from April 15, 2011 (the commencement of operations of Class I shares) through August 31, 2011. |
| |
| See accompanying notes to financial statements. |
CM Advisors Small Cap Value Fund Class R | |
| |
Per share data for a Class R share outstanding throughout the period: | |
| | Period Ended August 31, 2011(a) (Unaudited) | |
| Net asset value at beginning of period | | $ | 10.29 | |
| | | | | |
| Loss from investment operations: | | | | |
| Net investment loss | | | (0.01 | ) |
| Net realized and unrealized losses on investments | | | (1.51 | ) |
| Total from investment operations | | | (1.52 | ) |
| | | | | |
| Net asset value at end of period | | $ | 8.77 | |
| | | | | |
Total return (b) | | | (14.77% | )(c) |
| | | | | |
| Ratios and supplemental data: | | | | |
| Net assets at end of period (000’s) | | $ | 85 | |
| | | | | |
| Ratio of total expenses to average net assets | | | 35.11% | (d) |
| | | | | |
Ratio of net expenses to average net assets (e) | | | 1.50% | (d) |
| | | | | |
Ratio of net investment loss to average net assets (e) | | | (0.39% | )(d) |
| | | | | |
| Portfolio turnover rate | | | 10% | (c)(f) |
| (a) | Represents the period from commencement of operations (July 11, 2011) through August 31, 2011. |
| (b) | Total return is a measure of the change in value of an investment in the Fund over the period covered, which assumes any dividends or capital gains distributions are reinvested in shares of the Fund. The return shown does not reflect the deduction of taxes a shareholder would pay on Fund distributions or the redemption of Fund shares. |
| (c) | Not annualized. |
| (d) | Annualized. |
| (e) | Ratio was determined after investment advisory fee waivers and expense reimbursements. |
| (f) | Represents the period from April 15, 2011 (the commencement of operations of Class I shares) through August 31, 2011. |
| |
| See accompanying notes to financial statements. |
| CM Advisors Opportunity Fund | |
| |
Per share data for a share outstanding throughout each period: | |
| | Six Months Ended August 31, 2011 (Unaudited) | | | Period Ended February 28, 2011(a) | |
| Net asset value at beginning of period | | $ | 10.58 | | | $ | 10.00 | |
| | | | | | | | | |
| Income (loss) from investment operations: | | | | | | | | |
| Net investment loss | | | (0.06 | ) | | | (0.04 | ) |
| Net realized and unrealized gains (losses) on investments | | | (0.33 | ) | | | 0.62 | |
| Total from investment operations | | | (0.39 | ) | | | 0.58 | |
| | | | | | | | | |
| Less distributions: | | | | | | | | |
| Distributions from net realized gains | | | (0.47 | ) | | | — | |
| | | | | | | | | |
| Net asset value at end of period | | $ | 9.72 | | | $ | 10.58 | |
| | | | | | | | | |
Total return (b) | | | (4.07% | )(c) | | | 5.80% | (c) |
| | | | | | | | | |
| Ratios and supplemental data: | | | | | | | | |
| Net assets at end of period (000’s) | | $ | 1,576 | | | $ | 1,138 | |
| | | | | | | | | |
| Ratio of total expenses to average net assets | | | 12.57% | (d) | | | 15.72% | (d) |
| | | | | | | | | |
Ratio of net expenses to average net assets (e) | | | 1.50% | (d) | | | 1.50% | (d) |
| | | | | | | | | |
Ratio of net investment loss to average net assets (e) | | | (1.35% | )(d) | | | (1.11% | )(d) |
| | | | | | | | | |
| Portfolio turnover rate | | | 492% | (c) | | | 178% | (c) |
| (a) | Represents the period from commencement of operations (November 1, 2010) through February 28, 2011. |
| (b) | Total return is a measure of the change in value of an investment in the Fund over the period covered, which assumes any dividends or capital gains distributions are reinvested in shares of the Fund. The returns shown do not reflect the deduction of taxes a shareholder would pay on Fund distributions or the redemption of Fund shares. |
| (c) | Not annualized. |
| (d) | Annualized. |
| (e) | Ratio was determined after investment advisory fee waivers and expense reimbursements. |
| |
| See accompanying notes to financial statements. |
| CM Advisors Fixed Income Fund | |
| |
Per share data for a share outstanding throughout each period: | |
| | | Six Months Ended August 31, 2011 (Unaudited) | | | | |
| | | | | | | | | | | | | | | |
Net asset value at
beginning of period | | $ | 11.51 | | | $ | 11.14 | | | $ | 9.99 | | | $ | 11.01 | | | $ | 10.66 | | | $ | 10.00 | |
| | | | | | | | | | | | | | | | | | | | | | | | | |
Income (loss) from
investment operations: | | | | | | | | | | | | | | | | | | | | | | | | |
Net investment income | | | 0.11 | | | | 0.24 | | | | 0.32 | | | | 0.26 | | | | 0.25 | | | | 0.29 | |
Net realized and unrealized gains (losses) on
investments | | | 0.33 | | | | 0.49 | | | | 1.19 | | | | (0.38 | ) | | | 0.57 | | | | 0.84 | |
Total from investment
operations | | | 0.44 | | | | 0.73 | | | | 1.51 | | | | (0.12 | ) | | | 0.82 | | | | 1.13 | |
| | | | | | | | | | | | | | | | | | | | | | | | | |
| Less distributions: | | | | | | | | | | | | | | | | | | | | | | | | |
Dividends from net
investment income | | | (0.11 | ) | | | (0.26 | ) | | | (0.32 | ) | | | (0.21 | ) | | | (0.25 | ) | | | (0.29 | ) |
Distributions from net
realized gains | | | (0.00 | )(b) | | | (0.10 | ) | | | (0.04 | ) | | | (0.70 | ) | | | (0.22 | ) | | | — | |
In excess of net
investment income | | | — | | | | — | | | | — | | | | — | | | | — | | | | (0.18 | ) |
Total distributions | | | (0.11 | ) | | | (0.36 | ) | | | (0.36 | ) | | | (0.91 | ) | | | (0.47 | ) | | | (0.47 | ) |
| | | | | | | | | | | | | | | | | | | | | | | | | |
Proceeds from redemption
fees collected (Note 2) | | | 0.00 | (b) | | | 0.00 | (b) | | | 0.00 | (b) | | | 0.01 | | | | 0.00 | (b) | | | 0.00 | (b) |
| | | | | | | | | | | | | | | | | | | | | | | | | |
Net asset value at
end of period | | $ | 11.84 | | | $ | 11.51 | | | $ | 11.14 | | | $ | 9.99 | | | $ | 11.01 | | | $ | 10.66 | |
| | | | | | | | | | | | | | | | | | | | | | | | | |
Total return (c) | | | 3.85% | (d) | | | 6.63% | | | | 15.45% | | | | (0.60% | ) | | | 8.05% | | | | 11.39% | (d) |
| | | | | | | | | | | | | | | | | | | | | | | | | |
| Ratios and supplemental data: | | | | | | | | | | | | | | | | | | | | | | | | |
Net assets at end
of period (000’s) | | $ | 88,300 | | | $ | 79,935 | | | $ | 46,424 | | | $ | 19,417 | | | $ | 12,825 | | | $ | 3,126 | |
| | | | | | | | | | | | | | | | | | | | | | | | | |
Ratio of total expenses to
average net assets | | | 0.82% | (e) | | | 0.90% | | | | 1.06% | | | | 1.54% | | | | 2.28% | | | | 7.28% | (e) |
| | | | | | | | | | | | | | | | | | | | | | | | | |
Ratio of net expenses to
average net assets (f) | | | 0.82% | (e) | | | 0.90% | | | | 1.06% | | | | 1.50% | | | | 1.50% | | | | 1.50% | (e) |
| | | | | | | | | | | | | | | | | | | | | | | | | |
Ratio of net investment income to average net assets (f) | | | 1.94% | (e) | | | 2.13% | | | | 3.31% | | | | 2.77% | | | | 2.79% | | | | 3.28% | (e) |
| | | | | | | | | | | | | | | | | | | | | | | | | |
Portfolio turnover rate | | | 6% | (d) | | | 21% | | | | 0% | | | | 37% | | | | 188% | | | | 0% | |
| (a) | Represents the period from commencement of operations (March 24, 2006) through February 28, 2007. |
| (b) | Amount rounds to less than $0.01 per share. |
| (c) | Total return is a measure of the change in value of an investment in the Fund over the period covered, which assumes any dividends or capital gains distributions are reinvested in shares of the Fund. The returns shown do not reflect the deduction of taxes a shareholder would pay on Fund distributions or the redemption of Fund shares. |
| (d) | Not annualized. |
| (e) | Annualized. |
| (f) | Ratio was determined after investment advisory fee waivers and/or expense reimbursements. |
| |
| See accompanying notes to financial statements. |
| CM Advisors Family of Funds |
Notes to Financial Statements August 31, 2011 (Unaudited) |
1. Organization
CM Advisors Fund, CM Advisors Small Cap Value Fund, CM Advisors Opportunity Fund and CM Advisors Fixed Income Fund (collectively the “Funds” and individually a “Fund”) are each a no-load series of CM Advisors Family of Funds (the “Trust”), which was organized as a Delaware statutory trust and is registered under the Investment Company Act of 1940 (the “1940 Act”) as an open-end management investment company.
CM Advisors Fund commenced operations on May 13, 2003. The investment objective of the Fund is long-term growth of capital.
CM Advisors Small Cap Value Fund commenced operations on April 15, 2011. The investment objective of the Fund is long-term growth of capital.
CM Advisors Opportunity Fund commenced operations on November 1, 2010. The investment objective of the Fund is long-term growth of capital.
CM Advisors Fixed Income Fund commenced operations on March 24, 2006. The investment objective of the Fund is to preserve capital and maximize total return.
CM Advisors Fund and CM Advisors Small Cap Value Fund currently offer three classes of shares: Class I shares (sold without any sales loads and distribution and/or service fees), Class C shares (sold without any sales loads but subject to a distribution and/or service fee of up to 1.00% of the average daily net assets attributable to Class C shares) and Class R shares (sold without any sales loads but subject to a distribution and/or service fee of up to 0.25% of the average daily net assets attributable to Class R shares). Each class of shares represents an interest in the same assets of the Funds, has the same rights and is identical in all material respects except that (1) the classes bear differing levels of distribution fees, if any; (2) certain other class specific expenses will be borne solely by the class to which such expenses are attributable; (3) each class has exclusive voting rights with respect to matters relating to its own distribution arrangements; and (4) Class I shares require a higher minimum initial investment.
2. Significant Accounting Policies
The following is a summary of the Funds’ significant accounting policies. These policies are in conformity with accounting principles generally accepted in the United States of America (“GAAP”).
Investment Valuation – The Funds’ portfolio securities are generally valued at their market values determined on the basis of available market quotations as of the close of regular trading on the New York Stock Exchange (typically 4:00 p.m. Eastern time). Securities listed on an exchange or quoted on a national market system are valued at the last sales price. Securities which are quoted by NASDAQ are valued at the NASDAQ Official Closing Price. Securities traded in the over-the-counter market and listed securities for which no sale was reported on that date are valued at the most recent bid price. It is expected that fixed income securities will ordinarily be traded in the over-the-counter market. Securities and assets for which representative market quotations are not readily available (e.g., if the exchange on which the portfolio security is principally traded closes early or if trading of the particular portfolio security is halted during the day and does not resume prior to the Funds’ net asset value calculations) or which cannot be accurately valued using the Funds’ normal pricing procedures are valued at fair value as determined in good faith under policies approved by the Board of Trustees and will be
| CM Advisors Family of Funds |
Notes to Financial Statements (Continued) |
classified as Level 2 or 3 within the fair value hierarchy (see below). A portfolio security’s “fair value” price may differ from the price next available for that portfolio security using the Funds’ normal pricing procedures. Instruments with maturities of 60 days or less may be valued at amortized cost, which approximates market value.
GAAP establishes a single authoritative definition of fair value, sets out a framework for measuring fair value and requires additional disclosures about fair value measurements.
Various inputs are used in determining the value of the Funds’ investments. These inputs are summarized in the three broad levels listed below:
• Level 1 – quoted prices in active markets for identical securities
• Level 2 – other significant observable inputs
• Level 3 – significant unobservable inputs
The inputs or methodology used for valuing securities are not necessarily an indication of the risks associated with investing in those securities. The inputs used to measure the fair value of a particular security may fall into different levels of the fair value hierarchy. In such cases, for disclosure purposes, the level in the fair value hierarchy within which the fair value measurement of that security falls in its entirety is determined based on the lowest level input that is significant to the fair value measurement.
The following is a summary of the inputs used to value the Funds’ investments as of August 31, 2011 by security type:
| |
| | | | | | | | | | | | |
Common Stocks | | $ | 109,150,750 | | | $ | — | | | $ | — | | | $ | 109,150,750 | |
U.S. Government Obligations | | | — | | | | 4,999,900 | | | | — | | | | 4,999,900 | |
Warrants | | | 158,015 | | | | — | | | | — | | | | 158,015 | |
Money Market Funds | | | 7,435,054 | | | | — | | | | — | | | | 7,435,054 | |
Total | | $ | 116,743,819 | | | $ | 4,999,900 | | | $ | — | | | $ | 121,743,719 | |
CM Advisors Small Cap Value Fund | |
| | | | | | | | | | | | |
Common Stocks | | $ | 5,706,321 | | | $ | — | | | $ | — | | | $ | 5,706,321 | |
Money Market Funds | | | 144,749 | | | | — | | | | — | | | | 144,749 | |
Total | | $ | 5,851,070 | | | $ | — | | | $ | — | | | $ | 5,851,070 | |
CM Advisors Opportunity Fund | |
| | | | | | | | | | | | |
Common Stocks | | $ | 653,560 | | | $ | — | | | $ | — | | | $ | 653,560 | |
Closed-End Funds | | | 32,256 | | | | — | | | | — | | | | 32,256 | |
Exchange-Traded Notes | | | 70,084 | | | | — | | | | — | | | | 70,084 | |
Money Market Funds | | | 792,779 | | | | — | | | | — | | | | 792,779 | |
Total | | $ | 1,548,679 | | | $ | — | | | $ | — | | | $ | 1,548,679 | |
| CM Advisors Family of Funds |
Notes to Financial Statements (Continued) |
CM Advisors Fixed Income Fund | |
| | | | | | | | | | | | |
Corporate Bonds | | $ | — | | | $ | 32,058,959 | | | $ | — | | | $ | 32,058,959 | |
U.S. Government Obligations | | | — | | | | 53,271,800 | | | | — | | | | 53,271,800 | |
Closed-End Funds | | | 573,389 | | | | — | | | | — | | | | 573,389 | |
Money Market Funds | | | 2,335,713 | | | | — | | | | — | | | | 2,335,713 | |
Total | | $ | 2,909,102 | | | $ | 85,330,759 | | | $ | — | | | $ | 88,239,861 | |
Refer to CM Advisors Fund’s, CM Advisors Small Cap Value Fund’s and CM Advisors Opportunity Fund’s Schedules of Investments for a listing of the common stocks valued using Level 1 inputs by industry type. Refer to CM Advisors Fixed Income Fund’s Schedule of Investments for a listing of the corporate bonds valued using Level 2 inputs by industry type.
During the period ended August 31, 2011, the Funds did not have any significant transfers in and out of any Level. The Funds did not hold any derivative instruments or assets or liabilities that were measured at fair value on a recurring basis using significant unobservable inputs (Level 3) during the period ended as of August 31, 2011.
Share Valuation and Redemption Fees — The net asset value per share of each class of shares of CM Advisors Fund and CM Advisors Small Cap Value Fund is calculated daily by dividing the total value of the assets attributable to that class, less liabilities attributable to that class, by the number of shares of that class outstanding. The net asset value per share of CM Advisors Opportunity Fund and CM Advisors Fixed Income Fund is calculated on each business day by dividing the total value of each Fund’s assets, less liabilities, by the number of shares outstanding. The offering price and redemption price per share of each Class and each Fund is equal to the net asset value per share, except that shares of each Class and each Fund are subject to a redemption fee of 1% payable to the applicable Fund, if redeemed within 180 days of the date of purchase. During the periods ended August 31, 2011 and February 28, 2011, proceeds from redemption fees totaled $5,127 and $8,999, respectively, for Class I shares of CM Advisors Fund and $660 and $19,539, respectively, for CM Advisors Fixed Income Fund. There were no redemption fees for Class C and Class R shares of CM Advisors Fund, any Class of shares of CM Advisors Small Cap Value Fund or shares of CM Advisors Opportunity Fund for the period ended August 31, 2011.
Investment Transactions and Investment Income – Investment transactions are accounted for on trade date. Dividend income is recorded on the ex-dividend date. Interest income is accrued as earned. Discounts and premiums on fixed income securities purchased are amortized using the effective interest method. Gains and losses on securities sold are determined on a specific identification basis, which is the same basis used for federal income tax purposes.
Expenses – The Funds bear expenses incurred specifically on their behalf as well as a portion of general Trust expenses, which are allocated according to methods authorized by the Board of Trustees.
| CM Advisors Family of Funds |
Notes to Financial Statements (Continued) |
Dividend Distributions – Dividends arising from net investment income, if any, are declared and paid quarterly to shareholders of each Fund. Distributions from capital gains, if any, are generally declared and distributed annually. The amount of distributions from net investment income and net realized gains are determined in accordance with federal income tax regulations which may differ from GAAP. These “book/tax” differences are either temporary or permanent in nature and are primarily due to differing treatments of net short-term gains. Dividends and distributions are recorded on the ex-dividend date.
The tax character of distributions paid during the periods ended August 31, 2011 and February 28, 2011 was as follows:
| | | | | | | |
CM Advisors Fund - Class I | 08/31/11 | | $ | 122,484 | | | $ | 122,484 | |
| | 02/28/11 | | $ | 490,642 | | | $ | 490,642 | |
CM Advisors Opportunity Fund | 08/31/11 | | $ | 51,062 | | | $ | 51,062 | |
| | 02/28/11 | | $ | — | | | $ | — | |
CM Advisors Fixed Income Fund | 08/31/11 | | $ | 781,228 | | | $ | 781,228 | |
| | 02/28/11 | | $ | 2,064,460 | | | $ | 2,064,460 | |
During the period ended August 31, 2011, no distributions were paid by Class C or Class R shares of CM Advisors Fund or any Class of shares of CM Advisors Small Cap Value Fund.
Estimates – The preparation of financial statements in conformity with GAAP requires management to make estimates and assumptions that affect the reported amounts of assets and liabilities and disclosure of contingent assets and liabilities as of the date of the financial statements and the reported amounts of income and expenses during the reporting period. Actual results could differ from those estimates.
3. Federal Income Tax
It is each Fund’s policy to comply with the special provisions of Subchapter M of the Internal Revenue Code applicable to regulated investment companies. As provided therein, in any fiscal year in which a Fund so qualifies, and distributes at least 90% of its taxable net income, the Fund (but not the shareholders) will be relieved of federal income tax on the income distributed. Accordingly, no provision for income taxes has been made.
In order to avoid imposition of the excise tax applicable to regulated investment companies, it is also each Fund’s intention to declare as dividends in each calendar year at least 98% of its net investment income (earned during the calendar year) and 98.2% of its net realized capital gains (earned during the twelve months ended October 31) plus undistributed amounts from prior years.
The following information is computed on a tax basis for each item as of August 31, 2011:
| CM Advisors Family of Funds |
Notes to Financial Statements (Continued) |
| | | | | CM Advisors Small Cap Value Fund | | | CM Advisors Opportunity Fund | | | CM Advisors Fixed Income Fund | |
Tax cost of portfolio investments | | $ | 122,952,785 | | | $ | 6,170,432 | | | $ | 1,570,055 | | | $ | 82,574,461 | |
Gross unrealized appreciation | | $ | 14,960,754 | | | $ | 158,810 | | | $ | 27,052 | | | $ | 5,743,080 | |
Gross unrealized depreciation | | | (16,169,820 | ) | | | (478,172 | ) | | | (48,428 | ) | | | (77,680 | ) |
Net unrealized appreciation (depreciation) | | | (1,209,066 | ) | | | (319,362 | ) | | | (21,376 | ) | | | 5,665,400 | |
| Accumulated undistributed ordinary income | | | 101,751 | | | | — | | | | — | | | | 264,752 | |
Capital loss carryforwards | | | (46,352,110 | ) | | | — | | | | — | | | | — | |
Other gains (losses) | | | 1,379,051 | | | | 7,990 | | | | (32,589 | ) | | | 848,047 | |
Accumulated earnings (deficit) | | $ | (46,080,374 | ) | | $ | (311,372 | ) | | $ | (53,965 | ) | | $ | 6,778,199 | |
The difference between the federal income tax cost of portfolio investments and the financial statement cost for CM Advisors Small Cap Value Fund and CM Advisors Opportunity Fund is due to certain timing differences in the recognition of capital gains or losses under income tax regulations and GAAP. These “book/tax” differences are temporary in nature and are due to the tax deferral of losses on wash sales.
As of February 28, 2011, CM Advisors Fund had capital loss carryforwards of $46,352,110, of which $15,391,875 expires on February 28, 2017 and $30,960,235 expires on February 28, 2018. These capital loss carryforwards may be utilized in the current and future years to offset net realized capital gains, if any, prior to distributing such gains to shareholders.
The Funds recognize the benefits or expenses of uncertain tax positions only if the position is “more-likely-than-not” of being sustained assuming examination by tax authorities. Management has reviewed the tax positions taken on Federal income tax returns for all open tax years (tax years ended February 28, 2009 through February 28, 2011) and has concluded that no provision for unrecognized tax benefits or expenses is required in these financial statements.
4. Investment Transactions
During the period ended August 31, 2011, cost of purchases and proceeds from sales of investment securities, other than short-term investments and U.S. government securities, were as follows:
| | | | | CM Advisors Small Cap Value Fund | | | CM Advisors Opportunity Fund | | | CM Advisors Fixed Income Fund | |
Cost of purchases of investment securities | | $ | 32,826,103 | | | $ | 6,221,647 | | | $ | 4,481,284 | | | $ | 2,351,555 | |
| Proceeds from sales of investment securities | | $ | 16,095,703 | | | $ | 204,591 | | | $ | 4,675,137 | | | $ | 7,825,733 | |
| CM Advisors Family of Funds |
Notes to Financial Statements (Continued) |
5. Transactions with Affiliates
INVESTMENT ADVISORY AGREEMENT
The Funds pay a monthly advisory fee to Van Den Berg Management I, Inc. (the “Advisor”) based upon the average daily net assets of each Fund and calculated at the annual rate of 1.25% for CM Advisors Fund and CM Advisors Opportunity Fund, 1.00% for CM Advisors Small Cap Value Fund and 0.50% for CM Advisors Fixed Income Fund. The Advisor has entered into contractual agreements (the “Expense Limitation Agreements”) with each Fund under which it has agreed to waive its fees and to assume other expenses of the Funds, if necessary, in an amount that limits the Funds’ total operating expenses (exclusive of interest, taxes, brokerage commissions, extraordinary expenses, and payments, if any, under a Rule 12b-1 plan) to not more than 1.50% of the average daily net assets of CM Advisors Fund, CM Advisors Opportunity Fund and CM Advisors Fixed Income Fund and not more than 1.25% of the average daily net assets of CM Advisors Small Cap Value Fund, each until July 1, 2012. There can be no assurance that the Expense Limitation Agreements will continue beyond July 1, 2012. Accordingly, during the period ended August 31, 2011, with respect to CM Advisors Fund, the Advisor waived advisory fees of $19,329 and reimbursed the Fund for $8,792 of Class I expenses, $4,185 of Class C expenses and $4,220 of Class R expenses. With respect to CM Advisors Small Cap Value Fund, the Advisor waived its entire investment advisory fee of $7,923 and reimbursed the Fund for $48,340 of other operating expenses, $6,023 of Class I expenses, $4,202 of Class C expenses and $4,202 of Class R expenses. With respect to CM Advisors Opportunity Fund, the Advisor waived its entire investment advisory fee of $8,309 and reimbursed the Fund for $65,421 of other operating expenses. During the period ended August 31, 2011, there were no advisory fees waived or expenses reimbursed by the Advisor for CM Advisors Fixed Income Fund.
ADMINISTRATION AGREEMENT
Under the terms of an Administration Agreement with the Trust, Ultimus Fund Solutions, LLC (“Ultimus”) provides executive and administrative services and internal regulatory compliance services for the Funds. Ultimus supervises the preparation of tax returns, reports to shareholders of the Funds, reports to and filings with the Securities and Exchange Commission (“SEC”) and state securities commissions and prepares materials for meetings of the Board of Trustees. For these services, each Fund pays to Ultimus a monthly fee at an annual rate of 0.08% per annum of its average daily net assets up to $500 million, 0.05% of such assets from $500 million to $2 billion, 0.04% of such assets from $2 billion to $3 billion and 0.03% of such assets in excess of $3 billion, provided, however, that the minimum fee is $2,000 per month with respect to each Fund.
Certain officers of the Trust are also officers of Ultimus, or of Ultimus Fund Distributors, LLC (the “Distributor”), the principal underwriter of the Funds’ shares and an affiliate of Ultimus.
FUND ACCOUNTING AGREEMENT
Under the terms of a Fund Accounting Agreement with the Trust, Ultimus calculates the daily net asset value per share and maintains the financial books and records of each Fund. For these services, each Fund pays to Ultimus a base fee of $3,000 for CM Advisors Fund and CM Advisors Small Cap Value Fund and $2,000 per month for CM Advisors Opportunity Fund and CM Advisors Fixed Income Fund, plus an asset-based fee at the annual rate of 0.01% of the first $500 million of its average daily net assets and 0.005% of such assets in excess of $500 million. In addition, each Fund pay all costs of external pricing services.
| CM Advisors Family of Funds |
Notes to Financial Statements (Continued) |
TRANSFER AGENT AND SHAREHOLDER SERVICES AGREEMENT
Under the terms of a Transfer Agent and Shareholder Services Agreement with the Trust, Ultimus maintains the records of each shareholder’s account, answers shareholders’ inquiries concerning their accounts, processes purchases and redemptions of each Fund’s shares, acts as dividend and distribution disbursing agent and performs other shareholder service functions. For these services, Ultimus receives from each Fund a fee, payable monthly, at an annual rate of $17 per account, provided, however, that the minimum fee with respect to each share class is $1,000 per month if a class has 25 shareholder accounts or less, $1,250 if a class has more than 25 but less than 100 shareholder accounts, and $1,500 per month if a class has 100 or more shareholder accounts. In addition, each Fund pays out-of-pocket expenses, including but not limited to, postage and supplies.
DISTRIBUTION AGREEMENT
Pursuant to the terms of a Distribution Agreement with the Trust, the Distributor serves as the Funds’ principal underwriter. The Distributor is a wholly-owned subsidiary of Ultimus. The Distributor receives annual compensation of $6,000 from the Trust for such services.
DISTRIBUTION PLAN
The Trust has adopted plans of distribution (the “Plans”) pursuant to Rule 12b-1 under the 1940 Act, which permit Class C and Class R shares of CM Advisors Fund and CM Advisors Small Cap Value Fund to directly incur or reimburse the Funds’ principal underwriter for certain expenses related to the distribution of its shares. The annual limitation for payment of expenses pursuant to the Plans is 1.00% of each Fund’s average daily net assets attributable to Class C shares and 0.25% of each Fund’s average daily net assets attributable to Class R shares. The Trust has not adopted a plan of distribution with respect to Class I shares of the Funds, CM Advisors Opportunity Fund or CM Advisors Fixed Income Fund.
During the period ended August 31, 2011, Class C and Class R shares of CM Advisors Fund incurred distribution expenses of $129 and $32, respectively, and Class C and Class R shares of CM Advisors Small Cap Value Fund incurred distribution expenses of $125 and $31, respectively.
6. Capital Share Transactions
Proceeds and payments on capital shares as shown in the Statement of Changes in Net Assets for CM Advisors Fund and CM Advisors Small Cap Value Fund are the result of the following capital share transactions for the periods shown:
| | Period Ended August 31, 2011 | | | Period Ended February 28, 2011 | |
| CM Advisors Fund - Class I | | | | | | |
| Shares sold | | | 684,684 | | | | 1,564,569 | |
| Shares reinvested | | | 11,159 | | | | 50,457 | |
| Shares redeemed | | | (1,433,165 | ) | | | (4,430,692 | ) |
| Net decrease in shares outstanding | | | (737,322 | ) | | | (2,815,666 | ) |
| Shares outstanding, beginning of period | | | 13,511,436 | | | | 16,327,102 | |
| Shares outstanding, end of period | | | 12,774,114 | | | | 13,511,436 | |
| CM Advisors Family of Funds |
Notes to Financial Statements (Continued) |
| | Period Ended August 31, 2011 | | | Period Ended February 28, 2011 | |
| | | | | | | | | |
| CM Advisors Fund - Class C | | | | | | | | |
| Shares sold | | | 9,569 | | | | — | |
| Net increase in shares outstanding | | | 9,569 | | | | — | |
| Shares outstanding, beginning of period | | | — | | | | — | |
| Shares outstanding, end of period | | | 9,569 | | | | — | |
| | | | | | | | | |
| CM Advisors Fund - Class R | | | | | | | | |
| Shares sold | | | 9,569 | | | | — | |
| Net increase in shares outstanding | | | 9,569 | | | | — | |
| Shares outstanding, beginning of period | | | — | | | | — | |
| Shares outstanding, end of period | | | 9,569 | | | | — | |
| | | | | | | | | |
| CM Advisors Small Cap Value Fund - Class I | | | | | | | | |
| Shares sold | | | 653,527 | | | | — | |
| Net increase in shares outstanding | | | 653,527 | | | | — | |
| Shares outstanding, beginning of period | | | — | | | | — | |
| Shares outstanding, end of period | | | 653,527 | | | | — | |
| | | | | | | | | |
| CM Advisors Small Cap Value Fund - Class C | | | | | | | | |
| Shares sold | | | 9,718 | | | | — | |
| Net increase in shares outstanding | | | 9,718 | | | | — | |
| Shares outstanding, beginning of period | | | — | | | | — | |
| Shares outstanding, end of period | | | 9,718 | | | | — | |
| | | | | | | | | |
| CM Advisors Small Cap Value Fund - Class R | | | | | | | | |
| Shares sold | | | 9,718 | | | | — | |
| Net increase in shares outstanding | | | 9,718 | | | | — | |
| Shares outstanding, beginning of period | | | — | | | | — | |
| Shares outstanding, end of period | | | 9,718 | | | | — | |
7. Contingencies and Commitments
The Funds indemnify the Trust’s officers and Trustees for certain liabilities that might arise from the performance of their duties to the Funds. Additionally, in the normal course of business, the Funds enter into contracts that contain a variety of representations and warranties and which provide general indemnifications. Each Fund’s maximum exposure under these arrangements is unknown, as this would involve future claims that may be made against the Funds that have not yet occurred. However, based on experience, the Trust expects the risk of loss to be remote.
| CM Advisors Family of Funds |
Notes to Financial Statements (Continued) |
8. Recent Accounting Pronouncement
In May 2011, the Financial Accounting Standards Board issued Accounting Standards Update (“ASU”) No. 2011-04 “Amendments to Achieve Common Fair Value Measurement and Disclosure Requirements in U.S. GAAP and IFRSs.” ASU No. 2011-04 establishes common requirements for measuring fair value and for disclosing information about fair value measurements in accordance with GAAP and International Financial Reporting Standards. ASU No. 2011-04 is effective for interim and annual periods beginning after December 15, 2011 and is applied prospectively. Management is currently evaluating the impact ASU No. 2011-04 may have on financial statement disclosures.
The Regulated Investment Company Modernization Act of 2010 (the “Act”) was enacted on December 22, 2010. The Act makes changes to several tax rules impacting the Funds. In general, the provisions of the Act will be effective for the Funds’ fiscal year ending February 29, 2012. Although the Act provides several benefits, including unlimited carryover on future capital losses, there may be greater likelihood that all or a portion of the Funds’ pre-enactment capital loss carryovers may expire without being utilized due to the fact that post-enactment capital losses must be utilized before pre-enactment capital loss carryovers. Relevant information regarding the impact of the Act on the Funds, if any, will be included in the Annual Report for the year ended February 29, 2012.
9. Subsequent Events
The Funds are required to recognize in the financial statements the effects of all subsequent events that provide additional evidence about conditions that existed as of the date of the Statements of Assets and Liabilities. For non-recognized subsequent events that must be disclosed to keep the financial statements from being misleading, the Funds are required to disclose the nature of the event as well as an estimate of the financial effect, or a statement that such an estimate cannot be made. Management has evaluated subsequent events through the issuance of these financial statements and has noted no such events.
| CM Advisors Family of Funds |
About Your Funds’ Expenses (Unaudited) |
We believe it is important for you to understand the impact of costs on your investment. As a shareholder of the Funds, you may incur two types of costs: (1) transaction costs, including redemption fees; and (2) ongoing costs, including management fees, distribution (12b-1) fees and other Fund expenses. Ongoing costs, which are deducted from each Fund’s gross income, directly reduce the investment return of the Funds.
A mutual fund’s ongoing costs are expressed as a percentage of its average net assets. This figure is known as the expense ratio. The following examples are intended to help you understand the ongoing costs (in dollars) of investing in the Funds and to compare these costs with the ongoing costs of investing in other mutual funds. The examples below are based on an investment of $1,000 made at the beginning of the most recent semi-annual period (March 1, 2011 for Class I shares of CM Advisors Fund, CM Advisors Opportunity Fund and CM Advisors Fixed Income Fund, April 15, 2011 for Class I shares of CM Advisors Small Cap Value Fund and July 11, 2011 for Class C and Class R shares of CM Advisors Fund and CM Advisors Small Cap Value Fund) and held until the end of the period (August 31, 2011).
The table below illustrates each Fund’s costs in two ways:
Actual fund return – This section helps you to estimate the actual expenses that you paid over the period. The “Ending Account Value” shown is derived from each Fund’s actual return, and the third column shows the dollar amount of expenses that would have been paid by an investor who started with $1,000 in the Funds. You may use the information here, together with the amount you invested, to estimate the ongoing costs that you paid over the period.
To do so, simply divide your account value by $1,000 (for example, an $8,600 account value divided by $1,000 = 8.6), then multiply the result by the number given for the Funds under the heading “Expenses Paid During Period.”
Hypothetical 5% return – This section is intended to help you compare the Funds’ ongoing costs with those of other mutual funds. It assumes that each Fund had an annual return of 5% before expenses during the period shown, but that the expense ratio is unchanged. In this case, because the return used is not the Funds’ actual returns, the results do not apply to your investment. The example is useful in making comparisons because the SEC requires all mutual funds to calculate expenses based on a 5% return. You can assess each Fund’s ongoing costs by comparing this hypothetical example with the hypothetical examples that appear in shareholder reports of other funds.
Note that expenses shown in the table are meant to highlight and help you compare ongoing costs only. The Funds do not impose any sales loads. However, a redemption fee of 1% is charged on the sale of shares within 180 days of the date of their purchase.
The calculations assume no shares were bought or sold during the period. Your actual costs may have been higher or lower, depending on the amount of your investment and the timing of any purchases or redemptions.
More information about the Funds’ expenses, including annual expense ratios, can be found in this report. For additional information on operating expenses and other shareholder costs, please refer to the Funds’ prospectus.
| CM Advisors Family of Funds |
About Your Funds’ Expenses (Unaudited) (Continued) |
| CM Advisors Fund - Class I |
| Beginning Account Value March 1, 2011 | Ending Account Value August 31, 2011 | Expenses Paid During Period* |
| Based on Actual Fund Return | $1,000.00 | $903.20 | $7.20 |
Based on Hypothetical 5% Return
(before expenses) | $1,000.00 | $1,017.64 | $7.63 |
| * | Expenses are equal to the annualized expense ratio of 1.50% for the period, multiplied by the average account value over the period, multiplied by 184/365 (to reflect the one-half year period). |
| CM Advisors Fund - Class C |
| Beginning Account Value July 11, 2011 | Ending Account Value August 31, 2011 | Expenses Paid During Period* |
| Based on Actual Fund Return | $1,000.00 | $910.00 | $3.40 |
| * | Expenses are equal to the annualized expense ratio of 2.50% for the period, multiplied by the average account value over the period, multiplied by 52/365 (to reflect the period ended August 31, 2011). |
| CM Advisors Fund - Class C |
| Beginning Account Value March 1, 2011 | Ending Account Value August 31, 2011 | Expenses Paid During Period* |
Based on Hypothetical 5% Return
(before expenses) | $1,000.00 | $1,012.60 | $12.68 |
| * | Expenses are equal to the annualized expense ratio of 2.50% for the period, multiplied by the average account value over the period, multiplied by 184/365 (to reflect the period ended August 31, 2011). |
| CM Advisors Fund - Class R |
| Beginning Account Value July 11, 2011 | Ending Account Value August 31, 2011 | Expenses Paid During Period* |
| Based on Actual Fund Return | $1,000.00 | $911.00 | $2.38 |
| * | Expenses are equal to the annualized expense ratio of 1.75% for the period, multiplied by the average account value over the period, multiplied by 52/365 (to reflect the period ended August 31, 2011). |
| CM Advisors Fund - Class R |
| Beginning Account Value March 1, 2011 | Ending Account Value August 31, 2011 | Expenses Paid During Period* |
Based on Hypothetical 5% Return
(before expenses) | $1,000.00 | $1,016.38 | $8.89 |
| * | Expenses are equal to the annualized expense ratio of 1.75% for the period, multiplied by the average account value over the period, multiplied by 184/365 (to reflect the period ended August 31, 2011). |
| CM Advisors Family of Funds |
About Your Funds’ Expenses (Unaudited) (Continued) |
| CM Advisors Small Cap Value Fund - Class I |
| Beginning Account Value April 15, 2011 | Ending Account Value August 31, 2011 | Expenses Paid During Period* |
| Based on Actual Fund Return | $1,000.00 | $877.00 | $4.47 |
| * | Expenses are equal to the annualized expense ratio of 1.25% for the period, multiplied by the average account value over the period, multiplied by 139/365 (to reflect the period ended August 31, 2011). |
| CM Advisors Small Cap Value Fund - Class I |
| Beginning Account Value March 1, 2011 | Ending Account Value August 31, 2011 | Expenses Paid During Period* |
Based on Hypothetical 5% Return
(before expenses) | $1,000.00 | $1,018.90 | $6.36 |
| * | Expenses are equal to the annualized expense ratio of 1.25% for the period, multiplied by the average account value over the period, multiplied by 184/365 (to reflect the period ended August 31, 2011). |
| CM Advisors Small Cap Value Fund - Class C |
| Beginning Account Value July 11, 2011 | Ending Account Value August 31, 2011 | Expenses Paid During Period* |
| Based on Actual Fund Return | $1,000.00 | $851.30 | $2.97 |
| * | Expenses are equal to the annualized expense ratio of 2.25% for the period, multiplied by the average account value over the period, multiplied by 52/365 (to reflect the period ended August 31, 2011). |
| CM Advisors Small Cap Value Fund - Class C |
| Beginning Account Value March 1, 2011 | Ending Account Value August 31, 2011 | Expenses Paid During Period* |
Based on Hypothetical 5% Return
(before expenses) | $1,000.00 | $1,013.86 | $11.42 |
| * | Expenses are equal to the annualized expense ratio of 2.25% for the period, multiplied by the average account value over the period, multiplied by 184/365 (to reflect the period ended August 31, 2011). |
| CM Advisors Small Cap Value Fund - Class R |
| Beginning Account Value July 11, 2011 | Ending Account Value August 31, 2011 | Expenses Paid During Period* |
| Based on Actual Fund Return | $1,000.00 | $852.30 | $1.98 |
| * | Expenses are equal to the annualized expense ratio of 1.50% for the period, multiplied by the average account value over the period, multiplied by 52/365 (to reflect the period ended August 31, 2011). |
| CM Advisors Family of Funds |
About Your Funds’ Expenses (Unaudited) (Continued) |
| CM Advisors Small Cap Value Fund - Class R |
| Beginning Account Value March 1, 2011 | Ending Account Value August 31, 2011 | Expenses Paid During Period* |
Based on Hypothetical 5% Return
(before expenses) | $1,000.00 | $1,017.64 | $7.63 |
| * | Expenses are equal to the annualized expense ratio of 1.50% for the period, multiplied by the average account value over the period, multiplied by 184/365 (to reflect the period ended August 31, 2011). |
| CM Advisors Opportunity Fund |
| Beginning Account Value March 1, 2011 | Ending Account Value August 31, 2011 | Expenses Paid During Period* |
| Based on Actual Fund Return | $1,000.00 | $959.30 | $7.41 |
Based on Hypothetical 5% Return
(before expenses) | $1,000.00 | $1,017.64 | $7.63 |
| * | Expenses are equal to the annualized expense ratio of 1.50% for the period, multiplied by the average account value over the period, multiplied by 184/365 (to reflect the one-half year period). |
| CM Advisors Fixed Income Fund |
| Beginning Account Value March 1, 2011 | Ending Account Value August 31, 2011 | Expenses Paid During Period* |
| Based on Actual Fund Return | $1,000.00 | $1,038.50 | $4.21 |
Based on Hypothetical 5% Return
(before expenses) | $1,000.00 | $1,021.07 | $4.18 |
| * | Expenses are equal to the annualized expense ratio of 0.82% for the period, multiplied by the average account value over the period, multiplied by 184/365 (to reflect the one-half year period). |
Other Information (Unaudited) |
The Trust files a complete listing of portfolio holdings for the Funds with the SEC as of the first and third quarters of each fiscal year on Form N-Q. The filings are available upon request, by calling 1-888-859-5856. Furthermore, you may obtain a copy of these filings on the SEC’s website at http://www.sec.gov. The Trust’s Forms N-Q may also be reviewed and copied at the SEC’s Public Reference Room in Washington, DC, and information on the operation of the Public Reference Room may be obtained by calling 1-800-SEC-0330.
A description of the policies and procedures that the Funds use to determine how to vote proxies relating to portfolio securities is available without charge upon request by calling toll-free 1-888-859-5856, or on the SEC’s website at http://www.sec.gov. Information regarding how the Funds voted proxies relating to portfolio securities during the most recent 12-month period ended June 30 is also available without charge upon request by calling toll-free 1-888-859-5856, or on the SEC’s website at http://www.sec.gov.
| CM Advisors Small Cap Value Fund |
Approval of Investment Advisory Agreement (Unaudited) |
The Board of Trustees (the “Board”), including the Independent Trustees voting separately, has reviewed and approved the Investment Advisory Agreement with the Advisor for the CM Advisors Small Cap Value Fund (the “Small Cap Value Fund”). Approval took place at an in-person meeting held on July 19, 2010, at which a majority of the Trustees, including a majority of the Independent Trustees, were present.
In the course of their deliberations, the Board was advised by legal counsel. The Board received and reviewed a substantial amount of information provided by the Advisor in response to requests of the Board and counsel.
In considering the Investment Advisory Agreement for the Small Cap Value Fund and reaching their conclusions with respect thereto, the Board reviewed and analyzed various factors that it determined were relevant, including the factors described below.
The nature, extent, and quality of services to be provided by the Advisor. In this regard, the Board reviewed the responsibilities the Advisor would have under the proposed Investment Advisory Agreement. The Board also considered the administrative services that the Advisor would provide to the Small Cap Value Fund, its proposed efforts during the Fund’s start-up phase, its coordination of services for the Small Cap Value Fund among the Fund’s service providers, its compliance procedures and practices, and its proposed efforts to promote the Fund and assist in its distribution. The Board considered the services already provided by the Advisor to the current series of the Trust, as well as services provided in connection with the organization of the Small Cap Value Fund. The Board also noted that the Trust’s president, secretary, treasurer, chief compliance officer, principal executive officer and principal financial officer are employees of the Advisor, and would serve the Trust without additional compensation from the Small Cap Value Fund. After reviewing the foregoing information and further information concerning the Advisor’s business, the Board concluded that the quality, extent, and nature of the services to be provided by the Advisor are satisfactory and adequate for the Small Cap Value Fund.
The investment management capabilities and experience of the Advisor. In this regard, the Board evaluated the investment management experience of the Advisor. In particular, the Board received information from the Advisor regarding the experience of the Small Cap Value Fund’s portfolio manager in managing small cap value portfolios. The Board reviewed the investment objective and strategies for the Small Cap Value Fund and the Advisor’s plans for implementing such strategies for the Fund. After consideration of these factors, as well as the Advisor’s capabilities and experience in managing the current series of the Trust, the Board determined that the Advisor would be an appropriate manager for the Small Cap Value Fund.
The costs of the services to be provided and profits to be realized by the Advisor from its relationship with the Small Cap Value Fund. In this regard, the Board examined and evaluated the proposed fee arrangements between the Advisor and the Small Cap Value Fund under the proposed Investment Advisory Agreement. The Board considered the Advisor’s staffing, personnel, and methods of operating; the Advisor’s compliance policies and procedures; the financial condition of the Advisor and the level of commitment to the Small Cap Value Fund and the Advisor by the principals of the Advisor; the projected asset levels of the Small Cap Value Fund; the Advisor’s payment of startup costs for the Small Cap Value Fund; and the projected overall expenses of the Small Cap Value Fund. The Board reviewed the Small Cap Value Fund’s proposed Expense Limitation Agreement with the Advisor, and noted the benefit that would result to the Small Cap Value Fund from the Advisor’s likely waiver of a portion of its management fees for a period of time based on the projected asset levels of the Small Cap Value Fund.
| CM Advisors Small Cap Value Fund |
Approval of Investment Advisory Agreement (Unaudited) (Continued) |
The Board also considered potential benefits to the Advisor in managing the Small Cap Value Fund, including promotion of the Advisor’s name, the ability for the Advisor to place small accounts into the Small Cap Value Fund, and the potential for the Advisor to generate soft dollars from Fund trades that may benefit the Advisor’s clients other than the Small Cap Value Fund. The Board then compared the fees and expenses of the Small Cap Value Fund (including the management fee) to a peer group of other funds comparable to the Small Cap Value Fund in terms of the type of fund, the style of investment management, the size of the fund and the nature of the investment strategy and markets invested in, among other factors. The Board determined that, while the Small Cap Value Fund’s management fee is higher than the average of the other funds included in its peer group, the Fund’s net expense ratio will be less than the average of its peer group. Following these comparisons, and upon further consideration of the foregoing factors, the Board concluded that the management fees paid to the Advisor by the Small Cap Value Fund are fair and reasonable.
The extent to which economies of scale would be realized as the Small Cap Value Fund grows and whether management fee levels reflect these economies of scale for the benefit of the Fund’s investors. In this regard, the Board considered that the Small Cap Value Fund’s fee arrangements with the Advisor involve both a management fee and a proposed Expense Limitation Agreement. The Board determined that, while the management fee would remain the same at all asset levels, the Small Cap Value Fund would experience benefits from its proposed Expense Limitation Agreement, and would continue to do so until the Fund’s assets grow to a level where the Advisor begins receiving its full fee. Thereafter, the Board noted that the Small Cap Value Fund would benefit from economies of scale under its agreements with service providers other than the Advisor. Following further consideration of the Small Cap Value Fund’s projected asset levels, expectations for growth and levels of fees, the Board determined that the Small Cap Value Fund’s fee arrangement with the Advisor would provide benefits through the proposed Expense Limitation Agreement and that, at the Fund’s projected asset level for the next year, the Small Cap Value Fund’s arrangements with the Advisor are fair and reasonable.
The Advisor’s practices regarding brokerage and portfolio transactions. In this regard, the Board considered the Advisor’s standards, and performance in utilizing those standards, to seek best execution for Fund portfolio transactions, including the use of alternative markets (e.g., direct purchases from issuers or underwriters or, as to equity securities, “third market” for listed securities and principal market makers for over-the counter securities). The Board also considered the anticipated portfolio turnover rate for the Small Cap Value Fund; the process by which evaluations would be made of the overall reasonableness of commissions paid; the method and basis for selecting and evaluating the broker-dealers to be used; any anticipated allocation of portfolio business to persons affiliated with the Advisor; and the extent to which the Small Cap Value Fund would allocate portfolio business to broker-dealers who provide research, statistical or other services (“soft dollars”). After further consideration, the Board determined that the Advisor’s practices regarding brokerage and portfolio transactions are satisfactory.
Possible conflicts of interest. In evaluating the possibility for conflicts of interest, the Board considered such matters as the experience and abilities of the advisory personnel assigned to the Small Cap Value Fund; the basis of decisions to buy or sell securities for the Small Cap Value Fund and/or the Advisor’s other accounts; the method for bunching of portfolio securities transactions; and the substance and administration of the Advisor’s code of ethics. Following further consideration, the Board found the Advisor’s standards and practices relating to the identification and mitigation of potential conflicts of interests to be satisfactory.
| CM Advisors Small Cap Value Fund |
Approval of Investment Advisory Agreement (Unaudited) (Continued) |
Conclusion
After full consideration of the above factors as well as other factors, the Board unanimously concluded that the Investment Advisory Agreement was in the best interests of the Small Cap Value Fund and its shareholders.
CM Advisors Fund
CM Advisors Small Cap Value Fund
CM Advisors Opportunity Fund and
CM Advisors Fixed Income Fund
are each a series of
CM Advisors Family of Funds
| For Shareholder Service Inquiries: | For Investment Advisor Inquiries: |
| | |
Ultimus Fund Solutions, LLC P.O. Box 46707 Cincinnati, OH 45246-0707 | Van Den Berg Management I, Inc. (d/b/a CM Fund Advisors) 805 Las Cimas Parkway, Suite 430 Austin, Texas 78746 |
| | |
| Toll-Free Telephone: | Toll-Free Telephone: |
| 1-888-859-5856 | 1-888-859-5856 |
| | |
| | World Wide Web @: |
| | www.cmadvisorsfunds.com |
Investment in the Funds is subject to investment risks, including the possible loss of some or all of the principal amount invested. No investment strategy works all the time, and past performance is not necessarily indicative of future performance. The performance information quoted in this report represents past performance, which is not a guarantee of future results. Investment return and principal value of an investment will fluctuate so that an investor’s shares, when redeemed, may be worth more or less than their original cost. Current performance may be lower or higher than the performance data quoted. A redemption fee of 1% of the amount redeemed is imposed on redemptions of Fund shares occurring within 180 days following the purchase of such shares. An investor should consider the investment objectives, risks, and charges and expenses of the Funds carefully before investing. The prospectus contains this and other information about the Funds. A copy of the prospectus is available at www.centman.com or by calling Shareholder Services at 1-888-859-5856. The prospectus should be read carefully before investing. |
For More Information on your CM Advisors Family of Funds:
See Our Web site @ www.cmadvisorsfunds.com or
Call Our Shareholder Services Group Toll-Free at 1-888-859-5856
Not required
| Item 3. | Audit Committee Financial Expert. |
Not required
| Item 4. | Principal Accountant Fees and Services. |
Not required
| Item 5. | Audit Committee of Listed Registrants. |
Not applicable
| Item 6. | Schedule of Investments. |
| (a) | Not applicable [schedule filed with Item 1] |
| Item 7. | Disclosure of Proxy Voting Policies and Procedures for Closed-End Management Investment Companies. |
| Item 8. | Portfolio Managers of Closed-End Management Investment Companies. |
| Item 9. | Purchases of Equity Securities by Closed-End Management Investment Company and Affiliated Purchasers. |
| Item 10. | Submission of Matters to a Vote of Security Holders. |
The registrant has not adopted procedures by which shareholders may recommend nominees to the registrant’s board of trustees.
| Item 11. | Controls and Procedures. |
(a) Based on their evaluation of the registrant’s disclosure controls and procedures (as defined in Rule 30a-3(c) under the Investment Company Act of 1940) as of a date within 90 days of the filing date of this report, the registrant’s principal executive officer and principal financial officer have concluded that such disclosure controls and procedures are reasonably designed and are operating effectively to ensure that material information relating to the registrant, including its consolidated subsidiaries, is made known to them by others within those entities, particularly during the period in which this report is being prepared, and that the information required in filings on Form N-CSR is recorded, processed, summarized, and reported on a timely basis.
(b) There were no changes in the registrant’s internal control over financial reporting (as defined in Rule 30a-3(d) under the Investment Company Act of 1940) that occurred during the second fiscal quarter of the period covered by this report that have materially affected, or are reasonably likely to materially affect, the registrant’s internal control over financial reporting.
File the exhibits listed below as part of this Form. Letter or number the exhibits in the sequence indicated.
(a)(1) Any code of ethics, or amendment thereto, that is the subject of the disclosure required by Item 2, to the extent that the registrant intends to satisfy the Item 2 requirements through filing of an exhibit: Not required
(a)(2) A separate certification for each principal executive officer and principal financial officer of the registrant as required by Rule 30a-2(a) under the Act (17 CFR 270.30a-2(a)): Attached hereto
(a)(3) Any written solicitation to purchase securities under Rule 23c-1 under the Act (17 CFR 270.23c-1) sent or given during the period covered by the report by or on behalf of the registrant to 10 or more persons: Not applicable
(b) Certifications required by Rule 30a-2(b) under the Act (17 CFR 270.30a-2(b)): Attached hereto
| Exhibit 99.CERT | Certifications required by Rule 30a-2(a) under the Act |
| Exhibit 99.906CERT | Certifications required by Rule 30a-2(b) under the Act |
Pursuant to the requirements of the Securities Exchange Act of 1934 and the Investment Company Act of 1940, the registrant has duly caused this report to be signed on its behalf by the undersigned, thereunto duly authorized.
Pursuant to the requirements of the Securities Exchange Act of 1934 and the Investment Company Act of 1940, this report has been signed below by the following persons on behalf of the registrant and in the capacities and on the dates indicated.