Exhibit 99.2
Telkom SA Limited
Group Annual Results
for the year ended March 31, 2008
for the year ended March 31, 2008
June 9, 2008
Changing the way we do business

Cautionary statement on forward looking statements
All of the statements included in this document, as well as oral statements that may be made by us or by officers, directors or employees acting on
behalf of us, that are not statements of historical facts, including but not limited to financial targets and prospects, constitute or are based on
forward-looking statements within the meaning of the US Private Securities Litigation Reform Act of 1995, specifically Section 27A of the US
Securities Act of 1933, as amended, and Section 21E of the US Securities Exchange Act of 1934, as amended. These forward-looking statements
involve a number of known and unknown risks, uncertainties and other factors that could cause our actual results and outcomes to be materially
different from historical results or from any future results expressed or implied by such forward-looking statements. Among the factors that could
cause our actual results or outcomes to differ materially from our expectations are those risks identified in Item 3. “Key Information-Risk Factors,” of
Telkom’s most recent Annual Report on Form 20-F filed with the US Securities and Exchange Commission (SEC) and its other filings and
submissions with the SEC which are available on Telkom’s website at www.telkom.co.za/ir, including, but not limited to, any changes to our mobile
strategy and Vodacom holdings and our ability to impact such strategy and organizational changes thereto, increased competition in the South
African fixed-line, mobile and data communications markets; our ability to implement our strategy of transforming from basic voice and data
connectivity to fully converged solutions, developments in the regulatory environment; continued mobile growth and reductions in Vodacom’s and
Telkom’s net interconnect margins; Telkom’s and Vodacom’s ability to expand their operations and make investments and acquisitions in other
African countries and the general economic, political, social and legal conditions in South Africa and in other countries where Telkom and Vodacom
invest; our ability to improve and maintain our management information and other systems; our ability to attract and retain key personnel and
partners; our inability to appoint a majority of Vodacom’s directors and the consensus approval rights at Vodacom may limit our flexibility and ability
to implement our preferred strategies; Vodacom’s continued payment of dividends or distributions to us; our negative working capital; changes in
technology and delays in the implementation of new technologies; our ability to reduce theft, vandalism, network and payphone fraud and lost
revenue to non-licensed operators; the amount of damages Telkom is ultimately required to pay to Telcordia Technologies Incorporated; the
outcome of regulatory, legal and arbitration proceedings, including tariff approvals, and the outcome of Telkom’s hearings before the Competition
Commission and others; any requirements that we unbundle the local loop, our ability to negotiate favorable terms, rates and conditions for the
provision of interconnection services and facilities leasing services or if ICASA finds that we or Vodacom have significant market power or otherwise
imposes unfavorable terms and conditions on us; our ability to implement and recover the substantial capital and operational costs associated with
carrier pre-selection, number portability and the monitoring, interception and customer registration requirements contained in the South African
Regulation of Interception of Communications and Provisions of Communication-Related Information Act and the impact of these requirements on
our business; Telkom’s ability to comply with the South African Public Finance Management Act and South African Public Audit Act and the impact
of the Municipal Property Rates Act; fluctuations in the value of the Rand and inflation rates; the impact of unemployment, poverty, crime, HIV
infection, labor laws and labor relations, exchange control restrictions, and power outages in South Africa; and other matters not yet known to us or
not currently considered material by us.
We caution you not to place undue reliance on these forward-looking statements. All written and oral forward-looking statements attributable to us,
or persons acting on our behalf, are qualified in their entirety by these cautionary statements. Moreover, unless we are required by law to update
these statements, we will not necessarily update any of these statements after the date hereof, either to confirm them to actual results or to changes
in our expectation.
2
Reuben September
Overview

Financial summary
• Group operating revenue increased by 9.0% to
R56.3 billion
R56.3 billion
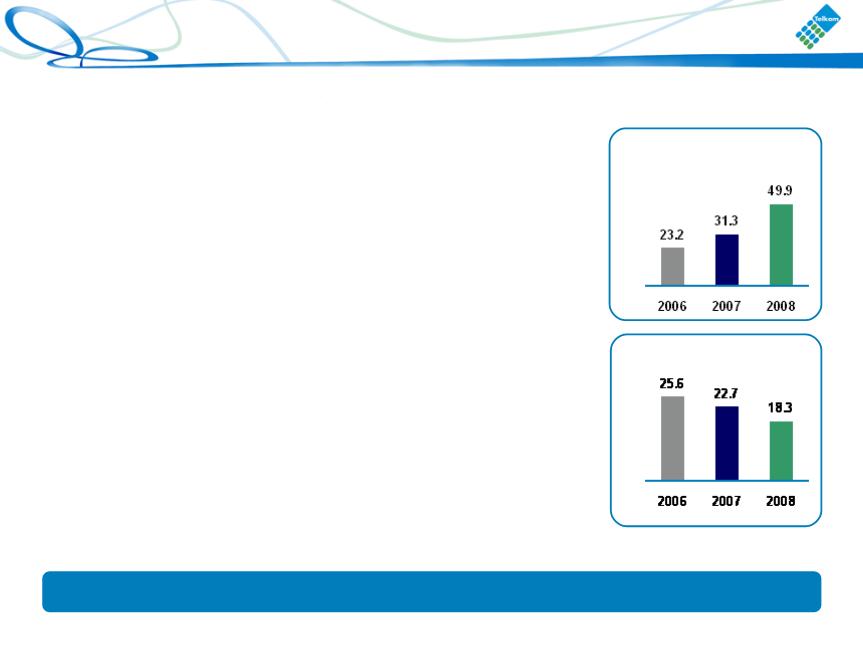
• Group EBITDA increased by 4.2% to R20.6 billion
• Net debt to equity increased to 49.9% from 31.3%
at March 31, 2007
at March 31, 2007
• Cash generated from operations increased by
3.6% to R21.1 billion
3.6% to R21.1 billion
• HEPS decreased by 4.0% to 1634.5 cents
per share
per share
• Ordinary dividend increased by 10.0% to
660 cents per share payable on July 7, 2008
660 cents per share payable on July 7, 2008
• No special dividend declared - investing in
South African and African operations
South African and African operations
4

Strategy overview - defend and grow
Changing the way we do business
Fixed Mobile
Geographic
Data
• Core strategy remains defend
and grow
and grow
• Telkom continues to move up
the value added data services
chain
the value added data services
chain
• We continue to pursue
acquisition opportunities in fast
growing emerging markets
acquisition opportunities in fast
growing emerging markets
• We aim to establish Telkom as a
regional ICT player
regional ICT player
• Leveraging our core strengths to
be a full play service provider
be a full play service provider
5
Traditional voice
• Annuity revenue increased 14.1% to R6.9 billion
• Telkom Closer packages increased 63.3% to 471,742
• Supreme call packages increased 121.4% to 12,777
• Term & Volume discount plans of R3.4 billion signed in FY2008
Defensive strategies are successful
• Continue converting revenue streams to
annuity revenues
annuity revenues
• Bundling call minutes with access line rental
in attractive subscription based value
propositions
in attractive subscription based value
propositions
6
*
Pricing initiatives
• Offering value-based calling plans
• Rebalancing tariffs to reduce arbitrage opportunities
• Driving the penetration of bundles to increase annuity based revenues
Offering value to remain competitive
7
Data
• Data revenues climbed 10.9% to R8.3 billion
• Focus on innovative products such as VPN Lite
• Ethos of innovation and speed to market being fostered
Data connectivity | Rbn4.5 | 4.5% |
Mobile leased lines | Rbn1.9 | 11.1% |
Internet access | Rbn1.2 | 29.1% |
Managed network services | Rm728.5 | 36.2% |
VPN services | Rm500.0 | 46.6% |
Data continues to grow in importance
8

Data centre business
• Increase Telkom’s share of the ICT revenue pie
• Stimulate use of bandwidth over our network
• Towards one-stop solutions as IT and
telecommunications converge
telecommunications converge
• Regulators insisting that data is properly protected
• Improving efficiencies through shared resources
• Telkom is pursuing the acquisition of a data centre
business outside South Africa
business outside South Africa
Moving up the value added services data chain
9

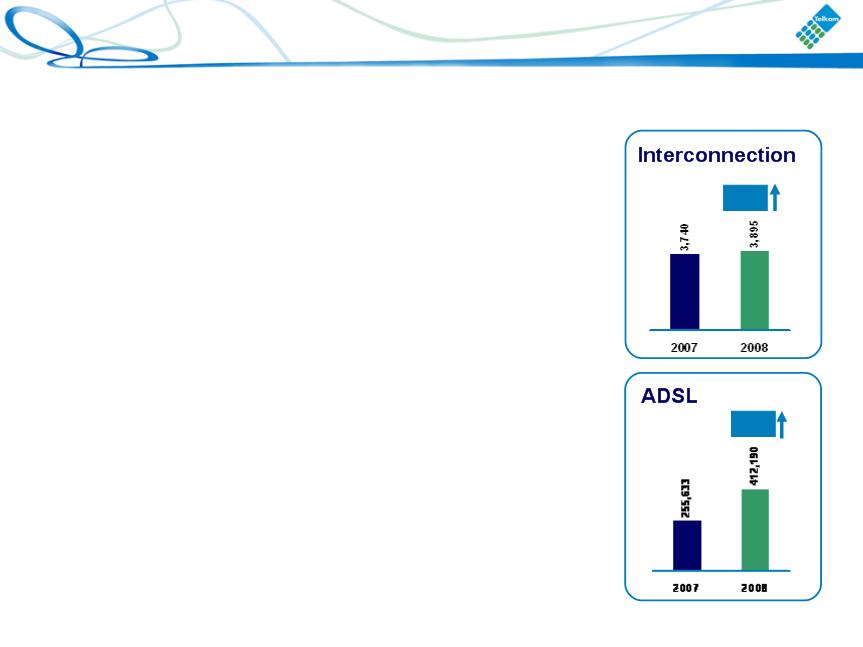
Broadband and converged services
• ADSL footprint now covering 92% of the network
• Coverage in township areas - 69%
• ADSL subscribers grown 61.2% to 412,190
• Do Broadband packages increased by 245.6% to
119,288
119,288
• Wholesale ADSL services have grown to 18,740 from
2,545 at September 2007
2,545 at September 2007
• ATTI has improved to 19 days from 23 days at
March 31, 2007
March 31, 2007
• 57% of all ADSL installation done through self-install
option
option
• Targeting 592,000 ADSL subscribers for FY 2009
Targeting ADSL penetration of 15% - 20% of fixed-access lines
by FY 2010/11
by FY 2010/11
10
Results to March 31, 2008
• Revenue of R845.4 million
• Profit after tax - R49.0 million
• ARPU for 11 months ended March 31, 2008 - $32
• Subscribers at March 31, 2008 - 813,392
• Subscribers at May 31, 2008 - 1,000,251
Strong operational performance
11
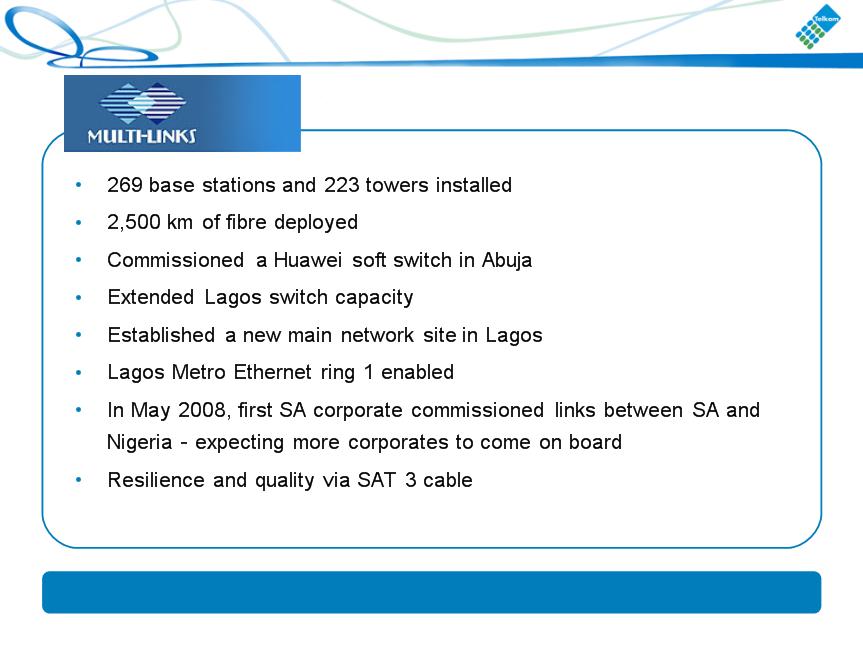
Fast becoming a serious competitor in Nigeria
12

•Ability to deliver complex data products to corporates growing
• Planned capex expenditure
– Further Metro Ethernet rings to be build in
Abuja, Lagos, Kano, Kaduna and Delta
Abuja, Lagos, Kano, Kaduna and Delta
– Six NGN nodes to be built during FY 2009
• Aggressively pursuing opportunities in the
growing markets of Nigeria
growing markets of Nigeria
13

• Targeted EBITDA margin range 17% - 22% at March 31, 2009
• Targeted base station growth 2009 - 1,150
• Targeted fibre deployment 2009 - 2,000km
• Targeted customer growth 2009 - 3.5 million
Multi-Links will be substantial contributor to Telkom
14
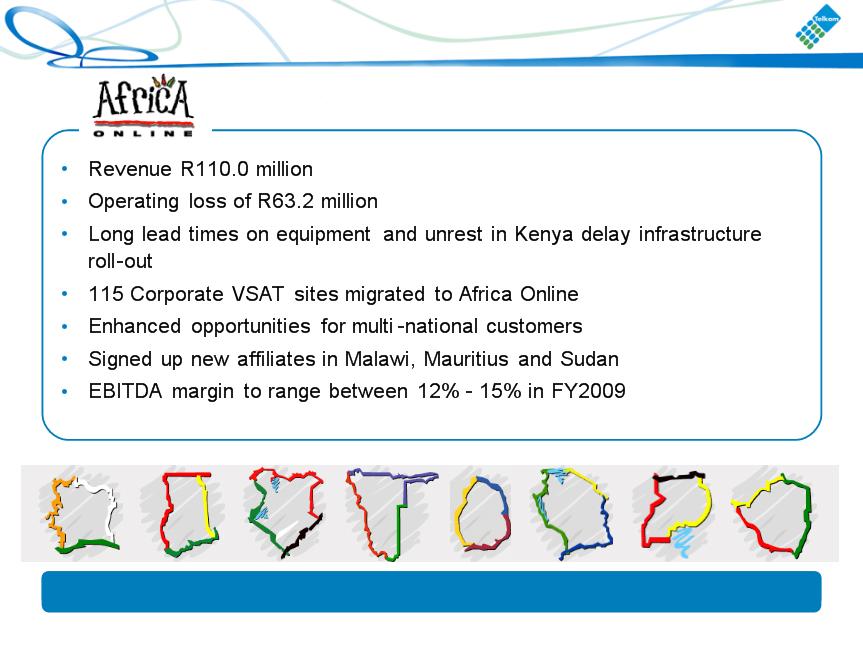
Ghana
Namibia
Swaziland
Zimbabwe
Uganda
Tanzania
Cote D’Ivoire
Kenya
Small company with big opportunities
15

Telkom Management Services Company
• Opportunities in sub-Saharan Africa for reputable
operator to provide management services
operator to provide management services
• Target market - -
– State owned incumbent operators
– Numerous new entrants in ICT industry
• Telkom has first hand experience of privatisation
• Leveraging experience with technology innovation,
equipment manufacturers, operator support
systems, business planning, support services and
IT solutions
equipment manufacturers, operator support
systems, business planning, support services and
IT solutions
TMSC will provide total management solutions
16

Potential corporate action announced on June 2, 2008
Binding proposals subject to requisite shareholder approval
• Proposal received from Vodafone:
– Vodafone would acquire a portion of Telkom’s stake in Vodacom; and
– Telkom would unbundle its remaining shareholding in Vodacom to Telkom
shareholders
shareholders
• Letter received from consortium lead by Mvelaphanda Holdings
– Consortium is considering making an offer for the entire issued share capital
of Telkom;
of Telkom;
– Offer will only be made if a number of pre-conditions are met;
– Proposal contemplates that Telkom will unbundle or sell its entire 50% stake
in Vodacom;
in Vodacom;
– In effect, the Consortium would acquire Telkom’s fixed line business
– Vodafone discussions are independent from the approach from the Consortium
• Telkom aims to continuously and expeditiously seek ways to unlock value
• To this end:
– Board and management evaluating the above proposals;
– Discussions are being held and clarifications are being obtained;
– Further announcement will be made when appropriate
17
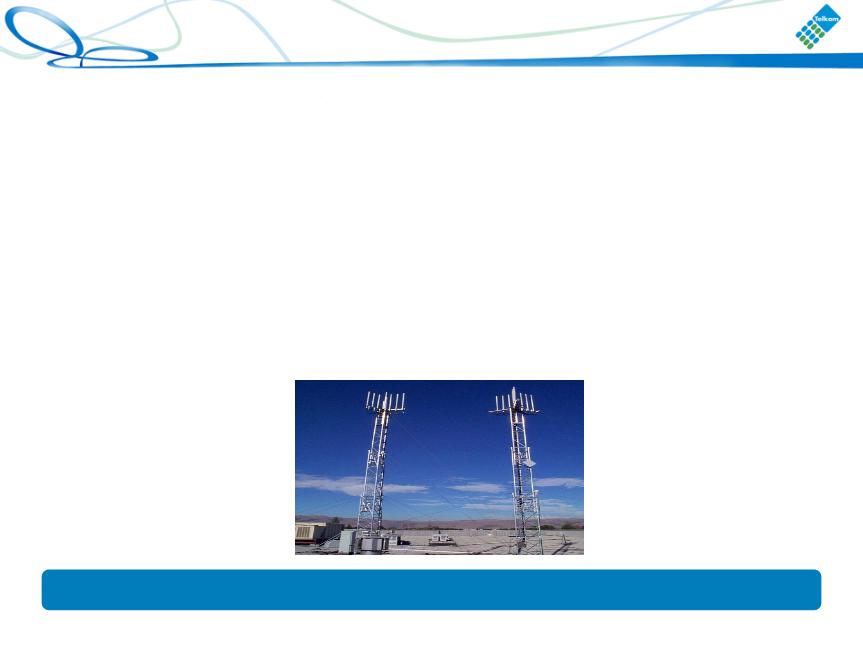
Fixed mobile and mobile data network
Getting ready to compete aggressively
• W-CDMA, capable of full mobility, to be deployed
in selective areas
in selective areas
• Huawei approved as exclusive vendor - scale
benefits with Multi-Links
benefits with Multi-Links
• Alleviate losses and service impacts of theft,
breakages and incidences
breakages and incidences
• Replacing high cost of copper in vulnerable areas
• Business case - R1.7 billion over 3 years with IRR
in excess of 20%
in excess of 20%
• First customers to be connected in September
2008
2008
18

Key NGN and capacity achievements
• 84 Metro Ethernet nodes deployed
• Dense Wave Division Multiplexing System deployed between Gauteng and
Durban - - significant increase in transport bandwidth capability
Durban - - significant increase in transport bandwidth capability
• Automatic self-healing rerouting of bandwidth has commenced
• National and local bandwidth increased by 1.2 Tbit/s - 21% increase
• International bandwidth increased to 4.5 Gbit/s - 88% increase
• 41% increase in bandwidth on ATM network
• National IP network bandwidth increased to 32.2 Gbit/s - 11% increase
• Diginet and Diginet Plus has increased to 27 Gbit/s - 20% increase
• 237 WiFi hotspots deployed
• WiMax - 56 base stations now installed
Telkom fulfilling commitment to dramatically increase bandwidth
19

Capability management
No need to own resources in order to use them
• Redesign of Telkom’s operations model to address rapidly changing technology,
speed of technology deployment and fluctuating demand in the most cost
efficient manner
speed of technology deployment and fluctuating demand in the most cost
efficient manner
• Includes outsourcing, out-tasking, consolidation and in-tasking
• Aim is to:
– Increase focus on customer service
– Deliver new differentiated services to the market faster
– Facilitate smoother and more rapid technology transition
– Facilitate risk and benefit sharing model
– Complete roll-out over two years
• Sustained employability and wellbeing of Telkom staff is of paramount importance
20
Capability management (cont.)
Moving towards a nimble, efficient organisation
• Capability management is in progress
– Commenced with issuing closed request for proposals for the
provisioning of professional services
provisioning of professional services
– Information sharing with unions started in July 2007, consultation
in April 2008
in April 2008
– Joint union and management team conducted benchmark studies
in Germany, Australia, New Zealand and Brazil
in Germany, Australia, New Zealand and Brazil
• Reducing number of contractors providing similar services currently
– Commenced with service provider consolidation process
21

Customer service quality improvement initiatives
Call Centre Operations - improving customer service
• Restructured all call centres under one structure
• Active traffic load distribution among call centres
• Selected single supplier of temporary staff
– Standardised remuneration
– Created temporary staff development path
• Automated credit note on theft affected services
• Enhanced alternate fault reporting via web
Vital to enhance customer service
22

Customer service quality improvement initiatives
Customer centricity starting to bear fruit
Focus on improving customer service
• Various initiatives in the Call Centres and Field
Operations resulted in:
Operations resulted in:
– Faults dropped from peak in February by 47%
– Reduction of theft by 15% from January
– Customer Fault Handling capacity improved
by 22%
by 22%
– ADSL call handling capacity improved by 37%
over last 3 months
over last 3 months
– Corporate fault management improved by 8%
– Corporate calls answered in 20 seconds
improved from 54% to 74%
improved from 54% to 74%
23
• On March 31, 2008 Telkom announced its intention to substantially
reduce its shareholding in Telkom Media
reduce its shareholding in Telkom Media
• A potential investor has been identified
• A definite proposal is expected to be received end June 2008
• Expansion of content rich services is crucial
• Content acts as a revenue driver and product differentiator in crowded
broadband market
broadband market
• Content can be sourced from other operators
Fast resolution of Telkom Media issue
24

Financial overview
Deon Fredericks
Group income statement
ZAR million | 2007 | 2008 | % | |
Operating revenue | 51,619 | 56,285 | 9.0 | |
Other income | 384 | 534 | 39.1 | |
Operating expenses | (37,533) | (42,337) | 12.8 | |
Operating profit | 14,470 | 14,482 | 0.1 | |
Investment income | 235 | 197 | 16.2 | |
EBITDA | 19,786 | 20,612 | 4.2 | |
Finance charges | (1,125) | (1,803) | 60.3 | |
Taxation | (4,731) | (4,704) | 0.6 | |
Net profit | 8,849 | 8,172 | (7.7) | |
Basic earnings per share (cents) | 1,681.0 | 1,565.0 | (6.9) | |
Dividend per share | 900.0 | 1,100 | 22.2 |
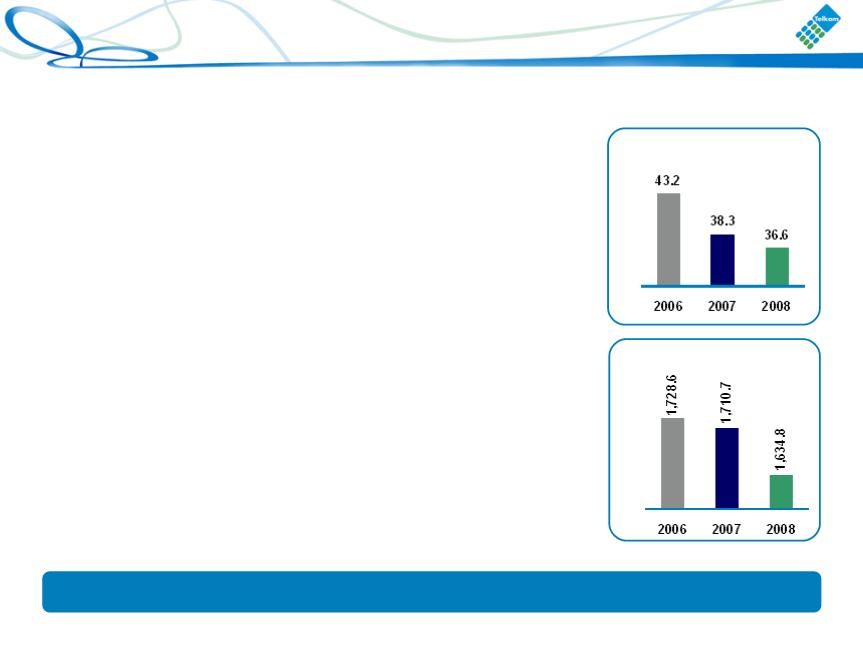
EBITDA margin
%
HEPS
Cents
Business environment changing - margin pressure continues
26
Group balance sheet
ZAR million | 2007 | 2008 | % | |
Non-current assets | 48,770 | 57,763 | 18.4 | |
Current assets | 10,376 | 12,609 | 21.5 | |
Total assets | 59,146 | 70,372 | 19.0 | |
Capital & reserves | 32,008 | 33,337 | 4.2 | |
Non-current liabilities | 8,554 | 15,104 | 76.6 | |
Current liabilities | 18,584 | 21,931 | 18.0 | |
Total equity & liabilities | 59,146 | 70,372 | 19.0 | |
Net debt | 10,026 | 16,617 | 65.7 |
50% net debt to equity
%
Balance sheet remains strong
18% return on assets
%
27

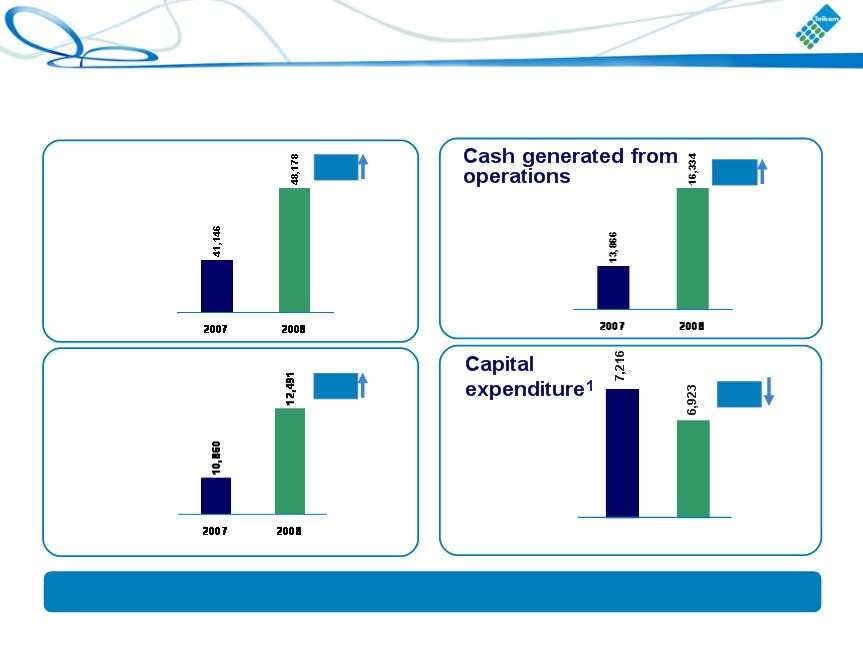
Group cash flow
ZAR millions | 2007 | 2008 | % |
Cash generated from operations | 20,520 | 21,256 | 3.6 |
Dividend paid | (4,784) | (5,732) | 19.8 |
Cash generated from operating activities | 9,356 | 10,603 | 13.3 |
Investing activities | 10,412 | (14,106) | 35.5 |
Financing activities | (2,920) | 2,943 | (200.8) |
Net increase/(decrease) in cash | (3,976) | (560) | (85.9) |
Cash at the end of the year | 308 | (208) | (167.5) |
Free cash flow | 3,728 | 2,150 | (42.3) |
Investing for future revenue growth
28

Segmental contribution
after inter-segmental eliminations
Operating revenue
Operating profit
EBITDA
Fixed line remains the major contributor
Mobile
Fixed-Line
Other
1%
38%
3%
56%
40%
3%
36%
29

Fixed-line income statement
ZAR million | 2007 | 2008 | % | |
Operating revenue | 32,346 | 32,572 | 0.7 | |
Other income | 334 | 497 | 48.8 | |
Operating expenses | (24,083) | (24,962) | 3.6 | |
Operating profit | 8,597 | 8,107 | (5.7) | |
Investment income | 3,041 | 3,975 | 30.7 | |
EBITDA | 12,179 | 12,058 | (1.0) | |
Finance charges | (856) | (1,277) | 49.2 | |
Taxation | (2,652) | (2,630) | (0.8) | |
Net profit | 8,130 | 8,175 | 0.6 |
EBITDA margin
%
EBIT margin
%
Excluding Telkom Media provision - EBITDA margin 37%
30
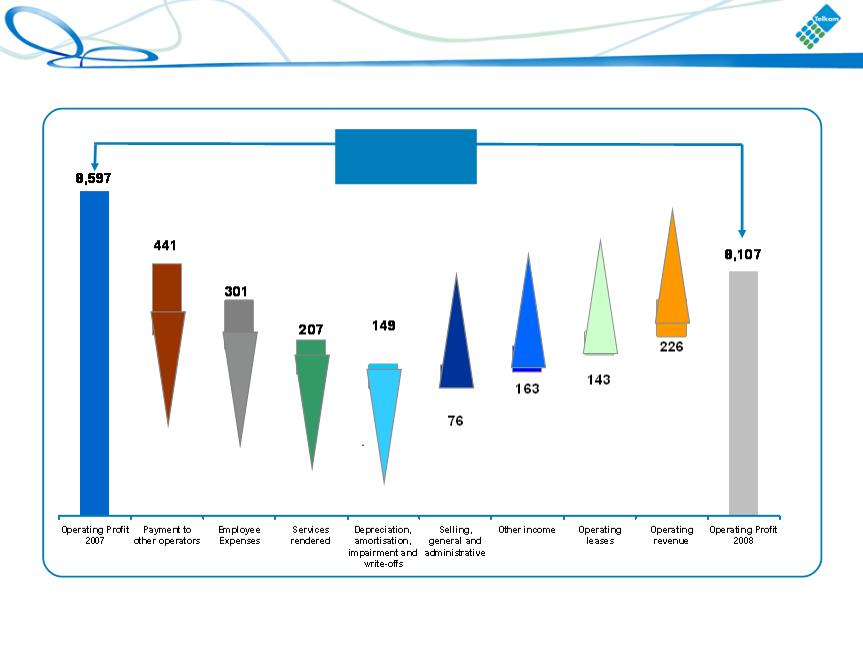
Fixed-line operating profit drivers
(R490 million)
ZAR million
31
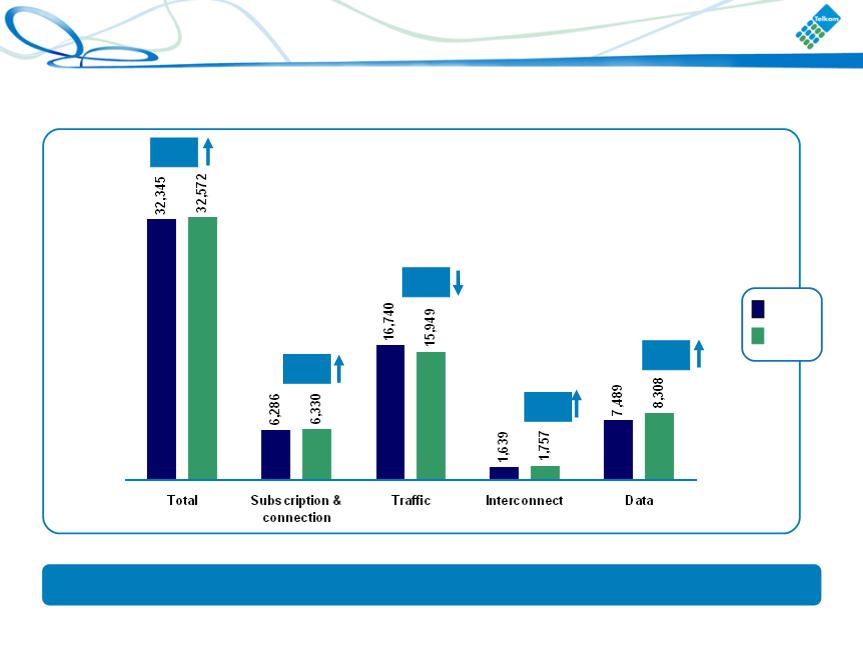
Fixed-line revenue
ZAR million
7.2%
(4.7%)
0.7%
0.7%
10.9%
Strong data revenue growth
2007
2008
32
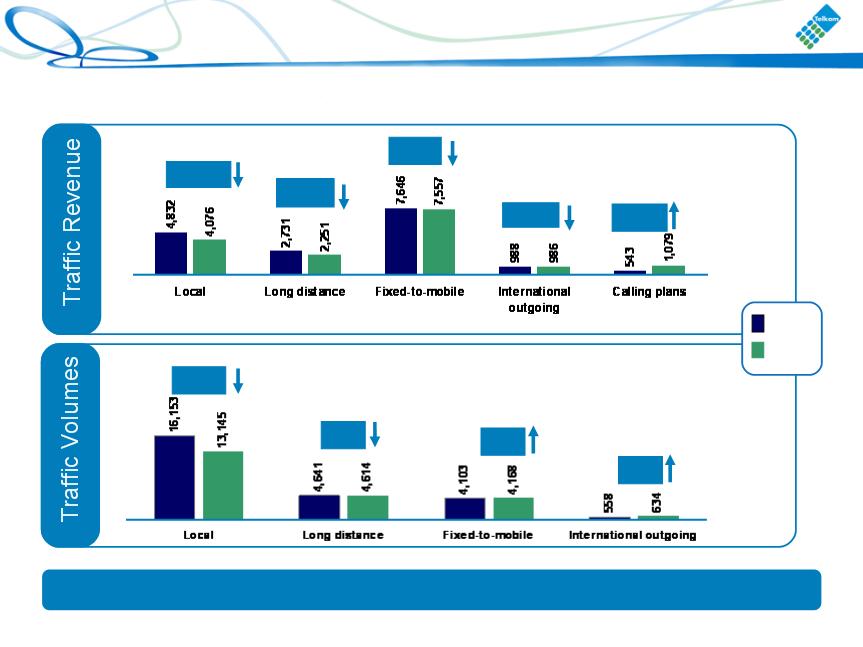
Fixed-line traffic
ZAR millions
Millions of minutes
(1.2%)
(15.6%)
(17.6%)
(0.2%)
(18.6)%
13.6%
(0.6%)
Traditional traffic declines, calling plans show strong growth
2007
2008
98.7%
1.6%
33

Fixed-line annuity revenue
ZAR millions | 2007 | 2008 | % |
Line rental | 4,503 | 4,731 | 5.1 |
Calling plans/packages | 543 | 1,079 | 98.7 |
CPE rental | 682 | 755 | 10.7 |
Value added services | 315 | 330 | 4.8 |
International other | 20 | 22 | 10.0 |
Total | 6,063 | 6,917 | 14.1 |
Recurring revenue continues to grow
• Annuity revenue includes all subscription revenue. It does not include usage or traffic related
revenue from calling plans/bundles, line installations, reconnection fees and CPE sales
revenue from calling plans/bundles, line installations, reconnection fees and CPE sales
34
Fixed-line revenue (continued)
ZAR millions | 2007 | 2008 | % |
Mobile | 816 | 838 | 2.7 |
Fixed domestic | 28 | - | |
International | 823 | 891 | 8.3 |
Interconnection revenue | 1,639 | 1,757 | 7.2 |
ZAR millions | 2007 | 2008 | % |
Leased lines | 5,825 | 6,460 | 10.9 |
Mobile leased facilities | 1,664 | 1,848 | 11.1 |
Data revenue | 7,489 | 8,308 | 10.9 |
Interconnection
Data
4.1%
61.2%
Millions of minutes
Subscribers
35
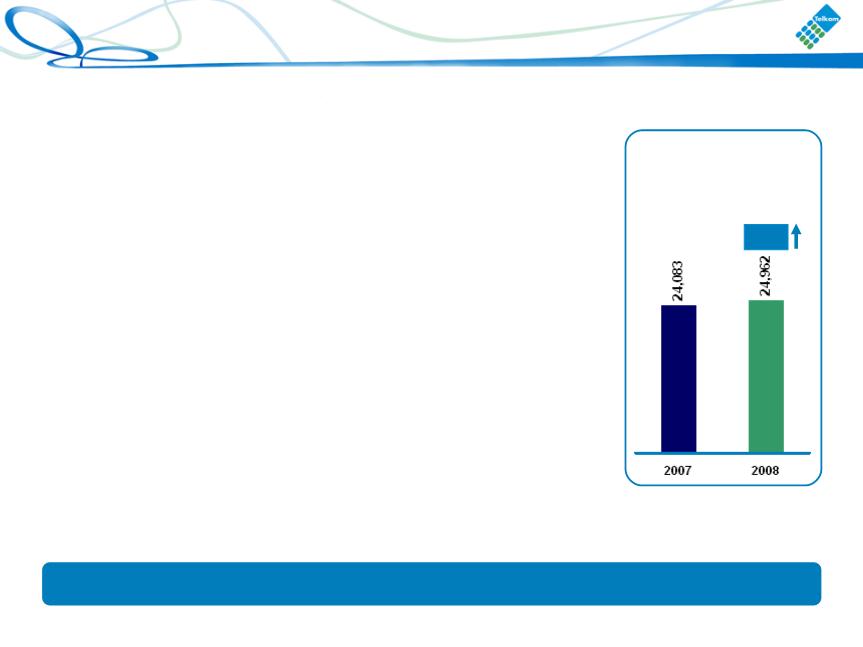
Fixed-line operating expenses
3.6%
ZAR millions | 2007 | 2008 | % |
Employee expenses | 7,096 | 7,397 | 4.2 |
Payments to other operators | 6,461 | 6,902 | 6.8 |
SG&A | 3,975 | 3,899 | (1.9) |
Services rendered | 2,206 | 2,413 | 9.4 |
Operating leases | 762 | 619 | (18.8) |
Depreciation, amortisation, impairment and write-offs | 3,583 | 3,732 | 4.2 |
Total
(Rm)
Operating expenses well contained in high inflationary environment
36
Fixed-line capex
ZAR millions | 2007 | 2008 | % |
Baseline expansion | 4,352 | 5,188 | 19.2 |
Sustainment | 416 | 277 | (33.4) |
Efficiencies & improvements | 1,141 | 841 | (26.3) |
Support | 501 | 451 | (10.0) |
Regulatory | 188 | 37 | (79.9) |
Total | 6,598 | 6,794 | 3.0 |
Telkom continues to build for the future
37

• Capex Plan of R30bn over 5 years from FY 2006 - FY 2010
• As at the end of the 2007/08 financial year R18,4bn (61%) of the R30bn
has been invested
has been invested
• An additional R2bn is planned for the last 2 years of the program
• The main drivers of the additional R2bn investment:
– FIFA 2010 requirements
– Fixed Wireless deployment
– International cable expansion
– Acceleration of a portion of the master plan
Investment in support of the strategy
Unpacking the R30bn 5 year capital expenditure program
38
Mobile financial highlights
Operating revenue
Operating profit
ZAR million
ZAR million
ZAR million
ZAR million
17.1%
17.8%
(4.0)%
15.0%
100% Vodacom (50% consolidated)
1. Including intangibles
Strong revenue growth
2007
2008
39

Leading the South African mobile market
Customers
ARPU1
Churn
Thousands
Thousands
ZAR
%
7.9%
10.9%
25.2%
1. Blended ARPU
ARPU remains stable
40

Performance in other African countries
ARPU1
ZAR
28%
30%
30%
25%
42%
1. Blended ARPU
Strong subscriber growth in African countries
2007
2008
41
Guidance for the next 3 financial years
Fixed-line and other
Constant revenue growth: CAGR to range between 5% - 10%
Capex to range between 23% and 27% of revenue over the
next 2 years and between 18% and 22% of revenue in the
2011 financial year
next 2 years and between 18% and 22% of revenue in the
2011 financial year
EBITDA margin to range between 32% and 36% - expect to see
improvement within the range towards the end of the 2011
financial year
improvement within the range towards the end of the 2011
financial year
Targeting net debt to EBITDA 1.3x
42

Thank you
Investor Relations
Nicola White
Tel: +27 12 311 5720
Fax: +27 12 311 5721
E-mail: whitenh@telkom.co.za
Telkom SA Limited
43