Exhibit 99.6

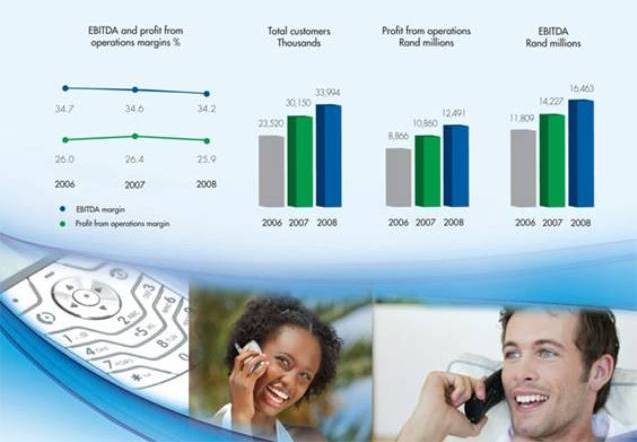
Total customers increased by 12.7% to 34.0 million
• Customers increased by 7.9% to 24.8 million in South Africa
• Customers increased by 29.6% to 4.2 million in Tanzania
• Customers increased by 25.0% to 3.3 million in the Democratic Republic of Congo
• Customers increased by 41.6% to 395 thousand in Lesotho
• Customers increased by 29.8% to 1.3 million in Mozambique
Revenue increased by 17.1% to R48.2 billion
Profit from operations increased by 15.0% to R12.5 billion
EBITDA increased by 15.7% to R16.5 billion
Net profit after taxation increased by 21.3% to R8.0 billion
Cash generated from operations increased by 17.8% to R16.3 billion
Dividends declared to Group shareholders increased by 10.0% to R5.9 billion


Vodacom Group (Proprietary) Limited, South Africa’s market leader in the provision of cellular services announces its results for the year ended March 31, 2008.
SOUTH AFRICA
Customers
The total number of customers increased by 7.9% to 24.8 million (2007: 23.0 million). The number of prepaid customers has increased by 6.4% to 21.2 million, while the number of contract customers has increased by 17.5% to 3.5 million.
The strong growth in customers was a direct result of the number of gross connections achieved, with continued levels of handset support to service providers in respect of the contract base, combined with decreased churn in the contract base.
Contract gross connections increased by 17.4% to 782 thousand (2007: 666 thousand), and prepaid gross connections increased by 11.1% to 11.2 million (2007: 10.1 million), bringing the total number of connections for the year to 12.0 million (2007: 10.9 million).
Loyalty and retention programmes continue to play an integral role in achieving the strategy of retaining market share and attracting new customers.
ARPU
During the period under review, total ARPU remained stable at R125 (2007: R125) per month mainly as a result of the implementation of the supplementary disconnection rule during September 2007.
Contract customer ARPU has decreased by 6.0% to R486 (2007: R517) per month. The main contributing factor to this decrease was the rapid growth in data customers as well as in the low end top up packages.
The developing market segment, through the prepaid service continued to drive market penetration in 2008 with the prepaid service making up 93.4% (2007: 93.2%) of all gross connections. The prepaid customer ARPU remained stable at R62 (2007: R63) per month.
Community services ARPU decreased by 23.6% to R689 (2007: R902) per month due to increased competition.
Churn
The cost of acquiring contract customers in a highly developed market is considerable. Vodacom implemented upgrade and retention policies over the last few years to retain its customers. Through the continued high level of handset support to service providers and an improvement in service to customers, contract churn remained low at 8.3% (2007: 9.7%).
The prepaid market is characterised by low acquisition costs due to the flexibility required by this market to access services. Prepaid churn increased during the year under review to 47.9% (2007: 37.5%) due to the supplementary disconnection rule implemented on prepaid customers. This change increased prepaid churn, but provides a better reflection of active prepaid SIM cards on the network.
Traffic and minutes of use
Total traffic increased with 11.7% to 22.8 billion (2007: 20.4 billion) minutes. This growth was due mainly to the 7.9% growth in the total customer base from 23.0 million to a base of 24.8 million at the end of March 31, 2008. Customer calling patterns continued the trend of the last few years where total mobile-to-mobile traffic increased with 13.5% while total mobile-to-fixed and fixed-to-mobile traffic only increased with 3.5%.
Minutes of use is reflective of voice trends outside and in excess of the bundle and showed a stabilised trend for the year under review. Contract minutes showed an 8.5% decrease to 172 (2007: 188) minutes per customer per month for 2008, as a result of high sales in hybrid products at the low end of the market; prepaid minutes showed a 2.1% decrease to 46 (2007: 47) minutes per customer per month in 2008.
Estimated market share
Despite strong competition, Vodacom remained the leader in the South African market with an estimated 55% (2007: 58%) market share as at March 31, 2008. The decline in market share is a result of increased deletions on the prepaid customer base and renewed efforts by the existing competitors to increase their share of the gross connections of both contract and prepaid customers. The cellular industry in South Africa has grown by an estimated 10% since March 2007. The market penetration of the cellular industry is now an estimated 94% (2007: 84%) of the population with a total

cellular market of approximately 45 million (2007: 40 million) customers. Prepaid customers continue to dominate the market and comprise an estimated 83% (2007: 83%) of the total cellular market.
NON-SOUTH AFRICAN OPERATIONS
Vodacom’s non-South African operations provide world-class communication services to 9.2 million customers (2007: 7.1 million). Profit from these operations increased by 51.6% to R790 million.
Vodacom Tanzania achieved a milestone in its customer base. The customer base increased by 29.6% to 4.2 million (2007: 3.2 million) at March 31, 2008. The Tanzanian market remains highly competitive, but low mobile penetration, estimated at 20% of the population combined with current economic growth signals further potential. Vodacom Tanzania’s estimated market share decreased slightly to 52% (2007: 55%) at March 31, 2008.
Vodacom Congo increased its customer base by 25.0% to 3.3 million (2007: 2.6 million) at March 31, 2008. Vodacom Congo retained its market lead with an estimated market share of 41% (2007: 47%) at March 31, 2008. The lower market share is the result of competitors cutting retail prices and offering various packages to attract new connections. The DRC has the lowest estimated mobile penetration of all Vodacom’s operations at 12% (2007: 9%) of the population.
Vodacom Lesotho is a small operation, but its estimated 80% market share at March 31, 2008 enables it to achieve high levels of profitability. Vodacom Lesotho increased its customer base by 41.6% to 395 thousand (2007: 279 thousand). Mobile penetration in Lesotho is now estimated at 26% (2006:17%).
Vodacom Mozambique increased its customer base by 29.8% to 1,282 thousand (2007: 988 thousand) at March 31, 2008. Vodacom Mozambique increased its estimated market share to 40% (2007: 35%) despite tough economic conditions, by being the value leader in the market. Mobile penetration is estimated at 16% (2007: 14%).

REVENUE
Geographical split
| Rand millions | % change | ||||
| Year ended March 31, | 2006 | 2007 | 2008 | 06/07 | 07/08 |
| South Africa, including holding companies | 31,069 | 37,007 | 42,784 | 19.1 | 15.6 |
| Tanzania | 1,312 | 1,729 | 2,354 | 31.8 | 36.1 |
| DRC | 1,334 | 1,914 | 2,297 | 43.5 | 20.0 |
| Lesotho | 170 | 227 | 309 | 33.5 | 36.1 |
| Mozambique | 158 | 269 | 434 | 70.3 | 61.3 |
| Revenue | 34,043 | 41,146 | 48,178 | 20.9 | 17.1 |
Revenue composition
| Rand millions | % of total | % change | ||||||||
| Year ended March 31, | 2006 | 2007 | 2008 | 2006 | 2007 | 2008 | 06/07 | 07/08 | ||
| Airtime, connection and access | 20,085 | 23,708 | 27,095 | 58.9 | 57.7 | 56.2 | 18.0 | 14.3 | ||
| Data | 2,038 | 3,342 | 5,002 | 6.0 | 8.1 | 10.4 | 64.0 | 49.7 | ||
| Interconnection | 6,697 | 7,835 | 8,887 | 19.7 | 19.0 | 18.5 | 17.0 | 13.4 | ||
| Equipment sales | 3,986 | 4,699 | 5,052 | 11.7 | 11.4 | 10.5 | 17.9 | 7.5 | ||
| International airtime | 971 | 1,306 | 1,836 | 2.9 | 3.2 | 3.8 | 34.5 | 40.6 | ||
| Other sales and services | 266 | 256 | 306 | 0.8 | 0.6 | 0.6 | (3.8) | 19.5 | ||
| Revenue | 34,043 | 41,146 | 48,178 | 100.0 | 100.0 | 100.0 | 20.9 | 17.1 | ||
Revenue increased by 17.1% for the year to March 31, 2008 boosted by a 49.7% increase in data revenue. The increase in revenue was mainly driven by a 12.7% increase in the customer base to 34.0 million customers. Prepaid customers represent 88.8% (2007: 89.4%) of the total customer base.
Data revenue
Geographical split
| Rand millions | % of total | % change | ||||||
| Year ended March 31, | 2006 | 2007 | 2008 | 2006 | 2007 | 2008 | 06/07 | 07/08 |
| South Africa | 1,886 | 3,113 | 4,669 | 92.6 | 93.1 | 93.4 | 65.1 | 50.0 |
| Tanzania | 108 | 146 | 207 | 5.3 | 4.4 | 4.1 | 35.2 | 41.8 |
| DRC | 25 | 52 | 79 | 1.2 | 1.6 | 1.6 | 108.0 | 51.9 |
| Lesotho | 16 | 23 | 31 | 0.8 | 0.7 | 0.6 | 43.8 | 34.8 |
| Mozambique | 3 | 8 | 16 | 0.1 | 0.2 | 0.3 | 166.7 | 100.0 |
| Data revenue | 2,038 | 3,342 | 5,002 | 100.0 | 100.0 | 100.0 | 64.0 | 49.7 |

Airtime, connection and access
Vodacom’s airtime, connection and access revenue increased primarily due to the number of customers increasing by 12.7% to 34.0 million.
Data
Vodacom’s data revenue increased mainly due to higher penetration levels, but also due to more affordable product offerings. Vodacom South Africa transmitted 4.7 billion (2007: 4.5 billion) SMSs over its network during the year ended March 31, 2008. The number of active data users includes: MMS users 1.4 million (2007: 1.2 million); data card and USB modem users 370 thousand (2007: 149 thousand); 3G/HSDPA handsets 1.3 million (2007: 584 thousand); Vodafone live! users 1,421 thousand (2007: 899 thousand); unique Mobile TV users 31 thousand (2007: 33 thousand).
Data revenue now constitutes 11.9% (2007: 9.4%) of service revenue (service revenue excludes equipment sales, starter pack sales and non-recurring revenue). Data revenue in all countries increased substantially, reaffirming the increased consumer connectivity needs.
Interconnection
Vodacom’s interconnection revenue increased by 13.4%, predominantly due to the growth in the customer base and the related increase in airtime traffic.
Equipment sales
In South Africa, handset sale volumes increased by 10.9% to 5.1 million (2007: 4.6 million) units. The growth in equipment unit sales was mainly driven by growth in customer bases, phone upgrades by customers and lower overall prices of new handsets due to more suppliers focusing on more affordable handsets. The average price per handset sold was R1,052 compared to R1,067 in the previous financial year.
International airtime
International airtime revenue of R1.8 billion, which increased by 40.6% year on year, comprises international calls by Vodacom customers, roaming revenue from Vodacom’s customers making and receiving calls whilst abroad and revenue from international visitors roaming on Vodacom’s networks.
Other sales and services
Revenue from other sales and services includes revenue from Vodacom’s cell captive insurance vehicle, wireless application service provider (“WASP”) revenue, site sharing rental income as well as other revenue from non-core operations.
PROFIT FROM OPERATIONS
Geographical Split
| Rand millions | % change | ||||
| Year ended March 31, | 2006 | 2007 | 2008 | 06/07 | 07/08 |
| South Africa | 8,602 | 10,293 | 11,669 | 19.7 | 13.4 |
| Tanzania | 263 | 346 | 460 | 31.6 | 32.9 |
| DRC | 117 | 277 | 364 | 136.8 | 31.4 |
| Lesotho | 51 | 75 | 123 | 47.1 | 64.0 |
| Mozambique | (144) | (177) | (157) | (22.9) | 11.3 |
| Holding companies | (23) | 46 | 32 | >200.0 | (30.4) |
| Profit from operations | 8,866 | 10,860 | 12,491 | 22.5 | 15.0 |
| Profit from operations margin (%) | 26.0 | 26.4 | 25.9 | 0.4 | (0.5) |
Profit from operations for the Group increased by 15.0% to R12.5 billion, based on revenue growth of 17.1% which was offset by cost increases in all operations in a rising inflationary environment and the start up costs of Vodacom Business. Operating expenses increased by 17.8% compared to revenue growth of 17.1%, resulting in Vodacom’s profit from operations margin decreasing to 25.9% (2007: 26.4%).
The Mozambique loss from operations includes an impairment of assets of R29.9 million (2007: R22.9 million).


EBITDA
Geographical split
| Rand millions | % change | ||||
| Year ended March 31, | 2006 | 2007 | 2008 | 06/07 | 07/08 |
| South Africa | 11,053 | 12,963 | 14,790 | 17.3 | 14.1 |
| Tanzania | 465 | 584 | 765 | 25.6 | 31.0 |
| DRC | 373 | 603 | 745 | 61.7 | 23.5 |
| Lesotho | 67 | 97 | 139 | 44.8 | 43.3 |
| Mozambique | (129) | (69) | (32) | 46.5 | 53.6 |
| Holding companies | (20) | 49 | 56 | > 200.0 | 14.3 |
| EBITDA | 11,809 | 14,227 | 16,463 | 20.5 | 15.7 |
| EBITDA margin (%) | 34.7 | 34.6 | 34.2 | (0.1) | (0.4) |
| EBITDA margin excluding equipment sales (%) | 39.9 | 39.9 | 39.3 | - | (0.6) |
Vodacom’s EBITDA margin adjusted for the impact of low margin cellular phone and equipment sales at 39.3% was 0.6% lower than the previous year at 39.9%.
OPERATING EXPENSES
Operating expenses composition
| Rand millions | % change | ||||
| Year ended March 31, | 2006 | 2007 | 2008 | 06/07 | 07/08 |
| Depreciation, amortisation and impairment | 2,943 | 3,384 | 3,941 | 15.0 | 16.5 |
| Payments to other network operators | 4,634 | 5,636 | 6,557 | 21.6 | 16.3 |
| Other direct network operating costs | 13,663 | 16,804 | 19,743 | 23.0 | 17.5 |
| Staff expenses | 2,042 | 2,373 | 2,976 | 16.2 | 25.4 |
| Marketing and advertising | 977 | 1,146 | 1,264 | 17.3 | 10.3 |
| Other operating expenditure | 1,043 | 1,064 | 1,362 | 2.0 | 28.0 |
| Other operating income | (125) | (120) | (156) | 4.0 | (30.0) |
| Operating expenses | 25,177 | 30,287 | 35,687 | 20.3 | 17.8 |
| Operating expenses as a % of revenue (%) | 74.0 | 73.6 | 74.1 | (0.4) | 0.5 |
Depreciation, amortisation and impairment
The depreciation expense is largely driven by capital expenditure on upgrading and expanding the Group’s networks. Capital expenditure on network equipment has increased in recent years with the implementation and expansion of 3G/HSDPA networks, but also through coverage strategies followed in the international operations.
The implementation of IAS 16: Property, Plant and Equipment, during the 2006 financial year, contributed to a lower depreciation charge for that year. Depreciation and amortisation increased by 16.5% (2007: 15.0%) to R3,941 million for the current financial year. Mozambique’s asset impairment amounted to R29.9 million (2007: R22.9 million).
Payments to other network operators
Payments to other network operators increased as a result of an increased amount of outgoing traffic terminating on other cellular networks, rather than on fixed-line networks. As the cost of terminating calls on other cellular networks is materially higher than calls terminating on fixed-line networks and as mobile substitution increases with

the growing number of total mobile users in South Africa, interconnection charges will continue increasing, putting pressure on margins.
Other direct network operating costs
Other direct network operating costs include the cost to connect customers onto the network as well as expenses such as cost of equipment and accessories sold, commissions paid to the distribution channels, customer retention expenses, regulatory and licence fees, distribution expenses, transmission rental costs as well as site and maintenance costs.
Staff expenses
Staff expenses increased primarily as a result of an increase in permanent headcount of 5.5% to 6,247 (2007: 5,920) employees in 2008. The headcount increase is mainly the result of the expansion of customer care operations, the strengthening of senior management structures to support the growth in ongoing operations and the launch of Vodacom Business. Annual salary increases and increased provisions for long-term incentive schemes also contributed to the increase in staff expenses.
Employee productivity has improved in all of Vodacom’s operations, as measured by customers per employee, improving with 6.9% to 5,442 (2007: 5,093) customers per employee.
Marketing and advertising
Marketing and advertising expenses are mainly driven by advertising related to new technology products and enhancing brand presence in all operations.
Other operating expenditure
The increase in other operating expenditure was primarily due to inflationary factors and the growth in the business. Other operating expenditure comprise of expenses such as accommodation, information technology costs, office administration, consultant expenses, social economic investment and insurance.
Other operating income
Other operating income comprises income that Vodacom does not consider as part of its core activities such as cost recoveries for risk management and consultancy services, franchise fees and rent received.
INTEREST, DIVIDENDS AND OTHER FINANCIAL INCOME AND FINANCE COSTS
Net gains/(losses) on financial instruments analysed by category, is as follows:
| Rand millions | % change | ||||
| Year ended March 31, | 2006 | 2007 | 2008 | 06/07 | 07/08 |
| Finance income | 130 | 75 | 72 | (42.3) | (4.0) |
| Finance expenses | (246) | (369) | (681) | (50.0) | (84.6) |
| Gain/(loss) on foreign exchange | |||||
| forward contract revaluation | (261) | 468 | 346 | >200.0 | (26.1) |
| Loss on revaluation of foreign denominated liabilities | (225) | (642) | (162) | (185.3) | 74.8 |
| (Loss)/gain on revaluation of foreign denominated assets | (27) | 10 | (15) | 137.0 | (>200.0) |
| Loss on interest rate swap revaluation | (7) | (10) | (10) | (42.9) | - |
| Gain/(loss) on sale of investments | (3) | (1) | 2 | 66.7 | >200.0 |
| Gain on revaluation of foreign denominated cash and cash equivalents | - | 6 | 24 | - | >200.0 |
| Total net losses on financial instruments | (639) | (463) | (424) | 27.5 | 8.4 |
Remeasurement of foreign exchange contracts (“FECs”), asset and liability revaluations, interest rate swaps, cash and cash equivalents, and a gain/loss on sale of investments resulted in a net gain of R185.1 million (2007: losses of R169.1 million).
In terms of a shareholders agreement, the minority shareholder in Vodacom Congo (RDC) s.p.r.l., Congolese Wireless Network s.p.r.l. (“CWN”) has a put option which comes into effect three years after the commencement date, December 1, 2001, and for a maximum of five years thereafter. In terms of the option, CWN shall be entitled to put to Vodacom International Limited such number of shares in and claims on loan account against Vodacom Congo (RDC) s.p.r.l. as constitute 19% of the entire issued share capital of that company. CWN can exercise this option in a maximum of three tranches and each tranche must consist of at least 5% of the entire issued share capital of Vodacom Congo (RDC) s.p.r.l. The option

price will be the fair market value of the related shares at the date the put option is exercised. The put option has a nil value as at March 31, 2008 and 2007. The option liability had a value of R396.5 million (2007: R249.3 million) as at
March 31, 2008.
Finance costs increased by 84.6% to R681.3 million mainly due to higher bank overdraft levels utilised to fund working capital. The net debt to equity ratio increased to 93.1% (2007: 72.8%) at March 31, 2008.
TAXATION
The taxation expense increased by 7.1% to R4.1 billion (2007: R3.8 billion) for the year ended March 31, 2008, mainly due to higher South African normal taxation paid on higher profits. Vodacom’s effective tax rate however decreased to 34.1% (2007: 36.9%) primarily due to a decrease in the secondary taxation on companies (“STC”) liability incurred as a result of the reduction in the STC rate from 12.5% to 10.0% effective October 1, 2007.
GROUP SHAREHOLDER DISTRIBUTIONS
Dividends declared for the 2008 financial year totalled R5,940.0 million (2007: R5,400.0 million), an increase of 10.0%. The final dividend of R3,190.0 million was paid on April 3, 2008.
CAPITAL EXPENDITURE
Capital expenditure additions
Geographical split
| Rand millions | % of total | % change | ||||||
| Year ended March 31, | 2006 | 2007 | 2008 | 2006 | 2007 | 2008 | 06/07 | 07/08 |
| South Africa | 4,384 | 4,993 | 4,252 | 85.3 | 73.9 | 71.8 | 13.9 | (14.8) |
| Tanzania | 318 | 957 | 713 | 6.2 | 14.2 | 12.1 | >200.0 | (25.5) |
| DRC | 273 | 506 | 658 | 5.3 | 7.5 | 11.1 | 85.3 | 30.0 |
| Lesotho | 26 | 25 | 36 | 0.5 | 0.4 | 0.6 | (3.8) | 44.0 |
| Mozambique | 121 | 85 | 111 | 2.4 | 1.3 | 1.9 | (29.8) | 30.6 |
| Holding companies | 16 | 182 | 146 | 0.3 | 2.7 | 2.5 | >200.0 | (19.8) |
Capital expenditure for the year | 5,138 | 6,748 | 5,916 | 100.0 | 100.0 | 100.0 | 31.3 | (12.3) |
Capital expenditure additions (including software) as a % of revenue (%) | 15.1 | 16.4 | 12.3 | - | - | - | 1.3 | (4.1) |
The Group’s investment in infrastructure amounted to R5.9 billion (2007: R6.7 billion) of which R4.9 billion (2007: R6.1 billion) relates to property, plant and equipment and R1.0 billion (2007: R0.6 billion) to computer software.
Closing capital expenditure investment at cost
Geographical split
| 2007 | 2008 | |||
| Year ended March 31, | R billions | Foreign | R billions | Foreign |
| South Africa (R billions) | 27.3 | - | 31.2 | - |
| Tanzania (TSH billions) | 2.7 | 456.7 | 3.8 | 579.1 |
| DRC (US$ millions) | 2.9 | 391.3 | 3.9 | 483.4 |
| Lesotho (Maloti millions) | 0.2 | 184.1 | 0.2 | 219.6 |
| Mozambique (MT millions) | 0.8 | 2,961.2 | 1.1 | 3,358.0 |
| Holding companies (R billions) | 0.2 | - | 0.1 | - |
| Closing capital expenditure investment at cost | 34.1 | - | 40.3 | - |

Property, plant and equipment (including software) that was sold and scrapped, amounted to R706.2 million (2007: R1,956.9 million).
Foreign currency translation differences for 2008 increased cumulative capital expenditure by R1,042.1 million (2007: R793.0 million).
It is Vodacom’s policy to hedge foreign denominated commitments of South African operations above a certain minimum level. However, Vodacom does not qualify for hedge accounting in terms of IAS 39 and therefore, all capital expenditure in South Africa is recorded at the exchange rate ruling at the date of acceptance of the equipment. Capital expenditure of Vodacom’s non-South African operations is translated at the average exchange rate of the Rand against the operation’s reporting currency for the period, while closing capital expenditure is translated at the closing exchange rate of the Rand against the reporting currency. For this reason, Vodacom’s capital expenditure in any given year cannot be properly evaluated without taking the exchange rate movements against the Rand into account, which are shown under the section “Financial instruments and risk management”.
FINANCIAL STRUCTURE AND FUNDING
Vodacom’s net debt position increased to R5.2 billion (2007: R2.7 billion) as at March 31, 2008. The Group’s net debt to EBITDA ratio was 52.6% (2007: 42.4%) while Vodacom’s net debt to equity ratio increased to 93.1% (2007: 72.8%).
Debt includes the final dividend of R3.2 billion (2007: R2.9 billion) payable to the Group’s shareholders and the STC thereon, due to these dividends being paid very soon after year-end and the materiality thereof. In addition, in terms of covenant calculations, certain intangible assets as well as minority interest are excluded from equity.

Funding sources
Vodacom’s ongoing objective is to fund all its non-South African operations by means of project finance, structured such that there is no recourse to our South African operations. Strong South African cash flows would then be utilised principally to pay dividends and make new growth-enhancing investments. The Group utilises its own funds and supported funding structures, subject to South African Reserve Bank approval to fund offshore investments in the initial stages of the investment, until the project is able to support project funding. Non-recourse funding for non-South African operations is not always suitable to high customer growth environments that require substantial capital expenditure.
While Vodacom Tanzania repaid its project funding on March 31, 2008, Vodacom Congo and Vodacom Mozambique are still substantially dependent on funding and guarantees from South Africa. These operations are funded by a mix of market priced direct loans

as well as security to facilitate their own credit lines.
In South Africa, debt consists primarily of finance lease liabilities, a long-term funding loan and short- term money market borrowings at variable interest rates.
Financial instruments and
Risk management
Subject to central bank regulations in the various countries as well as local market condition restrictions, Vodacom manages foreign currency risk, interest rate risk, credit risk and liquidity risk on an ongoing basis. The Group’s risk management procedures are described fully in the Group’s Annual Financial Statements.
Foreign exchange rates
| Rand exchange rate | % change | |||||
| Year ended March 31, | 2006 | 2007 | 2008 | 06/07 | 07/08 | |
| US Dollar | ||||||
| Average | 6.40 | 7.05 | 7.11 | 10.2 | 0.9 | |
| Closing | 6.19 | 7.29 | 8.13 | 17.8 | 11.5 | |
| Tanzanian Shilling | ||||||
| Average | 180.72 | 182.02 | 171.95 | 0.7 | (5.5) | |
| Closing | 198.03 | 170.83 | 151.99 | (13.7) | (11.0) | |
| Mozambican Metical | ||||||
| Average | 3.89 | 3.73 | 3.57 | (4.1) | (4.3) | |
| Closing | 4.37 | 3.63 | 2.99 | (16.9) | (17.6) | |
CASH FLOW
Vodacom had a positive free cash flow before shareholder distributions and financing activities of R3.4 billion (2007: R3.7 billion), a decrease of 8.0% when compared to the previous year due to investments in Smart companies amounting to R956.5 million. The cash generated from operations of R16.3 billion had a positive variance of R2.5 billion
(2007: positive variance of R2.8 billion) compared to the previous year.
CONCLUSION
As the Vodacom Group embraces the opportunities of a new era of electronic communications, we face exciting yet challenging times. We will nurture and grow our traditional mobile telephony business in five countries of operation while entering the wider world of providing convergence infrastructure and services.
Oyama Mabandla
Non-executive Chairman
Alan Knott-Craig
Chief Executive Officer


VODACOM SOUTH AFRICA
| Year ended March 31, | % change | ||||
| KEY INDICATORS | 2006 | 2007 | 2008 | 06/07 | 07/08 |
Customers (thousands) 1 | 19,162 | 23,004 | 24,821 | 20.1 | 7.9 |
| Contract | 2,362 | 3,013 | 3,541 | 27.6 | 17.5 |
| Prepaid | 16,770 | 19,896 | 21,177 | 18.6 | 6.4 |
| Community services | 30 | 95 | 103 | >200.0 | 8.4 |
| Gross connections (thousands) | 9,140 | 10,859 | 12,040 | 18.8 | 10.9 |
| Contract | 506 | 666 | 782 | 31.6 | 17.4 |
| Prepaid | 8,618 | 10,124 | 11,248 | 17.5 | 11.1 |
| Community services | 16 | 69 | 10 | >200.0 | (85.5) |
| Inactives (3 months - %) | 8.7 | 10.7 | 10.3 | 2.0 pts | (0.4 pts) |
| Contract | 2.4 | 3.1 | 4.0 | 0.7 pts | 0.9 pts |
| Prepaid | 9.6 | 11.8 | 11.4 | 2.2 pts | (0.4 pts) |
Churn (%) 2 | 17.7 | 33.8 | 42.3 | 16.1 pts | 8.5 pts |
| Contract | 10.0 | 9.7 | 8.3 | (0.3 pts) | (1.4 pts) |
| Prepaid | 18.8 | 37.5 | 47.9 | 18.7 pts | 10.4 pts |
Traffic (millions of minutes) 3 | 17,066 | 20,383 | 22,769 | 19.4 | 11.7 |
| Outgoing | 11,354 | 13,638 | 15,323 | 20.1 | 12.4 |
| Incoming | 5,712 | 6,745 | 7,446 | 18.1 | 10.4 |
ARPU (Rand per month) 4 | 139 | 125 | 125 | (10.1) | - |
| Contract | 572 | 517 | 486 | (9.6) | (6.0) |
| Prepaid | 69 | 63 | 62 | (8.7) | (1.6) |
| Community services | 1,796 | 902 | 689 | (49.8) | (23.6) |
Minutes of use per month 5 | 74 | 69 | 66 | (6.8) | (4.3) |
| Contract | 206 | 188 | 172 | (8.7) | (8.5) |
| Prepaid | 49 | 47 | 46 | (4.1) | (2.1) |
| Community services | 2,327 | 1,151 | 883 | (50.5) | (23.3) |
Gross capex spend (Rand millions) 6 | 4,384 | 4,993 | 4,251 | 13.9 | (14.9) |
| Capex as a % of revenue (%) | 14.1 | 13.5 | 9.9 | (0.6 pts) | (3.6 pts) |
Cumulative capex (Rand millions) 6 | 24,095 | 27,310 | 30,742 | 13.3 | 12.6 |
| Capex per customer (Rand) | 1,257 | 1,187 | 1,239 | (5.6) | 4.4 |
| Number of employees | 4,148 | 4,388 | 4,504 | 5.8 | 2.6 |
| Customers per employee | 4,619 | 5,242 | 5,511 | 13.5 | 5.1 |
Estimated mobile penetration (%) 7 | 71 | 84 | 94 | 13 pts | 10 pts |
Estimated mobile market share (%) 7 | 58 | 58 | 55 | - | (3.0 pts) |
Notes
| 1. | Customer totals are based on the total number of customers registered on Vodacom’s network, which have not been disconnected, including inactive customers, as at the end of the period indicated. |
| 2. | Churn is calculated by dividing the average monthly number of disconnections during the period by the average monthly total reported customer base during the period. |
| 3. | Traffic comprises total traffic registered on Vodacom’s network, including bundled minutes, outgoing international roaming calls and calls to free services, but excluding national roaming and incoming international roaming calls. |
| 4. | ARPU is calculated by dividing the average monthly revenue during the period by the average monthly total reported customer base during the period. ARPU excludes revenue from equipment sales, other sales and services and revenue from national and international users roaming on Vodacom’s networks. |
| 5. | Minutes of use per month is calculated by dividing the average monthly minutes during the period by the average monthly total reported customer base during the period. Minutes of use exclude calls to free services, bundled minutes and data minutes. |
| 6. | Cumulative capital expenditure (“capex”) includes software. |
| 7. | Estimated mobile penetration and market share is calculated based on Vodacom’s total reported customers and the estimated total reported customers of MTN and Cell C. |

VODACOM TANZANIA
| Year ended March 31 | % change | ||||
| KEY INDICATORS | 2006 | 2007 | 2008 | 06/07 | 07/08 |
Customers (thousands) 1 | 2,091 | 3,247 | 4,207 | 55.3 | 29.6 |
Contract | 7 | 14 | 16 | 100.0 | 14.3 |
Prepaid | 2,081 | 3,223 | 4,181 | 54.9 | 29.7 |
Community services | 3 | 10 | 10 | >200.0 | - |
| Gross connections (thousands) | 1,353 | 2,092 | 2,645 | 54.6 | 26.4 |
| Churn (%) | 28.5 | 35.6 | 45.5 | 7.1 pts | 9.9 pts |
ARPU (Rand) 2 | 67 | 52 | 49 | (22.4) | (5.8) |
| Gross capex spend (Rand millions) | 318 | 957 | 713 | >200.0 | (25.5) |
| Capex as a % of revenue (%) | 24.3 | 55.3 | 30.3 | 31.0 pts | (25.0 pts) |
| Cumulative capex (Rand millions) | 1,503 | 2,674 | 3,810 | 77.9 | 42.5 |
Number of employees 3 | 438 | 527 | 618 | 20.3 | 17.3 |
| Customers per employee | 4,774 | 6,161 | 6,807 | 29.1 | 10.5 |
Estimated mobile penetration (%) 4 | 9 | 16 | 20 | 7 pts | 4 pts |
Estimated mobile market share (%) 4 | 58 | 55 | 52 | (3 pts) | (3 pts) |
VODACOM CONGO
| Year ended March 31, | % change | ||||
| KEY INDICATORS | 2006 | 2007 | 2008 | 06/07 | 07/08 |
Customers (thousands) 1 | 1,571 | 2,632 | 3,289 | 67.5 | 25.0 |
Contract | 14 | 17 | 21 | 21.4 | 23.5 |
Prepaid | 1,538 | 2,587 | 3,209 | 68.2 | 24.0 |
Community services | 19 | 28 | 59 | 47.4 | 110.7 |
| Gross connections (thousands) | 892 | 1,688 | 2,141 | 89.2 | 26.8 |
| Churn (%) | 28.1 | 30.4 | 48.0 | 2.3 pts | 17.6 pts |
ARPU (Rand) 2 | 86 | 77 | 59 | (10.5) | (23.4) |
| Gross capex spend (Rand millions) | 273 | 506 | 658 | 85.3 | 30.0 |
| Capex as a % of revenue (%) | 20.5 | 26.4 | 28.7 | 5.9 pts | 2.3 pts |
| Cumulative capex (Rand millions) | 2,000 | 2,852 | 3,928 | 42.6 | 37.7 |
Number of employees 3 | 479 | 627 | 691 | 30.9 | 10.2 |
| Customers per employee | 3,279 | 4,198 | 4,759 | 28.0 | 13.4 |
Estimated mobile penetration (%) 4 | 6 | 9 | 12 | 3 pts | 3 pts |
Estimated mobile market share (%) 4 | 48 | 47 | 41 | (1 pt) | (6 pts) |
| Notes | |
| 1. | Customer totals are based on the total number of customers registered on Vodacom's network, which have not been disconnected, including inactive customers, as at the end of the period indicated. |
| 2. | ARPU is calculated by dividing the average monthly revenue during the period by the average monthly total reported customer base during the period. ARPUexcludes revenue from equipment sales, other sales and services and revenue from national and international users roaming on Vodacom's networks. |
| 3. | Headcount includes secondees. |
| 4. | Estimated mobile penetration and market share is calculated based on Vodacom's estimates. |

VODACOM LESOTHO
| Year ended March 31 | % change | ||||
| KEY INDICATORS | 2006 | 2007 | 2008 | 06/07 | 07/08 |
Customers (thousands) 1 | 206 | 279 | 395 | 35.4 | 41.6 |
Contract | 3 | 3 | 4 | - | 33.3 |
Prepaid | 200 | 272 | 383 | 36.0 | 40.8 |
Community services | 3 | 4 | 8 | 33.3 | 100.0 |
| Gross connections (thousands) | 98 | 119 | 176 | 21.4 | 47.9 |
| Churn (%) | 22.3 | 19.0 | 17.8 | (3.3 pts) | (1.2 pts) |
ARPU (Rand) 2 | 78 | 75 | 73 | (3.8) | (2.7) |
| Gross capex spend (Rand millions) | 26 | 25 | 36 | (3.8) | 44.0 |
| Capex as a % of revenue (%) | 15.2 | 11.0 | 11.6 | (4.2 pts) | 0.6 pts |
| Cumulative capex (Rand millions) | 225 | 184 | 220 | (18.2) | 19.6 |
Number of employees 3 | 67 | 60 | 70 | (10.4) | 16.7 |
| Customers per employee | 3,071 | 4,644 | 5,642 | 51.2 | 21.5 |
Estimated mobile penetration (%) 4 | 13 | 17 | 26 | 4 pts | 9 pts |
Estimated mobile market share (%) 4 | 80 | 80 | 80 | - | - |
VODACOM MOZAMBIQUE
| Year ended March 31 | % change | ||||
| KEY INDICATORS | 2006 | 2007 | 2008 | 06/07 | 07/08 |
Customers (thousands) 1 | 490 | 988 | 1,282 | 101.6 | 29.8 |
Contract | 8 | 15 | 21 | 87.5 | 40 |
Prepaid | 482 | 973 | 1,250 | 101.9 | 28.5 |
Community services | - | - | 11 | n/a | n/a |
| Gross connections (thousands) | 342 | 797 | 951 | 133.0 | 19.3 |
| Churn (%) | 32.2 | 41.7 | 58.7 | 9.5 pts | 17.0 pts |
ARPU (Rand) 2 | 36 | 28 | 29 | (22.2) | 3.6 |
| Gross capex spend (Rand millions) | 121 | 85 | 111 | (29.8) | 30.6 |
| Capex as a % of revenue (%) | 76.8 | 31.7 | 25.7 | (45.1 pts) | (6.0 pts) |
| Cumulative capex (Rand millions) | 605 | 816 | 1,123 | 34.9 | 37.6 |
Number of employees 3 | 170 | 129 | 157 | (24.1) | 21.7 |
| Customers per employee | 2,885 | 7,659 | 8,168 | 165.5 | 6.6 |
Estimated mobile penetration (%) 4 | 8 | 14 | 16 | 6 pts | 2 pts |
Estimated mobile market share (%) 4 | 30 | 35 | 40 | 5 pts | 5 pts |
| Notes | |
| 1. | Customer totals are based on the total number of customers registered on Vodacom's network, which have not been disconnected, including inactive customers, as at the end of the period indicated. |
| 2. | ARPU is calculated by dividing the average monthly revenue during the period by the average monthly total reported customer base during the period. ARPUexcludes revenue from equipment sales, other sales and services and revenue from national and international users roaming on Vodacom's networks. |
| 3. | Headcount includes secondees. |
| 4. | Estimated mobile penetration and market share is calculated based on Vodacom's estimates. |


| 2006 | 2007 | 2008 | |
| Rm | Rm | Rm | |
| Revenue | 34,042.5 | 41,146.4 | 48,177.8 |
| Other operating income | 125.1 | 119.8 | 155.6 |
| Direct network operating cost | (18,297.2) | (22,439.8) | (26,299.5) |
| Depreciation | (2,651.6) | (2,901.8) | (3,366.0) |
| Staff expenses | (2,042.1) | (2,372.5) | (2,975.4) |
| Marketing and advertising expenses | (976.9) | (1,146.4) | (1,264.3) |
| Other operating expenses | (1,042.7) | (1,063.6) | (1,362.4) |
| Amortisation of intangible assets | (344.2) | (459.4) | (545.2) |
| Impairment of assets | 52.8 | (22.9) | (29.9) |
| Profit from operations | 8,865.7 | 10,859.8 | 12,490.7 |
| Finance income | 129.9 | 74.5 | 72.3 |
| Finance costs | (246.0) | (369.3) | (681.3) |
| Gains/(Losses) on remeasurement and disposal of | |||
| financial instruments | (523.1) | (169.0) | 185.1 |
| Profit before taxation | 8,226.5 | 10,396.0 | 12,066.8 |
| Taxation | (3,083.7) | (3,836.0) | (4,109.2) |
| Net profit | 5,142.8 | 6,560.0 | 7,957.6 |
| Attributable to: | |||
| Equity shareholders | 5,026.1 | 6,342.4 | 7,811.4 |
| Minority interests | 116.7 | 217.6 | 146.2 |
| 2006 | 2007 | 2008 | |
| R | R | R | |
| Basic and diluted earnings per share | 502,610 | 634,240 | 781,140 |
| Dividend per share | 450,000 | 540,000 | 594,000 |


| 2006 | 2007 | 2008 | |
| Rm | Rm | Rm | |
| ASSETS | |||
| Non-current assets | 16,079.2 | 20,844.3 | 24,468.3 |
| Property, plant and equipment | 13,386.6 | 17,073.2 | 19,119.6 |
| Intangible assets | 1,954.9 | 2,700.3 | 4,224.1 |
| Financial assets | 92.1 | 209.5 | 244.2 |
| Deferred taxation | 297.6 | 386.1 | 455.1 |
| Deferred cost | 311.2 | 396.4 | 333.3 |
| Lease assets | 36.8 | 78.8 | 92.0 |
| Current assets | 8,688.6 | 7,625.9 | 9,706.9 |
| Deferred cost | 451.8 | 574.8 | 705.9 |
| Financial assets | 149.3 | 207.5 | 444.9 |
| Inventory | 454.3 | 364.3 | 636.9 |
| Trade and other receivables | 4,474.0 | 5,675.0 | 6,801.1 |
| Lease assets | 13.1 | 32.9 | 140.5 |
| Cash and cash equivalents | 3,146.1 | 771.4 | 977.6 |
| Total assets | 24,767.8 | 28,470.2 | 34,175.2 |
| EQUITY AND LIABILITIES | |||
| Ordinary share capital | * | * | * |
| Retained earnings | 8,583.0 | 9,523.2 | 11,392.9 |
| Non-distributable reserves | (194.0) | (97.4) | 8.8 |
| Equity attributable to equity holders of the parent | 8,389.0 | 9,425.8 | 11,401.7 |
| Minority interests | 283.3 | 221.2 | 403.6 |
| Total equity | 8,672.3 | 9,647.0 | 11,805.3 |
| Non-current liabilities | 2,236.6 | 3,812.1 | 4,788.2 |
| Interest bearing debt | 819.2 | 2,051.4 | 3,025.8 |
| Non-interest bearing debt | - | 3.0 | 6.0 |
| Deferred taxation | 602.3 | 757.3 | 776.5 |
| Deferred revenue | 320.3 | 412.3 | 358.8 |
| Provisions | 372.3 | 377.5 | 373.7 |
| Other non-current liabilities | 122.5 | 210.6 | 247.4 |
| Current liabilities | 13,858.9 | 15,011.1 | 17,581.7 |
| Trade and other payables | 5,104.7 | 6,874.4 | 7,561.3 |
| Deferred revenue | 1,604.5 | 1,904.8 | 2,229.9 |
| Taxation payable | 630.2 | 1,112.7 | 580.5 |
| Non-interest bearing debt | 4.3 | - | - |
| Interest bearing debt | 1,645.5 | 501.0 | 502.9 |
| Provisions | 623.0 | 741.8 | 909.5 |
| Dividends payable | 2,800.0 | 2,990.0 | 3,190.0 |
| Derivative financial liabilities | 60.9 | 7.2 | 10.8 |
| Bank borrowings | 1,385.8 | 879.2 | 2,596.8 |
| Total equity and liabilities | 24,767.8 | 28,470.2 | 34,175.2 |
| * Share capital R100 |


| Attributable to equity shareholders | ||||||
Share capital | Retained earnings | Non- Distribut- able reserves | Total | Minority interests | Total equity | |
| Rm | Rm | Rm | Rm | Rm | Rm | |
| Balance at March 31, 2005 | * | 8,059.1 | (299.9) | 7,759.2 | 128.7 | 7,887.9 |
| Net profit for the period | - | 5,026.1 | - | 5,026.1 | 116.7 | 5,142.8 |
| Dividends declared | - | (4,500.0) | - | (4,500.0) | (0.9) | (4,500.9) |
| Business combinations and | ||||||
| other acquisitions | - | - | - | - | 46.5 | 46.5 |
| Minority shares of VM, S.A.R.L. | - | - | - | - | 8.0 | 8.0 |
| Contingency reserve | - | (2.2) | 2.2 | - | - | - |
| Net gains and losses not | ||||||
| recognised in the income statement | ||||||
| Foreign currency translation reserve | - | - | 103.9 | 103.9 | (15.6) | 88.3 |
| Revaluation of available-for-sale | ||||||
| investments | - | - | (0.2) | (0.2) | (0.1) | (0.3) |
| Balance at March 31, 2006 | * | 8,583.0 | (194.0) | 8,389.0 | 283.3 | 8,672.3 |
| Net profit for the period | - | 6,342.4 | - | 6,342.4 | 217.6 | 6,560.0 |
| Dividends declared | - | (5,400.0) | - | (5,400.0) | (170.8) | (5,570.8) |
| Business combinations and | ||||||
| other acquisitions | - | - | - | (136.4) | (136.4) | |
| Contingency reserve | - | (2.2) | 2.2 | - | - | - |
| Net gains and losses not | ||||||
| recognised in the income statement | ||||||
| Foreign currency translation reserve | - | - | 94.4 | 94.4 | 27.5 | 121.9 |
| Balance at March 31, 2007 | * | 9,523.2 | (97.4) | 9,425.8 | 221.2 | 9,647.0 |
| Net profit for the period | - | 7,811.4 | - | 7,811.4 | 146.2 | 7,957.6 |
| Dividends declared | - | (5,940.0) | - | (5,940.0) | (0.6) | (5,940.6) |
| Business combinations and | ||||||
| other acquisitions | - | - | - | - | (6.1) | (6.1) |
| Disposal of subsidiaries | - | - | - | - | (0.3) | (0.3) |
| Minority shares of VM, S.A.R.L. | - | - | - | - | 0.8 | 0.8 |
| Contingency reserve | - | (1.7) | 1.7 | - | - | - |
| Net gains and losses not | ||||||
| recognised in the income statement | ||||||
| Foreign currency translation reserve | - | - | 87.7 | 87.7 | 42.4 | 130.1 |
| Revaluation of available-for-sale | ||||||
| investments | - | - | 16.8 | 16.8 | - | 16.8 |
| Balance at March 31, 2008 | * | 11,392.9 | 8.8 | 11,401.7 | 403.6 | 11,805.3 |
| * Share capital R100 | ||||||


| 2006 | 2007 | 2008 | |
| Rm | Rm | Rm | |
| CASH FLOW FROM OPERATING ACTIVITIES | |||
| Cash receipts from customers | 33,132.7 | 40,380.0 | 47,409.6 |
| Cash paid to suppliers and employees | (22,042.4) | (26,513.9) | (31,076.1) |
| Cash generated from operations | 11,090.3 | 13,866.1 | 16,333.5 |
| Finance costs paid | (214.3) | (326.6) | (669.6) |
| Finance income received | 124.1 | 41.7 | 74.3 |
| Realised net losses on remeasurement and | |||
| disposal of financial instruments | (17.6) | (38.8) | (151.0) |
| Taxation paid | (2,980.3) | (3,303.3) | (4,721.5) |
| Dividends paid – equity shareholders | (3,500.0) | (5,300.0) | (5,650.0) |
| Dividends paid – minority shareholders | (0.9) | (80.8) | (90.6) |
| Net cash flows from operating activities | 4,501.3 | 4,858.3 | 5,125.1 |
| CASH FLOW FROM INVESTING ACTIVITIES | |||
Additions to property, plant and equipment and intangible assets | (4,788.4) | (5,955.3) | (6,540.6) |
| Proceeds on disposal of property, plant and | |||
| equipment and intangible assets | 31.2 | 98.3 | 10.2 |
| Business combinations and other acquisitions | (0.1) | (591.2) | (956.5) |
| Disposal of subsidiaries | 15.7 | ||
| Other investing activities | (33.5) | (135.7) | (31.0) |
| Net cash flows utilised in investing activities | (4,790.8) | (6,583.9) | (7,502.2) |
| CASH FLOW FROM FINANCING ACTIVITIES | |||
| Non-interest bearing debt incurred | - | 3.0 | - |
| Non-interest bearing debt repaid | - | - | (3.0) |
| Interest bearing debt incurred | 32.3 | 6.0 | 1,000.0 |
| Interest bearing debt repaid | (89.7) | (141.3) | (117.5) |
| Finance lease capital repaid | (50.2) | (67.7) | (108.9) |
| Bank borrowings | - | - | 2,456.0 |
| Share capital and premium movement of minority | |||
| shareholders | - | - | 7.2 |
| Net cash flows from/(utilised) in financing activities | (107.6) | (200.0) | 3,233.8 |
NET INCREASE/(DECREASE) IN CASH AND CASH EQUIVALENTS | (397.1) | (1,925.6) | 856.7 |
(Bank borrowings)/cash and cash equivalents at the beginning of the year | 2,173.0 | 1,760.3 | (107.8) |
| Effect of foreign exchange rate changes | (15.6) | 57.5 | 87.9 |
| CASH AND CASH EQUIVALENTS/ | |||
| (BANK BORROWINGS) AT THE END OF THE YEAR | 1,760.3 | (107.8) | 836.8 |


This presentation has been prepared and published by Vodacom Group (Proprietary) Limited.
Vodacom Group (Proprietary) Limited is a private company and as such is not required by the Companies Act 61 of 1973, as amended, to publish its results.
Vodacom Group (Proprietary) Limited makes no guarantee, assurance, representation and/or warranty as to the accuracy of the information contained in this presentation and will not be held liable for any reliance placed on the information contained in this presentation.
The information contained in this presentation is subject to change without notice and may be incomplete or condensed. In addition, this presentation may not contain all material information pertaining to Vodacom Group (Proprietary) Limited and its subsidiaries.
Without in any way derogating from the generality of the foregoing, it should be noted that:
| • | Many of the statements included in this presentation are forward-looking statements that involve risks and/or uncertainties and caution must be exercised in placing any reliance on these statements. Moreover, Vodacom Group (Proprietary) Limited will not necessarily update any of these statements after the date of this presentation either to conform them to actual results or to changes in its expectations. |
| • | Insofar as the shareholders of Vodacom Group (Proprietary) Limited are listed and offer their shares publicly for sale on recognised stock exchanges locally and/or internationally, potential investors in the shares of Vodacom Group (Proprietary) Limited’s shareholders are cautioned not to place undue reliance on this presentation. |
