Exhibit 99.5
Vodacom Group (Pty) Ltd
Annual Financial Results
March 31, 2008

Operational highlights
Alan Knott-Craig
Chief Executive Officer
Total customers
34.0 million
12.7%
12.7%
High gross connections: increase of 15.4% year on year to 18.0 million
Revenue
R48.2 billion
17.1%
17.1%
Profit from operations
(Statutory operating profit)
(Statutory operating profit)
R12.5 billion
15.0%
15.0%
EBITDA
R16.5 billion
15.7%
Net profit after tax
R8.0 billion
21.3%
21.3%
Dividends
R5.9 billion
10.0%
10.0%
EBITDA margin: 34.2% (2007: 34.6%)
Group highlights
For the year ended March 31, 2008 vs. prior year
For the year ended March 31, 2008 vs. prior year
10.0%
year on
year
year on
year
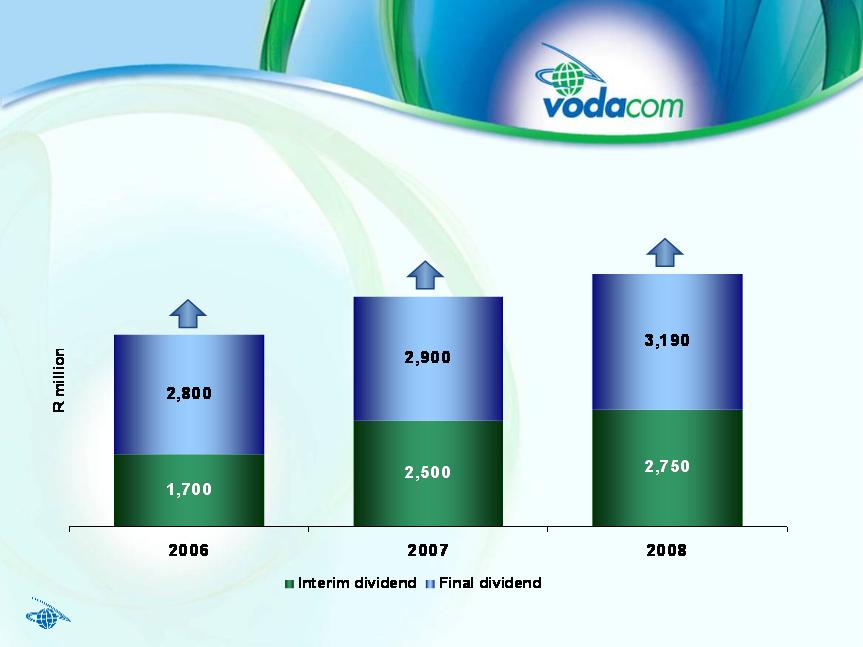
To date R23.0 billion in dividends has been distributed to shareholders
20.0%
year on
year
year on
year
32.4%
year on
year
year on
year
Group shareholder distributions
(after tax)
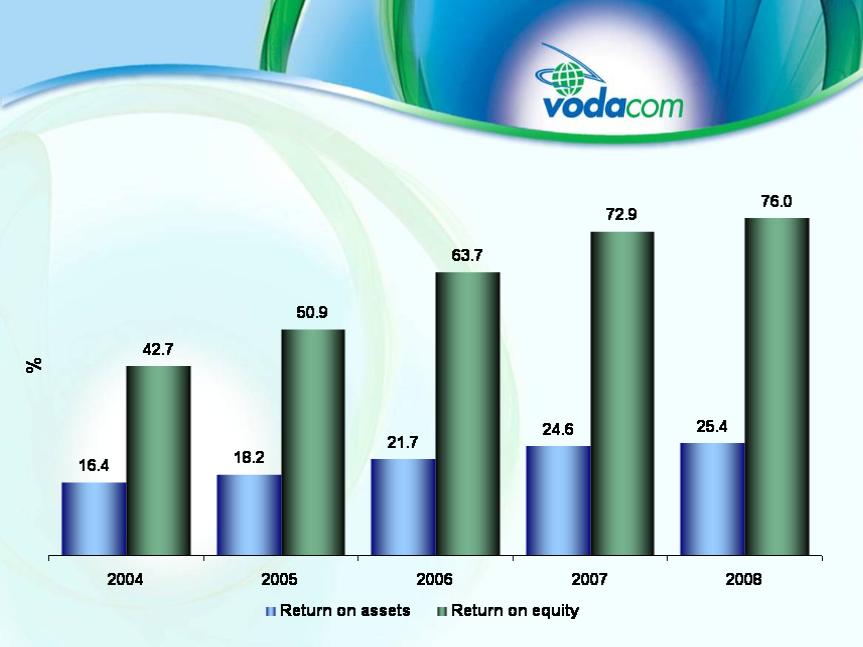
Group shareholder returns
March 2008 and results for the past 4 years
March 2008 and results for the past 4 years
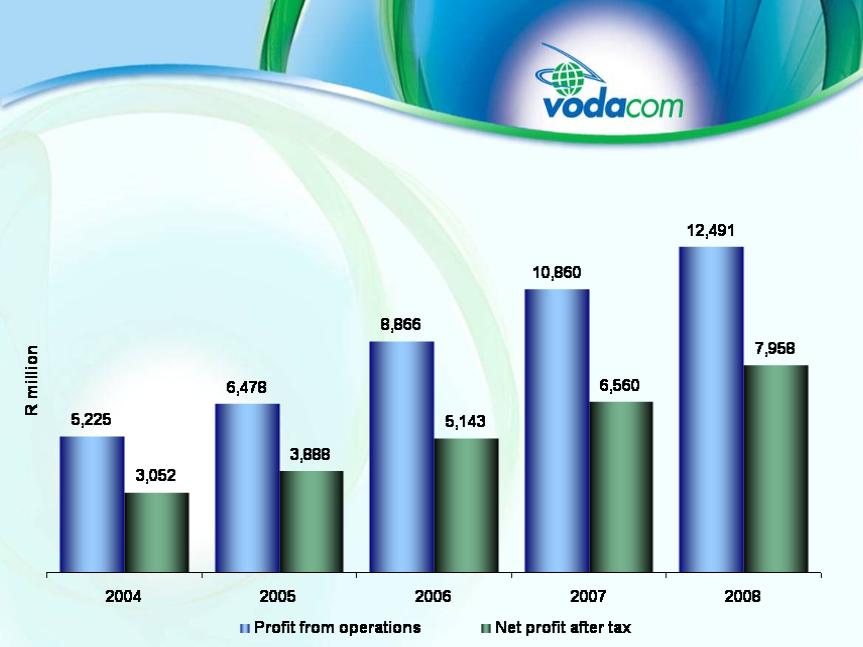
Profit from operations and net profit after tax
March 2008 and results for the past 4 years
March 2008 and results for the past 4 years
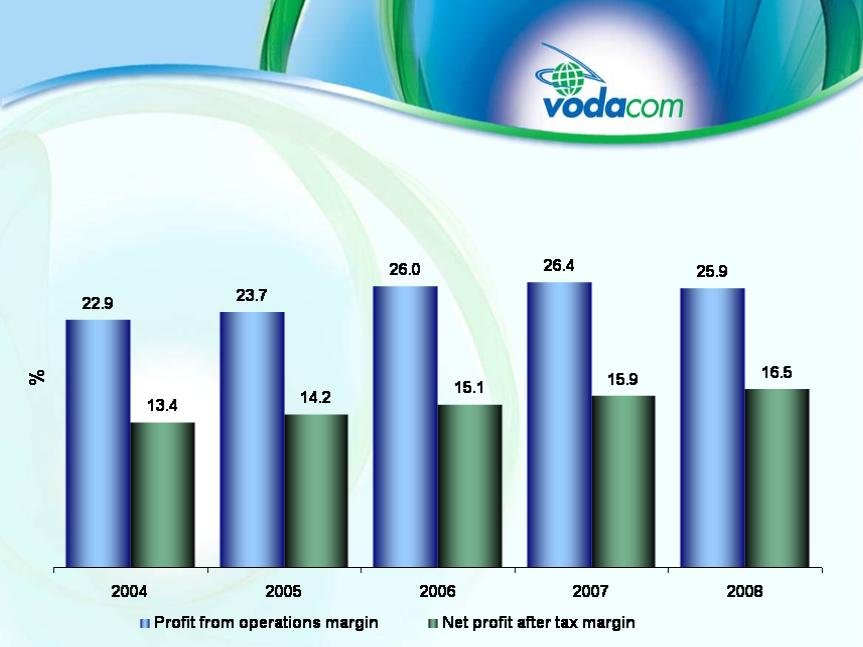
Profit from operations margin and net profit after tax margin
March 2008 and results for the past 4 years
March 2008 and results for the past 4 years
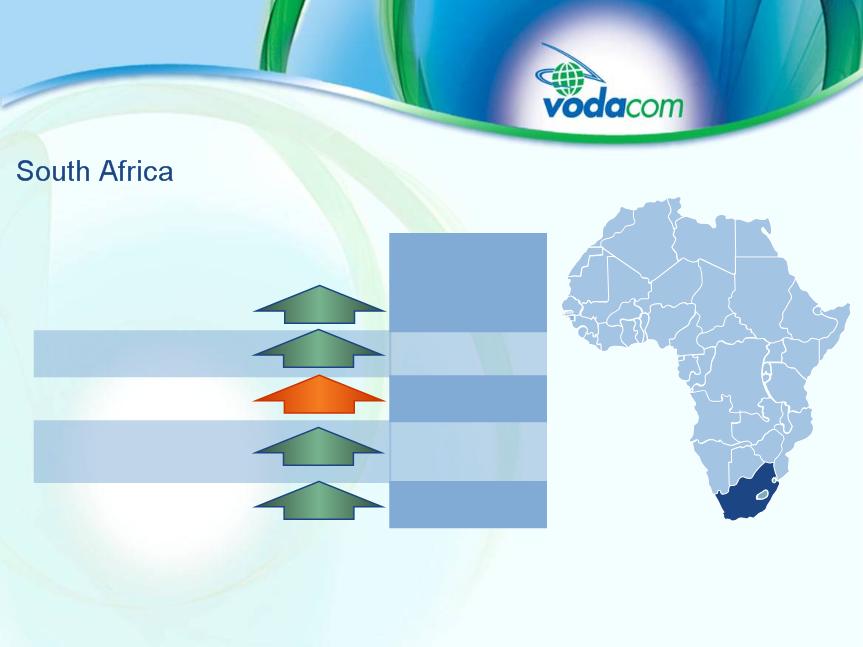
| 2008 | |
| • Total customers | 24.8 million |
| • Gross connections | 12.0 million |
| • Churn % * | 42.3% |
| • Estimated SIM card penetration % | 94% |
| • Profit from operations | R11.7 billion |
7.9%
10.9%
10 pts
13.4%
8.5 pts
* Supplementary disconnection rule implemented during September 2007
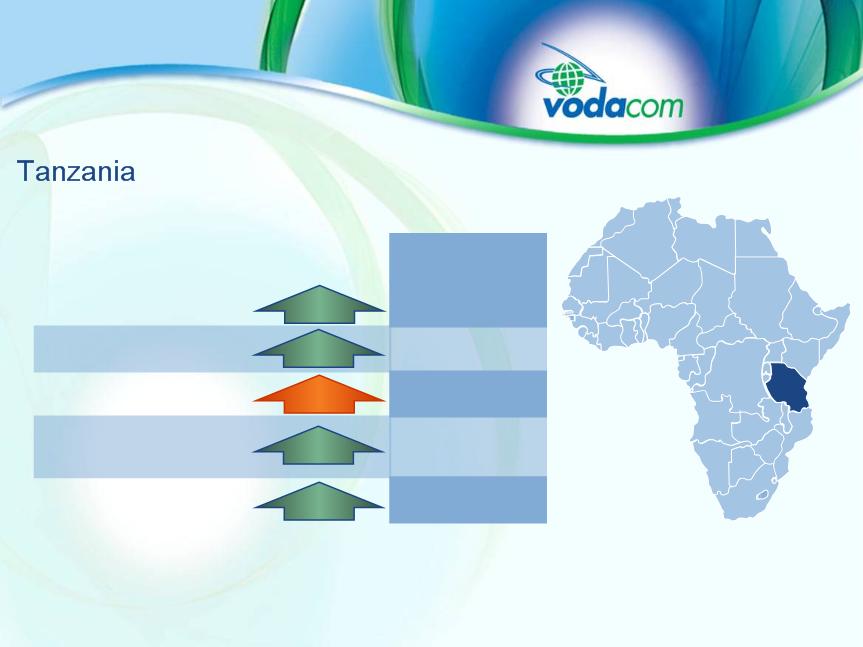
2008 | |
| • Total customers | 4.2 million |
| • Gross connections | 2.6 million |
| • Churn % | 45.5% |
| • Estimated SIM card penetration % | 20% |
| • Profit from operations | R460 million |
29.6%
26.4%
4 pts
32.9%
9.9 pts

2008 | |
| • Total customers | 3.3 million |
| • Gross connections | 2.1 million |
| • Churn % | 48.0% |
| • Estimated SIM card penetration % | 12% |
| • Profit from operations | R364 million |
25.0%
26.8%
3 pts
31.4%
17.6 pts
Democratic Republic of Congo (DRC)
2008 | |
| • Total customers | 395 thousand |
| • Gross connections | 176 thousand |
| • Churn % 1.2 pts | 17.8% |
| • Estimated SIM card penetration % | 26% |
| • Profit from operations | R123 million |
41.6%
47.9%
64.0%
9 pts
Lesotho
2008 | |
| • Total customers | 1.3 million |
| • Gross connections | 951 thousand |
| • Churn % | 58.7% |
| • Estimated SIM card penetration % | 16% |
| • Loss from operations 11.3% | R157 million |
• Loss from operations excluding impairment 17.5% | R127 million |
29.8%
19.3%
2 pts
17.0 pts
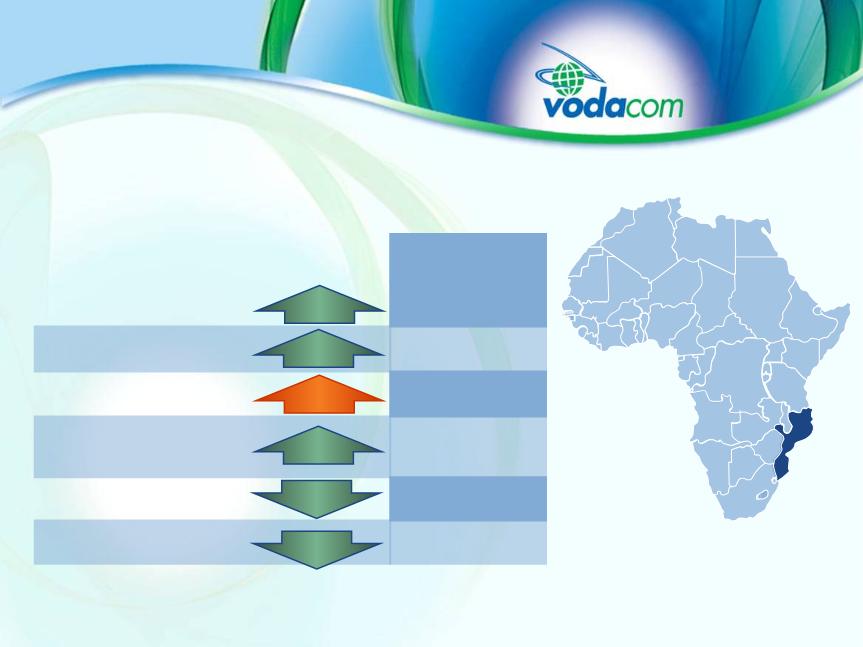
Mozambique
New acquisitions and investments
• In order to ensure horizontal growth within our area of focus, Vodacom made investments in
the following companies:
the following companies:
– Increased investments in G-Mobile Holdings Ltd (Wi-Fi business)
– Invested in Xlink Communications (Pty) Ltd (service provider of wireless data transfer systems and
services)
services)
– Launched Vodacom Business
• Effective September 13, 2006, Vodacom Service Provider Company (Pty) Ltd acquired the
contract customer base of approximately 160 thousand from Smartcom (Pty) Ltd. Group
also increased its effective equity interest in Smartcom (Pty) Ltd from 61.6% to 100%
contract customer base of approximately 160 thousand from Smartcom (Pty) Ltd. Group
also increased its effective equity interest in Smartcom (Pty) Ltd from 61.6% to 100%
• Acquired the customer base from Global Telematics SA (Pty) Ltd, effective April 1, 2008
• Increased equity interest in Smartphone SP (Pty) Ltd and Cointel VAS (Pty) Ltd from 70% to
100% during September 2007
100% during September 2007
New acquisitions and investments
Vodacom Business
• Vodacom Business was launched in
February 2008
February 2008
– To offer the market a full set of
converged communications services
converged communications services
• Developed a service portfolio that
includes:
includes:
– Next-generation Internet Protocol ISP
and voice services
and voice services
– Managed networks and infrastructure
services
services
– Access services
– Hosting and applications
• Platforms, systems and organisation
created and prepared to sell and bill
products
created and prepared to sell and bill
products
– Service portfolio coming on line during
the course of the year
the course of the year
Managed enterprise voice, VOIP and
VOIP gateway
VOIP gateway
• To be launched on July 1, 2008
• Launched on May 1, 2008
Hosting security and backup
ISPs
• ‘Dedicated Internet’ access launched
April 7, 2008
• ‘Broadband Internet’ access to be
launched in second quarter
launched in second quarter
Managed MPLS VPN service
• ‘MPLS VPN’ launched on April 7, 2008

Mobile TV / DVB-H |
• 31 thousand Mobile TV users |
• 22 TV channels |
Vodafone live!, 3G / HSDPA |
• Over 1.4 million Vodafone live! users (2007: 899 thousand) |
• 370 thousand data card and modem users (2007: 149 thousand) |
Data revenue
Data revenue as a % of service
revenue
revenue
50.0%
year on
year
year on
year
Innovative South Africa non-voice products
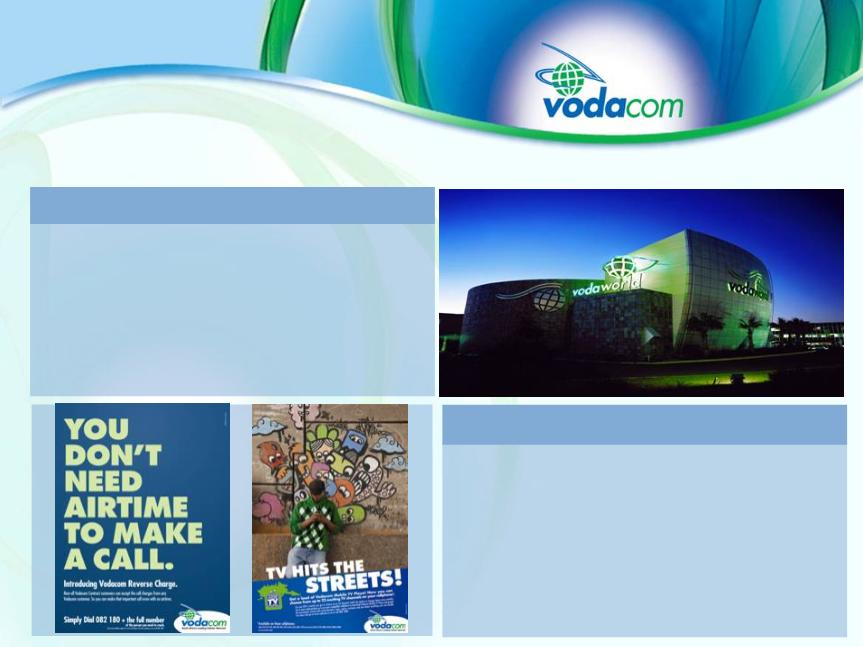
• Mobile TV Playa: provides TV streaming
• Music station: live radio streaming
• Prepaid data bundles: data usage for prepaid
• MEEP: 18,666 PC and 7,665 handset users
• Reverse charge: call charged to receiving party
• Mobile advertising: R24.1 m in revenue to date
New products and services
• Vodaworld still the largest one-stop mobile
telecommunications mall
telecommunications mall
• Vodacom currently has 980 dealers and
franchises, including 39 Vodacare outlets
franchises, including 39 Vodacare outlets
• More than 14 thousand retail outlets
• Currently 7 walk in customer care centres across
the country
the country
Customer care and service
New products, services and customer care outlets - South Africa
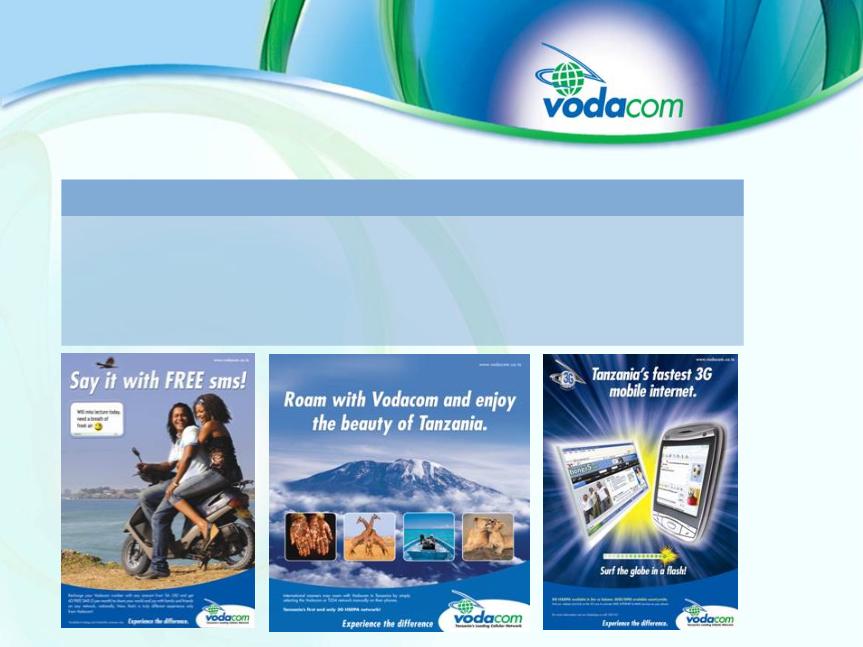
• Commercially launched 3G / HSDPA
• Commercially launched WiMax
• Launched a consumer loyalty program, Tuzo points and Tuzo draws
Tanzania
New innovative products and services
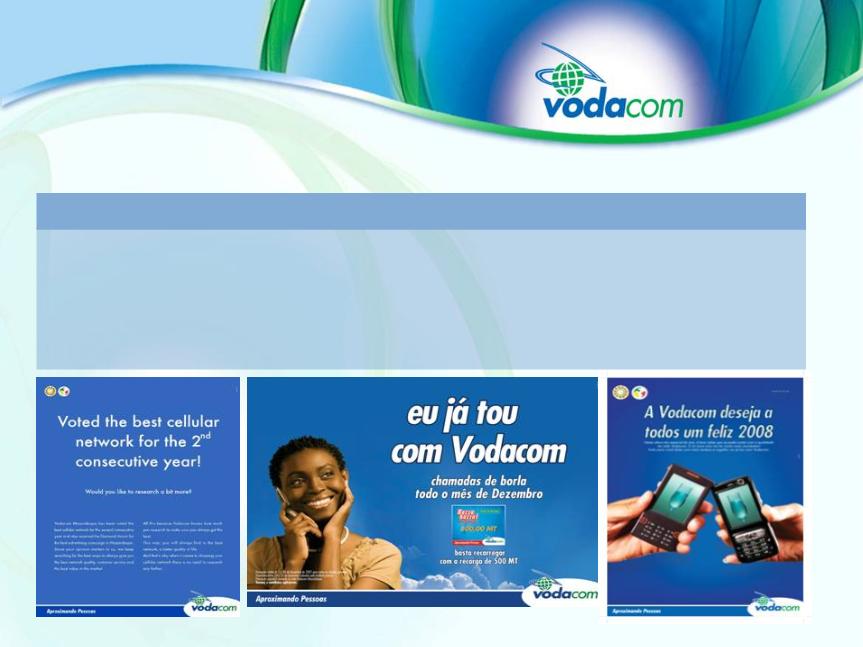
• 500MT: Free on-net calls for December upon recharging with a 500MT voucher
• Vodakool: a WAP Portal that enables customers to access services like vodamail and jokes
• Market leader in data services: Voted best cellular network for the second consecutive year
Mozambique
New innovative products and services
• Vodacom plans to have the deal concluded and implemented by the fourth quarter of 2008
• Royal Bafokeng Holdings (Pty) Ltd and Thebe Investment Corporation (Pty) Ltd chosen as
preferred partners in R7.5 billion BBBEE deal
preferred partners in R7.5 billion BBBEE deal
• Grouping structure of deal:
- 25% for all South African employees of Vodacom
- 30% for black South Africans and business partners via a Public Offer
- 45% for black strategic partners
BBBEE
Broad Based Black Economic Empowerment (BBBEE)
• Focus on horizontal growth and expansion
• Seek out new associated business opportunities in South Africa
• Further expansion into television and radio
• To play a significant role in international data transmission (Seacom, Eassy
Cable, etc)
Cable, etc)
• Focus on improving customer service and loyalty
• Focus on electronic communications, spearheaded by Vodacom Business
Way forward

Financial review
Johan van der Watt
Acting Chief Financial Officer
(106.4%)
(609)
(295)
(116)
Net finance costs
21.3%
7,958
6,560
5,143
Net profit
(7.1%)
(4,109)
(3,836)
(3,084)
Taxation
(17.8%)
(31,715)
(26,919)
(22,234)
Operating expenses excluding depreciation,
amortisation, impairment and other
amortisation, impairment and other
15.7%
16,463
14,227
11,809
EBITDA
(18.0%)
(3,972)
(3,367)
(2,943)
Depreciation, amortisation, impairment and
other
other
15.0%
12,491
10,860
8,866
Profit from operations
>200.0%
185
(169)
(523)
Net gain / (loss) on revaluations
16.1%
12,067
10,396
8,227
Profit before tax
17.1%
48,178
41,146
34,043
Revenue
2007
%
change
2008
2006
R million
Effective tax rate 34.1% vs. 36.9% prior year
DRC option liability R396.5 million (2007: R249.3 million)
Group income statement
Extract for the years ended March 31,
Extract for the years ended March 31,

Gross connections
Customers
Group operational indicators
• Gross connections up
15.4% year on year to
18.0 million
15.4% year on year to
18.0 million
• Customers up 12.7% year on
year to 34.0 million
year to 34.0 million
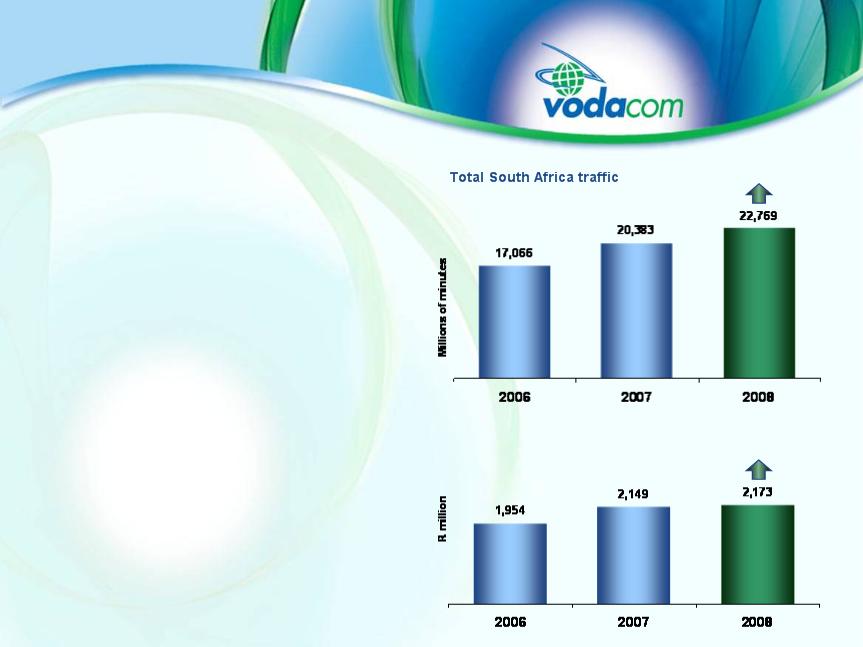
• Total traffic in South Africa
increased by 11.7% year on
year to 22.8 billion minutes
increased by 11.7% year on
year to 22.8 billion minutes
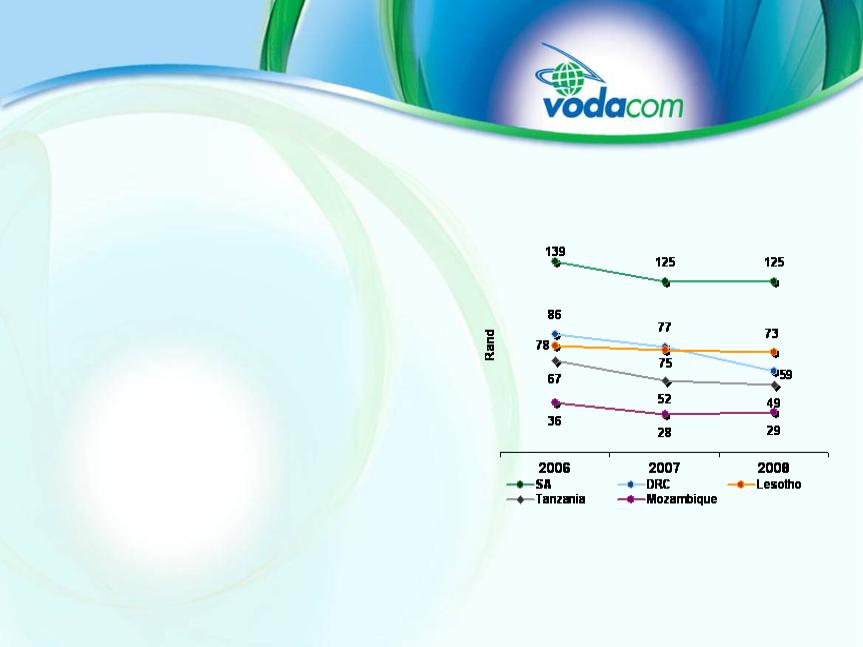
ARPU per month
ARPU by country
• SA remained stable at R125
• DRC decreased 23.4% to R59
• Lesotho decreased 2.7% to R73
• Tanzania decreased 5.8% to R49
• Mozambique increased 3.6% to
R29
R29
• Vodacom Group consolidated
ARPU decreased 4.5% year on
year from R111 to R106
ARPU decreased 4.5% year on
year from R111 to R106
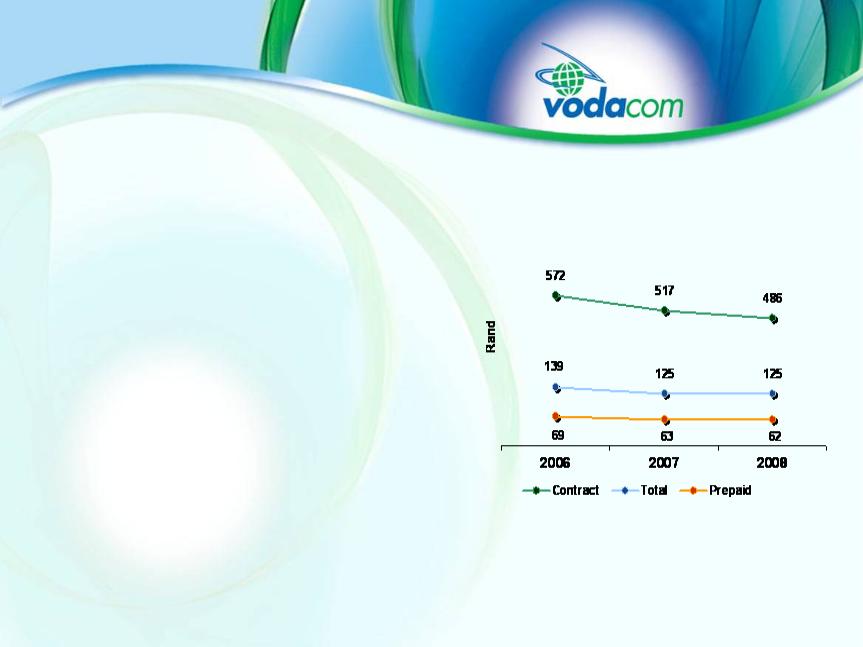
South Africa ARPU per month
South Africa ARPU
• Contract ARPU decreased
6.0% year on year to R486
6.0% year on year to R486
• Prepaid ARPU decreased
1.6% year on year to R62
1.6% year on year to R62
• Total ARPU remained stable
year on year at R125
year on year at R125
• Prepaid ARPU stable as a result of
implementation of supplementary
disconnection rule
implementation of supplementary
disconnection rule
• Increase in bulk sms
• Customer mix kept total ARPU stable
• Usage decreased slightly by 4.3% to
66 minutes of use per month per customer
66 minutes of use per month per customer

20.0%
2,297
1,914
1,334
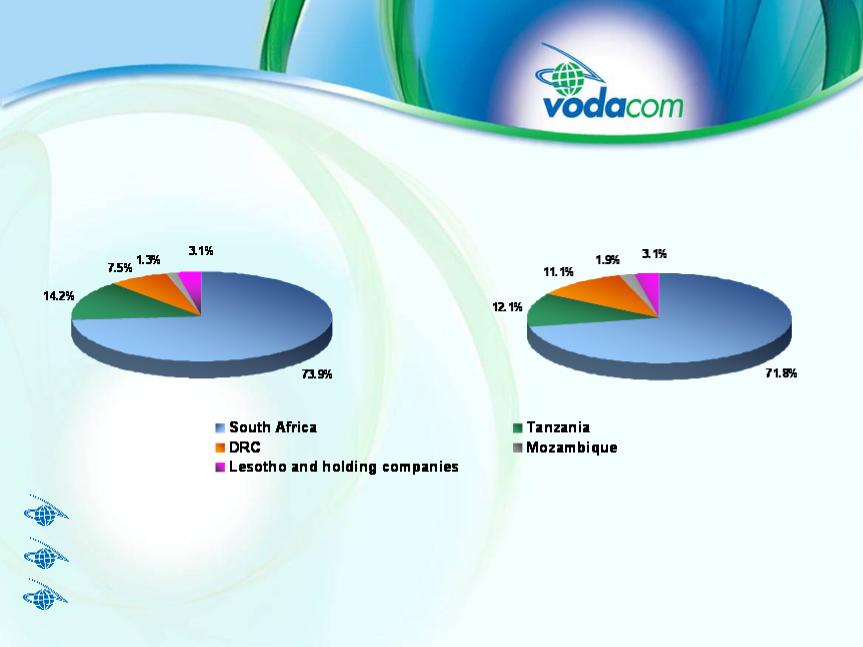
DRC
15.6%
42,784
37,007
31,069
South Africa, including holding companies
17.1%
48,178
41,146
34,043
61.3%
434
269
158
Mozambique
36.1%
309
227
170
Lesotho
36.1%
2,354
1,729
1,312
Tanzania
2007
%
change
change
2008
2006
R million
Revenue driven by strong customer growth
Non-South African operations contributing 11.2% (2007: 10.1%)
Data revenue increased by 49.7% or R1.7 billion (2007: R1.3 billion)
Group revenue
By country
By country
40.6%
1,836
1,306
971
International airtime
7.5%
5,052
4,699
3,986
Equipment sales
13.4%
8,887
7,835
6,697
Interconnection
14.3%
27,095
23,708
20,085
Airtime, connection and access
17.1%
48,178
41,146
34,043
19.5%
306
256
266
Other sales and services
49.7%
5,002
3,342
2,038
Data revenue
2007
%
change
change
2008
2006
R million
Revenue growth, excluding equipment sales was 18.3% (2007: 21.3%)
Data revenue as a % of service revenue was 11.9% (2007: 9.4%)
Group revenue
Revenue composition
Revenue composition

Revenue analysis - 2008
R43,126 million (excluding equipment sales)
Revenue analysis - 2007
R36,447 million (excluding equipment sales)
Interconnection contribution down 0.9% points to 20.6%
Data revenue contribution up 2.4% points to 11.6%
Group revenue (excluding equipment sales)
By revenue type
By revenue type

EBITDA margin by country
• Group EBITDA performance
– Increased 15.7% year on year to R16.5 billion
– EBITDA margin decreased 0.4% points year on year to
34.2%
34.2%
– EBITDA margin 39.3%, when excluding cellular phone
and equipment sales
and equipment sales
• South Africa EBITDA
– Increased 14.1% year on year to R14.8 billion
– EBITDA margin decreased 0.4% points year on year to
34.6%
34.6%
• EBITDA for non-South African operations
– Increased 33.1% year on year to R1.6 billion
– Non-South African operations contributed 9.8% of total
(2007: 8.5%)
(2007: 8.5%)
– Mozambique’s negative EBITDA decreased from
R69 million to R32 million
R69 million to R32 million
15.7%
year on
year
year on
year
EBITDA
EBITDA and margin analysis
31.4%
364
277
117
DRC
(30.4%)
32
46
(23)
Holding companies
32.9%
460
346
263
Tanzania
(0.5% pts)
25.9%
26.4%
26.0%
Profit from operations margin (%)
15.0%
12,491
10,860
8,866
11.3%
(157)
(177)
(144)
Mozambique
64.0%
123
75
51
Lesotho
13.4%
11,669
10,293
8,602
South Africa
2007
%
change
change
2008
2006
R million
Customer growth of 12.7% to 34.0 million
Revenue growth of 17.1% to R48.2 billion
Group profit from operations
By country
By country
South Africa net interconnect
11.7%
year on
year
year on
year
1.1%
year on
year
year on
year
Factors affecting trends and margins
• South Africa traffic mix
– Outgoing traffic increased 12.4% year on
year to 15.3 billion minutes
year to 15.3 billion minutes
– Incoming traffic increased 10.4% year on
year to 7.5 billion minutes
year to 7.5 billion minutes
– Total traffic increased 11.7% year on year to
22.8 billion minutes
22.8 billion minutes
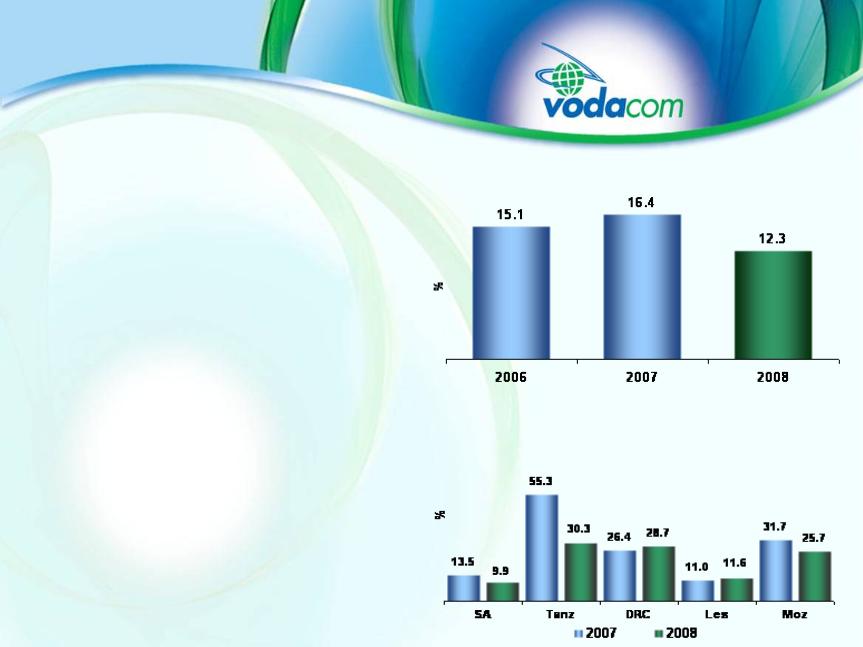
Gross capex additions as a % of revenue
Gross capex additions as a % of revenue
Productivity measures
• Consolidated customers
per employee
per employee
Increased 6.9% year on year to 5,442
based on 6,247 employees
based on 6,247 employees
• Consolidated gross capex
additions as a % of revenue
decreased to 12.3% from 16.4%
in the previous financial year
additions as a % of revenue
decreased to 12.3% from 16.4%
in the previous financial year
• Gross capex additions was
R5.9 billion vs. R6.7 billion in the
previous financial year
R5.9 billion vs. R6.7 billion in the
previous financial year
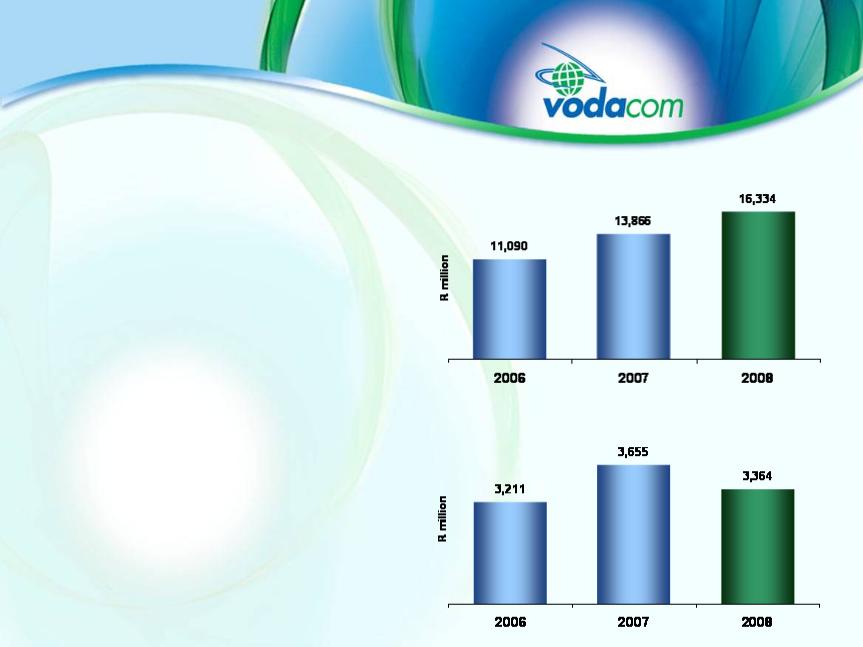
Cash generated from operations
Free cash flow
• Taxation increased by 43.0% to R4.7 billion
• Net capex additions increased by 11.5% to
R6.5 billion
R6.5 billion
• Net finance costs increased by 130.2% to
R746 million
R746 million
• Buy-out of all minority shareholders in the
Smartphone group for R956.5 million
Smartphone group for R956.5 million
Cash generation
• EBITDA increased by R2.2 billion
• Cash generated from operations
increased 17.8% to R16.3 billion
increased 17.8% to R16.3 billion
• Free cash flow decreased
8.0% to R3.4 billion
8.0% to R3.4 billion
• Current facilities amount to
R5.8 billion
R5.8 billion
• Utilisation after final dividend -
R5.7 billion
R5.7 billion
Capex gross additions - 2008
R5,916 million
R5,916 million
Capex gross additions - 2007
R6,748 million
R6,748 million
South Africa capex gross additions decreased by 14.8% to R4.3 billion
Non-South African capex gross additions decreased by 3.5% to R1.5 billion
At March 31, 2008, capex contracted but not yet incurred amounted to R1.6 billion
Capex additions and composition
Including software
Including software
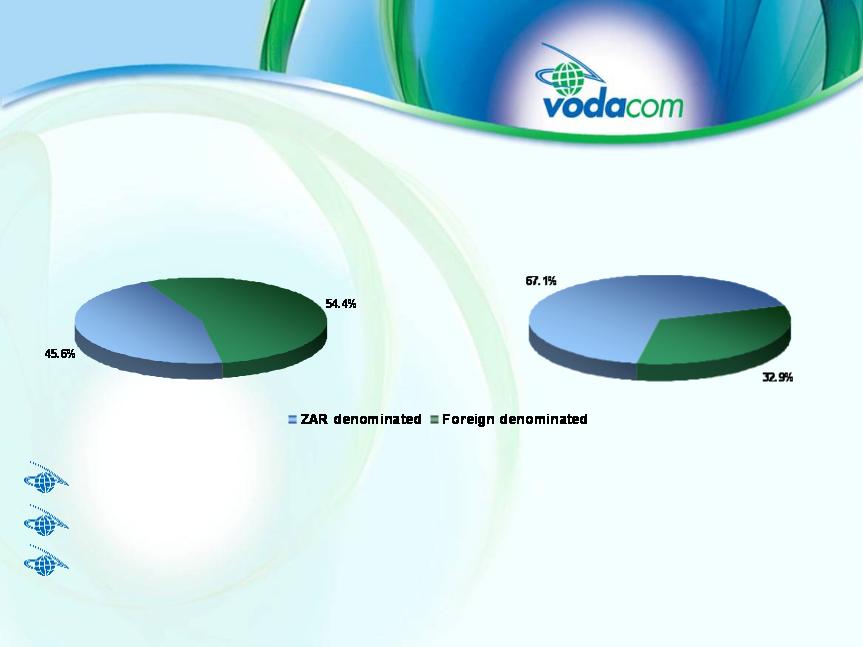
Gross debt composition
including bank overdrafts - 2008
including bank overdrafts - 2008
R6,131 million
Gross debt composition
including bank overdrafts - 2007
including bank overdrafts - 2007
R3,435 million
Net debt (excluding dividends and STC): R5,154 million (2007: R2,664 million)
Net debt to equity ratio 93.1% (2007: 72.8%) (including dividends and STC)
Net debt to EBITDA ratio 52.6% (2007: 42.4%) (including dividends and STC)
Debt composition
17.1%
17,582
15,011
13,860
Current liabilities
20.0%
34,175
28,470
24,768
Total equity and liabilities
25.6%
4,788
3,812
2,236
Non-current liabilities
22.4%
11,805
9,647
8,672
EQUITY AND LIABILITIES
Capital and reserves
20.0%
34,175
28,470
24,768
Total assets
27.3%
9,707
7,626
8,689
Current assets
17.4%
24,468
20,844
16,079
ASSETS
Non-current assets
2007
%
change
change
2008
2006
R million
Group balance sheet
Extract at March 31,
Extract at March 31,
>200.0%
837
(108)
1,760
Cash and cash equivalents at the
end of the year
end of the year
51.7%
88
58
(16)
Effect of foreign exchange rate changes
(106.1%)
(108)
1,760
2,173
Cash and cash equivalents at the
beginning of the year
beginning of the year
144.5%
857
(1,926)
(397)
Net increase in cash and cash
equivalents
equivalents
>200.0%
3,234
(200)
(107)
Net cash flows utilised in
financing activities
financing activities
(13.9%)
(7,502)
(6,584)
(4,791)
Net cash flows utilised in investing
activities
activities
5.5%
5,125
4,858
4,501
Net cash flows from operating activities
17.8%
16,334
13,866
11,090
Cash generated from operations
2007
%
change
change
2008
2006
R million
Group cash flow statement
Extract for the years ended March 31,
Extract for the years ended March 31,

Disclaimer
• This presentation has been prepared and published by Vodacom Group (Pty) Ltd.
• Vodacom Group (Pty) Ltd is a private company and as such is not required by the Companies
Act 61 of 1973, as amended, to publish its results.
Act 61 of 1973, as amended, to publish its results.
• Vodacom Group (Pty) Ltd makes no guarantee, assurance, representation and/or warranty as
to the accuracy of the information contained in this presentation and will not be held liable for
any reliance placed on the information contained in this presentation.
to the accuracy of the information contained in this presentation and will not be held liable for
any reliance placed on the information contained in this presentation.
• The information contained in this presentation is subject to change without notice and may be
incomplete or condensed. In addition, this presentation may not contain all material
information pertaining to Vodacom Group (Pty) Ltd and its subsidiaries.
incomplete or condensed. In addition, this presentation may not contain all material
information pertaining to Vodacom Group (Pty) Ltd and its subsidiaries.
• Without in any way derogating from the generality of the foregoing, it should be noted that:
– Many of the statements included in this presentation are forward-looking statements that
involve risks and/or uncertainties and caution must be exercised in placing any reliance on
these statements. Moreover, Vodacom Group (Pty) Ltd will not necessarily update any of
these statements after the date of this presentation either to conform them to actual
results or to changes in its expectations.
– Insofar as the shareholders of Vodacom Group (Pty) Ltd are listed and offer their shares
publicly for sale on recognised stock exchanges locally and/or internationally, potential
investors in the shares of Vodacom Group (Pty) Ltd’s shareholders are cautioned not to
place undue reliance on this presentation.
publicly for sale on recognised stock exchanges locally and/or internationally, potential
investors in the shares of Vodacom Group (Pty) Ltd’s shareholders are cautioned not to
place undue reliance on this presentation.

Thank you