UNITED STATES
SECURITIES AND EXCHANGE COMMISSION
Washington, D.C. 20549
FORM N-CSR
CERTIFIED SHAREHOLDER REPORT OF REGISTERED
MANAGEMENT INVESTMENT COMPANIES
Investment Company Act file number: 811-21295
JPMorgan Trust I
(Exact name of registrant as specified in charter)
270 Park Avenue
New York, NY 10017
(Address of principal executive offices) (Zip code)
Frank J. Nasta
270 Park Avenue
New York, NY 10017
(Name and Address of Agent for Service)
Registrant’s telephone number, including area code: (800) 480-4111
Date of fiscal year end: August 31
Date of reporting period: September 1, 2016 through February 28, 2017
Form N-CSR is to be used by management investment companies to file reports with the Commission not later than 10 days after the transmission to stockholders of any report that is required to be transmitted to stockholders under Rule 30e-1 under the Investment Company Act of 1940 (17 CFR 270.30e-1). The Commission may use the information provided on Form N-CSR in its regulatory, disclosure review, inspection, and policymaking roles.
A registrant is required to disclose the information specified by Form N-CSR, and the Commission will make this information public. A registrant is not required to respond to the collection of information contained in Form N-CSR unless the Form displays a currently valid Office of Management and Budget (“OMB”) control number. Please direct comments concerning the accuracy of the information collection burden estimate and any suggestions for reducing the burden to Secretary, Securities and Exchange Commission, 450 Fifth Street, NW, Washington, DC 20549-0609. The OMB has reviewed this collection of information under the clearance requirements of 44 U.S.C. Section 3507.
ITEM 1. REPORTS TO STOCKHOLDERS.
The following is a copy of the report transmitted to shareholders pursuant to Rule 30e-1 under the Investment Company Act of 1940 (17 CFR 270.30e-1).
Semi-Annual Report
J.P. Morgan Funds
February 28, 2017 (Unaudited)
JPMorgan Diversified Real Return Fund

CONTENTS
Investments in the Fund are not deposits or obligations of, or guaranteed or endorsed by, any bank and are not insured or guaranteed by the FDIC, the Federal Reserve Board or any other government agency. You could lose money if you sell when the Fund’s share price is lower than when you invested.
Past performance is no guarantee of future performance. The general market views expressed in this report are opinions based on market and other conditions through the end of the reporting period and are subject to change without notice. These views are not intended to predict the future performance of the Fund or the securities markets. References to specific securities and their issuers are for illustrative purposes only and are not intended to be, and should not be interpreted as, recommendations to purchase or sell such securities. Such views are not meant as investment advice and may not be relied on as an indication of trading intent on behalf of the Fund.
Prospective investors should refer to the Fund’s prospectus for a discussion of the Fund’s investment objective, strategies and risks. Call J.P. Morgan Funds Service Center at 1-800-480-4111 for a prospectus containing more complete information about the Fund, including management fees and other expenses. Please read it carefully before investing.
CEO’S LETTER
March 22, 2017 (Unaudited)
Dear Shareholders,
The U.S. economy continued its steady expansion over the past six months and by the end of February 2017, the world’s leading economies were growing in a more synchronized manner that could accelerate global growth.
| | |
 | | “In the U.S., the pace of economic expansion was sufficient to persuade the Federal Reserve Bank to raise interest rates in December 2016 and again in March 2017.” |
By early 2017, the World Bank estimated that global economic growth in 2017 will rise by 2.7% compared with 2.3% in 2016 and economists generally expect each of the world’s 20 largest economies will see an increase in gross domestic product in 2017.
In the 19-nation euro zone, manufacturing activity rose in February 2017 for the sixth consecutive month and reached levels not seen in nearly six years. Economic confidence surveys have been the strongest since 2011. While unemployment across the euro zone remained nearly twice that of the U.S., the jobless rate fell faster than expected in early 2017 to its lowest level since 2009. Importantly, euro zone inflation reached the European Central Bank’s (ECB) target of 2.0% in February 2017, which provided further evidence that the risk of a painful deflationary spiral had receded.
Meanwhile, Chinese factory activity was stronger than economists expected in February 2017 and more broadly, Chinese economic stimulus measures initiated in 2016 appeared to bolster trade throughout Asia. In Japan, corporate profits were estimated at record highs even in the face of a stronger yen. South Korean exports grew in February 2017 for the fourth consecutive month. Economic data from Australia and India showed signs of stronger growth.
To a certain extent, the healthier global economy was supported by a rebound in global oil prices, which reached 15-month highs in October 2016. Prices for other commodities also rose in the latter half of 2016, helping growth in those emerging market nations reliant on natural resource exports.
In the U.S., the pace of economic expansion was sufficient to persuade the Federal Reserve Bank to raise interest rates in December 2016 and again in March 2017. Meanwhile, leading
stock market indexes hit record highs in late 2016 and early 2017 amid strength in corporate profits and the broader U.S. economy. Investor expectations that the Republican Party’s newly-won control of the U.S. presidency along with its continuing majorities in both houses of the U.S. Congress would bolster economic growth while lowering certain taxes further supported U.S. financial assets.
While the global economy appeared to grow more synchronized during the six months ended February 2017, there also emerged political uncertainties in the U.S. and Europe. Britain’s planned exit from the European Union — and its immigration and trade policies — brought investor uncertainty and was seen as a drag on the U.K. economy. In November 2016, Donald Trump won the U.S. presidency after campaigning on a platform that included new restrictions on immigration and protective trade policies. While voters in the Netherlands declined to give the anti-immigrant Party for Freedom a majority in the lower house of Parliament, populist parties were also vying for power in Italy, France, Germany and elsewhere.
Each of these parties and their leaders — both in the U.S. and elsewhere — share broad policy goals that prioritize restricting immigration and shunning supranational trade agreements. Given that immigration and free trade are key drivers of economic growth in advanced, post-industrial nations, it remains to be seen how much electoral support these shared agendas would earn.
In the face of all this, U.S. and foreign financial markets generally rewarded investors with positive returns for the six months through February 2017. Over time, we believe financial markets will continue to reward those investors who maintain patience and discipline in the context of a properly diversified portfolio.
We look forward to managing your investment needs for years to come. Should you have any questions, please visit www.jpmorganfunds.com or contact the J.P. Morgan Funds Service Center at 1-800-480-4111.
Sincerely yours,

George C.W. Gatch
CEO, Investment Funds Management,
J.P. Morgan Asset Management
| | | | | | | | |
| | | |
| FEBRUARY 28, 2017 | | J.P. MORGAN FUNDS | | | | | 1 | |
JPMorgan Diversified Real Return Fund
FUND COMMENTARY
SIX MONTHS ENDED FEBRUARY 28, 2017 (Unaudited)
| | | | |
| REPORTING PERIOD RETURN: | |
| Fund (Class I Shares)1* | | | 2.76% | |
| Bloomberg Barclays 1-10 Year U.S. TIPS Index (formerly Barclays 1-10 Year U.S. TIPS Index) | | | 0.26% | |
| Consumer Price Index for All Urban Consumers — Seasonally Adjusted | | | 1.69% | |
| JPMorgan Diversified Real Return Composite Benchmark | | | 3.61% | |
| Net Assets as of 2/28/2017 | | $ | 83,527,075 | |
INVESTMENT OBJECTIVE**
The JPMorgan Diversified Real Return Fund (the “Fund”) seeks to maximize long-term real return.
HOW DID THE MARKET PERFORM?
U.S. financial markets overall provided mixed returns for the six months ended February 28, 2017. Equity markets rose along with bond yields amid a backdrop of low but rising interest rates and price inflation, as well as improved corporate profits.
Commodities prices stabilized during the reporting period and global oil prices reached 15-month highs in October 2016. Oil prices were further bolstered by the Organization of Petroleum Exporting Countries’ decision to curb production.
The November 8, 2016 election handed Donald Trump the U.S. presidency and the Republican Party a majority in both houses of the U.S. Congress. In the following months, key U.S. equity benchmarks reached multiple closing record highs. U.S. Treasury bonds underperformed other bond market sectors and high yield bonds (also known as “junk bonds”) outperformed the broader bond market.
WHAT WERE THE MAIN DRIVERS OF THE FUND’S PERFORMANCE?
For the six months ended February 28, 2017, the Fund’s Class I Shares outperformed the Bloomberg Barclays 1-10 Year U.S. TIPS Index (the “Index”). The Index only tracks Treasury Inflation Protected Securities (“TIPS”), while the Fund is invested in a broad range of assets. The Fund underperformed the JPMorgan Diversified Real Return Composite Benchmark (45% MSCI World Index, 55% Bloomberg Barclays U.S. TIPS 1-10 Year Index).
During the six month reporting period, real estate investment trusts (REITs) came under pressure against the backdrop of higher U.S. interest rates. The Fund’s exposure to REITs detracted from relative performance. Meanwhile, the Fund’s allocations to traditional equities and global natural resources equities were positive contributors to relative performance as the pickup in global growth and inflation during the period was well-received by investors.
HOW WAS THE FUND POSITIONED?
During the reporting period, the Fund was positioned with the goal of delivering real return.
Particularly since the U.S. election, the portfolio managers believed that the “lower for longer” economic environment seemed to be largely over and the U.S. had entered a reflationary environment with upward pressure on interest rates. While portfolio managers expected U.S. inflation to normalize, they expressed a more positive view on inflation within equity securities rather than within fixed income securities. As a result, the portfolio managers preferred allocating to traditional equity securities as well as to U.S. Consumer Price Index swaps to maintain inflation-sensitivity. The portfolio managers also preferred credit such as high yield securities over traditional TIPS given their expectation that rates would rise, which would hurt traditional TIPS performance. At the end of the reporting period, the Fund’s asset allocation consisted of the following weights: 8% in TIPS; 15% in other inflation-managed fixed income securities; 5% in floating rate securities; 15% in high yield debt; 14% in traditional equities; 12% in REITs; 9% in global natural resources equities; 5% in global infrastructure equities; and 10% in commodities.
| | | | | | |
| | | |
| 2 | | | | J.P. MORGAN FUNDS | | FEBRUARY 28, 2017 |
| | | | | | | | |
| TOP TEN HOLDINGS OF THE PORTFOLIO*** | |
| | 1. | | | JPMorgan Floating Rate Income Fund, Class R6 Shares | | | 5.6 | % |
| | 2. | | | Vanguard REIT Fund | | | 5.3 | |
| | 3. | | | JPMorgan Opportunistic Equity Long/Short Fund, Class R6 Shares | | | 2.0 | |
| | 4. | | | iShares TIPS Bond Fund | | | 1.6 | |
| | 5. | | | Renaissance Home Equity Loan Trust, Series 2003-2, Class A, VAR, 1.658%, 08/25/33 | | | 0.7 | |
| | 6. | | | Wells Fargo Mortgage-Backed Securities Trust, Series 2006-2, Class 1A12, 5.750%, 03/25/36 | | | 0.6 | |
| | 7. | | | Fremont Home Loan Trust, Series 2004-B, Class M1, VAR, 1.648%, 05/25/34 | | | 0.6 | |
| | 8. | | | CHL Mortgage Pass-Through Trust, Series 2003-21, Class A1, VAR, 3.243%, 05/25/33 | | | 0.5 | |
| | 9. | | | Alternative Loan Trust, Series 2006-14CB, Class A1, 6.000%, 06/25/36 | | | 0.5 | |
| | 10. | | | GSAMP Trust, Series 2003-HE1, Class M1, VAR, 2.024%, 06/20/33 | | | 0.5 | |
| | | | |
PORTFOLIO COMPOSITION*** | |
| Common Stocks | | | 33.9 | % |
| Corporate Bonds | | | 29.8 | |
| Investment Companies | | | 7.6 | |
| U.S. Treasury Obligations | | | 7.4 | |
| Exchange-Traded Funds | | | 6.8 | |
| Asset-Backed Securities | | | 2.6 | |
| Collateralized Mortgage Obligations | | | 2.3 | |
| Others (each less than 1.0%) | | | 0.0 | (a) |
| Short-Term Investments | | | 9.6 | |
| 1 | | Effective April 3, 2017, the Fund’s Select Class Shares were renamed Class I Shares. |
| * | | The return shown is based on the net asset values calculated for shareholder transactions and may differ from the return shown in the financial highlights, which reflects adjustments made to the net asset values in accordance with accounting principles generally accepted in the United States of America. |
| ** | | The adviser seeks to achieve the Fund’s objective. There can be no guarantee it will be achieved. |
| *** | | Percentages indicated are based on total investments as of February 28, 2017. The Fund’s portfolio composition is subject to change. |
| (a) | | Amount rounds to less than 0.05%. |
| | | | | | | | |
| | | |
| FEBRUARY 28, 2017 | | J.P. MORGAN FUNDS | | | | | 3 | |
JPMorgan Diversified Real Return Fund
FUND COMMENTARY
SIX MONTHS ENDED FEBRUARY 28, 2017 (Unaudited) (continued)
| | | | | | | | | | |
AVERAGE ANNUAL TOTAL RETURNS AS OF FEBRUARY 28, 2017 |
| | | | | | | | | | | | | | | | | | | | |
| | | | | |
| | | INCEPTION DATE OF
CLASS | | | 6 MONTH* | | | 1 YEAR | | | 5 YEAR | | | SINCE
INCEPTION | |
CLASS A SHARES | | | March 31, 2011 | | | | | | | | | | | | | | | | | |
With Sales Charge** | | | | | | | (1.94 | )% | | | 6.53 | % | | | (0.49 | )% | | | 0.07 | % |
Without Sales Charge | | | | | | | 2.65 | | | | 11.59 | | | | 0.43 | | | | 0.86 | |
CLASS C SHARES | | | March 31, 2011 | | | | | | | | | | | | | | | | | |
With CDSC*** | | | | | | | 1.42 | | | | 10.03 | | | | (0.08 | ) | | | 0.35 | |
Without CDSC | | | | | | | 2.42 | | | | 11.03 | | | | (0.08 | ) | | | 0.35 | |
CLASS R2 SHARES | | | March 31, 2011 | | | | 2.56 | | | | 11.36 | | | | 0.18 | | | | 0.61 | |
CLASS R5 SHARES | | | March 31, 2011 | | | | 2.81 | | | | 12.00 | | | | 0.77 | | | | 1.21 | |
CLASS I SHARES (FORMERLY SELECT CLASS SHARES) | | | March 31, 2011 | | | | 2.76 | | | | 11.82 | | | | 0.67 | | | | 1.10 | |
| ** | | Sales Charge for Class A Shares is 4.50%. |
| *** | | Assumes a 1% CDSC (contingent deferred sales charge) for the 6 month and one year periods and 0% CDSC thereafter. |
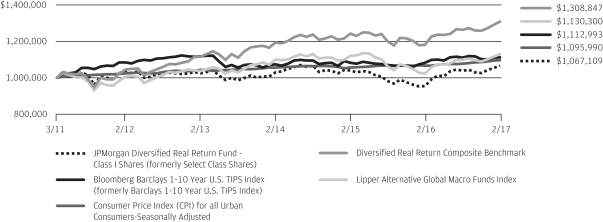
LIFE OF FUND PERFORMANCE (3/31/11 — 2/28/17)
The performance quoted is past performance and is not a guarantee of future results. Mutual funds are subject to certain market risks. Investment returns and principal value of an investment will fluctuate so that an investor’s shares, when redeemed, may be worth more or less than their original cost. Current performance may be higher or lower than the performance data shown. For up-to-date, month-end performance information please call 1-800-480-4111.
The Fund commenced operations on March 31, 2011.
The graph illustrates comparative performance for $1,000,000 invested in Class I Shares of the JPMorgan Diversified Real Return Fund, the Bloomberg Barclays 1-10 Year U.S. TIPS Index, the Consumer Price Index (CPI) for All Urban Consumers-Seasonally Adjusted, the Diversified Real Return Composite Benchmark and the Lipper Alternative Global Macro Funds Index from March 31, 2011 to February 28, 2017. The performance of the Fund assumes reinvestment of all dividends and capital gain distributions, if any, and does not include a sales charge. The performance of the Bloomberg Barclays 1-10 Year U.S. TIPS Index, the Consumer Price Index (CPI) for All Urban Consumers-Seasonally Adjusted and the Diversified Real Return Composite Benchmark does not reflect the deduction of expenses or a sales charge associated with a mutual fund. The performance of the Bloomberg Barclays 1-10 Year U.S. TIPS Index has been adjusted to reflect reinvestment of all dividends and capital gain distributions of the securities included in the benchmark, if applicable. The performance of the Lipper Alternative Global Macro Funds Index includes expenses associated with a mutual fund, such as investment management fees. These expenses are not identical to the expenses incurred by the Fund. The Bloomberg Barclays 1-10 Year U.S. TIPS Index represents the performance of intermediate (1-10 year) U.S. Treasury Inflation Protection Securities. The Consumer Price Index (CPI) for
All Urban Consumers-Seasonally Adjusted is a measure of the change in prices of goods and services purchased by urban consumers. Seasonal adjustment removes the effects of recurring seasonal influences from many economic series, including consumer prices. The adjustment process quantifies seasonal patterns and then factors them out of the series to permit analysis of non-seasonal price movements. Changing climatic conditions, production cycles, model changeovers, holidays, and sales can cause seasonal variation in prices. The Diversified Real Return Composite Benchmark is comprised of the Bloomberg Barclays 1-10 Year U.S. TIPS Index (55%) and the MSCI World Index (45%). The Lipper Alternative Global Macro Funds Index is an index based on total returns of certain mutual funds within the Fund’s designated category as determined by Lipper, Inc. Investors cannot invest directly in an Index.
Effective July 29, 2016, the Fund’s investment strategies changed. The Fund’s past performance would have been different if the Fund was managed using the current strategies.
Class I Shares have a $1,000,000 minimum initial investment.
Fund performance may reflect the waiver of the Fund’s fees and reimbursement of expenses for certain periods since the inception date. Without these waivers and reimbursements, performance would have been lower. Also, performance shown in this section does not reflect the deduction of taxes that a shareholder would pay on Fund distributions or redemptions of Fund shares.
The returns shown are based on net asset values calculated for shareholder transactions and may differ from the returns shown in the financial highlights, which reflect adjustments made to the net asset values in accordance with accounting principles generally accepted in the United States of America.
| | | | | | |
| | | |
| 4 | | | | J.P. MORGAN FUNDS | | FEBRUARY 28, 2017 |
JPMorgan Diversified Real Return Fund
CONSOLIDATED SCHEDULE OF PORTFOLIO INVESTMENTS
AS OF FEBRUARY 28, 2017 (Unaudited)
| | | | | | | | |
PRINCIPAL
AMOUNT($) | | | SECURITY DESCRIPTION | | VALUE($) | |
| | Asset-Backed Securities — 2.5% | |
| | 504,502 | | | Fremont Home Loan Trust, Series 2004-B, Class M1, VAR, 1.648%, 05/25/34 | | | 469,258 | |
| | 436,808 | | | GSAMP Trust, Series 2003-HE1, Class M1, VAR, 2.024%, 06/20/33 | | | 427,268 | |
| | 450,536 | | | RAMP Trust, Series 2003-RS10, Class MII1, VAR, 1.753%, 11/25/33 | | | 419,851 | |
| | 598,466 | | | Renaissance Home Equity Loan Trust, Series 2003-2, Class A, VAR, 1.658%, 08/25/33 | | | 559,329 | |
| | 205,284 | | | Structured Asset Securities Corp. Trust,
Series 2005-AR1, Class M1, VAR, 1.208%, 09/25/35 | | | 201,250 | |
| | | | | | | | |
| | | | Total Asset-Backed Securities
(Cost $2,043,550) | | | 2,076,956 | |
| | | | | | | | |
| | Collateralized Mortgage Obligations — 2.2% | |
| | 495,828 | | | Alternative Loan Trust, Series 2006-14CB, Class A1, 6.000%, 06/25/36 | | | 429,389 | |
| | | | CHL Mortgage Pass-Through Trust, | | | | |
| | 438,446 | | | Series 2003-21, Class A1, VAR, 3.243%, 05/25/33 | | | 437,868 | |
| | 389,924 | | | Series 2005-31, Class 2A1, VAR, 3.143%, 01/25/36 | | | 353,953 | |
| | 125,328 | | | GSR Mortgage Loan Trust, Series 2004-11, Class 2A2, VAR, 3.325%, 09/25/34 | | | 123,608 | |
| | 474,192 | | | Wells Fargo Mortgage-Backed Securities Trust, Series 2006-2, Class 1A12, 5.750%, 03/25/36 | | | 476,556 | |
| | | | | | | | |
| | | | Total Collateralized Mortgage Obligations
(Cost $1,820,069) | | | 1,821,374 | |
| | | | | | | | |
| | |
| SHARES | | | | | | |
| | Common Stocks — 32.7% | |
| | | | Consumer Discretionary — 2.0% | |
| | | | Auto Components — 0.0% (g) | |
| | 143 | | | Continental AG, (Germany) | | | 28,984 | |
| | | | | | | | |
| | | | Automobiles — 0.1% | |
| | 700 | | | Honda Motor Co. Ltd., (Japan) | | | 21,684 | |
| | 430 | | | Renault SA, (France) | | | 38,168 | |
| | 1,100 | | | Suzuki Motor Corp., (Japan) | | | 42,993 | |
| | 105 | | | Tesla, Inc. (a) | | | 26,249 | |
| | | | | | | | |
| | | | | | | 129,094 | |
| | | | | | | | |
| | | | Distributors — 0.1% | |
| | 301 | | | Genuine Parts Co. | | | 28,809 | |
| | 1,095 | | | LKQ Corp. (a) | | | 34,580 | |
| | | | | | | | |
| | | | | | | 63,389 | |
| | | | | | | | |
| | | | Hotels, Restaurants & Leisure — 0.4% | |
| | 393 | | | Brinker International, Inc. | | | 16,600 | |
| | 852 | | | Hilton Grand Vacations, Inc. (a) | | | 25,509 | |
| | 2,602 | | | Hilton Worldwide Holdings, Inc. | | | 148,834 | |
| | 385 | | | InterContinental Hotels Group plc, (United Kingdom) | | | 18,142 | |
| | 1,086 | | | La Quinta Holdings, Inc. (a) | | | 15,052 | |
| | | | | | | | |
SHARES | | | SECURITY DESCRIPTION | | VALUE($) | |
| | | | | |
| | | | Hotels, Restaurants & Leisure — continued | | | | |
| | 648 | | | Norwegian Cruise Line Holdings Ltd. (a) | | | 32,854 | |
| | 400 | | | Oriental Land Co. Ltd., (Japan) | | | 22,484 | |
| | 338 | | | Red Rock Resorts, Inc., Class A | | | 7,426 | |
| | 730 | | | Starbucks Corp. | | | 41,515 | |
| | | | | | | | |
| | | | | | | 328,416 | |
| | | | | | | | |
| | | | Household Durables — 0.1% | |
| | 429 | | | Mohawk Industries, Inc. (a) | | | 97,108 | |
| | 386 | | | Newell Brands, Inc. | | | 18,926 | |
| | 8,200 | | | Taylor Wimpey plc, (United Kingdom) | | | 18,308 | |
| | | | | | | | |
| | | | | | | 134,342 | |
| | | | | | | | |
| | | | Internet & Direct Marketing Retail — 0.4% | |
| | 199 | | | Amazon.com, Inc. (a) | | | 168,163 | |
| | 249 | | | Expedia, Inc. | | | 29,641 | |
| | 271 | | | Netflix, Inc. (a) | | | 38,517 | |
| | 42 | | | Priceline Group, Inc. (The) (a) | | | 72,414 | |
| | 540 | | | Wayfair, Inc., Class A (a) | | | 20,417 | |
| | | | | | | | |
| | | | | | | 329,152 | |
| | | | | | | | |
| | | | Media — 0.3% | |
| | 473 | | | CBS Corp. (Non-Voting), Class B | | | 31,180 | |
| | 103 | | | Charter Communications, Inc., Class A (a) | | | 33,275 | |
| | 1,466 | | | Clear Channel Outdoor Holdings, Inc., Class A | | | 7,037 | |
| | 500 | | | Dentsu, Inc., (Japan) | | | 27,744 | |
| | 896 | | | DISH Network Corp., Class A (a) | | | 55,552 | |
| | 982 | | | Entercom Communications Corp., Class A | | | 15,368 | |
| | 314 | | | Nexstar Media Group, Inc., Class A | | | 21,674 | |
| | 419 | | | Sinclair Broadcast Group, Inc., Class A | | | 16,718 | |
| | 222 | | | Time Warner, Inc. | | | 21,803 | |
| | | | | | | | |
| | | | | | | 230,351 | |
| | | | | | | | |
| | | | Multiline Retail — 0.2% | |
| | 550 | | | Dollar General Corp. | | | 40,161 | |
| | 500 | | | Izumi Co. Ltd., (Japan) | | | 22,316 | |
| | 742 | | | Kohl’s Corp. | | | 31,624 | |
| | 1,600 | | | Marui Group Co. Ltd., (Japan) | | | 22,105 | |
| | 513 | | | Nordstrom, Inc. | | | 23,937 | |
| | | | | | | | |
| | | | | | | 140,143 | |
| | | | | | | | |
| | | | Specialty Retail — 0.3% | |
| | 43 | | | AutoZone, Inc. (a) | | | 31,672 | |
| | 524 | | | Bed Bath & Beyond, Inc. | | | 21,169 | |
| | 598 | | | Best Buy Co., Inc. | | | 26,390 | |
| | 6,876 | | | Dixons Carphone plc, (United Kingdom) | | | 25,859 | |
| | 752 | | | Gap, Inc. (The) | | | 18,665 | |
| | 223 | | | Home Depot, Inc. (The) | | | 32,315 | |
| | 3,458 | | | Kingfisher plc, (United Kingdom) | | | 14,105 | |
SEE NOTES TO CONSOLIDATED FINANCIAL STATEMENTS.
| | | | | | | | |
| | | |
| FEBRUARY 28, 2017 | | J.P. MORGAN FUNDS | | | | | 5 | |
JPMorgan Diversified Real Return Fund
CONSOLIDATED SCHEDULE OF PORTFOLIO INVESTMENTS
AS OF FEBRUARY 28, 2017 (Unaudited) (continued)
| | | | | | | | |
SHARES | | | SECURITY DESCRIPTION | | VALUE($) | |
| | Common Stocks — continued | |
| | | | Specialty Retail — continued | | | | |
| | 123 | | | Murphy USA, Inc. (a) | | | 7,835 | |
| | 415 | | | Tiffany & Co. | | | 38,126 | |
| | 91 | | | Ulta Beauty, Inc. (a) | | | 24,882 | |
| | | | | | | | |
| | | | | | | 241,018 | |
| | | | | | | | |
| | | | Textiles, Apparel & Luxury Goods — 0.1% | |
| | 175 | | | adidas AG, (Germany) | | | 29,357 | |
| | 379 | | | Columbia Sportswear Co. | | | 20,822 | |
| | 892 | | | Hanesbrands, Inc. | | | 17,849 | |
| | 99 | | | Kering, (France) | | | 24,089 | |
| | | | | | | | |
| | | | | | | 92,117 | |
| | | | | | | | |
| | | | Total Consumer Discretionary | | | 1,717,006 | |
| | | | | | | | |
| | | | Consumer Staples — 1.1% | |
| | | | Beverages — 0.2% | |
| | 425 | | | Anheuser-Busch InBev SA/NV, (Belgium) | | | 46,489 | |
| | 292 | | | Dr Pepper Snapple Group, Inc. | | | 27,285 | |
| | 147 | | | Molson Coors Brewing Co., Class B | | | 14,757 | |
| | 527 | | | Monster Beverage Corp. (a) | | | 21,839 | |
| | 246 | | | Pernod Ricard SA, (France) | | | 28,153 | |
| | 500 | | | Suntory Beverage & Food Ltd., (Japan) | | | 20,982 | |
| | | | | | | | |
| | | | | | | 159,505 | |
| | | | | | | | |
| | | | Food & Staples Retailing — 0.2% | |
| | 198 | | | Casey’s General Stores, Inc. | | | 22,687 | |
| | 470 | | | CVS Health Corp. | | | 37,873 | |
| | 3,708 | | | Distribuidora Internacional de Alimentacion SA, (Spain) | | | 20,552 | |
| | 1,863 | | | Koninklijke Ahold Delhaize NV, (Netherlands) (a) | | | 39,658 | |
| | 828 | | | Kroger Co. (The) | | | 26,330 | |
| | | | | | | | |
| | | | | | | 147,100 | |
| | | | | | | | |
| | | | Food Products — 0.5% | |
| | 2,603 | | | Archer-Daniels-Midland Co. | | | 122,263 | |
| | 849 | | | Associated British Foods plc, (United Kingdom) | | | 27,592 | |
| | 652 | | | Bunge Ltd. | | | 53,366 | |
| | 65,600 | | | Golden Agri-Resources Ltd., (Singapore) | | | 17,756 | |
| | 287 | | | Ingredion, Inc. | | | 34,696 | |
| | 350 | | | Post Holdings, Inc. (a) | | | 28,655 | |
| | 352 | | | TreeHouse Foods, Inc. (a) | | | 29,948 | |
| | 396 | | | Tyson Foods, Inc., Class A | | | 24,774 | |
| | 35,700 | | | Wilmar International Ltd., (Singapore) | | | 92,568 | |
| | | | | | | | |
| | | | | | | 431,618 | |
| | | | | | | | |
| | | | Household Products — 0.1% | |
| | 308 | | | Energizer Holdings, Inc. | | | 16,897 | |
| | 468 | | | Procter & Gamble Co. (The) | | | 42,621 | |
| | | | | | | | |
| | | | | | | 59,518 | |
| | | | | | | | |
| | | | | | | | |
SHARES | | | SECURITY DESCRIPTION | | VALUE($) | |
| | | | | |
| | | | Personal Products — 0.1% | |
| | 965 | | | Coty, Inc., Class A | | | 18,122 | |
| | 1,017 | | | Unilever NV, (United Kingdom), CVA | | | 48,143 | |
| | | | | | | | |
| | | | | | | 66,265 | |
| | | | | | | | |
| | | | Tobacco — 0.0% (g) | |
| | 893 | | | British American Tobacco plc, (United Kingdom) | | | 56,406 | |
| | | | | | | | |
| | | | Total Consumer Staples | | | 920,412 | |
| | | | | | | | |
| | | | Energy — 4.2% | |
| | | | Energy Equipment & Services — 0.2% | |
| | 410 | | | Baker Hughes, Inc. | | | 24,715 | |
| | 723 | | | Halliburton Co. | | | 38,651 | |
| | 1,106 | | | Schlumberger Ltd. | | | 88,878 | |
| | 946 | | | TechnipFMC plc, (United Kingdom) (a) | | | 30,512 | |
| | | | | | | | |
| | | | | | | 182,756 | |
| | | | | | | | |
| | | | Oil, Gas & Consumable Fuels — 4.0% | |
| | 599 | | | AltaGas Ltd., (Canada) | | | 13,981 | |
| | 495 | | | Anadarko Petroleum Corp. | | | 32,002 | |
| | 556 | | | Apache Corp. | | | 29,240 | |
| | 39,880 | | | BP plc, (United Kingdom) | | | 224,870 | |
| | 2,481 | | | Canadian Natural Resources Ltd., (Canada) | | | 71,150 | |
| | 793 | | | Cheniere Energy, Inc. (a) | | | 38,104 | |
| | 1,465 | | | Chevron Corp. | | | 164,812 | |
| | 34,000 | | | CNOOC Ltd., (China) | | | 40,222 | |
| | 308 | | | Concho Resources, Inc. (a) | | | 40,795 | |
| | 1,557 | | | ConocoPhillips | | | 74,066 | |
| | 479 | | | Devon Energy Corp. | | | 20,769 | |
| | 562 | | | Ecopetrol SA, (Colombia), ADR (a) | | | 5,069 | |
| | 3,068 | | | Enbridge, Inc., (Canada) | | | 129,123 | |
| | 2,376 | | | Enbridge, Inc., (Canada) | | | 99,451 | |
| | 5,715 | | | Eni SpA, (Italy) | | | 88,167 | |
| | 803 | | | EOG Resources, Inc. | | | 77,883 | |
| | 449 | | | EQT Corp. | | | 26,891 | |
| | 4,451 | | | Exxon Mobil Corp. | | | 361,955 | |
| | 12,827 | | | Gazprom PJSC, (Russia), ADR | | | 57,254 | |
| | 575 | | | Imperial Oil Ltd., (Canada) | | | 17,962 | |
| | 1,125 | | | Inter Pipeline Ltd., (Canada) | | | 23,589 | |
| | 7,573 | | | Kinder Morgan, Inc. | | | 161,381 | |
| | 222 | | | Koninklijke Vopak NV, (Netherlands) | | | 9,402 | |
| | 925 | | | LUKOIL PJSC, (Russia), ADR | | | 49,047 | |
| | 682 | | | Marathon Petroleum Corp. | | | 33,827 | |
| | 146 | | | Novatek PJSC, (Russia), Reg. S, GDR | | | 18,925 | |
| | 653 | | | Occidental Petroleum Corp. | | | 42,804 | |
| | 2,928 | | | Oil Search Ltd., (Australia) | | | 15,637 | |
| | 746 | | | ONEOK, Inc. | | | 40,321 | |
| | 837 | | | PBF Energy, Inc., Class A | | | 20,498 | |
SEE NOTES TO CONSOLIDATED FINANCIAL STATEMENTS.
| | | | | | |
| | | |
| 6 | | | | J.P. MORGAN FUNDS | | FEBRUARY 28, 2017 |
| | | | | | | | |
SHARES | | | SECURITY DESCRIPTION | | VALUE($) | |
| | Common Stocks — continued | |
| | | | Oil, Gas & Consumable Fuels — continued | |
| | 1,292 | | | Pembina Pipeline Corp., (Canada) | | | 41,750 | |
| | 3,212 | | | Petroleo Brasileiro SA, (Brazil), ADR (a) | | | 32,377 | |
| | 844 | | | Phillips 66 | | | 65,992 | |
| | 124 | | | Pioneer Natural Resources Co. | | | 23,060 | |
| | 2,427 | | | Repsol SA, (Spain) | | | 35,903 | |
| | 2,234 | | | Rosneft Oil Co. PJSC, (Russia), Reg. S, GDR | | | 12,675 | |
| | 242 | | | Rosneft Oil Co. PJSC, (Russia), Reg. S, GDR | | | 1,391 | |
| | 9,190 | | | Royal Dutch Shell plc, (Netherlands), Class A | | | 237,817 | |
| | 3,068 | | | Royal Dutch Shell plc, (Netherlands), Class A | | | 79,492 | |
| | 2,235 | | | Statoil ASA, (Norway) | | | 39,406 | |
| | 3,544 | | | Suncor Energy, Inc., (Canada) | | | 110,333 | |
| | 604 | | | Targa Resources Corp. | | | 34,126 | |
| | 6,022 | | | TOTAL SA, (France) | | | 300,474 | |
| | 2,645 | | | TransCanada Corp., (Canada) | | | 121,596 | |
| | 1,362 | | | Ultrapar Participacoes SA, (Brazil), ADR | | | 28,262 | |
| | 434 | | | Valero Energy Corp. | | | 29,490 | |
| | 1,068 | | | Veresen, Inc., (Canada) | | | 10,871 | |
| | 2,226 | | | Williams Cos., Inc. (The) | | | 63,085 | |
| | 1,530 | | | Woodside Petroleum Ltd., (Australia) | | | 36,700 | |
| | 1,324 | | | Z Energy Ltd., (New Zealand) | | | 6,872 | |
| | | | | | | | |
| | | | | | | 3,340,869 | |
| | | | | | | | |
| | | | Total Energy | | | 3,523,625 | |
| | | | | | | | |
| | | | Financials — 2.6% | |
| | | | Banks — 1.3% | |
| | 2,016 | | | Australia & New Zealand Banking Group Ltd., (Australia) | | | 47,715 | |
| | 4,603 | | | Bank of America Corp. | | | 113,602 | |
| | 699 | | | BNP Paribas SA, (France) | | | 40,899 | |
| | 795 | | | Citigroup, Inc. | | | 47,549 | |
| | 1,008 | | | Citizens Financial Group, Inc. | | | 37,669 | |
| | 752 | | | East West Bancorp, Inc. | | | 40,698 | |
| | 985 | | | Fifth Third Bancorp | | | 27,028 | |
| | 543 | | | First Republic Bank | | | 50,950 | |
| | 573 | | | HDFC Bank Ltd., (India), ADR | | | 41,078 | |
| | 3,122 | | | ING Groep NV, (Netherlands) | | | 43,011 | |
| | 298 | | | M&T Bank Corp. | | | 49,757 | |
| | 7,800 | | | Mitsubishi UFJ Financial Group, Inc., (Japan) | | | 51,603 | |
| | 3,187 | | | Nordea Bank AB, (Sweden) | | | 37,262 | |
| | 493 | | | PNC Financial Services Group, Inc. (The) | | | 62,724 | |
| | 279 | | | Signature Bank (a) | | | 43,945 | |
| | 2,859 | | | Standard Chartered plc, (United Kingdom) (a) | | | 25,627 | |
| | 1,200 | | | Sumitomo Mitsui Financial Group, Inc., (Japan) | | | 46,749 | |
| | 720 | | | SunTrust Banks, Inc. | | | 42,833 | |
| | 828 | | | US Bancorp | | | 45,540 | |
| | 2,828 | | | Wells Fargo & Co. | | | 163,685 | |
| | | | | | | | |
| | | | | | | 1,059,924 | |
| | | | | | | | |
| | | | | | | | |
SHARES | | | SECURITY DESCRIPTION | | VALUE($) | |
| | |
| | | | Capital Markets — 0.6% | |
| | 255 | | | Affiliated Managers Group, Inc. | | | 42,822 | |
| | 95 | | | BlackRock, Inc. | | | 36,809 | |
| | 2,512 | | | Charles Schwab Corp. (The) | | | 101,510 | |
| | 275 | | | Deutsche Boerse AG, (Germany) (a) | | | 23,569 | |
| | 619 | | | Invesco Ltd. | | | 19,925 | |
| | 531 | | | Lazard Ltd., Class A | | | 22,865 | |
| | 724 | | | Morgan Stanley | | | 33,065 | |
| | 400 | | | Nasdaq, Inc. | | | 28,444 | |
| | 254 | | | Northern Trust Corp. | | | 22,187 | |
| | 370 | | | S&P Global, Inc. | | | 47,904 | |
| | 623 | | | T Rowe Price Group, Inc. | | | 44,364 | |
| | 2,427 | | | UBS Group AG, (Switzerland) | | | 37,414 | |
| | | | | | | | |
| | | | | | | 460,878 | |
| | | | | | | | |
| | | | Consumer Finance — 0.1% | |
| | 1,183 | | | Ally Financial, Inc. | | | 26,606 | |
| | 1,028 | | | Capital One Financial Corp. | | | 96,488 | |
| | | | | | | | |
| | | | | | | 123,094 | |
| | | | | | | | |
| | | | Diversified Financial Services — 0.0% (g) | |
| | 2,700 | | | ORIX Corp., (Japan) | | | 42,012 | |
| | | | | | | | |
| | | | Insurance — 0.6% | |
| | 16 | | | Alleghany Corp. (a) | | | 10,333 | |
| | 538 | | | Allied World Assurance Co. Holdings AG | | | 28,417 | |
| | 1,004 | | | American International Group, Inc. | | | 64,176 | |
| | 1,342 | | | AXA SA, (France) | | | 31,695 | |
| | 273 | | | Chubb Ltd. | | | 37,720 | |
| | 825 | | | CNO Financial Group, Inc. | | | 17,251 | |
| | 878 | | | Hartford Financial Services Group, Inc. (The) | | | 42,926 | |
| | 1,756 | | | Loews Corp. | | | 82,497 | |
| | 168 | | | Marsh & McLennan Cos., Inc. | | | 12,345 | |
| | 194 | | | Prudential Financial, Inc. | | | 21,445 | |
| | 1,483 | | | Prudential plc, (United Kingdom) | | | 29,638 | |
| | 700 | | | Sompo Holdings, Inc., (Japan) | | | 26,167 | |
| | 1,000 | | | Tokio Marine Holdings, Inc., (Japan) | | | 43,823 | |
| | 318 | | | Travelers Cos., Inc. (The) | | | 38,872 | |
| | 523 | | | Unum Group | | | 25,538 | |
| | | | | | | | |
| | | | | | | 512,843 | |
| | | | | | | | |
| | | | Total Financials | | | 2,198,751 | |
| | | | | | | | |
| | | | Health Care — 1.5% | |
| | | | Biotechnology — 0.4% | |
| | 369 | | | Celgene Corp. (a) | | | 45,575 | |
| | 700 | | | Exact Sciences Corp. (a) | | | 15,064 | |
| | 220 | | | Genmab A/S, (Denmark) (a) | | | 43,508 | |
| | 543 | | | Gilead Sciences, Inc. | | | 38,271 | |
SEE NOTES TO CONSOLIDATED FINANCIAL STATEMENTS.
| | | | | | | | |
| | | |
| FEBRUARY 28, 2017 | | J.P. MORGAN FUNDS | | | | | 7 | |
JPMorgan Diversified Real Return Fund
CONSOLIDATED SCHEDULE OF PORTFOLIO INVESTMENTS
AS OF FEBRUARY 28, 2017 (Unaudited) (continued)
| | | | | | | | |
SHARES | | | SECURITY DESCRIPTION | | VALUE($) | |
| | Common Stocks — continued | |
| | | | Biotechnology — continued | |
| | 170 | | | Intercept Pharmaceuticals, Inc. (a) | | | 21,690 | |
| | 489 | | | Kite Pharma, Inc. (a) | | | 34,606 | |
| | 702 | | | Shire plc | | | 42,330 | |
| | 338 | | | Spark Therapeutics, Inc. (a) | | | 21,558 | |
| | 416 | | | Vertex Pharmaceuticals, Inc. (a) | | | 37,698 | |
| | | | | | | | |
| | | | | | | 300,300 | |
| | | | | | | | |
| | | | Health Care Providers & Services — 0.5% | |
| | 1,337 | | | Acadia Healthcare Co., Inc. (a) | | | 59,790 | |
| | 522 | | | Aetna, Inc. | | | 67,213 | |
| | 102 | | | Cigna Corp. | | | 15,188 | |
| | 399 | | | Fresenius SE & Co. KGaA, (Germany) | | | 31,678 | |
| | 387 | | | HCA Holdings, Inc. (a) | | | 33,762 | |
| | 200 | | | Humana, Inc. | | | 42,250 | |
| | 979 | | | UnitedHealth Group, Inc. | | | 161,907 | |
| | | | | | | | |
| | | | | | | 411,788 | |
| | | | | | | | |
| | | | Health Care Technology — 0.0% (g) | |
| | 448 | | | Veeva Systems, Inc., Class A (a) | | | 19,573 | |
| | | | | | | | |
| | | | Life Sciences Tools & Services — 0.1% | |
| | 217 | | | Illumina, Inc. (a) | | | 36,326 | |
| | 449 | | | VWR Corp. (a) | | | 12,617 | |
| | | | | | | | |
| | | | | | | 48,943 | |
| | | | | | | | |
| | | | Pharmaceuticals — 0.5% | |
| | 104 | | | Allergan plc | | | 25,461 | |
| | 576 | | | AstraZeneca plc, (United Kingdom) | | | 33,195 | |
| | 1,698 | | | GlaxoSmithKline plc, (United Kingdom) | | | 34,746 | |
| | 170 | | | Jazz Pharmaceuticals plc (a) | | | 22,545 | |
| | 533 | | | Johnson & Johnson | | | 65,138 | |
| | 936 | | | Merck & Co., Inc. | | | 61,654 | |
| | 2,821 | | | Pfizer, Inc. | | | 96,253 | |
| | 635 | | | Revance Therapeutics, Inc. (a) | | | 13,335 | |
| | 264 | | | Roche Holding AG, (Switzerland) | | | 64,259 | |
| | 242 | | | Sanofi, (France) | | | 20,875 | |
| | 2,204 | | | TherapeuticsMD, Inc. (a) | | | 13,841 | |
| | | | | | | | |
| | | | | | | 451,302 | |
| | | | | | | | |
| | | | Total Health Care | | | 1,231,906 | |
| | | | | | | | |
| | | | Industrials — 3.4% | |
| | | | Aerospace & Defense — 0.1% | |
| | 518 | | | Airbus SE, (France) | | | 38,061 | |
| | 346 | | | Thales SA, (France) | | | 34,085 | |
| | 401 | | | United Technologies Corp. | | | 45,132 | |
| | | | | | | | |
| | | | | | | 117,278 | |
| | | | | | | | |
| | | | Air Freight & Logistics — 0.0% (g) | |
| | 1,500 | | | Yamato Holdings Co. Ltd., (Japan) | | | 32,743 | |
| | | | | | | | |
| | | | | | | | |
SHARES | | | SECURITY DESCRIPTION | | VALUE($) | |
| | |
| | | | Airlines — 0.2% | |
| | 1,936 | | | Delta Air Lines, Inc. | | | 96,664 | |
| | 1,200 | | | Japan Airlines Co. Ltd., (Japan) | | | 39,215 | |
| | 1,025 | | | Southwest Airlines Co. | | | 59,245 | |
| | | | | | | | |
| | | | | | | 195,124 | |
| | | | | | | | |
| | | | Building Products — 0.2% | |
| | 400 | | | Daikin Industries Ltd., (Japan) | | | 37,962 | |
| | 709 | | | Fortune Brands Home & Security, Inc. | | | 41,001 | |
| | 288 | | | Lennox International, Inc. | | | 47,411 | |
| | | | | | | | |
| | | | | | | 126,374 | |
| | | | | | | | |
| | | | Commercial Services & Supplies — 0.1% | |
| | 1,257 | | | Waste Connections, Inc., (Canada) | | | 109,849 | |
| | | | | | | | |
| | | | Construction & Engineering — 0.1% | |
| | 5,000 | | | Kajima Corp., (Japan) | | | 32,589 | |
| | 634 | | | OCI NV, (Netherlands) (a) | | | 12,604 | |
| | | | | | | | |
| | | | | | | 45,193 | |
| | | | | | | | |
| | | | Electrical Equipment — 0.1% | |
| | 217 | | | Acuity Brands, Inc. | | | 45,852 | |
| | | | | | | | |
| | | | Industrial Conglomerates — 0.2% | |
| | 615 | | | Carlisle Cos., Inc. | | | 63,529 | |
| | 341 | | | Honeywell International, Inc. | | | 42,455 | |
| | 435 | | | Siemens AG, (Germany) | | | 56,550 | |
| | | | | | | | |
| | | | | | | 162,534 | |
| | | | | | | | |
| | | | Machinery — 0.3% | |
| | 912 | | | CNH Industrial NV, (United Kingdom) | | | 8,426 | |
| | 1,900 | | | DMG Mori Co. Ltd., (Japan) | | | 30,027 | |
| | 376 | | | Dover Corp. | | | 30,118 | |
| | 227 | | | Illinois Tool Works, Inc. | | | 29,966 | |
| | 186 | | | Middleby Corp. (The) (a) | | | 25,800 | |
| | 415 | | | Stanley Black & Decker, Inc. | | | 52,767 | |
| | 339 | | | WABCO Holdings, Inc. (a) | | | 38,063 | |
| | 467 | | | Wartsila OYJ Abp, (Finland) | | | 23,979 | |
| | | | | | | | |
| | | | | | | 239,146 | |
| | | | | | | | |
| | | | Professional Services — 0.0% (g) | |
| | 249 | | | Equifax, Inc. | | | 32,646 | |
| | | | | | | | |
| | | | Road & Rail — 0.0% (g) | |
| | 360 | | | Old Dominion Freight Line, Inc. (a) | | | 33,034 | |
| | | | | | | | |
| | | | Trading Companies & Distributors — 0.2% | |
| | 808 | | | HD Supply Holdings, Inc. (a) | | | 34,744 | |
| | 1,800 | | | Mitsubishi Corp., (Japan) | | | 40,633 | |
| | 190 | | | United Rentals, Inc. (a) | | | 24,326 | |
| | 539 | | | Wolseley plc, (Switzerland) | | | 32,888 | |
| | | | | | | | |
| | | | | | | 132,591 | |
| | | | | | | | |
SEE NOTES TO CONSOLIDATED FINANCIAL STATEMENTS.
| | | | | | |
| | | |
| 8 | | | | J.P. MORGAN FUNDS | | FEBRUARY 28, 2017 |
| | | | | | | | |
SHARES | | | SECURITY DESCRIPTION | | VALUE($) | |
| | Common Stocks — continued | |
| | | | Transportation Infrastructure — 1.9% | |
| | 8,256 | | | Abertis Infraestructuras SA, (Spain) | | | 120,956 | |
| | 1,030 | | | Aena SA, (Spain) (e) | | | 147,133 | |
| | 451 | | | Aeroports de Paris, (France) | | | 51,164 | |
| | 6,813 | | | Atlantia SpA, (Italy) | | | 159,522 | |
| | 12,817 | | | Auckland International Airport Ltd., (New Zealand) | | | 67,683 | |
| | 12,851 | | | BBA Aviation plc, (United Kingdom) | | | 48,614 | |
| | 18,000 | | | Beijing Capital International Airport Co. Ltd., (China), Class H | | | 19,289 | |
| | 10,000 | | | China Merchants Port Holdings Co. Ltd., (China) | | | 27,883 | |
| | 22,000 | | | COSCO SHIPPING Ports Ltd., (China) | | | 24,502 | |
| | 268 | | | Flughafen Zuerich AG, (Switzerland) | | | 54,110 | |
| | 526 | | | Fraport AG Frankfurt Airport Services Worldwide, (Germany) | | | 32,907 | |
| | 7,744 | | | Groupe Eurotunnel SE, (France) | | | 72,249 | |
| | 577 | | | Grupo Aeroportuario del Pacifico SAB de CV, (Mexico), ADR | | | 49,882 | |
| | 257 | | | Grupo Aeroportuario del Sureste SAB de CV, (Mexico), ADR | | | 40,688 | |
| | 73,000 | | | Hutchison Port Holdings Trust, (Hong Kong) | | | 27,747 | |
| | 800 | | | Japan Airport Terminal Co. Ltd., (Japan) | | | 27,980 | |
| | 16,000 | | | Jiangsu Expressway Co. Ltd., (China), Class H | | | 21,107 | |
| | 2,000 | | | Kamigumi Co. Ltd., (Japan) | | | 18,766 | |
| | 6,242 | | | Macquarie Atlas Roads Group, (Australia) | | | 23,420 | |
| | 1,054 | | | Macquarie Infrastructure Corp. | | | 81,095 | |
| | 2,000 | | | Mitsubishi Logistics Corp., (Japan) | | | 28,721 | |
| | 17,076 | | | Qube Holdings Ltd., (Australia) | | | 30,200 | |
| | 8,900 | | | SATS Ltd., (Singapore) | | | 31,754 | |
| | 12,500 | | | Shenzhen International Holdings Ltd., (China) | | | 17,922 | |
| | 939 | | | Societa Iniziative Autostradali e Servizi SpA, (Italy) | | | 8,227 | |
| | 2,000 | | | Sumitomo Warehouse Co. Ltd. (The), (Japan) | | | 11,535 | |
| | 15,867 | | | Sydney Airport, (Australia) | | | 73,707 | |
| | 24,814 | | | Transurban Group, (Australia) | | | 209,849 | |
| | 740 | | | Wesco Aircraft Holdings, Inc. (a) | | | 8,954 | |
| | 820 | | | Westshore Terminals Investment Corp., (Canada) | | | 16,669 | |
| | | | | | | | |
| | | | | | | 1,554,235 | |
| | | | | | | | |
| | | | Total Industrials | | | 2,826,599 | |
| | | | | | | | |
| | | | Information Technology — 2.5% | |
| | | | Communications Equipment — 0.2% | |
| | 276 | | | Arista Networks, Inc. (a) | | | 32,841 | |
| | 1,383 | | | Cisco Systems, Inc. | | | 47,271 | |
| | 286 | | | Harris Corp. | | | 31,431 | |
| | 184 | | | Palo Alto Networks, Inc. (a) | | | 27,950 | |
| | | | | | | | |
| | | | | | | 139,493 | |
| | | | | | | | |
| | | | | | | | |
SHARES | | | SECURITY DESCRIPTION | | VALUE($) | |
| | | | | | | | |
| | | | Electronic Equipment, Instruments & Components — 0.2% | |
| | 716 | | | Amphenol Corp., Class A | | | 49,555 | |
| | 375 | | | Arrow Electronics, Inc. (a) | | | 27,075 | |
| | 1,634 | | | Corning, Inc. | | | 45,115 | |
| | 200 | | | Keyence Corp., (Japan) | | | 77,336 | |
| | | | | | | | |
| | | | | | | 199,081 | |
| | | | | | | | |
| | | | Internet Software & Services — 0.6% | |
| | 312 | | | Alphabet, Inc., Class C (a) | | | 256,842 | |
| | 1,155 | | | Facebook, Inc., Class A (a) | | | 156,549 | |
| | 1,239 | | | GoDaddy, Inc., Class A (a) | | | 45,657 | |
| | 600 | | | Tencent Holdings Ltd., (China) | | | 15,922 | |
| | | | | | | | |
| | | | | | | 474,970 | |
| | | | | | | | |
| | | | IT Services — 0.4% | |
| | 388 | | | Capgemini SA, (France) | | | 33,233 | |
| | 632 | | | Mastercard, Inc., Class A | | | 69,811 | |
| | 1,548 | | | PayPal Holdings, Inc. (a) | | | 65,016 | |
| | 891 | | | Vantiv, Inc., Class A (a) | | | 58,253 | |
| | 867 | | | Visa, Inc., Class A | | | 76,244 | |
| | | | | | | | |
| | | | | | | 302,557 | |
| | | | | | | | |
| | | | Semiconductors & Semiconductor Equipment — 0.4% | |
| | 894 | | | Applied Materials, Inc. | | | 32,381 | |
| | 288 | | | ASML Holding NV, (Netherlands) | | | 35,009 | |
| | 244 | | | Broadcom Ltd. | | | 51,467 | |
| | 310 | | | Cavium, Inc. (a) | | | 20,308 | |
| | 1,953 | | | Infineon Technologies AG, (Germany) | | | 34,716 | |
| | 235 | | | KLA-Tencor Corp. | | | 21,178 | |
| | 256 | | | Lam Research Corp. | | | 30,346 | |
| | 392 | | | NVIDIA Corp. | | | 39,780 | |
| | 501 | | | QUALCOMM, Inc. | | | 28,297 | |
| | 640 | | | Texas Instruments, Inc. | | | 49,037 | |
| | | | | | | | |
| | | | | | | 342,519 | |
| | | | | | | | |
| | | | Software — 0.5% | |
| | 372 | | | Adobe Systems, Inc. (a) | | | 44,022 | |
| | 914 | | | Electronic Arts, Inc. (a) | | | 79,061 | |
| | 364 | | | Guidewire Software, Inc. (a) | | | 19,889 | |
| | 2,363 | | | Microsoft Corp. | | | 151,185 | |
| | 427 | | | salesforce.com, Inc. (a) | | | 34,736 | |
| | 435 | | | ServiceNow, Inc. (a) | | | 37,810 | |
| | 450 | | | Splunk, Inc. (a) | | | 27,779 | |
| | | | | | | | |
| | | | | | | 394,482 | |
| | | | | | | | |
| | | | Technology Hardware, Storage & Peripherals — 0.2% | |
| | 1,304 | | | Apple, Inc. | | | 178,635 | |
| | 1,148 | | | Hewlett Packard Enterprise Co. | | | 26,197 | |
| | | | | | | | |
| | | | | | | 204,832 | |
| | | | | | | | |
| | | | Total Information Technology | | | 2,057,934 | |
| | | | | | | | |
SEE NOTES TO CONSOLIDATED FINANCIAL STATEMENTS.
| | | | | | | | |
| | | |
| FEBRUARY 28, 2017 | | J.P. MORGAN FUNDS | | | | | 9 | |
JPMorgan Diversified Real Return Fund
CONSOLIDATED SCHEDULE OF PORTFOLIO INVESTMENTS
AS OF FEBRUARY 28, 2017 (Unaudited) (continued)
| | | | | | | | |
SHARES | | | SECURITY DESCRIPTION | | VALUE($) | |
| | Common Stocks — continued | |
| | | | Materials — 5.6% | |
| | | | Chemicals — 1.4% | |
| | 425 | | | AdvanSix, Inc. (a) | | | 11,594 | |
| | 1,290 | | | Agrium, Inc., (Canada) | | | 124,367 | |
| | 923 | | | CF Industries Holdings, Inc. | | | 29,001 | |
| | 435 | | | Chr Hansen Holding A/S, (Denmark) | | | 25,937 | |
| | 624 | | | FMC Corp. | | | 35,955 | |
| | 4,818 | | | Israel Chemicals Ltd., (Israel) | | | 20,529 | |
| | 1,858 | | | K+S AG, (Germany) | | | 43,392 | |
| | 1,932 | | | Monsanto Co. | | | 219,920 | |
| | 1,486 | | | Mosaic Co. (The) | | | 46,348 | |
| | 8,134 | | | Potash Corp. of Saskatchewan, Inc., (Canada) | | | 141,099 | |
| | 851 | | | Syngenta AG, (Switzerland) (a) | | | 365,567 | |
| | 1,706 | | | Yara International ASA, (Norway) | | | 64,766 | |
| | | | | | | | |
| | | | | | | 1,128,475 | |
| | | | | | | | |
| | | | Construction Materials — 0.1% | |
| | 399 | | | Eagle Materials, Inc. | | | 41,380 | |
| | 126 | | | Martin Marietta Materials, Inc. | | | 27,210 | |
| | 220 | | | Vulcan Materials Co. | | | 26,534 | |
| | | | | | | | |
| | | | | | | 95,124 | |
| | | | | | | | |
| | | | Containers & Packaging — 0.7% | |
| | 11,230 | | | Amcor Ltd., (Australia) | | | 120,871 | |
| | 457 | | | Avery Dennison Corp. | | | 36,885 | |
| | 555 | | | Ball Corp. | | | 40,809 | |
| | 1,498 | | | Graphic Packaging Holding Co. | | | 19,998 | |
| | 1,837 | | | International Paper Co. | | | 96,810 | |
| | 475 | | | Packaging Corp. of America | | | 43,904 | |
| | 786 | | | Sealed Air Corp. | | | 36,533 | |
| | 2,293 | | | Smurfit Kappa Group plc, (Ireland) | | | 60,902 | |
| | 1,757 | | | WestRock Co. | | | 94,386 | |
| | | | | | | | |
| | | | | | | 551,098 | |
| | | | | | | | |
| | | | Metals & Mining — 3.0% | |
| | 820 | | | Alcoa Corp. | | | 28,364 | |
| | 7,795 | | | Anglo American plc, (United Kingdom) (a) | | | 122,393 | |
| | 2,134 | | | Antofagasta plc, (Chile) | | | 21,444 | |
| | 10,472 | | | ArcelorMittal, (Luxembourg) (a) | | | 92,146 | |
| | 6,540 | | | Barrick Gold Corp., (Canada) | | | 121,513 | |
| | 17,815 | | | BHP Billiton Ltd., (Australia) | | | 337,204 | |
| | 875 | | | Franco-Nevada Corp., (Canada) | | | 56,399 | |
| | 6,819 | | | Freeport-McMoRan, Inc. (a) | | | 91,375 | |
| | 1,026 | | | Fresnillo plc, (Mexico) | | | 18,827 | |
| | 67,146 | | | Glencore plc, (Switzerland) (a) | | | 267,682 | |
| | 4,702 | | | Goldcorp, Inc., (Canada) | | | 74,520 | |
| | 3,200 | | | JFE Holdings, Inc., (Japan) | | | 60,491 | |
| | | | | | | | |
SHARES | | | SECURITY DESCRIPTION | | VALUE($) | |
| | | | | | | | |
| | | | Metals & Mining — continued | |
| | 70 | | | Korea Zinc Co. Ltd., (South Korea) (a) | | | 25,743 | |
| | 3,773 | | | MMC Norilsk Nickel PJSC, (Russia), ADR | | | 60,077 | |
| | 4,231 | | | Newcrest Mining Ltd., (Australia) | | | 71,671 | |
| | 2,914 | | | Newmont Mining Corp. | | | 99,775 | |
| | 6,400 | | | Nippon Steel & Sumitomo Metal Corp., (Japan) | | | 157,322 | |
| | 13,845 | | | Norsk Hydro ASA, (Norway) | | | 78,385 | |
| | 462 | | | Novolipetsk Steel PJSC, (Russia), GDR | | | 8,855 | |
| | 1,768 | | | Nucor Corp. | | | 110,624 | |
| | 445 | | | POSCO, (South Korea) | | | 111,276 | |
| | 2,360 | | | Rio Tinto Ltd., (United Kingdom) | | | 111,889 | |
| | 1,185 | | | Rio Tinto plc, (United Kingdom) | | | 48,569 | |
| | 952 | | | Severstal PJSC, (Russia), Reg. S, GDR | | | 13,560 | |
| | 2,468 | | | Silver Wheaton Corp., (Canada) | | | 48,070 | |
| | 29,466 | | | South32 Ltd., (Australia) | | | 56,100 | |
| | 959 | | | Southern Copper Corp., (Peru) | | | 35,157 | |
| | 4,000 | | | Sumitomo Metal Mining Co. Ltd., (Japan) | | | 55,570 | |
| | 2,418 | | | thyssenkrupp AG, (Germany) | | | 60,356 | |
| | 7,239 | | | Vale SA, (Brazil), ADR | | | 74,924 | |
| | 598 | | | voestalpine AG, (Austria) | | | 25,126 | |
| | | | | | | | |
| | | | | | | 2,545,407 | |
| | | | | | | | |
| | | | Paper & Forest Products — 0.4% | |
| | 2,205 | | | Fibria Celulose SA, (Brazil), ADR | | | 18,853 | |
| | 680 | | | KapStone Paper and Packaging Corp. | | | 15,368 | |
| | 3,559 | | | Mondi plc, (South Africa) | | | 82,952 | |
| | 8,000 | | | Oji Holdings Corp., (Japan) | | | 38,319 | |
| | 5,520 | | | Stora Enso OYJ, (Finland), Class R | | | 59,198 | |
| | 6,453 | | | UPM-Kymmene OYJ, (Finland) | | | 153,044 | |
| | | | | | | | |
| | | | | | | 367,734 | |
| | | | | | | | |
| | | | Total Materials | | | 4,687,838 | |
| | | | | | | | |
| | | | Real Estate — 7.3% | |
| | | | Equity Real Estate Investment Trusts (REITs) — 7.1% | |
| | 1,262 | | | American Homes 4 Rent, Class A | | | 29,998 | |
| | 3,450 | | | Apartment Investment & Management Co., Class A | | | 160,528 | |
| | 1,620 | | | AvalonBay Communities, Inc. | | | 297,724 | |
| | 1,400 | | | Boston Properties, Inc. | | | 194,642 | |
| | 5,500 | | | Brandywine Realty Trust | | | 91,630 | |
| | 4,991 | | | Brixmor Property Group, Inc. | | | 116,490 | |
| | 2,340 | | | Camden Property Trust | | | 198,081 | |
| | 2,680 | | | Corporate Office Properties Trust | | | 91,361 | |
| | 3,020 | | | CubeSmart | | | 82,295 | |
| | 1,580 | | | CyrusOne, Inc. | | | 80,422 | |
| | 1,630 | | | Digital Realty Trust, Inc. | | | 176,040 | |
| | 1,560 | | | Duke Realty Corp. | | | 39,998 | |
SEE NOTES TO CONSOLIDATED FINANCIAL STATEMENTS.
| | | | | | |
| | | |
| 10 | | | | J.P. MORGAN FUNDS | | FEBRUARY 28, 2017 |
| | | | | | | | |
SHARES | | | SECURITY DESCRIPTION | | VALUE($) | |
| | Common Stocks — continued | |
| | | | Equity Real Estate Investment Trusts (REITs) — continued | |
| | 250 | | | EastGroup Properties, Inc. | | | 18,585 | |
| | 420 | | | Equinix, Inc. | | | 157,949 | |
| | 1,730 | | | Equity LifeStyle Properties, Inc. | | | 137,743 | |
| | 2,840 | | | Equity One, Inc. | | | 89,914 | |
| | 770 | | | Essex Property Trust, Inc. | | | 180,719 | |
| | 6,100 | | | GGP, Inc. | | | 151,646 | |
| | 7,498 | | | Goodman Group, (Australia) | | | 43,370 | |
| | 8,630 | | | HCP, Inc. | | | 282,978 | |
| | 1,200 | | | Highwoods Properties, Inc. | | | 62,988 | |
| | 6,690 | | | Host Hotels & Resorts, Inc. | | | 120,353 | |
| | 2,110 | | | Hudson Pacific Properties, Inc. | | | 77,184 | |
| | 3,900 | | | Invitation Homes, Inc. (a) | | | 84,981 | |
| | 1,020 | | | Kilroy Realty Corp. | | | 78,693 | |
| | 9,340 | | | Kimco Realty Corp. | | | 226,495 | |
| | 1,013 | | | Klepierre, (France) | | | 37,624 | |
| | 1,560 | | | Liberty Property Trust | | | 61,526 | |
| | 1,900 | | | Macerich Co. (The) | | | 128,022 | |
| | 2,150 | | | National Health Investors, Inc. | | | 162,798 | |
| | 909 | | | Outfront Media, Inc. | | | 23,589 | |
| | 3,028 | | | Park Hotels & Resorts, Inc. | | | 77,335 | |
| | 420 | | | Pennsylvania REIT | | | 6,930 | |
| | 7,580 | | | Prologis, Inc. | | | 386,959 | |
| | 1,432 | | | Public Storage | | | 325,723 | |
| | 3,942 | | | Quality Care Properties, Inc. (a) | | | 74,819 | |
| | 1,763 | | | Rayonier, Inc. | | | 50,492 | |
| | 3,480 | | | Realty Income Corp. | | | 213,254 | |
| | 800 | | | Senior Housing Properties Trust | | | 16,400 | |
| | 1,510 | | | Simon Property Group, Inc. | | | 278,444 | |
| | 1,640 | | | SL Green Realty Corp. | | | 184,795 | |
| | 15,500 | | | Spirit Realty Capital, Inc. | | | 170,345 | |
| | 1,290 | | | STORE Capital Corp. | | | 32,134 | |
| | 5,830 | | | Sunstone Hotel Investors, Inc. | | | 85,992 | |
| | 1,150 | | | Ventas, Inc. | | | 74,808 | |
| | 1,700 | | | Vornado Realty Trust | | | 186,779 | |
| | 3,887 | | | Weyerhaeuser Co. | | | 131,070 | |
| | | | | | | | |
| | | | | | | 5,982,645 | |
| | | | | | | | |
| | | | Real Estate Management & Development — 0.2% | |
| | 1,835 | | | CBRE Group, Inc., Class A (a) | | | 65,363 | |
| | 12,000 | | | China Resources Land Ltd., (China) | | | 32,739 | |
| | 2,000 | | | Mitsui Fudosan Co. Ltd., (Japan) | | | 45,254 | |
| | | | | | | | |
| | | | | | | 143,356 | |
| | | | | | | | |
| | | | Total Real Estate | | | 6,126,001 | |
| | | | | | | | |
| | | | | | | | |
SHARES | | | SECURITY DESCRIPTION | | VALUE($) | |
| | | | | | | | |
| | | | Telecommunication Services — 0.2% | |
| | | | Diversified Telecommunication Services — 0.1% | |
| | 900 | | | Nippon Telegraph & Telephone Corp., (Japan) | | | 38,069 | |
| | 34,880 | | | Telecom Italia SpA, (Italy) (a) | | | 28,149 | |
| | 649 | | | Verizon Communications, Inc. | | | 32,210 | |
| | | | | | | | |
| | | | | | | 98,428 | |
| | | | | | | | |
| | | | Wireless Telecommunication Services — 0.1% | |
| | 295 | | | T-Mobile US, Inc. (a) | | | 18,446 | |
| | 16,695 | | | Vodafone Group plc, (United Kingdom) | | | 41,811 | |
| | | | | | | | |
| | | | | | | 60,257 | |
| | | | | | | | |
| | | | Total Telecommunication Services | | | 158,685 | |
| | | | | | | | |
| | | | Utilities — 2.3% | |
| | | | Electric Utilities — 1.6% | |
| | 1,699 | | | American Electric Power Co., Inc. | | | 113,782 | |
| | 4,000 | | | CLP Holdings Ltd., (Hong Kong) | | | 40,684 | |
| | 736 | | | CPFL Energia SA, (Brazil), ADR | | | 11,975 | |
| | 1,742 | | | Duke Energy Corp. | | | 143,802 | |
| | 1,151 | | | Edison International | | | 91,781 | |
| | 748 | | | Enel Americas SA, (Chile), ADR | | | 7,293 | |
| | 24,723 | | | Enel SpA, (Italy) | | | 106,103 | |
| | 1,123 | | | Eversource Energy | | | 65,875 | |
| | 2,046 | | | Exelon Corp. | | | 75,109 | |
| | 14,090 | | | Iberdrola SA, (Spain) | | | 93,554 | |
| | 1,281 | | | NextEra Energy, Inc. | | | 167,811 | |
| | 1,079 | | | PG&E Corp. | | | 72,023 | |
| | 1,456 | | | PPL Corp. | | | 53,697 | |
| | 2,162 | | | Southern Co. (The) | | | 109,873 | |
| | 2,215 | | | SSE plc, (United Kingdom) | | | 42,321 | |
| | 2,087 | | | Xcel Energy, Inc. | | | 91,223 | |
| | | | | | | | |
| | | | | | | 1,286,906 | |
| | | | | | | | |
| | | | Gas Utilities — 0.0% (g) | |
| | 4,000 | | | China Gas Holdings Ltd., (Hong Kong) | | | 5,933 | |
| | 8,000 | | | China Resources Gas Group Ltd., (China) | | | 24,433 | |
| | | | | | | | |
| | | | | | | 30,366 | |
| | | | | | | | |
| | | | Independent Power & Renewable Electricity
Producers — 0.0% (g) | |
| | 4,000 | | | China Resources Power Holdings Co. Ltd., (China) | | | 7,239 | |
| | | | | | | | |
| | | | Multi-Utilities — 0.7% | |
| | 12,029 | | | Centrica plc, (United Kingdom) | | | 33,886 | |
| | 712 | | | Consolidated Edison, Inc. | | | 54,852 | |
| | 1,331 | | | Dominion Resources, Inc. | | | 103,339 | |
| | 4,402 | | | E.ON SE, (Germany) | | | 34,144 | |
| | 3,545 | | | Engie SA, (France) | | | 43,374 | |
| | 8,543 | | | National Grid plc, (United Kingdom) | | | 103,783 | |
SEE NOTES TO CONSOLIDATED FINANCIAL STATEMENTS.
| | | | | | | | |
| | | |
| FEBRUARY 28, 2017 | | J.P. MORGAN FUNDS | | | | | 11 | |
JPMorgan Diversified Real Return Fund
CONSOLIDATED SCHEDULE OF PORTFOLIO INVESTMENTS
AS OF FEBRUARY 28, 2017 (Unaudited) (continued)
| | | | | | | | |
SHARES | | | SECURITY DESCRIPTION | | VALUE($) | |
| | Common Stocks — continued | |
| | | | Multi-Utilities — continued | |
| | 1,112 | | | Public Service Enterprise Group, Inc. | | | 51,130 | |
| | 817 | | | Sempra Energy | | | 90,107 | |
| | 736 | | | WEC Energy Group, Inc. | | | 44,359 | |
| | | | | | | | |
| | | | | | | 558,974 | |
| | | | | | | | |
| | | | Water Utilities — 0.0% (g) | |
| | 10,000 | | | Beijing Enterprises Water Group Ltd., (China) | | | 7,139 | |
| | 766 | | | Cia de Saneamento Basico do Estado de Sao Paulo, (Brazil), ADR | | | 8,112 | |
| | 4,000 | | | Guangdong Investment Ltd., (China) | | | 5,449 | |
| | | | | | | | |
| | | | | | | 20,700 | |
| | | | | | | | |
| | | | Total Utilities | | | 1,904,185 | |
| | | | | | | | |
| | | | Total Common Stocks
(Cost $25,836,758) | | | 27,352,942 | |
| | | | | | | | |
| | |
PRINCIPAL
AMOUNT($) | | | | | | |
| | Corporate Bonds — 28.8% | |
| | | | Consumer Discretionary — 3.3% | |
| | | | Auto Components — 0.2% | |
| | | | American Axle & Manufacturing, Inc., | | | | |
| | 11,000 | | | 6.250%, 03/15/21 | | | 11,316 | |
| | 33,000 | | | 6.625%, 10/15/22 | | | 34,155 | |
| | 7,000 | | | Cooper-Standard Automotive, Inc., 5.625%, 11/15/26 (e) | | | 7,088 | |
| | 46,000 | | | Dana, Inc., 5.500%, 12/15/24 | | | 48,070 | |
| | 50,000 | | | Goodyear Tire & Rubber Co. (The), 5.000%, 05/31/26 | | | 51,000 | |
| | | | Icahn Enterprises LP, | | | | |
| | 15,000 | | | 5.875%, 02/01/22 | | | 15,300 | |
| | 4,000 | | | 6.250%, 02/01/22 (e) | | | 4,130 | |
| | 4,000 | | | 6.750%, 02/01/24 (e) | | | 4,155 | |
| | 25,000 | | | Tenneco, Inc., 5.375%, 12/15/24 | | | 26,125 | |
| | | | | | | | |
| | | | | | | 201,339 | |
| | | | | | | | |
| | | | Automobiles — 0.2% | |
| | 150,000 | | | Daimler Finance North America LLC, (Germany), 1.875%, 01/11/18 (e) | | | 150,313 | |
| | 35,000 | | | Ford Motor Co., 4.346%, 12/08/26 | | | 35,913 | |
| | | | | | | | |
| | | | | | | 186,226 | |
| | | | | | | | |
| | | | Distributors — 0.1% | |
| | 10,000 | | | Global Partners LP, 6.250%, 07/15/22 | | | 9,800 | |
| | 59,000 | | | LKQ Corp., 4.750%, 05/15/23 | | | 59,092 | |
| | | | | | | | |
| | | | | | | 68,892 | |
| | | | | | | | |
| | | | Diversified Consumer Services — 0.0% (g) | |
| | 22,000 | | | Service Corp. International, 5.375%, 05/15/24 | | | 23,307 | |
| | | | | | | | |
| | | | | | | | |
PRINCIPAL
AMOUNT($) | | | SECURITY DESCRIPTION | | VALUE($) | |
| | |
| | | | Hotels, Restaurants & Leisure — 0.8% | |
| | 18,000 | | | 1011778 BC ULC, (Canada), 6.000%, 04/01/22 (e) | | | 18,770 | |
| | 18,000 | | | Boyd Gaming Corp., 6.875%, 05/15/23 | | | 19,440 | |
| | 60,000 | | | Choice Hotels International, Inc., 5.750%, 07/01/22 | | | 65,100 | |
| | 15,000 | | | Downstream Development Authority of the Quapaw Tribe of Oklahoma, 10.500%, 07/01/19 (e) | | | 14,887 | |
| | 10,000 | | | ESH Hospitality, Inc., 5.250%, 05/01/25 (e) | | | 10,087 | |
| | 10,000 | | | Gateway Casinos & Entertainment Ltd., (Canada), 8.250%, 03/01/24 (e) | | | 10,163 | |
| | | | GLP Capital LP, | | | | |
| | 72,000 | | | 5.375%, 11/01/23 | | | 77,220 | |
| | 57,000 | | | 5.375%, 04/15/26 | | | 59,636 | |
| | 10,000 | | | Hilton Domestic Operating Co., Inc., 4.250%, 09/01/24 (e) | | | 9,890 | |
| | 4,000 | | | Hilton Grand Vacations Borrower LLC, 6.125%, 12/01/24 (e) | | | 4,220 | |
| | 10,000 | | | Jack Ohio Finance LLC, 6.750%, 11/15/21 (e) | | | 10,375 | |
| | 30,000 | | | Landry’s, Inc., 6.750%, 10/15/24 (e) | | | 31,200 | |
| | 81,000 | | | MGM Resorts International, 6.000%, 03/15/23 | | | 88,290 | |
| | 13,000 | | | NCL Corp. Ltd., 4.750%, 12/15/21 (e) | | | 13,276 | |
| | 7,000 | | | Sabre GLBL, Inc., 5.375%, 04/15/23 (e) | | | 7,123 | |
| | | | Scientific Games International, Inc., | | | | |
| | 55,000 | | | 7.000%, 01/01/22 (e) | | | 58,438 | |
| | 25,000 | | | 10.000%, 12/01/22 | | | 26,531 | |
| | 2,000 | | | Seminole Hard Rock Entertainment, Inc., 5.875%, 05/15/21 (e) | | | 2,050 | |
| | 40,000 | | | Six Flags Entertainment Corp., 4.875%, 07/31/24 (e) | | | 40,400 | |
| | 29,000 | | | Wynn Las Vegas LLC, 5.375%, 03/15/22 | | | 29,798 | |
| | 30,000 | | | Yum! Brands, Inc., 3.750%, 11/01/21 | | | 30,525 | |
| | | | | | | | |
| | | | | | | 627,419 | |
| | | | | | | | |
| | | | Household Durables — 0.1% | |
| | 9,000 | | | American Greetings Corp., 7.875%, 02/15/25 (e) | | | 9,439 | |
| | 25,000 | | | CalAtlantic Group, Inc., 5.875%, 11/15/24 | | | 26,812 | |
| | 10,000 | | | M/I Homes, Inc., 6.750%, 01/15/21 | | | 10,500 | |
| | | | Mattamy Group Corp., (Canada), | | | | |
| | 13,000 | | | 6.500%, 11/15/20 (e) | | | 13,357 | |
| | 3,000 | | | 6.875%, 12/15/23 (e) | | | 3,135 | |
| | | | Tempur Sealy International, Inc., | | | | |
| | 29,000 | | | 5.500%, 06/15/26 | | | 28,384 | |
| | 8,000 | | | 5.625%, 10/15/23 | | | 8,080 | |
| | 10,000 | | | Toll Brothers Finance Corp., 4.875%, 11/15/25 | | | 10,150 | |
| | | | | | | | |
| | | | | | | 109,857 | |
| | | | | | | | |
| | | | Internet & Direct Marketing Retail — 0.0% (g) | |
| | | | Netflix, Inc., | | | | |
| | 15,000 | | | 4.375%, 11/15/26 (e) | | | 14,869 | |
| | 10,000 | | | 5.875%, 02/15/25 | | | 10,850 | |
| | | | | | | | |
| | | | | | | 25,719 | |
| | | | | | | | |
SEE NOTES TO CONSOLIDATED FINANCIAL STATEMENTS.
| | | | | | |
| | | |
| 12 | | | | J.P. MORGAN FUNDS | | FEBRUARY 28, 2017 |
| | | | | | | | |
PRINCIPAL
AMOUNT($) | | | SECURITY DESCRIPTION | | VALUE($) | |
| | Corporate Bonds — continued | |
| | | | Media — 1.6% | |
| | 40,000 | | | AMC Networks, Inc., 4.750%, 12/15/22 | | | 40,400 | |
| | 46,000 | | | Cablevision Systems Corp., 8.000%, 04/15/20 | | | 50,830 | |
| | | | Charter Communications Operating LLC, | | | | |
| | 45,000 | | | 4.464%, 07/23/22 | | | 47,281 | |
| | 40,000 | | | 4.908%, 07/23/25 | | | 42,200 | |
| | 49,000 | | | Cinemark USA, Inc., 4.875%, 06/01/23 | | | 50,225 | |
| | | | Clear Channel Worldwide Holdings, Inc., | | | | |
| | 65,000 | | | Series B, 6.500%, 11/15/22 | | | 67,315 | |
| | 20,000 | | | Series B, 7.625%, 03/15/20 | | | 20,150 | |
| | 90,000 | | | Comcast Corp., 3.150%, 03/01/26 | | | 88,724 | |
| | | | CSC Holdings LLC, | | | | |
| | 30,000 | | | 6.750%, 11/15/21 | | | 33,000 | |
| | 30,000 | | | 8.625%, 02/15/19 | | | 33,169 | |
| | 20,000 | | | Discovery Communications LLC, 3.800%, 03/13/24 (w) | | | 19,962 | |
| | | | DISH DBS Corp., | | | | |
| | 5,000 | | | 5.875%, 07/15/22 | | | 5,359 | |
| | 2,000 | | | 5.875%, 11/15/24 | | | 2,135 | |
| | 107,000 | | | 6.750%, 06/01/21 | | | 117,433 | |
| | 7,000 | | | 7.750%, 07/01/26 | | | 8,225 | |
| | 20,000 | | | Gray Television, Inc., 5.875%, 07/15/26 (e) | | | 20,281 | |
| | 75,000 | | | iHeartCommunications, Inc., 9.000%, 12/15/19 | | | 65,540 | |
| | 30,000 | | | Live Nation Entertainment, Inc., 4.875%, 11/01/24 (e) | | | 30,000 | |
| | 15,000 | | | Mediacom Broadband LLC, 6.375%, 04/01/23 | | | 15,750 | |
| | 25,000 | | | Nexstar Broadcasting, Inc., 5.625%, 08/01/24 (e) | | | 25,562 | |
| | 55,000 | | | Nielsen Finance LLC, 5.000%, 04/15/22 (e) | | | 56,513 | |
| | 45,000 | | | Outfront Media Capital LLC, 5.875%, 03/15/25 | | | 47,306 | |
| | 5,000 | | | Quebecor Media, Inc., (Canada), 5.750%, 01/15/23 | | | 5,331 | |
| | 55,000 | | | Regal Entertainment Group, 5.750%, 03/15/22 | | | 57,544 | |
| | 25,000 | | | Sinclair Television Group, Inc., 5.625%, 08/01/24 (e) | | | 25,719 | |
| | | | Sirius XM Radio, Inc., | | | | |
| | 4,000 | | | 4.625%, 05/15/23 (e) | | | 4,090 | |
| | 50,000 | | | 5.375%, 04/15/25 (e) | | | 51,141 | |
| | 5,000 | | | 5.750%, 08/01/21 (e) | | | 5,209 | |
| | 40,000 | | | TEGNA, Inc., 6.375%, 10/15/23 | | | 42,600 | |
| | 20,000 | | | Time Warner, Inc., 2.950%, 07/15/26 | | | 18,565 | |
| | | | Univision Communications, Inc., | | | | |
| | 60,000 | | | 5.125%, 05/15/23 (e) | | | 60,000 | |
| | 5,000 | | | 5.125%, 02/15/25 (e) | | | 4,931 | |
| | 25,000 | | | Viacom, Inc., 2.250%, 02/04/22 | | | 23,888 | |
| | 60,000 | | | Videotron Ltd., (Canada), 5.000%, 07/15/22 | | | 63,150 | |
| | | | | | | | |
PRINCIPAL
AMOUNT($) | | | SECURITY DESCRIPTION | | VALUE($) | |
| | |
| | | | Media — continued | |
| | | | WMG Acquisition Corp., | | | | |
| | 5,000 | | | 4.875%, 11/01/24 (e) | | | 5,063 | |
| | 10,000 | | | 5.000%, 08/01/23 (e) | | | 10,225 | |
| | 23,000 | | | 5.625%, 04/15/22 (e) | | | 23,920 | |
| | | | | | | | |
| | | | | | | 1,288,736 | |
| | | | | | | | |
| | | | Multiline Retail — 0.1% | |
| | 35,000 | | | Dollar Tree, Inc., 5.750%, 03/01/23 | | | 37,012 | |
| | 20,000 | | | JC Penney Corp., Inc., 5.875%, 07/01/23 (e) | | | 20,038 | |
| | 10,000 | | | Neiman Marcus Group Ltd. LLC, 8.000%, 10/15/21 (e) | | | 6,275 | |
| | | | | | | | |
| | | | | | | 63,325 | |
| | | | | | | | |
| | | | Specialty Retail — 0.2% | |
| | 10,000 | | | Caleres, Inc., 6.250%, 08/15/23 | | | 10,475 | |
| | 58,000 | | | CST Brands, Inc., 5.000%, 05/01/23 | | | 60,175 | |
| | 25,000 | | | L Brands, Inc., 5.625%, 10/15/23 | | | 26,150 | |
| | 12,000 | | | Penske Automotive Group, Inc., 5.500%, 05/15/26 | | | 11,918 | |
| | 15,000 | | | PetSmart, Inc., 7.125%, 03/15/23 (e) | | | 14,719 | |
| | 35,000 | | | Sally Holdings LLC, 5.500%, 11/01/23 | | | 35,525 | |
| | | | | | | | |
| | | | | | | 158,962 | |
| | | | | | | | |
| | | | Textiles, Apparel & Luxury Goods — 0.0% (g) | |
| | 20,000 | | | Levi Strauss & Co., 5.000%, 05/01/25 | | | 20,425 | |
| | | | | | | | |
| | | | Total Consumer Discretionary | | | 2,774,207 | |
| | | | | | | | |
| | | | Consumer Staples — 1.7% | |
| | | | Beverages — 0.3% | |
| | 180,000 | | | Anheuser-Busch InBev Finance, Inc., (Belgium), 3.650%, 02/01/26 | | | 182,627 | |
| | 19,000 | | | Cott Beverages, Inc., (Canada), 5.375%, 07/01/22 | | | 19,475 | |
| | 45,000 | | | PepsiCo, Inc., 2.750%, 03/01/23 | | | 45,214 | |
| | | | | | | | |
| | | | | | | 247,316 | |
| | | | | | | | |
| | | | Food & Staples Retailing — 0.5% | |
| | | | Albertsons Cos. LLC, | | | | |
| | 10,000 | | | 5.750%, 03/15/25 (e) | | | 10,019 | |
| | 57,000 | | | 6.625%, 06/15/24 (e) | | | 60,277 | |
| | | | CVS Health Corp., | | | | |
| | 65,000 | | | 2.800%, 07/20/20 | | | 66,067 | |
| | 35,000 | | | 3.875%, 07/20/25 | | | 36,143 | |
| | 33,000 | | | Ingles Markets, Inc., 5.750%, 06/15/23 | | | 34,072 | |
| | 35,000 | | | Kroger Co. (The), 2.650%, 10/15/26 | | | 32,568 | |
| | 44,000 | | | New Albertsons, Inc., 8.000%, 05/01/31 | | | 43,670 | |
| | 35,000 | | | Rite Aid Corp., 6.125%, 04/01/23 (e) | | | 37,088 | |
| | | | SUPERVALU, Inc., | | | | |
| | 27,000 | | | 6.750%, 06/01/21 | | | 26,932 | |
| | 55,000 | | | 7.750%, 11/15/22 | | | 54,313 | |
| | 11,000 | | | US Foods, Inc., 5.875%, 06/15/24 (e) | | | 11,550 | |
| | | | | | | | |
| | | | | | | 412,699 | |
| | | | | | | | |
SEE NOTES TO CONSOLIDATED FINANCIAL STATEMENTS.
| | | | | | | | |
| | | |
| FEBRUARY 28, 2017 | | J.P. MORGAN FUNDS | | | | | 13 | |
JPMorgan Diversified Real Return Fund
CONSOLIDATED SCHEDULE OF PORTFOLIO INVESTMENTS
AS OF FEBRUARY 28, 2017 (Unaudited) (continued)
| | | | | | | | |
PRINCIPAL
AMOUNT($) | | | SECURITY DESCRIPTION | | VALUE($) | |
| | Corporate Bonds — continued | |
| | | | Food Products — 0.3% | |
| | 23,000 | | | Bumble Bee Holdings, Inc., 9.000%, 12/15/17 (e) | | | 22,914 | |
| | 18,000 | | | Dean Foods Co., 6.500%, 03/15/23 (e) | | | 18,765 | |
| | | | JBS USA LUX SA, (Brazil), | | | | |
| | 20,000 | | | 5.750%, 06/15/25 (e) | | | 20,600 | |
| | 31,000 | | | 5.875%, 07/15/24 (e) | | | 32,395 | |
| | 25,000 | | | 7.250%, 06/01/21 (e) | | | 25,750 | |
| | 90,000 | | | Kraft Heinz Foods Co., 3.000%, 06/01/26 | | | 84,979 | |
| | 11,000 | | | Pilgrim’s Pride Corp., 5.750%, 03/15/25 (e) | | | 11,302 | |
| | | | Post Holdings, Inc., | | | | |
| | 12,000 | | | 5.000%, 08/15/26 (e) | | | 11,557 | |
| | 12,000 | | | 5.500%, 03/01/25 (e) | | | 12,240 | |
| | 11,000 | | | 5.750%, 03/01/27 (e) | | | 11,131 | |
| | | | | | | | |
| | | | | | | 251,633 | |
| | | | | | | | |
| | | | Household Products — 0.1% | |
| | 12,000 | | | Kronos Acquisition Holdings, Inc., (Canada), 9.000%, 08/15/23 (e) | | | 12,255 | |
| | 25,000 | | | Spectrum Brands, Inc., 5.750%, 07/15/25 | | | 26,615 | |
| | | | | | | | |
| | | | | | | 38,870 | |
| | | | | | | | |
| | | | Personal Products — 0.1% | |
| | 39,000 | | | Nature’s Bounty Co. (The), 7.625%, 05/15/21 (e) | | | 41,194 | |
| | | | Revlon Consumer Products Corp., | | | | |
| | 27,000 | | | 5.750%, 02/15/21 | | | 27,202 | |
| | 15,000 | | | 6.250%, 08/01/24 | | | 15,413 | |
| | | | | | | | |
| | | | | | | 83,809 | |
| | | | | | | | |
| | | | Tobacco — 0.4% | |
| | 130,000 | | | Altria Group, Inc., 2.850%, 08/09/22 | | | 130,021 | |
| | 12,000 | | | BAT International Finance plc, (United Kingdom), 3.950%, 06/15/25 (e) | | | 12,324 | |
| | 120,000 | | | Philip Morris International, Inc., 2.125%, 05/10/23 | | | 114,538 | |
| | 90,000 | | | Reynolds American, Inc., 4.450%, 06/12/25 | | | 95,154 | |
| | | | | | | | |
| | | | | | | 352,037 | |
| | | | | | | | |
| | | | Total Consumer Staples | | | 1,386,364 | |
| | | | | | | | |
| | | | Energy — 2.9% | |
| | | | Energy Equipment & Services — 0.5% | |
| | 4,000 | | | Ensco plc, 5.200%, 03/15/25 | | | 3,540 | |
| | 18,000 | | | Nabors Industries, Inc., 5.500%, 01/15/23 (e) | | | 18,574 | |
| | | | Noble Holding International Ltd., (United Kingdom), | | | | |
| | 4,000 | | | 6.200%, 08/01/40 | | | 3,140 | |
| | 4,000 | | | 7.750%, 01/15/24 | | | 3,890 | |
| | 22,000 | | | Parker Drilling Co., 6.750%, 07/15/22 | | | 20,350 | |
| | 13,000 | | | Rowan Cos., Inc., 7.375%, 06/15/25 | | | 13,487 | |
| | 24,000 | | | SESI LLC, 7.125%, 12/15/21 | | | 24,660 | |
| | | | | | | | |
PRINCIPAL
AMOUNT($) | | | SECURITY DESCRIPTION | | VALUE($) | |
| | | | | | | | |
| | | | Energy Equipment & Services — continued | |
| | 10,000 | | | Summit Midstream Holdings LLC, 5.500%, 08/15/22 | | | 10,125 | |
| | 73,000 | | | Transocean Proteus Ltd., 6.250%, 12/01/24 (e) | | | 75,281 | |
| | | | Transocean, Inc., | | | | |
| | 7,000 | | | 5.550%, 10/15/22 | | | 6,506 | |
| | 84,000 | | | 6.800%, 03/15/38 | | | 67,620 | |
| | 2,000 | | | 7.500%, 04/15/31 | | | 1,795 | |
| | 53,000 | | | 9.000%, 07/15/23 (e) | | | 57,240 | |
| | 7,000 | | | 9.100%, 12/15/41 | | | 6,912 | |
| | 18,000 | | | Trinidad Drilling Ltd., (Canada), 6.625%, 02/15/25 (e) | | | 18,540 | |
| | 1,000 | | | Weatherford International LLC, 6.800%, 06/15/37 | | | 943 | |
| | | | Weatherford International Ltd., | | | | |
| | 4,000 | | | 5.950%, 04/15/42 | | | 3,350 | |
| | 8,000 | | | 6.500%, 08/01/36 | | | 7,380 | |
| | 2,000 | | | 6.750%, 09/15/40 | | | 1,820 | |
| | 3,000 | | | 7.000%, 03/15/38 | | | 2,828 | |
| | 12,000 | | | 7.750%, 06/15/21 | | | 12,945 | |
| | 67,000 | | | 9.875%, 02/15/24 (e) | | | 77,385 | |
| | 5,000 | | | Western Refining Logistics LP, 7.500%, 02/15/23 | | | 5,425 | |
| | | | | | | | |
| | | | | | | 443,736 | |
| | | | | | | | |
| | | | Oil, Gas & Consumable Fuels — 2.4% | |
| | | | Antero Resources Corp., | | | | |
| | 6,000 | | | 5.000%, 03/01/25 (e) | | | 5,820 | |
| | 55,000 | | | 5.125%, 12/01/22 | | | 55,275 | |
| | 24,000 | | | 5.375%, 11/01/21 | | | 24,540 | |
| | 5,000 | | | Blue Racer Midstream LLC, 6.125%, 11/15/22 (e) | | | 5,087 | |
| | 10,000 | | | Boardwalk Pipelines LP, 4.450%, 07/15/27 | | | 10,252 | |
| | | | BP Capital Markets plc, (United Kingdom), | | | | |
| | 160,000 | | | 1.375%, 05/10/18 | | | 159,685 | |
| | 35,000 | | | 3.017%, 01/16/27 | | | 33,750 | |
| | 25,000 | | | 3.216%, 11/28/23 | | | 25,101 | |
| | 30,000 | | | 3.588%, 04/14/27 | | | 30,220 | |
| | 15,000 | | | Buckeye Partners LP, 3.950%, 12/01/26 | | | 14,896 | |
| | 98,000 | | | California Resources Corp., 8.000%, 12/15/22 (e) | | | 83,300 | |
| | 30,000 | | | Canadian Natural Resources Ltd., (Canada), 3.800%, 04/15/24 | | | 30,282 | |
| | | | Cenovus Energy, Inc., (Canada), | | | | |
| | 11,000 | | | 3.000%, 08/15/22 | | | 10,759 | |
| | 20,000 | | | 6.750%, 11/15/39 | | | 22,606 | |
| | 2,000 | | | Cheniere Corpus Christi Holdings LLC, 5.875%, 03/31/25 (e) | | | 2,118 | |
| | | | Chesapeake Energy Corp., | | | | |
| | 15,000 | | | 4.875%, 04/15/22 | | | 13,440 | |
| | 3,000 | | | 5.750%, 03/15/23 | | | 2,737 | |
SEE NOTES TO CONSOLIDATED FINANCIAL STATEMENTS.
| | | | | | |
| | | |
| 14 | | | | J.P. MORGAN FUNDS | | FEBRUARY 28, 2017 |
| | | | | | | | |
PRINCIPAL
AMOUNT($) | | | SECURITY DESCRIPTION | | VALUE($) | |
| | Corporate Bonds — continued | |
| | | | Oil, Gas & Consumable Fuels — continued | |
| | 2,000 | | | 6.125%, 02/15/21 | | | 1,935 | |
| | 4,000 | | | 8.000%, 01/15/25 (e) | | | 3,975 | |
| | | | Chevron Corp., | | | | |
| | 75,000 | | | 1.961%, 03/03/20 | | | 75,040 | |
| | 25,000 | | | 2.498%, 03/03/22 | | | 25,000 | |
| | 30,000 | | | 2.895%, 03/03/24 | | | 30,000 | |
| | 44,000 | | | CITGO Petroleum Corp., 6.250%, 08/15/22 (e) | | | 45,320 | |
| | 5,000 | | | Columbia Pipeline Group, Inc., 4.500%, 06/01/25 | | | 5,307 | |
| | | | Continental Resources, Inc., | | | | |
| | 2,000 | | | 3.800%, 06/01/24 | | | 1,853 | |
| | 3,000 | | | 4.500%, 04/15/23 | | | 2,938 | |
| | 119,000 | | | 5.000%, 09/15/22 | | | 121,380 | |
| | 10,000 | | | Crestwood Midstream Partners LP, 6.250%, 04/01/23 | | | 10,375 | |
| | | | DCP Midstream Operating LP, | | | | |
| | 24,000 | | | 3.875%, 03/15/23 | | | 23,160 | |
| | 10,000 | | | 4.750%, 09/30/21 (e) | | | 10,325 | |
| | 15,000 | | | 6.750%, 09/15/37 (e) | | | 15,900 | |
| | 5,000 | | | Diamondback Energy, Inc., 4.750%, 11/01/24 (e) | | | 5,012 | |
| | 38,000 | | | Energy Transfer Equity LP, 5.875%, 01/15/24 | | | 40,850 | |
| | 55,000 | | | Enterprise Products Operating LLC, 3.950%, 02/15/27 | | | 56,661 | |
| | | | EP Energy LLC, | | | | |
| | 51,000 | | | 8.000%, 02/15/25 (e) | | | 49,725 | |
| | 79,000 | | | 9.375%, 05/01/20 | | | 77,222 | |
| | 15,000 | | | Genesis Energy LP, 5.625%, 06/15/24 | | | 14,963 | |
| | 35,000 | | | Hess Corp., 4.300%, 04/01/27 | | | 35,006 | |
| | | | Hilcorp Energy I LP, | | | | |
| | 41,000 | | | 5.000%, 12/01/24 (e) | | | 39,258 | |
| | 20,000 | | | 5.750%, 10/01/25 (e) | | | 19,850 | |
| | 5,000 | | | Martin Midstream Partners LP, 7.250%, 02/15/21 | | | 5,081 | |
| | | | MEG Energy Corp., (Canada), | | | | |
| | 6,000 | | | 6.375%, 01/30/23 (e) | | | 5,325 | |
| | 28,000 | | | 6.500%, 03/15/21 (e) | | | 28,630 | |
| | 25,000 | | | 6.500%, 01/15/25 (e) | | | 24,438 | |
| | | | MPLX LP, | | | | |
| | 15,000 | | | 4.125%, 03/01/27 | | | 15,097 | |
| | 25,000 | | | 4.875%, 12/01/24 | | | 26,689 | |
| | 14,000 | | | NGL Energy Partners LP, 6.125%, 03/01/25 (e) | | | 13,965 | |
| | 5,000 | | | NGPL PipeCo LLC, 9.625%, 06/01/19 (e) | | | 5,200 | |
| | | | NuStar Logistics LP, | | | | |
| | 3,000 | | | 4.800%, 09/01/20 | | | 3,090 | |
| | 7,000 | | | 6.750%, 02/01/21 | | | 7,630 | |
| | | | | | | | |
PRINCIPAL
AMOUNT($) | | | SECURITY DESCRIPTION | | VALUE($) | |
| | | | | | | | |
| | | | Oil, Gas & Consumable Fuels — continued | |
| | | | Oasis Petroleum, Inc., | | | | |
| | 13,000 | | | 6.500%, 11/01/21 | | | 13,228 | |
| | 4,000 | | | 6.875%, 03/15/22 | | | 4,080 | |
| | 16,000 | | | 6.875%, 01/15/23 | | | 16,220 | |
| | 40,000 | | | ONEOK Partners LP, 4.900%, 03/15/25 | | | 42,825 | |
| | | | ONEOK, Inc., | | | | |
| | 13,000 | | | 4.250%, 02/01/22 | | | 13,390 | |
| | 2,000 | | | 7.500%, 09/01/23 | | | 2,383 | |
| | 40,000 | | | Phillips 66 Partners LP, 3.550%, 10/01/26 | | | 38,825 | |
| | | | QEP Resources, Inc., | | | | |
| | 4,000 | | | 5.250%, 05/01/23 | | | 3,940 | |
| | 12,000 | | | 5.375%, 10/01/22 | | | 12,060 | |
| | 7,000 | | | 6.875%, 03/01/21 | | | 7,403 | |
| | | | Range Resources Corp., | | | | |
| | 12,000 | | | 4.875%, 05/15/25 | | | 11,370 | |
| | 3,000 | | | 5.000%, 03/15/23 (e) | | | 2,906 | |
| | 8,000 | | | Rice Energy, Inc., 7.250%, 05/01/23 | | | 8,400 | |
| | 2,000 | | | Rockies Express Pipeline LLC, 5.625%, 04/15/20 (e) | | | 2,110 | |
| | | | RSP Permian, Inc., | | | | |
| | 5,000 | | | 5.250%, 01/15/25 (e) | | | 5,125 | |
| | 26,000 | | | 6.625%, 10/01/22 | | | 27,495 | |
| | | | SM Energy Co., | | | | |
| | 5,000 | | | 5.000%, 01/15/24 | | | 4,688 | |
| | 9,000 | | | 6.500%, 11/15/21 | | | 9,202 | |
| | 10,000 | | | 6.500%, 01/01/23 | | | 10,025 | |
| | 60,000 | | | Sunoco Logistics Partners Operations LP, 4.250%, 04/01/24 | | | 61,211 | |
| | 20,000 | | | Sunoco LP, 6.375%, 04/01/23 | | | 20,250 | |
| | 10,000 | | | Tallgrass Energy Partners LP, 5.500%, 09/15/24 (e) | | | 10,100 | |
| | | | Targa Resources Partners LP, | | | | |
| | 11,000 | | | 4.250%, 11/15/23 | | | 10,917 | |
| | 15,000 | | | 5.125%, 02/01/25 (e) | | | 15,600 | |
| | 5,000 | | | 5.375%, 02/01/27 (e) | | | 5,238 | |
| | 8,000 | | | Tesoro Corp., 4.750%, 12/15/23 (e) | | | 8,280 | |
| | | | Tesoro Logistics LP, | | | | |
| | 10,000 | | | 5.250%, 01/15/25 | | | 10,538 | |
| | 25,000 | | | 6.375%, 05/01/24 | | | 27,177 | |
| | 15,000 | | | Transcanada Trust, (Canada), VAR, 5.300%, 03/15/77 | | | 15,150 | |
| | 4,000 | | | Western Refining, Inc., 6.250%, 04/01/21 | | | 4,135 | |
| | 31,000 | | | Whiting Petroleum Corp., 5.000%, 03/15/19 | | | 31,271 | |
SEE NOTES TO CONSOLIDATED FINANCIAL STATEMENTS.
| | | | | | | | |
| | | |
| FEBRUARY 28, 2017 | | J.P. MORGAN FUNDS | | | | | 15 | |
JPMorgan Diversified Real Return Fund
CONSOLIDATED SCHEDULE OF PORTFOLIO INVESTMENTS
AS OF FEBRUARY 28, 2017 (Unaudited) (continued)
| | | | | | | | |
PRINCIPAL
AMOUNT($) | | | SECURITY DESCRIPTION | | VALUE($) | |
| | Corporate Bonds — continued | |
| | | | Oil, Gas & Consumable Fuels — continued | |
| | | | Williams Cos., Inc. (The), | | | | |
| | 118,000 | | | 4.550%, 06/24/24 | | | 119,770 | |
| | 5,000 | | | 5.750%, 06/24/44 | | | 5,050 | |
| | 7,000 | | | WPX Energy, Inc., 6.000%, 01/15/22 | | | 7,166 | |
| | | | | | | | |
| | | | | | | 1,963,596 | |
| | | | | | | | |
| | | | Total Energy | | | 2,407,332 | |
| | | | | | | | |
| | | | Financials — 8.3% | |
| | | | Banks — 4.0% | |
| | | | Bank of America Corp., | | | | |
| | 50,000 | | | 2.000%, 01/11/18 | | | 50,231 | |
| | 60,000 | | | 2.503%, 10/21/22 | | | 58,328 | |
| | 185,000 | | | 3.875%, 08/01/25 | | | 189,080 | |
| | 65,000 | | | Series L, 3.950%, 04/21/25 | | | 65,235 | |
| | 25,000 | | | VAR, 3.124%, 01/20/23 | | | 25,051 | |
| | 175,000 | | | Bank of Montreal, (Canada), 2.375%, 01/25/19 | | | 176,890 | |
| | | | Bank of Nova Scotia (The), (Canada), | | | | |
| | 100,000 | | | 1.650%, 06/14/19 | | | 99,430 | |
| | 90,000 | | | 2.450%, 03/22/21 | | | 90,005 | |
| | 200,000 | | | Barclays plc, (United Kingdom), 2.000%, 03/16/18 | | | 199,993 | |
| | 250,000 | | | Capital One NA, 1.650%, 02/05/18 | | | 250,157 | |
| | | | CIT Group, Inc., | | | | |
| | 40,000 | | | 5.000%, 08/15/22 | | | 42,400 | |
| | 42,000 | | | 5.375%, 05/15/20 | | | 44,940 | |
| | | | Citigroup, Inc., | | | | |
| | 100,000 | | | 1.750%, 05/01/18 | | | 100,022 | |
| | 95,000 | | | 1.800%, 02/05/18 | | | 95,271 | |
| | 65,000 | | | 2.900%, 12/08/21 | | | 65,223 | |
| | 90,000 | | | 3.700%, 01/12/26 | | | 90,291 | |
| | 45,000 | | | 4.600%, 03/09/26 | | | 46,740 | |
| | 50,000 | | | VAR, 3.887%, 01/10/28 | | | 50,478 | |
| | 20,000 | | | Series T, VAR, 6.250%, 08/15/26 (x) (y) | | | 21,771 | |
| | 250,000 | | | Discover Bank, 2.000%, 02/21/18 | | | 250,730 | |
| | 200,000 | | | HSBC Bank plc, (United Kingdom), 1.500%, 05/15/18 (e) | | | 199,367 | |
| | 250,000 | | | PNC Bank NA, 2.200%, 01/28/19 | | | 252,172 | |
| | 147,000 | | | Royal Bank of Scotland Group plc, (United Kingdom), 6.125%, 12/15/22 | | | 156,274 | |
| | | | Toronto-Dominion Bank (The), (Canada), | | | | |
| | 110,000 | | | 2.125%, 04/07/21 | | | 108,820 | |
| | 60,000 | | | 2.500%, 12/14/20 | | | 60,398 | |
| | | | Wells Fargo & Co., | | | | |
| | 115,000 | | | 2.500%, 03/04/21 | | | 115,120 | |
| | 55,000 | | | 3.000%, 10/23/26 | | | 52,839 | |
| | 250,000 | | | Wells Fargo Bank NA, 2.150%, 12/06/19 | | | 251,340 | |
| | | | | | | | |
PRINCIPAL
AMOUNT($) | | | SECURITY DESCRIPTION | | VALUE($) | |
| | |
| | | | Banks — continued | |
| | | | Westpac Banking Corp., (Australia), | | | | |
| | 55,000 | | | 2.150%, 03/06/20 | | | 54,946 | |
| | 65,000 | | | 2.600%, 11/23/20 | | | 65,391 | |
| | 15,000 | | | VAR, 4.322%, 11/23/31 | | | 15,142 | |
| | | | | | | | |
| | | | | | | 3,344,075 | |
| | | | | | | | |
| | | | Capital Markets — 1.9% | |
| | 120,000 | | | Bank of New York Mellon Corp. (The), Series G, 2.150%, 02/24/20 | | | 120,564 | |
| | 250,000 | | | Credit Suisse AG, (Switzerland), 1.750%, 01/29/18 | | | 250,373 | |
| | | | Goldman Sachs Group, Inc. (The), | | | | |
| | 55,000 | | | 2.350%, 11/15/21 | | | 53,833 | |
| | 200,000 | | | 2.375%, 01/22/18 | | | 201,493 | |
| | 35,000 | | | 3.500%, 11/16/26 | | | 34,373 | |
| | 150,000 | | | 3.750%, 05/22/25 | | | 152,169 | |
| | | | Morgan Stanley, | | | | |
| | 105,000 | | | 2.500%, 01/24/19 | | | 105,983 | |
| | 120,000 | | | 2.625%, 11/17/21 | | | 119,032 | |
| | 202,000 | | | 2.650%, 01/27/20 | | | 204,232 | |
| | 50,000 | | | 3.875%, 01/27/26 | | | 51,009 | |
| | 45,000 | | | 4.350%, 09/08/26 | | | 46,304 | |
| | 250,000 | | | UBS AG, (Switzerland), 1.800%, 03/26/18 | | | 250,463 | |
| | | | | | | | |
| | | | | | | 1,589,828 | |
| | | | | | | | |
| | | | Consumer Finance — 1.1% | |
| | | | Ally Financial, Inc., | | | | |
| | 83,000 | | | 4.125%, 03/30/20 | | | 85,801 | |
| | 95,000 | | | 4.625%, 05/19/22 | | | 98,800 | |
| | 24,000 | | | 8.000%, 11/01/31 | | | 29,520 | |
| | 200,000 | | | Ford Motor Credit Co. LLC, 3.200%, 01/15/21 | | | 203,271 | |
| | | | General Motors Financial Co., Inc., | | | | |
| | 185,000 | | | 2.400%, 04/10/18 | | | 186,186 | |
| | 100,000 | | | 3.700%, 05/09/23 | | | 100,901 | |
| | 10,000 | | | 4.350%, 01/17/27 | | | 10,180 | |
| | 100,000 | | | HSBC USA, Inc., 2.750%, 08/07/20 | | | 101,025 | |
| | 40,000 | | | John Deere Capital Corp., 2.650%, 01/06/22 | | | 40,291 | |
| | 56,000 | | | Navient Corp., 8.450%, 06/15/18 | | | 59,850 | |
| | | | | | | | |
| | | | | | | 915,825 | |
| | | | | | | | |
| | | | Diversified Financial Services — 0.6% | |
| | 35,000 | | | ACE Cash Express, Inc., 11.000%, 02/01/19 (e) | | | 32,987 | |
| | 40,000 | | | Berkshire Hathaway, Inc., 3.125%, 03/15/26 | | | 40,186 | |
| | 15,000 | | | CNG Holdings, Inc., 9.375%, 05/15/20 (e) | | | 13,537 | |
| | 200,000 | | | GE Capital International Funding Co. Unlimited Co., 2.342%, 11/15/20 | | | 201,612 | |
| | 35,000 | | | National Rural Utilities Cooperative Finance Corp., 2.950%, 02/07/24 | | | 35,188 | |
SEE NOTES TO CONSOLIDATED FINANCIAL STATEMENTS.
| | | | | | |
| | | |
| 16 | | | | J.P. MORGAN FUNDS | | FEBRUARY 28, 2017 |
| | | | | | | | |
PRINCIPAL
AMOUNT($) | | | SECURITY DESCRIPTION | | VALUE($) | |
| | Corporate Bonds — continued | |
| | | | Diversified Financial Services — continued | |
| | 35,000 | | | Nationstar Mortgage LLC, 7.875%, 10/01/20 | | | 36,488 | |
| | | | Shell International Finance BV, (Netherlands), | | | | |
| | 30,000 | | | 2.875%, 05/10/26 | | | 29,183 | |
| | 75,000 | | | 3.250%, 05/11/25 | | | 75,657 | |
| | 10,000 | | | Speedy Cash Intermediate Holdings Corp., 10.750%, 05/15/18 (e) | | | 10,300 | |
| | | | | | | | |
| | | | | | | 475,138 | |
| | | | | | | | |
| | | | Insurance — 0.6% | |
| | | | American International Group, Inc., | | | | |
| | 55,000 | | | 3.300%, 03/01/21 | | | 56,369 | |
| | 80,000 | | | 3.900%, 04/01/26 | | | 81,004 | |
| | 121,000 | | | CNO Financial Group, Inc., 5.250%, 05/30/25 | | | 124,630 | |
| | 10,000 | | | Liberty Mutual Group, Inc., 7.800%, 03/15/37 (e) | | | 11,550 | |
| | 30,000 | | | Manulife Financial Corp., (Canada), VAR, 4.061%, 02/24/32 | | | 30,115 | |
| | 150,000 | | | Metropolitan Life Global Funding I, 2.500%, 12/03/20 (e) | | | 150,472 | |
| | 20,000 | | | NFP Corp., 9.000%, 07/15/21 (e) | | | 21,146 | |
| | 80,000 | | | Prudential Financial, Inc., 3.500%, 05/15/24 | | | 82,238 | |
| | | | | | | | |
| | | | | | | 557,524 | |
| | | | | | | | |
| | | | Thrifts & Mortgage Finance — 0.1% | |
| | 30,000 | | | Quicken Loans, Inc., 5.750%, 05/01/25 (e) | | | 29,550 | |
| | 25,000 | | | Radian Group, Inc., 7.000%, 03/15/21 | | | 27,875 | |
| | | | | | | | |
| | | | | | | 57,425 | |
| | | | | | | | |
| | | | Total Financials | | | 6,939,815 | |
| | | | | | | | |
| | | | Health Care — 2.3% | |
| | | | Biotechnology — 0.3% | |
| | 70,000 | | | AbbVie, Inc., 3.200%, 05/14/26 | | | 67,358 | |
| | | | Amgen, Inc., | | | | |
| | 55,000 | | | 1.850%, 08/19/21 | | | 53,168 | |
| | 25,000 | | | 2.600%, 08/19/26 | | | 23,205 | |
| | 35,000 | | | Celgene Corp., 3.875%, 08/15/25 | | | 35,783 | |
| | 55,000 | | | Gilead Sciences, Inc., 2.950%, 03/01/27 | | | 52,645 | |
| | | | | | | | |
| | | | | | | 232,159 | |
| | | | | | | | |
| | | | Health Care Equipment & Supplies — 0.2% | |
| | | | Abbott Laboratories, | | | | |
| | 20,000 | | | 2.900%, 11/30/21 | | | 20,036 | |
| | 20,000 | | | 3.750%, 11/30/26 | | | 19,990 | |
| | 15,000 | | | Hologic, Inc., 5.250%, 07/15/22 (e) | | | 15,637 | |
| | 52,000 | | | Mallinckrodt International Finance SA, 5.625%, 10/15/23 (e) | | | 49,920 | |
| | | | Teleflex, Inc., | | | | |
| | 11,000 | | | 4.875%, 06/01/26 | | | 11,083 | |
| | 20,000 | | | 5.250%, 06/15/24 | | | 20,650 | |
| | | | | | | | |
| | | | | | | 137,316 | |
| | | | | | | | |
| | | | | | | | |
PRINCIPAL
AMOUNT($) | | | SECURITY DESCRIPTION | | VALUE($) | |
| | | | | | | | |
| | | | Health Care Providers & Services — 1.0% | |
| | | | Acadia Healthcare Co., Inc., | | | | |
| | 19,000 | | | 5.625%, 02/15/23 | | | 19,760 | |
| | 20,000 | | | 6.500%, 03/01/24 | | | 21,250 | |
| | 15,000 | | | AMN Healthcare, Inc., 5.125%, 10/01/24 (e) | | | 15,262 | |
| | 55,000 | | | Anthem, Inc., 3.500%, 08/15/24 | | | 55,305 | |
| | | | Centene Corp., | | | | |
| | 10,000 | | | 4.750%, 01/15/25 | | | 10,287 | |
| | 29,000 | | | 6.125%, 02/15/24 | | | 31,465 | |
| | | | Community Health Systems, Inc., | | | | |
| | 7,000 | | | 5.125%, 08/01/21 | | | 6,877 | |
| | 6,000 | | | 7.125%, 07/15/20 | | | 5,640 | |
| | 44,000 | | | DaVita, Inc., 5.125%, 07/15/24 | | | 44,907 | |
| | | | Envision Healthcare Corp., | | | | |
| | 15,000 | | | 5.125%, 07/01/22 (e) | | | 15,356 | |
| | 18,000 | | | 5.625%, 07/15/22 | | | 18,743 | |
| | 45,000 | | | Express Scripts Holding Co., 3.400%, 03/01/27 | | | 42,701 | |
| | 29,000 | | | Fresenius Medical Care US Finance II, Inc., (Germany), 5.875%, 01/31/22 (e) | | | 31,647 | |
| | | | HCA, Inc., | | | | |
| | 48,000 | | | 5.000%, 03/15/24 | | | 50,580 | |
| | 120,000 | | | Series 1, 5.875%, 05/01/23 | | | 130,500 | |
| | 50,000 | | | 7.500%, 02/15/22 | | | 57,688 | |
| | 37,000 | | | IASIS Healthcare LLC, 8.375%, 05/15/19 | | | 36,168 | |
| | 11,000 | | | LifePoint Health, Inc., 5.375%, 05/01/24 (e) | | | 11,083 | |
| | 41,000 | | | MPH Acquisition Holdings LLC, 7.125%, 06/01/24 (e) | | | 44,178 | |
| | 36,000 | | | Team Health Holdings, Inc., 6.375%, 02/01/25 (e) | | | 35,730 | |
| | | | Tenet Healthcare Corp., | | | | |
| | 31,000 | | | 4.375%, 10/01/21 | | | 31,232 | |
| | 30,000 | | | 4.500%, 04/01/21 | | | 30,375 | |
| | 19,000 | | | 5.000%, 03/01/19 | | | 19,013 | |
| | 15,000 | | | 6.750%, 06/15/23 | | | 14,869 | |
| | 5,000 | | | 7.500%, 01/01/22 (e) | | | 5,413 | |
| | 11,000 | | | 8.125%, 04/01/22 | | | 11,550 | |
| | 55,000 | | | UnitedHealth Group, Inc., 3.100%, 03/15/26 | | | 54,894 | |
| | | | | | | | |
| | | | | | | 852,473 | |
| | | | | | | | |
| | | | Health Care Technology — 0.0% (g) | |
| | 35,000 | | | Quintiles IMS, Inc., 4.875%, 05/15/23 (e) | | | 36,006 | |
| | | | | | | | |
| | | | Life Sciences Tools & Services — 0.0% (g) | |
| | 40,000 | | | Thermo Fisher Scientific, Inc., 2.950%, 09/19/26 | | | 38,377 | |
| | | | | | | | |
| | | | Pharmaceuticals — 0.8% | |
| | | | Actavis Funding SCS, | | | | |
| | 100,000 | | | 2.350%, 03/12/18 | | | 100,711 | |
| | 75,000 | | | 3.800%, 03/15/25 | | | 75,776 | |
SEE NOTES TO CONSOLIDATED FINANCIAL STATEMENTS.
| | | | | | | | |
| | | |
| FEBRUARY 28, 2017 | | J.P. MORGAN FUNDS | | | | | 17 | |
JPMorgan Diversified Real Return Fund
CONSOLIDATED SCHEDULE OF PORTFOLIO INVESTMENTS
AS OF FEBRUARY 28, 2017 (Unaudited) (continued)
| | | | | | | | |
PRINCIPAL
AMOUNT($) | | | SECURITY DESCRIPTION | | VALUE($) | |
| | Corporate Bonds — continued | |
| | | | Pharmaceuticals — continued | |
| | 30,000 | | | Bristol-Myers Squibb Co., 3.250%, 02/27/27 | | | 30,027 | |
| | | | Concordia International Corp., (Canada), | | | | |
| | 39,000 | | | 7.000%, 04/15/23 (e) | | | 15,210 | |
| | 13,000 | | | 9.000%, 04/01/22 (e) | | | 11,440 | |
| | 56,000 | | | Endo Finance LLC, 5.750%, 01/15/22 (e) | | | 51,940 | |
| | 50,000 | | | Merck & Co., Inc., 2.350%, 02/10/22 | | | 49,982 | |
| | 39,000 | | | Mylan NV, 3.950%, 06/15/26 | | | 38,090 | |
| | 35,000 | | | Shire Acquisitions Investments Ireland DAC, 3.200%, 09/23/26 | | | 33,365 | |
| | 20,000 | | | Teva Pharmaceutical Finance Co. BV, (Israel), Series 2, 3.650%, 11/10/21 | | | 20,275 | |
| | 70,000 | | | Teva Pharmaceutical Finance Netherlands III BV, (Israel), 3.150%, 10/01/26 | | | 64,449 | |
| | | | Valeant Pharmaceuticals International, Inc., | | | | |
| | 50,000 | | | 5.875%, 05/15/23 (e) | | | 40,219 | |
| | 44,000 | | | 6.375%, 10/15/20 (e) | | | 40,040 | |
| | 25,000 | | | 6.750%, 08/15/18 (e) | | | 24,625 | |
| | 30,000 | | | 7.000%, 10/01/20 (e) | | | 27,975 | |
| | 21,000 | | | 7.250%, 07/15/22 (e) | | | 18,900 | |
| | | | | | | | |
| | | | | | | 643,024 | |
| | | | | | | | |
| | | | Total Health Care | | | 1,939,355 | |
| | | | | | | | |
| | | | Industrials — 2.3% | |
| | | | Aerospace & Defense — 0.6% | |
| | | | Arconic, Inc., | | | | |
| | 44,000 | | | 5.125%, 10/01/24 | | | 45,430 | |
| | 59,000 | | | 5.900%, 02/01/27 | | | 63,204 | |
| | | | Bombardier, Inc., (Canada), | | | | |
| | 16,000 | | | 6.000%, 10/15/22 (e) | | | 16,000 | |
| | 23,000 | | | 6.125%, 01/15/23 (e) | | | 23,000 | |
| | 6,000 | | | 7.500%, 03/15/25 (e) | | | 6,217 | |
| | 20,000 | | | 8.750%, 12/01/21 (e) | | | 22,150 | |
| | 10,000 | | | L3 Technologies, Inc., 3.850%, 12/15/26 | | | 10,167 | |
| | | | Lockheed Martin Corp., | | | | |
| | 50,000 | | | 2.900%, 03/01/25 | | | 49,121 | |
| | 35,000 | | | 3.550%, 01/15/26 | | | 35,785 | |
| | 50,000 | | | Northrop Grumman Corp., 3.200%, 02/01/27 | | | 49,746 | |
| | 8,000 | | | Orbital ATK, Inc., 5.500%, 10/01/23 | | | 8,320 | |
| | | | TransDigm, Inc., | | | | |
| | 30,000 | | | 6.000%, 07/15/22 | | | 30,862 | |
| | 31,000 | | | 6.375%, 06/15/26 (e) | | | 31,310 | |
| | 8,000 | | | 6.500%, 07/15/24 | | | 8,260 | |
| | 10,000 | | | 6.500%, 05/15/25 (e) | | | 10,238 | |
| | 50,000 | | | United Technologies Corp., 1.950%, 11/01/21 | | | 49,133 | |
| | | | | | | | |
| | | | | | | 458,943 | |
| | | | | | | | |
| | | | | | | | |
PRINCIPAL
AMOUNT($) | | | SECURITY DESCRIPTION | | VALUE($) | |
| | | | | | | | |
| | | | Air Freight & Logistics — 0.0% (g) | |
| | 20,000 | | | XPO Logistics, Inc., 6.125%, 09/01/23 (e) | | | 21,000 | |
| | | | | | | | |
| | | | Airlines — 0.1% | |
| | 25,000 | | | American Airlines Group, Inc., 5.500%, 10/01/19 (e) | | | 25,937 | |
| | 15,000 | | | United Continental Holdings, Inc., 5.000%, 02/01/24 | | | 14,944 | |
| | | | | | | | |
| | | | | | | 40,881 | |
| | | | | | | | |
| | | | Building Products — 0.1% | |
| | 9,000 | | | Airxcel, Inc., 8.500%, 02/15/22 (e) | | | 9,270 | |
| | 10,000 | | | Masonite International Corp., 5.625%, 03/15/23 (e) | | | 10,325 | |
| | 12,000 | | | NCI Building Systems, Inc., 8.250%, 01/15/23 (e) | | | 13,050 | |
| | | | Standard Industries, Inc., | | | | |
| | 15,000 | | | 5.000%, 02/15/27 (e) | | | 15,300 | |
| | 44,000 | | | 6.000%, 10/15/25 (e) | | | 46,750 | |
| | 13,000 | | | Unifrax I LLC, 7.500%, 02/15/19 (e) | | | 12,967 | |
| | | | | | | | |
| | | | | | | 107,662 | |
| | | | | | | | |
| | | | Commercial Services & Supplies — 0.3% | |
| | 6,000 | | | ACCO Brands Corp., 5.250%, 12/15/24 (e) | | | 6,075 | |
| | 59,000 | | | ADT Corp. (The), 4.125%, 06/15/23 | | | 56,787 | |
| | 15,000 | | | Covanta Holding Corp., 6.375%, 10/01/22 | | | 15,469 | |
| | 20,000 | | | Garda World Security Corp., (Canada), 7.250%, 11/15/21 (e) | | | 19,150 | |
| | 11,000 | | | Harland Clarke Holdings Corp., 8.375%, 08/15/22 (e) | | | 11,364 | |
| | 15,000 | | | Jaguar Holding Co. II, 6.375%, 08/01/23 (e) | | | 16,144 | |
| | | | Park Aerospace Holdings Ltd., (Ireland), | | | | |
| | 9,000 | | | 5.250%, 08/15/22 (e) | | | 9,382 | |
| | 9,000 | | | 5.500%, 02/15/24 (e) | | | 9,407 | |
| | 70,000 | | | Prime Security Services Borrower LLC, 9.250%, 05/15/23 (e) | | | 76,738 | |
| | 32,000 | | | West Corp., 5.375%, 07/15/22 (e) | | | 30,736 | |
| | | | | | | | |
| | | | | | | 251,252 | |
| | | | | | | | |
| | | | Construction & Engineering — 0.2% | |
| | | | AECOM, | | | | |
| | 38,000 | | | 5.125%, 03/15/27 (e) | | | 38,614 | |
| | 59,000 | | | 5.875%, 10/15/24 | | | 64,457 | |
| | 26,000 | | | MasTec, Inc., 4.875%, 03/15/23 | | | 26,000 | |
| | | | | | | | |
| | | | | | | 129,071 | |
| | | | | | | | |
| | | | Electrical Equipment — 0.1% | |
| | 13,000 | | | EnerSys, 5.000%, 04/30/23 (e) | | | 13,227 | |
| | 5,000 | | | International Wire Group, Inc., 10.750%, 08/01/21 (e) | | | 4,850 | |
SEE NOTES TO CONSOLIDATED FINANCIAL STATEMENTS.
| | | | | | |
| | | |
| 18 | | | | J.P. MORGAN FUNDS | | FEBRUARY 28, 2017 |
| | | | | | | | |
PRINCIPAL
AMOUNT($) | | | SECURITY DESCRIPTION | | VALUE($) | |
| | Corporate Bonds — continued | |
| | | | Electrical Equipment — continued | |
| | 22,000 | | | Sensata Technologies BV, 4.875%, 10/15/23 (e) | | | 22,468 | |
| | 66,000 | | | Vertiv Group Corp., 9.250%, 10/15/24 (e) | | | 70,867 | |
| | | | | | | | |
| | | | | | | 111,412 | |
| | | | | | | | |
| | | | Industrial Conglomerates — 0.1% | |
| | 15,000 | | | Honeywell International, Inc., 2.500%, 11/01/26 | | | 14,311 | |
| | | | Roper Technologies, Inc., | | | | |
| | 10,000 | | | 2.800%, 12/15/21 | | | 10,025 | |
| | 5,000 | | | 3.800%, 12/15/26 | | | 5,054 | |
| | | | | | | | |
| | | | | | | 29,390 | |
| | | | | | | | |
| | | | Machinery — 0.1% | |
| | 17,000 | | | BlueLine Rental Finance Corp., 7.000%, 02/01/19 (e) | | | 17,340 | |
| | 2,000 | | | Gates Global LLC, 6.000%, 07/15/22 (e) | | | 2,015 | |
| | 35,000 | | | Navistar International Corp., 8.250%, 11/01/21 | | | 35,350 | |
| | 7,000 | | | Oshkosh Corp., 5.375%, 03/01/25 | | | 7,254 | |
| | 20,000 | | | Parker-Hannifin Corp., 3.250%, 03/01/27 (e) | | | 20,135 | |
| | 28,000 | | | Terex Corp., 5.625%, 02/01/25 (e) | | | 28,735 | |
| | | | | | | | |
| | | | | | | 110,829 | |
| | | | | | | | |
| | | | Marine — 0.0% (g) | |
| | 22,529 | | | Shelf Drilling Holdings Ltd., (United Arab Emirates), 9.500%, 11/02/20 (e) | | | 21,403 | |
| | | | | | | | |
| | | | Professional Services — 0.0% (g) | |
| | 12,000 | | | IHS Markit Ltd., 4.750%, 02/15/25 (e) | | | 12,368 | |
| | | | | | | | |
| | | | Road & Rail — 0.1% | |
| | 70,000 | | | Burlington Northern Santa Fe LLC, 3.400%, 09/01/24 | | | 72,399 | |
| | | | | | | | |
| | | | Trading Companies & Distributors — 0.6% | |
| | 25,000 | | | Ahern Rentals, Inc., 7.375%, 05/15/23 (e) | | | 23,250 | |
| | 65,000 | | | Air Lease Corp., 3.000%, 09/15/23 | | | 63,946 | |
| | 119,000 | | | Aircastle Ltd., 5.125%, 03/15/21 | | | 127,032 | |
| | 45,000 | | | Aviation Capital Group Corp., 2.875%, 01/20/22 (e) | | | 44,761 | |
| | 15,000 | | | HD Supply, Inc., 5.750%, 04/15/24 (e) | | | 15,863 | |
| | 100,000 | | | International Lease Finance Corp., 3.875%, 04/15/18 | | | 102,201 | |
| | | | United Rentals North America, Inc., | | | | |
| | 5,000 | | | 5.500%, 05/15/27 | | | 5,110 | |
| | 40,000 | | | 5.750%, 11/15/24 | | | 42,400 | |
| | 60,000 | | | 5.875%, 09/15/26 | | | 63,075 | |
| | 10,000 | | | Univar USA, Inc., 6.750%, 07/15/23 (e) | | | 10,475 | |
| | 29,000 | | | WESCO Distribution, Inc., 5.375%, 06/15/24 | | | 29,870 | |
| | | | | | | | |
| | | | | | | 527,983 | |
| | | | | | | | |
| | | | Total Industrials | | | 1,894,593 | |
| | | | | | | | |
| | | | | | | | |
PRINCIPAL
AMOUNT($) | | | SECURITY DESCRIPTION | | VALUE($) | |
| | | | | | | | |
| | | | Information Technology — 2.0% | |
| | | | Communications Equipment — 0.5% | |
| | 30,000 | | | Alcatel-Lucent USA, Inc., (France), 6.450%, 03/15/29 | | | 33,150 | |
| | | | Avaya, Inc., | | | | |
| | 55,000 | | | 7.000%, 04/01/19 (d) (e) | | | 43,931 | |
| | 10,000 | | | 10.500%, 03/01/21 (d) (e) | | | 2,750 | |
| | 135,000 | | | Cisco Systems, Inc., 2.200%, 02/28/21 | | | 135,177 | |
| | 35,000 | | | CommScope, Inc., 5.500%, 06/15/24 (e) | | | 36,663 | |
| | | | Harris Corp., | | | | |
| | 50,000 | | | 1.999%, 04/27/18 | | | 50,106 | |
| | 50,000 | | | 3.832%, 04/27/25 | | | 51,388 | |
| | 10,000 | | | Nokia OYJ, (Finland), 6.625%, 05/15/39 | | | 10,675 | |
| | 12,000 | | | Plantronics, Inc., 5.500%, 05/31/23 (e) | | | 12,216 | |
| | | | | | | | |
| | | | | | | 376,056 | |
| | | | | | | | |
| | | | Electronic Equipment, Instruments & Components — 0.0% (g) | |
| | 20,000 | | | CDW LLC, 5.500%, 12/01/24 | | | 21,000 | |
| | | | | | | | |
| | | | Internet Software & Services — 0.1% | |
| | 25,000 | | | Genesys Telecommunications Laboratories, Inc., 10.000%, 11/30/24 (e) | | | 27,187 | |
| | 8,000 | | | Match Group, Inc., 6.375%, 06/01/24 | | | 8,640 | |
| | 13,000 | | | Rackspace Hosting, Inc., 8.625%, 11/15/24 (e) | | | 13,699 | |
| | 10,000 | | | Zayo Group LLC, 5.750%, 01/15/27 (e) | | | 10,573 | |
| | | | | | | | |
| | | | | | | 60,099 | |
| | | | | | | | |
| | | | IT Services — 0.1% | |
| | | | Alliance Data Systems Corp., | | | | |
| | 7,000 | | | 5.375%, 08/01/22 (e) | | | 6,965 | |
| | 5,000 | | | 5.875%, 11/01/21 (e) | | | 5,175 | |
| | | | First Data Corp., | | | | |
| | 25,000 | | | 5.000%, 01/15/24 (e) | | | 25,531 | |
| | 49,000 | | | 5.750%, 01/15/24 (e) | | | 50,776 | |
| | 31,000 | | | 7.000%, 12/01/23 (e) | | | 33,325 | |
| | | | | | | | |
| | | | | | | 121,772 | |
| | | | | | | | |
| | | | Semiconductors & Semiconductor Equipment — 0.3% | |
| | | | Analog Devices, Inc., | | | | |
| | 40,000 | | | 2.500%, 12/05/21 | | | 39,780 | |
| | 20,000 | | | 3.125%, 12/05/23 | | | 19,992 | |
| | 15,000 | | | 3.500%, 12/05/26 | | | 14,966 | |
| | 40,000 | | | Broadcom Corp., 3.625%, 01/15/24 (e) | | | 40,318 | |
| | | | Micron Technology, Inc., | | | | |
| | 2,000 | | | 5.250%, 08/01/23 (e) | | | 2,018 | |
| | 40,000 | | | 5.250%, 01/15/24 (e) | | | 40,500 | |
| | 8,000 | | | 5.500%, 02/01/25 | | | 8,260 | |
| | 27,000 | | | Microsemi Corp., 9.125%, 04/15/23 (e) | | | 31,118 | |
SEE NOTES TO CONSOLIDATED FINANCIAL STATEMENTS.
| | | | | | | | |
| | | |
| FEBRUARY 28, 2017 | | J.P. MORGAN FUNDS | | | | | 19 | |
JPMorgan Diversified Real Return Fund
CONSOLIDATED SCHEDULE OF PORTFOLIO INVESTMENTS
AS OF FEBRUARY 28, 2017 (Unaudited) (continued)
| | | | | | | | |
PRINCIPAL
AMOUNT($) | | | SECURITY DESCRIPTION | | VALUE($) | |
| | Corporate Bonds — continued | |
| | | | Semiconductors & Semiconductor Equipment — continued | |
| | 10,000 | | | Qorvo, Inc., 6.750%, 12/01/23 | | | 10,900 | |
| | 11,000 | | | QUALCOMM, Inc., 3.450%, 05/20/25 | | | 11,137 | |
| | 10,000 | | | Versum Materials, Inc., 5.500%, 09/30/24 (e) | | | 10,463 | |
| | | | | | | | |
| | | | | | | 229,452 | |
| | | | | | | | |
| | | | Software — 0.5% | |
| | 30,000 | | | Camelot Finance SA, 7.875%, 10/15/24 (e) | | | 31,950 | |
| | 5,000 | | | CURO Financial Technologies Corp., 12.000%, 03/01/22 (e) | | | 5,131 | |
| | 10,000 | | | Infor Software Parent LLC, 7.125% (cash), 05/01/21 (e) (v) | | | 10,275 | |
| | 35,000 | | | Infor US, Inc., 6.500%, 05/15/22 | | | 36,400 | |
| | 7,000 | | | Informatica LLC, 7.125%, 07/15/23 (e) | | | 6,790 | |
| | | | Microsoft Corp., | | | | |
| | 110,000 | | | 2.400%, 08/08/26 | | | 104,516 | |
| | 15,000 | | | 3.300%, 02/06/27 | | | 15,293 | |
| | 4,000 | | | Nuance Communications, Inc., 5.375%, 08/15/20 (e) | | | 4,093 | |
| | | | Open Text Corp., (Canada), | | | | |
| | 15,000 | | | 5.625%, 01/15/23 (e) | | | 15,731 | |
| | 3,000 | | | 5.875%, 06/01/26 (e) | | | 3,150 | |
| | | | Oracle Corp., | | | | |
| | 135,000 | | | 2.400%, 09/15/23 | | | 131,983 | |
| | 45,000 | | | 2.500%, 05/15/22 | | | 45,011 | |
| | 20,000 | | | Solera LLC, 10.500%, 03/01/24 (e) | | | 22,800 | |
| | 14,000 | | | Symantec Corp., 5.000%, 04/15/25 (e) | | | 14,369 | |
| | | | | | | | |
| | | | | | | 447,492 | |
| | | | | | | | |
| | | | Technology Hardware, Storage & Peripherals — 0.5% | |
| | | | Apple, Inc., | | | | |
| | 155,000 | | | 2.500%, 02/09/25 | | | 149,821 | |
| | 20,000 | | | 3.250%, 02/23/26 | | | 20,299 | |
| | | | Diamond 1 Finance Corp., | | | | |
| | 46,000 | | | 5.875%, 06/15/21 (e) | | | 48,665 | |
| | 80,000 | | | 6.020%, 06/15/26 (e) | | | 88,213 | |
| | 42,000 | | | 7.125%, 06/15/24 (e) | | | 46,405 | |
| | 8,000 | | | Diebold Nixdorf, Inc., 8.500%, 04/15/24 | | | 8,780 | |
| | | | EMC Corp., | | | | |
| | 13,000 | | | 2.650%, 06/01/20 | | | 12,670 | |
| | 10,000 | | | 3.375%, 06/01/23 | | | 9,558 | |
| | | | Western Digital Corp., | | | | |
| | 15,000 | | | 7.375%, 04/01/23 (e) | | | 16,405 | |
| | 10,000 | | | 10.500%, 04/01/24 | | | 11,688 | |
| | | | | | | | |
| | | | | | | 412,504 | |
| | | | | | | | |
| | | | Total Information Technology | | | 1,668,375 | |
| | | | | | | | |
| | | | | | | | |
PRINCIPAL
AMOUNT($) | | | SECURITY DESCRIPTION | | VALUE($) | |
| | | | | | | | |
| | | | Materials — 1.8% | |
| | | | Chemicals — 0.5% | |
| | 75,000 | | | Blue Cube Spinco, Inc., 10.000%, 10/15/25 | | | 91,125 | |
| | | | CF Industries, Inc., | | | | |
| | 55,000 | | | 3.400%, 12/01/21 (e) | | | 55,144 | |
| | 8,000 | | | 4.500%, 12/01/26 (e) | | | 8,194 | |
| | 12,000 | | | 5.150%, 03/15/34 | | | 11,370 | |
| | 67,000 | | | CVR Partners LP, 9.250%, 06/15/23 (e) | | | 71,690 | |
| | 55,000 | | | Hexion, Inc., 6.625%, 04/15/20 | | | 51,150 | |
| | 8,000 | | | Koppers, Inc., 6.000%, 02/15/25 (e) | | | 8,320 | |
| | 10,000 | | | Momentive Performance Materials, Inc., 3.880%, 10/24/21 | | | 9,800 | |
| | 65,000 | | | PolyOne Corp., 5.250%, 03/15/23 | | | 66,950 | |
| | 5,000 | | | Rain CII Carbon LLC, 8.000%, 12/01/18 (e) | | | 4,994 | |
| | 5,000 | | | Scotts Miracle-Gro Co. (The), 5.250%, 12/15/26 (e) | | | 5,106 | |
| | 5,000 | | | Valvoline, Inc., 5.500%, 07/15/24 (e) | | | 5,275 | |
| | | | | | | | |
| | | | | | | 389,118 | |
| | | | | | | | |
| | | | Construction Materials — 0.3% | |
| | 200,000 | | | Cemex SAB de CV, (Mexico), 6.125%, 05/05/25 (e) | | | 209,160 | |
| | 10,000 | | | US Concrete, Inc., 6.375%, 06/01/24 (e) | | | 10,575 | |
| | | | | | | | |
| | | | | | | 219,735 | |
| | | | | | | | |
| | | | Containers & Packaging — 0.3% | |
| | 60,000 | | | Ball Corp., 5.250%, 07/01/25 | | | 63,675 | |
| | 60,000 | | | Berry Plastics Corp., 5.125%, 07/15/23 | | | 61,800 | |
| | 4,000 | | | Flex Acquisition Co., Inc., 6.875%, 01/15/25 (e) | | | 4,090 | |
| | | | Graphic Packaging International, Inc., | | | | |
| | 10,000 | | | 4.125%, 08/15/24 | | | 9,925 | |
| | 11,000 | | | 4.750%, 04/15/21 | | | 11,577 | |
| | 30,000 | | | Owens-Brockway Glass Container, Inc., 5.375%, 01/15/25 (e) | | | 30,938 | |
| | 75,000 | | | Sealed Air Corp., 5.125%, 12/01/24 (e) | | | 78,375 | |
| | | | | | | | |
| | | | | | | 260,380 | |
| | | | | | | | |
| | | | Metals & Mining — 0.7% | |
| | | | ArcelorMittal, (Luxembourg), | | | | |
| | 39,000 | | | 6.125%, 06/01/25 | | | 43,826 | |
| | 59,000 | | | 7.000%, 02/25/22 | | | 67,113 | |
| | 60,000 | | | 7.750%, 03/01/41 | | | 68,100 | |
| | 5,000 | | | Coeur Mining, Inc., 7.875%, 02/01/21 | | | 5,162 | |
| | 59,000 | | | Commercial Metals Co., 4.875%, 05/15/23 | | | 60,327 | |
| | | | Freeport-McMoRan, Inc., | | | | |
| | 80,000 | | | 3.550%, 03/01/22 | | | 74,192 | |
| | 60,000 | | | 4.000%, 11/14/21 | | | 57,600 | |
| | 19,000 | | | 5.450%, 03/15/43 | | | 16,245 | |
| | 10,000 | | | Hecla Mining Co., 6.875%, 05/01/21 | | | 10,325 | |
SEE NOTES TO CONSOLIDATED FINANCIAL STATEMENTS.
| | | | | | |
| | | |
| 20 | | | | J.P. MORGAN FUNDS | | FEBRUARY 28, 2017 |
| | | | | | | | |
PRINCIPAL
AMOUNT($) | | | SECURITY DESCRIPTION | | VALUE($) | |
| | Corporate Bonds — continued | |
| | | | Metals & Mining — continued | |
| | 5,000 | | | HudBay Minerals, Inc., (Canada), 7.250%, 01/15/23 (e) | | | 5,337 | |
| | 10,000 | | | Kaiser Aluminum Corp., 5.875%, 05/15/24 | | | 10,500 | |
| | 15,000 | | | Lundin Mining Corp., (Canada), 7.500%, 11/01/20 (e) | | | 15,937 | |
| | 10,000 | | | New Gold, Inc., (Canada), 7.000%, 04/15/20 (e) | | | 10,175 | |
| | 4,000 | | | Peabody Securities Finance Corp., 6.000%, 03/31/22 (e) | | | 4,080 | |
| | | | Steel Dynamics, Inc., | | | | |
| | 5,000 | | | 5.000%, 12/15/26 (e) | | | 5,163 | |
| | 100,000 | | | 6.375%, 08/15/22 | | | 104,500 | |
| | | | Teck Resources Ltd., (Canada), | | | | |
| | 15,000 | | | 6.000%, 08/15/40 | | | 15,038 | |
| | 20,000 | | | 8.000%, 06/01/21 (e) | | | 22,225 | |
| | 5,000 | | | United States Steel Corp., 8.375%, 07/01/21 (e) | | | 5,625 | |
| | 15,000 | | | Vale Overseas Ltd., (Brazil), 6.250%, 08/10/26 | | | 16,460 | |
| | | | | | | | |
| | | | | | | 617,930 | |
| | | | | | | | |
| | | | Paper & Forest Products — 0.0% (g) | |
| | 10,000 | | | Clearwater Paper Corp., 4.500%, 02/01/23 | | | 9,800 | |
| | 23,000 | | | Hardwoods Acquisition, Inc., 7.500%, 08/01/21 (e) | | | 20,355 | |
| | | | | | | | |
| | | | | | | 30,155 | |
| | | | | | | | |
| | | | Total Materials | | | 1,517,318 | |
| | | | | | | | |
| | | | Real Estate — 0.3% | |
| | | | Equity Real Estate Investment Trusts (REITs) — 0.3% | |
| | 65,000 | | | American Tower Corp., 3.375%, 10/15/26 | | | 62,138 | |
| | 10,000 | | | Communications Sales & Leasing, Inc., 6.000%, 04/15/23 (e) | | | 10,500 | |
| | 60,000 | | | Crown Castle International Corp., 3.700%, 06/15/26 | | | 59,206 | |
| | 15,000 | | | DuPont Fabros Technology LP, 5.875%, 09/15/21 | | | 15,638 | |
| | | | Equinix, Inc., | | | | |
| | 25,000 | | | 5.375%, 04/01/23 | | | 25,937 | |
| | 11,000 | | | 5.750%, 01/01/25 | | | 11,660 | |
| | 5,000 | | | 5.875%, 01/15/26 | | | 5,341 | |
| | 40,000 | | | HCP, Inc., 3.400%, 02/01/25 | | | 39,050 | |
| | 30,000 | | | Iron Mountain, Inc., 5.750%, 08/15/24 | | | 30,787 | |
| | | | | | | | |
| | | | Total Real Estate | | | 260,257 | |
| | | | | | | | |
| | | | | | | | |
| | | | Telecommunication Services — 2.2% | |
| | | | Diversified Telecommunication Services — 1.6% | |
| | | | AT&T, Inc., | | | | |
| | 100,000 | | | 1.750%, 01/15/18 | | | 100,264 | |
| | 65,000 | | | 3.400%, 05/15/25 | | | 62,834 | |
| | 75,000 | | | 4.125%, 02/17/26 | | | 76,141 | |
| | 20,000 | | | 4.250%, 03/01/27 | | | 20,346 | |
| | | | | | | | |
PRINCIPAL
AMOUNT($) | | | SECURITY DESCRIPTION | | VALUE($) | |
| | | | | | | | |
| | | | Diversified Telecommunication Services — continued | |
| | | | CCO Holdings LLC, | | | | |
| | 15,000 | | | 5.125%, 05/01/27 (e) | | | 15,581 | |
| | 35,000 | | | 5.500%, 05/01/26 (e) | | | 37,144 | |
| | 40,000 | | | 5.750%, 02/15/26 (e) | | | 42,800 | |
| | 70,000 | | | 5.875%, 04/01/24 (e) | | | 75,075 | |
| | 15,000 | | | Cincinnati Bell, Inc., 7.000%, 07/15/24 (e) | | | 15,862 | |
| | 25,000 | | | Consolidated Communications, Inc., 6.500%, 10/01/22 | | | 24,937 | |
| | 141,000 | | | Embarq Corp., 7.995%, 06/01/36 | | | 141,463 | |
| | | | Frontier Communications Corp., | | | | |
| | 25,000 | | | 6.250%, 09/15/21 | | | 23,875 | |
| | 57,000 | | | 8.500%, 04/15/20 | | | 60,491 | |
| | 47,000 | | | 9.250%, 07/01/21 | | | 49,585 | |
| | 20,000 | | | 10.500%, 09/15/22 | | | 20,825 | |
| | 35,000 | | | 11.000%, 09/15/25 | | | 35,175 | |
| | 44,000 | | | Hughes Satellite Systems Corp., 5.250%, 08/01/26 (e) | | | 44,715 | |
| | | | Intelsat Jackson Holdings SA, (Luxembourg), | | | | |
| | 22,000 | | | 5.500%, 08/01/23 | | | 18,232 | |
| | 10,000 | | | 7.250%, 04/01/19 | | | 9,575 | |
| | 13,000 | | | 7.250%, 10/15/20 | | | 12,025 | |
| | 30,000 | | | 7.500%, 04/01/21 | | | 27,450 | |
| | 35,000 | | | 8.000%, 02/15/24 (e) | | | 37,888 | |
| | | | Level 3 Financing, Inc., | | | | |
| | 42,000 | | | 5.375%, 08/15/22 | | | 43,543 | |
| | 25,000 | | | 5.375%, 05/01/25 | | | 25,813 | |
| | 15,000 | | | Qwest Capital Funding, Inc., 6.875%, 07/15/28 | | | 14,269 | |
| | 5,000 | | | Qwest Corp., 7.250%, 09/15/25 | | | 5,437 | |
| | 25,000 | | | SBA Communications Corp., 4.875%, 09/01/24 (e) | | | 24,873 | |
| | | | Sprint Capital Corp., | | | | |
| | 37,000 | | | 6.875%, 11/15/28 | | | 39,590 | |
| | 3,000 | | | 8.750%, 03/15/32 | | | 3,600 | |
| | | | Verizon Communications, Inc., | | | | |
| | 115,000 | | | 2.625%, 08/15/26 | | | 105,397 | |
| | 70,000 | | | 2.946%, 03/15/22 (e) | | | 69,928 | |
| | 10,000 | | | Windstream Services LLC, 7.500%, 06/01/22 | | | 9,900 | |
| | 26,000 | | | Zayo Group LLC, 6.000%, 04/01/23 | | | 27,495 | |
| | | | | | | | |
| | | | | | | 1,322,128 | |
| | | | | | | | |
| | | | Wireless Telecommunication Services — 0.6% | |
| | 60,000 | | | Sprint Communications, Inc., 7.000%, 03/01/20 (e) | | | 65,550 | |
| | | | Sprint Corp., | | | | |
| | 175,000 | | | 7.125%, 06/15/24 | | | 188,946 | |
| | 50,000 | | | 7.625%, 02/15/25 | | | 55,750 | |
SEE NOTES TO CONSOLIDATED FINANCIAL STATEMENTS.
| | | | | | | | |
| | | |
| FEBRUARY 28, 2017 | | J.P. MORGAN FUNDS | | | | | 21 | |
JPMorgan Diversified Real Return Fund
CONSOLIDATED SCHEDULE OF PORTFOLIO INVESTMENTS
AS OF FEBRUARY 28, 2017 (Unaudited) (continued)
| | | | | | | | |
PRINCIPAL
AMOUNT($) | | | SECURITY DESCRIPTION | | VALUE($) | |
| | Corporate Bonds — continued | |
| | | | Wireless Telecommunication Services — continued | |
| | | | T-Mobile USA, Inc., | | | | |
| | 110,000 | | | 6.000%, 04/15/24 | | | 117,425 | |
| | 15,000 | | | 6.500%, 01/15/24 | | | 16,117 | |
| | 60,000 | | | 6.836%, 04/28/23 | | | 64,050 | |
| | | | | | | | |
| | | | | | | 507,838 | |
| | | | | | | | |
| | | | Total Telecommunication Services | | | 1,829,966 | |
| | | | | | | | |
| | | | Utilities — 1.7% | |
| | | | Electric Utilities — 0.6% | |
| | 10,000 | | | AEP Transmission Co. LLC, 3.100%, 12/01/26 (e) | | | 9,919 | |
| | 70,000 | | | Duke Energy Corp., 3.750%, 04/15/24 | | | 72,477 | |
| | 80,000 | | | Emera US Finance LP, (Canada), 3.550%, 06/15/26 | | | 78,983 | |
| | 70,000 | | | Entergy Corp., 4.000%, 07/15/22 | | | 73,452 | |
| | 60,000 | | | Exelon Corp., 3.950%, 06/15/25 | | | 61,828 | |
| | 40,000 | | | ITC Holdings Corp., 3.650%, 06/15/24 | | | 40,555 | |
| | 25,000 | | | Metropolitan Edison Co., 4.000%, 04/15/25 (e) | | | 25,380 | |
| | 65,000 | | | Pacific Gas & Electric Co., 3.400%, 08/15/24 | | | 66,652 | |
| | 30,000 | | | Terraform Global Operating LLC, 9.750%, 08/15/22 (e) | | | 33,600 | |
| | 25,000 | | | Trans-Allegheny Interstate Line Co., 3.850%, 06/01/25 (e) | | | 25,727 | |
| | 40,000 | | | Xcel Energy, Inc., 3.350%, 12/01/26 | | | 40,324 | |
| | | | | | | | |
| | | | | | | 528,897 | |
| | | | | | | | |
| | | | Gas Utilities — 0.3% | |
| | | | AmeriGas Partners LP, | | | | |
| | 6,000 | | | 5.500%, 05/20/25 | | | 6,082 | |
| | 9,000 | | | 5.750%, 05/20/27 | | | 9,045 | |
| | 5,000 | | | Ferrellgas LP, 6.750%, 06/15/23 | | | 4,850 | |
| | 5,000 | | | PBF Logistics LP, 6.875%, 05/15/23 | | | 5,088 | |
| | 10,000 | | | Rose Rock Midstream LP, 5.625%, 11/15/23 | | | 9,750 | |
| | 169,000 | | | Sabine Pass Liquefaction LLC, 5.625%, 03/01/25 | | | 185,478 | |
| | 13,000 | | | Summit Midstream Holdings LLC, 5.750%, 04/15/25 | | | 13,195 | |
| | | | | | | | |
| | | | | | | 233,488 | |
| | | | | | | | |
| | | | Independent Power & Renewable Electricity Producers — 0.5% | |
| | 80,000 | | | AES Corp., 7.375%, 07/01/21 | | | 90,200 | |
| | 75,000 | | | Calpine Corp., 5.250%, 06/01/26 (e) | | | 76,125 | |
| | | | Dynegy, Inc., | | | | |
| | 105,000 | | | 5.875%, 06/01/23 | | | 95,025 | |
| | 5,000 | | | 8.000%, 01/15/25 (e) | | | 4,750 | |
| | 35,000 | | | GenOn Energy, Inc., 9.875%, 10/15/20 | | | 25,725 | |
| | 45,000 | | | NRG Energy, Inc., 7.250%, 05/15/26 | | | 46,294 | |
| | 50,000 | | | NRG Yield Operating LLC, 5.375%, 08/15/24 | | | 51,250 | |
| | 11,000 | | | Pattern Energy Group, Inc., 5.875%, 02/01/24 (e) | | | 11,289 | |
| | | | | | | | |
| | | | | | | 400,658 | |
| | | | | | | | |
| | | | | | | | |
PRINCIPAL
AMOUNT($) | | | SECURITY DESCRIPTION | | VALUE($) | |
| | | | | | | | |
| | | | Multi-Utilities — 0.3% | |
| | 65,000 | | | Berkshire Hathaway Energy Co., 3.500%, 02/01/25 | | | 66,720 | |
| | | | CMS Energy Corp., | | | | |
| | 5,000 | | | 2.950%, 02/15/27 | | | 4,770 | |
| | 15,000 | | | 3.450%, 08/15/27 | | | 14,957 | |
| | | | Dominion Resources, Inc., | | | | |
| | 15,000 | | | Series D, 2.850%, 08/15/26 | | | 14,182 | |
| | 55,000 | | | 3.625%, 12/01/24 | | | 55,729 | |
| | 35,000 | | | New York State Electric & Gas Corp., 3.250%, 12/01/26 (e) | | | 34,873 | |
| | 60,000 | | | Sempra Energy, 4.050%, 12/01/23 | | | 62,916 | |
| | | | | | | | |
| | | | | | | 254,147 | |
| | | | | | | | |
| | | | Total Utilities | | | 1,417,190 | |
| | | | | | | | |
| | | | Total Corporate Bonds
(Cost $23,936,757) | | | 24,034,772 | |
| | | | | | | | |
| | |
| SHARES | | | | | | |
| | Exchange-Traded Funds — 6.6% | |
| | | | Fixed Income — 1.5% | |
| | 10,997 | | | iShares TIPS Bond Fund | | | 1,260,806 | |
| | | | | | | | |
| | | | U.S. Equity — 5.1% | |
| | 49,749 | | | Vanguard REIT Fund | | | 4,241,600 | |
| | | | | | | | |
| | | | Total Exchange-Traded Funds
(Cost $5,556,151) | | | 5,502,406 | |
| | | | | | | | |
| | Investment Companies — 7.4% (b) | |
| | | | Alternative Assets — 2.0% | |
| | 91,428 | | | JPMorgan Opportunistic Equity Long/Short Fund, Class R6 Shares (a) | | | 1,644,790 | |
| | | | | | | | |
| | | | Fixed Income — 5.4% | |
| | 476,057 | | | JPMorgan Floating Rate Income Fund,
Class R6 Shares | | | 4,513,017 | |
| | | | | | | | |
| | | | Total Investment Companies
(Cost $6,114,310) | | | 6,157,807 | |
| | | | | | | | |
| | Preferred Stock — 0.0% (g) | |
| | | | Consumer Staples — 0.0% (g) | | | | |
| | | | Household Products — 0.0% (g) | | | | |
| | 271 | | | Henkel AG & Co. KGaA (Preference), (Germany) (Cost $33,886) | | | 33,856 | |
| | | | | | | | |
| | |
NUMBER OF
RIGHTS | | | | | | |
| | Right — 0.0% (g) | |
| | | | Consumer Discretionary — 0.0% (g) | | | | |
| | | | Media — 0.0% (g) | | | | |
| | 1,096 | | | Media General, Inc., CVR (a)
(Cost $—) | | | — | |
| | | | | | | | |
SEE NOTES TO CONSOLIDATED FINANCIAL STATEMENTS.
| | | | | | |
| | | |
| 22 | | | | J.P. MORGAN FUNDS | | FEBRUARY 28, 2017 |
| | | | | | | | |
| | |
PRINCIPAL
AMOUNT($) | | | SECURITY DESCRIPTION | | VALUE($) | |
| | U.S. Treasury Obligations — 7.1% | | | | |
| | 28,000 | | | U.S. Treasury Bond, 0.875%, 02/15/47 | | | 28,054 | |
| | | | U.S. Treasury Inflation Indexed Bond, | | | | |
| | 162,000 | | | 0.625%, 02/15/43 | | | 160,162 | |
| | 51,000 | | | 0.750%, 02/15/42 | | | 52,971 | |
| | 128,000 | | | 0.750%, 02/15/45 | | | 127,005 | |
| | 82,400 | | | 1.000%, 02/15/46 | | | 86,676 | |
| | 57,000 | | | 1.375%, 02/15/44 | | | 66,104 | |
| | 74,000 | | | 1.750%, 01/15/28 | | | 97,206 | |
| | 82,000 | | | 2.000%, 01/15/26 | | | 114,002 | |
| | 34,000 | | | 2.125%, 02/15/40 | | | 48,376 | |
| | 47,000 | | | 2.125%, 02/15/41 | | | 66,392 | |
| | 151,000 | | | 2.375%, 01/15/25 | | | 224,709 | |
| | 64,000 | | | 2.500%, 01/15/29 | | | 88,774 | |
| | 20,000 | | | 3.375%, 04/15/32 | | | 38,611 | |
| | 73,000 | | | 3.625%, 04/15/28 | | | 146,049 | |
| | 21,000 | | | 3.875%, 04/15/29 | | | 43,064 | |
| | | | U.S. Treasury Inflation Indexed Note, | | | | |
| | 168,000 | | | 0.125%, 04/15/18 | | | 178,005 | |
| | 369,000 | | | 0.125%, 04/15/19 | | | 387,584 | |
| | 283,000 | | | 0.125%, 04/15/20 | | | 297,142 | |
| | 232,000 | | | 0.125%, 04/15/21 | | | 239,517 | |
| | 159,000 | | | 0.125%, 01/15/22 | | | 171,498 | |
| | 55,000 | | | 0.125%, 07/15/22 | | | 58,455 | |
| | 108,000 | | | 0.125%, 01/15/23 | | | 113,424 | |
| | 182,000 | | | 0.125%, 07/15/24 | | | 184,484 | |
| | 164,000 | | | 0.125%, 07/15/26 | | | 162,285 | |
| | 330,000 | | | 0.250%, 01/15/25 | | | 335,426 | |
| | 341,000 | | | 0.375%, 07/15/23 | | | 361,274 | |
| | 236,000 | | | 0.375%, 07/15/25 | | | 242,313 | |
| | 83,000 | | | 0.375%, 01/15/27 | | | 83,193 | |
| | 297,000 | | | 0.625%, 07/15/21 | | | 331,287 | |
| | 297,000 | | | 0.625%, 01/15/24 | | | 316,633 | |
| | 256,000 | | | 0.625%, 01/15/26 | | | 266,509 | |
| | 266,000 | | | 1.125%, 01/15/21 | | | 310,233 | |
| | 66,000 | | | 1.375%, 07/15/18 | | | 76,806 | |
| | 7,000 | | | 1.375%, 01/15/20 | | | 8,273 | |
| | 91,000 | | | 1.875%, 07/15/19 | | | 110,003 | |
| | 52,000 | | | 2.125%, 01/15/19 | | | 61,941 | |
| | 236,000 | | | U.S. Treasury Note, 0.750%, 01/31/18 (k) | | | 235,650 | |
| | | | | | | | |
| | | | Total U.S. Treasury Obligations
(Cost $5,937,345) | | | 5,920,090 | |
| | | | | | | | |
| | Short-Term Investments— 9.2% | |
| | | | U.S. Treasury Obligation — 0.0% (g) | |
| | 55,000 | | | U.S. Treasury Bill, 0.518%, 04/06/17 (k) (n) | | | 54,976 | |
| | | | | | | | |
| | | | | | | | |
| | |
SHARES | | | SECURITY DESCRIPTION | | VALUE($) | |
| | | | | | | | |
| | | | Investment Companies — 9.2% | |
| | 5,765,947 | | | JPMorgan U.S. Government Money Market Fund, Capital Shares, 0.477% (b) (l) ^ | | | 5,765,947 | |
| | 1,893,745 | | | JPMorgan U.S. Government Money Market Fund, Institutional Class Shares, 0.450% (b) (l) | | | 1,893,745 | |
| | | | | | | | |
| | | | Total Investment Companies | | | 7,659,692 | |
| | | | | | | | |
| | | | Total Short-Term Investments
(Cost $7,714,663) | | | 7,714,668 | |
| | | | | | | | |
| | | | Total Investments — 96.5%
(Cost $78,993,489) | | | 80,614,871 | |
| | | | Other Assets in Excess of
Liabilities — 3.5% | | | 2,912,204 | |
| | | | | | | | |
| | | | NET ASSETS — 100.0% | | $ | 83,527,075 | |
| | | | | | | | |
Percentages indicated are based on net assets.
| | | | |
| PORTFOLIO COMPOSITION BY COUNTRY* | |
United States | | | 73.1 | % |
Canada | | | 3.1 | |
United Kingdom | | | 2.5 | |
Switzerland | | | 1.6 | |
Australia | | | 1.5 | |
Japan | | | 1.4 | |
France | | | 1.0 | |
Others (each less than 1.0%) | | | 6.2 | |
Short-Term Investments | | | 9.6 | |
| * | Percentages indicated are based upon total investments as of February 28, 2017. |
SEE NOTES TO CONSOLIDATED FINANCIAL STATEMENTS.
| | | | | | | | |
| | | |
| FEBRUARY 28, 2017 | | J.P. MORGAN FUNDS | | | | | 23 | |
JPMorgan Diversified Real Return Fund
CONSOLIDATED SCHEDULE OF PORTFOLIO INVESTMENTS
AS OF FEBRUARY 28, 2017 (Unaudited) (continued)
| | | | | | | | | | | | | | | | | | | | |
| Futures Contracts | |
NUMBER OF
CONTRACTS | | | DESCRIPTION | | EXPIRATION
DATE | | | TRADING
CURRENCY | | | NOTIONAL
VALUE AT
FEBRUARY 28, 2017 | | | NET
UNREALIZED
APPRECIATION
(DEPRECIATION) | |
| | | | Long Futures Outstanding | | | | |
| | 7 | | | LME Primary Aluminum Futures^ | | | 03/13/17 | | | | USD | | | $ | 336,219 | | | $ | 32,704 | |
| | 5 | | | LME Zinc Futures^ | | | 03/13/17 | | | | USD | | | | 352,875 | | | | 36,360 | |
| | 12 | | | E-mini Russell 2000 | | | 03/17/17 | | | | USD | | | | 831,000 | | | | 9,209 | |
| | 13 | | | Mini MSCI Emerging Markets Index | | | 03/17/17 | | | | USD | | | | 605,020 | | | | 4,003 | |
| | 94 | | | Brent Crude Oil Futures^ | | | 03/31/17 | | | | USD | | | | 5,311,940 | | | | 14,255 | |
| | 11 | | | WTI Crude Oil Futures^ | | | 04/19/17 | | | | USD | | | | 598,730 | | | | 6,861 | |
| | 2 | | | Mini Gold Futures^ | | | 04/26/17 | | | | USD | | | | 80,250 | | | | 2,508 | |
| | 4 | | | Gasoline RBOB Futures^ | | | 04/28/17 | | | | USD | | | | 294,941 | | | | (11,426 | ) |
| | 7 | | | Live Cattle Futures^ | | | 04/28/17 | | | | USD | | | | 330,190 | | | | 22,759 | |
| | 4 | | | NY Harbor ULSD Futures^ | | | 04/28/17 | | | | USD | | | | 277,066 | | | | (5,886 | ) |
| | 11 | | | Sugar No. 11 (World Markets) Futures^ | | | 04/28/17 | | | | USD | | | | 236,914 | | | | (17,526 | ) |
| | 13 | | | CBOT Wheat Futures^ | | | 05/12/17 | | | | USD | | | | 288,437 | | | | (2,963 | ) |
| | 33 | | | Corn Futures^ | | | 05/12/17 | | | | USD | | | | 616,687 | | | | 15,187 | |
| | 4 | | | Hard Red Winter Wheat Futures^ | | | 05/12/17 | | | | USD | | | | 92,700 | | | | (712 | ) |
| | 9 | | | Soybean Futures^ | | | 05/12/17 | | | | USD | | | | 466,087 | | | | 5,111 | |
| | 7 | | | Soybean Meal Futures^ | | | 05/12/17 | | | | USD | | | | 235,480 | | | | 469 | |
| | 3 | | | LME Nickel Futures^ | | | 05/15/17 | | | | USD | | | | 197,568 | | | | (621 | ) |
| | 9 | | | LME Primary Aluminum Futures^ | | | 05/15/17 | | | | USD | | | | 433,125 | | | | 44,410 | |
| | 45 | | | Crude Oil Financial Futures^ | | | 05/19/17 | | | | USD | | | | 2,463,750 | | | | 12,663 | |
| | 1 | | | Copper Futures^ | | | 05/26/17 | | | | USD | | | | 67,850 | | | | 1,160 | |
| | 28 | | | Natural Gas Financial Futures^ | | | 05/26/17 | | | | USD | | | | 826,840 | | | | (96,095 | ) |
| | 3 | | | 10 Year U.S. Treasury Note | | | 06/21/17 | | | | USD | | | | 373,734 | | | | 931 | |
| | 7 | | | Gold 100 OZ Futures^ | | | 06/28/17 | | | | USD | | | | 880,040 | | | | (8,788 | ) |
| | 8 | | | Natural Gas Futures^ | | | 06/28/17 | | | | USD | | | | 242,160 | | | | (23,031 | ) |
| | 1 | | | 2 Year U.S. Treasury Note | | | 06/30/17 | | | | USD | | | | 216,406 | | | | 139 | |
| | 31 | | | 5 Year U.S. Treasury Note | | | 06/30/17 | | | | USD | | | | 3,648,797 | | | | 6,489 | |
| | 3 | | | Cotton No.2 Futures^ | | | 07/07/17 | | | | USD | | | | 116,220 | | | | 96 | |
| | 11 | | | Soybean Oil Futures^ | | | 07/14/17 | | | | USD | | | | 225,654 | | | | (13,166 | ) |
| | 9 | | | LME Primary Aluminum Futures^ | | | 07/17/17 | | | | USD | | | | 433,912 | | | | 18,360 | |
| | 4 | | | LME Zinc Futures^ | | | 07/17/17 | | | | USD | | | | 282,750 | | | | 2,613 | |
| | 10 | | | Copper Futures^ | | | 07/27/17 | | | | USD | | | | 681,625 | | | | 12,686 | |
| | 4 | | | Silver Futures^ | | | 07/27/17 | | | | USD | | | | 370,700 | | | | (1,610 | ) |
| | 8 | | | Lean Hogs Futures^ | | | 08/14/17 | | | | USD | | | | 249,040 | | | | 2,436 | |
| | 4 | | | Coffee ‘C’ Futures^ | | | 09/19/17 | | | | USD | | | | 220,800 | | | | (7,137 | ) |
| | | | Short Futures Outstanding | | | | |
| | (7 | ) | | LME Primary Aluminum Futures^ | | | 03/13/17 | | | | USD | | | | (336,219 | ) | | | (37,602 | ) |
| | (5 | ) | | LME Zinc Futures^ | | | 03/13/17 | | | | USD | | | | (352,875 | ) | | | (7,446 | ) |
| | (2 | ) | | E-mini S&P 500 | | | 03/17/17 | | | | USD | | | | (236,280 | ) | | | (9,959 | ) |
| | (3 | ) | | Mini MSCI EAFE Index | | | 03/17/17 | | | | USD | | | | (261,825 | ) | | | (9,861 | ) |
| | (16 | ) | | Natural Gas Financial Futures^ | | | 04/26/17 | | | | USD | | | | (459,200 | ) | | | 64,449 | |
| | (80 | ) | | Brent Crude Oil Futures^ | | | 04/28/17 | | | | USD | | | | (4,547,200 | ) | | | (24,998 | ) |
| | (9 | ) | | LME Primary Aluminum Futures^ | | | 05/15/17 | | | | USD | | | | (433,125 | ) | | | (19,996 | ) |
| | (8 | ) | | Ultra 10 Year U.S. Treasury Note | | | 06/21/17 | | | | USD | | | | (1,071,500 | ) | | | (8,018 | ) |
| | (33 | ) | | 5 Year U.S. Treasury Note | | | 06/30/17 | | | | USD | | | | (3,884,203 | ) | | | (5,483 | ) |
| | (1 | ) | | LME Zinc Futures^ | | | 07/17/17 | | | | USD | | | | (70,687 | ) | | | 2,159 | |
| | (45 | ) | | Crude Oil Financial Futures^ | | | 08/21/17 | | | | USD | | | | (2,486,250 | ) | | | 12,512 | |
| | | | | | | | | | | | | | | | | | | | |
| | | | | | | | | | | | | | | | | | | | |
| | | | | | | $ | 18,205 | |
| | | | | | | | | | | | | | | | | | | | |
SEE NOTES TO CONSOLIDATED FINANCIAL STATEMENTS.
| | | | | | |
| | | |
| 24 | | | | J.P. MORGAN FUNDS | | FEBRUARY 28, 2017 |
| | | | | | | | | | | | | | | | | | | | | | |
| Forward Foreign Currency Exchange Contracts | |
CONTRACTS
TO BUY | | | CURRENCY | | COUNTERPARTY | | SETTLEMENT
DATE | | | SETTLEMENT
VALUE | | | VALUE AT
FEBRUARY 28, 2017 | | | NET
UNREALIZED
APPRECIATION
(DEPRECIATION) | |
| | 141,715 | | | AUD | | Australia and New Zealand Banking Group Ltd. | | | 05/10/17 | | | $ | 107,850 | | | $ | 108,484 | | | $ | 634 | |
| | 148,947 | | | CHF | | Australia and New Zealand Banking Group Ltd. | | | 05/10/17 | | | | 150,201 | | | | 148,908 | | | | (1,293 | ) |
| | 29,454 | | | EUR | | Australia and New Zealand Banking Group Ltd. | | | 05/10/17 | | | | 31,491 | | | | 31,304 | | | | (187 | ) |
| | 45,020 | | | GBP | | Barclays Bank plc | | | 05/10/17 | | | | 56,646 | | | | 55,956 | | | | (690 | ) |
| | 260,622 | | | HKD | | Australia and New Zealand Banking Group Ltd. | | | 05/10/17 | | | | 33,628 | | | | 33,602 | | | | (26 | ) |
| | 2,916,199 | | | JPY | | Australia and New Zealand Banking Group Ltd. | | | 05/10/17 | | | | 26,041 | | | | 26,035 | | | | (6 | ) |
| | 222,168 | | | SEK | | Union Bank of Switzerland AG | | | 05/10/17 | | | | 25,250 | | | | 24,698 | | | | (552 | ) |
| | 50,768 | | | SGD | | Australia and New Zealand Banking Group Ltd. | | | 05/11/17 | | | | 35,923 | | | | 36,242 | | | | 319 | |
| | | | | | | | | | | | $ | 467,030 | | | $ | 465,229 | | | $ | (1,801 | ) |
| | |
CONTRACTS
TO SELL | | | CURRENCY | | COUNTERPARTY | | SETTLEMENT
DATE | | | SETTLEMENT
VALUE | | | VALUE AT
FEBRUARY 28, 2017 | | | NET
UNREALIZED
APPRECIATION
(DEPRECIATION) | |
| | 240,100 | | | DKK | | Citibank, NA | | | 05/10/17 | | | $ | 34,727 | | | $ | 34,336 | | | $ | 391 | |
| | 172,457 | | | EUR | | Barclays Bank plc | | | 05/10/17 | | | | 185,248 | | | | 183,290 | | | | 1,958 | |
| | 5,632 | | | EUR | | Deutsche Bank AG | | | 05/10/17 | | | | 5,936 | | | | 5,986 | | | | (50 | ) |
| | 10,656 | | | EUR | | TD Bank Financial Group | | | 05/10/17 | | | | 11,287 | | | | 11,326 | | | | (39 | ) |
| | 23,805 | | | EUR | | Union Bank of Switzerland AG | | | 05/10/17 | | | | 25,240 | | | | 25,300 | | | | (60 | ) |
| | 86,586 | | | HKD | | Union Bank of Switzerland AG | | | 05/10/17 | | | | 11,173 | | | | 11,163 | | | | 10 | |
| | 2,493,910 | | | JPY | | Australia and New Zealand Banking Group Ltd. | | | 05/10/17 | | | | 22,274 | | | | 22,265 | | | | 9 | |
| | 15,027,312 | | | JPY | | Barclays Bank plc | | | 05/10/17 | | | | 134,252 | | | | 134,160 | | | | 92 | |
| | 104,132 | | | NOK | | TD Bank Financial Group | | | 05/10/17 | | | | 12,557 | | | | 12,427 | | | | 130 | |
| | | | | | | | | | | | $ | 442,694 | | | $ | 440,253 | | | $ | 2,441 | |
| | |
| | | | | | | | | | | | | | | | | | |
| Inflation-Linked Swaps | | | | | | | | | | | | | | |
| | | RATE TYPE (r) | | | | | | | | | | |
| SWAP COUNTERPARTY | | PAYMENTS MADE
BY THE FUND | | PAYMENTS RECEIVED
BY THE FUND | | | TERMINATION
DATE | | | NOTIONAL
AMOUNT | | | VALUE | |
Bank of America NA | | 1.897% at termination | | | CPI-U at termination | | | | 11/01/2021 | | | $ | 4,000,000 | | | $ | 67,010 | |
Bank of America NA | | 2.018% at termination | | | CPI-U at termination | | | | 11/04/2026 | | | | 2,000,000 | | | | 56,174 | |
Deutsche Bank AG, New York | | 1.965% at termination | | | CPI-U at termination | | | | 11/02/2018 | | | | 4,000,000 | | | | 32,605 | |
Deutsche Bank AG, New York | | 2.293% at termination | | | CPI-U at termination | | | | 01/04/2027 | | | | 1,500,000 | | | | (978 | ) |
Morgan Stanley Capital Services | | 2.140% at termination | | | CPI-U at termination | | | | 02/10/2022 | | | | 3,000,000 | | | | 8,264 | |
Morgan Stanley Capital Services | | 2.238% at termination | | | CPI-U at termination | | | | 11/17/2026 | | | | 2,000,000 | | | | 11,752 | |
Morgan Stanley Capital Services | | 2.199% at termination | | | CPI-U at termination | | | | 12/01/2026 | | | | 2,000,000 | | | | 19,081 | |
Morgan Stanley Capital Services | | 2.320% at termination | | | CPI-U at termination | | | | 01/17/2027 | | | | 1,000,000 | | | | (2,976 | ) |
Morgan Stanley Capital Services | | 2.320% at termination | | | CPI-U at termination | | | | 01/17/2027 | | | | 1,000,000 | | | | (2,976 | ) |
| | | | | | | | | | | | | | | | | | |
| | | | | | | | | | | | | | | | $ | 187,956 | |
| | | | | | | | | | | | | | | | | | |
SEE NOTES TO CONSOLIDATED FINANCIAL STATEMENTS.
| | | | | | | | |
| | | |
| FEBRUARY 28, 2017 | | J.P. MORGAN FUNDS | | | | | 25 | |
JPMorgan Diversified Real Return Fund
NOTES TO CONSOLIDATED SCHEDULE OF PORTFOLIO INVESTMENTS
AS OF FEBRUARY 28, 2017 (Unaudited)
| | |
| ADR | | — American Depositary Receipt |
| AUD | | — Australian Dollar |
| Brent | | — Broom, Rannoch, Etieve, Ness, Tarbat |
| CBOT | | — Chicago Board of Trade |
| CHF | | — Swiss Franc |
| CPI-U | | — Consumer Price Index for All Urban Customers |
| CVA | | — Dutch Certification |
| CVR | | — Contingent Value Rights |
| DKK | | — Danish Krone |
| EAFE | | — Europe, Australasia and Far East |
| EUR | | — Euro |
| GBP | | — British Pound |
| GDR | | — Global Depositary Receipt |
| HKD | | — Hong Kong Dollar |
| JPY | | — Japanese Yen |
| LME | | — London Metal Exchange |
| MSCI | | — Morgan Stanley Capital International |
| NOK | | — Norwegian Krone |
| RBOB | | — Reformulated gasoline blendstock for oxygen blending |
| Reg. S | | — Security was purchased pursuant to Regulation S under the Securities Act of 1933, which exempts from registration securities offered and sold outside of the United States. Such a security cannot be sold in the United States without either an effective registration statement filed pursuant to the Securities Act of 1933, or pursuant to an exemption from registration. |
| REIT | | — Real Estate Investment Trust |
| SEK | | — Swedish Krona |
| SGD | | — Singapore Dollar |
| TIPS | | — Treasury Inflation Protected Security |
| ULSD | | — Ultra Low Sulfur Diesel |
| USD | | — United States Dollar |
| VAR | | — Variable Rate Security. The interest rate shown is the rate in effect as of February 28, 2017. |
| WTI | | — West Texas Intermediate |
| |
| (a) | | — Non-income producing security. |
| | |
| (b) | | — Investment in affiliate. Fund is registered under the Investment Company Act of 1940, as amended, and advised by J.P. Morgan Investment Management Inc. |
| (d) | | — Defaulted Security. Security has not paid its last interest payment and/or interest is not being accrued. |
| (e) | | — Security is exempt from registration under Rule 144A of the Securities Act of 1933, as amended. Unless otherwise indicated, this security has been determined to be liquid under procedures established by the Board of Trustees and may be resold in transactions exempt from registration, normally to qualified institutional buyers. |
| (g) | | — Amount rounds to less than 0.05%. |
| (k) | | — All or a portion of this security is deposited with the broker as initial margin for futures contracts. |
| (l) | | — The rate shown is the current yield as of February 28, 2017. |
| (n) | | — The rate shown is the effective yield as of February 28, 2017. |
| (r) | | — Rates shown are per annum and payments are as described. |
| (v) | | — Security has the ability to pay in kind (“PIK”) or pay income in cash. When applicable, separate rates of such payments are disclosed. |
| (x) | | — Security is perpetual and thus, does not have a predetermined maturity date. The coupon rate for this security is fixed for a period of time and may be structured to adjust thereafter. The date shown, if applicable, reflects the next call date. The coupon rate shown is the rate in effect as of February 28, 2017. |
| (y) | | — Preferred Security. |
| (w) | | — All or a portion of the security is a when-issued security, delayed delivery security, or forward commitment. |
| ^ | | — Represents positions held in the Subsidiary. |
Detailed information about investment portfolios of the underlying funds can be found in shareholder reports filed with the Securities and Exchange Commission (SEC) by each such underlying fund semi-annually on Form N-CSR and in certified portfolio holdings filed quarterly on Form N-Q, and are available for download from both the SEC’s as well as each respective underlying fund’s website. Detailed information about underlying J.P. Morgan Funds can also be found at www.jpmorganfunds.com or by calling 1-800-480-4111.
SEE NOTES TO CONSOLIDATED FINANCIAL STATEMENTS.
| | | | | | |
| | | |
| 26 | | | | J.P. MORGAN FUNDS | | FEBRUARY 28, 2017 |
THIS PAGE IS INTENTIONALLY LEFT BLANK
| | | | | | | | |
| | | |
| FEBRUARY 28, 2017 | | J.P. MORGAN FUNDS | | | | | 27 | |
CONSOLIDATED STATEMENT OF ASSETS AND LIABILITIES
AS OF FEBRUARY 28, 2017 (Unaudited)
| | | | |
| | |
Diversified Real
Return Fund | |
ASSETS: | |
Investments in non-affiliates, at value | | $ | 66,797,372 | |
Investments in affiliates, at value | | | 13,817,499 | |
| | | | |
Total investment securities, at value | | | 80,614,871 | |
Cash | | | 1,847,641 | |
Foreign currency, at value | | | 5,544 | |
Deposits at broker for futures contracts | | | 545,000 | |
Receivables: | | | | |
Investment securities sold | | | 250,033 | |
Fund shares sold | | | 125,409 | |
Interest from non-affiliates | | | 377,753 | |
Dividends from affiliates | | | 3,243 | |
Tax reclaims | | | 4,249 | |
Variation margin on futures contracts | | | 48,554 | |
Unrealized appreciation on forward foreign currency exchange contracts | | | 3,543 | |
Outstanding swap contracts, at value | | | 194,886 | |
Due from Adviser | | | 62,850 | |
| | | | |
Total Assets | | | 84,083,576 | |
| | | | |
| |
LIABILITIES: | | | | |
Payables: | | | | |
Investment securities purchased | | | 379,066 | |
Investment securities purchased — delayed delivery securities | | | 19,962 | |
Fund shares redeemed | | | 21,000 | |
Unrealized depreciation on forward foreign currency exchange contracts | | | 2,903 | |
Outstanding swap contracts, at value | | | 6,930 | |
Accrued liabilities: | | | | |
Administration fees | | | 629 | |
Distribution fees | | | 925 | |
Shareholder servicing fees | | | 1,227 | |
Custodian and accounting fees | | | 45,191 | |
Collateral management fees | | | 1,402 | |
Trustees’ and Chief Compliance Officer’s fees | | | 13,445 | |
Audit fees | | | 59,793 | |
Other | | | 4,028 | |
| | | | |
Total Liabilities | | | 556,501 | |
| | | | |
Net Assets | | $ | 83,527,075 | |
| | | | |
SEE NOTES TO CONSOLIDATED FINANCIAL STATEMENTS.
| | | | | | |
| | | |
| 28 | | | | J.P. MORGAN FUNDS | | FEBRUARY 28, 2017 |
| | | | |
| | |
Diversified Real
Return Fund | |
NET ASSETS: | |
Paid-in-Capital | | $ | 85,635,844 | |
Accumulated undistributed (distributions in excess of) net investment income | | | 119,544 | |
Accumulated net realized gains (losses) | | | (4,056,117 | ) |
Net unrealized appreciation (depreciation) | | | 1,827,804 | |
| | | | |
Total Net Assets | | $ | 83,527,075 | |
| | | | |
| |
Net Assets: | | | | |
Class A | | $ | 3,328,708 | |
Class C | | | 279,006 | |
Class R2 | | | 208,221 | |
Class R5 | | | 63,432,785 | |
Class I (formerly Select Class) | | | 16,278,355 | |
| | | | |
Total | | $ | 83,527,075 | |
| | | | |
| |
Outstanding units of beneficial interest (shares) ($0.0001 par value; unlimited number of shares authorized): | | | | |
Class A | | | 232,062 | |
Class C | | | 19,492 | |
Class R2 | | | 14,483 | |
Class R5 | | | 4,400,076 | |
Class I (formerly Select Class) | | | 1,130,792 | |
| |
Net Asset Value (a): | | | | |
Class A — Redemption price per share | | $ | 14.34 | |
Class C — Offering price per share (b) | | | 14.31 | |
Class R2 — Offering and redemption price per share | | | 14.38 | |
Class R5 — Offering and redemption price per share | | | 14.42 | |
Class I (formerly Select Class) — Offering and redemption price per share | | | 14.40 | |
Class A maximum sales charge | | | 4.50 | % |
Class A maximum public offering price per share | | | | |
[net asset value per share/(100% — maximum sales charge)] | | $ | 15.02 | |
| | | | |
| |
Cost of investments in non-affiliates | | $ | 65,219,487 | |
Cost of investments in affiliates | | | 13,774,002 | |
Cost of foreign currency | | | 5,581 | |
| (a) | Per share amounts may not recalculate due to rounding of net assets and/or shares outstanding. |
| (b) | Redemption price for Class C Shares varies based upon length of time the shares are held. |
SEE NOTES TO CONSOLIDATED FINANCIAL STATEMENTS.
| | | | | | | | |
| | | |
| FEBRUARY 28, 2017 | | J.P. MORGAN FUNDS | | | | | 29 | |
CONSOLIDATED STATEMENT OF OPERATIONS
FOR THE SIX MONTHS ENDED FEBRUARY 28, 2017 (Unaudited)
| | | | |
| | |
Diversified Real
Return Fund | |
INVESTMENT INCOME: | |
Interest income from non-affiliates | | $ | 392,514 | |
Interest income from affiliates | | | 8 | |
Dividend income from non-affiliates | | | 359,941 | |
Dividend income from affiliates | | | 144,212 | |
Foreign taxes withheld | | | (451 | ) |
| | | | |
Total investment income | | | 896,224 | |
| | | | |
| |
EXPENSES: | | | | |
Investment advisory fees | | | 197,953 | |
Administration fees | | | 39,590 | |
Distribution fees: | | | | |
Class A | | | 3,965 | |
Class C | | | 1,391 | |
Class R2 | | | 429 | |
Shareholder servicing fees: | | | | |
Class A | | | 3,965 | |
Class C | | | 464 | |
Class R2 | | | 214 | |
Class R5 | | | 13,572 | |
Class I (formerly Select Class) | | | 18,813 | |
Custodian and accounting fees | | | 72,605 | |
Collateral management fees | | | 4,145 | |
Interest expense to non-affiliates | | | 30 | |
Interest expense to affiliates | | | 9 | |
Professional fees | | | 100,042 | |
Trustees’ and Chief Compliance Officer’s fees | | | 22,934 | |
Printing and mailing costs | | | 38,339 | |
Registration and filing fees | | | 26,469 | |
Transfer agency fees (See Note 2.H) | | | 839 | |
Sub-transfer agency fees (See Note 2.H) | | | 25,750 | |
Other | | | 5,771 | |
| | | | |
Total expenses | | | 577,289 | |
| | | | |
Less fees waived | | | (246,980 | ) |
Less expense reimbursements | | | (78,991 | ) |
| | | | |
Net expenses | | | 251,318 | |
| | | | |
Net investment income (loss) | | | 644,906 | |
| | | | |
| |
REALIZED/UNREALIZED GAINS (LOSSES): | | | | |
Net realized gain (loss) on transactions from: | | | | |
Investments in non-affiliates | | | (483,096 | ) |
Investments in affiliates | | | (984,724 | ) |
Futures | | | 147,518 | |
Foreign currency transactions | | | 16,529 | |
Swaps | | | (132,721 | ) |
| | | | |
Net realized gain (loss) | | | (1,436,494 | ) |
| | | | |
Change in net unrealized appreciation/depreciation on: | | | | |
Investments in non-affiliates | | | 1,457,513 | |
Investments in affiliates | | | 1,247,823 | |
Futures | | | 34,419 | |
Foreign currency translations | | | 2,784 | |
Swaps | | | 187,956 | |
| | | | |
Change in net unrealized appreciation/depreciation | | | 2,930,495 | |
| | | | |
Net realized/unrealized gains (losses) | | | 1,494,001 | |
| | | | |
Change in net assets resulting from operations | | $ | 2,138,907 | |
| | | | |
SEE NOTES TO CONSOLIDATED FINANCIAL STATEMENTS.
| | | | | | |
| | | |
| 30 | | | | J.P. MORGAN FUNDS | | FEBRUARY 28, 2017 |
CONSOLIDATED STATEMENTS OF CHANGES IN NET ASSETS
FOR THE PERIODS INDICATED
| | | | | | | | |
| | | Diversified Real Return Fund | |
| | | Six Months Ended
February 28, 2017
(Unaudited) | | | Year Ended
August 31, 2016 | |
CHANGE IN NET ASSETS RESULTING FROM OPERATIONS: | |
Net investment income (loss) | | $ | 644,906 | | | $ | 1,093,368 | |
Net realized gain (loss) | | | (1,436,491 | ) | | | 1,676,126 | |
Distributions of capital gains received from investment company affiliates | | | — | | | | 287,211 | |
Change in net unrealized appreciation/depreciation | | | 2,930,495 | | | | (140,870 | ) |
| | | | | | | | |
Change in net assets resulting from operations | | | 2,138,907 | | | | 2,915,835 | |
| | | | | | | | |
| | |
DISTRIBUTIONS TO SHAREHOLDERS: | | | | | | | | |
Class A | | | | | | | | |
From net investment income | | | (28,195 | ) | | | (56,482 | ) |
Class C | | | | | | | | |
From net investment income | | | (1,602 | ) | | | (6,307 | ) |
Class R2 | | | | | | | | |
From net investment income | | | (1,110 | ) | | | (2,576 | ) |
Class R5 | | | | | | | | |
From net investment income | | | (542,662 | ) | | | (769,458 | ) |
Class I (formerly Select Class) | | | | | | | | |
From net investment income | | | (145,113 | ) | | | (319,533 | ) |
| | | | | | | | |
Total distributions to shareholders | | | (718,682 | ) | | | (1,154,356 | ) |
| | | | | | | | |
| | |
CAPITAL TRANSACTIONS: | | | | | | | | |
Change in net assets resulting from capital transactions | | | 11,542,025 | | | | 18,915,286 | |
| | | | | | | | |
| | |
NET ASSETS: | | | | | | | | |
Change in net assets | | | 12,962,250 | | | | 20,676,765 | |
Beginning of period | | | 70,564,825 | | | | 49,888,060 | |
| | | | | | | | |
End of period | | $ | 83,527,075 | | | $ | 70,564,825 | |
| | | | | | | | |
Accumulated undistributed (distributions in excess of) net investment income | | $ | 119,544 | | | $ | 193,320 | |
| | | | | | | | |
SEE NOTES TO CONSOLIDATED FINANCIAL STATEMENTS.
| | | | | | | | |
| | | |
| FEBRUARY 28, 2017 | | J.P. MORGAN FUNDS | | | | | 31 | |
CONSOLIDATED STATEMENTS OF CHANGES IN NET ASSETS
FOR THE PERIODS INDICATED (continued)
| | | | | | | | |
| | | Diversified Real Return Fund | |
| | | Six Months Ended
February 28, 2017
(Unaudited) | | | Year Ended
August 31, 2016 | |
CAPITAL TRANSACTIONS: | | | | | | | | |
Class A | | | | | | | | |
Proceeds from shares issued | | $ | 1,021,022 | | | $ | 3,420,986 | |
Distributions reinvested | | | 27,921 | | | | 56,322 | |
Cost of shares redeemed | | | (762,173 | ) | | | (2,607,580 | ) |
| | | | | | | | |
Change in net assets resulting from Class A capital transactions | | $ | 286,770 | | | $ | 869,728 | |
| | | | | | | | |
Class C | | | | | | | | |
Proceeds from shares issued | | $ | 91,143 | | | $ | 38,736 | |
Distributions reinvested | | | 1,490 | | | | 5,836 | |
Cost of shares redeemed | | | (249,885 | ) | | | (118,597 | ) |
| | | | | | | | |
Change in net assets resulting from Class C capital transactions | | $ | (157,252 | ) | | $ | (74,025 | ) |
| | | | | | | | |
Class R2 | | | | | | | | |
Proceeds from shares issued | | $ | 79,978 | | | $ | 42,259 | |
Distributions reinvested | | | 233 | | | | 412 | |
Cost of shares redeemed | | | (31,827 | ) | | | (50,527 | ) |
| | | | | | | | |
Change in net assets resulting from Class R2 capital transactions | | $ | 48,384 | | | $ | (7,856 | ) |
| | | | | | | | |
Class R5 | | | | | | | | |
Proceeds from shares issued | | $ | 21,208,663 | | | $ | 26,845,559 | |
Distributions reinvested | | | 516,142 | | | | 769,458 | |
Cost of shares redeemed | | | (11,627,599 | ) | | | (9,533,703 | ) |
| | | | | | | | |
Change in net assets resulting from Class R5 capital transactions | | $ | 10,097,206 | | | $ | 18,081,314 | |
| | | | | | | | |
Class I (formerly Select Class) | | | | | | | | |
Proceeds from shares issued | | $ | 1,418,230 | | | $ | 1,094,049 | |
Distributions reinvested | | | 144,189 | | | | 312,598 | |
Cost of shares redeemed | | | (295,502 | ) | | | (1,360,522 | ) |
| | | | | | | | |
Change in net assets resulting from Class I capital transactions | | $ | 1,266,917 | | | $ | 46,125 | |
| | | | | | | | |
Total change in net assets resulting from capital transactions | | $ | 11,542,025 | | | $ | 18,915,286 | |
| | | | | | | | |
SEE NOTES TO CONSOLIDATED FINANCIAL STATEMENTS.
| | | | | | |
| | | |
| 32 | | | | J.P. MORGAN FUNDS | | FEBRUARY 28, 2017 |
| | | | | | | | |
| | | Diversified Real Return Fund | |
| | | Six Months Ended
February 28, 2017
(Unaudited) | | | Year Ended
August 31, 2016 | |
SHARE TRANSACTIONS: | | | | | | | | |
Class A | | | | | | | | |
Issued | | | 73,121 | | | | 255,620 | |
Reinvested | | | 1,989 | | | | 4,174 | |
Redeemed | | | (53,734 | ) | | | (197,506 | ) |
| | | | | | | | |
Change in Class A Shares | | | 21,376 | | | | 62,288 | |
| | | | | | | | |
Class C | | | | | | | | |
Issued | | | 6,549 | | | | 2,787 | |
Reinvested | | | 106 | | | | 433 | |
Redeemed | | | (17,963 | ) | | | (8,864 | ) |
| | | | | | | | |
Change in Class C Shares | | | (11,308 | ) | | | (5,644 | ) |
| | | | | | | | |
Class R2 | | | | | | | | |
Issued | | | 5,641 | | | | 3,203 | |
Reinvested | | | 16 | | | | 30 | |
Redeemed | | | (2,232 | ) | | | (3,857 | ) |
| | | | | | | | |
Change in Class R2 Shares | | | 3,425 | | | | (624 | ) |
| | | | | | | | |
Class R5 | | | | | | | | |
Issued | | | 1,494,398 | | | | 1,922,430 | |
Reinvested | | | 36,578 | | | | 56,671 | |
Redeemed | | | (823,372 | ) | | | (701,391 | ) |
| | | | | | | | |
Change in Class R5 Shares | | | 707,604 | | | | 1,277,710 | |
| | | | | | | | |
Class I (formerly Select Class) | | | | | | | | |
Issued | | | 99,930 | | | | 81,807 | |
Reinvested | | | 10,231 | | | | 23,062 | |
Redeemed | | | (20,895 | ) | | | (101,337 | ) |
| | | | | | | | |
Change in Class I Shares | | | 89,266 | | | | 3,532 | |
| | | | | | | | |
SEE NOTES TO CONSOLIDATED FINANCIAL STATEMENTS.
| | | | | | | | |
| | | |
| FEBRUARY 28, 2017 | | J.P. MORGAN FUNDS | | | | | 33 | |
CONSOLIDATED FINANCIAL HIGHLIGHTS
FOR THE PERIODS INDICATED
| | | | | | | | | | | | | | | | | | | | | | | | | | | | |
| | | Per share operating performance | |
| | | | | | Investment operations | | | Distributions | |
| | | Net asset
value,
beginning
of period | | | Net
investment
income
(loss) (b)(c) | | | Net realized
and unrealized
gains
(losses) on
investments | | | Total from
investment
operations | | | Net
investment
income | | | Net
realized
gain | | | Total
distributions | |
Diversified Real Return Fund | | | | | | | | | | | | | | | | | | | | | | | | | | | | |
Class A | | | | | | | | | | | | | | | | | | | | | | | | | | | | |
Six Months Ended February 28, 2017 (Unaudited) | | $ | 14.09 | | | $ | 0.10 | | | $ | 0.27 | | | $ | 0.37 | | | $ | (0.12 | ) | | $ | — | | | $ | (0.12 | ) |
Year Ended August 31, 2016 | | | 13.61 | | | | 0.26 | | | | 0.49 | | | | 0.75 | | | | (0.27 | ) | | | — | | | | (0.27 | ) |
Year Ended August 31, 2015 | | | 15.08 | | | | 0.23 | (i) | | | (1.47 | ) | | | (1.24 | ) | | | (0.23 | ) | | | — | | | | (0.23 | ) |
Year Ended August 31, 2014 | | | 14.25 | | | | 0.22 | (i) | | | 0.89 | | | | 1.11 | | | | (0.28 | ) | | | — | | | | (0.28 | ) |
Year Ended August 31, 2013 | | | 15.07 | | | | 0.21 | | | | (0.78 | ) | | | (0.57 | ) | | | (0.24 | ) | | | (0.01 | ) | | | (0.25 | ) |
Year Ended August 31, 2012 | | | 15.14 | | | | 0.21 | (i) | | | (0.11 | ) | | | 0.10 | | | | (0.17 | ) | | | — | (j) | | | (0.17 | ) |
| | | | | | | |
Class C | | | | | | | | | | | | | | | | | | | | | | | | | | | | |
Six Months Ended February 28, 2017 (Unaudited) | | | 14.04 | | | | 0.06 | | | | 0.28 | | | | 0.34 | | | | (0.07 | ) | | | — | | | | (0.07 | ) |
Year Ended August 31, 2016 | | | 13.56 | | | | 0.17 | | | | 0.50 | | | | 0.67 | | | | (0.19 | ) | | | — | | | | (0.19 | ) |
Year Ended August 31, 2015 | | | 15.05 | | | | 0.16 | (i) | | | (1.47 | ) | | | (1.31 | ) | | | (0.18 | ) | | | — | | | | (0.18 | ) |
Year Ended August 31, 2014 | | | 14.20 | | | | 0.14 | (i) | | | 0.89 | | | | 1.03 | | | | (0.18 | ) | | | — | | | | (0.18 | ) |
Year Ended August 31, 2013 | | | 15.03 | | | | 0.12 | | | | (0.76 | ) | | | (0.64 | ) | | | (0.18 | ) | | | (0.01 | ) | | | (0.19 | ) |
Year Ended August 31, 2012 | | | 15.13 | | | | 0.14 | (i) | | | (0.12 | ) | | | 0.02 | | | | (0.12 | ) | | | — | (j) | | | (0.12 | ) |
| | | | | | | |
Class R2 | | | | | | | | | | | | | | | | | | | | | | | | | | | | |
Six Months Ended February 28, 2017 (Unaudited) | | | 14.12 | | | | 0.08 | | | | 0.28 | | | | 0.36 | | | | (0.10 | ) | | | — | | | | (0.10 | ) |
Year Ended August 31, 2016 | | | 13.64 | | | | 0.21 | | | | 0.50 | | | | 0.71 | | | | (0.23 | ) | | | — | | | | (0.23 | ) |
Year Ended August 31, 2015 | | | 15.12 | | | | 0.16 | (i) | | | (1.44 | ) | | | (1.28 | ) | | | (0.20 | ) | | | — | | | | (0.20 | ) |
Year Ended August 31, 2014 | | | 14.24 | | | | 0.18 | (i) | | | 0.89 | | | | 1.07 | | | | (0.19 | ) | | | — | | | | (0.19 | ) |
Year Ended August 31, 2013 | | | 15.06 | | | | 0.16 | | | | (0.76 | ) | | | (0.60 | ) | | | (0.21 | ) | | | (0.01 | ) | | | (0.22 | ) |
Year Ended August 31, 2012 | | | 15.14 | | | | 0.18 | (i) | | | (0.12 | ) | | | 0.06 | | | | (0.14 | ) | | | — | (j) | | | (0.14 | ) |
| | | | | | | |
Class R5 | | | | | | | | | | | | | | | | | | | | | | | | | | | | |
Six Months Ended February 28, 2017 (Unaudited) | | | 14.16 | | | | 0.13 | | | | 0.27 | | | | 0.40 | | | | (0.14 | ) | | | — | | | | (0.14 | ) |
Year Ended August 31, 2016 | | | 13.68 | | | | 0.29 | | | | 0.51 | | | | 0.80 | | | | (0.32 | ) | | | — | | | | (0.32 | ) |
Year Ended August 31, 2015 | | | 15.15 | | | | 0.29 | (i) | | | (1.49 | ) | | | (1.20 | ) | | | (0.27 | ) | | | — | | | | (0.27 | ) |
Year Ended August 31, 2014 | | | 14.31 | | | | 0.26 | (i) | | | 0.91 | | | | 1.17 | | | | (0.33 | ) | | | — | | | | (0.33 | ) |
Year Ended August 31, 2013 | | | 15.11 | | | | 0.26 | | | | (0.78 | ) | | | (0.52 | ) | | | (0.27 | ) | | | (0.01 | ) | | | (0.28 | ) |
Year Ended August 31, 2012 | | | 15.16 | | | | 0.19 | (i) | | | (0.03 | ) | | | 0.16 | | | | (0.21 | ) | | | — | (j) | | | (0.21 | ) |
| | | | | | | |
Class I (formerly Select Class) | | | | | | | | | | | | | | | | | | | | | | | | | | | | |
Six Months Ended February 28, 2017 (Unaudited) | | | 14.14 | | | | 0.12 | | | | 0.28 | | | | 0.40 | | | | (0.14 | ) | | | — | | | | (0.14 | ) |
Year Ended August 31, 2016 | | | 13.66 | | | | 0.28 | | | | 0.50 | | | | 0.78 | | | | (0.30 | ) | | | — | | | | (0.30 | ) |
Year Ended August 31, 2015 | | | 15.13 | | | | 0.26 | (i) | | | (1.47 | ) | | | (1.21 | ) | | | (0.26 | ) | | | — | | | | (0.26 | ) |
Year Ended August 31, 2014 | | | 14.29 | | | | 0.26 | (i) | | | 0.89 | | | | 1.15 | | | | (0.31 | ) | | | — | | | | (0.31 | ) |
Year Ended August 31, 2013 | | | 15.10 | | | | 0.24 | | | | (0.78 | ) | | | (0.54 | ) | | | (0.26 | ) | | | (0.01 | ) | | | (0.27 | ) |
Year Ended August 31, 2012 | | | 15.16 | | | | 0.28 | (i) | | | (0.14 | ) | | | 0.14 | | | | (0.20 | ) | | | — | (j) | | | (0.20 | ) |
| (a) | Annualized for periods less than one year, unless otherwise noted. |
| (b) | Net investment income (loss) is affected by the timing of distributions from Underlying Funds. |
| (c) | Calculated based upon average shares outstanding. |
| (d) | Not annualized for periods less than one year. |
| (e) | Includes adjustments in accordance with accounting principles generally accepted in the United States of America and as such, the net asset values for financial reporting purposes and the returns based upon those net asset values may differ from the net asset values and returns for shareholder transactions. |
| (f) | Includes earnings credits and interest expense, if applicable, each of which is less than 0.005% unless otherwise noted. |
| (g) | Does not include expenses of Underlying Funds. |
| (h) | Portfolio turnover is calculated by dividing the lesser of total purchases or sales of portfolio securities for the reporting period by the monthly average value of portfolio securities owned during the reporting period. Excluded from both the numerator and denominator are amounts relating to derivatives and securities whose maturities or expiration dates at the time of acquisition were one year or less. |
| (i) | Net investment income (loss) may appear disproportionate among classes due to the timing of recognition of income and changes in the relative size of the classes. |
| (j) | Amount rounds to less than $0.005. |
SEE NOTES TO CONSOLIDATED FINANCIAL STATEMENTS.
| | | | | | |
| | | |
| 34 | | | | J.P. MORGAN FUNDS | | FEBRUARY 28, 2017 |
| | | | | | | | | | | | | | | | | | | | | | | | | | |
| | | Ratios/Supplemental data | |
| | | | | | | | | | Ratios to average net assets (a) | | | | |
Net asset
value,
end of
period | | | Total return
(excludes
sales charge) (d)(e) | | | Net assets,
end of
period | | | Net
expenses (f)(g) | | | Net
investment
income
(loss) (b)(f) | | |
Expenses
without waivers ,
reimbursements and
earnings credits (g) | | | Portfolio
turnover
rate (d)(h) | |
| | | | | | | | | | | | | | | | | | | | | | | | | | |
| | | | | | | | | | | | | | | | | | | | | | | | | | |
| $ | 14.34 | | | | 2.65 | % | | $ | 3,328,708 | | | | 1.00 | % | | | 1.47 | % | | | 2.06 | % | | | 72 | % |
| | 14.09 | | | | 5.61 | | | | 2,968,684 | | | | 0.64 | | | | 1.91 | | | | 1.54 | | | | 95 | |
| | 13.61 | | | | (8.28 | ) | | | 2,020,268 | | | | 0.61 | | | | 1.58 | (i) | | | 1.29 | | | | 91 | |
| | 15.08 | | | | 7.88 | | | | 2,001,598 | | | | 0.61 | | | | 1.51 | (i) | | | 1.13 | | | | 59 | |
| | 14.25 | | | | (3.81 | ) | | | 3,345,116 | | | | 0.61 | | | | 1.39 | | | | 0.99 | | | | 39 | |
| | 15.07 | | | | 0.70 | | | | 1,904,463 | | | | 0.61 | | | | 1.43 | (i) | | | 1.29 | | | | 42 | |
| | | | | | |
| | | | | | | | | | | | | | | | | | | | | | | | | | |
| | 14.31 | | | | 2.42 | | | | 279,006 | | | | 1.50 | | | | 0.91 | | | | 2.45 | | | | 72 | |
| | 14.04 | | | | 5.04 | | | | 432,469 | | | | 1.14 | | | | 1.25 | | | | 2.11 | | | | 95 | |
| | 13.56 | | | | (8.74 | ) | | | 494,218 | | | | 1.11 | | | | 1.10 | (i) | | | 1.78 | | | | 91 | |
| | 15.05 | | | | 7.34 | | | | 443,103 | | | | 1.11 | | | | 0.98 | (i) | | | 1.60 | | | | 59 | |
| | 14.20 | | | | (4.29 | ) | | | 2,073,901 | | | | 1.11 | | | | 0.82 | | | | 1.49 | | | | 39 | |
| | 15.03 | | | | 0.16 | | | | 2,091,357 | | | | 1.11 | | | | 0.96 | (i) | | | 1.88 | | | | 42 | |
| | | | | | |
| | | | | | | | | | | | | | | | | | | | | | | | | | |
| | 14.38 | | | | 2.56 | | | | 208,221 | | | | 1.30 | | | | 1.13 | | | | 2.26 | | | | 72 | |
| | 14.12 | | | | 5.31 | | | | 156,168 | | | | 0.90 | | | | 1.55 | | | | 2.17 | | | | 95 | |
| | 13.64 | | | | (8.51 | ) | | | 159,377 | | | | 0.86 | | | | 1.09 | (i) | | | 1.55 | | | | 91 | |
| | 15.12 | | | | 7.60 | | | | 50,821 | | | | 0.86 | | | | 1.25 | (i) | | | 1.34 | | | | 59 | |
| | 14.24 | | | | (4.03 | ) | | | 1,309,391 | | | | 0.86 | | | | 1.06 | | | | 1.24 | | | | 39 | |
| | 15.06 | | | | 0.45 | | | | 1,329,140 | | | | 0.86 | | | | 1.23 | (i) | | | 1.47 | | | | 42 | |
| | | | | | |
| | | | | | | | | | | | | | | | | | | | | | | | | | |
| | 14.42 | | | | 2.88 | | | | 63,432,785 | | | | 0.65 | | | | 1.80 | | | | 1.52 | | | | 72 | |
| | 14.16 | | | | 5.95 | | | | 52,281,460 | | | | 0.31 | | | | 2.12 | | | | 1.02 | | | | 95 | |
| | 13.68 | | | | (7.97 | ) | | | 33,033,858 | | | | 0.26 | | | | 2.01 | (i) | | | 0.74 | | | | 91 | |
| | 15.15 | | | | 8.24 | | | | 42,715,599 | | | | 0.26 | | | | 1.74 | (i) | | | 0.66 | | | | 59 | |
| | 14.31 | | | | (3.44 | ) | | | 70,551,417 | | | | 0.26 | | | | 1.73 | | | | 0.54 | | | | 39 | |
| | 15.11 | | | | 1.08 | | | | 42,521,881 | | | | 0.26 | | | | 1.26 | (i) | | | 0.64 | | | | 42 | |
| | | | | | |
| | | | | | | | | | | | | | | | | | | | | | | | | | |
| | 14.40 | | | | 2.83 | | | | 16,278,355 | | | | 0.75 | | | | 1.70 | | | | 1.64 | | | | 72 | |
| | 14.14 | | | | 5.84 | | | | 14,726,044 | | | | 0.39 | | | | 2.04 | | | | 1.09 | | | | 95 | |
| | 13.66 | | | | (8.06 | ) | | | 14,180,339 | | | | 0.36 | | | | 1.80 | (i) | | | 0.94 | | | | 91 | |
| | 15.13 | | | | 8.16 | | | | 19,224,967 | | | | 0.36 | | | | 1.75 | (i) | | | 0.90 | | | | 59 | |
| | 14.29 | | | | (3.58 | ) | | | 17,911,308 | | | | 0.36 | | | | 1.59 | | | | 0.74 | | | | 39 | |
| | 15.10 | | | | 0.95 | | | | 12,897,374 | | | | 0.36 | | | | 1.86 | (i) | | | 1.00 | | | | 42 | |
SEE NOTES TO CONSOLIDATED FINANCIAL STATEMENTS.
| | | | | | | | |
| | | |
| FEBRUARY 28, 2017 | | J.P. MORGAN FUNDS | | | | | 35 | |
NOTES TO CONSOLIDATED FINANCIAL STATEMENTS
AS OF FEBRUARY 28, 2017 (Unaudited)
1. Organization
JPMorgan Trust I (the “Trust”) was formed on November 12, 2004, as a Delaware statutory trust, pursuant to a Declaration of Trust dated November 5, 2004 and is registered under the Investment Company Act of 1940, as amended (the “1940 Act”), as an open-end management investment company.
The following is a separate fund of the Trust (the “Fund”) covered by this report:
| | | | |
| | | Classes Offered | | Diversified/Non-Diversified |
| Diversified Real Return Fund | | Class A, Class C, Class R2, Class R5 and Class I^ | | Diversified |
| ^ | Effective April 3, 2017, Select Class was renamed Class I. |
The investment objective of the Fund is to seek to maximize long-term real return.
Class A Shares generally provide for a front-end sales charge while Class C Shares provide for a contingent deferred sales charge (“CDSC”). No sales charges are assessed with respect to Class R2, Class R5 and Class I Shares. All classes of shares have equal rights as to earnings, assets and voting privileges, except that each class may bear different transfer agency, sub-transfer agency, distribution and shareholder servicing fees and each class has exclusive voting rights with respect to its distribution plan and shareholder servicing agreements. Certain Class A Shares, for which front-end sales charges have been waived, may be subject to a CDSC as described in the Fund’s prospectus.
J.P. Morgan Investment Management Inc. (“JPMIM”) an indirect, wholly-owned subsidiary of JPMorgan Chase & Co. (“JPMorgan”) acts as Adviser (the “Adviser”) and Administrator (the “Administrator”) to the Fund.
Basis for Consolidation for the Fund
Diversified Real Return Fund CS Ltd. (the “Subsidiary”), a Cayman Islands exempted company, was incorporated on August 8, 2016 and became a wholly-owned subsidiary of the Fund effective September 30, 2016. The Subsidiary acts as an investment vehicle for the Fund in order to effect certain investments on behalf of the Fund consistent with the Fund’s investment objective and policies as described in the Fund’s prospectus. As of February 28, 2017, net assets of the Fund were $83,527,075 of which $8,163,406, or approximately 9.8%, represented the Subsidiary’s net assets. Net realized gains in the Subsidiary amounted to $255,400. The Consolidated Schedule of Portfolio Investments (“CSOI”) includes positions of the Fund and the Subsidiary. The consolidated financial statements include the accounts of the Fund and the Subsidiary. Subsequent references to the Fund within the Notes to Consolidated Financial Statements collectively refer to the Fund and the Subsidiary. All significant intercompany balances and transactions have been eliminated in consolidation.
2. Significant Accounting Policies
The following is a summary of significant accounting policies followed by the Fund in the preparation of its consolidated financial statements. The Fund is an investment company and, accordingly, follows the investment company accounting and reporting guidance of the Financial Accounting Standards Board Accounting Standards Codification Topic 946 — Investment Companies, which is part of U.S. generally accepted accounting principles (“GAAP”). The preparation of financial statements in conformity with GAAP requires management to make estimates and assumptions that affect the reported amounts of assets and liabilities and disclosure of contingent assets and liabilities at the date of the financial statements and the reported amounts of increases and decreases in net assets from operations during the reporting period. Actual results could differ from those estimates.
A. Valuation of Investments — The valuation of investments is in accordance with GAAP and the Fund’s valuation policies set forth by and under the supervision and responsibility of the Board of Trustees (the “Board”), which established the following approach to valuation, as described more fully below: (i) investments for which market quotations are readily available shall be valued at such unadjusted quoted prices and (ii) all other investments for which market quotations are not readily available shall be valued at their fair value as determined in good faith by the Board.
The Administrator has established the J.P. Morgan Investment Management Americas Valuation Committee (“AVC”) to assist the Board with the oversight and monitoring of the valuation of the Fund’s investments. The Administrator implements the valuation policies of the Fund’s investments, as directed by the Board. The AVC oversees and carries out the policies for the valuation of investments held in the Fund. This includes monitoring the appropriateness of fair values based on results of ongoing valuation oversight, including but not limited to consideration of macro or security specific events, market events and pricing vendor and broker due diligence. The Administrator is responsible for discussing and assessing the potential impacts to the fair values on an ongoing basis, and at least on a quarterly basis with the AVC and the Board.
Equities and other exchange-traded instruments are valued at the last sale price or official market closing price on the primary exchange on which the instrument is traded before the net asset values (“NAV”) of the Fund are calculated on a valuation date. Certain foreign equity instruments are valued by applying international fair value factors provided by approved affiliated and unaffiliated pricing vendors or third party broker-dealers (collectively referred to as “Pricing Services”). The factors seek to adjust the local closing price for movements of local markets post closing, but prior to the time the NAVs are calculated. Investments in open-end investment companies, excluding exchange-traded funds (“ETFs”) (the “Underlying Funds”), are valued at each Underlying Fund’s NAV per share as of the report date.
Fixed income instruments are valued based on prices received from approved Pricing Services. The Pricing Services use multiple valuation techniques to determine the valuation of fixed income instruments. In instances where sufficient market activity exists, the Pricing Services may utilize a market-based approach through which trades or quotes from market makers are used to determine the valuation of these instruments. In instances
| | | | | | |
| | | |
| 36 | | | | J.P. MORGAN FUNDS | | FEBRUARY 28, 2017 |
where sufficient market activity may not exist, the Pricing Services also utilize proprietary valuation models which may consider market transactions in comparable securities and the various relationships between securities in determining fair value and/or market characteristics in order to estimate the relevant cash flows, which are then discounted to calculate the fair values.
Futures are generally valued on the basis of available market quotations. Forward foreign currency exchange contracts are valued utilizing market quotations from approved Pricing Services.
Valuations reflected in this report are as of the report date. As a result, changes in valuation due to market events and/or issuer related events after the report date and prior to issuance of the report are not reflected herein.
The various inputs that are used in determining the valuation of the Fund’s investments are summarized into the three broad levels listed below.
| • | | Level 1 — Unadjusted inputs using quoted prices in active markets for identical investments. |
| • | | Level 2 — Other significant observable inputs including, but not limited to, quoted prices for similar investments, inputs other than quoted prices that are observable for investments (such as interest rates, prepayment speeds, credit risk, etc.) or other market corroborated inputs. |
| • | | Level 3 — Significant inputs based on the best information available in the circumstances, to the extent observable inputs are not available (including the Fund’s assumptions in determining the fair value of investments). |
A financial instrument’s level within the fair value hierarchy is based on the lowest level of any input, both individually and in the aggregate, that is significant to the fair value measurement. The inputs or methodology used for valuing instruments are not necessarily an indication of the risk associated with investing in those instruments.
The following table represents each valuation input as presented on the Consolidated Schedule of Portfolio Investments (“CSOI”):
| | | | | | | | | | | | | | | | |
| | | Level 1
Quoted prices | | | Level 2
Other significant observable inputs | | | Level 3
Significant unobservable inputs | | | Total | |
Investments in Securities | | | | | | | | | | | | | | | | |
Common Stocks | | | | | | | | | | | | | | | | |
Consumer Discretionary | | $ | 1,382,352 | | | $ | 334,654 | | | $ | — | | | $ | 1,717,006 | |
Consumer Staples | | | 570,256 | | | | 350,156 | | | | — | | | | 920,412 | |
Energy | | | 2,270,762 | | | | 1,252,863 | | | | — | | | | 3,523,625 | |
Financials | | | 1,671,567 | | | | 527,184 | | | | — | | | | 2,198,751 | |
Health Care | | | 961,315 | | | | 270,591 | | | | — | | | | 1,231,906 | |
Industrials | | | 1,126,044 | | | | 1,700,555 | | | | — | | | | 2,826,599 | |
Information Technology | | | 1,861,718 | | | | 196,216 | | | | — | | | | 2,057,934 | |
Materials | | | 2,274,144 | | | | 2,413,694 | | | | — | | | | 4,687,838 | |
Real Estate | | | 5,967,014 | | | | 158,987 | | | | — | | | | 6,126,001 | |
Telecommunication Services | | | 50,656 | | | | 108,029 | | | | — | | | | 158,685 | |
Utilities | | | 1,356,143 | | | | 548,042 | | | | — | | | | 1,904,185 | |
| | | | | | | | | | | | | | | | |
Total Common Stocks | | | 19,491,971 | | | | 7,860,971 | | | | — | | | | 27,352,942 | |
| | | | | | | | | | | | | | | | |
Preferred Stock | | | | | | | | | | | | | | | | |
Consumer Staples | | | — | | | | 33,856 | | | | — | | | | 33,856 | |
Debt Securities | | | | | | | | | | | | | | | | |
Asset-Backed Securities | | | — | | | | 2,076,956 | | | | — | | | | 2,076,956 | |
Collateralized Mortgage Obligations | | | — | | | | 1,821,374 | | | | — | | | | 1,821,374 | |
Corporate Bonds | | | | | | | | | | | | | | | | |
Consumer Discretionary | | | — | | | | 2,774,207 | | | | — | | | | 2,774,207 | |
Consumer Staples | | | — | | | | 1,386,364 | | | | — | | | | 1,386,364 | |
Energy | | | — | | | | 2,407,332 | | | | — | | | | 2,407,332 | |
Financials | | | — | | | | 6,939,815 | | | | — | | | | 6,939,815 | |
Health Care | | | — | | | | 1,939,355 | | | | — | | | | 1,939,355 | |
Industrials | | | — | | | | 1,894,593 | | | | — | | | | 1,894,593 | |
Information Technology | | | — | | | | 1,668,375 | | | | — | | | | 1,668,375 | |
Materials | | | — | | | | 1,517,318 | | | | — | | | | 1,517,318 | |
Real Estate | | | — | | | | 260,257 | | | | — | | | | 260,257 | |
Telecommunication Services | | | — | | | | 1,829,966 | | | | — | | | | 1,829,966 | |
Utilities | | | — | | | | 1,417,190 | | | | — | | | | 1,417,190 | |
| | | | | | | | | | | | | | | | |
Total Corporate Bonds | | | — | | | | 24,034,772 | | | | — | | | | 24,034,772 | |
| | | | | | | | | | | | | | | | |
| | | | | | | | |
| | | |
| FEBRUARY 28, 2017 | | J.P. MORGAN FUNDS | | | | | 37 | |
NOTES TO CONSOLIDATED FINANCIAL STATEMENTS
AS OF FEBRUARY 28, 2017 (Unaudited) (continued)
| | | | | | | | | | | | | | | | |
| | | Level 1
Quoted prices | | | Level 2
Other significant observable inputs | | | Level 3
Significant unobservable inputs | | | Total | |
U.S. Treasury Obligations | | $ | — | | | $ | 5,920,090 | | | $ | — | | | $ | 5,920,090 | |
Exchange-Traded Funds | | | 5,502,406 | | | | — | | | | — | | | | 5,502,406 | |
Investment Companies | | | 6,157,807 | | | | — | | | | — | | | | 6,157,807 | |
Rights | | | | | | | | | | | | | | | | |
Consumer Discretionary | | | — | | | | — | | | | — | (a) | | | — | (a) |
Short-Term Investments | | | | | | | | | | | | | | | | |
Investment Companies | | | 7,659,692 | | | | — | | | | — | | | | 7,659,692 | |
U.S. Treasury Obligations | | | — | | | | 54,976 | | | | — | | | | 54,976 | |
| | | | | | | | | | | | | | | | |
Total Short-Term Investments | | | 7,659,692 | | | | 54,976 | | | | — | | | | 7,714,668 | |
| | | | | | | | | | | | | | | | |
Total Investments in Securities | | $ | 38,811,876 | | | $ | 41,802,995 | | | $ | — | (a) | | $ | 80,614,871 | |
| | | | | | | | | | | | | | | | |
Appreciation in Other Financial Instruments | | | | | | | | | | | | | | | | |
Forward Foreign Currency Exchange Contracts | | $ | — | | | $ | 3,543 | | | $ | — | | | $ | 3,543 | |
Futures Contracts | | | 330,529 | | | | — | | | | — | | | | 330,529 | |
Swaps | | | — | | | | 194,886 | | | | — | | | | 194,886 | |
| | | | | | | | | | | | | | | | |
Total Appreciation in Other Financial Instruments | | $ | 330,529 | | | $ | 198,429 | | | $ | — | | | $ | 528,958 | |
| | | | | | | | | | | | | | | | |
Depreciation in Other Financial Instruments | | | | | | | | | | | | | | | | |
Forward Foreign Currency Exchange Contracts | | $ | — | | | $ | (2,903 | ) | | $ | — | | | $ | (2,903 | ) |
Futures Contracts | | | (312,324 | ) | | | — | | | | — | | | | (312,324 | ) |
Swaps | | | — | | | | (6,930 | ) | | | — | | | | (6,930 | ) |
| | | | | | | | | | | | | | | | |
Total Depreciation in Other Financial Instruments | | $ | (312,324 | ) | | $ | (9,833 | ) | | $ | — | | | $ | (322,157 | ) |
| | | | | | | | | | | | | | | | |
There were no significant transfers between level 1 and level 2 during the six months ended February 28, 2017.
B. Investment Transactions with Affiliates — The Fund invested in Underlying Funds which are advised by the Adviser, or its affiliates. An issuer which is under common control with the Fund may be considered an affiliate. For the purposes of the financial statements, the Fund assumes the issuers listed in the table below to be affiliated issuers. Underlying Funds’ distributions may be reinvested into the Underlying Funds. Reinvestment amounts are included in the purchase cost amounts in the table below. Included in the purchases and sales amounts in the table below are exchanges between certain share classes of the Underlying Funds. Such exchanges are not treated as purchases and sales for the purpose of recognizing realized gains (losses) or portfolio turnover. Included in the realized gain (loss) amounts in the table below are distributions of realized capital gains, if any, received from the Underlying Funds.
| | | | | | | | | | | | | | | | | | | | | | | | | | | | |
| | | | | | For the six months ended February 28, 2017 | | | | | | | |
| Affiliate | | Value at
August 31,
2016 | | | Purchase Cost | | | Sales Proceeds | | | Realized
Gain (Loss) | | | Dividend
Income | | | Shares at
February 28,
2017 | | | Value at
February 28,
2017 | |
JPMorgan Commodities Strategy Fund, Class R6 Shares | | $ | 6,556,770 | | | $ | 492,096 | | | $ | 7,267,682 | | | $ | (877,229 | ) | | $ | — | | | | — | | | $ | — | |
JPMorgan Emerging Markets Debt Fund, Class R6 Shares | | | — | | | | 1,417,153 | | | | 1,351,976 | | | | (65,177 | ) | | | 12,308 | | | | — | | | | — | |
JPMorgan Floating Rate Income Fund, Class R6 Shares | | | 6,204,513 | | | | 668,717 | | | | 2,413,573 | | | | (114,986 | ) | | | 96,851 | | | | 476,057 | | | | 4,513,017 | |
JPMorgan Inflation Managed Bond Fund, Class R6 Shares | | | 8,035,975 | | | | 22,876 | | | | 8,096,920 | | | | 80,921 | | | | 22,876 | | | | — | | | | — | |
JPMorgan Opportunistic Equity Long/Short Fund, Class R6 Shares | | | 1,727,112 | | | | 225,389 | | | | 325,742 | | | | (8,253 | ) | | | — | | | | 91,428 | | | | 1,644,790 | |
JPMorgan Prime Money Market Fund, Institutional Class Shares | | | 1,235,514 | | | | 1,193,119 | | | | 2,428,633 | | | | — | | | | 222 | | | | — | | | | — | |
JPMorgan U.S. Government Money Market Fund, Capital Shares | | | — | | | | 5,765,947 | | | | — | | | | — | | | | 8,043 | | | | 5,765,947 | | | | 5,765,947 | |
JPMorgan U.S. Government Money Market Fund, Institutional Class Shares | | | — | | | | 44,355,437 | | | | 42,461,692 | | | | — | | | | 3,912 | | | | 1,893,745 | | | | 1,893,745 | |
| | | | | | | | | | | | | | | | | | | | | | | | | | | | |
Total | | $ | 23,759,884 | | | | | | | | | | | $ | (984,724 | ) | | $ | 144,212 | | | | | | | $ | 13,817,499 | |
| | | | | | | | | | | | | | | | | | | | | | | | | | | | |
| | | | | | |
| | | |
| 38 | | | | J.P. MORGAN FUNDS | | FEBRUARY 28, 2017 |
C. Restricted Securities — Certain securities held by the Fund may be subject to legal or contractual restrictions on resale. Restricted securities generally are resold in transactions exempt from registration under the Securities Act of 1933 (the “Securities Act”). Disposal of these securities may involve time-consuming negotiations and expense. Prompt sale at the current valuation may be difficult and could adversely affect the net assets of the Fund.
As of February 28, 2017, the Fund had no investments in restricted securities other than securities sold to the Fund under Rule 144A and/or Regulation S under the Securities Act.
D. When Issued, Delayed Delivery Securities and Forward Commitments —The Fund purchased when issued securities, including To Be Announced (“TBA”) securities, and enter into contracts to purchase or sell securities for a fixed price that may be settled a month or more after the trade date, or purchase delayed delivery securities which generally settle seven days after the trade date. When issued securities are securities that have been authorized, but not issued in the market. A forward commitment involves entering into a contract to purchase or sell securities for a fixed price at a future date that may be settled a month or more after the trade date. A delayed delivery security is agreed upon in advance between the buyer and the seller of the security and is generally delivered beyond seven days of the agreed upon date. The purchase of securities on a when issued, delayed delivery, or forward commitment basis involves the risk that the value of the security to be purchased declines before the settlement date. The sale of securities on a forward commitment basis involves the risk that the value of the securities sold may increase before the settlement date. The Fund may be exposed to credit risk if the counterparty fails to perform under the terms of the transaction. Interest income for securities purchased on a when issued, delayed delivery, or forward commitment basis is not accrued until the settlement date.
The Fund had delayed delivery securities outstanding as of February 28, 2017, which are shown as a Payable for investment securities purchased-delayed delivery securities on the Consolidated Statement of Assets and Liabilities (“CSAL”). The values of these securities held at February 28, 2017 are detailed on the CSOI.
E. Derivatives — The Fund used instruments including futures, forward foreign currency exchange contracts and swaps in connection with its investment strategy. Derivative instruments may be used as substitutes for securities in which the Fund can invest, to hedge portfolio investments or to generate income or gain to the Fund. Derivatives may also be used to manage duration, sector and yield curve exposures and credit and spread volatility.
The Fund may be subject to various risks from the use of derivatives including the risk that changes in the value of a derivative may not correlate perfectly with the underlying asset, rate or index; counterparty credit risk related to derivatives counterparties’ failure to perform under contract terms; liquidity risk related to the lack of a liquid market for these contracts allowing the Fund to close out its position(s); and, documentation risk relating to disagreement over contract terms. Investing in certain derivatives also results in a form of leverage and as such, the Fund’s risk of loss associated with these instruments may exceed its value, as recorded on the CSAL
The Fund is party to various derivative contracts governed by International Swaps and Derivatives Association master agreements (“ISDA agreements”). The Fund’s ISDA agreements, which are separately negotiated with each dealer counterparty, may contain provisions allowing, absent other considerations, a counterparty to exercise rights, to the extent not otherwise waived, against the Fund in the event the Fund’s net assets decline over time by a pre-determined percentage or fall below a pre-determined floor. The ISDA agreements may also contain provisions allowing, absent other conditions, the Fund to exercise rights, to the extent not otherwise waived, against the counterparty (i.e., decline in a counterparty’s credit rating below a specified level). Such rights for both the counterparty and Fund often include the ability to terminate (i.e., close out) open contracts at prices which may favor the counterparty, which could have an adverse effect on the Fund. The ISDA agreements give the Fund and counterparty the right, upon an event of default, to close out all transactions traded under such agreements and to net amounts owed or due across all transactions and offset such net payable or receivable with collateral posted to a segregated account by one party to the other.
Counterparty credit risk may be mitigated to the extent a counterparty posts collateral for mark to market gains to the Fund.
Notes F(1) – F(3) below describe the various derivatives used by the Fund.
(1). Futures Contracts — The Fund used index, treasury or other financial futures contracts to manage and hedge equity price and interest rate risk associated with portfolio investments and to seek to enhance portfolio performance.
Futures contracts provide for the delayed delivery of the underlying instrument at a fixed price or are settled for a cash amount based on the change in the value of the underlying instrument at a specific date in the future. Upon entering into a futures contract, the Fund is required to deposit with the broker, cash or securities in an amount equal to a certain percentage of the contract amount, which is referred to as the initial margin deposit. Subsequent payments, referred to as variation margin, are made or received by the Fund periodically and are based on changes in the market value of open futures contracts. Changes in the market value of open futures contracts are recorded as Change in net unrealized appreciation/depreciation on the Consolidated Statement of Operations (“CSOP”). Realized gains or losses, representing the difference between the value of the contract at the time it was opened and the value at the time it was closed, are reported on the CSOP at the closing or expiration of the futures contract. Securities deposited as initial margin are designated on the CSOI and cash deposited is recorded on the CSAL. A receivable from and/or a payable to brokers for the daily variation margin is also recorded on the CSAL.
The use of futures contracts exposes the Fund to equity price and interest rate risk. The Fund may be subject to the risk that the change in the value of the futures contract may not correlate perfectly with the underlying instrument. Use of long futures contracts subjects the Fund to risk of loss in excess of the amounts shown on the CSAL, up to the notional amount of the futures contracts. Use of short futures contracts subjects the Fund to
| | | | | | | | |
| | | |
| FEBRUARY 28, 2017 | | J.P. MORGAN FUNDS | | | | | 39 | |
NOTES TO CONSOLIDATED FINANCIAL STATEMENTS
AS OF FEBRUARY 28, 2017 (Unaudited) (continued)
unlimited risk of loss. The Fund may enter into futures contracts only on exchanges or boards of trade. The exchange or board of trade acts as the counterparty to each futures transaction; therefore, the Fund’s credit risk is limited to failure of the exchange or board of trade. Under some circumstances, futures exchanges may establish daily limits on the amount that the price of a futures contract can vary from the previous day’s settlement price, which could effectively prevent liquidation of positions.
The Fund’s futures contracts are not subject to master netting arrangements (the right to close out all transactions traded with a counterparty and net amounts owed or due across transactions).
(2). Forward Foreign Currency Exchange Contracts — The Fund may be exposed to foreign currency risks associated with some or all of the portfolio investments and used forward foreign currency exchange contracts to hedge or manage certain of these exposures as part of an investment strategy. The Fund also bought forward foreign currency exchange contracts to gain exposure to currencies. Forward foreign currency exchange contracts represent obligations to purchase or sell foreign currency on a specified future date at a price fixed at the time the contracts are entered into. Non-deliverable forward foreign currency exchange contracts are settled with the counterparty in U.S. dollar without the delivery of foreign currency.
The values of the forward foreign currency exchange contracts are adjusted daily based on the applicable exchange rate of the underlying currency. Changes in the value of these contracts are recorded as unrealized appreciation or depreciation until the contract settlement date. When the forward foreign currency exchange contract is closed, the Fund records a realized gain or loss equal to the difference between the value at the time the contract was opened and the value at the time it was closed. The Fund also records a realized gain or loss when a forward foreign currency exchange contract offsets another forward foreign currency exchange contract with the same counterparty upon settlement.
The Fund’s forward foreign currency exchange contracts are subject to master netting arrangements (the right to close out all transactions with a counterparty and net amounts owed or due across transactions). As of February 28, 2017, the Fund did not receive or post collateral for forward foreign currency exchange contracts.
(3). Swaps —The Fund engaged in various swap transactions, including interest rate swaps, to manage interest rate (e.g., duration, yield curve), and inflation risks within its portfolio. The Fund also used swaps as alternatives to direct investments. Swap transactions are negotiated contracts over the counter (“OTC swaps”) between the Fund and a counterparty or centrally cleared (“centrally cleared swaps”) with a central clearinghouse through a Futures Commission Merchant (“FCM”), to exchange investment cash flows, assets, foreign currencies or market-linked returns at specified, future intervals.
Upfront payments made and/or received are recorded as assets or liabilities, respectively on the Statement of Assets and Liabilities and amortized over the term of the swap. The value of an OTC swap agreement is recorded as either an asset or a liability on CSAL at the beginning of the measurement period. Upon entering into a centrally cleared swap, the Fund is required to deposit with the FCM cash or securities, which is referred to as initial margin deposit. Securities deposited as initial margin are designated on the CSOI and cash deposited is recorded on the CSAL. Daily changes in valuation of centrally cleared swaps, if any, are recorded as a variation margin receivable or payable on the CSAL. The change in the value of swaps, including accruals of periodic amounts of interest to be paid or received on swaps, is reported as change in net unrealized appreciation/depreciation on the CSOP. A realized gain or loss is recorded upon payment or receipt of a periodic payment or payment made upon termination of a swap agreement.
The Fund may be required to post or receive collateral based on the net value of the Fund’s outstanding OTC swap contracts with the counterparty in the form of cash or securities. Daily movement of collateral is subject to minimum threshold amounts. Collateral posted by the Fund is held in a segregated account at the Fund’s custodian bank. Cash collateral posted by the Fund is invested in an affiliated money market fund (See Note 3.G.) and is reported on the CSAL as Investments in affiliates — restricted. Collateral received by the Fund is held in escrow in segregated accounts maintained by JPMorgan Chase Bank, N.A. (“JPMCB”), an affiliate of the Fund, which provides collateral management services to the Fund (See Note 3.F.).
At February 28, 2017, the Fund did not post or receive collateral for OTC swap contracts.
The central clearing house acts as the counterparty to each centrally cleared swap transaction, therefore credit risk is limited to the failure of the clearinghouse.
The Fund’s swap contracts (excluding centrally cleared swaps) are subject to master netting arrangements.
Inflation-Linked Swaps
The Fund used inflation-linked swaps to provide inflation protection within its portfolio. The use of swaps exposes the Fund to interest rate risk.
| | | | | | |
| | | |
| 40 | | | | J.P. MORGAN FUNDS | | FEBRUARY 28, 2017 |
(4). Summary of Derivative Information — The following table presents the value of derivatives held as of February 28, 2017, by their primary underlying risk exposure and respective location on the CSAL:
| | | | | | | | | | | | | | | | | | |
| Derivative Contracts | | CSAL Location | | | | | | | | | | | | |
| Gross Assets: | | | | Futures
Contracts (a) | | | Forward Foreign
Currency Exchange
Contracts | | | OTC
Swaps | | | Total | |
Interest rate contracts | | Receivables, Net Assets — Unrealized Appreciation | | $ | 7,559 | | | $ | — | | | $ | 194,886 | | | $ | 202,445 | |
Equity contracts | | Receivables, Net Assets — Unrealized Appreciation | | | 13,212 | | | | — | | | | — | | | | 13,212 | |
Foreign exchange contracts | | Receivables | | | — | | | | 3,543 | | | | — | | | | 3,543 | |
Commodities contracts | | Receivables, Net Assets — Unrealized Appreciation | | | 309,758 | | | | — | | | | — | | | | 309,758 | |
| | | | | | | | | | | | | | | | | | |
Total | | | | $ | 330,529 | | | $ | 3,543 | | | $ | 194,886 | | | $ | 528,958 | |
| | | | | | | | | | | | | | | | | | |
| Gross Liabilities: | | | | | | | | | | | | | | |
Interest rate contracts | | Payables, Net Assets — Unrealized Depreciation | | $ | (13,501 | ) | | $ | — | | | $ | (6,930 | ) | | $ | (20,431 | ) |
Equity contracts | | Payables, Net Assets — Unrealized Depreciation | | | (19,820 | ) | | | — | | | | — | | | | (19,820 | ) |
Foreign exchange contracts | | Payables | | | — | | | | (2,903 | ) | | | — | | | | (2,903 | ) |
Commodities contracts | | Payables, Net Assets — Unrealized Depreciation | | | (279,003 | ) | | | — | | | | — | | | | (279,003 | ) |
| | | | | | | | | | | | | | | | | | |
Total | | | | $ | (312,324 | ) | | $ | (2,903 | ) | | $ | (6,930 | ) | | $ | (322,157 | ) |
| | | | | | | | | | | | | | | | | | |
| (a) | This amount represents the cumulative appreciation (depreciation) of futures contracts as reported on the CSOI. The CSAL only reflects the current day variation margin receivable/payable from/to brokers. |
The following tables present the effect of derivatives on the CSOP for the six months ended February 28, 2017, by primary underlying risk exposure:
| | | | | | | | | | | | | | | | |
| Amount of Realized Gain (Loss) on Derivatives Recognized on the CSOP | |
| Derviative Contracts | | Futures
Contracts | | | Forward Foreign
Currency Exchange
Contracts | | | OTC
Swaps | | | Total | |
Interest rate contracts | | $ | (96,351) | | | $ | — | | | $ | — | | | $ | (96,351 | ) |
Equity contracts | | | (144,252 | ) | | | — | | | | — | | | | (144,252 | ) |
Foreign exchange contracts | | | — | | | | 16,387 | | | | — | | | | 16,387 | |
Commodities contracts | | | 388,121 | | | | — | | | | (132,721 | ) | | | 255,400 | |
| | | | | | | | | | | | | | | | |
Total | | $ | 147,518 | | | $ | 16,387 | | | $ | (132,721 | ) | | $ | 31,184 | |
| | | | | | | | | | | | | | | | |
|
| Amount of Change in Unrealized Appreciation (Depreciation) on Derivatives Recognized on the CSOP | |
| Derviative Contracts | | Futures
Contracts | | | Forward Foreign
Currency Exchange
Contracts | | | OTC
Swaps | | | Total | |
Interest rate contracts | | $ | 1,579 | | | $ | — | | | $ | 187,956 | | | $ | 189,535 | |
Equity contracts | | | 2,085 | | | | — | | | | — | | | | 2,085 | |
Foreign exchange contracts | | | — | | | | 2,811 | | | | — | | | | 2,811 | |
Commodities contracts | | | 30,755 | | | | — | | | | — | | | | 30,755 | |
| | | | | | | | | | | | | | | | |
Total | | $ | 34,419 | | | $ | 2,811 | | | $ | 187,956 | | | $ | 225,186 | |
| | | | | | | | | | | | | | | | |
| | | | | | | | |
| | | |
| FEBRUARY 28, 2017 | | J.P. MORGAN FUNDS | | | | | 41 | |
NOTES TO CONSOLIDATED FINANCIAL STATEMENTS
AS OF FEBRUARY 28, 2017 (Unaudited) (continued)
Derivatives Volume
The table below discloses the volume of the Fund’s futures contracts, forward foreign currency exchange contracts and swaps activity during the six months ended February 28, 2017. Please refer to the tables in the Summary of Derivatives Information for derivative-related gains and losses associated with volume activity.
| | | | |
Futures Contracts: | | | | |
Commodity | | | | |
Average Notional Balance Long | | $ | 12,778,497 | (a) |
Average Notional Balance Short | | | 4,921,728 | (a) |
Ending Notional Balance Long | | | 17,210,550 | |
Ending Notional Balance Short | | | 8,685,556 | |
Equity | | | | |
Average Notional Balance Long | | | 1,119,873 | (b) |
Average Notional Balance Short | | | 1,545,388 | |
Ending Notional Balance Long | | | 1,436,020 | |
Ending Notional Balance Short | | | 498,105 | |
Interest | | | | |
Average Notional Balance Long | | | 3,635,921 | |
Average Notional Balance Short | | | 6,205,734 | (c) |
Ending Notional Balance Long | | | 4,238,937 | |
Ending Notional Balance Short | | | 4,955,703 | |
Forward Foreign Currency Exchange Contracts: | | | | |
Average Settlement Value Purchased | | | 1,515,431 | |
Average Settlement Value Sold | | | 1,484,943 | |
Ending Settlement Value Purchased | | | 467,030 | |
Ending Settlement Value Sold | | | 442,694 | |
Interest Rate-Related SWAPs | | | | |
Average Notional Balance—Pays Fixed rate | | | 15,850,000 | (c) |
Ending Notional Balance—Pays Fixed Rate | | | 20,500,000 | |
| (a) | For the period November 1, 2016 through February 28, 2017. |
| (b) | For the period September 1, 2016 through February 28, 2017. |
| (c) | For the period October 1, 2016 through February 28, 2017. |
The Fund’s derivatives contracts held at February 28, 2017 are not accounted for as hedging instruments under GAAP.
F. Foreign Currency Translation — The books and records of the Fund are maintained in U.S. dollars. Foreign currency amounts are translated into U.S. dollars at the prevailing exchange rates of such currencies against the U.S. dollar. The market value of investment securities and other assets and liabilities are translated at the exchange rate as of the valuation date. Purchases and sales of investment securities, income and expenses are translated at the exchange rate prevailing on the respective dates of such transactions.
The Fund does not isolate the effect of changes in foreign exchange rates from changes in market prices on securities held. Accordingly, such changes are included within Change in net unrealized appreciation/depreciation on investments on the CSOP.
Reported realized foreign currency gains and losses arise from the disposition of foreign currency, currency gains or losses realized between the trade and settlement dates on securities transactions, and the difference between the amounts of dividends, interest and foreign withholding taxes recorded on the Fund’s books on the transaction date and the U.S. dollar equivalent of the amounts actually received or paid. These reported realized foreign currency gains and losses are included in Net realized gain (loss) on foreign currency transactions on the CSOP. Unrealized foreign currency gains and losses arise from changes (due to changes in exchange rates) in the value of foreign currency and other assets and liabilities denominated in foreign currencies, which are held at period end and are included in Change in net unrealized appreciation/depreciation on foreign currency translations on the CSOP.
G. Security Transactions and Investment Income — Investment transactions are accounted for on the trade date (the date the order to buy or sell is executed). Securities gains and losses are calculated on a specifically identified cost basis. Interest income is determined on the basis of coupon interest accrued using the effective interest method which adjusts for amortization of premiums and accretion of discounts. Dividend income net of foreign taxes withheld, if any, and distributions of net investment income and realized capital gains from the Underlying Funds and ETFs, if any, are recorded on the ex-dividend date or when the Fund first learns of the dividend.
The Fund invests in treasury inflation protected securities (TIPS). The principal amount of TIPS is adjusted periodically and is increased for inflation or decreased for deflation based on a monthly published index. These adjustments are recorded as increases or decreases to interest income on the CSOP. Coupon payments are based on the adjusted principal at the time the interest is paid.
| | | | | | |
| | | |
| 42 | | | | J.P. MORGAN FUNDS | | FEBRUARY 28, 2017 |
H. Allocation of Income and Expenses — Expenses directly attributable to a fund are charged directly to that fund, while the expenses attributable to more than one fund of the Trust are allocated among the respective funds. In calculating the NAV of each class, investment income, realized and unrealized gains and losses and expenses, other than class specific expenses, are allocated daily to each class of shares based upon the proportion of net assets of each class at the beginning of each day.
Transfer agency and sub-transfer agency fees are class-specific expenses. The amount of the transfer agency and sub-transfer agency fees charged to each class of the Fund for the six months ended February 28, 2017 are as follows:
| | | | | | | | | | | | | | | | | | | | | | | | |
| | | Class A | | | Class C | | | Class R2 | | | Class R5 | | | Class I | | | Total | |
Transfer agency fees | | $ | 248 | | | $ | 95 | | | $ | 20 | | | $ | 295 | | | $ | 181 | | | $ | 839 | |
Sub-transfer agency fees | | | 2,740 | | | | 88 | | | | 73 | | | | 22,735 | | | | 114 | | | | 25,750 | |
The Fund invests in Underlying Funds and ETFs and, as a result, bears a portion of the expenses incurred by these Underlying Funds and ETFs. These expenses are not reflected in the expenses shown on the CSOP and are not included in the ratios to average net assets shown on the Consolidated Financial Highlights. Certain expenses of affiliated Underlying Funds are waived as described in Note 3.F.
I. Federal Income Taxes — The Fund is treated as a separate taxable entity for Federal income tax purposes. The Fund’s policy is to comply with the provisions of the Internal Revenue Code of 1986, as amended (the “Code”), applicable to regulated investment companies and to distribute to shareholders all of its distributable net investment income and net realized capital gains on investments. Accordingly, no provision for Federal income tax is necessary. Management has reviewed the Fund’s tax positions for all open tax years and has determined that as of February 28, 2017, no liability for income tax is required in the Fund’s consolidated financial statements for net unrecognized tax benefits. However, management’s conclusions may be subject to future review based on changes in, or the interpretation of, the accounting standards or tax laws and regulations. The Fund’s Federal tax returns for the prior three fiscal years remain subject to examination by the Internal Revenue Service.
J. Foreign Taxes — The Fund may be subject to foreign taxes on income, gains on investments or currency purchases/repatriation, a portion of which may be recoverable. The Fund will accrue such taxes and recoveries as applicable, based upon its current interpretation of tax rules and regulations that exist in the markets in which it invests.
K. Distributions to Shareholders — Distributions from net investment income are generally declared and paid quarterly and are declared separately for each class. No class has preferential dividend rights; differences in per share rates are due to differences in separate class expenses. Net realized capital gains, if any, are distributed by the Fund at least annually. The amount of distributions from net investment income and net realized capital gains is determined in accordance with Federal income tax regulations, which may differ from GAAP. To the extent these “book/tax” differences are permanent in nature (i.e., that they result from other than timing of recognition — “temporary differences”), such amounts are reclassified within the capital accounts based on their Federal tax-basis treatment.
3. Fees and Other Transactions with Affiliates
A. Investment Advisory Fee — Pursuant to an Investment Advisory Agreement, the Adviser supervises the investments of the Fund and for such services is paid a fee. The fee is accrued daily and paid monthly at an annual rate of 0.50% of the Fund’s average daily net assets.
The Adviser waived Investment Advisory fees and/or reimbursed expenses as outlined in Note 3.F.
B. Administration Fee — Pursuant to an Administration Agreement, the Administrator provides certain administration services to the Fund. In consideration of these services, the Administrator receives a fee accrued daily and paid monthly at an annual rate of 0.10% of the Fund’s average daily net assets on the first $500 million in Fund assets; 0.075% of the Fund’s average daily net assets between $500 million and $1 billion and 0.05% of the Fund’s average daily net assets in excess of $1 billion. For the six months ended February 28, 2017, the effective annualized rate was 0.11% of the Fund’s average daily net assets, notwithstanding any fee waivers and/or expense reimbursements.
The Administrator waived Administration fees as outlined in Note 3.F.
JPMorgan Chase Bank, N.A. (“JPMCB”), a wholly-owned subsidiary of JPMorgan, serves as the Fund’s sub-administrator (the “Sub-administrator”). For its services as Sub-administrator, JPMCB receives a portion of the fees payable to the Administrator.
C. Distribution Fees — Pursuant to a Distribution Agreement, JPMorgan Distribution Services, Inc. (“JPMDS”), a wholly-owned subsidiary of JPMorgan, serves as the Trust’s principal underwriter and promotes and arranges for the sale of the Fund’s shares.
The Board has adopted a Distribution Plan (the “Distribution Plan”) for Class A, Class C and Class R2 Shares of the Fund in accordance with Rule 12b-1 under the 1940 Act. The Class R5 and Class I Shares do not charge a distribution fee. The Distribution Plan provides that the Fund shall pay distribution fees, including payments to JPMDS, at annual rates of 0.25%, 0.75% and 0.50% of the average daily net assets of Class A, Class C and Class R2 Shares, respectively.
| | | | | | | | |
| | | |
| FEBRUARY 28, 2017 | | J.P. MORGAN FUNDS | | | | | 43 | |
NOTES TO CONSOLIDATED FINANCIAL STATEMENTS
AS OF FEBRUARY 28, 2017 (Unaudited) (continued)
In addition, JPMDS is entitled to receive the front-end sales charges from purchases of Class A Shares and the CDSC from redemptions of Class C Shares and certain Class A Shares for which front-end sales charges have been waived. For the six months ended February 28, 2017, JPMDS retained the following amounts:
| | | | | | | | |
| | | Front-End Sales Charge | | | CDSC | |
| | $ | 169 | | | $ | — | |
D. Shareholder Servicing Fees — The Trust, on behalf of the Fund, has entered into a Shareholder Servicing Agreement with JPMDS under which JPMDS provides certain support services to the shareholders. For performing these services, JPMDS receives a fee that is accrued daily and paid monthly equal to a percentage of the average daily net assets as shown in the table below:
| | | | | | | | | | | | | | | | | | |
| | | Class A | | Class C | | | Class R2 | | | Class R5 | | | Class I | |
| | 0.25% | | | 0.25 | % | | | 0.25 | % | | | 0.05 | % | | | 0.25 | % |
JPMDS has entered into shareholder services contracts with affiliated and unaffiliated financial intermediaries who provide shareholder services and other related services to their clients or customers who invest in the Fund under which JPMDS will pay all or a portion of such fees earned to financial intermediaries for performing such services.
JPMDS waived shareholder servicing fees as outlined in Note 3.F.
E. Custodian and Accounting Fees — JPMCB provides portfolio custody and accounting services to the Fund. For performing these services, the Fund pays JPMCB transaction and asset-based fees that vary according to the number of transactions and positions, plus out-of-pocket expenses. The amounts paid directly to JPMCB by the Fund for custody and accounting services are included in Custodian and accounting fees on the CSOP. Payments to the custodian may be reduced by credits earned by the Fund, based on uninvested cash balances held by the custodian. Such earnings credits, if any, are presented separately on the CSOP.
Interest income earned on cash balances at the custodian, if any, is included in Interest income from affiliates on the CSOP.
Interest expense paid to the custodian related to cash overdrafts, if any, is included in Interest expense to affiliates on the CSOP.
F. Collateral Management Fees — JPMCB provides derivatives collateral management services for the Fund. The amounts paid directly to JPMCB, if any, by the Fund for these services are included in Collateral management fees on the CSOP
G. Waivers and Reimbursements — The Adviser, Administrator and/or JPMDS have contractually agreed to waive fees and/or reimburse expenses to the extent that total annual operating expenses of the Fund, inclusive of the Subsidiary (excluding acquired fund fees and expenses other than certain money market fund fees as described below, dividend expenses related to short sales, interest expenses related to short sales (effective January 1, 2016), interest, taxes, expenses related to litigation and potential litigation and extraordinary expenses) exceed the percentages of the Fund’s respective average daily net assets as shown in the table below:
| | | | | | | | | | | | | | | | | | |
| | | Class A | | Class C | | | Class R2 | | | Class R5 | | | Class I | |
| | 1.00% | | | 1.50 | % | | | 1.30 | % | | | 0.65 | % | | | 0.75 | % |
The expense limitation agreement was in effect for the six months ended February 28, 2017 and is in place until at least January 31, 2019.
For the six months ended February 28, 2017, the Fund’s service providers waived fees and/or reimbursed expenses for the Fund as follows. None of these parties expect the Fund to repay any such waived fees and/or reimbursed expenses in future years.
| | | | | | | | | | | | | | | | | | | | |
| | | Contractual Waivers | | | | |
| | | Investment
Advisory | | | Administration | | | Shareholder
Servicing | | | Total | | | Contractual
Reimbursements | |
| | $ | 181,717 | | | $ | 36,526 | | | $ | 26,874 | | | $ | 245,117 | | | $ | 78,991 | |
Additionally, the Fund may invest in one or more money market funds advised by the Adviser or its affiliates (affiliated money market funds). The Adviser, Administrator and/or JPMDS, as shareholder servicing agent, have contractually agreed to waive fees and/or reimburse expenses in an amount sufficient to offset the respective net fees each collects from the affiliated money market fund on the Fund’s investment in such affiliated money market fund.
The amount of the waivers resulting from investments in these money market funds for the six months ended February 28, 2017 was $1,863.
The Underlying Funds may impose separate shareholder servicing fees. To avoid charging a shareholder servicing fee at an effective rate above 0.25% for Class A, Class C, Class R2 and Class I Shares and above 0.05% for Class R5 Shares, JPMDS may waive shareholder servicing fees with respect to the Fund in an amount equal to the weighted average pro-rata amount of shareholder servicing fees charged by the affiliated Underlying Funds. This waiver may be in addition to any waivers required to meet the Fund’s contractual expense limitations, but will not exceed the Fund’s shareholder servicing fees.
H. Other — Certain officers of the Trust are affiliated with the Adviser, the Administrator and JPMDS. Such officers, with the exception of the Chief Compliance Officer, receive no compensation from the Fund for serving in their respective roles.
| | | | | | |
| | | |
| 44 | | | | J.P. MORGAN FUNDS | | FEBRUARY 28, 2017 |
The Board appointed a Chief Compliance Officer to the Fund in accordance with Federal securities regulations. The Fund, along with other affiliated funds, makes reimbursement payments, on a pro-rata basis, to the Administrator for a portion of the fees associated with the Office of the Chief Compliance Officer. Such fees are included in Trustees’ and Chief Compliance Officer’s fees on the CSOP.
The Trust adopted a Trustee Deferred Compensation Plan (the “Plan”) which allows the Independent Trustees to defer the receipt of all or a portion of compensation related to performance of their duties as Trustees. The deferred fees are invested in various J.P. Morgan Funds until distribution in accordance with the Plan.
During the six months ended February 28, 2017, the Fund purchased securities from an underwriting syndicate in which the principal underwriter or members of the syndicate were affiliated with the Adviser.
The Fund may use related party broker-dealers. For the six months ended February 28, 2017, the Fund incurred approximately $5 in commissions with broker-dealers affiliated with the Adviser.
The Securities and Exchange Commission (“SEC”) has granted an exemptive order permitting the Fund to engage in principal transactions with J.P. Morgan Securities, Inc., an affiliated broker, involving taxable money market instruments, subject to certain conditions.
The SEC has granted an exemptive order permitting the Fund to invest in certain financial instruments in addition to Underlying Funds and securities.
4. Investment Transactions
During the six months ended February 28, 2017, purchases and sales of investments (excluding short-term investments) were as follows:
| | | | | | | | | | | | | | | | |
| | | Purchases
(excluding
U.S. Government) | | | Sales
(excluding
U.S. Government) | | | Purchases
of U.S.
Government | | | Sales
of U.S.
Government | |
| | $ | 58,216,723 | | | $ | 41,570,773 | | | $ | 4,049,904 | | | $ | 10,227,982 | |
5. Federal Income Tax Matters
For Federal income tax purposes, the estimated cost and unrealized appreciation (depreciation) in value of investment securities held at February 28, 2017 were as follows:
| | | | | | | | | | | | | | | | |
| | | Aggregate
Cost | | | Gross
Unrealized
Appreciation | | | Gross
Unrealized
Depreciation | | | Gross
Unrealized
(Depreciation) | |
| | $ | 78,993,489 | | | $ | 2,497,315 | | | $ | 875,933 | | | $ | 1,621,382 | |
At August 31, 2016, the Fund had net capital loss carryforwards as follows:
| | | | | | | | |
| | | Capital Loss Carryforward Character | |
| | | Short-Term | | | Long-Term | |
| | $ | 2,190,562 | | | $ | — | |
6. Borrowings
The Fund relies upon an exemptive order granted by the SEC (the “Order”) permitting the establishment and operation of an Interfund Lending Facility (the “Facility”). The Facility allows the Fund to directly lend and borrow money to or from any other fund relying upon the Order at rates beneficial to both the borrowing and lending funds. Advances under the Facility are taken primarily for temporary or emergency purposes, including the meeting of redemption requests that otherwise might require the untimely disposition of securities, and are subject to the Fund’s borrowing restrictions. The Interfund loan rate is determined, as specified in the Order, by averaging the current repurchase agreement rate and the current bank loan rate. The Order was granted to JPMorgan Trust II and may be relied upon by the Fund because the Fund and the series of JPMorgan Trust II are both investment companies in the same “group of investment companies” (as defined in Section 12(d)(1)(G) of the 1940 Act).
The Trust and JPMCB have entered into a financing arrangement. Under this arrangement, JPMCB provides an unsecured, uncommitted credit facility in the aggregate amount of $100 million to certain of the J.P. Morgan Funds, including the Fund. Advances under the arrangement are taken primarily for temporary or emergency purposes, including the meeting of redemption requests that otherwise might require the untimely disposition of securities, and are subject to the Fund’s borrowing restrictions. Interest on borrowings is payable at a rate determined by JPMCB at the time of borrowing. This agreement has been extended until November 6, 2017.
The Fund had no borrowings outstanding from another fund or from the unsecured, uncommitted credit facility during the six months ended February 28, 2017.
In addition, effective August 16, 2016, the Trust along with certain other trusts (“Borrowers”) entered into a joint syndicated senior unsecured revolving credit facility totaling $1.5 billion (“Credit Facility”) with various lenders and The Bank of New York Mellon, as administrative agent for the lenders. This Credit Facility provides a source of funds to the Borrowers for temporary and emergency purposes, including the meeting of redemption
| | | | | | | | |
| | | |
| FEBRUARY 28, 2017 | | J.P. MORGAN FUNDS | | | | | 45 | |
NOTES TO CONSOLIDATED FINANCIAL STATEMENTS
AS OF FEBRUARY 28, 2017 (Unaudited) (continued)
requests that otherwise might require the untimely disposition of securities. Under the terms of the Credit Facility, a borrowing fund must have a minimum of $25,000,000 in adjusted net asset value and not exceed certain adjusted net asset coverage ratios prior to and during the time in which any borrowings are outstanding. If a fund does not comply with the aforementioned requirements, the fund must remediate within three business days with respect to the $25,000,000 minimum adjusted net asset value or within one business day with respect to certain asset coverage ratios or the administrative agent at the request of, or with the consent of, the lenders may terminate the Credit Facility and declare any outstanding borrowings to be due and payable immediately.
Interest associated with any borrowing under the Credit Facility is charged to the borrowing fund at a rate of interest equal to 1.00% plus the greater of the federal funds effective rate or one month LIBOR. The annual commitment fee to maintain the Credit Facility is 0.15% and is incurred on the unused portion of the Credit Facility and is allocated to all participating funds pro rata based on their respective net assets. The initial term of the Credit Facility is 364 days, unless extended.
The Fund had no borrowings outstanding from the Credit Facility at February 28, 2017. Average borrowings from the Credit Facility for, during, the six months ended February 28, 2017, were as follows:
| | | | | | | | | | | | | | | | |
| | | Average
Borrowings | | | Average Interest
Rate Paid | | | Number of Days
Outstanding | | | Interest
Paid | |
| | $ | 2,700,000 | | | | 1.77 | % | | | 2 | | | $ | 266 | |
7. Risks, Concentrations and Indemnifications
In the normal course of business, the Fund enters into contracts that contain a variety of representations which provide general indemnifications. The Fund’s maximum exposure under these arrangements is unknown. The amount of exposure would depend on future claims that may be made against the Fund that have not yet occurred. However, based on experience, the Fund expects the risk of loss to be remote.
As of February 28, 2017, the Fund had one individual shareholder account and three omnibus accounts which collectively represented 63.3% of the Fund’s net assets.
Significant shareholder transactions by these shareholders may impact the Fund’s performance.
Because of the Fund’s investments in Underlying Funds and ETFs, the Fund indirectly pays a portion of the expenses incurred by the Underlying Funds and ETFs. As a result, the cost of investing in the Fund may be higher than the cost of investing in a mutual fund that invests directly in individual securities and financial instruments. The Fund is also subject to certain risks related to the Underlying Funds’ and ETFs’ investments in securities and financial instruments such as fixed income securities, including high yield, asset-backed and mortgage-related securities, including collateralized mortgage obligations and stripped mortgage-backed securities, equity securities, commodities and real estate securities and convertible securities. These securities are subject to risks specific to their structure, sector or market. The Fund invests in unaffiliated ETFs. ETFs are pooled investment vehicles whose ownership interests are purchased and sold on a securities exchange. ETFs may be structured as investment companies, depositary receipts or other pooled investment vehicles and may be passively or actively managed. Passively managed ETFs generally seek to track the performance of a particular market index, including broad-based market indexes, as well as indexes relating to particular sectors, markets, regions or industries. Actively managed ETFs do not seek to track the performance of a particular market index. The price movement of an index-based ETF may not track the underlying index and may result in a loss. In addition, ETFs may trade at a price below or above their NAV (also known as a discount or premium, respectively).
In addition, the Underlying Funds and ETFs may use derivative instruments in connection with their individual investment strategies including futures, forward foreign currency exchange contracts, options, swaps and other derivatives, which are also subject to specific risks related to their structure, sector or market and may be riskier than investments in other types of securities.
Specific risks and concentrations present in the Underlying Funds and ETFs are disclosed within their individual financial statements and registration statements, as appropriate.
The Fund is subject to interest rate and credit risk. The value of debt securities may decline as interest rates increase. The Fund could lose money if the issuer of a fixed income security is unable to pay interest or repay principal when it is due. Many factors can cause interest rates to rise. Some examples include central bank monetary policy, rising inflation rates and general economic conditions. Given the historically low interest rate environment, risks associated with rising rates are heightened. The ability of the issuers of debt to meet their obligations may be affected by the economic and political developments in a specific industry or region.
The Fund invests in Preferred Securities. These securities are typically issued by corporations, generally in the form of interest bearing notes with preferred security characteristics and may include provisions that permit the issuer, in its discretion, to defer or omit distributions for a certain period of time.
| | | | | | |
| | | |
| 46 | | | | J.P. MORGAN FUNDS | | FEBRUARY 28, 2017 |
8. Investment Company Reporting Modernization
In October 2016, the U.S. Securities and Exchange Commission adopted new rules and forms, and amendments to certain current rules and forms, to modernize the reporting and disclosure of information by registered investment companies. In part, the final rules amend Regulation S-X and will require standardized, enhanced disclosures about derivatives in investment company financial statements, as well as other amendments. The compliance date for the amendments to Regulation S-X is August 1, 2017. At this time, management is currently assessing the anticipated impact of the Regulation S-X amendments on the Fund’s financial statements and related disclosures.
9. Subsequent Event
Effective April 3, 2017, the Fund ceased making direct payments to financial intermediaries for any applicable sub-transfer agency services. Payments to financial intermediaries for sub-transfer agency services are made by JPMDS from the Shareholder Servicing Fee which has been renamed as the Service Fee.
| | | | | | | | |
| | | |
| FEBRUARY 28, 2017 | | J.P. MORGAN FUNDS | | | | | 47 | |
SCHEDULE OF SHAREHOLDER EXPENSES
(Unaudited)
Hypothetical $1,000 Investment
As a shareholder of the Fund, you incur two types of costs: (1) transaction costs, including sales charges (loads) on purchase payments and (2) ongoing costs, including investment advisory fees, administration fees, distribution fees and other Fund expenses. The examples below are intended to help you understand your ongoing costs (in dollars) of investing in each Class (not including expenses of the Underlying Funds and ETFs) and to compare these ongoing costs with the ongoing costs of investing in other mutual funds. The examples assume that you had a $1,000 investment in each Class at the beginning of the reporting period, September 1, 2016 and continued to hold your shares at the end of the reporting period, February 28, 2017.
Actual Expenses
For each Class of the Fund in the table below, the first line provides information about actual account values and actual expenses. You may use the information in this line, together with the amount you invested, to estimate the expenses that you paid over the period. Simply divide your account value by $1,000 (for example, an $8,600 account value divided by $1,000 = 8.6), then multiply the result by the number in the first line of each Class under the heading entitled “Expenses Paid During the Period” to estimate the expenses you paid on your account during this period.
Hypothetical Example for Comparison Purposes
The second line of each Class in the table below provides information about hypothetical account values and hypothetical expenses based on the Class’ actual expense ratio and an assumed rate of return of 5% per year before expenses, which is not the Class’ actual return. The hypothetical account values and expenses may not be used to estimate the actual ending account balance or expenses you paid for the period. You may use this information to compare the ongoing costs of investing in the Class of the Fund and other funds. To do so, compare this 5% hypothetical example with the 5% hypothetical examples that appear in the shareholder reports of the other funds. Please note that the expenses shown in the table are meant to highlight your ongoing costs only and do not reflect any transaction costs, such as sales charges (loads) or redemption fees and expenses of the Underlying Funds and ETFs. Therefore, the second line for each Class in the table is useful in comparing ongoing costs only, and will not help you determine the relative total costs of owning different funds. In addition, if these transaction costs were included, your costs would have been higher. The examples also assume all dividends and distributions have been reinvested.
| | | | | | | | | | | | | | | | |
| | | Beginning
Account Value
September 1, 2016 | | | Ending
Account Value
February 28, 2017 | | | Expenses
Paid During
the Period* | | | Annualized
Expense
Ratio | |
Diversified Real Return Fund | | | | | | | | | | | | | | | | |
Class A | | | | | | | | | | | | | | | | |
Actual | | $ | 1,000.00 | | | $ | 1,026.50 | | | $ | 5.02 | | | | 1.00 | % |
Hypothetical | | | 1,000.00 | | | | 1,019.84 | | | | 5.01 | | | | 1.00 | |
Class C | | | | | | | | | | | | | | | | |
Actual | | | 1,000.00 | | | | 1,024.20 | | | | 7.53 | | | | 1.50 | |
Hypothetical | | | 1,000.00 | | | | 1,017.36 | | | | 7.50 | | | | 1.50 | |
Class R2 | | | | | | | | | | | | | | | | |
Actual | | | 1,000.00 | | | | 1,025.60 | | | | 6.53 | | | | 1.30 | |
Hypothetical | | | 1,000.00 | | | | 1,018.35 | | | | 6.51 | | | | 1.30 | |
Class R5 | | | | | | | | | | | | | | | | |
Actual | | | 1,000.00 | | | | 1,028.80 | | | | 3.27 | | | | 0.65 | |
Hypothetical | | | 1,000.00 | | | | 1,021.57 | | | | 3.26 | | | | 0.65 | |
Class I (formerly Select Class) | | | | | | | | | | | | | | | | |
Actual | | | 1,000.00 | | | | 1,028.30 | | | | 3.77 | | | | 0.75 | |
Hypothetical | | | 1,000.00 | | | | 1,021.08 | | | | 3.76 | | | | 0.75 | |
| * | Expenses are equal to each Class’ respective annualized expense ratio, multiplied by the average account value over the period, multiplied by 181/365 (to reflect the one-half year period). |
| | | | | | |
| | | |
| 48 | | | | J.P. MORGAN FUNDS | | FEBRUARY 28, 2017 |
J.P. Morgan Funds are distributed by JPMorgan Distribution Services, Inc., which is an affiliate of JPMorgan Chase & Co. Affiliates of JPMorgan Chase & Co. receive fees for providing various services to the funds.
Contact JPMorgan Distribution Services, Inc. at 1-800-480-4111 for a fund prospectus. You can also visit us at www.jpmorganfunds.com. Investors should carefully consider the investment objectives and risk as well as charges and expenses of the mutual fund before investing. The prospectus contains this and other information about the mutual fund. Read the prospectus carefully before investing.
Investors may obtain information about the Securities Investor Protection Corporation (SIPC), including the SIPC brochure by visiting www.sipc.org or by calling SIPC at 202-371-8300.
The Fund files a complete schedule of its fund holdings for the first and third quarters of its fiscal year with the SEC on Form N-Q. The Fund’s Forms N-Q are available on the SEC’s website at http://www.sec.gov and may be reviewed and copied at the SEC’s Public Reference Room in Washington, DC. Information on the operation of the SEC’s Public Reference Room may be obtained by calling 1-800-SEC-0330. Shareholders may request the Form N-Q without charge by calling 1-800-480-4111 or by visiting the J.P. Morgan Funds’ website at www.jpmorganfunds.com.
A description of the Fund’s policies and procedures with respect to the disclosure of the Fund’s holdings is available in the prospectus and Statement of Additional Information.
A copy of proxy policies and procedures is available without charge upon request by calling 1-800-480-4111 and on the Fund’s website at www.jpmorganfunds.com. A description of such policies and procedures is on the SEC’s website at www.sec.gov. The Trustees have delegated the authority to vote proxies for securities owned by the Fund to the Adviser. A copy of the Fund’s voting record for the most recent 12-month period ended June 30 is available on the SEC’s website at www.sec.gov or at the Fund’s website at www.jpmorganfunds.com no later than August 31 of each year. The Fund’s proxy voting record will include, among other things, a brief description of the matter voted on for each fund security, and will state how each vote was cast, for example, for or against the proposal.


J.P. Morgan Asset Management is the marketing name for the asset management businesses of JPMorgan Chase & Co. Those businesses include, but are not limited to, J.P. Morgan Investment Management Inc., Security Capital Research & Management Incorporated and J.P. Morgan Alternative Asset Management, Inc.
| | | | |
| | © JPMorgan Chase & Co., 2017. All rights reserved. February 2017. | | SAN-DRR-217 |
Semi-Annual Report
J.P. Morgan Income Funds
February 28, 2017 (Unaudited)
JPMorgan Global Bond Opportunities Fund

CONTENTS
Investments in the Fund are not deposits or obligations of, or guaranteed or endorsed by, any bank and are not insured or guaranteed by the FDIC, the Federal Reserve Board or any other government agency. You could lose money if you sell when the Fund’s share price is lower than when you invested.
Past performance is no guarantee of future performance. The general market views expressed in this report are opinions based on market and other conditions through the end of the reporting period and are subject to change without notice. These views are not intended to predict the future performance of the Fund or the securities markets. References to specific securities and their issuers are for illustrative purposes only and are not intended to be, and should not be interpreted as, recommendations to purchase or sell such securities. Such views are not meant as investment advice and may not be relied on as an indication of trading intent on behalf of the Fund.
Prospective investors should refer to the Fund’s prospectus for a discussion of the Fund’s investment objectives, strategies and risks. Call J.P. Morgan Funds Service Center at 1-800-480-4111 for a prospectus containing more complete information about the Fund, including management fees and other expenses. Please read it carefully before investing.
CEO’S LETTER
March 22, 2017 (Unaudited)
Dear Shareholders,
The U.S. economy continued its steady expansion over the past six months and by the end of February 2017, the world’s leading economies were growing in a more synchronized manner that could accelerate global growth.
| | |
 | | “In the U.S., the pace of economic expansion was sufficient to persuade the Federal Reserve Bank to raise interest rates in December 2016 and again in March 2017.” |
By early 2017, the World Bank estimated that global economic growth in 2017 will rise by 2.7% compared with 2.3% in 2016 and economists generally expect each of the world’s 20 largest economies will see an increase in gross domestic product in 2017.
In the 19-nation euro zone, manufacturing activity rose in February 2017 for the sixth consecutive month and reached levels not seen in nearly six years. Economic confidence surveys have been the strongest since 2011. While unemployment across the euro zone remained nearly twice that of the U.S., the jobless rate fell faster than expected in early 2017 to its lowest level since 2009. Importantly, euro zone inflation reached the European Central Bank’s (ECB) target of 2.0% in February 2017, which provided further evidence that the risk of a painful deflationary spiral had receded.
Meanwhile, Chinese factory activity was stronger than economists expected in February 2017 and more broadly, Chinese economic stimulus measures initiated in 2016 appeared to bolster trade throughout Asia. In Japan, corporate profits were estimated at record highs even in the face of a stronger yen. South Korean exports grew in February 2017 for the fourth consecutive month. Economic data from Australia and India showed signs of stronger growth.
To a certain extent, the healthier global economy was supported by a rebound in global oil prices, which reached 15-month highs in October 2016. Prices for other commodities also rose in the latter half of 2016, helping growth in those emerging market nations reliant on natural resource exports.
In the U.S., the pace of economic expansion was sufficient to persuade the Federal Reserve Bank to raise interest rates in December 2016 and again in March 2017. Meanwhile, leading
stock market indexes hit record highs in late 2016 and early 2017 amid strength in corporate profits and the broader U.S. economy. Investor expectations that the Republican Party’s newly-won control of the U.S. presidency along with its continuing majorities in both houses of the U.S. Congress would bolster economic growth while lowering certain taxes further supported U.S. financial assets.
While the global economy appeared to grow more synchronized during the six months ended February 2017, there also emerged political uncertainties in the U.S. and Europe. Britain’s planned exit from the European Union — and its immigration and trade policies — brought investor uncertainty and was seen as a drag on the U.K. economy. In November 2016, Donald Trump won the U.S. presidency after campaigning on a platform that included new restrictions on immigration and protective trade policies. While voters in the Netherlands declined to give the anti-immigrant Party for Freedom a majority in the lower house of Parliament, populist parties were also vying for power in Italy, France, Germany and elsewhere.
Each of these parties and their leaders – both in the U.S. and elsewhere – share broad policy goals that prioritize restricting immigration and shunning supranational trade agreements. Given that immigration and free trade are key drivers of economic growth in advanced, post-industrial nations, it remains to be seen how much electoral support these shared agendas would earn.
In the face of all this, U.S. and foreign financial markets generally rewarded investors with positive returns for the six months through February 2017. Over time, we believe financial markets will continue to reward those investors who maintain patience and discipline in the context of a properly diversified portfolio.
We look forward to managing your investment needs for years to come. Should you have any questions, please visit www.jpmorganfunds.com or contact the J.P. Morgan Funds Service Center at 1-800-480-4111.
Sincerely yours,

George C.W. Gatch
CEO, Investment Funds Management,
J.P. Morgan Asset Management
| | | | | | | | |
| | | |
| FEBRUARY 28, 2017 | | J.P. MORGAN INCOME FUNDS | | | | | 1 | |
JPMorgan Global Bond Opportunities Fund
FUND COMMENTARY
SIX MONTHS ENDED FEBRUARY 28, 2017 (Unaudited)
| | | | |
| Reporting Period Return: | |
| Fund (Class I Shares)*1 | | | 1.67% | |
| Bloomberg Barclays Multiverse Index (formerly the Barclays Multiverse Index) | | | (4.52)% | |
| |
| Net Assets as of 2/28/2017 (In Thousands) | | | $1,561,866 | |
| Duration as of 2/28/2017 | | | 3.1 years | |
INVESTMENT OBJECTIVE**
The JPMorgan Global Bond Opportunities Fund (the “Fund”) seeks to provide total return.
HOW DID THE MARKET PERFORM?
Equity markets generally rose along with bond yields amid a backdrop of low but rising interest rates and price inflation, as well as improved corporate profits, during the six months ended February 28, 2017.
Commodities prices stabilized during the reporting period and global oil prices reached 15-month highs in October 2016. Oil prices were further bolstered by the Organization of Petroleum Exporting Countries’ decision to curb production.
The November 8, 2016 election handed Donald Trump the U.S. presidency and maintained the Republican Party majority in both houses of the U.S. Congress. In the following months, key U.S. equity benchmarks reached multiple closing record highs. While developed market sovereign bonds underperformed other bond market sectors, high yield bonds (also known as “junk bonds”) outperformed the broader bond market. Emerging markets debt had mixed returns.
WHAT WERE THE MAIN DRIVERS OF THE FUND’S PERFORMANCE?
For the six months ended February 28, 2017, the Fund outperformed the Bloomberg Barclays Multiverse Index (the “Index”). The Fund’s allocations to high yield bonds and emerging markets debt were leading contributors to both absolute performance and performance relative to the Index. High yield bonds generally benefitted from investors’ appetite for yield growth. The Fund’s allocation to securitized debt also contributed to absolute performance.
The Fund’s allocation to government debt securities detracted from both absolute and relative performance during the reporting period. The Fund’s allocation to investment grade corporate debt also detracted from absolute performance.
HOW WAS THE FUND POSITIONED?
During the reporting period, the Fund invested opportunistically across different markets and sectors. The Fund’s managers applied a flexible investment approach and did not manage to a benchmark. This allowed the Fund to shift its allocations based on changing market conditions. The Fund had exposure to a broad range of asset classes during the reporting period, including high yield and investment grade corporate bonds, agency and non-agency mortgage-backed securities, asset-backed securities, commercial mortgage-backed securities, emerging markets debt, convertible bonds and foreign government securities.
During the reporting period, the Fund’s managers slightly increased their allocation to investment grade corporate bonds. The managers also increased the Fund’s exposure to emerging markets, in what they believed to be high yielding, fundamentally sound countries. The managers reduced the Fund’s exposure to the securitized debt sector.
The managers reduced the Fund’s overall duration amid expectations of increased fiscal stimulus and rising interest rates. Duration measures the price sensitivity of a portfolio of debt securities to changes in interest rates. Bonds with longer maturities will generally experience a larger increase or decrease in price as interest rates fall or rise, respectively, versus bonds with shorter maturities. The Fund’s duration fell to 3.08 years at February 28, 2017, from 5.13 years at August 31, 2016.
| | | | | | |
| | | |
| 2 | | | | J.P. MORGAN INCOME FUNDS | | FEBRUARY 28, 2017 |
| | | | |
PORTFOLIO COMPOSITION*** | |
| Corporate Bonds | | | 58.7 | % |
| Foreign Government Securities | | | 18.4 | |
| Commercial Mortgage-Backed Securities | | | 8.2 | |
| Asset-Backed Securities | | | 3.8 | |
| Convertible Bonds | | | 3.7 | |
| Loan Assignments | | | 2.8 | |
| Collateralized Mortgage Obligations | | | 2.2 | |
| Others (each less than 1.0%) | | | 0.2 | |
| Short-Term Investments | | | 2.0 | |
| | | | |
PORTFOLIO COMPOSITION BY COUNTRY*** | |
| United States | | | 50.4 | % |
| United Kingdom | | | 4.8 | |
| Luxembourg | | | 3.2 | |
| Mexico | | | 3.1 | |
| Brazil | | | 3.0 | |
| France | | | 2.6 | |
| Spain | | | 2.6 | |
| New Zealand | | | 2.4 | |
| Germany | | | 2.4 | |
| Indonesia | | | 2.4 | |
| Russia | | | 2.0 | |
| Italy | | | 1.8 | |
| Netherlands | | | 1.4 | |
| Canada | | | 1.3 | |
| Portugal | | | 1.3 | |
| Argentina | | | 1.1 | |
| Others (each less than 1.0%) | | | 12.2 | |
| Short-Term Investments | | | 2.0 | |
| 1 | | Effective April 3, 2017, the Fund’s Select Class Shares were renamed Class I Shares. |
| * | | The return shown is based on net asset values calculated for shareholder transactions and may differ from the return shown in the financial highlights, which reflects adjustments made to the net asset values in accordance with accounting principles generally accepted in the United States of America. |
| ** | | The adviser seeks to achieve the Fund’s objective. There can be no guarantee it will be achieved. |
| *** | | Percentages indicated are based on total investments as of February 28, 2017. The Fund’s portfolio composition is subject to change. |
| | | | | | | | |
| | | |
| FEBRUARY 28, 2017 | | J.P. MORGAN INCOME FUNDS | | | | | 3 | |
JPMorgan Global Bond Opportunities Fund
FUND COMMENTARY
SIX MONTHS ENDED FEBRUARY 28, 2017 (Unaudited) (continued)
| | | | | | | | | | | | | | | | | | |
AVERAGE ANNUAL TOTAL RETURNS AS OF FEBRUARY 28, 2017 | |
| | | | | |
| | | INCEPTION DATE OF
CLASS | | 6 MONTH* | | | 1 YEAR | | | 3 YEAR | | | SINCE
INCEPTION | |
CLASS A SHARES | | September 4, 2012 | | | | | | | | | | | | | | | | |
With Sales Charge** | | | | | (2.18 | )% | | | 6.46 | % | | | 2.20 | % | | | 3.96 | % |
Without Sales Charge | | | | | 1.64 | | | | 10.57 | | | | 3.52 | | | | 4.85 | |
CLASS C SHARES | | September 4, 2012 | | | | | | | | | | | | | | | | |
With CDSC*** | | | | | 0.35 | | | | 9.05 | | | | 3.09 | | | | 4.42 | |
Without CDSC | | | | | 1.35 | | | | 10.05 | | | | 3.09 | | | | 4.42 | |
CLASS R6 SHARES | | September 4, 2012 | | | 1.74 | | | | 10.97 | | | | 3.94 | | | | 5.26 | |
CLASS I SHARES (FORMERLY SELECT CLASS SHARES) | | September 4, 2012 | | | 1.67 | | | | 10.72 | | | | 3.77 | | | | 5.09 | |
| ** | | Sales Charge for Class A Shares is 3.75%. |
| *** | | Assumes a 1% CDSC (contingent deferred sales charge) for the 6 month and one year periods and 0% CDSC thereafter. |
LIFE OF FUND PERFORMANCE (9/4/12 TO 2/28/17)
The performance quoted is past performance and is not a guarantee of future results. Mutual funds are subject to certain market risks. Investment returns and principal value of an investment will fluctuate so that an investor’s shares, when redeemed, may be worth more or less than their original cost. Current performance may be higher or lower than the performance data shown. For up-to-date month-end performance information please call 1-800-480-4111.
The Fund commenced operations on September 4, 2012.
The graph illustrates comparative performance for $1,000,000 invested in Class I Shares of the JPMorgan Global Bond Opportunities Fund, the Bloomberg Barclays Multiverse Index and the Lipper Global Income Funds Index from September 4, 2012 to February 28, 2017. The performance of the Lipper Global Income Funds Index reflects an initial investment at the end of the month closest to the Fund’s inception. The performance of the Fund assumes reinvestment of all dividends and capital gain distributions, if any, and does not include a sales charge. The performance of the Bloomberg Barclays Multiverse Index does not reflect the deduction of expenses or a sales charge associated with a mutual fund, if applicable. The performance of the Lipper Global Income Funds Index includes expenses associated with a mutual fund, such as investment management fees. These expenses are not identical to the expenses incurred by the Fund. The Bloomberg Barclays Multiverse Index provides a broad-based measure of the international fixed income bond market. The Bloomberg Barclays Multiverse Index represents the union of the Bloomberg Barclays Global Aggregate
Index and the Bloomberg Barclays Global High Yield Index. The Bloomberg Barclays Global Aggregate Index is a measure of global investment grade debt from twenty-four different local currency markets. The Bloomberg Barclays Global High Yield Index provides a broad-based measure of the global high-yield fixed income markets. The Lipper Global Income Funds Index represents the total returns of certain mutual funds within the Fund’s designated category as determined by Lipper, Inc. Investors cannot invest directly in an index.
Class I Shares have a $1,000,000 minimum initial investment.
Subsequent to the inception of the Fund on September 4, 2012 until May 31, 2013, the Fund did not experience any shareholder purchase and sale activity. If such activity had occurred, the Fund’s performance may have been impacted.
Fund performance may reflect the waiver of the Fund’s fees and reimbursement of expenses for certain periods since the inception date. Without these waivers and reimbursements, performance would have been lower. Also, performance shown in this section does not reflect the deduction of taxes that a shareholder would pay on Fund distributions or redemptions of Fund shares.
The returns shown are based on net asset values calculated for shareholder transactions and may differ from the returns shown in the financial highlights, which reflect adjustments made to the net asset values in accordance with accounting principles generally accepted in the United States of America.
| | | | | | |
| | | |
| 4 | | | | J.P. MORGAN INCOME FUNDS | | FEBRUARY 28, 2017 |
JPMorgan Global Bond Opportunities Fund
SCHEDULE OF PORTFOLIO INVESTMENTS
AS OF FEBRUARY 28, 2017 (Unaudited)
(Amounts in U.S. Dollars, unless otherwise noted)
(Amounts in thousands)
| | | | | | | | |
PRINCIPAL AMOUNT | | | SECURITY DESCRIPTION | | VALUE | |
| | Asset-Backed Securities — 3.7% | |
| | | | Cayman Islands — 0.7% | |
| | 101 | | | Carlyle Global Market Strategies Commodities Funding Ltd., Series 2014-1A, Class A, VAR, 2.923%, 10/15/21 (e) | | | 48 | |
| | 1,999 | | | CIFC Funding 2017-I Ltd., Series 2017-1A, Class A, VAR, 2.392%, 04/23/29 (e) (w) | | | 1,999 | |
| | 1,000 | | | Flatiron CLO Ltd., Series 2013-1A, Class A1R, VAR, 2.190%, 01/17/26 (e) | | | 1,002 | |
| | 2,167 | | | Grippen Park CLO Ltd., Series 2017-1A, Class A, VAR, 01/20/30 (e) (w) | | | 2,167 | |
| | 250 | | | LCM XVI LP, Series 16A, Class A, VAR, 2.523%, 07/15/26 (e) | | | 251 | |
| | 1,627 | | | Octagon Investment Partners 30 Ltd., Series 2017-1A, Class A1, VAR, 2.355%, 03/17/30 (e) (w) | | | 1,627 | |
| | 250 | | | OZLM Funding IV Ltd., Series 2013-4A, Class A1, VAR, 2.191%, 07/22/25 (e) | | | 250 | |
| | 3,161 | | | Race Point VIII CLO Ltd., Series 2013-8A, Class AR, VAR, 2.392%, 02/20/30 (e) | | | 3,161 | |
| | 45 | | | Rockwall CDO II Ltd., Series 2007-1A, Class A1LA, VAR, 1.284%, 08/01/24 (e) | | | 45 | |
| | 420 | | | Sound Point CLO IV Ltd., Series 2013-3A, Class A, VAR, 2.411%, 01/21/26 (e) | | | 421 | |
| | 250 | | | THL Credit Wind River CLO Ltd., Series 2014-1A, Class A, VAR, 2.544%, 04/18/26 (e) | | | 250 | |
| | 420 | | | Venture XVII CLO Ltd., Series 2014-17A, Class A, VAR, 2.503%, 07/15/26 (e) | | | 420 | |
| | | | | | | | |
| | | | | | | 11,641 | |
| | | | | | | | |
| | | | Ireland — 0.1% | | | | |
| | 785 | | | Trafigura Securitisation Finance plc, Series 2014-1A, Class B, VAR, 3.020%, 10/15/21 (e) | | | 785 | |
| | | | | | | | |
| | | | Italy — 0.0% (g) | | | | |
| EUR | 14 | | | Italfinance Securitisation Vehicle SRL, Series 2005-1, Class A, Reg. S, VAR, 0.000%, 03/14/23 | | | 15 | |
| | | | | | | | |
| | | | United States — 2.9% | | | | |
| | 106 | | | ABFC Trust, Series 2004-OPT2, Class M2, VAR, 2.278%, 07/25/33 | | | 103 | |
| | 106 | | | ACE Securities Corp. Home Equity Loan Trust, Series 2004-OP1, Class M2, VAR, 2.353%, 04/25/34 | | | 101 | |
| | 948 | | | American Airlines Pass-Through Trust, Series 2015-1, Class B, 3.700%, 05/01/23 | | | 926 | |
| | | | Argent Securities, Inc. Asset-Backed Pass-Through Certificates, | | | | |
| | 107 | | | Series 2003-W7, Class M2, VAR, 3.403%, 03/25/34 | | | 105 | |
| | | | | | | | |
PRINCIPAL AMOUNT | | | SECURITY DESCRIPTION | | VALUE | |
| | | | | | | | |
| | | | United States — continued | | | | |
| | 111 | | | Series 2004-W3, Class A3, VAR, 1.598%, 02/25/34 | | | 101 | |
| | 40 | | | Bear Stearns Asset-Backed Securities Trust, Series 2002-1, Class 1A5, SUB, 6.890%, 12/25/34 | | | 40 | |
| | 2,812 | | | CAM Mortgage LLC, Series 2015-1, Class M, VAR, 4.750%, 07/15/64 (e) | | | 2,789 | |
| | 400 | | | Consumer Credit Origination Loan Trust, Series 2015-1, Class B, 5.210%, 03/15/21 (e) | | | 400 | |
| | 128 | | | Continental Airlines Pass-Through Trust, Series 2007-1, Class A, 5.983%, 04/19/22 | | | 143 | |
| | | | Countrywide Asset-Backed Certificates, | | | | |
| | 72 | | | Series 2002-4, Class M1, VAR, 1.903%, 12/25/32 | | | 68 | |
| | 154 | | | Series 2004-2, Class M1, VAR, 1.528%, 05/25/34 | | | 147 | |
| | 77 | | | Series 2004-BC1, Class M3, VAR, 2.878%, 10/25/33 | | | 69 | |
| | 3,490 | | | Series 2004-ECC2, Class M2, VAR, 1.753%, 12/25/34 | | | 3,369 | |
| | 2,063 | | | Series 2005-AB3, Class 1A1, VAR, 1.028%, 02/25/36 | | | 1,832 | |
| | 164 | | | Credit-Based Asset Servicing & Securitization LLC, Series 2005-CB5, Class AV3, VAR, 1.168%, 08/25/35 | | | 162 | |
| | | | Exeter Automobile Receivables Trust, | | | | |
| | 51 | | | Series 2013-2A, Class C, 4.350%, 01/15/19 (e) | | | 52 | |
| | 395 | | | Series 2014-3A, Class B, 2.770%, 11/15/19 (e) | | | 396 | |
| | 140 | | | First Franklin Mortgage Loan Trust, Series 2004-FF5, Class A1, VAR, 1.498%, 08/25/34 | | | 134 | |
| | 860 | | | FirstKey Lending Trust, Series 2015-SFR1, Class D, VAR, 4.367%, 03/09/47 (e) | | | 835 | |
| | 198 | | | Flagship Credit Auto Trust, Series 2014-2, Class C, 3.950%, 12/15/20 (e) | | | 200 | |
| | 60 | | | Fremont Home Loan Trust, Series 2004-2, Class M2, VAR, 1.708%, 07/25/34 | | | 58 | |
| | 340 | | | GMAT Trust, Series 2013-1A, Class M, VAR, 5.000%, 11/25/43 (e) | | | 324 | |
| | 39 | | | Home Equity Asset Trust, Series 2004-6, Class M2, VAR, 1.678%, 12/25/34 | | | 35 | |
| | 3,435 | | | LV Tower 52 Issuer, Series 2013-1, Class M, 7.750%, 02/15/23 (e) | | | 3,348 | |
| | 107 | | | Merrill Lynch Mortgage Investors Trust, Series 2003-OPT1, Class M1, VAR, 1.753%, 07/25/34 | | | 99 | |
SEE NOTES TO FINANCIAL STATEMENTS.
| | | | | | | | |
| | | |
| FEBRUARY 28, 2017 | | J.P. MORGAN INCOME FUNDS | | | | | 5 | |
JPMorgan Global Bond Opportunities Fund
SCHEDULE OF PORTFOLIO INVESTMENTS
AS OF FEBRUARY 28, 2017 (Unaudited) (continued)
(Amounts in U.S. Dollars, unless otherwise noted)
(Amounts in thousands)
| | | | | | | | |
PRINCIPAL AMOUNT | | | SECURITY DESCRIPTION | | VALUE | |
| | Asset-Backed Securities — continued | |
| | | | United States — continued | | | | |
| | 148 | | | Mid-State Capital Corp. Trust, Series 2006-1, Class M2, 6.742%, 10/15/40 (e) | | | 156 | |
| | 88 | | | Morgan Stanley ABS Capital I, Inc. Trust, Series 2004-HE1, Class M1, VAR, 1.633%, 01/25/34 | | | 85 | |
| | 75 | | | New Century Home Equity Loan Trust, Series 2003-4, Class M2, VAR, 3.508%, 10/25/33 | | | 73 | |
| | 2,066 | | | NRPL Trust, Series 2015-2A, Class A1, SUB, 3.750%, 10/25/57 (e) | | | 2,067 | |
| | | | OneMain Financial Issuance Trust, | | | | |
| | 300 | | | Series 2014-1A, Class B, 3.240%, 06/18/24 (e) | | | 301 | |
| | 182 | | | Series 2014-2A, Class C, 4.330%, 09/18/24 (e) | | | 183 | |
| | 151 | | | Series 2014-2A, Class D, 5.310%, 09/18/24 (e) | | | 152 | |
| | 1,266 | | | Series 2015-1A, Class A, 3.190%, 03/18/26 (e) | | | 1,277 | |
| | 608 | | | Series 2015-1A, Class C, 5.120%, 03/18/26 (e) | | | 611 | |
| | 340 | | | Park Place Securities, Inc. Asset-Backed Pass-Through Certificates, Series 2005-WCH1, Class M3, VAR, 1.618%, 01/25/36 | | | 336 | |
| | 156 | | | People’s Choice Home Loan Securities Trust, Series 2004-2, Class M1, VAR, 1.678%, 10/25/34 | | | 156 | |
| | | | Pretium Mortgage Credit Partners I, | | | | |
| | 2,114 | | | Series 2015-NPL4, Class A1, SUB, 4.375%, 11/27/30 (e) | | | 2,132 | |
| | 2,516 | | | Series 2016-NPL1, Class A1, SUB, 4.375%, 02/27/31 (e) | | | 2,537 | |
| | 1,400 | | | Progress Residential Trust, Series 2015-SFR2, Class D, 3.684%, 06/12/32 (e) | | | 1,395 | |
| | 2,438 | | | RASC Trust, Series 2005-EMX1, Class M1, VAR, 1.423%, 03/25/35 | | | 2,311 | |
| | | | Renaissance Home Equity Loan Trust, | | | | |
| | 1,069 | | | Series 2004-1, Class M1, VAR, 1.358%, 05/25/34 | | | 989 | |
| | 796 | | | Series 2005-1, Class AF6, SUB, 4.970%, 05/25/35 | | | 814 | |
| | 910 | | | Series 2005-2, Class M1, SUB, 5.051%, 08/25/35 | | | 751 | |
| | 231 | | | Saxon Asset Securities Trust, Series 2004-3, Class M1, VAR, 1.678%, 12/26/34 | | | 213 | |
| | 188 | | | Structured Asset Investment Loan Trust, Series 2003-BC10, Class A4, VAR, 1.778%, 10/25/33 | | | 184 | |
| | | | | | | | |
PRINCIPAL AMOUNT | | | SECURITY DESCRIPTION | | VALUE | |
| | |
| | | | United States — continued | | | | |
| | 225 | | | Sunset Mortgage Loan Co. LLC, Series 2014-NPL2, Class A, SUB, 3.721%, 11/16/44 (e) | | | 225 | |
| | 656 | | | US Airways Pass Through Trust, 5.375%, 11/15/21 | | | 677 | |
| | 796 | | | Vericrest Opportunity Loan Trust, Series 2015-NPL3, Class A1, SUB, 3.375%, 10/25/58 (e) | | | 797 | |
| | 175 | | | VOLT XIX LLC, Series 2014-NP11, Class A1, SUB, 3.875%, 04/25/55 (e) | | | 175 | |
| | 1,683 | | | VOLT XXV LLC, Series 2015-NPL8, Class A1, SUB, 3.500%, 06/26/45 (e) | | | 1,683 | |
| | 736 | | | VOLT XXVI LLC, Series 2014-NPL6, Class A2, SUB, 4.250%, 09/25/43 (e) | | | 726 | |
| | 1,825 | | | VOLT XXVII LLC, Series 2014-NPL7, Class A2, SUB, 4.750%, 08/27/57 (e) | | | 1,802 | |
| | 3,578 | | | VOLT XXXVII LLC, Series 2015-NP11, Class A1, SUB, 3.625%, 07/25/45 (e) | | | 3,579 | |
| | 2,758 | | | VOLT XXXVIII LLC, Series 2015-NP12, Class A1, SUB, 3.875%, 09/25/45 (e) | | | 2,765 | |
| | 186 | | | Westlake Automobile Receivables Trust, Series 2014-2A, Class D, 2.860%, 07/15/21 (e) | | | 187 | |
| | | | | | | | |
| | | | | | | 45,175 | |
| | | | | | | | |
| | | | Total Asset-Backed Securities
(Cost $57,491) | | | 57,616 | |
| | | | | | | | |
| | Collateralized Mortgage Obligations — 2.1% | |
| | | | Italy — 0.0% (g) | |
| EUR | 120 | | | Intesa Sec SpA, Series 3, Class B, Reg. S, VAR, 0.000%, 10/30/33 | | | 124 | |
| | | | | | | | |
| | | | Spain — 0.0% (g) | |
| EUR | 39 | | | TDA 13-Mixto Fondo de Titulizacion de Activos, Series 13, Class A2, VAR, 0.000%, 09/30/32 | | | 41 | |
| | | | | | | | |
| | | | United States — 2.1% | |
| | | | Alternative Loan Trust | | | | |
| | 114 | | | Series 2005-6CB, Class 1A6, 5.500%, 04/25/35 | | | 117 | |
| | 1,954 | | | Series 2005-21CB, Class A17, 6.000%, 06/25/35 | | | 1,954 | |
| | 149 | | | Chase Mortgage Finance Trust, Series 2007-A1, Class 2A3, VAR, 3.101%, 02/25/37 | | | 149 | |
| | 1,490 | | | DSLA Mortgage Loan Trust, Series 2005-AR4, Class 2A1A, VAR, 1.039%, 08/19/45 | | | 1,277 | |
| | | | FHLMC REMIC | | | | |
| | 216 | | | Series 3110, Class SL, IF, IO, 5.380%, 02/15/26 | | | 17 | |
| | 790 | | | Series 3459, Class JS, IF, IO, 5.480%, 06/15/38 | | | 109 | |
SEE NOTES TO FINANCIAL STATEMENTS.
| | | | | | |
| | | |
| 6 | | | | J.P. MORGAN INCOME FUNDS | | FEBRUARY 28, 2017 |
| | | | | | | | |
PRINCIPAL AMOUNT | | | SECURITY DESCRIPTION | | VALUE | |
| | Collateralized Mortgage Obligations — continued | |
| | | | United States — continued | | | | |
| | 270 | | | Series 3716, Class PI, IO, 4.500%, 04/15/38 | | | 26 | |
| | 26 | | | Series 3736, Class QB, 4.000%, 05/15/37 | | | 26 | |
| | 1,071 | | | Series 3775, Class LI, IO, 3.500%, 12/15/20 | | | 48 | |
| | 918 | | | Series 3907, Class AI, IO, 5.000%, 05/15/40 | | | 88 | |
| | 3,427 | | | Series 3907, Class SW, IF, IO, 5.880%, 07/15/26 | | | 487 | |
| | 1,290 | | | Series 3914, Class LS, IF, IO, 6.030%, 08/15/26 | | | 174 | |
| | 558 | | | Series 4018, Class HI, IO, 4.500%, 03/15/41 | | | 102 | |
| | 773 | | | Series 4030, Class IL, IO, 3.500%, 04/15/27 | | | 87 | |
| | 3,066 | | | Series 4043, Class PI, IO, 2.500%, 05/15/27 | | | 250 | |
| | 263 | | | Series 4056, Class BI, IO, 3.000%, 05/15/27 | | | 24 | |
| | 1,847 | | | Series 4057, Class UI, IO, 3.000%, 05/15/27 | | | 175 | |
| | 578 | | | Series 4073, Class IQ, IO, 4.000%, 07/15/42 | | | 119 | |
| | 2,325 | | | Series 4097, Class CI, IO, 3.000%, 08/15/27 | | | 209 | |
| | 680 | | | Series 4119, Class LI, IO, 3.500%, 06/15/39 | | | 84 | |
| | 1,402 | | | Series 4120, Class UI, IO, 3.000%, 10/15/27 | | | 145 | |
| | 288 | | | Series 4136, Class IN, IO, 3.000%, 11/15/27 | | | 30 | |
| | 279 | | | Series 4146, Class AI, IO, 3.000%, 12/15/27 | | | 26 | |
| | 1,368 | | | Series 4173, Class I, IO, 4.000%, 03/15/43 | | | 286 | |
| | 891 | | | Series 4215, Class LI, IO, 3.500%, 07/15/41 | | | 129 | |
| | 1,835 | | | Series 4280, Class KI, IO, 3.500%, 09/15/31 | | | 180 | |
| | 781 | | | Series 4304, Class DI, IO, 2.500%, 01/15/27 | | | 63 | |
| | 2,278 | | | Series 4311, Class QI, IO, 3.000%, 10/15/28 | | | 206 | |
| | 2,247 | | | Series 4313, Class UI, IO, 3.000%, 03/15/29 | | | 254 | |
| | 474 | | | Series 4323, Class IW, IO, 3.500%, 04/15/28 | | | 48 | |
| | 1,185 | | | Series 4324, Class AI, IO, 3.000%, 11/15/28 | | | 97 | |
| | 1,868 | | | Series 4351, Class GI, IO, 5.000%, 11/15/19 | | | 34 | |
| | 1,949 | | | Series 4372, Class SY, IF, IO, 5.330%, 08/15/44 | | | 350 | |
| | | | | | | | |
PRINCIPAL AMOUNT | | | SECURITY DESCRIPTION | | VALUE | |
| | | | | | | | |
| | | | United States — continued | | | | |
| | 3,374 | | | Series 4585, Class JI, IO, 4.000%, 05/15/45 | | | 629 | |
| | 467 | | | FHLMC STRIPS, Series 305, Class IO, IO, 3.500%, 03/15/28 | | | 52 | |
| | 35 | | | First Horizon Mortgage Pass-Through Trust, Series 2005-5, Class 1A6, 5.500%, 10/25/35 | | | 34 | |
| | | | FNMA REMIC | | | | |
| | 905 | | | Series 2009-101, Class SI, IF, IO, 4.972%, 12/25/39 | | | 100 | |
| | 256 | | | Series 2010-102, Class IP, IO, 5.000%, 12/25/39 | | | 24 | |
| | 1,090 | | | Series 2011-144, Class SA, IF, IO, 5.872%, 11/25/25 | | | 113 | |
| | 262 | | | Series 2012-25, Class AI, IO, 3.500%, 03/25/27 | | | 29 | |
| | 1,225 | | | Series 2012-93, Class SG, IF, IO, 5.322%, 09/25/42 | | | 241 | |
| | 406 | | | Series 2012-107, Class IG, IO, 3.500%, 10/25/27 | | | 45 | |
| | 334 | | | Series 2012-118, Class DI, IO, 3.500%, 01/25/40 | | | 39 | |
| | 1,244 | | | Series 2012-120, Class DI, IO, 3.000%, 03/25/31 | | | 135 | |
| | 274 | | | Series 2012-128, Class KI, IO, 3.000%, 11/25/27 | | | 26 | |
| | 284 | | | Series 2012-144, Class EI, IO, 3.000%, 01/25/28 | | | 26 | |
| | 484 | | | Series 2012-144, Class SK, IF, IO, 5.322%, 01/25/43 | | | 117 | |
| | 3,057 | | | Series 2012-145, Class EI, IO, 3.000%, 01/25/28 | | | 283 | |
| | 353 | | | Series 2012-148, Class JI, IO, 3.500%, 12/25/39 | | | 44 | |
| | 315 | | | Series 2012-150, Class BI, IO, 3.000%, 01/25/28 | | | 29 | |
| | 351 | | | Series 2013-5, Class BI, IO, 3.500%, 03/25/40 | | | 43 | |
| | 255 | | | Series 2013-9, Class IO, IO, 3.000%, 02/25/28 | | | 24 | |
| | 312 | | | Series 2013-9, Class YI, IO, 3.500%, 02/25/28 | | | 34 | |
| | 4,397 | | | Series 2013-15, Class IO, IO, 2.500%, 03/25/28 | | | 362 | |
| | 381 | | | Series 2013-15, Class QI, IO, 3.000%, 03/25/28 | | | 36 | |
| | 1,452 | | | Series 2013-18, Class AI, IO, 3.000%, 03/25/28 | | | 136 | |
| | 305 | | | Series 2013-26, Class IJ, IO, 3.000%, 04/25/28 | | | 30 | |
SEE NOTES TO FINANCIAL STATEMENTS.
| | | | | | | | |
| | | |
| FEBRUARY 28, 2017 | | J.P. MORGAN INCOME FUNDS | | | | | 7 | |
JPMorgan Global Bond Opportunities Fund
SCHEDULE OF PORTFOLIO INVESTMENTS
AS OF FEBRUARY 28, 2017 (Unaudited) (continued)
(Amounts in U.S. Dollars, unless otherwise noted)
(Amounts in thousands)
| | | | | | | | |
PRINCIPAL AMOUNT | | | SECURITY DESCRIPTION | | VALUE | |
| | Collateralized Mortgage Obligations — continued | |
| | | | United States — continued | | | | |
| | 1,538 | | | Series 2013-31, Class DI, IO, 3.000%, 04/25/28 | | | 166 | |
| | 291 | | | Series 2013-31, Class YI, IO, 3.500%, 04/25/28 | | | 31 | |
| | 8,918 | | | Series 2013-61, Class HI, IO, 3.000%, 06/25/33 | | | 1,211 | |
| | 1,740 | | | Series 2013-64, Class LI, IO, 3.000%, 06/25/33 | | | 244 | |
| | 13,082 | | | Series 2013-66, Class IE, IO, 3.000%, 08/25/32 | | | 1,500 | |
| | 3,038 | | | Series 2014-35, Class KI, IO, 3.000%, 06/25/29 | | | 370 | |
| | 1,998 | | | Series 2014-44, Class QI, IO, 3.000%, 08/25/29 | | | 200 | |
| | 5,345 | | | Series 2015-48, Class ST, IF, IO, 4.842%, 07/25/45 | | | 1,078 | |
| | | | FNMA STRIPS | | | | |
| | 2,617 | | | Series 401, Class C6, IO, 4.500%, 10/25/29 | | | 212 | |
| | 860 | | | Series 409, Class 23, IO, VAR, 3.500%, 04/25/27 | | | 82 | |
| | 8,702 | | | Series 410, Class C12, IO, 5.500%, 07/25/24 | | | 611 | |
| | | | GNMA | | | | |
| | 1,666 | | | Series 2002-24, Class AG, IF, IO, 7.180%, 04/16/32 | | | 315 | |
| | 1,392 | | | Series 2003-69, Class SB, IF, IO, 5.830%, 08/16/33 | | | 279 | |
| | 1,072 | | | Series 2011-13, Class S, IF, IO, 5.180%, 01/16/41 | | | 167 | |
| | 172 | | | GSMSC Pass-Through Trust, Series 2008-2R, Class 2A1, VAR, 7.500%, 10/25/36 (e) | | | 141 | |
| | 250 | | | HarborView Mortgage Loan Trust, Series 2007-6, Class 2A1A, VAR, 0.971%, 08/19/37 | | | 221 | |
| | 569 | | | Structured Adjustable Rate Mortgage Loan Trust, Series 2005-1, Class 5A1, VAR, 3.153%, 02/25/35 | | | 564 | |
| | 1,335 | | | THL Credit Wind River CLO Ltd.07/22/29 (w) | | | 1,335 | |
| | | | Wells Fargo Mortgage-Backed Securities Trust | | | | |
| | 1,485 | | | Series 2004-BB, Class A5, VAR, 3.074%, 01/25/35 | | | 1,495 | |
| | 3,009 | | | Series 2004-M, Class A1, VAR, 3.004%, 08/25/34 | | | 3,076 | |
| | 3,071 | | | Series 2004-N, Class A6, VAR, 3.008%, 08/25/34 | | | 3,076 | |
| | 3,070 | | | Series 2004-N, Class A7, VAR, 3.008%, 08/25/34 | | | 3,075 | |
| | 2,064 | | | Series 2005-AR2, Class 2A1, VAR, 3.163%, 03/25/35 | | | 2,055 | |
| | | | | | | | |
PRINCIPAL AMOUNT | | | SECURITY DESCRIPTION | | VALUE | |
| | | | | | | | |
| | | | United States — continued | | | | |
| | 474 | | | Series 2005-AR2, Class 2A2, VAR, 3.163%, 03/25/35 | | | 479 | |
| | 427 | | | Series 2005-AR4, Class 2A2, VAR, 3.273%, 04/25/35 | | | 427 | |
| | 647 | | | Series 2005-AR16, Class 3A1, VAR, 3.155%, 03/25/35 | | | 647 | |
| | 70 | | | Series 2007-2, Class 3A5, 5.250%, 03/25/37 | | | 72 | |
| | | | | | | | |
| | | | | | | 33,130 | |
| | | | | | | | |
| | | | Total Collateralized Mortgage Obligations
(Cost $32,936) | | | 33,295 | |
| | | | | | | | |
| | Commercial Mortgage-Backed Securities — 7.9% | |
| | | | United States — 7.9% | |
| | | | Banc of America Commercial Mortgage Trust, | | | | |
| | 26 | | | Series 2006-2, Class B, VAR, 5.746%, 05/10/45 | | | 26 | |
| | 1,435 | | | Series 2007-3, Class AJ, VAR, 5.628%, 06/10/49 | | | 1,456 | |
| | 2,400 | | | Series 2007-3, Class B, VAR, 5.628%, 06/10/49 | | | 2,405 | |
| | 1,610 | | | Series 2007-4, Class AJ, VAR, 5.887%, 02/10/51 | | | 1,630 | |
| | | | Bear Stearns Commercial Mortgage Securities Trust, | | | | |
| | 4,060 | | | Series 2006-PW13, Class B, VAR, 5.660%, 09/11/41 (e) | | | 3,942 | |
| | 1,073 | | | Series 2006-PW14, Class AJ, 5.273%, 12/11/38 | | | 1,074 | |
| | 6,820 | | | Series 2007-PW16, Class AJ, VAR, 5.699%, 06/11/40 | | | 6,836 | |
| | 3,825 | | | Series 2007-PW17, Class AJ, VAR, 5.886%, 06/11/50 | | | 3,861 | |
| | 3,435 | | | CD Mortgage Trust, Series 2007-CD5, Class C, VAR, 6.124%, 11/15/44 | | | 3,497 | |
| | 1,400 | | | CG-CCRE Commercial Mortgage Trust, Series 2014-FL2, Class A, VAR, 2.624%, 11/15/31 (e) | | | 1,400 | |
| | | | Citigroup Commercial Mortgage Trust, | | | | |
| | 2,475 | | | Series 2014-GC23, Class D, VAR, 4.516%, 07/10/47 (e) | | | 2,104 | |
| | 4,125 | | | Series 2015-P1, Class D, 3.225%, 09/15/48 (e) | | | 3,266 | |
| | 2,092 | | | Series 2016-C3, Class C, 4.140%, 11/15/49 | | | 2,036 | |
| | | | Commercial Mortgage Trust, | | | | |
| | 100 | | | Series 2004-GG1, Class H, VAR, 6.417%, 06/10/36 (e) | | | 92 | |
| | 1,790 | | | Series 2006-C8, Class AJ, 5.377%, 12/10/46 | | | 1,789 | |
SEE NOTES TO FINANCIAL STATEMENTS.
| | | | | | |
| | | |
| 8 | | | | J.P. MORGAN INCOME FUNDS | | FEBRUARY 28, 2017 |
| | | | | | | | |
PRINCIPAL AMOUNT | | | SECURITY DESCRIPTION | | VALUE | |
| | Commercial Mortgage-Backed Securities — continued | |
| | | | United States — continued | |
| | 1,840 | | | Series 2014-CR15, Class D, VAR, 4.761%, 02/10/47 (e) | | | 1,671 | |
| | 2,200 | | | Series 2015-CR23, Class CMC, VAR, 3.685%, 05/10/48 (e) | | | 2,169 | |
| | 3,620 | | | Series 2015-CR24, Class A5, 3.696%, 08/10/48 | | | 3,753 | |
| | 1,070 | | | Series 2015-CR24, Class D, VAR, 3.463%, 08/10/48 | | | 820 | |
| | 5,180 | | | Series 2016-COR1, Class C, VAR, 4.396%, 10/10/49 | | | 5,135 | |
| | 1,999 | | | Credit Suisse Commercial Mortgage Trust, Series 2007-C1, Class AM, 5.416%, 02/15/40 | | | 1,997 | |
| | | | GS Mortgage Securities Trust, | | | | |
| | 1,580 | | | Series 2007-GG10, Class AM, VAR, 5.865%, 08/10/45 | | | 1,578 | |
| | 3,150 | | | Series 2016-GS2, Class D, 2.753%, 05/10/49 (e) | | | 2,349 | |
| | 1,139 | | | Series 2016-GS4, Class C, VAR, 3.804%, 11/10/49 | | | 1,102 | |
| | | | JP Morgan Chase Commercial Mortgage Securities Trust, | | | | |
| | 120 | | | Series 2005-LDP2, Class D, VAR, 4.941%, 07/15/42 | | | 120 | |
| | 1,395 | | | Series 2006-LDP8, Class C, VAR, 5.549%, 05/15/45 | | | 1,397 | |
| | 6,345 | | | Series 2007-LD11, Class AM, VAR, 5.787%, 06/15/49 | | | 6,436 | |
| | 5,035 | | | Series 2007-LDPX, Class AM, VAR, 5.464%, 01/15/49 | | | 5,026 | |
| | 2,870 | | | LB Commercial Mortgage Trust, Series 2007-C3, Class AJ, VAR, 5.967%, 07/15/44 | | | 2,829 | |
| | | | LB-UBS Commercial Mortgage Trust, | | | | |
| | 3,603 | | | Series 2006-C6, Class AJ, VAR, 5.452%, 09/15/39 | | | 3,184 | |
| | 2,121 | | | Series 2007-C1, Class C, VAR, 5.533%, 02/15/40 | | | 2,120 | |
| | 6,030 | | | Series 2007-C6, Class AJ, VAR, 6.175%, 07/15/40 | | | 6,064 | |
| | 1,415 | | | LMREC, Inc., Series 2016-CRE2, Class A, VAR, 2.477%, 11/24/31 (e) | | | 1,415 | |
| | 248 | | | ML-CFC Commercial Mortgage Trust, Series 2006-4, Class AJ, 5.239%, 12/12/49 | | | 249 | |
| | | | Morgan Stanley Bank of America Merrill Lynch Trust, | | | | |
| | 2,430 | | | Series 2014-C14, Class D, VAR, 4.830%, 02/15/47 (e) | | | 2,152 | |
| | | | | | | | |
PRINCIPAL AMOUNT | | | SECURITY DESCRIPTION | | VALUE | |
| | | | | | | | |
| | | | United States — continued | |
| | 1,060 | | | Series 2014-C19, Class D, 3.250%, 12/15/47 (e) | | | 830 | |
| | 4,447 | | | Series 2016-C31, Class C, VAR, 4.322%, 11/15/49 | | | 4,261 | |
| | | | Morgan Stanley Capital I Trust, | | | | |
| | 1,537 | | | Series 2005-HQ7, Class D, VAR, 5.149%, 11/14/42 | | | 1,533 | |
| | 255 | | | Series 2006-HQ8, Class D, VAR, 5.493%, 03/12/44 | | | 105 | |
| | 2,630 | | | Series 2006-HQ9, Class D, VAR, 5.862%, 07/12/44 | | | 2,626 | |
| | 1,628 | | | Series 2006-HQ10, Class AJ, VAR, 5.389%, 11/12/41 | | | 1,628 | |
| | 3,273 | | | Series 2007-HQ11, Class AJ, VAR, 5.508%, 02/12/44 | | | 3,275 | |
| | 2,533 | | | Series 2016-BNK2, Class D, VAR, 3.000%, 11/15/49 (e) | | | 1,946 | |
| | | | Wachovia Bank Commercial Mortgage Trust, | | | | |
| | 100 | | | Series 2005-C21, Class F, VAR, 5.289%, 10/15/44 (e) | | | 89 | |
| | 2,893 | | | Series 2006-C29, Class AJ, VAR, 5.368%, 11/15/48 | | | 2,912 | |
| | 6,105 | | | Series 2007-C31, Class AJ, VAR, 5.660%, 04/15/47 | | | 6,150 | |
| | 2,530 | | | Series 2007-C33, Class AJ, VAR, 5.975%, 02/15/51 | | | 2,537 | |
| | 2,600 | | | Series 2007-C33, Class B, VAR, 5.975%, 02/15/51 | | | 2,537 | |
| | 2,600 | | | Series 2007-C33, Class C, VAR, 5.975%, 02/15/51 | | | 2,412 | |
| | 250 | | | Series 2007-C34, Class AJ, VAR, 5.952%, 05/15/46 | | | 251 | |
| | | | Wells Fargo Commercial Mortgage Trust, | | | | |
| | 1,370 | | | Series 2010-C1, Class C, VAR, 5.599%, 11/15/43 (e) | | | 1,483 | |
| | 1,250 | | | Series 2015-NXS2, Class A5, VAR, 3.767%, 07/15/58 | | | 1,303 | |
| | 1,276 | | | Series 2016-BNK1, Class D, 3.000%, 08/15/49 (e) | | | 1,018 | |
| | | | | | | | |
| | | | Total Commercial Mortgage-Backed Securities
(Cost $125,337) | | | 123,876 | |
| | | | | | | | |
| | |
| SHARES | | | | | | |
| | Common Stocks — 0.2% | |
| | | | Colombia — 0.2% | |
| | 14 | | | Pacific Exploration and Production Corp. (a) | | | 583 | |
| | 47 | | | Pacific Exploration and Production Corp. (a) | | | 1,825 | |
| | | | | | | | |
| | | | | | | 2,408 | |
| | | | | | | | |
SEE NOTES TO FINANCIAL STATEMENTS.
| | | | | | | | |
| | | |
| FEBRUARY 28, 2017 | | J.P. MORGAN INCOME FUNDS | | | | | 9 | |
JPMorgan Global Bond Opportunities Fund
SCHEDULE OF PORTFOLIO INVESTMENTS
AS OF FEBRUARY 28, 2017 (Unaudited) (continued)
(Amounts in U.S. Dollars, unless otherwise noted)
(Amounts in thousands)
| | | | | | | | |
SHARES | | | SECURITY DESCRIPTION | | VALUE | |
| | Common Stocks — continued | |
| | | | United States — 0.0% (g) | |
| | 3 | | | NII Holdings, Inc. (a) | | | 6 | |
| | 4 | | | Penn Virginia Corp. (a) | | | 200 | |
| | 6 | | | Vistra Energy Corp. | | | 100 | |
| | | | | | | | |
| | | | | | | 306 | |
| | | | | | | | |
| | | | Total Common Stocks
(Cost $2,552) | | | 2,714 | |
| | | | | | | | |
| | |
PRINCIPAL
AMOUNT | | | | | | |
| | Convertible Bonds — 3.6% | |
| | | | China — 0.2% | | | | |
| | 3,050 | | | Ctrip.com International Ltd., 1.000%, 07/01/20 | | | 3,321 | |
| | | | | | | | |
| | | | Netherlands — 0.1% | | | | |
| | 1,565 | | | NXP Semiconductors NV, 1.000%, 12/01/19 | | | 1,806 | |
| | | | | | | | |
| | | | South Korea — 0.1% | | | | |
| | 830 | | | MagnaChip Semiconductor SA, 5.000%, 03/01/21 (e) | | | 955 | |
| | | | | | | | |
| | | | United Arab Emirates — 0.0% (g) | | | | |
| EU | R 500 | | | Aabar Investments PJSC, Reg. S, 0.500%, 03/27/20 | | | 471 | |
| | | | | | | | |
| | | | United States — 3.2% | | | | |
| | 1,490 | | | Aerojet Rocketdyne Holdings, Inc., 2.250%, 12/15/23 (e) | | | 1,516 | |
| | 2,315 | | | Cypress Semiconductor Corp., 4.500%, 01/15/22 (e) | | | 2,798 | |
| | 1,990 | | | Envestnet, Inc., 1.750%, 12/15/19 | | | 1,910 | |
| | | | Finisar Corp., | | | | |
| | 1,470 | | | 0.500%, 12/15/33 | | | 1,829 | |
| | 1,000 | | | 0.500%, 12/15/36 (e) | | | 1,055 | |
| | 2,045 | | | General Cable Corp., SUB, 4.500%, 11/15/29 | | | 1,515 | |
| | 1,310 | | | HealthSouth Corp., 2.000%, 12/01/43 | | | 1,574 | |
| | 2,300 | | | Intel Corp., 2.950%, 12/15/35 | | | 3,119 | |
| | 1,710 | | | Liberty Media Corp.-Liberty Formula One, 1.000%, 01/30/23 (e) | | | 1,781 | |
| | 3,560 | | | Live Nation Entertainment, Inc., 2.500%, 05/15/19 | | | 3,803 | |
| | 2,950 | | | Nabors Industries, Inc., 0.750%, 01/15/24 (e) | | | 2,847 | |
| | 1,085 | | | Newpark Resources, Inc., 4.000%, 10/01/17 | | | 1,099 | |
| | 3,005 | | | Nuance Communications, Inc., 1.500%, 11/01/35 | | | 3,084 | |
| | 2,085 | | | Oasis Petroleum, Inc., 2.625%, 09/15/23 | | | 2,824 | |
| | 3,470 | | | ON Semiconductor Corp., 1.000%, 12/01/20 | | | 3,782 | |
| | 2,440 | | | Red Hat, Inc., 0.250%, 10/01/19 | | | 3,110 | |
| | 1,380 | | | Shutterfly, Inc., 0.250%, 05/15/18 | | | 1,366 | |
| | | | | | | | |
PRINCIPAL
AMOUNT | | | SECURITY DESCRIPTION | | VALUE | |
| | | | | | | | |
| | | | United States — continued | |
| | 2,575 | | | Synchronoss Technologies, Inc., 0.750%, 08/15/19 | | | 2,435 | |
| | 1,335 | | | Teradyne, Inc., 1.250%, 12/15/23 (e) | | | 1,490 | |
| | 805 | | | Wabash National Corp., 3.375%, 05/01/18 | | | 1,487 | |
| | 1,855 | | | Web.com Group, Inc., 1.000%, 08/15/18 | | | 1,795 | |
| | 3,255 | | | Zillow Group, Inc., 2.000%, 12/01/21 (e) | | | 3,241 | |
| | | | | | | | |
| | | | | | | 49,460 | |
| | | | | | | | |
| | | | Total Convertible Bonds
(Cost $54,416) | | | 56,013 | |
| | | | | | | | |
| | Corporate Bonds — 57.0% | |
| | | | Argentina — 0.2% | | | | |
| | 2,630 | | | Petrobras Argentina SA, 7.375%, 07/21/23 (e) | | | 2,716 | |
| | 700 | | | YPF SA, Reg. S, 8.500%, 03/23/21 | | | 769 | |
| | | | | | | | |
| | | | | | | 3,485 | |
| | | | | | | | |
| | | | Australia — 0.3% | |
| | 1,215 | | | Australia & New Zealand Banking Group Ltd., VAR, 6.750%, 06/15/26 (e) (x) (y) | | | 1,314 | |
| | GBP 2,000 | | | BHP Billiton Finance Ltd., Reg. S, VAR, 6.500%, 10/22/77 | | | 2,832 | |
| | 35 | | | Nufarm Australia Ltd., 6.375%, 10/15/19 (e) | | | 36 | |
| | | | | | | | |
| | | | | | | 4,182 | |
| | | | | | | | |
| | | | Bahamas — 0.0% (g) | |
| | 565 | | | Ultrapetrol Bahamas Ltd., 8.875%, 06/15/21 (d) | | | 113 | |
| | | | | | | | |
| | | | Barbados — 0.1% | |
| | 700 | | | Columbus Cable Barbados Ltd., Reg. S, 7.375%, 03/30/21 | | | 744 | |
| | | | | | | | |
| | | | Belgium — 0.7% | |
| | | | Anheuser-Busch InBev Finance, Inc., | | | | |
| | 4,565 | | | 3.650%, 02/01/26 | | | 4,631 | |
| | 2,055 | | | 4.900%, 02/01/46 | | | 2,258 | |
| | EUR 1,970 | | | KBC Group NV, Reg. S, VAR, 5.625%, 03/19/19 (x) (y) | | | 2,126 | |
| | EUR 1,750 | | | Ontex Group NV, Reg. S, 4.750%, 11/15/21 | | | 1,948 | |
| | | | | | | | |
| | | | | | | 10,963 | |
| | | | | | | | |
| | | | Brazil — 1.1% | |
| | 700 | | | Banco Votorantim SA, Reg. S, 7.375%, 01/21/20 | | | 752 | |
| | 1,560 | | | Eldorado Intl. Finance GmbH, 8.625%, 06/16/21 (e) | | | 1,326 | |
| | | | JBS USA LUX SA, | | | | |
| | 236 | | | 5.750%, 06/15/25 (e) | | | 243 | |
| | 1,137 | | | 5.875%, 07/15/24 (e) | | | 1,188 | |
SEE NOTES TO FINANCIAL STATEMENTS.
| | | | | | |
| | | |
| 10 | | | | J.P. MORGAN INCOME FUNDS | | FEBRUARY 28, 2017 |
| | | | | | | | |
PRINCIPAL
AMOUNT | | | SECURITY DESCRIPTION | | VALUE | |
| | Corporate Bonds — continued | |
| | | | Brazil — continued | |
| | 545 | | | 7.250%, 06/01/21 (e) | | | 561 | |
| | 260 | | | 8.250%, 02/01/20 (e) | | | 267 | |
| | | | Petrobras Global Finance BV, | | | | |
| | 540 | | | 6.125%, 01/17/22 | | | 555 | |
| | 2,900 | | | 6.850%, 06/05/15 | | | 2,509 | |
| | 3,305 | | | 8.750%, 05/23/26 | | | 3,746 | |
| | 2,430 | | | Suzano Austria GmbH, 5.750%, 07/14/26 (e) | | | 2,485 | |
| | 2,750 | | | Votorantim Cimentos SA, Reg. S, 7.250%, 04/05/41 | | | 2,778 | |
| | | | | | | | |
| | | | | | | 16,410 | |
| | | | | | | | |
| | | | Canada — 1.0% | |
| | 1,435 | | | 1011778 BC ULC, 6.000%, 04/01/22 (e) | | | 1,496 | |
| | 188 | | | ATS Automation Tooling Systems, Inc., 6.500%, 06/15/23 (e) | | | 196 | |
| | | | Baytex Energy Corp., | | | | |
| | 100 | | | 5.125%, 06/01/21 (e) | | | 91 | |
| | 75 | | | 5.625%, 06/01/24 (e) | | | 69 | |
| | | | Bombardier, Inc., | | | | |
| | 40 | | | 4.750%, 04/15/19 (e) | | | 41 | |
| | 169 | | | 6.125%, 01/15/23 (e) | | | 169 | |
| | 333 | | | 8.750%, 12/01/21 (e) | | | 369 | |
| | 230 | | | Cascades, Inc., 5.500%, 07/15/22 (e) | | | 233 | |
| | 2,600 | | | Cenovus Energy, Inc., 6.750%, 11/15/39 | | | 2,939 | |
| | 307 | | | Concordia International Corp., 7.000%, 04/15/23 (e) | | | 120 | |
| | 733 | | | Cott Beverages, Inc., 6.750%, 01/01/20 | | | 758 | |
| | 110 | | | DS Services of America, Inc., 10.000%, 09/01/21 (e) | | | 119 | |
| | 2,025 | | | Encana Corp., 6.500%, 08/15/34 | | | 2,317 | |
| | 25 | | | Garda World Security Corp., 7.250%, 11/15/21 (e) | | | 24 | |
| | 182 | | | Kronos Acquisition Holdings, Inc., 9.000%, 08/15/23 (e) | | | 186 | |
| | 325 | | | Lundin Mining Corp., 7.875%, 11/01/22 (e) | | | 356 | |
| | 194 | | | Mattamy Group Corp., 6.500%, 11/15/20 (e) | | | 199 | |
| | | | MEG Energy Corp., | | | | |
| | 800 | | | 6.375%, 01/30/23 (e) | | | 710 | |
| | 264 | | | 6.500%, 03/15/21 (e) | | | 270 | |
| | 405 | | | New Gold, Inc., 6.250%, 11/15/22 (e) | | | 409 | |
| | | | NOVA Chemicals Corp., | | | | |
| | 171 | | | 5.000%, 05/01/25 (e) | | | 173 | |
| | 80 | | | 5.250%, 08/01/23 (e) | | | 82 | |
| | 227 | | | Open Text Corp., 5.625%, 01/15/23 (e) | | | 238 | |
| | 350 | | | Precision Drilling Corp., 5.250%, 11/15/24 | | | 347 | |
| | 1,625 | | | Quebecor Media, Inc., 5.750%, 01/15/23 | | | 1,733 | |
| | | | | | | | |
PRINCIPAL
AMOUNT | | | SECURITY DESCRIPTION | | VALUE | |
| | | | | | | | |
| | | | Canada — continued | | | | |
| | | | Teck Resources Ltd., | | | | |
| | 30 | | | 8.000%, 06/01/21 (e) | | | 33 | |
| | 120 | | | 8.500%, 06/01/24 (e) | | | 140 | |
| | 357 | | | Transcanada Trust, VAR, 5.625%, 05/20/75 | | | 372 | |
| | 1,300 | | | Videotron Ltd., 5.375%, 06/15/24 (e) | | | 1,386 | |
| | | | | | | | |
| | | | | | | 15,575 | |
| | | | | | | | |
| | | | Chile — 0.3% | |
| | 1,980 | | | Empresa Electrica Angamos SA, 4.875%, 05/25/29 (e) | | | 1,976 | |
| | 1,720 | | | Empresa Electrica Guacolda SA, 4.560%, 04/30/25 (e) | | | 1,641 | |
| | 1,400 | | | VTR Finance BV, Reg. S, 6.875%, 01/15/24 | | | 1,473 | |
| | | | | | | | |
| | | | | | | 5,090 | |
| | | | | | | | |
| | | | China — 0.1% | |
| | 700 | | | Agile Group Holdings Ltd., Reg. S, 9.000%, 05/21/20 | | | 768 | |
| | 700 | | | Moon Wise Global Ltd., Reg. S, VAR, 9.000%, 01/28/19 (x) (y) | | | 760 | |
| | 700 | | | West China Cement Ltd., Reg. S, 6.500%, 09/11/19 | | | 729 | |
| | | | | | | | |
| | | | | | | 2,257 | |
| | | | | | | | |
| | | | Colombia — 0.1% | |
| | 1,881 | | | Pacific Exploration and Production Corp., 10.000% (cash), 11/02/21 (v) | | | 2,114 | |
| | | | | | | | |
| | | | Denmark — 0.0% (g) | |
| | | | Danske Bank A/S, | | | | |
| GBP | 195 | | | Reg. S, VAR, 5.375%, 09/29/21 | | | 256 | |
| EUR | 380 | | | Reg. S, VAR, 5.750%, 04/06/20 (x) (y) | | | 426 | |
| | | | | | | | |
| | | | | | | 682 | |
| | | | | | | | |
| | | | France — 2.6% | |
| | 15 | | | Alcatel-Lucent USA, Inc., 6.450%, 03/15/29 | | | 16 | |
| EUR | 700 | | | Arkema SA, Reg. S, VAR, 4.750%, 10/29/20 (x) (y) | | | 790 | |
| EUR | 1,000 | | | BiSoho SAS, Reg. S, 5.875%, 05/01/23 | | | 1,131 | |
| | 2,500 | | | BPCE SA, 5.150%, 07/21/24 (e) | | | 2,553 | |
| | | | Credit Agricole SA, | | | | |
| GBP | 450 | | | Reg. S, VAR, 8.125%, 10/26/19 (x) (y) | | | 623 | |
| | 1,250 | | | VAR, 8.125%, 12/23/25 (e) (x) (y) | | | 1,336 | |
| EUR | 1,300 | | | Elis SA, Reg. S, 3.000%, 04/30/22 | | | 1,417 | |
| EUR | 2,600 | | | Europcar Groupe SA, Reg. S, 5.750%, 06/15/22 | | | 2,906 | |
| EUR | 467 | | | Holdikks SAS, Reg. S, 6.750%, 07/15/21 | | | 338 | |
| EUR | 1,450 | | | Holding Medi-Partenaires SAS, Reg. S, 7.000%, 05/15/20 | | | 1,612 | |
| EUR | 2,710 | | | Labeyrie Fine Foods SAS, Reg. S, 5.625%, 03/15/21 | | | 2,937 | |
SEE NOTES TO FINANCIAL STATEMENTS.
| | | | | | | | |
| | | |
| FEBRUARY 28, 2017 | | J.P. MORGAN INCOME FUNDS | | | | | 11 | |
JPMorgan Global Bond Opportunities Fund
SCHEDULE OF PORTFOLIO INVESTMENTS
AS OF FEBRUARY 28, 2017 (Unaudited) (continued)
(Amounts in U.S. Dollars, unless otherwise noted)
(Amounts in thousands)
| | | | | | | | |
PRINCIPAL
AMOUNT | | | SECURITY DESCRIPTION | | VALUE | |
| | Corporate Bonds — continued | |
| | | | France — continued | |
| | | | NEW Areva Holding SA, | | | | |
| EUR | 2,600 | | | 4.375%, 11/06/19 | | | 2,802 | |
| EUR | 2,000 | | | 4.875%, 09/23/24 | | | 2,142 | |
| EUR | 2,250 | | | Peugeot SA, Reg. S, 2.375%, 04/14/23 | | | 2,455 | |
| EUR | 1,450 | | | Rexel SA, Reg. S, 3.250%, 06/15/22 | | | 1,596 | |
| | | | SFR Group SA, | | | | |
| | 1,700 | | | 6.000%, 05/15/22 (e) | | | 1,764 | |
| | 250 | | | 6.250%, 05/15/24 (e) | | | 253 | |
| EUR | 5,050 | | | Reg. S, 5.375%, 05/15/22 | | | 5,580 | |
| | | | Societe Generale SA, | | | | |
| | 1,470 | | | VAR, 7.375%, 09/13/21 (e) (x) (y) | | | 1,488 | |
| | 2,130 | | | VAR, 8.000%, 09/29/25 (e) (x) (y) | | | 2,181 | |
| EUR | 1,750 | | | TOTAL SA, Reg. S, VAR, 3.875%, 05/18/22 (x) (y) | | | 1,974 | |
| EUR | 2,000 | | | Verallia Packaging SASU, Reg. S, 5.125%, 08/01/22 | | | 2,248 | |
| | | | | | | | |
| | | | | | | 40,142 | |
| | | | | | | | |
| | | | Germany — 2.4% | |
| EUR | 300 | | | Allianz SE, Reg. S, VAR, 4.750%, 10/24/23 (x) (y) | | | 355 | |
| EUR | 1,850 | | | CeramTec Group GmbH, Reg. S, 8.250%, 08/15/21 | | | 2,091 | |
| EUR | 500 | | | Commerzbank AG, 7.750%, 03/16/21 | | | 639 | |
| EUR | 1,400 | | | Douglas GmbH, Reg. S, 6.250%, 07/15/22 | | | 1,624 | |
| | | | Fresenius Medical Care US Finance II, Inc., | | | | |
| | 295 | | | 4.750%, 10/15/24 (e) | | | 303 | |
| | 250 | | | 5.875%, 01/31/22 (e) | | | 273 | |
| EUR | 3,450 | | | HP Pelzer Holding GmbH, Reg. S, 7.500%, 07/15/21 | | | 3,878 | |
| | 346 | | | IHO Verwaltungs GmbH, 4.750% (cash), 09/15/26 (e) (v) | | | 342 | |
| EUR | 250 | | | Kirk Beauty One GmbH, Reg. S, 8.750%, 07/15/23 | | | 293 | |
| EUR | 1,800 | | | ProGroup AG, Reg. S, 5.125%, 05/01/22 | | | 2,026 | |
| EUR | 5,300 | | | Schaeffler Finance BV, Reg. S, 3.250%, 05/15/25 | | | 6,072 | |
| | 4,410 | | | Siemens Financieringsmaatschappij NV, 2.350%, 10/15/26 (e) | | | 4,138 | |
| EUR | 1,100 | | | Techem Energy Metering Service GmbH & Co. KG, Reg. S, 7.875%, 10/01/20 | | | 1,212 | |
| | | | Unitymedia Hessen GmbH & Co. KG, | | | | |
| | 200 | | | 5.500%, 01/15/23 (e) | | | 209 | |
| EUR | 2,200 | | | Reg. S, 4.000%, 01/15/25 | | | 2,458 | |
| EUR | 4,374 | | | Reg. S, 5.125%, 01/21/23 | | | 4,899 | |
| | | | | | | | |
PRINCIPAL
AMOUNT | | | SECURITY DESCRIPTION | | VALUE | |
| | | | | | | | |
| | | | Germany — continued | |
| EUR | 2,000 | | | WEPA Hygieneprodukte GmbH, Reg. S, 3.750%, 05/15/24 | | | 2,226 | |
| | | | ZF North America Capital, Inc., | | | | |
| | 167 | | | 4.500%, 04/29/22 (e) | | | 173 | |
| | 1,244 | | | 4.750%, 04/29/25 (e) | | | 1,282 | |
| EUR | 2,000 | | | Reg. S, 2.750%, 04/27/23 | | | 2,248 | |
| | | | | | | | |
| | | | | | | 36,741 | |
| | | | | | | | |
| | | | Greece — 0.0% (g) | |
| EUR | 450 | | | OTE plc, Reg. S, 3.500%, 07/09/20 | | | 479 | |
| | | | | | | | |
| | | | Guatemala — 0.1% | |
| | 700 | | | Comcel Trust, Reg. S, 6.875%, 02/06/24 | | | 741 | |
| | | | | | | | |
| | | | Hong Kong — 0.1% | |
| | 700 | | | Shimao Property Holdings Ltd., Reg. S, 8.375%, 02/10/22 | | | 783 | |
| | 700 | | | Studio City Co. Ltd., Reg. S, 7.250%, 11/30/21 | | | 749 | |
| | | | | | | | |
| | | | | | | 1,532 | |
| | | | | | | | |
| | | | Indonesia — 0.1% | |
| | 1,450 | | | Star Energy Geothermal Wayang Windu Ltd.,
Reg. S, 6.125%, 03/27/20 | | | 1,494 | |
| | | | | | | | |
| | | | Ireland — 0.8% | |
| | | | Ardagh Packaging Finance plc, | | | | |
| | 300 | | | 6.000%, 06/30/21 (e) | | | 311 | |
| EUR | 957 | | | 6.750%, 05/15/24 (e) | | | 1,122 | |
| EUR | 1,500 | | | Reg. S, 4.125%, 05/15/23 | | | 1,691 | |
| EUR | 600 | | | Reg. S, 6.750%, 05/15/24 | | | 703 | |
| EUR | 1,870 | | | Bank of Ireland, Reg. S, VAR, 7.375%, 06/18/20 (x) (y) | | | 2,116 | |
| EUR | 3,150 | | | eircom Finance DAC, Reg. S, 4.500%, 05/31/22 | | | 3,494 | |
| EUR | 2,900 | | | Smurfit Kappa Acquisitions Unltd Co., Reg. S, 3.250%, 06/01/21 | | | 3,321 | |
| | | | | | | | |
| | | | | | | 12,758 | |
| | | | | | | | |
| | | | Israel — 0.1% | |
| | | | Teva Pharmaceutical Finance Netherlands III BV, | | | | |
| | 1,085 | | | 2.200%, 07/21/21 | | | 1,045 | |
| | 1,300 | | | 3.150%, 10/01/26 | | | 1,197 | |
| | | | | | | | |
| | | | | | | 2,242 | |
| | | | | | | | |
| | | | Italy — 1.1% | |
| EUR | 1,050 | | | Enel SpA, Reg. S, VAR, 6.500%, 01/10/74 | | | 1,201 | |
| EUR | 600 | | | Intesa Sanpaolo SpA, Reg. S, 6.625%, 09/13/23 | | | 750 | |
| EUR | 3,000 | | | Leonardo SpA, 4.500%, 01/19/21 | | | 3,565 | |
| EUR | 1,500 | | | Saipem Finance International BV, Reg. S, 3.750%, 09/08/23 | | | 1,672 | |
SEE NOTES TO FINANCIAL STATEMENTS.
| | | | | | |
| | | |
| 12 | | | | J.P. MORGAN INCOME FUNDS | | FEBRUARY 28, 2017 |
| | | | | | | | |
PRINCIPAL
AMOUNT | | | SECURITY DESCRIPTION | | VALUE | |
| | Corporate Bonds — continued | |
| | | | Italy — continued | |
| | | | Telecom Italia SpA, | | | | |
| EUR | 2,500 | | | Reg. S, 3.250%, 01/16/23 | | | 2,800 | |
| EUR | 2,350 | | | Reg. S, 3.625%, 05/25/26 | | | 2,583 | |
| | | | Wind Acquisition Finance SA, | | | | |
| | 815 | | | 7.375%, 04/23/21 (e) | | | 849 | |
| EUR | 400 | | | Reg. S, 4.000%, 07/15/20 | | | 432 | |
| EUR | 3,350 | | | Reg. S, 7.000%, 04/23/21 | | | 3,696 | |
| | | | | | | | |
| | | | | | | 17,548 | |
| | | | | | | | |
| | | | Jamaica — 0.1% | |
| | 1,574 | | | Digicel Group Ltd., Reg. S, 7.125%, 04/01/22 | | | 1,276 | |
| | | | | | | | |
| | | | Japan — 0.1% | |
| | | | SoftBank Group Corp., | | | | |
| | 200 | | | 4.500%, 04/15/20 (e) | | | 207 | |
| EUR | 1,550 | | | Reg. S, 4.000%, 07/30/22 | | | 1,818 | |
| | | | | | | | |
| | | | | | | 2,025 | |
| | | | | | | | |
| | | | Kazakhstan — 0.4% | |
| | 6,090 | | | Tengizchevroil Finance Co. International Ltd., 4.000%, 08/15/26 (e) | | | 5,856 | |
| | | | | | | | |
| | | | Luxembourg — 3.0% | |
| | | | Altice Financing SA, | | | | |
| | 700 | | | 6.625%, 02/15/23 (e) | | | 736 | |
| EUR | 3,450 | | | Reg. S, 5.250%, 02/15/23 | | | 3,905 | |
| | | | Altice Luxembourg SA, | | | | |
| | 200 | | | 7.625%, 02/15/25 (e) | | | 213 | |
| | 750 | | | 7.750%, 05/15/22 (e) | | | 798 | |
| EUR | 300 | | | Reg. S, 6.250%, 02/15/25 | | | 338 | |
| EUR | 5,575 | | | Reg. S, 7.250%, 05/15/22 | | | 6,268 | |
| | | | ArcelorMittal, | | | | |
| | 1,465 | | | 7.000%, 02/25/22 | | | 1,667 | |
| EUR | 2,500 | | | Reg. S, 2.875%, 07/06/20 | | | 2,830 | |
| | 1,750 | | | FAGE International SA, 5.625%, 08/15/26 (e) | | | 1,798 | |
| EUR | 845 | | | Galapagos Holding SA, Reg. S, 7.000%, 06/15/22 | | | 787 | |
| EUR | 225 | | | Galapagos SA, Reg. S, 5.375%, 06/15/21 | | | 238 | |
| | | | Garfunkelux Holdco 3 SA, | | | | |
| EUR | 1,950 | | | Reg. S, 7.500%, 08/01/22 | | | 2,180 | |
| GBP | 2,000 | | | Reg. S, 8.500%, 11/01/22 | | | 2,593 | |
| | | | INEOS Group Holdings SA, | | | | |
| | 2,250 | | | 5.875%, 02/15/19 (e) | | | 2,283 | |
| EUR | 450 | | | Reg. S, 5.375%, 08/01/24 | | | 502 | |
| | 62 | | | Intelsat Connect Finance SA, 12.500%, 04/01/22 (e) | | | 54 | |
| | | | Intelsat Jackson Holdings SA, | | | | |
| | 667 | | | 5.500%, 08/01/23 | | | 553 | |
| | | | | | | | |
PRINCIPAL
AMOUNT | | | SECURITY DESCRIPTION | | VALUE | |
| | | | | | | | |
| | | | Luxembourg — continued | |
| | 162 | | | 7.250%, 04/01/19 | | | 155 | |
| | 202 | | | 7.250%, 10/15/20 | | | 187 | |
| | 1,945 | | | 7.500%, 04/01/21 | | | 1,780 | |
| | 612 | | | 8.000%, 02/15/24 (e) | | | 662 | |
| EUR | 1,350 | | | Kloeckner Pentaplast of America, Inc., Reg. S, 7.125%, 11/01/20 | | | 1,493 | |
| EUR | 1,900 | | | Matterhorn Telecom SA, Reg. S, 3.875%, 05/01/22 | | | 2,088 | |
| EUR | 400 | | | Picard Bondco SA, Reg. S, 7.750%, 02/01/20 | | | 443 | |
| EUR | 1,250 | | | SES SA, Reg. S, VAR, 4.625%, 01/02/22 (x) (y) | | | 1,377 | |
| EUR | 4,500 | | | SIG Combibloc Holdings SCA, Reg. S, 7.750%, 02/15/23 | | | 5,137 | |
| EUR | 1,500 | | | Swissport Investments SA, Reg. S, 6.750%, 12/15/21 | | | 1,742 | |
| EUR | 2,500 | | | Telenet Finance VI Luxembourg SCA, Reg. S, 4.875%, 07/15/27 | | | 2,871 | |
| EUR | 975 | | | Trionista TopCo GmbH, Reg. S, 6.875%, 04/30/21 | | | 1,081 | |
| | | | | | | | |
| | | | | | | 46,759 | |
| | | | | | | | |
| | | | Mexico — 0.8% | |
| | 1,900 | | | Banco Nacional de Comercio Exterior SNC, VAR, 3.800%, 08/11/26 (e) | | | 1,843 | |
| | 450 | | | Cemex Finance LLC, 9.375%, 10/12/22 (e) | | | 488 | |
| | | | Cemex SAB de CV, | | | | |
| | 1,250 | | | 5.700%, 01/11/25 (e) | | | 1,285 | |
| | 200 | | | 6.125%, 05/05/25 (e) | | | 209 | |
| | 650 | | | Comision Federal de Electricidad, 4.750%, 02/23/27 (e) | | | 640 | |
| | 1,940 | | | Elementia SAB de CV, 5.500%, 01/15/25 (e) | | | 1,911 | |
| | | | Petroleos Mexicanos, | | | | |
| | 3,400 | | | 6.875%, 08/04/26 | | | 3,713 | |
| | 2,681 | | | VAR, 4.606%, 03/11/22 (e) | | | 2,818 | |
| | | | | | | | |
| | | | | | | 12,907 | |
| | | | | | | | |
| | | | Morocco — 0.2% | | | | |
| | 3,100 | | | OCP SA, 4.500%, 10/22/25 (e) | | | 3,026 | |
| | | | | | | | |
| | | | Netherlands — 1.3% | | | | |
| | | | AerCap Ireland Capital DAC, | | | | |
| | 1,330 | | | 4.625%, 10/30/20 | | | 1,419 | |
| | 365 | | | 4.625%, 07/01/22 | | | 388 | |
| | 900 | | | Bluewater Holding BV, Reg. S, 10.000%, 12/10/19 (e) | | | 657 | |
| EUR | 600 | | | Hema Bondco I BV, Reg. S, 6.250%, 06/15/19 | | | 620 | |
| EUR | 1,500 | | | Lincoln Finance Ltd., Reg. S, 6.875%, 04/15/21 | | | 1,718 | |
SEE NOTES TO FINANCIAL STATEMENTS.
| | | | | | | | |
| | | |
| FEBRUARY 28, 2017 | | J.P. MORGAN INCOME FUNDS | | | | | 13 | |
JPMorgan Global Bond Opportunities Fund
SCHEDULE OF PORTFOLIO INVESTMENTS
AS OF FEBRUARY 28, 2017 (Unaudited) (continued)
(Amounts in U.S. Dollars, unless otherwise noted)
(Amounts in thousands)
| | | | | | | | |
PRINCIPAL
AMOUNT | | | SECURITY DESCRIPTION | | VALUE | |
| | Corporate Bonds — continued | |
| | | | Netherlands — continued | | | | |
| | | | NXP BV, | | | | |
| | 1,000 | | | 5.750%, 02/15/21 (e) | | | 1,029 | |
| | 1,000 | | | 5.750%, 03/15/23 (e) | | | 1,055 | |
| | | | Shell International Finance BV, | | | | |
| | 774 | | | 2.875%, 05/10/26 | | | 753 | |
| | 2,015 | | | 3.250%, 05/11/25 | | | 2,033 | |
| | 868 | | | 3.750%, 09/12/46 | | | 814 | |
| | 1,875 | | | 4.000%, 05/10/46 | | | 1,830 | |
| EUR | 2,150 | | | UPC Holding BV, Reg. S, 6.375%, 09/15/22 | | | 2,410 | |
| | 750 | | | UPCB Finance IV Ltd., 5.375%, 01/15/25 (e) | | | 767 | |
| | 800 | | | Zhaikmunai LLP, Reg. S, 7.125%, 11/13/19 | | | 782 | |
| EUR | 2,950 | | | Ziggo Bond Finance BV, Reg. S, 4.625%, 01/15/25 | | | 3,313 | |
| | | | | | | | |
| | | | | | | 19,588 | |
| | | | | | | | |
| | | | New Zealand — 0.1% | |
| | | | Reynolds Group Issuer, Inc., | | | | |
| | 900 | | | 5.750%, 10/15/20 | | | 927 | |
| | 713 | | | 6.875%, 02/15/21 | | | 733 | |
| | | | | | | | |
| | | | | | | 1,660 | |
| | | | | | | | |
| | | | Nigeria — 0.2% | |
| | 1,400 | | | Access Bank plc, 10.500%, 10/19/21 (e) | | | 1,468 | |
| | 1,400 | | | IHS Netherlands Holdco BV, 9.500%, 10/27/21 (e) | | | 1,472 | |
| | 585 | | | Sea Trucks Group Ltd., Reg. S, 9.000%, 03/26/18 (d) (e) | | | 219 | |
| | | | | | | | |
| | | | | | | 3,159 | |
| | | | | | | | |
| | | | Norway — 0.1% | |
| EUR | 1,400 | | | Lock A/S, Reg. S, 7.000%, 08/15/21 | | | 1,572 | |
| | | | | | | | |
| | | | Panama — 0.0% (g) | |
| | 700 | | | Global Bank Corp., Reg. S, 5.125%, 10/30/19 | | | 725 | |
| | | | | | | | |
| | | | Peru — 0.3% | |
| | 3,970 | | | Southern Copper Corp., 5.875%, 04/23/45 | | | 4,193 | |
| | | | | | | | |
| | | | Poland — 0.2% | |
| EUR | 1,950 | | | Play Finance 1 SA, Reg. S, 6.500%, 08/01/19 | | | 2,131 | |
| EUR | 1,250 | | | Play Topco SA, Reg. S, 7.750% (cash), 02/28/20 (v) | | | 1,341 | |
| | | | | | | | |
| | | | | | | 3,472 | |
| | | | | | | | |
| | | | Portugal — 0.3% | |
| EUR | 1,800 | | | EDP — Energias de Portugal SA, Reg. S, VAR, 5.375%, 09/16/75 | | | 2,014 | |
| | | | EDP Finance BV, | | | | |
| | 400 | | | 5.250%, 01/14/21 (e) | | | 427 | |
| EUR | 2,000 | | | Reg. S, 2.375%, 03/23/23 | | | 2,201 | |
| | | | | | | | |
| | | | | | | 4,642 | |
| | | | | | | | |
| | | | | | | | |
PRINCIPAL
AMOUNT | | | SECURITY DESCRIPTION | | VALUE | |
| | |
| | | | Spain — 1.4% | |
| EUR | 1,200 | | | Banco Bilbao Vizcaya Argentaria SA, Reg. S, VAR, 8.875%, 04/14/21 (x) (y) | | | 1,396 | |
| EUR | 1,500 | | | Campofrio Food Group SA, Reg. S, 3.375%, 03/15/22 | | | 1,647 | |
| EUR | 2,250 | | | Cirsa Funding Luxembourg SA, Reg. S, 5.750%, 05/15/21 | | | 2,515 | |
| EUR | 957 | | | eDreams ODIGEO SA, 8.500%, 08/01/21 (e) | | | 1,086 | |
| | | | Gestamp Funding Luxembourg SA, | | | | |
| EUR | 946 | | | 3.500%, 05/15/23 (e) | | | 1,050 | |
| EUR | 700 | | | Reg. S, 3.500%, 05/15/23 | | | 778 | |
| EUR | 1,825 | | | Grupo Antolin Dutch BV, Reg. S, 4.750%, 04/01/21 | | | 1,987 | |
| EUR | 1,650 | | | PortAventura Entertainment Barcelona BV, Reg. S, 7.250%, 12/01/20 | | | 1,813 | |
| | | | Repsol International Finance BV, | | | | |
| EUR | 336 | | | Reg. S, VAR, 3.875%, 03/25/21 (x) (y) | | | 366 | |
| EUR | 3,312 | | | Reg. S, VAR, 4.500%, 03/25/75 | | | 3,554 | |
| EUR | 1,600 | | | Santander Issuances SAU, Reg. S, 3.250%, 04/04/26 | | | 1,739 | |
| | | | Telefonica Europe BV, | | | | |
| EUR | 1,800 | | | Reg. S, VAR, 5.875%, 03/31/24 (x) (y) | | | 2,088 | |
| EUR | 700 | | | Reg. S, VAR, 6.500%, 09/18/18 (x) (y) | | | 798 | |
| EUR | 1,300 | | | Reg. S, VAR, 7.625%, 09/18/21 (x) (y) | | | 1,611 | |
| | | | | | | | |
| | | | | | | 22,428 | |
| | | | | | | | |
| | | | Sweden — 0.7% | |
| EUR | 3,570 | | | Auris Luxembourg II SA, Reg. S, 8.000%, 01/15/23 | | | 4,108 | |
| EUR | 2,950 | | | Verisure Holding AB, Reg. S, 6.000%, 11/01/22 | | | 3,405 | |
| EUR | 1,000 | | | Volvo Car AB, Reg. S, 3.250%, 05/18/21 | | | 1,140 | |
| EUR | 2,197 | | | Volvo Treasury AB, Reg. S, VAR, 4.200%, 06/10/75 | | | 2,464 | |
| | | | | | | | |
| | | | | | | 11,117 | |
| | | | | | | | |
| | | | Switzerland — 0.9% | |
| | 1,938 | | | Credit Suisse AG, 6.500%, 08/08/23 (e) | | | 2,110 | |
| | | | Credit Suisse Group AG, | | | | |
| | 1,575 | | | 4.282%, 01/09/28 (e) | | | 1,579 | |
| | 1,600 | | | VAR, 7.500%, 12/11/23 (e) (x) (y) | | | 1,732 | |
| EUR | 2,200 | | | Dufry Finance SCA, Reg. S, 4.500%, 08/01/23 | | | 2,503 | |
| | | | UBS AG, | | | | |
| | 1,404 | | | Reg. S, 5.125%, 05/15/24 | | | 1,437 | |
| | 2,250 | | | Reg. S, VAR, 4.750%, 05/22/23 | | | 2,308 | |
| | | | UBS Group AG, | | | | |
| | 850 | | | Reg. S, VAR, 7.000%, 02/19/25 (x) (y) | | | 915 | |
| | 723 | | | Reg. S, VAR, 7.125%, 02/19/20 (x) (y) | | | 760 | |
| | | | | | | | |
| | | | | | | 13,344 | |
| | | | | | | | |
SEE NOTES TO FINANCIAL STATEMENTS.
| | | | | | |
| | | |
| 14 | | | | J.P. MORGAN INCOME FUNDS | | FEBRUARY 28, 2017 |
| | | | | | | | |
PRINCIPAL
AMOUNT | | | SECURITY DESCRIPTION | | VALUE | |
| | Corporate Bonds — continued | |
| | | | Turkey — 0.1% | |
| | 700 | | | Finansbank A/S, Reg. S, 6.250%, 04/30/19 | | | 733 | |
| | 1,550 | | | Turkiye Sise ve Cam Fabrikalari A/S, Reg. S, 4.250%, 05/09/20 | | | 1,546 | |
| | | | | | | | |
| | | | | | | 2,279 | |
| | | | | | | | |
| | | | United Arab Emirates — 0.5% | |
| | 2,910 | | | DP World Ltd., Reg. S, 6.850%, 07/02/37 | | | 3,293 | |
| | 2,800 | | | EMG SUKUK Ltd., Reg. S, 4.564%, 06/18/24 | | | 2,922 | |
| | 700 | | | MAF Global Securities Ltd., Reg. S, VAR, 7.125%, 10/29/18 (x) (y) | | | 739 | |
| | 249 | | | Shelf Drilling Holdings Ltd., 9.500%, 11/02/20 (e) | | | 237 | |
| | | | | | | | |
| | | | | | | 7,191 | |
| | | | | | | | |
| | | | United Kingdom — 4.7% | |
| EUR | 1,250 | | | Alliance Automotive Finance plc, Reg. S, 6.250%, 12/01/21 | | | 1,412 | |
| | | | Anglo American Capital plc, | | | | |
| | 740 | | | 4.125%, 04/15/21 (e) | | | 762 | |
| EUR | 3,950 | | | Reg. S, 3.250%, 04/03/23 | | | 4,566 | |
| | | | Ashtead Capital, Inc., | | | | |
| | 300 | | | 5.625%, 10/01/24 (e) | | | 318 | |
| | 1,000 | | | 6.500%, 07/15/22 (e) | | | 1,046 | |
| | | | Barclays plc, | | | | |
| | 2,800 | | | 4.375%, 09/11/24 | | | 2,811 | |
| EUR | 600 | | | Reg. S, VAR, 2.625%, 11/11/25 | | | 644 | |
| GBP | 2,800 | | | Boparan Finance plc, Reg. S, 5.250%, 07/15/19 | | | 3,536 | |
| | 915 | | | BP Capital Markets plc, 3.062%, 03/17/22 | | | 927 | |
| EUR | 2,500 | | | British Telecommunications plc, Reg. S, 1.750%, 03/10/26 | | | 2,725 | |
| EUR | 2,100 | | | EC Finance plc, Reg. S, 5.125%, 07/15/21 | | | 2,305 | |
| | | | Fiat Chrysler Automobiles NV, | | | | |
| | 273 | | | 4.500%, 04/15/20 | | | 282 | |
| | 1,290 | | | 5.250%, 04/15/23 | | | 1,337 | |
| EUR | 5,200 | | | Reg. S, 3.750%, 03/29/24 | | | 5,742 | |
| GBP | 1,400 | | | Galaxy Bidco Ltd., Reg. S, 6.375%, 11/15/20 | | | 1,790 | |
| | 800 | | | Genel Energy Finance plc, Reg. S, 7.500%, 05/14/19 (e) | | | 658 | |
| GBP | 530 | | | HBOS Capital Funding LP, Reg. S, VAR, 6.461%, 11/30/18 (x) (y) | | | 697 | |
| GBP | 700 | | | Iceland Bondco plc, Reg. S, 6.250%, 07/15/21 | | | 903 | |
| EUR | 3,200 | | | Ineos Finance plc, Reg. S, 4.000%, 05/01/23 | | | 3,530 | |
| | | | Jaguar Land Rover Automotive plc, | | | | |
| | 500 | | | 4.125%, 12/15/18 (e) | | | 510 | |
| | 200 | | | 4.250%, 11/15/19 (e) | | | 205 | |
| GBP | 1,960 | | | Reg. S, 3.875%, 03/01/23 | | | 2,510 | |
| | | | | | | | |
PRINCIPAL
AMOUNT | | | SECURITY DESCRIPTION | | VALUE | |
| | |
| | | | United Kingdom — continued | |
| GBP | 790 | | | Reg. S, 5.000%, 02/15/22 | | | 1,072 | |
| | | | Lloyds Banking Group plc, | | | | |
| | 2,560 | | | 4.650%, 03/24/26 | | | 2,620 | |
| | 2,882 | | | VAR, 7.500%, 06/27/24 (x) (y) | | | 3,059 | |
| EUR | 1,150 | | | Merlin Entertainments plc, Reg. S, 2.750%, 03/15/22 | | | 1,275 | |
| | | | Nationwide Building Society, | | | | |
| | 3,000 | | | 4.000%, 09/14/26 (e) | | | 2,889 | |
| GBP | 1,380 | | | Reg. S, VAR, 6.875%, 06/20/19 (x) (y) | | | 1,765 | |
| GBP | 710 | | | NGG Finance plc, Reg. S, VAR, 5.625%, 06/18/73 | | | 971 | |
| GBP | 1,080 | | | Pizzaexpress Financing 1 plc, Reg. S, 8.625%, 08/01/22 | | | 1,310 | |
| GBP | 2,500 | | | Pizzaexpress Financing 2 plc, Reg. S, 6.625%, 08/01/21 | | | 3,195 | |
| | 1,645 | | | Royal Bank of Scotland Group plc, 6.125%, 12/15/22 | | | 1,749 | |
| | 1,520 | | | Santander UK Group Holdings plc, 4.750%, 09/15/25 (e) | | | 1,516 | |
| | 200 | | | Seadrill Ltd., 6.625%, 09/15/20 (e) | | | 79 | |
| GBP | 638 | | | Standard Life plc, VAR, 6.750%, 07/12/27 (x) (y) | | | 902 | |
| EUR | 2,300 | | | Synlab Unsecured Bondco plc, Reg. S, 8.250%, 07/01/23 | | | 2,684 | |
| GBP | 3,580 | | | Tesco plc, 5.000%, 03/24/23 | | | 4,926 | |
| | 200 | | | Virgin Media Finance plc, 5.750%, 01/15/25 (e) | | | 205 | |
| | 775 | | | Virgin Media Secured Finance plc, 5.500%, 08/15/26 (e) | | | 794 | |
| EUR | 2,200 | | | Worldpay Finance plc, Reg. S, 3.750%, 11/15/22 | | | 2,511 | |
| | | | | | | | |
| | | | | | | 72,738 | |
| | | | | | | | |
| | | | United States — 30.4% | |
| | 250 | | | A10 Revolving Asset Financing LLC, VAR, 6.950%, 01/09/20 | | | 250 | |
| | | | Acadia Healthcare Co., Inc., | | | | |
| | 55 | | | 5.625%, 02/15/23 | | | 57 | |
| | 100 | | | 6.125%, 03/15/21 | | | 103 | |
| | 406 | | | ACE Cash Express, Inc., 11.000%, 02/01/19 (e) | | | 383 | |
| | | | Actavis Funding SCS, | | | | |
| | 2,735 | | | 3.000%, 03/12/20 | | | 2,785 | |
| | 1,435 | | | 4.850%, 06/15/44 | | | 1,464 | |
| | | | Adient Global Holdings Ltd., | | | | |
| EUR | 575 | | | 3.500%, 08/15/24 (e) | | | 623 | |
| EUR | 800 | | | Reg. S, 3.500%, 08/15/24 | | | 868 | |
SEE NOTES TO FINANCIAL STATEMENTS.
| | | | | | | | |
| | | |
| FEBRUARY 28, 2017 | | J.P. MORGAN INCOME FUNDS | | | | | 15 | |
JPMorgan Global Bond Opportunities Fund
SCHEDULE OF PORTFOLIO INVESTMENTS
AS OF FEBRUARY 28, 2017 (Unaudited) (continued)
(Amounts in U.S. Dollars, unless otherwise noted)
(Amounts in thousands)
| | | | | | | | |
PRINCIPAL
AMOUNT | | | SECURITY DESCRIPTION | | VALUE | |
| | Corporate Bonds — continued | |
| | | | United States — continued | |
| | | | ADT Corp. (The), | | | | |
| | 500 | | | 3.500%, 07/15/22 | | | 475 | |
| | 552 | | | 4.125%, 06/15/23 | | | 531 | |
| | 186 | | | Advanced Micro Devices, Inc., 7.000%, 07/01/24 | | | 199 | |
| | | | AECOM, | | | | |
| | 486 | | | 5.125%, 03/15/27 (e) | | | 494 | |
| | 365 | | | 5.750%, 10/15/22 | | | 385 | |
| | 630 | | | 5.875%, 10/15/24 | | | 688 | |
| | | | AES Corp., | | | | |
| | 1,500 | | | 5.500%, 04/15/25 | | | 1,519 | |
| | 1,260 | | | Air Lease Corp., 3.000%, 09/15/23 | | | 1,240 | |
| | 1,275 | | | Air Medical Group Holdings, Inc., 6.375%, 05/15/23 (e) | | | 1,240 | |
| | | | Aircastle Ltd., | | | | |
| | 465 | | | 5.125%, 03/15/21 | | | 496 | |
| | 310 | | | 7.625%, 04/15/20 | | | 352 | |
| | 165 | | | AK Steel Corp., 7.500%, 07/15/23 | | | 180 | |
| | 130 | | | Alabama Power Co., 4.150%, 08/15/44 | | | 133 | |
| | | | Albertsons Cos. LLC, | | | | |
| | 495 | | | 5.750%, 03/15/25 (e) | | | 496 | |
| | 760 | | | 6.625%, 06/15/24 (e) | | | 804 | |
| | 209 | | | Aleris International, Inc., 7.875%, 11/01/20 | | | 207 | |
| | | | Alliance Data Systems Corp., | | | | |
| | 156 | | | 5.375%, 08/01/22 (e) | | | 155 | |
| | 390 | | | 5.875%, 11/01/21 (e) | | | 404 | |
| | | | Ally Financial, Inc., | | | | |
| | 1,420 | | | 4.125%, 03/30/20 | | | 1,468 | |
| | 20 | | | 4.250%, 04/15/21 | | | 21 | |
| | 1,600 | | | 4.625%, 03/30/25 | | | 1,636 | |
| | 250 | | | 4.750%, 09/10/18 | | | 258 | |
| | 365 | | | 8.000%, 11/01/31 | | | 449 | |
| | | | Altice US Finance I Corp., | | | | |
| | 560 | | | 5.375%, 07/15/23 (e) | | | 584 | |
| | 335 | | | 5.500%, 05/15/26 (e) | | | 346 | |
| | | | Altria Group, Inc., | | | | |
| | 965 | | | 3.875%, 09/16/46 | | | 911 | |
| | 1,500 | | | 4.000%, 01/31/24 | | | 1,582 | |
| | 1,165 | | | 4.250%, 08/09/42 | | | 1,158 | |
| | | | AMC Entertainment Holdings, Inc., | | | | |
| | 1,090 | | | 5.750%, 06/15/25 | | | 1,129 | |
| | 230 | | | 5.875%, 02/15/22 | | | 241 | |
| | | | American Axle & Manufacturing, Inc., | | | | |
| | 1,448 | | | 6.625%, 10/15/22 | | | 1,499 | |
| | | | | | | | |
PRINCIPAL
AMOUNT | | | SECURITY DESCRIPTION | | VALUE | |
| | |
| | | | United States — continued | |
| | 1,500 | | | American Express Credit Corp., Series F, 2.600%, 09/14/20 | | | 1,516 | |
| | 114 | | | American Greetings Corp., 7.875%, 02/15/25 (e) | | | 120 | |
| | 2,080 | | | American International Group, Inc., 4.800%, 07/10/45 | | | 2,130 | |
| | | | Amkor Technology, Inc., | | | | |
| | 1,000 | | | 6.375%, 10/01/22 | | | 1,036 | |
| | 850 | | | 6.625%, 06/01/21 | | | 868 | |
| | | | Analog Devices, Inc., | | | | |
| | 1,465 | | | 3.500%, 12/05/26 | | | 1,462 | |
| | 190 | | | 4.500%, 12/05/36 | | | 190 | |
| | 1,320 | | | Anixter, Inc., 5.500%, 03/01/23 | | | 1,383 | |
| | | | Antero Resources Corp., | | | | |
| | 493 | | | 5.125%, 12/01/22 | | | 496 | |
| | 500 | | | 5.375%, 11/01/21 | | | 511 | |
| | | | Apple, Inc., | | | | |
| | 1,235 | | | 3.350%, 02/09/27 | | | 1,253 | |
| | 525 | | | 3.850%, 08/04/46 | | | 505 | |
| | 755 | | | 4.375%, 05/13/45 | | | 786 | |
| | 1,530 | | | 4.650%, 02/23/46 | | | 1,665 | |
| | | | Arconic, Inc., | | | | |
| | 725 | | | 5.125%, 10/01/24 | | | 748 | |
| | 250 | | | 5.400%, 04/15/21 | | | 268 | |
| | 1,425 | | | Ashland LLC, 4.750%, 08/15/22 | | | 1,479 | |
| | | | AT&T, Inc., | | | | |
| | 2,630 | | | 3.400%, 05/15/25 | | | 2,542 | |
| | 1,325 | | | 4.300%, 12/15/42 | | | 1,186 | |
| | 2,230 | | | 4.750%, 05/15/46 | | | 2,084 | |
| | 1,335 | | | 5.250%, 03/01/37 | | | 1,376 | |
| | 182 | | | Avaya, Inc., 10.500%, 03/01/21 (d) (e) | | | 50 | |
| | 1,930 | | | Avis Budget Car Rental LLC, 5.500%, 04/01/23 | | | 1,930 | |
| EUR | 1,500 | | | Axalta Coating Systems LLC, Reg. S, 4.250%, 08/15/24 | | | 1,703 | |
| | | | Ball Corp., | | | | |
| EUR | 2,000 | | | 4.375%, 12/15/23 | | | 2,385 | |
| | 500 | | | 5.250%, 07/01/25 | | | 531 | |
| | | | Bank of America Corp., | | | | |
| | 3,795 | | | 2.625%, 10/19/20 | | | 3,821 | |
| | 1,830 | | | 3.500%, 04/19/26 | | | 1,815 | |
| | 1,040 | | | 4.250%, 10/22/26 | | | 1,060 | |
| | 4,070 | | | Series AA, VAR, 6.100%, 03/17/25 (x) (y) | | | 4,342 | |
| | 466 | | | Series X, VAR, 6.250%, 09/05/24 (x) (y) | | | 499 | |
| | 474 | | | Series DD, VAR, 6.300%, 03/10/26 (x) (y) | | | 517 | |
| | 50 | | | Series K, VAR, 8.000%, 01/30/18 (x) (y) | | | 52 | |
SEE NOTES TO FINANCIAL STATEMENTS.
| | | | | | |
| | | |
| 16 | | | | J.P. MORGAN INCOME FUNDS | | FEBRUARY 28, 2017 |
| | | | | | | | |
PRINCIPAL
AMOUNT | | | SECURITY DESCRIPTION | | VALUE | |
| | Corporate Bonds — continued | |
| | | | United States — continued | |
| | 400 | | | Berry Plastics Corp., 5.500%, 05/15/22 | | | 417 | |
| | 1,125 | | | Biogen, Inc., 5.200%, 09/15/45 | | | 1,228 | |
| | | | Blue Cube Spinco, Inc., | | | | |
| | 357 | | | 9.750%, 10/15/23 | | | 426 | |
| | 673 | | | 10.000%, 10/15/25 | | | 817 | |
| | 279 | | | Blue Racer Midstream LLC, 6.125%, 11/15/22 (e) | | | 284 | |
| | 157 | | | BlueLine Rental Finance Corp., 7.000%, 02/01/19 (e) | | | 160 | |
| | 3,000 | | | Boardwalk Pipelines LP, 3.375%, 02/01/23 | | | 2,957 | |
| | 652 | | | Boyd Gaming Corp., 6.875%, 05/15/23 | | | 704 | |
| | 157 | | | Bumble Bee Holdings, Inc., 9.000%, 12/15/17 (e) | | | 156 | |
| | 1,340 | | | Burlington Northern Santa Fe LLC, 4.550%, 09/01/44 | | | 1,441 | |
| | 673 | | | Cablevision Systems Corp., 8.000%, 04/15/20 | | | 744 | |
| | 246 | | | Caesars Entertainment Operating Co., Inc., 8.500%, 02/15/20 (d) | | | 275 | |
| | 210 | | | CalAtlantic Group, Inc., 8.375%, 01/15/21 | | | 245 | |
| | 256 | | | California Resources Corp., 8.000%, 12/15/22 (e) | | | 218 | |
| | 1,000 | | | Calpine Corp., 6.000%, 01/15/22 (e) | | | 1,049 | |
| | 3,000 | | | Capital One Financial Corp., 4.200%, 10/29/25 | | | 3,050 | |
| | 77 | | | Capsugel SA, 7.000% (cash), 05/15/19 (e) (v) | | | 77 | |
| | | | CCO Holdings LLC, | | | | |
| | 681 | | | 5.375%, 05/01/25 (e) | | | 713 | |
| | 2,075 | | | 5.500%, 05/01/26 (e) | | | 2,202 | |
| | 405 | | | 5.750%, 09/01/23 | | | 425 | |
| | 2,450 | | | 5.750%, 02/15/26 (e) | | | 2,621 | |
| | 2,145 | | | 5.875%, 04/01/24 (e) | | | 2,301 | |
| | | | CDW LLC, | | | | |
| | 163 | | | 5.000%, 09/01/23 | | | 168 | |
| | 165 | | | 5.500%, 12/01/24 | | | 173 | |
| | 201 | | | Centene Corp., 4.750%, 05/15/22 | | | 208 | |
| | | | CenturyLink, Inc., | | | | |
| | 200 | | | Series T, 5.800%, 03/15/22 | | | 207 | |
| | 1,345 | | | Series W, 6.750%, 12/01/23 | | | 1,407 | |
| | | | CF Industries, Inc., | | | | |
| | 185 | | | 3.450%, 06/01/23 | | | 172 | |
| | 2,360 | | | 4.500%, 12/01/26 (e) | | | 2,417 | |
| | 390 | | | 5.150%, 03/15/34 | | | 370 | |
| | 565 | | | Change Healthcare Holdings, Inc., 11.000%, 12/31/19 | | | 581 | |
| | 3,273 | | | Charter Communications Operating LLC, 4.908%, 07/23/25 | | | 3,453 | |
| | | | | | | | |
PRINCIPAL
AMOUNT | | | SECURITY DESCRIPTION | | VALUE | |
| | |
| | | | United States — continued | |
| | | | Chesapeake Energy Corp., | | | | |
| | 1,025 | | | 6.625%, 08/15/20 | | | 1,020 | |
| | 328 | | | 8.000%, 01/15/25 (e) | | | 326 | |
| | 2,848 | | | Chevron Corp., 2.355%, 12/05/22 | | | 2,788 | |
| | 215 | | | Cincinnati Bell, Inc., 7.000%, 07/15/24 (e) | | | 227 | |
| | 90 | | | Cinemark USA, Inc., 5.125%, 12/15/22 | | | 93 | |
| | | | CIT Group, Inc., | | | | |
| | 29 | | | 3.875%, 02/19/19 | | | 30 | |
| | 1,220 | | | 5.000%, 08/15/22 | | | 1,293 | |
| | 491 | | | 5.250%, 03/15/18 | | | 507 | |
| | 400 | | | 5.375%, 05/15/20 | | | 428 | |
| | 1,495 | | | 5.500%, 02/15/19 (e) | | | 1,575 | |
| | 200 | | | Citgo Holding, Inc., 10.750%, 02/15/20 (e) | | | 217 | |
| | 398 | | | CITGO Petroleum Corp., 6.250%, 08/15/22 (e) | | | 410 | |
| | | | Citigroup, Inc., | | | | |
| | 2,690 | | | 2.400%, 02/18/20 | | | 2,698 | |
| | 2,695 | | | 2.650%, 10/26/20 | | | 2,711 | |
| | 1,980 | | | 3.200%, 10/21/26 | | | 1,905 | |
| | 1,210 | | | 4.125%, 07/25/28 | | | 1,199 | |
| | 2,463 | | | Series O, VAR, 5.875%, 03/27/20 (x) (y) | | | 2,543 | |
| | 972 | | | Series M, VAR, 6.300%, 05/15/24 (x) (y) | | | 1,027 | |
| | | | Claire’s Stores, Inc., | | | | |
| | 250 | | | 6.125%, 03/15/20 (e) | | | 105 | |
| | 880 | | | 9.000%, 03/15/19 (e) | | | 405 | |
| | 1,130 | | | Clean Harbors, Inc., 5.125%, 06/01/21 | | | 1,155 | |
| | | | Clear Channel Worldwide Holdings, Inc., | | | | |
| | 4,445 | | | Series B, 6.500%, 11/15/22 | | | 4,603 | |
| | 3,075 | | | Series B, 7.625%, 03/15/20 | | | 3,098 | |
| | 225 | | | Clearwater Paper Corp., 4.500%, 02/01/23 | | | 220 | |
| | 56 | | | Cloud Peak Energy Resources LLC, 12.000%, 11/01/21 | | | 61 | |
| | 220 | | | CNG Holdings, Inc., 9.375%, 05/15/20 (e) | | | 199 | |
| | 670 | | | CNO Financial Group, Inc., 5.250%, 05/30/25 | | | 690 | |
| | 177 | | | Coeur Mining, Inc., 7.875%, 02/01/21 | | | 183 | |
| | 1,000 | | | Cogent Communications Finance, Inc., 5.625%, 04/15/21 (e) | | | 1,020 | |
| | 600 | | | Cogent Communications Group, Inc., 5.375%, 03/01/22 (e) | | | 624 | |
| | | | Comcast Corp., | | | | |
| | 2,095 | | | 2.350%, 01/15/27 | | | 1,924 | |
| | 1,030 | | | 4.600%, 08/15/45 | | | 1,071 | |
| | 500 | | | Commercial Metals Co., 4.875%, 05/15/23 | | | 511 | |
| | 1,300 | | | CommScope Technologies Finance LLC, 6.000%, 06/15/25 (e) | | | 1,391 | |
| | 400 | | | CommScope, Inc., 5.500%, 06/15/24 (e) | | | 419 | |
SEE NOTES TO FINANCIAL STATEMENTS.
| | | | | | | | |
| | | |
| FEBRUARY 28, 2017 | | J.P. MORGAN INCOME FUNDS | | | | | 17 | |
JPMorgan Global Bond Opportunities Fund
SCHEDULE OF PORTFOLIO INVESTMENTS
AS OF FEBRUARY 28, 2017 (Unaudited) (continued)
(Amounts in U.S. Dollars, unless otherwise noted)
(Amounts in thousands)
| | | | | | | | |
PRINCIPAL
AMOUNT | | | SECURITY DESCRIPTION | | VALUE | |
| | Corporate Bonds — continued | |
| | | | United States — continued | |
| | | | Communications Sales & Leasing, Inc., | | | | |
| | 2,355 | | | 6.000%, 04/15/23 (e) | | | 2,473 | |
| | | | Community Health Systems, Inc., | | | | |
| | 99 | | | 5.125%, 08/01/21 | | | 97 | |
| | 101 | | | 6.875%, 02/01/22 | | | 89 | |
| | 1,401 | | | Concho Resources, Inc., 5.500%, 04/01/23 | | | 1,450 | |
| | 450 | | | CONSOL Energy, Inc., 5.875%, 04/15/22 | | | 439 | |
| | 206 | | | Consolidated Communications, Inc., 6.500%, 10/01/22 | | | 205 | |
| | | | Continental Resources, Inc., | | | | |
| | 1,020 | | | 4.500%, 04/15/23 | | | 999 | |
| | 575 | | | 5.000%, 09/15/22 | | | 586 | |
| | 205 | | | Cooper-Standard Automotive, Inc., 5.625%, 11/15/26 (e) | | | 208 | |
| | 800 | | | CoreCivic, Inc., 4.625%, 05/01/23 | | | 802 | |
| | 261 | | | Crestwood Midstream Partners LP, 6.125%, 03/01/22 | | | 270 | |
| | | | Crown Castle International Corp., | | | | |
| | 2,300 | | | 3.400%, 02/15/21 | | | 2,345 | |
| | 1,070 | | | 3.700%, 06/15/26 | | | 1,056 | |
| EUR | 2,750 | | | Crown European Holdings SA, Reg. S, 4.000%, 07/15/22 | | | 3,234 | |
| | | | CSC Holdings LLC, | | | | |
| | 225 | | | 6.750%, 11/15/21 | | | 247 | |
| | 129 | | | 8.625%, 02/15/19 | | | 143 | |
| | 1,000 | | | 10.125%, 01/15/23 (e) | | | 1,158 | |
| | 80 | | | CSI Compressco LP, 7.250%, 08/15/22 | | | 77 | |
| | 119 | | | CURO Financial Technologies Corp., 12.000%, 03/01/22 (e) | | | 122 | |
| | 680 | | | CVS Health Corp., 2.875%, 06/01/26 | | | 652 | |
| | | | Dana, Inc., | | | | |
| | 1,910 | | | 5.500%, 12/15/24 | | | 1,996 | |
| | 600 | | | 6.000%, 09/15/23 | | | 632 | |
| | 210 | | | Darling Ingredients, Inc., 5.375%, 01/15/22 | | | 218 | |
| | 312 | | | Dean Foods Co., 6.500%, 03/15/23 (e) | | | 325 | |
| | 835 | | | Denbury Resources, Inc., 4.625%, 07/15/23 | | | 651 | |
| | | | Diamond 1 Finance Corp., | | | | |
| | 470 | | | 5.875%, 06/15/21 (e) | | | 497 | |
| | 2,675 | | | 6.020%, 06/15/26 (e) | | | 2,950 | |
| | 450 | | | 7.125%, 06/15/24 (e) | | | 497 | |
| | | | DISH DBS Corp., | | | | |
| | 890 | | | 5.000%, 03/15/23 | | | 914 | |
| | 2,265 | | | 5.875%, 07/15/22 | | | 2,428 | |
| | 2,526 | | | 5.875%, 11/15/24 | | | 2,697 | |
| | 760 | | | 6.750%, 06/01/21 | | | 834 | |
| | 717 | | | 7.750%, 07/01/26 | | | 842 | |
| | | | | | | | |
PRINCIPAL
AMOUNT | | | SECURITY DESCRIPTION | | VALUE | |
| | |
| | | | United States — continued | |
| | 500 | | | DJO Finco, Inc., 8.125%, 06/15/21 (e) | | | 442 | |
| | 1,155 | | | Dominion Resources, Inc., 3.625%, 12/01/24 | | | 1,170 | |
| | 180 | | | Downstream Development Authority of the Quapaw Tribe of Oklahoma, 10.500%, 07/01/19 (e) | | | 179 | |
| | | | Dynegy, Inc., | | | | |
| | 99 | | | 5.875%, 06/01/23 | | | 90 | |
| | 26 | | | 6.750%, 11/01/19 | | | 27 | |
| | 615 | | | 7.375%, 11/01/22 | | | 604 | |
| | 760 | | | 7.625%, 11/01/24 | | | 722 | |
| | 393 | | | E*TRADE Financial Corp., 5.375%, 11/15/22 | | | 416 | |
| | 2,409 | | | Embarq Corp., 7.995%, 06/01/36 | | | 2,417 | |
| | 440 | | | EMC Corp., 2.650%, 06/01/20 | | | 429 | |
| | | | Endo Ltd., | | | | |
| | 1,000 | | | 6.000%, 07/15/23 (e) | | | 920 | |
| | 285 | | | 6.000%, 02/01/25 (e) | | | 255 | |
| | 1,000 | | | Energizer Holdings, Inc., 5.500%, 06/15/25 (e) | | | 1,035 | |
| | 475 | | | Energy Transfer Equity LP, 5.875%, 01/15/24 | | | 511 | |
| | 495 | | | EnerSys, 5.000%, 04/30/23 (e) | | | 504 | |
| | 1,520 | | | Entergy Corp., 2.950%, 09/01/26 | | | 1,449 | |
| | 400 | | | Envision Healthcare Corp., 5.125%, 07/01/22 (e) | | | 409 | |
| | | | EP Energy LLC, | | | | |
| | 400 | | | 7.750%, 09/01/22 | | | 348 | |
| | 960 | | | 8.000%, 02/15/25 (e) | | | 936 | |
| | 1,434 | | | 9.375%, 05/01/20 | | | 1,402 | |
| | | | Equinix, Inc., | | | | |
| | 38 | | | 5.375%, 01/01/22 | | | 40 | |
| | 300 | | | 5.375%, 04/01/23 | | | 311 | |
| | 27 | | | 5.750%, 01/01/25 | | | 29 | |
| | 111 | | | 5.875%, 01/15/26 | | | 119 | |
| | 570 | | | ESH Hospitality, Inc., 5.250%, 05/01/25 (e) | | | 575 | |
| | 1,965 | | | Express Scripts Holding Co., 3.400%, 03/01/27 | | | 1,865 | |
| | 151 | | | Fidelity & Guaranty Life Holdings, Inc., 6.375%, 04/01/21 (e) | | | 152 | |
| | | | First Data Corp., | | | | |
| | 3,269 | | | 5.750%, 01/15/24 (e) | | | 3,388 | |
| | 471 | | | 7.000%, 12/01/23 (e) | | | 506 | |
| | 385 | | | FirstEnergy Transmission LLC, 5.450%, 07/15/44 (e) | | | 426 | |
| | | | Ford Motor Credit Co. LLC, | | | | |
| | 2,575 | | | 3.200%, 01/15/21 | | | 2,617 | |
| | 3,000 | | | 3.664%, 09/08/24 | | | 2,981 | |
| | 2,385 | | | 4.389%, 01/08/26 | | | 2,454 | |
SEE NOTES TO FINANCIAL STATEMENTS.
| | | | | | |
| | | |
| 18 | | | | J.P. MORGAN INCOME FUNDS | | FEBRUARY 28, 2017 |
| | | | | | | | |
PRINCIPAL
AMOUNT | | | SECURITY DESCRIPTION | | VALUE | |
| | Corporate Bonds — continued | |
| | | | United States — continued | |
| | 1,505 | | | Freeport-McMoRan, Inc., 3.550%, 03/01/22 | | | 1,396 | |
| | | | Frontier Communications Corp., | | | | |
| | 475 | | | 6.250%, 09/15/21 | | | 454 | |
| | 1,000 | | | 6.875%, 01/15/25 | | | 842 | |
| | 828 | | | 8.500%, 04/15/20 | | | 879 | |
| | 427 | | | 9.250%, 07/01/21 | | | 450 | |
| | 365 | | | 10.500%, 09/15/22 | | | 380 | |
| | 2,197 | | | 11.000%, 09/15/25 | | | 2,208 | |
| | 1,976 | | | GE Capital International Funding Co. Unlimited Co., 3.373%, 11/15/25 | | | 2,036 | |
| | 748 | | | General Electric Co., 3.450%, 05/15/24 | | | 780 | |
| | 2,620 | | | General Motors Co., 5.200%, 04/01/45 | | | 2,638 | |
| | | | General Motors Financial Co., Inc., | | | | |
| | 2,000 | | | 3.700%, 05/09/23 | | | 2,018 | |
| | 1,005 | | | 4.350%, 01/17/27 | | | 1,023 | |
| | 314 | | | Genesys Telecommunications Laboratories, Inc., 10.000%, 11/30/24 (e) | | | 341 | |
| | 595 | | | GenOn Energy, Inc., 9.875%, 10/15/20 | | | 437 | |
| | 1,650 | | | Gilead Sciences, Inc., 4.150%, 03/01/47 | | | 1,585 | |
| | | | Goldman Sachs Group, Inc. (The), | | | | |
| | 910 | | | 2.625%, 04/25/21 | | | 910 | |
| | 930 | | | 2.750%, 09/15/20 | | | 938 | |
| | 1,850 | | | 3.850%, 07/08/24 | | | 1,902 | |
| | 1,815 | | | 4.250%, 10/21/25 | | | 1,861 | |
| | 1,200 | | | 5.150%, 05/22/45 | | | 1,279 | |
| | 484 | | | Series O, VAR, 5.300%, 11/10/26 (x) (y) | | | 489 | |
| | 4,681 | | | Series M, VAR, 5.375%, 05/10/20 (x) (y) | | | 4,810 | |
| | 225 | | | Series L, VAR, 5.700%, 05/10/19 (x) (y) | | | 232 | |
| | 26 | | | Goodman Networks, Inc., 12.125%, 07/01/18 | | | 10 | |
| | 1,000 | | | Goodyear Tire & Rubber Co. (The), 8.750%, 08/15/20 | | | 1,185 | |
| | 850 | | | H&E Equipment Services, Inc., 7.000%, 09/01/22 | | | 895 | |
| | 170 | | | Harland Clarke Holdings Corp., 6.875%, 03/01/20 (e) | | | 172 | |
| | 1,949 | | | Harris Corp., 4.854%, 04/27/35 | | | 2,104 | |
| | | | HCA, Inc., | | | | |
| | 300 | | | 5.000%, 03/15/24 | | | 316 | |
| | 4,125 | | | 5.375%, 02/01/25 | | | 4,316 | |
| | 800 | | | Series 1, 5.875%, 05/01/23 | | | 870 | |
| | 100 | | | 6.500%, 02/15/20 | | | 109 | |
| | 2,275 | | | 7.500%, 02/15/22 | | | 2,625 | |
| | | | HealthSouth Corp., | | | | |
| | 250 | | | 5.125%, 03/15/23 | | | 250 | |
| | 490 | | | 5.750%, 11/01/24 | | | 500 | |
| | 650 | | | 5.750%, 09/15/25 | | | 658 | |
| | | | | | | | |
PRINCIPAL
AMOUNT | | | SECURITY DESCRIPTION | | VALUE | |
| | |
| | | | United States — continued | |
| | 375 | | | Hecla Mining Co., 6.875%, 05/01/21 | | | 387 | |
| | 780 | | | Herc Rentals, Inc., 7.750%, 06/01/24 (e) | | | 858 | |
| | | | Hertz Corp. (The), | | | | |
| | 1,150 | | | 6.250%, 10/15/22 | | | 1,106 | |
| | 2,105 | | | 7.375%, 01/15/21 | | | 2,110 | |
| | 630 | | | Hess Corp., 5.800%, 04/01/47 | | | 670 | |
| | 2,785 | | | Hexion, Inc., 6.625%, 04/15/20 | | | 2,590 | |
| | 1,485 | | | Hilcorp Energy I LP, 5.000%, 12/01/24 (e) | | | 1,422 | |
| | 1,000 | | | Hill-Rom Holdings, Inc., 5.750%, 09/01/23 (e) | | | 1,045 | |
| | 235 | | | Holly Energy Partners LP, 6.000%, 08/01/24 (e) | | | 247 | |
| | | | Hughes Satellite Systems Corp., | | | | |
| | 445 | | | 5.250%, 08/01/26 (e) | | | 452 | |
| | 93 | | | 6.625%, 08/01/26 (e) | | | 97 | |
| | 75 | | | Huntington Ingalls Industries, Inc., 5.000%, 12/15/21 (e) | | | 78 | |
| | | | Huntsman International LLC, | | | | |
| | 550 | | | 4.875%, 11/15/20 | | | 572 | |
| | 1,600 | | | 5.125%, 11/15/22 | | | 1,680 | |
| | 680 | | | IASIS Healthcare LLC, 8.375%, 05/15/19 | | | 665 | |
| | 536 | | | Icahn Enterprises LP, 5.875%, 02/01/22 | | | 547 | |
| | 525 | | | iHeartCommunications, Inc., 9.000%, 12/15/19 | | | 459 | |
| | 30 | | | IHS Markit Ltd., 5.000%, 11/01/22 (e) | | | 32 | |
| | 500 | | | ILFC E-Capital Trust I, VAR, 4.670%, 12/21/65 (e) | | | 470 | |
| | 535 | | | ILFC E-Capital Trust II, VAR, 4.920%, 12/21/65 (e) | | | 499 | |
| | 1,500 | | | Infor Software Parent LLC, 7.125% (cash), 05/01/21 (e) (v) | | | 1,541 | |
| | 1,385 | | | Infor US, Inc., 6.500%, 05/15/22 | | | 1,440 | |
| | 1,000 | | | Informatica LLC, 7.125%, 07/15/23 (e) | | | 970 | |
| | 825 | | | Intel Corp., 4.900%, 07/29/45 | | | 940 | |
| | | | International Game Technology plc, | | | | |
| | 1,925 | | | 6.250%, 02/15/22 (e) | | | 2,079 | |
| EUR | 2,300 | | | Reg. S, 4.750%, 02/15/23 | | | 2,658 | |
| | | | International Lease Finance Corp., | | | | |
| | 1,235 | | | 3.875%, 04/15/18 | | | 1,262 | |
| | 515 | | | 6.250%, 05/15/19 | | | 559 | |
| | 900 | | | inVentiv Group Holdings, Inc., 7.500%, 10/01/24 (e) | | | 940 | |
| | 515 | | | Iron Mountain, Inc., 5.750%, 08/15/24 | | | 528 | |
| | 135 | | | Isle of Capri Casinos, Inc., 5.875%, 03/15/21 | | | 139 | |
| | 910 | | | Jack Ohio Finance LLC, 6.750%, 11/15/21 (e) | | | 944 | |
| | 400 | | | Kaiser Aluminum Corp., 5.875%, 05/15/24 | | | 420 | |
| | 650 | | | Kindred Healthcare, Inc., 8.750%, 01/15/23 | | | 631 | |
SEE NOTES TO FINANCIAL STATEMENTS.
| | | | | | | | |
| | | |
| FEBRUARY 28, 2017 | | J.P. MORGAN INCOME FUNDS | | | | | 19 | |
JPMorgan Global Bond Opportunities Fund
SCHEDULE OF PORTFOLIO INVESTMENTS
AS OF FEBRUARY 28, 2017 (Unaudited) (continued)
(Amounts in U.S. Dollars, unless otherwise noted)
(Amounts in thousands)
| | | | | | | | |
PRINCIPAL
AMOUNT | | | SECURITY DESCRIPTION | | VALUE | |
| | Corporate Bonds — continued | |
| | | | United States — continued | |
| | 785 | | | Kinetic Concepts, Inc., 7.875%, 02/15/21 (e) | | | 846 | |
| | 930 | | | KLX, Inc., 5.875%, 12/01/22 (e) | | | 979 | |
| | | | Kraft Heinz Foods Co., | | | | |
| | 565 | | | 4.375%, 06/01/46 | | | 534 | |
| | 2,035 | | | 5.200%, 07/15/45 | | | 2,150 | |
| | | | Kroger Co. (The), | | | | |
| | 2,275 | | | 2.650%, 10/15/26 | | | 2,117 | |
| | 1,825 | | | 4.450%, 02/01/47 | | | 1,812 | |
| | | | Lamb Weston Holdings, Inc., | | | | |
| | 100 | | | 4.625%, 11/01/24 (e) | | | 102 | |
| | 100 | | | 4.875%, 11/01/26 (e) | | | 101 | |
| | 98 | | | Landry’s, Inc., 6.750%, 10/15/24 (e) | | | 102 | |
| | | | Lennar Corp., | | | | |
| | 125 | | | 4.500%, 06/15/19 | | | 129 | |
| | 225 | | | Series B, 12.250%, 06/01/17 | | | 230 | |
| | 750 | | | Level 3 Communications, Inc., 5.750%, 12/01/22 | | | 777 | |
| | | | Level 3 Financing, Inc., | | | | |
| | 103 | | | 5.125%, 05/01/23 | | | 105 | |
| | 153 | | | 5.250%, 03/15/26 (e) | | | 155 | |
| | 188 | | | 5.375%, 08/15/22 | | | 195 | |
| | 160 | | | 5.375%, 01/15/24 | | | 164 | |
| | 612 | | | 5.375%, 05/01/25 | | | 632 | |
| | 48 | | | 5.625%, 02/01/23 | | | 50 | |
| | 5 | | | VAR, 4.762%, 01/15/18 | | | 5 | |
| | 233 | | | LIN Television Corp., 5.875%, 11/15/22 | | | 242 | |
| EUR | 700 | | | LKQ Italia Bondco SpA, Reg. S, 3.875%, 04/01/24 | | | 793 | |
| | 390 | | | LTF Merger Sub, Inc., 8.500%, 06/15/23 (e) | | | 413 | |
| | 180 | | | M/I Homes, Inc., 6.750%, 01/15/21 | | | 189 | |
| | | | Mallinckrodt International Finance SA, | | | | |
| | 63 | | | 4.750%, 04/15/23 | | | 56 | |
| | 1,135 | | | 5.500%, 04/15/25 (e) | | | 1,056 | |
| | 184 | | | 5.625%, 10/15/23 (e) | | | 177 | |
| | 381 | | | 5.750%, 08/01/22 (e) | | | 373 | |
| | | | Masco Corp., | | | | |
| | 3,780 | | | 4.375%, 04/01/26 | | | 3,931 | |
| | 92 | | | Masonite International Corp., 5.625%, 03/15/23 (e) | | | 95 | |
| | 550 | | | MasTec, Inc., 4.875%, 03/15/23 | | | 550 | |
| | | | MetLife, Inc., | | | | |
| | 1,920 | | | 3.000%, 03/01/25 | | | 1,901 | |
| | 435 | | | 6.400%, 12/15/36 | | | 481 | |
| | | | MGM Resorts International, | | | | |
| | 1,985 | | | 6.000%, 03/15/23 | | | 2,164 | |
| | | | | | | | |
PRINCIPAL
AMOUNT | | | SECURITY DESCRIPTION | | VALUE | |
| | |
| | | | United States — continued | |
| | 735 | | | 6.625%, 12/15/21 | | | 820 | |
| | 2,545 | | | 7.750%, 03/15/22 | | | 2,971 | |
| | | | Micron Technology, Inc., | | | | |
| | 427 | | | 5.250%, 08/01/23 (e) | | | 431 | |
| | 2,275 | | | 5.250%, 01/15/24 (e) | | | 2,303 | |
| | 130 | | | 5.500%, 02/01/25 | | | 134 | |
| | | | Microsoft Corp., | | | | |
| | 1,515 | | | 4.100%, 02/06/37 | | | 1,570 | |
| | 1,390 | | | 4.875%, 12/15/43 | | | 1,565 | |
| EUR | 1,100 | | | Mohawk Industries, Inc., 2.000%, 01/14/22 | | | 1,245 | |
| | 350 | | | Momentive Performance Materials USA, Inc., 8.875%, 10/15/20 (d) | | | — | |
| | 350 | | | Momentive Performance Materials, Inc., 3.880%, 10/24/21 | | | 343 | |
| | | | Morgan Stanley, | | | | |
| | 2,500 | | | 2.800%, 06/16/20 | | | 2,532 | |
| | 3,110 | | | 3.700%, 10/23/24 | | | 3,176 | |
| | 1,500 | | | 3.875%, 01/27/26 | | | 1,530 | |
| | 790 | | | 4.300%, 01/27/45 | | | 796 | |
| | 1,090 | | | 4.375%, 01/22/47 | | | 1,108 | |
| | 2,670 | | | Series H, VAR, 5.450%, 07/15/19 (x) (y) | | | 2,739 | |
| | 2,470 | | | Series J, VAR, 5.550%, 07/15/20 (x) (y) | | | 2,569 | |
| | 846 | | | MPG Holdco I, Inc., 7.375%, 10/15/22 | | | 914 | |
| | 408 | | | MPH Acquisition Holdings LLC, 7.125%, 06/01/24 (e) | | | 440 | |
| | | | MPLX LP, | | | | |
| | 1,000 | | | 4.875%, 06/01/25 | | | 1,064 | |
| | 385 | | | 5.200%, 03/01/47 | | | 393 | |
| | 155 | | | MSCI, Inc., 5.250%, 11/15/24 (e) | | | 164 | |
| | | | Mylan NV, | | | | |
| | 3,095 | | | 3.150%, 06/15/21 | | | 3,096 | |
| | 487 | | | 5.250%, 06/15/46 | | | 487 | |
| | 325 | | | Nabors Industries, Inc., 5.500%, 01/15/23 (e) | | | 335 | |
| | | | Nationstar Mortgage LLC, | | | | |
| | 530 | | | 6.500%, 07/01/21 | | | 542 | |
| | 415 | | | 7.875%, 10/01/20 | | | 433 | |
| | 335 | | | Nature’s Bounty Co. (The), 7.625%, 05/15/21 (e) | | | 354 | |
| | 1,700 | | | Neiman Marcus Group Ltd. LLC, 8.000%, 10/15/21 (e) | | | 1,067 | |
| | | | Netflix, Inc., | | | | |
| | 300 | | | 5.500%, 02/15/22 | | | 320 | |
| | 200 | | | 5.750%, 03/01/24 | | | 215 | |
| | | | New Albertsons, Inc., | | | | |
| | 197 | | | 7.450%, 08/01/29 | | | 193 | |
| | 53 | | | 8.000%, 05/01/31 | | | 53 | |
SEE NOTES TO FINANCIAL STATEMENTS.
| | | | | | |
| | | |
| 20 | | | | J.P. MORGAN INCOME FUNDS | | FEBRUARY 28, 2017 |
| | | | | | | | |
PRINCIPAL
AMOUNT | | | SECURITY DESCRIPTION | | VALUE | |
| | Corporate Bonds — continued | |
| | | | United States — continued | |
| | 22 | | | 8.700%, 05/01/30 | | | 23 | |
| | 289 | | | Newfield Exploration Co., 5.750%, 01/30/22 | | | 308 | |
| | | | Nexstar Broadcasting, Inc., | | | | |
| | 1,650 | | | 6.125%, 02/15/22 (e) | | | 1,726 | |
| | 300 | | | NFP Corp., 9.000%, 07/15/21 (e) | | | 317 | |
| | 2,085 | | | Nielsen Finance LLC, 5.000%, 04/15/22 (e) | | | 2,142 | |
| | 1,290 | | | Noble Energy, Inc., 5.250%, 11/15/43 | | | 1,360 | |
| | 485 | | | Novelis Corp., 5.875%, 09/30/26 (e) | | | 499 | |
| | | | NRG Energy, Inc., | | | | |
| | 630 | | | 6.625%, 01/15/27 (e) | | | 619 | |
| | 115 | | | 7.875%, 05/15/21 | | | 119 | |
| | | | Oasis Petroleum, Inc., | | | | |
| | 5 | | | 6.875%, 03/15/22 | | | 5 | |
| | 870 | | | 6.875%, 01/15/23 | | | 882 | |
| | | | Oracle Corp., | | | | |
| | 4,150 | | | 2.650%, 07/15/26 | | | 3,988 | |
| | 1,455 | | | 4.500%, 07/08/44 | | | 1,531 | |
| | 8 | | | Orbital ATK, Inc., 5.250%, 10/01/21 | | | 8 | |
| | 208 | | | Oshkosh Corp., 5.375%, 03/01/25 | | | 216 | |
| | | | Outfront Media Capital LLC, | | | | |
| | 5 | | | 5.250%, 02/15/22 | | | 5 | |
| | 150 | | | 5.625%, 02/15/24 | | | 158 | |
| | | | Parker Drilling Co., | | | | |
| | 150 | | | 6.750%, 07/15/22 | | | 138 | |
| | 50 | | | 7.500%, 08/01/20 | | | 49 | |
| | 300 | | | Penn Virginia Corp., 8.500%, 05/01/20 (d) | | | 7 | |
| | 330 | | | Performance Food Group, Inc., 5.500%, 06/01/24 (e) | | | 342 | |
| | 2,283 | | | PetSmart, Inc., 7.125%, 03/15/23 (e) | | | 2,240 | |
| | 696 | | | Pilgrim’s Pride Corp., 5.750%, 03/15/25 (e) | | | 715 | |
| | 70 | | | Pinnacle Foods Finance LLC, 5.875%, 01/15/24 | | | 74 | |
| | 1,000 | | | Plantronics, Inc., 5.500%, 05/31/23 (e) | | | 1,018 | |
| | 330 | | | PolyOne Corp., 5.250%, 03/15/23 | | | 340 | |
| | | | Post Holdings, Inc., | | | | |
| | 1,007 | | | 6.750%, 12/01/21 (e) | | | 1,079 | |
| | 655 | | | 7.750%, 03/15/24 (e) | | | 727 | |
| | | | Prestige Brands, Inc., | | | | |
| | 10 | | | 5.375%, 12/15/21 (e) | | | 10 | |
| | 75 | | | 6.375%, 03/01/24 (e) | | | 80 | |
| | 760 | | | Prime Security Services Borrower LLC, 9.250%, 05/15/23 (e) | | | 833 | |
| | 660 | | | Prudential Financial, Inc., 4.600%, 05/15/44 | | | 698 | |
| EUR | 2,700 | | | PSPC Escrow Corp., Reg. S, 6.000%, 02/01/23 | | | 3,004 | |
| | 515 | | | QEP Resources, Inc., 5.375%, 10/01/22 | | | 518 | |
| | | | | | | | |
PRINCIPAL
AMOUNT | | | SECURITY DESCRIPTION | | VALUE | |
| | |
| | | | United States — continued | |
| | 15 | | | Quad/Graphics, Inc., 7.000%, 05/01/22 | | | 15 | |
| | 795 | | | Quicken Loans, Inc., 5.750%, 05/01/25 (e) | | | 783 | |
| EUR | 1,000 | | | Quintiles IMS, Inc., Reg. S, 3.500%, 10/15/24 | | | 1,091 | |
| | | | Qwest Capital Funding, Inc., | | | | |
| | 24 | | | 6.875%, 07/15/28 | | | 23 | |
| | 11 | | | 7.750%, 02/15/31 | | | 10 | |
| | 660 | | | Rackspace Hosting, Inc., 8.625%, 11/15/24 (e) | | | 695 | |
| | 375 | | | Radian Group, Inc., 7.000%, 03/15/21 | | | 418 | |
| | 150 | | | Radio Systems Corp., 8.375%, 11/01/19 (e) | | | 156 | |
| | 195 | | | Rain CII Carbon LLC, 8.000%, 12/01/18 (e) | | | 195 | |
| | 1,250 | | | Realogy Group LLC, 5.250%, 12/01/21 (e) | | | 1,300 | |
| | 595 | | | Regal Entertainment Group, 5.750%, 03/15/22 | | | 623 | |
| | | | Regency Energy Partners LP, | | | | |
| | 48 | | | 5.000%, 10/01/22 | | | 51 | |
| | 550 | | | 5.500%, 04/15/23 | | | 570 | |
| | | | Revlon Consumer Products Corp., | | | | |
| | 500 | | | 5.750%, 02/15/21 | | | 504 | |
| | 400 | | | 6.250%, 08/01/24 | | | 411 | |
| | 4,280 | | | Reynolds American, Inc., 4.450%, 06/12/25 | | | 4,525 | |
| | 840 | | | RHP Hotel Properties LP, 5.000%, 04/15/23 | | | 858 | |
| | 250 | | | Rice Energy, Inc., 7.250%, 05/01/23 | | | 262 | |
| | 1,250 | | | Rite Aid Corp., 6.125%, 04/01/23 (e) | | | 1,325 | |
| | 1,000 | | | Riverbed Technology, Inc., 8.875%, 03/01/23 (e) | | | 1,067 | |
| | 855 | | | Roper Technologies, Inc., 3.800%, 12/15/26 | | | 864 | |
| | 50 | | | RR Donnelley & Sons Co., 7.625%, 06/15/20 | | | 54 | |
| | 600 | | | RSI Home Products, Inc., 6.500%, 03/15/23 (e) | | | 624 | |
| | 31 | | �� | RSP Permian, Inc., 6.625%, 10/01/22 | | | 33 | |
| | | | Sabine Pass Liquefaction LLC, | | | | |
| | 1,245 | | | 5.625%, 03/01/25 | | | 1,366 | |
| | 990 | | | 5.625%, 04/15/23 | | | 1,089 | |
| | 600 | | | 5.750%, 05/15/24 | | | 664 | |
| | 604 | | | Sabre GLBL, Inc., 5.375%, 04/15/23 (e) | | | 615 | |
| | | | SBA Communications Corp., | | | | |
| | 250 | | | 4.875%, 07/15/22 | | | 255 | |
| | 330 | | | 4.875%, 09/01/24 (e) | | | 329 | |
| | | | Scientific Games International, Inc., | | | | |
| | 165 | | | 7.000%, 01/01/22 (e) | | | 176 | |
| | 315 | | | 10.000%, 12/01/22 | | | 334 | |
| | 500 | | | Sealed Air Corp., 5.125%, 12/01/24 (e) | | | 522 | |
| | 675 | | | Seminole Hard Rock Entertainment, Inc., 5.875%, 05/15/21 (e) | | | 692 | |
SEE NOTES TO FINANCIAL STATEMENTS.
| | | | | | | | |
| | | |
| FEBRUARY 28, 2017 | | J.P. MORGAN INCOME FUNDS | | | | | 21 | |
JPMorgan Global Bond Opportunities Fund
SCHEDULE OF PORTFOLIO INVESTMENTS
AS OF FEBRUARY 28, 2017 (Unaudited) (continued)
(Amounts in U.S. Dollars, unless otherwise noted)
(Amounts in thousands)
| | | | | | | | |
PRINCIPAL
AMOUNT | | | SECURITY DESCRIPTION | | VALUE | |
| | Corporate Bonds — continued | |
| | | | United States — continued | |
| | | | Sensata Technologies BV, | | | | |
| | 1,000 | | | 4.875%, 10/15/23 (e) | | | 1,021 | |
| | 129 | | | 5.000%, 10/01/25 (e) | | | 131 | |
| | 600 | | | 5.625%, 11/01/24 (e) | | | 633 | |
| | 265 | | | Sensata Technologies UK Financing Co. plc, 6.250%, 02/15/26 (e) | | | 286 | |
| | | | SESI LLC, | | | | |
| | 84 | | | 6.375%, 05/01/19 | | | 84 | |
| | 165 | | | 7.125%, 12/15/21 | | | 170 | |
| | 247 | | | Shingle Springs Tribal Gaming Authority, 9.750%, 09/01/21 (e) | | | 269 | |
| | | | Shire Acquisitions Investments Ireland DAC, | | | | |
| | 2,915 | | | 2.400%, 09/23/21 | | | 2,855 | |
| | 2,615 | | | 3.200%, 09/23/26 | | | 2,493 | |
| | | | Sinclair Television Group, Inc., | | | | |
| | 175 | | | 5.375%, 04/01/21 | | | 180 | |
| | 900 | | | 5.625%, 08/01/24 (e) | | | 926 | |
| | 2,000 | | | 6.125%, 10/01/22 | | | 2,093 | |
| | | | Sirius XM Radio, Inc., | | | | |
| | 415 | | | 4.625%, 05/15/23 (e) | | | 424 | |
| | 70 | | | 5.375%, 04/15/25 (e) | | | 72 | |
| | 880 | | | 5.750%, 08/01/21 (e) | | | 917 | |
| | 3,310 | | | 6.000%, 07/15/24 (e) | | | 3,525 | |
| | 200 | | | Six Flags Entertainment Corp., 5.250%, 01/15/21 (e) | | | 206 | |
| | 247 | | | SM Energy Co., 6.500%, 11/15/21 | | | 253 | |
| | | | Spectrum Brands, Inc., | | | | |
| | 29 | | | 6.125%, 12/15/24 | | | 31 | |
| | 500 | | | 6.625%, 11/15/22 | | | 529 | |
| | | | Sprint Capital Corp., | | | | |
| | 75 | | | 6.875%, 11/15/28 | | | 80 | |
| | 895 | | | 8.750%, 03/15/32 | | | 1,074 | |
| | | | Sprint Communications, Inc., | | | | |
| | 1,030 | | | 7.000%, 03/01/20 (e) | | | 1,125 | |
| | 352 | | | 7.000%, 08/15/20 | | | 380 | |
| | 59 | | | 9.125%, 03/01/17 | | | 59 | |
| | | | Sprint Corp., | | | | |
| | 1,392 | | | 7.125%, 06/15/24 | | | 1,503 | |
| | 22 | | | 7.250%, 09/15/21 | | | 24 | |
| | 404 | | | 7.625%, 02/15/25 | | | 451 | |
| | 7,639 | | | 7.875%, 09/15/23 | | | 8,498 | |
| | 665 | | | SPX FLOW, Inc., 5.625%, 08/15/24 (e) | | | 683 | |
| | | | Steel Dynamics, Inc., | | | | |
| | 15 | | | 5.125%, 10/01/21 | | | 16 | |
| | 190 | | | 5.500%, 10/01/24 | | | 201 | |
| | 250 | | | 6.375%, 08/15/22 | | | 261 | |
| | | | | | | | |
PRINCIPAL
AMOUNT | | | SECURITY DESCRIPTION | | VALUE | |
| | |
| | | | United States — continued | |
| | 114 | | | Stone Energy Corp., 7.500%, 11/15/22 (d) | | | 80 | |
| | 250 | | | Summit Midstream Holdings LLC, 5.500%, 08/15/22 | | | 253 | |
| | 2,010 | | | Sunoco Logistics Partners Operations LP, 5.350%, 05/15/45 | | | 2,047 | |
| | | | SUPERVALU, Inc., | | | | |
| | 155 | | | 6.750%, 06/01/21 | | | 155 | |
| | 300 | | | 7.750%, 11/15/22 | | | 296 | |
| | 145 | | | Synchrony Financial, 3.750%, 08/15/21 | | | 149 | |
| | 150 | | | Talen Energy Supply LLC, 4.625%, 07/15/19 (e) | | | 146 | |
| | 500 | | | Targa Resources Partners LP, 5.250%, 05/01/23 | | | 516 | |
| | 375 | | | Team Health Holdings, Inc., 6.375%, 02/01/25 (e) | | | 372 | |
| | 1,000 | | | TEGNA, Inc., 6.375%, 10/15/23 | | | 1,065 | |
| | 520 | | | Tempur Sealy International, Inc., 5.500%, 06/15/26 | | | 509 | |
| | | | Tenet Healthcare Corp., | | | | |
| | 300 | | | 4.500%, 04/01/21 | | | 304 | |
| | 1,055 | | | 6.000%, 10/01/20 | | | 1,118 | |
| | 200 | | | 6.750%, 02/01/20 | | | 204 | |
| | 1,000 | | | 6.750%, 06/15/23 | | | 991 | |
| | 100 | | | 8.000%, 08/01/20 | | | 102 | |
| | 3,035 | | | 8.125%, 04/01/22 | | | 3,187 | |
| | 207 | | | Tenneco, Inc., 5.375%, 12/15/24 | | | 216 | |
| | 65 | | | TerraForm Power Operating LLC, SUB, 6.375%, 02/01/23 (e) | | | 67 | |
| | 251 | | | Tesoro Corp., 4.750%, 12/15/23 (e) | | | 260 | |
| | | | Tesoro Logistics LP, | | | | |
| | 156 | | | 5.500%, 10/15/19 | | | 165 | |
| | 150 | | | 6.250%, 10/15/22 | | | 161 | |
| | | | Texas Competitive Electric Holdings Co. LLC, | | | | |
| | 375 | | | 8.500%, 05/01/20 (d) | | | 1 | |
| | 1,000 | | | Time, Inc., 5.750%, 04/15/22 (e) | | | 1,031 | |
| | | | T-Mobile USA, Inc., | | | | |
| | 4 | | | 5.250%, 09/01/18 | | | 4 | |
| | 21 | | | 6.000%, 03/01/23 | | | 22 | |
| | 5 | | | 6.125%, 01/15/22 | | | 5 | |
| | 400 | | | 6.250%, 04/01/21 | | | 414 | |
| | 1,436 | | | 6.375%, 03/01/25 | | | 1,544 | |
| | 203 | | | 6.464%, 04/28/19 | | | 205 | |
| | 690 | | | 6.500%, 01/15/24 | | | 741 | |
| | 327 | | | 6.625%, 04/01/23 | | | 347 | |
| | 765 | | | 6.633%, 04/28/21 | | | 796 | |
| | 798 | | | 6.731%, 04/28/22 | | | 830 | |
| | 203 | | | 6.836%, 04/28/23 | | | 217 | |
SEE NOTES TO FINANCIAL STATEMENTS.
| | | | | | |
| | | |
| 22 | | | | J.P. MORGAN INCOME FUNDS | | FEBRUARY 28, 2017 |
| | | | | | | | |
PRINCIPAL
AMOUNT | | | SECURITY DESCRIPTION | | VALUE | |
| | Corporate Bonds — continued | |
| | | | United States — continued | |
| | 77 | | | Toll Brothers Finance Corp., 4.875%, 11/15/25 | | | 78 | |
| | | | TransDigm, Inc., | | | | |
| | 394 | | | 6.375%, 06/15/26 (e) | | | 398 | |
| | 895 | | | 6.500%, 07/15/24 | | | 924 | |
| | 192 | | | Transocean Proteus Ltd., 6.250%, 12/01/24 (e) | | | 198 | |
| | 1,200 | | | Transocean, Inc., 9.000%, 07/15/23 (e) | | | 1,296 | |
| EUR | 2,175 | | | Trinseo Materials Operating SCA, Reg. S, 6.375%, 05/01/22 | | | 2,476 | |
| | 200 | | | UCI International LLC, 8.625%, 02/15/19 (d) | | | 51 | |
| | 225 | | | Unifrax I LLC, 7.500%, 02/15/19 (e) | | | 224 | |
| | 265 | | | Unit Corp., 6.625%, 05/15/21 | | | 264 | |
| | | | United Rentals North America, Inc., | | | | |
| | 385 | | | 5.500%, 07/15/25 | | | 406 | |
| | 50 | | | 5.500%, 05/15/27 | | | 51 | |
| | 50 | | | 5.875%, 09/15/26 | | | 53 | |
| | 700 | | | 6.125%, 06/15/23 | | | 735 | |
| | 586 | | | 7.625%, 04/15/22 | | | 612 | |
| | 710 | | | UnitedHealth Group, Inc., 4.750%, 07/15/45 | | | 800 | |
| | | | Universal Health Services, Inc., | | | | |
| | 34 | | | 3.750%, 08/01/19 (e) | | | 35 | |
| | 47 | | | 4.750%, 08/01/22 (e) | | | 48 | |
| | | | Univision Communications, Inc., | | | | |
| | 90 | | | 5.125%, 05/15/23 (e) | | | 90 | |
| | 175 | | | 6.750%, 09/15/22 (e) | | | 184 | |
| | 143 | | | US Concrete, Inc., 6.375%, 06/01/24 | | | 151 | |
| | 181 | | | Valeant Pharmaceuticals International, 7.000%, 10/01/20 (e) | | | 169 | |
| | | | Valeant Pharmaceuticals International, Inc., | | | | |
| | 300 | | | 5.375%, 03/15/20 (e) | | | 269 | |
| | 114 | | | 5.500%, 03/01/23 (e) | | | 92 | |
| | 85 | | | 5.625%, 12/01/21 (e) | | | 71 | |
| | 3,193 | | | 5.875%, 05/15/23 (e) | | | 2,568 | |
| | 1,000 | | | 6.125%, 04/15/25 (e) | | | 802 | |
| | 326 | | | 6.375%, 10/15/20 (e) | | | 297 | |
| | 237 | | | 6.750%, 08/15/21 (e) | | | 214 | |
| | 1,533 | | | 7.250%, 07/15/22 (e) | | | 1,380 | |
| | 100 | | | 7.500%, 07/15/21 (e) | | | 92 | |
| | 39 | | | VeriSign, Inc., 5.250%, 04/01/25 | | | 41 | |
| | | | Verizon Communications, Inc., | | | | |
| | 2,000 | | | 3.500%, 11/01/24 | | | 2,004 | |
| | 710 | | | 3.850%, 11/01/42 | | | 602 | |
| | 630 | | | 4.125%, 08/15/46 | | | 551 | |
| | 1,493 | | | 4.862%, 08/21/46 | | | 1,464 | |
| | 1,070 | | | 5.012%, 04/15/49 (e) | | | 1,050 | |
| | | | | | | | |
PRINCIPAL
AMOUNT | | | SECURITY DESCRIPTION | | VALUE | |
| | |
| | | | United States — continued | |
| | 405 | | | Vertiv Group Corp., 9.250%, 10/15/24 (e) | | | 435 | |
| | 965 | | | Vista Outdoor, Inc., 5.875%, 10/01/23 | | | 958 | |
| | | | Walgreens Boots Alliance, Inc., | | | | |
| | 1,000 | | | 2.700%, 11/18/19 | | | 1,015 | |
| | 200 | | | 4.800%, 11/18/44 | | | 207 | |
| | 311 | | | Weatherford International Ltd., 9.875%, 02/15/24 (e) | | | 359 | |
| | | | Wells Fargo & Co., | | | | |
| | 2,245 | | | 3.000%, 04/22/26 | | | 2,168 | |
| | 1,210 | | | 4.900%, 11/17/45 | | | 1,290 | |
| | 1,265 | | | Series S, VAR, 5.900%, 06/15/24 (x) (y) | | | 1,338 | |
| | 325 | | | WESCO Distribution, Inc., 5.375%, 06/15/24 | | | 335 | |
| | 750 | | | Western Digital Corp., 10.500%, 04/01/24 | | | 877 | �� |
| | 357 | | | Western Refining Logistics LP, 7.500%, 02/15/23 | | | 387 | |
| | 175 | | | Westlake Chemical Corp., 4.625%, 02/15/21 (e) | | | 182 | |
| | 333 | | | Whiting Petroleum Corp., 5.000%, 03/15/19 | | | 336 | |
| | | | Windstream Services LLC, | | | | |
| | 140 | | | 6.375%, 08/01/23 | | | 127 | |
| | 105 | | | 7.500%, 06/01/22 | | | 104 | |
| | 584 | | | 7.500%, 04/01/23 | | | 560 | |
| | 25 | | | 7.750%, 10/15/20 | | | 26 | |
| | 1,700 | | | 7.750%, 10/01/21 | | | 1,754 | |
| | | | WMG Acquisition Corp., | | | | |
| | 351 | | | 5.625%, 04/15/22 (e) | | | 365 | |
| | 200 | | | 6.750%, 04/15/22 (e) | | | 211 | |
| | 282 | | | WPX Energy, Inc., 6.000%, 01/15/22 | | | 289 | |
| | 1,715 | | | Wynn Las Vegas LLC, 5.500%, 03/01/25 (e) | | | 1,741 | |
| | 465 | | | XPO Logistics, Inc., 6.500%, 06/15/22 (e) | | | 488 | |
| | | | Zayo Group LLC, | | | | |
| | 124 | | | 5.750%, 01/15/27 (e) | | | 131 | |
| | 1,360 | | | 6.000%, 04/01/23 | | | 1,438 | |
| | 65 | | | 6.375%, 05/15/25 | | | 70 | |
| | 2,170 | | | Zebra Technologies Corp., 7.250%, 10/15/22 | | | 2,348 | |
| | | | | | | | |
| | | | | | | 475,297 | |
| | | | | | | | |
| | | | Total Corporate Bonds
(Cost $892,231) | | | 890,546 | |
| | | | | | | | |
| | Foreign Government Securities — 17.9% | |
| | | | Angola — 0.2% | | | | |
| | 3,464 | | | Republic of Angola, 9.500%, 11/12/25 (e) | | | 3,499 | |
| | | | | | | | |
| | | | Argentina — 0.9% | | | | |
| | | | Provincia de Buenos Aires, | | | | |
| | 2,828 | | | 9.125%, 03/16/24 (e) | | | 3,118 | |
| | 3,000 | | | Reg. S, 9.950%, 06/09/21 | | | 3,398 | |
SEE NOTES TO FINANCIAL STATEMENTS.
| | | | | | | | |
| | | |
| FEBRUARY 28, 2017 | | J.P. MORGAN INCOME FUNDS | | | | | 23 | |
JPMorgan Global Bond Opportunities Fund
SCHEDULE OF PORTFOLIO INVESTMENTS
AS OF FEBRUARY 28, 2017 (Unaudited) (continued)
(Amounts in U.S. Dollars, unless otherwise noted)
(Amounts in thousands)
| | | | | | | | |
PRINCIPAL
AMOUNT | | | SECURITY DESCRIPTION | | VALUE | |
| | Foreign Government Securities — continued | |
| | | | Argentina — continued | | | | |
| | | | Republic of Argentina, | | | | |
| | 2,930 | | | 6.875%, 04/22/21 (e) | | | 3,129 | |
| | 3,600 | | | 6.875%, 01/26/27 (e) | | | 3,600 | |
| | | | | | | | |
| | | | | | | 13,245 | |
| | | | | | | | |
| | | | Belarus — 0.3% | | | | |
| | 5,100 | | | Republic of Belarus, Reg. S, 8.950%, 01/26/18 | | | 5,253 | |
| | | | | | | | |
| | | | Brazil — 1.9% | | | | |
| BRL | 92,500 | | | Brazil Notas do Tesouro Nacional, Series F, 10.000%, 01/01/25 | | | 29,410 | |
| | | | | | | | |
| | | | Colombia — 0.3% | | | | |
| | 5,420 | | | Republic of Colombia, 5.000%, 06/15/45 | | | 5,382 | |
| | | | | | | | |
| | | | Croatia — 0.2% | | | | |
| | 3,200 | | | Republic of Croatia, Reg. S, 5.500%, 04/04/23 | | | 3,437 | |
| | | | | | | | |
| | | | Dominican Republic — 0.2% | | | | |
| | 2,960 | | | Government of Dominican Republic, 6.875%, 01/29/26 (e) | | | 3,249 | |
| | | | | | | | |
| | | | Ecuador — 0.2% | | | | |
| | 2,730 | | | Republic of Ecuador, 10.750%, 03/28/22 (e) | | | 3,044 | |
| | | | | | | | |
| | | | Egypt — 0.3% | | | | |
| | | | Republic of Egypt, | | | | |
| | 2,200 | | | 6.125%, 01/31/22 (e) | | | 2,282 | |
| | 1,900 | | | 8.500%, 01/31/47 (e) | | | 2,060 | |
| | | | | | | | |
| | | | | | | 4,342 | |
| | | | | | | | |
| | | | Indonesia — 2.2% | | | | |
| | | | Republic of Indonesia, | | | | |
| IDR | 368,877,000 | | | 8.750%, 05/15/31 | | | 29,280 | |
| | 5,200 | | | Reg. S, 5.375%, 10/17/23 | | | 5,759 | |
| | | | | | | | |
| | | | | | | 35,039 | |
| | | | | | | | |
| | | | Italy — 0.6% | | | | |
| EUR | 10,045 | | | Republic of Italy, Reg. S, 2.800%, 03/01/67 (e) | | | 9,025 | |
| | | | | | | | |
| | | | Mexico — 2.1% | | | | |
| | | | United Mexican States, | | | | |
| EUR | 2,610 | | | 3.375%, 02/23/31 | | | 2,869 | |
| MXN | 632,000 | | | Series M, 6.500%, 06/09/22 | | | 30,574 | |
| | | | | | | | |
| | | | | | | 33,443 | |
| | | | | | | | |
| | | | New Zealand — 2.3% | | | | |
| | | | Republic of New Zealand, | | | | |
| NZD | 21,340 | | | Reg. S, Series 0427, 4.500%, 04/15/27 | | | 17,009 | |
| | | | | | | | |
PRINCIPAL
AMOUNT | | | SECURITY DESCRIPTION | | VALUE | |
| | |
| | | | New Zealand — continued | | | | |
| NZD | 25,940 | | | Reg. S, Series 0433, 3.500%, 04/14/33 | | | 18,401 | |
| | | | | | | | |
| | | | | | | 35,410 | |
| | | | | | | | |
| | | | Nigeria — 0.4% | | | | |
| | 5,826 | | | Republic of Nigeria, 7.875%, 02/16/32 (e) | | | 6,132 | |
| | | | | | | | |
| | | | Oman — 0.2% | | | | |
| | 3,300 | | | Republic of Oman, 4.750%, 06/15/26 (e) | | | 3,234 | |
| | | | | | | | |
| | | | Pakistan — 0.2% | | | | |
| | 3,400 | | | Republic of Pakistan, Reg. S, 7.250%, 04/15/19 | | | 3,628 | |
| | | | | | | | |
| | | | Panama — 0.2% | | | | |
| | 2,430 | | | Republic of Panama, 3.875%, 03/17/28 | | | 2,460 | |
| | | | | | | | |
| | | | Paraguay — 0.1% | | | | |
| | 2,090 | | | Republic of Paraguay, 5.000%, 04/15/26 (e) | | | 2,132 | |
| | | | | | | | |
| | | | Portugal — 0.9% | | | | |
| | | | Portugal Obrigacoes do Tesouro, | | | | |
| EUR | 9,303 | | | Reg. S, 2.875%, 10/15/25 (e) | | | 9,262 | |
| EUR | 5,446 | | | Reg. S, 2.875%, 07/21/26 (e) | | | 5,323 | |
| | | | | | | | |
| | | | | | | 14,585 | |
| | | | | | | | |
| | | | Russia — 2.0% | | | | |
| RUB | 1,781,780 | | | Russian Federation, 8.150%, 02/03/27 | | | 30,649 | |
| | | | | | | | |
| | | | Spain — 1.1% | | | | |
| | | | Spain Government Bond, | | | | |
| EUR | 4,869 | | | Reg. S, 1.300%, 10/31/26 (e) | | | 5,046 | |
| EUR | 11,187 | | | Reg. S, 1.950%, 04/30/26 (e) | | | 12,306 | |
| | | | | | | | |
| | | | | | | 17,352 | |
| | | | | | | | |
| | | | Sri Lanka — 0.3% | | | | |
| | 3,780 | | | Republic of Sri Lanka, 6.825%, 07/18/26 (e) | | | 3,936 | |
| | | | | | | | |
| | | | Turkey — 0.2% | | | | |
| | 3,000 | | | Republic of Turkey, 6.625%, 02/17/45 | | | 3,131 | |
| | | | | | | | |
| | | | Ukraine — 0.1% | | | | |
| | 700 | | | Republic of Ukraine, Reg. S, 7.750%, 09/01/19 | | | 703 | |
| | | | | | | | |
| | | | Uruguay — 0.2% | | | | |
| | 3,250 | | | Republic of Uruguay, 4.375%, 10/27/27 | | | 3,352 | |
| | | | | | | | |
| | | | Zambia — 0.3% | | | | |
| | 4,400 | | | Republic of Zambia, Reg. S, 8.500%, 04/14/24 | | | 4,576 | |
| | | | | | | | |
| | | | Total Foreign Government Securities
(Cost $282,404) | | | 279,648 | |
| | | | | | | | |
SEE NOTES TO FINANCIAL STATEMENTS.
| | | | | | |
| | | |
| 24 | | | | J.P. MORGAN INCOME FUNDS | | FEBRUARY 28, 2017 |
| | | | | | | | |
PRINCIPAL
AMOUNT | | | SECURITY DESCRIPTION | | VALUE | |
| | Loan Assignments — 2.8% | | | | |
| | | | Australia — 0.0% (g) | | | | |
| | 343 | | | FMG Resources Pty. Ltd., Term Loan B, VAR, 3.750%, 06/30/19 | | | 345 | |
| | | | | | | | |
| | | | Canada — 0.2% | | | | |
| | 1,139 | | | Concordia Healthcare Corp., Initial Dollar Term Loan, VAR, 5.250%, 10/21/21 | | | 928 | |
| | 40 | | | Garda World Security Corp., Term B Delayed Draw Loan, VAR, 4.000%, 11/06/20 | | | 40 | |
| | 156 | | | Garda World Security Corp., Term B Loan, VAR, 4.000%, 11/06/20 | | | 157 | |
| | 379 | | | Mitel Networks Corp., Term Loan 2015, VAR, 5.539%, 04/29/22 | | | 382 | |
| | 1,367 | | | Valeant Pharmaceuticals International, Inc., Series F-1 Tranche B Term Loan, VAR, 5.530%, 04/01/22 | | | 1,375 | |
| | | | | | | | |
| | | | | | | 2,882 | |
| | | | | | | | |
| | | | Luxembourg — 0.1% | | | | |
| | 475 | | | Intelsat Jackson Holdings SA, Tranche B-2 Term Loan, VAR, 3.750%, 06/30/19 | | | 472 | |
| | 956 | | | Onex Wizard Acquisition Co. II S.C.A., Initial Dollar Term Loan, VAR, 4.000%, 03/11/22 | | | 966 | |
| | | | | | | | |
| | | | | | | 1,438 | |
| | | | | | | | |
| | | | Sweden — 0.1% | | | | |
| | 1,022 | | | Auris Luxembourg III SARL, Facility B-4, VAR, 4.250%, 01/17/22 | | | 1,030 | |
| | | | | | | | |
| | | | United States — 2.4% | | | | |
| | 535 | | | Acadia Healthcare Co., Inc., Tranche B-2 Term Loan, VAR, 3.781%, 02/16/23 | | | 539 | |
| | 170 | | | Albertson’s LLC, Term Loan B-4, VAR, 3.781%, 08/25/21 | | | 172 | |
| | 471 | | | Albertson’s LLC, Term Loan B-5, VAR, 4.247%, 12/21/22 | | | 477 | |
| | 69 | | | Albertson’s LLC, Term Loan B-6, VAR, 4.302%, 06/22/23 | | | 70 | |
| | 344 | | | American Casino & Entertainment Properties LLC, Term Loan B, VAR, 4.250%, 07/07/22 | | | 346 | |
| | 97 | | | Avaya, Inc., DIP Term Loan, VAR, 4.983%, 01/19/18 (d) | | | 100 | |
| | 185 | | | Avaya, Inc., Term Loan B-3 Extending Tranche, VAR, 5.537%, 10/26/17^ | | | 147 | |
| | 105 | | | Avaya, Inc., Term Loan B-6, VAR, 6.532%, 03/31/18 (d) | | | 84 | |
| | 479 | | | Avaya, Inc., Term Loan B-7, VAR, 6.282%, 05/29/20 (d) | | | 383 | |
| | 667 | | | Axalta Coating Systems U.S. Holdings, Inc., Term Loan B, VAR, 3.498%, 02/01/20 | | | 675 | |
| | 421 | | | Berry Plastics Corp., Term Loan K, VAR, 3.022%, 02/08/20 | | | 423 | |
| | | | | | | | |
PRINCIPAL
AMOUNT | | | SECURITY DESCRIPTION | | VALUE | |
| | | | | |
| | | | United States — continued | | | | |
| | 205 | | | Berry Plastics Corp., Term Loan L, VAR, 3.022%, 01/06/21 | | | 206 | |
| | 131 | | | BJ’s Wholesale Club, Inc., 2nd Lien Term Loan, VAR, 8.500%, 01/27/25 | | | 131 | |
| | 250 | | | California Resources Corp., 1st Lien Second Out Term Loan, VAR, 11.375%, 08/05/21 | | | 282 | |
| | 985 | | | Calpine Corp., Term Loan, VAR, 3.750%, 05/27/22 | | | 990 | |
| | 300 | | | Chesapeake Energy Corp., 1st Lien Last Out, VAR, 8.553%, 08/23/21 | | | 324 | |
| | 744 | | | CHG Healthcare Services, Inc., Term Loan B, VAR, 4.750%, 06/07/23 | | | 754 | |
| | 290 | | | Chrysler Group LLC, Tranche B Term Loan, VAR, 3.280%, 12/31/18 | | | 290 | |
| | 411 | | | CHS/Community Health Systems, Inc., Incremental 2018 Term F Loan, VAR, 4.180%, 12/31/18 | | | 410 | |
| | 813 | | | CHS/Community Health Systems, Inc., Incremental 2021 Term H Loan, VAR, 4.000%, 01/27/21 | | | 798 | |
| | 362 | | | Cincinnati Bell, Inc., Term Loan, VAR, 4.000%, 09/10/20 | | | 364 | |
| | 842 | | | CITGO Petroleum Corp., Term B Loan, VAR, 4.500%, 07/29/21 | | | 846 | |
| | 550 | | | Clear Channel Communications, Inc., Term Loan D, VAR, 7.531%, 01/30/19 | | | 477 | |
| | 24 | | | Clear Channel Communications, Inc., Tranche E Term Loan, VAR, 8.281%, 07/30/19 | | | 20 | |
| | 940 | | | Compass investorsOnex USI Acquisition Corp., Term Loan B, VAR, 4.250%, 12/27/19 | | | 945 | |
| | 149 | | | Consolidated Communications, Inc., Term Loan B2, VAR, 4.000%, 10/05/23 ^ | | | 150 | |
| | 875 | | | Continental Building Products, Inc., Term Loan B, VAR, 3.281%, 08/18/23 | | | 882 | |
| | 49 | | | DaVita HealthCare Partners, Inc., Tranche B Term Loan, VAR, 3.531%, 06/24/21 | | | 49 | |
| | 998 | | | Dell Software Group, Term Loan, VAR, 7.000%, 09/15/22 | | | 1,014 | |
| | 850 | | | Delta 2 SARL, USD Facility B-3, VAR, 5.068%, 07/30/21 | | | 852 | |
| | 91 | | | Dole Food Co., Inc., Tranche B Term Loan, VAR, 4.549%, 11/01/18 | | | 92 | |
| | 313 | | | Drillships Ocean Ventures, Inc., Term Loan, VAR, 5.563%, 07/25/21 | | | 290 | |
| | 340 | | | Duff & Phelps Corp., Initial Term B-1 Loan, VAR, 4.750%, 04/23/20 | | | 342 | |
| | 489 | | | Duff & Phelps Corp., Term Loan, VAR, 4.750%, 04/23/20 | | | 492 | |
| | 459 | | | Emdeon, Inc., Term B-3 Loan, VAR, 3.750%, 11/02/18 | | | 459 | |
SEE NOTES TO FINANCIAL STATEMENTS.
| | | | | | | | |
| | | |
| FEBRUARY 28, 2017 | | J.P. MORGAN INCOME FUNDS | | | | | 25 | |
JPMorgan Global Bond Opportunities Fund
SCHEDULE OF PORTFOLIO INVESTMENTS
AS OF FEBRUARY 28, 2017 (Unaudited) (continued)
(Amounts in U.S. Dollars, unless otherwise noted)
(Amounts in thousands, except number of Futures contracts)
| | | | | | | | |
PRINCIPAL
AMOUNT | | | SECURITY DESCRIPTION | | VALUE | |
| | Loan Assignments — continued | | | | |
| | | | United States — continued | | | | |
| | 510 | | | Energy Future Intermediate Holding Co. LLC, Term Loan, VAR, 4.304%, 06/30/17 | | | 511 | |
| | 108 | | | Entegris, Inc., Tranche B Term Loan, VAR, 3.531%, 04/30/21 | | | 109 | |
| | 175 | | | FGI Operating Co., Term Loan B, VAR, 5.500%, 04/19/19 ^ | | | 168 | |
| | | | First Data Corp., Term Loan, | | | | |
| | 753 | | | VAR, 3.779%, 03/24/21 | | | 759 | |
| | 800 | | | VAR, 3.779%, 07/08/22 | | | 805 | |
| | 400 | | | GoDaddy, Inc., Term Loan B, VAR, 3.270%, 02/03/24 ^ | | | 401 | |
| | 379 | | | Graton Economic Development Authority, Incremental Term B Loan, VAR, 4.779%, 09/01/22 | | | 383 | |
| | 87 | | | Halyard Health, Inc., Term Loan, VAR, 3.531%, 11/01/21 | | | 88 | |
| | 244 | | | Hearthside Group Holdings LLC, 1st Lien Term Loan B, VAR, 4.000%, 06/21/21 | | | 246 | |
| | 382 | | | HUB International Ltd., Initial Term Loan, VAR, 4.034%, 10/02/20 | | | 385 | |
| | 376 | | | Hudson Products Holdings, Inc., Term Loan, VAR, 5.000%, 03/15/19 | | | 361 | |
| | 1,101 | | | IASIS Healthcare LLC, Term Loan B, VAR, 4.500%, 05/03/18 | | | 1,101 | |
| | 491 | | | IMS Health, Inc., Term Loan, VAR, 3.500%, 03/17/21 | | | 493 | |
| | 1,080 | | | Infor US, Inc., Tranche B-6 Term Loan, VAR, 3.750%, 02/01/22 ^ | | | 1,081 | |
| | 743 | | | Intrawest Operations Group LLC, Initial Term Loan, VAR, 4.500%, 12/09/20 | | | 749 | |
| | 530 | | | inVentiv Health, Inc., Term Loan B, VAR, 4.804%, 09/28/23 | | | 533 | |
| | 519 | | | J. Crew Group, Inc., Initial Loan, VAR, 4.000%, 03/05/21 ^ | | | 296 | |
| | 380 | | | Jeld-Wen, Inc., Consolidated Term Loan B, VAR, 4.750%, 07/01/22 | | | 382 | |
| | 92 | | | Landry’s, Inc., 1st Lien Term Loan, VAR, 4.029%, 09/22/23 | | | 93 | |
| | 98 | | | Mauser AG (FKA Pertus Sechzehnte GmbH), 1st Lien Initial Dollar Term Loan, VAR, 4.500%, 07/31/21 | | | 98 | |
| | 425 | | | Moran Foods LLC, Term Loan B, VAR, 7.000%, 11/29/23 | | | 421 | |
| | 238 | | | MultiPlan, Inc., 1st Lien Term Loan B, VAR, 5.000%, 06/07/23 | | | 242 | |
| | 460 | | | National Mentor Holdings, Inc., Tranche B Term Loan, VAR, 4.250%, 01/31/21 | | | 460 | |
| | 986 | | | NVA Holdings, Inc., 1st Lien Term Loan, VAR, 4.750%, 08/14/21 | | | 991 | |
| | | | | | | | |
PRINCIPAL
AMOUNT | | | SECURITY DESCRIPTION | | VALUE | |
| | | | | |
| | | | United States — continued | | | | |
| | 314 | | | NVA Holdings, Inc., 1st Lien Term Loan B, VAR, 4.250%, 08/13/21 ^ | | | 317 | |
| | 286 | | | Packers Holdings LLC, Initial Term Loan, VAR, 4.750%, 12/02/21 | | | 290 | |
| | 394 | | | Peabody Energy Corp., Term Loan, VAR, 4.250%, 09/24/20 (d) | | | 398 | |
| | 413 | | | Petco Animal Supplies, Inc., 1st Lien Term Loan B-1, VAR, 4.287%, 01/26/23 | | | 397 | |
| | 253 | | | PetSmart, Inc., Term Loan B, VAR, 4.000%, 03/11/22 | | | 249 | |
| | 429 | | | Prime Security Services Borrower LLC, Term B-1 Loan, VAR, 4.250%, 05/02/22 | | | 433 | |
| | 350 | | | Rackspace Hosting, Inc., 1st Lien Term Loan B, VAR, 4.534%, 11/03/23 ^ | | | 354 | |
| | 500 | | | Rite Aid Corp., Tranche 2 Term Loan, VAR, 4.875%, 06/21/21 | | | 502 | |
| | 977 | | | Scientific Games Corp., Initial Term Loan, VAR, 4.845%, 10/18/20 | | | 992 | |
| | 487 | | | Sears Roebuck Acceptance Corp., Term Loan, VAR, 5.500%, 06/30/18 | | | 482 | |
| | 1,479 | | | Summit Materials Co. I LLC, Term Loan, VAR, 3.853%, 07/18/22 | | | 1,495 | |
| | 107 | | | SUPERVALU, Inc., Term Loan B, VAR, 5.500%, 03/21/19 | | | 108 | |
| | 465 | | | Tribe Buyer LLC, 1st Lien Term Loan, VAR, 5.500%, 02/08/24 | | | 463 | |
| | 200 | | | Tribe Buyer LLC, 2nd Lien Term Loan, VAR, 11.000%, 02/08/25 | | | 196 | |
| | 496 | | | Tribune Media Co., Term Loan B, VAR, 3.781%, 12/27/20 | | | 496 | |
| | 979 | | | Tronox Ltd., Term Loan, VAR, 4.500%, 03/19/20 | | | 986 | |
| | 463 | | | Univision Communications, Inc., 2013 Incremental Term Loan, VAR, 4.000%, 03/01/20 | | | 464 | |
| | 1,275 | | | Univision Communications, Inc., Replacement 1st Lien Term Loan, VAR, 4.000%, 03/01/20 | | | 1,279 | |
| | 112 | | | Western Refining, Inc., 1st Lien Term Loan B, VAR, 5.500%, 06/23/23 | | | 112 | |
| | 1,420 | | | WMG Acquisition Corp., Term Loan B, VAR, 3.750%, 11/01/23 | | | 1,423 | |
| | | | | | | | |
| | | | | | | 37,467 | |
| | | | | | | | |
| | | | Total Loan Assignments
(Cost $43,140) | | | 43,162 | |
| | | | | | | | |
| | |
| SHARES | | | | | | |
| | Preferred Stock — 0.0% (g) | |
| | | | Ireland — 0.0% (g) | | | | |
| | — | (h) | | XLIT Ltd., Series D, VAR, 4.143%, 04/17/17 ($1,000 par value) @
(Cost $50) | | | 52 | |
| | | | | | | | |
SEE NOTES TO FINANCIAL STATEMENTS.
| | | | | | |
| | | |
| 26 | | | | J.P. MORGAN INCOME FUNDS | | FEBRUARY 28, 2017 |
| | | | | | | | |
NUMBER
OF RIGHTS | | | SECURITY DESCRIPTION | | VALUE | |
| | Rights — 0.0% (g) | |
| | | | United States — 0.0% (g) | | | | |
| | 6 | | | Vistra Energy Corp., expiring 12/31/49 (a)
(Cost $—) | | | 7 | |
| | | | | | | | |
| | |
PRINCIPAL
AMOUNT | | | | | | |
| | Short-Term Investments — 2.0% | |
| | | | U.S. Treasury obligation — 0.0% (g) | | | | |
| | 285 | | | U.S. Treasury Bill, 0.511%, 04/06/17 (k) (n) | | | 285 | |
| | | | | | | | |
| | | | | | | | |
SHARES | | | SECURITY DESCRIPTION | | VALUE | |
| | | | Investment Company — 2.0% | | | | |
| | 30,691 | | | JPMorgan Prime Money Market Fund, Institutional Class Shares, 0.850% (b) (l) | | | 30,703 | |
| | | | | | | | |
| | | | Total Short-Term Investments
(Cost $30,987) | | | 30,988 | |
| | | | | | | | |
| | | | Total Investments — 97.2%
(Cost $1,521,544) | | | 1,517,917 | |
| | | | Other Assets in Excess of
Liabilities — 2.8% | | | 43,949 | |
| | | | | | | | |
| | | | NET ASSETS — 100.0% | | $ | 1,561,866 | |
| | | | | | | | |
Percentages indicated are based on net assets.
| | | | | | | | |
| TBA Short Commitment | |
PRINCIPAL
AMOUNT | | | SECURITY DESCRIPTION | | VALUE | |
| | (200 | ) | | FNMA, 30 Year, Single Family, TBA, 3.000%, 03/25/47 (w) | | $ | (199 | ) |
| | | | | | | | |
| | | | (Proceeds received of $198) | | | | |
| | | | | | | | | | | | | | | | | | | | |
| Futures Contracts | | | | |
NUMBER OF CONTRACTS | | | DESCRIPTION | | EXPIRATION
DATE | | | TRADING
CURRENCY | | | NOTIONAL
VALUE AT FEBRUARY 28, 2017 | | | NET
UNREALIZED
APPRECIATION (DEPRECIATION) | |
| | | | Long Futures Outstanding | | | | | |
| | 416 | | | Euro-Bund | | | 03/08/17 | | | | EUR | | | | 73,180 | | | | 1,557 | |
| | 980 | | | 10 Year Australian Government Bond | | | 03/15/17 | | | | AUD | | | | 96,359 | | | | 114 | |
| | 476 | | | 10 Year Canadian Government Bond | | | 06/21/17 | | | | CAD | | | | 49,223 | | | | 333 | |
| | 4 | | | Long Gilt | | | 06/28/17 | | | | GBP | | | | 632 | | | | 11 | |
| | |
| | | | Short Futures Outstanding | | | | | |
| | (203 | ) | | Euro-Buxl | | | 03/08/17 | | | | EUR | | | | (37,338 | ) | | | (1,569 | ) |
| | (691 | ) | | Euro-OAT | | | 03/08/17 | | | | EUR | | | | (109,770 | ) | | | (251 | ) |
| | (1,804 | ) | | 10 Year U.S. Treasury Note | | | 06/21/17 | | | | USD | | | | (224,739 | ) | | | (659 | ) |
| | (26 | ) | | 10 Year U.S. Treasury Ultra Bond | | | 06/21/17 | | | | USD | | | | (3,482 | ) | | | (12 | ) |
| | (47 | ) | | U.S. Treasury Long Bond | | | 06/21/17 | | | | USD | | | | (7,128 | ) | | | (72 | ) |
| | (73 | ) | | U.S. Ultra Bond | | | 06/21/17 | | | | USD | | | | (11,810 | ) | | | (154 | ) |
| | (9 | ) | | Long Gilt | | | 06/28/17 | | | | GBP | | | | (1,421 | ) | | | (24 | ) |
| | (1,007 | ) | | 2 Year U.S. Treasury Note | | | 06/30/17 | | | | USD | | | | (217,921 | ) | | | (144 | ) |
| | (135 | ) | | 5 Year U.S. Treasury Note | | | 06/30/17 | | | | USD | | | | (15,890 | ) | | | (21 | ) |
| | (1,260 | ) | | 90 Day Eurodollar | | | 03/19/18 | | | | USD | | | | (309,739 | ) | | | 572 | |
| | (683 | ) | | 90 Day Eurodollar | | | 12/17/18 | | | | USD | | | | (167,344 | ) | | | 237 | |
| | | | | | | | | | | | | | | | | | | | |
| | | | | | | | | | | | | | | | | | | (82 | ) |
| | | | | | | | | | | | | | | | | | | | |
SEE NOTES TO FINANCIAL STATEMENTS.
| | | | | | | | |
| | | |
| FEBRUARY 28, 2017 | | J.P. MORGAN INCOME FUNDS | | | | | 27 | |
JPMorgan Global Bond Opportunities Fund
SCHEDULE OF PORTFOLIO INVESTMENTS
AS OF FEBRUARY 28, 2017 (Unaudited) (continued)
(Amounts in U.S. Dollars, unless otherwise noted)
(Amounts in thousands)
| | | | | | | | | | | | | | | | | | | | | | | | |
| Forward Foreign Currency Exchange Contracts | |
CONTRACTS
TO BUY | | | CURRENCY | | | COUNTERPARTY | | SETTLEMENT
DATE | | | SETTLEMENT
VALUE | | | VALUE AT
FEBRUARY 28, 2017 | | | NET
UNREALIZED
APPRECIATION (DEPRECIATION) | |
| | 3,500 | | | | AUD | | | Australia and New Zealand Banking Group Ltd. | | | 03/06/17 | | | | 2,675 | | | | 2,683 | | | | 8 | |
| | 1,650 | | | | AUD | | | National Australia Bank Ltd. | | | 03/06/17 | | | | 1,266 | | | | 1,265 | | | | (1 | ) |
| | 42,041 | | | | CAD | | | Merrill Lynch International | | | 03/06/17 | | | | 32,111 | | | | 31,653 | | | | (458 | ) |
| | 800 | | | | CAD | | | National Australia Bank Ltd. | | | 03/06/17 | | | | 609 | | | | 603 | | | | (6 | ) |
| | 58,062 | | | | EUR | | | Goldman Sachs International | | | 03/06/17 | | | | 61,530 | | | | 61,520 | | | | (10 | ) |
| | 2,000 | | | | EUR | | | National Australia Bank Ltd. | | | 03/06/17 | | | | 2,140 | | | | 2,119 | | | | (21 | ) |
| | 3,532 | | | | GBP | | | National Australia Bank Ltd. | | | 03/06/17 | | | | 4,366 | | | | 4,383 | | | | 17 | |
| | 128,501 | | | | MXN | | | Goldman Sachs International | | | 04/07/17 | | | | 6,441 | | | | 6,360 | | | | (81 | ) |
| | 49,275 | | | | NZD | | | Australia and New Zealand Banking Group Ltd. | | | 03/06/17 | | | | 35,614 | | | | 35,488 | | | | (126 | ) |
| | | | | | | | | | | | | | | 146,752 | | | | 146,074 | | | | (678 | ) |
| | |
| | | | | | | | | | | | | | | | | | | | | | | | |
CONTRACTS
TO SELL | | | CURRENCY | | | COUNTERPARTY | | SETTLEMENT
DATE | | | SETTLEMENT
VALUE | | | VALUE AT
FEBRUARY 28, 2017 | | | NET
UNREALIZED
APPRECIATION
(DEPRECIATION) | |
| | 4,926 | | | | AUD | | | Australia and New Zealand Banking Group Ltd. | | | 03/06/17 | | | | 3,719 | | | | 3,777 | | | | (58 | ) |
| | 224 | | | | AUD | | | Standard Chartered Bank | | | 03/06/17 | | | | 173 | | | | 172 | | | | 1 | |
| | 9,525 | | | | AUD | | | National Australia Bank Ltd. | | | 04/07/17 | | | | 7,317 | | | | 7,296 | | | | 21 | |
| | 3,126 | | | | CAD | | | HSBC Bank, NA | | | 03/06/17 | | | | 2,382 | | | | 2,353 | | | | 29 | |
| | 1,067 | | | | CAD | | | National Australia Bank Ltd. | | | 03/06/17 | | | | 816 | | | | 803 | | | | 13 | |
| | 38,648 | | | | CAD | | | Royal Bank of Canada | | | 03/06/17 | | | | 29,413 | | | | 29,099 | | | | 314 | |
| | 42,041 | | | | CAD | | | Merrill Lynch International | | | 04/07/17 | | | | 32,120 | | | | 31,662 | | | | 458 | |
| | 730 | | | | EUR | | | BNP Paribas | | | 03/06/17 | | | | 779 | | | | 773 | | | | 6 | |
| | 220,843 | | | | EUR | | | Citibank, NA | | | 03/06/17 | | | | 238,930 | | | | 233,994 | | | | 4,936 | |
| | 58,591 | | | | EUR | | | Goldman Sachs International | | | 03/06/17 | | | | 62,705 | | | | 62,081 | | | | 624 | |
| | 720 | | | | EUR | | | National Australia Bank Ltd. | | | 03/06/17 | | | | 763 | | | | 763 | | | | — | (h) |
| | 56,973 | | | | EUR | | | Goldman Sachs International | | | 04/07/17 | | | | 60,459 | | | | 60,463 | | | | (4 | ) |
| | 27,515 | | | | GBP | | | Merrill Lynch International | | | 03/06/17 | | | | 34,874 | | | | 34,145 | | | | 729 | |
| | 304 | | | | GBP | | | Royal Bank of Canada | | | 03/06/17 | | | | 380 | | | | 376 | | | | 4 | |
| | 146,366 | | | | MXN | | | National Australia Bank Ltd. | | | 04/07/17 | | | | 7,315 | | | | 7,244 | | | | 71 | |
| | 49,275 | | | | NZD | | | Australia and New Zealand Banking Group Ltd. | | | 03/06/17 | | | | 35,750 | | | | 35,488 | | | | 262 | |
| | 49,275 | | | | NZD | | | Australia and New Zealand Banking Group Ltd. | | | 04/07/17 | | | | 35,579 | | | | 35,452 | | | | 127 | |
| | | | | | | | | | | | | | | 553,474 | | | | 545,941 | | | | 7,533 | |
| | |
SEE NOTES TO FINANCIAL STATEMENTS.
| | | | | | |
| | | |
| 28 | | | | J.P. MORGAN INCOME FUNDS | | FEBRUARY 28, 2017 |
NOTES TO SCHEDULE OF PORTFOLIO INVESTMENTS
AS OF FEBRUARY 28, 2017 (Unaudited)
| | |
| ABS | | — Asset-Backed Security |
| AUD | | — Australian Dollar |
| BRL | | — Brazilian Real |
| CAD | | — Canadian Dollar |
| CDO | | — Collateralized Debt Obligation |
| CLO | | — Collateralized Loan Obligation |
| DIP | | — Debtor-in-possession |
| EUR | | — Euro |
| FHLMC | | — Federal Home Loan Mortgage Corp. |
| FNMA | | — Federal National Mortgage Association |
| GBP | | — British Pound |
| GNMA | | — Government National Mortgage Association |
| IDR | | — Indonesian Rupiah |
| IF | | — Inverse Floaters represent securities that pay interest at a rate that increases (decreases) with a decline (incline) in a specified index. The interest rate shown is the rate in effect as of February 28, 2017. The rate may be subject to a cap and floor. |
| IO | | — Interest Only represents the right to receive the monthly interest payments on an underlying pool of mortgage loans. The principal amount shown represents the par value on the underlying pool. The yields on these securities are subject to accelerated principal paydowns as a result of prepayment or refinancing of the underlying pool of mortgage instruments. As a result, interest income may be reduced considerably. |
| MXN | | — Mexican Peso |
| NZD | | — New Zealand Dollar |
| Reg. S | | — Security was purchased pursuant to Regulation S under the Securities Act of 1933, which exempts from registration securities offered and sold outside of the United States. Such a security cannot be sold in the United States without either an effective registration statement filed pursuant to the Securities
Act of 1933, or pursuant to an exemption from registration. |
| REMIC | | — Real Estate Mortgage Investment Conduit |
| RUB | | — Russian Ruble |
| STRIPS | | — Separate Trading of Registered Interest and Principal of Securities. The STRIPS Program lets investors hold and trade individual interest and principal components of eligible notes and bonds as separate securities. |
| SUB | | — Step-Up Bond. The interest rate shown is the rate in effect as of February 28, 2017. |
| | |
| TBA | | — To Be Announced |
| USD | | — United States Dollar |
| VAR | | — Variable Rate Security. The interest rate shown is the rate in effect as of February 28, 2017. |
| |
| (a) | | — Non-income producing security. |
| (b) | | — Investment in affiliate. Money market fund is registered under the Investment Company Act of 1940, as amended, and advised by J.P. Morgan Investment Management Inc. |
| (d) | | — Defaulted Security. Security has not paid its last interest payment and/or interest is not being accrued. |
| (e) | | — Security is exempt from registration under Rule 144A of the Securities Act of 1933, as amended. Unless otherwise indicated, this security has been determined to be liquid under procedures established by the Board of Trustees and may be resold in transactions exempt from registration, normally to qualified institutional buyers. |
| (g) | | — Amount rounds to less than 0.05%. |
| (h) | | — Amount rounds to less than 500. |
| (k) | | — All or a portion of this security is deposited with the broker as initial margin for future contracts. |
| (l) | | — The rate shown is the current yield as of February 28, 2017. |
| (n) | | — The rate shown is the effective yield as of February 28, 2017. |
| (v) | | — Security has the ability to pay in kind (“PIK”) or pay income in cash. When applicable, separate rates of such payments are disclosed. |
| (w) | | — All or portion of the security is a when-issued security, delayed delivery security, or forward commitment. |
| (x) | | — Security is perpetual and thus, does not have a predetermined maturity date. The coupon rate for this security is fixed for a period of time and may be structured to adjust thereafter. The date shown, if applicable, reflects the next call date. The coupon rate shown is the rate in effect as of February 28, 2017. |
| (y) | | — Preferred Security |
| ^ | | — All or a portion of the security is unsettled as of February 28, 2017. Unless otherwise indicated, the coupon rate is undetermined. The coupon rate shown may not be accrued for the entire position. |
| @ | | — The date shown reflects the next call date on which the issuer may redeem the security. The coupon rate for this security is currently in effect as of February 28, 2017. |
SEE NOTES TO FINANCIAL STATEMENTS.
| | | | | | | | |
| | | |
| FEBRUARY 28, 2017 | | J.P. MORGAN INCOME FUNDS | | | | | 29 | |
STATEMENT OF ASSETS AND LIABILITIES
AS OF FEBRUARY 28, 2017 (Unaudited)
(Amounts in thousands, except per share amounts)
| | | | |
| | | Global Bond
Opportunities
Fund | |
ASSETS: | | | | |
Investments in non-affiliates, at value | | $ | 1,487,214 | |
Investments in affiliates, at value | | | 30,703 | |
| | | | |
Total investment securities, at value | | | 1,517,917 | |
Cash | | | 2,348 | |
Foreign currency, at value | | | 10,497 | |
Deposits at broker for futures contracts | | | 9,570 | |
Receivables: | | | | |
Investment securities sold | | | 2,761 | |
Investment securities sold — delayed delivery securities | | | 198 | |
Fund shares sold | | | 16,294 | |
Interest and dividends from non-affiliates | | | 18,517 | |
Dividends from affiliates | | | 18 | |
Tax reclaims | | | 58 | |
Variation margin on futures contracts | | | 238 | |
Unrealized appreciation on forward foreign currency exchange contracts | | | 7,620 | |
Unrealized appreciation on unfunded commitments | | | 3 | |
| | | | |
Total Assets | | | 1,586,039 | |
| | | | |
| |
LIABILITIES: | | | | |
Payables: | | | | |
TBA short commitments, at value | | | 199 | |
Investment securities purchased | | | 13,615 | |
Investment securities purchased — delayed delivery securities | | | 7,184 | |
Fund shares redeemed | | | 1,531 | |
Unrealized depreciation on forward foreign currency exchange contracts | | | 765 | |
Accrued liabilities: | | | | |
Investment advisory fees | | | 498 | |
Administration fees | | | 8 | |
Distribution fees | | | 60 | |
Shareholder servicing fees | | | 100 | |
Custodian and accounting fees | | | 36 | |
Trustees’ and Chief Compliance Officer’s fees | | | — | (a) |
Other | | | 177 | |
| | | | |
Total Liabilities | | | 24,173 | |
| | | | |
Net Assets | | $ | 1,561,866 | |
| | | | |
| (a) | Amount rounds to less than 500. |
SEE NOTES TO FINANCIAL STATEMENTS.
| | | | | | |
| | | |
| 30 | | | | J.P. MORGAN INCOME FUNDS | | FEBRUARY 28, 2017 |
| | | | |
| | | Global Bond
Opportunities
Fund | |
NET ASSETS: | | | | |
Paid-in-Capital | | $ | 1,592,349 | |
Accumulated undistributed (distributions in excess of) net investment income | | | (6,893 | ) |
Accumulated net realized gains (losses) | | | (26,575 | ) |
Net unrealized appreciation (depreciation) | | | 2,985 | |
| | | | |
Total Net Assets | | $ | 1,561,866 | |
| | | | |
| |
Net Assets: | | | | |
Class A | | $ | 146,321 | |
Class C | | | 57,617 | |
Class R6 | | | 147,233 | |
Class I (formerly Select Class) | | | 1,210,695 | |
| | | | |
Total | | $ | 1,561,866 | |
| | | | |
| |
Outstanding units of beneficial interest (shares) | | | | |
($0.0001 par value; unlimited number of shares authorized): | | | | |
Class A | | | 14,451 | |
Class C | | | 5,708 | |
Class R6 | | | 14,508 | |
Class I (formerly Select Class) | | | 119,340 | |
| |
Net Asset Value (a): | | | | |
Class A — Redemption price per share | | $ | 10.13 | |
Class C — Offering price per share (b) | | | 10.09 | |
Class R6 — Offering and redemption price per share | | | 10.15 | |
Class I (formerly Select Class) — Offering and redemption price per share | | | 10.14 | |
Class A maximum sales charge | | | 3.75 | % |
Class A maximum public offering price per share
[net asset value per share/(100% — maximum sales charge)] | | $ | 10.52 | |
| | | | |
| |
Cost of investments in non-affiliates | | $ | 1,490,842 | |
Cost of investments in affiliates | | | 30,702 | |
Cost of foreign currency | | | 10,539 | |
Proceeds from short TBAs | | | 198 | |
| (a) | Per share amounts may not recalculate due to rounding of net assets and/or shares outstanding. |
| (b) | Redemption price for Class C Shares varies based upon length of time the shares are held. |
SEE NOTES TO FINANCIAL STATEMENTS.
| | | | | | | | |
| | | |
| FEBRUARY 28, 2017 | | J.P. MORGAN INCOME FUNDS | | | | | 31 | |
STATEMENT OF OPERATIONS
FOR THE SIX MONTHS ENDED FEBRUARY 28, 2017 (Unaudited)
(Amounts in thousands)
| | | | |
| | | Global Bond
Opportunities
Fund | |
INVESTMENT INCOME: | | | | |
Interest income from non-affiliates | | $ | 34,233 | |
Interest income from affiliates | | | 10 | |
Dividend income from non-affiliates | | | 16 | |
Dividend income from affiliates | | | 104 | |
Foreign taxes withheld | | | (147 | ) |
| | | | |
Total investment income | | | 34,216 | |
| | | | |
| |
EXPENSES: | | | | |
Investment advisory fees | | | 3,906 | |
Administration fees | | | 581 | |
Distribution fees: | | | | |
Class A | | | 165 | |
Class C | | | 200 | |
Shareholder servicing fees: | | | | |
Class A | | | 165 | |
Class C | | | 66 | |
Class I (formerly Select Class) | | | 1,374 | |
Custodian and accounting fees | | | 136 | |
Interest expense to affiliates | | | 3 | |
Professional fees | | | 61 | |
Trustees’ and Chief Compliance Officer’s fees | | | 15 | |
Printing and mailing costs | | | 28 | |
Registration and filing fees | | | 45 | |
Transfer agency fees (See Note 2.I.) | | | 10 | |
Sub-transfer agency fees (See Note 2.I.) | | | 220 | |
Other | | | 22 | |
| | | | |
Total expenses | | | 6,997 | |
| | | | |
Less fees waived | | | (2,166 | ) |
Less earnings credits | | | — | (a) |
Less expense reimbursements | | | (4 | ) |
| | | | |
Net expenses | | | 4,827 | |
| | | | |
Net investment income (loss) | | | 29,389 | |
| | | | |
| |
REALIZED/UNREALIZED GAINS (LOSSES): | | | | |
Net realized gain (loss) on transactions from: | | | | |
Investments in non-affiliates | | | (16,436 | ) |
Investments in affiliates | | | 9 | |
Futures | | | 2,917 | |
Foreign currency transactions | | | 15,728 | |
| | | | |
Net realized gain (loss) | | | 2,218 | |
| | | | |
Change in net unrealized appreciation/depreciation on: | | | | |
Investments in non-affiliates | | | (12,632 | ) |
Investments in affiliates | | | 1 | |
Futures | | | (2,388 | ) |
Foreign currency translations | | | 8,137 | |
Unfunded commitments | | | 3 | |
| | | | |
Change in net unrealized appreciation/depreciation | | | (6,879 | ) |
| | | | |
Net realized/unrealized gains (losses) | | | (4,661 | ) |
| | | | |
Change in net assets resulting from operations | | $ | 24,728 | |
| | | | |
| (a) | Amount rounds to less than 500. |
SEE NOTES TO FINANCIAL STATEMENTS.
| | | | | | |
| | | |
| 32 | | | | J.P. MORGAN INCOME FUNDS | | FEBRUARY 28, 2017 |
STATEMENT OF CHANGES IN NET ASSETS
FOR THE PERIODS INDICATED
(Amounts in thousands)
| | | | | | | | |
| | | Global Bond Opportunities Fund | |
| | | Six Months Ended
February 28, 2017
(Unaudited) | | | Year Ended
August 31, 2016 | |
CHANGE IN NET ASSETS RESULTING FROM OPERATIONS: | | | | | | | | |
Net investment income (loss) | | $ | 29,389 | | | $ | 51,024 | |
Net realized gain (loss) | | | 2,218 | | | | (12,452 | ) |
Change in net unrealized appreciation/depreciation | | | (6,879 | ) | | | 52,034 | |
| | | | | | | | |
Change in net assets resulting from operations | | | 24,728 | | | | 90,606 | |
| | | | | | | | |
| | |
DISTRIBUTIONS TO SHAREHOLDERS: | | | | | | | | |
Class A | | | | | | | | |
From net investment income | | | (3,669 | ) | | | (4,239 | ) |
Class C | | | | | | | | |
From net investment income | | | (1,377 | ) | | | (1,255 | ) |
Class R6 | | | | | | | | |
From net investment income | | | (3,864 | ) | | | (6,999 | ) |
Class I (formerly Select Class) | | | | | | | | |
From net investment income | | | (31,602 | ) | | | (52,977 | ) |
| | | | | | | | |
Total distributions to shareholders | | | (40,512 | ) | | | (65,470 | ) |
| | | | | | | | |
| | |
CAPITAL TRANSACTIONS: | | | | | | | | |
Change in net assets resulting from capital transactions | | | 176,978 | | | | 241,385 | |
| | | | | | | | |
| | |
NET ASSETS: | | | | | | | | |
Change in net assets | | | 161,194 | | | | 266,521 | |
Beginning of period | | | 1,400,672 | | | | 1,134,151 | |
| | | | | | | | |
End of period | | $ | 1,561,866 | | | $ | 1,400,672 | |
| | | | | | | | |
Accumulated undistributed (distributions in excess of) net investment income | | $ | (6,893 | ) | | $ | 4,230 | |
| | | | | | | | |
| | |
CAPITAL TRANSACTIONS: | | | | | | | | |
Class A | | | | | | | | |
Proceeds from shares issued | | $ | 45,847 | | | $ | 100,815 | |
Distributions reinvested | | | 3,553 | | | | 4,173 | |
Cost of shares redeemed | | | (26,874 | ) | | | (47,414 | ) |
| | | | | | | | |
Change in net assets resulting from Class A capital transactions | | $ | 22,526 | | | $ | 57,574 | |
| | | | | | | | |
Class C | | | | | | | | |
Proceeds from shares issued | | $ | 14,730 | | | $ | 39,751 | |
Distributions reinvested | | | 1,271 | | | | 1,148 | |
Cost of shares redeemed | | | (7,021 | ) | | | (6,345 | ) |
| | | | | | | | |
Change in net assets resulting from Class C capital transactions | | $ | 8,980 | | | $ | 34,554 | |
| | | | | | | | |
Class R6 | | | | | | | | |
Proceeds from shares issued | | $ | 27,274 | | | $ | 86,783 | |
Distributions reinvested | | | 1,404 | | | | 2,415 | |
Cost of shares redeemed | | | (35,588 | ) | | | (51,649 | ) |
| | | | | | | | |
Change in net assets resulting from Class R6 capital transactions | | $ | (6,910 | ) | | $ | 37,549 | |
| | | | | | | | |
Class I (formerly Select Class) | | | | | | | | |
Proceeds from shares issued | | $ | 330,585 | | | $ | 808,159 | |
Distributions reinvested | | | 12,704 | | | | 13,467 | |
Cost of shares redeemed | | | (190,907 | ) | | | (709,918 | ) |
| | | | | | | | |
Change in net assets resulting from Class I capital transactions | | $ | 152,382 | | | $ | 111,708 | |
| | | | | | | | |
Total change in net assets resulting from capital transactions | | $ | 176,978 | | | $ | 241,385 | |
| | | | | | | | |
SEE NOTES TO FINANCIAL STATEMENTS.
| | | | | | | | |
| | | |
| FEBRUARY 28, 2017 | | J.P. MORGAN INCOME FUNDS | | | | | 33 | |
STATEMENT OF CHANGES IN NET ASSETS
FOR THE PERIODS INDICATED (continued)
(Amounts in thousands)
| | | | | | | | |
| | | Global Bond Opportunities Fund | |
| | | Six Months Ended
February 28, 2017
(Unaudited) | | | Year Ended
August 31, 2016 | |
SHARE TRANSACTIONS: | | | | | | | | |
Class A | | | | | | | | |
Issued | | | 4,541 | | | | 10,154 | |
Reinvested | | | 354 | | | | 423 | |
Redeemed | | | (2,671 | ) | | | (4,779 | ) |
| | | | | | | | |
Change in Class A Shares | | | 2,224 | | | | 5,798 | |
| | | | | | | | |
Class C | | | | | | | | |
Issued | | | 1,459 | | | | 4,013 | |
Reinvested | | | 127 | | | | 117 | |
Redeemed | | | (698 | ) | | | (644 | ) |
| | | | | | | | |
Change in Class C Shares | | | 888 | | | | 3,486 | |
| | | | | | | | |
Class R6 | | | | | | | | |
Issued | | | 2,693 | | | | 8,827 | |
Reinvested | | | 140 | | | | 245 | |
Redeemed | | | (3,486 | ) | | | (5,270 | ) |
| | | | | | | | |
Change in Class R6 Shares | | | (653 | ) | | | 3,802 | |
| | | | | | | | |
Class I (formerly Select Class) | | | | | | | | |
Issued | | | 32,702 | | | | 81,537 | |
Reinvested | | | 1,265 | | | | 1,363 | |
Redeemed | | | (18,931 | ) | | | (72,538 | ) |
| | | | | | | | |
Change in Class I Shares | | | 15,036 | | | | 10,362 | |
| | | | | | | | |
SEE NOTES TO FINANCIAL STATEMENTS.
| | | | | | |
| | | |
| 34 | | | | J.P. MORGAN INCOME FUNDS | | FEBRUARY 28, 2017 |
THIS PAGE IS INTENTIONALLY LEFT BLANK
| | | | | | | | |
| | | |
| FEBRUARY 28, 2017 | | J.P. MORGAN INCOME FUNDS | | | | | 35 | |
FINANCIAL HIGHLIGHTS
FOR THE PERIODS INDICATED
| | | | | | | | | | | | | | | | | | | | | | | | | | | | |
| | | Per share operating performance | |
| | | | | | Investment operations | | | Distributions | |
| | | Net asset
value,
beginning
of period | | | Net
investment
income
(loss) | | | Net realized
and unrealized
gains (losses) on
investments | | | Total from
investment
operations | | | Net
investment
income | | | Net
realized
gain | | | Total
distributions | |
Global Bond Opportunities Fund | | | | | | | | | | | | | | | | | | | | | |
Class A | | | | | | | | | | | | | | | | | | | | | | | | | | | | |
Six Months Ended February 28, 2017 (Unaudited) | | $ | 10.24 | | | $ | 0.20 | (f) | | $ | (0.04 | ) | | $ | 0.16 | | | $ | (0.27 | ) | | $ | — | | | $ | (0.27 | ) |
Year Ended August 31, 2016 | | | 10.01 | | | | 0.38 | (f) | | | 0.34 | | | | 0.72 | | | | (0.49 | ) | | | — | | | | (0.49 | ) |
Year Ended August 31, 2015 | | | 10.60 | | | | 0.40 | (f) | | | (0.53 | ) | | | (0.13 | ) | | | (0.45 | ) | | | (0.01 | ) | | | (0.46 | ) |
Year Ended August 31, 2014 | | | 10.20 | | | | 0.42 | (f) | | | 0.38 | | | | 0.80 | | | | (0.35 | ) | | | (0.05 | ) | | | (0.40 | ) |
September 4, 2012(h) through August 31, 2013 | | | 10.00 | | | | 0.45 | | | | 0.16 | | | | 0.61 | | | | (0.41 | ) | | | — | | | | (0.41 | ) |
| | | | | | | |
Class C | | | | | | | | | | | | | | | | | | | | | | | | | | | | |
Six Months Ended February 28, 2017 (Unaudited) | | | 10.21 | | | | 0.18 | (f) | | | (0.05 | ) | | | 0.13 | | | | (0.25 | ) | | | — | | | | (0.25 | ) |
Year Ended August 31, 2016 | | | 9.99 | | | | 0.34 | (f) | | | 0.33 | | | | 0.67 | | | | (0.45 | ) | | | — | | | | (0.45 | ) |
Year Ended August 31, 2015 | | | 10.59 | | | | 0.35 | (f) | | | (0.51 | ) | | | (0.16 | ) | | | (0.43 | ) | | | (0.01 | ) | | | (0.44 | ) |
Year Ended August 31, 2014 | | | 10.21 | | | | 0.37 | (f) | | | 0.39 | | | | 0.76 | | | | (0.33 | ) | | | (0.05 | ) | | | (0.38 | ) |
September 4, 2012(h) through August 31, 2013 | | | 10.00 | | | | 0.44 | | | | 0.14 | | | | 0.58 | | | | (0.37 | ) | | | — | | | | (0.37 | ) |
| | | | | | | |
Class R6 | | | | | | | | | | | | | | | | | | | | | | | | | | | | |
Six Months Ended February 28, 2017 (Unaudited) | | | 10.27 | | | | 0.22 | (f) | | | (0.05 | ) | | | 0.17 | | | | (0.29 | ) | | | — | | | | (0.29 | ) |
Year Ended August 31, 2016 | | | 10.03 | | | | 0.42 | (f) | | | 0.35 | | | | 0.77 | | | | (0.53 | ) | | | — | | | | (0.53 | ) |
Year Ended August 31, 2015 | | | 10.61 | | | | 0.44 | (f) | | | (0.52 | ) | | | (0.08 | ) | | | (0.49 | ) | | | (0.01 | ) | | | (0.50 | ) |
Year Ended August 31, 2014 | | | 10.21 | | | | 0.48 | (f) | | | 0.36 | | | | 0.84 | | | | (0.39 | ) | | | (0.05 | ) | | | (0.44 | ) |
September 4, 2012(h) through August 31, 2013 | | | 10.00 | | | | 0.52 | | | | 0.14 | | | | 0.66 | | | | (0.45 | ) | | | — | | | | (0.45 | ) |
| | | | | | | |
Class I (formerly Select Class) | | | | | | | | | | | | | | | | | | | | | | | | | | | | |
Six Months Ended February 28, 2017 (Unaudited) | | | 10.26 | | | | 0.21 | (f) | | | (0.04 | ) | | | 0.17 | | | | (0.29 | ) | | | — | | | | (0.29 | ) |
Year Ended August 31, 2016 | | | 10.03 | | | | 0.40 | (f) | | | 0.35 | | | | 0.75 | | | | (0.52 | ) | | | — | | | | (0.52 | ) |
Year Ended August 31, 2015 | | | 10.61 | | | | 0.42 | (f) | | | (0.52 | ) | | | (0.10 | ) | | | (0.47 | ) | | | (0.01 | ) | | | (0.48 | ) |
Year Ended August 31, 2014 | | | 10.21 | | | | 0.45 | (f) | | | 0.37 | | | | 0.82 | | | | (0.37 | ) | | | (0.05 | ) | | | (0.42 | ) |
September 4, 2012(h) through August 31, 2013 | | | 10.00 | | | | 0.50 | | | | 0.14 | | | | 0.64 | | | | (0.43 | ) | | | — | | | | (0.43 | ) |
| (a) | Annualized for periods less than one year, unless otherwise noted. |
| (b) | Not annualized for periods less than one year. |
| (c) | Includes adjustments in accordance with accounting principles generally accepted in the United States of America and as such, the net asset values for financial reporting purposes and the returns based upon those net asset values may differ from the net asset values and returns for shareholder transactions. |
| (d) | Includes earnings credits and interest expense, if applicable, each of which is less than 0.005% unless otherwise noted. |
| (e) | Portfolio turnover is calculated by dividing the lesser of total purchases or sales of portfolio securities for the reporting period by the monthly average value of portfolio securities owned during the reporting period. Excluded from both the numerator and denominator are amounts relating to derivatives and securities whose maturities or expiration dates at the time of acquisition were one year or less. |
| (f) | Calculated based upon average shares outstanding. |
| (g) | Certain non-recurring expenses incurred by the Fund were not annualized for the year ended August 31, 2014 and for the period ended August 31, 2013. |
| (h) | Commencement of operations. |
SEE NOTES TO FINANCIAL STATEMENTS.
| | | | | | |
| | | |
| 36 | | | | J.P. MORGAN INCOME FUNDS | | FEBRUARY 28, 2017 |
| | | | | | | | | | | | | | | | | | | | | | | | | | |
| | | Ratios/Supplemental data | |
| | | | | | | | | | Ratios to average net assets (a) | | | | |
Net asset
value,
end of
period | | | Total return
(excludes
sales charge) (b)(c) | | | Net assets,
end of
period
(000’s) | | | Net
expenses (d) | | | Net
investment income
(loss) | | | Expenses
without waivers,
reimbursements and
earnings credits | | | Portfolio
turnover
rate (b)(e) | |
| | | | | | | | | | | | | | | | | | | | | | | | | | |
| | | | | | | | | | | | | | | | | | | | | | | | | | |
| $ | 10.13 | | | | 1.64 | % | | $ | 146,321 | | | | 0.90 | % | | | 3.92 | % | | | 1.27 | % | | | 31 | % |
| | 10.24 | | | | 7.51 | | | | 125,248 | | | | 0.89 | | | | 3.81 | | | | 1.27 | | | | 71 | |
| | 10.01 | | | | (1.26 | ) | | | 64,383 | | | | 0.89 | | | | 3.85 | | | | 1.27 | | | | 90 | |
| | 10.60 | | | | 8.01 | | | | 19,131 | | | | 0.89 | (g) | | | 4.01 | (g) | | | 1.49 | (g) | | | 77 | |
| | 10.20 | | | | 6.12 | | | | 203 | | | | 0.90 | (g) | | | 4.66 | (g) | | | 2.41 | (g) | | | 117 | |
| | | | | | |
| | | | | | | | | | | | | | | | | | | | | | | | | | |
| | 10.09 | | | | 1.35 | | | | 57,617 | | | | 1.29 | | | | 3.52 | | | | 1.74 | | | | 31 | |
| | 10.21 | | | | 7.03 | | | | 49,223 | | | | 1.29 | | | | 3.40 | | | | 1.76 | | | | 71 | |
| | 9.99 | | | | (1.63 | ) | | | 13,324 | | | | 1.29 | | | | 3.44 | | | | 1.79 | | | | 90 | |
| | 10.59 | | | | 7.55 | | | | 4,727 | | | | 1.29 | (g) | | | 3.49 | (g) | | | 1.98 | (g) | | | 77 | |
| | 10.21 | | | | 5.77 | | | | 53 | | | | 1.30 | (g) | | | 4.30 | (g) | | | 2.54 | (g) | | | 117 | |
| | | | | | |
| | | | | | | | | | | | | | | | | | | | | | | | | | |
| | 10.15 | | | | 1.74 | | | | 147,233 | | | | 0.50 | | | | 4.30 | | | | 0.68 | | | | 31 | |
| | 10.27 | | | | 8.01 | | | | 155,660 | | | | 0.49 | | | | 4.23 | | | | 0.69 | | | | 71 | |
| | 10.03 | | | | (0.86 | ) | | | 113,977 | | | | 0.49 | | | | 4.22 | | | | 0.71 | | | | 90 | |
| | 10.61 | | | | 8.38 | | | | 47,277 | | | | 0.49 | (g) | | | 4.53 | (g) | | | 1.00 | (g) | | | 77 | |
| | 10.21 | | | | 6.58 | | | | 53 | | | | 0.50 | (g) | | | 5.10 | (g) | | | 1.55 | (g) | | | 117 | |
| | | | | | |
| | | | | | | | | | | | | | | | | | | | | | | | | | |
| | 10.14 | | | | 1.67 | | | | 1,210,695 | | | | 0.65 | | | | 4.16 | | | | 0.95 | | | | 31 | |
| | 10.26 | | | | 7.76 | | | | 1,070,541 | | | | 0.64 | | | | 4.09 | | | | 0.95 | | | | 71 | |
| | 10.03 | | | | (0.97 | ) | | | 942,467 | | | | 0.64 | | | | 4.08 | | | | 0.97 | | | | 90 | |
| | 10.61 | | | | 8.22 | | | | 132,823 | | | | 0.64 | (g) | | | 4.30 | (g) | | | 1.26 | (g) | | | 77 | |
| | 10.21 | | | | 6.43 | | | | 26,731 | | | | 0.65 | (g) | | | 4.95 | (g) | | | 1.80 | (g) | | | 117 | |
SEE NOTES TO FINANCIAL STATEMENTS.
| | | | | | | | |
| | | |
| FEBRUARY 28, 2017 | | J.P. MORGAN INCOME FUNDS | | | | | 37 | |
NOTES TO FINANCIAL STATEMENTS
AS OF FEBRUARY 28, 2017 (Unaudited)
1. Organization
JPMorgan Trust I (the “Trust”) was formed on November 12, 2004, as a Delaware statutory trust, pursuant to a Declaration of Trust dated November 5, 2004 and is registered under the Investment Company Act of 1940, as amended (the “1940 Act”), as an open-end management investment company.
The following is a separate fund of the Trust (the “Fund”) covered by this report:
| | | | |
| | | Classes Offered | | Diversified/Non-Diversified |
| Global Bond Opportunities Fund | | Class A, Class C, Class R6 and Class I^ | | Diversified |
| ^ | Effective April 3, 2017, Select Class was renamed Class I. |
The investment objective of the Fund is to seek to provide total return.
Class A Shares generally provide for a front-end sales charge while Class C Shares provide for a contingent deferred sales charge (“CDSC”). No sales charges are assessed with respect to Class R6 and Class I Shares. All classes of shares have equal rights as to earnings, assets and voting privileges, except that each class may bear different transfer agency, sub-transfer agency, distribution and shareholder servicing fees and each class has exclusive voting rights with respect to its distribution plan and shareholder servicing agreements. Certain Class A Shares, for which front-end sales charges have been waived, may be subject to a CDSC as described in the Fund’s prospectus.
J.P. Morgan Investment Management Inc. (“JPMIM”) an indirect, wholly-owned subsidiary of JPMorgan Chase & Co. (“JPMorgan”) acts as Adviser (the “Adviser”) and Administrator (the “Administrator”) to the Fund.
2. Significant Accounting Policies
The following is a summary of significant accounting policies followed by the Fund in the preparation of its financial statements. The Fund is an investment company and, accordingly, follows the investment company accounting and reporting guidance of the Financial Accounting Standards Board Accounting Standards Codification Topic 946 — Investment Companies, which is part of U.S. generally accepted accounting principles (“GAAP”). The preparation of financial statements in conformity with GAAP requires management to make estimates and assumptions that affect the reported amounts of assets and liabilities and disclosure of contingent assets and liabilities at the date of the financial statements and the reported amounts of increases and decreases in net assets from operations during the reporting period. Actual results could differ from those estimates.
A. Valuation of Investments — The valuation of investments is in accordance with GAAP and the Fund’s valuation policies set forth by and under the supervision and responsibility of the Board of Trustees (the “Board”), which established the following approach to valuation, as described more fully below: (i) investments for which market quotations are readily available shall be valued at such unadjusted quoted prices and (ii) all other investments for which market quotations are not readily available shall be valued at their fair value as determined in good faith by the Board.
The Administrator has established the J.P. Morgan Investment Management Americas Valuation Committee (“AVC”) to assist the Board with the oversight and monitoring of the valuation of the Fund’s investments. The Administrator implements the valuation policies of the Fund’s investments, as directed by the Board. The AVC oversees and carries out the policies for the valuation of investments held in the Fund. This includes monitoring the appropriateness of fair values based on results of ongoing valuation oversight, including but not limited to consideration of macro or security specific events, market events and pricing vendor and broker due diligence. The Administrator is responsible for discussing and assessing the potential impacts to the fair values on an ongoing basis, and at least on a quarterly basis with the AVC and the Board.
A market-based approach is primarily used to value the Fund’s investments. Investments for which market quotations are not readily available are fair valued by approved affiliated and unaffiliated pricing vendors or third party broker-dealers (collectively referred to as “Pricing Services”) or may be internally fair valued using methods set forth by the valuation policies approved by the Board. This may include related or comparable assets or liabilities, recent transactions, market multiples, book values, and other relevant information for the investment to determine the fair value of the investment. An income-based valuation approach may be used in which the anticipated future cash flows of the investment are discounted to calculate the fair value. Discounts may also be applied due to the nature or duration of any restrictions on the disposition of the investments. Valuations may be based upon current market prices of securities that are comparable in coupon, rating, maturity and industry. It is possible that the estimated values may differ significantly from the values that would have been used, had a ready market for the investments existed, and such differences could be material.
Fixed income instruments are valued based on prices received from Pricing Services. The Pricing Services use multiple valuation techniques to determine the valuation of fixed income instruments. In instances where sufficient market activity exists, the Pricing Services may utilize a market-based approach through which trades or quotes from market makers are used to determine the valuation of these instruments. In instances where sufficient market activity may not exist, the Pricing Services also utilize proprietary valuation models which may consider market transactions in comparable securities and the various relationships between securities in determining fair value and/or market characteristics in order to estimate the relevant cash flows, which are then discounted to calculate the fair values.
Equities and other exchange-traded instruments are valued at the last sale price or official market closing price on the primary exchange on which the instrument is traded before the net asset values (“NAV”) of the Fund are calculated on a valuation date.
Investments in open-end investment companies (the “Underlying Funds”) are valued at each Underlying Fund’s NAV per share as of the report date.
Futures are generally valued on the basis of available market quotations. Forward foreign currency exchange contracts are valued utilizing market quotations from approved Pricing Services.
| | | | | | |
| | | |
| 38 | | | | J.P. MORGAN INCOME FUNDS | | FEBRUARY 28, 2017 |
See the table on “Quantitative Information about Level 3 Fair Value Measurements” for information on the valuation techniques and inputs used to value level 3 securities held by the Fund at February 28, 2017.
Valuations reflected in this report are as of the report date. As a result, changes in valuation due to market events and/or issuer related events after the report date and prior to issuance of the report are not reflected herein.
The various inputs that are used in determining the valuation of the Fund’s investments are summarized into the three broad levels listed below.
| • | | Level 1 — Unadjusted inputs using quoted prices in active markets for identical investments. |
| • | | Level 2 — Other significant observable inputs including, but not limited to, quoted prices for similar investments, inputs other than quoted prices that are observable for investments (such as interest rates, prepayment speeds, credit risk, etc.) or other market corroborated inputs. |
| • | | Level 3 — Significant inputs based on the best information available in the circumstances, to the extent observable inputs are not available (including the Fund’s assumptions in determining the fair value of investments). |
A financial instrument’s level within the fair value hierarchy is based on the lowest level of any input, both individually and in the aggregate, that is significant to the fair value measurement. The inputs or methodology used for valuing instruments are not necessarily an indication of the risk associated with investing in those instruments.
The following table represents each valuation input as presented on the Schedule of Portfolio Investments (“SOI”) (amounts in thousands):
| | | | | | | | | | | | | | | | |
| | | Level 1
Quoted prices | | | Level 2
Other significant
observable inputs | | | Level 3
Significant
unobservable inputs | | | Total | |
Investments in Securities | | | | | | | | | | | | | | | | |
Debt Securities | | | | | | | | | | | | | | | | |
Asset-Backed Securities | | | | | | | | | | | | | | | | |
Cayman Islands | | $ | — | | | $ | 8,432 | | | $ | 3,209 | | | $ | 11,641 | |
Ireland | | | — | | | | — | | | | 785 | | | | 785 | |
Italy | | | — | | | | 15 | | | | — | | | | 15 | |
United States | | | — | | | | 4,527 | | | | 40,648 | | | | 45,175 | |
| | | | | | | | | | | | | | | | |
Total Asset-Backed Securities | | | — | | | | 12,974 | | | | 44,642 | | | | 57,616 | |
| | | | | | | | | | | | | | | | |
Collateralized Mortgage Obligations | | | | | | | | | | | | | | | | |
Italy | | | — | | | | — | | | | 124 | | | | 124 | |
Spain | | | — | | | | 41 | | | | — | | | | 41 | |
United States | | | — | | | | 33,130 | | | | — | | | | 33,130 | |
| | | | | | | | | | | | | | | | |
Total Collateralized Mortgage Obligations | | | — | | | | 33,171 | | | | 124 | | | | 33,295 | |
| | | | | | | | | | | | | | | | |
Commercial Mortgage-Backed Securities | | | | | | | | | | | | | | | | |
United States | | | — | | | | 78,778 | | | | 45,098 | | | | 123,876 | |
| | | | | | | | | | | | | | | | |
Convertible Bonds | | | | | | | | | | | | | | | | |
China | | | — | | | | 3,321 | | | | — | | | | 3,321 | |
Netherlands | | | — | | | | 1,806 | | | | — | | | | 1,806 | |
South Korea | | | — | | | | 955 | | | | — | | | | 955 | |
United Arab Emirates | | | — | | | | 471 | | | | — | | | | 471 | |
United States | | | — | | | | 49,460 | | | | — | | | | 49,460 | |
| | | | | | | | | | | | | | | | |
Total Convertible Bonds | | | — | | | | 56,013 | | | | — | | | | 56,013 | |
| | | | | | | | | | | | | | | | |
Corporate Bonds | | | | | | | | | | | | | | | | |
Argentina | | | — | | | | 3,485 | | | | — | | | | 3,485 | |
Australia | | | — | | | | 4,182 | | | | — | | | | 4,182 | |
Bahamas | | | — | | | | — | | | | 113 | | | | 113 | |
Barbados | | | — | | | | 744 | | | | — | | | | 744 | |
Belgium | | | — | | | | 10,963 | | | | — | | | | 10,963 | |
Brazil | | | — | | | | 16,410 | | | | — | | | | 16,410 | |
Canada | | | — | | | | 15,575 | | | | — | | | | 15,575 | |
Chile | | | — | | | | 5,090 | | | | — | | | | 5,090 | |
China | | | — | | | | 2,257 | | | | — | | | | 2,257 | |
Colombia | | | — | | | | 2,114 | | | | — | | | | 2,114 | |
Denmark | | | — | | | | 682 | | | | — | | | | 682 | |
France | | | — | | | | 40,142 | | | | — | | | | 40,142 | |
Germany | | | — | | | | 36,741 | | | | — | | | | 36,741 | |
| | | | | | | | |
| | | |
| FEBRUARY 28, 2017 | | J.P. MORGAN INCOME FUNDS | | | | | 39 | |
NOTES TO FINANCIAL STATEMENTS
AS OF FEBRUARY 28, 2017 (Unaudited) (continued)
| | | | | | | | | | | | | | | | |
| | | Level 1
Quoted prices | | | Level 2
Other significant
observable inputs | | | Level 3
Significant
unobservable inputs | | | Total | |
Greece | | $ | — | | | $ | 479 | | | $ | — | | | $ | 479 | |
Guatemala | | | — | | | | 741 | | | | — | | | | 741 | |
Hong Kong | | | — | | | | 1,532 | | | | — | | | | 1,532 | |
Indonesia | | | — | | | | 1,494 | | | | — | | | | 1,494 | |
Ireland | | | — | | | | 12,758 | | | | — | | | | 12,758 | |
Israel | | | — | | | | 2,242 | | | | — | | | | 2,242 | |
Italy | | | — | | | | 17,548 | | | | — | | | | 17,548 | |
Jamaica | | | — | | | | 1,276 | | | | — | | | | 1,276 | |
Japan | | | — | | | | 2,025 | | | | — | | | | 2,025 | |
Kazakhstan | | | — | | | | 5,856 | | | | — | | | | 5,856 | |
Luxembourg | | | — | | | | 46,759 | | | | — | | | | 46,759 | |
Mexico | | | — | | | | 12,907 | | | | — | | | | 12,907 | |
Morocco | | | — | | | | 3,026 | | | | — | | | | 3,026 | |
Netherlands | | | — | | | | 19,588 | | | | — | | | | 19,588 | |
New Zealand | | | — | | | | 1,660 | | | | — | | | | 1,660 | |
Nigeria | | | — | | | | 3,159 | | | | — | | | | 3,159 | |
Norway | | | — | | | | 1,572 | | | | — | | | | 1,572 | |
Panama | | | — | | | | 725 | | | | — | | | | 725 | |
Peru | | | — | | | | 4,193 | | | | — | | | | 4,193 | |
Poland | | | — | | | | 3,472 | | | | — | | | | 3,472 | |
Portugal | | | — | | | | 4,642 | | | | — | | | | 4,642 | |
Spain | | | — | | | | 22,428 | | | | — | | | | 22,428 | |
Sweden | | | — | | | | 11,117 | | | | — | | | | 11,117 | |
Switzerland | | | — | | | | 13,344 | | | | — | | | | 13,344 | |
Turkey | | | — | | | | 2,279 | | | | — | | | | 2,279 | |
United Arab Emirates | | | — | | | | 7,191 | | | | — | | | | 7,191 | |
United Kingdom | | | — | | | | 72,738 | | | | — | | | | 72,738 | |
United States | | | — | | | | 474,724 | | | | 573 | | | | 475,297 | |
| | | | | | | | | | | | | | | | |
Total Corporate Bonds | | | — | | | | 889,860 | | | | 686 | | | | 890,546 | |
| | | | | | | | | | | | | | | | |
Foreign Government Securities | | | — | | | | 279,648 | | | | — | | | | 279,648 | |
| | | | | | | | | | | | | | | | |
Preferred Stocks | | | | | | | | | | | | | | | | |
Ireland | | | — | | | | 52 | | | | — | | | | 52 | |
| | | | | | | | | | | | | | | | |
Common Stocks | | | | | | | | | | | | | | | | |
Colombia | | | 2,408 | | | | — | | | | — | | | | 2,408 | |
United States | | | 306 | | | | — | | | | — | | | | 306 | |
| | | | | | | | | | | | | | | | |
Total Common Stocks | | | 2,714 | | | | — | | | | — | | | | 2,714 | |
| | | | | | | | | | | | | | | | |
Loan Assignments | | | | | | | | | | | | | | | | |
Australia | | | — | | | | 345 | | | | — | | | | 345 | |
Canada | | | — | | | | 2,882 | | | | — | | | | 2,882 | |
Luxembourg | | | — | | | | 1,438 | | | | — | | | | 1,438 | |
Sweden | | | — | | | | 1,030 | | | | — | | | | 1,030 | |
United States | | | — | | | | 37,467 | | | | — | | | | 37,467 | |
| | | | | | | | | | | | | | | | |
Total Loan Assignments | | | — | | | | 43,162 | | | | — | | | | 43,162 | |
| | | | | | | | | | | | | | | | |
Rights | | | | | | | | | | | | | | | | |
United States | | | — | | | | — | | | | 7 | | | | 7 | |
| | | | | | | | | | | | | | | | |
Short-Term Investment | | | | | | | | | | | | | | | | |
Investment Company | | | 30,703 | | | | — | | | | — | | | | 30,703 | |
U.S. Treasury Obligation | | | — | | | | 285 | | | | — | | | | 285 | |
| | | | | | | | | | | | | | | | |
Total Investments in Securities | | $ | 33,417 | | | $ | 1,393,943 | | | $ | 90,557 | | | $ | 1,517,917 | |
| | | | | | | | | | | | | | | | |
Liabilities | | | | | | | | | | | | | | | | |
Debt Securities | | | | | | | | | | | | | | | | |
TBA Short Commitment | | | — | | | | (199 | ) | | | — | | | | (199 | ) |
| | | | | | | | | | | | | | | | |
| | | | | | |
| | | |
| 40 | | | | J.P. MORGAN INCOME FUNDS | | FEBRUARY 28, 2017 |
| | | | | | | | | | | | | | | | |
| | | Level 1
Quoted prices | | | Level 2
Other significant
observable inputs | | | Level 3
Significant
unobservable inputs | | | Total | |
Appreciation in Other Financial Instruments | | | | | | | | | | | | | | | | |
Forward Foreign Currency Exchange Contracts | | $ | — | | | $ | 7,620 | | | $ | — | | | $ | 7,620 | |
Futures Contracts | | | 2,824 | | | | — | | | | — | | | | 2,824 | |
| | | | | | | | | | | | | | | | |
Total Appreciation in Other Financial Instruments | | $ | 2,824 | | | $ | 7,620 | | | $ | — | | | $ | 10,444 | |
| | | | | | | | | | | | | | | | |
Depreciation in Other Financial Instruments | | | | | | | | | | | | | | | | |
Forward Foreign Currency Exchange Contracts | | $ | — | | | $ | (765 | ) | | $ | — | | | $ | (765 | ) |
Futures Contracts | | | (2,906 | ) | | | — | | | | — | | | | (2,906 | ) |
| | | | | | | | | | | | | | | | |
Total Depreciation in Other Financial Instruments | | $ | (2,906 | ) | | $ | (765 | ) | | $ | — | | | $ | (3,671 | ) |
| | | | | | | | | | | | | | | | |
Transfers between fair value levels are valued utilizing values as of the beginning of the period.
There were no transfers between level 1 and level 2 during the six months ended February 28, 2017.
The following is a summary of investments for which significant unobservable inputs (level 3) were used in determining fair value (amounts in thousands):
| | | | | | | | | | | | | | | | | | | | | | | | | | | | | | | | | | | | |
| | | Balance as of
August 31, 2016 | | | Realized
gain (loss) | | | Change in net
unrealized
appreciation
(depreciation) | | | Net
accretion
(amortization) | | | Purchases1 | | | Sales2 | | | Transfers
into Level 3 | | | Transfers
out
of Level 3 | | | Balance as of
February 28, 2017 | |
Investments in Securities: | | | | | | | | | | | | | | | | | | | | | | | | | | | | | | | | | | | | |
Asset-Backed Securities — Cayman Islands | | $ | 100 | | | $ | — | | | $ | (30 | ) | | $ | — | | | $ | 3,161 | | | $ | (22 | ) | | $ | — | | | $ | — | | | $ | 3,209 | |
Asset-Backed Securities — Ireland | | | 973 | | | | — | | | | 13 | | | | — | (a) | | | — | | | | (201 | ) | | | — | | | | — | | | | 785 | |
Asset-Backed Securities — United States | | | 45,691 | | | | — | | | | 216 | | | | 25 | | | | 2,520 | | | | (8,836 | ) | | | 1,032 | | | | — | | | | 40,648 | |
Collateralized Mortgage Obligation — Italy | | | 130 | | | | — | | | | (6 | ) | | | — | (a) | | | — | | | | — | | | | — | | | | — | | | | 124 | |
Commercial Mortgage-Backed Securities — Italy | | | 109 | | | | — | | | | 3 | | | | — | | | | — | | | | (112 | ) | | | — | | | | — | | | | — | |
Commercial Mortgage-Backed Securities — United States | | | 26,725 | | | | — | | | | 5 | | | | 8 | | | | 20,124 | | | | (4,485 | ) | | | 2,721 | | | | — | | | | 45,098 | |
Corporate Bonds — Bahamas | | | — | | | | — | | | | — | | | | — | | | | — | | | | — | | | | 113 | | | | — | | | | 113 | |
Corporate Bonds — United States | | | 2,422 | | | | 18 | | | | (18 | ) | | | 28 | | | | 4 | | | | (1,882 | ) | | | 250 | | | | (249 | ) | | | 573 | |
Preferred Stock — Ireland | | | 47 | | | | — | | | | — | | | | — | | | | — | | | | — | | | | — | | | | (47 | ) | | | — | |
Right — United States | | | — | | | | — | | | | 7 | | | | — | | | | — | | | | — | | | | — | | | | — | | | | 7 | |
Warrant — United States | | | 135 | | | | 1,756 | | | | (135 | ) | | | — | | | | — | | | | (1,756 | ) | | | — | | | | — | | | | — | |
| | | | | | | | | | | | | | | | | | | | | | | | | | | | | | | | | | | | |
| | $ | 76,332 | | | $ | 1,774 | | | $ | 55 | | | $ | 61 | | | $ | 25,809 | | | $ | (17,294 | ) | | $ | 4,116 | | | $ | (296 | ) | | $ | 90,557 | |
| | | | | | | | | | | | | | | | | | | | | | | | | | | | | | | | | | | | |
| 1 | Purchases include all purchases of securities and securities received in corporate actions. |
| 2 | Sales include all sales of securities, maturities, paydowns and securities tendered in corporate actions. |
| (a) | Amount round to less than 500. |
Transfers among all levels are due to a decline or an increase in market activity (e.g. frequency of trades), respectively, which resulted in a lack of or increase in available market inputs to determine the price for the six months ended February 28, 2017.
The change in net unrealized appreciation (depreciation) attributable to securities owned at February 28, 2017, which were valued using significant unobservable inputs (level 3), amounted to approximately $268,000. This amount is included in Change in net unrealized appreciation/depreciation of investments in non-affiliates on the Statement of Operations.
| | | | | | | | |
| | | |
| FEBRUARY 28, 2017 | | J.P. MORGAN INCOME FUNDS | | | | | 41 | |
NOTES TO FINANCIAL STATEMENTS
AS OF FEBRUARY 28, 2017 (Unaudited) (continued)
Quantitative Information about Level 3 Fair Value Measurements #
(Amounts in thousands)
| | | | | | | | | | | | |
| | | Fair Value at
2/28/17 | | | Valuation Technique(s) | | Unobservable Input | | Range (Weighted Average) | |
| | $ | 37,535 | | | Discounted Cash Flow | | Constant Prepayment Rate | | | 0.00% - 35.00% (5.01%) | |
| | | | | | | | Constant Default Rate | | | 0.00% - 50.00% (13.98%) | |
| | | | | | | | Yield (Discount Rate of Cash Flows) | | | 2.31% - 7.54% (4.43%) | |
| | | 48 | | | Pending Sale Amount | | Expected Recovery | | | 48.00% of par (48.00% of par) | |
| | | | | | | | | | | | |
| Asset-Backed Securities | | | 37,583 | | | | | | | | | |
| |
| | | 42,824 | | | Discounted Cash Flow | | Yield (Discount Rate of Cash Flows) | | | 3.56% - 126.84% (17.26%) | |
| | | | | | | | | | | | |
| Commercial Mortgage-Backed Securities | | | 42,824 | | | | | | | | | |
| |
| | | 264 | | | Discounted Cash Flow | | Yield (Discount Rate of Cash Flows) | | | 6.69% (6.69%) | |
| | | | | | | | | | | | |
| | | | | | | | Projected Principal Writedown | | | 100.00% (100.00%) | |
| Corporate Bonds | | | 264 | | | | | | | | | |
| |
| Total | | $ | 80,671 | | | | | | | | | |
| |
| # | The table above does not include certain level 3 investments that are valued by brokers and pricing services. At February 28, 2017 , the value of these investments was approximately $9,886,000. The inputs for these investments are not readily available or cannot be reasonably estimated and are generally those inputs described in Note 2.A. |
The significant unobservable inputs used in the fair value measurement of the Fund’s investments are listed above. Generally, a change in the assumptions used in any input in isolation may be accompanied by a change in another input. Significant changes in any of the unobservable inputs may significantly impact the fair value measurement. The impact is based on the relationship between each unobservable input and the fair value measurement. Significant increases (decreases) in the yield and default rate may decrease (increase) the fair value measurement. A significant change in the prepayment rate (Constant Prepayment Rate or PSA Prepayment Model) may decrease or increase the fair value measurement.
B. Restricted Securities — Certain securities held by the Fund may be subject to legal or contractual restrictions on resale. Restricted securities generally are resold in transactions exempt from registration under the Securities Act of 1933 (the “Securities Act”). Disposal of these securities may involve time-consuming negotiations and expense. Prompt sale at the current valuation may be difficult and could adversely affect the net assets of the Fund.
As of February 28, 2017, the Fund had no investments in restricted securities other than securities sold to the Fund under Rule 144A or Regulation S under the Securities Act.
C. Loan Assignments — The Fund may invest in debt instruments that are interests in amounts owed to lenders or lending syndicates (a “Lender”) by corporate, governmental, or other borrowers (a “Borrower”). A loan is often administered by a bank or other financial institution (the “Agent”) that acts as Agent for all holders. The Agent administers the terms of the loan, as specified in the loan agreement. The Fund invests in loan assignments of all or a portion of the loans. When a fund purchases a loan assignment, the Fund has direct rights against the Borrower on a loan, provided, however, the Fund’s rights may be more limited than the Lender from which it acquired the assignment and the Fund may be able to enforce its rights only through the Agent. As a result, a fund assumes the credit risk of the Borrower as well as any other persons interpositioned between the Fund and the Borrower (“Intermediate Participants”). A fund may incur certain costs and delays in realizing payment on a loan assignment or suffer a loss of principal and/or interest if assets or interests held by the Agent or other Intermediate Participants are determined to be subject to the claims of the Agent’s or other Intermediate Participant’s creditors. In addition, it is unclear whether loan assignments and other forms of direct indebtedness offer securities law protections against fraud and misrepresentation. Also, because JPMIM may wish to invest in publicly traded securities of a Borrower, it may not have access to material non-public information regarding the Borrower to which other investors have access. Although certain loan assignments are secured by collateral, a fund could experience delays or limitations in realizing the value on such collateral or have its interest subordinated to other indebtedness of the Borrower. Loan assignments are vulnerable to market conditions such that economic conditions or other events may reduce the demand for assignments and certain assignments which were liquid, when purchased, may become illiquid and they may be difficult to value. In addition, the settlement period for loans is uncertain as there is no standardized settlement schedule applicable to such investments. Therefore, a fund may not receive the proceeds from a sale of such investments for a period after the sale.
Certain loan assignments are also subject to the risks associated with high yield securities described under Note 7.
D. Unfunded Commitments — The Fund may enter into commitments to buy and sell investments including commitments to buy loan assignments to settle on future dates as part of their normal investment activities. Unfunded commitments may include revolving loan facilities which may obligate the Fund to provide cash to the borrower on demand. Unfunded commitments are generally traded and priced as part of a related loan assignment (Note 2.C.). The value of the unfunded portion of the investment is determined using a pro-rata allocation, based on its par value relative to the par value of the entire investment. The unrealized appreciation/depreciation from unfunded commitments is reported on the Statements of Assets and Liabilities. Credit risk exists on these commitments to the extent of any difference between the sales price and current value of the underlying securities sold. Market risk exists on these commitments to buy to the same extent as if the securities were owned on a settled basis and
| | | | | | |
| | | |
| 42 | | | | J.P. MORGAN INCOME FUNDS | | FEBRUARY 28, 2017 |
gains and losses are recorded and reported in the same manner. The Fund may receive an ongoing commitment fee based on the undrawn portion of the underlying loan facility, which is recorded as a component of interest income on the Statements of Operations (amounts in thousands).
At February 29, 2016, the following Funds had the following loan commitments in which all or a portion of the commitment was unfunded which could be extended at the option of the borrower (amounts in thousands):
| | | | | | | | | | | | | | | | | | | | | | | | | | | | | | | | | | | | | | |
| | | | | | | | | | | | | | Unfunded
Commitment | | | Funded
Commitment | | | Total
Commitment | |
| Security Description | | Term | | Maturity
Date | | | Commitment
Fee Rate | | | Rate if
Funded | | | Par
Amount | | | Value | | | Par
Amount | | | Value | | | Par
Amount | | | Value | |
Avaya, Inc. | | DIP Term Loan | | | 01/19/18 | | | | 0.000 | % | | | 8.500 | % | | $ | 68 | | | $ | 71 | | | $ | 97 | | | $ | 100 | | | $ | 165 | | | $ | 171 | |
E. Derivatives — The Fund used derivative instruments including futures and forward foreign currency exchange contracts in connection with its investment strategy. Derivative instruments may be used as substitutes for securities in which the Fund can invest, to hedge portfolio investments or to generate income or gain to the Fund. Derivatives may also be used to manage duration, sector and yield curve exposures and credit and spread volatility.
The Fund may be subject to various risks from the use of derivatives including the risk that changes in the value of a derivative may not correlate perfectly with the underlying asset, rate or index; counterparty credit risk related to derivatives counterparties’ failure to perform under contract terms; liquidity risk related to the lack of a liquid market for these contracts allowing the Fund to close out its position(s); and, documentation risk relating to disagreement over contract terms. Investing in certain derivatives also results in a form of leverage and as such, the Fund’s risk of loss associated with these instruments may exceed its value, as recorded on the Statement of Assets and Liabilities.
The Fund is party to various derivative contracts governed by International Swaps and Derivatives Association master agreements (“ISDA agreements”). The Fund’s ISDA agreements, which are separately negotiated with each dealer counterparty, may contain provisions allowing, absent other considerations, a counterparty to exercise rights, to the extent not otherwise waived, against the Fund in the event the Fund’s net assets decline over time by a pre-determined percentage or fall below a pre-determined floor. The ISDA agreements also contain provisions allowing, absent other conditions, the Fund to exercise rights, to the extent not otherwise waived, against the counterparty (i.e., decline in a counterparty’s credit rating below a specified level). Such rights for both the counterparty and the Fund often include the ability to terminate (i.e., close out) open contracts at prices which may favor the counterparty, which could have an adverse effect on the Fund. The ISDA agreements give the Fund and counterparty the right, upon an event of default, to close out all transactions traded under such agreements and to net amounts owed or due across all transactions and offset such net payable or receivable with collateral posted to a segregated account by one party to the other.
Counterparty credit risk may be mitigated to the extent a counterparty posts collateral for mark to market gains to the Fund.
Notes E(1) — E(3) below describe the various derivatives used by the Fund.
(1). Futures Contracts — The Fund used treasury, index or other financial futures contracts to gain or reduce exposure to the stock and bond markets, maintain liquidity and minimize transaction costs. The Fund also bought futures contracts to immediately invest incoming cash in the market or sold futures in response to cash outflows, thereby simulating an invested position in the underlying index while maintaining a cash balance for liquidity.
Futures contracts provide for the delayed delivery of the underlying instrument at a fixed price or are settled for a cash amount based on the change in the value of the underlying instrument at a specific date in the future. Upon entering into a futures contract, the Fund is required to deposit with the broker, cash or securities in an amount equal to a certain percentage of the contract amount, which is referred to as the initial margin deposit. Subsequent payments, referred to as variation margin, are made or received by the Fund periodically and are based on changes in the market value of open futures contracts. Changes in the market value of open futures contracts are recorded as Change in net unrealized appreciation/depreciation on the Statement of Operations. Realized gains or losses, representing the difference between the value of the contract at the time it was opened and the value at the time it was closed, are reported on the Statement of Operations at the closing or expiration of the futures contract. Securities deposited as initial margin are designated on the SOI and cash deposited is recorded on the Statement of Assets and Liabilities. A receivable from and/or a payable to brokers for the daily variation margin is also recorded on the Statement of Assets and Liabilities.
The use of futures contracts exposes the Fund to interest rate risk. The Fund may be subject to the risk that the change in the value of the futures contract may not correlate perfectly with the underlying instrument. Use of long futures contracts subjects the Fund to risk of loss in excess of the amounts shown on the Statement of Assets and Liabilities, up to the notional amount of the futures contracts. Use of short futures contracts subjects the Fund to unlimited risk of loss. The Fund may enter into futures contracts only on exchanges or boards of trade. The exchange or board of trade acts as the counterparty to each futures transaction; therefore, the Fund’s credit risk is limited to failure of the exchange or board of trade. Under some circumstances, futures exchanges may establish daily limits on the amount that the price of a futures contract can vary from the previous day’s settlement price, which could effectively prevent liquidation of positions.
The Fund’s futures contracts are not subject to master netting arrangements (the right to close out all transactions traded with a counterparty and net amounts owed or due across transactions).
(2). Forward Foreign Currency Exchange Contracts — The Fund may be exposed to foreign currency risks associated with some or all of the portfolio investments and used forward foreign currency exchange contracts to hedge or manage certain of these exposures as part of an investment strategy. The Fund also bought forward foreign currency exchange contracts to gain exposure to currencies. Forward foreign currency exchange contracts represent obligations to purchase or sell foreign currency on a specified future date at a price fixed at the time the contracts are entered into. Non-deliverable forward foreign currency exchange contracts are settled with the counterparty in U.S. dollar without the delivery of foreign currency.
| | | | | | | | |
| | | |
| FEBRUARY 28, 2017 | | J.P. MORGAN INCOME FUNDS | | | | | 43 | |
NOTES TO FINANCIAL STATEMENTS
AS OF FEBRUARY 28, 2017 (Unaudited) (continued)
The values of the forward foreign currency exchange contracts are adjusted daily based on the applicable exchange rate of the underlying currency. Changes in the value of these contracts are recorded as unrealized appreciation or depreciation until the contract settlement date. When the forward foreign currency exchange contract is closed, the Fund records a realized gain or loss equal to the difference between the value at the time the contract was opened and the value at the time it was closed. The Fund also records a realized gain or loss when a forward foreign currency exchange contract offsets another forward foreign currency exchange contract with the same counterparty upon settlement.
The Fund’s forward foreign currency exchange contracts are subject to master netting arrangements (the right to close out all transactions with a counterparty and net amounts owed or due across transactions). As of February 28, 2017, the Fund did not receive or post collateral for forward foreign currency exchange contracts.
(3). Summary of Derivatives Information — The following table presents the value of derivatives held as of February 28, 2017, by their primary underlying risk exposure and respective location on the Statement of Assets and Liabilities (amounts in thousands):
| | | | | | | | | | | | | | |
| Derivative Contracts | | Statement of Assets and Liabilities Location | | | | | | | | | |
| Gross Assets: | | | | Futures
Contracts (a) | | | Forward Foreign
Currency Exchange
Contracts | | | Total | |
Interest rate contracts | | Receivables, Net Assets — Unrealized Appreciation | | $ | 2,824 | | | $ | — | | | $ | 2,824 | |
Foreign exchange contracts | | Receivables | | | — | | | | 7,620 | | | | 7,620 | |
| | | | | | | | | | | | | | |
Total | | | | $ | 2,824 | | | $ | 7,620 | | | $ | 10,444 | |
| | | | | | | | | | | | | | |
| | | | |
Gross Liabilities: | | | | | | | | | | | |
Interest rate contracts | | Payables, Net Assets — Unrealized Depreciation | | $ | (2,906 | ) | | $ | — | | | $ | (2,906 | ) |
Foreign exchange contracts | | Payables | | | — | | | | (765 | ) | | | (765 | ) |
| | | | | | | | | | | | | | |
Total | | | | $ | (2,906 | ) | | $ | (765 | ) | | $ | (3,671 | ) |
| | | | | | | | | | | | | | |
| (a) | This amount represents the cumulative appreciation (depreciation) of futures contracts as reported on the SOI. The Statement of Assets and Liabilities only reflects the current day variation margin receivable/payable from/to brokers. |
The following table presents the Fund’s gross derivative assets and liabilities by counterparty net of amounts available for offset under netting arrangements and any related collateral received or posted by the Fund as of February 28, 2017 (amounts in thousands):
| | | | | | | | | | | | | | | | |
| Counterparty | | Gross Amount of
Derivative Assets
subject to netting
agreement Presented
on the Statement of
Assets and Liabilities (a) | | | Derivatives
Available
for offset | | | Collateral
Received | | | Net Amount Due
From Counterparty
(Not less than zero) | |
Australia and New Zealand Banking Group Limited | | $ | 397 | | | $ | (184 | ) | | $ | — | | | $ | 213 | |
BNP Paribas | | | 6 | | | | — | | | | — | | | | 6 | |
Citibank, N.A. | | | 4,936 | | | | — | | | | — | | | | 4,936 | |
Goldman Sachs International | | | 624 | | | | (95 | ) | | | — | | | | 529 | |
HSBC Bank, N.A. | | | 29 | | | | — | | | | — | | | | 29 | |
Merrill Lynch International | | | 1,187 | | | | (458 | ) | | | — | | | | 729 | |
National Australia Bank Limited | | | 122 | | | | (28 | ) | | | — | | | | 94 | |
Royal Bank of Canada | | | 318 | | | | — | | | | — | | | | 318 | |
Standard Chartered Bank | | | 1 | | | | — | | | | — | | | | 1 | |
| | | | | | | | | | | | | | | | |
| | $ | 7,620 | | | $ | (765 | ) | | $ | — | | | $ | 6,855 | |
| | | | | | | | | | | | | | | | |
| | | | |
| Counterparty | | Gross Amount of
Derivative Liabilities
subject to netting
agreement Presented
on the Statement of
Assets and Liabilities (a) | | | Derivatives
Available
for offset | | | Collateral
Posted | | | Net Amount Due
to Counterparty
(Not less than zero) | |
Australia and New Zealand Banking Group Limited | | $ | 184 | | | $ | (184 | ) | | $ | — | | | $ | — | |
Goldman Sachs International | | | 95 | | | | (95 | ) | | | — | | | | — | |
Merrill Lynch International | | | 458 | | | | (458 | ) | | | — | | | | — | |
National Australia Bank Limited | | | 28 | | | | (28 | ) | | | — | | | | — | |
| | | | | | | | | | | | | | | | |
| | $ | 765 | | | $ | (765 | ) | | $ | — | | | $ | — | |
| | | | | | | | | | | | | | | | |
| (a) | For financial reporting purposes, the Fund does not offset derivative assets and derivative liabilities subject to master netting arrangements on the Statement of Assets and Liabilities. |
| | | | | | |
| | | |
| 44 | | | | J.P. MORGAN INCOME FUNDS | | FEBRUARY 28, 2017 |
The following tables present the effect of derivatives on the Statement of Operations for the six months ended February 28, 2017, by primary underlying risk exposure (amounts in thousands):
| | | | | | | | | | | | |
| Amount of Realized Gain (Loss) on Derivatives Recognized on the Statement of Operations | |
| Derivative Contracts | | Futures Contracts | | | Forward Foreign
Currency Exchange
Contracts | | | Total | |
Interest rate contracts | | $ | 2,917 | | | $ | — | | | $ | 2,917 | |
Foreign exchange contracts | | | — | | | | 15,974 | | | | 15,974 | |
| | | | | | | | | | | | |
Total | | $ | 2,917 | | | $ | 15,974 | | | $ | 18,891 | |
| | | | | | | | | | | | |
| | | | | | | | | | | | |
| Amount of Change in Unrealized Appreciation (Depreciation) on Derivatives Recognized on the Statement of Operations | |
| Derivative Contracts | | Futures Contracts | | | Forward Foreign
Currency Exchange
Contracts | | | Total | |
Interest rate contracts | | $ | (2,388 | ) | | $ | — | | | $ | (2,388 | ) |
Foreign exchange contracts | | | — | | | | 8,440 | | | | 8,440 | |
| | | | | | | | | | | | |
Total | | $ | (2,388 | ) | | $ | 8,440 | | | $ | 6,052 | |
| | | | | | | | | | | | |
The Fund’s derivatives contracts held at February 28, 2017 are not accounted for as hedging instruments under GAAP.
Derivatives Volume — The table below discloses the volume of the Fund’s futures contracts and forward foreign currency exchange contracts activity during the six months ended February 28, 2017 (amounts in thousands, except number of contracts). Please refer to the tables in the Summary of Derivatives Information for derivative-related gains and losses associated with volume activity.
| | | | |
Futures Contracts: | | | | |
Average Notional Balance Long | | $ | 303,356 | |
Average Notional Balance Short | | | 949,526 | |
Ending Notional Balance Long | | | 219,394 | |
Ending Notional Balance Short | | | 1,106,582 | |
| |
Forward Foreign Currency Exchange Contracts: | | | | |
Average Settlement Value Purchased | | | 116,476 | |
Average Settlement Value Sold | | | 533,095 | |
Ending Settlement Value Purchased | | | 146,752 | |
Ending Settlement Value Sold | | | 553,474 | |
F. When Issued, Delayed Delivery Securities and Forward Commitments — The Fund purchased when issued securities, including To Be Announced (“TBA”) securities, and entered into contracts to purchase or sell securities for a fixed price that may be settled a month or more after the trade date, or purchased delayed delivery securities which generally settle seven days after the trade date. When issued securities are securities that have been authorized, but not issued in the market. A forward commitment involves entering into a contract to purchase or sell securities for a fixed price at a future date that may be settled a month or more after the trade date. A delayed delivery security is agreed upon in advance between the buyer and the seller of the security and is generally delivered beyond seven days of the agreed upon date. The purchase of securities on a when issued, delayed delivery, or forward commitment basis involves the risk that the value of the security to be purchased declines before settlement date. The sale of securities on a forward commitment basis involves the risk that the value of the securities sold may increase before the settlement date. The Fund may be exposed to credit risk if the counterparty fails to perform under the terms of the transaction. Interest income for securities purchased on a when issued, delayed delivery, or forward commitment basis is not accrued until settlement date.
The Fund had TBA purchase commitments and TBA short commitments outstanding as of February 28, 2017, which are shown as a Receivable for investment securities sold-delayed delivery securities and Payable for investment securities purchased-delayed delivery securities, respectively, on the Statements of Assets and Liabilities. The values of these securities held at February 28, 2017 are detailed on the SOIs.
G. Foreign Currency Translation — The books and records of the Fund are maintained in U.S. dollars. Foreign currency amounts are translated into U.S. dollars at the prevailing exchange rates of such currencies against the U.S. dollar. The market value of investment securities and other assets and liabilities are translated at the exchange rate as of the valuation date. Purchases and sales of investment securities, income and expenses are translated at the exchange rate prevailing on the respective dates of such transactions.
The Fund does not isolate the effect of changes in foreign exchange rates from changes in market prices on securities held. Accordingly, such changes are included within Change in net unrealized appreciation/depreciation on investments on the Statement of Operations.
Reported realized foreign currency gains and losses arise from the disposition of foreign currency, currency gains or losses realized between the trade and settlement dates on securities transactions, and the difference between the amounts of dividends, interest and foreign withholding taxes recorded on the Fund’s books on the transaction date and the U.S. dollar equivalent of the amounts actually received or paid. These reported realized foreign
| | | | | | | | |
| | | |
| FEBRUARY 28, 2017 | | J.P. MORGAN INCOME FUNDS | | | | | 45 | |
NOTES TO FINANCIAL STATEMENTS
AS OF FEBRUARY 28, 2017 (Unaudited) (continued)
currency gains and losses are included in Net realized gain (loss) on foreign currency transactions on the Statement of Operations. Unrealized foreign currency gains and losses arise from changes (due to changes in exchange rates) in the value of foreign currency and other assets and liabilities denominated in foreign currencies, which are held at period end and are included in Change in net unrealized appreciation/depreciation on foreign currency translations on the Statement of Operations.
H. Security Transactions and Investment Income — Investment transactions are accounted for on the trade date (the date the order to buy or sell is executed). Securities gains and losses are calculated on a specifically identified cost basis. Interest income is determined on the basis of coupon interest accrued using the effective interest method which adjusts for amortization of premiums and accretion of discounts. Dividend income, net of foreign taxes withheld, if any, is recorded on the ex-dividend date or when the Fund first learns of the dividend. Certain Funds may receive other income from investment in loan assignments and/or unfunded commitments, including amendment fees, consent fees and commitment fees. These fees are recorded as income when received by the Fund. These amounts are included in Interest Income in the Statement of Operations.
I. Allocation of Income and Expenses — Expenses directly attributable to a fund are charged directly to that fund, while the expenses attributable to more than one fund of the Trust are allocated among the respective funds. In calculating the NAV of each class, investment income, realized and unrealized gains and losses and expenses, other than class specific expenses, are allocated daily to each class of shares based upon the proportion of net assets of each class at the beginning of each day.
Transfer agency fees and sub-transfer agency fees are class-specific expenses. The amount of the transfer agency fees and sub-transfer agency fees charged to each class of the Fund for the six months ended February 28, 2017 are as follows (amounts in thousands):
| | | | | | | | | | | | | | | | | | | | |
| | | Class A | | | Class C | | | Class R6 | | | Class I | | | Total | |
Transfer agency fees | | $ | 3 | | | $ | 2 | | | $ | — | (a) | | $ | 5 | | | $ | 10 | |
Sub-transfer agency fees | | | 61 | | | | 15 | | | | — | | | | 144 | | | | 220 | |
| (a) | Amount rounds to less than 500. |
J. Federal Income Taxes — The Fund is treated as a separate taxable entity for Federal income tax purposes. The Fund’s policy is to comply with the provisions of the Internal Revenue Code of 1986, as amended (the “Code”), applicable to regulated investment companies and to distribute to shareholders all of its distributable net investment income and net realized capital gains on investments. Accordingly, no provision for Federal income tax is necessary. Management has reviewed the Fund’s tax positions for all open tax years and has determined that as of February 28, 2017, no liability for income tax is required in the Fund’s financial statements for net unrecognized tax benefits. However, management’s conclusions may be subject to future review based on changes in, or the interpretation of, the accounting standards or tax laws and regulations. The Fund’s Federal tax returns for the prior three fiscal years remain subject to examination by the Internal Revenue Service.
K. Foreign Taxes — The Fund may be subject to foreign taxes on income, gains on investments or currency purchases/repatriation, a portion of which may be recoverable. The Fund will accrue such taxes and recoveries as applicable, based upon its current interpretation of tax rules and regulations that exist in the markets in which it invests.
L. Distributions to Shareholders — Distributions from net investment income are generally declared and paid monthly and are declared separately for each class. No class has preferential dividend rights; differences in per share rates are due to differences in separate class expenses. Net realized capital gains, if any, are distributed by the Fund at least annually. The amount of distributions from net investment income and net realized capital gains is determined in accordance with Federal income tax regulations, which may differ from GAAP. To the extent these “book/tax” differences are permanent in nature (i.e., that they result from other than timing of recognition — “temporary differences”), such amounts are reclassified within the capital accounts based on their Federal tax-basis treatment.
3. Fees and Other Transactions with Affiliates
A. Investment Advisory Fee — Pursuant to an Investment Advisory Agreement, the Adviser supervises the investments of the Fund and for such services is paid a fee. The fee is accrued daily and paid monthly at an annual rate of 0.55% of the Fund’s average daily net assets.
The Adviser waived Investment Advisory fees and/or reimbursed expenses as outlined in Note 3.G.
B. Administration Fees — Pursuant to an Administration Agreement, the Administrator provides certain administration services to the Fund. In consideration of these services, the Administrator receives a fee accrued daily and paid monthly at an annual rate of 0.15% of the first $25 billion of the average daily net assets of all funds in the J.P. Morgan Funds Complex covered by the Administration Agreement (excluding certain funds of funds and money market funds) and 0.075% of the average daily net assets in excess of $25 billion of all such funds. For the six months ended February 28, 2017, the effective rate was 0.08% of the Fund’s average daily net assets, notwithstanding any fee waivers and/or expense reimbursements.
The Administrator waived Administration fees as outlined in Note 3.G.
JPMorgan Chase Bank, N.A. (“JPMCB”), a wholly-owned subsidiary of JPMorgan, serves as the Fund’s sub-administrator (the “Sub-administrator”). For its services as Sub-administrator, JPMCB receives a portion of the fees payable to the Administrator.
C. Distribution Fees — Pursuant to a Distribution Agreement, JPMorgan Distribution Services, Inc. (the “JPMDS”), a wholly-owned subsidiary of JPMorgan, serves as the Trust’s principal underwriter and promotes and arranges for the sale of the Fund’s shares. The Board has adopted a
| | | | | | |
| | | |
| 46 | | | | J.P. MORGAN INCOME FUNDS | | FEBRUARY 28, 2017 |
Distribution Plan (the “Distribution Plan”) for Class A and Class C Shares of the Fund in accordance with Rule 12b-1 under the 1940 Act. Class R6 and Class I do not charge a distribution fee. The Distribution Plan provides that the Fund shall pay distribution fees, including payments to JPMDS, at annual rates of 0.25% and 0.75% of the average daily net assets of Class A and Class C Shares, respectively.
In addition, JPMDS is entitled to receive the front-end sales charges from purchases of Class A Shares and the CDSC from redemptions of Class C Shares and certain Class A Shares for which front-end sales charges have been waived. For the six months ended February 28, 2017, JPMDS retained the following amounts (in thousands):
| | | | | | |
| | | Front-End Sales Charge | | CDSC | |
| | $23 | | $ | — | (a) |
| (a) | Amount rounds to less than 500. |
D. Shareholder Servicing Fees — The Trust, on behalf of the Fund, has entered into a Shareholder Servicing Agreement with JPMDS under which JPMDS provides certain support services to the shareholders. The Class R6 Shares do not charge a shareholder servicing fee. For performing these services, JPMDS receives a fee that is accrued daily and paid monthly at an annual rate of 0.25% of the average daily net assets of Class A, Class C and Class I Shares.
JPMDS has entered into shareholder services contracts with affiliated and unaffiliated financial intermediaries who provide shareholder services and other related services to their clients or customers who invest in the Fund under which JPMDS will pay all or a portion of such fees earned to financial intermediaries for performing such services.
JPMDS waived shareholder servicing fees as outlined in Note 3.G.
E. Custodian and Accounting Fees — JPMCB provides portfolio custody and accounting services to the Fund. For performing these services, the Fund pays JPMCB transaction and asset-based fees that vary according to the number of transactions and positions, plus out-of-pocket expenses. The amounts paid directly to JPMCB by the Fund for custody and accounting services are included in Custodian and accounting fees on the Statement of Operations. Payments to the custodian may be reduced by credits earned by the Fund, based on uninvested cash balances held by the custodian. Such earnings credits, if any, are presented separately on the Statement of Operations.
Interest income earned on cash balances at the custodian, if any, is included in Interest income from affiliates on the Statement of Operations.
Interest expense paid to the custodian related to cash overdrafts, if any, is included in Interest expense to affiliates on the Statement of Operations.
F. Collateral Management Fees — JPMCB provides derivatives collateral management services for the Fund. The amounts are paid directly to JPMCB by the Fund for these services are included in Collateral management fees on the Statement of Operations.
G. Waivers and Reimbursements — The Adviser, Administrator and/or Distributor have contractually agreed to waive fees and/or reimburse the Fund to the extent that total annual operating expenses (excluding acquired fund fees and expenses other than certain money market fund fees as described below, dividend expenses related to short sales, interest expenses related to short sales, interest, taxes, expenses related to litigation and potential litigation and extraordinary expenses) exceed the percentages of the Fund’s average daily net assets as shown in the table below:
| | | | | | | | | | | | | | | | |
| | | Class A | | | Class C | | | Class R6 | | | Class I | |
| | | 0.90 | % | | | 1.30 | % | | | 0.50 | % | | | 0.65 | % |
The expense limitation agreement was in effect for the six months ended February 28, 2017 and is in place until at least December 31, 2017.
For the six months ended February 28, 2017, the Fund’s service providers waived fees and/or reimbursed expenses for the Fund as follows (amounts in thousands). None of these parties expect the Fund to repay any such waived fees and/or reimbursed expenses in future years.
| | | | | | | | | | | | | | | | | | | | |
| | | Contractual Waivers | | | | |
| | | Investment
Advisory | | | Administration | | | Shareholder
Servicing | | | Total | | | Contractual
Reimbursements | |
| | $ | 749 | | | $ | 499 | | | $ | 891 | | | $ | 2,139 | | | $ | 4 | |
Additionally, the Fund may invest in one or more money market funds advised by the Adviser or its affiliates (affiliated money market funds). The Adviser, Administrator and/or Distributor, as shareholder servicing agent, have contractually agreed to waive fees and/or reimburse expenses in an amount sufficient to offset the respective net fees each collects from the affiliated money market fund on the Fund’s investment in such affiliated money market fund.
The amounts of these waivers/reimbursements resulting from investments in these money market funds for the six months ended February 28, 2017 were approximately $27,000.
H. Other — Certain officers of the Trust are affiliated with the Adviser, the Administrator and JPMDS. Such officers, with the exception of the Chief Compliance Officer, receive no compensation from the Fund for serving in their respective roles.
| | | | | | | | |
| | | |
| FEBRUARY 28, 2017 | | J.P. MORGAN INCOME FUNDS | | | | | 47 | |
NOTES TO FINANCIAL STATEMENTS
AS OF FEBRUARY 28, 2017 (Unaudited) (continued)
The Board appointed a Chief Compliance Officer to the Fund in accordance with Federal securities regulations. The Fund, along with other affiliated funds, makes reimbursement payments, on a pro-rata basis, to the Administrator for a portion of the fees associated with the Office of the Chief Compliance Officer. Such fees are included in Trustees’ and Chief Compliance Officer’s fees on the Statement of Operations.
The Trust adopted a Trustee Deferred Compensation Plan (the “Plan”) which allows the Independent Trustees to defer the receipt of all or a portion of compensation related to performance of their duties as Trustees. The deferred fees are invested in various J.P. Morgan Funds until distribution in accordance with the Plan.
During the six months ended February 28, 2017, the Fund purchased securities from an underwriting syndicate in which the principal underwriter or members of the syndicate were affiliated with the Adviser.
The Fund may use related party broker-dealers. For the six months ended February 28, 2017, the Fund did not incur any brokerage commissions with broker-dealers affiliated with the Adviser.
The Securities and Exchange Commission (“SEC”) has granted an exemptive order permitting the Fund to engage in principal transactions with J.P. Morgan Securities, Inc., an affiliated broker, involving taxable money market instruments, subject to certain conditions.
4. Investment Transactions
During the six months ended February 28, 2017, purchases and sales of investments (excluding short-term investments) were as follows (amounts in thousands):
| | | | | | | | |
| | | Purchases
(excluding U.S.
Government) | | | Sales
(excluding U.S.
Government) | |
| | $ | 585,266 | | | $ | 423,878 | |
During the six months ended February 28, 2017, there were no purchases or sales of U.S. Government securities.
5. Federal Income Tax Matters
For Federal income tax purposes, the estimated cost and unrealized appreciation (depreciation) in value of investment securities held at February 28, 2017 were as follows (amounts in thousands):
| | | | | | | | | | | | | | | | |
| | | Aggregate
Cost | | | Gross
Unrealized
Appreciation | | | Gross
Unrealized
Depreciation | | | Gross
Unrealized
(Depreciation) | |
| | $ | 1,521,544 | | | $ | 31,998 | | | $ | 35,661 | | | $ | (3,663 | ) |
The difference between book and tax basis appreciation (depreciation) on investments is primarily attributed to investments in contingent preferred debt instruments.
6. Borrowings
The Fund relies upon an exemptive order granted by the SEC (the “Order”) permitting the establishment and operation of an Interfund Lending Facility (the “Facility”). The Facility allows the Fund to directly lend and borrow money to or from any other fund relying upon the Order at rates beneficial to both the borrowing and lending funds. Advances under the Facility are taken primarily for temporary or emergency purposes, including the meeting of redemption requests that otherwise might require the untimely disposition of securities, and are subject to the Fund’s borrowing restrictions. The Interfund loan rate is determined, as specified in the Order, by averaging the current repurchase agreement rate and the current bank loan rate. The Order was granted to JPMorgan Trust II and may be relied upon by the Fund because the Fund and the series of JPMorgan Trust II are both investment companies in the same “group of investment companies” (as defined in Section 12(d)(1)(G) of the 1940 Act).
The Trust and JPMCB have entered into a financing arrangement. Under this arrangement, JPMCB provides an unsecured, uncommitted credit facility in the aggregate amount of $100 million to certain of the J.P. Morgan Funds, including the Fund. Advances under the arrangement are taken primarily for temporary or emergency purposes, including the meeting of redemption requests that otherwise might require the untimely disposition of securities, and are subject to the Fund’s borrowing restrictions. Interest on borrowings is payable at a rate determined by JPMCB at the time of borrowing. This agreement has been extended until November 6, 2017.
The Fund had no borrowings outstanding from another fund or from the unsecured, uncommitted credit facility at February 28, 2017.
In addition, effective August 16, 2016, the Trust along with certain other trusts (“Borrowers”) entered into a joint syndicated senior unsecured revolving credit facility totaling $1.5 billion (“Credit Facility”) with various lenders and The Bank of New York Mellon, as administrative agent for the lenders. This Credit Facility provides a source of funds to the Borrowers for temporary and emergency purposes, including the meeting of redemption requests that otherwise might require the untimely disposition of securities. Under the terms of the Credit Facility, a borrowing fund must have a minimum of $25,000,000 in adjusted net asset value and not exceed certain adjusted net asset coverage ratios prior to and during the time in which any borrowings are outstanding. If a fund does not comply with the aforementioned requirements, the fund must remediate within three business days with respect to the $25,000,000 minimum adjusted net asset value or within one business day with respect to certain asset coverage ratios or the administrative agent at the request of, or with the consent of, the lenders may terminate the Credit Facility and declare any outstanding borrowings to be due and payable immediately.
| | | | | | |
| | | |
| 48 | | | | J.P. MORGAN INCOME FUNDS | | FEBRUARY 28, 2017 |
Interest associated with any borrowing under the Credit Facility is charged to the borrowing fund at a rate of interest equal to 1.00% plus the greater of the federal funds effective rate or one month LIBOR. The annual commitment fee to maintain the Credit Facility is 0.15% and is incurred on the unused portion of the Credit Facility and is allocated to all participating funds pro rata based on their respective net assets. The initial term of the Credit Facility is 364 days, unless extended.
The Fund did not utilize the Credit Facility during the six months ended February 28, 2017.
7. Risks, Concentrations and Indemnifications
In the normal course of business, the Fund enters into contracts that contain a variety of representations which provide general indemnifications. The Fund’s maximum exposure under these arrangements is unknown. The amount of exposure would depend on future claims that may be made against the Fund that have not yet occurred. However, based on experience, the Fund expects the risk of loss to be remote.
As of February 28, 2017, the Fund had one affiliated omnibus account which represented 45.3% of the Fund’s net assets.
The Fund may have elements of risk not typically associated with investments in the United States of America due to concentrated investments in a limited number of countries or regions, which may vary throughout the period. Such concentrations may subject the Fund to additional risks resulting from political or economic conditions in such countries or regions and the possible imposition of adverse governmental laws or currency exchange restrictions could cause the securities and their markets to be less liquid and their prices to be more volatile than those of comparable U.S. securities.
As of February 28, 2017, a significant portion of the Fund’s net assets consisted of securities that were denominated in foreign currencies. Changes in currency exchange rates will affect the value of, and investment income from, such securities.
The Fund invests in debt securities that have preferred stock characteristics. These characteristics include provisions that permit the issuer, in its discretion, to defer or omit distributions for a certain period of time.
The Fund is subject to interest rate and credit risk. The value of debt securities may decline as interest rates increase. The Fund could lose money if the issuer of a fixed income security is unable to pay interest or repay principal when it is due. The Fund invests in floating rate loans and other floating rate debt securities. Although these investments are generally less sensitive to interest rate changes than other fixed rate instruments, the value of floating rate loans and other floating rate investments may decline if their interest rates do not rise as quickly, or as much, as general interest rates. Many factors can cause interest rates to rise. Some examples include central bank monetary policy, rising inflation rates and general economic conditions. Given the historically low interest rate environment, risks associated with rising rates are heightened. The ability of the issuers of debt to meet their obligations may be affected by the economic and political developments in a specific industry or region.
Derivatives may be riskier than other types of investments because they may be more sensitive to changes in economic and market conditions and could result in losses that significantly exceed the Fund’s original investment. Many derivatives create leverage thereby causing the Fund to be more volatile than they would have been if it had not used derivatives. Derivatives also expose the Fund to counterparty risk (the risk that the derivative counterparty will not fulfill its contractual obligations), including credit risk of the derivative counterparty.
The Fund is also subject to counterparty credit risk, which is the risk that a counterparty fails to perform on agreements with the Fund such as forward foreign currency exchange contracts and TBA securities.
The Fund is subject to risks associated with securities with contractual cash flows including asset-backed and mortgage-related securities such as collateralized mortgage obligations, mortgage pass-through securities and commercial mortgage-backed securities, including securities backed by sub-prime mortgage loans. The value, liquidity and related income of these securities are sensitive to changes in economic conditions, including real estate value, prepayments, delinquencies and/or defaults, and may be adversely affected by shifts in the market’s perception of the issuers and changes in interest rates.
The Fund invests in high yield securities that are not rated or rated below investment grade (commonly known as “junk bonds.”) These securities are considered to be high risk investments. Investments in lower-rated securities or unrated securities of comparable quality tend to be more sensitive to economic conditions than higher rated securities. Junk bonds involve a greater risk of default by the issuer because such securities are generally unsecured and are often subordinated to other creditors’ claims. The market price of these securities can change suddenly and unexpectedly. As a result, the Fund is intended for investors who are able and willing to assume a high degree of risk.
The Fund’s investments in sovereign and corporate debt obligations within emerging market countries may be subject to potentially higher risks than investments in more developed markets and the prices of such investments may be volatile. The yields of emerging market debt obligations reflect, among other things, perceived credit risk. The consequences of political, social or economic instability in these markets may have disruptive effects on the market prices of the Fund’s investments and the income they generate, as well as the Fund’s ability to repatriate such amounts.
8. Investment Company Reporting Modernization
In October 2016, the U.S. Securities and Exchange Commission adopted new rules and forms, and amendments to certain current rules and forms, to modernize the reporting and disclosure of information by registered investment companies. In part, the final rules amend Regulation S-X and will require standardized, enhanced disclosures about derivatives in investment company financial statements, as well as other amendments. The compliance date for the amendments to Regulation S-X is August 1, 2017. At this time, management is currently assessing the anticipated impact of the Regulation S-X amendments on the Fund’s (s) financial statements and related disclosures.
9. Subsequent Event
Effective April 3, 2017, the Fund ceased making direct payments to financial intermediaries for any applicable sub-transfer agency services. Payments to financial intermediaries for sub-transfer agency services are made by JPMDS from the Shareholder Servicing Fee which has been renamed as the Service Fee.
| | | | | | | | |
| | | |
| FEBRUARY 28, 2017 | | J.P. MORGAN INCOME FUNDS | | | | | 49 | |
SCHEDULE OF SHAREHOLDER EXPENSES
(Unaudited)
Hypothetical $1,000 Investment
As a shareholder of the Fund, you incur two types of costs: (1) transaction costs, including sales charges (loads) on purchase payments and (2) ongoing costs, including investment advisory fees, administration fees, distribution fees and other Fund expenses. The examples below are intended to help you understand your ongoing costs (in dollars) of investing in the Fund and to compare these ongoing costs with the ongoing costs of investing in other mutual funds. The examples assume that you had a $1,000 investment in each Class at the beginning of the reporting period, September 1, 2016, and continued to hold your shares at the end of the reporting period, February 28, 2017.
Actual Expenses
For each Class of the Fund in the table below, the first line provides information about actual account values and actual expenses. You may use the information in this line, together with the amount you invested, to estimate the expenses that you paid over the period. Simply divide your account value by $1,000 (for example, an $8,600 account value divided by $1,000 = 8.6), then multiply the result by the number in the first line of each Class under the heading entitled “Expenses Paid During the Period” to estimate the expenses you paid on your account during this period.
Hypothetical Example for Comparison Purposes
The second line of each Class in the table below provides information about hypothetical account values and hypothetical expenses based on the Class’ actual expense ratio and an assumed rate of return of 5% per year before expenses, which is not the Class’ actual return. The hypothetical account values and expenses may not be used to estimate the actual ending account balance or expenses you paid for the period. You may use this information to compare the ongoing costs of investing in the Class of the Fund and other funds. To do so, compare this 5% hypothetical example with the 5% hypothetical examples that appear in the shareholder reports of the other funds. Please note that the expenses shown in the table are meant to highlight your ongoing costs only and do not reflect any transaction costs, such as sales charges (loads) or redemption fees. Therefore, the second line for each Class in the table is useful in comparing ongoing costs only, and will not help you determine the relative total costs of owning different funds. In addition, if these transaction costs were included, your costs would have been higher. The examples also assume all dividends and distributions have been reinvested.
| | | | | | | | | | | | | | | | |
| | | Beginning
Account Value
September 1, 2016 | | | Ending
Account Value
February 28, 2017 | | | Expenses
Paid During
the Period* | | | Annualized
Expense
Ratio | |
Global Bond Opportunities Fund | | | | | |
Class A | | | | | | | | | | | | | | | | |
Actual | | $ | 1,000.00 | | | $ | 1,016.40 | | | $ | 4.50 | | | | 0.90 | % |
Hypothetical | | | 1,000.00 | | | | 1,020.33 | | | | 4.51 | | | | 0.90 | |
Class C | | | | | | | | | | | | | | | | |
Actual | | | 1,000.00 | | | | 1,013.50 | | | | 6.44 | | | | 1.29 | |
Hypothetical | | | 1,000.00 | | | | 1,018.40 | | | | 6.46 | | | | 1.29 | |
Class R6 | | | | | | | | | | | | | | | | |
Actual | | | 1,000.00 | | | | 1,017.40 | | | | 2.50 | | | | 0.50 | |
Hypothetical | | | 1,000.00 | | | | 1,022.32 | | | | 2.51 | | | | 0.50 | |
Class I (formerly Select Class) | | | | | | | | | | | | | | | | |
Actual | | | 1,000.00 | | | | 1,016.70 | | | | 3.25 | | | | 0.65 | |
Hypothetical | | | 1,000.00 | | | | 1,021.57 | | | | 3.26 | | | | 0.65 | |
| * | Expenses are equal to each Class’ respective annualized expense ratio, multiplied by the average account value over the period, multiplied by 181/365 (to reflect the one-half year period). |
| | | | | | |
| �� | | |
| 50 | | | | J.P. MORGAN INCOME FUNDS | | FEBRUARY 28, 2017 |
J.P. Morgan Funds are distributed by JPMorgan Distribution Services, Inc., which is an affiliate of JPMorgan Chase & Co. Affiliates of JPMorgan Chase & Co. receive fees for providing various services to the funds.
Contact JPMorgan Distribution Services, Inc. at 1-800-480-4111 for a fund prospectus. You can also visit us at www.jpmorganfunds.com. Investors should carefully consider the investment objectives and risk as well as charges and expenses of the mutual fund before investing. The prospectus contains this and other information about the mutual fund. Read the prospectus carefully before investing.
Investors may obtain information about the Securities Investor Protection Corporation (SIPC), including the SIPC brochure by visiting www.sipc.org or by calling SIPC at 202-371-8300.
The Fund files a complete schedule of its fund holdings for the first and third quarters of its fiscal year with the SEC on Form N-Q. The Fund’s Forms N-Q are available on the SEC’s website at http://www.sec.gov and may be reviewed and copied at the SEC’s Public Reference Room in Washington, DC. Information on the operation of the SEC’s Public Reference Room may be obtained by calling 1-800-SEC-0330. Shareholders may request the Form N-Q without charge by calling 1-800-480-4111 or by visiting the J.P. Morgan Funds’ website at www.jpmorganfunds.com.
A description of the Fund’s policies and procedures with respect to the disclosure of the Fund’s holdings is available in the prospectus and Statement of Additional Information.
A copy of proxy policies and procedures is available without charge upon request by calling 1-800-480-4111 and on the Fund’s website at www.jpmorganfunds.com. A description of such policies and procedures is on the SEC’s website at www.sec.gov. The Trustees have delegated the authority to vote proxies for securities owned by the Fund to the Adviser. A copy of the Fund’s voting record for the most recent 12-month period ended June 30 is available on the SEC’s website at www.sec.gov or at the Fund’s website at www.jpmorganfunds.com no later than August 31 of each year. The Fund’s proxy voting record will include, among other things, a brief description of the matter voted on for each fund security, and will state how each vote was cast, for example, for or against the proposal.
��

J.P. Morgan Asset Management is the marketing name for the asset management businesses of JPMorgan Chase & Co. Those businesses include, but are not limited to, J.P. Morgan Investment Management Inc., Security Capital Research & Management Incorporated and J.P. Morgan Alternative Asset Management, Inc.
| | | | |
| | © JPMorgan Chase & Co., 2017. All rights reserved. February 2017. | | SAN-GBO-217 |
Semi-Annual Report
J.P. Morgan Income Funds
February 28, 2017 (Unaudited)
JPMorgan Floating Rate Income Fund

CONTENTS
Investments in the Fund are not deposits or obligations of, or guaranteed or endorsed by, any bank and are not insured or guaranteed by the FDIC, the Federal Reserve Board or any other government agency. You could lose money if you sell when the Fund’s share price is lower than when you invested.
Past performance is no guarantee of future performance. The general market views expressed in this report are opinions based on market and other conditions through the end of the reporting period and are subject to change without notice. These views are not intended to predict the future performance of the Fund or the securities markets. References to specific securities and their issuers are for illustrative purposes only and are not intended to be, and should not be interpreted as, recommendations to purchase or sell such securities. Such views are not meant as investment advice and may not be relied on as an indication of trading intent on behalf of the Fund.
Prospective investors should refer to the Fund’s prospectus for a discussion of the Fund’s investment objective, strategies and risks. Call J.P. Morgan Funds Service Center at 1-800-480-4111 for a prospectus containing more complete information about the Fund, including management fees and other expenses. Please read it carefully before investing.
CEO’S LETTER
March 22, 2017 (Unaudited)
Dear Shareholders,
The U.S. economy continued its steady expansion over the past six months and by the end of February 2017, the world’s leading economies were growing in a more synchronized manner that could accelerate global growth.
| | |
 | | “In the U.S., the pace of economic expansion was sufficient to persuade the Federal Reserve Bank to raise interest rates in December 2016 and again in March 2017.” |
By early 2017, the World Bank estimated that global economic growth in 2017 will rise by 2.7% compared with 2.3% in 2016 and economists generally expect each of the world’s 20 largest economies will see an increase in gross domestic product in 2017.
In the 19-nation euro zone, manufacturing activity rose in February 2017 for the sixth consecutive month and reached levels not seen in nearly six years. Economic confidence surveys have been the strongest since 2011. While unemployment across the euro zone remained nearly twice that of the U.S., the jobless rate fell faster than expected in early 2017 to its lowest level since 2009. Importantly, euro zone inflation reached the European Central Bank’s (ECB) target of 2.0% in February 2017, which provided further evidence that the risk of a painful deflationary spiral had receded.
Meanwhile, Chinese factory activity was stronger than economists expected in February 2017 and more broadly, Chinese economic stimulus measures initiated in 2016 appeared to bolster trade throughout Asia. In Japan, corporate profits were estimated at record highs even in the face of a stronger yen. South Korean exports grew in February 2017 for the fourth consecutive month. Economic data from Australia and India showed signs of stronger growth.
To a certain extent, the healthier global economy was supported by a rebound in global oil prices, which reached 15-month highs in October 2016. Prices for other commodities also rose in the latter half of 2016, helping growth in those emerging market nations reliant on natural resource exports.
In the U.S., the pace of economic expansion was sufficient to persuade the Federal Reserve Bank to raise interest rates in December 2016 and again in March 2017. Meanwhile, leading
stock market indexes hit record highs in late 2016 and early 2017 amid strength in corporate profits and the broader U.S. economy. Investor expectations that the Republican Party’s newly-won control of the U.S. presidency along with its continuing majorities in both houses of the U.S. Congress would bolster economic growth while lowering certain taxes further supported U.S. financial assets.
While the global economy appeared to grow more synchronized during the six months ended February 2017, there also emerged political uncertainties in the U.S. and Europe. Britain’s planned exit from the European Union — and its immigration and trade policies — brought investor uncertainty and was seen as a drag on the U.K. economy. In November 2016, Donald Trump won the U.S. presidency after campaigning on a platform that included new restrictions on immigration and protective trade policies. While voters in the Netherlands declined to give the anti-immigrant Party for Freedom a majority in the lower house of Parliament, populist parties were also vying for power in Italy, France, Germany and elsewhere.
Each of these parties and their leaders – both in the U.S. and elsewhere – share broad policy goals that prioritize restricting immigration and shunning supranational trade agreements. Given that immigration and free trade are key drivers of economic growth in advanced, post-industrial nations, it remains to be seen how much electoral support these shared agendas would earn.
In the face of all this, U.S. and foreign financial markets generally rewarded investors with positive returns for the six months through February 2017. Over time, we believe financial markets will continue to reward those investors who maintain patience and discipline in the context of a properly diversified portfolio.
We look forward to managing your investment needs for years to come. Should you have any questions, please visit www.jpmorganfunds.com or contact the J.P. Morgan Funds Service Center at 1-800-480-4111.
Sincerely yours,

George C.W. Gatch
CEO, Investment Funds Management,
J.P. Morgan Asset Management
| | | | | | | | |
| | | |
| FEBRUARY 28, 2017 | | J.P. MORGAN INCOME FUNDS | | | | | 1 | |
JPMorgan Floating Rate Income Fund
FUND COMMENTARY
SIX MONTHS ENDED FEBRUARY 28, 2017 (Unaudited)
| | | | | | | | |
| REPORTING PERIOD RETURN: | |
| Fund (Class I Shares)1* | | | 3.37% | |
Credit Suisse Leveraged Loan Index | | | 4.30% | |
| Bloomberg Barclays U.S. Aggregate Index | | | (2.19)% | |
| |
| Net Assets as of 2/28/2017 (In Thousands) | | | $2,143,505 | |
INVESTMENT OBJECTIVE**
The JPMorgan Floating Rate Income Fund (the “Fund”) seeks to provide current income with a secondary objective of capital appreciation.
HOW DID THE MARKET PERFORM?
U.S. financial markets overall provided positive returns for the six months ended February 28, 2017. Equity markets rose along with bond yields amid a backdrop of low but rising interest rates and price inflation, as well as improved corporate profits.
Commodities prices stabilized during the reporting period and global oil prices reached 15-month highs in October. Oil prices were further bolstered by the Organization of Petroleum Exporting Countries’ decision to curb production.
The November 8, 2016 election handed Donald Trump the U.S. presidency and the Republican Party majority in both houses of the U.S. Congress. In the following months, key U.S. equity benchmarks reached multiple closing record highs. While U.S. Treasury bonds underperformed other bond market sectors, corporate bonds and high-yield bonds (also known as “junk bonds”) posted positive returns.
WHAT WERE THE MAIN DRIVERS OF THE FUND’S PERFORMANCE?
The Fund’s Class I Shares underperformed the Credit Suisse Leveraged Loan Index (the “Benchmark”) for the six months ended February 28, 2017. The Fund’s security selection — mostly in loan assignments — in the health care and service sectors was a leading detractor from performance relative to the Benchmark. The Fund’s cash position, which was used to manage the Fund’s day-to-day operations and was not part of the Fund’s investment strategy, also detracted from performance. The Fund’s security selection — mostly in loan assignments — in the utilities and financial sectors was a leading positive contributor to relative performance.
Relative to the Bloomberg Barclays U.S. Aggregate Index, the Fund’s allocation to high yield bonds (also known as “junk bonds”) helped performance as high yield bonds generally outperformed other sectors of the bond market during the reporting period.
HOW WAS THE FUND POSITIONED?
Relative to the Benchmark during the six month reporting period, the Fund was overweight in securities rated BBB and BB and was underweight in securities rated B, CCC and CC to D. The Fund’s portfolio managers generally upgraded the credit quality of the portfolio during the reporting period and gained exposure to higher quality loan assignments and bonds mainly by investing in floating rate loan facilities issued by corporations and, to a lesser extent, fixed rate short duration corporate debt securities.
| | | | |
PORTFOLIO COMPOSITION*** | |
| Loan Assignments | | | 70.5 | % |
| Corporate Bonds | | | 12.5 | |
| Others (each less than 1.0%) | | | 2.1 | |
| Short-Term Investment | | | 14.9 | |
| 1 | | Effective April 3, 2017, the Fund’s Select Class Shares were renamed Class I Shares. |
| * | | The return shown is based on net asset values calculated for shareholder transactions and may differ from the return shown in the financial highlights, which reflects adjustments made to the net asset values in accordance with accounting principles generally accepted in the United States of America. |
| ** | | The adviser seeks to achieve the Fund’s objective. There can be no guarantee it will be achieved. |
| *** | | Percentages indicated are based on total investments as of February 28, 2017. The Fund’s portfolio composition is subject to change. |
| | | | | | |
| | | |
| 2 | | | | J.P. MORGAN INCOME FUNDS | | FEBRUARY 28, 2017 |
| | | | | | | | | | | | | | | | | | |
AVERAGE ANNUAL TOTAL RETURNS AS OF FEBRUARY 28, 2017 | |
| | | | | |
| | | INCEPTION DATE OF
CLASS | | 6 MONTH* | | | 1 YEAR | | | 5 YEAR | | | SINCE
INCEPTION | |
CLASS A SHARES | | June 1, 2011 | | | | | | | | | | | | | | | | |
With Sales Charge** | | | | | 0.88 | % | | | 9.10 | % | | | 2.82 | % | | | 2.54 | % |
Without Sales Charge | | | | | 3.25 | | | | 11.56 | | | | 3.61 | | | | 3.23 | |
CLASS C SHARES | | June 1, 2011 | | | | | | | | | | | | | | | | |
With CDSC*** | | | | | 2.00 | | | | 10.03 | | | | 3.06 | | | | 2.71 | |
Without CDSC | | | | | 3.00 | | | | 11.03 | | | | 3.06 | | | | 2.71 | |
CLASS R6 SHARES | | October 31, 2013 | | | 3.42 | | | | 11.94 | | | | 3.92 | | | | 3.54 | |
CLASS I SHARES (FORMERLY SELECT CLASS SHARES) | | June 1, 2011 | | | 3.37 | | | | 11.82 | | | | 3.85 | | | | 3.48 | |
| ** | | Sales Charge for Class A Shares is 2.25%. |
| *** | | Assumes a 1% CDSC (contingent deferred sales charge) for the 6 month and one year periods and 0% CDSC thereafter. |
LIFE OF FUND PERFORMANCE (6/1/11 TO 2/28/17)
The performance quoted is past performance and is not a guarantee of future results. Mutual funds are subject to certain market risks. Investment returns and principal value of an investment will fluctuate so that an investor’s shares, when redeemed, may be worth more or less than their original cost. Current performance may be higher or lower than the performance data shown. For up-to-date, month-end performance information please call 1-800-480-4111.
The Fund commenced operations on June 1, 2011.
Returns for Class R6 Shares prior to their inception date are based on the performance of Class I Shares. The actual returns for Class R6 Shares would have been different than those shown because Class R6 Shares have different expenses than Class I Shares.
The graph illustrates comparative performance for $1,000,000 invested in the Class I Shares of JPMorgan Floating Rate Income Fund, the Credit Suisse Leveraged Loan Index, the Bloomberg Barclays U.S. Aggregate Index and the Lipper Loan Participation Funds Index from June 1, 2011 to February 28, 2017. The performance of the Lipper Loan Participation Funds Index reflects an initial investment at the end of the month closest to the Fund’s inception. The performance of the Fund assumes reinvestment of all dividends and capital gain distributions, if any. The performance of the Credit Suisse Leveraged Loan Index and the Bloomberg Barclays U.S. Aggregate Index does not reflect the deduction of expenses or a sales charge associated with a mutual fund and has been adjusted to reflect reinvestment of all dividends and capital gain distributions of the securities included in the indices, if applicable. The perform-
ance of the Lipper Loan Participation Funds Index includes expenses associated with a mutual fund, such as investment management fees. These expenses are not identical to the expenses incurred by the Fund. The Credit Suisse Leveraged Loan Index is an unmanaged market value-weighted index designed to represent the investable universe of the U.S. dollar-denominated leveraged loan market. The index reflects reinvestment of all distributions and changes in market prices. The Bloomberg Barclays U.S. Aggregate Index is an unmanaged index that represents securities that are SEC-registered, taxable, and dollar denominated. The index covers the U.S. investment grade fixed rate bond market, with index components for government and corporate securities, mortgage pass-through securities, and asset-backed securities. The Lipper Loan Participation Funds Index is an index based on total returns of certain mutual funds within the Fund’s designated category as determined by Lipper, Inc. Investors cannot invest directly in an index.
Class I Shares have a $1,000,000 minimum initial investment.
Fund performance may reflect the waiver of the Fund’s fees and reimbursement of expenses for certain periods since the inception date. Without these waivers and reimbursements, performance would have been lower. Also, performance shown in this section does not reflect the deduction of taxes that a shareholder would pay on Fund distributions or redemptions of Fund shares.
The returns shown are based on net asset values calculated for shareholder transactions and may differ from the returns shown in the financial highlights, which reflect adjustments made to the net asset values in accordance with accounting principles generally accepted in the United States of America.
| | | | | | | | |
| | | |
| FEBRUARY 28, 2017 | | J.P. MORGAN INCOME FUNDS | | | | | 3 | |
JPMorgan Floating Rate Income Fund
SCHEDULE OF PORTFOLIO INVESTMENTS
AS OF FEBRUARY 28, 2017 (Unaudited)
(Amounts in thousands)
| | | | | | | | |
PRINCIPAL
AMOUNT($) | | | SECURITY DESCRIPTION | | VALUE($) | |
| | Asset-Backed Securities — 0.8% | |
| | 9,648 | | | Continental Airlines Pass-Through Certificates, Series 2012-3, Class C, 6.125%, 04/29/18 | | | 10,058 | |
| | | | Continental Airlines Pass-Through Trust, | | | | |
| | 204 | | | Series 2003-ERJ1, 7.875%, 07/02/18 | | | 212 | |
| | 3,331 | | | Series 2004-ERJ1, 9.558%, 09/01/19 | | | 3,565 | |
| | 772 | | | Series 2006-ERJ1, 9.318%, 11/01/19 (e) | | | 826 | |
| | 2,262 | | | Sprint Spectrum Co. LLC, 3.360%, 09/20/21 (e) | | | 2,268 | |
| | | | | | | | |
| | | | Total Asset-Backed Securities
(Cost $16,720) | | | 16,929 | |
| | | | | | | | |
| | Corporate Bonds — 13.8% | |
| | | | Consumer Discretionary — 2.3% | |
| | | | Automobiles — 0.2% | |
| | 3,417 | | | Jaguar Land Rover Automotive plc, (United Kingdom), 4.125%, 12/15/18 (e) | | | 3,486 | |
| | | | | | | | |
| | | | Hotels, Restaurants & Leisure — 1.3% | |
| | | | GLP Capital LP, | | | | |
| | 2,000 | | | 4.375%, 04/15/21 | | | 2,082 | |
| | 3,000 | | | 4.875%, 11/01/20 | | | 3,150 | |
| | 5,000 | | | International Game Technology, 7.500%, 06/15/19 | | | 5,513 | |
| | 5,000 | | | International Game Technology plc, 5.625%, 02/15/20 (e) | | | 5,288 | |
| | 4,780 | | | MGM Resorts International, 5.250%, 03/31/20 | | | 5,031 | |
| | 7,627 | | | NCL Corp. Ltd., 4.750%, 12/15/21 (e) | | | 7,789 | |
| | | | | | | | |
| | | | | | | 28,853 | |
| | | | | | | | |
| | | | Media — 0.7% | |
| | | | Cablevision Systems Corp., | | | | |
| | 892 | | | 8.000%, 04/15/20 | | | 985 | |
| | 543 | | | 8.625%, 09/15/17 | | | 560 | |
| | 2,600 | | | Charter Communications Operating LLC, 3.579%, 07/23/20 | | | 2,673 | |
| | 1,486 | | | CSC Holdings LLC, 8.625%, 02/15/19 | | | 1,643 | |
| | 7,000 | | | DISH DBS Corp., 7.875%, 09/01/19 | | | 7,805 | |
| | 1,500 | | | Nielsen Finance LLC, 4.500%, 10/01/20 | | | 1,530 | |
| | | | | | | | |
| | | | | | | 15,196 | |
| | | | | | | | |
| | | | Specialty Retail — 0.1% | |
| | | | Claire’s Stores, Inc., | | | | |
| | 1,872 | | | 6.125%, 03/15/20 (e) | | | 789 | |
| | 4,000 | | | 9.000%, 03/15/19 (e) | | | 1,840 | |
| | | | | | | | |
| | | | | | | 2,629 | |
| | | | | | | | |
| | | | Total Consumer Discretionary | | | 50,164 | |
| | | | | | | | |
| | | | Consumer Staples — 0.2% | |
| | | | Beverages — 0.1% | |
| | 1,600 | | | DS Services of America, Inc., (Canada), 10.000%, 09/01/21 (e) | | | 1,736 | |
| | | | | | | | |
| | | | | | | | |
PRINCIPAL
AMOUNT($) | | | SECURITY DESCRIPTION | | VALUE($) | |
| | |
| | | | Food Products — 0.1% | | | | |
| | 2,277 | | | Bumble Bee Holdings, Inc., 9.000%, 12/15/17 (e) | | | 2,268 | |
| | | | | | | | |
| | | | Total Consumer Staples | | | 4,004 | |
| | | | | | | | |
| | | | Energy — 2.1% | |
| | | | Energy Equipment & Services — 0.1% | |
| | 1,788 | | | SESI LLC, 7.125%, 12/15/21 | | | 1,837 | |
| | | | | | | | |
| | | | Oil, Gas & Consumable Fuels — 2.0% | |
| | 3,000 | | | Antero Resources Corp., 5.375%, 11/01/21 | | | 3,067 | |
| | | | NGPL PipeCo LLC, | | | | |
| | 9,750 | | | 7.119%, 12/15/17 (e) | | | 10,103 | |
| | 5,000 | | | 9.625%, 06/01/19 (e) | | | 5,200 | |
| | 1,750 | | | Oasis Petroleum, Inc., 6.500%, 11/01/21 | | | 1,781 | |
| | 6,000 | | | Rockies Express Pipeline LLC, 6.850%, 07/15/18 (e) | | | 6,315 | |
| | 4,000 | | | Sunoco LP, 5.500%, 08/01/20 | | | 4,030 | |
| | 4,000 | | | Targa Resources Partners LP, 5.000%, 01/15/18 | | | 4,058 | |
| | 4,000 | | | Tesoro Logistics LP, 5.500%, 10/15/19 | | | 4,240 | |
| | 4,000 | | | Whiting Petroleum Corp., 5.000%, 03/15/19 | | | 4,035 | |
| | | | | | | | |
| | | | | | | 42,829 | |
| | | | | | | | |
| | | | Total Energy | | | 44,666 | |
| | | | | | | | |
| | | | Financials — 1.0% | |
| | | | Consumer Finance — 0.7% | |
| | 12,050 | | | Ally Financial, Inc., 8.000%, 03/15/20 | | | 13,781 | |
| | | | | | | | |
| | | | Thrifts & Mortgage Finance — 0.3% | |
| | 6,940 | | | Radian Group, Inc., 5.250%, 06/15/20 | | | 7,304 | |
| | | | | | | | |
| | | | Total Financials | | | 21,085 | |
| | | | | | | | |
| | | | Health Care — 2.1% | |
| | | | Health Care Equipment & Supplies — 0.1% | |
| | 3,000 | | | Mallinckrodt International Finance SA, 3.500%, 04/15/18 | | | 3,008 | |
| | | | | | | | |
| | | | Health Care Providers & Services — 1.7% | |
| | | | HCA, Inc., | | | | |
| | 7,000 | | | 4.250%, 10/15/19 | | | 7,280 | |
| | 6,000 | | | 6.500%, 02/15/20 | | | 6,584 | |
| | | | Tenet Healthcare Corp., | | | | |
| | 4,000 | | | 4.375%, 10/01/21 | | | 4,030 | |
| | 18,273 | | | VAR, 4.463%, 06/15/20 | | | 18,501 | |
| | | | | | | | |
| | | | | | | 36,395 | |
| | | | | | | | |
| | | | Health Care Technology — 0.3% | |
| | 6,000 | | | Change Healthcare Holdings, Inc., 11.000%, 12/31/19 | | | 6,165 | |
| | | | | | | | |
| | | | Total Health Care | | | 45,568 | |
| | | | | | | | |
SEE NOTES TO FINANCIAL STATEMENTS.
| | | | | | |
| | | |
| 4 | | | | J.P. MORGAN INCOME FUNDS | | FEBRUARY 28, 2017 |
| | | | | | | | |
PRINCIPAL
AMOUNT($) | | | SECURITY DESCRIPTION | | VALUE($) | |
| | Corporate Bonds — continued | |
| | | | Industrials — 1.2% | |
| | | | Aerospace & Defense — 0.1% | |
| | 2,272 | | | Bombardier, Inc., (Canada), 4.750%, 04/15/19 (e) | | | 2,332 | |
| | | | | | | | |
| | | | Airlines — 0.3% | |
| | 5,523 | | | Allegiant Travel Co., 5.500%, 07/15/19 | | | 5,689 | |
| | | | | | | | |
| | | | Commercial Services & Supplies — 0.5% | |
| | 11,745 | | | ILFC E-Capital Trust I, VAR, 4.670%, 12/21/65 (e) | | | 11,040 | |
| | | | | | | | |
| | | | Machinery — 0.1% | |
| | 3,200 | | | Bluewater Holding BV, (Netherlands), Reg. S, 10.000%, 12/10/19 (e) | | | 2,336 | |
| | | | | | | | |
| | | | Marine — 0.2% | |
| | 4,256 | | | Shelf Drilling Holdings Ltd., (United Arab Emirates), 9.500%, 11/02/20 (e) | | | 4,043 | |
| | | | | | | | |
| | | | Total Industrials | | | 25,440 | |
| | | | | | | | |
| | | | Information Technology — 1.5% | |
| | | | Electronic Equipment, Instruments & Components — 0.2% | |
| | 3,400 | | | Anixter, Inc., 5.625%, 05/01/19 | | | 3,587 | |
| | | | | | | | |
| | | | IT Services — 0.3% | |
| | 5,000 | | | Alliance Data Systems Corp., 5.875%, 11/01/21 (e) | | | 5,175 | |
| | | | | | | | |
| | | | Semiconductors & Semiconductor Equipment — 0.1% | |
| | 2,615 | | | NXP BV, (Netherlands), 4.125%, 06/01/21 (e) | | | 2,712 | |
| | | | | | | | |
| | | | Software — 0.4% | |
| | 4,350 | | | Infor US, Inc., 5.750%, 08/15/20 (e) | | | 4,513 | |
| | 2,143 | | | Nuance Communications, Inc., 5.375%, 08/15/20 (e) | | | 2,193 | |
| | 1,860 | | | Symantec Corp., 4.200%, 09/15/20 | | | 1,922 | |
| | | | | | | | |
| | | | | | | 8,628 | |
| | | | | | | | |
| | | | Technology Hardware, Storage & Peripherals — 0.5% | |
| | | | Diamond 1 Finance Corp., | | | | |
| | 5,838 | | | 4.420%, 06/15/21 (e) | | | 6,126 | |
| | 5,000 | | | 5.875%, 06/15/21 (e) | | | 5,290 | |
| | | | | | | | |
| | | | | | | 11,416 | |
| | | | | | | | |
| | | | Total Information Technology | | | 31,518 | |
| | | | | | | | |
| | | | Materials — 1.4% | |
| | | | Chemicals — 0.5% | |
| | 9,000 | | | CF Industries, Inc., 3.400%, 12/01/21 (e) | | | 9,023 | |
| | 1,000 | | | Rain CII Carbon LLC, 8.000%, 12/01/18 (e) | | | 999 | |
| | | | | | | | |
| | | | | | | 10,022 | |
| | | | | | | | |
| | | | Construction Materials — 0.5% | |
| | 9,545 | | | Cemex SAB de CV, (Mexico), VAR, 5.773%, 10/15/18 (e) | | | 9,951 | |
| | | | | | | | |
| | | | | | | | |
PRINCIPAL
AMOUNT($) | | | SECURITY DESCRIPTION | | VALUE($) | |
| | |
| | | | Containers & Packaging — 0.4% | |
| | 5,000 | | | Ardagh Packaging Finance plc, (Ireland), 4.250%, 09/15/22 (e) | | | 5,075 | |
| | 4,195 | | | Reynolds Group Issuer, Inc., (New Zealand), VAR, 4.523%, 07/15/21 (e) | | | 4,305 | |
| | | | | | | | |
| | | | | | | 9,380 | |
| | | | | | | | |
| | | | Metals & Mining — 0.0% (g) | |
| | 897 | | | United States Steel Corp., 8.375%, 07/01/21 (e) | | | 1,009 | |
| | | | | | | | |
| | | | Total Materials | | | 30,362 | |
| | | | | | | | |
| | | | Real Estate — 0.4% | |
| | | | Equity Real Estate Investment Trusts (REITs) — 0.4% | |
| | 3,000 | | | Equinix, Inc., 5.375%, 01/01/22 | | | 3,168 | |
| | 4,330 | | | Iron Mountain, Inc., 6.000%, 10/01/20 (e) | | | 4,548 | |
| | | | | | | | |
| | | | Total Real Estate | | | 7,716 | |
| | | | | | | | |
| | | | Telecommunication Services — 0.9% | |
| | | | Diversified Telecommunication Services — 0.6% | |
| | | | Frontier Communications Corp., | | | | |
| | 6,570 | | | 7.125%, 03/15/19 | | | 6,981 | |
| | 1,250 | | | 8.125%, 10/01/18 | | | 1,338 | |
| | 2,750 | | | 8.500%, 04/15/20 | | | 2,918 | |
| | 2,135 | | | Level 3 Financing, Inc., VAR, 4.762%, 01/15/18 | | | 2,140 | |
| | | | | | | | |
| | | | | | | 13,377 | |
| | | | | | | | |
| | | | Wireless Telecommunication Services — 0.3% | |
| | 6,000 | | | SoftBank Group Corp., (Japan), 4.500%, 04/15/20 (e) | | | 6,202 | |
| | | | | | | | |
| | | | Total Telecommunication Services | | | 19,579 | |
| | | | | | | | |
| | | | Utilities — 0.7% | |
| | | | Electric Utilities — 0.0% (g) | |
| | 75,000 | | | Texas Competitive Electric Holdings Co. LLC, 8.500%, 05/01/20 (d) | | | 240 | |
| | | | | | | | |
| | | | Independent Power & Renewable Electricity Producers — 0.7% | |
| | | | AES Corp., | | | | |
| | 4,000 | | | 7.375%, 07/01/21 | | | 4,510 | |
| | 4,216 | | | VAR, 3.931%, 06/01/19 | | | 4,218 | |
| | 3,000 | | | GenOn Energy, Inc., 9.875%, 10/15/20 | | | 2,205 | |
| | 4,460 | | | NRG Energy, Inc., 7.875%, 05/15/21 | | | 4,627 | |
| | | | | | | | |
| | | | | | | 15,560 | |
| | | | | | | | |
| | | | Total Utilities | | | 15,800 | |
| | | | | | | | |
| | | | Total Corporate Bonds
(Cost $293,748) | | | 295,902 | |
| | | | | | | | |
SEE NOTES TO FINANCIAL STATEMENTS.
| | | | | | | | |
| | | |
| FEBRUARY 28, 2017 | | J.P. MORGAN INCOME FUNDS | | | | | 5 | |
JPMorgan Floating Rate Income Fund
SCHEDULE OF PORTFOLIO INVESTMENTS
AS OF FEBRUARY 28, 2017 (Unaudited) (continued)
(Amounts in thousands)
| | | | | | | | |
| SHARES | | | SECURITY DESCRIPTION | |
VALUE($) | |
| | Common Stocks — 0.8% | |
| | | | Energy — 0.0% (g) | |
| | | | Oil, Gas & Consumable Fuels — 0.0% (g) | |
| | 1 | | | Southcross Holdco Equity (a) | | | 486 | |
| | | | | | | | |
| | | | Utilities — 0.8% | |
| | | | Electric Utilities — 0.8% | |
| | 1,056 | | | Vistra Energy Corp. | | | 17,067 | |
| | | | | | | | |
| | | | Total Common Stocks
(Cost $17,933) | | | 17,553 | |
| | | | | | | | |
| | Preferred Stock — 0.7% | |
| | | | Financials — 0.7% | |
| | | | Insurance — 0.7% | |
| | 16 | | | XLIT Ltd., (Ireland), Series D, VAR, 4.143%, 04/17/17 ($1,000 par VALUE($)) @
(Cost $13,587) | | | 14,203 | |
| | | | | | | | |
| | |
PRINCIPAL
AMOUNT($) | | | | | | |
| | Loan Assignments — 77.8% | |
| | | | Consumer Discretionary — 17.1% | |
| | | | Auto Components — 0.1% | |
| | 816 | | | Key Safety Systems, Inc., Initial Term Loan, VAR, 5.540%, 08/29/21 | | | 824 | |
| | 1,237 | | | Metaldyne Performance Group (MPG Holdco I, Inc.), Initial Term Loan, VAR, 3.750%, 10/20/21 | | | 1,237 | |
| | | | | | | | |
| | | | | | | 2,061 | |
| | | | | | | | |
| | | | Automobiles — 0.1% | |
| | 2,844 | | | Chrysler Group LLC, Tranche B Term Loan, VAR, 3.280%, 12/31/18 | | | 2,846 | |
| | | | | | | | |
| | | | Diversified Consumer Services — 0.8% | |
| | 16,586 | | | Spin Holdco, Inc., Initial Term Loan, VAR, 4.285%, 11/14/19 | | | 16,518 | |
| | | | | | | | |
| | | | Hotels, Restaurants & Leisure — 4.1% | |
| | 6,622 | | | American Casino & Entertainment Properties LLC, Term Loan B, VAR, 4.250%, 07/07/22 | | | 6,669 | |
| | 3,154 | | | Casablanca US Holdings, Inc., 1st Lien Term Loan, VAR, 5.500%, 02/07/24 ^ | | | 3,107 | |
| | 9,653 | | | CBAC Borrower LLC, Term Loan B, VAR, 8.250%, 07/02/20 | | | 9,677 | |
| | 4,140 | | | Gateway Casinos & Entertainment Ltd., 1st Lien Term Loan B, (Canada), VAR, 02/15/23 ^ | | | 4,163 | |
| | 6,694 | | | Golden Nugget, Inc., Closing Date Facility Term Loan, VAR, 4.500%, 11/21/19 | | | 6,769 | |
| | 2,869 | | | Golden Nugget, Inc., Delayed Draw Term Loan, VAR, 4.500%, 11/21/19 | | | 2,901 | |
| | 7,023 | | | Graton Economic Development Authority, Incremental Term B Loan, VAR, 4.779%, 09/01/22 | | | 7,093 | |
| | | | | | | | |
PRINCIPAL
AMOUNT($) | | | SECURITY DESCRIPTION | |
VALUE($) | |
| | |
| | | | Hotels, Restaurants & Leisure — continued | |
| | 562 | | | Hilton Worldwide Finance LLC, Initial Term Loan, VAR, 3.500%, 10/26/20 | | | 566 | |
| | 7,646 | | | Hilton Worldwide Finance LLC, Series B-2 Term Loan, VAR, 3.278%, 10/25/23 | | | 7,678 | |
| | 12,634 | | | Intrawest Operations Group LLC, Initial Term Loan, VAR, 4.500%, 12/09/20 | | | 12,729 | |
| | 3,263 | | | Landry’s, Inc., 1st Lien Term Loan, VAR, 4.029%, 09/22/23 | | | 3,297 | |
| | 12,548 | | | Penn National Gaming, Inc., Term Loan, VAR, 3.250%, 01/19/24 ^ | | | 12,644 | |
| | 10,836 | | | Scientific Games Corp., Initial Term Loan, VAR, 4.845%, 10/18/20 | | | 11,003 | |
| | | | | | | | |
| | | | | | | 88,296 | |
| | | | | | | | |
| | | | Internet & Direct Marketing Retail — 0.5% | |
| | 13,564 | | | Lands’ End, Inc., Initial Term B Loan, VAR, 4.250%, 04/04/21 | | | 10,064 | |
| | | | | | | | |
| | | | Leisure Products — 1.6% | |
| | 14,475 | | | Delta 2 Sarl, USD Facility B-3, VAR, 5.068%, 07/30/21 | | | 14,509 | |
| | 20,479 | | | FGI Operating Co. LLC, Term B Loan, VAR, 5.500%, 04/19/19 ^ | | | 19,694 | |
| | | | | | | | |
| | | | | | | 34,203 | |
| | | | | | | | |
| | | | Media — 7.1% | |
| | 660 | | | Altice US Finance I Corp., Senior Secured Term Loan B, VAR, 3.781%, 01/20/25 | | | 667 | |
| | 5,318 | | | AMC Entertainment, Inc., 1st Lien Term Loan, VAR, 3.521%, 12/15/22 | | | 5,374 | |
| | 2,400 | | | AMC Entertainment, Inc., Term Loan B, VAR, 3.528%, 10/31/23 | | | 2,425 | |
| | 2,583 | | | Charter Communications Operating LLC, 1st Lien Term Loan H, VAR, 2.790%, 01/15/22 ^ | | | 2,592 | |
| | 1,884 | | | Charter Communications Operating LLC, 1st Lien Term Loan I, VAR, 3.030%, 01/15/24 | | | 1,896 | |
| | 13,641 | | | CSC Holdings LLC, Term Loan B, VAR, 3.772%, 10/11/24 | | | 13,772 | |
| | 2,939 | | | Entercom Communications Corp., 1st Lien Term Loan B, VAR, 4.511%, 11/01/23 | | | 2,950 | |
| | 9,834 | | | Gray Television, Inc., 1st Lien Term Loan B, VAR, 3.276%, 02/28/24 | | | 9,908 | |
| | 11,961 | | | iHeartCommunications, Inc., Term Loan D, VAR, 7.531%, 01/30/19 | | | 10,380 | |
| | 2,795 | | | iHeartCommunications, Inc., Tranche E Term Loan, VAR, 8.281%, 07/30/19 | | | 2,418 | |
| | 718 | | | Mission Broadcasting, Inc., 1st Lien Term Loan B, VAR, 3.772%, 09/26/23 | | | 729 | |
| | 9,147 | | | MTL Publishing LLC, Term B-4 Loan, VAR, 3.527%, 08/22/22 | | | 9,186 | |
SEE NOTES TO FINANCIAL STATEMENTS.
| | | | | | |
| | | |
| 6 | | | | J.P. MORGAN INCOME FUNDS | | FEBRUARY 28, 2017 |
| | | | | | | | |
PRINCIPAL
AMOUNT($) | | | SECURITY DESCRIPTION | |
VALUE($) | |
| | Loan Assignments — continued | |
| | | | Media — continued | |
| | 7,560 | | | Nexstar Broadcasting, Inc., 1st Lien Term Loan B, VAR, 3.772%, 09/22/23 | | | 7,676 | |
| | 7,907 | | | NVA Holdings, Inc., 1st Lien Term Loan, VAR, 4.750%, 08/14/21 | | | 7,946 | |
| | 2,518 | | | NVA Holdings, Inc., 1st Lien Term Loan B, VAR, 08/13/21 ^ | | | 2,543 | |
| | 8,293 | | | Sinclair Broadcast Group, Inc., 1st Lien Term Loan B, VAR, 3.040%, 01/03/24 | | | 8,300 | |
| | 7,506 | | | Tribune Media Co., 1st Lien Term Loan B, VAR, 3.781%, 01/18/24 ^ | | | 7,569 | |
| | 5,740 | | | Tribune Media Co., Term Loan B, VAR, 3.781%, 12/27/20 | | | 5,740 | |
| | 6,748 | | | Univision Communications, Inc., 2013 Incremental Term Loan, VAR, 4.000%, 03/01/20 | | | 6,766 | |
| | 25,506 | | | Univision Communications, Inc., Replacement 1st Lien Term Loan, VAR, 4.000%, 03/01/20 | | | 25,597 | |
| | 1,968 | | | Vertis, Inc., 1st Lien Term Loan, VAR, 12.000%, 12/21/15 (d) | | | — | (h) |
| | 10,825 | | | WMG Acquisition Corp., Term Loan B, VAR, 3.750%, 11/01/23 | | | 10,852 | |
| | 7,242 | | | Zuffa LLC, 1st Lien Guaranteed Senior Secured Term Loan, VAR, 4.250%, 08/18/23 | | | 7,291 | |
| | | | | | | | |
| | | | | | | 152,577 | |
| | | | | | | | |
| | | | Multiline Retail — 0.4% | |
| | 11,394 | | | Neiman Marcus Group, Inc., Other Term Loan, VAR, 4.250%, 10/25/20 | | | 9,169 | |
| | | | | | | | |
| | | | Specialty Retail — 1.5% | |
| | 9,075 | | | Bass Pro Group LLC, Senior Secured Term Loan B, VAR, 5.970%, 11/04/23 | | | 8,706 | |
| | 3,831 | | | Culligan Holding, Inc., 1st Lien Term Loan, VAR, 5.000%, 12/13/23 | | | 3,893 | |
| | 8,084 | | | Harbor Freight Tools USA, Inc., 1st Lien Term Loan, VAR, 3.778%, 08/11/23 | | | 8,089 | |
| | 12,807 | | | J. Crew Group, Inc., Initial Loan, VAR, 4.000%, 03/05/21 | | | 7,307 | |
| | 4,139 | | | PetSmart, Inc., Term Loan B, VAR, 4.000%, 03/11/22 | | | 4,075 | |
| | | | | | | | |
| | | | | | | 32,070 | |
| | | | | | | | |
| | | | Textiles, Apparel & Luxury Goods — 0.9% | |
| | 6,373 | | | Cole Haan LLC, Term B-1 Loan, VAR, 5.060%, 01/31/20 | | | 5,608 | |
| | 4,875 | | | Nine West Holdings, Inc., Initial Loan, VAR, 4.755%, 10/08/19 | | | 3,246 | |
| | 9,776 | | | SAMSONITE IP Holdings, 1st Lien Term Loan B, VAR, 3.031%, 08/01/23 | | | 9,865 | |
| | | | | | | | |
| | | | | | | 18,719 | |
| | | | | | | | |
| | | | Total Consumer Discretionary | | | 366,523 | |
| | | | | | | | |
| | | | | | | | |
PRINCIPAL
AMOUNT($) | | | SECURITY DESCRIPTION | |
VALUE($) | |
| | |
| | | | Consumer Staples — 8.5% | |
| | | | Food & Staples Retailing — 4.0% | |
| | 10,547 | | | Albertson’s LLC, Term Loan B-4, VAR, 3.781%, 08/25/21 | | | 10,672 | |
| | 25,109 | | | Albertson’s LLC, Term Loan B-5, VAR, 4.247%, 12/21/22 | | | 25,452 | |
| | 6,016 | | | BJ’s Wholesale Club, Inc., 1st Lien Term Loan, VAR, 4.750%, 01/27/24 | | | 5,967 | |
| | 2,075 | | | BJ’s Wholesale Club, Inc., 2nd Lien Term Loan, VAR, 8.500%, 01/27/25 | | | 2,072 | |
| | 15,800 | | | Moran Foods LLC, Term Loan B, VAR, 7.000%, 11/29/23 ^ | | | 15,662 | |
| | 13,000 | | | Rite Aid Corp., Tranche 2 Term Loan, VAR, 4.875%, 06/21/21 | | | 13,044 | |
| | 13,565 | | | SUPERVALU, Inc., Term Loan B, VAR, 5.500%, 03/21/19 | | | 13,667 | |
| | | | | | | | |
| | | | | | | 86,536 | |
| | | | | | | | |
| | | | Food Products — 3.3% | |
| | 20,527 | | | Dole Food Co., Inc., Tranche B Term Loan, VAR, 4.549%, 11/01/18 | | | 20,589 | |
| | 18,310 | | | Hearthside Group Holdings LLC, 1st Lien Term Loan B, VAR, 4.000%, 06/21/21 | | | 18,401 | |
| | 10,894 | | | JBS USA LLC, Term Loan B, VAR, 3.279%, 10/30/22 | | | 10,953 | |
| | 19,407 | | | Pinnacle Foods Finance LLC, Term Loan B, VAR, 2.780%, 01/27/24 ^ | | | 19,496 | |
| | | | | | | | |
| | | | | | | 69,439 | |
| | | | | | | | |
| | | | Personal Products — 1.2% | |
| | 13,930 | | | NBTY, Inc., Term Loan, VAR, 5.000%, 05/05/23 | | | 14,017 | |
| | 8,540 | | | Prestige Brands, Inc., 1st Lien Term Loan B-4, VAR, 3.531%, 01/24/24 ^ | | | 8,643 | |
| | 2,723 | | | Revlon Consumer Products Corp., Term Loan B, VAR, 4.281%, 09/07/23 | | | 2,738 | |
| | | | | | | | |
| | | | | | | 25,398 | |
| | | | | | | | |
| | | | Total Consumer Staples | | | 181,373 | |
| | | | | | | | |
| | | | Energy — 5.4% | |
| | | | Energy Equipment & Services — 0.5% | |
| | 3,389 | | | Drillships Financing Holding, Inc., Tranche B-1 Term Loan, VAR, 6.063%, 03/31/21 | | | 2,772 | |
| | 3,510 | | | Floatel International Ltd., Initial Term Loan, (Bermuda), VAR, 6.000%, 06/27/20 | | | 3,068 | |
| | 4,500 | | | Vistra Operations Co. LLC, Term Loan B-2, VAR, 4.022%, 12/14/23 | | | 4,526 | |
| | | | | | | | |
| | | | | | | 10,366 | |
| | | | | | | | |
SEE NOTES TO FINANCIAL STATEMENTS.
| | | | | | | | |
| | | |
| FEBRUARY 28, 2017 | | J.P. MORGAN INCOME FUNDS | | | | | 7 | |
JPMorgan Floating Rate Income Fund
SCHEDULE OF PORTFOLIO INVESTMENTS
AS OF FEBRUARY 28, 2017 (Unaudited) (continued)
(Amounts in thousands)
| | | | | | | | |
PRINCIPAL
AMOUNT($) | | | SECURITY DESCRIPTION | |
VALUE($) | |
| | Loan Assignments — continued | |
| | | | Oil, Gas & Consumable Fuels — 4.9% | |
| | 1,280 | | | Alon USA Partners LP, MLP Term Loans, VAR, 9.250%, 11/26/18 | | | 1,280 | |
| | 5,210 | | | California Resources Corp., 1st Lien Second Out Term Loan, VAR, 11.375%, 08/05/21 | | | 5,870 | |
| | 2,693 | | | Citgo Holding, Inc., Term Loan, VAR, 9.500%, 05/12/18 | | | 2,736 | |
| | 5,929 | | | CITGO Petroleum Corp., Term B Loan, VAR, 4.500%, 07/29/21 | | | 5,961 | |
| | 14,338 | | | Energy Transfer Equity LP, Term Loan, VAR, 3.529%, 02/02/24 | | | 14,373 | |
| | 19,162 | | | Gulf Finance LLC, 1st Lien Term Loan B, VAR, 6.250%, 07/27/23 | | | 19,441 | |
| | 39,200 | | | MEG Energy Corp., 1st Lien Term B Loan, (Canada), VAR, 4.540%, 12/31/23 ^ | | | 39,410 | |
| | 8,313 | | | Peabody Energy Corp., Term Loan, VAR, 4.250%, 09/24/20 (d) | | | 8,408 | |
| | 6,083 | | | Sabine Oil & Gas Corp., Term Loan, VAR, 12.000%, 12/31/18 (d) ^ | | | 167 | |
| | 1,263 | | | Southcross Holdings Borrower LP, Tranche B Term Loan, VAR, 3.500%, 04/13/23 | | | 1,058 | |
| | 6,854 | | | Western Refining, Inc., 1st Lien Term Loan B, VAR, 5.500%, 06/23/23 | | | 6,880 | |
| | | | | | | | |
| | | | | | | 105,584 | |
| | | | | | | | |
| | | | Total Energy | | | 115,950 | |
| | | | | | | | |
| | | | Financials — 1.6% | |
| | | | Capital Markets — 0.5% | |
| | 3,121 | | | Duff & Phelps Corp., Term Loan, VAR, 4.750%, 04/23/20 | | | 3,141 | |
| | 6,227 | | | Lightstone Group LLC, Term Loan B, VAR, 6.539%, 12/31/23 | | | 6,315 | |
| | 593 | | | Lightstone Group LLC, Term Loan C, VAR, 6.539%, 12/31/23 | | | 602 | |
| | | | | | | | |
| | | | | | | 10,058 | |
| | | | | | | | |
| | | | Consumer Finance — 0.8% | |
| | 17,503 | | | Sears Roebuck Acceptance Corp., Term Loan, VAR, 5.500%, 06/30/18 | | | 17,316 | |
| | | | | | | | |
| | | | Diversified Financial Services — 0.3% | |
| | 2,060 | | | Compass investorsOnex USI Acquisition Corp., Term Loan B, VAR, 4.250%, 12/27/19 | | | 2,071 | |
| | 3,193 | | | Tkc Holdings Inc., 1st Lien Term Loan, VAR, 4.750%, 02/01/23 | | | 3,217 | |
| | 1,611 | | | Tkc Holdings Inc., 2nd Lien Term Loan, VAR, 8.500%, 02/01/24 ^ | | | 1,614 | |
| | | | | | | | |
| | | | | | | 6,902 | |
| | | | | | | | |
| | | | Total Financials | | | 34,276 | |
| | | | | | | | |
| | | | | | | | |
PRINCIPAL
AMOUNT($) | | | SECURITY DESCRIPTION | |
VALUE($) | |
| | | | | |
| | | | Health Care — 9.1% | |
| | | | Health Care Equipment & Supplies — 1.2% | |
| | 8,740 | | | Auris Luxembourg III Sarl, Facility B-4, (Luxembourg), VAR, 4.250%, 01/17/22 | | | 8,812 | |
| | 8,050 | | | Mallinckrodt International Finance SA, Incremental Term B-1 Loan, VAR, 3.748%, 03/19/21 | | | 8,065 | |
| | 8,655 | | | Mallinckrodt International Finance SA, Initial Term B Loan, VAR, 3.498%, 03/19/21 | | | 8,663 | |
| | | | | | | | |
| | | | | | | 25,540 | |
| | | | | | | | |
| | | | Health Care Providers & Services — 5.0% | |
| | 5,673 | | | Acadia Healthcare Co., Inc., Tranche B-2 Term Loan, VAR, 3.781%, 02/16/23 | | | 5,717 | |
| | 16,386 | | | CHG Healthcare Services, Inc., Term Loan B, VAR, 4.750%, 06/07/23 | | | 16,591 | |
| | 14,525 | | | CHS/Community Health Systems, Inc., Incremental 2018 Term F Loan, VAR, 4.180%, 12/31/18 ^ | | | 14,482 | |
| | 7,324 | | | CHS/Community Health Systems, Inc., Incremental 2021 Term H Loan, VAR, 4.000%, 01/27/21 | | | 7,195 | |
| | 12,481 | | | IASIS Healthcare LLC, Term Loan B, VAR, 4.500%, 05/03/18 | | | 12,476 | |
| | 6,280 | | | inVentiv Health, Inc., Term Loan B, VAR, 4.804%, 09/28/23 | | | 6,318 | |
| | 12,444 | | | MultiPlan, Inc., 1st Lien Term Loan B, VAR, 5.000%, 06/07/23 | | | 12,633 | |
| | 21,463 | | | National Mentor Holdings, Inc., Tranche B Term Loan, VAR, 4.250%, 01/31/21 | | | 21,470 | |
| | 10,800 | | | Tennessee Merger Sub, Inc., 1st Lien Term Loan B, VAR, 3.750%, 01/12/24 ^ | | | 10,766 | |
| | | | | | | | |
| | | | | | | 107,648 | |
| | | | | | | | |
| | | | Health Care Technology — 0.4% | |
| | 7,890 | | | Press Ganey Holdings Inc., 1st Lien Term Loan, VAR, 4.250%, 09/29/23 | | | 7,900 | |
| | | | | | | | |
| | | | Pharmaceuticals — 2.5% | |
| | 20,968 | | | Concordia Healthcare Corp., Initial Dollar Term Loan, (Canada), VAR, 5.250%, 10/21/21 | | | 17,100 | |
| | 15,000 | | | Grifols Worldwide Operations Ltd., Term Loan B, (Spain), VAR, 2.969%, 01/19/25 ^ | | | 15,049 | |
| | 15,899 | | | Valeant Pharmaceuticals International, Inc., Series D-2 Tranche B Term Loan, (Canada), VAR, 5.030%, 02/13/19 | | | 15,969 | |
| | 6,671 | �� | | Valeant Pharmaceuticals International, Inc., Series F-1 Tranche B Term Loan, (Canada), VAR, 5.530%, 04/01/22 | | | 6,712 | |
| | | | | | | | |
| | | | | | | 54,830 | |
| | | | | | | | |
| | | | Total Health Care | | | 195,918 | |
| | | | | | | | |
SEE NOTES TO FINANCIAL STATEMENTS.
| | | | | | |
| | | |
| 8 | | | | J.P. MORGAN INCOME FUNDS | | FEBRUARY 28, 2017 |
| | | | | | | | |
PRINCIPAL
AMOUNT($) | | | SECURITY DESCRIPTION | |
VALUE($) | |
| | Loan Assignments — continued | |
| | | | Industrials — 9.3% | |
| | | | Aerospace & Defense — 0.6% | |
| | 2,722 | | | Transdigm Group, Inc., 1st Lien Term Loan D, VAR, 3.983%, 06/04/21 | | | 2,732 | |
| | 2,724 | | | Transdigm Group, Inc., 1st Lien Term Loan E, VAR, 3.852%, 05/16/22 | | | 2,734 | |
| | 6,971 | | | Transdigm Group, Inc., Tranche F Term Loan, VAR, 3.781%, 06/09/23 | | | 7,005 | |
| | | | | | | | |
| | | | | | | 12,471 | |
| | | | | | | | |
| | | | Air Freight & Logistics — 0.5% | |
| | 10,123 | | | XPO Logistics, Inc., Term loan, VAR, 4.250%, 10/31/21 | | | 10,205 | |
| | | | | | | | |
| | | | Airlines — 1.0% | | | | |
| | 19,250 | | | American Airlines, Inc., Term Loan B, VAR, 3.270%, 12/14/23 | | | 19,346 | |
| | 1,429 | | | Delta Air Lines, Inc., Term Loan B-1, VAR, 3.273%, 10/18/18 | | | 1,437 | |
| | | | | | | | |
| | | | | | | 20,783 | |
| | | | | | | | |
| | | | Building Products — 1.1% | |
| | 8,826 | | | Continental Building Products, Inc., Term Loan B, VAR, 3.281%, 08/18/23 | | | 8,892 | |
| | 5,318 | | | Jeld-Wen, Inc., Consolidated Term Loan B, VAR, 4.750%, 07/01/22 | | | 5,351 | |
| | 10,023 | | | Summit Materials Co. I LLC, Term Loan, VAR, 3.853%, 07/18/22 | | | 10,132 | |
| | | | | | | | |
| | | | | | | 24,375 | |
| | | | | | | | |
| | | | Commercial Services & Supplies — 3.4% | |
| | 3,292 | | | Advanced Disposal Services, Inc., Term Loan B, VAR, 3.500%, 11/10/23 | | | 3,324 | |
| | 7,078 | | | Camelot Finance LP, 1st Lien Term Loan B, VAR, 4.750%, 10/03/23 | | | 7,157 | |
| | 2,018 | | | Garda World Security Corp., Term B Delayed Draw Loan, (Canada), VAR, 4.000%, 11/06/20 | | | 2,025 | |
| | 12,633 | | | Garda World Security Corp., Term B Loan, (Canada), VAR, 4.000%, 11/06/20 | | | 12,680 | |
| | 4,200 | | | Harland Clarke Holdings Corp., 1st Lien Term Loan B5, VAR, 7.000%, 12/31/21 ^ | | | 4,239 | |
| | 1,168 | | | Packers Holdings LLC, Initial Term Loan, VAR, 4.750%, 12/02/21 | | | 1,186 | |
| | 29,689 | | | Prime Security Services Borrower LLC, Term B-1 Loan, VAR, 4.250%, 05/02/22 | | | 29,962 | |
| | 5,100 | | | Tribe Buyer LLC, 1st Lien Term Loan, VAR, 5.500%, 02/08/24 | | | 5,074 | |
| | 2,200 | | | Tribe Buyer LLC, 2nd Lien Term Loan, VAR, 11.000%, 02/08/25 | | | 2,156 | |
| | | | | | | | |
PRINCIPAL
AMOUNT($) | | | SECURITY DESCRIPTION | |
VALUE($) | |
| | |
| | | | Commercial Services & Supplies — continued | |
| | 5,933 | | | University Support Services LLC, 1st Lien Term Loan B, VAR, 6.250%, 07/06/22 ^ | | | 5,999 | |
| | | | | | | | |
| | | | | | | 73,802 | |
| | | | | | | | |
| | | | Electrical Equipment — 0.3% | |
| | 7,760 | | | Cortes NP Acquisition Corp., 1st Lien Term Loan B, VAR, 6.030%, 11/30/23 | | | 7,815 | |
| | | | | | | | |
| | | | Industrial Conglomerates — 0.4% | | | | |
| | 8,747 | | | Hudson Products Holdings, Inc., Term Loan, VAR, 5.000%, 03/15/19 | | | 8,398 | |
| | | | | | | | |
| | | | Machinery — 1.9% | | | | |
| | 16,286 | | | Gates Global LLC, Initial Dollar Term Loan, VAR, 4.250%, 07/06/21 | | | 16,288 | |
| | 9,864 | | | Onex Wizard Acquisition Co. II S.C.A., Initial Dollar Term Loan, (Luxembourg), VAR, 4.000%, 03/11/22 | | | 9,969 | |
| | 4,740 | | | Piscine US Acquisition LLC, 1st Lien Term Loan, VAR, 5.500%, 12/12/23 | | | 4,773 | |
| | 9,502 | | | Rexnord LLC/RBS Global Inc., Term Loan B, VAR, 3.770%, 08/21/23 | | | 9,554 | |
| | | | | | | | |
| | | | | | | 40,584 | |
| | | | | | | | |
| | | | Marine — 0.1% | |
| | 1,867 | | | Drillships Ocean Ventures, Inc., Term Loan, VAR, 5.563%, 07/25/21 | | | 1,726 | |
| | | | | | | | |
| | | | Total Industrials | | | 200,159 | |
| | | | | | | | |
| | | | Information Technology — 10.0% | | | | |
| | | | Communications Equipment — 1.2% | | | | |
| | 3,370 | | | Avaya, Inc., DIP Term Loan, VAR, 4.983%, 01/19/18 (d) | | | 3,477 | |
| | 26,626 | | | Avaya, Inc., Term Loan B-7, VAR, 6.282%, 05/29/20 (d) | | | 21,255 | |
| | | | | | | | |
| | | | | | | 24,732 | |
| | | | | | | | |
| | | | Internet Software & Services — 0.5% | | | | |
| | 4,455 | | | Genesys Telecommunications Laboratories, Inc., Term Loan B, VAR, 5.025%, 12/01/23 | | | 4,506 | |
| | 6,625 | | | GoDaddy, Inc., Term Loan B, VAR, 3.270%, 02/03/24 ^ | | | 6,639 | |
| | | | | | | | |
| | | | | | | 11,145 | |
| | | | | | | | |
| | | | IT Services — 2.6% | |
| | | | First Data Corp., Term Loan, | | | | |
| | 28,142 | | | VAR, 3.779%, 03/24/21 | | | 28,384 | |
| | 11,106 | | | VAR, 3.779%, 07/08/22 | | | 11,178 | |
| | 1,980 | | | Global Payments, Inc., Term Loan B, VAR, 3.281%, 04/22/23 | | | 2,000 | |
| | 4,904 | | | Optiv Security, Inc., 1st Lien Term Loan, VAR, 4.250%, 01/13/24 | | | 4,933 | |
SEE NOTES TO FINANCIAL STATEMENTS.
| | | | | | | | |
| | | |
| FEBRUARY 28, 2017 | | J.P. MORGAN INCOME FUNDS | | | | | 9 | |
JPMorgan Floating Rate Income Fund
SCHEDULE OF PORTFOLIO INVESTMENTS
AS OF FEBRUARY 28, 2017 (Unaudited) (continued)
(Amounts in thousands)
| | | | | | | | |
PRINCIPAL
AMOUNT($) | | | SECURITY DESCRIPTION | |
VALUE($) | |
| | Loan Assignments — continued | |
| | | | IT Services — continued | |
| | 4,000 | | | Optiv Security, Inc., 2nd Lien Term Loan, VAR, 8.250%, 01/13/25 | | | 4,048 | |
| | 5,225 | | | SMS Systems Maintenance Services, Inc., Term Loan B, VAR, 6.000%, 10/30/23 ^ | | | 5,234 | |
| | | | | | | | |
| | | | | | | 55,777 | |
| | | | | | | | |
| | | | Semiconductors & Semiconductor Equipment — 1.7% | |
| | 9,995 | | | Micron Technology, Inc., Term Loan B, VAR, 4.540%, 04/26/22 | | | 10,121 | |
| | 8,043 | | | Microsemi Corp., Closing Date Term B Loan, VAR, 3.031%, 01/15/23 ^ | | | 8,098 | |
| | 13,606 | | | ON Semiconductor Corp., 1st Lien Term Loan B, VAR, 4.031%, 03/31/23 | | | 13,722 | |
| | 5,277 | | | Versum Materials, Inc., Senior Secured Term Loan B, VAR, 3.498%, 09/22/23 | | | 5,339 | |
| | | | | | | | |
| | | | | | | 37,280 | |
| | | | | | | | |
| | | | Software — 2.5% | |
| | 7,265 | | | Inception Merger Sub, Inc./Rackspace Hosting, Inc., 1st Lien Term Loan B, VAR, 4.534%, 11/03/23 | | | 7,342 | |
| | 9,722 | | | Infor US, Inc., Tranche B-6 Term Loan, VAR, 3.750%, 02/01/22 | | | 9,729 | |
| | 5,911 | | | Landesk Software Group, Inc., 1st Lien Term Loan, VAR, 5.250%, 01/18/24 | | | 5,940 | |
| | 1,885 | | | Landesk Software Group, Inc., 2nd Lien Term Loan, VAR, 10.000%, 01/18/25 | | | 1,863 | |
| | 5,250 | | | Salient CRGT, Inc., Term Loan B, VAR, 6.750%, 02/24/22 ^ | | | 5,158 | |
| | 13,571 | | | SolarWinds, Inc., 1st Lien Term Loan, VAR, 4.500%, 02/03/23 ^ | | | 13,633 | |
| | 4,566 | | | Solera LLC, Dollar Term Loan, VAR, 5.750%, 03/03/23 | | | 4,590 | |
| | 5,345 | | | SS&C Technologies Holdings, Inc., Term B-1 Loan, VAR, 4.031%, 07/08/22 | | | 5,370 | |
| | 513 | | | SS&C Technologies Holdings, Inc., Term B-2 Loan, VAR, 4.031%, 07/08/22 | | | 515 | |
| | | | | | | | |
| | | | | | | 54,140 | |
| | | | | | | | |
| | | | Technology Hardware, Storage & Peripherals — 1.5% | |
| | 16,658 | | | Dell Inc. 1st Lien Term Loan B, VAR, 4.040%, 06/02/23 | | | 16,760 | |
| | 5,471 | | | Dell Software Group, Term Loan, VAR, 7.000%, 09/15/22 | | | 5,564 | |
| | 5,420 | | | Radiate Holdco LLC, Term Loan, VAR, 3.781%, 12/12/23 | | | 5,460 | |
| | 4,677 | | | Western Digital Corp., Term Loan B, VAR, 4.529%, 04/29/23 | | | 4,701 | |
| | | | | | | | |
| | | | | | | 32,485 | |
| | | | | | | | |
| | | | Total Information Technology | | | 215,559 | |
| | | | | | | | |
| | | | | | | | |
PRINCIPAL
AMOUNT($) | | | SECURITY DESCRIPTION | |
VALUE($) | |
| | | | | | | | |
| | | | Materials — 5.1% | |
| | | | Chemicals — 1.1% | |
| | 2,075 | | | Axalta Coating Systems US Holdings, Inc., Term Loan, VAR, 3.498%, 02/01/20 | | | 2,101 | |
| | 3,682 | | | GCP Applied Technologies, Inc., 1st Lien Term Loan, VAR, 4.248%, 02/03/22 | | | 3,721 | |
| | 4,237 | | | Gemini HDPE LLC, Advance, VAR, 4.039%, 08/06/21 | | | 4,290 | |
| | 4,054 | | | New Arclin US Holding Corp., Term Loan, VAR, 5.250%, 02/15/24 | | | 4,100 | |
| | 9,175 | | | PolyOne Corp., Term B-2 Loan, VAR, 3.030%, 11/11/22 | | | 9,232 | |
| | | | | | | | |
| | | | | | | 23,444 | |
| | | | | | | | |
| | | | Construction Materials — 1.6% | |
| | 18,529 | | | Forterra Finance LLC, 1st Lien Term Loan, VAR, 4.500%, 10/18/23 | | | 18,705 | |
| | 8,953 | | | Headwaters, Inc., Term Loan B, VAR, 4.000%, 03/24/22 | | | 8,977 | |
| | 7,471 | | | Quikrete Holdings, Inc., Term Loan B, VAR, 4.022%, 11/15/23 | | | 7,557 | |
| | | | | | | | |
| | | | | | | 35,239 | |
| | | | | | | | |
| | | | Containers & Packaging — 1.9% | |
| | 3,557 | | | Ardagh Holdings USA, Inc., New Term Loan, VAR, 4.009%, 12/17/19 | | | 3,566 | |
| | 7,070 | | | Berry Plastics Corp., Term Loan I, VAR, 3.281%, 10/01/22 | | | 7,118 | |
| | 6,364 | | | Berry Plastics Corp., Term Loan J, VAR, 3.281%, 01/20/24 | | | 6,402 | |
| | 2,509 | | | Berry Plastics Corp., Term Loan K, VAR, 3.022%, 02/08/20 | | | 2,521 | |
| | 3,226 | | | Berry Plastics Corp., Term Loan L, VAR, 3.022%, 01/06/21 | | | 3,241 | |
| | 1,590 | | | HLX PLY Holdings, Inc., Term Loan, VAR, 4.250%, 12/29/23 | | | 1,601 | |
| | 10,301 | | | Reynolds Group Holdings, Inc., Term Loan, VAR, 3.781%, 02/05/23 | | | 10,378 | |
| | 7,070 | | | Viskase Corp., Inc., Initial Term Loan, VAR, 4.377%, 01/30/21 | | | 6,822 | |
| | | | | | | | |
| | | | | | | 41,649 | |
| | | | | | | | |
| | | | Metals & Mining — 0.4% | |
| | 7,542 | | | FMG Resources Pty, Ltd. (Fortescue Metals Group), Term Loan B, (Australia), VAR, 3.750%, 06/30/19 | | | 7,586 | |
| | | | | | | | |
| | | | Paper & Forest Products — 0.1% | |
| | 2,314 | | | Unifrax I LLC/Unifrax Holding Co., Term Loan, VAR, 3.250%, 11/28/18 | | | 2,307 | |
| | | | | | | | |
| | | | Total Materials | | | 110,225 | |
| | | | | | | | |
SEE NOTES TO FINANCIAL STATEMENTS.
| | | | | | |
| | | |
| 10 | | | | J.P. MORGAN INCOME FUNDS | | FEBRUARY 28, 2017 |
| | | | | | | | |
PRINCIPAL
AMOUNT($) | | | SECURITY DESCRIPTION | |
VALUE($) | |
| | Loan Assignments — continued | |
| | | | Real Estate — 0.4% | |
| | | | Equity Real Estate Investment Trusts (REITs) — 0.4% | |
| | 7,632 | | | MGM Growth Properties, Term Loan B, VAR, 3.281%, 04/25/23 | | | 7,692 | |
| | | | | | | | |
| | | | Real Estate Management & Development — 0.0% (g) | |
| | 222 | | | CityCenter Holdings LLC, Term B Loan, VAR, 3.750%, 10/16/20 | | | 224 | |
| | | | | | | | |
| | | | Total Real Estate | | | 7,916 | |
| | | | | | | | |
| | | | Telecommunication Services — 4.6% | | | | |
| | | | Diversified Telecommunication Services — 3.8% | |
| | 3,588 | | | Cincinnati Bell, Inc., Term Loan, VAR, 4.000%, 09/10/20 | | | 3,616 | |
| | 9,037 | | | Consolidated Communications, Inc., Term Loan B, VAR, 4.000%, 09/27/23 | | | 9,089 | |
| | 2,033 | | | Consolidated Communications, Inc., Term Loan B-2, VAR, 4.000%, 10/05/23 ^ | | | 2,045 | |
| | 22,005 | | | Intelsat Jackson Holdings SA, Tranche B-2 Term Loan, (Luxembourg), VAR, 3.750%, 06/30/19 ^ | | | 21,855 | |
| | 27,300 | | | Level 3 Financing, Inc., Tranche B Term Loan, VAR, 02/15/24 ^ | | | 27,427 | |
| | 11,846 | | | Zayo Group LLC, 1st Lien Term Loan B, VAR, 3.500%, 01/12/24 ^ | | | 11,957 | |
| | 5,704 | | | Zayo Group LLC, Term B-3 Loan, VAR, 3.500%, 01/29/24 ^ | | | 5,757 | |
| | | | | | | | |
| | | | | | | 81,746 | |
| | | | | | | | |
| | | | Wireless Telecommunication Services — 0.8% | |
| | 10,075 | | | Sprint Communications, Inc., 1st Lien Term Loan B, VAR, 3.313%, 02/02/24 ^ | | | 10,089 | |
| | 1,192 | | | Syniverse Holdings, Inc., Initial Term Loan, VAR, 4.039%, 04/23/19 | | | 1,086 | |
| | 6,066 | | | Syniverse Holdings, Inc., Tranche B Term Loan, VAR, 4.000%, 04/23/19 | | | 5,481 | |
| | | | | | | | |
| | | | | | | 16,656 | |
| | | | | | | | |
| | | | Total Telecommunication Services | | | 98,402 | |
| | | | | | | | |
| | | | Utilities — 6.7% | |
| | | | Electric Utilities — 3.6% | |
| | 31,507 | | | Calpine Construction Finance Co., Term B-1 Loan, VAR, 3.030%, 05/03/20 | | | 31,494 | |
| | 5,000 | | | Energy Future Intermediate Holding Co. LLC, Term Loan, VAR, 4.304%, 06/30/17 | | | 5,013 | |
| | 4,350 | | | Homer City Generation LP, 1st Lien Term Loan B, VAR, 9.250%, 02/15/23 ^ | | | 4,263 | |
| | 8,729 | | | InterGen NV, Term Advance, VAR, 5.500%, 06/15/20 | | | 8,718 | |
| | | | | | | | |
PRINCIPAL
AMOUNT($) | | | SECURITY DESCRIPTION | |
VALUE($) | |
| | |
| | | | Electric Utilities — continued | |
| | 22,189 | | | Texas Competitive Electric Holdings Co. LLC, Term Loan, VAR, 3.531%, 08/04/23 | | | 22,289 | |
| | 5,061 | | | Texas Competitive Electric Holdings Co. LLC, Term Loan C, VAR, 3.531%, 08/04/23 | | | 5,083 | |
| | | | | | | | |
| | | | | | | 76,860 | |
| | | | | | | | |
| | | | Independent Power & Renewable Electricity Producers — 3.1% | |
| | | | Calpine Corp., Term Loan, | | | | |
| | 17,049 | | | VAR, 2.600%, 12/26/19 | | | 17,031 | |
| | 9,468 | | | VAR, 3.750%, 05/27/22 | | | 9,512 | |
| | 20,870 | | | Dynegy, Inc., Term Loan, VAR, 4.250%, 01/12/24 ^ | | | 21,077 | |
| | 18,155 | | | NRG Energy, Inc., Term Loan, VAR, 3.031%, 06/30/23 ^ | | | 18,213 | |
| | | | | | | | |
| | | | | | | 65,833 | |
| | | | | | | | |
| | | | Total Utilities | | | 142,693 | |
| | | | | | | | |
| | | | Total Loan Assignments
(Cost $1,686,605) | | | 1,668,994 | |
| | | | | | | | |
| | |
NUMBER
OF RIGHT | | | | | | |
| | Right — 0.0% (g) | |
| | | | Utilities — 0.0% (g) | |
| | | | Electric Utilities — 0.0% (g) | |
| | 1,250 | | | Vistra Energy Corp., expiring 12/31/49 (a)
(Cost $—) | | | 1,502 | |
| | | | | | | | |
| | |
| SHARES | | | | | | |
| | Short-Term Investment — 16.5% | |
| | | | Investment Company — 16.5% | |
| | 352,644 | | | JPMorgan U.S. Government Money Market Fund, Institutional Class Shares, 0.450% (b) (l)
(Cost $352,644) | | | 352,644 | |
| | | | | | | | |
| | | | Total Investments — 110.4%
(Cost $2,381,237) | | | 2,367,727 | |
| | | | Liabilities in Excess of Other Assets — (10.4)% | | | (224,222 | ) |
| | | | | | | | |
| | | | NET ASSETS — 100.0% | | $ | 2,143,505 | |
| | | | | | | | |
Percentages indicated are based on net assets.
SEE NOTES TO FINANCIAL STATEMENTS.
| | | | | | | | |
| | | |
| FEBRUARY 28, 2017 | | J.P. MORGAN INCOME FUNDS | | | | | 11 | |
JPMorgan Floating Rate Income Fund
NOTES TO SCHEDULE OF PORTFOLIO INVESTMENTS
AS OF FEBRUARY 28, 2017 (Unaudited)
| | |
| DIP | | — Debtor-in-possession |
| Reg. S | | — Security was purchased pursuant to Regulation S under the Securities Act of 1933, which exempts from registration securities offered and sold outside of the United States. Such a security cannot be sold in the United States without either an effective registration statement filed pursuant to the Securities Act of 1933, or pursuant to an exemption from registration. |
| VAR | | — Variable Rate Security. The interest rate shown is the rate in effect as of February 28, 2017. |
| (a) | | — Non-income producing security. |
| (b) | | — Investment in affiliate. Money market fund is registered under the Investment Company Act of 1940, as amended, and advised by J.P. Morgan Investment Management Inc. |
| (d) | | — Defaulted Security. Security has not paid its last interest payment and/or interest is not being accrued. |
| (e) | | — Security is exempt from registration under Rule 144A of the Securities Act of 1933, as amended. Unless otherwise indicated, this security has been determined to be liquid under procedures established by the Board of Trustees and may be resold in transactions exempt from registration, normally to qualified institutional buyers. |
| | |
| (g) | | — Amount rounds to less than 0.05%. |
| (h) | | — Amount rounds to less than 500. |
| (l) | | — The rate shown is the current yield as of February 28, 2017. |
| @ | | — The date shown reflects the next call date on which the issuer may redeem the security. The coupon rate for this security is currently in effect as of February 28, 2017. |
| ^ | | — All or a portion of the security is unsettled as of February 28, 2017. Unless otherwise indicated, the coupon rate is undetermined. The coupon rate shown may not be accrued for the entire position. |
SEE NOTES TO FINANCIAL STATEMENTS.
| | | | | | |
| | | |
| 12 | | | | J.P. MORGAN INCOME FUNDS | | FEBRUARY 28, 2017 |
THIS PAGE IS INTENTIONALLY LEFT BLANK
| | | | | | | | |
| | | |
| FEBRUARY 28, 2017 | | J.P. MORGAN INCOME FUNDS | | | | | 13 | |
STATEMENT OF ASSETS AND LIABILITIES
AS OF FEBRUARY 28, 2017 (Unaudited)
(Amounts in thousands, except per share amounts)
| | | | |
| | |
Floating Rate
Income Fund | |
ASSETS: | |
Investments in non-affiliates, at value | | $ | 2,015,083 | |
Investments in affiliates, at value | | | 352,644 | |
| | | | |
Total investment securities, at value | | | 2,367,727 | |
Cash | | | 2,378 | |
Foreign currency, at value | | | 1 | |
Receivables: | | | | |
Investment securities sold | | | 13,150 | |
Fund shares sold | | | 20,376 | |
Interest from non-affiliates | | | 9,432 | |
Dividends from affiliates | | | 119 | |
Tax reclaims | | | 354 | |
Unrealized appreciation on unfunded commitments | | | 99 | |
| | | | |
Total Assets | | | 2,413,636 | |
| | | | |
|
LIABILITIES: | |
Payables: | | | | |
Investment securities purchased | | | 267,862 | |
Fund shares redeemed | | | 1,023 | |
Accrued liabilities: | | | | |
Investment advisory fees | | | 827 | |
Administration fees | | | 126 | |
Distribution fees | | | 37 | |
Shareholder servicing fees | | | 86 | |
Custodian and accounting fees | | | 25 | |
Trustees’ and Chief Compliance Officer’s fees | | | 5 | |
Other | | | 140 | |
| | | | |
Total Liabilities | | | 270,131 | |
| | | | |
Net Assets | | $ | 2,143,505 | |
| | | | |
SEE NOTES TO FINANCIAL STATEMENTS.
| | | | | | |
| | | |
| 14 | | | | J.P. MORGAN INCOME FUNDS | | FEBRUARY 28, 2017 |
| | | | |
| | |
Floating Rate
Income Fund | |
NET ASSETS: | |
Paid-in-Capital | | $ | 2,317,853 | |
Accumulated undistributed (distributions in excess of) net investment income | | | 271 | |
Accumulated net realized gains (losses) | | | (161,208 | ) |
Net unrealized appreciation (depreciation) | | | (13,411 | ) |
| | | | |
Total Net Assets | | $ | 2,143,505 | |
| | | | |
|
Net Assets: | |
Class A | | $ | 106,878 | |
Class C | | | 28,630 | |
Class R6 | | | 915,277 | |
Class I (formerly Select Class) | | | 1,092,720 | |
| | | | |
Total | | $ | 2,143,505 | |
| | | | |
|
Outstanding units of beneficial interest (shares) | |
($0.0001 par value; unlimited number of shares authorized): | | | | |
Class A | | | 11,275 | |
Class C | | | 3,029 | |
Class R6 | | | 96,523 | |
Class I (formerly Select Class) | | | 115,233 | |
| |
Net Asset Value (a): | | | | |
Class A — Redemption price per share | | $ | 9.48 | |
Class C — Offering price per share (b) | | | 9.45 | |
Class R6 — Offering and redemption price per share | | | 9.48 | |
Class I (formerly Select Class) — Offering and redemption price per share | | | 9.48 | |
Class A maximum sales charge | | | 2.25 | % |
Class A maximum public offering price per share
[net asset value per share/(100% — maximum sales charge)] | | $ | 9.70 | |
| | | | |
| |
Cost of investments in non-affiliates | | $ | 2,028,593 | |
Cost of investments in affiliates | | | 352,644 | |
Cost of foreign currency | | | 2 | |
| (a) | Per share amounts may not recalculate due to rounding of net assets and/or shares outstanding. |
| (b) | Redemption price for Class C Shares varies based upon length of time the shares are held. |
SEE NOTES TO FINANCIAL STATEMENTS.
| | | | | | | | |
| | | |
| FEBRUARY 28, 2017 | | J.P. MORGAN INCOME FUNDS | | | | | 15 | |
STATEMENT OF OPERATIONS
FOR THE SIX MONTHS PERIOD ENDED FEBRUARY 28, 2017 (Unaudited)
(Amounts in thousands)
| | | | |
| | |
Floating Rate
Income Fund | |
INVESTMENT INCOME: | |
Interest income from non-affiliates | | $ | 43,330 | |
Interest income from affiliates | | | 1 | |
Dividend income from non-affiliates | | | 3,235 | |
Dividend income from affiliates | | | 381 | |
| | | | |
Total investment income | | | 46,947 | |
| | | | |
|
EXPENSES: | |
Investment advisory fees | | | 5,086 | |
Administration fees | | | 757 | |
Distribution fees: | | | | |
Class A | | | 113 | |
Class C | | | 93 | |
Shareholder servicing fees: | | | | |
Class A | | | 113 | |
Class C | | | 31 | |
Class I (formerly Select Class) | | | 1,131 | |
Custodian and accounting fees | | | 93 | |
Professional fees | | | 61 | |
Trustees’ and Chief Compliance Officer’s fees | | | 19 | |
Printing and mailing costs | | | 18 | |
Transfer agency fees (See Note 2.G.) | | | 13 | |
Sub-transfer agency fees (See Note 2.G.) | | | 28 | |
Other | | | 24 | |
| | | | |
Total expenses | | | 7,580 | |
| | | | |
Less fees waived | | | (989 | ) |
Less earnings credits | | | (1 | ) |
| | | | |
Net expenses | | | 6,590 | |
| | | | |
Net investment income (loss) | | | 40,357 | |
| | | | |
| |
REALIZED/UNREALIZED GAINS (LOSSES): | | | | |
Net realized gain (loss) on transactions from: | |
Investments in non-affiliates | | | (42,745 | ) |
Change in net unrealized appreciation/depreciation on: | | | | |
Investments in non-affiliates | | | 65,572 | |
Foreign currency translations | | | — | (a) |
Unfunded commitments | | | 99 | |
| | | | |
Change in net unrealized appreciation/depreciation | | | 65,671 | |
| | | | |
Net realized/unrealized gains (losses) | | | 22,926 | |
| | | | |
Change in net assets resulting from operations | | $ | 63,283 | |
| | | | |
| (a) | Amount rounds to less than 500. |
SEE NOTES TO FINANCIAL STATEMENTS.
| | | | | | |
| | | |
| 16 | | | | J.P. MORGAN INCOME FUNDS | | FEBRUARY 28, 2017 |
STATEMENT OF CHANGES IN NET ASSETS
FOR THE PERIODS INDICATED
(Amounts in thousands)
| | | | | | | | |
| | | Floating Rate Income Fund | |
| | | Six Months Ended
February 28, 2017
(Unaudited) | | | Year Ended
August 31, 2016 | |
CHANGE IN NET ASSETS RESULTING FROM OPERATIONS: | |
Net investment income (loss) | | $ | 40,357 | | | $ | 89,591 | |
Net realized gain (loss) | | | (42,745 | ) | | | (86,271 | ) |
Change in net unrealized appreciation/depreciation | | | 65,671 | | | | 27,758 | |
| | | | | | | | |
Change in net assets resulting from operations | | | 63,283 | | | | 31,078 | |
| | | | | | | | |
|
DISTRIBUTIONS TO SHAREHOLDERS: | |
Class A | | | | | | | | |
From net investment income | | | (1,883 | ) | | | (3,571 | ) |
Class C | | | | | | | | |
From net investment income | | | (452 | ) | | | (902 | ) |
Class R6 | | | | | | | | |
From net investment income | | | (18,379 | ) | | | (35,032 | ) |
Class I (formerly Select Class) | | | | | | | | |
From net investment income | | | (19,797 | ) | | | (50,890 | ) |
| | | | | | | | |
Total distributions to shareholders | | | (40,511 | ) | | | (90,395 | ) |
| | | | | | | | |
|
CAPITAL TRANSACTIONS: | |
Change in net assets resulting from capital transactions | | | 309,434 | | | | (580,069 | ) |
| | | | | | | | |
|
NET ASSETS: | |
Change in net assets | | | 332,206 | | | | (639,386 | ) |
Beginning of period | | | 1,811,299 | | | | 2,450,685 | |
| | | | | | | | |
End of period | | $ | 2,143,505 | | | $ | 1,811,299 | |
| | | | | | | | |
Accumulated undistributed (distributions in excess of) net investment income | | $ | 271 | | | $ | 425 | |
| | | | | | | | |
SEE NOTES TO FINANCIAL STATEMENTS.
| | | | | | | | |
| | | |
| FEBRUARY 28, 2017 | | J.P. MORGAN INCOME FUNDS | | | | | 17 | |
STATEMENT OF CHANGES IN NET ASSETS
FOR THE PERIODS INDICATED (continued)
(Amounts in thousands)
| | | | | | | | |
| | | Floating Rate Income Fund | |
| | | Six Months Ended
February 28, 2017
(Unaudited) | | | Year Ended
August 31, 2016 | |
CAPITAL TRANSACTIONS: | | | | | | | | |
Class A | | | | | | | | |
Proceeds from shares issued | | $ | 44,364 | | | $ | 41,079 | |
Distributions reinvested | | | 1,882 | | | | 3,571 | |
Cost of shares redeemed | | | (23,821 | ) | | | (45,374 | ) |
| | | | | | | | |
Change in net assets resulting from Class A capital transactions | | $ | 22,425 | | | $ | (724 | ) |
| | | | | | | | |
Class C | | | | | | | | |
Proceeds from shares issued | | $ | 9,427 | | | $ | 5,536 | |
Distributions reinvested | | | 443 | | | | 889 | |
Cost of shares redeemed | | | (3,478 | ) | | | (10,483 | ) |
| | | | | | | | |
Change in net assets resulting from Class C capital transactions | | $ | 6,392 | | | $ | (4,058 | ) |
| | | | | | | | |
Class R6 | | | | | | | | |
Proceeds from shares issued | | $ | 111,153 | | | $ | 560,102 | |
Distributions reinvested | | | 16,268 | | | | 29,261 | |
Cost of shares redeemed | | | (60,102 | ) | | | (135,113 | ) |
| | | | | | | | |
Change in net assets resulting from Class R6 capital transactions | | $ | 67,319 | | | $ | 454,250 | |
| | | | | | | | |
Class I (formerly Select Class) | | | | | | | | |
Proceeds from shares issued | | $ | 320,240 | | | $ | 171,842 | |
Distributions reinvested | | | 1,840 | | | | 7,700 | |
Cost of shares redeemed | | | (108,782 | ) | | | (1,209,079 | ) |
| | | | | | | | |
Change in net assets resulting from Class I capital transactions | | $ | 213,298 | | | $ | (1,029,537 | ) |
| | | | | | | | |
Total change in net assets resulting from capital transactions | | $ | 309,434 | | | $ | (580,069 | ) |
| | | | | | | | |
| | |
SHARE TRANSACTIONS: | | | | | | | | |
Class A | | | | | | | | |
Issued | | | 4,713 | | | | 4,441 | |
Reinvested | | | 200 | | | | 388 | |
Redeemed | | | (2,528 | ) | | | (4,916 | ) |
| | | | | | | | |
Change in Class A Shares | | | 2,385 | | | | (87 | ) |
| | | | | | | | |
Class C | | | | | | | | |
Issued | | | 1,002 | | | | 598 | |
Reinvested | | | 47 | | | | 97 | |
Redeemed | | | (370 | ) | | | (1,138 | ) |
| | | | | | | | |
Change in Class C Shares | | | 679 | | | | (443 | ) |
| | | | | | | | |
Class R6 | | | | | | | | |
Issued | | | 11,734 | | | | 60,095 | |
Reinvested | | | 1,726 | | | | 3,189 | |
Redeemed | | | (6,365 | ) | | | (14,781 | ) |
| | | | | | | | |
Change in Class R6 Shares | | | 7,095 | | | | 48,503 | |
| | | | | | | | |
Class I (formerly Select Class) | | | | | | | | |
Issued | | | 33,835 | | | | 18,718 | |
Reinvested | | | 195 | | | | 829 | |
Redeemed | | | (11,521 | ) | | | (130,329 | ) |
| | | | | | | | |
Change in Class I Shares | | | 22,509 | | | | (110,782 | ) |
| | | | | | | | |
SEE NOTES TO FINANCIAL STATEMENTS.
| | | | | | |
| | | |
| 18 | | | | J.P. MORGAN INCOME FUNDS | | FEBRUARY 28, 2017 |
THIS PAGE IS INTENTIONALLY LEFT BLANK
| | | | | | | | |
| | | |
| FEBRUARY 28, 2017 | | J.P. MORGAN INCOME FUNDS | | | | | 19 | |
FINANCIAL HIGHLIGHTS
FOR THE PERIODS INDICATED
| | | | | | | | | | | | | | | | | | | | | | | | | | | | |
| | | | | | Per share operating performance | |
| | | | | | Investment operations | | | Distributions | |
| | | Net asset
value,
beginning
of period | | | Net
investment
income
(loss) | | | Net realized
and unrealized
gains
(losses) on
investments | | | Total from
investment
operations | | | Net
investment
income | | | Net
realized
gain | | | Total
distributions | |
Floating Rate Income Fund | | | | | | | | | | | | | | | | | | | | | | | | | | | | |
Class A | | | | | | | | | | | | | | | | | | | | | | | | | | | | |
Six Months Ended February 28, 2017 (Unaudited) | | $ | 9.36 | | | $ | 0.19 | (f) | | $ | 0.12 | | | $ | 0.31 | | | $ | (0.19 | ) | | $ | — | | | $ | (0.19 | ) |
Year Ended August 31, 2016 | | | 9.56 | | | | 0.40 | (f) | | | (0.20 | ) | | | 0.20 | | | | (0.40 | ) | | | — | | | | (0.40 | ) |
Year Ended August 31, 2015 | | | 10.04 | | | | 0.38 | (f) | | | (0.47 | ) | | | (0.09 | ) | | | (0.39 | ) | | | — | (g) | | | (0.39 | ) |
Year Ended August 31, 2014 | | | 10.02 | | | | 0.39 | (h) | | | 0.02 | | | | 0.41 | | | | (0.38 | ) | | | (0.01 | ) | | | (0.39 | ) |
Year Ended August 31, 2013 | | | 9.89 | | | | 0.43 | | | | 0.14 | | | | 0.57 | | | | (0.43 | ) | | | (0.01 | ) | | | (0.44 | ) |
Year Ended August 31, 2012 | | | 9.41 | | | | 0.47 | (f) | | | 0.44 | | | | 0.91 | | | | (0.43 | ) | | | — | (g) | | | (0.43 | ) |
| | | | | | | |
Class C | | | | | | | | | | | | | | | | | | | | | | | | | | | | |
Six Months Ended February 28, 2017 (Unaudited) | | | 9.34 | | | | 0.17 | (f) | | | 0.11 | | | | 0.28 | | | | (0.17 | ) | | | — | | | | (0.17 | ) |
Year Ended August 31, 2016 | | | 9.54 | | | | 0.35 | (f) | | | (0.19 | ) | | | 0.16 | | | | (0.36 | ) | | | — | | | | (0.36 | ) |
Year Ended August 31, 2015 | | | 10.02 | | | | 0.33 | (f) | | | (0.46 | ) | | | (0.13 | ) | | | (0.35 | ) | | | — | (g) | | | (0.35 | ) |
Year Ended August 31, 2014 | | | 10.01 | | | | 0.34 | (h) | | | 0.02 | | | | 0.36 | | | | (0.34 | ) | | | (0.01 | ) | | | (0.35 | ) |
Year Ended August 31, 2013 | | | 9.88 | | | | 0.40 | | | | 0.13 | | | | 0.53 | | | | (0.39 | ) | | | (0.01 | ) | | | (0.40 | ) |
Year Ended August 31, 2012 | | | 9.41 | | | | 0.44 | (f) | | | 0.42 | | | | 0.86 | | | | (0.39 | ) | | | — | (g) | | | (0.39 | ) |
| | | | | | | |
Class R6 | | | | | | | | | | | | | | | | | | | | | | | | | | | | |
Six Months Ended February 28, 2017 (Unaudited) | | | 9.37 | | | | 0.21 | (f) | | | 0.11 | | | | 0.32 | | | | (0.21 | ) | | | — | | | | (0.21 | ) |
Year Ended August 31, 2016 | | | 9.57 | | | | 0.43 | (f) | | | (0.19 | ) | | | 0.24 | | | | (0.44 | ) | | | — | | | | (0.44 | ) |
Year Ended August 31, 2015 | | | 10.05 | | | | 0.41 | (f) | | | (0.46 | ) | | | (0.05 | ) | | | (0.43 | ) | | | — | (g) | | | (0.43 | ) |
October 31, 2013 (i) through August 31, 2014 | | | 10.10 | | | | 0.34 | (h) | | | (0.03 | )(j) | | | 0.31 | | | | (0.35 | ) | | | (0.01 | ) | | | (0.36 | ) |
| | | | | | | |
Class I (formerly Select Class) | | | | | | | | | | | | | | | | | | | | | | | | | | | | |
Six Months Ended February 28, 2017 (Unaudited) | | | 9.37 | | | | 0.20 | (f) | | | 0.11 | | | | 0.31 | | | | (0.20 | ) | | | — | | | | (0.20 | ) |
Year Ended August 31, 2016 | | | 9.57 | | | | 0.42 | (f) | | | (0.19 | ) | | | 0.23 | | | | (0.43 | ) | | | — | | | | (0.43 | ) |
Year Ended August 31, 2015 | | | 10.05 | | | | 0.40 | (f) | | | (0.46 | ) | | | (0.06 | ) | | | (0.42 | ) | | | — | (g) | | | (0.42 | ) |
Year Ended August 31, 2014 | | | 10.03 | | | | 0.42 | (h) | | | 0.02 | | | | 0.44 | | | | (0.41 | ) | | | (0.01 | ) | | | (0.42 | ) |
Year Ended August 31, 2013 | | | 9.89 | | | | 0.46 | | | | 0.15 | | | | 0.61 | | | | (0.46 | ) | | | (0.01 | ) | | | (0.47 | ) |
Year Ended August 31, 2012 | | | 9.41 | | | | 0.50 | (f) | | | 0.43 | | | | 0.93 | | | | (0.45 | ) | | | — | (g) | | | (0.45 | ) |
| (a) | Annualized for periods less than one year, unless otherwise noted. |
| (b) | Not annualized for periods less than one year. |
| (c) | Includes adjustments in accordance with accounting principles generally accepted in the United States of America and as such, the net asset values for financial reporting purposes and the returns based upon those net asset values may differ from the net asset values and returns for shareholder transactions. |
| (d) | Includes earnings credits and interest expense, if applicable, each of which is less than 0.005% unless otherwise noted. |
| (e) | Portfolio turnover is calculated by dividing the lesser of total purchases or sales of portfolio securities for the reporting period by the monthly average value of portfolio securities owned during the reporting period. Excluded from both the numerator and denominator are amounts relating to derivatives and securities whose maturities or expiration dates at the time of acquisition were one year or less. |
| (f) | Calculated based upon average shares outstanding. |
| (g) | Amount rounds to less than $0.005. |
| (h) | Net investment income (loss) may appear disproportionate among the classes due to the timing of recognition of income and changes in the relative size of the classes. |
| (i) | Commencement of offering of class of shares. |
| (j) | Calculation of the net realized and unrealized gains (losses) per share do not correlate with the Fund’s net realized and unrealized gains (losses) presented in the Statement of Operations due to the timing of capital transactions in relation to the fluctuating market values of the Fund’s investments. |
SEE NOTES TO FINANCIAL STATEMENTS.
| | | | | | |
| | | |
| 20 | | | | J.P. MORGAN INCOME FUNDS | | FEBRUARY 28, 2017 |
| | | | | | | | | | | | | | | | | | | | | | | | | | |
| | | Ratios/Supplemental data | |
| | | | | | | | | | Ratios to average net assets (a) | | | | |
Net asset
value,
end of
period | | | Total return
(excludes
sales charge) (b)(c) | | | Net assets,
end of
period
(000’s) | | | Net
expenses (d) | | | Net
investment
income
(loss) | | |
Expenses
without waivers,
reimbursements and
earnings credits | | | Portfolio
turnover
rate (b)(e) | |
| | | | | | | | | | | | | | | | | | | | | | | | | | |
| | | | | | | | | | | | | | | | | | | | | | | | | | |
| $ | 9.48 | | | | 3.36 | % | | $ | 106,878 | | | | 0.98 | % | | | 4.11 | % | | | 1.19 | % | | | 29 | % |
| | 9.36 | | | | 2.30 | | | | 83,254 | | | | 0.99 | | | | 4.29 | | | | 1.22 | | | | 41 | |
| | 9.56 | | | | (0.92 | ) | | | 85,854 | | | | 0.99 | | | | 3.85 | | | | 1.25 | | | | 16 | |
| | 10.04 | | | | 4.15 | | | | 168,575 | | | | 0.98 | | | | 3.85 | (h) | | | 1.15 | | | | 61 | |
| | 10.02 | | | | 5.90 | | | | 158,323 | | | | 0.97 | | | | 4.64 | | | | 1.16 | | | | 42 | |
| | 9.89 | | | | 9.82 | | | | 63,811 | | | | 0.97 | | | | 4.80 | | | | 1.20 | | | | 65 | |
| | | | | | |
| | | | | | | | | | | | | | | | | | | | | | | | | | |
| | 9.45 | | | | 3.00 | | | | 28,630 | | | | 1.48 | | | | 3.58 | | | | 1.71 | | | | 29 | |
| | 9.34 | | | | 1.78 | | | | 21,937 | | | | 1.49 | | | | 3.79 | | | | 1.73 | | | | 41 | |
| | 9.54 | | | | (1.37 | ) | | | 26,637 | | | | 1.49 | | | | 3.35 | | | | 1.73 | | | | 16 | |
| | 10.02 | | | | 3.59 | | | | 22,738 | | | | 1.48 | | | | 3.35 | (h) | | | 1.65 | | | | 61 | |
| | 10.01 | | | | 5.50 | | | | 15,323 | | | | 1.47 | | | | 4.07 | | | | 1.65 | | | | 42 | |
| | 9.88 | | | | 9.24 | | | | 2,408 | | | | 1.47 | | | | 4.45 | | | | 1.68 | | | | 65 | |
| | | | | | |
| | | | | | | | | | | | | | | | | | | | | | | | | | |
| | 9.48 | | | | 3.42 | | | | 915,277 | | | | 0.63 | | | | 4.43 | | | | 0.65 | | | | 29 | |
| | 9.37 | | | | 2.65 | | | | 837,611 | | | | 0.64 | | | | 4.67 | | | | 0.66 | | | | 41 | |
| | 9.57 | | | | (0.49 | ) | | | 391,548 | | | | 0.64 | | | | 4.18 | | | | 0.67 | | | | 16 | |
| | 10.05 | | | | 3.05 | | | | 916,404 | | | | 0.63 | | | | 4.11 | (h) | | | 0.66 | | | | 61 | |
| | | | | | |
| | | | | | | | | | | | | | | | | | | | | | | | | | |
| | 9.48 | | | | 3.37 | | | | 1,092,720 | | | | 0.73 | | | | 4.33 | | | | 0.91 | | | | 29 | |
| | 9.37 | | | | 2.55 | | | | 868,497 | | | | 0.74 | | | | 4.51 | | | | 0.91 | | | | 41 | |
| | 9.57 | | | | (0.61 | ) | | | 1,946,646 | | | | 0.74 | | | | 4.09 | | | | 0.92 | | | | 16 | |
| | 10.05 | | | | 4.40 | | | | 2,930,115 | | | | 0.73 | | | | 4.10 | (h) | | | 0.90 | | | | 61 | |
| | 10.03 | | | | 6.25 | | | | 3,158,706 | | | | 0.72 | | | | 4.85 | | | | 0.91 | | | | 42 | |
| | 9.89 | | | | 10.09 | | | | 781,827 | | | | 0.72 | | | | 5.12 | | | | 0.94 | | | | 65 | |
SEE NOTES TO FINANCIAL STATEMENTS.
| | | | | | | | |
| | | |
| FEBRUARY 28, 2017 | | J.P. MORGAN INCOME FUNDS | | | | | 21 | |
NOTES TO FINANCIAL STATEMENTS
AS OF FEBRUARY 28, 2017 (Unaudited)
1. Organization
JPMorgan Trust I (the “Trust”) was formed on November 12, 2004, as a Delaware statutory trust, pursuant to a Declaration of Trust dated November 5, 2004 and is registered under the Investment Company Act of 1940, as amended (the “1940 Act”), as an open-end management investment company.
The following is a separate fund of the Trust (the “Fund”) covered by this report:
| | | | |
| | | Classes Offered | | Diversified/Non-Diversified |
| Floating Rate Income Fund | | Class A, Class C, Class R6 and Class I^ | | Diversified |
| ^ | Effective April 3, 2017, Select Class was renamed Class I. |
The investment objective of the Fund is to seek to provide current income with a secondary objective of capital appreciation.
Class A Shares generally provide for a front-end sales charge while Class C Shares provide for a contingent deferred sales charge (“CDSC”). No sales charges are assessed with respect to Class R6 and Class I Shares. All classes of shares have equal rights as to earnings, assets and voting privileges, except that each class may bear different transfer agency, sub-transfer agency, distribution and shareholder servicing fees and each class has exclusive voting rights with respect to its distribution plan and shareholder servicing agreements. Certain Class A Shares, for which front-end sales charges have been waived, may be subject to a CDSC as described in the Fund’s prospectus.
J.P. Morgan Investment Management Inc. (“JPMIM”) an indirect, wholly-owned subsidiary of JPMorgan Chase & Co. (“JPMorgan”) acts as Adviser (the “Adviser”) and Administrator (the “Administrator”) to the Fund. Prior to April 1, 2016, JPMorgan Funds Management, Inc. (“JPMFM”) served as the Fund’s administrator. Effective April 1, 2016, JPMFM merged into JPMIM and JPMIM became the Fund’s Administrator under the Administration Agreement.
2. Significant Accounting Policies
The following is a summary of significant accounting policies followed by the Fund in the preparation of its financial statements. The Fund is an investment company and, accordingly, follows the investment company accounting and reporting guidance of the Financial Accounting Standards Board Accounting Standards Codification Topic 946 — Investment Companies, which is part of U.S. generally accepted accounting principles (“GAAP”). The preparation of financial statements in conformity with GAAP requires management to make estimates and assumptions that affect the reported amounts of assets and liabilities and disclosure of contingent assets and liabilities at the date of the financial statements and the reported amounts of increases and decreases in net assets from operations during the reporting period. Actual results could differ from those estimates.
A. Valuation of Investments — The valuation of investments is in accordance with GAAP and the Fund’s valuation policies set forth by and under the supervision and responsibility of the Board of Trustees (the “Board”), which established the following approach to valuation, as described more fully below: (i) investments for which market quotations are readily available shall be valued at such unadjusted quoted prices and (ii) all other investments for which market quotations are not readily available shall be valued at their fair value as determined in good faith by the Board.
The Administrator has established the J.P. Morgan Investment Management Americas Valuation Committee (“AVC”) to assist the Board with the oversight and monitoring of the valuation of the Fund’s investments. The Administrator implements the valuation policies of the Fund’s investments, as directed by the Board. The AVC oversees and carries out the policies for the valuation of investments held in the Fund. This includes monitoring the appropriateness of fair values based on results of ongoing valuation oversight, including but not limited to consideration of macro or security specific events, market events and pricing vendor and broker due diligence. The Administrator is responsible for discussing and assessing the potential impacts to the fair values on an ongoing basis, and at least on a quarterly basis with the AVC and the Board.
A market-based approach is primarily used to value the Fund’s investments. Investments for which market quotations are not readily available are fair valued by approved affiliated and unaffiliated pricing vendors or third party broker-dealers (collectively referred to as “Pricing Services”) or may be internally fair valued using methods set forth by the valuation policies approved by the Board. This may include related or comparable assets or liabilities, recent transactions, market multiples, book values, and other relevant information for the investment to determine the fair value of the investment. An income-based valuation approach may be used in which the anticipated future cash flows of the investment are discounted to calculate the fair value. Discounts may also be applied due to the nature or duration of any restrictions on the disposition of the investments. Valuations may be based upon current market prices of securities that are comparable in coupon, rating, maturity and industry. It is possible that the estimated values may differ significantly from the values that would have been used, had a ready market for the investments existed, and such differences could be material.
Fixed income instruments are valued based on prices received from Pricing Services. The Pricing Services use multiple valuation techniques to determine the valuation of fixed income instruments. In instances where sufficient market activity exists, the Pricing Services may utilize a market-based approach through which trades or quotes from market makers are used to determine the valuation of these instruments. In instances where sufficient market activity may not exist, the Pricing Services also utilize proprietary valuation models which may consider market transactions in comparable securities and the various relationships between securities in determining fair value and/or market characteristics in order to estimate the relevant cash flows, which are then discounted to calculate the fair values.
Equities and other exchange-traded instruments are valued at the last sale price or official market closing price on the primary exchange on which the instrument is traded before the net asset values (“NAV”) of the Fund are calculated on a valuation date. Investments in open-end investment companies, including J.P. Morgan Funds (the “Underlying Funds”), are valued at each Underlying Fund’s NAV as of the report date.
| | | | | | |
| | | |
| 22 | | | | J.P. MORGAN INCOME FUNDS | | FEBRUARY 28, 2017 |
Valuations reflected in this report are as of the report date. As a result, changes in valuation due to market events and/or issuer related events after the report date and prior to issuance of the report are not reflected herein.
The various inputs that are used in determining the valuation of the Fund’s investments are summarized into the three broad levels listed below.
| • | | Level 1 — Unadjusted inputs using quoted prices in active markets for identical investments. |
| • | | Level 2 — Other significant observable inputs including, but not limited to, quoted prices for similar investments, inputs other than quoted prices that are observable for investments (such as interest rates, prepayment speeds, credit risk, etc.) or other market corroborated inputs. |
| • | | Level 3 — Significant inputs based on the best information available in the circumstances, to the extent observable inputs are not available (including the Fund’s assumptions in determining the fair value of investments). |
A financial instrument’s level within the fair value hierarchy is based on the lowest level of any input, both individually and in the aggregate, that is significant to the fair value measurement. The inputs or methodology used for valuing instruments are not necessarily an indication of the risk associated with investing in those instruments.
The following table represents each valuation input as presented on the Schedule of Portfolio Investments (amounts in thousands):
| | | | | | | | | | | | | | | | |
| | | Level 1
Quoted prices | | | Level 2
Other significant
observable inputs | | | Level 3
Significant
unobservable inputs | | | Total | |
Investments in Securities | | | | | | | | | |
Debt Securities | | | | | | | | | |
Asset-Backed Securities | | $ | — | | | $ | 16,929 | | | $ | — | | | $ | 16,929 | |
Corporate Bonds | | | | | | | | | | | | | | | | |
Consumer Discretionary | | | — | | | | 50,164 | | | | — | | | | 50,164 | |
Consumer Staples | | | — | | | | 4,004 | | | | — | | | | 4,004 | |
Energy | | | — | | | | 44,666 | | | | — | | | | 44,666 | |
Financials | | | — | | | | 21,085 | | | | — | | | | 21,085 | |
Health Care | | | — | | | | 45,568 | | | | — | | | | 45,568 | |
Industrials | | | — | | | | 25,440 | | | | — | | | | 25,440 | |
Information Technology | | | — | | | | 31,518 | | | | — | | | | 31,518 | |
Materials | | | — | | | | 30,362 | | | | — | | | | 30,362 | |
Real Estate | | | — | | | | 7,716 | | | | — | | | | 7,716 | |
Telecommunication Services | | | — | | | | 19,579 | | | | — | | | | 19,579 | |
Utilities | | | — | | | | 15,560 | | | | 240 | | | | 15,800 | |
| | | | | | | | | | | | | | | | |
Total Corporate Bonds | | | — | | | | 295,662 | | | | 240 | | | | 295,902 | |
| | | | | | | | | | | | | | | | |
Common Stocks | | | | | | | | | |
Energy | | | — | | | | — | | | | 486 | | | | 486 | |
Utilities | | | 17,067 | | | | — | | | | — | | | | 17,067 | |
| | | | | | | | | | | | | | | | |
Total Common Stocks | | | 17,067 | | | | — | | | | 486 | | | | 17,553 | |
| | | | | | | | | | | | | | | | |
Preferred Stock | | | | | | | | | |
Financials | | | — | | | | 14,203 | | | | — | | | | 14,203 | |
| | | | | | | | | | | | | | | | |
Loan Assignments | | | | | | | | | |
Consumer Discretionary | | | — | | | | 356,846 | | | | 9,677 | | | | 366,523 | |
Consumer Staples | | | — | | | | 181,373 | | | | — | | | | 181,373 | |
Energy | | | — | | | | 115,950 | | | | — | | | | 115,950 | |
Financials | | | — | | | | 34,276 | | | | — | | | | 34,276 | |
Health Care | | | — | | | | 195,918 | | | | — | | | | 195,918 | |
Industrials | | | — | | | | 200,159 | | | | — | | | | 200,159 | |
Information Technology | | | — | | | | 215,559 | | | | — | | | | 215,559 | |
Materials | | | — | | | | 110,225 | | | | — | | | | 110,225 | |
Real Estate | | | — | | | | 7,916 | | | | — | | | | 7,916 | |
Telecommunication Services | | | — | | | | 98,402 | | | | — | | | | 98,402 | |
Utilities | | | — | | | | 142,693 | | | | — | | | | 142,693 | |
| | | | | | | | | | | | | | | | |
Total Loan Assignments | | | — | | | | 1,659,317 | | | | 9,677 | | | | 1,668,994 | |
| | | | | | | | | | | | | | | | |
Right | | | | | | | | | |
Utilities | | | — | | | | — | | | | 1,502 | | | | 1,502 | |
Short-Term Investment | | | | | | | | | |
Investment Company | | | 352,644 | | | | — | | | | — | | | | 352,644 | |
| | | | | | | | | | | | | | | | |
Total Investments in Securities | | $ | 369,711 | | | $ | 1,986,111 | | | $ | 11,905 | | | $ | 2,367,727 | |
| | | | | | | | | | | | | | | | |
| | | | | | | | |
| | | |
| FEBRUARY 28, 2017 | | J.P. MORGAN INCOME FUNDS | | | | | 23 | |
NOTES TO FINANCIAL STATEMENTS
AS OF FEBRUARY 28, 2017 (Unaudited) (continued)
Transfers between fair value levels are valued utilizing values as of beginning of the period.
There were no transfers between Level 1 and Level 2 during the six months ended February 28, 2017.
The following is a summary of investments for which significant unobservable inputs (level 3) were used in determining fair value (amounts in thousands):
| | | | | | | | | | | | | | | | | | | | | | | | | | | | | | | | | | | | |
| | | Balance as of August 31, 2016 | | | Realized
gain (loss) | | | Change in
net unrealized
appreciation
(depreciation) | | | Net
accretion
(amortization) | | | Purchases1 | | | Sales2 | | | Transfers
into Level 3 | | | Transfers
out
of Level 3 | | | Balance as of February 28, 2017 | |
Investments in Securities: | | | | | | | | | | | | | | | | | | | | | | | | | | | | | | | | | |
Corporate Bonds — Utilities | | $ | — | | | $ | — | | | $ | 240 | | | $ | — | | | $ | — | | | $ | — | | | $ | — | | | $ | — | | | $ | 240 | |
Common Stocks — Energy | | | 494 | | | | — | | | | (8 | ) | | | — | | | | — | | | | — | | | | — | | | | — | | | | 486 | |
Preferred Stock — Financials | | | 12,849 | | | | — | | | | — | | | | — | | | | — | | | | — | | | | — | | | | (12,849 | ) | | | — | |
Loan Assignments — Consumer Discretionary | | | — | (a) | | | — | | | | 258 | | | | 8 | | | | — | | | | (48 | ) | | | 9,459 | | | | — | | | | 9,677 | |
Right — Utilities | | | — | | | | — | | | | 1,502 | | | | — | | | | — | | | | — | | | | — | | | | — | | | | 1,502 | |
| | | | | | | | | | | | | | | | | | | | | | | | | | | | | | | | | | | | |
| | $ | 13,343 | | | $ | — | | | $ | 1,992 | | | $ | 8 | | | $ | — | | | $ | (48 | ) | | $ | 9,459 | | | $ | (12,849 | ) | | $ | 11,905 | |
| | | | | | | | | | | | | | | | | | | | | | | | | | | | | | | | | | | | |
| (a) | Amount rounds to less than 500. |
| 1 | Purchases include all purchases of securities and securities received in corporate actions. |
| 2 | Sales include all sales of securities, maturities, paydowns and securities tendered in corporate actions. |
Transfers into, and out of, level 3 are valued utilizing values as of the beginning of the period.
Transfers between level 2 and level 3 are due to a decline or an increase in market activity (e.g. frequency of trades), respectively, which resulted in a lack or increase in available market inputs to determine price for the six months ended February 28, 2017.
The changes in net unrealized appreciation (depreciation) attributable to securities owned at February 28, 2017, which were valued using significant unobservable inputs (level 3) amounted to approximately $1,991,000. This amount is included in Change in net unrealized appreciation/depreciation of investments in non-affiliates on the Statement of Operations.
Quantitative Information about Level 3 Fair Value Measurements #
(Amounts in thousands)
| | | | | | | | | | | | |
| | | Fair Value at
February 28, 2017 | | | Valuation Technique(s) | | Unobservable Input | | Range (Weighted Average) | |
| | $ | —(a) | | | Discounted Cash Flow | | Cash flows from operations | | | 0.00% (0.00%) | |
| | | | | | | | | | | | |
| Loan Assignments | | | —(a) | | | | | | | | | |
| |
| Total | | $ | —(a) | | | | | | | | | |
| |
| # | The table above does not include certain level 3 investments that are valued by brokers and pricing services. At February 28, 2017, the value of these investments was approximately $11,905,000. The inputs for these investments are not readily available or cannot be reasonably estimated and are generally those inputs described in Note 2.A. |
| (a) | Amount rounds to less than 500. |
The significant unobservable inputs used in the fair value measurement of the Fund’s investments are listed above. Generally, a change in the assumptions used in any input in isolation may be accompanied by a change in another input. Significant changes in any of the unobservable inputs may significantly impact the fair value measurement. The impact is based on the relationship between each unobservable input and the fair value measurement. Significant increases (decreases) in the default rate may decrease (increase) the fair value measurement. A significant change in the discount rate or prepayment rate (Constant Prepayment Rate or PSA Prepayment Model) may decrease or increase the fair value measurement.
B. Foreign Currency Translation — The books and records of the Fund are maintained in U.S. dollars. Foreign currency amounts are translated into U.S. dollars at the prevailing exchange rates of such currencies against the U.S. dollar. The market value of investment securities and other assets and liabilities are translated at the exchange rate as of the valuation date. Purchases and sales of investment securities, income and expenses are translated at the exchange rate prevailing on the respective dates of such transactions.
The Fund does not isolate the effect of changes in foreign exchange rates from changes in market prices on securities held. Accordingly, such changes are included within Change in net unrealized appreciation/depreciation on investments on the Statement of Operations.
Reported realized foreign currency gains and losses arise from the disposition of foreign currency, currency gains or losses realized between the trade and settlement dates on securities transactions, and the difference between the amounts of dividends, interest and foreign withholding taxes
recorded on the Fund’s books on the transaction date and the U.S. dollar equivalent of the amounts actually received or paid. These reported realized foreign currency gains and losses are included in Net realized gain (loss) on foreign currency transactions on the Statement of Operations.
| | | | | | |
| | | |
| 24 | | | | J.P. MORGAN INCOME FUNDS | | FEBRUARY 28, 2017 |
Unrealized foreign currency gains and losses arise from changes (due to changes in exchange rates) in the value of foreign currency and other assets and liabilities denominated in foreign currencies, which are held at period end and are included in Change in net unrealized appreciation/depreciation on foreign currency translations on the Statement of Operations.
C. Restricted Securities — Certain securities held by the Fund may be subject to legal or contractual restrictions on resale. Restricted securities generally are resold in transactions exempt from registration under the Securities Act of 1933, (the “Securities Act”). Disposal of these securities may involve time-consuming negotiations and expense. Prompt sale at the current valuation may be difficult and could adversely affect the net assets of the Fund.
As of February 28, 2017, the Fund had no investments in restricted securities other than securities sold to the Fund under Rule 144A or Regulation S under the Securities Act.
D. Loan Assignments — The Fund may invest in debt instruments that are interests in amounts owed to lenders or lending syndicates (a “Lender”) by corporate, governmental, or other borrowers (a “Borrower”). A loan is often administered by a bank or other financial institution (the “Agent”) that acts as agent for all holders. The Agent administers the terms of the loan, as specified in the loan agreement. The fund invests in loan assignments of all or a portion of the loans. When a fund purchases a loan assignment, the fund has direct rights against the Borrower on a loan, provided, however, the Fund’s rights may be more limited than the Lender from which they acquired the assignment and the fund may be able to enforce its rights only through the Agent. As a result, a fund assumes the credit risk of the Borrower as well as any other persons interpositioned between the Fund and the Borrower (“Intermediate Participants”). A fund may incur certain costs and delays in realizing payment on a loan assignment or suffer a loss of principal and/or interest if assets or interests held by the Agent or other Intermediate Participants are determined to be subject to the claims of the Agent’s or other Intermediate Participant’s creditors. In addition, it is unclear whether loan assignments and other forms of direct indebtedness offer securities law protections against fraud and misrepresentation. Also, because JPMIM may wish to invest in publicly traded securities of a Borrower, it may not have access to material non-public information regarding the Borrower to which other investors have access. Although certain loan assignments are secured by collateral, a fund could experience delays or limitations in realizing the value on such collateral or have its interest subordinated to other indebtedness of the Borrower. Loan assignments are vulnerable to market conditions such that economic conditions or other events may reduce the demand for assignments and certain assignments which were liquid, when purchased, may become illiquid and they may be difficult to value. In addition, the settlement period for loans is uncertain as there is no standardized settlement schedule applicable to such investments. Therefore, a fund may not receive the proceeds from a sale of such investments for a period after the sale.
Certain loan assignments are also subject to the risks associated with high yield securities described under Note 7.
At February 28, 2017, the Fund had investments in Loan Assignments that amounted to more than 5% of the Fund’s net assets, by agent bank as follows:
| | | | |
| Agent Bank | | Percentage | |
Credit Suisse International | | | 15.9 | % |
Bank of America, N.A. | | | 11.4 | |
Deutsche Bank AG | | | 10.9 | |
Barclays Bank plc | | | 9.6 | |
Citibank, N.A | | | 6.2 | |
Goldman Sachs International | | | 5.9 | |
Morgan Stanley Capital Services | | | 5.0 | |
E. Unfunded Commitments — The Fund may enter into commitments to buy and sell investments including commitments to buy loan assignments to settle on future dates as part of their normal investment activities. Unfunded commitments may include revolving loan facilities which may obligate the Fund to provide cash to the borrower on demand. Unfunded commitments are generally traded and priced as part of a related loan assignment (Note 2.D.). The value of the unfunded portion of the investment is determined using a pro-rata allocation, based on its par value relative to the par value of the entire investment. The unrealized appreciation/depreciation from unfunded commitments is reported on the Statements of Assets and Liabilities. Credit risk exists on these commitments to the extent of any difference between the sales price and current value of the underlying securities sold. Market risk exists on these commitments to buy to the same extent as if the securities were owned on a settled basis and gains and losses are recorded and reported in the same manner. The Fund may receive an ongoing commitment fee based on the undrawn portion of the underlying loan facility, which is recorded as a component of interest income on the Statements of Operations.
| | | | | | | | | | | | | | | | | | | | | | | | | | | | | | | | | | | | | | |
| | | Term | | Maturity
Date | | | Commitment
Fee Rate | | | Rate if
Funded | | | Unfunded
Commitment | | | Funded
Commitment | | | Total
Commitment | |
| Security Description | | | | | | Par
Amount | | | Value | | | Par
Amount | | | Value | | | Par
Amount | | | Value | |
Avaya, Inc. | | DIP Term Loan | | | 01/19/18 | | | | 0.000 | % | | | 8.500 | % | | $ | 2,356 | | | $ | 2,455 | | | $ | 3,370 | | | $ | 3,477 | | | $ | 5,726 | | | $ | 5,932 | |
F. Security Transactions and Investment Income — Investment transactions are accounted for on the trade date (the date the order to buy or sell is executed). Securities gains and losses are calculated on a specifically identified cost basis. Interest income is determined on the basis of coupon interest accrued using the effective interest method which adjusts for amortization of premiums and accretion of discounts. Dividend income, net of foreign taxes withheld, if any, is recorded on the ex-dividend date or when the Fund first learns of the dividend. Certain Funds may receive other
| | | | | | | | |
| | | |
| FEBRUARY 28, 2017 | | J.P. MORGAN INCOME FUNDS | | | | | 25 | |
NOTES TO FINANCIAL STATEMENTS
AS OF FEBRUARY 28, 2017 (Unaudited) (continued)
income from investment in loan assignments and/or unfunded commitments, including amendment fees, consent fees and commitment fees. These fees are recorded as income when received by the Fund. These amounts are included in Interest Income in the Statement of Operations.
G. Allocation of Income and Expenses — Expenses directly attributable to a fund are charged directly to that fund, while the expenses attributable to more than one fund of the Trust are allocated among the respective funds. In calculating the NAV of each class, investment income, realized and unrealized gains and losses and expenses, other than class specific expenses, are allocated daily to each class of shares based upon the proportion of net assets of each class at the beginning of each day.
Transfer agency fees and sub-transfer agency fees are class-specific expenses. The amount of the transfer-agency and sub-transfer agency fees charged to each class of the Fund for the six months ended February 28, 2017 are as follows (amounts in thousands):
| | | | | | | | | | | | | | | | | | | | |
| | | Class A | | | Class C | | | Class R6 | | | Class I | | | Total | |
Transfer agency fees | | $ | 5 | | | $ | 2 | | | $ | 2 | | | $ | 4 | | | $ | 13 | |
Sub-transfer agency fees | | | 13 | | | | 5 | | | | — | | | | 10 | | | | 28 | |
H. Federal Income Taxes — The Fund is treated as a separate taxable entity for Federal income tax purposes. The Fund’s policy is to comply with the provisions of the Internal Revenue Code of 1986, as amended (the “Code”), applicable to regulated investment companies and to distribute to shareholders all of its distributable net investment income and net realized capital gains on investments. Accordingly, no provision for Federal income tax is necessary. Management has reviewed the Fund’s tax positions for all open tax years and has determined that as of February 28, 2017, no liability for income tax is required in the Fund’s financial statements for net unrecognized tax benefits. However, management’s conclusions may be subject to future review based on changes in, or the interpretation of, the accounting standards or tax laws and regulations. The Fund’s Federal tax returns for the prior three fiscal years remain subject to examination by the Internal Revenue Service.
I. Foreign Taxes — The Fund may be subject to foreign taxes on income, gains on investments or currency purchases/repatriation, a portion of which may be recoverable. The Fund will accrue such taxes and recoveries as applicable, based upon its current interpretation of tax rules and regulations that exist in the markets in which it invests.
J. Distributions to Shareholders — Distributions from net investment income are generally declared and paid monthly and are declared separately for each class. No class has preferential dividend rights; differences in per share rates are due to differences in separate class expenses. Net realized capital gains, if any, are distributed by the Fund at least annually. The amount of distributions from net investment income and net realized capital gains is determined in accordance with Federal income tax regulations, which may differ from GAAP. To the extent these “book/tax” differences are permanent in nature (i.e., that they result from other than timing of recognition — “temporary differences”), such amounts are reclassified within the capital accounts based on their Federal tax-basis treatment.
3. Fees and Other Transactions with Affiliates
A. Investment Advisory Fee — Pursuant to an Investment Advisory Agreement, the Adviser supervises the investments of the Fund and for such services is paid a fee. The fee is accrued daily and paid monthly at an annual rate of 0.55% of the Fund’s average daily net assets.
The Adviser waived Investment Advisory fees and/or reimbursed expenses as outlined in Note 3.F.
B. Administration Fee — Pursuant to an Administration Agreement, the Administrator provides certain administration services to the Fund. In consideration of these services, the Administrator receives a fee accrued daily and paid monthly at an annual rate of 0.15% of the first $25 billion of the average daily net assets of all funds in the J.P. Morgan Funds Complex covered by the Administration Agreement (excluding certain funds of funds and money market funds) and 0.075% of the average daily net assets in excess of $25 billion of all such funds. For the six months ended February 28, 2017, the effective rate was 0.08% of the Fund’s average daily net assets, notwithstanding any fee waivers and/or expense reimbursements.
The Administrator waived Administration fees as outlined in Note 3.F.
Effective April 1, 2016, the Administrator merged into JPMIM, and JPMIM became the Fund’s administrator under the Administration Agreement.
JPMorgan Chase Bank, N.A. (“JPMCB”), a wholly-owned subsidiary of JPMorgan, serves as the Fund’s sub-administrator (the “Sub-administrator”). For its services as Sub-administrator, JPMCB receives a portion of the fees payable to the Administrator.
C. Distribution Fees — Pursuant to a Distribution Agreement, JPMorgan Distribution Services, Inc. (“JPMDS”), a wholly-owned subsidiary of JPMorgan, serves as the Trust’s principal underwriter and promotes and arranges for the sale of the Fund’s shares.
The Board has adopted a Distribution Plan (the “Distribution Plan”) for Class A and Class C Shares of the Fund in accordance with Rule 12b-1 under the 1940 Act. Class R6 and Class I do not charge a distribution fee. The Distribution Plan provides that the Fund shall pay distribution fees, including payments to JPMDS, at annual rates of 0.25% and 0.75% of the average daily net assets of Class A and Class C Shares, respectively.
In addition, JPMDS is entitled to receive the front-end sales charges from purchases of Class A Shares and the CDSC from redemptions of Class C Shares and certain Class A Shares for which front-end sales charges have been waived. For the six months ended February 28, 2017, JPMDS retained the following (amounts in thousands):
| | | | | | |
| | | Front-End Sales Charge | | CDSC | |
| | $4 | | $ | — | |
| | | | | | |
| | | |
| 26 | | | | J.P. MORGAN INCOME FUNDS | | FEBRUARY 28, 2017 |
D. Shareholder Servicing Fees — The Trust, on behalf of the Fund, has entered into a Shareholder Servicing Agreement with JPMDS under which JPMDS provides certain support services to the shareholders. Class R6 Shares do not charge a shareholder servicing fee. For performing these services, JPMDS receives a fee that is accrued daily and paid monthly at an annual rate of 0.25% of the average daily net assets of Class A, Class C and Class I Shares, respectively.
JPMDS has entered into shareholder services contracts with affiliated and unaffiliated financial intermediaries who provide shareholder services and other related services to their clients or customers who invest in the Fund under which JPMDS will pay all or a portion of such fees earned to financial intermediaries for performing such services.
JPMDS waived shareholder servicing fees as outlined in Note 3.F.
E. Custodian and Accounting Fees — JPMCB provides portfolio custody and accounting services to the Fund. For performing these services, the Fund pays JPMCB transaction and asset-based fees that vary according to the number of transactions and positions, plus out-of-pocket expenses. The amounts paid directly to JPMCB by the Fund for custody and accounting services are included in Custodian and accounting fees on the Statement of Operations. Payments to the custodian may be reduced by credits earned by the Fund, based on uninvested cash balances held by the custodian. Such earnings credits, if any, are presented separately on the Statement of Operations.
Interest income earned on cash balances at the custodian, if any, is included in Interest income from affiliates on the Statement of Operations.
Interest expense paid to the custodian related to cash overdrafts, if any, is included in Interest expense to affiliates on the Statement of Operations.
F. Waivers and Reimbursements — The Adviser, Administrator and/or Distributor have contractually agreed to waive fees and/or reimburse the Fund to the extent that total annual operating expenses (excluding acquired fund fees and expenses other than certain money market fund fees as described below, dividend expenses related to short sales, interest expenses related to short sales, interest, taxes, expenses related to litigation and potential litigation and extraordinary expenses) exceed the percentages of the Fund’s respective average daily net assets as shown in the table below:
| | | | | | | | | | | | | | |
| | | Class A | | Class C | | | Class R6 | | | Class I | |
| | 1.00% | | | 1.50 | % | | | 0.65 | % | | | 0.75 | % |
The expense limitation agreement was in effect for the six months ended February 28, 2017 and is in place until at least December 31, 2017.
For the six months ended February 28, 2017, the Fund’s service providers waived fees and/or reimbursed expenses for the Fund as follows (amounts in thousands). None of these parties expect the Fund to repay any such waived fees and/or reimbursed expenses in future years.
| | | | | | | | | | | | | | | | | | | | |
| | | Contractual Waivers | | | | |
| | | Investment
Advisory | | | Administration | | | Shareholder
Servicing | | | Total | | | Contractual
Reimbursements | |
| | $ | 32 | | | $ | 22 | | | $ | 801 | | | $ | 855 | | | $ | — | |
Additionally, the Fund may invest in one or more money market funds advised by the Adviser or its affiliates (affiliated money market funds). Effective December 29, 2016, the Adviser, Administrator and/or Distributor, as shareholder servicing agent, have contractually agreed to waive fees and/or reimburse expenses in an amount sufficient to offset the respective net fees each collects from the affiliated money market fund on the Fund’s investment in such affiliated money market fund.
The amounts of these waivers/reimbursements resulting from investments in these money market funds for the six months ended February 28, 2017 was approximately $134,000.
G. Other — Certain officers of the Trust are affiliated with the Adviser, the Administrator and JPMDS. Such officers, with the exception of the Chief Compliance Officer, receive no compensation from the Fund for serving in their respective roles.
The Board appointed a Chief Compliance Officer to the Fund in accordance with Federal securities regulations. The Fund, along with other affiliated funds, makes reimbursement payments, on a pro-rata basis, to the Administrator for a portion of the fees associated with the Office of the Chief Compliance Officer. Such fees are included in Trustees’ and Chief Compliance Officer’s fees on the Statement of Operations.
The Trust adopted a Trustee Deferred Compensation Plan (the “Plan”) which allows the Independent Trustees to defer the receipt of all or a portion of compensation related to performance of their duties as Trustees. The deferred fees are invested in various J.P. Morgan Funds until distribution in accordance with the Plan.
During the six months ended February 28, 2017, the Fund purchased securities from an underwriting syndicate in which the principal underwriter or members of the syndicate were affiliated with the Adviser.
The Fund may use related party broker-dealers. For the six months ended February 28, 2017, the Fund did not incur any brokerage commissions with broker-dealers affiliated with the Adviser.
The Securities and Exchange Commission (“SEC”) has granted an exemptive order permitting the Fund to engage in principal transactions with J.P. Morgan Securities, Inc., an affiliated broker, involving taxable money market instruments, subject to certain conditions.
| | | | | | | | |
| | | |
| FEBRUARY 28, 2017 | | J.P. MORGAN INCOME FUNDS | | | | | 27 | |
NOTES TO FINANCIAL STATEMENTS
AS OF FEBRUARY 28, 2017 (Unaudited) (continued)
4. Investment Transactions
During the six months ended February 28, 2017, purchases and sales of investments (excluding short-term investments) were as follows (amounts in thousands):
| | | | | | | | |
| | | Purchases
(excluding U.S.
Government) | | | Sales
(excluding U.S.
Government) | |
| | $ | 798,522 | | | $ | 512,844 | |
During the six months ended February 28, 2017, there were no purchases or sales of U.S. Government securities.
5. Federal Income Tax Matters
For Federal income tax purposes, the estimated cost and unrealized appreciation (depreciation) in value of investment securities held at February 28, 2017 were as follows (amounts in thousands):
| | | | | | | | | | | | | | | | |
| | | Aggregate
Cost | | | Gross
Unrealized
Appreciation | | | Gross
Unrealized
Depreciation | | | Gross
Unrealized
(Depreciation) | |
| | $ | 2,381,237 | | | $ | 25,352 | | | $ | 38,862 | | | $ | (13,510 | ) |
The difference between book and tax basis appreciation (depreciation) on investments is primarily attributed to debt modifications.
6. Borrowings
The Fund relies upon an exemptive order granted by the SEC (the “Order”) permitting the establishment and operation of an Interfund Lending Facility (the “Facility”). The Facility allows the Fund to directly lend and borrow money to or from any other fund relying upon the Order at rates beneficial to both the borrowing and lending funds. Advances under the Facility are taken primarily for temporary or emergency purposes, including the meeting of redemption requests that otherwise might require the untimely disposition of securities, and are subject to the Fund’s borrowing restrictions. The Interfund loan rate is determined, as specified in the Order, by averaging the current repurchase agreement rate and the current bank loan rate. The Order was granted to JPMorgan Trust II and may be relied upon by the Fund because the Fund and the series of JPMorgan Trust II are both investment companies in the same “group of investment companies” (as defined in Section 12(d)(1)(G) of the 1940 Act).
The Trust and JPMCB have entered into a financing arrangement. Under this arrangement, JPMCB provides an unsecured, uncommitted credit facility in the aggregate amount of $100 million to certain of the J.P. Morgan Funds, including the Fund. Advances under the arrangement are taken primarily for temporary or emergency purposes, including the meeting of redemption requests that otherwise might require the untimely disposition of securities, and are subject to the Fund’s borrowing restrictions. Interest on borrowings is payable at a rate determined by JPMCB at the time of borrowing. This agreement has been extended until November 6, 2017.
The Fund had no borrowings outstanding from another fund or from the unsecured, uncommitted credit facility at February 28, 2017.
In addition, effective August 16, 2016, the Trust along with certain other trusts (“Borrowers”) entered into a joint syndicated senior unsecured revolving credit facility totaling $1.5 billion (“Credit Facility”) with various lenders and The Bank of New York Mellon, as administrative agent for the lenders. This Credit Facility provides a source of funds to the Borrowers for temporary and emergency purposes, including the meeting of redemption requests that otherwise might require the untimely disposition of securities. Under the terms of the Credit Facility, a borrowing fund must have a minimum of $25,000,000 in adjusted net asset value and not exceed certain adjusted net asset coverage ratios prior to and during the time in which any borrowings are outstanding. If a fund does not comply with the aforementioned requirements, the fund must remediate within three business days with respect to the $25,000,000 minimum adjusted net asset value or within one business day with respect to certain asset coverage ratios or the administrative agent at the request of, or with the consent of, the lenders may terminate the Credit Facility and declare any outstanding borrowings to be due and payable immediately.
Interest associated with any borrowing under the Credit Facility is charged to the borrowing fund at a rate of interest equal to 1.00% plus the greater of the federal funds effective rate or one month LIBOR. The annual commitment fee to maintain the Credit Facility is 0.15% and is incurred on the unused portion of the Credit Facility and is allocated to all participating funds pro rata based on their respective net assets. The initial term of the Credit Facility is 364 days, unless extended.
The Fund did not utilize the Credit Facility during the six months ended February 28, 2017.
7. Risks, Concentrations and Indemnifications
In the normal course of business, the Fund enters into contracts that contain a variety of representations which provide general indemnifications. The Fund’s maximum exposure under these arrangements is unknown. The amount of exposure would depend on future claims that may be made against the Fund that have not yet occurred. However, based on experience, the Fund expects the risk of loss to be remote.
As of February 28, 2017, the Fund had one affiliated omnibus account, which represented 51.9% of the Fund’s net assets.
| | | | | | |
| | | |
| 28 | | | | J.P. MORGAN INCOME FUNDS | | FEBRUARY 28, 2017 |
As of February 28, 2017, the JPMorgan Investor Funds and JPMorgan SmartRetirement Funds, which are affiliated funds of funds, owned in the aggregate, shares representing more than 10% of the net assets of the Fund as follows:
| | | | | | | | |
| | | J.P. Morgan
Investor
Funds | | | JPMorgan
SmartRetirement
Funds | |
| | | 22.8 | % | | | 10.4 | % |
Significant shareholder transactions by these shareholders may impact the Fund’s performance.
The Fund is subject to interest rate and credit risk. The value of debt securities may decline as interest rates increase. The Fund could lose money if the issuer of a fixed income security is unable to pay interest or repay principal when it is due. The Fund invests in floating rate loans and other floating rate debt securities. Although these investments are generally less sensitive to interest rate changes than other fixed rate instruments, the value of floating rate loans and other floating rate investments may decline if their interest rates do not rise as quickly, or as much, as general interest rates. Many factors can cause interest rates to rise. Some examples include central bank monetary policy, rising inflation rates and general economic conditions. Given the historically low interest rate environment, risks associated with rising rates are heightened. The ability of the issuers of debt to meet their obligations may be affected by the economic and political developments in a specific industry or region.
The Fund invests in high yield securities that are not rated or rated below investment grade (commonly known as “junk bonds.”) These securities are considered to be high risk investments. Investments in lower-rated securities or unrated securities of comparable quality tend to be more sensitive to economic conditions than higher rated securities. Junk bonds involve a greater risk of default by the issuer because such securities are generally unsecured and are often subordinated to other creditors’ claims. The market price of these securities can change suddenly and unexpectedly. As a result, the Fund is intended for investors who are able and willing to assume a high degree of risk.
The Fund is subject to the risk that, should the Fund decide to sell an illiquid investment when a ready buyer is not available at a price the Fund deems to be representative of its value, the value of the Fund’s net assets could be adversely affected.
8. Investment Company Reporting Modernization
In October 2016, the U.S. Securities and Exchange Commission adopted new rules and forms, and amendments to certain current rules and forms, to modernize the reporting and disclosure of information by registered investment companies. In part, the final rules amend Regulation S-X and will require standardized, enhanced disclosures about derivatives in investment company financial statements, as well as other amendments. The compliance date for the amendments to Regulation S-X is August 1, 2017. At this time, management is currently assessing the anticipated impact of the Regulation S-X amendments on the Fund’s (s) financial statements and related disclosures.
| | | | | | | | |
| | | |
| FEBRUARY 28, 2017 | | J.P. MORGAN INCOME FUNDS | | | | | 29 | |
SCHEDULE OF SHAREHOLDER EXPENSES
(Unaudited)
Hypothetical $1,000 Investment
As a shareholder of the Fund, you incur two types of costs: (1) transaction costs, including sales charges (loads) on purchase payments and (2) ongoing costs, including investment advisory fees, administration fees, distribution fees and other Fund expenses. The examples below are intended to help you understand your ongoing costs (in dollars) of investing in the Fund and to compare these ongoing costs with the ongoing costs of investing in other mutual funds. The examples assume that you had a $1,000 investment in each Class at the beginning of the reporting period, September 1, 2016, and continued to hold your shares at the end of the reporting period, February 28, 2017.
Actual Expenses
For each Class of the Fund in the table below, the first line provides information about actual account values and actual expenses. You may use the information in this line, together with the amount you invested, to estimate the expenses that you paid over the period. Simply divide your account value by $1,000 (for example, an $8,600 account value divided by $1,000 = 8.6), then multiply the result by the number in the first line of each Class under the heading entitled “Expenses Paid During the Period” to estimate the expenses you paid on your account during this period.
Hypothetical Example for Comparison Purposes
The second line of each Class in the table below provides information about hypothetical account values and hypothetical expenses based on the Class’ actual expense ratio and an assumed rate of return of 5% per year before expenses, which is not the Class’ actual return. The hypothetical account values and expenses may not be used to estimate the actual ending account balance or expenses you paid for the period. You may use this information to compare the ongoing costs of investing in the Class of the Fund and other funds. To do so, compare this 5% hypothetical example with the 5% hypothetical examples that appear in the shareholder reports of the other funds. Please note that the expenses shown in the table are meant to highlight your ongoing costs only and do not reflect any transaction costs, such as sales charges (loads) or redemption fees. Therefore, the second line for each Class in the table is useful in comparing ongoing costs only, and will not help you determine the relative total costs of owning different funds. In addition, if these transaction costs were included, your costs would have been higher. The examples also assume all dividends and distributions have been reinvested.
| | | | | | | | | | | | | | | | |
| | | Beginning
Account Value
September 1, 2016 | | | Ending
Account Value
February 28, 2017 | | | Expenses
Paid During
the Period* | | | Annualized
Expense
Ratio | |
Floating Rate Income Fund | | | | | | | | | | | | | | | | |
Class A | | | | | | | | | | | | | | | | |
Actual | | $ | 1,000.00 | | | $ | 1,033.60 | | | $ | 4.94 | | | | 0.98 | % |
Hypothetical | | | 1,000.00 | | | | 1,019.93 | | | | 4.91 | | | | 0.98 | |
Class C | | | | | | | | | | | | | | | | |
Actual | | | 1,000.00 | | | | 1,030.00 | | | | 7.45 | | | | 1.48 | |
Hypothetical | | | 1,000.00 | | | | 1,017.46 | | | | 7.40 | | | | 1.48 | |
Class R6 | | | | | | | | | | | | | | | | |
Actual | | | 1,000.00 | | | | 1,034.20 | | | | 3.18 | | | | 0.63 | |
Hypothetical | | | 1,000.00 | | | | 1,021.67 | | | | 3.16 | | | | 0.63 | |
Class I (formerly Select Class) | | | | | | | | | | | | | | | | |
Actual | | | 1,000.00 | | | | 1,033.70 | | | | 3.68 | | | | 0.73 | |
Hypothetical | | | 1,000.00 | | | | 1,021.17 | | | | 3.66 | | | | 0.73 | |
| * | Expenses are equal to each Class’ respective annualized expense ratio, multiplied by the average account value over the period, multiplied by 181/365 (to reflect the one-half year period). |
| | | | | | |
| | | |
| 30 | | | | J.P. MORGAN INCOME FUNDS | | FEBRUARY 28, 2017 |
J.P. Morgan Funds are distributed by JPMorgan Distribution Services, Inc., which is an affiliate of JPMorgan Chase & Co. Affiliates of JPMorgan Chase & Co. receive fees for providing various services to the funds.
Contact JPMorgan Distribution Services, Inc. at 1-800-480-4111 for a fund prospectus. You can also visit us at www.jpmorganfunds.com. Investors should carefully consider the investment objectives and risk as well as charges and expenses of the mutual fund before investing. The prospectus contains this and other information about the mutual fund. Read the prospectus carefully before investing.
Investors may obtain information about the Securities Investor Protection Corporation (SIPC), including the SIPC brochure by visiting www.sipc.org or by calling SIPC at 202-371-8300.
The Fund files a complete schedule of its fund holdings for the first and third quarters of its fiscal year with the SEC on Form N-Q. The Fund’s Forms N-Q are available on the SEC’s website at http://www.sec.gov and may be reviewed and copied at the SEC’s Public Reference Room in Washington, DC. Information on the operation of the SEC’s Public Reference Room may be obtained by calling 1-800-SEC-0330. Shareholders may request the Form N-Q without charge by calling 1-800-480-4111 or by visiting the J.P. Morgan Funds’ website at www.jpmorganfunds.com.
A description of the Fund’s policies and procedures with respect to the disclosure of the Fund’s holdings is available in the prospectus and Statement of Additional Information.
A copy of proxy policies and procedures is available without charge upon request by calling 1-800-480-4111 and on the Fund’s website at www.jpmorganfunds.com. A description of such policies and procedures is on the SEC’s website at www.sec.gov. The Trustees have delegated the authority to vote proxies for securities owned by the Fund to the Adviser. A copy of the Fund’s voting record for the most recent 12-month period ended June 30 is available on the SEC’s website at www.sec.gov or at the Fund’s website at www.jpmorganfunds.com no later than August 31 of each year. The Fund’s proxy voting record will include, among other things, a brief description of the matter voted on for each fund security, and will state how each vote was cast, for example, for or against the proposal.

J.P. Morgan Asset Management is the marketing name for the asset management businesses of JPMorgan Chase & Co. Those businesses include, but are not limited to, J.P. Morgan Investment Management Inc., Security Capital Research & Management Incorporated and J.P. Morgan Alternative Asset Management, Inc.
| | | | |
| | © JPMorgan Chase & Co., 2017. All rights reserved. February 2017. | | SAN-FRI-217 |
ITEM 2. CODE OF ETHICS.
Disclose whether, as of the end of the period covered by the report, the registrant has adopted a code of ethics that applies to the registrant’s principal executive officer, principal financial officer, principal accounting officer or controller, or persons performing similar functions, regardless of whether these individuals are employed by the registrant or a third party. If the registrant has not adopted such a code of ethics, explain why it has not done so.
The registrant must briefly describe the nature of any amendment, during the period covered by the report, to a provision of its code of ethics that applies to the registrant’s principal executive officer, principal financial officer, principal accounting officer or controller, or persons performing similar functions, regardless of whether these individuals are employed by the registrant or a third party, and that relates to any element of the code of ethics definition enumerated in paragraph (b) of this Item. The registrant must file a copy of any such amendment as an exhibit pursuant to Item 12(a)(1), unless the registrant has elected to satisfy paragraph (f) of this Item by positing its code of ethics on its website pursuant to paragraph (f)(2) of this Item, or by undertaking to provide its code of ethics to any person without charge, upon request, pursuant to paragraph (f)(3) of this Item.
If the registrant has, during the period covered by the report, granted a waiver, including an implicit waiver, from a provision of the code of ethics that applies to the registrant’s principal executive officer, principal financial officer, principal accounting officer or controller, or persons performing similar functions, regardless of whether these individuals are employed by the registrant or third party, that relates to one or more items set forth in paragraph (b) of this Item, the registrant must briefly describe the nature of the waiver, the name of the person to whom the waiver was granted, and the date of the waiver.
Not applicable to a semi-annual report.
ITEM 3. AUDIT COMMITTEE FINANCIAL EXPERT.
| (a) | (1) Disclose that the registrant’s board of directors has determined that the registrant either: |
(i) Has at least one audit committee financial expert serving on its audit committee; or
(ii) Does not have an audit committee financial expert serving on its audit committee.
(2) If the registrant provides the disclosure required by paragraph (a)(1)(i) of this Item, it must disclose the name of the audit committee financial expert and whether that person is “independent.” In order to be considered “independent” for purposes of this Item, a member of an audit committee may not, other than in his or her capacity as a member of the audit committee, the board of directors, or any other board committee:
(i) Accept directly or indirectly any consulting, advisory, or other compensatory fee from the issuer; or
(ii) Be an “interested person” of the investment company as defined in Section 2(a)(19) of the Act (15 U.S.C. 80a-2(a)(19)).
(3) If the registrant provides the disclosure required by paragraph (a)(1)(ii) of this Item, it must explain why it does not have an audit committee financial expert.
Not applicable to a semi-annual report.
ITEM 4. PRINCIPAL ACCOUNTANT FEES AND SERVICES.
(a) Disclose, under the caption Audit Fees, the aggregate fees billed for each of the last two fiscal years for professional
services rendered by the principal accountant for the audit of the registrant’s annual financial statements or services that are normally provided by the accountant in connection with statutory and regulatory filings or engagements for those fiscal years.
(b) Disclose, under the caption Audit-Related Fees, the aggregate fees billed in each of the last two fiscal years for assurance and related services by the principal accountant that are reasonably related to the performance of the audit of the registrant’s financial statements and are not reported under paragraph (a) of this Item. Registrants shall describe the nature of the services comprising the fees disclosed under this category.
(c) Disclose, under the caption Tax Fees, the aggregate fees billed in each of the last two fiscal years for professional services rendered by the principal accountant for tax compliance, tax advice, and tax planning. Registrants shall describe the nature of the services comprising the fees disclosed under this category.
(d) Disclose, under the caption All Other Fees, the aggregate fees billed in each of the last two fiscal years for products and services provided by the principal accountant, other than the services reported in paragraphs (a) through (c) of this Item. Registrants shall describe the nature of the services comprising the fees disclosed under this category.
(e) (1) Disclose the audit committee’s pre-approval policies and procedures described in paragraph (c)(7) of Rule 2-01 of Regulation S-X.
(2) Disclose the percentage of services described in each of paragraphs (b) through (d) of this Item that were approved by the audit committee pursuant to paragraph (c)(7)(i)(C) of Rule 2-01 of Regulation S-X.
(f) If greater than 50 percent, disclose the percentage of hours expended on the principal accountant’s engagement to audit the registrant’s financial statements for the most recent fiscal year that were attributed to work performed by persons other than the principal accountant’s full-time, permanent employees.
Not applicable—Less than 50%.
(g) Disclose the aggregate non-audit fees billed by the registrant’s accountant for services rendered to the registrant, and rendered to the registrant’s investment adviser (not including any sub-adviser whose role is primarily portfolio management and is subcontracted with or overseen by another investment adviser), and any entity controlling, controlled by, or under common control with the adviser that provides ongoing services to the registrant for each of the last two fiscal years of the registrant.
(h) Disclose whether the registrant’s audit committee of the board of directors has considered whether the provision of non-audit services that were rendered to the registrant’s investment adviser (not including any subadviser whose role is primarily portfolio management and is subcontracted with or overseen by another investment adviser), and any entity controlling, controlled by, or under common control with the investment adviser that provides ongoing services to the registrant that were not pre-approved pursuant to paragraph (c)(7)(ii) of Rule 2-01 of Regulation S-X is compatible with maintaining the principal accountant’s independence.
Not applicable to a semi-annual report.
ITEM 5. AUDIT COMMITTEE OF LISTED REGISTRANTS.
(a) If the registrant is a listed issuer as defined in Rule 10A-3 under the Exchange Act (17CFR 240.10A-3), state whether or not the registrant has a separately-designated standing audit committee established in accordance with Section 3(a)(58)(A) of the Exchange Act (15 U.S.C. 78c(a)(58)(A)). If the registrant has such a committee, however designated, identify each committee member. If the entire board of directors is acting as the registrant’s audit committee as specified in Section 3(a)(58)(B) of the Exchange Act (15 U.S.C. 78c(a)(58)(B)), so state.
(b) If applicable, provide the disclosure required by Rule 10A-3(d) under the Exchange Act (17CFR 240.10A-3(d)) regarding an exemption from the listing standards for all audit committees.
Not applicable to a semi-annual report.
ITEM 6. SCHEDULE OF INVESTMENTS.
File Schedule I – Investments in securities of unaffiliated issuers as of the close of the reporting period as set forth in Section 210.12-12 of Regulation S-X, unless the schedule is included as part of the report to shareholders filed under Item 1 of this Form.
Included in Item 1.
ITEM 7. DISCLOSURE OF PROXY VOTING POLICIES AND PROCEDURES FOR CLOSED-END MANAGEMENT INVESTMENT COMPANIES.
A closed-end management investment company that is filing an annual report on this Form N-CSR must, unless it invests exclusively in non-voting securities, describe the policies and procedures that it uses to determine how to vote proxies relating to portfolio securities, including the procedures that the company uses when a vote presents a conflict between the interests of its shareholders, on the one hand, and those of the company’s investment adviser; principal underwriter; or any affiliated person (as defined in Section 2(a)(3) of the Investment Company Act of 1940 (15 U.S.C. 80a-2(a)(3)) and the rules thereunder) of the company, its investment adviser, or its principal underwriter, on the other. Include any policies and procedures of the company’s investment adviser, or any other third party, that the company uses, or that are used on the company’s behalf, to determine how to vote proxies relating to portfolio securities.
Not applicable.
ITEM 8. PORTFOLIO MANAGERS OF CLOSED-END MANAGEMENT INVESTMENT COMPANIES.
Not applicable.
ITEM 9. PURCHASE OF EQUITY SECURITIES BY CLOSED-END MANAGEMENT INVESTMENT COMPANY AND AFFILIATED PURCHASERS.
(a) If the registrant is a closed-end management investment company, provide the information specified in paragraph (b) of this Item with respect to any purchase made by or on behalf of the registrant or any “affiliated purchaser,” as defined in Rule 10b-18(a)(3) under the Exchange Act (17 CFR 240.10b-18(a)(3)), of shares or other units of any class of the registrant’s equity securities that is registered by the registrant pursuant to Section 12 of the Exchange Act (15 U.S.C. 781).
Not applicable.
ITEM 10. SUBMISSION OF MATTERS TO A VOTE OF SECURITY HOLDERS.
Describe any material changes to the procedures by which shareholders may recommend nominees to the registrant’s board of directors, where those changes were implemented after the registrant last provided disclosure in response to the requirements of Item 7(d)(2)(ii)(G) of Schedule 14A (17 CFR 240.14a-101), or this Item.
No material changes to report.
ITEM 11. CONTROLS AND PROCEDURES.
(a) Disclose the conclusions of the registrant’s principal executive and principal financial officers, or persons performing similar functions, regarding the effectiveness of the registrant’s disclosure controls and procedures (as defined in Rule 30a-3(c) under the Act (17 CFR 270.30a-3(c))) as of a date within 90 days of the filing date of the report that includes the disclosure required by this paragraph, based on the evaluation of these controls and procedures required by Rule 30a-3(b) under the Act (17 CFR 270.30a-3(b)) and Rules 13a-15(b) or 15d-15(b) under the Exchange Act (17 CFR 240.13a-15(b) or 240.15d-15(b)).
The Registrant’s principal executive and principal financial officers have concluded, based on their evaluation of the Registrant’s disclosure controls and procedures as of a date within 90 days of the filing date of this report, that the Registrant’s disclosure controls and procedures are reasonably designed to ensure that information required to be disclosed by the Registrant on Form N-CSR is recorded, processed, summarized and reported within the required time periods and that information required to be disclosed by the Registrant in the reports that it files or submits on Form N-CSR is accumulated and communicated to the Registrant’s management, including its principal executive and principal financial officers, as appropriate to allow timely decisions regarding required disclosure.
(b) Disclose any change in the registrant’s internal control over financial reporting (as defined in Rule 30a-3(d) under the Act (17 CFR 270.30a-3(d)) that occurred during the registrant’s second fiscal quarter of the period covered by this report that has materially affected, or is reasonably likely to materially affect, the registrant’s internal control over financial reporting.
There were no changes in the Registrant’s internal control over financial reporting that occurred during the last fiscal quarter covered by this report that have materially affected, or are reasonably likely to materially affect, the Registrant’s internal control over financial reporting.
ITEM 12. EXHIBITS.
(a) File the exhibits listed below as part of this Form. Letter or number the exhibits in the sequence indicated.
(a)(1) Any code of ethics, or amendment thereto, that is the subject of the disclosure required by Item 2, to the extent that the registrant intends to satisfy the Item 2 requirements through filing of an exhibit.
Not applicable.
(a)(2) A separate certification for each principal executive officer and principal financial officer of the registrant as required by Rule 30a-2(a) under the Act (17 CFR 270.30a-2).
Certifications pursuant to Rule 30a-2(a) under the Investment Company Act of 1940 are attached hereto.
(a)(3) Any written solicitation to purchase securities under Rule 23c-1 under the Act (17 CFR 270.23c-1) sent or given during the period covered by the report by or on behalf of the registrant to 10 or more persons.
Not applicable.
(b) A separate or combined certification for each principal executive officer and principal officer of the registrant as required by Rule 30a-2(b) under the Act of 1940.
Certifications pursuant to Rule 30a-2(b) under the Investment Company Act of 1940 are attached hereto.
SIGNATURES
Pursuant to the requirements of the Securities Exchange Act of 1934 and the Investment Company Act of 1940, the registrant has duly caused this report to be signed on its behalf by the undersigned, thereunto duly authorized.
JPMorgan Trust I
| | |
| By: | | /s/ Brian S. Shlissel |
| | Brian S. Shlissel |
| | President and Principal Executive Officer |
| | May 4, 2017 |
Pursuant to the requirements of the Securities Exchange Act of 1934 and the Investment Company Act of 1940, this report has been signed below by the following persons on behalf of the registrant and in the capacities and on the dates indicated.
| | |
| By: | | /s/ Brian S. Shlissel |
| | Brian S. Shlissel |
| | President and Principal Executive Officer |
| | May 4, 2017 |
| |
| By: | | /s/ Laura M. Del Prato |
| | Laura M. Del Prato |
| | Treasurer and Principal Financial Officer |
| | May 4, 2017 |