UNITED STATES
SECURITIES AND EXCHANGE COMMISSION
Washington, D.C. 20549
FORM N-CSR
CERTIFIED SHAREHOLDER REPORT OF REGISTERED
MANAGEMENT INVESTMENT COMPANIES
Investment Company Act file number: 811-21295
JPMorgan Trust I
(Exact name of registrant as specified in charter)
270 Park Avenue
New York, NY 10017
(Address of principal executive offices) (Zip code)
Frank J. Nasta
270 Park Avenue
New York, NY 10017
(Name and Address of Agent for Service)
Registrant’s telephone number, including area code: (800) 480-4111
Date of fiscal year end: December 31
Date of reporting period: January 1, 2017 through June 30, 2017
Form N-CSR is to be used by management investment companies to file reports with the Commission not later than 10 days after the transmission to stockholders of any report that is required to be transmitted to stockholders under Rule 30e-1 under the Investment Company Act of 1940 (17 CFR 270.30e-1). The Commission may use the information provided on Form N-CSR in its regulatory, disclosure review, inspection, and policymaking roles.
A registrant is required to disclose the information specified by Form N-CSR, and the Commission will make this information public. A registrant is not required to respond to the collection of information contained in Form N-CSR unless the Form displays a currently valid Office of Management and Budget (“OMB”) control number. Please direct comments concerning the accuracy of the information collection burden estimate and any suggestions for reducing the burden to Secretary, Securities and Exchange Commission, 450 Fifth Street, NW, Washington, DC 20549-0609. The OMB has reviewed this collection of information under the clearance requirements of 44 U.S.C. Section 3507.
ITEM 1. REPORTS TO STOCKHOLDERS.
The following is a copy of the report transmitted to shareholders pursuant to Rule 30e-1 under the Investment Company Act of 1940 (17 CFR 270.30e-1).
Semi-Annual Report
J.P. Morgan Specialty Funds
June 30, 2017 (Unaudited)
Security Capital U.S. Core Real Estate Securities Fund

CONTENTS
Investments in the Fund are not deposits or obligations of, or guaranteed or endorsed by, any bank and are not insured or guaranteed by the FDIC, the Federal Reserve Board or any other government agency. You could lose money if you sell when the Fund’s share price is lower than when you invested.
Past performance is no guarantee of future performance. The general market views expressed in this report are opinions based on market and other conditions through the end of the reporting period and are subject to change without notice. These views are not intended to predict the future performance of the Fund or the securities markets. References to specific securities and their issuers are for illustrative purposes only and are not intended to be, and should not be interpreted as, recommendations to purchase or sell such securities. Such views are not meant as investment advice and may not be relied on as an indication of trading intent on behalf of the Fund.
Prospective investors should refer to the Fund’s prospectus for a discussion of the Fund’s investment objective, strategies and risks. Call J.P. Morgan Funds Service Center at 1-800-480-4111 for a prospectus containing more complete information about the Fund, including management fees and other expenses. Please read it carefully before investing.
CEO’S LETTER
August 4, 2017 (Unaudited)
Dear Shareholder,
As the U.S. economic expansion entered its eighth year in 2017, growth in both developed and emerging market economies became increasingly synchronized even as U.S. growth cooled in the early part of the year. Amid an environment of economic growth, low inflation and rising corporate earnings, global financial markets overall produced positive returns.
| | |
 | | “In the U.S., the continued economic expansion, muted inflation, corporate earnings growth and historically low volatility in financial markets helped to drive key equity market indexes to multiple record closing highs throughout the first half of 2017.” |
While U.S. gross domestic product (GDP) growth slowed to 1.2% in the first quarter of 2017, it rebounded to 2.6% growth in the second quarter of 2017 on the back of a surge in consumer spending. Meanwhile, the U.S. jobless rate continued to shrink and fell to 4.4% in June 2017 from 4.8% six months earlier. In response to these numbers, along with nascent signs of price inflation, the U.S. Federal Reserve (the “Fed”) raised interest rates in June 2017 and signaled it would raise rates once more before the end of the year. Fed Chairwoman Janet Yellen also indicated she was prepared to begin partially unwinding the central bank’s $4.5 trillion balance sheet of assets purchased through its quantitative easing program.
Despite the apparent health of the U.S. economy, by mid-2017 domestic price inflation was below the Fed’s target of 2% growth and wage growth remained below economists’ expectations, the latter despite an environment of essentially full employment for U.S. workers. These trends — and the Fed’s acknowledgment of them — provided some near-term uncertainty about the central bank’s commitment to tightening monetary policy.
Throughout the first half of 2017, global energy prices continued to fall amid an oversupply of crude oil and natural gas. Despite efforts by the Organization of Petroleum Exporting
Countries to curb global production, the price of a barrel of benchmark West Texas Intermediate crude oil dropped to $46 by the end of June 2017.
Meanwhile, the leading economies of the European Union (the “EU”) continued to strengthen. Annualized GDP for the 19 core EU nations rose 1.9% in the first quarter of 2017 and 2.1% in the second quarter. The June 2017 aggregate unemployment rate for those nations fell to 9.1%, the lowest level since March 2009. Also, in separate elections, voters in the Netherlands and France largely rejected populist campaigns espousing policies to limit free trade and immigration. The election results provided another boost to global equity prices.
In the U.S., the continued economic expansion, muted inflation, corporate earnings growth and historically low volatility in financial markets helped to drive key equity market indexes to multiple record closing highs throughout the first half of 2017. U.S. investors appeared to shrug off intermittent political and policy dramas emanating from Washington, D.C. and extended the run-up in U.S. equity prices into its eighth consecutive year — one of the longest on record. For the six months ended June 30, 2017, the Standard & Poor’s 500 Index returned 9.34%.
U.S. and foreign financial markets largely rewarded those investors who remained fully invested throughout the first half of 2017, reaffirming the fundamental virtues of patience and diversification within a prudent investment strategy.
We look forward to managing your investment needs for years to come. Should you have any questions, please visit www.jpmorganfunds.com or contact the J.P. Morgan Funds Service Center at 1-800-480-4111.
Sincerely yours,

George C.W. Gatch
CEO, Global Funds Management & Institutional,
J.P. Morgan Asset Management
| | | | | | | | |
| | | |
| JUNE 30, 2017 | | J.P. MORGAN SPECIALTY FUNDS | | | | | 1 | |
J.P. Morgan Specialty Funds
MARKET OVERVIEW
SIX MONTHS ENDED JUNE 30, 2017 (Unaudited)
Real estate investment trust (“REIT”) common equity securities generated attractive total returns in the second quarter of 2017 in the context of easing long-term interest rates but with a high degree of variability among property segments as investors responded to signs of weaker supply/demand trends, particularly for retail real estate. For the six months ended June 30, 2017, the Wilshire U.S. Real Estate Securities Index posted a gain of 2.42%, compared with a 9.34% return for the Standard & Poor’s 500 Index.
Benefitting from the pullback in long-term interest rates, REIT senior fixed income securities — particularly perpetual preferred securities — generated attractive returns in the second quarter. For the six months ended June 30, 2017, the Wells Fargo Hybrid and Preferred Securities REIT Index posted a return of 8.76%, and the Bloomberg Barclays Investment Grade REIT Index generated a return of 3.31%.
Volatility and dislocation… two words that we believe captured the essence of pricing in public real estate markets during the reporting period, and may have signaled a compelling opportunity for astute and targeted investors. As we have reported in the past, there are myriad factors that fuel pricing volatility in public real estate markets… volatility for the market as a whole and also across and even within property segments. These factors include the expanded role of generalist investors in the REIT space, policy cross-currents associated with a change in U.S. presidential administrations and, importantly, greater uncertainty surrounding late-cycle supply/demand operating fundamentals for many property segments.
Against this backdrop of pricing volatility, we believe that other factors created significant pockets of pricing dislocation, causing a wedge between fundamental cash flow values and current trading sentiments and emotions in the public markets. We saw this in retail, for example, where the “internet trade” is ravaging the public pricing of retail real estate owners with the view that significant swaths of their assets are increasingly obsolete in the emerging age of e-commerce. Although this view could be accurate, we believe that well-capitalized public owners have been actively culling their portfolios of weaker assets for many years now. While we believe on-line commerce will certainty redefine winners and losers in retail, well located, high quality real estate may well become more valuable in the omni-channel retail models already taking shape.
We believe that we have seen similar patterns: Three years ago, the public market dislocation opportunity was in industrial warehouse companies. Public investors were laser-focused on a significant ramp-up in new industrial supply, missing the broader secular theme of prospective new demand associated with e-commerce. Also, it’s amusing to recall the predictions for urban office space that accompanied the dawn of the Internet. The ability to work anywhere was predicted to free us from expensive and low quality-of-life urban living, and would render urban office markets obsolete. Today, employers find themselves unable to attract and retain scarce talent outside of the innovation and social ecosystems that have become many of our cities.
We believe mining value from volatility and dislocation in public real estate markets is a compelling opportunity for real estate investors, particularly as aggregate expected total returns in real estate continue to normalize to the realities of late cycle supply/demand fundamentals for many property segments. Where there may be mispricing for a company, a property type or for the market as a whole, public markets provide for transacting in or out of diverse, high-quality portfolios in an efficient manner. Remarkably, these targeted public return opportunities involve a highly attractive risk-return relationship in our view, reflecting the quality and diversity of the underlying real estate, conservative balance sheets and investment liquidity. As we saw in 2015, and with two privatization transactions in the second quarter of 2017, global institutional demand for U.S. real estate investments remained strong with abundant private capital ready to take advantage of public market overreactions where they occurred.
At the end of the day, real estate stocks are not a homogenous group, and we believe investors can expect to see a dispersed pattern of performance moving forward, with absolute winners and losers under a broad range of economic scenarios. We believe successful investing in this environment requires the resources to analyze and fully understand the underlying real estate markets, capital structures, cash flow growth opportunities, and risks under alternative economic scenarios. It also requires patience and conviction to move against the market’s momentum often so keenly focused on shorter-term earnings targets and events. These qualities are fundamental to our investment approach and we believe they will enable us to produce attractive risk-adjusted investment returns over the longer term.
| | | | | | |
| | | |
| 2 | | | | J.P. MORGAN SPECIALTY FUNDS | | JUNE 30, 2017 |
Security Capital U.S. Core Real Estate Securities Fund
FUND COMMENTARY
SIX MONTHS ENDED JUNE 30, 2017 (Unaudited)
| | | | |
| REPORTING PERIOD RETURN: | |
| Fund (Class I Shares)1* | | | 2.51% | |
| Wilshire U.S. Real Estate Securities Index | | | 2.43% | |
| Bloomberg Barclays Investment Grade REIT Index | | | 3.31% | |
| U.S. Core Real Estate Composite Benchmark | | | 3.34% | |
| |
| Net Assets as of 6/30/2017 (In Thousands) | | $ | 105,044 | |
INVESTMENT OBJECTIVE**
The Security Capital U.S. Core Real Estate Securities Fund (the “Fund”) seeks a risk-adjusted total return over the long term by investing primarily in real estate securities.
WHAT WERE THE MAIN DRIVERS OF THE FUND’S PERFORMANCE?
The Fund’s Class I Shares generated a positive return for the six months ended June 30, 2017, outperforming the all-common equity Wilshire U.S. Real Estate Securities Index (“WILRESI”), while underperforming the Bloomberg Barclays Investment Grade REIT Index and the U.S. Core Real Estate Securities Composite Benchmark. The Fund invests in equity and fixed income securities of publicly listed real estate companies and, therefore, its performance is compared with multiple benchmarks, including real estate investment trust (“REIT”) equity and fixed income benchmarks as well as a blended composite benchmark.
The Fund’s REIT common equity holdings represented 68.4% of the portfolio and generated positive returns for the six month reporting period. Among the Fund’s common stock holdings, stock selection among office, hotel and industrial companies was a key positive performance factor for the reporting period
relative to the WILRESI. These factors were partly offset by weaker relative performance from overweight positions in the underperforming strip center, regional malls and self-storage sectors.
In absolute terms, the Fund’s investments in REIT preferred equity and REIT debt, representing 21.7% and 9.1% of the portfolio, respectively, generated positive returns for the six month reporting period, contributing to the Fund’s relative outperformance versus the WILRESI. This reflected wide yield spreads among REIT preferred equity and the Fund’s positioning in REIT debt holdings with shorter maturities.
HOW WAS THE FUND POSITIONED?
The Fund’s portfolio managers utilized a bottom-up process to inform both security selection and security type (common equity, preferred equity or debt). They relied on proprietary cash flow models, extensive field work and internal real estate market research to target what they believed to be attractive long-term investment opportunities, emphasizing quality real estate portfolios, flexible balance sheets and transparent business models.
| 1 | | On April 3, 2017, the Fund’s Select Class Shares were renamed Class I shares. |
| | | | | | | | |
| | | |
| JUNE 30, 2017 | | J.P. MORGAN SPECIALTY FUNDS | | | | | 3 | |
Security Capital U.S. Core Real Estate Securities Fund
FUND COMMENTARY
SIX MONTHS ENDED JUNE 30, 2017 (Unaudited) (continued)
| | | | | | | | |
| TOP TEN HOLDINGS OF THE PORTFOLIO*** | |
| | 1. | | | Simon Property Group, Inc. | | | 5.6 | % |
| | 2. | | | Prologis, Inc. | | | 4.5 | |
| | 3. | | | AvalonBay Communities, Inc. | | | 3.6 | |
| | 4. | | | Equity Residential | | | 3.1 | |
| | 5. | | | Equinix, Inc. | | | 3.0 | |
| | 6. | | | HCP, Inc. | | | 2.9 | |
| | 7. | | | Welltower, Inc. | | | 2.6 | |
| | 8. | | | Public Storage | | | 2.5 | |
| | 9. | | | Vornado Realty Trust | | | 2.2 | |
| | 10. | | | Corporate Office Properties LP,
3.600%, 05/15/23 | | | 2.2 | |
| | | | |
PORTFOLIO COMPOSITION BY SECURITY TYPE*** | |
| Common Stocks | | | 68.4 | % |
| Preferred Stocks | | | 20.7 | |
| Corporate Bonds | | | 9.2 | |
| Short-Term Investment | | | 1.7 | |
| * | | The return shown is based on net asset values calculated for shareholder transactions and may differ from the return shown in the financial highlights, which reflects adjustments made to the net asset values in accordance with accounting principles generally accepted in the United States of America. |
| ** | | The adviser seeks to achieve the Fund’s objective. There can be no guarantee it will be achieved. |
| *** | | Percentages indicated are based on total investments as of June 30, 2017. The Fund’s portfolio composition is subject to change. |
| | | | | | | | |
GEOGRAPHIC DIVERSIFICATION | |
| | | Security Capital U.S.
Core Real Estate
Securities Fund (a) | | | NCREIF (b) | |
East | | | 37.2 | % | | | 33.2 | % |
Northeast | | | 21.0 | % | | | 21.7 | % |
Mideast | | | 16.2 | % | | | 11.5 | % |
West | | | 29.4 | % | | | 38.4 | % |
Pacific | | | 24.0 | % | | | 31.9 | % |
Mountain | | | 5.4 | % | | | 6.5 | % |
South | | | 18.7 | % | | | 19.7 | % |
Southeast | | | 10.9 | % | | | 9.3 | % |
Southwest | | | 7.8 | % | | | 10.4 | % |
Midwest | | | 9.8 | % | | | 8.7 | % |
East North Central | | | 7.4 | % | | | 7.3 | % |
West North Central | | | 2.4 | % | | | 1.4 | % |
Non-U.S. | | | 4.9 | % | | | 0.0 | % |
| (a) | | Percentages indicated are based on total investments as of June 30, 2017. The Fund’s portfolio composition is subject to change. |
| (b) | | Reflects the industry average of institutions belonging to the National Council of Real Estate Investment Fiduciaries. |
| | | | | | |
| | | |
| 4 | | | | J.P. MORGAN SPECIALTY FUNDS | | JUNE 30, 2017 |
| | | | | | | | | | | | | | | | | | | | |
AVERAGE ANNUAL TOTAL RETURNS AS OF JUNE 30, 2017 | |
| | | | | |
| | | INCEPTION DATE OF
CLASS | | | 6 MONTH* | | | 1 YEAR | | | 5 YEAR | | | SINCE
INCEPTION | |
CLASS A SHARES | | | August 31, 2011 | | | | | | | | | | | | | | | | | |
With Sales Charge** | | | | | | | (2.99 | )% | | | (5.57 | )% | | | 5.76 | % | | | 6.90 | % |
Without Sales Charge | | | | | | | 2.39 | | | | (0.34 | ) | | | 6.91 | | | | 7.89 | |
CLASS C SHARES | | | August 31, 2011 | | | | | | | | | | | | | | | | | |
With CDSC*** | | | | | | | 1.12 | | | | (1.84 | ) | | | 6.36 | | | | 7.35 | |
Without CDSC | | | | | | | 2.12 | | | | (0.84 | ) | | | 6.36 | | | | 7.35 | |
CLASS I SHARES (FORMERLY SELECT CLASS SHARES) | | | August 31, 2011 | | | | 2.51 | | | | (0.10 | ) | | | 7.16 | | | | 8.17 | |
CLASS R5 SHARES | | | August 31, 2011 | | | | 2.61 | | | | 0.11 | | | | 7.37 | | | | 8.38 | |
CLASS R6 SHARES | | | August 31, 2011 | | | | 2.64 | | | | 0.16 | | | | 7.44 | | | | 8.44 | |
| ** | | Sales Charge for Class A Shares is 5.25%. |
| *** | | Assumes a 1% CDSC (contingent deferred sales charge) for the 6 month and one year period and 0% CDSC thereafter. |
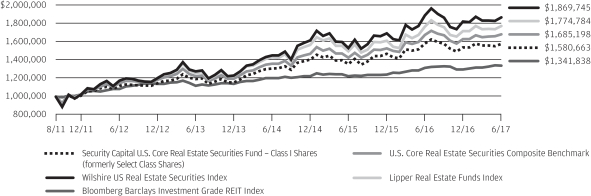
LIFE OF FUND PERFORMANCE (8/31/11 TO 6/30/2017)
The performance quoted is past performance and is not a guarantee of future results. Mutual funds are subject to certain market risks. Investment returns and principal value of an investment will fluctuate so that an investor’s shares, when redeemed, may be worth more or less than their original cost. Current performance may be higher or lower than the performance data shown. For up-to-date month-end performance information please call 1-800-480-4111.
The Fund commenced operations on August 31, 2011.
The graph illustrates comparative performance for $1,000,000 invested in Class I Shares of the Security Capital U.S. Core Real Estate Securities Fund, the Wilshire US Real Estate Securities Index, Bloomberg Barclays Investment Grade REIT Index, U.S. Core Real Estate Securities Composite Benchmark and the Lipper Real Estate Funds Index from August 31, 2011 to June 30, 2017. The performance of the Fund assumes reinvestment of all dividends and capital gain distributions, if any, and does not include a sales charge. The performance of the indices, other than the Lipper Real Estate Funds Index, does not reflect the deduction of expenses or a sales charge associated with a mutual fund and has been adjusted to reflect reinvestment of all dividends and capital gain distributions of the securities included in the benchmark, if applicable. The performance of the Lipper Real Estate Funds Index includes expenses associated with a mutual fund, such as investment management fees. These expenses are not identical to the expenses incurred by the Fund. The Wilshire US Real Estate Securities Index is an unmanaged, float-adjusted market capitalization-weighted index comprising publicly traded REITs and real estate operating companies, not including special purpose REITs. It is comprised of major
companies engaged in the equity ownership and operation of commercial real estate. The Bloomberg Barclays Investment Grade REIT Index includes publicly issued U.S. corporate and secured notes that meet the specified maturity, liquidity, and quality requirements. To qualify, bonds must be SEC-registered or 144a securities with registration rights and only includes the portion of the Bloomberg Barclays U.S. Corporate Index deemed to be a Real Estate Investment Trust. The U.S. Core Real Estate Securities Composite Benchmark is a composite benchmark comprised of unmanaged indices that includes 60% Wilshire US Real Estate Securities Index, 10% Wells Fargo Hybrid and Preferred Securities REIT Index and 30% Bloomberg Barclays Investment Grade REIT Index. The Lipper Real Estate Funds Index represents the total returns of the funds in the indicated category as defined by Lipper, Inc. Investors cannot invest directly in an index.
Class I Shares have a $1,000 minimum initial investment.
Fund performance may reflect the waiver of the Fund’s fees and reimbursement of expenses for certain periods since the inception date. Without these waivers and reimbursements, performance would have been lower. Also, performance shown in this section does not reflect the deduction of taxes that a shareholder would pay on Fund distributions or redemptions of Fund shares.
The returns shown are based on net asset values calculated for shareholder transactions and may differ from the returns shown in the financial highlights, which reflect adjustments made to the net asset values in accordance with accounting principles generally accepted in the United States of America.
| | | | | | | | |
| | | |
| JUNE 30, 2017 | | J.P. MORGAN SPECIALTY FUNDS | | | | | 5 | |
Security Capital U.S. Core Real Estate Securities Fund
SCHEDULE OF PORTFOLIO INVESTMENTS
AS OF JUNE 30, 2017 (Unaudited)
(Amounts in thousands)
| | | | | | | | |
SHARES | | | SECURITY DESCRIPTION | | VALUE($) | |
| | Common Stocks — 67.7% | |
| | | | Apartments — 12.8% | |
| | 70 | | | American Homes 4 Rent, Class A | | | 1,591 | |
| | 22 | | | Apartment Investment & Management Co., Class A | | | 943 | |
| | 19 | | | AvalonBay Communities, Inc. | | | 3,720 | |
| | 48 | | | Equity Residential | | | 3,177 | |
| | 7 | | | Essex Property Trust, Inc. | | | 1,903 | |
| | 10 | | | Sun Communities, Inc. | | | 863 | |
| | 33 | | | UDR, Inc. | | | 1,280 | |
| | | | | | | | |
| | | | | | | 13,477 | |
| | | | | | | | |
| | | | Health Care — 7.9% | |
| | 94 | | | HCP, Inc. | | | 3,019 | |
| | 59 | | | Senior Housing Properties Trust | | | 1,203 | |
| | 21 | | | Ventas, Inc. | | | 1,429 | |
| | 36 | | | Welltower, Inc. | | | 2,666 | |
| | | | | | | | |
| | | | | | | 8,317 | |
| | | | | | | | |
| | | | Hotels — 4.1% | |
| | 18 | | | Hospitality Properties Trust | | | 533 | |
| | 97 | | | Host Hotels & Resorts, Inc. | | | 1,779 | |
| | 23 | | | LaSalle Hotel Properties | | | 676 | |
| | 21 | | | Park Hotels & Resorts, Inc. | | | 566 | |
| | 25 | | | Pebblebrook Hotel Trust | | | 795 | |
| | | | | | | | |
| | | | | | | 4,349 | |
| | | | | | | | |
| | | | Industrial — 12.3% | |
| | 14 | | | CoreSite Realty Corp. | | | 1,409 | |
| | 14 | | | CyrusOne, Inc. | | | 800 | |
| | 9 | | | Digital Realty Trust, Inc. | | | 1,032 | |
| | 7 | | | Equinix, Inc. | | | 3,088 | |
| | 47 | | | Liberty Property Trust | | | 1,901 | |
| | 79 | | | Prologis, Inc. | | | 4,640 | |
| | | | | | | | |
| | | | | | | 12,870 | |
| | | | | | | | |
| | | | Office — 9.2% | |
| | 16 | | | Alexandria Real Estate Equities, Inc. | | | 1,879 | |
| | 15 | | | Boston Properties, Inc. | | | 1,787 | |
| | 40 | | | Douglas Emmett, Inc. | | | 1,534 | |
| | 43 | | | Hudson Pacific Properties, Inc. | | | 1,455 | |
| | 9 | | | Kilroy Realty Corp. | | | 652 | |
| | 25 | | | Vornado Realty Trust | | | 2,326 | |
| | | | | | | | |
| | | | | | | 9,633 | |
| | | | | | | | |
| | | | Regional Malls — 9.0% | |
| | 39 | | | GGP, Inc. | | | 921 | |
| | 37 | | | Macerich Co. (The) | | | 2,160 | |
| | 36 | | | Simon Property Group, Inc. | | | 5,782 | |
| | 11 | | | Taubman Centers, Inc. | | | 636 | |
| | | | | | | | |
| | | | | | | 9,499 | |
| | | | | | | | |
| | | | | | | | |
| | | | | | | | |
SHARES | | | SECURITY DESCRIPTION | | VALUE($) | |
| | | | | | | | |
| | | | Shopping Centers — 6.2% | |
| | 113 | | | DDR Corp. | | | 1,028 | |
| | 6 | | | Federal Realty Investment Trust | | | 787 | |
| | 59 | | | Kimco Realty Corp. | | | 1,076 | |
| | 37 | | | Kite Realty Group Trust | | | 706 | |
| | 21 | | | Regency Centers Corp. | | | 1,300 | |
| | 54 | | | Weingarten Realty Investors | | | 1,636 | |
| | | | | | | | |
| | | | | | | 6,533 | |
| | | | | | | | |
| | | | Storage — 6.2% | |
| | 44 | | | CubeSmart | | | 1,055 | |
| | 18 | | | Extra Space Storage, Inc. | | | 1,389 | |
| | 19 | | | Life Storage, Inc. | | | 1,433 | |
| | 12 | | | Public Storage | | | 2,581 | |
| | | | | | | | |
| | | | | | | 6,458 | |
| | | | | | | | |
| | | | Total Common Stocks
(Cost $62,055) | | | 71,136 | |
| | | | | | | | |
| | |
PRINCIPAL
AMOUNT($) | | | | | | |
| | Corporate Bonds — 9.1% | |
| | | | Apartments — 0.2% | |
| | 197 | | | Post Apartment Homes LP, 3.375%, 12/01/22 | | | 200 | |
| | | | | | | | |
| | | | Health Care — 2.7% | |
| | 298 | | | HCP, Inc., 4.000%, 12/01/22 | | | 311 | |
| | | | Senior Housing Properties Trust, | | | | |
| | 1,428 | | | 6.750%, 04/15/20 | | | 1,549 | |
| | 879 | | | 6.750%, 12/15/21 | | | 980 | |
| | | | | | | | |
| | | | | | | 2,840 | |
| | | | | | | | |
| | | | Industrial — 0.2% | |
| | 252 | | | DCT Industrial Operating Partnership LP, 4.500%, 10/15/23 | | | 265 | |
| | | | | | | | |
| | | | Office — 4.3% | |
| | 232 | | | Alexandria Real Estate Equities, Inc.,
4.600%, 04/01/22 | | | 248 | |
| | | | Corporate Office Properties LP, | | | | |
| | 2,305 | | | 3.600%, 05/15/23 | | | 2,291 | |
| | 1,293 | | | 3.700%, 06/15/21 | | | 1,324 | |
| | 140 | | | Equity Commonwealth, 5.875%, 09/15/20 | | | 150 | |
| | 451 | | | Government Properties Income Trust,
3.750%, 08/15/19 | | | 454 | |
| | 67 | | | SL Green Realty Corp., 4.500%, 12/01/22 | | | 69 | |
| | | | | | | | |
| | | | | | | 4,536 | |
| | | | | | | | |
| | | | Regional Malls — 1.0% | |
| | | | CBL & Associates LP, | | | | |
| | 600 | | | 4.600%, 10/15/24 | | | 553 | |
| | 480 | | | 5.250%, 12/01/23 | | | 468 | |
| | | | | | | | |
| | | | | | | 1,021 | |
| | | | | | | | |
SEE NOTES TO FINANCIAL STATEMENTS.
| | | | | | |
| | | |
| 6 | | | | J.P. MORGAN SPECIALTY FUNDS | | JUNE 30, 2017 |
| | | | | | | | |
PRINCIPAL
AMOUNT($) | | | SECURITY DESCRIPTION | | VALUE($) | |
| | Corporate Bonds — continued | |
| | | | Shopping Centers — 0.7% | |
| | 117 | | | Equity One, Inc., 3.750%, 11/15/22 | | | 121 | |
| | 593 | | | Retail Properties of America, Inc.,
4.000%, 03/15/25 | | | 569 | |
| | | | | | | | |
| | | | | | | 690 | |
| | | | | | | | |
| | | | Total Corporate Bonds
(Cost $9,424) | | | 9,552 | |
| | | | | | | | |
| | |
| SHARES | | | | | | |
| | Preferred Stocks — 20.5% | |
| | | | Apartments — 4.1% | |
| | 70 | | | American Homes 4 Rent, Series D,
6.500%, 05/24/21 ($25 par value) @ | | | 1,806 | |
| | 34 | | | American Homes 4 Rent, Series E,
6.350%, 06/29/21 ($25 par value) @ | | | 869 | |
| | 18 | | | American Homes 4 Rent, Series F,
5.875%, 04/24/22 ($25 par value) @ | | | 460 | |
| | 36 | | | Apartment Investment & Management Co., 6.875%, 05/16/19 ($25 par value) @ | | | 967 | |
| | 3 | | | Equity LifeStyle Properties, Inc., Series C,
6.750%, 09/07/17 @ | | | 84 | |
| | 3 | | | Sun Communities, Inc., Series A,
7.125%, 11/14/17 ($25 par value) @ | | | 78 | |
| | | | | | | | |
| | | | | | | 4,264 | |
| | | | | | | | |
| | | | Health Care — 0.3% | |
| | 10 | | | Sabra Health Care REIT, Inc., Series A, 7.125%, 03/21/18 ($25 par value) @ | | | 249 | |
| | 5 | | | Senior Housing Properties Trust, 6.250%, 02/01/46 ($25 par value) | | | 123 | |
| | | | | | | | |
| | | | | | | 372 | |
| | | | | | | | |
| | | | Hotels — 2.7% | |
| | 27 | | | Ashford Hospitality Trust, Inc., Series D,
8.450%, 08/02/17 ($25 par value) @ | | | 674 | |
| | 26 | | | LaSalle Hotel Properties, Series J,
6.300%, 05/25/21 ($25 par value) @ | | | 661 | |
| | 46 | | | Sunstone Hotel Investors, Inc., Series E,
6.950%, 03/11/21 ($25 par value) @ | | | 1,200 | |
| | 10 | | | Sunstone Hotel Investors, Inc., Series F,
6.450%, 05/17/21 ($25 par value) @ | | | 257 | |
| | | | | | | | |
| | | | | | | 2,792 | |
| | | | | | | | |
| | | | Industrial — 0.3% | |
| | 11 | | | Digital Realty Trust, Inc., Series I,
6.350%, 08/24/20 ($25 par value) @ | | | 310 | |
| | | | | | | | |
| | | | Office — 3.6% | |
| | 66 | | | SL Green Realty Corp., Series I,
6.500%, 08/10/17 ($25 par value) @ | | | 1,656 | |
| | 42 | | | Urstadt Biddle Properties, Inc., Series F,
7.125%, 10/24/17 ($25 par value) @ | | | 1,072 | |
| | | | | | | | |
SHARES | | | SECURITY DESCRIPTION | | VALUE($) | |
| | | | | | | | |
| | | | Office — continued | |
| | 2 | | | Urstadt Biddle Properties, Inc., Series G, 6.750%, 10/28/19 ($25 par value) @ | | | 56 | |
| | 10 | | | VEREIT, Inc., Series F,
6.700%, 01/03/19 ($25 par value) @ | | | 269 | |
| | 20 | | | Vornado Realty Trust, Series G,
6.625%, 08/02/17 ($25 par value) @ | | | 522 | |
| | 8 | | | Vornado Realty Trust, Series K,
5.700%, 08/01/17 ($25 par value) @ | | | 200 | |
| | | | | | | | |
| | | | | | | 3,775 | |
| | | | | | | | |
| | | | Regional Malls — 6.2% | |
| | 66 | | | CBL & Associates Properties, Inc., Series D, 7.375%, 08/02/17 ($25 par value) @ | | | 1,533 | |
| | 74 | | | GGP, Inc., Series A,
6.375%, 02/13/18 ($25 par value) @ | | | 1,881 | |
| | 21 | | | Pennsylvania REIT, Series A,
8.250%, 08/01/17 ($25 par value) @ | | | 537 | |
| | 5 | | | Pennsylvania REIT, Series B,
7.375%, 10/11/17 ($25 par value) @ | | | 135 | |
| | 45 | | | Pennsylvania REIT, Series C,
7.200%, 01/27/22 ($25 par value) @ | | | 1,204 | |
| | 2 | | | Taubman Centers, Inc., Series J,
6.500%, 08/14/17 ($25 par value) @ | | | 47 | |
| | 23 | | | Taubman Centers, Inc., Series K,
6.250%, 03/15/18 ($25 par value) @ | | | 577 | |
| | 23 | | | Washington Prime Group, Inc., Series H,
7.500%, 08/10/17 ($25 par value) @ | | | 588 | |
| | | | | | | | |
| | | | | | | 6,502 | |
| | | | | | | | |
| | | | Shopping Centers — 3.0% | |
| | 38 | | | DDR Corp., Series A,
6.375%, 06/05/22 ($25 par value) @ | | | 994 | |
| | 14 | | | DDR Corp., Series J,
6.500%, 08/01/17 ($25 par value) @ | | | 345 | |
| | 21 | | | DDR Corp., Series K,
6.250%, 04/09/18 ($25 par value) @ | | | 529 | |
| | 1 | | | Regency Centers Corp., Series 7, 6.000%, 08/23/17 ($25 par value) @ | | | 13 | |
| | 24 | | | Retail Properties of America, Inc., Series A, 7.000%, 12/20/17 ($25 par value) @ | | | 623 | |
| | 24 | | | Saul Centers, Inc., Series C,
6.875%, 02/12/18 ($25 par value) @ | | | 624 | |
| | | | | | | | |
| | | | | | | 3,128 | |
| | | | | | | | |
| | | | Storage — 0.3% | |
| | 13 | | | Public Storage, Series V,
5.375%, 09/20/17 ($25 par value) @ | | | 319 | |
| | 1 | | | Public Storage, Series Y,
6.375%, 03/17/19 ($25 par value) @ | | | 38 | |
| | | | | | | | |
| | | | | | | 357 | |
| | | | | | | | |
| | | | Total Preferred Stocks
(Cost $21,181) | | | 21,500 | |
| | | | | | | | |
SEE NOTES TO FINANCIAL STATEMENTS.
| | | | | | | | |
| | | |
| JUNE 30, 2017 | | J.P. MORGAN SPECIALTY FUNDS | | | | | 7 | |
Security Capital U.S. Core Real Estate Securities Fund
SCHEDULE OF PORTFOLIO INVESTMENTS
AS OF JUNE 30, 2017 (Unaudited) (continued)
(Amounts in thousands)
| | | | | | | | |
SHARES | | | SECURITY DESCRIPTION | | VALUE($) | |
| | Short-Term Investment — 1.7% | |
| | | | Investment Company — 1.7% | |
| | 1,767 | | | JPMorgan U.S. Government Money Market Fund, Institutional Class Shares, 0.840% (b) (l) (Cost $1,767) | | | 1,767 | |
| | | | | | | | |
| | | | Total Investments — 99.0%
(Cost $94,427) | | | 103,955 | |
| | | | Other Assets in Excess
of Liabilities — 1.0% | | | 1,089 | |
| | | | | | | | |
| | | | NET ASSETS — 100.0% | | $ | 105,044 | |
| | | | | | | | |
Percentages indicated are based on net assets.
NOTES TO SCHEDULE OF PORTFOLIO INVESTMENTS:
| | |
| REIT | | — Real Estate Investment Trust |
| (b) | | — Investment in affiliate. Money market fund is registered under the Investment Company Act of 1940, as amended, and advised by J.P. Morgan Investment Management Inc. |
| (l) | | — The rate shown is the current yield as of June 30, 2017. |
| @ | | — The date shown reflects the next call date on which the issuer may redeem the security. The coupon rate for this security is currently in effect as of June 30, 2017 and is based upon the stated par value. |
SEE NOTES TO FINANCIAL STATEMENTS.
| | | | | | |
| | | |
| 8 | | | | J.P. MORGAN SPECIALTY FUNDS | | JUNE 30, 2017 |
THIS PAGE IS INTENTIONALLY LEFT BLANK
| | | | | | | | |
| | | |
| JUNE 30, 2017 | | J.P. MORGAN SPECIALTY FUNDS | | | | | 9 | |
STATEMENT OF ASSETS AND LIABILITIES
AS OF JUNE 30, 2017 (Unaudited)
(Amounts in thousands, except per share amounts)
| | | | |
| | | Security Capital U.S. Core Real Estate
Securities Fund | |
ASSETS: | | | | |
Investments in non-affiliates, at value | | $ | 102,188 | |
Investments in affiliates, at value | | | 1,767 | |
| | | | |
Total investment securities, at value | | | 103,955 | |
Receivables: | | | | |
Investment securities sold | | | 730 | |
Fund shares sold | | | 19 | |
Interest and dividends from non-affiliates | | | 469 | |
Dividends from affiliates | | | 1 | |
| | | | |
Total Assets | | | 105,174 | |
| | | | |
| |
LIABILITIES: | | | | |
Payables: | | | | |
Due to custodian | | | — | (a) |
Fund shares redeemed | | | 2 | |
Accrued liabilities: | | | | |
Investment advisory fees | | | 42 | |
Distribution fees | | | 1 | |
Service fees | | | 11 | |
Custodian and accounting fees | | | 4 | |
Trustees’ and Chief Compliance Officer’s fees | | | — | (a) |
Audit fees | | | 45 | |
Printing and mailing cost | | | 11 | |
Registration fees | | | 12 | |
Other | | | 2 | |
| | | | |
Total Liabilities | | | 130 | |
| | | | |
Net Assets | | $ | 105,044 | |
| | | | |
| (a) | Amount rounds to less than 500. |
SEE NOTES TO FINANCIAL STATEMENTS.
| | | | | | |
| | | |
| 10 | | | | J.P. MORGAN SPECIALTY FUNDS | | JUNE 30, 2017 |
| | | | |
| | | Security Capital
U.S. Core
Real Estate
Securities Fund | |
NET ASSETS: | | | | |
Paid-in-Capital | | $ | 97,630 | |
Accumulated undistributed (distributions in excess of) net investment income | | | 330 | |
Accumulated net realized gains (losses) | | | (2,444 | ) |
Net unrealized appreciation (depreciation) | | | 9,528 | |
| | | | |
Total Net Assets | | $ | 105,044 | |
| | | | |
| |
Net Assets: | | | | |
Class A | | $ | 1,701 | |
Class C | | | 436 | |
Class I (formerly Select Class) | | | 48,119 | |
Class R5 | | | 24 | |
Class R6 | | | 54,764 | |
| | | | |
Total | | $ | 105,044 | |
| | | | |
| |
Outstanding units of beneficial interest (shares)
($0.0001 par value; unlimited number of shares authorized): | | | | |
Class A | | | 96 | |
Class C | | | 25 | |
Class I (formerly Select Class) | | | 2,709 | |
Class R5 | | | 1 | |
Class R6 | | | 3,078 | |
| |
Net Asset Value (a): | | | | |
Class A — Redemption price per share | | $ | 17.72 | |
Class C — Offering price per share (b) | | | 17.69 | |
Class I (formerly Select Class) — Offering and redemption price per share | | | 17.76 | |
Class R5 — Offering and redemption price per share | | | 17.78 | |
Class R6 — Offering and redemption price per share | | | 17.79 | |
Class A maximum sales charge | | | 5.25 | % |
Class A maximum public offering price per share
[net asset value per share/(100% — maximum sales charge)] | | $ | 18.70 | |
| | | | |
| |
Cost of investments in non-affiliates | | $ | 92,660 | |
Cost of investments in affiliates | | | 1,767 | |
| (a) | Per share amounts may not recalculate due to rounding of net assets and/or shares outstanding. |
| (b) | Redemption price for Class C Shares varies based upon length of time the shares are held. |
SEE NOTES TO FINANCIAL STATEMENTS.
| | | | | | | | |
| | | |
| JUNE 30, 2017 | | J.P. MORGAN SPECIALTY FUNDS | | | | | 11 | |
STATEMENT OF OPERATIONS
FOR THE SIX MONTHS ENDED JUNE 30, 2017 (Unaudited)
(Amounts in thousands)
| | | | |
| | | Security Capital
U.S. Core
Real Estate
Securities Fund | |
INVESTMENT INCOME: | | | | |
Interest income from non-affiliates | | $ | 202 | |
Interest income from affiliates | | | — | (a) |
Dividend income from non-affiliates | | | 1,675 | |
Dividend income from affiliates | | | 4 | |
| | | | |
Total investment income | | | 1,881 | |
| | | | |
| |
EXPENSES: | | | | |
Investment advisory fees | | | 333 | |
Administration fees | | | 45 | |
Distribution fees: | | | | |
Class A | | | 2 | |
Class C | | | 2 | |
Service fees: | | | | |
Class A | | | 2 | |
Class C | | | 1 | |
Class I (formerly Select Class) | | | 68 | |
Class R5 | | | — | (a) |
Custodian and accounting fees | | | 20 | |
Interest expense to affiliates | | | 1 | |
Professional fees | | | 33 | |
Trustees’ and Chief Compliance Officer’s fees | | | 13 | |
Printing and mailing costs | | | 13 | |
Registration and filing fees | | | 32 | |
Transfer agency fees (See Note 2.C.) | | | 2 | |
Sub-transfer agency fees (See Note 2.C.) | | | 8 | |
Other | | | 4 | |
| | | | |
Total expenses | | | 579 | |
| | | | |
Less fees waived | | | (60 | ) |
Less expense reimbursements | | | (72 | ) |
| | | | |
Net expenses | | | 447 | |
| | | | |
Net investment income (loss) | | | 1,434 | |
| | | | |
| |
REALIZED/UNREALIZED GAINS (LOSSES): | | | | |
Net realized gain (loss) on transactions from investments in non-affiliates | | | 583 | |
Change in net unrealized appreciation/depreciation on investments in non-affiliates | | | 787 | |
| | | | |
Net realized/unrealized gains (losses) | | | 1,370 | |
| | | | |
Change in net assets resulting from operations | | $ | 2,804 | |
| | | | |
| (a) | Amount rounds to less than 500. |
SEE NOTES TO FINANCIAL STATEMENTS.
| | | | | | |
| | | |
| 12 | | | | J.P. MORGAN SPECIALTY FUNDS | | JUNE 30, 2017 |
STATEMENTS OF CHANGES IN NET ASSETS
FOR THE PERIODS INDICATED
(Amounts in thousands)
| | | | | | | | |
| | | Security Capital U.S. Core Real Estate
Securities Fund | |
| | | Six Months Ended
June 30, 2017
(Unaudited) | | | Year Ended
December 31, 2016 | |
CHANGE IN NET ASSETS RESULTING FROM OPERATIONS: | | | | | | | | |
Net investment income (loss) | | $ | 1,434 | | | $ | 2,844 | |
Net realized gain (loss) | | | 583 | | | | 4,519 | |
Change in net unrealized appreciation/depreciation | | | 787 | | | | (720 | ) |
| | | | | | | | |
Change in net assets resulting from operations | | | 2,804 | | | | 6,643 | |
| | | | | | | | |
| | |
DISTRIBUTIONS TO SHAREHOLDERS: | | | | | | | | |
Class A | | | | | | | | |
From net investment income | | | (17 | ) | | | (33 | ) |
From net realized gains | | | — | | | | (107 | ) |
Return of capital | | | — | | | | (5 | ) |
Class C | | | | | | | | |
From net investment income | | | (3 | ) | | | (8 | ) |
From net realized gains | | | — | | | | (31 | ) |
Return of capital | | | — | | | | (1 | ) |
Class I (formerly Select Class) | | | | | | | | |
From net investment income | | | (572 | ) | | | (1,193 | ) |
From net realized gains | | | — | | | | (3,336 | ) |
Return of capital | | | — | | | | (153 | ) |
Class R5 | | | | | | | | |
From net investment income | | | (1 | ) | | | (1 | ) |
From net realized gains | | | — | | | | (2 | ) |
Return of capital | | | — | | | | — | (a) |
Class R6 | | | | | | | | |
From net investment income | | | (678 | ) | | | (1,516 | ) |
From net realized gains | | | — | | | | (3,385 | ) |
Return of capital | | | — | | | | (146 | ) |
| | | | | | | | |
Total distributions to shareholders | | | (1,271 | ) | | | (9,917 | ) |
| | | | | | | | |
| | |
CAPITAL TRANSACTIONS: | | | | | | | | |
Change in net assets resulting from capital transactions | | | (10,377 | ) | | | 42,715 | |
| | | | | | | | |
| | |
NET ASSETS: | | | | | | | | |
Change in net assets | | | (8,844 | ) | | | 39,441 | |
Beginning of period | | | 113,888 | | | | 74,447 | |
| | | | | | | | |
End of period | | $ | 105,044 | | | $ | 113,888 | |
| | | | | | | | |
Accumulated undistributed (distributions in excess of) net investment income | | $ | 330 | | | $ | 167 | |
| | | | | | | | |
| (a) | Amount rounds to less than 500. |
SEE NOTES TO FINANCIAL STATEMENTS.
| | | | | | | | |
| | | |
| JUNE 30, 2017 | | J.P. MORGAN SPECIALTY FUNDS | | | | | 13 | |
STATEMENTS OF CHANGES IN NET ASSETS
FOR THE PERIODS INDICATED (continued)
(Amounts in thousands)
| | | | | | | | |
| | | Security Capital U.S. Core Real Estate
Securities Fund | |
| | | Six Months Ended
June 30, 2017
(Unaudited) | | | Year Ended
December 31, 2016 | |
CAPITAL TRANSACTIONS: | | | | | | | | |
Class A | | | | | | | | |
Proceeds from shares issued | | $ | 398 | | | $ | 1,598 | |
Distributions reinvested | | | 17 | | | | 145 | |
Cost of shares redeemed | | | (564 | ) | | | (5,852 | ) |
| | | | | | | | |
Change in net assets resulting from Class A capital transactions | | $ | (149 | ) | | $ | (4,109 | ) |
| | | | | | | | |
Class C | | | | | | | | |
Proceeds from shares issued | | $ | 49 | | | $ | 423 | |
Distributions reinvested | | | 3 | | | | 40 | |
Cost of shares redeemed | | | (150 | ) | | | (355 | ) |
| | | | | | | | |
Change in net assets resulting from Class C capital transactions | | $ | (98 | ) | | $ | 108 | |
| | | | | | | | |
Class I (formerly Select Class) | | | | | | | | |
Proceeds from shares issued | | $ | 6,686 | | | $ | 13,253 | |
Distributions reinvested | | | 545 | | | | 4,415 | |
Cost of shares redeemed | | | (17,361 | ) | | | (10,033 | ) |
| | | | | | | | |
Change in net assets resulting from Class I capital transactions | | $ | (10,130 | ) | | $ | 7,635 | |
| | | | | | | | |
Class R5 | | | | | | | | |
Proceeds from shares issued | | $ | — | (a) | | $ | 3 | |
Distributions reinvested | | | 1 | | | | 3 | |
Cost of shares redeemed | | | (5 | ) | | | — | (a) |
| | | | | | | | |
Change in net assets resulting from Class R5 capital transactions | | $ | (4 | ) | | $ | 6 | |
| | | | | | | | |
Class R6 | | | | | | | | |
Proceeds from shares issued | | $ | 1,439 | | | $ | 53,293 | |
Distributions reinvested | | | 678 | | | | 5,048 | |
Cost of shares redeemed | | | (2,113 | ) | | | (19,266 | ) |
| | | | | | | | |
Change in net assets resulting from Class R6 capital transactions | | $ | 4 | | | $ | 39,075 | |
| | | | | | | | |
Total change in net assets resulting from capital transactions | | $ | (10,377 | ) | | $ | 42,715 | |
| | | | | | | | |
| (a) | Amount rounds to less than 500. |
SEE NOTES TO FINANCIAL STATEMENTS.
| | | | | | |
| | | |
| 14 | | | | J.P. MORGAN SPECIALTY FUNDS | | JUNE 30, 2017 |
| | | | | | | | |
| | | Security Capital U.S. Core Real Estate
Securities Fund | |
| | | Six Months Ended
June 30, 2017
(Unaudited) | | | Year Ended
December 31, 2016 | |
SHARE TRANSACTIONS: | | | | | | | | |
Class A | | | | | | | | |
Issued | | | 23 | | | | 84 | |
Reinvested | | | 1 | | | | 8 | |
Redeemed | | | (32 | ) | | | (333 | ) |
| | | | | | | | |
Change in Class A Shares | | | (8 | ) | | | (241 | ) |
| | | | | | | | |
Class C | | | | | | | | |
Issued | | | 3 | | | | 23 | |
Reinvested | | | — | (a) | | | 2 | |
Redeemed | | | (9 | ) | | | (19 | ) |
| | | | | | | | |
Change in Class C Shares | | | (6 | ) | | | 6 | |
| | | | | | | | |
Class I (formerly Select Class) | | | | | | | | |
Issued | | | 381 | | | | 744 | |
Reinvested | | | 31 | | | | 250 | |
Redeemed | | | (985 | ) | | | (547 | ) |
| | | | | | | | |
Change in Class I Shares | | | (573 | ) | | | 447 | |
| | | | | | | | |
Class R5 | | | | | | | | |
Issued | | | — | (a) | | | — | (a) |
Reinvested | | | — | (a) | | | — | (a) |
Redeemed | | | — | (a) | | | — | (a) |
| | | | | | | | |
Change in Class R5 Shares | | | — | (a) | | | — | (a) |
| | | | | | | | |
Class R6 | | | | | | | | |
Issued | | | 81 | | | | 2,937 | |
Reinvested | | | 38 | | | | 284 | |
Redeemed | | | (119 | ) | | | (1,042 | ) |
| | | | | | | | |
Change in Class R6 Shares | | | — | (a) | | | 2,179 | |
| | | | | | | | |
| (a) | Amount rounds to less than 500. |
SEE NOTES TO FINANCIAL STATEMENTS.
| | | | | | | | |
| | | |
| JUNE 30, 2017 | | J.P. MORGAN SPECIALTY FUNDS | | | | | 15 | |
FINANCIAL HIGHLIGHTS
FOR THE PERIODS INDICATED
| | | | | | | | | | | | | | | | | | | | | | | | | | | | | | | | |
| | | Per share operating performance | |
| | | | | | Investment operations | | | Distributions | |
| | | Net asset
value,
beginning
of period | | | Net
investment
income
(loss) (b) | | | Net realized
and unrealized
gains (losses) on
investments | | | Total from
investment
operations | | | Net
investment
income | | | Net
realized
gain | | | Return of
capital | | | Total
distributions | |
Security Capital U.S. Core Real Estate Securities Fund | |
Class A | |
Six Months Ended June 30, 2017 (Unaudited) | | $ | 17.48 | | | $ | 0.20 | | | $ | 0.22 | | | $ | 0.42 | | | $ | (0.18 | ) | | $ | — | | | $ | — | | | $ | (0.18 | ) |
Year Ended December 31, 2016 | | | 18.10 | | | | 0.33 | | | | 0.50 | | | | 0.83 | | | | (0.33 | ) | | | (1.07 | ) | | | (0.05 | ) | | | (1.45 | ) |
Year Ended December 31, 2015 | | | 18.32 | | | | 0.30 | | | | 0.47 | | | | 0.77 | | | | (0.35 | ) | | | (0.64 | ) | | | — | | | | (0.99 | ) |
Year Ended December 31, 2014 | | | 15.70 | | | | 0.31 | | | | 3.05 | | | | 3.36 | | | | (0.29 | ) | | | (0.45 | ) | | | — | | | | (0.74 | ) |
Year Ended December 31, 2013 | | | 16.36 | | | | 0.29 | | | | (0.21 | ) | | | 0.08 | | | | (0.28 | ) | | | (0.44 | ) | | | (0.02 | ) | | | (0.74 | ) |
Year Ended December 31, 2012 | | | 14.98 | | | | 0.34 | | | | 1.62 | | | | 1.96 | | | | (0.29 | ) | | | (0.29 | ) | | | — | | | | (0.58 | ) |
|
Class C | |
Six Months Ended June 30, 2017 (Unaudited) | | | 17.45 | | | | 0.15 | | | | 0.22 | | | | 0.37 | | | | (0.13 | ) | | | — | | | | — | | | | (0.13 | ) |
Year Ended December 31, 2016 | | | 18.08 | | | | 0.29 | | | | 0.45 | | | | 0.74 | | | | (0.25 | ) | | | (1.07 | ) | | | (0.05 | ) | | | (1.37 | ) |
Year Ended December 31, 2015 | | | 18.32 | | | | 0.22 | | | | 0.44 | | | | 0.66 | | | | (0.26 | ) | | | (0.64 | ) | | | — | | | | (0.90 | ) |
Year Ended December 31, 2014 | | | 15.70 | | | | 0.24 | | | | 3.04 | | | | 3.28 | | | | (0.21 | ) | | | (0.45 | ) | | | — | | | | (0.66 | ) |
Year Ended December 31, 2013 | | | 16.37 | | | | 0.22 | | | | (0.22 | ) | | | — | (f) | | | (0.21 | ) | | | (0.44 | ) | | | (0.02 | ) | | | (0.67 | ) |
Year Ended December 31, 2012 | | | 15.00 | | | | 0.25 | | | | 1.62 | | | | 1.87 | | | | (0.21 | ) | | | (0.29 | ) | | | — | | | | (0.50 | ) |
|
Class I (formerly Select Class) | |
Six Months Ended June 30, 2017 (Unaudited) | | | 17.52 | | | | 0.21 | | | | 0.23 | | | | 0.44 | | | | (0.20 | ) | | | — | | | | — | | | | (0.20 | ) |
Year Ended December 31, 2016 | | | 18.14 | | | | 0.43 | | | | 0.44 | | | | 0.87 | | | | (0.37 | ) | | | (1.07 | ) | | | (0.05 | ) | | | (1.49 | ) |
Year Ended December 31, 2015 | | | 18.36 | | | | 0.34 | | | | 0.47 | | | | 0.81 | | | | (0.39 | ) | | | (0.64 | ) | | | — | | | | (1.03 | ) |
Year Ended December 31, 2014 | | | 15.72 | | | | 0.35 | | | | 3.07 | | | | 3.42 | | | | (0.33 | ) | | | (0.45 | ) | | | — | | | | (0.78 | ) |
Year Ended December 31, 2013 | | | 16.38 | | | | 0.33 | | | | (0.21 | ) | | | 0.12 | | | | (0.32 | ) | | | (0.44 | ) | | | (0.02 | ) | | | (0.78 | ) |
Year Ended December 31, 2012 | | | 15.00 | | | | 0.41 | | | | 1.59 | | | | 2.00 | | | | (0.33 | ) | | | (0.29 | ) | | | — | | | | (0.62 | ) |
|
Class R5 | |
Six Months Ended June 30, 2017 (Unaudited) | | | 17.54 | | | | 0.23 | | | | 0.23 | | | | 0.46 | | | | (0.22 | ) | | | — | | | | — | | | | (0.22 | ) |
Year Ended December 31, 2016 | | | 18.15 | | | | 0.46 | | | | 0.46 | | | | 0.92 | | | | (0.41 | ) | | | (1.07 | ) | | | (0.05 | ) | | | (1.53 | ) |
Year Ended December 31, 2015 | | | 18.38 | | | | 0.38 | | | | 0.46 | | | | 0.84 | | | | (0.43 | ) | | | (0.64 | ) | | | — | | | | (1.07 | ) |
Year Ended December 31, 2014 | | | 15.73 | | | | 0.38 | | | | 3.08 | | | | 3.46 | | | | (0.36 | ) | | | (0.45 | ) | | | — | | | | (0.81 | ) |
Year Ended December 31, 2013 | | | 16.39 | | | | 0.37 | | | | (0.22 | ) | | | 0.15 | | | | (0.35 | ) | | | (0.44 | ) | | | (0.02 | ) | | | (0.81 | ) |
Year Ended December 31, 2012 | | | 15.00 | | | | 0.41 | | | | 1.62 | | | | 2.03 | | | | (0.35 | ) | | | (0.29 | ) | | | — | | | | (0.64 | ) |
|
Class R6 | |
Six Months Ended June 30, 2017 (Unaudited) | | | 17.55 | | | | 0.24 | | | | 0.22 | | | | 0.46 | | | | (0.22 | ) | | | — | | | | — | | | | (0.22 | ) |
Year Ended December 31, 2016 | | | 18.16 | | | | 0.48 | | | | 0.45 | | | | 0.93 | | | | (0.42 | ) | | | (1.07 | ) | | | (0.05 | ) | | | (1.54 | ) |
Year Ended December 31, 2015 | | | 18.38 | | | | 0.39 | | | | 0.47 | | | | 0.86 | | | | (0.44 | ) | | | (0.64 | ) | | | — | | | | (1.08 | ) |
Year Ended December 31, 2014 | | | 15.74 | | | | 0.40 | | | | 3.05 | | | | 3.45 | | | | (0.36 | ) | | | (0.45 | ) | | | — | | | | (0.81 | ) |
Year Ended December 31, 2013 | | | 16.39 | | | | 0.43 | | | | (0.26 | ) | | | 0.17 | | | | (0.36 | ) | | | (0.44 | ) | | | (0.02 | ) | | | (0.82 | ) |
Year Ended December 31, 2012 | | | 15.00 | | | | 0.42 | | | | 1.62 | | | | 2.04 | | | | (0.36 | ) | | | (0.29 | ) | | | — | | | | (0.65 | ) |
| (a) | Annualized for periods less than one year, unless otherwise noted. |
| (b) | Calculated based upon average shares outstanding. |
| (c) | Not annualized for periods less than one year. |
| (d) | Includes adjustments in accordance with accounting principles generally accepted in the United States of America and as such, the net asset values for financial reporting purposes and the returns based upon those net asset values may differ from the net asset values and returns for shareholder transactions. |
| (e) | Includes earnings credits and interest expense, if applicable, each of which is less than 0.005% unless otherwise noted. |
| (f) | Amount rounds to less than $0.005. |
SEE NOTES TO FINANCIAL STATEMENTS.
| | | | | | |
| | | |
| 16 | | | | J.P. MORGAN SPECIALTY FUNDS | | JUNE 30, 2017 |
| | | | | | | | | | | | | | | | | | | | | | | | | | |
| | | Ratios/Supplemental data | |
| | | | | | | | | | Ratios to average net assets (a) | | | | |
Net asset
value,
end of
period | | | Total return
(excludes
sales charge) (c)(d) | | | Net assets,
end of
period
(000’s) | | | Net
expenses (e) | | | Net
investment
income
(loss) | | | Expenses without
waivers,
reimbursements and
earnings credits | | | Portfolio
turnover
rate (c) | |
| | |
| | |
| $ | 17.72 | | | | 2.39 | % | | $ | 1,701 | | | | 1.07 | % | | | 2.34 | % | | | 1.48 | % | | | 39 | % |
| | 17.48 | | | | 4.63 | | | | 1,826 | | | | 1.17 | | | | 1.76 | | | | 1.56 | | | | 147 | |
| | 18.10 | | | | 4.38 | | | | 6,232 | | | | 1.17 | | | | 1.66 | | | | 1.47 | | | | 85 | |
| | 18.32 | | | | 21.54 | | | | 6,177 | | | | 1.16 | | | | 1.75 | | | | 1.45 | | | | 76 | |
| | 15.70 | | | | 0.46 | | | | 4,270 | | | | 1.17 | | | | 1.75 | | | | 1.56 | | | | 106 | |
| | 16.36 | | | | 13.14 | | | | 3,867 | | | | 1.17 | | | | 2.11 | | | | 2.33 | | | | 74 | |
|
| | |
| | 17.69 | | | | 2.12 | | | | 436 | | | | 1.67 | | | | 1.68 | | | | 2.00 | | | | 39 | |
| | 17.45 | | | | 4.14 | | | | 527 | | | | 1.67 | | | | 1.57 | | | | 2.06 | | | | 147 | |
| | 18.08 | | | | 3.79 | | | | 448 | | | | 1.67 | | | | 1.23 | | | | 2.12 | | | | 85 | |
| | 18.32 | | | | 21.00 | | | | 356 | | | | 1.66 | | | | 1.38 | | | | 1.96 | | | | 76 | |
| | 15.70 | | | | (0.04 | ) | | | 88 | | | | 1.67 | | | | 1.30 | | | | 2.05 | | | | 106 | |
| | 16.37 | | | | 12.53 | | | | 57 | | | | 1.67 | | | | 1.56 | | | | 2.90 | | | | 74 | |
|
| | |
| | 17.76 | | | | 2.51 | | | | 48,119 | | | | 0.92 | | | | 2.43 | | | | 1.17 | | | | 39 | |
| | 17.52 | | | | 4.86 | | | | 57,495 | | | | 0.92 | | | | 2.30 | | | | 1.15 | | | | 147 | |
| | 18.14 | | | | 4.61 | | | | 51,412 | | | | 0.92 | | | | 1.86 | | | | 1.19 | | | | 85 | |
| | 18.36 | | | | 21.91 | | | | 63,028 | | | | 0.91 | | | | 1.99 | | | | 1.20 | | | | 76 | |
| | 15.72 | | | | 0.69 | | | | 44,340 | | | | 0.92 | | | | 1.98 | | | | 1.31 | | | | 106 | |
| | 16.38 | | | | 13.42 | | | | 41,370 | | | | 0.92 | | | | 2.53 | | | | 1.91 | | | | 74 | |
|
| | |
| | 17.78 | | | | 2.61 | | | | 24 | | | | 0.73 | | | | 2.60 | | | | 1.11 | | | | 39 | |
| | 17.54 | | | | 5.11 | | | | 28 | | | | 0.72 | | | | 2.49 | | | | 1.78 | | | | 147 | |
| | 18.15 | | | | 4.77 | | | | 23 | | | | 0.72 | | | | 2.03 | | | | 1.79 | | | | 85 | |
| | 18.38 | | | | 22.17 | | | | 71 | | | | 0.71 | | | | 2.17 | | | | 1.00 | | | | 76 | |
| | 15.73 | | | | 0.87 | | | | 58 | | | | 0.72 | | | | 2.18 | | | | 1.11 | | | | 106 | |
| | 16.39 | | | | 13.65 | | | | 57 | | | | 0.72 | | | | 2.52 | | | | 1.94 | | | | 74 | |
|
| | |
| | 17.79 | | | | 2.64 | | | | 54,764 | | | | 0.67 | | | | 2.76 | | | | 0.89 | | | | 39 | |
| | 17.55 | | | | 5.16 | | | | 54,012 | | | | 0.67 | | | | 2.54 | | | | 0.88 | | | | 147 | |
| | 18.16 | | | | 4.89 | | | | 16,332 | | | | 0.67 | | | | 2.14 | | | | 0.92 | | | | 85 | |
| | 18.38 | | | | 22.15 | | | | 25,542 | | | | 0.66 | | | | 2.27 | | | | 0.95 | | | | 76 | |
| | 15.74 | | | | 0.98 | | | | 7,630 | | | | 0.67 | | | | 2.60 | | | | 1.04 | | | | 106 | |
| | 16.39 | | | | 13.70 | | | | 57 | | | | 0.67 | | | | 2.57 | | | | 1.89 | | | | 74 | |
SEE NOTES TO FINANCIAL STATEMENTS.
| | | | | | | | |
| | | |
| JUNE 30, 2017 | | J.P. MORGAN SPECIALTY FUNDS | | | | | 17 | |
NOTES TO FINANCIAL STATEMENTS
AS OF JUNE 30, 2017 (Unaudited)
1. Organization
JPMorgan Trust I (the “Trust”) was formed on November 12, 2004, as Delaware statutory trust, pursuant to a Declaration of Trust dated November 5, 2004 and is registered under the Investment Company Act of 1940, as amended (the “1940 Act”), as an open-end management investment company.
The following is a separate fund of the Trust (the “Fund”) covered by this report:
| | | | |
| Fund | | Classes Offered | | Diversified/Non-Diversified |
| Security Capital U.S. Core Real Estate Securities Fund | | Class A, Class C, Class I^, Class R5 and Class R6 | | Diversified* |
| ^ | Effective April 3, 2017, Select Class was renamed Class I. |
| * | Effective February 15, 2017, the Fund changed its designation to diversified. |
The investment objective of the Fund is to seek a risk-adjusted total return over the long-term by investing primarily in real estate securities.
Class A Shares generally provide for a front-end sales charge while Class C Shares provide for a contingent deferred sales charge (“CDSC”). No sales charges are assessed with respect to Class I, Class R5 and Class R6 Shares. All classes of shares have equal rights as to earnings, assets and voting privileges, except that each class may bear different transfer agency, sub-transfer agency (through April 2, 2017), distribution and service fees and each class has exclusive voting rights with respect to its distribution plan and shareholder servicing agreements. Effective April 3, 2017 sub-transfer agency and shareholder servicing fees were consolidated into a single service fee. Certain Class A Shares, for which front-end sales charges have been waived, may be subject to a CDSC as described in the Fund’s prospectus. Beginning on November 14, 2017, Class C Shares will automatically convert to Class A Shares after ten years.
Security Capital Research & Management Incorporated (the “Adviser”) an indirect, wholly-owned subsidiary of JPMorgan Asset Management Holdings Inc. acts as investment adviser to the Fund. J.P. Morgan Investment Management Inc. (“JPMIM”) (the “Administrator”), an indirect, wholly-owned subsidiary of JPMorgan Chase & Co. (“JPMorgan”), acts as Administrator to the Fund.
2. Significant Accounting Policies
The following is a summary of significant accounting policies followed by the Fund in the preparation of its financial statements. The Fund is an investment company and, accordingly, follows the investment company accounting and reporting guidance of the Financial Accounting Standards Board Accounting Standards Codification Topic 946 — Investment Companies, which is part of U.S. generally accepted accounting principles (“GAAP”). The preparation of financial statements in conformity with GAAP requires management to make estimates and assumptions that affect the reported amounts of assets and liabilities and disclosure of contingent assets and liabilities at the date of the financial statements and the reported amounts of increases and decreases in net assets from operations during the reporting period. Actual results could differ from those estimates.
A. Valuation of Investments — The valuation of investments is in accordance with GAAP and the Fund’s valuation policies set forth by and under the supervision and responsibility of the Board of Trustees (the “Board”), which established the following approach to valuation, as described more fully below: (i) investments for which market quotations are readily available shall be valued at such unadjusted quoted prices and (ii) all other investments for which market quotations are not readily available shall be valued at their fair value as determined in good faith by the Board.
The Administrator has established the J.P. Morgan Investment Management Americas Valuation Committee (“AVC”) to assist the Board with the oversight and monitoring of the valuation of the Fund’s investments. The Administrator implements the valuation policies of the Fund’s investments, as directed by the Board. The AVC oversees and carries out the policies for the valuation of investments held in the Fund. This includes monitoring the appropriateness of fair values based on results of ongoing valuation oversight, including but not limited to consideration of macro or security specific events, market events and pricing vendor and broker due diligence. The Administrator is responsible for discussing and assessing the potential impacts to the fair values on an ongoing basis, and at least on a quarterly basis with the AVC and the Board.
Fixed-income instruments are valued based on prices received from approved affiliated and unaffiliated pricing vendors or third party broker-dealers (collectively referred to as “Pricing Services”). The Pricing Services use multiple valuation techniques to determine the valuation of fixed-income instruments. In instances where sufficient market activity exists, the Pricing Services may utilize a market-based approach through which trades or quotes from market makers are used to determine the valuation of these instruments. In instances where sufficient market activity may not exist, the Pricing Services also utilize proprietary valuation models which may consider market transactions in comparable securities and the various relationships between securities in determining fair value and/or market characteristics in order to estimate the relevant cash flows, which are then discounted to calculate the fair values.
Equities and other exchange-traded instruments are valued at the last sale price or official market closing price on the primary exchange on which the instrument is traded before the net asset values (“NAV”) of the Fund are calculated on a valuation date. Investments in open-end investment companies (the “Underlying Funds”) are valued at each Underlying Fund’s NAV per share as of the report date.
Valuations reflected in this report are as of the report date. As a result, changes in valuation due to market events and/or issuer related events after the report date and prior to issuance of the report are not reflected herein.
| | | | | | |
| | | |
| 18 | | | | J.P. MORGAN SPECIALTY FUNDS | | JUNE 30, 2017 |
The various inputs that are used in determining the valuation of the Fund’s investments are summarized into the three broad levels listed below.
| • | | Level 1 — Unadjusted inputs using quoted prices in active markets for identical investments. |
| • | | Level 2 — Other significant observable inputs including, but not limited to, quoted prices for similar investments, inputs other than quoted prices that are observable for investments (such as interest rates, prepayment speeds, credit risk, etc.) or other market corroborated inputs. |
| • | | Level 3 — Significant inputs based on the best information available in the circumstances, to the extent observable inputs are not available (including the Fund’s assumptions in determining the fair value of investments). |
A financial instrument’s level within the fair value hierarchy is based on the lowest level of any input, both individually and in the aggregate, that is significant to the fair value measurement. The inputs or methodology used for valuing instruments are not necessarily an indication of the risk associated with investing in those instruments.
The following table represents each valuation input as presented on the Schedule of Portfolio Investments (“SOI”) (amounts in thousands):
| | | | | | | | | | | | | | | | |
| | | Level 1
Quoted prices | | | Level 2
Other significant
observable inputs | | | Level 3
Significant
unobservable inputs | | | Total | |
Total Investments in Securities (a) | | $ | 94,403 | | | $ | 9,552 | | | $ | — | | | $ | 103,955 | |
| | | | | | | | | | | | | | | | |
| (a) | All portfolio holdings designated as level 1 and level 2 are disclosed individually on the SOI. Level 2 consists of corporate bonds. Please refer to the SOI for industry specifics of portfolio holdings. |
There were no transfers among any levels for the six months ended June 30, 2017.
B. Security Transactions and Investment Income — Investment transactions are accounted for on the trade date (the date the order to buy or sell is executed). Securities gains and losses are calculated on a specifically identified cost basis. Interest income is determined on the basis of coupon interest accrued using the effective interest method which adjusts for amortization of premiums and accretion of discounts. Dividend income, net of foreign taxes withheld, if any, is recorded on the ex-dividend date or when the Fund first learns of the dividend.
To the extent such information is publicly available, the Fund records distributions received in excess of income earned from underlying investments as a reduction of cost of investments and/or realized gain. Such amounts are based on estimates if actual amounts are not available and actual amounts of income, realized gain and return of capital may differ from the estimated amounts. The Fund adjusts the estimated amounts of the components of distributions (and consequently its net investment income) as necessary once the issuers provide information about the actual composition of the distributions.
C. Allocation of Income and Expenses — Expenses directly attributable to a fund are charged directly to that fund, while the expenses attributable to more than one fund of the Trust are allocated among the respective funds. In calculating the NAV of each class, investment income, realized and unrealized gains and losses and expenses, other than class-specific expenses, are allocated daily to each class of shares based upon the proportion of net assets of each class at the beginning of each day.
Transfer agency fees are class-specific expenses and sub-transfer agency fees were class-specific expenses up through April 2, 2017. Effective April 3, 2017, the Fund ceased making direct payments to financial intermediaries for any applicable sub-transfer agency services. Payments to financial intermediaries for sub-transfer agency services are made by JPMorgan Distribution Services, Inc. from the Shareholder Servicing Fee, which has been renamed as the Service Fee. The amount of the transfer agency fees and sub-transfer agency fees charged to each class of the Fund for the six months ended June 30, 2017 are as follows (amounts in thousands):
| | | | | | | | | | | | | | | | | | | | | | | | |
| | | Class A | | | Class C | | | Class I | | | Class R5 | | | Class R6 | | | Total | |
Transfer agency fees | | $ | — | (a) | | $ | — | (a) | | $ | 1 | | | $ | — | (a) | | $ | 1 | | | $ | 2 | |
Sub-transfer agency fees | | | 1 | | | | — | (a) | | | 7 | | | | — | (a) | | | — | | | | 8 | |
| (a) | Amount rounds to less than 500. |
D. Federal Income Taxes — The Fund is treated as a separate taxable entity for Federal income tax purposes. The Fund’s policy is to comply with the provisions of the Internal Revenue Code of 1986, as amended (the “Code”), applicable to regulated investment companies and to distribute to shareholders all of its distributable net investment income and net realized capital gains on investments. Accordingly, no provision for Federal income tax is necessary. Management has reviewed the Fund’s tax positions for all open tax years and has determined that as of June 30, 2017, no liability for income tax is required in the Fund’s financial statements for net unrecognized tax benefits. However, management’s conclusions may be subject to future review based on changes in, or the interpretation of, the accounting standards or tax laws and regulations. The Fund’s Federal tax returns for the prior three fiscal years remains subject to examination by the Internal Revenue Service.
E. Distributions to Shareholders — Distributions from net investment income are generally declared and paid quarterly and are declared separately for each class. No class has preferential dividend rights; differences in per share rates are due to differences in separate class expenses. Net realized capital gains, if any, are distributed at least annually. The amount of distributions from net investment income and net realized capital gains is determined in accordance with Federal income tax regulations, which may differ from GAAP. To the extent these “book/tax” differences are
| | | | | | | | |
| | | |
| JUNE 30, 2017 | | J.P. MORGAN SPECIALTY FUNDS | | | | | 19 | |
NOTES TO FINANCIAL STATEMENTS
AS OF JUNE 30, 2017 (Unaudited) (continued)
permanent in nature (i.e., that they result from other than timing of recognition — “temporary differences”), such amounts are reclassified within the capital accounts based on their Federal tax-basis treatment.
3. Fees and Other Transactions with Affiliates
A. Investment Advisory Fee — Pursuant to an Investment Advisory Agreement, the Adviser acts as the investment adviser to the Fund. The Adviser supervises the investments of the Fund and for such services is paid a fee. The fee is accrued daily and paid monthly based on the Fund’s average daily net assets at an annual rate of 0.60%.
B. Administration Fee — Pursuant to an Administration Agreement, the Administrator provides certain administration services to the Fund. In consideration of these services, the Administrator receives a fee accrued daily and paid monthly at an annual rate of 0.15% of the first $25 billion of the average daily net assets of all funds in the J.P. Morgan Funds Complex covered by the Administration Agreement (excluding certain funds of funds and money market funds) and 0.075% of the average daily net assets in excess of $25 billion of all such funds. For the six months ended June 30, 2017, the effective annualized rate was 0.08% of the Fund’s average daily net assets, notwithstanding any fee waivers and/or expense reimbursements.
JPMorgan Chase Bank, N.A. (“JPMCB”), a wholly-owned subsidiary of JPMorgan, serves as the Fund’s sub-administrator (the “Sub-administrator”). For its services as Sub-administrator, JPMCB receives a portion of the fees payable to the Administrator.
C. Distribution Fees — Pursuant to a Distribution Agreement, JPMorgan Distribution Services, Inc. (“JPMDS”), a wholly-owned subsidiary of JPMorgan, serves as the Trust’s principal underwriter and promotes and arranges for the sale of the Fund’s shares.
The Board has adopted a Distribution Plan (the “Distribution Plan”) for Class A and Class C Shares of the Fund in accordance with Rule 12b-1 under the 1940 Act. Class I, Class R5 and Class R6 Shares do not charge a distribution fee. The Distribution Plan provides that the Fund shall pay distribution fees, including payments to JPMDS, at annual rates of 0.25% and 0.75% of the average daily net assets of Class A and Class C Shares, respectively.
In addition, JPMDS is entitled to receive the front-end sales charges from purchases of Class A Shares and the CDSC from the redemptions of Class C Shares and certain Class A Shares for which front-end sales charges have been waived. For the six months ended June 30, 2017, JPMDS retained the following amounts (in thousands):
| | | | | | | | |
| | | Front-End Sales Charge | | | CDSC | |
| | $ | — | (a) | | $ | — | |
| (a) | Amount rounds to less than 500. |
D. Service Fees — The Trust, on behalf of the Fund, has entered into a Shareholder Servicing Agreement with JPMDS under which JPMDS provides certain support services to the shareholders. The Class R6 Shares do not charge a service fee. For performing these services, JPMDS receives a fee that is accrued daily and paid monthly equal to a percentage of the average daily net assets as shown in the table below:
| | | | | | | | | | | | | | | | |
| | | Class A | | | Class C | | | Class I | | | Class R5 | |
| | | 0.25 | % | | | 0.25 | % | | | 0.25 | % | | | 0.10 | %* |
| * | Prior to April 3, 2017, the service fee for Class R5 Shares was 0.05%. |
JPMDS has entered into shareholder services contracts with affiliated and unaffiliated financial intermediaries who provide shareholder services and other related services to their clients or customers who invest in the Fund under which JPMDS will pay all or a portion of such fees earned to financial intermediaries for performing such services.
E. Custodian and Accounting Fees — JPMCB provides portfolio custody and accounting services to the Fund. For performing these services, the Fund pays JPMCB transaction and asset-based fees that vary according to the number of transactions and positions, plus out-of-pocket expenses. The amounts paid directly to JPMCB by the Fund for custody and accounting services are included in Custodian and accounting fees on the Statement of Operations. Payments to the custodian may be reduced by credits earned by the Fund, based on uninvested cash balances held by the custodian. Such earnings credits, if any, are presented separately on the Statement of Operations.
Interest expense paid to the custodian related to cash overdrafts, if any, is included in Interest expense to affiliates on the Statement of Operations.
F. Waivers and Reimbursements — The Administrator and JPMDS have contractually agreed to waive fees and/or reimburse the Fund to the extent that total annual operating expenses (excluding acquired fund fees and expenses, dividend and interest expenses related to short sales, interest, taxes, expenses related to litigation and potential litigation, and extraordinary expenses) exceed the percentages of the Fund’s average daily net assets as shown in the table below:
| | | | | | | | | | | | | | | | | | | | |
| | | Class A | | | Class C | | | Class I | | | Class R5 | | | Class R6 | |
| | | 1.18 | % | | | 1.68 | % | | | 0.93 | % | | | 0.73 | % | | | 0.68 | % |
The expense limitation agreements were in effect for the six months ended June 30, 2017 and are in place until at least April 30, 2018.
| | | | | | |
| | | |
| 20 | | | | J.P. MORGAN SPECIALTY FUNDS | | JUNE 30, 2017 |
For the six months ended June 30, 2017, the Administrator and JPMDS waived fees and/or reimbursed expenses for the Fund as follows (amounts in thousands). None of these parties expect the Fund to repay any such waived fees and reimbursed expenses in future years.
| | | | | | | | | | | | | | | | |
| | | Contractual Waivers | | | | |
| | | Administration
Fees | | | Service Fees | | | Total | | | Contractual Reimbursements | |
| | $ | 45 | | | $ | 12 | | | $ | 57 | | | $ | 72 | |
Additionally, the Fund may invest in one or more money market funds advised by the Adviser or its affiliates (affiliated money market funds). The Administrator and/or JPMDS, as shareholder servicing agent, have contractually agreed to waive fees and/or reimburse expenses in an amount sufficient to offset the respective net fees each collects from the affiliated money market fund on the Fund’s investment in such affiliated money market fund. A portion of the waiver and/or reimbursement was voluntary.
The amount of waivers resulting from investments in these money market funds for the six months ended June 30, 2017 was approximately $3.
G. Other — Certain officers of the Trust are affiliated with the Adviser, the Administrator and JPMDS. Such officers, with the exception of the Chief Compliance Officer, receive no compensation from the Fund for serving in their respective roles.
The Board appointed a Chief Compliance Officer to the Fund in accordance with Federal securities regulations. The Fund, along with other affiliated funds, makes reimbursement payments, on a pro-rata basis, to the Administrator for a portion of the fees associated with the Office of the Chief Compliance Officer. Such fees are included in Trustees’ and Chief Compliance Officer’s fees on the Statement of Operations.
The Trust adopted a Trustee Deferred Compensation Plan (the “Plan”) which allows the Independent Trustees to defer the receipt of all or a portion of compensation related to performance of their duties as Trustees. The deferred fees are invested in various J.P. Morgan Funds until distribution in accordance with the Plan.
During the six months ended June 30, 2017, the Fund purchased securities from an underwriting syndicate in which the principal underwriter or members of the syndicate were affiliated with the Adviser.
The Fund may use related party broker-dealers. For the six months ended June 30, 2017, the Fund did not incur any brokerage commissions with broker-dealers affiliated with the Adviser.
The Securities and Exchange Commission (“SEC”) has granted an exemptive order permitting the Fund to engage in principal transactions with J.P. Morgan Securities, Inc., an affiliated broker, involving taxable money market instruments, subject to certain conditions.
4. Investment Transactions
During the six months ended June 30, 2017, purchases and sales of investments (excluding short-term investments) were as follows (amounts in thousands):
| | | | | | | | |
| | | Purchases
(excluding
U.S. Government) | | | Sales
(excluding
U.S. Government) | |
| | $ | 42,460 | | | $ | 49,834 | |
During the six months ended June 30, 2017, there were no purchases or sales of U.S. Government securities.
5. Federal Income Tax Matters
For Federal income tax purposes, the cost and unrealized appreciation (depreciation) in value of investment securities held at June 30, 2017 were as follows (amounts in thousands):
| | | | | | | | | | | | | | | | |
| | | Aggregate Cost | | | Gross Unrealized Appreciation | | | Gross Unrealized Depreciation | | | Net Unrealized
Appreciation
(Depreciation) | |
| | $ | 94,427 | | | $ | 11,670 | | | $ | 2,142 | | | $ | 9,528 | |
Net capital losses incurred after October 31 and within the taxable year are deemed to arise on the first business day of the Fund’s next taxable year. For the year ended December 31, 2016, the Fund deferred to January 1, 2017 the following net capital losses of (amounts in thousands):
| | | | | | | | |
| | | Net Capital Losses | |
| | | Short-Term | | | Long-Term | |
| | $ | 186 | | | $ | 95 | |
6. Borrowings
The Fund relies upon an exemptive order granted by the SEC (the “Order”) permitting the establishment and operation of an Interfund Lending Facility (the “Facility”). The Facility allows the Fund to directly lend and borrow money to or from any other fund relying upon the Order at rates
| | | | | | | | |
| | | |
| JUNE 30, 2017 | | J.P. MORGAN SPECIALTY FUNDS | | | | | 21 | |
NOTES TO FINANCIAL STATEMENTS
AS OF JUNE 30, 2017 (Unaudited) (continued)
beneficial to both the borrowing and lending funds. Advances under the Facility are taken primarily for temporary or emergency purposes, including the meeting of redemption requests that otherwise might require the untimely disposition of securities, and are subject to the Fund’s borrowing restrictions. The Interfund loan rate is determined, as specified in the Order, by averaging the current repurchase agreement rate and the current bank loan rate. The Order was granted to JPMorgan Trust II and may be relied upon by the Fund because the Fund and the series of JPMorgan Trust II are both investment companies in the same “group of investment companies” (as defined in Section 12 (d)(1)(G) of the 1940 Act).
The Trust and JPMCB have entered into a financing arrangement. Under this arrangement, JPMCB provides an unsecured, uncommitted credit facility in the aggregate amount of $100 million to certain of the J.P. Morgan Funds, including the Fund. Advances under the arrangement are taken primarily for temporary or emergency purposes, including the meeting of redemption requests that otherwise might require the untimely disposition of securities, and are subject to the Fund’s borrowing restrictions. Interest on borrowings is payable at a rate determined by JPMCB at the time of borrowing. This agreement has been extended until November 6, 2017.
The Fund had no borrowings outstanding from another fund or from the unsecured, uncommitted credit facility during the six months ended June 30, 2017. Average borrowings from the Facility for, or at any time during the six months ended June 30, 2017, were as follows (amounts in thousands):
| | | | | | | | | | | | | | | | |
| | | Average
Borrowings | | | Average Interest
Rate Paid | | | Number of
Days Outstanding | | | Interest
Paid | |
| | $ | 4,409 | | | | 1.41 | % | | | 5 | | | $ | 1 | |
In addition, effective August 16, 2016, the Trust along with certain other trusts (“Borrowers”) entered into a joint syndicated senior unsecured revolving credit facility totaling $1.5 billion (“Credit Facility”) with various lenders and The Bank of New York Mellon, as administrative agent for the lenders. This Credit Facility provides a source of funds to the Borrowers for temporary and emergency purposes, including the meeting of redemption requests that otherwise might require the untimely disposition of securities. Under the terms of the Credit Facility, a borrowing fund must have a minimum of $25,000,000 in adjusted net asset value and not exceed certain adjusted net asset coverage ratios prior to and during the time in which any borrowings are outstanding. If a fund does not comply with the aforementioned requirements, the fund must remediate within three business days with respect to the $25,000,000 minimum adjusted net asset value or within one business day with respect to certain asset coverage ratios or the administrative agent at the request of, or with the consent of, the lenders may terminate the Credit Facility and declare any outstanding borrowings to be due and payable immediately.
Interest associated with any borrowing under the Credit Facility is charged to the borrowing fund at a rate of interest equal to 1.00% plus the greater of the federal funds effective rate or one month LIBOR. The annual commitment fee to maintain the Credit Facility is 0.15% and is incurred on the unused portion of the Credit Facility and is allocated to all participating funds pro rata based on their respective net assets. Effective August 15, 2017, this agreement has been amended and restated for a term of 364 days, unless extended. The Fund did not utilize the Credit Facility during the six months ended June 30, 2017.
7. Risks, Concentrations and Indemnifications
In the normal course of business, the Fund enters into contracts that contain a variety of representations which provide general indemnifications. The Fund’s maximum exposure under these arrangements is unknown. The amount of exposure would depend on future claims that may be made against the Fund that have not yet occurred. However, based on experience, the Fund expects the risk of loss to be remote.
As of June 30, 2017, the Fund had shareholder accounts which owned more than 10% of the Fund’s outstanding shares as follows:
| | | | | | |
| | | Number of Non-Affiliated
Shareholder Accounts | | % of
the Fund | |
| | 3 | | | 71.8 | % |
Because the Fund may invest a substantial portion of their assets in REITs, the Fund may be subject to certain risks similar to those associated with direct investments in real estate. REITs may be affected by changes in the value of their underlying properties and by defaults by tenants. REITs depend generally on their ability to generate cash flow to make distributions to shareholders, and certain REITs have self-liquidation provisions by which mortgages held may be paid in full and distributions of capital returns may be made at any time.
The Fund is subject to interest rate and credit risk. The value of debt securities may decline as interest rates increase. The Fund could lose money if the issuer of a fixed-income security is unable to pay interest or repay principal when it is due. The ability of the issuers of debt to meet their obligations may be affected by the economic and political developments in a specific industry or region.
8. Investment Company Reporting Modernization
In October 2016, the U.S. Securities and Exchange Commission adopted new rules and forms, and amendments to certain current rules and forms, to modernize the reporting and disclosure of information by registered investment companies. In part, the final rules amend Regulation S-X and will require standardized, enhanced disclosures about derivatives in investment company financial statements, as well as other amendments. The amendments to Regulation S-X will apply to Fund’s fiscal year end on or after August 1, 2017. At this time, management is currently evaluating the impact of the Regulation S-X amendments on the Fund’s financial statements and related disclosures. The adoption will have no effect on the Fund’s net assets or results of operations.
| | | | | | |
| | | |
| 22 | | | | J.P. MORGAN SPECIALTY FUNDS | | JUNE 30, 2017 |
9. Subsequent Event
At their meeting on August 16, 2017, the Board of the Fund approved the liquidation of the Fund, which is expected to occur on or about December 8, 2017. Effective August 24, 2017, the Fund no longer accepted purchase orders from new investors.
| | | | | | | | |
| | | |
| JUNE 30, 2017 | | J.P. MORGAN SPECIALTY FUNDS | | | | | 23 | |
SCHEDULE OF SHAREHOLDER EXPENSES
(Unaudited)
Hypothetical $1,000 Investment
As a shareholder of the Fund, you incur two types of costs: (1) transaction costs, including sales charges (loads) on purchase payments and (2) ongoing costs, including investment advisory fees, administration fees, distribution fees and other Fund expenses. The examples below are intended to help you understand your ongoing costs (in dollars) of investing in the Fund and to compare these ongoing costs with the ongoing costs of investing in other mutual funds. The examples assume that you had a $1,000 investment in each Class at the beginning of the reporting period, January 1, 2017, and continued to hold your shares at the end of the reporting period, June 30, 2017.
Actual Expenses
For each Class of the Fund in the table below, the first line provides information about actual account values and actual expenses. You may use the information in this line, together with the amount you invested, to estimate the expenses that you paid over the period. Simply divide your account value by $1,000 (for example, an $8,600 account value divided by
$1,000 = 8.6), then multiply the result by the number in the first line of each Class under the heading entitled “Expenses Paid During the Period” to estimate the expenses you paid on your account during this period.
Hypothetical Example for Comparison Purposes
The second line of each Class in the table below provides information about hypothetical account values and hypothetical expenses based on the Class’ actual expense ratio and an assumed rate of return of 5% per year before expenses, which is not the Class’ actual return. The hypothetical account values and expenses may not be used to estimate the actual ending account balance or expenses you paid for the period. You may use this information to compare the ongoing costs of investing in the Class of the Fund and other funds. To do so, compare this 5% hypothetical example with the 5% hypothetical examples that appear in the shareholder reports of the other funds. Please note that the expenses shown in the table are meant to highlight your ongoing costs only and do not reflect any transaction costs, such as sales charges (loads) or redemption fees. Therefore, the second line for each Class in the table is useful in comparing ongoing costs only, and will not help you determine the relative total costs of owning different funds. In addition, if these transaction costs were included, your costs would have been higher. The examples also assume all dividends and distributions have been reinvested.
| | | | | | | | | | | | | | | | |
| | | Beginning
Account Value
January 1, 2017 | | | Ending
Account Value
June 30, 2017 | | | Expenses
Paid During
the Period* | | | Annualized
Expense
Ratio | |
Security Capital U.S. Core Real Estate Securities Fund | | | | | | | | | | | | | | | | |
Class A | | | | | | | | | | | | | | | | |
Actual | | $ | 1,000.00 | | | $ | 1,023.90 | | | $ | 5.37 | | | | 1.07 | % |
Hypothetical | | | 1,000.00 | | | | 1,019.49 | | | | 5.36 | | | | 1.07 | |
Class C | | | | | | | | | | | | | | | | |
Actual | | | 1,000.00 | | | | 1,021.20 | | | | 8.37 | | | | 1.67 | |
Hypothetical | | | 1,000.00 | | | | 1,016.51 | | | | 8.35 | | | | 1.67 | |
Class I (formerly Select Class) | | | | | | | | | | | | | | | | |
Actual | | | 1,000.00 | | | | 1,025.10 | | | | 4.62 | | | | 0.92 | |
Hypothetical | | | 1,000.00 | | | | 1,020.23 | | | | 4.61 | | | | 0.92 | |
Class R5 | | | | | | | | | | | | | | | | |
Actual | | | 1,000.00 | | | | 1,026.10 | | | | 3.67 | | | | 0.73 | |
Hypothetical | | | 1,000.00 | | | | 1,021.17 | | | | 3.66 | | | | 0.73 | |
Class R6 | | | | | | | | | | | | | | | | |
Actual | | | 1,000.00 | | | | 1,026.40 | | | | 3.37 | | | | 0.67 | |
Hypothetical | | | 1,000.00 | | | | 1,021.47 | | | | 3.36 | | | | 0.67 | |
| * | Expenses are equal to each Class’ respective annualized expense ratio, multiplied by the average account value over the period, multiplied by 181/365 (to reflect the one-half year period). |
| | | | | | |
| | | |
| 24 | | | | J.P. MORGAN SPECIALTY FUNDS | | JUNE 30, 2017 |
J.P. Morgan Funds are distributed by JPMorgan Distribution Services, Inc., which is an affiliate of JPMorgan Chase & Co. Affiliates of JPMorgan Chase & Co. receive fees for providing various services to the funds.
Contact JPMorgan Distribution Services, Inc. at 1-800-480-4111 for a fund prospectus. You can also visit us at www.jpmorganfunds.com. Investors should carefully consider the investment objectives and risk as well as charges and expenses of the mutual fund before investing. The prospectus contains this and other information about the mutual fund. Read the prospectus carefully before investing.
Investors may obtain information about the Securities Investor Protection Corporation (SIPC), including the SIPC brochure by visiting www.sipc.org or by calling SIPC at 202-371-8300.
The Fund files a complete schedule of its fund holdings for the first and third quarters of its fiscal year with the SEC on Form N-Q. The Fund’s Forms N-Q are available on the SEC’s website at http://www.sec.gov and may be reviewed and copied at the SEC’s Public Reference Room in Washington, DC. Information on the operation of the SEC’s Public Reference Room may be obtained by calling 1-800-SEC-0330. Shareholders may request the Form N-Q without charge by calling 1-800-480-4111 or by visiting the J.P. Morgan Funds’ website at www.jpmorganfunds.com.
A description of the Fund’s policies and procedures with respect to the disclosure of the Fund’s holdings is available in the prospectus and Statement of Additional Information.
A copy of proxy policies and procedures is available without charge upon request by calling 1-800-480-4111 and on the Fund’s website at www.jpmorganfunds.com. A description of such policies and procedures is on the SEC’s website at www.sec.gov. The Trustees have delegated the authority to vote proxies for securities owned by the Fund to the Adviser. A copy of the Fund’s voting record for the most recent 12-month period ended June 30 is available on the SEC’s website at www.sec.gov or at the Fund’s website at www.jpmorganfunds.com no later than August 31 of each year. The Fund’s proxy voting record will include, among other things, a brief description of the matter voted on for each fund security, and will state how each vote was cast, for example, for or against the proposal.


J.P. Morgan Asset Management is the marketing name for the asset management businesses of JPMorgan Chase & Co. Those businesses include, but are not limited to, J.P. Morgan Investment Management Inc., Security Capital Research & Management Incorporated and J.P. Morgan Alternative Asset Management, Inc.
| | | | |
| | © JPMorgan Chase & Co., 2017. All rights reserved. June 2017. | | SAN-USRE-617 |
ITEM 2. CODE OF ETHICS.
Disclose whether, as of the end of the period covered by the report, the registrant has adopted a code of ethics that applies to the registrant’s principal executive officer, principal financial officer, principal accounting officer or controller, or persons performing similar functions, regardless of whether these individuals are employed by the registrant or a third party. If the registrant has not adopted such a code of ethics, explain why it has not done so.
The registrant must briefly describe the nature of any amendment, during the period covered by the report, to a provision of its code of ethics that applies to the registrant’s principal executive officer, principal financial officer, principal accounting officer or controller, or persons performing similar functions, regardless of whether these individuals are employed by the registrant or a third party, and that relates to any element of the code of ethics definition enumerated in paragraph (b) of this Item. The registrant must file a copy of any such amendment as an exhibit pursuant to Item 12(a)(1), unless the registrant has elected to satisfy paragraph (f) of this Item by positing its code of ethics on its website pursuant to paragraph (f)(2) of this Item, or by undertaking to provide its code of ethics to any person without charge, upon request, pursuant to paragraph (f)(3) of this Item.
If the registrant has, during the period covered by the report, granted a waiver, including an implicit waiver, from a provision of the code of ethics that applies to the registrant’s principal executive officer, principal financial officer, principal accounting officer or controller, or persons performing similar functions, regardless of whether these individuals are employed by the registrant or third party, that relates to one or more items set forth in paragraph (b) of this Item, the registrant must briefly describe the nature of the waiver, the name of the person to whom the waiver was granted, and the date of the waiver.
Not applicable to a semiannual report.
ITEM 3. AUDIT COMMITTEE FINANCIAL EXPERT.
(a) (1) Disclose that the registrant’s board of directors has determined that the registrant either:
(i) Has at least one audit committee financial expert serving on its audit committee; or
(ii) Does not have an audit committee financial expert serving on its audit committee.
(2) If the registrant provides the disclosure required by paragraph (a)(1)(i) of this Item, it must disclose the name of the audit committee financial expert and whether that person is “independent.” In order to be considered “independent” for purposes of this Item, a member of an audit committee may not, other than in his or her capacity as a member of the audit committee, the board of directors, or any other board committee:
(i) Accept directly or indirectly any consulting, advisory, or other compensatory fee from the issuer; or
(ii) Be an “interested person” of the investment company as defined in Section 2(a)(19) of the Act (15 U.S.C. 80a-2(a)(19)).
(3) If the registrant provides the disclosure required by paragraph (a)(1)(ii) of this Item, it must explain why it does not have an audit committee financial expert.
Not applicable to a semiannual report.
ITEM 4. PRINCIPAL ACCOUNTANT FEES AND SERVICES.
(a) Disclose, under the caption Audit Fees, the aggregate fees billed for each of the last two fiscal years for professional services rendered by the principal accountant for the audit of the registrant’s annual financial statements or services that are normally provided by the accountant in connection with statutory and regulatory filings or engagements for those fiscal years.
(b) Disclose, under the caption Audit-Related Fees, the aggregate fees billed in each of the last two fiscal years for assurance and related services by the principal accountant that are reasonably related to the performance of the audit of the registrant’s financial statements and are not reported under paragraph (a) of this Item. Registrants shall describe the nature of the services comprising the fees disclosed under this category.
(c) Disclose, under the caption Tax Fees, the aggregate fees billed in each of the last two fiscal years for professional services rendered by the principal accountant for tax compliance, tax advice, and tax planning. Registrants shall describe the nature of the services comprising the fees disclosed under this category.
(d) Disclose, under the caption All Other Fees, the aggregate fees billed in each of the last two fiscal years for products and services provided by the principal accountant, other than the services reported in paragraphs (a) through (c) of this Item. Registrants shall describe the nature of the services comprising the fees disclosed under this category.
(e) (1) Disclose the audit committee’s pre-approval policies and procedures described in paragraph (c)(7) of Rule 2-01 of Regulation S-X.
(2) Disclose the percentage of services described in each of paragraphs (b) through (d) of this Item that were approved by the audit committee pursuant to paragraph (c)(7)(i)(C) of Rule 2-01 of Regulation S-X.
(f) If greater than 50 percent, disclose the percentage of hours expended on the principal accountant’s engagement to audit the registrant’s financial statements for the most recent fiscal year that were attributed to work performed by persons other than the principal accountant’s full-time, permanent employees.
Not applicable to a semiannual report.
(g) Disclose the aggregate non-audit fees billed by the registrant’s accountant for services rendered to the registrant, and rendered to the registrant’s investment adviser (not including any sub-adviser whose role is primarily portfolio management and is subcontracted with or overseen by another investment adviser), and any entity controlling, controlled by, or under common control with the adviser that provides ongoing services to the registrant for each of the last two fiscal years of the registrant.
(h) Disclose whether the registrant’s audit committee of the board of directors has considered whether the provision of non-audit services that were rendered to the registrant’s investment adviser (not including any subadviser whose role is primarily portfolio management and is subcontracted with or overseen by another investment adviser), and any entity controlling, controlled by, or under common control with the investment adviser that provides ongoing services to the registrant that were not pre-approved pursuant to paragraph (c)(7)(ii) of Rule 2-01 of Regulation S-X is compatible with maintaining the principal accountant’s independence.
Not applicable to a semiannual report.
ITEM 5. AUDIT COMMITTEE OF LISTED REGISTRANTS.
(a) If the registrant is a listed issuer as defined in Rule 10A-3 under the Exchange Act (17CFR 240.10A-3), state whether or not the registrant has a separately-designated standing audit committee established in accordance with Section 3(a)(58)(A) of the Exchange Act (15 U.S.C. 78c(a)(58)(A)). If the registrant has such a committee, however designated, identify each committee member. If the entire board of directors is acting as the registrant’s audit committee as specified in Section 3(a)(58)(B) of the Exchange Act (15 U.S.C. 78c(a)(58)(B)), so state.
(b) If applicable, provide the disclosure required by Rule 10A-3(d) under the Exchange Act (17CFR 240.10A-3(d)) regarding an exemption from the listing standards for all audit committees.
Not applicable to a semiannual report.
ITEM 6. SCHEDULE OF INVESTMENTS.
File Schedule I – Investments in securities of unaffiliated issuers as of the close of the reporting period as set forth in Section 210.12-12 of Regulation S-X, unless the schedule is included as part of the report to shareholders filed under Item 1 of this Form.
Included in Item 1.
ITEM 7. DISCLOSURE OF PROXY VOTING POLICIES AND PROCEDURES FOR CLOSED-END MANAGEMENT INVESTMENT COMPANIES.
A closed-end management investment company that is filing an annual report on this Form N-CSR must, unless it invests exclusively in non-voting securities, describe the policies and procedures that it uses to determine how to vote proxies relating to portfolio securities, including the procedures that the company uses when a vote presents a conflict between the interests of its shareholders, on the one hand, and those of the company’s investment adviser; principal underwriter; or any affiliated person (as defined in Section 2(a)(3) of the Investment Company Act of 1940 (15 U.S.C. 80a-2(a)(3)) and the rules thereunder) of the company, its investment adviser, or its principal underwriter, on the other. Include any policies and procedures of the company’s investment adviser, or any other third party, that the company uses, or that are used on the company’s behalf, to determine how to vote proxies relating to portfolio securities.
Not applicable.
ITEM 8. PORTFOLIO MANAGERS OF CLOSED-END MANAGEMENT INVESTMENT COMPANIES.
Not applicable.
ITEM 9. PURCHASE OF EQUITY SECURITIES BY CLOSED-END MANAGEMENT INVESTMENT COMPANY AND AFFILIATED PURCHASERS.
(a) If the registrant is a closed-end management investment company, provide the information specified in paragraph (b) of this Item with respect to any purchase made by or on behalf of the registrant or any “affiliated purchaser,” as defined in Rule 10b-18(a)(3) under the Exchange Act (17 CFR 240.10b-18(a)(3)), of shares or other units of any class of the registrant’s equity securities that is registered by the registrant pursuant to Section 12 of the Exchange Act (15 U.S.C. 781).
Not applicable.
ITEM 10. SUBMISSION OF MATTERS TO A VOTE OF SECURITY HOLDERS.
Describe any material changes to the procedures by which shareholders may recommend nominees to the registrant’s board of directors, where those changes were implemented after the registrant last provided disclosure in response to the requirements of Item 7(d)(2)(ii)(G) of Schedule 14A (17 CFR 240.14a-101), or this Item.
No material changes to report.
ITEM 11. CONTROLS AND PROCEDURES.
(a) Disclose the conclusions of the registrant’s principal executive and principal financial officers, or persons performing similar functions, regarding the effectiveness of the registrant’s disclosure controls and procedures (as defined in Rule 30a-3(c) under the Act (17 CFR 270.30a-3(c))) as of a date within 90 days of the filing date of the report that includes the disclosure required by this paragraph, based on the evaluation of these controls and procedures required by Rule 30a-3(b) under the Act (17 CFR 270.30a-3(b)) and Rules 13a-15(b) or 15d-15(b) under the Exchange Act (17 CFR 240.13a-15(b) or 240.15d-15(b)).
The Registrant’s principal executive and principal financial officers have concluded, based on their evaluation of the Registrant’s disclosure controls and procedures as of a date within 90 days of the filing date of this report, that the Registrant’s disclosure controls and procedures are reasonably designed to ensure that information required to be disclosed by the Registrant on Form N-CSR is recorded, processed, summarized and reported within the required time periods and that information required to be disclosed by the Registrant in the reports that it files or submits on Form N-CSR is accumulated and communicated to the Registrant’s management, including its principal executive and principal financial officers, as appropriate to allow timely decisions regarding required disclosure.
(b) Disclose any change in the registrant’s internal control over financial reporting (as defined in Rule 30a-3(d) under the Act (17 CFR 270.30a-3(d)) that occurred during the registrant’s second fiscal quarter of the period covered by this report that has materially affected, or is reasonably likely to materially affect, the registrant’s internal control over financial reporting.
There were no changes in the Registrant’s internal control over financial reporting that occurred during the last fiscal quarter covered by this report that have materially affected, or are reasonably likely to materially affect, the Registrant’s internal control over financial reporting.
ITEM 12. EXHIBITS.
(a) File the exhibits listed below as part of this Form. Letter or number the exhibits in the sequence indicated.
(a)(1) Any code of ethics, or amendment thereto, that is the subject of the disclosure required by Item 2, to the extent that the registrant intends to satisfy the Item 2 requirements through filing of an exhibit.
Not applicable.
(a)(2) A separate certification for each principal executive officer and principal financial officer of the registrant as required by Rule 30a-2(a) under the Act (17 CFR 270.30a-2).
Certifications pursuant to Rule 30a-2(a) under the Investment Company Act of 1940 are attached hereto.
(a)(3) Any written solicitation to purchase securities under Rule 23c-1 under the Act (17 CFR 270.23c-1) sent or given during the period covered by the report by or on behalf of the registrant to 10 or more persons.
Not applicable.
(b) A separate or combined certification for each principal executive officer and principal officer of the registrant as required by Rule 30a-2(b) under the Act of 1940.
Certifications pursuant to Rule 30a-2(b) under the Investment Company Act of 1940 are attached hereto.
SIGNATURES
Pursuant to the requirements of the Securities Exchange Act of 1934 and the Investment Company Act of 1940, the registrant has duly caused this report to be signed on its behalf by the undersigned, thereunto duly authorized.
| | |
| JPMorgan Trust I |
| |
| By: | | /s/ Brian S. Shlissel |
| | Brian S. Shlissel |
| | President and Principal Executive Officer |
| | September 1, 2017 |
Pursuant to the requirements of the Securities Exchange Act of 1934 and the Investment Company Act of 1940, this report has been signed below by the following persons on behalf of the registrant and in the capacities and on the dates indicated.
| | |
| |
| By: | | /s/ Brian S. Shlissel |
| | Brian S. Shlissel |
| | President and Principal Executive Officer |
| | September 1, 2017 |
| |
| By: | | /s/ Laura M. Del Prato |
| | Laura M. Del Prato |
| | Treasurer and Principal Financial Officer |
| | September 1, 2017 |